Chlorophyll Turnover in Skeletonema costatum, a Marine Plankton Diatom
Upload
khangminh22Category
view
0download
0
Diatom records of Holocene climatic and hydrological changes in the western Hudson Bay region, Canada
by
Charlotte Ellen Friel
A thesis submitted in conformity with the requirements for the degree of Masters of Science
Department of Geography University of Toronto
© Copyright by Charlotte Ellen Friel 2011

ii
Diatom records of Holocene climatic and hydrological shifts in the
western Hudson Bay region, Canada
Charlotte Ellen Friel
Masters of Science 2011
Department of Geography
University of Toronto
Abstract
Rapidly changing climates in northern Canada make the western Hudson Bay region an area
of high importance for paleoenvironmental studies. Long-term changes in assemblages of
diatoms (microscopic algae) were analyzed from lake sediment cores from Baker Lake,
Nunavut, and Lake AT01, northern Ontario, to track responses to past environmental changes.
Diatom assemblages dating to 6700 years ago in AT01 were initially characterized by cold-
tolerant Fragilarioid assemblages, but shifted to an assemblage dominated by large benthic
species and Cymbella diluviana consistent with the timing of the Holocene Thermal
Maximum after 6300 years BP. A possible drainage event in Lake AT01 may have added
significant hydrologic control on the diatom assemblages. The post-industrial period is
marked by the largest compositional shifts in both records. Assemblages during the 20th
century are indicative of reduced ice cover and enhanced thermal stratification linked to a
climate regime shift noted in Hudson Bay since the mid-1990’s.
iii
Acknowledgments
First and foremost I would like to thank my supervisor, Dr. Sarah Finkelstein, for her
immeasurable help over the past 2 years in every aspect of this project. Your infinitely
positive and encouraging feedback, as well as your enthusiasm for paleoecology have been a
continual inspiration. I would also like to acknowledge Dr. Finkelstein, the Centre for Global
Change Science and the Ministry of Natural Resources for their financial support.
To my fellow lab mates Ben, JP, Carlos, Maara and Jane, thank you for all that you
have contributed on so many occasions throughout the project both in regards to my thesis and
not, you have been an amazing support in my work and have made the last two years that
much more fun despite the long hours on the scope! A huge thank you also to Stephanie and
Kristen for your help in some of the less exciting aspects of my lab work. Joan, I owe you an
especially notable thank you for your invaluable help in just about every software package in
the lab and of course for your company on the many coffee breaks and keeping me calm
during the more stressful moments.
Additional acknowledgements must go to Peter Barnett (Ontario Geological Survey)
for help on the interpretation of my unusual lake, Andrew Medeiros (York University) for
encouraging my involvement in the Baker Lake project and Alex Wolfe (University of
Alberta) for providing the modern diatom data from Baffin Island.
Finally, thank you to my friends, family and especially Graham for being a source of
continued support during my academic pursuits.

! iv
Table of Contents !!Title Page Abstract Acknowledgements Table of Contents List of Tables List of Plates List of Figures List of Appendices
i ii iii iv vi vii viii ix
CHAPTER 1 – INTRODUCTION AND LITERATURE REVIEW 1
Thesis Outline
Climate Change: an overview The Paleoecological Approach and Diatoms Holocene Paleoclimates of the Canadian Arctic and Subarctic Hudson Bay and the Hudson Bay Lowlands Research Questions
1 2 3 7 13 20 CHAPTER 2 – EXPLAINING DIATOM COMMUNITY SHIFTS IN A 7000 YEAR RECORD FROM A KETTLE LAKE IN THE CENTRAL HUDSON BAY LOWLANDS
21
Abstract
Introduction Materials and Methods
21 22 25 Study area 25 Field methods 26 Laboratory methods 27 Statistical methods 29 Results 30 Core chronology 30 General stratigraphic trends 32 Biostratigraphic trends 33 Discussion
Future Work Conclusion Tables Figures
36 48 49 50 54

! v
CHAPTER 3 – A QUANTITATIVE RECONSTRUCTION OF LATE HOLOCENE PALEOENVIRONMENTAL CHANGES; COMPARING DIATOM ASSEMBLAGE SHIFTS, INFERRED PH AND MEASURED LAKE-ICE COVER IN BAKER LAKE, NUNAVUT, CANADA
61
Abstract
Introduction Study Area Materials and Methods
61 62 64 65 Field methods 65 Laboratory methods 65 Statistical methods 66 Model design 67 Results 68 Core stratigraphy and chronology 68 Fossil diatom assemblages 69 Model results 71 Discussion
Conclusion Tables Figures
73 78 79 80 CHAPTER 4 - CONCLUSIONS 88 Pre-industrial paleoenvironments of the western Hudson Bay
region Post-industrial changes in the western Hudson Bay region Summary
88 89
91 Reference List
93
Appendix A: AT01 raw counts, summary data and diatom plates Appendix B: Baker Lake raw counts and summary data Appendix C: Updates to diatom taxonomy Appendix D: Diatom concentration formula Plate 1: Fragilaria, Cymbella diluviana and small benthics Plate 2: Large benthics Plate 3: Cyclotella and other abundant species
112 144 168 174
175 176 177
! ! ! !! ! ! !! ! ! !! ! ! !! ! ! !

vi
List of Tables
Chapter 2: AT01
Table 1: Modern water chemistry variables
Table 2: 210Pb dates
Table 3: Radiocarbon dates
Table 4: Sedimentation rates
Chapter 3: Baker Lake
Table 1: Diatom-inferred pH reconstructions model performances

vii
List of Plates
Plate 1: Fragilaria, Cymbella diluviana and small benthic speices
Plate 2: Large benthic species
Plate 3: Cyclotella and other abundant species

viii
List of Figures
Chapter 2: AT01
Figure 1: Location map of the Hudson Bay Lowlands and Lake AT01
Figure 2: Digital elevation model and topographic profile of the AT01 moraine
Figure 3: Core chronology
Figure 4: AT01 summary stratigraphy
Figure 5: AT01 diatom stratigraphy
Figure 6: Detrended Correspondence Analysis of fossil diatom taxa
Figure 7: Proposed model of kettle lake formation in the AT01 basin
Chapter 3
Figure 1: Location map of Baker Lake and the western Hudson Bay region
Figure 2: Core chronology
Figure 3: BL01 summary stratigraphy
Figure 4: BL01 diatom stratigraphy
Figure 5: Detrended Correspondence Analysis of modern Baffin Island and Baker Lake fossil
diatom assemblages
Figure 6: Residual plots of selected diatom-inferred pH models
Figure 7: Summary of diatom-inferred pH and instrumental ice and temperature records
Figure 8: Correlation plot of ice cover duration and diatom-inferred pH in Baker Lake
ix
List of Appendices
Appendix A: AT01 raw counts and summary data
Appendix B: Baker Lake raw counts and summary data
Appendix C: Updates to diatom taxonomy
Appendix D: Diatom concentration formula

! 1
CHAPTER 1
Introduction and Literature Review
Thesis Outline
This thesis is organized into four chapters. The first presents an introduction and literature
review of climate and diatom-based paleolimnology across the Canadian arctic and subarctic with
particular emphasis on the role of Hudson Bay in the climate and ecosystem dynamics of eastern
Canada. Chapters 2 and 3 are written in manuscript format. In Chapter 2, I will examine diatom
community changes throughout the post-glacial period in a sediment record from a small kettle
lake in the Hudson Bay Lowlands, Northern Ontario. Diatom shifts will be discussed in relation
to pre and post industrial period changes and will be drawn into the context of known intervals of
climatic change in the eastern Canadian subarctic during the Holocene. This will provide an
improved understanding of the range of natural variability throughout the Holocene and how
ecosystem changes have occurred in relation to climates both warmer and cooler than present
day. Chapter 3 will present diatom assemblage dynamics over the last 150 years from a large
lake in the northwestern Hudson Bay region, Nunavut. Diatom compositional shifts will be
explored in relation to measured changes in lake ice cover duration and air temperature to
corroborate the idea that diatoms respond sensitively to changes in lake-ice cover. In this chapter
a quantitative reconstruction of diatom-inferred pH will be carried out using a transfer function
derived from the modern diatom assemblages of Baffin Island, Nunavut. Chapter 4 will draw the
two research papers and literature review together to make some general conclusions

! 2
Climate change: an overview
Increasing anthropogenic inputs are changing the composition of the atmosphere and as a
result, the global climate is being altered (Karl and Trenberth, 2003). The intensification of
human-induced modifications on the climate during the last century has focused research efforts
on climate variability and ecosystem response to changes in the global climate system. The rate
at which the climate is warming has increased from 0.05°C per decade during the last 150 years
to 0.18°C per decade during the last 25 years (Trenberth et al, 2007). Ongoing changes in
landuse practices and increased emissions of greenhouse gases have heightened concerns that the
rate and magnitude of anthropogenically-induced climate change in the future will continue to
increase and surpass that of any natural change that has occurred over the last 10,000 years
(Rühland and Smol, 2002a; Karl and Trenberth, 2003). The potential for climate warming to
reorganize global ecosystems in terms of their location, expanse and character, amd cause strong
positive feedbacks between the biosphere and atmosphere, prompts the need to understand in
greater detail how ecosystems might respond to rapid future changes in the climate.
Research has emphasized the importance of computer-based general circulation models
(GCMs), which simulate resultant climatic changes under altered climatic parameters such as
increased concentrations of greenhouse gases in the atmosphere. Predictions of GCMs
demonstrate broad consensus that global mean temperature is likely to increase by approximately
1.0°C to 3.5°C by the year 2100 (Trenberth et al, 2007). Furthermore, GCM simulations
consistently predict the polar amplification of warming due to positive land-surface albedo
feedbacks (Serreze et al, 2000). This amplification has been evidenced in documented increases
of near-surface air temperatures in the Arctic and Subarctic up to two to three times greater than
the global average (ACIA, 2004).
Whilst simulations of the large-scale climatic processes are generally agreed upon,
significant uncertainties regarding the magnitude and extent of regional and local-scale climatic

! 3
changes remain prominent (Dibike et al, 2011b). Furthermore, deficiencies in datasets,
particularly from high northern latitudes and uncertainties regarding the parameterization and
modeling of some components of the climate system, hamper the development of accurate
climate simulations, reflecting a lack of knowledge regarding present day climatic processes and
past natural variability (Laing, 1999).
High latitude ecosystems are particularly sensitive to climatic change, with many species
living at their ecological limits. As such, they represent a key reference point for the detection of
global climate change (Smol et al, 2005). Owing to a paucity of instrumental data exceeding the
last 150 years, analogues for the impact of future climatic changes are frequently sought in
Holocene paleoecological data.
The Paleoecological Approach and Diatoms
Understanding recent climate warming within the context of long-term climate change and
natural variability requires the examination of long-term data sets. Paleoecology allows us to
carry out quantitative reconstructions of the natural ranges of variability in climate, limnology
and ecological communities which can be paired with model simulations to test their robustness
and refine scientific understanding of the climate system. Proxy data obtained from a variety of
natural archives (e.g. the sediments of lakes and peat, tree rings and ice cores) provides
paleoecologists with a continuous perspective of environmental variability specifically in terms
of the periodicities of climatic change and the magnitude of ecological impacts over long
timescales (Smol et al, 2005). This study focuses on paleolimnology, using the chemical,
physical and biological information stored within lake sediments to reconstruct past
environmental conditions during the Holocene in arctic and subarctic lakes. Using present-day
knowledge of the direct and indirect effects of climate on limnic systems, paleolimnological
techniques are employed to track past climatic change using diatoms, a reliable lacustrine proxy

! 4
indicator of paleoclimates and paleolimnology.
Diatoms (Class Bacillariophyceae) are a taxonomically diverse group of unicellular algae
that are important primary producers in many aquatic environments and have specific ecological
requirements (Lowe and Walker, 1997). Their short generation times allow for a rapid and
sensitive response to environmental perturbation and the siliceous nature of the diatom cell wall
makes these organisms abundant and often well preserved in lake sediments (Smol and
Cumming, 2000). Since diatoms originate within a water body they are considered to be
representative of the local environment within the aquatic system in which they were extracted
thereby reducing the complications associated with long distance transport of other proxy
indicators (Rühland and Smol, 2002b). Their ability to inhabit a wide range of aquatic and semi-
aquatic habits providing sufficient light is available for photosynthesis has made the application
of diatoms in paleolimnological research geographically extensive.
Many diatoms have specific habitat preferences and can be used to infer water depth and
hydrological conditions by tracking shifts in the relative abundances of diatoms with differing
life strategies, i.e. planktonic versus epiphytic. Competitive interactions between diatom species
will result in abundance and assemblage shifts which should theoretically reflect the optimal
environmental conditions of the most dominant species. The composition of aquatic
communities in high latitude regions is largely controlled by climate and more specifically
temperature, which in turn will influence limnological variables such as the duration of lake-ice
cover (Smol, 1988). The onset, duration and extent of lake ice cover have significant
implications for the chemical and biological interactions between a water body and its biota.
Since the open-water season is especially short in arctic and many subarctic environments
(frequently less than 2 months per year) even small changes in the duration of the ice-free period
can greatly impact on the aquatic biota found within lakes (Smol, 1988).
Studies documenting recent shifts in the structure of diatom communities of arctic lakes

! 5
have highlighted the significant role of increased temperature in altering diatom communities via
reduced ice-cover and enhanced thermal stratification (Douglas et al. 1994; Rühland et al. 2003).
For example, an increase in the abundance of planktonic diatoms relative to periphytic or benthic
diatoms, may reflect a decrease in the duration and extent of ice cover and associated increases in
habitat availability within the water column under warmer climates (Douglas and Smol 1999;
Smol 1988; Rühland et al. 2008).
Whilst the physical status of a lake (duration of ice cover, depth) will influence the diatom
assemblage, limnological variables related to lake-water chemistry also play a significant role in
structuring diatom community assemblages. Several diatom calibration studies have identified
lake-water pH as the variable accounting for the greatest amount of variation in diatom species
assemblages (Weckstrom et al, 1997; Michelutti et al, 2007a) and have utilized sediment diatom
assemblages to reliably reconstruct lake-water pH (Battarbee et al, 1999; Wolfe, 2002). Growing
interest in the relationship between pH and climate has led to diatom-reconstructed lake-water pH
being used to infer changes in aspects of the climate system particularly in alpine, subarctic and
arctic lakes (Cole et al, 1994; Koinig et al, 1998). Analyses of climate controls on the pH of
poorly buffered lakes have suggested that cold air temperatures may induce a lowering of lake-
water pH, and vice versa, via links between lake alkalinity, catchment weathering, aeolian dust
fluxes and dissolved inorganic carbon (DIC) speciation (Psenner and Schmidt; 1992, Wolfe,
2002).
Where solute concentrations are low, lake-water pH is largely regulated by DIC dynamics
associated with lake-ice cover duration and thus climate (Douglas and Smol, 2010). During cold
periods when lake ice cover is extensive, respired CO2 in the water column becomes trapped.
CO2 thus dominates the DIC pool under such conditions and pH declines accordingly. During
warmer intervals, the longer duration of the ice-free period encourages equilibrium between
dissolved and atmospheric CO2, eliminating supersaturation of CO2 in the water column and

! 6
allowing for greater photosynthetic activity. An increase in the drawdown of limnetic CO2
occurs shifting the DIC pool towards higher proportions of HCO3- and a concurrent pH increase
occurs (Wolfe, 2002). Several diatom-inferred pH models have demonstrated a close coupling of
lake-water pH to Holocene climatic fluctuations (Joynt and Wolfe, 2001; Wolfe, 2002; Michelutti
et al, 2007a).
Changes in catchment characteristics such as the extent and type of vegetation cover and
degree of permafrost development (continuous versus discontinuous) will significantly impact on
lake hydrological regime and the concentration of major ions and nutrients. As such, climate can
also influence pH in well buffered sites via increased mineralization in catchments that can occur
with warming leading to a greater influx of base cations into the lake (Antoniades et al, 2005;
Larsen et al, 2006; Douglas and Smol, 2010). Similarly, decomposing organic matter in the lake
catchment, such as plants, release dissolved organic carbon (DOC) that is transported to lakes.
Whilst the physiological role of DOC in diatom populations is not well known, it appears that
higher DOC concentrations colour lake-water, effectively screening UV-B radiation from the
water column which has been linked to decreases in diatom photosynthesis (Vincent and Pienitz,
2000). Studies have demonstrated that in North American arctic tree-line regions, changes in
diatom assemblage compositions are strongly correlated with changes in lake-water DOC
(Ponader et al, 2002; Fallu et al, 2005). This relationship can be used to reconstruct ecosystem-
level response to catchment vegetation and climatic change particularly at sites near or north of
the tree-line where watersheds have sparse vegetation cover, short growing seasons, slow rates of
decay and thus low concentrations of DOC (Pienitz et al, 1999; Ponader et al, 2002).
The well-defined optima and tolerances of diatoms to climate-induced limnological
variables such as water depth, pH, temperature and DOC, have led to the use of sediment diatom
assemblages in providing an indirect record of environmental and climatic change over a variety
of time scales (Smol, 1988; An derson et al, 1996; Smol and Cumming, 2000). Furthermore,

! 7
when used in conjunction with calibration datasets and multivariate statistical methods, the
response of diatom taxa to important explanatory environmental variables can be modeled.
Holocene Paleoclimates of the Canadian Arctic and Subarctic
Studies using diatoms and other paleoclimatic proxy data have documented a variety of
physical and biological changes in the North American Arctic and Subarctic in response to recent
and past Holocene climate changes. These changes include decreases in freshwater-ice and sea-
ice extent (Comiso et al, 2008; Dibike et al, 2011a; 2011b), increased pollen concentrations (Viau
and Gajewski, 2009; Peros and Gajewski, 2009) and changes in algal community assemblages
found in lake sediments (Adams and Finkelstein, 2010; Rühland et al, 2008). Although broad
patterns of Northern Hemisphere Holocene climate changes have been deduced, the response of
ecosystems at the local scale to climatic perturbation vary significantly owing largely to gradients
in topography, surficial geology, vegetation cover and land-ocean-ice feedbacks (Kaufman et al,
2004; Finkelstein and Gajewski, 2008). To gain a greater understanding of the mechanisms
responsible for the temporal and spatial variability in Holocene climate, a dense network of sites
and proxy records with well-constrained chronologies are required (Unkel et al, 2010).
Paleoclimatic reconstructions from across North America suggest that the early Holocene
was as warm or warmer than present day climaxing during the Holocene Thermal Maximum
(HTM) (Gajewski and Atkinson, 2003; Finkelstein and Gajewski, 2007). However, a synthesis
of 120 sites exhibiting the HTM suggests that warming initiated at significantly different times
across the northern high latitudes from approximately 11,300 ± 1500 years BP in Eastern
Beringia, to < 6000 years BP in the eastern Canadian Arctic and High Arctic archipelago
(Kaufman et al, 2004). The spatial variability of the HTM is manifest in several diatom studies
with peaks in diatom concentrations and biogenic silica values occurring between 4500 and 3000
years BP in Melville Peninsula (Adams and Finkelstein, 2010) compared to between 10000 and

! 8
7000 years BP (Chakraborty et al, 2010) at sites in the southwest Yukon Territory.
It is understood that a geographically homogenous increase in total annual insolation
relative to present-day values and driven by Earth’s orbital forcing caused the HTM (Berger and
Loutre, 1991). The spatially varied response of ecosystems in the eastern Arctic to increased
insolation was also influenced by the presence of residual Laurentide Ice centered on Hudson
Bay and patterns of oceanic and atmospheric circulation in the North Atlantic region (Kaufman et
al, 2004, Ren et al, 2009). Areas downstream of the Laurentide Ice Sheet (LIS) were cooled by
advection through the atmosphere, and by meltwater and iceberg discharge into Hudson Bay’s
adjacent seas (Ren et al, 2009). As a result, the persistence of Laurentide Ice in the Hudson Bay
region shaped the Holocene climate history for much of eastern Arctic and Subarctic Canada.
Evidence from chironomid-based summer air temperature reconstructions (Rolland et al,
2008) sediment diatom assemblages (Joynt and Wolfe, 2001; Paul et al, 2010) and pollen records
(Garralla and Gajewski, 1992) suggests that the HTM occurred between 7000 and 3600 years BP
in Foxe Basin, northern Baffin Island, mainland Nunavut and subarctic Quebec. During the
HTM in these regions, summer temperatures may have been up to 2.2°C warmer than present
(Kaufmann et al, 2004) and characterized by more complex and diverse diatom assemblages
(Rolland et al, 2008). Pollen analyses from a site in subarctic central Quebec suggest a warm,
dry period with increased abundances of open forest taxa such as Betula papyrifera dominating
assemblages between 4700-3900 years BP indicative of a brief HTM (Garralla and Gajewski,
1992). Similarly, high percentages of Pinus pollen after 6800 years BP in peat profiles from
Cochrane (Kettles et al, 2000) and the presence of a Poplar forest at R Lake on the Sutton Ridges
in the Hudson Bay Lowlands and macrofossils of aquatic plants such as Najas whose modern
northern range limit is more than 100 km to the south of the R Lake study site between 6500 and
3000 years BP, also support the presence of the HTM in northern Ontario (McAndrews et al,
1982).

! 9
However, paleoclimatic data from other sites in northern Quebec, southern Baffin Island
and Southampton Island suggests that stratigraphic changes in diatom at several lakes have been
minimal during the last 6000 years (Wolfe, 1991; Laing et al, 2002; Saulnier-Talbot et al, 2003).
Diatom data from these locations are consistent with findings from pollen-based vegetation
reconstructions which observe no significant movement of treeline in northern Quebec since the
postglacial forest maximum ca. 5000 years BP (Richard, 1981; Payette and Lavoie, 1994; Lavoie
and Payette, 1996) and chironomid-based temperature reconstructions from several lakes in
northernmost Quebec and Southampton Island which highlight little temperature change during
the last 6000 years BP (Saulnier-Talbot et al, 2003; Fallu et al, 2005; Rolland et al, 2008). As
such, considerable variation in the response of paleoecological proxies and regions to the HTM
and other climatic changes has been documented in relation to local topography, geology and
proximity to Hudson Bay and Hudson Strait (Gajewski et al, 1993).
Similar patterns are noted in Hudson Bay (HB) using productivity and
micropaleontological indicators in marine sediment cores (Sawada et al, 1999; Haberzettl et al,
2010). In southern HB, dinocyst and foraminiferal assemblages indicative of subarctic conditions
possibly warmer than present and relatively well-oxygenated bottom waters with high biogenic
production indicate that interglacial conditions were established at approximately 6500 years BP
(Bilodeau et al, 1990). However, low biogenic production and high outwash deposition related to
cold Arctic water masses and the persistence of dense seasonal sea-ice cover until 4000 years BP
in northern HB suggest a muting of the HTM similar to that noted in northern Quebec (Bilodeau
et al, 1990; Haberzettl et al, 2010).
The HTM was followed by a period of cooler temperatures, identified as the Neoglacial
that began as early as 6000 years BP but became more severe after 3000 years BP across much of
the Canadian high latitudes and had a significant impact on the functioning of ecosystems on a
large scale (Kaufman et al, 2004). Evidence of this is demonstrated by decreases in diatom

! 10
production after 4000 years BP concurrent with a shift in species assemblage composition
between 2000 - 2500 years BP on Baffin Island (Wolfe, 2003) and between 3200 and 3000 years
BP from Melville Peninsula (Adams and Finkelstein, 2010). Dinoflagellate records from southern
HB show that Neoglacial cooling was accompanied by more extensive sea-ice cover and colder
surface water temperatures between 4000 and 2000 yrs BP (Ren et al, 2009; Haberzettl et al,
2010). In the Hudson Bay Lowlands (HBL), increased peat accumulation associated with high
abundances of Sphagnum spores and fewer tree macrofossils suggest that Neoglacial cooling was
evident after 3000 years BP in the western HB region (McAndrews et al, 1982; Kettles et al,
2000; Terasmae and Hughes, 1960). Furthermore, consistency in the timing of southward
treeline movement and decreases in lake-water pH inferred by pollen and diatom records from
two Northwest Territory (N.W.T.) tundra lakes, support the conclusion that the Neoglacial caused
widespread cooling across much of subarctic Canada between approximately 4000 and 2500
years BP (MacDonald et al, 1993; Rühland and Smol, 2005).
However, in the eastern HB region, pollen and macrofossil evidence documented from two
sites in northern boreal Quebec show evidence of cooler and drier conditions occurring
simultaneously between 5000 and 1500 years BP (Beaulieu-Audy et al, 2009) yet a diatom-based
DOC reconstruction from the same lake suggested that such catchment vegetation shifts in
response to Neoglacial cooling were too subtle during the last 3000 years to cause pronounced
variations in lake DOC in northern Quebec (Ponader et al, 2002). As such, variability in the
timing and magnitude of ecosystem response to Holocene climate change across the Canadian
high latitudes is apparent (Podritske, 2006).
Superimposed on patterns of Holocene supra-millennial scale climatic change are sub-
millennial scale climate events documented in the eastern Canadian Arctic and Subarctic, most
notably the Medieval Warm Period (MWP) from 900 to 1100 AD and the Little Ice Age (LIA)
between 1450 to 1850 AD (Mann et al, 2008). Chironomid (Rolland et al, 2009), diatom (Adams

! 11
and Finkelstein, 2010) and pollen (Viau and Gajewski, 2009) records have revealed that these
short-lived climatic events promoted catchment and limnological changes that caused ecosystem
shifts across a variety of sites in the eastern Canadian Arctic and Subarctic, although these
changes were smaller in magnitude than those documented for the HTM and Neoglacial periods.
A series of written diaries describing weather patterns in Churchill were analyzed to determine
synoptic climate data for the period 1715-1910; these documents provide a form of historical
evidence to suggest that a period of colder temperatures occurred during the early 1700’s
consistent with LIA trends observed in the paleoecological record (Ball and Kingsley, 1984; Ball,
1985; 1994). The cold LIA period was followed by a trend towards consistently warmer mean
summer air temperatures after 1852 (Ball and Kingsley, 1984) similar to trends noted across
much of Arctic and Subarctic Canada (Overpeck et al, 1997).
Common to several diatom records from the Canadian High Arctic (Douglas and Smol,
1999), the boreal and tundra regions of the Canadian Subarctic (Moser et al, 2002; Rühland and
Smol, 2005), and the northern Canadian Cordillera, is a consistent and unprecedented shift in
diatom community dynamics within the last 150 years. Syntheses of diatom records from
remote sites located away from the direct influence of human disturbance have linked these
diatom assemblage shifts primarily to climate warming via a lengthening of the ice-free season
and its associated impacts on limnological variables (Smol et al, 2005). Increased primary
productivity as well as significant taxonomic shifts have also been noted across trophic levels,
amongst diatom, chrysophyte and chironomid communities, all of which have been linked to the
increasing availability of new habitats, enhanced lake nutrient levels and thermal stratification
associated with climate warming (Douglas and Smol, 1999; Sovari and Korhola, 2002).
In several diatom records, recent climate warming has been linked to a shift in the ratio of
benthic to planktonic diatoms throughout the late Holocene (Rühland et al, 2008). A decrease in
the duration of ice cover as a result of warming can cause an expansion of diatom habitats

! 12
available within the water column via increased water depth and deepened light penetration
(Douglas and Smol 2010; Paul et al. 2010). Shifts from diatom assemblages dominated by
benthic taxa such as Fragilaria spp. to ones dominated by planktonic taxa such as Cyclotella spp.
are thus linked to warming. During colder years, diatom assemblages are dominated by littoral,
benthic taxa with the opposite occurring during warmer periods where higher diatom
concentrations are found representative of a well-developed littoral zone and extensive habitat
availability within the water column (Smol, 1988; Rühland et al, 2003). Further support for
recent climate changes influencing diatom species compositional shifts are provided by several
detailed studies of diatom communities in the Canadian High Arctic where in modern studies,
benthic Fragilaria taxa are frequently present at their highest relative abundances when lake-ice
cover is extensive, and in fossil studies of sediments deposited during the Little Ice Age cold
interval (Wolfe, 2003; Smith, 2002; Finkelstein and Gajewski, 2008).
Similarly, a temperature-driven inverse relationship between different species of planktonic
diatoms has also been noted (Rühland et al, 2008). Evidence that warming is favouring smaller
organisms in aquatic ecosystems has been documented in many paleolimnological studies where
larger, heavier species are replaced by smaller, lighter species as thermal stratification is
enahnced (Winder et al, 2009; Yun et al, 2010). Sinking rate is a strong selective pressure among
planktonic diatoms and has been reported most commonly from arctic and subarctic
investigations in relation to the abundances of Cyclotella spp. relative to Aulacoseira spp
(Rühland et al, 2008) whereby Aulacoseira, a more silicified and heavier diatom, requires more
turbulent conditions to remain suspended in the water column. Since temperature and water
column stability are intimately linked (Byllaardt and Cyr, 2011), warmer conditions promote
enhanced thermal stratification increasing water column stability, reducing turbulent mixing and
thus allowing the smaller, lighter Cyclotella spp. to outcompete the heavier Aulacoseira spp.
(Rühland and Smol, 2005). This inverse relationship has been noted in recent studies in both
! 13
European and North American lakes since 1850 AD (Sorvari and Korhola 1998; Rühland et al.
2008). Quantitative lake-water temperature inference models based on the modern diatom
assemblages of 61 Baffin Island lakes also support the conclusion that such diatom species shifts
are consistent with increased summer lake-water temperatures of up to 2°C during the past 150
years (Joynt and Wolfe, 2001).
Recent changes in diatom community composition as a result of climate warming appear
generally synchronous, widespread and relatively uniform across the circumpolar region, a
pattern unprecedented in records from the earlier Holocene where few diatom records derived
from the Canadian Arctic and Subarctic reveal the same spatial or temporal consistency (Smol et
al, 2005; Podritske and Gajewski, 2007). Although many paleolimnological studies have now
been completed in the Arctic (Pienitz et al, 2004), most have focused on the last few centuries
and are often at low resolution particularly throughout the early postglacial period (Smol et al
2005). Furthermore, a lack of spatial coverage across much of the Canadian Subarctic has
resulted in some important data gaps in certain sensitive geographic regions such as the Hudson
Bay region.
Hudson Bay and the Hudson Bay Lowlands
With a total surface area of 1.24 x 10⁶ km2 (Hare et al, 2008), the Hudson Bay marine
system, comprised of Hudson Bay (HB), James Bay (JB) and the Foxe Basin, is the largest inland
sea in the world (Gagnon and Gough, 2005a). Compared to other regions at similar latitudes the
climate of HB and its adjacent terrestrial landscape (from herein referred to as the HB region) is
anomalously cold. HB is the most southerly body of Arctic marine water and concurrently
supports the most southern Arctic marine ecosystem in the world (Hare et al, 2008). Within the
HB terrestrial environment, treeline reaches its southernmost position in North America where it
intersects James Bay. This is also the southernmost position of continuous permafrost in North

! 14
America. Compared to the same limits in the northwest near the Beaufort Sea, treeline is 1600
km further south in the HB region (Rouse, 1984). Comprising a geographically large part of the
HB region is the Hudson Bay Lowland (HBL) and its extensive peatlands. At 325,000km2, the
HBL peatlands are the largest in North America and play a significant role in the global climate
by storing vast amounts of carbon as partially decomposed organic matter (Gorham, 1991; Moore
et al, 1994). Due to the extent of the HBL peatlands and their large carbon content, the effect of
climate change on these peatlands is of major concern (Tarnocai, 2006). Necessary to the
maintenance of peat accumulating ecosystems are cool climates, stabilized water levels,
anaerobic conditions and decreased nutrient availability causing decreased rates of
decomposition. Thus, if the climate becomes drier and/or warmer, the functioning and
distribution of this sensitive ecosystem could be significantly altered.
Decreases in sea-ice extent and thickness in HB and concomitant reductions in snow cover
on land are key concerns for the maintenance of the HBL peatlands as they will influence the
temperature and hydrological regime of the HBL (Tarnocai, 2006). As such, it is important to
understand the mechanisms through which HB moderates the climate of the HB region.
The HB marine system differs from the Arctic Ocean and adjacent seas in that it is
essentially a closed system and thus isolated from the effects of open water circulation, warm
water intrusions and sea-ice export (Wang et al, 2004; Hoccheim et al, 2010). As a result,
variations in sea-ice concentration and extent are generally more reflective of atmospheric
forcings including the North Atlantic Oscillation, the Arctic Oscillation and Southern Oscillations
(NAO, AO and SOI respectively) and related air temperature and wind patterns (Hochheim et al,
2010). Shifts in the large-scale patterns of atmospheric circulation between the positive and
negative modes of the NAO, SOI and AO are thought to manifest locally as surface air
temperature and wind anomalies (Prisenberg et al, 1997). For example, the NAO is defined as a
north-south oscillation in the pressure field between the Icelandic low and the Azores high and

! 15
alternates between its positive and negative phases at decadal to multi-decadal timescales
(Parkinson and Cavalieri, 2008). During positive NAO years the Icelandic Low becomes
anomalously deep, resulting in low-pressure anomalies and the southward movement of cold,
arctic air over the area west of Iceland and Greenland inducing cold anomalies over much of
eastern Canada (Qian et al, 2008). Qian et al, (2008) demonstrated that HB sea-ice anomalies are
positively correlated with the NAO, whereby during the years when a strong positive NAO
prevails, increased sea-ice extent often occurs in HB. Furthermore, when a strong positive NAO
combines with a strong negative SOI, extremely cold temperatures and earlier sea-ice formation
are noted in HB (Joly et al, 2009; Hoccheim et al, 2010).
Whilst inter-annual variability in HB sea-ice thickness, duration and extent is underpinned
by decadal-scale changes in the natural modes of variability in atmospheric circulation, recent
warming in the Arctic and Subarctic has accelerated, with temperature increases and rates of sea-
ice loss far greater than those explained by natural shifts in atmospheric circulation alone
(Holland et al, 2006). It has been suggested that a ‘tipping point’ may have been passed as a
result of strong positive feedbacks leading to accelerated sea-ice retreat during an era of thinner,
less extensive ice cover in the Arctic (Lindsay and Zhang, 2005). Trends in the timing of sea ice
duration HB between 1979-2008 reveal that the rate of decline has accelerated from -3% per
decade between 1979-1996 to -10.7% per decade between 1997-2007 with progressively later
freeze-up dates (Comiso et al, 2008; Hoccheim et al, 2011). Consequently, in recent years, there
has been a substantial increase in the length of the melt season in HB and evidence is mounting
that such observed changes are associated with anthropogenically driven climate change
(Johannessen et al, 1999). The rate at which these reductions in sea-ice are occurring is of
particular concern since it will significantly impact on the ability of ecosystems to adapt.
Sea-ice is a vital factor in moderating the climate of the HB region. Typically in regions
close to a large water body, climate is moderated by the slow release of heat during the winter.

! 16
However, the extent and thickness of sea-ice coverage in HB throughout most of the year (> 90%
from December to May) (Qian et al. 2008; Joly et al, 2009) creates an insulating layer between
HB waters and the overlying atmosphere, significantly limiting the exchange of sensible heat
between the water and the atmosphere. Thus, almost total sea-ice coverage from December to
May serves to nullify the moderating effects of HB waters during the winter making the
prevailing climate colder (Gagnon and Gough, 2005b; Bhatt et al, 2010). Furthermore, the
persistence of sea-ice in HB until June-July means that HB waters are unable to warm
significantly until the ice-free season (Qian et al, 2008). Cold temperatures are also maintained
during the summer by the prominence of a significant regional scale pressure gradient in response
to horizontal differences in surface heating between the land and HB waters. The pressure
gradient results in an increase in the frequency of onshore winds which are up to 5°C cooler than
offshore winds, between May and August extending up to 65 km inland (Rouse and Bello, 1985;
Rouse, 1991).
The persistence of a colder climate throughout the year in response to extensive sea-ice
results in snow being maintained on land for longer periods of time than would otherwise occur
causing a greater proportion of radiant energy to the surface to be reflected back to space and lost
for surface warming. As a result, the presence of HB creates a steep gradient of terrestrial
landscape change throughout most of the year from the interior towards the HB coast with
climate changing rapidly from temperate continental boreal conditions in the west-southwest to
arctic conditions along the coast of HB contributing significantly to the cool climatic conditions
necessary to the maintenance of permafrost in the HBL peatlands.
Although research remains limited, investigations into the impact of earlier sea-ice melt in
HB on the climate of the surrounding region suggest that temperatures inland of HB could
increase by up to 3.5°C if the melt season were initiated 30 days earlier than at present (Rouse
and Bello, 1985). This would result in an increased rate of evaporation and a lengthening of the

! 17
growing season, likely causing a shift in the position of treeline and discontinuous permafrost
zone to between 2° and 4° latitude further north (Rouse and Bello, 1985; Rouse, 1991).
For the HBL, an increase in temperature would result in an increase in evaporation rates
likely encouraging the drawdown of the water table, exposing much of the peatlands to a more
aerobic environment. Since cold-climate peatlands like the HBL can only exchange gasses with
the atmosphere during thawed conditions the emission and/or uptake of CH4 and CO2 will vary
significantly with peatland functioning primarily related to climate and its impact on plant
growth, permafrost degradation and depth of the water table. Additionally, loss of freshwater-ice
as a result of increasing temperatures is expected to significantly impact on energy and moisture
exchanges in the HB terrestrial environment via changes in precipitation and snow melt patterns,
as well as evaporation, flooding and wetland formation (Prowse and Brown, 2010; Woo, 2010).
A recent study highlighted the potential impact of changing wetland conditions on
atmospheric CO2 and CH4 fluxes (Finkelstein and Cowling, 2011), whereby a statistically
significant negative correlation was identified between atmospheric CO2 levels measured in the
Antarctic Law Dome ice core and the extent of North American wetlands. The work suggests
that the expansion of wetlands may account for small decreases in atmospheric CO2 noted during
the last 2000 years, related to the accumulation of carbon stored in peat. Similarly, Tarnocai and
Stolbovoy (2006) estimated that if the current trend in climate warming continues, the melting of
permafrost in Canadian peatlands could prompt the release of approximately 40 Gt of carbon into
the atmosphere, > 80% of which will come from the HBL. Alternatively, climate warming could
instead result in permafrost melting, causing bog environments to revert back to wetter fen
environments thereby increasing peatland carbon storage. Evidently, significant uncertainty
exists in relation to the future of northern peatlands and their impact on the global climate under
altered climatic conditions and consequently, peatlands and permafrost have been identified as
two of four key vulnerable carbon pools within the Earth system (Tarnocai, 2006). As such the

! 18
HBL represents a region of high importance for paleoclimatic reconstructions.
Despite the sensitivity of the HB region to climate change, data concerning paleoclimates
in this area and their impacts on carbon storage remain limited. Early research carried out on the
western coasts of HB and JB highlight the complexity of reconstructing climate due to the
region's deglacial history (McAndrews et al, 1982; Ball, 1983; Klinger and Short, 1996). The
substantial load of the LIS depressed the Earth’s surface 100 - 315 m below its present position,
allowing the Tyrrell Sea to flood the HBL subsequent to deglaciation (Lee, 1960). Once the
loading from the ice mass was removed, significant isostatic uplift of the land surface began,
ranging from a submergence rate of -10 m per 1000 years between 8000 - 7000 years BP to an
emergence rate of +24 - 26 m per 1000 years between 4000 - 3000 years BP, to +8 - 10 m per
1000 years from 1000 years BP to present (Andrews and Peltier, 1989). As such, the postglacial
vegetation and peatland evolution of the HBL landscape have been driven in large part, by these
patterns and rates of uplift (Glaser et al, 2004). Faster rates of uplift near the coasts have
impeded regional drainage, caused water levels to rise and resulted in the maintenance of
waterlogged soils from the time of land emergence. Therefore, difficulties in separating the
effects of isostasy, peatland succession and climate-driven changes on the vegetation
communities throughout the Holocene in the HBL have severely hampered the interpretation of
pollen records from the region.
Of the existing Holocene paleoclimatic studies undertaken in the HB region, most have
been obtained from peat cores (Kettles et al, 2000; Glaser et al, 2004) which reveal more local
patterns of vegetation change (Faegri and Iversen, 1989). Additionally some records are
hampered by low resolution and/or poor chronological control (McAndrews et al, 1982), have
exclusively utilized pollen (McAndrews et al, 1982), are located in peripheral regions such as
Southampton Island (Rolland et al, 2008) and the James Bay Lowlands in Quebec (Fallu and
Pienitz, 1999; Loisel and Garneau, 2010), where climate and topography are significantly
! 19
different. Furthermore, although paleolimnological investigations into diatom shifts related to
recent warming have been well documented for the Canadian High Arctic and parts of the central
Canadian Subarctic (e.g. Smol et al, 2005; Rühland and Smol, 2005) few studies are available
from the western HB region.
Based on paleoclimatic records obtained from regions peripheral to HB, there is little
evidence to suggest that global warming has caused significant ecological changes during the
Holocene with the exception of approximately the last decade (Fallu et al, 2005; Rolland et al,
2008; Hoccheim et al, 2010). This delayed warming is in stark contrast to the sudden and
prolonged warming observed in most other arctic regions since the termination of the LIA 150
years BP (Smol et al, 2005) and severe climatic fluctuations noted throughout the last ca. 7000
years (Kaufman et al, 2004). The sudden response of ecosystems peripheral to HB to climatic
warming during the last ca. 15 years suggests that it is becoming increasingly important to
understand the varied spatial and temporal manifestations of global warming in different arctic
and subarctic ecosystems.

! 20
Research Objectives
Given that limnological studies in the western HB region are still rare, research in this
remote area is important for developing improved estimates of natural variability in ecosystem
dynamics and their responses to environmental changes. Therefore the main research questions
to be answered in the study are as follows:
• How have diatom assemblages changed throughout the middle and late Holocene in two
lakes from the western Hudson Bay region?
• How do the magnitudes of changes compare between the pre and post-industrial periods?
• Do the timing and magnitude of these changes correspond to middle and late Holocene
diatom assemblage shifts identified from previous studies?
• Can the diatom record from Lake AT01 be used to infer aspects of regional climate change
in the HBL in terms of contributing to the differentiation of allogenic and autogenic
signals in other records?
• Do previously determined controls over diatom assemblages such as ice cover, habitat
availability and thermal stratification correspond to the qualitatively inferred climatic
changes in the two lakes based on the ecological optima and preferences of the different
species/genera found?
!

! 21
CHAPTER 2
Explaining diatom community shifts in a 7000-year Holocene record from a kettle lake in
the central Hudson Bay Lowlands, Canada
Abstract
Changes in diatom assemblage composition were examined from the sediments of Lake AT01
(53°16.505’ N, 84°12.514’ W, 115 m a.s.l.) a small, isolated kettle lake located on an end
moraine in the Hudson Bay Lowlands (HBL). Diatom shifts over the last ca. 7000 years were
related to the response of this ecosystem to climatic and hydrological change throughout the
Holocene. Despite the climatic sensitivity of the region, a detailed diatom analysis for the
Holocene has not yet been undertaken. Diatoms were present at 6730 years BP with an
assemblage initially characterized by cold-water tolerant, benthic Fragilaria species. After 6300
years BP the diatom assemblage became dominated by large benthic taxa and high relative
abundances of Cymbella diluviana consistent with the timing of the Holocene Thermal Maximum
in subarctic Canada. Abrupt changes between 2000 and 400 years BP were suggested by a
compositional shift to a diatom assemblage indicative of lower lake level characterized by peak
abundances of several acidophilic and epiphytic taxa in tandem with an uncharacteristically low
sedimentation rate. Several potential mechanisms for a period of low sedimentation between
4500 and 400 years BP are examined, including a possible cool and dry climatic interval during
the late pre-industrial Holocene or a hiatus in the sediment record. One possible explanation for
limnological changes after 4500 years BP is associated with glacial thermokarst processes, which
may have induced a drainage event. During the 20th century the diatom assemblages were
consistent with an unprecedented and climatically induced ecosystem shift characterized by

! 22
substantial increases in planktonic taxa associated with shorter duration of ice cover and a longer
growing season consistent with other circumpolar records.
Introduction
Arctic and subarctic regions are highly susceptible to environmental variability particularly
in relation to climatic warming (Rühland et al, 2003). Whilst GCM’s vary in their projections of
the magnitude of regional climate change, they consistently highlight the polar amplification of
warming at high northern latitudes (Serreze et al, 2000). The importance of the polar regions lies
with their intimate connections to ocean circulation, positive albedo feedbacks, and biospheric
moderations of greenhouse gas concentrations (Joynt and Wolfe, 2001). Observed climatic
trends suggest that average surface air temperatures have increased by !0.3°C per decade during
the 20th century (Keyser et al, 2000), with increases predicted to reach up to 4°C across subarctic
regions during the next century (Hengeveld, 2000). The potential for climate warming to
reorganize global ecosystems in terms of their location, expanse and character prompts the need
to understand how sensitive ecosystems may respond to future warming.
Peatlands have been listed as one of four key vulnerable carbon pools within the Earth
system likely to be altered by climate warming (Tarnocai, 2006). The Hudson Bay Lowland
(HBL) peatlands are the second largest peatlands in the world and the largest in North America
(Glaser et al, 2004). Owing to poor drainage and cool climatic conditions, the HBL stores vast
amounts of carbon as partially decomposed organic matter (Moore et al, 1994). However, the
functioning of this sensitive ecosystem under a warmer climate is largely unknown.
Across the central and eastern Canadian subarctic, evidence of temperatures up to 2.2°C
warmer than present (Kaufman et al, 2004; Rolland et al, 2008) during the Holocene Thermal
Maximum (HTM) (6000 - 4000 years BP), followed by cooler climatic conditions during the
Neoglacial period (ca. 4000 - 2500 years BP) have been inferred using diatom and pollen

! 23
analyses of peat and lake sediment profiles (McAndrews et al, 1982; Garralla and Gajewski,
1992; Rühland and Smol, 2005). However, spatial analyses of available paleoclimatic proxy data
have highlighted that the response of ecosystems to climate warming has been geographically
varied (Kaufman et al, 2004). Within the Canadian subarctic, the HBL marks a transitional zone
between the climate of northern Quebec, which is moderated by open water, and the more
continental climate of the Northwest Territories. Large dissimilarities in modern and
paleoclimatic data between sites from these adjacent regions confirm the importance of
understanding the varying drivers and impacts of climatic change across different regions.
Subarctic Quebec is the closest climate analogue to the HBL in Canada. Numerous
paleoclimatic records from this region have highlighted that climate change has resulted in
significantly altered ecosystem functioning throughout the Holocene (Ponader et al, 2002; Fallu
and Pienitz, 1999). However, in the HBL where a substantial portion of global terrestrial carbon
is located, ecosystem changes similar in magnitude to those documented in subarctic Quebec are
likely to have a greater impact on the global climate system via the potentially large release of
carbon from the HBL peatlands. Despite their importance, there are little data available
concerning how the HBL has responded to climate change in the past and how it may respond
under future climate warming scenarios.
Paleoclimatic research in the HBL is restricted to pollen and macrofossil analyses including
only one lake sediment record in which pollen and macrofossil analyses reveal little change in
Holocene climate with the exception of a possible increase in precipitation and cooler
temperatures after 3000 years BP (McAndrews et al, 1982). However, poor chronological
control makes it difficult to relate this record to larger-scale patterns of climatic change.
Furthermore, the interpretation of paleoecological records concerning HBL peatland initiation in
relation to climatic change is complicated by dynamic local hydrology and patterns of vegetation
succession related to ongoing regional isostatic uplift (Klinger and Short, 1996; Kettles et al,

! 24
2000; Glaser et al, 2004).
Diatoms provide an indirect record of climatic change as they are known to respond
sensitively to changes in limnological conditions associated with the duration of seasonal ice
cover, length of the growing season, water chemistry and habitat availability (Smol, 1988; Lotter
and Bigler, 2000, Wolfe, 2002). Several studies spanning the Canadian Arctic and Subarctic
(Rühland et al, 2003; Smol et al, 2005; Smol and Douglas, 2007) have documented distinct
compositional shifts in diatom communities and significant increases in diatom diversity and
productivity (LeBlanc et al, 2004; Antoniades et al, 2005), likely in response to climatic warming
within the last few centuries. Increases in the relative abundances of small planktonic Cyclotella
spp. concurrent with decreases in benthic Fragilaria taxa from several subarctic sites in Finland
and Canada (Sorvari et al, 2002; Rühland et al, 2003) have been associated with warming-
induced decreases in lake-ice cover and related changes in the strength of thermal stratification
and extent of subsurface habitat development (Rühland et al, 2008). However, several of these
studies span only a short time period and have chronologies limited to the last 150 years using
210Pb dating methods (Smol et al, 2005). Studies that assess diatom communities over longer
time scales allow recent community shifts associated with climatic change to be examined within
the context of ecosystem response to past natural climate variability (Podritske and Gajewski
2007). Furthermore, the opportunity to study a lake site disconnected from the underlying
groundwater system may allow the interpretation of ecosystem changes independent of the
dynamic hydrological shifts which influence the surrounding peatlands.
In order to determine whether limnological conditions in the HBL have changed during the
Holocene and to understand the nature of any such changes, a high-resolution diatom analysis
spanning the last 7000 years is presented from Lake AT01, Northern Ontario, Canada. This
paper focuses on two key research questions; (1) how have the diatom assemblages changed
throughout the Holocene in Lake AT01 particularly in relation to their magnitudes during the pre-

! 25
versus post-industrial periods? (2) Can the timing of these changes be related to regional patterns
of climatic change in order to distinguish between local and regional shifts in climate and
hydrology?
Materials and Methods
Study area
Lake AT01 (53°16.505’ N and 84°12.514’ W) is a small (55.26 ha, maximum known depth
= 6 m), alkaline (pH 8.8) lake located in the Hudson Bay Lowlands (HBL), northern Ontario,
Canada (Figure 1). The HBL comprise a low-lying bedrock plain with an average elevation of 90
m a.s.l. (Dredge and Cowan, 1989). The plain was formed by subaerial denudation under
Pleistocene ice sheets and is underlain by Paleozoic and Mesozoic limestone and shales (Dredge
and Cowan, 1989). More than 90% of the HBL is comprised of saturated peatlands (Riley, 2003)
which have spread across the low lying bedrock plain during the last 5000 - 6000 years forming
the largest continuous peat basin in North America (Glaser et al, 2004). Peat thickness varies
from approximately 30 cm in marsh wetlands in the northern HBL up to 4-5 m in inland bogs and
coastal fens (Klinger and Short, 1996; Martini 2006). Wetland vegetation, predominantly black
spruce, tamarack, Sphagnum and other mosses, sedges and shrub birch dominates the HBL
(McAndrews et al, 1982) with a few isolated limestone reefs and bioherms supporting spruce-
lichen woodlands.
Lake AT01 is located on the western flank of an asymmetric ridge, likely an end moraine,
which originated along a former ice margin of the Laurentide Ice Sheet (P. Barnett, pers.
commun. March 2011). The ridge ranges in elevation from 90 m to 160 m a.s.l with AT01
located at 115 m a.s.l (Figure 2). Although the exact bathymetry of Lake AT01 is unknown, in-
situ sonar measurements and observations from the air suggest that the bathymetry of AT01 is
irregular with an underwater ridge in the center of the lake that has resulted in the formation of a

! 26
small island. Numerous kettle holes, formed by the melting of trapped or buried ice blocks are
noticeable from areal photos and a digital elevation model (DEM) of the study region (Figure 2)
suggesting that AT01 is a kettle lake. During the incursion of the Tyrell Sea in the HBL after
8000 years BP, the entire moraine was submerged by seawater, evidenced by abandoned
shorebluffs and former beach bars shown on the DEM (Figure 2). As a result, marine clay now
overlies much of the bedrock in the region. The island in AT01 supports the growth of spruce
and willow, and a spruce forest surrounds the lake. An abundance of charcoal was noted on the
island and around the lake suggestive of recent fire activity.
Located in the high boreal forest ecoclimatic region, climate of the HBL is characterized by
a humid, microthermal Arctic climate with relatively short, mild summers and long, cold winters
with a mean annual temperature of -4°C, mean summer temperature of 15°C, and mean winter
temperature of -23°C (Environment Canada, 1988; Martini, 2006). Precipitation is moderate to
high with a mean annual precipitation of approximately 750 mm with between 200-240 cm of
snow precipitation (Environment Canada, 1988). Wind regime is consistent and strong (Martini,
2006) with regional climate influenced by Arctic air masses that travel southwards unimpeded by
topographic obstacles. Cold Arctic waters transported into Hudson Bay move along a
geostrophic anticlockwise current and also result in frigid air masses that cool the western coasts
of Hudson Bay and James Bay (Martini, 2006).
Since most other lakes in the region are shallow (< 1m in depth), thermokarst-type systems,
Lake AT01 offers an ideal site for paleoclimatic and paleoenvironmental studies. It is deep
enough to preclude both ice disturbance of bottom sediments and periodic drying and thus its
sediment record is likely to contain an uninterrupted post-glacial sequence.
Field methods
Core AT01-L2 was sampled from the northeastern part of the AT01 basin in August 2010.

! 27
It is a remote site requiring helicopter access and use of the DeBeers Victor Mine site as staging
area (Figure 1). A 238-cm sediment core was retrieved in 1-m sections using a Livingstone
piston corer (Wright, 1967) from a raft anchored at three points. Since bathymetric data for
AT01 are not available, the deepest part of the lake was determined visually from the air and
quantitatively using sonar measurements in portions of the lake. Core sections were extruded in
the field, packaged in PVC tubing and shipped to the Paleoecology Laboratory at the University
of Toronto, Ontario for future analysis. Due to the high water content of the sediments at the top
of the core, approximately the uppermost 5-cm of sediment was lost during core extrusion. To
capture the uppermost, unconsolidated sediment/water interface undisturbed, six short (ranging
from 10-37-cm in length and named G1-G6) cores were retrieved using a Glew gravity corer
(Glew, 1988) and extruded in the field on the day of sampling. Samples were extruded into
Ziploc® bags at 0.5-cm intervals using a portable extruding device (Glew, 1988) to allow for high
resolution analysis of the most recent sediments from AT01. A YSI-600QS multi-parameter
probe was used to measure in-situ limnological variables including; pH, temperature and specific
conductance (Table 1). Replicate epilimnetic water samples were collected at 0.5-m depth and
stored in pre-cleaned polyethylene bottles prior to extensive chemical analyses (Table 1) carried
out at AGAT Laboratories (Mississauga, Ontario), an accredited lab using standard protocols for
water quality analysis.
Laboratory methods
Core chronology was determined using both 14C and 210Pb radioisotopic dating methods.
Samples for 210Pb analysis of the recent sediments were sent to Flett Research Ltd (Winnipeg,
Manitoba), where dates were derived by subtracting unsupported isotopes from background
(supported) 210Pb activity; ages were estimated using constant rate of supply modeling (Table 2)
(Appleby and Oldfield, 1978). Samples were prepared for submission for 210Pb dating by sub-

! 28
sampling a known volume of sediment, drying to constant weight at 60°C, and grinding to a fine
powder.
Prior to core subsampling for other analyses, the sediment core was split lengthwise and
any observed plant macrofossils were removed for potential 14C dating. Several samples were
sieved and aquatic and terrestrial organic matter consisting of moss fragments, small twigs, plant
fibres and chironomid head capsules were individually picked from the sieved sediments for
radiocarbon dating. Radiocarbon dating of six samples was performed using Accelerator Mass
Spectrometry (AMS) at Beta Analytic Inc (Miami, Florida). Radiocarbon dates were calibrated
to calendar years before present (years BP) using the INTCAL09 calibration curve (Reimer et al,
2009). In the text, ages are estimated through extrapolation and interpolation from the dated
intervals and expressed as calibrated years before present (years BP) unless stated otherwise. By
convention in reporting radiocarbon dates, present day is 1950 AD. Therefore dates that are more
recent than 1950 AD are given a negative designation, ie. -25 yrs BP for 1975 AD. Both
calibrated and non-calibrated dates are listed in Table 3.
Loss on ignition (LOI) was used to estimate the organic (LOI550) and carbonate (LOI950)
content of the sediments (Heiri et al, 2001) at 1-cm increments between 0-30 cm and at 2-cm
increments throughout the rest of the core. LOI was used to ‘match’ cores G2 and L2 to create a
contiguous stratigraphy. Bulk density was calculated for the same intervals as used for LOI by
determining the ratio of dry weight of sediment (g) to wet sediment (mL) using data obtained
from the LOI analyses. Measurements of the magnetic susceptibility of the core were carried out
at 1-cm increments throughout the core using a Bartington MS2E high-resolution surface-
scanning sensor with measurements recorded manually to give a relative estimate of the magnetic
mineral concentration in the sediments (Unkel et al., 2010).
Sediment was subsampled from Core AT01-L2-G2 for diatom analysis at 58 points, at 1-
cm intervals (0-4.5 cm), 3.5-cm intervals (5-40 cm) and 5-cm intervals (40-250 cm). Diatom

! 29
preparation followed standard procedures (Rühland et al, 1999): subsamples of 0.5 ml were
treated with 10% HCl, followed by treatment with nitric and sulfuric acids (50:50 molar ratio)
and heated to fully digest the organic matter. Due to the highly flocculent nature of the AT01
sediments, a few drops of alcohol were added to encourage aggregation of the fine, highly
organic material. The samples were then successively rinsed with distilled water until neutral.
The resulting diatom slurries were mounted onto glass microscope slides using Naphrax®. A
minimum of 500 diatom valves were identified and enumerated per sample along horizontal
transects using a Zeiss microscope with differential interference contrast (DIC) optics and a 100x
oil immersion objective. If upon initial observation, transects contained few or no diatoms, at
least 10 transects were scanned to evenly assess the diatom assemblage in the sample.
Taxonomic identifications were based primarily on Cumming et al. (1995), Fallu et al. (2000)
and Krammer and Lange-Bertalot (1986-1991). Raw diatom counts were converted to relative
abundance data for each sample based on the total number of identified diatoms in each sample.
Broken diatom fragments were also enumerated if less than 50% of the diatom valve was present,
although these counts were not included in the raw diatom counts or percent abundance data. For
taxonomic clarity, a list of taxonomic names that are currently being used by diatomists together
the synonyms of previously accepted names are given in Appendix C.
Statistical methods
Diatom-based biostratigraphic zones were established by cluster analysis using constrained
cluster analysis with incremental sum of squares partitioning (CONISS) (Grimm 1987) and a
squared chord distance dissimilarity coefficient (ZONE v 1.2, Juggins 1992). Only diatom taxa
with a maximum abundance of at least 1% and > 2 occurrences and samples with counts of > 100
valves were retained in the analyses. A diatom biostatigraphic diagram was produced using C2 v
1.6.8. software (Juggins 2009). The Shannon-Weiner Index (H’) was computed as a measure of

! 30
species evenness (Krebs, 2001) and computed using CANOCO v 4.5.3 (Ter Braak and Simlauer
1998). Since the concentration of diatoms in lake sediments can be used as a proxy of diatom
production (Podritske and Gajewski, 2007) diatom concentration for each sample was calculated
and given as number of valves per unit volume and dry weight of sediment (see Appendix D for
formula).
The fossil diatom assemblages were analyzed by detrended correspondence analysis (DCA)
using CANOCO v 4.5.3 (Ter Braak and Smilauer 1998) to detect the timing and magnitude of
major shifts in community composition in the record. For this purpose data were square-root
transformed to stabilize variance and rare taxa were downweighted. To make comparisons with
the timing of changes in the diatom data and other measurements throughout the core, the DCA
axis 1 and axis 2 samples scores were plotted in relation to core depth and age.
Results
Core chronology
The core chronology was developed using several 210Pb dates obtained from the uppermost
sediments and six AMS 14C dates (Table 2; Figure 3). The 210Pb profile for AT01 shows an
exponential decline in 210Pb activity from the surface to the bottom sediments with the exception
of between 9-17 cm where rapid sedimentation may have occurred over approximately 4 years
(1972-1976 AD) (Table 2). Unsupported 210Pb is contained within the upper 52.5 cm (1850 -
2010 AD according to 210Pb methods) highlighting an uncharacteristically high (> 2.34 mm!yr-1)
sedimentation rate compared to other subarctic lakes during the post-industrial period (Brothers
et al 2008; average for subarctic lakes over the last 150 years = 0.10 mm!yr-1). 210Pb data suggest
that ages can be estimated for the last 148 years with ages older than 80 years being
approximations only (Flett Laboratory, pers comms, March 2011).

! 31
The 14C chronology based on six 14C dates indicates that the sediments of AT01 extend
back to ca. 6840 years BP (Table 3). The uppermost 14C date (AT01 31-32) was sampled at 45
cm and yielded an age of ca. 132 years BP (1818 AD) (Table 3); when plotted with its 2-sigma
range error, the date was within the range of 210Pb dating and showed close agreement with the
bottommost 210Pb dates (Figure 3). However, based on the median probability age, AT01 32-33
implied an older age than the two bottommost 210Pb dates (Figure 3). An age-depth model was
established using an inverse third order polynomial (Edwards and Whittington, 2001; Blockley et
al, 2007) through the dates below 45-cm incorporating all six 14C dates (Figure 3). Ages were
interpolated between each radiocarbon date including the uppermost dates at 45-cm thus
excluding the two bottommost 210Pb dates from age interpolations.
Based on the age-depth model, three general trends in sedimentation rate occur in the AT01
record (Figure 3 and Table 4). Sedimentation rates between 251 - 88 cm (6840 – 4497 years BP)
are similar and reasonably high with an average rate of 0.82 mm!yr-1. Although much higher
with an average rate of 2.34 mm!yr-1, sedimentation rates also remained similarly linear
throughout the post-industrial period (0 – 45 cm) (2010 - 1818 AD). However, the time
encompassed by the depths 88 – 45 cm corresponds to a substantial reduction in sedimentation
rate (approximately 0.09 mm.yr-1) implied by the 14C ages yielded at 88 cm and 45 cm. Without
another 14C date between 88 – 45 cm it is difficult to further constrain exactly when this
transitional period of low sedimentation begins. Nonetheless, the transition period corresponds to
a marked reduction in the rate of sediment accumulation between 88 – 45 cm.
With the exception of a reduction in LOI550 values between 50 - 30 cm there is little
lithological evidence available to suggest any other physical change in sediment properties during
the transition period (Figure 4). Whilst magnetic susceptibility values begin to increase after 65
cm (Figure 4) it is difficult to interpret this trend independent of visibly apparent drying and
! 32
thinning of the core with decreasing depth.
General stratigraphic trends
The AT01-L2-G2 core consisted of highly organic algal gyttja and dy sediments typically
found in lakes where allochthonous catchment inputs are predominantly wetland plants (Wetzel,
2001). Organic dy is the predominant sediment type from the core surface to a depth of 238 cm
(> 6710 years BP); from 238 cm to 245 cm the sediment consisted of coarse, organic-rich sand,
followed by a brief relatively organic rich gyttja horizon between 245-247 cm overlying the basal
sediments (247-251 cm) which were comprised of sand. The transitions between sediment types
from 238 cm to the base of the core are noted in both the magnetic susceptibility and LOI values
(Figure 4). LOI550 is low at the base of the core (5%) with a small peak of 20% marking the short
organic rich horizon before sustaining higher values of > 50% throughout the middle and
uppermost sediments (Figure 4). A 15% decrease in LOI550 occurs between 1800 – 40 years BP
(50 – 30 cm) followed by maximum LOI550 values of 82% in the uppermost sediments.
Carbonate content, estimated by combustion of samples at 950°C, is generally high (>13%)
in the basal section between 251-238 cm with the exception of between 245-247 cm where it
drops to 5%. At 238 cm LOI950 decreases to 3% at 6710 years BP marking the transition from
carbonate and organic rich-sands to more organic sediments. Two notable peaks in the carbonate
content can be seen; the first occurs between 4810 – 4620 years BP (91 – 98 cm) and the second
in the uppermost sediments where values increase gradually from 2.5% to 9% between 1998 and
2010 AD (2.5 – 0.5 cm). Although brief, the magnitude of this increase in LOI950 values is
beyond that expected by lab error alone (Heiri et al, 2001).
Changes in sediment bulk density closely reflect the biostratigraphic zones based on the
diatom assemblages. Values above 0.15 g/cm3 were only noted below 240 cm and were thus
omitted from Figure 4 to allow for a clearer representation of the smaller magnitude changes
! 33
throughout the rest of the core. With the exception of three peaks between 251 - 240 cm, 140 -
130 cm and 48 – 25 cm, bulk density remains low (approximately < 0.075 g/cm3) and generally
consistent throughout AT01-L2-G2 (Figure 4). Greatest changes in bulk density occur between
50 and 0 cm (zone 1) with peak values of 0.125 g/cm3 and lowest values of 0.025 g/cm3.
Magnetic susceptibility is comparatively high in the basal sediments (60 S.I. units) but
remains low and unchanging (< 1.5 SI units) throughout the rest of the record (Figure 4).
However, above approximately 60 cm (ca. 3200 years BP) in the core and where greatest changes
in LOI550 values and diatom community dynamics occur, magnetic susceptibility could not be
measured accurately due to thinning of the core section as a result of drying subsequent to
collection.
Biostratigraphic trends
Diatoms appear at 241 cm (6730 years BP) and are reasonably well preserved throughout
the core. The AT01 diatom flora was relatively diverse, with a total of 101 taxa (30 genera)
identified (Appendix A). The assemblage was composed of predominantly benthic taxa and
showed a shift from large benthic to small benthic taxa at approximately 48 cm (after ca. 1200
years BP). In the most recent sediments (1980 - 2010 AD) an abrupt appearance of planktonic
taxa is noted. Diatom concentration remains low throughout the pre-industrial period with only a
gradual increase after 120 cm (5300 years BP) but increases threefold after 22 cm (1950 AD)
(Figure 4). Below 235 cm (6680 years BP) it was not possible to count > 500 diatom valves, thus
a cutoff of 100 valves counted was set for the sample to be included in the stratigraphic diagram
(Figure 5).
Cluster analyses of the diatom assemblages indicated four statistically significant zones
with generally large changes in the diatom taxa represented in each. The occurrence of diatoms
at 241 cm is coincident with a 9% reduction in estimated carbonate content and 40% increase in

! 34
LOI550 and a substantial decrease in magnetic susceptibility (< 48 S.I. units). During Zone 1 (241
- 203 cm) (6730 - 6375 years BP) the diatom flora is characterized by high relative abundances of
Fragilaria taxa including (in order of decreasing temperature optima from Joynt and Wolfe,
(2001): Pseudostaurosira pseudoconstruens (< 8%), Staurosira construens (< 8%), S. construens
var. venter (> 60%), and Staurosirella pinnata (2 - 10%) (Figure 5). Few other taxa are present
at a relative abundance of > 1% with the exception of Cymbella diluviana (> 15%) whose
abundance increases throughout zone 1 reaching a maximum abundance of 70% at the transition
into zone 2. A small complex of planktonic Aulacoseira taxa varieties distans and ambigua are
also present at low abundances in zone 1 (< 2%). The sample at 219 cm appears anomalous in
zone 1 with high relative abundances of Navicula stroemii (12%), Denticula elegens (9%) and
Brachysira vitrea (16%) (Figure 5).
Staurosira consruens var. venter remains dominant early in zone 2 (203 – 131 cm) (6375 –
5420 years BP) but its abundance declines and its dominance is replaced by Cymbella dilvuiana
(> 40%), which increases gradually throughout the zone. The Fragilaria complex decreases to a
combined relative abundance of < 2% at the top of zone 2 (5420 years BP) and C. diluviana
increases to relative abundances of > 60%. Diatom diversity in zone 2 remains low (< 20 taxa),
with moderate relative abundances of Navicula aurora (> 8%), Amphora libyca (> 5%) and
Cymbella subcuspidata (> 2%) consistently contributing to the assemblage. Neidium ampliatum,
Stauroneis phoenicentron and Navicula viridula also appear at low abundances (< 2%) at the top
of zone 2.
Zone 3 (131 - 52 cm) (5420 – 2130 years BP) is characterized by an assemblage similar to
zone 2 with increases in diatom diversity and the proliferation of several large benthic taxa
including Navicula cryptotonella, N. viridula, Sellaphora pupula, Neidium ampliatum and
Stauroneis phoenicentron. Cymbella diluviana remains dominant in zone 3 with relative
abundances maintained above 30% although it consistently decreases throughout the zone. The

! 35
re-establishment of Staurosira construens var. venter occurs in zone 3, although peak abundance
does not exceed 6% in this zone (compared to > 70% in zone 1). By approximately 70 cm (3500
years BP) S. construens var. venter becomes absent from the record. An estimate of diatom
preservation, based on the number of diatom central nodule fragments, suggests that preservation
is lowest during zone 3 with the number of broken diatom central pieces per sample reaching 50.
At 132 cm (5440 years BP) the relative abundance of Cymbella diluviana drops to < 10%
concurrent with increases in the relative abundances of Amphora libyca and Cymbella
subcuspidata, Neidium ampliatum and Navicula viridula in this sample only.
The period encompassed by Zone 4 (52– 0 cm) (2130 - -60 years BP (2010 AD)) reflects
the greatest changes in the diatom assemblage. With the exception of Navicula cryptotonella and
Sellaphora pupula, most of the large pennate forms which dominated zone 3 decline abruptly in
zone 4 reaching their lowest combined relative abundances of the entire record after ca. 1903
AD.
Whilst not deemed statistically significant, zone 4 can be divided into three subzones: 4a
(2130 – 150 years BP), 4b (1800 – 1975 AD) and 4c (1975 – 2010 AD) for ease of interpretation.
The diatom assemblage of subzone 4a is markedly different from the alkaliphilous and
circumneutral diatom assemblages noted in zone 3 and subzone 4b. Subzone 4a is characterized
by several acidophilous taxa including Brachysira zellensis (40%), Cymbella perpusilla and
Frustulia saxicona with a combined relative abundance of 45%. Peak abundances of epiphytic
Eunotia and Gomphonema taxa also characterize this subzone.
Replacing the acidophilous assemblage of subzone 4a is a diverse group of small pennate
and generally alkaliphilous and circumneutral diatoms including; Achnanthidium minutissimum,
Rossithidium pusillum, Brachysira vitrea, B. zellensis, Denticula elegens, D. kuetzingii, Cymbella
incerta, C. microcephala, C. descripta, Eunota praerupta, E. exigua, Gomphonema angustum,
Navicula stroemii, and Nitzschia bacillium. This small benthic diatom assemblage dominates

! 36
much of zone 4 from 1800 - 1975 AD (subzone 4b). Maximum diatom diversity (87 taxa) and
species evenness are found in zone 4 and this is reflected by the increased representation of rare
taxa (relative abundances of less than 2%) especially from the genera Gomphonema, Diploneis
and Epithemia.
Species from the planktonic genus Cyclotella are present in the most recent sediments of
zone 4 (subzone 4c) as are low abundances of the planktonic species Tabellaria flocculosa. Prior
to 1975 AD Cylotella spp. have been either absent or present at very low (< 1%) abundances in
the AT01 record, however after 1975 AD Cyclotella stelligera dominates the subzone 4c and
reaches a peak abundance of > 15 %.
Ordinations of fossil diatom assemblages using DCA found long gradient lengths for
species and sample composition along the first two axes (4.074 and 1.797 standard deviation
(SD) units) (Figure 6). The DCA sample scores support the zonation above, marked by a
pronounced decrease in axis 1 scores of 2 SD units and an increase of 1 SD unit in axis 2 for
samples above 45 cm (132 years BP) (Figure 4).
Discussion
Marked compositional shifts in the diatom assemblages of AT01 suggest that this
subarctic kettle lake has responded sensitively to environmental changes throughout the
Holocene. The record obtained from Lake AT01 confirms the chronology for glacial retreat and
postglacial evolution of the HBL suggested by Dredge and Cowan (1989). As such, the inception
and development of Lake AT01 and its paleoclimatic history are framed by locally dynamic and
complex postglacial landscape interactions characterized by rapid rates of isostatic rebound
(Andrews and Peltier, 1989) and marine incursion, superimposed on regional patterns of climatic
change.

! 37
Based on geomorphic evidence, the basin of Lake AT01 likely began as a kettle, with
lake formation and the diatom assemblages of AT01 being significantly influenced by changes in
the nature of remnant kettle ice within the lake basin related to postglacial climate change. End
moraines commonly contain masses of glacial ice (ice-cored moraines, Figure 7) which melt to
form kettle holes/lakes (Wright and Stefanova, 2004). The disappearance of kettle ice occurs at
varying rates depending on climate (Lee and Clark, 1966) with melting often continuing long
after the disappearance of active glacial ice. It is suggested that the melting of kettle ice blocks
within an ice-cored moraine leads to a three stage process of lake formation including; 1) initial
surface melting of ice to form ephemeral pools, 2) increased ice melt and enlargement of pools to
ponds, 3) final melting of ice to form a full-sized lake (Figure 7) (Florin and Wright, 1969). As
such, aspects of diatom compositional change in AT01 may be attributable to changes in lake
morphology throughout the Holocene related to stages of kettle lake formation which are
underpinned by patterns of regional climatic change.
The basal sediments of AT01 (6840 - 6730 years BP) capture the cold environmental
characteristics of the early Holocene following deglaciation in eastern subarctic Canada. Prior to
6730 years BP, the sediments of AT01 indicate a high energy, glacial outwash environment
characterized by high magnetic susceptibility values and coarser grained, inorganic sediments
(Figure 4). Elevated carbonate content in the sediments during this time is consistent with
unstable, poorly developed soils and greater inputs of glacially derived inorganic materials from
the catchment. The absence of diatoms in the lake sediments at this time was likely due to a
combination of highly alkaline, turbid lake water conditions and extreme disturbances related to
deglaciation. When diatoms first appear at 6730 years BP, a cold climate is inferred through low
diatom concentrations, the small number of taxa present and low species diversity as well as high
relative abundances of cold-tolerant Fragilaria taxa particularly S. construens var. venter and S.

! 38
pinnata. The cold local climate is most likely associated with the retreating glacial isostatic
Tyrrell Sea and Laurentide Ice Sheet (LIS) (Dredge and Cowan, 1989).
Based on a model of kettle lake formation adapted from Florin and Wright (1969) (Figure
7), surficial melting of the remnant ice block would begin after LIS retreat in summer once parts
of the buried ice became exposed to the sun. In areas of localized surface melting, small
depressions on top of the ice block would allow the formation of ephemeral pools where water
would be extremely cold and nutrient poor. High abundances of small, benthic Fragilarioid taxa
are commonly associated with very cold, dilute, oligotrophic ponds (< 2m water depth) in
modern diatom studies in the Canadian High Arctic (Michelutti et al, 2007b; Lim et al, 2008).
Several taxa in the Fragilaria group, particularly S. pinnata and S. construens var. venter, tend to
proliferate where ice cover is prolonged and the growing season is exceptionally short (Paull et
al, 2008). It has also been noted that araphid diatom taxa tend to dominate water bodies during
the initial stages of colonization with the Fragilarioids being among the most common colonizing
taxa across a multitude of sites in the Canadian Arctic (Smol, 1988; Stevenson and Peterson
1989; Douglas et al, 1994; Acs et al, 2000). Thus it is not surprising that the initial early
Holocene diatom assemblage of AT01 is dominated by a small benthic Fragilaria complex.
Although the autecology of the Fragilarioids is less well defined compared to many other
taxonomic groups (Finkelstein and Gajewski, 2008), modern biogeographic studies indicate that
the environmental optima of the Fragilaria are distinguishable with S. pinnata and S. construens
var. venter commonly exhibiting the lowest temperature optimums (Joynt and Wolfe, 2001;
Bouchard et al, 2004). Based on this accepted climate inference, the high relative abundances of
S. construens var. venter and peak abundances of S. pinnata, recorded in the early postglacial
represents the coldest period recorded in the diatom record. As such, the persistence of the
Fragilaria dominated assemblage between 6730-6230 years BP indicates that a cool period

! 39
persisted for more than 2000 years after the retreat of the LIS in the western Hudson Bay region
(Dyke, 2004).
After the recession of the LIS, which occurred between approximately 8600 – 8450 years
BP (Dyke, 2004), the cold, glacial Tyrrell Sea inundated the HBL. Based on the basal dates
obtained from peat cores approximately 60 km southeast of AT01 (Finkelstein group,
unpublished data), peat accumulation initiated in the region after 6400 years BP. The basal date
obtained from AT01, which predates this age by 340 years and the comparably higher elevation
of AT01 suggest that at least during its early stages of formation, AT01 was probably located on
an island (the AT01 moraine) within the Tyrell Sea. The island effect, also noted in a similar
study from the northern HBL (McAndrews et al, 1982), would have contributed to sustained cold
climatic conditions after deglaciation in AT01.
Following permanent retreat of the LIS, summer insolation remained high relative to
present day values (Berger and Loutre, 1991) resulting in the Holocene Thermal Maximum
across the Canadian Arctic between ca. 10,000 and 3000 years BP (Kaufman et al, 2004).
Sustained low LOI950 values, enhanced algal productivity as suggested by increasing diatom
valve concentrations, higher relative abundances of large benthic diatoms and substantial
decreases in the relative abundances of all Fragilaria taxa suggest that climate warming occurred
in AT01 between 6300 and 4700 years BP. Of the paleoclimatic data available, the timing of
inferred warming in AT01 is consistent with the timing of the HTM reported from other
paleoclimatic studies from the HBL (McAndrews et al, 1982; Kettles et al, 2000) and comparable
subarctic sites (Payette and Filion, 1993; Moser and MacDonald, 1990; MacDonald et al, 1993;
1998; Rühland, 2001; Kaufman et al, 2004).
However, the dominance of Cymbella diluviana between 6375 – 2100 years BP and
throughout the inferred HTM interval suggests that while temperatures may have been warmer
compared to the preceding early postglacial period, conditions remained cool throughout the

! 40
HTM with warming of lower magnitude compared to other subarctic sites. Little is known of the
environmental optima of C. diluviana; few studies in Canada have reported this diatom in high
abundances. Where noted, C. diluviana is a dominant constituent of cool, postglacial diatom
assemblages and is linked to brackish water and stagnant ice conditions (Florin, 1970; Stoermer
et al, 1988; McIntyre et al, 1991; Robertson, 1995). Stagnant ice conditions in AT01 could be
the result of both remnant ice within the lake basin (Figure 7a-b) and despite some increase in
temperature consistent with the HTM, cool climatic conditions may have persisted that did not
allow for complete melting of the block to occur. According the progression of ice block melting
noted in Figure 7, once the initially small depression and ephemeral pool formed, melting of the
ice block would continue at a faster rate (Florin and Wright, 1969). Enhanced slumping of
surficial material along the margins of the pool is encouraged as the pool depression deepens. As
slope angle increases, more surficial material is lost and increasingly larger portions of the buried
ice are exposed to the sun thus increasing the extent of melting and enlarging the ephemeral pool
to form a pond (Figure 7b).
While both increased sun exposure and air temperatures may have caused accelerated ice
block melting, the diatom assemblages of AT01 suggest only very slight warming during the
inferred HTM, enough to encourage the almost complete disappearance of cold-water Fragilaria
taxa but only slight enough to allow a second cold-water assemblage to dominate the pond.
Pollen (Richard, 1981; Payette and Lavoie, 1994), and chironomid-based temperature
reconstruction (Saulnier-Talbot et al, 2003; Fallu et al, 2005) records from sites proximal to
Hudson Bay in Quebec note similarly minimal warming trends during the HTM citing the
buffering of climate by open water and extensive ice cover in Hudson Bay until after 4000 years
BP as major factors in locally muting the HTM signal. Similarly, it is unlikely that the HTM
could have been as warm in the HBL compared to other subarctic sites due to the presence of the
cold Tyrrell Sea which imposed sustained cold temperatures across much of the HBL until its

! 41
recession. A modern-day analogue of this is noted across much of the terrestrial landscape
adjacent to Hudson Bay in relation to extensive sea-ice and a regional scale pressure gradient that
encourages cool onshore winds. As such, the presence of Hudson Bay creates a steep gradient of
landscape change from approximately 300 km inland where climate is characterized by temperate
continental boreal conditions chaging to a Polar climate at the Hudson Bay coast (Rouse, 1991).
Species richness increases during diatom zones 2 and 3 relative to zone 1 with several
large benthic species appearing after ca. 6100 years BP, although species richness remains low
compared to other subarctic lakes (Rühland and Smol, 2005; Podritske and Gajewski, 2007). The
marked temporal separation of abundances of small vs large benthic diatoms in AT01 suggests a
relationship between environmental conditions and allometry, whereby small and large diatom
valve sizes are advantageous under different environmental conditions (Passy, 2007). Valve size
has been associated with temperature, nutrient and light availability, chemical stresses and
hydrodynamic patterns (Finkel et al, 2009; Lange et al, 2011), with studies suggesting that large
valve size may be a competitive advantage for benthic diatoms in resource-limited environments.
In benthic habitats, larger species may be better able to gain access to light and nutrients,
although their reduced motility decreases dispersal and encourages low species diversity (Passy,
2007). Furthermore, a smaller surface area to volume (SA/V) ratio, characteristic of larger valve
size, is advantageous in colder, more nutrient limited settings since a lower SA/V ratio reduces
exposure to harsh environmental conditions (Yun et al 2010). Whilst C. diluviana is not
categorized as a large benthic species similar to others noted in zones 2 and 3, it exhibits
enormous morphological variation (Plate 1: f-i), which may be influenced by changes in water
chemistry, habitat availability and basin characteristics suggesting that this species is able to
adapt easily to changes in limnology and climate (McInytre et al, 1990; 1991).
However, the initial dominance of small, benthic Fragilaria prior to the proliferation of
larger (> 40 µm) benthic species suggests that larger valve size becomes advantageous only

! 42
above a certain threshold of nutrient availability. During the early postglacial interval, conditions
may have been so cold and nutrient limited that only the colonizing Fragilaria were able to
survive. However, the progression of the pool to a pond accompanied by some mild amelioration
of climate may have led to conditions where other species were able to outcompete the
Fragilaria. Therefore the interval between 6100 to ca. 4700 years BP is most likely a period of
relatively warmer temperatures compared to the periods that precede and follow it.
The time period between 4750 – 4000 years BP is characterized by a brief reoccurrence
of Fragilaria species S. construens var. venter, S. pinnata and F. brevistriata, concurrent with
decreases in C. diluviana and a low amplitude peak in LOI950 at 4800 - 4550 years BP possibly
representing the termination of the HTM. This assemblage shift coupled with decreased
biological productivity evidenced by the increase in LOI950 and low sedimentation rates may
represent the advancement of Neoglacial cooling after 4500 years BP in response to a decrease in
Northern Hemisphere summer insolation (Kaufman et al, 2004). Although spatially variable,
Neoglacial cooling has been recorded across subarctic Canada between ca. 4000 and 2000 years
BP (Grove, 2001; Kaufman et al, 2004).
Reduced sediment accumulation rates have been linked to Neoglacial cooling in parts of
the eastern Canadian Arctic after 3000 years BP (Wolfe, 2002; Adams and Finkelstein, 2010).
While reduced sediment accumulation rates and a brief increase in the relative abundances of
Fragilaria species occur in AT01 after 4750 years BP, the continued dominance of C. diluviana
and other large benthic species suggest that any temperature changes associated with Neoglacial
cooling were again subtle. Similarly, only moderate diatom compositional change in relation to
Neoglacial cooling has been noted at other sites from subarctic Quebec and the low Arctic tundra
of Nunavut (Ponader et al, 2002; Paul et al, 2010) possibly related to the gradual onset and
smaller relative amplitude of this cooling interval as well as only limited warming preceding
Neoglacial cooling thus making the cooling episode appear less marked.

! 43
The suggestion that only moderate changes in climate have occurred throughout much of
the Holocene in AT01 are also indicated by the generally low species diversity and considerable
dominance of C. diluviana from 6300 to 2100 years BP. Reynolds et al (1993) suggest that
habitats which experience little disturbance for extended periods of time can become more
homogenous in their community composition due to increased competition pressures resulting in
the dominance of one or a few particularly strong competitors.
Problematically, an extremely low rate of sedimentation (< 0.09 mm!yr-1) makes the
interpretation of any biostratigraphic changes between 4500 – 150 years BP in AT01 very
difficult. Without a better-constrained chronology of the sediment interval between 88 and 45
cm, it is hard to decipher whether slow sediment accumulation occurred throughout this interval
or whether the same rate of sedimentation occurred between 88 and 45 cm and was then followed
by a hiatus in sedimentation prior to the post-industrial period. Sudden reductions in
sedimentation rate similar to the magnitude of that noted in AT01 (from > 0.81 mm!yr-1 to 0.09
mm!yr-1) are rare and are seldom reported from other sites. However, smaller decreases in
sedimentation rates are often linked to periods of cooling and/or drought (Adams and Finkelstein,
2010; Shinneman et al, 2010). While significant shifts in the diatoms occur in the younger
sediments of AT01 these shifts do not take place until after 50 cm (Figure 5). Between 200 - 50
cm little diatom compositional change occurs to suggest any major cooling event. Even if the
AT01 record suggests potential evidence of the Neoglacial, any cooling associated with this
period was not severe enough to cause significant change in the diatoms as other studies have
reported and thus unlikely to have been severe enough to cause such a marked transition in
sedimentation regime. Similarly, a pollen record from R Lake, located approximately 118 km
north of AT01, revealed little change in the vegetation that would provide evidence of any severe
Neoglacial cooling (McAndrews, 1982). Using the same pollen record, a precipitation

! 44
reconstruction suggested that regional precipitation values actually increased after 3000 years BP
with generally wetter, but not cooler, conditions until after 150 years BP (Bunbury et al, 2011).
This combined data suggest that cooling and/or drought either did not occur, or were not severe
enough to cause such a substantial decrease in the sedimentation rate in lake AT01 between 4500
– 150 years BP.
Instead, the shift may require an explanation that relates to a more rapid change in the
AT01 environment, possibly in relation to a drainage event and resultant hiatus in the record.
Studies have suggested that lakes in regions of continuous and discontinuous permafrost may be
susceptible to catastrophic drainage events as a result of permafrost degradation and accelerated
thermokarst activity (Jorgenson and Osterkamp, 2005; Kokfelt et al 2009; MacDonald et al,
2011). Glacial thermokarst often results in the formation of kettle lakes and is common on ice-
cored moraines like the AT01 moraine (Jorgenson and Osterkamp, 2005). Similar to the model
proposed by Florin and Wright (1969, Figure 7), glacial thermokarst is the process whereby a
lake is underlain by glacial/kettle ice which eventually thaws causing a change in lake
morphology (Harris, 2002). By incorporating the glacial thermokarst model into the Florin and
Wright (1969) lake development model (Figure 7c-d), it seems plausible that once all of the
underlying kettle ice melted from AT01, lake bottom subsidence occurred causing the lake to
drain either completely or almost completely (Marsh and Neumann, 2001; Jorgenson and
Osterkamp, 2005). If a drainage event occurred, the sedimentation rate would have been either
reduced (with slower, incomplete drainage) or may have ceased entirely (hiatus) for a short
period of time (complete, rapid drainage).
The only limitation of this explanation is that if drainage occurred via lake bottom
subsidence and a subsurface drainage channel, it might be expected that there would be more
disruption to the stratigraphic integrity of the sediments and yet there appears to be little evidence
of change in physical sediment properties between 88 and 50 cm in the AT01 sediment core

! 45
(Figure 4). It thus seems more likely that drainage occurred via a surface drainage channel
causing the lake level to decrease without entirely draining the lake (Figure 7c-d) resulting in a
slightly more prolonged reduction in sedimentation rate due to the turbulent lake environment
and lack of sediment settling. This drainage process resembles that of glacier-dammed lakes
where drainage occurs via surface channels on top of the ice due to the melting potential and
thermal energy of the lake-water (Marsh and Neumann, 2001). Lake recharge may have
followed the draining event via increased precipitation and saturated overland flow throughout
much of the late Holocene.
The base of zone 4 encompasses both the latter part of the period of slow sedimentation
rate and marks the initiation of diatom assemblages that are significantly different from those
recorded throughout the pre-industrial period. Interestingly the bottommost sediments of zone 4
(52 - 48 cm, zone 4a) document the only acidophilous diatom assemblage throughout the entire
AT01 record characterized by Frustulia saxonica, Brachysira zellensis, several Cymbella
varieties and high relative abundances of epiphytic Eunotia and Gomphonema species. The
sudden increase in acidophiles and epiphytes between ca. 2150 – 1700 years BP may additionally
indicate a decrease in lake depth as a result of kettle ice thaw processes that ultimately resulted in
a change in lakewater extent and geochemistry. A shallower lake would increase in the extent of
the littoral zone, facilitating the colonization of more wetland vegetation both around and within
the shallower parts of the lake basin (Figure 7d). More vegetation would provide a greater
number of habitats for epiphytic diatom taxa, those that live attached to plants. Furthermore, an
increase in wetland vegetation within the lake basin and an increase in the relative abundances of
acidophilic diatom taxa may substantiate the hypothesis that a shallower version of AT01 existed
at this time characterized by a small, acidic, peaty pond.
Lowest recorded LOI550 values are also noted at the base of zone 4 (50 – 45 cm). Despite
complexities with the age-depth model at this particular interval in the core it is suggested that

! 46
the LOI550 reduction corresponds to the time between 1800 and 130 years BP. It should also be
noted that this interval encompasses the Little Ice Age, the timing of which is documented in a
series of written diaries from Churchill, Manitoba, (between 1700 – 1852 AD) (Ball and
Kingsley, 1984; Ball, 1983; 1985; 1994). Cold temperatures during this brief climatic transition
have been related to decreases in sedimentation rates, diatom concentration and diatom
compositional changes in several subarctic and Arctic diatom records (Adams and Finkelstein,
2010, Rühland and Smol, 2005). However, it is difficult to reconcile such fine scale (decadal to
multi-decadal) trends in the AT01 record during this time frame based on the low sedimentation
rate yielded from the age-depth model.
After the substantial changes that characterize the onset of zone 4, an alkaliphilous
diatom assemblage was re-established between 1200 and -25 years BP (1975 AD). Whilst the
diatom assemblage remains dominated by benthic taxa, species present at high abundances are
consistently smaller benthic species (< 30 µm). Small valve size is consistent with a larger SA/V
ratio that enables more efficient metabolizing of nutrients allowing smaller species to be more
competitive when nutrient concentrations are higher (Yun et al, 2010). Increased species
evenness during the post-industrial period reflects significant deviation from the earlier pre-
industrial assemblages where individual species were present at abundances above 70%.
Increased diversity and proliferation of several benthic species suggests an increase in the
diversity of habitats in the littoral zone with less persistent lake-ice cover although not reduced
enough to encourage the proliferation of planktonic species.
The sedimentation rate after 1800 AD is almost double that of any rate experienced in
AT01 during the pre-industrial period and approximately eight times higher than the average rate
of sedimentation for subarctic sites across Canada during the last 150 years (Brothers et al, 2008)
This increase appears to be partially attributable to a decrease in bulk density (Figure 4),
however, when combined with the significant compositional shift in the diatoms during the same

! 47
interval it suggests that a largely different hydrological and/or climatic regime has been operating
in AT01 since ca. 150 years BP. Several studies suggest that lake trophic state is significantly
positively correlated with modern sedimentation rates in relation to higher productivity and
greater nutrient inputs (Trolle et al, 2008; Umbanowar et al, 2011). Marked increases in LOI550
values after 1970 AD and peak diatom valve concentrations after 1950 AD indicate an increase in
primary production consistent with peaks in productivity which may be linked to an increase in
sedimentation rate. Additionally an increase in the sedimentation rate after the drainage
event/hiatus may be a result of a change in lake morphometry whereby the disappearance of ice
from the lake basin may have increased the slope angle of the lake basin resulting in an increase
of sediment inputs to the lake (Rowan et al, 1992). Furthermore, reduced ice cover in the
catchment linked to general warming trends at the same time may have allowed for an increase in
catchment inputs to the lake with enhanced productivity and a lengthening of the growing season
also likely related to climate warming since the LIA and/or Neoglacial.
The diatom assemblage shifts in the most recent sediments of AT01 (1975 AD - present)
represent ecological changes that are consistent with what is now recognized as a geographically
widespread response to recent climate warming across the circumpolar region (Smol et al 2005;
Rühland et al, 2008). These changes include the unprecedented expansion of planktonic
Cyclotella species, which prior to 1980 AD, had been absent or present only at very low
abundances in AT01. The increase in planktonic species which is particularly prominent after ca.
1995 AD indicates the expansion of habitat availability within the water column in relation to
substantial decreases in lake-ice cover and a prolonged ice-free season during the summer (Smol,
1988). Resultant changes in lake water chemistry, nutrient distribution, light dynamics and water
column stability may have ultimately provided conditions under which small, light, planktonic
taxa with rapid growth rates and high SA/V ratios were competitively superior (Sorvari et al
2002).

! 48
Studies from several circumpolar Arctic and subarctic lakes have noted significant 19th
century increases in planktonic species, particularly C. stelligera, that are similar to those found
in AT01 (summarized in Smol et al, 2005). In all studies, assemblage shifts are attributed to 19th
century climate warming and its impacts on lake ice phenology, aquatic habitat structure and
water column properties. The proliferation of planktonic diatom species have also been
successfully correlated with the timing of recent climate warming in several temperate and a few
low Arctic lakes where diatom records and instrumental temperature and/or lake-ice cover
duration data are available from the same lakes (Rühland et al 2008; Medeiros et al, 2011; also
see chapter 3 this thesis).
Statistically significant declines in both sea-ice concentration and extent have also been
noted in Hudson Bay (HB) since 1980 (Parkinson et al, 1999). Whilst these trends were only
slightly negative prior to 1996, a climatic regime shift that has taken place since the mid-1990s
has resulted in much more significant reductions in sea-ice during the spring between 1996-2005
AD in relation to increases in air temperatures associated with a strongly negative phase of the
NAO (Hoccheim et al, 2011). As such, marked increases in the relative abundances of all
planktonic diatom taxa in AT01 after 1995 AD may be interpreted as the response of freshwater-
ice in the HB terrestrial landscape to increasing air temperature trends noted in the HB marine
environment.
Future Work
While this paper has provided some speculative models of lake development with regards
to Lake AT01, future work is required to determine if they are correct. A paleohydrological
indicator such as the oxygen isotope analysis of plant cellulose would provide a quantitative
insight into various aspects of past hydrology, hydroecology and hydroclimatology by tracking
the oxygen isotope composition of lake water (Wolfe et al, 2007). Additionally carbon: nitrogen

! 49
(C:N) isotope ratios and a pollen-based vegetation reconstruction would allow us to assess
catchment and lakeside vegetation to detect the possibility of more wetland type vegetation
around the lake at the base of zone 4a as well as shifts in both aquatic and terrestrial ecosystems.
Conclusion
Marked compositional shifts in the diatom assemblages have occurred throughout the
Holocene in Lake AT01, the timing and magnitude of which have been broadly consistent with
middle Holocene climatic intervals including the HTM and Neoglacial cooling. However, whilst
the diatoms have broadly corresponded to intervals of climatic change, the persistence of kettle
ice within the AT01 lake basin until approximately 1800 years BP has also shaped the diatom
community significantly. While low temporal resolution reduces the robustness of the inferences
throughout the period 4500 – 400 years BP it is possible to distinguish changes in the diatoms
and other sedimentological properties consistent with a drainage event that caused a significant
lowering of lake level. Nonetheless data concerning paleohydrology would help provide more
insight to the nature and timing of this event.
Changes throughout the post-industrial era appear unprecedented throughout the
Holocene with the most significant diatom compositional shifts occurring after ca. 1830 years
BP. A diatom assemblage consistent with increased habitat availability within the water column
linked to a decrease in the duration of ice cover are associated with trends in recent warming
recorded across the circumpolar region and prominent negative sea-ice trends in Hudson Bay
since 1996. This paper is the first diatom paleolimnological study from the HBL which, in
collaboration with vegetation, water table and biogeochemical reconstructions, provides a more
comprehensive insight into the paleoclimate history of the HBL and its impact on carbon
dynamics in the region throughout the Holocene.
!

! 50
TP - Total Phosphorus TKN - Total Kjeldahl Nitrogen DOC - Dissolved Organic Carbon DIC - Dissolved Inorganic Carbon Table 1. Selected water chemistry variables from AT01. Symbol * denotes in situ measurements, all other variables measured at AGAT laboratory.
Variable AT01 Cl (mg/L) 0.52 Ca (mg/L) 28.3 K (mg/L) 0.23 Mg (mg/L) 3.37 Na (mg/L) 0.52 SO4 (mg/L) < 0.10 Alkalinity (mg/L) 82 pH* 8.8 Water temperature (°C)* 15.2 TP (mg/L) < 0.05 TKN (mg/L) 0.54 Conductivity (µs/cm)* 150 DOC (mg/L) 15.4 DIC (mg/L) 19.9 SiO2 (mg/L) 0.37

! 51
Table 2. 210Pb dates and 210Pb total activity from the AT01-G6-L2 sediment cores. Dates were not obtained for the samples sent from 81 cm and 101 cm.
Depth (cm)
210Pb total activity (DPM/g)
Years before presenta at bottom of sediment section (CRS model estimate)
0.0-1.0 65.90 2.0 1.0-2.0 70.39 4.7 2.0-2.5 88.10 8.2 3.0-3.5 81.95 12.9 4.5-5.0 67.04 19.8 5.5-6.0 66.61 33.0 19.0-19.5 26.92 39.0 20.0-20.5 10.62 42.4 22.5-23.0 15.80 47.3 24.5-25.0 9.15 52.9 26.5-27.0 8.50 58.0 28.5-29.0 6.28 62.5 30.5-31.0 6.93 70.3 33.5-34.0 5.32 79.2 36.5-37.0 3.05 86.6 40.5-41.0 3.28 107.5 52.5-53.0 1.26 129.9 62.5-63.0 1.63 158.2 81-81.5 0.63 101-101.5 0.93

! 52
Table 3. Accelerator Mass Spectrometry (AMS) dates (Beta Analytic Inc.) from Lake AT01. a
denotes that samples AT01-99-100 and AT01 173-176 do not have a 13C/12C Ratio reported as the samples were too small to do a separate 13C/12C ratio and AMS analyses. b After discussion with Roxy Hasting, Curator of Botany at the Royal Alberta Museum, AT01 99-100 was identified as a moss fragment and member of the Amblystegeaceae family. AT01 31-32 was within range of 210Pb dating and showed close agreement to ages yielded from similar depths using 210Pb dating methods.
Lab code Depth (cm)
Conventional date (14C yr
BP)
2-! calibrated age range
Calibrated yr BP
(median probability)
"13C Material
Beta-286597 32 130 ± 40 54-152 132 -28.1 Wood
Beta-296735 74-76 4110 ± 40 4088-4760 4497 -29.7 Plant fibers,
chironomid head capsules
Beta-286598 99 4540 ± 40 5047-5200 5162 N/Aa Moss fragmentb
Beta-296736 173-176 5950 ± 40 5988-6207 6089 N/Aa Plant fibers,
chironomid head capsules
Beta-286599 230 5950 ± 40 6676-6882 6778 -29.0 Wood
Beta-286600 238 6000 ± 40 6742-6943 6840 -30.2 Wood

! 53
Table 4. Average sedimentation rate calculated based on radiocarbon dates (no. of cm/no.of years)*10)). Sedimentation rates are given relative to both actual depth of radiocarbon dates sampled from the AT01 long core (AT01-L2) and as contiguous depth (combined long core and short core).
AT01-L2 depth (cm)
Contiguous depth (cm)
AT01-L2-G2
Average sedimentation rate (mm!yr-1)
0-32 0 - 45 2.34
32-75 45 - 88 0.09
75-99 88 - 112 0.36
99-174 112 - 187 0.78
174-230 187 - 243 0.83
230-238 243 – 251 1.29
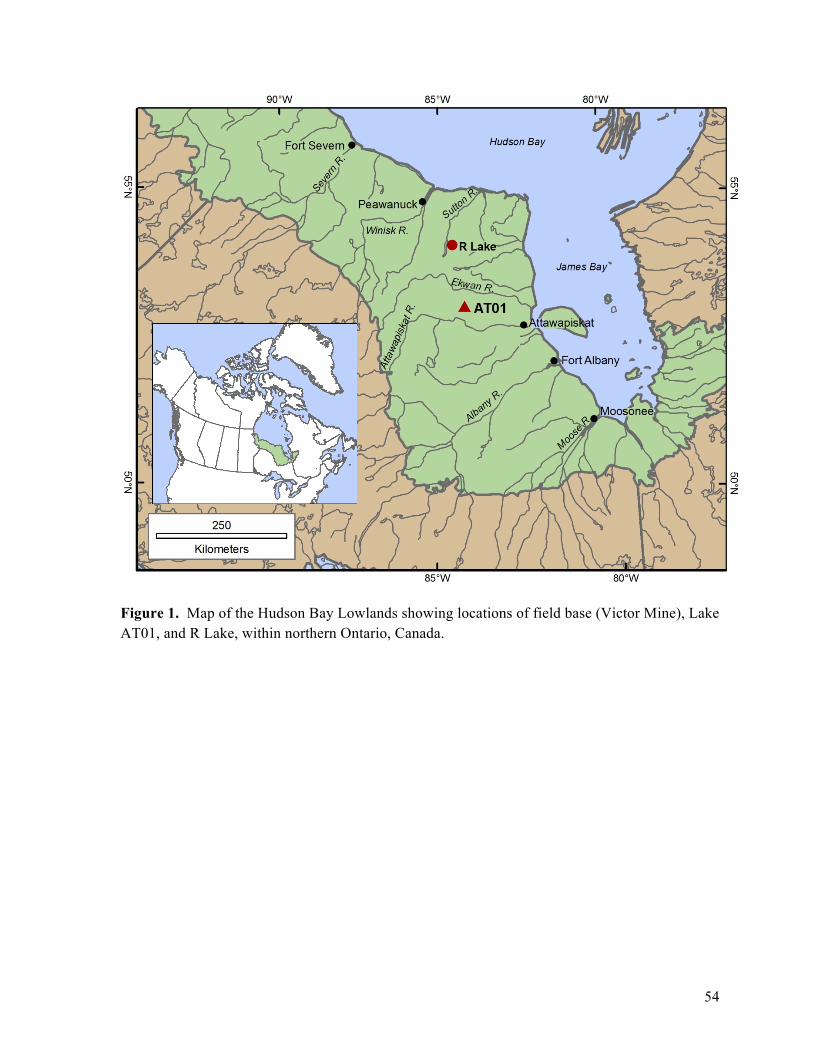
! 54
! Figure 1. Map of the Hudson Bay Lowlands showing locations of field base (Victor Mine), Lake AT01, and R Lake, within northern Ontario, Canada.

! 55
! Figure 2. Digital elevation model (DEM) showing relative changes in elevation and the position of Lake AT01 (arrow) on the western slope of an end moraine. Topographic profile (inset) shows elevation (m a.s.l.) of AT01 basin and the end moraine with vertical exaggeration calculated. Several kettle holes are apparent in the northwestern portion of the DEM. Data, images and assistance in interpretation were provided by P. Barnett of the Ontario Geological Survey.
!!!!!
!!
1
Vertical exaggeration = 50 x!

! 56
!! ! Figure 3. Age-depth model. Chronology prepared for Lake AT01 based on 6 AMS 14C dates and 18 210Pb obtained from AT01-G6 and L2 cores. Ages are plotted relative to calibrated years before present (years BP). Radiocarbon dates are presented in calibrated, calendar years with their 2! error age ranges. 14C dates were fitted to a curve using an inverse third-order polynomial. 210Pb ages were determined using the constant rate of supply model (CRS). Inset: Axes are the same variables and units as in the main graph. All 210Pb dates (years BP) are presented with the uppermost 14C date plotted and its 2! error age range shown.
Age
(yea
rs B
P)
Depth (cm)

! 57
Figure 4. Summary of biostratigraphic, paleoclimatic and sedimentological data for core AT01-L2-G2. Results of ordination by DCA of fossil samples are plotted as DCA1 (axis 1 sample scores) and DCA2 (axis 2 sample scores). Gray horizontal lines denote biostratigraphic zones determined by cluster analysis (CONISS). Secondary y-axis displays age as calibrated years before present (years BP).

! 58
! Figure 5. Biostratigraphic trends in the relative abundances (%) of the most common diatom taxa in core AT01-L2-G2 (note x-axis scaling differs). Species are grouped as small benthics (< 20 µm), large benthics (> 40 µm), planktonics and Fragilaria. Diatom taxa displaying similar trends and/or are known to have similar ecological affinities are grouped resulting in 7 taxonomic groups: the Aulacoseira complex (A. distans, A. ambigua); the Brachysira complex (B. brebissoni, B. styraica); the Cymbella complex (C. microcephala, C.delicatula, C. incerta, C.cesati, C. meulleri, C. perpusilla); the Denticula complex (D. elegens, D. keutzingii); Eunotia complex (E. bilunaris, E. praerupta, E. arcus); the Gomphonema complex (G. subtile, G. parvulum, G. olivaceum) and the Nitzchia complex (N. palea, N. perminuta, N. fonitcola, N. dissipata). Secondary y-axis displays age as calibrated years before present (years BP).

! 59
!
Figure 6. Species and sample scores along the first two axes of DCA ordination for the 55 AT01 diatom samples. Open triangles represent species scores with names of the species that best typify each biostratigraphic zone shown in the biplot. Numbers correspond to samples with their position relative to the first two axes of the DCA highlighting the sample score. Biostratigraphic zones determined using cluster analysis are shown as following; zone 1 = dot-dash line; zone 2 = solid gray line; zone 3= dashed gray line; zone 4 = solid black line.

! 60
Figure 7. Suggested development of of Lake AT01 based on a kettle ice-block deposition and melting stages within in an ice-cored moraine. Adapted from Florin and Wright (1969) see discussion for details.
Retreat of active glacial ice and isolation of kettle ice block. Burial of ice block within moraine by outwash material from glacier terminus leaving an ice-cored moraine.
a) Surficial melting of isolated ice at points of accidental breaching of ablation cover to form small ephemeral pools. Diatom zone 1.
!
b) As small pool depressions form, increased sediment slumping results in more exposure of ice surface. Increased melting causes the enlargement of small pool to ponds. Diatom zones 2 and 3.!
c) More rapid melting of ice causes formation of a surface drainage channel (indicated by arrow) and more rapid drainage occurs and almost complete drainage of the water body occurs.
!
d) Low lake level subsequent to drainage and formation of a shallow lake with increased vegetation able to colonize the lake basin. Diatom subzone 4a.
!
e) Lake recharge increases lake level and formation of modern day lake occurs. Diatom subzones 4b and 4c.!

! 61
CHAPTER 3
A quantitative reconstruction of late Holocene paleoenvironmental changes; comparing
diatom assemblage shifts, inferred pH and measured lake-ice cover in Baker Lake,
Nunavut, Canada
Abstract
Changes in diatom assemblage composition were examined from the sediments of Baker Lake, a
large continental tundra lake 320 km west of the northern Hudson Bay coast, Nunavut, Canada,
for the purpose of tracking late Holocene climatic shifts. Shifts in the dominant functional
groups of diatom taxa were linked to an inferred increase in lake-water temperature and
subsequent decreases in the duration of lake ice-cover over the past 200 years. The early part of
the record was characterized by the dominance of small benthic, alkaliphilous diatom taxa
(Fragilaria and Achnanthes species) and heavily silicified, tychoplanktonic Aulacoseira species.
The 20th century assemblages were marked by a shift to diatom assemblages characteristic of
more open water habitats dominated by small planktonic Cyclotella species. A diatom based
inference model was developed to reconstruct lake water pH (RMSEP = 0.35, r2boot = 0.40). The
strength of this model and the reliability of diatom-inferred changes in lake-ice duration were
tested through comparisons with observed changes in ice-cover duration and air temperature
trends recorded at the Baker Lake climate station since 1959 AD. The analysis indicated that
whilst diatom community shifts appear to reflect changes in temperature and the duration of ice
cover, the relationship between diatom-inferred pH and lake ice-cover duration is less robust.
! 62
Introduction
Changes in climatic conditions can have important and complex effects on lake
ecosystems (Smol and Cumming, 2000). Climate is an important driver of changes in lake
physico-chemical properties including lake-water temperature, nutrient cycling and pH, which
may in turn affect lake biota (Enache et al, 2011). For diatoms specifically, pH has been cited in
several studies as the most significant variable in explaining their distribution and community
compositional change (Joynt and Wolfe, 2001; Keatley et al, 2008; Bennett et al, 2010) in
relation to lake-ice cover dynamics and the trapping of CO2 in dilute, lower pH systems (Wolfe,
2002). The lake-specific response of aquatic ecosystems to climate forcing and the degree of
ecological change that occurs, is also complex and may be modulated by differences in
seasonaility and/or related changes in lake thermal structure and mixing regimes. In high latitude
regions, the extended duration of lake-ice cover severely limits the length of the growing season
and thus even slight changes in climate may impact on lake-ice regime having a significant
impact on limnology, hydrology and diatom assemblage composition (Smol et al, 2005). In the
absence of long-term monitoring data in the Arctic, paleolimnological records supply valuable
information on the climate history of a region and associated ecological change.
Diatoms are important primary producers in aquatic ecosystems; they support higher
trophic levels and respond sensitively to climate-induced changes in limnology making them
useful for reconstructing past responses of aquatic ecosystems to climatic changes (Smol, 1988;
Sorvari et al, 20020; Larocque, 2004). The sensitivity of diatoms to temperature, particularly in
high latitude regions is thought to be related more proximally to the duration of lake-ice cover
(Smol, 1988; Adams and Finkelstein, 2010). Increases in the duration of the ice-free season
affect algal production via increased light penetration and subsequent increases in the rate of
photosynthesis as well as increases in habitat availability, particularly for planktonic diatoms.

! 63
Studies of recent shifts in the structure of diatom communities of Arctic lakes have
suggested the significant role of warming in altering the composition of diatom communities
found in recently deposited sediments as a result of reduced ice-cover duration and enhanced
thermal stratification (Rühland et al, 2003; Smol et al, 2005). These recent changes are observed
in several diatom records as increases in the abundances of planktonic diatoms (e.g., Cyclotella
spp.) relative to periphytic or benthic diatoms (e.g., Fragilaria spp.) (Rühland et al, 2008). A
decrease in ice-cover duration will result in the expansion of available diatom habitats within the
water column via increased water depth, deepened light penetration and enhanced thermal
stratification (Douglas and Smol 2010; Paul et al, 2010). Similarly, temperature increases and
enhanced thermal stratification have also been linked to decreases in the abundances of heavier
and more silicified planktonic diatoms (e.g. Aulacoseira spp.) relative to smaller, lighter
planktonic species, whereby sinking rate is a significant competitive pressure under warmer
conditions with reduced lake-water turbulence (Yun et al, 2010). Such shifts in the dominant
functional groups of diatoms have been noted in recent studies in both European and North
American lakes (Sorvari and Korhola 1998; Rühland et al, 2008).
Increased temperature and concurrent decreases in lake-ice cover may also indirectly
influence diatom assemblages through controls on lake-water chemistry, notably changes in lake-
water pH. Numerous diatom calibration studies have utilized sediment diatom assemblages to
quantitatively reconstruct changes in lake-water pH in arctic (Joynt and Wolfe, 2001; Antoniades
et al, 2005; Michelutti et al, 2006b; Lim et al, 2007) and subarctic (Weckstrom et al, 1997) lakes.
Poorly buffered lakes in ice-dominated regimes are particularly susceptible to changes in air
temperature and lake-ice cover (Psenner and Schmidt, 1992; Douglas and Smol, 2010). Colder
climates and increased duration of ice cover will cause an increase in the amount of trapped,
respired CO2 in the water column, dominating the DIC pool resulting in decreased lake-water pH
(Wolfe, 2002). As such, several diatom-based pH inference models have demonstrated a close

! 64
coupling of lake-water pH to Holocene climatic fluctuations including the onset of Neoglacial
cooling and marked Anthropocene warming during the last 150 years (Joynt and Wolfe, 2001;
Wolfe, 2002; Michelutti et al, 2006a).
The primary objective of this paper is to infer and quantify paleoenvironmental change at
a site in the northern Hudson Bay region (HB region) during the late Holocene. Specifically, the
study will (1) determine whether the paleoclimatic changes recorded in the diatom record from
Baker Lake are similar in timing and magnitude to measured temperature and ice duration data
since 1950; (2) test the usefulness of fossil diatom assemblage shifts in generating a pH transfer
function derived from modern species-environment relations to determine the timing and
magnitude of environmental changes at Baker Lake during the last ca. 200 years.
Study area
Baker Lake (64.3°N 96.08°W) is a large (188,700 ha), deep (maximum known depth
approximately 60 m), circumneutral (pH 7.2) continental lake situated 320 km west of Hudson
Bay within the Kivalliq region of Nunavut, Canada (Figure 1) (Dibike et al, 2011). Baker Lake is
fed by the Thelon River from the west and the Kaza River from the south, and outflows into
Chesterfield Inlet (Johnson, 1965). A small town, also named Baker Lake, with a population of
approximately 1700 people is situated on the north-western shore of the lake. Instrumental
climate data from a weather station located at the airport in Baker Lake town indicates that the
climate is polar, characterised by a mean annual temperature of -11.8 ºC and mean annual
precipitation of 157 mm. Regional climate is influenced by both Arctic air masses and the
movement of seawater. Cold Arctic waters in Hudson Bay move along a geostrophic
anticlockwise current, resulting in frigid air masses that cool the western coasts of Hudson Bay
(Martini, 2006). However, lake-effect warming and cooling throughout the open-water season
also impact on the local climate of Baker Lake.

! 65
Bedrock geology is comprised of Archean granitoid gneiss and feldspathic sandstone
(Rainbird et al, 2003) and is overlain by a thick and continuous till veneer (Natural Resources
Canada, 1995). The vegetation of the Baker Lake catchment is composed of gently rolling tundra
characterized by dwarf shrubs (such as Salix spp.) and several grasses.
Methods
Field Methods
Fieldwork was carried out by members of the Quinlan laboratory (Department of
Biology, York University, Ontario) in August 2007. Replicate sediment cores of length 20 cm
were recovered from the eastern basin of Baker Lake, at a water depth of 13.7 m, using an
Uwitec gravity corer (8.4 cm diameter) deployed from a boat anchored at three points. Sediment
cores were extruded in the field at 0.5 cm intervals, stored in Whirl-Pak® bags and kept cool (4
ºC) until diatom processing was carried out at the Paleoecology lab, University of Toronto.
A variety of water chemistry variables including temperature, specific conductance, pH
and dissolved oxygen, were measured using a YSI-600QS multi-parameter probe at 1 m intervals
from the lake bottom. Replicate epilimnetic water samples were collected at 0.5 m below the
water surface in pre-cleaned polyethylene bottles and treated immediately in the field following
the protocols outlined in the Analytic Methods Manual of Environment Canada (Environment
Canada 1994). Samples were analysed by the National Laboratory for Environmental Testing
(NLET) at the Canadian Centre for Inland Waters (CCIW), Burlington, Canada and are reported
in Medeiros et al (2011).
Laboratory methods
Diatoms were analyzed from 23 samples at 1 cm intervals throughout the sediment core
with 3 additional samples at 1 cm, 8 cm and 18 cm. Processing followed methods outlined by

! 66
Rühland et al. (1999); subsamples of 0.5 cc were treated with 10% HCl, followed by treatment
with nitric and sulfuric acids (50:50 molar ratio) and heated to fully digest the organic matter.
Due to the high clay content of the samples, a few drops of a 5% Calgon solution (Sodium
Hexametaphosphate) were added to encourage disaggregation of the fine clastic material. The
samples were then successively rinsed with distilled water until neutral. The resulting diatom
slurries were mounted onto glass microscope slides using Naphrax®. A minimum of 500 diatom
valves were identified for each sample and enumerated along horizontal transects using a Zeiss
microscope with differential interference contrast (DIC) optics and a 100x oil immersion
objective. Diatom valves were identified and counted along randomly selected transects and at
least three transects were counted per sample.
Diatom taxonomy was based primarily on Cumming et al. (1995), Fallu et al. (2000),
Krammer and Lange-Bertalot (1986-1991) and Antoniades et al. (2008). Raw diatom counts were
converted to relative abundance data for each sample based on the total number of identified
diatoms in each sample. Species diversity was expressed for each interval using Hill's N2
diversity index (Hill 1973). Diatom concentration was calculated in valves/g of dry sediment by
pipetting a known volume of sediment slurry of known concentration (in grams of sediment mL-
1) onto glass coverslips, and then measuring (in mm2) the area of the coverslip over which the
diatoms were enumerated (see Appendix D).
Statistical methods
Raw diatom counts from each interval were converted to percent abundance of each
species. A diatom stratigraphic diagram was produced using C2 v1.6.8 software (Juggins 2009).
Biostratigraphical changes in the diatom assemblages were zoned using constrained cluster
analysis with incremental sum of squares partitioning (CONISS) (Grimm 1987) and a squared
chord distance dissimilarity coefficient (ZONE v 1.2. Juggins 1992). Only diatom taxa with a

! 67
maximum abundance of at least 1% and occurrences in at least 3 samples were retained in the
analyses. The fossil diatom assemblage was analyzed by principal component analysis (PCA)
using CANOCO v4.5.3 (terBraak and Simlauer 1998) to detect the timing and magnitude of
major shifts in community composition in the record. For this purpose, the data were square-root
transformed to stabilize variance and rare taxa were downweighted.
Model design
A transfer function for pH was applied to the fossil diatom assemblages from Baker Lake
using a calibration set of modern diatom assemblages from 61 lakes on Baffin Island (Joynt and
Wolfe, 2001). This dataset was selected because the lakes in the study are generally
circumneutral owing to similar bedrock geology as Baker Lake and at least 75% of the Baker
Lake fossil taxa were represented in the modern calibration dataset. Canonical correspondence
analysis, as performed by Joynt and Wolfe (2001) indicated that pH was the primary
environmental control over diatom distribution. The study of Joynt and Wolfe (2001) developed
a diatom-based inference model for pH using weighted-averaging (WA) regression and
calibration with classical deshrinking methods and replacement from within the original dataset
(bootstrapping) for 1000 iterations. WA uses the weighted abundances of taxa within the modern
training set to determine each taxon’s optimum and tolerance towards a particular environmental
variable (e.g. pH) by regressing taxon relative abundances with regards to a suite of
environmental data (Birks, 1995). Once the optima and tolerances for all taxa are defined in
regards to the environmental variable of interest, an estimate of that variables (pH) from a fossil
sample is the weighted average, based on fossil abundance data, of the pH optima for all taxa
present in the fossil assemblage (Birks, 1995).
To determine whether the Baker Lake diatom assemblages down-core were well
represented by the sample calibration set from Baffin Island, the core intervals were ordinated

! 68
with modern diatom data by detrended correspondence analysis (DCA) using CANOCO v. 4.5.3
(terBraak and Smilauer, 1998). The reconstruction of lake-water pH for Baker Lake was
conducted using the statistical software C2 v.1.6.1. Weighted average (WA), partial least square
(PLS), and partial least square weighted average (WA-PLS) transfer functions, and the modern
analogue technique (MAT) regression were applied to each dataset using bootstrapping cross
validation, excluding taxa with a maximum abundance of < 0.5% and < 3 occurrences to avoid
overestimating the effect of rare taxa. Model selection was based on comparisons of the statistical
performances of transfer functions applied to the dataset, details of which are outlined in the
results section.
Annually resolved ice freeze-up and break-up dates for Baker Lake ice cover were
obtained from the Canadian Ice service database (ww.ice-glaces.ec.gc.ca) and were used to
calculate the duration of ice cover as number of days per year, at Baker Lake during the period
1959-2010. Similarly, a yearly instrumental air temperature record was also obtained for Baker
Lake since 1950 from Environment Canada.
Core chronology was established using the constant rate of supply (CRS) model of 210Pb
accumulation carried out at MyCore Scientific Inc, Ontario. Measurements of 210Pb activity were
performed on 20 samples at 1 cm intervals throughout the core. Loss-on-ignition (LOI) analyses
were carried out at 0.5-cm intervals throughout the core to estimate the percent organic matter
and carbonate content (Heiri et al, 2001).
Results
Core stratigraphy and chronology
Analyses of the physical characteristics of the sediment core show that the 20-cm Baker
Lake core is divisible into two sections; the uppermost section of the core (0-2 cm; 2004 -2007
AD) is comprised of sediments with high estimated organic matter content (as estimated by

! 69
LOI550 values) below which organic matter drops from 25% to < 5% throughout the remainder of
the core (Figure 2). Percent carbonate content (LOI950) remained stable and low throughout the
core at < 1%.
210Pb dating suggested a relatively high sedimentation rate of 864 g!m-2 !yr-1compared to
other Arctic systems (Evenset et al, 2007). Background 210Pb was established at 12.5 cm
providing an age of 1885 AD (Figure 3). Unfortunately without the incorporation of secondary
dating methods, ages could not be established below this depth.
Fossil diatom assemblages
The diatom assemblage of Baker Lake was species rich with a total of 163 diatom taxa
representing 28 genera identified. Diatom abundance and diversity were both high compared to
many Arctic lakes (e.g., Smith 2002). The assemblages were composed of predominantly
benthic taxa with the exception of a high relative abundance of the tychoplanktonic Aulacoseira
genus, particularly in the lower half of the core, and high relative abundances of Cyclotella and
Tabellaria species in the most recent sediments (Figure 3). Diatom concentration remained high
and exhibited little variation throughout the core with values ranging from 5.30 x 10⁷ valves!g-1
to a maximum of 9.9 x10⁷ valves!g-1. It was therefore possible to count at least 500 diatom
valves in each sample. It should be noted that the reliability of diatom concentration values is
based on the accuracy of the age-depth model and therefore may reflect varying rates of sediment
accumulation as opposed to any climatic factors.
Stratigraphically constrained cluster analysis of the diatom assemblages indicated three
statistically significant zones, although changes in the diatom assemblage are largely subtle
throughout the core (Figure 4). Zone 1 (20 cm - 8.5 cm) spans the period prior to ~ 1885 AD -
~1951 AD. This zone is characterized by high relative abundances of taxa indicative of cold and

! 70
turbulent conditions, including the heavily silicified tychoplanktonic Aulacoseira lirata (>12%),
and small benthic Fragilaria taxa (cumulatively >15%) (F. brevistriata, Staurosira construens
var. venter and Pseudostaurosirella pseudoconstruens). Other species characterizing zone 1
include: Achnanthidium minutissimum, Rossithidium pussilum, Encyonema silesiacum, and peak
abundances of Amphora pediculus var. ovalis.
Zone 2 (1.5-8.5 cm) (~ 1951 - 2006 AD) is characterized by a relatively abrupt and
sustained decrease in Aulacoseira taxa as well as a gradual increase in the smaller, planktonic
taxa indicative of warmer water, mainly Cyclotella stelligera and C. rossi from 1960 AD
onwards (Figure 4). The relative abundances of the cold water and nutrient poor tolerant taxa in
the Fragilaria group begin high in zone 2 (> 5 %) but decline after 1965 AD. The abundances of
small benthic diatoms including Karayeva clevei, Rossithidium pusillum and Amphora pediculus
var. ovalis, decrease in zone 2 relative to zone 1, while there are small increases in zone 2 in
some of the larger benthic taxa including: Nitzschia perminuta, N. palea, Diatoma tenue,
Encyonema silesiacum and Navicula cryptotonella.
The uppermost zone (1.5 – 0 cm) 2006 - 2007 AD incorporates only the most recent two
samples. This zone is characterized by a sudden 10% increase in the relative abundance of small
planktonic species Cyclotella stelligera and C. rossi accompanied by a continued decrease in the
heavily silicified centric Aulacoseira taxa. This abrupt increase is also accompanied by increases
in Tabellaria flocculosa and Achnanthidium minutissimum. The relative abundances of all
Fragilaria taxa reach their lowest values in zone 3 with the almost complete disappearance of
Staurosirella pinnata and Pseudostaurosira pseduoconstruens (< 1% abundance) and significant
decrease of F. brevistriata (to < 2% abundance). The relative abundances of Encyonema minuta
and Rossithidium pusillum reach a maximum of 5% and 10% respectively and the relative
abundances of planktonic species Cyclotella stelligera and C. rossi remain higher than recorded

! 71
in any other sample throughout the core (> 5%) with the exception of the previous sample (Figure
4).
Whilst the taxonomic diversity (Figure 3) of the diatom assemblages does not increase in
the uppermost sample as documented for many other Arctic sites (Smol et al. 2005), there are
large shifts in the abundances of different functional groups throughout this record. Ordinations
of fossil diatom assemblages using PCA found short gradient lengths for species and samples
along the first two axes (1.225 and 0.882 standard deviation units). The PCA sample scores
support the zonation above, with more pronounced increases in axis 1 scores for samples above 9
cm, and variability in axis 2 scores through zones 2 and 3 (Figure 3).
Model results
A modern surface sediment diatom calibration dataset from 61 sites from Baffin Island
(Joynt and Wolfe, 2001) was used to quantitatively reconstruct pH changes throughout the Baker
Lake diatom record. The Joynt and Wolfe (2001) dataset of modern diatom assemblages
contains 107 species representing 32 genera with relative abundances of > 1% in at least 3
samples. Similar to the surface sediment assemblages from Baffin Island, planktonic species are
present throughout the Baker Lake record however, benthic diatoms have greater taxonomic
richness in the Baker Lake record. Dominant species in both datasets include Aulacoseira lirata,
Staurosira construens var. venter and Rossithidium pusillum.
A DCA of the combined modern and fossil data found that the gradient lengths of species
composition along the first two axes were 4.081 and 2.580 standard deviation units respectively.
DCA indicates a reasonable similarity of the Baker Lake assemblages with the Baffin Island sites
along both axis 1 and 2 (Figure 5). A replication of the analyses carried out by Joynt and Wolfe
(2001) confirmed that the modern diatom assemblages are a reasonable predictor of pH (r2 =
0.63) and thus a diatom-inferred pH reconstruction was applied to the fossil assemblages of

! 72
Baker Lake. Residual plots of the 61 sites highlighted two outliers that represented sites with pH
environments unique compared to the other sites within the calibration set (pH values below 5.5)
(Figure 6a). Re-running each transfer function with these two sites (site numbers 58 and 60)
removed from the analyses resulted in considerably improved performance of the models (Table
1). As such, a pH reconstruction for Baker Lake was performed with the exclusion of the
outlying sites from the modern calibration dataset.
A range of diatom-inferred pH transfer functions were analysed to reconstruct past pH in
the Baker Lake record (Table 1). In general WA with classical deshrinking (WAclassic) generated
the strongest inference model with the most robust performance statistics (Figure 6b). The
transfer function generated from WAclassic was most suitable for predicting pH as it had the
strongest correlation coefficient (r2boot = 0.40) and lowest maximum bias (max biasboot = 0.42 pH
units). However, the transfer function generated using the second component Weighted
Averaging-Partial Least Squares (WA-PLS) method gave the lowest root mean square error of
prediction (RMSEP = 0.33 pH units) compared to a slightly higher WAclassic RMSEP value of
0.35 pH units (Table 1 and Figure 6). Residual plots also demonstrated a stronger relationship
between observed and predicted pH values for the WA-PLS transfer function (Figure 6c).
However, the modern lake-water pH was most accurately predicted using the WAclassic model,
which reported a modern diatom-inferred pH of 7.19 compared to the measured lake-water pH in
the field of 7.2. Results from both the WAclassic and WA-PLS transfer functions are reported in
Figures 6 and 7 for graphical comparison. The performance statistics obtained from the Baker
Lake diatom-pH reconstructions are consistent with other diatom pH inference models, with
maximum biasboot ranging from 0.39-1.60 pH units and RMSEP ranging from 0.31-0.98
(Antoniades et al, 2004, 2005; Michelutti et al, 2006b; Adams and Finkelstein, 2010).
Based on the WAclassic transfer function, diatom-inferred pH for Baker Lake does not vary
greatly throughout the core with the lowest pH value of 6.9 occurring at 1919 AD and the highest

! 73
diatom inferred pH of 7.3 occurring at 1980 AD (Figure 3 entire record; Figure 7 1959-2009
AD). Additionally, the RMSEP calculated by the model (RMSEP = 0.35) encompasses almost
the entire range of reconstructed pH values for Baker Lake (0.4 pH units).
Calculated ice cover duration for Baker Lake ranges from 104 days per year in 1996, to
266 days per year in 1972 AD. Ice cover data were available for every year spanning the period
1959 – 2010 AD with the exception of four years between 1999 and 2002 AD. There is a general
trend towards decreasing duration of ice cover throughout the instrumental record with lowest
values exhibited between 1994-1998. As would be expected, ice cover duration and measured
temperature changes are inversely correlated. An inverse relationship also exists between ice
cover duration and diatom-inferred pH (r2 = 0.63) (Figure 8). However this relationship is not
statistically significant (p < 0.0985) likely due to small sample size. While the inverse
relationship between diatom-inferred pH and changes in measured lake-ice duration is noted in
parts of the record for example between 1981-1985 where a period of reduced ice cover duration
(< 200 days) corresponds with peak pH values (7.29), there exist other periods of comparatively
short ice cover duration (<160 days between 1992-1996), which correspond to decreased pH
values (Figure 7).
Discussion
The Baker Lake diatom assemblages have undergone relatively modest changes during
the late Holocene with the most pronounced shifts occurring in the very recent sediments (> 2005
AD). In zones 1 and 2, a shift to a diatom community that is largely different to that recorded in
zone 3 is noted, characterized by increasingly high relative abundances of small planktonic
Cyclotella spp. which were present at only trace amounts (< 2%) in previous intervals.
Concurrent with the expansion of smaller, lighter, planktonic diatoms were marked decreases in
both benthic Fragilaria species and tychoplanktonic Aulacoseira taxa.

! 74
A higher relative abundance of Fragilaria species in the bottommost sediments can be
interpreted as generally colder conditions and related limnological characteristics including
extensive ice and snow cover (Rühland et al, 2003). The fragilarioid group are known to be
pioneering and opportunistic diatoms, often dominating the modern and fossil diatom
assemblages of Arctic lakes and proliferating during colder periods with short growing seasons
and extended ice cover (Douglas and Smol, 1995; Bouchard et al, 2004). Consistent with the
ecological affinities of Fragilarioid spp., the dominance of Aulacoseira spp. in the early
sediments is also typical of colder, Arctic tundra conditions with strong winds and decreased
thermal stratification with reduced nutrient distribution (Rühland and Smol, 2005). The
environmental conditions inferred from the diatom assemblages of zone 1 correspond closely to
those suggested by chironomid assemblages analyzed in the same sediment core, where higher
relative abundances of cold-water chironomid taxa are present and a -3°C deviation from the
1970-1990 AD climate normals is suggested by chironomid-inferred summer water temperatures
(Medeiros et al, 2011).
After 1950 AD, a marked shift in the diatom record was delineated by an increase in
planktonic taxa (zone 2). This shift was mainly reflected by an increase in Cyclotella stelligera,
the proliferation of which has been widely noted at this time period across arctic and subarctic
regions (Rühland et al, 2003; Rühland et al, 2008). Increases in these taxa have been linked to
increased air temperature resulting in a longer ice-free season and/or deeper sub-surface habitats
where nutrient concentrations are slightly elevated, light properties are stabilized, and thermal
stratification is enhanced (Fahnenstiel and Glime 1983; Rühland et al, 2003). In the Baker Lake
record, the increases in Cyclotella spp. are accompanied by decreases in Aulacoseira spp. and
Fragilaria spp., in both zones 1 and 2. The inverse correlation between the abundances of the
two planktonic genera Aulacoseira and Cyclotella has been noted elsewhere in the Arctic
(Sorvari et al. 2002; Rühland et al 2003). For example, Rühland and Smol (2005) found that the

! 75
decline in the heavy and highly silicified Aulacoseira taxa at Slipper Lake, an inland subarctic
tundra lake in the Northwest Territories, was likely an indication of stronger thermal stratification
and reduced mixing after ca. 1850 AD.
Similarly, in a 50-lake dataset from the Canadian Arctic treeline, strongest thermal
stratification, which was recorded in the deepest sites (14-19 m), resulted in the greatest increases
in Cyclotella species (Rühland et al, 2003). Since turbulent mixing is required to keep heavier
planktonic diatom valves afloat in the euphotic zone (Reynolds 1993) thermal stratification was
found to be a major driver for the expansion of small planktonic diatoms in deep (< 27 m)
subarctic lakes of Finnish Lapland (Sovari et al. 2002). Increased thermal stratification can be
caused by increases in air temperature, length of the ice-free season, and also by a decline in
wind speeds. At Baker Lake these trends, beginning around 1950 AD, intensify after 2005 AD
(Zone 3; Figure 4).
The duration of measured lake-ice cover exhibits little fluctuation and remains high (>
220 days per year) between 1959 and !1972 AD but is underpinned by a subtle decline in the
duration of ice-cover throughout the instrumental record (Figure 7). The longer duration of ice
cover prior to 1972 AD is consistent with the dominance of Aulacoseira spp. and Fragilaria spp.
until approximately 1970 AD. After 1972 AD the duration of ice cover from year to year
becomes increasingly variable, concurrent with the expansion of Cyclotella spp., and decreases in
Aulacoseira spp., to consistently below 10%. Shifts in the relative abundances of these taxa
support the hypothesis that the dominance of smaller and lighter planktonic taxa is related to a
decrease in the duration of ice cover and associated limnological variables in Baker Lake.
Similarly, the relative abundances of Fragilaria taxa decrease during the 1970’s and remain low
(< 4%), although appear to respond to a short-lived increase in ice-cover duration between 1998
and 2005 AD highlighting their tolerance for colder conditions.

! 76
The sudden proliferation of Cyclotella species after 2005 AD also appears consistent with
a trend towards more substantial decreases in the duration of lake-ice cover since 2004 AD.
Concurrent with decreased ice cover and enhanced thermal stratification is evidence of increased
nutrient cycling within Baker Lake. An increase in the relative abundances of the diatoms
Tabellaria flocculosa and Achnanthidium minutissimum, indicators of higher nutrient
concentrations (Hadley et al. 2010), suggests that higher temperatures may have enhanced
nutrient cycling within the lake. These compositional shifts suggest that a decrease in lake-ice
cover duration occurred in tandem with an increase of 2ºC in mean annual temperature relative to
the 1970-1990 climate normal and enhanced nutrient cycling within Baker Lake.
Initially diatom-inferred pH values exhibit an inverse relationship with measured ice
cover duration reaching a maximum when ice cover duration is shorter between 1980 and 1986
AD, as expected if DIC and lake-ice dynamics drive lake-water pH (Wolfe, 2002). However,
after ca. 1986 AD, temporal shifts in diatom-inferred pH appear directionally synchronous with
changes in ice cover duration. As such, it is likely that the diatom pH transfer function either
does not provide an accurate representation of past pH values or lake-ice cover is not the main
control on lake-water pH in Baker Lake.
Whilst it is expected that high latitude lakes are climatically sensitive (ACIA, 2004; Smol
et al, 2005) studies have frequently suggested that the response of larger, deep lakes to climatic
perturbation is often of lower magnitude or muted compared to smaller, shallower lakes
(Michelutti et al, 2003; Antoniades et al, 2005; Keatley et al, 2008). As such, lake depth plays a
significant role in how changes in climate and changes in lake-ice cover duration affect the
diatom flora. Compared to previous diatom-inferred pH reconstructions from the Arctic,
reconstructed pH in Baker Lake does not exhibit substantial variation. For example, the
termination of the Little Ice Age, which was marked by temperature increases of up to < 1°C in
the eastern Arctic, was concurrent with an increase of 0.7 pH units in several Baffin Island lakes
! 77
(Wolfe, 2003). However, a measured 3°C increase in air temperature recorded throughout the
20th century at the Baker Lake climate station is marked by a change in diatom-inferred pH of
only 0.4 pH units.
However, the lack of substantial change in diatom-inferred pH throughout the record is
not entirely unexpected. Diatom community shifts in Baker Lake are analogous to those noted in
other deep lakes from the circumpolar region where diatom communities have exhibited only
subtle changes beginning during the last 20 years (Doubleday et al, 1995; Antoniades et al, 2005)
with relatively small increases in planktonic species in the most recent sediments (Sorvari et al,
2002; Rühland et al, 2003). Additionally, the modest nature of diatom assemblage shifts in the
Baker Lake record may also explain why changes in diatom-inferred pH are only slight compared
to records from smaller, shallower lakes.
Furthermore, despite shifts in diatom community composition in relation to measured
changes in ice cover duration, the directional symmetry between diatom-inferred pH and lake-ice
cover duration obtained for Baker Lake suggest that there may be poor analogues between the
fossil and modern samples used for calibration which reduces the quality of the reconstruction.
Whilst both Baker Lake and many of the 61 calibration set lakes are dominated by Aulacoseira
spp., Cyclotella stelligera and Staurosira construens var. venter, there are many other
subdominant species within the Baffin Island lakes such as Eunotia spp., Pinnularia spp. and
Frustulia spp. that were present at only trace abundances in the Baker Lake diatom record.
Furthermore, whilst a DCA performed on the combined modern and fossil assemblages used in
the reconstruction indicated a reasonable degree of similarity between the fossil and modern
assemblages, the fossil diatom assemblages ordinated at least 1 SD unit away from the majority
of sites in the modern calibration set along DCA axis 1 (Figure 5) indicating that the modern
training set used may not be ideally suited to the fossil assemblages of Baker Lake. Nonetheless,
few other diatom pH calibration datasets are available for the low Canadian Arctic and many

! 78
other modern studies within closer proximity to Baker Lake are treeline sites which focus strictly
on diatom-DOC relationships (Fallu et al, 1999; Pienitz et al, 1999; Rühland and Smol, 2002).
Conclusion
The diatom record from Baker Lake tracks subtle compositional changes in species
relative abundances which are consistent with the onset of recent warming since ca. 1950 AD.
The most striking changes were represented by the inverse relationship between planktonic
diatoms Aulacoseira spp. and Cyclotella spp. The decline in Aulacoseira lirata relative to
Cyclotella stelligera suggests that climate has warmed in the low Arctic resulting in longer ice-
free periods with increased growing season length, enhanced thermal stratification and a
reduction in wind-induced mixing. When compared to the instrumental record, diatom species
shifts since 1959 AD are generally synchronous with increases in measured air temperature and
decreases in the duration of lake-ice cover, particularly after 1985 AD.
Diatom-inferred pH exhibits a more complicated relationship with changes in the
duration of ice cover whereby reductions in the duration of ice-cover did not necessarily equate
to more alkaline conditions. This may be due to both the appropriateness of the modern
calibration set used, and the possibility that lake-ice cover may not be the main control over
lakewater pH in such a large, deep lake. As such, the diatom pH reconstruction does not provide
a complete representation of changes in Baker Lake throughout the late Holocene. Nonetheless,
this study supports the growing body of paleoecological evidence throughout the northern high
latitudes suggesting that recent arctic warming has not been a localized event. Furthermore,
Baker Lake represents one of few high-resolution diatom records of late Holocene climate
change in the western Hudson Bay region.
!

! 79
!Inference Model Apparent Cross validation RMSE (pH) r2 RMSEP (pH) r2boot Max biasboot %change WA (inverse) 0.34 0.45 0.39 0.32 1.67 WA (classic) 0.50 0.45 0.52 0.33 1.44 33.45 WAtol (inverse) 0.32 0.50 0.39 0.33 1.67 WAtol (classic) 0.45 0.50 0.49 0.34 1.47 24.73 WA (inversea) 0.24 0.53 0.28 0.39 0.51 WA (classica) 0.33 0.53 0.35 0.40 0.42 24.24 WAtol (inversea) 0.23 0.55 0.29 0.38 0.48 WAtol (classica) 0.32 0.55 0.35 0.40 0.38 20.73 MAT 0.36 0.36 0.38 0.37 1.66 PLS-1 0.34 0.45 0.39 0.32 1.29 PLS-2 0.31 0.51 0.41 0.30 1.49 WAPLS-1 0.27 0.49 0.32 0.36 1.09 WAPLS-2 0.24 0.60 0.38 0.26 1.12 15.94 WAPLS- 1a 0.24 0.53 0.28 0.39 0.50 WAPLS-2a 0.20 0.67 0.33 0.30 0.48 18.29 !Table 1. Performance of each model type relating to pH and diatom variance. Modern diatom data provided by Joynt and Wolfe (2001). a denotes model run with the exclusion of sites 58 and 60 from the analysis. !!!!!!!!!!!!!!!!!!!!!!!!

! 80
!!
!!!Figure 1: Location map of Baker Lake and the Baker Lake climate station (same location). Shaded area represents the Hudson Bay Lowlands to the south and the location of Lake AT01 (see chapter 2). !!!!!!!!!

! 81
!!!!!!!!!!!!!!!!!!!!!!!!!!Figure 2. Age-depth curve for Baker Lake based on 210Pb dates. Background 210Pb activity was reached at 12.5 cm with an age of 1883 AD. !!!!!!

! 82
!!Figure 3. Summary of biostratigraphic, paleoclimatic and sedimentological data for core BL01. Results of ordination by PCA of fossil samples are plotted as PCA1 (axis 1 scores) and PCA (axis 2 scores) (x-axis scaling differs). !!!!!!!!!!!!!!!!!!!! ! ! !!!

! 83
!!!!!!!!!!!!!!!!!!!!!!!!!!!!!!!!!!!!!!!Figure 4. Biostratigraphic trends of the relative abudnaces (%) of the most common diatom taxa in the core BL01, (x-axis scaling differs). Diatom taxa displaying similar trends and/or are known to have similar ecological preferences are grouped, resulting in 3 taxonomic groups: the Achnanthes complex (A. altaica, A. flexella, A. nitidiformis); the Nitzschia complex (N. dissipata, N. palea, N. fonticola); the Surirella complex (S. angusta, S. bifrons, S. lirata). Symbol + denotes present at abundance of < 0.5%. 210Pb ages are noted on secondary Y axis. Horizontal lines delineate biostratigraphic zones determined by cluster analysis.
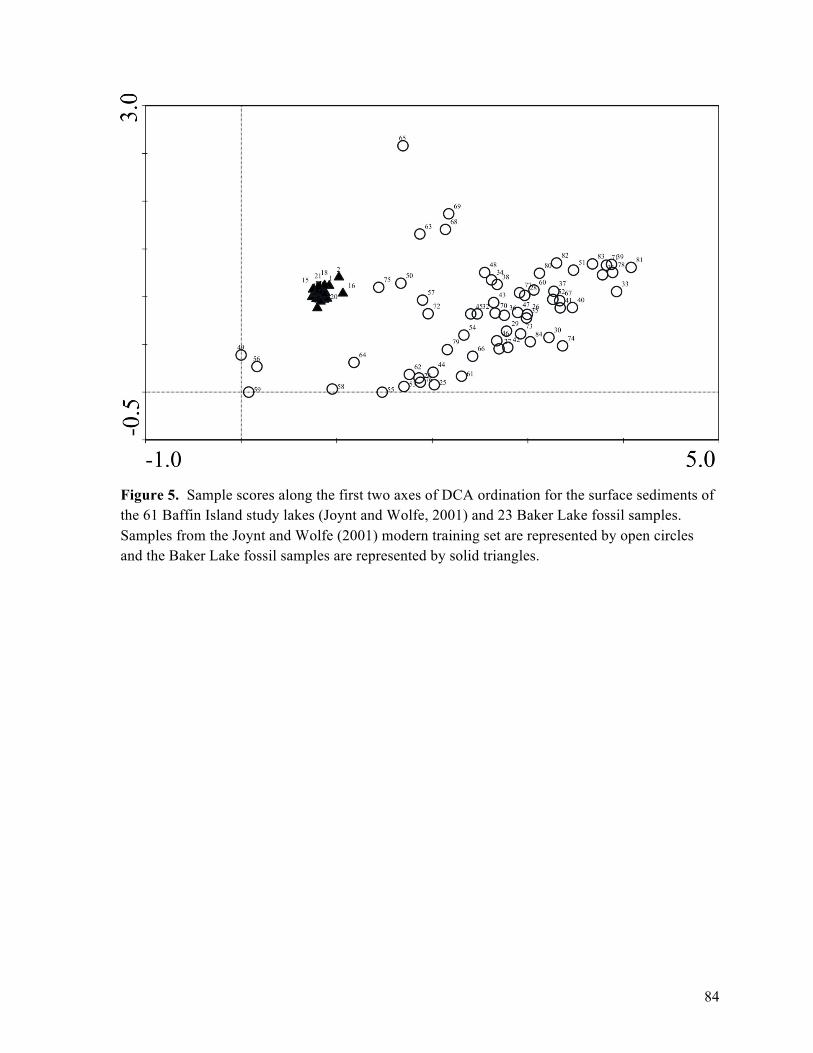
! 84
!!Figure 5. Sample scores along the first two axes of DCA ordination for the surface sediments of the 61 Baffin Island study lakes (Joynt and Wolfe, 2001) and 23 Baker Lake fossil samples. Samples from the Joynt and Wolfe (2001) modern training set are represented by open circles and the Baker Lake fossil samples are represented by solid triangles. !!!!!!!!!!!!!!!!!!!!!!

! 85
!!!!!!!!!!!!!!!!!!!!!!!!!!!"#$%&'!()!"#$%&'()*+',*!-#&.##)!(-*#/0#1!,2!0#/*3*!&+#!1'%&(45')6#//#1!,2!3*')7!8%9!:;!<$%**'<!!/#7/#**'()!-%*#1!()!%$$!=>!*&31?!$%@#*A!8<9!:;!<$%**'<!-%*#1!()!BC!*&31?!$%@#*!8*'&#*!BD!%)1!=E!/#4(0#19A!8#9!:;5FGH!*#<()1!<(4,()#)&!3*')7!BC!*&31?!$%@#*I!!F$(&*!()!&+#!/'7+&!1#,'<&!&+#!(-*#/0#1!,2!0#/*3*!/#*'13%$!0%$3#*I!!!!!!!!!!!!!!!!!!!!Figure 6. Relationships between observed pH versus the diatom-inferred pH using (a) WA classic regression based on all 61 study lakes; (c) WA classic based on 59 study lakes (sites 58 and 60 removed); (e) WA-PLS second component using 59 study lakes. Plots on the right depict the observed pH versus residual values.

! 86
!
! Figure 7. A comparison of the Baker Lake diatom-inferred pH values based on the output of WA-PLS components 1 and 2 and WA classic inference models and lake-ice cover duration and mean annual temperature deviation for the period 1950-2010. !!!!!!!!!!!!!!!

! 87
!!!
!!!!
Figure 8. Correlation scatterplot showing relationship between duration of lake-ice cover on Baker Lake (days of year) and diatom-inferred pH between 1959-2010. !!!!!!!
!
!"!#!$%&"!'!(!$%$)*+!

! 88
CHAPTER 4
Conclusions
This thesis has focused on the response of diatoms to changes in environmental and
climatic conditions in the western Hudson Bay region. Changes in limnological variables related
to climate and hydrology have dictated the distribution of diatom assemblages over time from the
western HB region with results suggesting that changes occurring during the late post-industrial
period are unprecedented since the early-middle Holocene.
Pre-industrial paleoenvironments of the western Hudson Bay Region
Evidence exists for the onset of two periods of climate change including the HTM and
possibly Neoglacial cooling in the AT01 diatom record during the pre-industrial interval (Chapter
2). The timing of a significant decrease in the relative abundances of cold-water tolerant
Fragilaria species is consistent with other subarctic records suggesting the existence of the HTM
after 6000 years BP in eastern Canada (Kaufman et al, 2004). However, while significant,
taxonomic changes associated with the inception and duration of the HTM were found to be of
lower magnitude than those associated post-industrial recent warming. The onset of Neoglacial
cooling is more speculative due to low temporal resolution of the diatom record between 4500
and 150 years BP. However, reduced diatom productivity and a brief reappearance of Fragilaria
species between 4500 and 3500 years BP suggest a colder interval.
Trends in the diatom assemblages have added new information to interpretations made with
more conventional indicators from peatland studies in the Hudson Bay Lowlands. The AT01
diatom record has tracked changes in lake-ice cover, lake depth and nutrient availability, and
provided an independent line of evidence for warm and cold periods in the HBL during the

! 89
Holocene. Separating climatic from non-climatic or geological influences on the evolution of the
HBL peatlands remains complex in a landscape shaped by significant rates of isostatic rebound
and related peatland succession. However, the record of an HTM and possibly Neoglacial
cooling are important new contributions to paleoclimatic data in the HBL. Whilst non-climatic
factors, namely hydrology, played a dominant role in the ontogeny of Lake AT01, a speculative
model based on kettle lake development suggested that dynamic hydrological changes may have
been more closely related to climatically induced, progressive melting of remnant kettle ice in the
lake basin than a result of isostatic rebound. As such, since its isolation from the Tyrrell Sea,
Lake AT01 has provided a record of paleoclimate since 7000 years BP in the HBL largely
independent of geological control.
Nonetheless, similar to both northern HB (Haberzettl et al, 2010) and terrestrial regions
peripheral to HB (Fallu et al, 2005; Rolland et al, 2008), the relative magnitudes of climatic
episodes including the HTM and Neoglacial were small compared to changes noted at other sites
in the subarctic (McDonald et al, 1993; 1998; Kaufman et al, 2004). Thus it was concluded that
the persistence of kettle ice and the cold postglacial Tyrrell Sea within and surrounding the AT01
basin likely muted the climate signal to some extent. Future work at this lake requires the
utilization of a multi-proxy approach incorporating an indicator for paleohydrology to further
extract climate and hydrology signals to determine what has been the primary driver of diatom
compositional change in Lake AT01.
Post-industrial changes in the western Hudson Bay region
The diatom records from both Lake AT01 and Baker Lake indicated that substantial
limnological changes have occurred over the last 150 years with notable shifts in the dominant
functional groups of diatoms during the 20th century similar to other arctic, subarctic and
temperate studies (Rühland et al, 2008). Marked increases in Cyclotella taxa during the late 20th

! 90
century in both lakes were concurrent with decreases in benthic species and increased diatom
production. These diatom shifts may be related to recent arctic warming since the 19th century,
likely resulting in shorter periods of ice cover, a longer growing season, enhanced thermal
stratification and increased nutrient cycling, all of which are known to encourage the
development of planktonic diatom assemblages (Smol, 1988; Douglas and Smol, 1999).
To determine if lake-ice duration was the primary control on the diatom assemblages of
Baker Lake, a quantitative and qualitative comparison of instrumental lake-ice data and diatom
compositional change was carried out (Chapter 3). Variations in measured lake-ice duration were
used as a guide to interpret observed changes in the fossil diatoms from Baker Lake. Qualitative
species assemblage shifts indicated that Baker Lake has undergone a long-term and subtle
climate warming which has lead to littoral habitat diversification and increased habitat
availability within the water column and water column stability. When compared to the
instrumental record, diatom species shifts since 1959 AD were generally synchronous with
increases in measured air temperature and decreases in the duration of lake-ice cover, a trend
which intensified after 1985 AD.
Weighted-averaging reconstructed values for lake-water pH however, were less consistent
with the instrumental record with significant reductions in the duration of lake-ice cover after ca.
1985 AD not reflected by changes in diatom-inferred pH. Additionally throughout the majority of
the Baker Lake record, diatom-inferred pH changes were directionally synchronous with changes
in the duration of ice cover despite the expected inverse relationship noted in several other
studies (Wolfe, 2002; Wolfe, 2003). This finding is important in understanding the manifestation
of temperature changes and lake-ice cover dynamics on the diatom communities of larger, deeper
lakes. It is possible that the diatoms of Baker Lake may have responded more sensitively to other
physico-chemical variables than to pH. Thus it is important to establish whether pH is the main
control of diatom assemblage compositions across a lake size-depth gradient. Future work

! 91
should examine existing lake-ice cover data for large, deep lakes to explore whether these sites
exhibit lower variability in ice cover duration compared to smaller, shallower lakes and the
impact of differing ice cover regimes on the diatom assemblages. Additionally a lack of modern
calibration studies in the western Hudson Bay region meant that there were some poor analogues
between the modern and fossil samples used for calibration resulting in reduced quality of the
reconstruction.
The temporal consistency in the onset of planktonic diatom proliferation during the late
20th century in both Baker Lake and AT01 highlighted the slightly later response of these lakes to
climate warming compared to other subarctic (Rühland and Smol, 2005) and arctic (Smol et al,
2005) sites, where warming-induced assemblage shifts have occurred since the 19th century.
However, the timing of diatom-inferred warming at both lakes is consistent with a climatic shift
that has been noted in Hudson Bay since the mid 1990’s (Hoccheim et al, 2010). A strongly
negative NAO linked to both natural variability and increased anthropogenic warming are
thought to have caused large-scale and strongly negative sea-ice anomalies in HB and Hudson
Strait since 1980 AD, and decreases in freshwater-ice extent linked to increased temperature
trends in the HB region which have been amplified since 1996 AD (Lindsay and Zhang, 2005;
Hoccheim et al, 2010; Dibike et al, 2011b). A decline in HB sea-ice may have reduced the extent
of snow and freshwater-ice on land (Rouse et al, 1997) which may in turn alter energy and
moisture exchanges over lakes and their catchments with the potential to impact on regional
hydrology via modifications in snow melt, evaporation, flooding, wetland formation, soil freeze
thaw and run-off generation (Woo, 2010).
Summary
Lake AT01 represents the only diatom record of Holocene paleoenvironments in the HBL.
Additionally, few diatom records of post-industrial arctic warming exist from the northwestern

! 92
Hudson Bay region. Consistent with satellite and instrumental data from other sites peripheral to
HB, neither lake revealed indisputable evidence of climate related diatom shifts in the western
HB region until after 1950 AD, with the most pronounced climate induced assemblage shifts
noted prominently after 1980 AD. Whereas most high latitude studies are characterized by low
sediment accumulation with the last 150 years of sedimentation contained within the to 5 cm of
sediments, rapid sedimentation rates in Baker Lake and particularly AT01, provided unusually
high-resolution records of the post-industrial period in the western Hudson Bay region.
Establishing two sub-decadal resolution diatom records has provided a clearer biological and
climatic signal throughout the Holocene in Lake AT01 and particularly recent decades in both
lakes relative to previous Arctic paleoclimatic reconstructions. However, more
paleolimnological studies are required to improve our knowledge of past climates and
environments over longer timescales in the western HB region and strengthen our interpretations.
!
!
!
!

93
References ACIA (2004) Impacts of a Warming Arctic: Arctic Climate Impact Assessment 1042pp. Available from: acia.uaf.edu. [Accessed 12 September 2010] Acs E, Kiss KT, Szabo K, Makk J (2000) Short-term colonization sequence of periphyton on glass slides in a large river (River Danube, near Budapest). Algological Studies 100: 135-156 Adams J, Finkelstein S (2010) Watershed-scale reconstruction of middle and late Holocene paleoenvironmental changes on Melville Peninsula, Nunavut, Canada. Quaternary Science Reviews 29: 2302-2312 Andrews J, Peltier R (1989) Quaternary geodynamics Canada. In: Fulton JR (eds) Quaternary Geology of Canada and Greenland, Geological survey of Canada. Springer, Canada Antoniades D, Douglas MSV, Smol JP (2004) Diatom species-environment relationships and inference models from Isachsen, Ellef Ringnes Island, Canadian High Arctic. Hydrobiologia 529: 1-18 Antoniades D, Douglas MSV, Smol, JP (2005) Quantitative estimates of recent environmental changes in the Canadian High Arctic inferred from diatoms in lake and pond sediments. Journal of Paleolimnology 33: 349-360. Antoniades D, Hamilton PB, Douglas MSV, Smol JP (eds) (2008) Diatoms of North America: The Freshwater Floras of Prince Patrick, Ellef Ringnes and northern Ellesmere Islands from the Canadian Arctic Archipelago. Gantner Verlag Ruggell, Liechtenstein Appleby P, Oldfield F (1978) The calculation of lead-210 dates assuming a constant rate of supply of unsupported 210Pb to the sediment. Catena 5: 1-8 Ball T (1983) The migration of geese as an indicator of climate change in the southern HB region between 1715 and 1851. Climate Change 5: 85-93 Ball T (1985) Historical evidence and climatic implications of a shift in the boreal forest tundra transition in central Canada. Climate Change 8: 121-134 Ball T (1994) Climate of two locations on the southwestern corner of Hudson Bay: AD 1720-1729. International Journal of Climatology 14: 1151-1168
Ball T, Kingsley, R (1984) Instrumental temperature records at two sites in central Canada: 1768 to 1910, Climate Change 6: 39-56

94
Battarbee RW, Charles DF, Dixit SS, Renberg I (1999) Diatoms as indicators of surface water acidity. In: Stoermer EF, Smol JP (eds) The diatoms: applications for the environmental and earth sciences. Cambridge University Press, UK Beaulieu-Audy V, Garneau M, Richard PJH, Asnong H (2009) Holocene palaeoecological reconstruction of three boreal peatlands in the La Grande Riviere region, Quebec, Canada. The Holocene 19: 459-476 Bennett JR, Cumming BF, Ginn BK, Smol JP (2010) Broad-scale environmental response and niche conservatism in lacustrine diatom communities. Global Ecology and Biogeography 19: 724-732 Berger A, Loutre MF (1991) Insolation values for the climate of the last 100,000 years. Quaternary Science Reviews 10: 297-317 Bhatt US, Walker DA, Raynolds MK, Comiso JC, Epstein HE, Jia G, Gens R, Pinzon JE, Tucker CJ, Tweedie CE, Webber PJ (2010) Circumpolar Arctic tundra vegetation linked to sea ice decline. Earth Interactions 14 doi: 10.1175/2010EI315.1 Bilodeau G, Vernal A, Hillaire-Marcel C (1990) Postglacial paleoceanography of Hudson Bay: stratigraphic, microfaunal and palynological evidence. Canadian Journal of Earth Sciences 27: 946-963 Birks HJB (1995) Quantitative palaeoenvironmental reconstructions In: Maddy D, Brew JS (eds) Statistical Modelling of Quaternary Science Data, Technical Guide 5. Quaternary Research Association, UK Blockley SPE, Blaauw M, Bronk Ramsey C, van der Plicht J (2007) Building and testing age models for radiocarbon dates in lateglacial and early Holocene sediments. Quaternary Science Reviews 26: 1915-1926 Bouchard G, Gajewski K, Hamilton PB (2004) Freshwater diatom biogeography in the Canadian Arctic Archipelago. Journal of Biogreography 31:1955-1973. Brothers S, Vermaire JC, Gregory-Eaves I (2008) Empirical models for describing recent sedimentation rates in lakes distributed across broad spatial scales. Journal of Paleolimnology 40: 1003-1019 Bunbury J, Finkelstein SA, Bollmann J (2011) A testate amoeba record of Holocene hydro-climatic change from a peat bog in the Attawapiskat River watershed, Hudson Bay Lowlands. Submitted
95
Byllaardt JV, Cyr H (2011) Does a warmer lake mean smaller benthic algae? Evidence against the importance of temperature-size relationships in natural systems. Oikos 120: 162-169 Chakraborty K, Finkelstein S, Desloges J, Chow N (2010) Holocene paleoenvironmental changes inferred from diatom assemblages in sediment of Kusawa Lake, Yukon Territory, Canada. Quaternary Research 74: 15-22 Cole JJ, Caraco NF, Kling GW, Kratz TK (1994) Carbon dioxide supersaturation in the surface waters of lakes. Science 282: 1568-1570 Comiso JC, Parkinson CL, Gersten R, Stock L (2008) Accelerated decline in the Arctic sea ice cover. Geophysical Research Letters 35: L01703 doi: 10.1029/2007GL031972 Cumming BF, Wilson SE, Hall RI, Smol JP (eds) (1995) Diatoms from British Columbia (Canada) lakes and their relationship to salinity, nutrients and other limnological variables, Bibliotheca Diatomologica Band 31. J. Cramer, Berlin/Stuttgart, Germany Dibike Y, Prowse T, Bonsal B, de Rham Laurent, Saloranta T (2011a) Simulation of North American lake-ice cover characteristics under contemporary and future climate conditions. International Journal of Climatology doi: 10.1002/joc.2300 Dibike Y, Prowse T, Saloranta T, Ahmed R (2011b) Response of Northern Hemisphere lake-ice cover and lake-water thermal structure patterns to a changing climate. Hydrological Processes doi: 10.1002/hyp.8068 Doubleday NC, Douglas MSV, Smol JP (1995) Paleoenvironmental studies of black carbon depositions in the High Arctic: a case study from northern Ellesmere Island. Science of the Total Environment 160: 661-668 Douglas MSV, Smol, JP (1995) Periphytic diatom assemblages from high Arctic ponds. Journal of Phycology 31:60-69 Douglas MSV, Smol JP (1999) Freshwater diatoms as indicators of environmental change in the High Arctic. In: Stoermer EF, Smol JP (eds) The Diatoms: Applications for the environment and earth sciences. Cambridge University Press, UK Douglas MSV, Smol JP (2010) Freshwater diatoms as indicators of environmental change in the High Arctic, In: Stoermer EF, Smol JP (2nd edition) The Diatoms: applications for the environmental and earth sciences. Cambridge University Press, Cambridge, UK
96
Douglas, MSV, Smol JP, Blake W (1994) Marked post-18th century environmental change in high Arctic ecosystems. Science 266: 416-419 Dredge L, Cowan W (1989) Quaternary geology of the southwestern Canadian Shield. In: Fulton RJ (eds) Quaternary geology of Canada and Greenland. Elsevier, Canada Dyke AS (2004) An outline of North American deglaciation with emphasis on central and northern Canada. Developments in Quaternary Science 2: 373-424 Dyke AS, Prest VK (1987) Late Wisconsinan and Holocene history of the Laurentide Ice Sheet. Geographie Physique et Quaternaire 41:237-263 Edwards KJ, Whittington G (2001) Lake sediments, erosion and landscape change during the Holocene in Britain and Ireland. Catena 42: 143-173 Enache MD, Paterson AM, Cumming BF (2011) Changes in diatom assemblages since pre-industrial times in 40 reference lakes from the Experimental Lakes Area (northwestern Ontario, Canada). Journal of Paleolimnology doi: 10.1007/s10933-011-9504-2 Environment Canada (1988) Wetlands of Canada, Ecological Land Classification series no. 24. Polyscience Publications Inc, Ottawa, Canada Environment Canada (1994) Manual of analytical methods. Burlington, Ontario: National Laboratory for Environmental Testing, Canadian Centre for Inland Waters. Environment Canada Press, Ottawa, Canada Evenset A, Christensen GN, Carroll J, Zaborska A, Berger U, Herzke D, Gregor D (2007) Historical trends in persistent organic pollutants and metals recorded in sediment from Lake Ellasjøen, Bjørnøya, Norwegian Arctic. Environmental Pollution 146:196-205 Faegri K, Iversen J (1989) (3rd edition) Textbook of pollen analysis. John Wiley & Sons, Toronto, Canada Fahnenstiel GL, Glime JM (1983) Subsurface chlorophyll maximum and associated Cyclotella pulse in Lake Superior. Internationale Revue der Gesamten Hydrobiology und Hydrographie 68: 605-618. Fallu MA, Pienitz R (1999) Lacustrine diatoms in the Hudson Bay and James Bay area of Quebec – reconstruction of dissolved organic carbon concentrations. Ecoscience 6: 603-620 Fallu MA, Allaire N, Pienitz R (eds) (2000) Freshwater diatoms from northern Quebec and Labrador (Canada). Bibliotheca Diatomologica 45. Cramer, Germany

97
Fallu MA, Pienitz R, Walker I, Lavoie M (2005) Paleolimnology of a shrub-tundra lake and response of aquatic and terrestrial indicators to climate change in arctic Quebec, Canada. Palaeogeography, Palaeoclimatology ,Palaeoecology 215: 183-203 Finkel ZV, Vaillancourt J, Irwin AJ, Reavie ED, Smol JP (2009) Environmental control of diatom community size structure across aquatic ecosystems. Proceedings of the Royal Society B 276: 1627-1634 Finkelstein SA, Gajewski K (2007) A paleolimnological record of diatom-community dynamics and late-Holocene climate changes from Prescott Island, Nunavut, central Canadian Arctic. The Holocene 17: 803-812 Finkelstein SA, Gajewski K (2008) Responses of Fragilarioid-dominated diatom assemblages in a small Arctic lake to Holocene climatic changes, Russel Island, Nunavut, Canada. Journal of Paleolimnology 40: 1079-1095 Finkelstein SA, Cowling SA (2011) Wetlands, temperature and atmospheric CO2 and CH4 coupling over the past two millenia. Global Biogeochemical Cycles 25: GB1002 doi:10.1029/2010GB003887 Florin MB (1970) Late-glacial diatoms of Kirchner Marsh, southeastern Minnesota. Nova Hedwigia Beiheft 31: 667-756 Florin MB, Wright HE (1969) Diatom evidence for the persistence of stagnant glacial ice in Minnesota. Geological Society of America Bulletin 80: 695-704 Gagnon A, Gough W (2005a) Climate change scenarios for the Hudson Bay regions: an intermodel comparison. Climate Change 69: 269-297 Gagnon A, Gough W (2005b) Trends in the dates of ice freeze-up and break-up over Hudson Bay, Canada. Arctic 58: 370-382 Gajewski K, Atkinson D (2003) Climate change in northern Canada. Environmental Reviews 11: 69-102 Gajewski K, Payette S, Ritchie M (1993) Holocene vegetation history at boreal-forest shrub-tundra transition in northwestern Quebec. Journal of Ecology 81: 433-443 Garralla J, Gajeski K (1992) Holocene vegetation histories from three sites in the tundra of northwestern Quebec. Arctic and Alpine Research 24: 329-336

98
Glaser PH, Hansen BC, Siegel DI, Reeve AS, Morin PJ (2004) Rates, pathways and drivers for peatland development in the Hudson Bay Lowlands, northern Ontario, Canada. Journal of Ecology 92: 1036-1053 Glew J (1988) A new trigger mechanism for sediment samplers. Journal of Paleolimnology 2: 241-243 Gorham E (1991) Northern Peatlands: role in the carbon cycle and probable responses to climatic warming. Ecological Applications 1: 182-195 Grimm E (1987) CONISS: A FORTRAN 77 program for stratigraphically constrained cluster analysis by the method of incremental sum of squares. Computing Geology 13:13-16 Grove JM (2001) Initiation of the “Little Ice Age” in regions round the North Atlantic. Climate Change 48: 53-82 Haberzettl T, St-Onge G, Lajeunesse P (2010) Multi-proxy records of environmental changes in Hudson Bay and Strait since the final outburst flood of Lake Agassiz-Ojibway. Marine Geology 271: 93-105 Hadley K, Douglas MSV, Blais J, Smol JP (2010) Nutrient enrichment in the High Arctic associated with Thule Inuit whalers: a paleolimnological investigation from Ellesmere Island (Nunavut, Canada). Hydrobiologia 649: 129-138. Hare A, Stern G, Macdonald R, Kuzyk Z, Wang F (2008) Contemporary and preindustrial mass budgets of mercury in the Hudson Bay Marine System: the role of sediment recycling. Science of the Total Environment 406: 190-204 Harris SA (2002) Causes and consequences of rapid thermokarst development in permafrost or glacial terrain. Permafrost Periglacial Process 13: 237-242 Heiri O, Lotter AF, Lemcke G (2001) Loss on ignition as a method for estimating organic and carbonate content in sediments: reproducibility and comparability of results. Journal of Paleolimnology 25: 101-110. Hengeveld HG (2000) Projections for Canada’s climate future: A discussion of recent simulations with the Canadian Global Climate Model. Meterological Service of Canada, Environment Canada, Ontario, Canada. Available from: msc.ec.gc.ca/saib/climate/docs/ccd_001-01.pdf [Accessed January 5 2011] Hill MO (1973) Diversity and evenness: a unifying notation and its consequences. Ecology 36: 427-431

99
Hoccheim K, Barber D (2010) Atmospheric forcing of sea ice in Hudson Bay during the fall period, 1980-2005. Journal of Geophysical Research 115: 1-20 Hoccheim K, Barber D, Lukovich J (2010) Changing sea ice conditions in Hudson Bay 1980-2005. In: Ferguson SH, Loseto LL, Mallory ML (eds) A Little Less Arctic: top predators in the world’s largest northern insland sea, Hudson Bay. Springer, Canada Hoccheim K, Lukovich J, Barber D (2011) Atmospheric forcing of sea ice in Hudson Bay during the spring period, 1980-2005. Journal of Marine Systems doi: 10.1016/j.jmarsys.2011.05.003 Holland M, Bitz C, Temblay B (2006) Future abrupt reductions in the summer Arctic sea ice. Geophysical Research Letters 33: L23503 doi: 10.1029/2006GL028024 Johannessen OM, Shaline EV, Miles MW (1999) Satellite evidence for an Arctic sea ice cover in transformation. Science 285: 1937-1939 Johnson L (1965) The salinity of Baker Lake, N.W.T., Canada. Journal of the Fisheries Research Board of Canada. 22: 239-241 doi: 10.1139.f65-024 Joly S, Senneville S, Caya D, Saucier J (2009) Sensitivity of Hudson Bay sea ice and ocean climate to atmospheric temperature forcing. Climate Dynamics doi: 10.1007/s00382-009-0731-4 Jorgenson MT, Osterkamp TE (2005) Response of boreal ecosystems to varying modes of permafrost degradation. Canadian Journal of Forestry Research 35: 2100-2111 Joynt EH, Wolfe AP (2001) Paleoenvironmental inference models from sediment diatom assemblages in Baffin Island lakes (Nunavut, Canada) and reconstructions of summer water temperature. Cananadian Journal of Fisheries and Aquatic Sciences 58: 1222-1243 Juggins S (1992) ZONE data analysis, v. 1.2 Available from: staff.ncl.ac.uk/stephen.juggins/software/ZoneHome.htm Juggins S (2009) C2 data analysis, v.1.6.8. Available from: staff.ncl.ac.uk/staff/stephen.juggins/software/C2Home.htm Karl TR, Trenberth KE (2003) Modern global climate change. Science 302: 1719-1723

100
Kaufman D, Ager T, Anderson N, Anderson P, Andrews J, Bartlein P, Brubaker L, Coats L, Cwynar L, Duvall M, Dyke A, Edwards M, Eisner W, Gajewski K, Geirsdottir A, Hu F, Jennings A, Kaplan M, Kerwin M, Lozhkin A, MacDonald G, Miller G, Mock C, Oswald W, Otto-Bliesner B, Porinchu D, Rühland K, Smol JP, Steig E, Wolfe B (2004) Holocene thermal maximum in the western Arctic (0-180DEGW). Quaternary Science Reviews 23: 529-560. Keatley BE, Douglas MSV, Smol JP (2008) Prolonged ice cover dampens diatom community responses to recent climatic change in high arctic lakes. Arctic Antarctic and Alpine Research 40: 364-372 Kettles I, Garneau M, Jette H (2000) Macrofossil, pollen and geochemical records of peatlands in the Kinosheo Lake and Detour Lake areas, northern Ontario. Geological Survey of Canada, Bulletin 545: 1-24 Keyser AR, Kimball JS, Nemani RR, Running SW (2000) Simulating the effects of climatic change on the carbon balance of North American high-latitude forests. Global Change Biology 6: 185-195 Klinger LF, Short SK (1996) Succession in the Hudson Bay Lowland, Northern Ontario, Canada. Arctic and Alpine Research 28: 172-183. Koinig KA, Schmidt R, Sommaruga-Wograth S, Tessandri R, Psenner R (1998) Climate change as the primary cause for pH shifts in a high alpine lake. Water, Air and Soil Pollution 104: 167-180 Kokfelt U, Rosen P, Schoning K, Christensens TR, Forster J, Karlsson J, Ruess N, Rundgren M, Callaghan TV, Jonasson C, Hammarlund D (2009) Ecosystem response to increased precipitation and permafrost decay in subarctic Sweden inferred from peat and lake sediments. Global Change Biology 15: 1652-1663 Krammer K, Lange-Bertalot H (1986-1991) Bacillariophyceae In: Ettl H, Gerloff J, Heynig M, Mollenhauer D, (eds) Su!wasserflora von Mitteleuropa, vol. 2 (1-4). Gustav Fischer Verlag, Stuttgart, Germany Krebs CJ (eds) (2001) Ecology: The experimental analysis of distribution and abundance, fifth ed. Benjamin/Cummings, New York. Laing TE (1999) Diatoms as indicators of past environmental and climatic changes in the Siberian Arctic. M.Sc. thesis Queen’s University, Kingston, Canada 128pp.

101
Laing TE, Pienitz R, Payette S (2002) Evalutation of limnological responses to recent environmental change and caribou activity in the Riviere George Region, northern Quebec, Canada. Arctic Antarctic and Alpine Research 34: 454-464 Lange K, Liess A, Piggott JJ, Townsend CR, Matthaei CD (2011) Light nutrients and grazing interact to determine diatom community composition and functional group structure. Freshwater Biology 56:264-278 Larsen J, Jones VJ, Eide W (2006) Climatically driven pH changes in two Norwegian alpine lakes. Journal of Paleolimnology 36: 175-187 Lavoie C, Payette S (1996) The long-term stability of the boreal forest limit in subarctic Canada. Ecology 77: 1226-1233 LeBlanc M, Gajewski K, Hamilton P (2004) A diatom-based Holocene paleoenvironmental record from a mid-Arctic lake on Boothia Peninsula, Nunavut, Canada. The Holocene 14: 417-425 Lee HA (1960) Late glacial and postglacial Hudson Bay Sea episode. Science 131: 1609-1611 Lee WHK, Clark SP (1966) Physical constants. Geological Society of America 97: 483-511 Lim DSS, Smol JP, Douglas MSV (2007) Diatom assemblages and their relationships to lakewater nitrogen levels and other limnological variables from 36 lakes and ponds on Banks Island, N.W.T., Canadian Arctic. Hydrobiologia 586: 191-211 Lim DSS, Smol JP, Douglas MSV (2008) Recent environmental changes on Banks Island (N.W.T., Canadian Arctic) quantified using fossil diatom assemblages. Journal of Paleolimnology 40: 385-398 Lindsday RW, Zhang J (2005) The thinning of Arcitc sea ice, 1988-2003: have we passed a tipping point? Journal of Climatology 18: 4879-4894 Loisel J, Garneau, M (2010) Paleoecohydrology and carbon accumulation estimates from two sites in eastern Canada: Potential and limits of multi-proxy archives. Palaeogeography, Palaeoclimatology, Palaeoecology 291: 493-533 Lotter AF, Bigler C (2000) Do diatoms in the Swiss Alps reflect the length of ice-cover? Aquatic Sciences 62: 125-141

102
Lowe JJ, Walker RJ (eds) (1997) Reconstructing Quaternary Environments. Cambridge University Press, UK MacDonald GM, Edwards TWD, Moser KA, Pienitz R, Smol JP (1993) Rapid response of treeline vegetation and lakes to past climate warming. Nature 361: 242-246 MacDonald GM, Szeicz JM, Claricoates J, Dale KA (1998) Response of the central Canadian treeline to recent climate changes. Annals of the Association of American Geographers 88: 193-208 MacDonald LA, Turner KW, Balasubramaniam AM, Wolfe BB, Hall RI, Sweetman JN (2011) Tracking hydrological responses of a thermokarst lake in the Old Crow Flats (Yukon Territory, Canada) to recent climate variability using aerial photographs and paleolimnological methods. Hydrological Processes doi: 10.1002/hyp8116 Marsh P, Neumann NN (2001) Processes controlling the rapid drainage of two ice-rich permafrost-dammed lakes in NW Canada. Hydrological Processes 15: 3433-3446 Martini I (2006) The cold-climate peatlands of the Hudson Bay Lowland, Canada: brief overview of recent work. In: Martini I, Martinez-Cortizas A, Chesworth W (eds) Peatlands: Evolution and records of environmental and climate changes. Elsevier, Canada McAndrews J, Riley J, Davis T (1982) Vegetation History of the Hudson Bay lowland: a postglacial pollen diagram from the Sutton Ridge. Naturaliste Canadien 109: 597-608 McIntyre SH (1990) Postglacial pH history of a naturally acidified lake in northern Ontario, Canada. M.Sc. thesis, University of Waterloo, Ontario, Canada 187pp. McIntyre SH, Duthie HC, Warner BC (1991) Postglacial development of a marl and peat complex on the Precambrian Shield of northwestern Ontario. Journal of Paleolimnology 6: 141-155 Medeiros AM, Friel CE, Finkelstein SA, Quinlan R 2011. A high resolution multi-proxy record of pronounced 20th century environmental change at Baker Lake, Nunavut. Submitted Michelutti N, Douglas MSV, Smol JP (2003) Diatom response to recent climatic change in a High Arctic Lake, (Char Lake, Cornwallis Island, Nunavut). Global Planet Change 38: 257-271 Michelutti N, Smol JP, Douglas MSV (2006a) Ecological characteristics of modern diatom assemblages from Axel Heiberg Island (High Arctic Canada) and their application to paleolimnological inference models. Canadian Journal of Botany 84: 1695-1713

103
Michelutti N, Douglas MSV, Wolfe AP, Smol JP (2006b) Heightened sensitivity of a poorly buffered high Arctic lake to late-Holocene climate change. Quaternary Research 65: 421-430 Michelutti N, Wolfe AP, Briner JP, Miller GH (2007a) Climatically controlled chemical and biological development in Arctic lakes. Journal of Geophysical Research 112: G03002 doi:10.1029/2006JG000396 Michelutti N, Douglas MSV, Smol JP (2007b) Evaluating diatom community composition in the absence of marked limnological gradients in the high Arctic: surface sediment calibration set from Cornwallis Island (Nunavut, Canada). Polar Biology 30: 1459-1473 Moore TR, Heyes A, Roulet NT (1994) Methane emission from wetlands, southern Hudson Bay lowland. Journal of Geophysical Research 99: 1455–1467 Moser KA, MaDonald GM (1990) Holocene vegetation changes at treeline north of Yellowknife, Northwest Territories, Canada. Quaternary Research 34: 227-239 Moser K, Smol, JP, MacDonald G, Larsen C (2002) 19th century eutrophication of a remote boreal lake: a consequence of climate warming? Journal of Paleolimnology 28: 269-281 Natural Resources Canada (1995) Surficial materials of Canada, 1:5 000 000 map 1880A. Geological Survey of Canada, Ottawa, Canada Overpeck J, Hughen K, Hardy D, Bradley R, Case R, Douglas M, Finney B, Gajewski K, Jacoby G, Jennings H, Lamoureux S, Lasca A, MacDonald G, Moore J, Retelle S, Smith S, Wolfe A, Zielinski G (1997) Arctic environmental change of the past four centuries. Science 278: 1251-1256 Parkinson CL, Cavalieri DL (2008) Arctic sea ice variability and trends, 1979-2006. Journal of Geophysical Research, 113: C07003 doi: 10.1029/2007JC004558 Parkinson CL, Cavalieri DL, Gloerson P, Zwally HJ, Comiso J (1999) Arctic sea-ice extents, areas, and trends, 1978-1996. Journal of Geophysical Research, 102: 20,837-20,856 Passy SI (2007) Differential cell size optimization strategies produce distinct diatom richness-body size relationships in stream benthos and plankton. Journal of Ecology 95: 745-754 Paul CA, Rühland KM, Smol JP (2010) Diatom-inferred climatic and environmental changes over the last 9000 years from a low Arctic (Nunavut, Canada) tundra lake. Palaeogeography, Palaeoclimatology, Palaeoecology 291: 205-216

104
Paull TM, Hamilton PB, Gajewski K, LeBlanc M (2008) Numerical analysis of small Arctic diatoms (Bacillariophyceae) representing the Staurosira and Staurosirella species complexes. Phycologia 47: 213-224 Payette S, Filion L (1993) Holocene water-level fluctuations of a subarctic lake at the tree line in northern Quebec. Boreas 22:7-14 Payette S, Lavoie C (1994) The arctic tree line as a record of past and recent climatic changes. Environmental Reviews 2: 78-90 Peros MC, Gajewski K (2009) Pollen-based reconstructions of late Holocene climate from the central and western Canadian Arctic. Journal of Paleolimnology 41:161-175 Pienitz R, Smol JP, MacDonald GM (1999) Paleolimnological reconstruction of Holocene climatic trends from two boreal treeline lakes, Northwest Territories, Canada. Arctic Antarctic and Alpine Research 31: 82- 93 Pienitz R, Douglas MSV, Smol JP (eds) (2004) Long term enviromnetal change in Arctic and Antarctic lakes. Springer, Dordrecht, Germany Podritske B (2006) Holocene climate variability and long-term diatom community dynamics in a small lake on Victoria Island, NWT, Canada. MSc thesis, University of Ottawa. Ottawa, Canada Podritske B, Gajewski K (2007) Diatom community response to multiple scales of Holocene climate variability in a small lake on Victoria Island, NWT, Canada. Quanternary Science Reviews 26: 3179-3196 Ponader K, Pienitz R, Vincent W, Gajewski K (2002) Limnological conditions in a subarctic lake (northern Quebec, Canada) during the late Holocene: analyses based on fossil diatoms. Journal of Paleolimnology 27: 353-366 Prisenberg S, Peterson I, Narayanan S, Umoh J (1997) Interactions between atmosphere, ice cover and ocean off Labrador and Newfoundland from 1962-1992. Canadian Journal of Fisheries and Aquatic Sciences 54: 30-39 Prowse TD, Brown K (2010) Hydro-ecological effects of changing Arctic river and lake ice covers: a review. Hydrology Research 41 doi: 10.2166/nh.2010.142 Psenner R, Schmidt R (1992) Climate-driven pH control of remote alpine lakes and effects of acid deposition. Nature 356: 781-783

105
Qian M, Jones C, Laprise R, Caya D (2008) The influences of NAO and the Hudson Bay sea-ice on the climate of eastern Canada. Climate Dynamics 31: 169-182 Rainbird RH, Hadlari T, Aspler LB, Donaldson JA, LeCehminant AN, Peterson TD (2003) Sequence stratigraphy and evolution of the Paleoproterozoic intracontinental Baker Lake and Thelon Basins, western Churchill Province, Nunavut, Canada. Precambrian Research 125: 21-53 Reimer PJ, Baillie MGL, Bard E, Bayliss A, Beck JW, Blackwell PG, Bronk Ramsey C, Buck CE, Burr GS, Edwards RL, Friedrich M, Grootes PM, Guilderson TP, Hajdas I, Heaton TJ, Hogg AG, Hughen KA, Kaiser KF, Kromer B, McCormac FG, Manning SW, Reimer RW, Richards DA, Southon JR, Talamo S, Turney CSM, van der Plicht J, Weyhenmeyer CE (2009) IntCal09 and Marine09 radiocarbon age calibration curves, 0-50,000 years cal BP. Radiocarbon 51: 1111-1150 Ren J, Jiang H, Seidenkrantz M, Kuijpers A (2009) A diatom-based reconstruction of Early Holocene hydrographic and climatic change in a southwest Greenland Fjord. Marine Micropaleontology 70: 166-177 Reynolds CS (1993) Scales of disturbances and their role in plankton ecology. Hydrobiologia 249: 157-171 Reynolds CS, Padisak J, Sommer U (1993) Intermediate disturbance in the ecology of phytoplankton and the maintainence of species diversity: a synthesis. Hydrobiologia 249: 183-188 Richard PJH (1981) Paleophytogeographie postglaciare en Ungava par l’analyse pollinique. Paleo-Quebec 13. Ph.D thesis, Université du Québec a Trois-Rivierés, Canada 153pp. Riley JL (eds) (2003) Flora of the Hudson Bay Lowland and its postglacial origins. NRC Press, Ottawa, Ontario, Canada Robertson AM (1995) Palaeoenvironment during Preboreal-Boreal Narke, South Central Sweden. Quaternary International 27: 103-109 Rolland N, Larocque I, Francus P, Pienitz R, Laperriere L (2008) Holocene climate inferred from biological (Diptera: Chironomidae) analyses in a Southampton Island (Nunavut, Canada) lake. The Holocene 18: 229-242 Rolland N, Larocque I, Francus P, Pienitz R, Laperriere L (2009) Evidence for a warmer period during the 12th and 13th centuries AD from chironomid assemblages in Southampton Island, Nunavut, Canada. Quaternary Research 72: 27-37

106
Rouse WR (1984) Microclimate at arctic tree line: radiation balance of tundra and forest. Water Resources Research 20: 57-66 Rouse WR (1991) Impacts of Hudson Bay on the terrestrial climate of the Hudson Bay Lowlands. Arctic and Alpine Research 23: 24-30 Rouse WR, Douglas MSV, Hecky RE, Hershey AE, Kling GW, Lesack L, Marsh P, McDonald M, Nicholson BJ, Roulet NT, Smol JP (1997) Effects of climate change on the freshwaters of Arctic and Subarctic North America. Hydrological Processes 11: 873-902 Rouse WR, Bello R (1985) Impact of Hudson Bay on the energy balance in the Hudson Bay Lowlands and the potential for climatic modification. Atmosphere-Ocean 23: 375-392 Rowan DJ, Klaff J, Rasmussen JB (1992) Estimating the mud deposition boundary depth in lakes from wave theory. Canadian Journal of Fisheries and Aquatic Sciences 49: 2492-2499 Rühland K (2001) Diatom assemblage shifts relative to changes in environmental and climatic conditions in the circumpolar treeline regions of the Canadian and Siberian Arctic. PhD Thesis, Queen’s University. Kingston, Canada Rühland K, Smol JP (2002a) Freshwater diatoms from the Canadian arctic treeline and development of paleolimnological inference models. Journal of Phycology 38: 249-264 Rühland K, Smol JP (2002b) Diatom limnological relationships in 77 lakes from the central Canadian treeline region: development of diatom-based inference models for reconstructions of long-term environmental change. Journal of Phycology 38, 249-254 Rühland K, Smol JP (2005) Diatom shifts as evidence for recent Subarctic warming in a remote tundra lake, NWT, Canada. Palaeogeography, Palaeoclimatology, Palaeoecology, 226: 1-16 Rühland K, Karst T, Paterson A, Gregorgy-Eaves I, Smol JP, Cumming B (1999) Standard sediment sample preparation methods for siliceous microfossils (diatoms, chrysophyte scales and cycts). PEARL research laboratory, Queen’s University, Kingston, Canada Rühland K, Priesnitz A, Smol JP (2003) Paleolimnological evidence from diatoms for recent environmental changes in 50 lakes across Canadian Arctic treeline. Arctic, Antarctic and Alpine Research 35: 110-123

107
Rühland K, Paterson A, Smol JP (2008) Hemispheric-scale patterns of climate-related shifts in planktonic diatoms from North American and European lakes. Global Change Biology 14: 2740-2754 Saulnier-Talbot E, Pienitz R, Vincent W (2003) Holocene lake succession and palaeo-optics of a Subarctic lake, northern Quebec, Canada. The Holocene 13: 513-526 Sawada MA, Gajewski K, de Vernal A, Richard PJH (1999) Comparison of marine and terrestrial Holocene climatic reconstructions from northeastern North America. The Holocene 9: 267-277 Serreze MC, Walsh JE, Chaplin FS, Osterkamp T, Dyurgerov M, Romanovsky V, Oechel WC, Morison J, Zhang T, Barry RG (2000) Observational evidence of recent change in the northern high-latitude environment. Climate Change 46: 159-207 Shinneman ALC, Bennett DM, Fritz SC, Schmeider J, Engstrom DR, Efting A, Holz J (2010) Inferring lake depth using diatom assemblages in the shallow, seasonally variable lakes of the Nebraska sand hills (USA): calibration validation and application of a 69-lake training set. Journal of Paleolimnology 44: 443-464 Smith IR (2002) Diatom-based Holocene paleoenvironmental records from continental sites on northeastern Ellesmere Island, high Arctic, Canada. Journal of Paleolimnology 27: 9-28. Smol JP (1988) Paleoclimate proxy data from freshwater arctic diatoms. Verhandlungender InternationaleVereinigung fur Theoretische und Angewandte Limnologie 23: 837-844 Smol JP, Cumming BF (2000) Tracking long-term changes in climate using algal indicators in lake sediments. Journal of Phycology, 36: 986-1011 Smol JP, Douglas MSV (2007) From controversy to consensus: making the case for recent climate change in the Arctic using lake sediments. Frontiers in Ecology and the Environment 5: 466-474 Smol JP, Wolfe AP, Birks HJB, Douglas MSV, Jones VJ, Korhola A, Pienitz R, Rühland K, Sorvari S, Antoniades D, Brooks SJ, Fallu MA, Hughes M, Keatley B, Laing T, Michelutti N, Nazarova L, Nyman M, Paterson AM, Perren B, Quinlan R, Rautio M, Saulnier-Talbot E, Siito- nen S, Solovieva N, Weckstrom, J (2005) Climate-driven regime shifts in the biological communities of arctic lakes. Proceedings of the National Academy of Sciences 102: 4397–4402 Sovari S, Korhala A (1998) Recent diatom assemblage change in subarctic Lake Saanajarvi, NW Finnish Lapland. Journal of Paleolimnology 20: 205-215

108
Sovari S, Korhola A, Thompson R (2002) Lake diatom response to recent Arctic warming in Finnish Lapland. Global Change Biology 8: 171-181 Stevenson RJ, Peterson CG (1989) Variation in benthic diatom (Bacillariophyceae) immigration with habitat characteristics and cell morphology. Journal of Phycology 25: 120-129 Stoermer EF, Kociolek JP, Shoshani J, Frisch C (1988) Diatoms from the Shelton Mastodon site. Journal of Paleolimnology 1: 193-199 Tarnocai C (2006) The effect of climate change on carbon in Canadian peatlands. Global and Planetary Change 53:222-232 Tarnocai C, Stolbovoy V (2006) Northern peatlands: their characteristics, development and sensitivity to climate change. Developments in Earth Surface Processes 9: 17-51 Ter Braak CJF, !milauer P (1998) CANOCO for Windows (v. 4.5.3), Centre for Biometry. Wageningen, The Netherlands Ter Braak CJF, !milauer P (eds) (1998) CANOCO reference manual and user’s guide to CANOCO for windows: Software for canonical community ordination (version 4). Microcomputer Power, New York Terasmae J, Hughes O (eds) (1960) A palynological and geological study of Pleistocene deposits in the James Bay Lowlands, Ontario, Department of Mines and Technical Surveys. NRC Press, Ottawa, Canada Trenberth KE, Solomon S, Mann M (2007) Observations: Surface and Atmospheric Climate Change. In: Climate Change 2007. The Physical Science Basis. Contribution of WG 1 to the Fourth Assessment Report of the Intergovernmental Panel on Climate Change. Cambridge University Press. Cambridge, U. K., and New York, NY, USA Trolle D, Hamilton DP, Hendy C, Pilditch C (2008) Sediment and nutrient accumulation rates in sediments of twelve New Zealand lakes: influence of lake morphology, catchment characteristics and trophic state. Marine and Freshwater Research 59:1067-1078 Umbanhowar CE, Camill P, Dorale JA (2011) Regional heterogeneity and the effects of land use and climate on 20 lakes in the big woods region of Minnesota. Journal of Paleolimnology 45: 151-166 Unkel I, Bjork S, Wohlforth B (2010) Deglacial environmental changes on Isla de los Estados (54.4 S) southeastern Tierra del Fuego. Quaternary Science Reviews 27: 1541-1554

109
Viau AE, Gajewski K (2009) Reconstructing millennial, regional paleoclimates of Boreal Canada during the Holocene. Journal of Climate 22: 316-330 Vincent WF, Pienitz R (2000) Effects of climate change relative to ozone depletion on UV exposure in subarctic lakes. Nature 404: 484-487 Wang J, Mysak L, Ingram R (2004) Interannual variability of sea-ice cover in Hudson Bay, Baffin Bay and the Labrador Sea. Atmosphere-Ocean 32: 421-447 Weckstrom J, Korhola A, Blom T (1997) Diatoms as quantitative indicators of pH and water temperature in subarctic Fennoscandian lakes. Hydrobiologia 347: 171-184 Winder M, Reuter JE, Schladow GS (2009) Lake warming favours small-sized planktonic diatoms. Proceedings of the Royal Society Biological Sciences 276: 427-435 Wolfe AP (1991) Mid and late Holocene diatoms from ‘Water Supply Lake’, Baffin Island, Arctic Canada. Canadian Journal of Botany 74: 435-439 Wolfe AP (2002) Climate modulates the acidity of arctic lakes on millennial timescales. Geology 30: 215-218 Wolfe AP (2003) Diatom community responses to late-Holocene climate variability, Baffin Island, Canada: a comparison of numerical approaches. The Holocene 13: 29-37 Wolfe AP, Cooke C, Hobbs W (2006) Are current rates of atmospheric nitrogen deposition influencing Lakes in the Eastern Canadian Arctic? Arctic, Antarctic and Alpine Research 38: 465-475 Wolfe BB, Falcone MD, Clogg-Wright KP, Mongeon CL, Yi Y, Brock BE, St. Amour NA, William MA, Edwards TWD (2007) Progress in isotope paleohydrology using lake sediment cellulose. Journal of Paleolimnology 37: 221-231 Woo MK (2010) Cold ocean seas and northern hydrology: an exploratory overview. Hydrology Research 41 doi: 10.2166/nh.2010.023 Wright HE Jr (1967) A square-rod piston sampler for lake sediments. Journal of Sedimentary Petrology 37: 975-976 Wright HE and Stefanova I (2004) Plant trash in the basal sediments of glacial lakes. Acta Palaeobotanica 44: 141-146

110
Yun MS, Lee SH, Chung IK (2010) Photosynthetic activity of benthic diatoms in response to different temperatures. Journal of Applied Phycology 22: 559-562

Appendix A. AT01 raw counts and summary data
Diatom raw counts for each interval in the AT01-L2-G2 record. Column headings refer to calendar years before 1950 (years BP)
111
Age (years BP) -60 -55 -52 -43 -40 -24 -22Depth down core (cm) 0 1.5 2.5 3.5 4.5 7 9.5Total valves counted 670 582 634 503 603 480 301Diatom concentration (valves/cm3) 9.77E+07 4.49E+07 6.20E+06 7.91E+07 2.84E+07 3.06E+06 2.53E+05Shannon-Weiner Diversity Index (H') 3.10 2.85 2.81 2.68 2.92 2.43 2.98Species Achnanthes gracillima 0 3 0 0 0 0 0Achnanthes ventralis 0 0 0 0 0 0 0Achnanthidium minutissimum 7 15 4 10 3 11 3Amphora inariensis 4 0 13 2 8 9 6Amphora ovalis 0 0 0 0 0 0 0Amphora ovalis var. pediculus 0 0 0 0 0 0 0Amphora thumensis 0 0 0 0 0 0 0Aneumastus tuscala 0 0 2 4 4 2 6Aulacoseira complex. 0 0 0 0 0 0 0Brachysira brebissonii 0 0 1 1 1 0 6Brachysira styriaca 11 8 6 2 8 6 2Brachysira vitrea 92 97 99 62 87 37 21Brachysira zellensis 27 8 14 8 18 49 33Caloneis silicula var. minuta 0 0 0 0 0 0 2Caloneis westii 0 0 0 0 0 0 0Cocconeis placentula 0 0 0 0 0 0 0Craticula cuspidata 0 0 0 0 2 0 0Craticula cuspidata 0 0 0 0 0 0 0Cyclostephanos invisitatus 0 0 0 0 0 0 0Cyclotella bodanica 7 15 10 1 0 0 0Cyclotella bodanica var. affins 0 4 1 0 1 0 0Cyclotella michighiania 12 3 3 3 0 0 0Cyclotella ocellata 0 0 0 0 0 0 0

Appendix A. AT01 raw counts and summary data
Diatom raw counts for each interval in the AT01-L2-G2 record. Column headings refer to calendar years before 1950 (years BP)
112
Age (years BP) -60 -55 -52 -43 -40 -24 -22Cyclotella stelligera 110 86 43 15 12 8 1Cymbella angustata 0 0 0 0 6 5 0Cymbella cesatii 32 19 15 20 8 12 3Cymbella delicatula 3 9 16 23 0 12 3Cymbella descripta 3 9 4 2 0 3 0Cymbella diluviana 0 0 0 2 21 3 10Cymbella inaequalis 0 0 0 0 0 0 0Cymbella incerta 10 17 10 4 0 7 0Cymbella laevis 0 0 0 0 0 0 0Cymbella microcephala 22 24 13 18 20 23 7Cymbella minuta 7 16 10 4 0 4 0Cymbella proxima 7 4 11 8 0 5 0Cymbella pusilla 5 17 4 3 16 7 4Cymbella subcuspidata 4 2 4 2 4 2 2Cymbella tumidula 0 17 0 3 12 4 7Denticula elegans 6 0 27 14 41 9 12Denticula kuetzingii 45 15 35 50 33 17 8Diadesmis perpusilla 0 0 0 0 4 0 0Diatom mesoden 4 2 4 0 0 0 0Diatoma tenue 0 0 0 0 0 0 0Diploneis marginestriata 0 0 0 0 0 0 0Diploneis oblongella 0 0 0 0 0 0 0Diploneis oculata 4 0 2 0 2 0 0Encyonema minuta 0 0 0 0 0 0 0Encyonema muelleri 0 0 0 0 0 0 0Encyonema silesiaca 0 0 3 6 7 2 7Epithemia frickii 2 0 0 0 0 0 4Eucocconeis flexella 0 0 3 9 6 8 4

Appendix A. AT01 raw counts and summary data
Diatom raw counts for each interval in the AT01-L2-G2 record. Column headings refer to calendar years before 1950 (years BP)
113
Age (years BP) -60 -55 -52 -43 -40 -24 -22Eunotia arcus 4 0 0 0 0 0 0Eunotia exigua 16 10 15 15 9 4 10Eunotia praerupta 29 15 45 36 10 8 11Fragilaria brevistriata 0 0 0 0 0 0 0Fragilaria capucina 0 0 0 0 0 0 0Fragilaria construens var. pumila 0 0 0 0 0 0 0Fragilaria oldenburgia 0 0 0 0 0 0 0Synedra tenera 4 4 4 1 0 0 0Frustulia saxonica 9 0 2 3 12 6 1Gomphonema angustatum 4 4 0 9 9 2 6Gomphonema gracile 2 0 3 2 0 0 0Gomphonema minuta 0 2 0 0 0 0 2Gomphonema subtile 0 0 0 1 4 1 0Hantzchia amphioxys 0 0 0 0 0 0 0Mastologia smithii 2 2 0 2 6 0 0Navicula absoluta 0 10 0 0 0 0 0Navicula cryptotenella 30 38 65 30 47 25 12Navicula explanata 0 0 0 5 2 1 2Navicula micropupula 0 0 0 2 5 0 0Navicula oblonga 2 0 8 3 0 2 0Navicula pseudoventralis 4 0 4 3 3 1 0Navicula aurora 0 5 0 0 0 0 0Navicula schmassmanni 0 0 0 0 0 0 0Navicula sp. 1 0 17 0 0 0 0 0Navicula stroemii 37 0 5 17 19 42 16Navicula viridula 7 11 8 10 2 1 4Navicula vulpina 0 0 0 0 2 0 0Neidium affine 0 0 0 0 0 0 0

Appendix A. AT01 raw counts and summary data
Diatom raw counts for each interval in the AT01-L2-G2 record. Column headings refer to calendar years before 1950 (years BP)
114
Age (years BP) -60 -55 -52 -43 -40 -24 -22Neidium ampliatum 4 2 9 5 2 9 1Nitszchia dissipata 8 4 0 8 8 20 5Nitzchia gracillis 0 0 0 0 1 0 2Nitzchia palea 2 4 0 0 0 2 0Pinnularia major 2 0 0 0 0 0 0Pinnularia mesolepta 0 6 0 0 0 0 0Pinnularia microstauron 6 4 7 5 8 2 0Psammothidium subatomoides 0 4 0 0 0 0 0Pseudostaurosira pseudoconstruens 0 0 0 0 0 0 0Rhopalodia gibba 4 7 15 5 4 2 2Rossithidium pussilum 48 27 46 32 66 71 47Sellaphora laevissima 0 3 4 2 8 0 2Sellaphora pupula 8 7 20 15 40 6 22Sellaphora pupula var. subcapitata 0 0 0 0 0 0 0Stauroneis anceps 0 0 0 0 0 0 0Stauroneis phoenicenteron 8 1 13 12 6 1 2Staurosira construens 0 0 0 0 0 0 0Staurosira construens var. venter 0 0 0 0 0 0 0Staurosira construens var. venter long 0 0 0 0 0 0 0Staurosirella leptostauron 0 0 0 0 0 0 0Staurosirella pinnata 0 0 0 0 0 0 0Staurosirella pinnata var. intercedens 0 0 0 0 0 0 0Stephanodiscus alpina 0 0 0 0 0 0 0Surirella angusta 0 0 0 1 0 0 0Tabellaria flocculosa 2 3 2 0 2 0 0

Appendix A. AT01 raw counts and summary data
Diatom raw counts for each interval in the AT01-L2-G2 record. Column headings refer to calendar years before 1950 (years BP)
115
Age (years BP) -17 -16 -14 -13 -2 8 20Depth down core (cm) 12.5 13.5 17 20.5 24 27.5 31Total valves counted 536 502 550 574 331 576 521Diatom concentration (valves/cm3) 3.18E+07 7.01E+07 9.55E+07 5.83E+07 4.57E+08 6.37E+07 2.19E+07Shannon-Weiner Diversity Index (H') 2.88 3.22 3.05 2.09 1.34 3.06 2.17Species Achnanthes gracillima 0 0 0 0 0 0 0Achnanthes ventralis 0 0 0 0 0 0 8Achnanthidium minutissimum 4 18 13 14 5 21 12Amphora inariensis 12 8 6 9 2 0 0Amphora ovalis 0 2 0 0 0 2 0Amphora ovalis var. pediculus 0 0 0 0 0 0 6Amphora thumensis 0 0 0 2 0 0 0Aneumastus tuscala 7 2 0 4 2 8 0Aulacoseira complex. 0 0 0 0 0 0 0Brachysira brebissonii 1 2 3 12 0 5 2Brachysira styriaca 2 0 2 4 0 8 0Brachysira vitrea 11 26 39 50 8 50 110Brachysira zellensis 71 33 40 70 45 50 38Caloneis silicula var. minuta 0 0 0 0 2 0 0Caloneis westii 0 0 2 0 0 0 0Cocconeis placentula 0 0 0 0 0 0 0Craticula cuspidata 0 0 0 0 0 0 0Craticula cuspidata 0 0 2 0 0 0 0Cyclostephanos invisitatus 0 0 0 0 0 0 0Cyclotella bodanica 0 2 0 0 2 0 0Cyclotella bodanica var. affins 0 0 0 0 0 0 0Cyclotella michighiania 0 0 2 0 0 0 0Cyclotella ocellata 0 0 0 0 0 0 0

Appendix A. AT01 raw counts and summary data
Diatom raw counts for each interval in the AT01-L2-G2 record. Column headings refer to calendar years before 1950 (years BP)
116
Age (years BP) -17 -16 -14 -13 -2 8 20Cyclotella stelligera 7 28 4 0 1 0 0Cymbella angustata 0 0 0 0 0 0 0Cymbella cesatii 4 0 9 0 0 0 14Cymbella delicatula 5 11 2 2 0 6 10Cymbella descripta 0 8 2 0 0 6 8Cymbella diluviana 23 17 6 27 20 18 3Cymbella inaequalis 0 0 0 0 0 0 0Cymbella incerta 2 0 4 0 4 2 11Cymbella laevis 0 0 0 0 0 0 2Cymbella microcephala 6 16 21 5 2 18 27Cymbella minuta 0 0 2 0 0 3 0Cymbella proxima 2 0 4 0 0 0 0Cymbella pusilla 6 9 22 6 6 12 16Cymbella subcuspidata 0 2 3 0 0 0 0Cymbella tumidula 0 0 7 0 0 0 0Denticula elegans 17 14 27 20 18 15 4Denticula kuetzingii 4 14 22 28 14 24 2Diadesmis perpusilla 0 0 0 0 0 0 0Diatom mesoden 2 0 0 0 0 0 4Diatoma tenue 0 0 0 0 0 0 0Diploneis marginestriata 0 0 0 0 0 2 0Diploneis oblongella 0 0 0 0 0 2 0Diploneis oculata 0 2 2 0 0 0 0Encyonema minuta 0 0 0 0 0 0 0Encyonema muelleri 0 9 1 0 0 0 0Encyonema silesiaca 11 6 2 6 0 13 9Epithemia frickii 0 0 0 0 0 0 0Eucocconeis flexella 2 0 0 2 0 0 0

Appendix A. AT01 raw counts and summary data
Diatom raw counts for each interval in the AT01-L2-G2 record. Column headings refer to calendar years before 1950 (years BP)
117
Age (years BP) -17 -16 -14 -13 -2 8 20Eunotia arcus 0 0 2 0 4 0 0Eunotia exigua 2 9 4 14 0 0 0Eunotia praerupta 2 5 18 2 2 6 0Fragilaria brevistriata 0 0 0 7 2 9 2Fragilaria capucina 0 0 0 0 0 4 0Fragilaria construens var. pumila 0 0 0 0 0 0 0Fragilaria oldenburgia 0 0 0 0 0 0 0Fragilaria tenera 0 0 0 0 0 0 2Frustulia saxonica 20 12 8 10 13 8 12Gomphonema angustatum 16 8 0 4 2 0 0Gomphonema gracile 0 8 2 0 0 7 0Gomphonema minuta 3 3 4 0 0 0 0Gomphonema subtile 5 1 0 0 0 0 6Hantzchia amphioxys 0 0 0 0 0 0 0Mastologia smithii 0 0 0 0 0 0 0Navicula absoluta 0 0 5 0 0 6 8Navicula cryptotenella 11 18 35 6 0 13 49Navicula explanata 8 5 8 4 2 4 0Navicula micropupula 0 4 0 3 0 0 0Navicula oblonga 2 0 2 0 0 2 0Navicula pseudoventralis 6 6 2 14 1 3 5Navicula aurora 2 0 0 0 0 0 0Navicula schmassmanni 0 4 2 0 0 1 0Navicula sp. 1 0 6 0 0 1 0 0Navicula stroemii 58 24 22 99 58 18 34Navicula viridula 13 3 11 6 2 4 3Navicula vulpina 0 0 1 2 1 0 0Neidium affine 0 0 0 0 0 0 0

Appendix A. AT01 raw counts and summary data
Diatom raw counts for each interval in the AT01-L2-G2 record. Column headings refer to calendar years before 1950 (years BP)
118
Age (years BP) -17 -16 -14 -13 -2 8 20Neidium ampliatum 14 8 19 5 3 6 0Nitszchia dissipata 6 4 15 18 10 17 34Nitzchia gracillis 3 2 0 0 0 0 0Nitzchia palea 0 2 8 3 3 3 2Pinnularia major 0 0 0 0 0 0 0Pinnularia mesolepta 0 0 0 0 0 2 0Pinnularia microstauron 14 4 0 10 0 4 0Psammothidium subatomoides 0 6 0 0 0 0 0Pseudostaurosira pseudoconstruens 0 0 0 0 0 0 0Rhopalodia gibba 0 0 0 0 0 0 0Rossithidium pussilum 72 62 75 68 56 67 62Sellaphora laevissima 6 4 3 0 6 3 0Sellaphora pupula 65 39 49 31 29 6 1Sellaphora pupula var. subcapitata 0 0 0 0 0 13 10Stauroneis anceps 0 0 0 0 0 1 0Stauroneis phoenicenteron 7 4 2 4 2 2 0Staurosira construens 0 0 0 0 0 0 0Staurosira construens var. venter 0 0 0 0 0 0 0Staurosira construens var. venter long 0 0 0 0 0 0 0Staurosirella leptostauron 0 0 0 0 0 0 0Staurosirella pinnata 0 0 0 0 0 0 0Staurosirella pinnata var. intercedens 0 0 0 0 0 2 0Stephanodiscus alpina 0 0 0 0 0 0 0Surirella angusta 0 0 1 0 0 0 0Tabellaria flocculosa 0 1 0 0 0 0 0

Appendix A. AT01 raw counts and summary data
Diatom raw counts for each interval in the AT01-L2-G2 record. Column headings refer to calendar years before 1950 (years BP)
119
Age (years BP) 28 50 88 1543 2515 3135 3556Depth down core (cm) 34.5 37.5 42.5 47.5 52.5 57.5 62.5Total valves counted 518 617 725 299 522 569 644Diatom concentration (valves/cm3) 3.84E+07 2.46E+07 1.19E+07 1.42E+05 6.97E+07 1.30E+07 2.01E+07Shannon-Weiner Diversity Index (H') 2.28 1.93 1.37 1.37 1.37 2.18 2.24Species Achnanthes gracillima 0 0 0 0 0 0 0Achnanthes ventralis 0 0 0 0 0 0 0Achnanthidium minutissimum 34 27 0 0 0 0 0Amphora inariensis 0 2 43 7 31 25 10Amphora ovalis 0 0 1 1 6 2 9Amphora ovalis var. pediculus 0 0 0 0 2 0 0Amphora thumensis 0 0 2 0 0 0 0Aneumastus tuscala 0 0 0 0 0 0 0Aulacoseira complex. 0 0 2 2 0 0 0Brachysira brebissonii 0 8 0 1 4 0 0Brachysira styriaca 8 5 0 1 0 0 0Brachysira vitrea 51 59 48 6 0 0 0Brachysira zellensis 51 91 98 107 40 0 0Caloneis silicula var. minuta 0 0 0 0 0 0 0Caloneis westii 0 0 0 0 0 0 0Cocconeis placentula 0 1 0 0 0 0 0Craticula cuspidata 0 0 0 0 0 0 0Craticula cuspidata 0 2 0 0 0 0 0Cyclostephanos invisitatus 0 0 0 0 0 0 0Cyclotella bodanica 0 0 0 0 0 0 0Cyclotella bodanica var. affins 0 0 2 0 0 0 3Cyclotella michighiania 0 0 0 0 0 0 0Cyclotella ocellata 0 0 0 0 0 0 0

Appendix A. AT01 raw counts and summary data
Diatom raw counts for each interval in the AT01-L2-G2 record. Column headings refer to calendar years before 1950 (years BP)
120
Age (years BP) 28 50 88 1543 2515 3135 3556Cyclotella stelligera 0 2 0 0 0 0 0Cymbella angustata 0 2 0 2 0 0 0Cymbella cesatii 3 7 0 2 0 0 0Cymbella delicatula 5 12 0 0 0 0 0Cymbella descripta 22 10 0 0 0 0 0Cymbella diluviana 8 5 278 28 216 177 219Cymbella inaequalis 0 0 2 0 0 4 4Cymbella incerta 6 12 0 1 0 0 0Cymbella laevis 0 2 0 0 0 0 0Cymbella microcephala 26 19 0 6 0 0 0Cymbella minuta 0 3 0 3 0 0 0Cymbella proxima 0 0 0 0 0 0 0Cymbella pusilla 0 16 0 1 0 0 0Cymbella subcuspidata 0 4 4 0 2 2 6Cymbella tumidula 0 0 0 0 0 0 0Denticula elegans 24 21 0 5 0 0 0Denticula kuetzingii 0 15 0 0 0 3 0Diadesmis perpusilla 0 0 0 0 0 0 0Diatom mesoden 0 0 0 0 0 0 0Diatoma tenue 6 0 0 0 0 0 0Diploneis marginestriata 4 2 0 4 0 0 0Diploneis oblongella 2 3 0 0 0 0 0Diploneis oculata 0 0 0 0 0 0 0Encyonema minuta 0 0 0 0 0 0 0Encyonema muelleri 0 2 0 0 0 0 0Encyonema silesiaca 5 10 0 2 0 0 0Epithemia frickii 0 0 0 0 0 0 0Eucocconeis flexella 0 0 0 0 0 0 0

Appendix A. AT01 raw counts and summary data
Diatom raw counts for each interval in the AT01-L2-G2 record. Column headings refer to calendar years before 1950 (years BP)
121
Age (years BP) 28 50 88 1543 2515 3135 3556Eunotia arcus 0 0 0 2 0 0 2Eunotia exigua 0 0 0 0 0 0 0Eunotia praerupta 6 30 0 19 0 0 0Fragilaria brevistriata 2 9 11 6 0 2 0Fragilaria capucina 0 2 0 0 0 0 0Fragilaria construens var. pumila 0 0 0 0 0 0 0Fragilaria oldenburgia 0 0 0 0 0 0 0Fragilaria tenera 0 0 0 0 0 0 0Frustulia saxonica 16 0 37 10 0 16 7Gomphonema angustatum 0 0 0 9 0 0 0Gomphonema gracile 5 6 0 0 0 0 0Gomphonema minuta 0 0 0 0 0 0 0Gomphonema subtile 0 0 0 0 0 0 0Hantzchia amphioxys 0 0 0 0 0 2 0Mastologia smithii 0 0 0 0 0 0 0Navicula absoluta 3 7 13 2 3 0 0Navicula cryptotenella 18 55 0 3 3 0 28Navicula explanata 0 0 2 2 2 0 2Navicula micropupula 0 0 0 0 0 0 0Navicula oblonga 0 0 12 0 8 17 10Navicula pseudoventralis 10 13 0 5 6 0 0Navicula aurora 0 0 25 9 19 23 39Navicula schmassmanni 0 0 0 0 0 0 0Navicula sp. 1 0 0 0 0 0 0 0Navicula stroemii 23 38 2 9 2 4 0Navicula viridula 9 2 28 2 22 19 24Navicula vulpina 3 0 0 0 1 0 0Neidium affine 0 0 0 0 2 0 0

Appendix A. AT01 raw counts and summary data
Diatom raw counts for each interval in the AT01-L2-G2 record. Column headings refer to calendar years before 1950 (years BP)
122
Age (years BP) 28 50 88 1543 2515 3135 3556Neidium ampliatum 0 5 0 0 12 24 48Nitszchia dissipata 11 22 0 3 0 1 0Nitzchia gracillis 2 2 0 0 0 0 0Nitzchia palea 10 7 0 0 0 0 0Pinnularia major 0 2 0 0 0 0 0Pinnularia mesolepta 0 4 0 0 6 0 0Pinnularia microstauron 6 6 0 0 4 0 0Psammothidium subatomoides 0 0 0 0 0 0 31Pseudostaurosira pseudoconstruens 0 0 2 0 2 5 0Rhopalodia gibba 0 0 2 0 0 0 0Rossithidium pussilum 6 35 0 20 1 3 7Sellaphora laevissima 7 0 0 1 0 0 0Sellaphora pupula 19 17 45 11 45 17 60Sellaphora pupula var. subcapitata 0 4 0 0 1 0 0Stauroneis anceps 0 3 0 0 0 0 0Stauroneis phoenicenteron 2 3 20 0 4 4 7Staurosira construens 0 0 0 0 0 6 0Staurosira construens var. venter 0 0 21 0 6 34 12Staurosira construens var. venter long 0 2 0 0 4 0 3Staurosirella leptostauron 0 0 2 0 0 0 0Staurosirella pinnata 0 0 2 0 6 0 3Staurosirella pinnata var. intercedens 0 0 0 2 0 3 0Stephanodiscus alpina 0 0 0 0 0 0 0Surirella angusta 0 0 0 0 0 0 2Tabellaria flocculosa 2 0 0 0 0 0 2

Appendix A. AT01 raw counts and summary data
Diatom raw counts for each interval in the AT01-L2-G2 record. Column headings refer to calendar years before 1950 (years BP)
123
Age (years BP) 3860 4092 4280 4439 4578 4703 4819Depth down core (cm) 67.5 72.5 77.5 82.5 87.5 92.5 97.5Total valves counted 577 570 528 548 542 509 563Diatom concentration (valves/cm3) 1.19E+08 1.24E+07 5.20E+07 3.70E+07 2.55E+07 1.23E+08 2.07E+07Shannon-Weiner Diversity Index (H') 2.27 2.04 2.28 1.30 2.09 1.93 2.17Species Achnanthes gracillima 0 0 0 0 0 0 0Achnanthes ventralis 0 0 0 0 0 0 0Achnanthidium minutissimum 0 0 0 0 0 0 0Amphora inariensis 63 33 5 20 50 8 40Amphora ovalis 4 3 5 2 0 9 5Amphora ovalis var. pediculus 0 0 0 0 0 0 2Amphora thumensis 0 0 0 0 0 0 0Aneumastus tuscala 2 3 0 0 0 0 0Aulacoseira complex. 0 0 0 0 0 0 0Brachysira brebissonii 0 0 0 0 0 0 0Brachysira styriaca 0 0 0 0 0 0 0Brachysira vitrea 0 0 0 0 0 0 0Brachysira zellensis 5 0 0 0 0 0 2Caloneis silicula var. minuta 0 0 0 0 0 0 0Caloneis westii 0 0 0 0 0 0 0Cocconeis placentula 0 0 0 0 0 0 0Craticula cuspidata 0 0 0 0 0 0 0Craticula cuspidata 2 0 0 0 0 0 0Cyclostephanos invisitatus 0 0 0 0 0 0 0Cyclotella bodanica 2 0 0 0 0 0 0Cyclotella bodanica var. affins 0 0 2 0 0 0 2Cyclotella michighiania 0 0 0 0 0 0 0Cyclotella ocellata 0 0 0 0 0 0 0

Appendix A. AT01 raw counts and summary data
Diatom raw counts for each interval in the AT01-L2-G2 record. Column headings refer to calendar years before 1950 (years BP)
124
Age (years BP) 3860 4092 4280 4439 4578 4703 4819Cyclotella stelligera 0 0 0 0 0 0 0Cymbella angustata 0 0 0 0 0 0 0Cymbella cesatii 0 0 0 0 0 0 0Cymbella delicatula 0 0 0 0 0 0 0Cymbella descripta 0 0 0 0 0 0 0Cymbella diluviana 89 270 219 384 221 276 160Cymbella inaequalis 10 5 3 0 6 8 0Cymbella incerta 0 0 0 0 0 0 0Cymbella laevis 0 0 0 0 0 0 0Cymbella microcephala 0 0 0 0 0 0 0Cymbella minuta 0 0 0 2 0 0 3Cymbella proxima 0 0 0 0 0 0 0Cymbella pusilla 0 0 0 0 0 0 0Cymbella subcuspidata 30 13 12 0 13 16 7Cymbella tumidula 0 0 0 0 0 0 0Denticula elegans 0 0 0 0 0 0 0Denticula kuetzingii 0 0 0 0 0 0 0Diadesmis perpusilla 0 0 0 0 0 0 0Diatom mesoden 0 0 0 0 0 0 0Diatoma tenue 0 0 0 0 0 0 0Diploneis marginestriata 0 0 0 0 0 0 0Diploneis oblongella 0 0 0 0 0 0 0Diploneis oculata 0 0 0 0 0 0 0Encyonema minuta 0 0 0 0 0 0 0Encyonema muelleri 0 0 0 0 0 0 0Encyonema silesiaca 0 0 0 0 0 0 0Epithemia frickii 0 0 0 0 0 0 0Eucocconeis flexella 0 0 0 0 0 0 0

Appendix A. AT01 raw counts and summary data
Diatom raw counts for each interval in the AT01-L2-G2 record. Column headings refer to calendar years before 1950 (years BP)
125
Age (years BP) 3860 4092 4280 4439 4578 4703 4819Eunotia arcus 0 0 0 0 0 0 0Eunotia exigua 0 0 0 0 4 0 0Eunotia praerupta 0 0 2 0 0 0 0Fragilaria brevistriata 0 20 0 2 0 0 0Fragilaria capucina 0 0 0 0 0 0 0Fragilaria construens var. pumila 0 0 0 0 0 0 0Fragilaria oldenburgia 0 0 0 0 0 0 0Fragilaria tenera 0 0 0 0 0 0 0Frustulia saxonica 0 5 4 0 6 5 3Gomphonema angustatum 0 0 0 0 0 0 0Gomphonema gracile 0 0 0 0 0 0 0Gomphonema minuta 0 0 0 0 0 0 0Gomphonema subtile 0 0 0 0 0 0 0Hantzchia amphioxys 0 0 0 0 4 0 0Mastologia smithii 0 0 0 0 0 0 0Navicula absoluta 0 0 0 0 3 0 0Navicula cryptotenella 21 0 28 0 2 18 2Navicula explanata 0 6 4 0 0 2 0Navicula micropupula 0 0 0 0 0 0 0Navicula oblonga 19 32 37 5 18 12 35Navicula pseudoventralis 0 0 0 0 0 0 0Navicula aurora 32 24 24 19 67 23 62Navicula schmassmanni 0 0 0 1 0 0 0Navicula sp. 1 0 0 0 0 0 0 0Navicula stroemii 0 2 0 5 0 0 0Navicula viridula 59 16 30 12 21 0 34Navicula vulpina 2 0 0 2 0 0 0Neidium affine 0 0 0 0 0 0 0

Appendix A. AT01 raw counts and summary data
Diatom raw counts for each interval in the AT01-L2-G2 record. Column headings refer to calendar years before 1950 (years BP)
126
Age (years BP) 3860 4092 4280 4439 4578 4703 4819Neidium ampliatum 17 28 20 5 30 17 32Nitszchia dissipata 0 0 0 0 0 3 0Nitzchia gracillis 0 0 0 0 0 0 0Nitzchia palea 0 0 1 0 0 0 2Pinnularia major 0 0 0 0 0 0 0Pinnularia mesolepta 0 0 6 8 0 8 2Pinnularia microstauron 0 0 0 0 0 0 0Psammothidium subatomoides 0 0 10 0 0 22 0Pseudostaurosira pseudoconstruens 0 3 2 0 0 0 0Rhopalodia gibba 0 0 0 0 0 0 0Rossithidium pussilum 0 0 0 3 0 0 0Sellaphora laevissima 0 0 0 0 0 0 0Sellaphora pupula 27 34 35 9 28 20 20Sellaphora pupula var. subcapitata 0 0 0 0 0 0 0Stauroneis anceps 5 0 0 0 0 0 0Stauroneis phoenicenteron 4 7 7 3 3 10 8Staurosira construens 0 1 0 0 0 0 0Staurosira construens var. venter 4 10 13 7 15 10 0Staurosira construens var. venter long 11 3 18 31 14 7 24Staurosirella leptostauron 0 2 0 0 0 0 0Staurosirella pinnata 2 2 6 0 0 0 2Staurosirella pinnata var. intercedens 0 0 0 0 0 0 0Stephanodiscus alpina 0 0 0 0 0 0 0Surirella angusta 0 0 2 0 0 0 2Tabellaria flocculosa 0 0 0 0 0 0 0

Appendix A. AT01 raw counts and summary data
Diatom raw counts for each interval in the AT01-L2-G2 record. Column headings refer to calendar years before 1950 (years BP)
127
Age (years BP) 4927 5029 5126 5219 5317 5412 5502Depth down core (cm) 102.5 107.5 112.5 117.5 123 128.5 134Total valves counted 756 581 558 588 601 266 651Diatom concentration (valves/cm3) 2.20E+07 4.90E+06 9.55E+07 3.05E+07 4.76E+07 9.64E+06 1.74E+07Shannon-Weiner Diversity Index (H') 1.86 1.97 1.33 1.55 1.37 1.92 1.34Species Achnanthes gracillima 0 0 0 0 0 0 0Achnanthes ventralis 0 0 0 0 0 0 0Achnanthidium minutissimum 0 0 7 0 0 0 0Amphora inariensis 66 52 9 49 7 22 24Amphora ovalis 8 5 2 0 3 7 0Amphora ovalis var. pediculus 0 0 0 0 0 0 0Amphora thumensis 0 0 0 0 0 0 0Aneumastus tuscala 2 2 0 0 0 0 2Aulacoseira complex. 0 0 0 0 0 0 0Brachysira brebissonii 0 0 0 0 0 0 0Brachysira styriaca 0 0 0 0 0 0 0Brachysira vitrea 0 0 0 0 0 0 0Brachysira zellensis 0 2 3 0 0 2 0Caloneis silicula var. minuta 0 0 0 0 0 0 2Caloneis westii 0 0 0 0 0 0 0Cocconeis placentula 0 0 0 0 0 0 2Craticula cuspidata 0 0 0 0 0 0 0Craticula cuspidata 0 0 0 0 0 0 0Cyclostephanos invisitatus 0 0 0 0 0 0 0Cyclotella bodanica 0 0 0 0 0 0 0Cyclotella bodanica var. affins 0 0 0 0 0 0 0Cyclotella michighiania 0 0 0 0 0 0 0Cyclotella ocellata 1 3 0 0 0 0 0

Appendix A. AT01 raw counts and summary data
Diatom raw counts for each interval in the AT01-L2-G2 record. Column headings refer to calendar years before 1950 (years BP)
128
Age (years BP) 4927 5029 5126 5219 5317 5412 5502Cyclotella stelligera 0 0 0 0 0 0 0Cymbella angustata 0 0 0 0 0 0 0Cymbella cesatii 0 0 0 0 0 0 0Cymbella delicatula 0 0 0 0 0 0 0Cymbella descripta 0 0 0 0 0 0 0Cymbella diluviana 337 280 396 308 419 14 464Cymbella inaequalis 6 9 0 0 0 0 0Cymbella incerta 0 0 0 0 0 0 0Cymbella laevis 0 0 0 0 0 0 0Cymbella microcephala 0 0 0 0 0 0 0Cymbella minuta 0 0 4 0 0 0 0Cymbella proxima 0 0 0 0 0 0 0Cymbella pusilla 0 0 0 0 0 0 0Cymbella subcuspidata 16 11 2 0 4 10 5Cymbella tumidula 0 0 0 0 0 0 0Denticula elegans 0 0 1 0 0 0 0Denticula kuetzingii 0 0 0 0 0 0 0Diadesmis perpusilla 0 0 0 0 0 0 0Diatom mesoden 0 0 0 0 0 0 0Diatoma tenue 0 0 0 0 0 0 0Diploneis marginestriata 0 0 0 0 0 0 0Diploneis oblongella 0 0 0 0 0 0 0Diploneis oculata 0 0 0 0 0 0 0Encyonema minuta 0 0 0 0 0 0 0Encyonema muelleri 0 0 0 0 0 0 0Encyonema silesiaca 0 0 0 0 0 0 0Epithemia frickii 0 0 0 0 0 0 0Eucocconeis flexella 0 0 0 0 0 0 0

Appendix A. AT01 raw counts and summary data
Diatom raw counts for each interval in the AT01-L2-G2 record. Column headings refer to calendar years before 1950 (years BP)
129
Age (years BP) 4927 5029 5126 5219 5317 5412 5502Eunotia arcus 0 0 0 0 0 0 0Eunotia exigua 0 0 0 0 0 0 0Eunotia praerupta 1 1 0 0 0 0 0Fragilaria brevistriata 2 5 2 0 0 0 8Fragilaria capucina 0 0 0 0 0 0 0Fragilaria construens var. pumila 0 0 0 0 0 0 0Fragilaria oldenburgia 0 0 0 0 2 0 0Fragilaria tenera 0 0 0 0 0 0 0Frustulia saxonica 11 7 0 1 0 0 5Gomphonema angustatum 5 6 0 0 0 0 0Gomphonema gracile 0 0 0 0 0 0 0Gomphonema minuta 2 2 0 0 0 0 0Gomphonema subtile 0 0 0 0 0 0 0Hantzchia amphioxys 0 0 0 0 0 0 0Mastologia smithii 0 0 0 0 0 0 0Navicula absoluta 0 0 0 0 0 0 0Navicula cryptotenella 4 2 6 0 20 0 2Navicula explanata 0 0 0 0 2 0 3Navicula micropupula 0 0 0 0 0 0 0Navicula oblonga 5 4 1 7 13 4 4Navicula pseudoventralis 0 0 0 0 0 0 0Navicula aurora 53 39 15 56 30 16 20Navicula schmassmanni 0 0 0 0 0 0 0Navicula sp. 1 0 0 0 0 0 0 0Navicula stroemii 0 12 22 0 0 0 13Navicula viridula 12 9 3 14 0 28 16Navicula vulpina 4 1 0 0 0 0 0Neidium affine 0 0 0 0 0 0 0
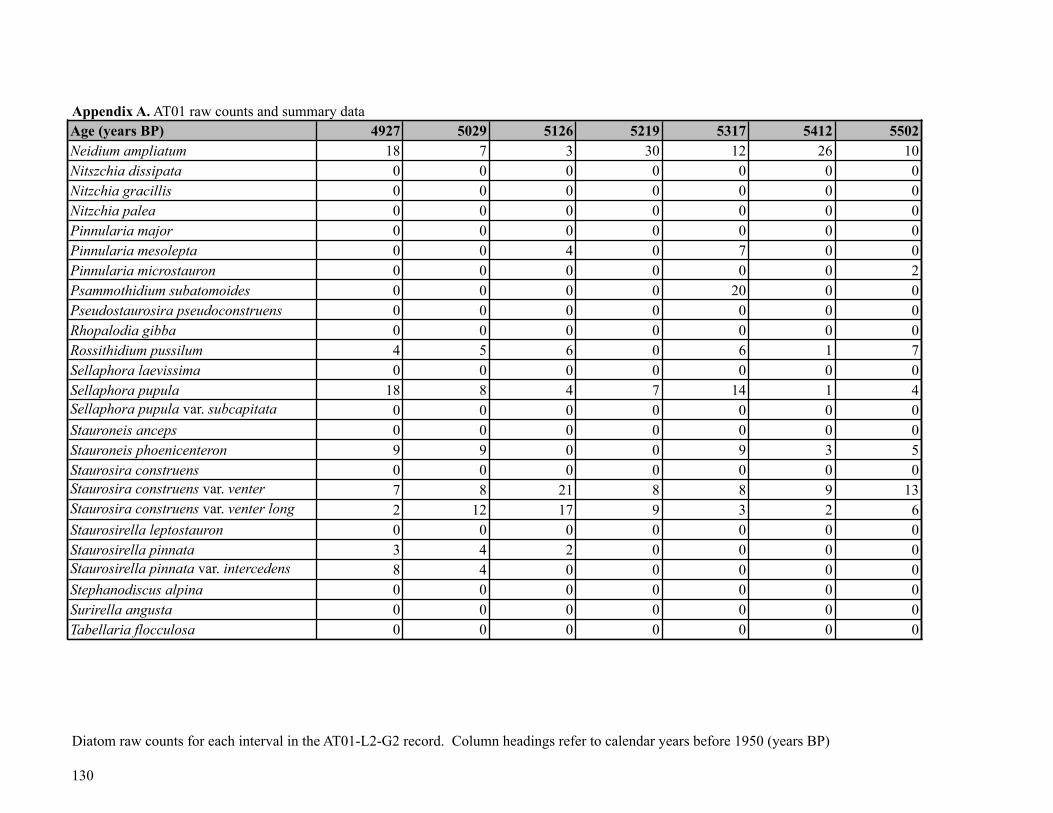
Appendix A. AT01 raw counts and summary data
Diatom raw counts for each interval in the AT01-L2-G2 record. Column headings refer to calendar years before 1950 (years BP)
130
Age (years BP) 4927 5029 5126 5219 5317 5412 5502Neidium ampliatum 18 7 3 30 12 26 10Nitszchia dissipata 0 0 0 0 0 0 0Nitzchia gracillis 0 0 0 0 0 0 0Nitzchia palea 0 0 0 0 0 0 0Pinnularia major 0 0 0 0 0 0 0Pinnularia mesolepta 0 0 4 0 7 0 0Pinnularia microstauron 0 0 0 0 0 0 2Psammothidium subatomoides 0 0 0 0 20 0 0Pseudostaurosira pseudoconstruens 0 0 0 0 0 0 0Rhopalodia gibba 0 0 0 0 0 0 0Rossithidium pussilum 4 5 6 0 6 1 7Sellaphora laevissima 0 0 0 0 0 0 0Sellaphora pupula 18 8 4 7 14 1 4Sellaphora pupula var. subcapitata 0 0 0 0 0 0 0Stauroneis anceps 0 0 0 0 0 0 0Stauroneis phoenicenteron 9 9 0 0 9 3 5Staurosira construens 0 0 0 0 0 0 0Staurosira construens var. venter 7 8 21 8 8 9 13Staurosira construens var. venter long 2 12 17 9 3 2 6Staurosirella leptostauron 0 0 0 0 0 0 0Staurosirella pinnata 3 4 2 0 0 0 0Staurosirella pinnata var. intercedens 8 4 0 0 0 0 0Stephanodiscus alpina 0 0 0 0 0 0 0Surirella angusta 0 0 0 0 0 0 0Tabellaria flocculosa 0 0 0 0 0 0 0

Appendix A. AT01 raw counts and summary data
Diatom raw counts for each interval in the AT01-L2-G2 record. Column headings refer to calendar years before 1950 (years BP)
131
Age (years BP) 5589 5673 5754 5832 5907 5979 6049Depth down core (cm) 139.5 145 150.5 156 161.5 167 172.5Total valves counted 623 649 554 591 692 605 599Diatom concentration (valves/cm3) 2.54E+08 1.77E+07 4.39E+07 1.11E+07 4.22E+07 1.57E+07 3.83E+07Shannon-Weiner Diversity Index (H') 0.99 1.34 1.56 1.55 0.95 1.09 0.90Species Achnanthes gracillis 0 0 0 0 0 0 0Navicula veneta 0 0 0 0 0 0 0Achnanthes minutissima 0 0 0 0 0 0 0Amphora libyca 2 30 28 46 23 28 15Amphora ovalis 2 3 0 4 3 1 2Amphora pediculus 0 0 0 0 0 0 0Amphora thumensis 0 0 0 0 0 0 0Navicula tuscala 0 0 0 0 0 0 0Aulacoseira complexe 0 0 0 1 0 0 0Anomoeoneis brachysira 0 0 0 0 0 0 0Anomoeoneis styriaca 0 0 0 0 0 0 0Anomoeoneis vitrea 0 0 0 0 0 0 0Anomoeoneis brachysira zellensis 0 0 0 0 0 0 0Caloneis silicula 0 0 0 0 0 0 0Caloneis westii 0 0 0 0 0 0 0Cocconeis placentula 0 0 0 0 0 0 0Craticula cuspidata 0 0 0 0 0 0 0Navicula cuspidata 0 0 0 0 0 0 0Cyclostephanos invisitatis 0 0 0 0 0 0 0Cyclotella bodanica 0 0 0 0 0 0 0Cyclotella bodanica var. affins 0 0 0 0 0 0 0Cyclotella michighiania 0 0 0 0 0 0 0Cyclotella ocellata 0 0 0 0 0 0 0

Appendix A. AT01 raw counts and summary data
Diatom raw counts for each interval in the AT01-L2-G2 record. Column headings refer to calendar years before 1950 (years BP)
132
Age (years BP) 5589 5673 5754 5832 5907 5979 6049Cyclotella stelligera 0 0 0 2 0 0 0Cymbella angustata 0 0 0 0 0 0 0Cymbella cesatii 0 0 0 0 0 0 0Cymbella delicatula 0 0 0 0 0 0 0Cymbella descripta 0 0 0 0 0 0 0Navicula diluviana 486 420 321 339 529 420 468Cymbella ehrenbergii 0 0 0 0 0 0 0Cymbella incerta 0 0 0 0 0 0 0Cymbella laevis 0 0 0 0 0 0 0Cymbella microcephala 0 0 0 0 0 0 0Cymbella minuta 0 0 0 0 0 0 0Cymbella proxima 0 0 0 0 0 0 0Cymbella pusilla 0 0 0 0 0 0 0Cymbella subcuspidata 6 9 9 12 2 7 0Cymbella tumidula 0 0 0 0 0 0 0Denticula elegans 0 0 0 0 0 0 0Denticula kuetzingii 0 0 0 2 0 0 0Cymbella perpusilla 0 0 0 0 0 0 0Diatom mesoden 0 0 0 0 0 0 0Diatoma tenue 0 0 0 0 0 0 0Diploneis marg 0 0 0 0 0 0 0Diploneis oblongella 0 0 0 0 0 0 0Diploneis ocullata 0 0 0 0 0 0 0Encyonema minuta 0 0 0 0 0 0 0Cymbella muelleri 0 2 0 0 0 0 0Cymbella silesiaca 0 0 0 0 0 0 0Epithemia frickii 0 0 0 0 0 0 0Achnanthes flexella 0 0 0 0 0 0 0

Appendix A. AT01 raw counts and summary data
Diatom raw counts for each interval in the AT01-L2-G2 record. Column headings refer to calendar years before 1950 (years BP)
133
Age (years BP) 5589 5673 5754 5832 5907 5979 6049Eunotia bilnaris 0 0 0 0 0 0 0Eunotia exigua 0 0 0 0 0 0 0Eunotia praerupta 0 0 0 0 0 0 0Fragilaria brevistriata 0 0 6 19 0 0 8Fragilaria capucina 0 0 0 0 0 0 0Fragilaria construens var. pumila 0 0 0 0 0 0 0Fragilaria oldenburgia 0 0 0 0 0 0 0Fragilaria tenera 0 0 0 0 0 0 0Frustulia rhomboides var. crassinervia 1 3 0 0 0 0 0Gomphonema angusta 0 0 0 0 0 0 0Gomphonema aquaemin 0 0 0 0 0 0 0Gomphonema minuta 0 0 0 0 0 0 0Gomphonema subtile 0 0 0 0 0 0 0Hantzchia amphioxys 0 2 0 0 0 2 0Mastologia smithii 0 0 0 0 0 0 0Navicula absoluta 0 0 0 0 0 0 0Navicula cryptotenella 0 0 0 0 0 0 0Navicula explanata 2 0 0 0 0 0 0Navicula micropunctata 0 0 0 0 0 0 0Navicula oblonga 0 2 4 0 0 1 0Navicula pseudoventralis 0 0 0 0 0 0 0Navicula aurora 18 46 33 57 25 39 23Navicula schmassmanni 0 0 0 0 0 0 0Navicula aurora 0 0 0 0 0 0 0Navicula stroemii 0 0 0 66 3 0 0Navicula viridula 0 11 26 9 3 3 0Navicula vulpina 0 1 0 4 0 0 0Nedium densestriatum 2 0 0 0 0 0 0

Appendix A. AT01 raw counts and summary data
Diatom raw counts for each interval in the AT01-L2-G2 record. Column headings refer to calendar years before 1950 (years BP)
134
Age (years BP) 5589 5673 5754 5832 5907 5979 6049Nedium ampliatum 7 2 29 2 0 6 0Nitzchia bacillium 0 0 0 0 0 0 0Nitzchia gracillis 0 0 0 0 0 0 0Nitzchia palea 0 0 0 0 0 0 0Pinnularia maior 0 0 0 0 0 0 0Pinnularia silvatica 5 3 0 0 0 0 0Pinnularia microstauron 0 0 2 0 0 0 0Achnanthes subtamoids 16 0 0 0 0 0 0Pseudostaurosira pseudoconstruens 0 0 0 0 6 0 0Rhopalodia gibba 0 0 0 0 0 0 0Achnanthes pusiila 1 0 0 0 1 0 0Navicula laevissima 0 0 0 0 2 0 0Navicula pupula 4 6 12 0 1 0 0Navicula pupula var. subcapitata 0 0 0 0 0 0 0Stauroneis anceps 0 0 0 0 0 0 0Stauroneis phoenicenteron 4 0 8 1 1 1 0Staurosira construens 0 0 0 0 0 0 0Staurosira construens var venter 12 18 5 4 13 4 10Staurosira construens var venter long 7 10 0 3 3 2 8Staurosurirella leptostauron 0 0 0 0 0 0 0Staurosirella pinnata 0 0 0 8 2 3 10Staurosirella pinnata var intercedens 0 0 0 0 2 0 0Stephanodiscus alpina 0 0 0 0 0 0 0Surirella angusta 0 0 0 0 0 0 0Tabellaria Flocculosa 0 0 0 0 0 0 0

Appendix A. AT01 raw counts and summary data
Diatom raw counts for each interval in the AT01-L2-G2 record. Column headings refer to calendar years before 1950 (years BP)
135
Age (years BP) 6117 6182 6245 6306 6365 6422 6477Depth down core (cm) 178 183.5 189 194.5 200 205.5 211Total valves counted 528 575 527 522 532 599 160Diatom concentration (valves/cm3) 7.80E+07 2.64E+07 8.80E+06 1.97E+06 4.85E+07 3.14E+06 1.27E+03Shannon-Weiner Diversity Index (H') 0.82 1.33 1.12 1.47 1.25 1.16 1.20Species Achnanthes gracillima 0 0 0 0 0 0 0Achnanthes ventralis 0 0 0 0 0 0 0Achnanthidium minutissimum 0 0 0 0 0 0 0Amphora inariensis 9 32 8 1 2 1 0Amphora ovalis 0 0 1 0 0 0 0Amphora ovalis var. pediculus 0 0 0 0 0 0 1Amphora thumensis 0 0 0 6 12 2 0Aneumastus tuscala 0 0 0 0 0 0 0Aulacoseira complex. 0 0 0 0 0 2 0Brachysira brebissonii 0 0 0 0 0 0 0Brachysira styriaca 0 0 0 0 0 0 0Brachysira vitrea 0 0 0 0 0 0 0Brachysira zellensis 0 0 0 0 0 0 0Caloneis silicula var. minuta 0 0 0 0 0 0 0Caloneis westii 0 0 0 0 0 0 0Cocconeis placentula 0 0 0 0 0 0 0Craticula cuspidata 0 0 0 0 0 0 0Craticula cuspidata 0 0 0 0 0 0 0Cyclostephanos invisitatus 0 0 0 0 0 2 0Cyclotella bodanica 0 0 0 0 0 2 0Cyclotella bodanica var. affins 0 0 0 0 0 0 0Cyclotella michighiania 0 0 0 0 0 0 0Cyclotella ocellata 0 0 0 0 0 0 0

Appendix A. AT01 raw counts and summary data
Diatom raw counts for each interval in the AT01-L2-G2 record. Column headings refer to calendar years before 1950 (years BP)
136
Age (years BP) 6117 6182 6245 6306 6365 6422 6477Cyclotella stelligera 0 0 0 0 0 0 0Cymbella angustata 0 0 0 0 0 0 0Cymbella cesatii 0 0 0 0 0 0 0Cymbella delicatula 0 0 0 0 0 0 0Cymbella descripta 0 0 0 0 0 0 0Cymbella diluviana 410 349 302 261 253 215 22Cymbella inaequalis 0 0 0 0 0 0 0Cymbella incerta 0 0 0 0 0 0 0Cymbella laevis 0 0 0 0 0 0 0Cymbella microcephala 0 0 0 0 0 0 0Cymbella minuta 0 0 0 0 0 8 0Cymbella proxima 0 0 0 0 0 0 0Cymbella pusilla 0 0 0 0 0 0 0Cymbella subcuspidata 3 2 0 0 0 0 0Cymbella tumidula 0 0 0 0 0 0 0Denticula elegans 0 0 0 0 0 0 0Denticula kuetzingii 0 0 0 0 0 0 0Diadesmis perpusilla 0 0 0 0 0 0 0Diatom mesoden 0 0 0 0 0 0 0Diatoma tenue 0 0 0 0 0 0 0Diploneis marginestriata 0 0 0 0 0 0 0Diploneis oblongella 0 0 0 0 0 0 0Diploneis oculata 0 0 0 0 0 0 0Encyonema minuta 0 0 0 5 1 0 0Encyonema muelleri 0 0 0 0 0 0 0Encyonema silesiaca 0 0 0 0 0 0 0Epithemia frickii 0 0 0 0 0 0 0Eucocconeis flexella 0 0 0 0 0 0 0

Appendix A. AT01 raw counts and summary data
Diatom raw counts for each interval in the AT01-L2-G2 record. Column headings refer to calendar years before 1950 (years BP)
137
Age (years BP) 6117 6182 6245 6306 6365 6422 6477Eunotia arcus 0 0 0 0 0 0 0Eunotia exigua 0 0 0 0 0 0 0Eunotia praerupta 0 0 0 0 0 0 0Fragilaria brevistriata 0 5 2 0 0 70 0Fragilaria capucina 0 0 0 0 0 10 0Fragilaria construens var. pumila 0 0 0 0 0 6 0Fragilaria oldenburgia 0 0 0 0 0 0 0Fragilaria tenera 0 0 0 0 0 0 0Frustulia saxonica 0 0 0 0 0 0 0Gomphonema angustatum 0 0 0 0 0 0 0Gomphonema gracile 0 0 0 0 0 0 0Gomphonema minuta 0 0 0 0 0 0 0Gomphonema subtile 0 0 0 0 0 0 0Hantzchia amphioxys 0 0 0 0 0 0 0Mastologia smithii 0 0 0 0 0 0 0Navicula absoluta 0 0 0 0 0 0 0Navicula cryptotenella 0 0 0 0 0 0 0Navicula explanata 0 0 0 0 0 0 0Navicula micropupula 0 0 0 0 0 0 0Navicula oblonga 0 0 0 0 0 0 0Navicula pseudoventralis 0 0 0 0 0 0 0Navicula aurora 13 48 6 12 3 0 0Navicula schmassmanni 0 0 0 0 0 0 0Navicula sp. 1 0 0 0 0 0 0 0Navicula stroemii 0 0 3 2 0 0 0Navicula viridula 0 0 0 0 0 0 0Navicula vulpina 0 19 0 0 0 0 0Neidium affine 0 0 0 0 0 0 0

Appendix A. AT01 raw counts and summary data
Diatom raw counts for each interval in the AT01-L2-G2 record. Column headings refer to calendar years before 1950 (years BP)
138
Age (years BP) 6117 6182 6245 6306 6365 6422 6477Neidium ampliatum 0 9 2 0 0 0 0Nitszchia dissipata 0 0 0 0 0 0 0Nitzchia gracillis 0 0 0 0 0 0 0Nitzchia palea 0 0 0 0 0 0 0Pinnularia major 0 0 0 0 0 0 0Pinnularia mesolepta 0 0 0 0 0 0 0Pinnularia microstauron 0 0 0 0 0 0 0Psammothidium subatomoides 0 0 0 0 0 0 0Pseudostaurosira pseudoconstruens 2 1 8 38 33 15 10Rhopalodia gibba 0 0 0 0 0 0 0Rossithidium pussilum 0 0 0 0 0 0 0Sellaphora laevissima 0 0 0 0 0 0 0Sellaphora pupula 0 0 0 0 0 0 0Sellaphora pupula var. subcapitata 0 0 0 0 0 0 0Stauroneis anceps 0 0 0 0 0 0 0Stauroneis phoenicenteron 0 3 0 0 0 0 0Staurosira construens 0 0 8 33 20 28 10Staurosira construens var. venter 10 27 58 109 180 210 103Staurosira construens var. venter long 9 6 2 5 5 14 2Staurosirella leptostauron 0 0 0 0 0 0 0Staurosirella pinnata 0 4 7 6 5 7 5Staurosirella pinnata var. intercedens 2 2 3 0 5 2 0Stephanodiscus alpina 0 0 0 0 0 0 0Surirella angusta 0 0 0 0 0 0 0Tabellaria flocculosa 0 0 0 0 0 0 0

Appendix A. AT01 raw counts and summary data
Diatom raw counts for each interval in the AT01-L2-G2 record. Column headings refer to calendar years before 1950 (years BP)
139
Age (years BP) 6531 6583 6633 6681 6720Depth down core (cm) 216.5 222 227.5 233 237.5Total valves counted 131 441 100 138 9Diatom concentration (valves/cm3) 2.69E+02 4.52E+05 1.23E+03 2.02E+03 2.43E+02Shannon-Weiner Diversity Index (H') 1.33 1.19 1.09 1.14 1.46Species Achnanthes gracillima 0 0 0 0 0Achnanthes ventralis 0 0 0 0 0Achnanthidium minutissimum 0 0 0 0 0Amphora inariensis 0 0 0 0 0Amphora ovalis 0 0 0 0 0Amphora ovalis var. pediculus 0 0 0 0 0Amphora thumensis 0 0 0 0 0Aneumastus tuscala 0 0 0 0 0Aulacoseira complex. 2 8 0 0 0Brachysira brebissonii 0 0 0 0 0Brachysira styriaca 0 0 0 0 0Brachysira vitrea 0 0 0 0 0Brachysira zellensis 20 0 0 0 0Caloneis silicula var. minuta 0 0 0 0 0Caloneis westii 0 0 0 0 0Cocconeis placentula 0 0 0 0 0Craticula cuspidata 0 0 0 0 0Craticula cuspidata 0 0 0 0 0Cyclostephanos invisitatus 0 0 0 0 0Cyclotella bodanica 0 0 0 0 0Cyclotella bodanica var. affins 0 0 0 0 0Cyclotella michighiania 0 0 0 0 0Cyclotella ocellata 0 0 0 0 0

Appendix A. AT01 raw counts and summary data
Diatom raw counts for each interval in the AT01-L2-G2 record. Column headings refer to calendar years before 1950 (years BP)
140
Age (years BP) 6531 6583 6633 6681 6720Cyclotella stelligera 0 0 0 0 0Cymbella angustata 0 0 0 0 0Cymbella cesatii 0 0 0 0 0Cymbella delicatula 0 0 0 0 0Cymbella descripta 0 0 0 0 0Cymbella diluviana 15 168 12 4 0Cymbella inaequalis 0 0 0 0 0Cymbella incerta 0 0 0 0 0Cymbella laevis 0 0 0 0 0Cymbella microcephala 0 0 0 0 0Cymbella minuta 0 0 0 0 0Cymbella proxima 0 0 0 0 0Cymbella pusilla 0 0 0 0 0Cymbella subcuspidata 0 0 0 0 0Cymbella tumidula 0 0 0 0 0Denticula elegans 10 0 0 0 0Denticula kuetzingii 0 0 0 0 0Diadesmis perpusilla 0 0 0 0 0Diatom mesoden 0 0 0 0 0Diatoma tenue 0 0 0 0 0Diploneis marginestriata 0 0 0 0 0Diploneis oblongella 0 0 0 0 0Diploneis oculata 0 0 0 0 0Encyonema minuta 0 4 0 0 0Encyonema muelleri 2 0 0 0 0Encyonema silesiaca 0 0 0 0 0Epithemia frickii 0 0 0 0 0Eucocconeis flexella 0 0 0 0 0
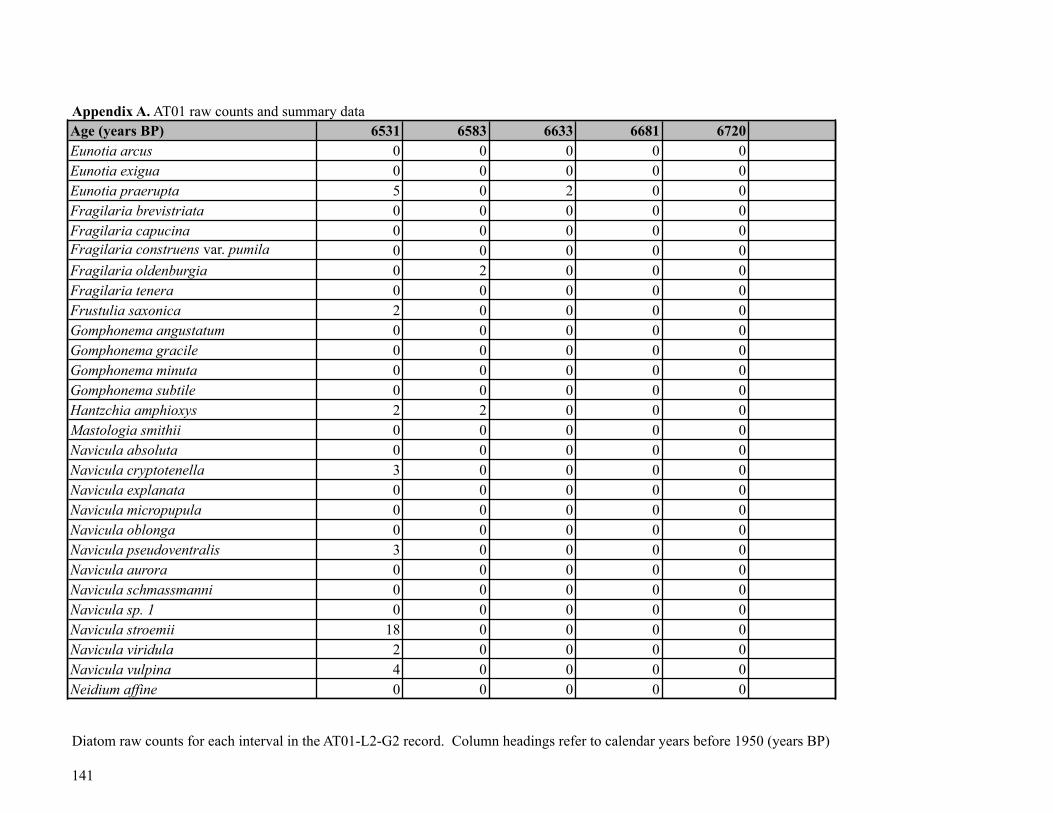
Appendix A. AT01 raw counts and summary data
Diatom raw counts for each interval in the AT01-L2-G2 record. Column headings refer to calendar years before 1950 (years BP)
141
Age (years BP) 6531 6583 6633 6681 6720Eunotia arcus 0 0 0 0 0Eunotia exigua 0 0 0 0 0Eunotia praerupta 5 0 2 0 0Fragilaria brevistriata 0 0 0 0 0Fragilaria capucina 0 0 0 0 0Fragilaria construens var. pumila 0 0 0 0 0Fragilaria oldenburgia 0 2 0 0 0Fragilaria tenera 0 0 0 0 0Frustulia saxonica 2 0 0 0 0Gomphonema angustatum 0 0 0 0 0Gomphonema gracile 0 0 0 0 0Gomphonema minuta 0 0 0 0 0Gomphonema subtile 0 0 0 0 0Hantzchia amphioxys 2 2 0 0 0Mastologia smithii 0 0 0 0 0Navicula absoluta 0 0 0 0 0Navicula cryptotenella 3 0 0 0 0Navicula explanata 0 0 0 0 0Navicula micropupula 0 0 0 0 0Navicula oblonga 0 0 0 0 0Navicula pseudoventralis 3 0 0 0 0Navicula aurora 0 0 0 0 0Navicula schmassmanni 0 0 0 0 0Navicula sp. 1 0 0 0 0 0Navicula stroemii 18 0 0 0 0Navicula viridula 2 0 0 0 0Navicula vulpina 4 0 0 0 0Neidium affine 0 0 0 0 0

Appendix A. AT01 raw counts and summary data
Diatom raw counts for each interval in the AT01-L2-G2 record. Column headings refer to calendar years before 1950 (years BP)
142
Age (years BP) 6531 6583 6633 6681 6720Neidium ampliatum 0 0 0 0 0Nitszchia dissipata 0 0 0 0 0Nitzchia gracillis 0 0 0 0 0Nitzchia palea 0 0 0 0 0Pinnularia major 0 0 0 0 0Pinnularia mesolepta 0 0 0 0 0Pinnularia microstauron 0 0 0 0 0Psammothidium subatomoides 0 0 0 0 0Pseudostaurosira pseudoconstruens 10 26 4 4 0Rhopalodia gibba 0 0 0 0 0Rossithidium pussilum 0 0 0 0 0Sellaphora laevissima 0 0 0 0 0Sellaphora pupula 4 0 0 0 0Sellaphora pupula var. subcapitata 0 0 0 0 0Stauroneis anceps 0 0 0 0 0Stauroneis phoenicenteron 0 0 0 0 0Staurosira construens 1 9 9 12 0Staurosira construens var. venter 8 190 69 98 5Staurosira construens var. venter long 1 18 2 10 1Staurosirella leptostauron 0 0 0 0 0Staurosirella pinnata 1 4 2 3 1Staurosirella pinnata var. intercedens 0 6 0 4 1Stephanodiscus alpina 2 0 0 0 0Surirella angusta 0 2 0 1 0Tabellaria flocculosa 0 0 0 0 0

Appendix B. Baker Lake raw counts and summary data
Diatom raw counts for each interval in the Baker Lake record. Column headings refer to years AD. Where age of sediment interval is unavailable, depth down core (cm) is provided. 143
Year (AD) 2007 2006 2002 1996 1985 1978 1973Depth down core (cm) 0.5 1.5 2.5 3.5 4.5 5.5 6.5Total valves counted 486 497 501 561 569 539 575Diatom concentration (valves/cm3) 9.99E+09 9.72E+09 6.97E+09 7.49E+09 7.96E+09 7.51E+09 8.45E+09Diatom-inferred pH 7.19 7.18 7.24 7.18 7.29 7.18 7.07Hill's N2 Diversity Index 39.71 32.72 42.96 48.26 46.92 45.73 49.47Species Achnanthes biasolettiana var. subatomus 0 2 2 4 0 0 0Achnanthes bicapitata 3 2 3 7 1 2 4Achnanthes carissima 2 0 0 3 4 3 1Achnanthes chlidanos 0 2 4 0 6 0 0Achnanthes curtissima 5 12 6 5 8 10 12Achnanthes gracillima 7 3 9 14 15 8 22Achnanthes imperfecta 0 0 0 0 0 4 2Achnanthes implexiformis 2 0 2 3 5 0 0Achnanthes lanceolata 0 0 5 0 0 0 3Achnanthes laterostrata 4 11 2 4 4 2 4Achnanthes nitidiformis 7 0 7 1 6 2 5Achnanthes rivulaire 0 2 6 1 2 1 2Achnanthes rosenstockii 0 0 0 0 0 0 0Achnanthes suchlandtii 0 10 11 7 19 17 9Achnanthes ventralis 0 0 0 0 0 0 0Achnanthes ziegleri 0 0 0 2 0 0 0Achnanthidium minutissimum 42 40 17 19 37 17 14Amphora inariensis 0 0 0 0 0 0 3Amphora ovalis var. pediculus 6 0 8 8 7 13 15Amphora ovalis var. affinis 0 0 2 3 5 4 2Amphora thumensis 3 0 0 0 0 2 0Aneumastus tusculus 0 0 0 0 0 1 0Aulacoseira ambigua 18 15 15 30 20 55 65Aulacoseira distans 4 2 3 2 6 5 7Bracysira zellensis 0 0 0 0 0 2 0Caloneis silicula 0 0 3 2 0 2 2

Appendix B. Baker Lake raw counts and summary data
Diatom raw counts for each interval in the Baker Lake record. Column headings refer to years AD. Where age of sediment interval is unavailable, depth down core (cm) is provided. 144
Year (AD) 2007 2006 2002 1996 1985 1978 1973Cavinula cocconeiformis 2 1 2 8 2 0 6Cavinula jaernefeltii 0 4 0 3 2 0 0Cocconeis placentula var. euglypta 2 0 2 0 5 2 2Cocconeis placentula var. placentula 0 0 0 0 0 0 0Craticula ambigua 0 0 0 0 0 0 0Cyclostephanos invis 0 0 0 0 0 0 0Cyclotella bodanica 2 8 2 0 5 3 1Cyclotella bodanica var. affinis 2 7 5 5 0 4 2Cyclotella ocellata 0 4 1 0 2 0 0Cyclotella rossi 17 15 16 13 15 7 12Cyclotella stelligera 36 60 26 29 20 11 11Cyclotella tripartita 0 12 0 0 8 1 4Cymbella arctica 0 0 0 0 0 0 0Cymbella descripta 3 2 4 1 4 2 5Cymbella gaeumanni 3 5 4 2 8 4 2Cymbella naviculiformis 4 5 3 1 4 5 2Cymbella pusilla 2 4 0 5 9 6 5Denticula kuetzingii 0 0 0 0 0 0 0Diatoma tenue 4 0 3 12 13 8 2Diatoma tenue var. elonga 8 0 5 6 0 3 12Didymosphaenia geminata 0 0 0 0 0 0 0Diploneis boldtiana 0 7 0 0 0 0 0Diploneis marginestriata 3 1 1 2 0 4 2Diploneis oblongella 1 0 1 0 0 1 0Diploneis parma 0 2 2 1 0 5 6Diploneis smithi var. dilatata 0 0 0 0 0 0 0Encyonema minuta 16 7 15 13 15 9 7Encyonema silesiacum 0 8 6 14 26 24 18Eucocconeis flexella 0 0 0 0 0 0 0Eunotia arcus 0 0 2 4 0 0 0Eunotia bidens 0 0 0 0 2 0 0Eunotia exigua 4 2 5 3 0 0 0

Appendix B. Baker Lake raw counts and summary data
Diatom raw counts for each interval in the Baker Lake record. Column headings refer to years AD. Where age of sediment interval is unavailable, depth down core (cm) is provided. 145
Year (AD) 2007 2006 2002 1996 1985 1978 1973Eunotia rhomboidea 1 2 3 1 0 0 0Eunotia veneris 0 2 0 0 0 0 0Fragilaria brevistriata 21 20 28 8 20 14 11Fragilaria capucina 5 5 9 18 8 7 13Fragilaria construens var. pumilla 0 0 0 0 0 0 0Fragilaria lata 2 0 0 0 2 2 2Fragilaria neoproducta 6 6 3 4 8 1 3Fragilaria pulchilla var. lanceolata 0 0 1 0 0 0 0Fragilariforma virescens 4 5 4 12 10 3 7Frustulia rhomboides 1 2 0 0 1 0 0Frustulia saxonica 3 0 0 0 2 0 0Gomphonema angustum 3 0 0 1 0 0 0Gomphonema gracile 0 0 0 3 0 4 4Gomphonema olivaceum 6 0 0 3 8 1 0Gomphonema parvulum 0 0 0 1 0 2 0Gomphonema subtile 0 2 0 0 0 0 0Gyrosigma acuminatum 2 4 3 5 6 6 2Karayevia clevei 7 5 2 0 0 0 0Kobayasia jaagii 0 0 0 0 0 0 0Mastologia smithii 0 0 0 0 0 1 0Navicula absoluta 7 0 0 6 0 7 9Navicula agrestis 1 1 0 1 0 0 0Navicula bryophila 0 0 0 1 0 0 0Navicula cari 0 0 0 0 0 0 0Navicula crytocephala 0 0 0 0 0 0 0Navicula cyrototenella 4 1 6 4 7 4 2Navicula digitulus 0 0 0 2 0 4 0Navicula disjuncta 0 0 3 0 2 0 0Navicula expecta 0 0 0 0 0 0 0Navicula gerloffi 0 0 0 0 3 0 0Navicula indifferens 0 0 0 0 0 0 0Navicula leptostriata 8 4 17 17 18 20 12

Appendix B. Baker Lake raw counts and summary data
Diatom raw counts for each interval in the Baker Lake record. Column headings refer to years AD. Where age of sediment interval is unavailable, depth down core (cm) is provided. 146
Year (AD) 2007 2006 2002 1996 1985 1978 1973Navicula menisculus 0 0 0 0 0 0 0Navicula minima 0 0 0 0 2 0 0Navicula notha 0 0 0 0 0 0 0Navicula pseudoanglica 0 0 0 0 0 0 0Navicula pseudoscutiformis 2 2 4 4 2 2 3Navicula pseudoventralis 0 0 0 0 0 2 0Navicula radiosa 0 0 0 0 0 0 0Navicula salinarum 0 0 0 0 0 0 0Navicula schadei 0 2 3 0 1 0 1Navicula schmassmannii 7 14 11 7 19 5 9Navicula seminulum var. hustedtii 2 0 0 3 0 0 0Navicula soehresis 0 0 0 0 0 0 0Navicula submuralis 2 0 0 4 0 2 0Navicula trivialis 0 0 0 0 0 0 0Navicula veneta 2 0 0 0 5 0 0Navicula vitabunda 0 0 1 1 0 4 3Nedium ampliatum 1 0 0 1 2 0 0Nedium iridis 1 1 0 0 1 0 0Nitzchia amphibia 3 2 5 6 3 3 6Nitzschia bacilium 0 0 0 4 0 0 0NItzschia capitelatta 0 0 0 0 0 3 0Nitzschia constricta 0 0 0 1 3 0 0Nitzschia dissipata 0 0 10 0 12 0 0Nitzschia fonticola 3 0 0 4 0 3 5Nitzschia frustulum 0 0 0 0 0 8 6Nitzschia gracillis 0 7 14 2 0 8 11Nitzschia liebethruthii 3 0 7 8 0 10 3Nitzschia palea 20 3 28 16 2 23 18Nitzschia perminuta 20 16 26 19 33 32 26Nitzschia recta 18 0 9 20 0 12 9Nitzschia tubicole 0 10 6 0 9 0 0Pinnularia biceps 0 2 2 0 0 0 0

Appendix B. Baker Lake raw counts and summary data
Diatom raw counts for each interval in the Baker Lake record. Column headings refer to years AD. Where age of sediment interval is unavailable, depth down core (cm) is provided. 147
Year (AD) 2007 2006 2002 1996 1985 1978 1973Pinnularia major 0 0 0 0 0 0 0Pinnularia mesolepta 0 0 0 0 0 0 0Pinnularia microstauron 0 0 0 0 4 2 0Pinnularia nodosa 0 0 0 0 2 0 0Pinnularia pluviana 0 0 0 0 0 0 0Pinnularia radiosa 0 0 0 0 0 0 0Pinnularia rhombica 0 0 0 0 0 2 0Pinnularia rupestris 0 0 2 0 0 0 0Pinnularia silvatica 0 0 0 4 0 0 0Planothidium calcar 0 0 2 0 0 0 0Planothidium oestrupii 4 2 0 6 3 0 3Psammothidium altaica 4 4 5 7 6 4 5Psammothidium marginulatum 2 3 4 2 3 5 4Psammothidium subatomoides 12 8 3 15 8 8 3Pseudostarosirella pseudoconstruens 8 0 14 18 5 15 12Rossithidium pusillum 21 25 14 24 11 11 16Sellaphora bacilium 1 0 0 0 0 0 0Sellaphora pupula 0 5 2 0 8 0 0Sellaphora seminulum 0 0 0 0 0 2 4Stauroneis anceps 0 0 1 0 0 0 0Stauroneis construens var. venter 5 1 0 0 0 2 5Stauroneis neohyalina 0 0 0 0 3 2 4Stauroneis smithii 0 0 0 0 0 3 8Staurosira leptostauron var. dubia 0 0 0 0 0 0 0Staurosirella pinnata 12 7 5 12 11 9 15Staurosirella pinnata var. intercedens 0 0 0 1 1 0 0Stephanodiscus alpina 1 0 0 2 3 0 2Stephanodiscus niagarae 0 0 0 0 0 0 0Surirella angusta 0 0 0 1 2 0 3Surirella biseriata var.. bifrons 0 0 0 0 0 0 0Surirella brebissoni 0 1 0 0 2 0 0Surirella linearis 0 0 4 2 0 2 4

Appendix B. Baker Lake raw counts and summary data
Diatom raw counts for each interval in the Baker Lake record. Column headings refer to years AD. Where age of sediment interval is unavailable, depth down core (cm) is provided. 148
Year (AD) 2007 2006 2002 1996 1985 1978 1973Surirella minuta 0 0 0 2 0 6 4Surirella ovalis 6 2 3 2 5 0 5Surirella striatula 3 4 1 2 3 2 0Synedra berolinensis 2 4 3 1 1 2 2Synedra famelica 2 0 0 0 0 0 0Synedra tenera 6 0 3 3 0 0 0Tabellaria fenestrata 3 2 2 0 1 0 0Tabellaria flocculosa 17 56 18 33 13 20 40

Appendix B. Baker Lake raw counts and summary data
Diatom raw counts for each interval in the Baker Lake record. Column headings refer to years AD. Where age of sediment interval is unavailable, depth down core (cm) is provided. 149
Year (AD) 1960 1952 1951 1950 1938 1913 1883Depth down core (cm) 7.5 8 8.5 9.5 10.5 11.5 12.5Total valves counted 653 576 511 510 508 489 498Diatom concentration (valves/cm3) 9.58E+09 7.55E+09 7.35E+09 5.30E+09 6.96E+09 6.82E+09 6.41E+09Diatom-inferred pH 7.12 7.14 7.15 7.09 6.99 7.11 7.18Hill's N2 Diversity Index 48.19 49.98 43.27 40.74 41.47 41.76 49.98Species Achnanthes biasolettiana var. subatomus 0 1 2 2 3 2 0Achnanthes bicapitata 1 4 1 3 1 2 6Achnanthes carissima 6 0 1 0 0 7 0Achnanthes chlidanos 0 3 0 7 6 2 7Achnanthes curtissima 0 3 4 0 9 4 4Achnanthes gracillima 12 10 3 14 20 8 6Achnanthes imperfecta 4 0 0 2 2 0 0Achnanthes implexiformis 7 3 0 0 0 0 1Achnanthes lanceolata 4 2 4 4 2 1 0Achnanthes laterostrata 7 9 9 8 7 8 12Achnanthes nitidiformis 19 5 5 10 6 4 2Achnanthes rivulaire 1 3 2 3 2 4 4Achnanthes rosenstockii 0 4 3 0 7 0 1Achnanthes suchlandtii 23 10 20 22 7 20 14Achnanthes ventralis 3 0 0 0 0 0 0Achnanthes ziegleri 0 0 0 0 0 0 0Achnanthidium minutissimum 14 24 9 18 8 13 25Amphora inariensis 3 0 0 0 2 1 0Amphora ovalis var. pediculus 20 13 10 18 13 10 12Amphora ovalis var. affinis 4 5 3 8 3 2 0Amphora thumensis 0 0 0 0 0 0 0Aneumastus tusculus 0 0 0 0 0 0 0Aulacoseira ambigua 70 62 48 60 87 71 48Aulacoseira distans 10 3 5 7 5 7 0Bracysira zellensis 0 0 0 0 0 1 0Caloneis silicula 2 0 0 3 0 3 0

Appendix B. Baker Lake raw counts and summary data
Diatom raw counts for each interval in the Baker Lake record. Column headings refer to years AD. Where age of sediment interval is unavailable, depth down core (cm) is provided. 150
Year (AD) 1960 1952 1951 1950 1938 1913 1883Cavinula cocconeiformis 0 4 0 0 0 0 2Cavinula jaernefeltii 0 7 3 0 0 2 4Cocconeis placentula var. euglypta 6 6 11 5 4 8 5Cocconeis placentula var. placentula 0 0 0 2 1 2 0Craticula ambigua 0 0 0 0 0 1 0Cyclostephanos invis 0 0 0 0 0 0 0Cyclotella bodanica 6 8 1 0 5 0 7Cyclotella bodanica var. affinis 0 0 0 0 4 7 2Cyclotella ocellata 0 3 0 0 0 0 0Cyclotella rossi 13 5 4 7 7 8 0Cyclotella stelligera 10 16 5 11 10 3 12Cyclotella tripartita 3 10 0 0 0 0 12Cymbella arctica 0 0 0 0 0 4 0Cymbella descripta 1 0 0 0 0 0 0Cymbella gaeumanni 3 2 4 1 2 1 3Cymbella naviculiformis 6 2 3 1 2 7 3Cymbella pusilla 6 2 1 4 1 2 1Denticula kuetzingii 0 0 0 0 0 0 0Diatoma tenue 3 17 11 3 0 3 7Diatoma tenue var. elonga 9 0 2 5 2 1 0Didymosphaenia geminata 0 0 0 0 0 2 0Diploneis boldtiana 0 0 0 0 0 2 0Diploneis marginestriata 4 1 2 2 1 2 0Diploneis oblongella 0 0 3 0 0 0 0Diploneis parma 0 0 2 0 5 2 1Diploneis smithi var. dilatata 0 0 0 0 0 2 0Encyonema minuta 10 8 12 4 7 3 19Encyonema silesiacum 21 19 22 12 20 6 15Eucocconeis flexella 2 0 0 4 0 0 0Eunotia arcus 0 0 0 5 0 0 1Eunotia bidens 0 0 0 0 0 0 2Eunotia exigua 0 0 2 4 0 0 0

Appendix B. Baker Lake raw counts and summary data
Diatom raw counts for each interval in the Baker Lake record. Column headings refer to years AD. Where age of sediment interval is unavailable, depth down core (cm) is provided. 151
Year (AD) 1960 1952 1951 1950 1938 1913 1883Eunotia rhomboidea 0 0 0 0 0 0 0Eunotia veneris 0 0 0 0 3 0 0Fragilaria brevistriata 34 32 38 22 12 14 35Fragilaria capucina 30 17 13 15 16 7 14Fragilaria construens var. pumilla 0 0 0 0 0 0 0Fragilaria lata 4 0 2 0 0 0 0Fragilaria neoproducta 3 12 5 0 2 0 8Fragilaria pulchilla var. lanceolata 0 0 0 0 0 0 0Fragilariforma virescens 14 8 4 7 9 3 12Frustulia rhomboides 0 0 0 0 0 0 0Frustulia saxonica 1 0 2 0 2 2 0Gomphonema angustum 0 2 6 0 1 2 3Gomphonema gracile 2 0 6 0 0 5 0Gomphonema olivaceum 6 3 0 0 3 0 5Gomphonema parvulum 0 2 0 0 2 0 2Gomphonema subtile 0 0 0 0 0 0 0Gyrosigma acuminatum 5 2 5 2 0 0 0Karayevia clevei 14 15 0 2 2 10 7Kobayasia jaagii 0 0 0 0 0 2 0Mastologia smithii 0 0 0 0 3 0 0Navicula absoluta 0 0 3 5 2 0 0Navicula agrestis 0 0 0 4 0 0 0Navicula bryophila 0 0 0 0 0 0 0Navicula cari 0 0 0 0 4 0 0Navicula crytocephala 8 0 0 3 0 0 0Navicula cyrototenella 7 2 2 2 0 4 0Navicula digitulus 0 2 0 0 0 0 2Navicula disjuncta 0 2 0 0 0 0 1Navicula expecta 0 11 0 0 0 0 10Navicula gerloffi 0 2 0 0 0 0 2Navicula indifferens 0 3 0 0 1 0 2Navicula leptostriata 14 8 9 8 10 10 0

Appendix B. Baker Lake raw counts and summary data
Diatom raw counts for each interval in the Baker Lake record. Column headings refer to years AD. Where age of sediment interval is unavailable, depth down core (cm) is provided. 152
Year (AD) 1960 1952 1951 1950 1938 1913 1883Navicula menisculus 0 0 4 0 0 0 0Navicula minima 0 0 0 0 2 0 0Navicula notha 0 0 5 0 0 0 0Navicula pseudoanglica 0 0 0 0 0 0 0Navicula pseudoscutiformis 0 1 0 0 0 2 2Navicula pseudoventralis 0 0 0 0 0 1 0Navicula radiosa 0 4 0 0 0 0 2Navicula salinarum 0 0 2 0 0 4 0Navicula schadei 0 2 0 0 3 0 4Navicula schmassmannii 7 12 8 13 11 9 9Navicula seminulum var. hustedtii 2 0 0 0 0 3 0Navicula soehresis 0 0 0 0 0 0 0Navicula submuralis 0 0 0 0 0 0 0Navicula trivialis 0 0 0 0 0 0 0Navicula veneta 0 1 0 0 0 0 3Navicula vitabunda 5 7 0 0 2 0 6Nedium ampliatum 0 2 2 0 0 0 0Nedium iridis 0 0 0 0 0 0 0Nitzchia amphibia 7 10 10 8 2 5 8Nitzschia bacilium 0 0 0 0 0 6 0NItzschia capitelatta 0 0 0 0 0 0 0Nitzschia constricta 2 5 0 0 0 0 2Nitzschia dissipata 8 0 0 4 0 0 0Nitzschia fonticola 0 0 0 0 0 0 0Nitzschia frustulum 2 0 0 4 5 5 0Nitzschia gracillis 0 0 0 2 0 0 0Nitzschia liebethruthii 6 0 8 9 0 4 0Nitzschia palea 10 0 25 14 4 10 1Nitzschia perminuta 34 13 17 29 11 11 16Nitzschia recta 13 0 14 15 0 11 0Nitzschia tubicole 0 10 0 0 3 0 7Pinnularia biceps 0 0 0 0 0 0 0

Appendix B. Baker Lake raw counts and summary data
Diatom raw counts for each interval in the Baker Lake record. Column headings refer to years AD. Where age of sediment interval is unavailable, depth down core (cm) is provided. 153
Year (AD) 1960 1952 1951 1950 1938 1913 1883Pinnularia major 0 0 0 0 0 0 0Pinnularia mesolepta 2 0 3 0 2 4 0Pinnularia microstauron 2 0 2 0 0 0 0Pinnularia nodosa 0 6 0 0 0 0 5Pinnularia pluviana 0 0 0 0 0 0 0Pinnularia radiosa 0 0 0 0 0 0 0Pinnularia rhombica 0 0 0 0 0 0 0Pinnularia rupestris 0 0 0 0 0 0 0Pinnularia silvatica 0 6 0 3 4 0 8Planothidium calcar 2 0 0 0 0 0 0Planothidium oestrupii 3 7 1 2 2 0 4Psammothidium altaica 5 10 5 7 4 6 12Psammothidium marginulatum 0 5 2 0 0 1 4Psammothidium subatomoides 3 6 4 1 12 0 4Pseudostarosirella pseudoconstruens 8 13 10 4 7 10 0Rossithidium pusillum 7 14 12 18 18 23 15Sellaphora bacilium 0 0 2 0 2 0 0Sellaphora pupula 2 0 0 0 0 3 0Sellaphora seminulum 0 0 0 0 0 0 0Stauroneis anceps 2 0 0 0 0 0 2Stauroneis construens var. venter 5 0 2 0 2 0 0Stauroneis neohyalina 0 3 0 0 0 0 4Stauroneis smithii 3 0 2 1 2 0 0Staurosira leptostauron var. dubia 0 0 0 0 0 0 0Staurosirella pinnata 12 15 11 5 20 24 18Staurosirella pinnata var. intercedens 0 3 0 0 0 2 0Stephanodiscus alpina 4 0 3 1 2 0 0Stephanodiscus niagarae 0 0 0 0 0 0 0Surirella angusta 1 3 2 0 2 2 4Surirella biseriata var.. bifrons 0 0 0 0 0 0 1Surirella brebissoni 0 0 0 0 0 0 0Surirella linearis 5 0 0 3 0 0 0

Appendix B. Baker Lake raw counts and summary data
Diatom raw counts for each interval in the Baker Lake record. Column headings refer to years AD. Where age of sediment interval is unavailable, depth down core (cm) is provided. 154
Year (AD) 1960 1952 1951 1950 1938 1913 1883Surirella minuta 2 0 0 1 0 0 0Surirella ovalis 2 0 3 4 6 1 0Surirella striatula 0 1 1 0 0 0 0Synedra berolinensis 0 0 4 2 2 1 1Synedra famelica 0 0 0 6 5 9 0Synedra tenera 7 2 5 3 0 2 0Tabellaria fenestrata 0 2 0 0 0 0 0Tabellaria flocculosa 23 16 30 19 40 29 15

Appendix B. Baker Lake raw counts and summary data
Diatom raw counts for each interval in the Baker Lake record. Column headings refer to years AD. Where age of sediment interval is unavailable, depth down core (cm) is provided. 155
Year (AD) N/A N/A N/A N/A N/A N/A N/ADepth down core (cm) 13.5 14.5 15.5 16.5 17.5 18 18.5Total valves counted 436 414 500 532 555 533 502Diatom concentration (valves/cm3) 6.29E+09 6.17E+09 6.25E+10 7.48E+09 7.39E+09 8.06E+09 9.92E+09Diatom-inferred pH 7.11 6.98 7.16 7.17 7.16 7.12 7.29Hill's N2 Diversity Index 44.32 38.51 45.99 40.73 42.72 43.54 41.57Species Achnanthes biasolettiana var. subatomus 0 4 0 0 0 0 0Achnanthes bicapitata 0 0 0 0 0 0 0Achnanthes carissima 2 0 0 0 0 0 0Achnanthes chlidanos 4 3 10 7 7 7 0Achnanthes curtissima 3 3 5 6 3 5 3Achnanthes gracillima 12 4 4 4 10 13 3Achnanthes imperfecta 0 0 0 0 0 0 0Achnanthes implexiformis 0 0 4 0 0 0 0Achnanthes lanceolata 1 2 4 2 0 0 0Achnanthes laterostrata 4 0 17 5 10 8 11Achnanthes nitidiformis 6 0 0 2 0 14 9Achnanthes rivulaire 5 2 7 8 5 5 2Achnanthes rosenstockii 0 0 2 0 0 1 0Achnanthes suchlandtii 9 7 12 19 19 5 9Achnanthes ventralis 0 2 0 0 0 5 2Achnanthes ziegleri 0 0 0 0 0 0 0Achnanthidium minutissimum 23 13 14 31 30 15 40Amphora inariensis 3 1 2 0 0 2 1Amphora ovalis var. pediculus 16 10 13 7 4 3 26Amphora ovalis var. affinis 4 2 1 1 4 0 3Amphora thumensis 0 0 0 0 0 0 0Aneumastus tusculus 0 0 0 0 0 0 0Aulacoseira ambigua 69 90 50 63 91 75 58Aulacoseira distans 4 16 3 12 7 13 5Bracysira zellensis 0 5 0 0 0 0 0Caloneis silicula 0 0 0 3 0 0 0

Appendix B. Baker Lake raw counts and summary data
Diatom raw counts for each interval in the Baker Lake record. Column headings refer to years AD. Where age of sediment interval is unavailable, depth down core (cm) is provided. 156
Depth (cm) 13.5 14.5 15.5 16.5 17.5 18 18.5Cavinula cocconeiformis 0 0 0 3 4 0 4Cavinula jaernefeltii 7 0 2 0 0 0 0Cocconeis placentula var. euglypta 6 2 8 10 7 6 6Cocconeis placentula var. placentula 0 0 3 6 0 0 0Craticula ambigua 0 0 0 0 0 0 0Cyclostephanos invis 0 0 0 0 2 0 0Cyclotella bodanica 3 0 8 0 2 3 1Cyclotella bodanica var. affinis 0 0 2 0 3 2 10Cyclotella ocellata 0 0 0 0 0 0 0Cyclotella rossi 8 9 5 6 10 6 7Cyclotella stelligera 5 4 3 6 4 18 3Cyclotella tripartita 0 0 5 0 0 2 0Cymbella arctica 0 0 0 0 0 0 0Cymbella descripta 0 0 0 0 0 0 0Cymbella gaeumanni 2 1 2 1 1 2 1Cymbella naviculiformis 2 0 0 4 1 2 6Cymbella pusilla 1 5 1 2 0 0 2Denticula kuetzingii 0 0 0 0 0 0 0Diatoma tenue 4 2 4 9 2 18 2Diatoma tenue var. elonga 2 6 0 0 12 0 4Didymosphaenia geminata 0 0 0 0 0 0 0Diploneis boldtiana 5 0 0 1 0 0 2Diploneis marginestriata 0 0 0 0 0 0 0Diploneis oblongella 0 0 0 6 2 0 2Diploneis parma 2 6 2 0 0 8 0Diploneis smithi var. dilatata 0 0 0 0 0 0 0Encyonema minuta 7 4 16 11 6 11 10Encyonema silesiacum 13 15 13 14 12 17 9Eucocconeis flexella 0 1 0 0 0 0 0Eunotia arcus 0 0 3 2 0 0 0Eunotia bidens 0 0 2 0 0 0 0Eunotia exigua 0 0 0 0 0 0 0

Appendix B. Baker Lake raw counts and summary data
Diatom raw counts for each interval in the Baker Lake record. Column headings refer to years AD. Where age of sediment interval is unavailable, depth down core (cm) is provided. 157
Depth (cm) 13.5 14.5 15.5 16.5 17.5 18 18.5Eunotia rhomboidea 0 0 0 0 0 0 0Eunotia veneris 0 0 0 0 0 0 0Fragilaria brevistriata 10 14 37 26 31 14 14Fragilaria capucina 12 5 11 31 22 24 13Fragilaria construens var. pumilla 0 2 0 0 0 0 0Fragilaria lata 0 0 0 0 0 0 0Fragilaria neoproducta 0 0 2 0 0 8 0Fragilaria pulchilla var. lanceolata 0 0 0 0 0 0 0Fragilariforma virescens 0 0 0 12 9 7 5Frustulia rhomboides 0 0 0 0 0 0 0Frustulia saxonica 0 0 0 0 0 2 0Gomphonema angustum 7 4 4 2 3 2 2Gomphonema gracile 3 2 0 0 0 0 2Gomphonema olivaceum 0 0 6 4 2 8 8Gomphonema parvulum 0 0 0 0 0 0 0Gomphonema subtile 0 0 0 0 0 0 0Gyrosigma acuminatum 3 2 0 3 0 2 0Karayevia clevei 4 8 4 2 13 2 12Kobayasia jaagii 0 0 0 0 0 0 0Mastologia smithii 0 0 0 0 0 0 0Navicula absoluta 13 1 0 0 0 0 4Navicula agrestis 3 2 0 0 0 2 3Navicula bryophila 0 0 0 0 0 0 0Navicula cari 0 2 0 0 0 0 0Navicula crytocephala 0 0 0 0 0 0 0Navicula cyrototenella 0 7 0 7 0 0 0Navicula digitulus 2 0 2 3 3 4 4Navicula disjuncta 0 2 0 0 0 0 0Navicula expecta 0 0 2 0 2 6 0Navicula gerloffi 0 0 0 3 0 0 0Navicula indifferens 0 0 2 0 0 0 0Navicula leptostriata 8 2 2 0 0 0 4

Appendix B. Baker Lake raw counts and summary data
Diatom raw counts for each interval in the Baker Lake record. Column headings refer to years AD. Where age of sediment interval is unavailable, depth down core (cm) is provided. 158
Depth (cm) 13.5 14.5 15.5 16.5 17.5 18 18.5Navicula menisculus 0 0 0 0 0 0 0Navicula minima 0 0 0 0 0 0 0Navicula notha 0 0 0 0 0 0 0Navicula pseudoanglica 2 0 0 0 0 0 0Navicula pseudoscutiformis 2 0 4 0 0 2 0Navicula pseudoventralis 3 0 0 6 9 0 2Navicula radiosa 0 0 1 0 0 4 0Navicula salinarum 1 0 0 0 0 0 0Navicula schadei 0 0 4 1 3 2 0Navicula schmassmannii 10 8 8 15 10 10 5Navicula seminulum var. hustedtii 0 0 0 0 0 0 0Navicula soehresis 0 0 0 2 0 0 0Navicula submuralis 0 0 0 0 0 0 0Navicula trivialis 0 0 0 1 4 0 0Navicula veneta 0 0 8 0 0 0 0Navicula vitabunda 0 0 8 0 0 0 0Nedium ampliatum 0 0 0 0 0 1 6Nedium iridis 0 0 0 0 0 1 2Nitzchia amphibia 6 5 0 13 0 10 4Nitzschia bacilium 0 0 0 0 6 0 0NItzschia capitelatta 0 0 0 0 0 0 0Nitzschia constricta 2 0 4 0 0 0 0Nitzschia dissipata 0 0 0 0 0 0 0Nitzschia fonticola 0 0 0 3 0 0 0Nitzschia frustulum 1 0 0 0 2 4 0Nitzschia gracillis 0 0 0 7 0 0 0Nitzschia liebethruthii 0 2 0 0 4 0 3Nitzschia palea 8 15 2 0 6 0 6Nitzschia perminuta 7 8 27 13 8 10 16Nitzschia recta 7 5 0 0 3 0 0Nitzschia tubicole 0 0 8 7 5 0 0Pinnularia biceps 0 0 0 0 1 0 0
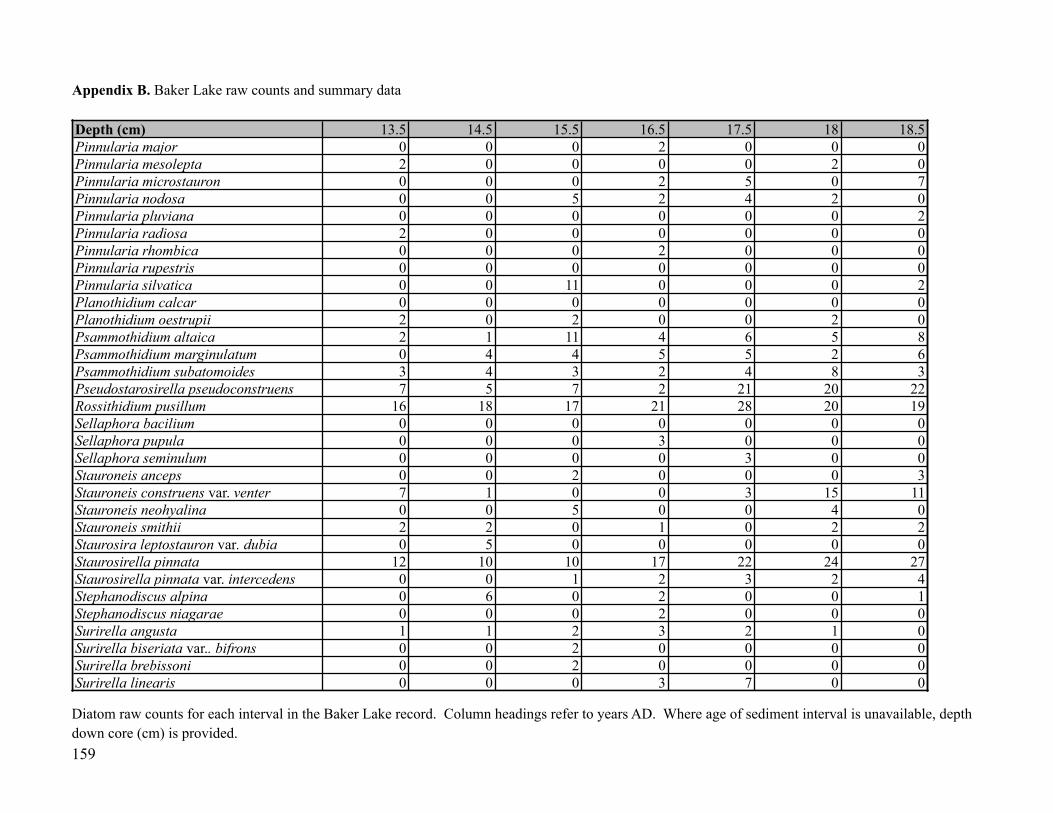
Appendix B. Baker Lake raw counts and summary data
Diatom raw counts for each interval in the Baker Lake record. Column headings refer to years AD. Where age of sediment interval is unavailable, depth down core (cm) is provided. 159
Depth (cm) 13.5 14.5 15.5 16.5 17.5 18 18.5Pinnularia major 0 0 0 2 0 0 0Pinnularia mesolepta 2 0 0 0 0 2 0Pinnularia microstauron 0 0 0 2 5 0 7Pinnularia nodosa 0 0 5 2 4 2 0Pinnularia pluviana 0 0 0 0 0 0 2Pinnularia radiosa 2 0 0 0 0 0 0Pinnularia rhombica 0 0 0 2 0 0 0Pinnularia rupestris 0 0 0 0 0 0 0Pinnularia silvatica 0 0 11 0 0 0 2Planothidium calcar 0 0 0 0 0 0 0Planothidium oestrupii 2 0 2 0 0 2 0Psammothidium altaica 2 1 11 4 6 5 8Psammothidium marginulatum 0 4 4 5 5 2 6Psammothidium subatomoides 3 4 3 2 4 8 3Pseudostarosirella pseudoconstruens 7 5 7 2 21 20 22Rossithidium pusillum 16 18 17 21 28 20 19Sellaphora bacilium 0 0 0 0 0 0 0Sellaphora pupula 0 0 0 3 0 0 0Sellaphora seminulum 0 0 0 0 3 0 0Stauroneis anceps 0 0 2 0 0 0 3Stauroneis construens var. venter 7 1 0 0 3 15 11Stauroneis neohyalina 0 0 5 0 0 4 0Stauroneis smithii 2 2 0 1 0 2 2Staurosira leptostauron var. dubia 0 5 0 0 0 0 0Staurosirella pinnata 12 10 10 17 22 24 27Staurosirella pinnata var. intercedens 0 0 1 2 3 2 4Stephanodiscus alpina 0 6 0 2 0 0 1Stephanodiscus niagarae 0 0 0 2 0 0 0Surirella angusta 1 1 2 3 2 1 0Surirella biseriata var.. bifrons 0 0 2 0 0 0 0Surirella brebissoni 0 0 2 0 0 0 0Surirella linearis 0 0 0 3 7 0 0

Appendix B. Baker Lake raw counts and summary data
Diatom raw counts for each interval in the Baker Lake record. Column headings refer to years AD. Where age of sediment interval is unavailable, depth down core (cm) is provided. 160
Depth (cm) 13.5 14.5 15.5 16.5 17.5 18 18.5Surirella minuta 0 0 0 0 0 0 0Surirella ovalis 3 2 1 0 1 3 0Surirella striatula 0 0 0 0 0 0 0Synedra berolinensis 4 6 5 2 5 4 1Synedra famelica 9 16 7 5 2 0 8Synedra tenera 3 5 0 4 5 0 3Tabellaria fenestrata 0 0 0 0 0 0 0Tabellaria flocculosa 15 13 30 34 25 22 17

Appendix B. Baker Lake raw counts and summary data
Diatom raw counts for each interval in the Baker Lake record. Column headings refer to years AD. Where age of sediment interval is unavailable, depth down core (cm) is provided. 161
Year (AD) N/A N/ADepth down core (cm) 19 20Total valves counted 560 519Diatom concentration (valves/cm3) 5.95E+09 6.89E+09Diatom-inferred pH 7.28 7.19Hill's N2 Diversity Index 39.13 36.4Species Achnanthes biasolettiana var. subatomus 0 0Achnanthes bicapitata 0 0Achnanthes carissima 0 0Achnanthes chlidanos 15 4Achnanthes curtissima 3 8Achnanthes gracillima 2 4Achnanthes imperfecta 0 0Achnanthes implexiformis 0 0Achnanthes lanceolata 1 0Achnanthes laterostrata 6 6Achnanthes nitidiformis 0 0Achnanthes rivulaire 5 2Achnanthes rosenstockii 2 0Achnanthes suchlandtii 10 17Achnanthes ventralis 14 3Achnanthes ziegleri 0 0Achnanthidium minutissimum 24 18Amphora inariensis 3 2Amphora ovalis var. pediculus 0 0Amphora ovalis var. affinis 0 0Amphora thumensis 0 0Aneumastus tusculus 0 0Aulacoseira ambigua 70 88Aulacoseira distans 4 6Bracysira zellensis 0 0Caloneis silicula 0 0

Appendix B. Baker Lake raw counts and summary data
Diatom raw counts for each interval in the Baker Lake record. Column headings refer to years AD. Where age of sediment interval is unavailable, depth down core (cm) is provided. 162
Depth (cm) 19 20Cavinula cocconeiformis 0 0Cavinula jaernefeltii 0 0Cocconeis placentula var. euglypta 7 8Cocconeis placentula var. placentula 0 0Craticula ambigua 0 0Cyclostephanos invis 0 0Cyclotella bodanica 3 5Cyclotella bodanica var. affinis 2 0Cyclotella ocellata 0 0Cyclotella rossi 5 7Cyclotella stelligera 20 3Cyclotella tripartita 10 4Cymbella arctica 0 0Cymbella descripta 0 4Cymbella gaeumanni 2 0Cymbella naviculiformis 7 2Cymbella pusilla 2 1Denticula kuetzingii 0 2Diatoma tenue 7 5Diatoma tenue var. elonga 0 0Didymosphaenia geminata 0 0Diploneis boldtiana 0 0Diploneis marginestriata 0 0Diploneis oblongella 0 0Diploneis parma 5 5Diploneis smithi var. dilatata 0 0Encyonema minuta 7 9Encyonema silesiacum 31 29Eucocconeis flexella 0 0Eunotia arcus 2 2Eunotia bidens 0 0Eunotia exigua 0 0

Appendix B. Baker Lake raw counts and summary data
Diatom raw counts for each interval in the Baker Lake record. Column headings refer to years AD. Where age of sediment interval is unavailable, depth down core (cm) is provided. 163
Depth (cm) 19 20Eunotia rhomboidea 0 0Eunotia veneris 0 0Fragilaria brevistriata 23 27Fragilaria capucina 12 17Fragilaria construens var. pumilla 0 4Fragilaria lata 0 0Fragilaria neoproducta 15 4Fragilaria pulchilla var. lanceolata 0 0Fragilariforma virescens 7 6Frustulia rhomboides 0 0Frustulia saxonica 0 0Gomphonema angustum 2 2Gomphonema gracile 0 0Gomphonema olivaceum 4 0Gomphonema parvulum 0 2Gomphonema subtile 0 0Gyrosigma acuminatum 6 8Karayevia clevei 2 4Kobayasia jaagii 0 0Mastologia smithii 0 0Navicula absoluta 0 0Navicula agrestis 1 4Navicula bryophila 0 0Navicula cari 0 0Navicula crytocephala 0 0Navicula cyrototenella 0 0Navicula digitulus 0 0Navicula disjuncta 0 0Navicula expecta 4 18Navicula gerloffi 0 0Navicula indifferens 0 0Navicula leptostriata 0 2

Appendix B. Baker Lake raw counts and summary data
Diatom raw counts for each interval in the Baker Lake record. Column headings refer to years AD. Where age of sediment interval is unavailable, depth down core (cm) is provided. 164
Depth (cm) 19 20Navicula menisculus 0 0Navicula minima 0 0Navicula notha 0 0Navicula pseudoanglica 0 0Navicula pseudoscutiformis 0 0Navicula pseudoventralis 0 0Navicula radiosa 0 0Navicula salinarum 0 2Navicula schadei 5 2Navicula schmassmannii 9 4Navicula seminulum var. hustedtii 0 0Navicula soehresis 0 0Navicula submuralis 0 0Navicula trivialis 0 0Navicula veneta 0 0Navicula vitabunda 0 0Nedium ampliatum 5 4Nedium iridis 2 3Nitzchia amphibia 4 4Nitzschia bacilium 0 0NItzschia capitelatta 0 0Nitzschia constricta 8 0Nitzschia dissipata 0 4Nitzschia fonticola 0 0Nitzschia frustulum 10 0Nitzschia gracillis 0 0Nitzschia liebethruthii 0 0Nitzschia palea 0 0Nitzschia perminuta 19 21Nitzschia recta 0 0Nitzschia tubicole 0 0Pinnularia biceps 0 0

Appendix B. Baker Lake raw counts and summary data
Diatom raw counts for each interval in the Baker Lake record. Column headings refer to years AD. Where age of sediment interval is unavailable, depth down core (cm) is provided. 165
Depth (cm) 19 20Pinnularia major 0 0Pinnularia mesolepta 0 2Pinnularia microstauron 0 0Pinnularia nodosa 0 0Pinnularia pluviana 0 2Pinnularia radiosa 0 0Pinnularia rhombica 0 0Pinnularia rupestris 0 0Pinnularia silvatica 4 4Planothidium calcar 0 0Planothidium oestrupii 2 1Psammothidium altaica 2 9Psammothidium marginulatum 3 5Psammothidium subatomoides 8 4Pseudostarosirella pseudoconstruens 24 8Rossithidium pusillum 23 14Sellaphora bacilium 0 0Sellaphora pupula 0 0Sellaphora seminulum 0 0Stauroneis anceps 0 0Stauroneis construens var. venter 9 12Stauroneis neohyalina 4 0Stauroneis smithii 0 4Staurosira leptostauron var. dubia 0 0Staurosirella pinnata 33 30Staurosirella pinnata var. intercedens 2 4Stephanodiscus alpina 0 0Stephanodiscus niagarae 0 0Surirella angusta 2 1Surirella biseriata var.. bifrons 1 2Surirella brebissoni 0 0Surirella linearis 0 0

Appendix B. Baker Lake raw counts and summary data
Diatom raw counts for each interval in the Baker Lake record. Column headings refer to years AD. Where age of sediment interval is unavailable, depth down core (cm) is provided. 166
Depth (cm) 19 20Surirella minuta 0 0Surirella ovalis 3 5Surirella striatula 0 0Synedra berolinensis 3 7Synedra famelica 0 0Synedra tenera 0 0Tabellaria fenestrata 1 1Tabellaria flocculosa 29 13

Appendix C. Updates to diatom taxonomy
List of diatom taxonomic names that are currently in use and their common synonyms (previously used names)
167
Current taxon name SynonymAchnanthes biasolettianaAchnanthes bicapitataAchnanthes carissimaAchnanthes chlidanosAchnanthes curtissimaAchnanthes gracillimaAchnanthes imperfectaAchnanthes implexiformisAchnanthes nitidiformisAchnanthes rivulaireAchnanthes rosenstockiiAchnanthes suchlandtiiAchnanthes ventralis Navicula ventralisAchnanthes ventralisAchnanthes ziegleriAchnanthidium minutissimum Achnanthes minutissimaAmphora inariensisAmphora ovalis Amphora libycaAmphora ovalis var. pediculus Amphora pedicilusAmphora ovalis var. affinisAmphora thumensisAneumastus tuscala Navicula tuscalaAulacoseira ambigua Melosira ambiguaAulacoseira distans Melosira distansAulacoseira lirataBrachysira brebissonii Anomoeneis serians var. brachysiraBrachysira styriaca Anomoeneis styriacaBrachysira vitrea Anomoeneis vitreaBrachysira zellensis Anomoeneis zellensisCaloneis silicula var. minuta Caloneis siliculaCaloneis westiiCavinula cocconeiformis Navicula cocconeiformisCavinula jaernefeltii Navicula jaernefeltiiCavinula pseudoscutiformis Navicula pseudoscutiformisCocconeis placentulaCocconeis placentula var. euglyptaCocconeis placentula var. placentulaCraticula ambigua Navicula ambiguaCraticula cuspidata Navicula cuspidataCyclostephanos invisitatus Stephanodiscus invisitatus

Appendix C. Updates to diatom taxonomy
List of diatom taxonomic names that are currently in use and their common synonyms (previously used names)
168
Current taxon name SynonymCyclotella bodanicaCyclotella bodanica var. affinsCyclotella michiganianaCyclotella ocellataCyclotella rossiCyclotella stelligeraCyclotella tripartitaCymbella angustataCymbella arcticaCymbella delicatulaCymbella descriptaCymbella diluviana Navicula diluvianaCymbella gaeumanniCymbella inaequalis Cymbella ehrenbergiiCymbella incertaCymbella laevisCymbella microcephalaCymbella minuta var. latensCymbella naviculiformisCymbella proximaCymbella pusillaCymbella subcuspidataCymbella tumidulaDenticula elegansDenticula kuetzingiiDiadesmis perpusillaDiatom mesodenDiatoma tenueDiatoma tenue var. elongaDidymosphaenia geminataDiploneis boldtianaDiploneis marginestriataDiploneis oblongellaDiploneis oculataDiploneis parmaDiploneis smithi var. dilatataEncyonema minuta Cymbella minutaEncyonema muelleri Cymbella muelleriEncyonema silesiaca Cymbella silesiacaEncyonopsis cesatii Cymbella cesatii

Appendix C. Updates to diatom taxonomy
List of diatom taxonomic names that are currently in use and their common synonyms (previously used names)
169
Current taxon name SynonymEpithemia frickiiEucocconeis flexella Achnanthes flexellaEunotia arcusEunotia bidensEunotia exigua Eunotia paludosaEunotia praerupta Eunotia praerupta curtaEunotia rhomboideaEunotia venerisFragilaria brevistriataFragilaria capucinaFragilaria construens var. pumillaFragilaria lataFragilaria neoproductaFragilaria oldenburgiaFragilaria pulchilla var. lanceolataFragilariforma virescensFrustulia rhomboidesFrustulia saxonica Frustula rhomboides var. saxonicaGomphonema angustatumGomphonema angustumGomphonema gracileGomphonema olivaceumGomphonema parvulumGomphonema subtileGyrosigma acuminatumHantzchia amphioxysKarayevia clevei Achnanthes cleveiKarayevia laterostrata Achnanthes laterostrataKobayasia jaagii Navicula jaagiiMastologia smithiiNavicula absolutaNavicula agrestisNavicula bryophilaNavicula cariNavicula cryptotenella Navicula radiosa var. tenellaNavicula digitulusNavicula disjunctaNavicula expectaNavicula explanataNavicula gerloffi

Appendix C. Updates to diatom taxonomy
List of diatom taxonomic names that are currently in use and their common synonyms (previously used names)
170
Current taxon name SynonymNavicula indifferensNavicula leptostriataNavicula menisculusNavicula micropupulaNavicula minimaNavicula nothaNavicula oblongaNavicula pseudoanglicaNavicula pseudoventralisNavicula radiosaNavicula salinarumNavicula schadeiNavicula schmassmanniiNavicula soehrensis Navicula sp. 1Navicula stroemiiNavicula submuralisNavicula trivialisNavicula venetaNavicula viridulaNavicula vulpinaNeidium affine Neidium affine genuinaNeidium ampliatum Neidium iridis var. ampliatumNitzchia amphibiaNitzschia baciliumNItzschia capitelattaNitzschia constrictaNitzschia dissipataNitzschia fonticolaNitzschia frustulumNitzschia gracillisNitzschia liebethruthiiNitzschia paleaNitzschia perminutaNitzschia rectaPalnothidium lanceolatum Achnanthes lanceolataPinnularia biceps Pinnularia interrupta var. bicepsPinnularia major Navicula majorPinnularia mesolepta Navicula mesoleptaPinnularia microstauron

Appendix C. Updates to diatom taxonomy
List of diatom taxonomic names that are currently in use and their common synonyms (previously used names)
171
Current taxon name SynonymPinnularia nodosaPinnularia pluvianaPinnularia radiosaPinnularia rhombicaPinnularia rupestrisPlanothidium calcar Achnanthes calcarPlanothidium oestrupii Achnanthes oestrupiiPsammothidium altaica Achnanthes altaicaPsammothidium marginulatum Achnanthes marginulataPsammothidium subatomoides Achnanthes subatomoidesPseudostarosirella pseudoconstruens Fragilaria pseudoconstruensRhopalodia gibbaRossithidium pussilum Achnanthes pusillaSellaphora bacilium Navicula baciliumSellaphora laevissima Navicula laevissimaSellaphora pupula Navicula pupulaSellaphora pupula var. subcapitata Navicula pupula var. subcaptitataSellaphora seminulum Navicula seminulumSellaphora seminulum Navicula seminulumSellaphora vitabunda Navicula vitabundaStauroneis ancepsStauroneis neohyalinaStauroneis phoenicenteronStauroneis smithiiStaurosira construens Fragialria construensStaurosira construens var. venter Fragilaria construens var. venterStaurosira construens var. venter long Fragilaria construens var. venter longStaurosirella leptostauron Fragilaria lepostauronStaurosirella pinnata Fragilaria pinnataStaurosirella pinnata var. intercedens Fragilaria pinnata var. intercedensStephanodiscus alpinaStephanodiscus niagaraeSurirella angustaSurirella angustaSurirella biseriata var. bifrons Surirella bifronsSurirella brebissoniSurirella linearisSurirella minutaSurirella ovalisSurirella striatula

Appendix C. Updates to diatom taxonomy
List of diatom taxonomic names that are currently in use and their common synonyms (previously used names)
172
Current taxon name SynonymSynedra berolinensis Fragilaria berolinensisSynedra famelica Fragilaria famelicaSynedra tenera Fragilaria teneraTabellaria fenestrata Striatella fenestrata

! 173
Appendix D Diatom Concentration Diatom concentration (valves/g) (X) = !"#!$%!!"#$%&' ! !!"#!!"!!"#$#%&'!!"#$%&! !" ! !"#!!"!!"#$%!!"#$$%! !" ! !"#$%&'()!!"#!! !!!!"#!!"!!"#!!"!!"#$%!!"#$$% !" ! !"#!!"!#$$#%!!"#!!!"#$! !" ! !!!!!"#$%&' ! !!!"#$! ! !!!"#$%!
Volume of sediment in final slurry = Z T counted = # of transects counted T width = transect width (mm) T length = transect length (mm) X =
!!!"!!"#!$%!!"#$%&'!!"!!"#$%!"!#$!!!!"#!$%!!"!!"#$%&! =
!"#$%&!!"!!"#$%"&'!!"#$%&!'!!"!!"#$%!"!#$!!"#$%&!!"!!"#$%"&'!!"!!"#$%&!
X(valves) = !!!"#!$%!!"#$%&'!!"#$%&!!"!!"#$%"&'!!"#$"%&!!"#!!!!"!
!"#$%&!!"!!"#$%"&'!!"#$%&!'!!"!!!!!!"#$%! !"
Y Y = concentration of final slurry !"!!"#
!"!!"#$% * vol pipetted onto slip (mL) * !"#!!!"#$%&'!!!!!!!"!#$!!"#!!!"!!"#$!!!!!!
Z Z = !"#$%&!!"!!"#$%"&'!!"!!"#$$%!!!"!!"#!!"#$%&!!"!!"#$$%!!!"!!"#$%! ! !"#$#%&'!!"#$%&!!"!!"#$%"&'!!"#$!!!"!!"#$%&!!"!!!!!!"!
Diatom concentration (valves/cc) = !!"#$%&!!"#!$#%&'%("#!!"#!$%!!!"#$!!"#$%&'!!!!!!!

a) b)
c) d) e)
g) h) i)f)
Plate 1. Fragilaria and Cymbella diluviana X 1500a) Staurosira construens var. venterb) Staurosira construens var. venter longc) Pseudostaurosirella pseudoconstruensd) Fragilaria leptostaurone) Staurosirella pinnata var. intercedensf-i) Cymbella diluviana

j) k) l) m)
Plate 2: large benthic species X 1500j) Navicula viridulak) Navicula auroral) Stauroneis phoenicenteronm) cf. Pinnularia microstauron

n) o) p) q)
r) s) t) u) v)
w) x)Plate 3: Cyclotella and other abundant speciesn) Amphora libycao) Neidium ampliatump) Pinnularia microstauronq) Frustulia saxonica; r) Eunotia (girdle view)s) Eunotia praeruptat) Denticula keutzingiiu) Gomphonema subtilev) Nitzschia fonticola w) Cyclotella stelligerax) Cyclotella pseudostelligera
Copyright © 2022 FDOKUMEN