
Are the 41 kyr glacial oscillations a linear response to Milankovitch forcing?
Upload
khangminh22Category
view
0download
0
Turbomachinery Propulsion and Power
International Journal of
Article
Forcing Pulsations by Means of a Siren for GasTurbine Applications
Fabrice Giuliani 1,* , Markus Stütz 1, Nina Paulitsch 1 and Lukas Andracher 2
1 Combustion Bay One e.U., Advanced Combustion Management, 8010 Graz, Austria;[email protected] (M.S.); [email protected] (N.P.)
2 Institute of Aviation, Department of Engineering, University of Applied Sciences FH JOANNEUM GmbH,8020 Graz, Austria; [email protected]
* Correspondence: [email protected]; Tel.: +43-316-22-8980
Received: 27 February 2020 ; Accepted: 8 May 2020; Published: 13 May 2020
Abstract: A siren is a robust fast-valve that generates effective flow pulsations and powerful noiselevels under well-controlled conditions. It operates under the inlet flow conditions of a gas turbinecombustor. Its principle is based on a sonic air jet periodically sheared by a cogged wheel rotatingat a given speed. It is used as an alternative to loudspeakers in combustion laboratories when theuse of these is made difficult by aggressive flow conditions, such as hot air under pressure, possiblycontaining impurities. It is also a serious candidate as an effective flow actuator to be deployed onpower gas turbine fleets. The authors have gathered more than twenty years of knowledge on sirentechnology. This pulsator was originally developed for research on thermoacoustics. By scanningthrough a given frequency range, one detects the acoustic resonance of specific parts of the combustorassembly, or possibly triggers a combustion instability during a sensitivity analysis of a flame tosmall perturbations. In 2010, Giuliani et al. developed a novel siren model with the capacity tovary the amplitude of pulsation independently from the frequency. In this contribution, the physics,the metrics, and the resulting parameters of the pulsator are discussed. Technical solutions areunveiled about visiting large frequency ranges (currently 6 kHz) and achieving elevated pressurefluctuations (150 dB SPL proven, possibly up to 155 dB SPL) with a compact device. A multimodalexcitation is available with this technology, one idea being to dissipate the acoustic energy on nearbypeaks. The contribution ends with a summary of the applications performed so far and the perspectiveof an industrial application.
Keywords: combustion instabilities; forcing; siren; flow control; calibration
1. Introduction
This paper is about active control of combustion stability in gas turbines. In opposition tobatch-cycle internal combustion engines, continuous flow machines, such as a gas turbine, are supposedto operate a steady flow conditions at the different stations of the Joule-Brayton cycle. The turbulentflow can be described by a stochastic bandwidth of eddies and boundary layers, in which sizes go fromtypical passages length down to micro-structures according to the Kolmogorov scales, following theflow. However, if some conditions are met, the flow can turn unsteady, resulting in strong pulsations ata given frequency. The combustor is prone to provide these conditions, and the problem of combustioninstabilities has become more acute with low-emission burners operating in the lean domain.
The conditions to achieve a resonance in the flow are a resonator, a trigger, an energy source,and an arrangement favouring a coupling of all of these. Resonance is usually achieved with suddensection changes, or obstacles in the flow connected to cavities of a characteristic length or volume,so that specific frequencies are enhanced in bulk mode, or Helmholtz mode. The trigger can be the
Int. J. Turbomach. Propuls. Power 2020, 5, 9; doi:10.3390/ijtpp5020009 www.mdpi.com/journal/ijtpp

Int. J. Turbomach. Propuls. Power 2020, 5, 9 2 of 31
turbulent flow itself, for instance, a vortex detachment of von Kármán street type at a section changeor behind an obstacle. The trigger can also be the flow noise related to the rotor speed, the stator–rotorinteraction, and the passage through specific parts that resonate when excited at their eigenfrequencies.Sound waves propagate from their point source in all directions, at the vector sum of the flow speedplus the sound speed [1]. In relationship with the turbulent flow pattern, the machine’s noise isalso spread over a given bandwidth. The energy term in the case of combustion instabilities is theunsteady part of the heat input. The latter depends on mixing time scales, thermochemical timescales, and specific flame lengths scales, also resulting in a given bandwidth of combustion turbulence.Taken separately, the energy content of each unsteadiness is very low compared to the flow’s kineticenergy, overall pressure, or thermal energy. They are named small perturbation.
Combustion instabilities appear when all of these conditions happen to interact at somepoint. This involves an aero-thermo-acoustic coupling, which is one way to describe physicallythe combustion instability. Small perturbations can therefore trigger a large-amplitude fluctuationof each of these quantities, where the steady flow becomes pulsed in the combustor, where the localpressure fluctuation is such that vibrations and narrow-peak sounds are being generated, and theflame front deforms and moves periodically at the same pace possibly nearer to the walls. The sumof it all greatly impairs the performance of the machine. It also accelerates the hot core’s fatiguein a dramatic manner. It raises dramatic safety concerns. This explains why modern gas turbinecombustors are equipped with high-temperature resistant fast-pressure sensors and accelerometers sothat the combustion stability is monitored in real time. Should an instability be detected at an earlystage, the operation is tuned so that this instability disappears.
Combustion instabilities are the reason for the development of the apparatus discussed in thispaper: a siren. In the early years of space exploration, the topic was combustion instabilities in rocketengines [2]. Then, it became critical in large power gas turbines operating at elevated operation ratioand under lean conditions, a pattern which is conducive to the presence of combustion instabilities [3,4].The problem of combustion instability has been a major theme of research over the last half century, aswell as a major barrier against the introduction of lean burn technologies in aeroengines to this day [5].
Numerous investigations on the experimental side, as well as in terms of models, were conductedto make progress on the understanding of combustion instabilities [6,7], as well as on technologies toavoid or damp these when they happen (passive and active combustion control [8,9]), or to benefit fromthis coupling (pulse combustion [10]). The present paper reviews different experimental techniquesused to reproduce the flow patterns described before in a well-controlled manner. By opposition toself-resonating situations, the instability is hereby forced. The paper starts with a general overview andthen focuses on one particular technology developed by authors over the two last decades. Differentmodes of operations are described. The blow-down forcing is the most effective one, where the siren isplaced upstream from the pressurised test cell. As a comparison, an effective configuration of dischargeforcing is shown: the siren is placed downstream from the test cell or derives a part of the pressurisedair in it. The second configuration is a convenient strategy for the control of the acoustic boundariesin the combustor because it does not relies on a separate source of compressed air anymore, but itleaks periodically a part of the plenum air that can be derived further down the machine, e.g., forcooling purposes. In laboratories, the siren can be used as a calibrator for fast-pressure probes oraccelerometers. Another application is to force flow pulsation and trigger, in a well-controlled manner,thermoacoustic instabilities on research flames. In the industry, the intention is to equip gas turbinecombustors with an effective flow modulator for control purposes, which has the possibility to passthrough some critical frequencies with a zero-gain. One application is the displacement of the acousticenergy from a resonant frequency to one of its sub-harmonics, where the selected sub-harmonic is notharmful. A more immediate application is to generate a powerful and calibrated sound and then checkout the response and sensitivity drift of all mounted pressure sensors and accelerometers with time,without dismounting them, and possibly during operation. We show and explain why multimodalexcitation makes sense. Suggestions are made in the end about the use of this equipment for sensor

Int. J. Turbomach. Propuls. Power 2020, 5, 9 3 of 31
calibration, instrumentation health monitoring and for active combustion control purposes in powergas turbines.
2. Solutions for Flow Modulation, Noise Emissions, or both Simultaneously
Pulse combustion applications, as well as the challenge of combustion instabilities, explain whydevices for dynamic flow control were developed, with the intention to understand the physicsinvolved in couplings of thermoacoustic nature and eventually control them. Pulse combustion [10,11]covers a range of rather rare applications exploiting the beneficial effects of thermoacoustic couplings.Combustion instabilities are the uncontrolled pendant of pulse combustion. They happen due to aninconvenient coupling of dynamic parameters under some operating conditions of the machine.
2.1. Passive and Active Control
Regarding commercial systems, the favoured solution is passive control, where the machinedoes not rely on an additional apparatus. It involves a refined hot core design with smoothly shapedtransitions that avoids acute resonant frequencies (e.g., that could be triggered by the flow itself).For ad-hoc solutions, pacification elements, such as acoustic liners, Helmholtz resonators, or wallabsorbers, can be used to avoid or damp critical resonances. However, as long as passive control is notsatisfactory—and in case the system has already been deployed and suffers on-site from a combustioninstability never seen before, as has happened several times in history, one must rely on an ad-hocsolution based on active control.
Active control is about controlled flow forcing. The forcing is a deliberate action performed ona continuous flow, with the intention to bring in a calibrated periodic compound. Acting at selectedfrequencies by means of an additional apparatus called pulsator can bring a system out of balancethat would tend to be naturally stable. The frequency must match an eigenfrequency, and the level ofperturbation must overcome a threshold to initiate the resonance. After that, the level of pulsationgrows up to the limit cycle amplitude, where the forces of excitation acting on the growth rate arecounterbalanced by damping effects [12].
Active control is considered where passive control measures are ineffective. In a laboratory, activecontrol delivers well-controlled boundary conditions [6–9]. In the industry, ad-hoc active controlsystems were developed to solve grave combustion instability problems [3,4].
The difficulty of active control is the intrusion of a separate aggregate in the gas turbine machinery,the need for fail-safe strategies and the difficulty in transmission of the know-how from one device tothe next. Keeping that in mind, the siren apparatus detailed in the following was developed with anall-rounder philosophy for laboratory and for power GT applications.
2.2. Active Control for Combustion in Continuous Flow Machines
The air inlet valve of the Argus-Schmidt pulse jet is one historical piece of technology designed toperiodically let in a mass flow of fresh air into a quarter-wave thermoresonator called Schmidt-Argustube [11]. This device was part of the V1-“buzz bomb” during World War II [13]. The valve consistsin an array or flexible metal blades, comparable in shape and in vibration dynamics to clarinetmouthpieces, slightly bent and pressed two by two against each other. These are called Reed valves(see Figure 1). They were designed to open/close at pressure fluctuations up to 3% of the ambientpressure at about 43 Hz. Based on this cyclic air feed and on a pulse combustion process in aquarter-wave Schmidt tube, the pulse jet could develop from 2 to 3.3 kN of thrust. The periodic valvewas therefore an ad-hoc design able to sustain the combustion pulsation process.

Int. J. Turbomach. Propuls. Power 2020, 5, 9 4 of 31
Figure 1. Pulse combustion application: the Schmidt-Argus pulse jet engine in action. Thrust tests ledat Thalerhof airport by Zhuber and Pirker in the 1960s (archives TU Graz/TTM) with detail of the Reedair valve and ignition sparklers.
The low pressure ratio achieved was also the limiting factor in terms of performance, and thisexplains why this principle was not further developed for propulsion. Nevertheless, some importantworks by Reynst [14] on a better heat generation making the best possible use of thermoacoustics haveled, for instance, to a few commercial applications of pulse combustion boilers; the unique sellingproposition (USP) of these being a better thermal efficiency than conventional, a complete combustionand a satisfying trade-off regarding emissions. Modern applications show that the problems inherentto noise, vibrations, and limited operational bandwidth have been managed with some success overtime [15].
Combustion instabilities are the uncontrolled pendant of pulse combustion. They happen dueto an inconvenient match of parameters at some place of the machine’s operational bandwidth.This explains why actuators were developed to reproduce these conditions, with the intention tounderstand the physics of the interaction, and eventually control them.
Many combustion laboratories perform successful flow modulation by means of a loudspeaker,or a set of loudspeaker [16–18]. For power systems, applications using loudspeakers are unrealisticbecause of the aggressive operating conditions (high pressure, high temperature), on the one side, andbecause of their limited acoustic power, on the other.
The first successful industrial combustion stability control systems were acting on the injection offuel, such as Moog’s D6xx series Direct-Drive Valves (DDV) used by Hermann et al. [3].
Previous works, such as author’s about multiphase, show that the most promising strategyis an actuation performed on the transporting phase, namely the air [19]. Technologies others thanloudspeakers have been tried: rotating valves by Choudhury et al. [20], confined pulse jet by Parikh [21]based on a similar principle, electro-pneumatic valves use by Yu et al. [22], or mechanical shakers withBurnel et al. [23]. In order to provide a satisfactory trade-off between operational range and effectivepulsation in presence of aggressive flow conditions, the siren technology was chosen.
2.3. The Siren
The layout of a siren consists in a jet of air sheared periodically by a rotating disk by means of teethor holes on this disk. Some models of siren were developed for operation under elevated conditionsof flow pressure and temperature, specifically for large mass flow rates at the cost of low pressuredrops (about 4%) [24,25]. In the following, we discuss a siren technology with a large pressure dropand a critical jet, setting precisely the amount of average and pulse flows based on the sole upstreamconditions [26]. In comparison to the references mentioned previously, the passage of sheared air isunique and the cooling of the motor part is simpler. Since this siren technology is based on a shearedsonic jet, the resulting pulsation is depending on the generating conditions only. In other words, it actsindependently from a possibly established instability situated downstream, which is convenient forcontrol purposes.

Int. J. Turbomach. Propuls. Power 2020, 5, 9 5 of 31
2.4. Evolution of a Pulsator of Siren Type
2.4.1. The ONERA Siren
A first model developed at ONERA in the frame of the studies [6,19,27] is an evolution ofelectro-pneumatic devices taking into consideration an hot air flow up to 500 K and elevated pressureoperation. The motivation was to develop a compromise between a rotating valve (for a wide pulsationfrequency range) and a shocked nozzle with varying critical surface for a high air flow rate. The deviceincluded a 20 teeth cogged wheel placed below a sonic hole and covering periodically its initial surfaceof 15%. The pulsation range could cover to 0–1 kHz at 15% pulsation amplitude. The wheel wasentrained by a constant-current electromotor type ESCAP 460 SC, non-regulated mounted in directdrive with the cogged-wheel. The device is represented on Figure 2.
Figure 2. The ONERA siren [6,19,27]. (Up): Side and front views of the actuator. (Down): Viewsincluding open wheel casing.
The siren reports in real time about the pulsation status. The phase-defined feedback is providedby a secondary wheel placed on the same entrainment axis as the cogged wheel, as shown on Figure 3.This wheel possesses as many holes as there are teeth on the cogged wheel. An optoelectronic sensorplaced close to its edge detects the passage of a hole. This provides the TTL phase reference signal(or triggering signal for the acquisition systems). This could drive, for instance, a phase-lockedstroboscope, or any apparatus able to sample data at one precise moment of the pulsation.
The same device was adapted on all further siren generations. It operates well on the investigated0–6 kHz range.
2.4.2. TU Graz Siren
TU Graz performed from 2004 to 2010 a research programme on the density fluctuation inpulsed flames and used the first apparatus in publications [28–30]. The basic principle, as well asthe feedback, repeats the ONERA siren features. Improvements were wished in terms of precision,this is why a servo motor was implemented. It was also observed that the fixed pulsation rate couldbe problematic at some frequencies where the flame would blow out because of the strength of thepulsation. The second-generation of the siren can be seen in Figure 4, where details of the differentmechanisms are shown.

Int. J. Turbomach. Propuls. Power 2020, 5, 9 6 of 31
Figure 3. Optoelectronic sensor for real-time frequency and phase information on the air pulse state.(Left): Technical drawing. (Right): Close-up of the device mounted at the rear of the air pulsator carter.
Figure 4. TU Graz siren, with details of the nozzle and wheel assembly, as well as the connecting rod,able to change the free critical surface based by moving the eccentric shaft of the cogged wheel.
Therefore, a system able to vary the amplitude was designed, based on the refined positioningof the cogged wheel relatively to the fix-mounted nozzle by means of an adjustable eccentric frame.The drive of the cogged wheel would be transmitted by a cardan to the wheel’s shaft. The drive of theadjustable eccentric frame is driven by a connecting rod. With this device, one could go through criticalfrequencies at zero gain amplitude and therefore pass through these frequencies without damage,which is convenient. The principle is shown in Figure 5.
Int. J. Turbomach. Propuls. Power 2020, 5, 9 7 of 31
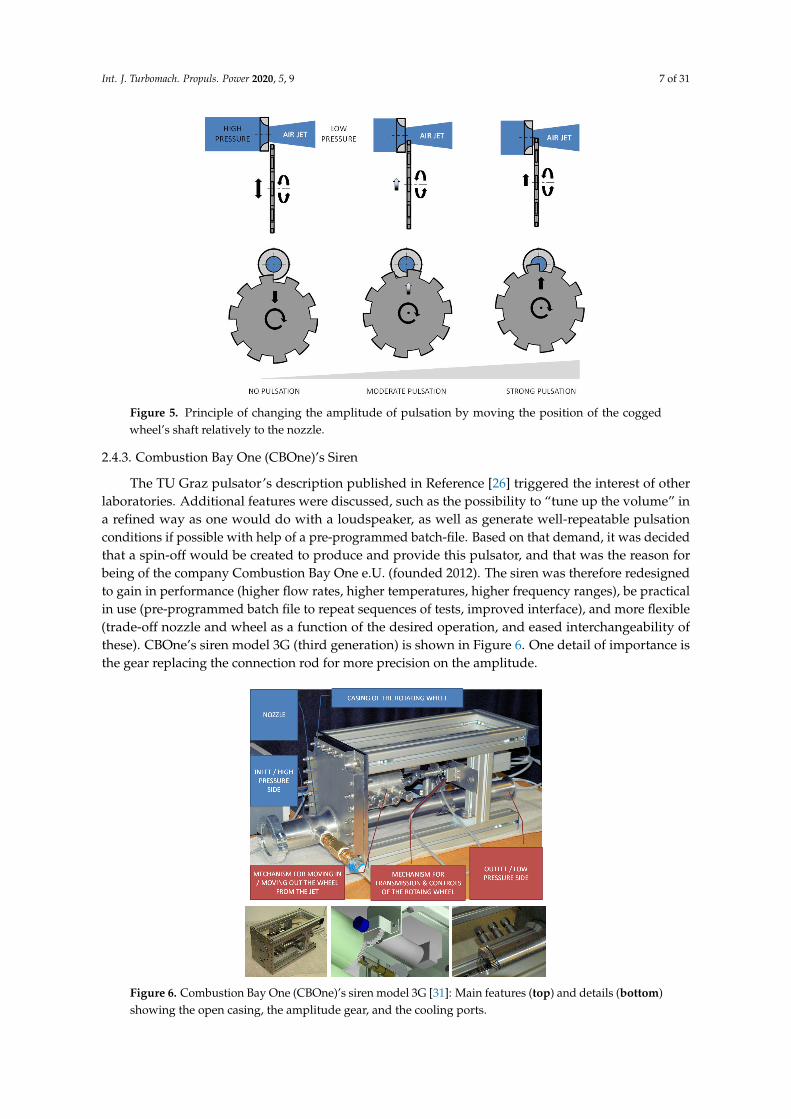
Figure 5. Principle of changing the amplitude of pulsation by moving the position of the coggedwheel’s shaft relatively to the nozzle.
2.4.3. Combustion Bay One (CBOne)’s Siren
The TU Graz pulsator’s description published in Reference [26] triggered the interest of otherlaboratories. Additional features were discussed, such as the possibility to “tune up the volume” ina refined way as one would do with a loudspeaker, as well as generate well-repeatable pulsationconditions if possible with help of a pre-programmed batch-file. Based on that demand, it was decidedthat a spin-off would be created to produce and provide this pulsator, and that was the reason forbeing of the company Combustion Bay One e.U. (founded 2012). The siren was therefore redesignedto gain in performance (higher flow rates, higher temperatures, higher frequency ranges), be practicalin use (pre-programmed batch file to repeat sequences of tests, improved interface), and more flexible(trade-off nozzle and wheel as a function of the desired operation, and eased interchangeability ofthese). CBOne’s siren model 3G (third generation) is shown in Figure 6. One detail of importance isthe gear replacing the connection rod for more precision on the amplitude.
Figure 6. Combustion Bay One (CBOne)’s siren model 3G [31]: Main features (top) and details (bottom)showing the open casing, the amplitude gear, and the cooling ports.

Int. J. Turbomach. Propuls. Power 2020, 5, 9 8 of 31
3. Elements of Design
3.1. Mass Flow
The siren’s concept described before is based on the discharge of a sonic jet. The mass flow ofa sonic jet is dependent on the generating conditions (Po, To) and on the nozzle neck section S only.This area is called the critical section, and under these conditions the nozzle is choked (the Machnumber is 1 in this section). This area is the quantity that is being periodically varied with the siren.From then on, the mass flow is proportional to the generating pressure Po under isothermal conditions.The geometry of the convergent and critical section is calculated according to Hugoniot’s formulas.There is no divergent; the jet blows in the open of the wheel casing. The assumptions are that the headconditions (Po, To) are constant. A critical section can also be used as a mass flow meter provided thenozzle is choked, and that its dimensions and the generating conditions are known. One relies on theperfect gases’ law. The other assumptions are that the small distance separating the jet critical sectionfrom the plane of the wheel is negligible, the thickness of the wheel compared to the diameter of thejet is negligible, and the specific relaxation times (or response time) of a critical jet are much smallerthat the shear periods, i.e., the flow response is instantaneous. The mass flow in the critical sectionis the following:
m =
√γ
r ToPo
(2
γ + 1
) γ+12(γ−1)
S, (1)
=
√γ
r ToPo
(2
γ + 1
) γ+12(γ−1) πd2
4for a round nozzle. (2)
When using air (γ = 1.4), the simplified formula is:
m =0.6847√
r ToPo S
=0.1712 Po π d2√
r Tofor a round nozzle.
3.2. Technical Solution to Achieve Elevated Frequencies
Solutions were developed to augment the pulsation performance while keeping the pulsator’sdimensions similar. Over the last years, new requests including higher frequencies and higher pulsationlevels have been formulated. The higher frequency is needed to visit up to the second harmonic ofprecessing vortex cores [18,32], or spinning tangential instabilities [33]. Therefore, we discuss effectivepulsations in the range zero to six kHz. The second motivation is to achieve pulsation levels near155 dB SPL for calibration purposes, and at higher ambient pressures and temperatures compared tostandard conditions. If the chocked nozzle’s surface is limited in size, the alternative is to augment thebackpressure. The walls, casing, and seals can be adapted accordingly.
For a given maximum motor speed, elevated pulsation frequencies can be achieved by maximisingthe number of teeth on the cogged wheel. However, a limiting factor on this tooth number is related tothe ratio between the average distance between two upward fronts on the wheel (or tooth period) andthe nozzle width. This ratio must remain larger than 2; otherwise, a cut-off frequency is met. This isthe reason why one considers slot-like nozzles as an arrangement to this limiting factor.
A new geometry tending towards a slot was developed as an alternative to the round criticalnozzle of diameter d. A double-Laval convergent profile was drawn along the two axes of symmetry ofthe slot to ensure that the nozzle surface is choked at the upper and lower edges, as shown in Figure 7.

Int. J. Turbomach. Propuls. Power 2020, 5, 9 9 of 31
Surface ratio 3/4 1/2 1/4of disc ø d
Slotshape
Width (% d) 63.5% 40.4% 19.8%
Surface ofcircumscribing 92.8% 97.2% 99.3%rectangle d ∗ h
Figure 7. Novel nozzle profiles showing a slot-like outlet, for several round surface ratios (top),nozzle arrangement with wheel (middle), and nozzle cut views (bottom).
It is of importance to relate to a round surface to easily connect to the set of round nozzles.The resulting slot therefore has a surface corresponding to a given ratio of the reference disc area withdiameter d. For a ratio 1/x of the reference round surface πd2/4, the width w of the slot is:
w = d sin α
where α is the solution of sin α cos α + α− π
2x= 0. (3)
Figure 7 shows the nozzle surface for ratios 3/4, 1/2 and 1/4. Slots having a surface equal to orsmaller than 1/4 of the reference disc area can be approximated by a rectangle of dimensions d and w .The same figure shows an arrangement with a 60-teeth wheel able to achieve 5.4 kHz with the currentmodel. A set of quarter-round nozzles was produced with success using additive manufacturing [34].
3.3. Multimodal Excitation
The incentive is to augment the number of excited frequencies. The intention is twofold. In thispaper, it is shown that at least three distinct frequencies can be generated by the siren and acceleratethe characterization of the resonance of the system, by gathering more resonances in one take whilescanning through the frequencies of excitation. In the future, it is intended to address the effectivenessof a multimodal excitation to damp a combustion instability by offering, at once, several frequencybands where the acoustic energy can be dissipated.

Int. J. Turbomach. Propuls. Power 2020, 5, 9 10 of 31
The chosen modes compose the first inversion of a major chord, like playing E-G-C on a piano.There are no multiples of each other, with their relative periods being 5, 6, and 8. This is the reasonwhy a multimodal wheel having 25, 30, and 40 holes or teeth positioned at different radii was designedand tested, as shown in Figure 8.
Thiswheel plays
G ˘˘˘
when rotatingat 788 rpm.
20 20.01 20.02 20.03 20.04 20.05
Time (s)
-1
-0.8
-0.6
-0.4
-0.2
0
0.2
0.4
0.6
0.8
1
sign
(P')*
squa
re r
oot(
abso
lute
(P'))
(a.
u.)
Multimodal, chord @ 788~rpm, measured
Figure 8. The multimodal wheel, designed to generate a synthetic signal reproducing a major chord,and measured chord waveform.
The device combines with the nozzle slot shown before. For this section, the reference diameter is12 mm and the surface is one quarter of a round. The amplitude feature can be used to play none, one,two, or three tones at a time. The shown chunk from Figure 8 is derived from the measurement of thedynamic pressure 0.5 m down the siren’s nozzle.
3.4. Nozzle Free Surface Calculation and Pulsed Flow Prediction Tools
In the following, the variable section S is determined. The case of a round nozzle of criticaldiameter d is shown.
The parameters are the eccenter, the diameter of the nozzle, and the lower and higher diametersof the cogged wheel. Based on the tilting angle of the chassis, the eccenter will vary, and the coverageof the nozzle will change accordingly. The whole kinematics are reconstructed, fed by the previousparameters. The eccenter is the distance separating the motor axis from the cogged wheel axis, it hasa fixed value. It is set by rotating an off-centre chassis, as shown in Figure 9, where two cases areshown. The nozzle and the wheels are interchangeable as a function of the type of pulsation which isdesired. The figure shows how, by completely retracting the wheel, and how, by penetrating the jetto its maximum, the sonic jet is alternatively opened (no tooth blocking the path) and closed (toothblocking the path). The first wheel is such that it does only partially cover the nozzle with a maximumpulsation of say 50%; it is called the safety wheel and is used in explorative cases, where the resonancefrequencies of the system are not known. Once these are identified and can be avoided by passingthrough at zero gain, the full range-wheel can be used, which covers up to 100% of the nozzle’s criticalsurface during the pulsation cycle.

Int. J. Turbomach. Propuls. Power 2020, 5, 9 11 of 31
SAFETY WHEEL FULL-RANGE WHEEL
0 2 4 6 8 10 12
X/d
-5
-4
-3
-2
-1
0
1
2
3
4
5
Y/d
Moving position of the rotating wheel shaft for a periodically
free/covered round critical nozzle of diameter d = twice the excentre
Nozzle
Median line wheel up
Wheel boundaries
Median line intermediate
Median line wheel down
Off-center shaft position
0 2 4 6 8 10 12
X/d
-5
-4
-3
-2
-1
0
1
2
3
4
5
Y/d
Moving position of the rotating wheel shaft for a periodically free/covered round critical nozzle of diameter d = twice the excentre
NozzleMedian line wheel upWheel boundariesMedian line intermediateMedian line wheel downOff-center shaft position
Figure 9. Relative position of the cogged wheel (mobile) versus the nozzle surface (fixed), for the safetyand full-range versions.
In the case where the diameter d is twice larger than the eccenter, the pulsation levels and resultingaverage mass flow can be derived as shown in Figure 10. A pulsation amplitude by x% means that,during the pulsation cycle, x% of the critical surface S is covered. Assuming constant (P0, T0) generatingconditions, the resulting mass flow fluctuation is shown.
SAFETY WHEEL FULL-RANGE WHEEL
0 30 60 90 120 150 180 210 240 270 300 330 360
Châssis angle α (deg)
0
10
20
30
40
50
60
70
80
90
100
Flu
ctu
atio
n %
Nozzle free area and fluctuation amplitude
as a function of the chassis' angle
Maximum opening
Minimum opening
Fluctuation amplitude from min to max
0 30 60 90 120 150 180 210 240 270 300 330 360
Châssis angle α (deg)
0
10
20
30
40
50
60
70
80
90
100
Flu
ctua
tion
%
Nozzle free area and fluctuation amplitude as a function of the chassis' angle
Maximum openingMinimum openingFluctuation amplitude from min to max
0 30 60 90 120 150 180 210 240 270 300 330 360
Châssis angle α (deg)
40
50
60
70
80
90
100
No
zzle
fre
e a
rea
(%
)
Average, min and max flow rates during a pulsation cycle
are proportional to the nozzle free area
Area free - no tooth
Area blocked - tooth passage
Average area
0 30 60 90 120 150 180 210 240 270 300 330 360
Châssis angle α (deg)
0
10
20
30
40
50
60
70
80
90
100
Noz
zle
free
are
a (%
)
Average, min and max flow rates during a pulsation cycleare proportional to the nozzle free area
Area free - no toothArea blocked - tooth passageAverage area
Figure 10. Percentage of covered surface of the jet critical section expressed as a function of the tiltingangle α of the off-centre frame, and corresponding mass flows during the pulsation cycle.

Int. J. Turbomach. Propuls. Power 2020, 5, 9 12 of 31
The coverage of the nozzle’s surface is calculated numerically as a function of the nozzle andwheel geometries, in order to reconstitute the mass flow pulsation pattern at the siren’s outlet, and isbased on the previous feedback of the amplitude. Early works were reported by A. Lang [35], whotested, among others, cogged wheels with a sine profile within his PhD Thesis.
The results of the prediction tool are shown in Figure 11. Round nozzles periodically coveredby step-like teeth will generate sine-like patterns (as confirmed with Laser Doppler Anemometer(LDA) measurements in Reference [26]) when the pulsation level is low or when the tooth width issmall compared to the nozzle diameter. When the coverage tends towards 100%, the signal tendstowards a saw pattern when the tooth period is near to twice the width w of the slot, and towards asquare signal when the tooth period is much greater than w. A multimodal wheel was also computedreproducing a major chord, for good comparison with the last section of this article dedicated tothis subject. The last signal chunk shown in Figure 11 compares well with the signal measurementfrom Figure 8, despite the fact that it is unfiltered (jet noise and 50 Hz disturbance are present).Nevertheless, the pseudo-periodicity, the peak count, and the component slides can be recognised.
0 0.2 0.4 0.6 0.8 1 1.2 1.4 1.6 1.8 2
Number of pulsation periods
0
10
20
30
40
50
60
70
80
90
100
Fre
e su
rfac
e [%
]
Round nozzle, sine-like signal
0 0.5 1 1.5 2 2.5 3
Pulsation period [τ]
0
10
20
30
40
50
60
70
80
90
100
Fre
e su
rfac
e [%
]
Slot, triangle-like signal
0 5 10 15 20 25 30
Pulsation period [τ]
0
10
20
30
40
50
60
70
80
90
100
Fre
e su
rfac
e [%
]
Multimodal, chord
Figure 11. Module “Eclipse” for the calculation of the pulsation pattern. (Top): Sine-like signal witha round nozzle at 33% coverage. (Middle): Saw-like modulation with a quarter-round slot at 66%coverage. (Bottom): Multimodal wheel (major chord).

Int. J. Turbomach. Propuls. Power 2020, 5, 9 13 of 31
3.5. Siren Performance
The pulsation frequency is function of the number of teeth on the wheel and of the electric driveperformance. The pulsation frequency relates to the shaft’s rotational speed Ω (rpm) as follows:
f =nΩ60
. (4)
CBOne’s siren 3G is equipped with a 250 W DC motor driving the cogged wheel (topping at6000 rpm) and a geared 60 W step motor moving the chassis. The compact design responds to thedemands of different laboratories, including hot flow conditions. The focus was put on the flexibilityaspect, as well as on the robustness, allowing 4-h-long combustion tests sessions in a row. The deviceis air-cooled. The standard input/output flanges are DN 50/40 on the high pressure and low pressureside. The aggregate’s dimensions L ×W × H are 600 mm × 210 mm × 230 mm for a weight of 15 kg.The performance parameters are shown in Table 1.
Table 1. Performance sheet of the third generation siren. Values in bold are theoretical; others, includingbetween parenthesis, were proven experimentally.
Parameter Lower Design Full Load
Frequency range (Hz) 0–500 0–1000 0–6000
Number of teeth n – 5 10 60
Pulsation (%) 0 30 100
Nozzle critical surface (mm2) 20 50 120
Free flowing mass flow (g/s) 10 50 500 (120)at room temperature of dry air
Maximum admissible (%) 100 100 5pulsation level
Corresponding SPL at (dB SPL) 113 146 155outlet stagnation point (150 forcedunder atmospheric resonanceconditions [36])
Open/close Periodicity (%/%) 20/80 50/50 80/20of cycle
High pressure side (bar abs) 2 4 20 (12)
Low pressure side (bar abs) 1 2 10 (6)
Flow temperature (K) 223 293 550(dry)
Accelerations/ (Hz/s) 1 30 60decelerations
Amplitude (%/s) 1 2 4change rate of full scale
Frequency uncertainty (%) ± 1 ± 1 ± 1
Average amplitude (%) of ± 3 ± 3 ± 3uncertainty full scale
The uncertainty on the frequency depends on the precision of the electric drive only. In case ahigh-precision is requested in the low-frequency range, it is recommended to work with the leastnumber of teeth. Phase-control using this device is feasible in the 0–200 Hz. The error term in terms ofamplitude is specific of the maximum covered surface over the whole actuation range. Typical valuesare reported in the table.

Int. J. Turbomach. Propuls. Power 2020, 5, 9 14 of 31
4. Calibration of Dynamic Sensors and Acoustic Characterisation of the Hot Core
4.1. Calibration of Dynamic Sensors
The siren can be used for dynamic sensor calibration. A solution based on the siren technologywould be an alternative to the usual piston calibrators, with an enlarged operation envelope. It canachieve, in a well-controlled manner, high-power pulsations and visit intermediate pressure andtemperature conditions on the sensor’s membrane. As shown in Figure 12, the sensor (fast-pressuretransducer, or accelerometer) is placed at the tip of a total pressure probeholder facing the siren’sjet. The principle of retractable wheel is kept, so that the set-up’s resonant modes can be avoided.This set-up would be the first of its kind, opening the door to a new type of extreme conditions testing.
Figure 12. Schematic set-up for dynamic sensor calibration at various intermediate pressuresand temperatures.
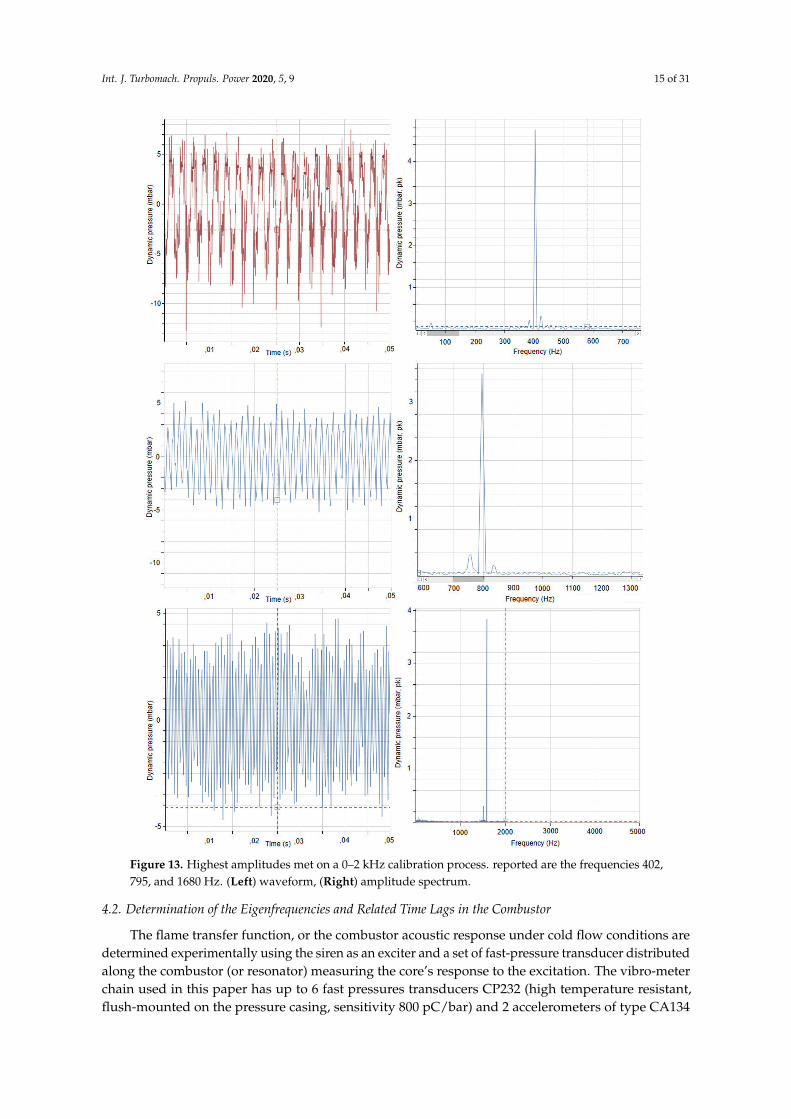
The set-up from Figure 12 was tested using the Vibro-Meter measurement chain detailed inreference [37] (MEGGITT, Fribourg, Switzerland). The same fast-pressure sensing equipment is usedin the next sections. The results are shown in Figure 13. The nozzle used is a slot nozzle (referencediameter 10 mm, surface 1/4 of a round) to explore high frequencies, with a 20-teeth wheel so that theexpected signal should be near to a triangle signal. The probe is situated in the jet of a 26 mm diameterpipe, and the probe itself has a diameter of 13 mm. The probe is at ambient conditions. The generatingpressure P0 is 2.8 bar. The pulsation is set to all-or-nothing (or 0 to 100% surface blockage during thecycle). The total pressure fluctuation at the probe’s surface corresponds to the change in dynamicpressure (2.25 mbar amplitude, or 138 dB SPL).
By scanning through the frequencies, one detects peak amplitudes situated between 1.5 and4 mbar. The explanation offered for the discrepancies is that the blockage of the probe in the jet ishigh, thus reducing the outlet cross section. Furthermore, some quarter-wave modes and subharmonicsare met, which could explain the gain up to a factor of 2. On the other hand, some changes in crosssection in the set-up are responsible for Helmholtz effects, and the absorption at some frequenciescan be heard. Another explanation is the possible non-linearity of the sensor used, operating in itsbottom-end region of scale, while the conversion from electrical current to pressure value was enteredas a fixed factor.
Nevertheless, these results are very encouraging. The expected order of magnitude is met.This first test shows that the expected triangle-like signal is well reproduced. These results arewell-repeatable within a 4% uncertainty range. The calibration is made possible up to 6 kHz in a nextstep, making this benchmarking method unique.
Int. J. Turbomach. Propuls. Power 2020, 5, 9 15 of 31
Figure 13. Highest amplitudes met on a 0–2 kHz calibration process. reported are the frequencies 402,795, and 1680 Hz. (Left) waveform, (Right) amplitude spectrum.
4.2. Determination of the Eigenfrequencies and Related Time Lags in the Combustor
The flame transfer function, or the combustor acoustic response under cold flow conditions aredetermined experimentally using the siren as an exciter and a set of fast-pressure transducer distributedalong the combustor (or resonator) measuring the core’s response to the excitation. The vibro-meterchain used in this paper has up to 6 fast pressures transducers CP232 (high temperature resistant,flush-mounted on the pressure casing, sensitivity 800 pC/bar) and 2 accelerometers of type CA134

Int. J. Turbomach. Propuls. Power 2020, 5, 9 16 of 31
(outer skin-mounted, sensitivity 10 pC/g, see the specific results in Reference [37]). The acquisitiondevice is a VM600 rack including a XMV16/XIO16T card pair. It can acquire signals with anacquisition frequency up to 100 kHz over 16 channels coded in 24 bit. The data monitoring andpost-processing is done with the VibroSight software suite (all technologies by Vibro-Meter, MEGGITT,Fribourg, Switzerland).
The siren can “play” pre-programmed batch files containing a sequence of different excitation.This is done first under non-reactive conditions and then in the presence of a flame. The typicalsequence is shown in Figure 14. The first part of the experiment contains frequency ramps performedat fixed amplitude (possibly several of them up to zero amplitude to differentiate sound from structurevibration). After that, the frequencies of interest that repeat well during the ramps are investigated oneby one, with a variable amplitude in order to perform a sensitivity analysis and a determination of thegain. This experiment is called “Kölner Dom“ in tribute to the Cathedral of Cologne that happens tomatch well the typical pattern of the scanned frequency.
0 2 4 6 8 10 120
2000
4000
6000
Fre
quency [H
z]
The "Kölner Dom" experiment
⇐ Frequency ramps ⇒ ← Frequency steps @ eigenfrequencies →
0 2 4 6 8 10 12
Time [min]
0
50
100
Puls
ation
am
plit
ude [%
] ← - Fixed amplitude - → ⇐- - - - - - - Sensitivity analysis - - - - - - -⇒
Figure 14. The “Kölner Dom“ experiment, or the typical sequence of excitation of the siren for anacoustic characterisation of the system.
The method is applied to an experimental combustion test rig called ”the emootion facility“ [38]equipped with an additively manufactured burner made up of Inconel 718 called ”CBO4“ [39].The combination of both, as well as the specific instrumentation, are presented in a separatepaper [40]. This is a single-sector pressurised combustor including a two-staged, axially centredburner with a transparent liner allowing an optical access to the flame. The siren nozzle is a 12 mmquarter-round nozzle.
The response of three CP232 probes are shown. These are mounted at several locations on thepressure casing of the combustor, as suggested in Figure 17. The sensors are positioned so that thesensor called Dyn01 is diametrically opposed to Dyn03, flush mounted on the pressure casing at adistance of 20 mm downstream of the front plate. Dyn02 is in line with Dyn03 at a distance of 40 mmof the front plate.
The cold flow characterisation using the Kölner Dom method is shown in Figure 15. The upperplot shows the good reproducibility of the method by repeating three times in a row the same sequence.The resonant frequencies found during the ramps are 180, 606, 1440, and 1960 Hz. These are analysedafter that as frequency steps in the frame of the sensitivity analysis.

Int. J. Turbomach. Propuls. Power 2020, 5, 9 17 of 31
Figure 15. ”Kölner Dom” measurement performed on the emootion test facility [38] with non-reactivetests at standard conditions, nozzle 12 mm. (Top): Repetition 3 times of the characterisation sequenceto verify the reproducibility. (Bottom): Focus on one measurement.
What can be observed from these measurements are probably standing waves, for instance,at 180 Hz, where all sensors must be placed near a belly (same excitation pattern, same amplitude),while the different measurement locations become visible with the further frequencies.
4.3. Modal Analysis: Measurement of the Phase Shifts or Time Lags in Relationship to Standing orTransported Waves
The same experiment is repeated with a 6 kW premixed flame in the same facility (see Figure 16).One focuses on the 1604 Hz resonance, which is observed in presence of a flame, and gets amplified bythe siren’s excitation. The sensitivity analysis shows that the excitation in all-or-nothing mode bringsthe acoustic pressure from 0 at rest near 1 mbar peak. The phase shifts versus the synchronisationsignal (TTL of the siren) are displayed, too: These can be measured with accuracy in the lower kHzdomain based on a 10 kHz sampling frequency, and repeat well during the fluctuations of amplitude.Based on that, a multiple sensor analysis is possible in order to understand the type of instability(axial or tangential, standing or travelling wave).

Int. J. Turbomach. Propuls. Power 2020, 5, 9 18 of 31
Figure 16. Excitation of the flame at 1604 Hz, where a resonance was observed with combustion.The first part is a continuous excitation; the second part is a sensitivity analysis with variable amplitude.The top plot reports the peak amplitudes of the fast pressure transducers. The lower plot reports thephase shift measured at this frequency versus the reference signal of the pulsator.
4.4. Health Diagnostic of Fast Pressure Sensors and Accelerometers during Operation
This is a field application for power gas turbines. It can be performed at rest or during operationand does not necessitate to dismount the sensors, which is convenient. The siren is mounted inblow-down modus (see Figure 17) and generates a calibrated noise at non-critical frequency when themachine is running, or scans through frequencies when the machine is at rest. A high-frequency bandis suggested for this purpose in the same figure, where calibrated noise could be generated duringoperation, without a risk of triggering a combustion instability. Indeed, no significant resonance wasobserved in the 2.4 kHz+ zone while exciting with the siren up to 6 kHz. This is a way to test how thedynamic sensors (fast pressure transducers, accelerometers) respond, without having to dismantlethem, and monitor their response over time within an acceptable drift margin.
Int. J. Turbomach. Propuls. Power 2020, 5, 9 19 of 31
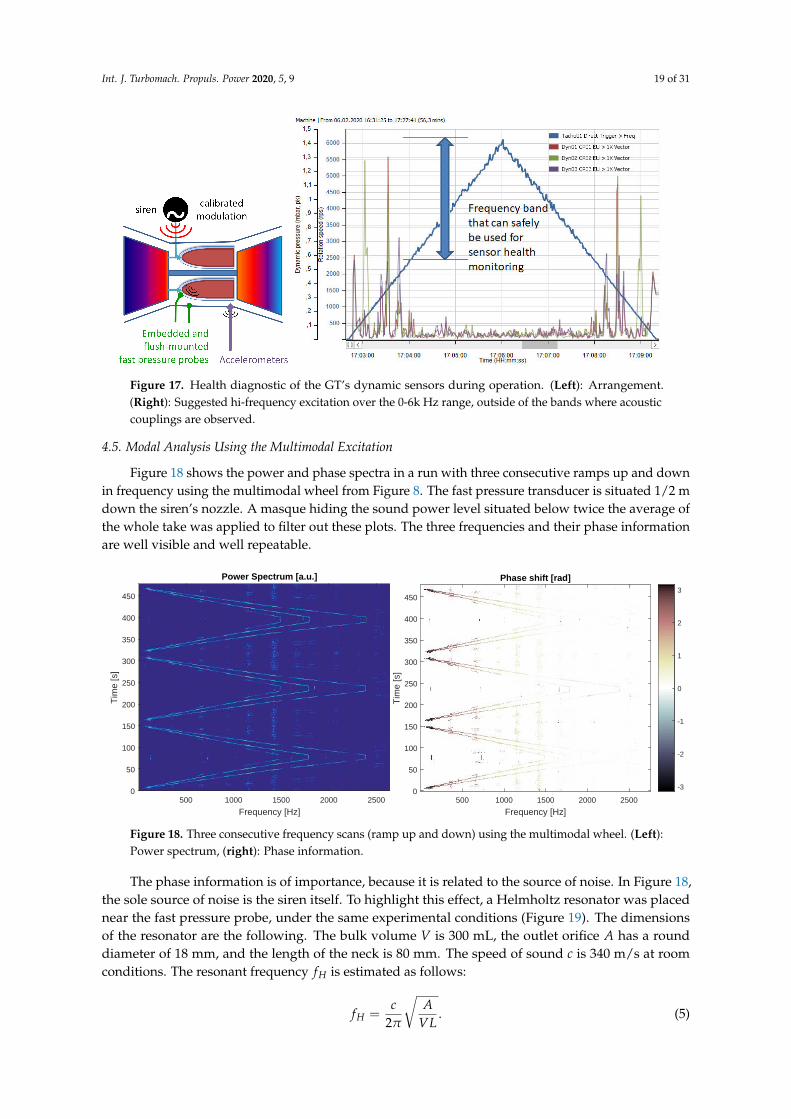
Figure 17. Health diagnostic of the GT’s dynamic sensors during operation. (Left): Arrangement.(Right): Suggested hi-frequency excitation over the 0-6k Hz range, outside of the bands where acousticcouplings are observed.
4.5. Modal Analysis Using the Multimodal Excitation
Figure 18 shows the power and phase spectra in a run with three consecutive ramps up and downin frequency using the multimodal wheel from Figure 8. The fast pressure transducer is situated 1/2 mdown the siren’s nozzle. A masque hiding the sound power level situated below twice the average ofthe whole take was applied to filter out these plots. The three frequencies and their phase informationare well visible and well repeatable.
Power Spectrum [a.u.]
500 1000 1500 2000 2500
Frequency [Hz]
0
50
100
150
200
250
300
350
400
450
Tim
e [s
]
Phase shift [rad]
500 1000 1500 2000 2500
Frequency [Hz]
0
50
100
150
200
250
300
350
400
450
Tim
e [s
]
-3
-2
-1
0
1
2
3
Figure 18. Three consecutive frequency scans (ramp up and down) using the multimodal wheel. (Left):Power spectrum, (right): Phase information.
The phase information is of importance, because it is related to the source of noise. In Figure 18,the sole source of noise is the siren itself. To highlight this effect, a Helmholtz resonator was placednear the fast pressure probe, under the same experimental conditions (Figure 19). The dimensionsof the resonator are the following. The bulk volume V is 300 mL, the outlet orifice A has a rounddiameter of 18 mm, and the length of the neck is 80 mm. The speed of sound c is 340 m/s at roomconditions. The resonant frequency fH is estimated as follows:
fH =c
2π
√A
VL. (5)

Int. J. Turbomach. Propuls. Power 2020, 5, 9 20 of 31
Power Spectrum [a.u.]
100 200 300
Frequency [Hz]
0
100
200
300
400
500
600
700
800
900
Tim
e [s
]
Phase shift [rad]
100 200 300
Frequency [Hz]
0
100
200
300
400
500
600
700
800
900
Tim
e [s
]
-3
-2
-1
0
1
2
3
Figure 19. Scanning through the bulk mode of an Helmholtz resonator.
The substitution into the previous formula produces an estimated resonant frequencyfH = 176 Hz. The measured resonance takes place in bulk mode centred at 182 Hz with a variance of4 Hz, matching well with the previous estimate. The effect of the siren, when each of the excitationfrequencies meets the Helmholtz’ own, is to narrow the bulk effect and amplify the peak frequency.However, the Helmholtz cavity remains as the main source of noise at 182 Hz as shown by thephase trace.
The advantage of using the multimodal wheel for scans is therefore that the information on theresonant frequencies, and a hint on the resonators location is multiplied by the numbers of modeson the wheel for one take. Furthermore, provided the highest mode is phase-locked with the siren(here, the outer crown of 40 teeth), the phase difference between all modes is constant as a function ofthe frequency, as long as the siren is the noise source. This means that an observed shift in phase versusa set value corresponds to the excitation of another part in the machinery (e.g., the flame) that overridesthe sound generated by the siren. Instead of applying the multi-microphone method to situate a soundsource [41,42], only one sensor monitors single sources emitting several known frequencies (the siren,and any resonant part excited by the siren). The microphone can be phase-locked on the pattern period,meaning every five counts of the lower frequency wheel, six counts of the middle, or height counts ofthe outer one (effectively: this one). Therefore, in theory, one sensor suffices to monitor the machine,and redundancy is no longer required. In practice, the number of dynamic sensors can be reduced tothe least number meeting the safety and certification requests.
5. Combustor Flow Control and Flame Forcing
5.1. Effective Flow Control in the Combustor of a Gas Turbine: Possible Siren Placements
In all previous works by the same team, the siren was used in so-called blow-down configuration,where at least a part of the combustion air is being pulsed upstream from the burner. Regardingreal gas turbines, having an additional piece of equipment that needs a separate pressurised air feedwith backpressure at least double that of the largest operating pressure ratio (OPR) might not bewanted. A more convenient way to use the siren is the so-called discharge mode, where a part ofthe plenum air is sampled periodically and derived a bleed towards the siren. By comparison to theblow-down excitation, the discharge provokes only a periodic change in mass flow, but theoreticallyno sound, because sound does not travel upstream in a transonic configuration. Thus, it is a pure

Int. J. Turbomach. Propuls. Power 2020, 5, 9 21 of 31
aerodynamic fluctuation. The column of air flowing through the vessel is brought to resonance,and these resonances—or eigenfrequencies—are specific of the component and/or of the localconditions exposed to this flow modulation. The air bleed can be used for other purposes, suchas service air or cooling air. Both possible uses of the siren actuator in blow-down and dischargeconfiguration are shown in Figure 20.
Figure 20. Possible implementations of a siren on a gas turbine for flow control [36]: (a) Blow-downand (b) discharge configurations.
The tests presented under this section were performed with the discharge configuration, whichgives a less strong disturbance to the combustion chamber volume. The idea is to decouple the noiseemitted by the siren from the noise emitted by any resonant element in the pressure vessel. In themeantime, the periodic bleed is used as an excitation to reveal and enhance these resonances. In theend, the objective is to excite the flame effectively, without overriding it because of the pulsation’sexaggerated energy level. Figure 21 shows the experimental arrangement.
Figure 21. Functionality of siren configurations on the pressurised test rig.
Int. J. Turbomach. Propuls. Power 2020, 5, 9 22 of 31
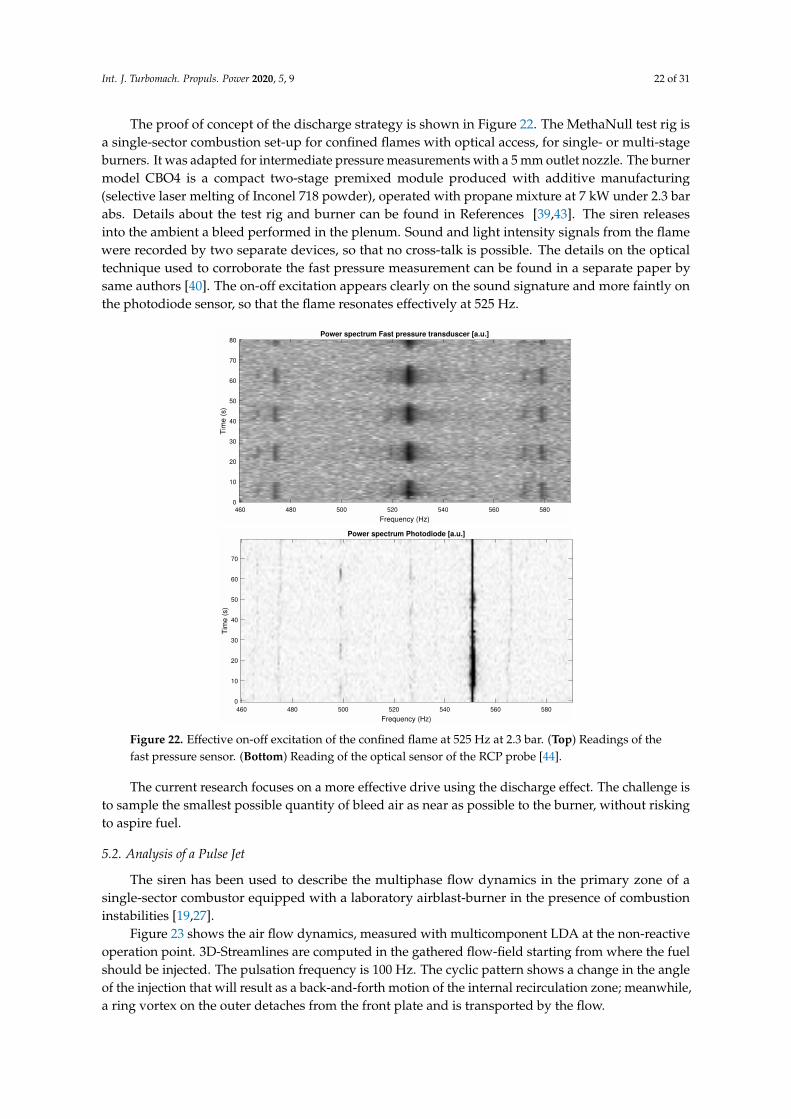
The proof of concept of the discharge strategy is shown in Figure 22. The MethaNull test rig isa single-sector combustion set-up for confined flames with optical access, for single- or multi-stageburners. It was adapted for intermediate pressure measurements with a 5 mm outlet nozzle. The burnermodel CBO4 is a compact two-stage premixed module produced with additive manufacturing(selective laser melting of Inconel 718 powder), operated with propane mixture at 7 kW under 2.3 barabs. Details about the test rig and burner can be found in References [39,43]. The siren releasesinto the ambient a bleed performed in the plenum. Sound and light intensity signals from the flamewere recorded by two separate devices, so that no cross-talk is possible. The details on the opticaltechnique used to corroborate the fast pressure measurement can be found in a separate paper bysame authors [40]. The on-off excitation appears clearly on the sound signature and more faintly onthe photodiode sensor, so that the flame resonates effectively at 525 Hz.
Power spectrum Fast pressure transduscer [a.u.]
460 480 500 520 540 560 580
Frequency (Hz)
0
10
20
30
40
50
60
70
80
Tim
e (
s)
Power spectrum Photodiode [a.u.]
460 480 500 520 540 560 580
Frequency (Hz)
0
10
20
30
40
50
60
70
Tim
e (
s)
Figure 22. Effective on-off excitation of the confined flame at 525 Hz at 2.3 bar. (Top) Readings of thefast pressure sensor. (Bottom) Reading of the optical sensor of the RCP probe [44].
The current research focuses on a more effective drive using the discharge effect. The challenge isto sample the smallest possible quantity of bleed air as near as possible to the burner, without riskingto aspire fuel.
5.2. Analysis of a Pulse Jet
The siren has been used to describe the multiphase flow dynamics in the primary zone of asingle-sector combustor equipped with a laboratory airblast-burner in the presence of combustioninstabilities [19,27].
Figure 23 shows the air flow dynamics, measured with multicomponent LDA at the non-reactiveoperation point. 3D-Streamlines are computed in the gathered flow-field starting from where the fuelshould be injected. The pulsation frequency is 100 Hz. The cyclic pattern shows a change in the angleof the injection that will result as a back-and-forth motion of the internal recirculation zone; meanwhile,a ring vortex on the outer detaches from the front plate and is transported by the flow.

Int. J. Turbomach. Propuls. Power 2020, 5, 9 23 of 31
Figure 24 highlights the dynamics of the ring vortices (or “donuts”) being generated around thejet at the front plate, detaching the front plate, and then being transported by the flow. The coherentstructures in the flow are revealed using the second invariant criterion (called also λ2 criterion) fromJeong and Hussain [45]. Figure 24 uses the same “data brick” of LDA measurements as required forcomputing the streamlines from Figure 23 and focuses on the extreme jet velocities to materialise thejet envelope and the different recirculating zones, the vorticity (based on a curl of the velocity field), orthe axial gradient. This is a way to materialise the ring vortex in 3D.
0 0.2 0.4 0.6 0.8−0.8
−0.6
−0.4
−0.2
0
0.2
0.4
0.6
0.8
x/D
45o−60o
z/D
−0.8 −0.6 −0.4 −0.2 0 0.2 0.4 0.6 0.8−0.8
−0.6
−0.4
−0.2
0
0.2
0.4
0.6
0.8
dlines
/ D = 0.5
y/D
z/D
0 0.2 0.4 0.6 0.8−0.8
−0.6
−0.4
−0.2
0
0.2
0.4
0.6
0.8
x/D
135o−150o
z/D
−0.8 −0.6 −0.4 −0.2 0 0.2 0.4 0.6 0.8−0.8
−0.6
−0.4
−0.2
0
0.2
0.4
0.6
0.8
dlines
/ D = 0.5
y/D
z/D
0 0.2 0.4 0.6 0.8−0.8
−0.6
−0.4
−0.2
0
0.2
0.4
0.6
0.8
x/D
225o−240o
z/D
−0.8 −0.6 −0.4 −0.2 0 0.2 0.4 0.6 0.8−0.8
−0.6
−0.4
−0.2
0
0.2
0.4
0.6
0.8
dlines
/ D = 0.5
y/D
z/D
0 0.2 0.4 0.6 0.8−0.8
−0.6
−0.4
−0.2
0
0.2
0.4
0.6
0.8
x/D
315o−330o
z/D
−0.8 −0.6 −0.4 −0.2 0 0.2 0.4 0.6 0.8−0.8
−0.6
−0.4
−0.2
0
0.2
0.4
0.6
0.8
dlines
/ D = 0.5
y/D
z/D
Figure 23. 3D streamlines for free-jet configuration, emitted along a d/D = 1/2 diameter circle placedin the injection section (mixing layer, where the liquid phase is injected). (Left and middle): Profile andfront views of the 3D streamlines. (Right): three-quarter view. Air pulsation 30% of 30 g/s at 100 Hz.

Int. J. Turbomach. Propuls. Power 2020, 5, 9 24 of 31
About 24 h of LDA measurements where needed to gather all the measurement points needed togenerate the displays in Figures 23 and 24. The siren allowed the flow pattern to be kept well-repeatableand provided the synchronisation signal to reproduce in a refined way the whole pulsation cycle.
a. Extreme axial velocities b. Vorticity (curl) c. Gradient and streamlines
Figure 24. 3D analysis of the airblast aerodynamics, measured with conditioned Laser DopplerAnemometer (LDA) and phase-averaged [19,27]. (a) Extreme axial velocities u to sort out the air jetshape and the recirculating zones. (b) Analysis of the field vorticity, applying the curl operator∇∧U(u,v,w). (c) Analysis of the mixing layer positions (gradient operator and normalisation:|∇U(u,v,w)|) comparison with the 3D streamlines emitted from the liquid injection

Int. J. Turbomach. Propuls. Power 2020, 5, 9 25 of 31
5.3. Modal Control of a Pulse Flame
The siren has been used to excite the resonant modes of a premixed air-methane burner, built asquarter-wave resonator (Figure 25) [28,30]. With a 3 m long pipe separating the siren’s nozzle from theburner, the fundamental harmonic is 25 Hz, and only the subharmonics of frequency f = 25× (1 + N),where N = 1, 2, 3, ..., can be amplified.
0 0.5 1 1.5 2 2.5 3−0.05
0
0.05
critical nozzle with sirene
3m long resonator
venturi + swirler (+ chamber)
Dim
. (m
)
Mode 1/4 − 25 Hz
Mode 3/4 − 75 Hz
Mode 1 − 100 Hz
(no resonance)
Mode 7/4 − 175 Hz
Figure 25. Amplified modes with the siren on a quarter-wave resonator.
The flame would receive an actuation at any frequency as shown in the previous section, but theone meeting one of these resonant frequencies are remarkable because the flame catches-up andbecomes the main source of noise. The pulsation dynamic can be observed in Figure 26. The firstcolumn described with a schlieren technique the V-shaped swirl flame, attached to the tip of the burner.The middle column shows the 25 Hz resonance. The outer contour of the flame creates a recurrentroll driven by the detachment of a peripheral ring vortex. Although the burners are not the same,the fresh reactants jet dynamics and the outer vortex ring detachment are similar, respectively, to thoseof Figures 23 and 24, a detailed particle image velocimetry (PIV) analysis published in Reference [30]establishes this fact. The deformation of the 25 Hz flame is impressive. This is definitely the typeof instability that, when self-sustained, would harm a combustor. The siren can be used to force asubharmonic, like the frequency 175 Hz as shown with the right column. At this pulsation frequencythe flame remains bounded where the steady state flame used to be. The deformations observed havea much lower amplitude than observed in the 25 Hz pulsating case. The flame envelope remainsbounded within its original domain. This suggests the idea of modal control that can be driven by thesiren: Move the dynamic of a flame to a higher frequency and reduce the wavelengths so that, eventhough resonant, the flame does not harm the structure.

Int. J. Turbomach. Propuls. Power 2020, 5, 9 26 of 31
a. Natural turbulence b. Amplification 25Hz c. Amplification 175Hz
X (mm) I. No. 253
Y (
mm
)
0 20 40 60 80 100 120
−40
−20
0
20
40
60
80
X (mm) I. No. 118
Y (
mm
)
0 20 40 60 80 100 120
−40
−20
0
20
40
60
80
X (mm) I. No. 28
Y (
mm
)
0 20 40 60 80 100 120
−40
−20
0
20
40
60
80
X (mm) I. No. 254
Y (
mm
)
0 20 40 60 80 100 120
−40
−20
0
20
40
60
80
X (mm) I. No. 128
Y (
mm
)
0 20 40 60 80 100 120
−40
−20
0
20
40
60
80
X (mm) I. No. 29
Y (
mm
)
0 20 40 60 80 100 120
−40
−20
0
20
40
60
80
X (mm) I. No. 255
Y (
mm
)
0 20 40 60 80 100 120
−40
−20
0
20
40
60
80
X (mm) I. No. 98
Y (
mm
)
0 20 40 60 80 100 120
−40
−20
0
20
40
60
80
X (mm) I. No. 30
Y (
mm
)
0 20 40 60 80 100 120
−40
−20
0
20
40
60
80
X (mm) I. No. 256
Y (
mm
)
0 20 40 60 80 100 120
−40
−20
0
20
40
60
80
X (mm) I. No. 108
Y (
mm
)
0 20 40 60 80 100 120
−40
−20
0
20
40
60
80
X (mm) I. No. 26
Y (
mm
)
0 20 40 60 80 100 120
−40
−20
0
20
40
60
80
Figure 26. High speed schlieren visualisations (1000 fps, single frame, full sensor resolution) on apremixed air-methane flame in free-jet configuration. Column (a): Turbulent flame. (b): Amplification25 Hz. (c): Amplification 175 Hz. All consecutive pictures are chosen and arranged so that one completepulsation cycle is visible for the modes 25 and 175 Hz. Inverted grayscale.
5.4. Improvement of the Combustion Performance Using Forcing
It was observed from the previous study that the 175 Hz pulsed flame offered a better robustnessversus lean blow-out limit than the naturally turbulent flame (without forcing) [43]. The offeredexplanation is that the deformation of the pulse flame is such that the flame front concentrates on asmaller volume and augments the density of energy, so that forcing at a rightly chosen frequency cancontribute to a better self-sustain of the flame. This feature was explored and confirmed in the study ofReference [36], where an operation point at part load known to operate poorly was improved withhelp of the siren.
Figure 27 shows the pre-programmed “Kölner Dom“ sequence of the testing procedure usingthe siren, repeated twice to highlight the similarity in the response of the flame. At first, a ramp in

Int. J. Turbomach. Propuls. Power 2020, 5, 9 27 of 31
frequency is performed to detect the eigenfrequencies of the flame (also see Reference [43] for thescanning and peak-finding procedure). After that, each resonant frequency is assessed (200, 368, and512 Hz) with variable amplitudes on the configuration of the cited paper. This is the sensibility analysis,in order to determine the amount of energy to be brought in the pulsation to drive the flame. At 368 Hzpulsation, both NOx and CO emissions could be reduced by 15%, while the combustion efficiencyimpaired at 98% at steady state could be brought back to 100%.
0
100
200
300
400
500
600
700
800
11:24:43 11:27:36 11:30:29 11:33:22 11:36:14 11:39:07 11:42:00 11:44:53 11:47:46
Fre
qu
en
cy [
Hz]
/ A
mp
litu
de
[%
]
Time [s]
Sirene Output 04/08/2016
MusicPaper Sequence
Frequency
Amplitude
620
630
640
650
660
670
680
690
700
710
720
0
5
10
15
20
25
30
35
40
45
50
11:24:43 11:27:36 11:30:29 11:33:22 11:36:14 11:39:07 11:42:00 11:44:53 11:47:46
Tem
pe
ratu
re [
K]
Ga
s [p
pm
]
Time [s]
Emission Measurement 04/08/2016
MusicPaper Sequence
CO
NO
Temp
Figure 27. Test sequence using MUSICPAPER control software. (Top) Time-sequence repeated twice,starting with 2 frequency ramps followed by 3 frequency steps, at variable amplitudes of pulsation.(Bottom) Simultaneous exhaust gas measurements.
6. Future Developments: A More Powerful Siren
Solutions are currently being tested to augment the pulsation performance while keeping thepulsator’s dimensions similar. Over the last years, requests about higher frequencies and higherpulsation levels have been formulated. The higher frequency is needed to visit up to the secondharmonic of precessing vortex cores [18,32] or spinning tangential instabilities [33]. The second is to

Int. J. Turbomach. Propuls. Power 2020, 5, 9 28 of 31
achieve pulsation levels near 155 dB SPL for calibration purposes, and at higher ambient pressuresand temperatures than standard conditions.
In the short term, we intend to produce the Siren-E (”E“ for energy) covering this typeof applications. Among the modifications, a profiled jet divergent should reduce the jet noise.The pressure performance will be quadrupled: the high pressure port will go up to 80 bar, the lowup to 40 bar, and the pressure step will be dimensioned for up to 40 bar. The device is intended to becompatible with many existing gas turbines.
The siren-E is also envisioned as a sub-part of a dynamic sensor calibration set-up. A solutionbased on the siren technology would be an alternative to the usual piston calibrators, with an enlargedoperation envelope. It can achieve in a well-controlled manner high-power pulsations and visitintermediate pressure and temperature conditions on the sensor’s membrane. The multimodal wheelallows the monitoring of several peaks, which are not harmonics of each other, generated by thesiren. The principle of retractable wheel is kept, so that the set-up’s resonant modes can be avoided.This set-up would be a first of its kind, opening the door to a new type of extreme conditions testing.
7. Conclusions
The article summarises about 20 years of research on calibrated flow forcing using three successivegenerations of siren, including the latest developments on high-frequency and multimodal excitation.The background of this study is on combustion stability. The different options for flow forcing,the specifics, the dimensioning details, and the successive features of a siren were described in detail.Examples of use show how effective low-energy forcing can be on injection dynamics. Some ideaswere proposed, such as the passivation of strong combustion instabilities using modal control bydisplacing the resonance energy to a higher harmonic, more diffusive and less harmful, or acousticenergy dissipation using the multimodal excitation. It was also shown that the discharge configurationis feasible as equipment on a power gas turbine and effective. The siren generation will be an adaptionof the current to higher energy levels, compliant with power and laboratory applications. It willtherefore be more powerful as a new calibration method and as a realistic and reliable flow controllerfor safe and quiet gas turbine operation.
8. Patents
Giuliani, F. Vorrichtung und Verfahren zum Betreiben einer Flamme (apparatus and method foroperating a flame), 2016. Patent AT516424B1.
Author Contributions: F.G.: Conceptualization, methodology, supervision, writing. M.S.: hardware and softwareaspects. N.P.: data acquisition and processing. L.A.: experimental research and laboratory curation. All authorshave read and agreed to the published version of the manuscript.
Funding: The progress in the siren technology is supported financially since 2016 by the FFG (Austrian ResearchPromotion Agency) and by the BMVIT (Austrian Federal Ministry for Transport, Innovation and Technology) inthe frame of the collaborative research ”emo(o)tion” (Engine health monitoring and refined combustion controlbased on optical diagnostic techniques embedded in the combustor, contract 861004, consortium Combustion Bayone e.U. and FH JOANNEUM) in the frame of the “Take-Off” program.
Acknowledgments: Excerpts of works performed within the DGA/PEA TITAN (Projet d’Etude Approfondie de laDélégation Générale de l’Armement, France, 1999–2002), within the EU-funded Project NEWAC (New AeroengineCore Concepts, FP6 2006–2010, contract AIP5-CT-2006-030876), and within the project MethaNull (financiallysupported by the JITU-PreSeed Grant of the Austrian Federal Ministry for Economy, Family and Youth underguidance of the AustriaWirtschaftsservice GmbH (AWS) from 2013 to 2015, Contract P1302031-PSI01). Specialthanks to Andreas Lang, Pierre Gajan and Krzysztof Solinski for their kind help. We hereby wish to acknowledgeall parties.
Conflicts of Interest: The authors declare no conflict of interest.

Int. J. Turbomach. Propuls. Power 2020, 5, 9 29 of 31
Abbreviations
The following abbreviations are used in this manuscript:
CBOne Combustion Bay One e.U.CBO4 Name of the burner described in Reference [39]d (mm) Nozzle diameter (round) or reference diameter (slot)DN (mm) Nominal pipe size (from diamètre nominal) according to standard ISO 6708emootion Project acronym, stands for “engine health monitoring and refined combustion
control based on optical diagnostic techniques embedded in the combustor”f (Hz) FrequencyfH (Hz) Resonant frequency in an Helmholtz resonatorLDA Laser Doppler Anemometerm (kg/s) Air mass flown A given number, number of teethr (J/kg/K) Air constant, r = 286 J/kg/KOPR Operating pressure ratioPIV Particle image velocimetryP0, T0 (Pa,K) Generating pressure and temperature upstream of the chocked nozzleS (mm2) Area of the critical sectionUSP Unique selling propositionx Variablew (m) Width of the slotα (rad) Angle deciding the opening of the nozzle’s slotγ (-) Heat capacity ratio of airω (rpm) Spool rotating speed
References
1. Hirschberg, A.; Rienstra, S. Elements of Aero-Acoustics; Applied Aero-Acoustics, LS 1994-04; Von KarmanInstitute for Fluid Dynamics: Brussels, Belgium, 1994.
2. Culick, F. Dynamics of Combustion Systems, Fundamentals, Acoustics and Control; Active Control of EngineDynamics; RTO AVT-VKI Special Course: Brussels, Belgium, 2001.
3. Hermann, J. Application of Active Instability Control to Heavy Duty Gas Turbines; Active Control of EngineDynamics, RTO-EN-020; RTO AVT-VKI Special Course: Brussels, Belgium, 2001; pp. 287–302.
4. Kokanovic, S.; Guidati, G.; Torchalla, S.; Schuermans, B. Active Combustion Control System forReduction of NOx and Pulsation Levels in Gas Turbines. In Proceedings of the ASME Turbo Expo:Power for Land, Sea, and Air, Barcelona, Spain, 8–11 May 2006; Volume 1, pp. 673–682. Available online:https://asmedigitalcollection.asme.org/GT/proceedings-pdf/GT2006/42363/673/4564907/673_1.pdf(accessed on 12 May 2020).
5. Lieuwen, T.C.; Yang, V. Gas Turbine Emissions; Cambridge Aerospace Series; Cambridge University Press:Cambridge, MA, USA, 2013; Volume 38.
6. Apeloig, J.M.; d”Herbigny, F.X.; Simon, F.; Gajan, P.; Orain, M.; Roux, S. Liquid-Fuel Behavior in anAeronautical Injector Submitted to Thermoacoustic Instabilities. J. Propuls. Power 2015, 31, 309–319.[CrossRef]
7. Renaud, A.; Ducruix, S.; Zimmer, L. Bistable behaviour and thermo-acoustic instability triggering in a gasturbine model combustor. Proc. Combust. Inst. 2016. [CrossRef]
8. Yu, K.; Wilson, K. Scale-Up Experiments on Liquid-Fueled Active Combustion Control. J. Propuls. Power2002, 18, 53–60. [CrossRef]
9. Dowling, A.P.; Stow, S.R. Acoustic analysis of gas turbine combustors. J. Propuls. Power 2003, 19, 751–764.[CrossRef]
10. Zinn, B. Pulse combustion applications: Past, Present and Future. In Unsteady Combustion; Kluwer AcademicPublishers: Berlin, Germany, 1996; pp. 113–137.
11. Putnam, A.; Belles, F.; Kentfield, J. Pulse combustion. Prog. Energy Combust. Sci. 1986, 12, 43–79. [CrossRef]

Int. J. Turbomach. Propuls. Power 2020, 5, 9 30 of 31
12. Boudy, F.; Durox, D.; Schuller, T.; Jomaas, G.; Candel, S. Describing Function Analysis of Limit Cycles in aMultiple Flame Combustor. J. Eng. Gas Turbines Power 2011, 133, 061502, doi:10.1115/1.4002275. [CrossRef]
13. Der Reichsminister der Luftfahrt und Oberbefehlshaber der Luftwaffe, Vorwald. FZG 76, Gerätehandbuch,Detailierte Konstruktions-, Wartungs- und Serviceanleitung. Teil 3: Triebwerk; Fieseler Fi-103. D. (Luft) T.2076,g. Kdos.: Flensburg, Germany, 1944.
14. Reynst, F.H. Pulsating Combustion: The Collected Works of FH Reynst; Pergamon Press: Oxford, UK, 1961.15. Meng, X.; de Jong, W.; Kudra, T. A state-of-the-art review of pulse combustion: Principles, modeling,
applications and R&D issues. Renew. Sustain. Energy Rev. 2016, 55, 73–114. [CrossRef]16. Dowling, A.; Morgans, A. Feedback control of combustion oscillations. Annu. Rev. Fluid Mech. 2005,
37, 151–182. [CrossRef]17. Leitgeb, T.; Schuller, T.; Durox, D.; Giuliani, F.; Koeberl, S.; Woisetschlaeger, J. Interferometric determination
of heat release rate in a pulsated flame. Combust. Flame 2013, 160, 589–600. [CrossRef]18. Lückoff, F.; Sieber, M.; Paschereit, C.O.; Oberleithner, K. Phase-Opposition Control of the Precessing Vortex
Core in Turbulent Swirl Flames for Investigation of Mixing and Flame Stability. J. Eng. Gas Turbines Power2019, 141, 111008, doi:10.1115/1.4044469. [CrossRef]
19. Giuliani, F.; Gajan, P.; Diers, O.; Ledoux, M. Influence of pulsed entries on a spray generated by anair-blast injection device-An experimental analysis on combustion instability processes in aeroengines.Proc. Combust. Inst. 2002, 29, 91–98. [CrossRef]
20. Choudhury, P.; Gerstein, M.; Mojardy, R. A novel feedback concept for combustion instabilities in ramjet.In Proceedings of the 22rd JANNAF Combustion Meeting, Johns Hopkins Univ, Baltimore, MD, USA,7–10 October 1985.
21. Parikh, P.G.; Moffat, R.J. Resonant entrainment of a confined pulsed jet. J. Fulid Eng. 1982, 104, 482–488.[CrossRef]
22. Yu, K.; Wilson, K.; Parr, T.; Smith, R.; Schadow, K. Characterization of pulsating spray droplets and theirinteraction with vortical structures. In Proceedings of the 34th Aerospace Sciences Meeting and Exhibit,AIAA 96-0083, Reno, NV, USA, 15–18 January 1996.
23. Burnel, S.; Thomas, J. Influence de la forme d’entrée sur un écoulement pulsé en canalisation cylindrique.J. Mécanique Appliquée 1978, 2, 399–417.
24. Cheung, W.; Sims, G.; Copplestone, R.; Tilston, J.; Wilson, C.; Stow, S.R.; Dowling, A.P. Measurement andanalysis of flame transfer function in a sector combustor under high pressure conditions. In Proceedingsof the ASME Turbo Expo 2003, Collocated with the 2003 International Joint Power Generation Conference.American Society of Mechanical Engineers, GT2003-38219, Atlanta, GA, USA, 16–19 June 2003; pp. 187–194.
25. Eckstein, J.; Freitag, E.; Hirsch, C.; Sattelmayer, T.; von der Bank R..; Schilling, T. Forced Low-Frequency SprayCharacteristics of a Generic Airblast Swirl Diffusion Burner. J. Eng. Gas Turbines Power 2005, 127, 301–306.[CrossRef]
26. Giuliani, F.; Lang, A.; Gradl, K.J.; Siebenhofer, P.; Fritzer, J. Air flow modulation for refined control of thecombustion dynamics using a novel actuator. J. Eng. Gas Turbine Power 2012. [CrossRef]
27. Gajan, P.; Strzelecki, A.; Platet, B.; Lecourt, R.; Giuliani, F. Experimental Investigation of Spray BehaviorDownstream of an Aeroengine Injector with Acoustic Excitation. J. Propuls. Power 2007, 23, 390–397.[CrossRef]
28. Giuliani, F.; Wagner, B.; Woisetschläger, J.; Heitmeir, F. Laser Vibrometry for Real-Time Combustion StabilityDiagnostic. In Proceedings of the ASME Turbo Expo 2006: Power for Land, Sea and Air, GT2006-90413,Barcelona, Spain, 8–11 May 2006.
29. Lang, A.; Leitgeb, T.; Woisetschläger, J.; Strzelecki, A.; Gajan, P.; Giuliani, F. Analysis of a pulsedflame at intermediate pressure. In Proceedings of the ISFV13-13th International Symposium on FlowVisualization/FLUVISU12-12th French Congress on Visualization in Fluid Mechanics, Nice, France,1–4 July 2008.
30. Giuliani, F.; Leitgeb, T.; Lang, A.; Woisetschlaeger, J. Mapping the density fluctuations in a pulsed air-methaneflame using laser-vibrometry. J. Eng. Gas Turbines Power 2010, 132. [CrossRef]
31. Renaud, A.; Ducruix, S.; Scouflaire, P.; Zimmer, L. Experimental study of the interactions between air flowrate modulations and PVC in a swirl-stabilised liquid fuel burner. In Proceedings of the ASME Turbo Expo,GT2015-42775, Montreal, QC, Canada, 15–19 June 2015.

Int. J. Turbomach. Propuls. Power 2020, 5, 9 31 of 31
32. Renaud, A.; Ducruix, S.; Zimmer, L. Experimental Study of the Precessing Vortex Core Impact on the LiquidFuel Spray in a Gas Turbine Model Combustor. J. Eng. Gas Turbines Power 2019, 141. [CrossRef]
33. Ghirardo, G.; Juniper, M.P. Azimuthal instabilities in annular combustors: Standing and spinning modes.Proc. R. Soc. A: Math. Phys. Eng. Sci. 2013, 469. [CrossRef]
34. Giuliani, F.; Paulitsch, N.; Cozzi, D.; Görtler, M.; Andracher, L. An assessment on the benefits of additivemanufacturing regarding new swirler geometries for gas turbine burners. In Proceedings of the ASMETurbo Expo 2018: Turbomachinery Technical Conference and Exposition. American Society of MechanicalEngineers, GT2018-75165, Oslo, Norway, 11–15 June 2018.
35. Lang, A. Unsteady Combustion Phenomena in Current and Future Aero Engines. Ph.D. Thesis, TU Graz,Graz, Austria, 2011.
36. Giuliani, F.; Pfefferkorn, L.; Kraft, G.E. Improvement of impaired combustion conditions at some off-designoperation by driving a precisely controlled modulation of the burner air feed. In Proceedings of the ASMETurbo Expo, GT2017-64429, Charlotte, CA, USA, 26–30 June 2017.
37. Giuliani, F.; Reiss, H.; Stuetz, M.; Moosbrugger, V.; Silbergasser, A. Readings on specific gas turbine flamebehaviours using an industrial combustion monitoring system. In Proceedings of the ASME Turbo Expo,GT2016-56166, Seoul, Korea, 13–17 June 2016.
38. Andracher, L.; Giuliani, F.; Paulitsch, N.; Moosbrugger, V. Progress on Combined Optic-Acoustic Monitoringof Combustion in a Gas Turbine. In Proceedings of the ASME Turbo Expo 2020, Turbomachinery TechnicalConference & Exposition, GT2020-16007, London, UK, 22 June 2020.
39. Moosbrugger, V.; Giuliani, F.; Paulitsch, N.; Andracher, L. Progress in burner design using additivemanufacturing with a monolithic approach and added features. In Proceedings of the TurbomachineryTechnical Conference & Exposition, ASME Turbo Expo 2019, GT2019-90720, Phoenix, AZ, USA,17–21 June 2019.
40. Giuliani, F.; Andracher, L.; Moosbrugger, V.; Paulitsch, N.; Hofer, A. Combined Optic-Acoustic Monitoringof Combustion in a Gas Turbine. Int. J. Turbomach. Propulsion Power 2020, Submitted, under revision.
41. Seybert, A.; Ross, D. Experimental determination of acoustic properties using a two-microphonerandom-excitation technique. J. Acoust. Soc. Am. 1977, 61, 1362–1370. [CrossRef]
42. Padois, T.; Berry, A.; Gauthier, P.A.; Joshi, N. Beamforming matrix regularization and inverse problemfor sound source localization: Application to aero-engine noise. In Proceedings of the 19th AIAA/CEASAeroacoustics Conference, Berlin, Germany, 27–29 May 2013; p. 2212.
43. Giuliani, F.; Moosbrugger, V.; Stuetz, M.; Leitgeb-Simandl, T. Optimisation of support fuel consumptionburning low heat value gas using controlled combustion oscillations. In Proceedings of the ASME TurboExpo, GT2015-42377, Montreal, QC, Canada, 15–19 June 2015.
44. Kraft, G.E.; Giuliani, F.; Pfefferkorn, L.; Paulitsch, N.; Andracher, L. Heat resistant probe combiningoptic and acoustic sensors for advanced combustion monitoring including detection of flame instabilities.In Proceedings of the ASME Turbo Expo, GT2017-63626, Charlotte, CA, USA, 26–30 June 2017.
45. Jeong, J.; Hussain, F. On the identification of a vortex. J. Fluid Mech. 1995, 285, 69–94. [CrossRef]
c© 2020 by the authors. Licensee MDPI, Basel, Switzerland. This article is an open accessarticle distributed under the terms and conditions of the Creative Commons Attribution(CC BY-NC-ND) license (https://creativecommons.org/licenses/by-nc-nd/4.0/).
Copyright © 2022 FDOKUMEN