Evidence for orbital and North Atlantic climate forcing in alpine ...
64
This is a repository copy of Evidence for orbital and North Atlantic climate forcing in alpine Southern California between 125 and 10 ka from multi-proxy analyses of Baldwin Lake . White Rose Research Online URL for this paper: http://eprints.whiterose.ac.uk/117010/ Version: Accepted Version Article: Glover, K.C. orcid.org/0000-0002-1616-0215, MacDonald, G.M., Kirby, M.E. et al. (5 more authors) (2017) Evidence for orbital and North Atlantic climate forcing in alpine Southern California between 125 and 10 ka from multi-proxy analyses of Baldwin Lake. Quaternary Science Reviews, 167. pp. 47-62. ISSN 0277-3791 https://doi.org/10.1016/j.quascirev.2017.04.028 Article available under the terms of the CC-BY-NC-ND licence (https://creativecommons.org/licenses/by-nc-nd/4.0/ [email protected] https://eprints.whiterose.ac.uk/ Reuse This article is distributed under the terms of the Creative Commons Attribution-NonCommercial-NoDerivs (CC BY-NC-ND) licence. This licence only allows you to download this work and share it with others as long as you credit the authors, but you can’t change the article in any way or use it commercially. More information and the full terms of the licence here: https://creativecommons.org/licenses/ Takedown If you consider content in White Rose Research Online to be in breach of UK law, please notify us by emailing [email protected] including the URL of the record and the reason for the withdrawal request.
-
Upload
khangminh22 -
Category
Documents
-
view
1 -
download
0
Transcript of Evidence for orbital and North Atlantic climate forcing in alpine ...

This is a repository copy of Evidence for orbital and North Atlantic climate forcing in alpine Southern California between 125 and 10 ka from multi-proxy analyses of Baldwin Lake.
White Rose Research Online URL for this paper:http://eprints.whiterose.ac.uk/117010/
Version: Accepted Version
Article:
Glover, K.C. orcid.org/0000-0002-1616-0215, MacDonald, G.M., Kirby, M.E. et al. (5 more authors) (2017) Evidence for orbital and North Atlantic climate forcing in alpine Southern California between 125 and 10 ka from multi-proxy analyses of Baldwin Lake. Quaternary Science Reviews, 167. pp. 47-62. ISSN 0277-3791
https://doi.org/10.1016/j.quascirev.2017.04.028
Article available under the terms of the CC-BY-NC-ND licence (https://creativecommons.org/licenses/by-nc-nd/4.0/
[email protected]://eprints.whiterose.ac.uk/
Reuse
This article is distributed under the terms of the Creative Commons Attribution-NonCommercial-NoDerivs (CC BY-NC-ND) licence. This licence only allows you to download this work and share it with others as long as you credit the authors, but you can’t change the article in any way or use it commercially. More information and the full terms of the licence here: https://creativecommons.org/licenses/
Takedown
If you consider content in White Rose Research Online to be in breach of UK law, please notify us by emailing [email protected] including the URL of the record and the reason for the withdrawal request.

Glover et al. – Alpine Southern California climatic change since 125 ka – QSR submission
ABSTRACT 1
We employed a new, multi-proxy record from Baldwin Lake (~125 - 10 ka) to examine drivers 2
of terrestrial Southern California climate over long timescales. Correlated bulk organic and 3
biogenic silica proxy data demonstrated high-amplitude changes from 125 - 71 ka, suggesting 4
that summer insolation directly influenced lake productivity during MIS 5. From 60 - 57 ka, 5
hydrologic state changes and events occurred in California and the U.S. Southwest, though the 6
pattern of response varied geographically. Intermediate, less variable levels of winter and 7
summer insolation followed during MIS 3 (57 - 29 ka), which likely maintained moist conditions 8
in Southern California that were punctuated with smaller-order, millennial-scale events. These 9
Dansgaard-Oeschger events brought enhanced surface temperatures (SSTs) to the eastern Pacific 10
margin, and aridity to sensitive terrestrial sites in the Southwest and Southern California. Low 11
temperatures and reduced evaporation are widespread during MIS 2, though there is increasing 12
evidence for moisture extremes in Southern California from 29 - 20 ka. Our record shows that 13
both orbital-scale radiative forcing and rapid North Atlantic temperature perturbations were 14
likely influences on Southern California climate prior to the last glacial. However, these forcings 15
produced a hydroclimatic response throughout California and the U.S. Southwest that was 16
geographically complex. This work highlights that it is especially urgent to improve our 17
understanding of the response to rapid climatic change in these regions. Enhanced temperature 18
and aridity are projected for the rest of the 21st century, which will place stress on water 19
resources. 20
21
22
23
*ManuscriptClick here to view linked References

Glover et al. – Alpine Southern California climatic change since 125 ka – QSR submission
1. Introduction 24
Throughout the U.S. Southwest, Great Basin, and California, climate model projections for the 25
21st century indicate that increased radiative forcing that will produce enhanced temperatures, 26
aridity, and climate variability (Overpeck et al., 2013). These projections prompted our 27
investigation of regional sensitivity to past climate change and potential forcing mechanisms 28
over the past 125 ka, in a sector of the U.S. that is already water-stressed and increasingly 29
populous (Georgescu et al., 2012). Retrospective studies are crucial for deepening our 30
understanding of large-scale climate dynamics and teleconnections, and assessing the potential 31
range of temperature and hydrological variability. Long-lasting droughts in the West during the 32
Late Quaternary have been documented (e.g. Brunelle and Anderson, 2003; Heusser et al., 2015; 33
MacDonald and Case, 2005; Mensing et al., 2013), most of which were associated with warm 34
intervals (Woodhouse et al., 2010). Conversely, extreme wet events were also a feature of West 35
Coast climates (e.g. Bird and Kirby, 2006; Kirby et al., 2013, 2012). These prolonged 36
hydroclimatic events, on the order of several decades or centuries, have no analogue in the past 37
150 years of instrumental records. 38
39
A growing body of climatic records from the U.S. Southwest, Great Basin, and Southern 40
California suggests regional sensitivity to a variety of climate drivers that include an 41
atmospheric-oceanic teleconnection with the North Atlantic (Asmerom et al., 2010; MacDonald 42
et al., 2008; Oster et al., 2014; Reheis et al., 2015; Wagner et al., 2010), Pacific Ocean (Hendy 43
and Kennett, 2000a; Heusser, 1998; Lund and Mix, 1998) boreal insolation (Lachniet et al., 44
2014; Moseley et al., 2016), and migrating storm tracks (Garcia et al., 2014; Kirby et al., 2006; 45
Owen et al., 2003). Offshore marine cores have documented long histories through several 46
Marine Isotope Stages (MISs), but with dynamically different responses compared to terrestrial 47
Glover et al. – Alpine Southern California climatic change since 125 ka – QSR submission
sites (Heusser and Basalm, 1977; Hooghiemstra et al., 2006). The longer-term climate history of 48
terrestrial Southern California throughout past glaciations and multiple MISs is lesser-known, 49
compared to abundant studies on the Holocene and last glacial (MIS 2). 50
51
In this study, a newly-acquired core from Baldwin Lake in the San Bernardino Mountains (SBM) 52
that spanned 125 – 10 ka provided insight to the long-term temperature and hydrological 53
variability of Southern California, and associated climatic drivers. We use this material to 54
address the following questions: Is alpine Southern California sensitive to orbital and North 55
Atlantic forcing over long timescales? How does the record of paleoenvironmental change and 56
climatic variability at Baldwin Lake compare to other Southern California, Great Basin and 57
Southwestern sites over the past 125 – 20 ka? 58
59
2. Setting 60
Located east of the Los Angeles Basin, the SBM are part of the Transverse Ranges and include 61
some of the highest elevation peaks in Southern California. The SBM form a barrier between the 62
interior Mojave and Sonoran Deserts, and the summer-dry, winter-wet Mediterranean conditions 63
towards the coast. The San Andreas and Mill Creek Faults bound either side of the SBM range. 64
Triassic- to Cretaceous-age granitic rocks dominate the SBM range (Morton and Miller, 2006), 65
with other allocthonous sedimentary terranes of Precambrian and Mesozoic age (Dibblee, 1964). 66
High relief valleys and slopes are often covered with Quaternary deposits, including alluvium, 67
talus, and fanglomerates. 68
69
Baldwin Lake (34.275N, 116.8˚W) lies at an elevation of 2060 m in the Big Bear Valley of the 70
SBM, approximately 160 km east of the Pacific coastline (Figure 1). It is presently an 71
Glover et al. – Alpine Southern California climatic change since 125 ka – QSR submission
intermittent lake, and one of two major lake basins in Big Bear Valley, with a 79 km2 watershed 72
(Big Bear Lake TMDL Task Force, 2012). To the west, the Big Bear Lake watershed is 96 km2, 73
and supported a lake throughout the Holocene (Kirby et al., 2012; Paladino, 2008). Sugarloaf 74
Mountain to the south (3033 m) is the primary sediment source of the Baldwin basin, via the 14 75
km2 Sugarloaf fan (Flint and Martin, 2012; Leidy, 2006). Smaller-scale faults occur throughout 76
Big Bear Valley, including a thrust fault <1 km east of Baldwin Lake on Nelson Ridge (Flint and 77
Martin, 2012). The highest elevations of the Transverse Ranges were glaciated during MIS 2; 78
moraines still persist on the northern flank of Mt. San Gorgonio (3,506 masl) and mark later 79
Holocene readvances (Owen et al., 2003). 80
81
Mediterranean winter-wet and summer-dry conditions prevail throughout the SBM and Southern 82
California, modulated by upwelling and currents on the North American Pacific margin. The 83
configuration of the North Pacific High and North American Low, and westerly winds, drive this 84
strong precipitation seasonality (Barron et al., 2003; Cayan and Peterson, 1989). Seasonal 85
migration of the Polar Jet Stream (PJS) brings Pacific-derived moisture in the winter months, and 86
Southern California’s yearly precipitation averages 13 - 64 cm at lower elevations, and 64 – 150 87
cm in the mountains (www.wrh.noaa.gov). Annual precipitation averages are comparatively 88
higher in Big Bear Valley, averaging ~220 cm/yr (U.S. Climate Data, 2016) and the moisture is 89
largely derived from North Pacific winter storms (Wise, 2010). Other precipitation sources 90
include orographic uplift, lateral snow drift (Minnich, 1984), and occasional summer storms that 91
result from convection or dissipating tropical cyclones (Tubbs, 1972). Average July high 92
temperature at Big Bear City is 27.2 ˚C, and January’s average high is 8.3 ˚C (U.S. Climate Data, 93
2016). 94
95

Glover et al. – Alpine Southern California climatic change since 125 ka – QSR submission
3. Materials and Methods 96
3.1 Core recovery and Initial Core Description (ICD) 97
We re-cored Baldwin Lake in August 2012 at the basin depocenter (34˚16.56633’, -98
116˚48.61182’) with a CME-95 truck-mounted hollow stem auger drill. Prior coring at Baldwin 99
Lake in 2004 yielded a 14.2 m sequence referred to as BLDC04-2 (Figure 1; Kirby et al., 2006). 100
We refer to the new sequence of cores as BDL12, which consisted of overlapping 2.5 foot 101
sections from two separate holes totaling 27m, now archived at UCLA. Cores were split at 102
UCLA in 2013, then photographed and described at the Limnological Research Center (LRC) in 103
2014, following conventions for Initial Core Description (ICD; Schnurrenberger et al., 2003). 104
Key sedimentary structures and changes, described by depth from surface, have been 105
summarized for the Supplemental Information. 106
107
3.2 Sedimentary Analyses 108
Initial magnetic susceptibility data were collected at UCLA with a Bartington MS2e sensor, and 109
later replicated at LRC. The GeoTek Multi-Sensor Core Logger at LRC collected 0.5-cm interval 110
data. Loss-on-ignition (LOI) analysis at 1-cm intervals throughout BDL12 determined the bulk 111
organic and carbonate content of the sediment (Dean, 1974; Heiri et al., 2001). Organic content 112
was determined from the mass lost from1-cm3 volume samples after 1-hour burns at 550˚C in a 113
muffle furnace, and carbonate content was calculated after subsequent 1-hour burns at 950˚C. 114
Core density was calculated from sample dry weight values recorded during LOI analysis. Bulk 115
inorganic values were percentage values, calculated from the remaining sample weight after all 116
LOI burns compared to the initial dry weight. Mass accumulation rates (MARs) were calculated 117
by multiplying a horizon’s dry density by the sedimentation rate derived from the age model 118

Glover et al. – Alpine Southern California climatic change since 125 ka – QSR submission
(Rack et al., 1995). The 1-cm LOI and MS data were used to correlate the core sections, and 119
determine a depth-below-surface value for each horizon of the sequence. 120
121
Grain size sampling was initially done at 50 cm intervals (Silveira, 2014), with later sampling 122
that targeted the basal coarse-grained facies, and the slowly-deposited MIS 2 interval. Samples 123
(n=93) were digested in 30-35% H2O2 to remove organics, then 1N HCl to remove carbonates, 124
and lastly 1M NaOH to remove biogenic silicates, with intermittent centrifuging. Analyses were 125
performed on a Malvern Mastersizer 2000 laser diffraction grain size analyzer at CSUF. The 126
results were combined with high-resolution grain-size data from core BLDC04 (Blazevic et al., 127
2009) after re-aligning BLDC04’s measured depths to correlate with BDL12 (see Supplemental 128
Data). We reported the grain size mode (i.e., most frequently-occurring size) here in µm, after 129
averaging values at 25-cm intervals for the core above 15 m, and at 50-cm intervals for the core 130
section spanning 15 – 27 m. This was done to reduce noise and variable sampling resolutions 131
throughout the ~27 m sequence. X-ray fluorescence (XRF) values were taken with a portable 132
Innov-X Analyzer at 5 cm intervals along a split core surface that was lined with Ultralene film. 133
Elements reported here include titanium (Ti), iron (Fe), calcium (Ca), potassium (K), and 134
manganese (Mn). 135
136
3.3 Biogenic Silica (BSi) 137
We selectively analyzed biogenic silica (BSi) throughout the core in order to determine if lake 138
productivity was a primary contributor to organic content changes. Amorphous silica is a 139
structural component of diatoms, radiolarians, sponges, and phytoliths in aquatic environments 140
Its measurement can potentially establish paleoproductivity and orbital influence in long lake 141
histories (e.g. Prokopenko et al., 2006; Wohlfarth et al., 2008). Samples (n=32) from each of the 142
Glover et al. – Alpine Southern California climatic change since 125 ka – QSR submission
Marine Isotope Stages were analyzed with wet-alkaline extraction (Conley and Schelske, 2002) 143
to characterize the relationship between organic content and BSi in different core facies. 144
145
3.4 Chronologic control – assumptions and approach 146
We present a new age model here that extends to Marine Isotope Stage 5, and replaces the 147
chronology of Kirby et al. (2006). The prior BLDC04-2 chronology included bulk dates that 148
were not securely cross-dated with other methods, such as macrofossils or tephra layers 149
(Zimmerman and Myrbo, 2015). From BDL12, AMS 14C dating was conducted on seven wood 150
and charcoal samples from the upper 8 m (Table 1). Infrared Stimulated Luminescence (IRSL) 151
single-grain analysis was conducted on lower sections of the sequence that possessed a higher 152
sand fraction (Buylaert et al., 2009; Rhodes, 2015). IRSL was applied to 150-175 µm K-feldspar 153
grains, a technique increasingly used in Southern California, where quartz demonstrates low 154
sensitivity in many locations (Garcia et al., 2014; Lawson et al., 2012). Four 20-cm sections of 155
core were removed with a handsaw under luminescence laboratory lighting conditions, and a 156
~1.5 cm diameter cylinder of sediment was extracted from the core interior for IRSL dating. 157
Once disturbed, these sections were not further analyzed. Preparation procedures, measurement 158
at UCLA, and analysis followed Rhodes (2015). Fading measurements were used to correct both 159
the IRSL signal measured at 50˚C and the post-IR IRSL signal at 225˚C, which demonstrated 160
mean g-values of 0.03 and 0.015 respectively. Dose rates were calculated using ICP-MS (for U, 161
Th) and ICP-OES (for K) determinations at SGS, Vancouver, Canada. 162
163
In order to construct the age model, we hypothesized that lake productivity was the primary 164
contributor to total organic deposition and responded to changes in radiation. This was based 165

Glover et al. – Alpine Southern California climatic change since 125 ka – QSR submission
upon establishing relationships between key proxies, and making certain assumptions about 166
basin response from the available data. First, we found that total organic matter and BSi data 167
were correlated to each other (r=0.81, p<0.001) throughout the basin’s history. This suggests that 168
primary productivity, rather than preservation, was a key contributor to organic matter variation 169
(Colman et al., 1995; Conley and Schelske, 2002; Kaplan et al., 2002). Second, we assume that 170
local radiation is an important control on length of the freshwater photosynthetic season (e.g. 171
Colman et al., 1995; Hu et al., 2003) and seasonal ice cover of the lake surface (McKay et al., 172
2008; Melles et al., 2006; Prokopenko et al., 2006). This assumption underlies our use of 173
relatively local (30˚N) summer insolation values as a proxy for seasonal light intensity, and 174
primary driver for the associated peaks and troughs in total organic matter. This relationship 175
between 30˚N summer insolation and organic deposition was initially proposed for the site in the 176
BLDC04-2 study (Kirby et al., 2006). The new organic matter dataset presented here replicated 177
this apparent correlation to 30˚N insolation in a 20-kyr section of core constrained with 178
radiocarbon dating (40 – 20 ka). 179
180
Visual curve matching (Groot et al., 2014) is a technique often used in the absence of other 181
chronologic data or techniques (e.g. Tzedakis et al., 2001), or to supplement existing dates (e.g. 182
Cacho et al., 1999). We employed it here it as a first-pass interpretation of basin response to 183
climate drivers, and to construct a working age model for a newly-recovered long paleorecord. A 184
series of tie points that match five peaks and troughs in the insolation and bulk organics datasets 185
were established during MIS 5 (~116 – 71 ka; Table 1; Figure 2b). This exercise assumes that 186
basin response to insolation shifts was immediate. While highly-resolved, directly-dated 187
speleothem records spanning MIS 6 – 1 showed that Great Basin paleotemperature response 188
Glover et al. – Alpine Southern California climatic change since 125 ka – QSR submission
lagged boreal insolation shifts by ~3 kyr (Lachniet et al., 2014), there is not yet evidence for a 189
similar lag at California sites. Age uncertainties from recent California paleorecords are 190
comparatively greater (e.g. Herbert et al., 2001; Kirby et al., 2015; Oster and Kelley, 2016; this 191
study). We ascribed a 2-kyr uncertainty to each tie-point for the Bacon 2.2 model (e.g. Mahan et 192
al., 2014). This allowed for the possibility of 1) leads/lags in lake response compared to 193
insolation, 2) influences other than temperature on organic matter production (e.g. nutrient 194
cycling, moisture variability, and lake level variability), and 3) horizons where the tie-points 195
overlapped with IRSL dates. 196
197
Bacon 2.2 is a Bayesian approach to modeling the age of terrestrial cores (Blaauw and Christen, 198
2011), and was employed for our age-depth model, incorporating 14C dates, 50˚C and post-IR 199
225˚C luminescence dates, and five tie-points (Table 1, Figure 2). Bacon 2.2 algorithms perform 200
calendar year conversions on 14C dates using IntCal13 (Reimer, 2013), and incorporate 2-sigma 201
results in the model. In our model, the sediment mean accumulation rates was set to 50 cm/yr, 202
and core section thickness was 50 cm, both suggested by the program (Blaauw and Christen, 203
2011). Default priors for memory strength and memory mean (i.e., the degree to which 204
sedimentation rate depends on that of adjacent horizons) were retained (Blaauw and Christen, 205
2011; Goring et al., 2012). Luminescence sample J3096 was excluded, as it had low yield, 206
displayed non-standard TL during preheat measurements, and was not in stratigraphic agreement 207
with the other three samples (Table 1). A sharp break between clayey silt and the basal coarse-208
grained sandy layer downsection occurred at 2596 cm, possibly indicating of a hiatus. The 209
uppermost lake sediments above 152 cm, where the youngest radiocarbon date was obtained, 210
Glover et al. – Alpine Southern California climatic change since 125 ka – QSR submission
have an uncertain age. Bacon 2.2 thus extrapolated the model between 0 – 152 cm without 211
constraints. 212
213
4. Results and Proxy 214
4.1 Age Model 215
The weighted mean ages from the Bacon 2.2 age model (Figure 3) ranged from 125.7 – 5.3 ka 216
cal BP, and were used for plotting figures, and the ensuing discussion of regional paleoclimate 217
events. Without reliable age control above 152 cm, we were not confident that the Middle 218
Holocene was the true age of the core top, and have excluded the desiccated upper 1 m of 219
BDL12 from the ensuing figures and discussion. Direct dating of a charcoal fragment yielded a 220
date of ~11.9 ka, and was obtained from a 3-cm charcoal layer (154-151 cm) not captured in the 221
BLDC04-2 core. Previously, the upper material in the basin had been constrained by a ~20.3 ka 222
bulk date at 114-117 cm (Kirby et al., 2006). Our new series of 14C dates suggested, instead, that 223
basin deposition continued after the Last Glacial Maximum (LGM) and included the Pleistocene-224
Holocene transition, though at very slow sedimentation rates (<0.03 cm/yr). The fading-corrected 225
IRSL ages measured at 50˚C and post-IR IRSL at 225˚C were within range of the tie-points 226
established (Table 1, Figure 2). The Bacon 2.2 age model (Figure 2), however, produced ages at 227
the tie-point horizons that were 0.6 – 2.5 kyr offset from the ages initially assigned (Table 1). 228
This was the result of assigning each a ±2 kyr error, and the influence of the IRSL dates in the 229
model. 230
231
4.2 Sedimentology and Summary of Proxy Data 232
The BDL12 sequence was 91.9% complete, with some missing portions due to coring gaps and 233
disturbances. Details of core stratigraphy are described by depth and approximate age in the 234

Glover et al. – Alpine Southern California climatic change since 125 ka – QSR submission
Supplemental Information. Key changes in core stratigraphy and sedimentological data (dry 235
density, inorganics, MARs, and grain size) are shown by depth in Figure 3. Grain size mode 236
results throughout the sequence were consistently in the range of silt (2-50 µm), except for the 237
basal sand unit (mode >400 µm). We summarized important sedimentological changes, as 238
related to density and grain size, in Table 2 with the modifiers “sandy,” or “clayey” for cases 239
when these size fractions were ≥20%, and the silt remained the dominant fraction (≥60%). Figure 240
4 shows proxy data by age and MIS, with 30˚N summer insolation shifts. MIS 5 substages are 241
referenced with letters (e.g. MIS 5a), though age boundaries between substages have no global 242
standard, and tend to vary geographically (Imbrie et al., 1984). 243
244
4.3 Relationships and Environmental Interpretation for Baldwin Lake Proxy Data 245
We assumed the following relationships between proxy data, environmental conditions, and local 246
summer insolation in our interpretation of site history. The immediate response for primary 247
productivity to 30˚N summer insolation during MIS 5 and MIS 3/2 was discussed in detail in 248
section 3.4, as this assumption underpinned the age model. For Baldwin Lake, we interpreted 249
positive correlation between BSi and total organic content as evidence that paleoproductivity was 250
the dominant control on organic deposition. Several factors could have influenced the large 251
changes observed in the coupled organic-BSi proxy data throughout the record. Correlated 252
organic-BSi data have indicated shifts in lake water temperature at other high latitude or altitude 253
sites (e.g. Blass et al., 2007; Hahn et al., 2013; McKay et al., 2008; Nussbaumer et al., 2011; 254
Street et al., 2012; Vogel et al., 2013). High concentrations of BSi may also be linked to periods 255
of increased runoff, and nutrients, within catchments (Ampel et al., 2008; Conley and Schelske, 256
2002). Organic deposition as a proxy for relative wetness in the SBM has also been suggested, 257
Glover et al. – Alpine Southern California climatic change since 125 ka – QSR submission
with 30˚N summer insolation impacting precipitation dynamics and moisture delivery to 258
Southern California (Kirby et al., 2006). While it is challenging to disentagle how much each of 259
these processes contributed to bulk organic measurements over time, key periods when one 260
process seemed most dominant are discussed in the paleoenvironmental history of the basin 261
below (section 5.1), with supporting evidence. 262
263
Times of high organic deposition generally coincided with low values of both magnetic 264
susceptibility and dry density (Table 2). Low MS values (<12 SI) throughout most of BDL12 265
(Figure 4, Table 2) suggest this proxy detected a largely diamagnetic fraction throughout basin 266
history (Dearing, 1999). Bedrock sources are largely granodioritic, yet the MS signal was 267
dampened at times of episodic, high-energy clastic input. We hypothesized that in this basin, 268
sediment frequently underwent sulfide reduction at the lake bottom, particularly when the lake 269
was productive and organic deposition was ≥10%). Such a reduction process can partially or 270
completely dissolve magnetite, and produce low MS values (Dearing, 1999; Kirby et al., 2007; 271
Nowaczyk et al., 2006). 272
273
Trace element data aided our interpretation of allochthonous deposition, lake level changes, and 274
lake ventilation. We interpreted relatively higher values of Ti, and in part, Fe, to phases of 275
increased detrital, non-biogenic sediment deposition (Kylander et al., 2011; Vogel et al., 2013). 276
Ca values changed in tandem with and were highly correlated to CaCO3 (r=0.84; Figure 4h-i), 277
suggesting that trace element Ca was largely derived from the precipitation of CaCO3, rather 278
than bedrock sources in the watershed. Such calcite precipitation tends to occur in lake systems 279
when warm water temperatures, and potentially lake regression, produce saturation, leading to 280

Glover et al. – Alpine Southern California climatic change since 125 ka – QSR submission
high CaCO3 values (Hodell et al., 1998). High values in the manganese to titanium ratio (Mn:Ti; 281
Figure 4) have been interpreted as a proxy for a well-mixed lake with bottom ventilation 282
(Kylander et al., 2011). Times of high Ca, CaCO3 and Mn:Ti, including 114 – 107 ka, 87 – 75 283
ka, and 14 – 10 ka (Figure 4), and were distinct facies, with lighter gray-brown sediment and, 284
from 87 – 75 ka, horizons with mollusk shells. We interpreted the combination of increased Ca, 285
CaCO3, and Mn:Ti to indicate phases when Baldwin Lake was warmer and well-ventilated. This 286
warming may have also resulted from the lake shallowing. At horizons when all three of these 287
parameters remained low, we assumed a stratified lake. When such conditions are coupled with 288
high productivity, the deposition and bacterial decomposition of phytoplankton could produce 289
reducing conditions and an anoxic lake bottom, and thus removal of a strong magnetic signal 290
(Dearing, 1999). 291
292
5. Discussion 293
5.1 Baldwin Lake’s Environmental Change from 125 – 10 ka 294
The basal luminescence age results at 2700 cm depth, with potential dates of 136 ± 10 ka (50˚C 295
IRSL signal) or 124 ± 8 ka (225˚C IRSL signal; Table 1), suggested that deposition of the 296
BDL12 sequence began during MIS 5e. This facies was largely comprised of dense, coarse, 297
massive sand. With <1% fine grains, we interpreted these basal sediments to be well-winnowed, 298
and deposited under high-energy conditions. Fluvial and colluvial processes likely dominated 299
erosion and transport in the alpine valley at this time, with the Baldwin Basin possibly connected 300
to adjacent Lower Bear Basin (Figure 1). The transition to finer-grained clayey silt was abrupt 301
and interpreted as a hiatus, largely because IRSL-dated results from either side of the break have 302
a difference of ≥10 kyr over 1.3 m of core. Rapid sedimentation from Sugarloaf Mountain, 303

Glover et al. – Alpine Southern California climatic change since 125 ka – QSR submission
including possible landslide events (e.g. the Sugarloaf Fan; Figure 1), may have aided closure of 304
the basin, and the separation of the Baldwin and Lower Bear Lake basins (Leidy, 2006; Stout, 305
1976). 306
307
Trace elements that were key to the interpretation of MIS 5e conditions are reported in Table 2 308
with approximate values. Sediment upsection of the basal sand possessed high Ti and Fe, and 309
low carbonate and organic content (Table 2, Figure 4). This largely detrital, inorganic deposition 310
suggests that Baldwin Lake remained deep, unproductive, and cool for the first half of MIS 5d 311
during a summer insolation minimum at 116 ka. Ca, CaCO3, and organics later increased at 112 312
ka while MS decreased, indicating the lake became warmer, shallower, and more productive. 313
314
The period centered around MIS 5c was the basin’s first productive phase from 109 – 96 ka, with 315
organic values reaching >30% on two occasions between 106 – 103 ka, and BSi of ~11.3 mg/g. 316
Productivity declined to minimal levels by 95 ka (Table 2, Figure 4a-b). During MIS 5b – 5a (95 317
– 71 ka), productivity again increased and decreased, reaching >30% at 83 ka. Lowstand 318
conditions occurred during MIS 5b, with high Ca, CaCO3, and Mn:Ti (Table 2, Figure 4). 319
Abundant littoral mollusks Lymnaea and Planorbella spp. (Burch, 1982) indicate that the lake 320
shoreline had reached the basin depocenter, where the core was taken. All Ca-based lowstand 321
evidence quickly disappeared at 82 ka, and organics surged to 33% by 81.6 ka in the deeper 322
water, before declining alongside summer insolation to reach ~1% at 73 ka. 323
324
During MIS 4 and 3, lower amplitude oscillations in summer insolation apparently yielded a 325
long-term state of lake productivity, perhaps because seasonal insolation was less variable. 326
Glover et al. – Alpine Southern California climatic change since 125 ka – QSR submission
Organics increased from the onset of MIS 4 (71 ka), and then maintained moderate values 327
(average = 16.4%; Figure 4b). Early MIS 4 had relatively high levels of Ca, CaCO3, and Mn:Ti 328
(Table 2, Figure 4g-i) that declined over the ensuing ~5-6 kyr. These lower values persisted until 329
the end of MIS 2, suggesting lake stratification, and infrequent ventilation. Meanwhile, biologic 330
sedimentation increased (average bulk organics =18.8%) and underwent millennial-scale 331
fluctuations, where bulk organic values ranged between 10 – 28%. 332
333
Periods of subtle laminae occurred during the first half of MIS 3 (57 – 46 ka), and are described 334
in greater detail for core BLDC04-2 (Kirby et al., 2006). While laminated and non-laminated 335
sediment may indicate lake water level shifts (Retelle and Child, 1996), we do not find support 336
for the alternating perennial-to-playa conditions during MIS 3 proposed by Blazevic et al. 337
(2009). The sediments and their chemistry are not consistent with playa conditions, best 338
characterized by the elemental “signature” of high Ca, CaCO3, and Mn:Ti that marked Baldwin 339
Lake’s desiccation at the onset of the Holocene (Figure 4g-i). The abovementioned low 340
concentrations of these elements persisted during MIS 3, along with low MS (Table 2, Figure 341
4f), suggesting a lack of significant bottom ventilation events. These conditions lasted for most 342
of MIS 4 and the duration of MIS 3, at least 35 kyr. This period of greater effective moisture in 343
the SBM has also been noted in other parts of the Transverse Ranges (Santa Barbara Basin; 344
Heusser, 1998), Valley Wells in the Mojave Desert (Pigati et al., 2011), and in the Great Basin 345
(Maher et al., 2014). 346
347
Organic matter concentrations declined during the lower insolation and colder temperatures of 348
MIS 2, after a final peak at 27.7 ka. Sedimentation slowed significantly and was largely detrital, 349

Glover et al. – Alpine Southern California climatic change since 125 ka – QSR submission
with Fe and Ti increasing into the Last Glacial Maximum (LGM, 26 – 19 ka; Figure 4d-e). BSi 350
decreased to ~5 mg/g by the end of MIS 2, but moderate values (~5 – 10 mg/g) until that time 351
(Table 2, Figure 4) suggest continued productivity, despite the cold conditions and reduced light 352
availability in the early part of this glacial. Glacial conditions can produce a sparsely-vegetated 353
landscape and enhanced runoff capable of maintaining relatively high diatom productivity 354
(Ampel et al., 2008), and the high Fe and Ti values suggest a similar response in the Baldwin 355
Lake basin. The highest MS excursion in the core occurred at 27 – 25.5 ka; aside from oxidation 356
of the core since its collection, there are no other unique sedimentary structures, nor shifts in 357
other proxy data, that correspond to this excursion. One possible interpretation for this high MS 358
peak was a decrease in reducing conditions, which would preserve the magnetic signal (Dearing, 359
1999). 360
361
Shallow-water indicators Ca, CaCO3, and Mn:Ti increased suddenly around 12 ka, after which 362
time Baldwin Lake likely transitioned to an intermittent, playa surface as summer insolation rose 363
from 23 – 11 ka. Frequent dry episodes prevented further preservation of biologic material. 364
While the Holocene is a notable omission in BDL12, a Holocene-age paleorecord from 365
neighboring Lower Bear Lake (Figure 1) has provided insight into SBM climate since 9.3 ka 366
(Kirby et al., 2012). 367
368
5.2 Important Climatic Drivers in Southern California 369
5.2.1 Orbital-Scale Radiative Forcing 370
California pollen sites that date to MIS 5e, including the Santa Barbara Basin (ODP 893; 371
Heusser, 1998), ODP 1018 (Lyle et al., 2010), and Owens Lake (Woolfenden, 2003) have shown 372
Glover et al. – Alpine Southern California climatic change since 125 ka – QSR submission
orbitally-induced landscape change. The influence of boreal summer insolation, largely credited 373
with driving continental ice sheet mass, was a primary driver of change at interior Great Basin 374
speleothem sites including the Leviathan, Pinnacle, and Lehman Caves (Lachniet et al., 2014), 375
and Devil’s Hole (Moseley et al., 2016). The high-amplitude shifts detected in organic matter 376
during MIS 5 in BDL12 suggest that organic deposition was a primary response to local summer 377
insolation, a relationship first proposed for the shorter Baldwin Lake sequence (Kirby et al., 378
2006). 379
380
Globally, MIS 4 conditions were milder compared to other glacials, including in the North 381
American West and Sierra Nevada (Brook et al., 2006; Forester et al., 2005; Jiménez-Moreno et 382
al., 2010; Phillips et al., 1996; Rood et al., 2011). At Baldwin Lake, summer insolation minima 383
likely drove cold conditions that were short-lived, as the primary productivity increased and 384
recovered within a few kyr of MIS 4 onset. During MIS 3, both winter and summer insolation 385
were at their least variable in the record, reducing local seasonality (Figure 5c). Summer 386
insolation varied between 481 – 509 W/m2, while winter insolation was relatively static (Figure 387
5c, Table 2). This may have allowed the lake to remain ice-free, and for primary productivity to 388
continue, for longer durations each year compared to other MISs. During MIS 2, summer 389
insolation declined to only 471 W/m2 (23 ka) compared to 465 W/m2 in MIS 4, but winter 390
insolation was slightly lower (234 W/m2 vs. 239 W/m2). Summer insolation reached 515 W/m2 at 391
11 ka, the first time since 81 ka that radiation reached such levels. Proxy data (e.g. trace element 392
Ca and CaCO3 maxima) suggest that the lake was shallow and warm at the onset of the 393
Holocene, a different set of conditions compared to earlier, equivalent summer insolation 394
maxima during MIS 5 (≥510 W/m2). Enhanced evaporation and shifting precipitation are 395

Glover et al. – Alpine Southern California climatic change since 125 ka – QSR submission
possible causes for the end of perennial conditions at Baldwin Lake, as well as the infilling of the 396
basin (~16 m of deposition between 81 and 11 ka). After 11 ka, sediments that are massive, high-397
carbonate, and degraded suggest that intermittent deposition likely continued, with periods of 398
desiccation that compromised sediment chemical and biologic preservation. Other sites in arid 399
and semiarid California exhibited similar transitions from relatively wet towards intermittent or 400
dry conditions at the Pleistocene-to-Holocene transition, including Owens Lake (Bacon et al., 401
2006) and Lake Manly/Death Valley (Li et al., 1996). 402
403
5.2.2 Millennial-Scale Forcing during MIS 3 404
We have shown that major productivity shifts in Baldwin Lake likely occurred at the slow pace 405
of orbital variation, though these changes were not without shorter-order minima and maxima, 406
particularly during MIS 3. What rapid processes account for such change? Kirby et al. (2006) 407
proposed these were wet events corresponding to North Atlantic interstadials, or Dansgaard-408
Oeschger (D-O) events. D-O events were North Atlantic millennial-scale temperature 409
oscillations that occur between 120 and 10 ka, first recognized in 18O data from the Greenland 410
ice cores (Dansgaard et al., 1993). Interstadial-stadial couplets typically had a rapid onset, 411
followed by gradual cooling (Grootes et al., 1993; Johnsen et al., 1992). Freshwater discharge to 412
the North Atlantic increased during interstadials, likely reducing deep water formation and 413
impacting Atlantic Meridional Overturning Circulation. Rapid transmission of a dynamic climate 414
signal to the globe within decades was the net result (Elliot et al., 2002; Gottschalk et al., 2015), 415
though regional response, duration and precise timing differed from the Greenland chronology. 416
417

Glover et al. – Alpine Southern California climatic change since 125 ka – QSR submission
D-O events propagated to the North Pacific (Lund and Mix, 1998), and Hendy and Kennett 418
(2000a) have documented D-O events in the Santa Barbara Basin (SBB) with oxygen isotopes, 419
and shifts in benthic foraminifera assemblages that support warmer SSTs during interstadials 420
(Figure 5a, 5b). Behl and Kennett (1996) noted laminations driven by anoxia during D-O 421
interstadials. Thus, the SBB response during MIS 3 interstadials was enhanced marine 422
temperatures, driven by increased influx of subtropical waters and weaker California Current 423
(Hendy and Kennett, 2000a). In Owens Lake, total organic carbon apparently increased in 424
tandem with D-O interstadials, though ascribing specific events to these %TOC fluctuations is 425
largely speculative, due to chronological uncertainties (Benson et al., 2003, 2002). 426
427
We found a similar response in Baldwin Lake’s total organic matter. Within the limits of dating 428
uncertainties, there was apparent synchronicity between terrestrial BDL12, marine SBB, and 429
NGRIP 18O in the timing, duration, and relative amplitude of D-O interstadials. We suggest D-430
O event numbers for BDL12 (Figure 5c) after conventions of Rasmussen et al. (2014). Core gaps 431
and noisy organic data occurred between 60 – 52 ka, however, and winter insolation prior to 50 432
ka may have dampened the amplitude of potential D-O interstadials (Figure 5c). Rasmussen et al. 433
(2014) confirm that the North Atlantic response from 59 – 54 ka was a complex transition 434
between global climatic states, and complex sub-intervals during D-O interstadials from this 435
interval have been identified since initial identification and numbering. Thus, D-O interstadials 436
16-17 were not assigned to specific organic peaks in BDL12, but likely occurred over a 3-5 kyr 437
interval of high-amplitude, rapid changes (Figure 5c). Despite these caveats, millennial-scale 438
fluctuations in Baldwin Lake organic deposition suggest that North Atlantic MIS 3 and MIS 2 439

Glover et al. – Alpine Southern California climatic change since 125 ka – QSR submission
perturbations were strong enough to influence Southern California climate during a period of 440
intermediate insolation. 441
442
5.3 Pacific- and North Atlantic-induced events in California, the Great Basin, and Southwest 443
We examined other paleoclimate sites in California, the Great Basin, and Southwest (Figure 6) 444
for their response to rapid change, and asked 1) which events are coeval to environmental 445
changes in the SBM, 2) was there a temperature and/or hydrological response at each site, and 3) 446
is there a coherent geographic pattern of response? We focused largely on 85 – 20 ka, the period 447
with the greatest number of comparative sites to BDL12, mapped in Figures 6 and 7 with the 448
ecoregions of Bailey (2009). 449
450
MIS 5a events in BDL12 included lowstands at 87 and 82 ka. The 82 ka event in particular was 451
coeval with other evidence of warm conditions throughout the West, including a marine 452
highstand along the California and Southern Oregon coasts 84 – 76 ka (Muhs et al., 2012). 453
Devil’s Hole experienced a maximum in 18O isotopic values (82.5 ±0.7 ka; Moseley et al., 454
2016), and the onset of warm SSTs at ODP 1017 occurred 82 ka (Seki et al., 2002). Baldwin 455
Lake rapidly transgressed after 82 ka over the course of 0.6 – 0.7 kyr, suggesting a sudden 456
change in either basin deposition, or moisture regime. 457
458
Widespread climatic change next happened at terrestrial sites during the 3 kyr period spanning 459
Heinrich Event 6 (H6, 60 ± 5 ka; Hemming, 2004) and the transition to MIS 3 (57 ka). Several 460
terrestrial sites underwent hydrologic shifts. Lake Manley in Death Valley transitioned from 461
mudflat to more arid saltpan ~59 – 57 ka (Forester et al., 2005). Runoff to Lake Babicora, 462
Glover et al. – Alpine Southern California climatic change since 125 ka – QSR submission
located at the southernmost extent of the region shown (Figure 6), also reduced 58 ka (Roy et al., 463
2013). In contrast, other sites in Southern California became wet, including Baldwin Lake’s 464
perennial lake phase throughout MIS 3, and the onset of groundwater flow in Valley Wells 60 ka 465
(Figure 6; Pigati et al., 2011). West of the Sierra Nevada, peak moisture included a wetter phase 466
from 61.7 ± 0.5 to 59.8 ± 0.6 ka at McLean’s Cave, with a return to relatively dry conditions 467
afterwards (Oster et al., 2014). This demonstrated the site’s a sensitivity to North Atlantic 468
changes: Heinrich 6 (60 ± 5 ka; Hemming, 2004) coincided with wet conditions, and D-O 469
interstadials 15–18 were arid phases in the Sierra Nevada foothills (Oster et al., 2014). 470
Meanwhile, ice-rafted debris from increased freshwater runoff reached a maximum 59 – 58 ka at 471
Mono Lake east of the Sierra Nevada (Zimmerman et al., 2011). 472
473
Thus, terrestrial hydrologic change is not uniform throughout California at the MIS 4/3 474
transition, though wetter sites tended to cluster in the southern sector of the Mojave Desert and 475
the SBM. Offshore sites responded consistently with enhanced SSTs initiating close to the MIS 476
4/3 transition at sites1014, 1017, and 1012, but hydrologic change was difficult to determine 477
from available records and proxy data (Hendy et al., 2004; Hendy and Kennett, 2000b; Herbert et 478
al., 2001; Seki et al., 2002). High resolution BSi data from ODP 1018 showed increasing SSTs 479
61 ka, and these data provide insight to other processes and moisture at the Northern California 480
site: enhanced SSTs were accompanied with greater productivity, suppressed upwelling, and 481
aridity that lasted 8-10 kyr (Lyle et al., 2010). 482
483
More sites span MIS 3, including recently-developed records that depend upon groundwater 484
infiltration (e.g. speleothem records, soil precipitates, and groundwater/desert wetland deposits). 485

Glover et al. – Alpine Southern California climatic change since 125 ka – QSR submission
We synthesize the sensitivity of paleoclimatic records to D-O interstadials, noting if the response 486
was cold, warm, wet or dry (Figure 7). The investigators’ original climatic interpretation for D-O 487
interstadial response were used in this map. Uncertainty in dating methods can be several 488
millennia at sites of MIS 3 age, a recognized problem in trying to detect events that last, on 489
average, ~1.48 kyr (Benson et al., 2003; Denniston et al., 2007; Zimmerman et al., 2011). Still, 490
mapping current knowledge of D-O interstadial response in a large sector of the North American 491
West did show emergent patterns, and may provide a framework for future hypothesis-testing at 492
regional paleoclimate sites. 493
494
High-resolution marine records ODP 1017 and 1014 responded to D-O interstadials with warmer 495
SSTs (Hendy and Kennett, 2000b; Hendy and Pedersen, 2005; Pak et al., 2012; Pospelova et al., 496
2015; Seki et al., 2002). Heusser (1998) detected millennial-scale increases in ODP 893 oak 497
pollen, a dry-adapted taxa, that corresponded to D-O interstadials. Enhanced aridity was the 498
norm during D-O interstadials at terrestrial sites, including Southwestern speleothem records 499
Fort Stanton, Carlsbad Cavern, and Cave of the Bells (Asmerom et al., 2010; Brook et al., 2006; 500
Wagner et al., 2010). In the tropical-temperate desert south of the Great Basin, sites demonstrate 501
a potential sensitivity to D-O interstadials quite late, with arid fluctuations that start at 35 ka (e.g. 502
Searles Lake, Lin et al., 1998; Las Vegas Valley, Springer et al., 2015). Sites that experienced 503
overall greater effective moisture throughout MIS 3, but did not exhibit consistent millennial-504
scale variability, include Valley Wells (Pigati et al., 2011), the San Pedro Valley (Pigati et al., 505
2009). Records in Mexico began to show a sensitivity to D-O events by mid-MIS 3 (42 – 40 ka), 506
with warmer SSTs in the Gulf of California (Price et al., 2013) and enhanced moisture at Lake 507
Babicora (Roy et al., 2013). 508
Glover et al. – Alpine Southern California climatic change since 125 ka – QSR submission
509
The Great Basin response to D-O interstadials varied geographically, with enhanced moisture at 510
its northern and western margins, and no apparent response towards the interior (Figure 7). 511
Millennial-scale oscillations were absent from Lehman, Leviathan, and Pinnacle speleothem 512
records (Lachniet et al., 2014), and groundwater precipitates (Franklin, Newark Valley, Diamond 513
Valley, Barstow, and Yucca Mountain, Figure 6-7; Maher et al., 2014). Higher lake levels during 514
interstadials occur at Mono, Pyramid, and Owens Lakes to the east of the Sierra Nevada (Benson 515
et al., 2003). The northeastern Great Basin underwent saline and hypersaline oscillations in the 516
Great Salt Lake during MIS 3 (Balch et al., 2005), and Benson et al. (2011) interpreted higher 517
lake levels and wet D-O interstadials for this sector of the Lake Bonneville Basin. This wet 518
response at the margins of the Great Basin may be due to nearby glaciers and the Laurentide Ice 519
Sheet, a potential source of meltwater during warm excursions. 520
521
In the SBM, Kirby et al. (2006) previously hypothesized that D-O interstadials were wet 522
episodes based upon laminated deposits in deep water conditions, but laminated horizons 523
observed in BDL12 did not reliably match the organic excursions proposed as the D-O 524
interstadials. Directly-dated relict shorelines at paleolake Manix to the north, part of the Mojave 525
River watershed with its headwaters in the SBM, showed that D-O stadials were unusually wet 526
for the region (Reheis et al., 2015). Yet with no supporting evidence in our current dataset that 527
D-O interstadials enhanced moisture in alpine Southern California, the hydrologic response at 528
Baldwin Lake remains ambiguous. North of the SBM in the Mojave Desert, and eastward 529
towards the Southwest, the geographic pattern of response to D-O interstadials was enhanced 530
aridity (Figure 7). 531

Glover et al. – Alpine Southern California climatic change since 125 ka – QSR submission
532
Reduced insolation, reduced evaporation, and generally wet conditions prevailed in Southern 533
California and the Southwest at the MIS 3/2 transition at 29 ka, with some centennial- to 534
millennial arid events. Groundwater infiltration prevailed in the Great Basin until 24 ka (Maher 535
et al., 2014), while a highstand persisted at Owens Lake (Bacon et al., 2006) and Lake Manly (Li 536
et al., 1996). Cave of the Bells (Wagner et al., 2010) and the San Pedro Valley sites of Pigati et 537
al. (2009) were wet from 25 – 20 ka. An arid episode just prior to the LGM was evident at 538
several of these sites, best documented with a well-dated, highly-resolved pollen study at Lake 539
Elsinore that showed a ~2 kyr drought from 27.5 – 25.5 ka (Heusser et al., 2015). Other arid 540
episodes that interrupted otherwise wet conditions include reversals at Owens Lake 25-24 ka 541
(Bacon et al., 2006), Pyramid Lake at 29 ka (Benson et al., 2013), and a pair of lakes on the 542
Colorado Plateau at 24.5 – 24 ka (Hay and Walker Lakes; Anderson et al., 2000). The high 543
magnetic susceptibility excursion at Baldwin Lake was contemporaneous with the Lake Elsinore 544
drought, and could have been caused by rapid sediment burial or lake mixing (Dearing, 1999). 545
546
An influx of Pacific moisture arrived in Southern California by 22 ka (Oster et al., 2015). Lake 547
highstand and basin spillover events towards the east are events often mentioned as part of Big 548
Bear Valley’s Ice Age history (Krantz, 1983; Leidy, 2006; Stout, 1976), but the evidence has not 549
been directly dated. Glaciation occurred for ~5 kyr on San Gorgonio, the highest-elevation peak 550
in the SBM, depositing a series of moraines 20 – 16 ka and 16 – 15 ka (Owen et al., 2003). The 551
early MIS 2 drought at Lake Elsinore 27.5 – 25.5 ka, and subsequent moisture influx ~22 ka, 552
suggest that Southern California had a complex and dynamic hydrologic history during the Last 553
Ice Age, with changes occurring on millennial, and perhaps submillenial, scales. Further study 554

Glover et al. – Alpine Southern California climatic change since 125 ka – QSR submission
with tighter-resolution proxy analyses are necessary to better resolve these events in space and 555
time. 556
557
6. Conclusions 558
Physical and geochemical proxy analyses on Baldwin Lake suggest that Southern California 559
climate change was sensitive to orbitally-induced radiation over the past 125 ka, particularly in 560
material recovered from MIS 5. Variations in local summer insolation during MIS 5e-5a (125 – 561
71 ka) were large, ranging 448 – 533 W/m2, and likely the primary cause of high-amplitude 562
shifts in lake productivity. Summer insolation was less pronounced during MIS 4 – 3 (71 – 29 563
ka; 465 – 510 W/m2), while winter insolation was relatively stable. During the combined effects 564
of intermediate radiation and reduced seasonal variability, portions of the North American West, 565
particularly Southern California, experienced 1) greater effective moisture throughout MIS 3, 566
and 2) sensitivity to North Atlantic forcing, namely Dansgaard-Oeschger (D-O) interstadial 567
events. 568
569
The influence of D-O interstadials on California, the Great Basin, and U.S. Southwest during 570
MIS 3 -2 produced a geographically varied response. In alpine Southern California, productivity 571
increases in the Baldwin Lake core were the apparent responses to D-O interstadials. While we 572
have no direct measure of hydrologic change during these interstadials in the present study, 573
enhanced aridity was a consistent response at sensitive sites in the surrounding Mojave Desert, 574
and eastward into the Southwest. Sites on the western and northeastern margins of the Great 575
Basin were wet during D-O interstadials, and no consistent millennial-scale events have been 576
detected at Great Basin interior sites during MIS 3. MIS 2 brought depressed insolation and cold, 577
Glover et al. – Alpine Southern California climatic change since 125 ka – QSR submission
glacial conditions with variable moisture. While summer insolation did not quite reach MIS 5 578
maxima (~530-540 W/m2) at the MIS 2/1 transition, climate was warm and/or dry enough to 579
cause Southern California lakes to transition to intermittent, or playa, states. Baldwin Lake has 580
been an intermittent lake since ~12 ka. 581
582
This work highlights the sensitivity of Southern California’s climate to radiative and oceanic 583
forcing, and the need to better understand how the ocean-atmospheric system reorganizes itself 584
to transmit such changes. It is also clear that during past climate states, radiative and oceanic 585
forcing produced hydrologic responses that varied geographically. Improved understanding of 586
the nature and drivers of this variability is an urgent need at present, as recent studies (e.g. Cayan 587
et al., 2010; Diffenbaugh et al., 2015; Overpeck and Udall, 2010) forecast an increasingly warm 588
and arid Southern California and Southwest for the rest of the 21st century. Enhanced 589
temperature and aridity will certainly produce stresses on the region’s population and 590
ecosystems. 591
592
Acknowledgments 593
We are grateful for the financial support provided by the UCLA Institute of the Environment and 594
Sustainability Presidential Fund, UCLA Graduate Division, Limnological Research Center, 595
Geological Society of America, UCLA Dept. of Geography John Muir Memorial Endowment, 596
Society of Woman Geographers, and the Department of the Interior Southwest Climate Science 597
Center. Fieldwork and core recovery were greatly assisted by Katie Nelson, Scott Eliason, and 598
Gina Griffith of the San Bernardino National Forest; Larry Winslow of Big Bear, CA; and Gregg 599
Drilling, L.L.C. KCG especially thanks Wendy Barrera for leading IRSL subsampling and 600

Glover et al. – Alpine Southern California climatic change since 125 ka – QSR submission
preparation at the UCLA Luminescence Laboratory, assistance from Jessica Rodysill and 601
Kristina Brady while visiting the Limnological Research Center at the University of Minnesota, 602
and Katherine Whitacre at Northern Arizona University’s Amino Acid Geochronology Lab. We 603
thank several students for their assistance in the field and lab, including Lauren Brown, April 604
Chaney, Elaine Chang, Christine Hiner, Tamryn Kong, Alec Lautanen, Jennifer Leidelmeijer, 605
Setareh Nejat, Alex Pakalniskis, Sargam Saraf, Nicole Tachiki, Marcus Thomson, Alice Wong, 606
Alex Woodward and Renée Yun. The thorough and thoughtful comments of two anonymous 607
reviewers greatly improved the paper, and are much appreciated. Candid conversation and 608
feedback from many of the investigators cited, too numerous to name here, have also improved 609
our discussion of long-term climate change in the North American West. 610
611
612
613

Glover et al. – Alpine Southern California climatic change since 125 ka – QSR submission
7. References 614
Ampel, L., Wohlfarth, B., Risberg, J., Veres, D., 2008. Paleolimnological response to millennial 615 and centennial scale climate variability during MIS 3 and 2 as suggested by the diatom 616 record in Les Echets, France. Quat. Sci. Rev. 27, 1493–1504. 617 doi:10.1016/j.quascirev.2008.04.014 618
Anderson, R.S., Betancourt, J.L., Mead, J.I., Hevly, R.H., Adam, D.P., 2000. Middle- and late-619 Wisconsin paleobotanic and paleoclimatic records from the southern Colorado Plateau, 620 USA. Palaeogeogr. Palaeoclimatol. Palaeoecol. 155, 31–57. doi:10.1016/S0031-621 0182(99)00093-0 622
Asmerom, Y., Polyak, V.J., Burns, S.J., 2010. Variable winter moisture in the southwestern 623 United States linked to rapid glacial climate shifts. Nat. Geosci. 3, 114–117. 624 doi:10.1038/ngeo754 625
Bacon, S.N., Burke, R.M., Pezzopane, S.K., Jayko, A.S., 2006. Last glacial maximum and 626 Holocene lake levels of Owens Lake, eastern California, USA. Quat. Sci. Rev. 25, 1264–627 1282. doi:10.1016/j.quascirev.2005.10.014 628
Bailey, R.G., 2009. Ecosystem geography: from ecoregions to sites, 2nd ed. ed. Springer, New 629 York. 630
Balch, D.P., Cohen, A.S., Schnurrenberger, D.W., Haskell, B.J., Valero Garces, B.L., Beck, 631 J.W., Cheng, H., Edwards, R.L., 2005. Ecosystem and paleohydrological response to 632 Quaternary climate change in the Bonneville Basin, Utah. Palaeogeogr. Palaeoclimatol. 633 Palaeoecol. 221, 99–122. doi:10.1016/j.palaeo.2005.01.013 634
Barron, J.A., Heusser, L., Herbert, T., Lyle, M., 2003. High-resolution climatic evolution of 635 coastal northern California during the past 16,000 years. Paleoceanography 18, n/a-n/a. 636 doi:10.1029/2002PA000768 637
Behl, R.J., Kennett, J.P., 1996. Brief interstadial events in the Santa Barbara basin, NE Pacific, 638 during the past 60 kyr. Nature 379, 243–246. doi:10.1038/379243a0 639
Benson, L., Lund, S., Negrini, R., Linsley, B., Zic, M., 2003. Response of North American Great 640 Basin Lakes to Dansgaard–Oeschger oscillations. Quat. Sci. Rev. 22, 2239–2251. 641 doi:10.1016/S0277-3791(03)00210-5 642
Benson, L.V., Kashgarian, M., Rye, R.O., Lund, S.P., Paillet, F., Smoot, J.P., Kester, C., 643 Mensing, S.A., Meko, D.M., Lindström, S., 2002. Holocene Multidecadal and 644 Multicentennial Droughts Affecting Northern California and Nevada. Quat. Sci. Rev. 21, 645 659–682. 646
Benson, L.V., Lund, S.P., Smoot, J.P., Rhode, D.E., Spencer, R.J., Verosub, K.L., Louderback, 647 L.A., Johnson, C.A., Rye, R.O., Negrini, R.M., 2011. The rise and fall of Lake 648 Bonneville between 45 and 10.5 ka. Quat. Int. 235, 57–69. 649 doi:10.1016/j.quaint.2010.12.014 650
Benson, L.V., Smoot, J.P., Lund, S.P., Mensing, S.A., Foit, F.F., Rye, R.O., 2013. Insights from 651 a synthesis of old and new climate-proxy data from the Pyramid and Winnemucca lake 652

Glover et al. – Alpine Southern California climatic change since 125 ka – QSR submission
basins for the period 48 to 11.5 cal ka. Quat. Int. 310, 62–82. 653 doi:10.1016/j.quaint.2012.02.040 654
Big Bear Lake TMDL Task Force [WWW Document], 2012. URL 655 http://www.sawpa.org/collaboration/past-projects/big-bear-lake-tmdl-taskforce/ (accessed 656 6.18.14). 657
Bird, B.W., Kirby, M.E., 2006. An Alpine Lacustrine Record of Early Holocene North American 658 Monsoon Dynamics from Dry Lake, Southern California (USA). J. Paleolimnol. 35, 179–659 192. doi:10.1007/s10933-005-8514-3 660
Blaauw, M., Christen, J.A., 2011. Flexible Paleoclimate Age-Depth Models Using an 661 Autoregressive Gamma Process. Bayesian Anal. 6, 457–474. doi:10.1214/11-BA618 662
Blass, A., Bigler, C., Grosjean, M., Sturm, M., 2007. Decadal-scale autumn temperature 663 reconstruction back to AD 1580 inferred from the varved sediments of Lake Silvaplana 664 (southeastern Swiss Alps). Quat. Res. 68, 184–195. doi:10.1016/j.yqres.2007.05.004 665
Blazevic, M.A., Kirby, M.E., Woods, A.D., Browne, B.L., Bowman, D.D., 2009. A sedimentary 666 facies model for glacial-age sediments in Baldwin Lake, Southern California. Sediment. 667 Geol. 219, 151–168. doi:10.1016/j.sedgeo.2009.05.003 668
Brook, G.A., Ellwood, B.B., Railsback, L.B., Cowart, J.B., 2006. A 164 ka record of 669 environmental change in the American Southwest from a Carlsbad Cavern speleothem. 670 Palaeogeogr. Palaeoclimatol. Palaeoecol. 237, 483–507. 671 doi:10.1016/j.palaeo.2006.01.001 672
Brunelle, A., Anderson, R.S., 2003. Sedimentary charcoal as an indicator of late-Holocene 673 drought in the Sierra Nevada, California, and its relevance to the future. The Holocene 674 13, 21–28. doi:10.1191/0959683603hl591rp 675
Burch, J.B., 1982. Freshwater snails (Mollusca: Gastropoda) of North America (No. EPA-600/3-676 82-026). United States Environmental Protection Agency. 677
Buylaert, J.P., Murray, A.S., Thomsen, K.J., Jain, M., 2009. Testing the potential of an elevated 678 temperature IRSL signal from K-feldspar. Radiat. Meas. 44, 560–565. 679 doi:10.1016/j.radmeas.2009.02.007 680
Cacho, I., Grimalt, J.O., Pelejero, C., Canals, M., Sierro, F.J., Flores, J.A., Shackleton, N., 1999. 681 Dansgaard-Oeschger and Heinrich event imprints in Alboran Sea paleotemperatures. 682 Paleoceanography 14, 698–705. doi:10.1029/1999PA900044 683
Cayan, D.R., Das, T., Pierce, D.W., Barnett, T.P., Tyree, M., Gershunov, A., 2010. Future 684 dryness in the southwest US and the hydrology of the early 21st century drought. Proc. 685 Natl. Acad. Sci. 107, 21271–21276. doi:10.1073/pnas.0912391107 686
Cayan, D.R., Peterson, D.H., 1989. The influence of North Pacific atmospheric circulation on 687 streamflow in the west., in: Aspects of Climate Variability in the Pacific and the Western 688 Americas. American Geophysical Union, pp. 375–397. 689
Climate - Southern California Average Annual Precipitation [WWW Document], n.d. . Clim. - 690 South. Calif. Aver. Annu. Precip. URL http://www.wrh.noaa.gov/sgx/climate/pcpn-691 avg.php?wfo=sgx 692

Glover et al. – Alpine Southern California climatic change since 125 ka – QSR submission
Colman, S.M., Peck, J.A., Karabanov, E.B., Carter, S.J., Bradbury, J.P., King, J.W., Williams, 693 D.F., 1995. Continental climate response to orbital forcing from biogenic silica records in 694 Lake Baikal. Nature 378, 769–771. doi:10.1038/378769a0 695
Conley, D.J., Schelske, C.L., 2002. Biogenic Silica, in: Smol, J.P., Birks, H.J.B., Last, W.M., 696 Bradley, R.S., Alverson, K. (Eds.), Tracking Environmental Change Using Lake 697 Sediments. Kluwer Academic Publishers, Dordrecht, pp. 281–293. 698
Dansgaard, W., Johnsen, S.J., Clausen, H.B., Dahl-Jensen, D., Gundestrup, N.S., Hammer, C.U., 699 Hvidberg, C.S., Steffensen, N.S., Sceinbjörnsdottir, A.E., Jouzel, J., Bond, G., 1993. 700 Climate instability during the last interglacial period recorded in the GRIP ice core. 701 Nature 364, 203–207. doi:10.1038/364203a0 702
Dean, W.E., 1974. Determination of Carbonate and Organic Matter in Calcareous Sediments and 703 Sedimentary Rocks by Loss on Ignition: Comparison With Other Methods. SEPM J. 704 Sediment. Res. Vol. 44. doi:10.1306/74D729D2-2B21-11D7-8648000102C1865D 705
Dearing, J., 1999. Environmental Magnetic Susceptibility: Using the Bartington MS2 System, 706 2nd ed. Chi Publishing, Kenilworth, England. 707
Denniston, R.F., Asmerom, Y., Polyak, V., Dorale, J.A., Carpenter, S.J., Trodick, C., Hoye, B., 708 González, L.A., 2007. Synchronous millennial-scale climatic changes in the Great Basin 709 and the North Atlantic during the last interglacial. Geology 35, 619. 710 doi:10.1130/G23445A.1 711
Dibblee, T.W., 1964. Geological map of the San Gorgonio Mountain Quadrangle, San 712 Bernardino and Riverside Counties, California. Miscellaneous Geologic Investigations. 713
Diffenbaugh, N.S., Swain, D.L., Touma, D., 2015. Anthropogenic warming has increased 714 drought risk in California. Proc. Natl. Acad. Sci. 112, 3931–3936. 715 doi:10.1073/pnas.1422385112 716
Elliot, M., Labeyrie, L., Duplessy, J.-C., 2002. Changes in North Atlantic deep-water formation 717 associated with the Dansgaard–Oeschger temperature oscillations (60–10ka). Quat. Sci. 718 Rev. 21, 1153–1165. doi:10.1016/S0277-3791(01)00137-8 719
Flint, L.E., Martin, P., 2012. Geohydrology of Big Bear Valley, California: Phase 1—Geologic 720 Framework, Recharge, and Preliminary Assessment of the Source and Age of 721 Groundwater (Scientific Investigations No. 2012–5100). U. S. Geological Survey. 722
Forester, R.M., Lowenstein, T.K., Spencer, R.J., 2005. An ostracode based paleolimnologic and 723 paleohydrologic history of Death Valley: 200 to 0 ka. Geol. Soc. Am. Bull. 117, 1379. 724 doi:10.1130/B25637.1 725
Garcia, A.L., Knott, J.R., Mahan, S.A., Bright, J., 2014. Geochronology and paleoenvironment 726 of pluvial Harper Lake, Mojave Desert, California, USA. Quat. Res. 81, 305–317. 727 doi:10.1016/j.yqres.2013.10.008 728
Georgescu, M., Moustaoui, M., Mahalov, A., Dudhia, J., 2012. Summer-time climate impacts of 729 projected megapolitan expansion in Arizona. Nat. Clim. Change 3, 37–41. 730 doi:10.1038/nclimate1656 731
Goring, S., Williams, J.E., Blois, J.L., Jackson, S.T., Paciorek, C.J., Booth, R.K., Marlon, J.R., 732 Blaauw, M., Christen, J.A., 2012. Deposition times in the northeastern United States 733
Glover et al. – Alpine Southern California climatic change since 125 ka – QSR submission
during the Holocene: establishing valid priors for Bayesian age models. Quat. Sci. Rev. 734 48, 54–60. 735
Gottschalk, J., Skinner, L.C., Misra, S., Waelbroeck, C., Menviel, L., Timmermann, A., 2015. 736 Abrupt changes in the southern extent of North Atlantic Deep Water during Dansgaard–737 Oeschger events. Nat. Geosci. 8, 950–954. doi:10.1038/ngeo2558 738
Groot, M.H.M., van der Plicht, J., Hooghiemstra, H., Lourens, L.J., Rowe, H.D., 2014. Age 739 modelling for Pleistocene lake sediments: A comparison of methods from the Andean 740 Fúquene Basin (Colombia) case study. Quat. Geochronol. 22, 144–154. 741 doi:10.1016/j.quageo.2014.01.002 742
Grootes, P.M., Stuiver, M., White, J.W.C., Johnsen, S., Jouzel, J., 1993. Comparison of oxygen 743 isotope records from the GISP2 and GRIP Greenland ice cores. Nature 366, 552–554. 744 doi:10.1038/366552a0 745
Hahn, A., Kliem, P., Ohlendorf, C., Zolitschka, B., Rosén, P., 2013. Climate induced changes as 746 registered in inorganic and organic sediment components from Laguna Potrok Aike 747 (Argentina) during the past 51 ka. Quat. Sci. Rev. 71, 154–166. 748 doi:10.1016/j.quascirev.2012.09.015 749
Heiri, O., Lotter, A.F., Lemcke, G., 2001. Loss on ignition as a method for estimating organic 750 and carbonate content in sediments: reproducibility and comparability of results. J. 751 Paleolimnol. 25, 101–110. 752
Hemming, S.R., 2004. Heinrich events: Massive late Pleistocene detritus layers of the North 753 Atlantic and their global climate imprint. Rev. Geophys. 42. doi:10.1029/2003RG000128 754
Hendy, I.L., Kennett, J.P., 2000. Dansgaard-Oeschger Cycles and the California Current System: 755 Planktonic foraminiferal response to rapid climate change in Santa Barbara Basin, Ocean 756 Drilling Program Hole 893A. Paleoceanography 15, 30. doi:10.1029/1999PA000413 757
Hendy, I.L., Kennett, J.P., 2000. Stable isotope stratigraphy and paleoceanography of the last 758 170 ky: Site 1014, Tanner Basin, California., in: Proceedings of the Ocean Drilling 759 Program, Scientific Results. pp. 129–140. 760
Hendy, I.L., Pedersen, T.F., 2005. Is pore water oxygen content decoupled from productivity on 761 the California Margin? Trace element results from Ocean Drilling Program Hole 1017E, 762 San Lucia slope, California: PRODUCTIVITY-PORE WATER OXYGEN 763 DECOUPLING. Paleoceanography 20, n/a-n/a. doi:10.1029/2004PA001123 764
Hendy, I.L., Pedersen, T.F., Kennett, J.P., Tada, R., 2004. Intermittent existence of a southern 765 Californian upwelling cell during submillennial climate change of the last 60 kyr. 766 Paleoceanography 19, n/a-n/a. doi:10.1029/2003PA000965 767
Herbert, T.D., Schuffert, J.., Andreasen, D., Heusser, L.E., Lyle, M., Mix, A., Ravelo, A.C., 768 Stott, L.D., Herguera, J.C., 2001. Collapse of the California Current During Glacial 769 Maxima Linked to Climate Change on Land. Science 293, 71–76. 770 doi:10.1126/science.1059209 771
Heusser, L., 1998. Direct correlation of millennial-scale changes in western North American 772
vegetation and climate with changes in the California Current System over the past 773 60
kyr. Paleoceanography 13, 252–262. doi:10.1029/98PA00670 774

Glover et al. – Alpine Southern California climatic change since 125 ka – QSR submission
Heusser, L.E., Basalm, W.L., 1977. Pollen Distribution in the Northeast Pacific Ocean. Quat. 775 Res. 7, 45–62. 776
Heusser, L.E., Kirby, M.E., Nichols, J.E., 2015. Pollen-based evidence of extreme drought 777 during the last Glacial (32.6–9.0 ka) in coastal southern California. Quat. Sci. Rev. 126, 778 242–253. doi:10.1016/j.quascirev.2015.08.029 779
Hodell, D.A., Schelske, C.L., Fahnenstiel, G.L., Robbins, L.L., 1998. Biologically induced 780 calcite and its isotopic composition in Lake Ontario. Limnol. Oceanogr. 43, 187–199. 781
Hooghiemstra, H., Lézine, A.-M., Leroy, S.A.G., Dupont, L., Marret, F., 2006. Late Quaternary 782 palynology in marine sediments: A synthesis of the understanding of pollen distribution 783 patterns in the NW African setting. Quat. Int. 148, 29–44. 784 doi:10.1016/j.quaint.2005.11.005 785
Hu, F.S., Kaufman, D.S., Yoneji, S., Nelson, D., Shemesh, A., Huang, Y., Tian, J., Bond, G., 786 Clegg, B., Brown, T., 2003. Cyclic Variation and Solar Forcing of Holocene Climate in 787 the Alaskan Subarctic. Science 301, 1890–1893. doi:10.1126/science.1088568 788
Imbrie, J., Hays, J.D., Martinson, D.G., McIntyre, A., Mix, A.C., Morley, J.J., Pisias, N.., Prell, 789 W.L., Shackleton, N.J., 1984. The orbital theory of Pleistocene climate: Support from a 790 revised chronology of the marine delta18O record., in: Ilankovitch and Climate: 791 Understanding the Response to Astronomical Forcing. p. 269. 792
Jiménez-Moreno, G., Anderson, R.S., Desprat, S., Grigg, L.D., Grimm, E.C., Heusser, L.E., 793 Jacobs, B.F., López-Martínez, C., Whitlock, C.L., Willard, D.A., 2010. Millennial-scale 794 variability during the last glacial in vegetation records from North America. Quat. Sci. 795 Rev. 29, 2865–2881. doi:10.1016/j.quascirev.2009.12.013 796
Johnsen, S.J., Clausen, H.B., Dansgaard, W., Fuhrer, K., Gundestrup, N., Hammer, C.U., 797 Iversen, P., Jouzel, J., Stauffer, B., steffensen, J.P., 1992. Irregular glacial interstadials 798 recorded in a new Greenland ice core. Nature 359, 311–313. doi:10.1038/359311a0 799
Kaplan, M.R., Wolfe, A.P., Miller, G.H., 2002. Holocene Environmental Variability in Southern 800 Greenland Inferred from Lake Sediments. Quat. Res. 58, 149–159. 801 doi:10.1006/qres.2002.2352 802
Kirby, M.E., Feakins, S.J., Bonuso, N., Fantozzi, J.M., Hiner, C.A., 2013. Latest Pleistocene to 803 Holocene hydroclimates from Lake Elsinore, California. Quat. Sci. Rev. 76, 1–15. 804 doi:10.1016/j.quascirev.2013.05.023 805
Kirby, M.E., Knell, E.J., Anderson, W.T., Lachniet, M.S., Palermo, J., Eeg, H., Lucero, R., 806 Murrieta, R., Arevalo, A., Silveira, E., Hiner, C.A., 2015. Evidence for insolation and 807 Pacific forcing of late glacial through Holocene climate in the Central Mojave Desert 808 (Silver Lake, CA). Quat. Res. 84, 174–186. doi:10.1016/j.yqres.2015.07.003 809
Kirby, M.E., Lund, S.P., Anderson, M.A., Bird, B.W., 2007. Insolation forcing of Holocene 810 climate change in Southern California: a sediment study from Lake Elsinore. J. 811 Paleolimnol. 38, 395–417. doi:10.1007/s10933-006-9085-7 812
Kirby, M.E., Lund, S.P., Bird, B.W., 2006. Mid-Wisconsin sediment record from Baldwin Lake 813 reveals hemispheric climate dynamics (Southern CA, USA). Palaeogeogr. 814 Palaeoclimatol. Palaeoecol. 241, 267–283. doi:10.1016/j.palaeo.2006.03.043 815

Glover et al. – Alpine Southern California climatic change since 125 ka – QSR submission
Kirby, M.E., Zimmerman, S.R.H., Patterson, W.P., Rivera, J.J., 2012. A 9170-year record of 816 decadal-to-multi-centennial scale pluvial episodes from the coastal Southwest United 817 States: a role for atmospheric rivers? Quat. Sci. Rev. 46, 57–65. 818 doi:10.1016/j.quascirev.2012.05.008 819
Krantz, T., 1983. The Pebble Plains of Baldwin Lake. Fremontia 10, 9–13. 820
Kylander, M.E., Ampel, L., Wohlfarth, B., Veres, D., 2011. High-resolution X-ray fluorescence 821 core scanning analysis of Les Echets (France) sedimentary sequence: new insights from 822 chemical proxies. J. Quat. Sci. 26, 109–117. doi:10.1002/jqs.1438 823
Lachniet, M.S., Denniston, R.F., Asmerom, Y., Polyak, V.J., 2014. Orbital control of western 824 North America atmospheric circulation and climate over two glacial cycles. Nat. 825 Commun. 5. doi:10.1038/ncomms4805 826
Lawson, M.J., Roder, B.J., Stang, D.M., Rhodes, E.J., 2012. OSL and IRSL characteristics of 827 quartz and feldspar from southern California, USA. Radiat. Meas. 47, 830–836. 828 doi:10.1016/j.radmeas.2012.03.025 829
Leidy, R., 2006. Prehistoric and Historic Environmental Conditions in Bear Valley, San 830 Bernardino County, California. Sacramento, CA. 831
Li, J., Lowenstein, T.K., Brown, C.B., Ku, T.-L., Luo, S., 1996. A 100 ka record of water tables 832 and paleoclimates from salt cores, Death Valley, California. Palaeogeogr. Palaeoclimatol. 833 Palaeoecol. 123, 179–203. doi:10.1016/0031-0182(95)00123-9 834
Lin, J.C., Broecker, W.S., Hemming, S.R., Hajdas, I., Anderson, R.F., Smith, G.I., Kelley, M., 835 Bonani, G., 1998. A Reassessment of U-Th and14C Ages for Late-Glacial High-836 Frequency Hydrological Events at Searles Lake, California. Quat. Res. 49, 11–23. 837 doi:10.1006/qres.1997.1949 838
Lund, D.C., Mix, A.C., 1998. Millennial-scale deep water oscillations: Reflections of the North 839 Atlantic in the deep Pacific from 10 to 60 ka. Paleoceanography 13, 10–19. 840 doi:10.1029/97PA02984 841
Lyle, M., Heusser, L., Ravelo, C., Andreasen, D., Olivarez Lyle, A., Diffenbaugh, N., 2010. 842 Pleistocene water cycle and eastern boundary current processes along the California 843 continental margin. Paleoceanography 25. doi:10.1029/2009PA001836 844
MacDonald, G.M., Case, R.A., 2005. Variations in the Pacific Decadal Oscillation over the past 845 millennium. Geophys. Res. Lett. 32. doi:10.1029/2005GL022478 846
MacDonald, G.M., Moser, K.A., Bloom, A.M., Porinchu, D.F., Potito, A.P., Wolfe, B.B., 847 Edwards, T.W.D., Petel, A., Orme, A.R., Orme, A.J., 2008. Evidence of temperature 848 depression and hydrological variations in the eastern Sierra Nevada during the Younger 849 Dryas stade. Quat. Res. 70, 131–140. doi:10.1016/j.yqres.2008.04.005 850
Mahan, S.A., Gray, H.J., Pigati, J.S., Wilson, J., Lifton, N.A., Paces, J.B., Blaauw, M., 2014. A 851 geochronologic framework for the Ziegler Reservoir fossil site, Snowmass Village, 852 Colorado. Quat. Res. 82, 490–503. doi:10.1016/j.yqres.2014.03.004 853
Maher, K., Ibarra, D.E., Oster, J.L., Miller, D.M., Redwine, J.L., Reheis, M.C., Harden, J.W., 854 2014. Uranium isotopes in soils as a proxy for past infiltration and precipitation across 855 the western United States. Am. J. Sci. 314, 821–857. doi:10.2475/04.2014.01 856
Glover et al. – Alpine Southern California climatic change since 125 ka – QSR submission
McKay, N.P., Kaufman, D.S., Michelutti, N., 2008. Biogenic silica concentration as a high-857 resolution, quantitative temperature proxy at Hallet Lake, south-central Alaska. Geophys. 858 Res. Lett. 35. doi:10.1029/2007GL032876 859
Melles, M., Brigham-Grette, J., Glushkova, O.Y., Minyuk, P.S., Nowaczyk, N.R., Hubberten, 860 H.-W., 2006. Sedimentary geochemistry of core PG1351 from Lake El’gygytgyn—a 861 sensitive record of climate variability in the East Siberian Arctic during the past three 862 glacial–interglacial cycles. J. Paleolimnol. 37, 89–104. doi:10.1007/s10933-006-9025-6 863
Mensing, S.A., Sharpe, S.E., Tunno, I., Sada, D.W., Thomas, J.M., Starratt, S., Smith, J., 2013. 864 The Late Holocene Dry Period: multiproxy evidence for an extended drought between 865 2800 and 1850 cal yr BP across the central Great Basin, USA. Quat. Sci. Rev. 78, 266–866 282. doi:10.1016/j.quascirev.2013.08.010 867
Minnich, R.A., 1984. Snow Drifting and Timberline Dynamics on Mount San Gorgonio, 868 California, U.S.A. Arct. Alp. Res. 16, 395. doi:10.2307/1550901 869
Morton, D.M., Miller, F.K., 2006. Geologic map of the San Bernardino and Santa Ana 30’ x 60’ 870 quadrangles, California (Open-File No. 2006–1217). U. S. Geological Survey. 871
Moseley, G.E., Edwards, R.L., Wendt, K.A., Cheng, H., Dublyansky, Y., Lu, Y., Boch, R., 872 Spotl, C., 2016. Reconciliation of the Devils Hole climate record with orbital forcing. 873 Science 351, 165–168. doi:10.1126/science.aad4132 874
Muhs, D.R., Simmons, K.R., Schumann, R.R., Groves, L.T., Mitrovica, J.X., Laurel, D., 2012. 875 Sea-level history during the Last Interglacial complex on San Nicolas Island, California: 876 implications for glacial isostatic adjustment processes, paleozoogeography and tectonics. 877 Quat. Sci. Rev. 37, 1–25. doi:10.1016/j.quascirev.2012.01.010 878
Nowaczyk, N.R., Melles, M., Minyuk, P., 2006. A revised age model for core PG1351 from 879 Lake El’gygytgyn, Chukotka, based on magnetic susceptibility variations tuned to 880 northern hemisphere insolation variations. J. Paleolimnol. 37, 65–76. 881 doi:10.1007/s10933-006-9023-8 882
Nussbaumer, S.U., Steinhilber, F., Trachsel, M., Breitenmoser, P., Beer, J., Blass, A., Grosjean, 883 M., Hafner, A., Holzhauser, H., Wanner, H., Zumbühl, H.J., 2011. Alpine climate during 884 the Holocene: a comparison between records of glaciers, lake sediments and solar 885 activity. J. Quat. Sci. 26, 703–713. doi:10.1002/jqs.1495 886
Oster, J.L., Ibarra, D.E., Winnick, M.J., Maher, K., 2015. Steering of westerly storms over 887 western North America at the Last Glacial Maximum. Nat. Geosci. 8, 201–205. 888 doi:10.1038/ngeo2365 889
Oster, J.L., Kelley, N.P., 2016. Tracking regional and global teleconnections recorded by 890 western North American speleothem records. Quat. Sci. Rev. 149, 18–33. 891 doi:10.1016/j.quascirev.2016.07.009 892
Oster, J.L., Montañez, I.P., Mertz-Kraus, R., Sharp, W.D., Stock, G.M., Spero, H.J., Tinsley, J., 893 Zachos, J.C., 2014. Millennial-scale variations in western Sierra Nevada precipitation 894 during the last glacial cycle MIS 4/3 transition. Quat. Res. 82, 236–248. 895 doi:10.1016/j.yqres.2014.04.010 896
Glover et al. – Alpine Southern California climatic change since 125 ka – QSR submission
Overpeck, J., Garfin, G., Jardine, A., Busch, D.E., Cayan, D., Dettinger, M., Fleishman, E., 897 Gershunov, A., MacDonald, G., Redmond, K.T., Travis, W.R., Udall, B., 2013. Summary 898 for Decision Makers, in: Garfin, G., Jardine, A., Merideth, R., Black, M., LeRoy, S. 899 (Eds.), Assessment of Climate Change in the Southwest United States. Island 900 Press/Center for Resource Economics, Washington, DC, pp. 1–20. 901
Overpeck, J., Udall, B., 2010. Dry Times Ahead. Science 328, 1642–1643. 902 doi:10.1126/science.1186591 903
Owen, L.A., Finkel, R.C., Minnich, R.A., Perez, A.E., 2003. Extreme southwestern margin of 904 late Quaternary glaciation in North America: Timing and controls. Geology 31, 729. 905 doi:10.1130/G19561.1 906
Pak, D.K., Lea, D.W., Kennett, J.P., 2012. Millennial scale changes in sea surface temperature 907 and ocean circulation in the northeast Pacific, 10-60 kyr BP: CA MARGIN 908 MILLENNIAL SCALE EVENTS. Paleoceanography 27, n/a-n/a. 909 doi:10.1029/2011PA002238 910
Paladino, L., 2008. A vegetation reconstruction of Big Bear Lake: local changes and inferred 911 regional climatology. UCLA, Los Angeles. 912
Phillips, F.M., Zreda, M.G., Benson, L.V., Plummer, M.A., Elmore, D., Sharma, P., 1996. 913 Chronology for Fluctuations in Late Pleistocene Sierra Nevada Glaciers and Lakes. 914 Science 274, 749–751. doi:10.1126/science.274.5288.749 915
Pigati, J.S., Bright, J.E., Shanahan, T.M., Mahan, S.A., 2009. Late Pleistocene paleohydrology 916 near the boundary of the Sonoran and Chihuahuan Deserts, southeastern Arizona, USA. 917 Quat. Sci. Rev. 28, 286–300. doi:10.1016/j.quascirev.2008.09.022 918
Pigati, J.S., Miller, D.M., Bright, J.E., Mahan, S.A., Nekola, J.C., Paces, J.B., 2011. Chronology, 919 sedimentology, and microfauna of groundwater discharge deposits in the central Mojave 920 Desert, Valley Wells, California. Geol. Soc. Am. Bull. 123, 2224–2239. 921 doi:10.1130/B30357.1 922
Pospelova, V., Price, A.M., Pedersen, T.F., 2015. Palynological evidence for late Quaternary 923 climate and marine primary productivity changes along the California margin: CLIMATE 924 AND PRIMARY PRODUCTIVITY ON CM. Paleoceanography 30, 877–894. 925 doi:10.1002/2014PA002728 926
Price, A.M., Mertens, K.N., Pospelova, V., Pedersen, T.F., Ganeshram, R.S., 2013. Late 927 Quaternary climatic and oceanographic changes in the Northeast Pacific as recorded by 928 dinoflagellate cysts from Guaymas Basin, Gulf of California (Mexico): 929 DINOFLAGELLATE CYSTS FROM GUAYMAS BASIN. Paleoceanography 28, 200–930 212. doi:10.1002/palo.20019 931
Prokopenko, A.A., Hinnov, L.A., Williams, D.F., Kuzmin, M.I., 2006. Orbital forcing of 932 continental climate during the Pleistocene: a complete astronomically tuned climatic 933 record from Lake Baikal, SE Siberia. Quat. Sci. Rev. 25, 3431–3457. 934 doi:10.1016/j.quascirev.2006.10.002 935
Rack, F.R., Heise, E.A., Stein, R., 1995. MAGNETIC SUSCEPTIBILITY AND PHYSICAL 936 PROPERTIES OF SEDIMENT CORES FROM SITE 893, SANTA BARBARA BASIN: 937 RECORDS OF SEDIMENT DIAGENESIS OR OF PALEOCLIMATIC AND 938

Glover et al. – Alpine Southern California climatic change since 125 ka – QSR submission
PALEOCEANOGRAPHIC CHANGE?., in: In Proceedings of the Ocean Drilling 939 Program, Scientific Results. 940
Rasmussen, S.O., Bigler, M., Blockley, S.P., Blunier, T., Buchardt, S.L., Clausen, H.B., 941 Cvijanovic, I., Dahl-Jensen, D., Johnsen, S.J., Fischer, H., Gkinis, V., Guillevic, M., 942 Hoek, W.Z., Lowe, J.J., Pedro, J.B., Popp, T., Seierstad, I.K., Steffensen, J.P., Svensson, 943 A.M., Vallelonga, P., Vinther, B.M., Walker, M.J.C., Wheatley, J.J., Winstrup, M., 2014. 944 A stratigraphic framework for abrupt climatic changes during the Last Glacial period 945 based on three synchronized Greenland ice-core records: refining and extending the 946 INTIMATE event stratigraphy. Quat. Sci. Rev. 106, 14–28. 947 doi:10.1016/j.quascirev.2014.09.007 948
Reheis, M.C., Miller, D.M., McGeehin, J.P., Redwine, J.R., Oviatt, C.G., Bright, J., 2015. 949 Directly dated MIS 3 lake-level record from Lake Manix, Mojave Desert, California, 950 USA. Quat. Res. 83, 187–203. doi:10.1016/j.yqres.2014.11.003 951
Reimer, P., 2013. IntCal13 and Marine13 Radiocarbon Age Calibration Curves 0–50,000 Years 952 cal BP. Radiocarbon 55, 1869–1887. doi:10.2458/azu_js_rc.55.16947 953
Retelle, M., Child, J., 1996. Suspended sediment transport and deposition in a high arctic 954 meromictic lake. J. Paleolimnol. 16. doi:10.1007/BF00176933 955
Rhodes, E.J., 2015. Dating sediments using potassium feldspar single-grain IRSL: Initial 956 methodological considerations. Quat. Int. 362, 14–22. doi:10.1016/j.quaint.2014.12.012 957
Rood, D.H., Burbank, D.W., Finkel, R.C., 2011. Chronology of glaciations in the Sierra Nevada, 958 California, from 10Be surface exposure dating. Quat. Sci. Rev. 30, 646–661. 959 doi:10.1016/j.quascirev.2010.12.001 960
Roy, P.D., Quiroz-Jiménez, J.D., Pérez-Cruz, L.L., Lozano-García, S., Metcalfe, S.E., Lozano-961 Santacruz, R., López-Balbiaux, N., Sánchez-Zavala, J.L., Romero, F.M., 2013. Late 962 Quaternary paleohydrological conditions in the drylands of northern Mexico: a summer 963 precipitation proxy record of the last 80 cal ka BP. Quat. Sci. Rev. 78, 342–354. 964 doi:10.1016/j.quascirev.2012.11.020 965
Schnurrenberger, D., Russell, J., Kelts, K., 2003. Classification of lacustrine sediments based on 966 sedimentary components. J. Paleolimnol. 29, 141–154. doi:10.1023/A:1023270324800 967
Seki, O., Ishiwatari, R., Matsumoto, K., 2002. Millennial climate oscillations in NE Pacific 968 surface waters over the last 82 kyr: New evidence from alkenones: ALKENONE SEA 969 SURFACE TEMPERATURE IN CALIFORNIA MARGIN. Geophys. Res. Lett. 29, 59-970 1-59–4. doi:10.1029/2002GL015200 971
Silveira, E.I., 2014. Reconstructing hydrologic change over the past 96,000 years using 972 sediments from Baldwin Lake, San Bernardino County, California (B.A. Thesis). CSU-973 Fullerton, Fullerton, CA. 974
Springer, K.B., Manker, C.R., Pigati, J.S., 2015. Dynamic response of desert wetlands to abrupt 975 climate change. Proc. Natl. Acad. Sci. 112, 14522–14526. doi:10.1073/pnas.1513352112 976
Stout, M.L., 1976. Geologic Guide to the San Bernardino Mountains, Southern California: 977 Annual Spring Field Trip. 978

Glover et al. – Alpine Southern California climatic change since 125 ka – QSR submission
Street, J.H., Anderson, R.S., Paytan, A., 2012. An organic geochemical record of Sierra Nevada 979 climate since the LGM from Swamp Lake, Yosemite. Quat. Sci. Rev. 40, 89–106. 980 doi:10.1016/j.quascirev.2012.02.017 981
Tubbs, A.M., 1972. Summer Thunderstorms Over Southern California. Mon. Weather Rev. 100, 982 799–807. doi:10.1175/1520-0493(1972)100<0799:STOSC>2.3.CO;2 983
Tzedakis, P.C., Andrieu, V., de Beaulieu, J.-L., Birks, H.J.B., Crowhurst, S., Follieri, M., 984 Hooghiemstra, H., Magri, D., Reille, M., Sadori, L., Shackleton, N.J., Wijmstra, T.A., 985 2001. Establishing a terrestrial chronological framework as a basis for biostratigraphical 986 comparisons. Quat. Sci. Rev. 20, 1583–1592. doi:10.1016/S0277-3791(01)00025-7 987
U.S. Climate Data [WWW Document], 2016. . US Clim. Data Big Bear Lake - Calif. URL 988 http://www.usclimatedata.com/climate/big-bear-lake/california/united-states/usca0094 989 (accessed 8.8.16). 990
Vogel, H., Meyer-Jacob, C., Melles, M., Brigham-Grette, J., Andreev, A.A., Wennrich, V., 991 Tarasov, P.E., Rosén, P., 2013. Detailed insight into Arctic climatic variability during 992 MIS 11c at Lake El’gygytgyn, NE Russia. Clim. Past 9, 1467–1479. doi:10.5194/cp-9-993 1467-2013 994
Wagner, J.D.M., Cole, J.E., Beck, J.W., Patchett, P.J., Henderson, G.M., Barnett, H.R., 2010. 995 Moisture variability in the southwestern United States linked to abrupt glacial climate 996 change. Nat. Geosci. 3, 110–113. doi:10.1038/ngeo707 997
Wise, E.K., 2010. Spatiotemporal variability of the precipitation dipole transition zone in the 998 western United States: PRECIPITATION DIPOLE TRANSITION ZONE. Geophys. Res. 999 Lett. 37, n/a-n/a. doi:10.1029/2009GL042193 1000
Wohlfarth, B., Veres, D., Ampel, L., Lacourse, T., Blaauw, M., Preusser, F., Andrieu-Ponel, V., 1001 Kéravis, D., Lallier-Vergès, E., Björck, S., Davies, S.M., de Beaulieu, J.-L., Risberg, J., 1002 Hormes, A., Kasper, H.U., Possnert, G., Reille, M., Thouveny, N., Zander, A., 2008. 1003 Rapid ecosystem response to abrupt climate changes during the last glacial period in 1004 western Europe, 40–16 ka. Geology 36, 407. doi:10.1130/G24600A.1 1005
Woodhouse, C.A., Meko, D.M., MacDonald, G.M., Stahle, D.W., Cook, E.R., 2010. A 1,200-1006 year perspective of 21st century drought in southwestern North America. Proc. Natl. 1007 Acad. Sci. 107, 21283–21288. doi:10.1073/pnas.0911197107 1008
Woolfenden, W.B., 2003. A 180,000-year pollen record from Owens Lake, CA: terrestrial 1009 vegetation change on orbital scales. Quat. Res. 59, 430–444. doi:10.1016/S0033-1010 5894(03)00033-4 1011
Zimmerman, S.H., Myrbo, A., 2015. Lacustrine Environments (14 C)., in: Encyclopedia of 1012 Scientific Dating Methods. pp. 365–371. 1013
Zimmerman, S.R.H., Pearl, C., Hemming, S.R., Tamulonis, K., Hemming, N.G., Searle, S.Y., 1014 2011. Freshwater control of ice-rafted debris in the last glacial period at Mono Lake, 1015 California, USA. Quat. Res. 76, 264–271. doi:10.1016/j.yqres.2011.06.003 1016
1017

Table 1. AMS radiocarbon dates, infrared-stimulated luminescence dates, and tie points used for BDL12’s age model. Mean age from Bacon 2.2 (based upon IntCal13; Reimer et al., 2013) is used for the calendar-years age model; see text and Figure 2 for details.
Accelerated Mass Spectometry Radiocarbon Dates W. M. Keck Carbon Cycle AMS Radiocarbon Lab, UC-Irvine Sample No. Depth (cm) Material Raw 14C Age Approximate
Calendar Age UCI-121791 152 charcoal 10,010 ± 320 ~11,868 UCI-124533 262 charcoal 21,150 ± 810 ~24,307 UCI-124534 389 charcoal 25,170 ± 280 ~29,339 UCI-121792 440 pine cone piece 25,990 ± 140 ~30,400 UCI-124535 529 charcoal 27,240 ± 180 ~31,474 UCI-124536 745 charcoal 35,710 ± 790 ~40,417 UCI-121793 815 twig 41,010 ± 700 ~43,997 Post-IR Infrared Stimulated Luminescence dates Earth and Planetary Sciences Dept., UCLA Sample No. Depth (cm) Material 50˚C IRSL Signal
(cal yr BP) 225˚C IRSL Signal
(cal yr BP) J0395 2075 massive silt 88,500 ± 6,200 87,800 ± 6,100 J0396 2173 clayey silt 55,800 ± 5,400 44,900 ± 3,900 J0397 2570 sand 117,000 ± 8,000 109,000 ± 8,000 J0398 2700 sand 136,000 ± 10,000 124,000 ± 8,000 Tie-Points for orbital tuning
Depth (cm) Age (cal yr BP) 1573 71,000 1746 83,000 2060 94,000 2197 105,000 2433 116,000
Table1

Table 2. Multi-proxy summary from Baldwin Lake core BDL12, by Marine Isotope Stage (MIS). MS = magnetic susceptibility, reported in SI units (105 of measured values). CaCO3 = carbonate content from loss-on-ignition analysis. Trace element data (Ca, Fe, Ti, and Mn:Ti) reported as average ppm for each MIS, unless otherwise noted. “Insolation” refers to summer insolation at 30˚N (Laskar, 2004), except for MIS 3, where both summer and winter are noted. For MIS 5, substages with letters (e.g. MIS 5b) refer to the span of the entire substage and its conditions, and are ordered alphabetically youngest-to-oldest.
Stage/Substages Cal Yr BP
Key Changes in Insolation and Proxy Data Key Paleoenvironmental Conditions/Events
MIS 5e (125 to 120)
• relatively rapid insolation shift from 528 W/m2 at 127 ka, to 474 W/m2 at 120 ka • sand facies throughout (grain size mode >400 µm); minimal clay (<1%) • high dry density (>1.2 g/cm3), MS <7 SI throughout; average value 3.2 SI • Ti (~2400 ppm) and Fe (~8500 ppm) low until rapid increase to 3500 ppm (Ti) and >20,000 ppm (Fe) at 121 ka • low organic content (<1%), CaCO3 (<3%) and Ca (~6800 ppm) throughout; no BSi analysis
• High-energy deposition
MIS 5d – 5c (120 to 95)
• insolation low 448 W/m2 at 116 ka, rose to 533 W/m2 by 105 ka, declined to 460 W/m2 by 95 ka • fine-grained, inorganic clayey silt throughout, with fine sand (grain size mode = 58 µm) at 106 ka • MS rose from ~7 SI to ~16 SI from 121 - 118 ka, gradually declined to <5 SI by 112 ka, generally stayed below <6 SI until 95 ka, except for short excursion at 101 ka (51 SI) • high Ti (~3500 ppm) and Fe (~35,000 ppm) until 112 ka, lows of ~600 ppm (Ti) and ~8000 ppm (Fe) at 107 and 102 ka, moderate-to-high Ti (~2500 ppm) and Fe (~25,000 ppm) began 98 ka • low-to-moderate Ca (~20,000 ppm) and CaCO3 (5000-10,000 ppm) until peak at 112 ka (Ca ~109,000 ppm, CaCO3 ~20%), then declined over next 8 kyr until 95 ka • low organics (<5%) until 113 ka, peaks ~33-39% at 106 ka and 103 ka, declined to <5% by 95 ka • BSi generally followed organics, with 1-3 mg/g background, peak of 11.3 mg/g at 103 ka
• Basin closure near onset of MIS 5d • Cool, deep, unproductive lake conditions ascribed to MIS 5d insolation minimum • High-erosion event 106 ka • Transition to more shallow, productive lake late MIS 5d; peak productivity during MIS 5c (103 ka)
MIS 5b – 5a (95 to 71)
• insolation rose from 460 W/m2 at 95 ka to 524 W/m2 by 83 ka; declined to 465 W/m2 by 72-71 ka • silt deposition throughout, with calcareous layers including mollusks that end abruptly 81 ka • MS low (<2 SI) between 86 – 76 ka; rose to 5 – 7 SI by end of MIS 5 • moderate Ti (~1200 ppm) and Fe (17,000 ppm) at 95 ka, declined to <100 ppm and ~6000 ppm by 83 ka, gradually increased to 1700 ppm and 18,000 ppm by 71 ka. • moderate Ca (25,000 – 60,000 ppm) until 89 ka, then maxima 180,000 ppm at 86 ka, and 160,000 ppm at 83 ka. CaCO3 ranged 5-15%, with peaks 22% at 86 ka, and 30% at 83 ka. Mn:Ti 0.84 at 83 ka and 0.74 c. 86 ka. • varied organic content: minima are <5% from 95 – 93 ka and 73 – 72.6 ka, maxima of ~33% at 88.2 ka and 81.6 ka. Maximum for BDL12 is 44% at the MIS 5a/MIS 4 transition (71 ka) • BSi varied with organics, with peak value 17.4 mg/g at 82.6 ka
• High-amplitude change in lake productivity • Lowstand conditions evident at 87 ka and 82 ka, with abrupt transition out of the latter, likely due to rapid shift in available moisture
Table2

MIS 4 (71 to 57)
• low insolation 465 W/m2 at 71 ka increased to 510 W/m2 by 60 ka • clayey silt (density ~0.70 g/cm3) deposition that transitioned to organic silt (density <0.54 g/cm3) • moderate-to-high organics (average = 16.5%); BSi at late MIS 4 (55-51 ka) was 9.8 – 11.5 mg/g • moderate-to-low MS, Ti and Fe throughout (MS ~5.0 SI, Ti ~1500 ppm, Fe ~20,000 ppm) • shallow-water indicators were moderate at onset of MIS 4: Ca (22,000 ppm), CaCO3 (<11%), but decline by 69 ka and remain low (Ca ~ 4900 ppm, CaCO3 <5%, Mn:Ti ~0.11),
• Basin shift occurred 69 ka towards deeper lake and sustained productivity that persisted after MIS 4
MIS 3 (57 to 29)
• summer insolation ranged between 481 – 506 W/m2; winter insolation 213 – 227 W/m2 and maintained 220 W/m2 from 49 to 37 ka • fine-grained organic silt (mode 12 – 39 µm), dry density <1.00 g/cm3 (average = 0.48 g/cm3) • low MS (average = 3.9 SI); Ti decreased from ~1700 to 900 ppm by 37 ka, then increased to ~1400 ppm by 29 ka. Broad decrease and increase in Fe (ranged ~11,000 – 21,000 ppm) with shorter, rapid increases throughout (~ 51,000 ppm) • suppressed Ca (~2500 ppm) and CaCO3 (<10%, average of ~4.3%) throughout MIS 3 • moderate organic content (average = 18.8%), with millennial-scale fluctuations ranging 10—28% • BSi relatively high throughout MIS 3, ranging 7.7 – 13.4 mg/g
• lowest-amplitude variation in both summer and winter insolation for nearly 30 kyr; reduced seasonality • Consistently productive lake that remained stratified and deep • Organic content does not shift in tandem with summer insolation, and millennial-scale fluctuations suggest North Atlantic forcing (Figure 5)
MIS 2 (29 to 14)
• insolation low of 471 W/m2 at 23 ka, reached 509 W/m2 by 14 ka • predominantly silt deposition, with a coarser layer (28% sand) 28 ka; deposition rate declined by more than half (~0.05 cm/yr during MIS 3 to ~0.02 cm/yr for MIS 2m) • MS maximum at LGM start, with peak at 26 ka (~100 SI) above background values of 0 – 11 SI • high Ti (2300 – 3600 ppm) and Fe (average 26,000 ppm, with 56,000 ppm peak) began 26.3 ka, maintained until MIS 1 • low Ca (6000 ppm), CaCO3 (generally <5%) and Mn:Ti (0.12) throughout • final organic content increase to 23% at 27.7 ka, then decline to <5% by 21 ka and thereafter • BSi decreased overall from 7.9 to 5.4 mg/g, though with peaks and lags separate from organics. Pediastrum are abundant 24 ka, and trace element phosphorus began increase 27 ka from ~7000 ppm, reaching ~14,000 ppm by 14.5 ka
• Low insolation, cold conditions, and deep water • last phase of moderate productivity at 27.7 ka not paced with insolation • BSi suggests moderate-to-low lake productivity during MIS 2, perhaps due to high K influx and abundant Pediastrum 24 ka
MIS 1 (<14)
• insolation continued its increase to 515 W/m2 by 11 ka, declined to 488 W/m2 by 5 ka • desiccated, inorganic clayey silt (mode grain size <29µm); dry density is high (0.67 – 1.74 g/cm3) • erratic MS, varying between -2.6 - 8 SI; high Ca (~84,000 ppm), low Ti (~1300 ppm), generally low Fe (18,000 ppm) with excursion ~73,000 ppm at 11.8 ka, high Mn:Ti (0.58) • relatively high carbonate content; abrupt rise at 12.7 ka to ~15%; MIS 1 average 14.6% • low organic content (<10%, average 4.7%) and two moderate BSi horizons (4.5 – 7.8 mg/g)
• Transition to intermittent lake • Desiccation, low sedimentation, and uncertain age prevent study of lake conditions after c. 12 ka

2000
3000
2400
2400
2400
2400
2600
2400
2400
2800
2400 2200
2400
2400
2200
2200
2200
2200
2000
2000
2000
1800
1800
1800
1600
1600
1400
2600
2600
2200
2200
2200
2200
2200
2400
2000
1800
1800
1800
1800
1800
1600
Esri, HERE, DeLorme, MapmyIndia, © OpenStreetMap contributors, and the GIS user community0 2.5 5 7.5 101.25
km
Water body
Elevationcontour (m)
State Hwy
City Limits
DamCoringLocation
BBLVCV05-1
2400
BDL12BLDC04-2
Baldwin
Lake
Sugarloaf
Mountain
Lower Bear
Lake
2400
extent of Pleistocene-
age Sugarloaf fan
(Leidy, 2006)
Figure1

02
04
06
08
01
00
12
01
40
0 500 1000 1500 2000 25003000
Depth (cm)
Ag
e (
ka B
P)
Legend
Tie point with ± 2 kyr error
Radiocarbon date
IR50 IRSL date
Weighted mean age
Core break/hiatus
post-IR225 IRSL date
460 500 540
12
01
00
80
60
Jun 21 Insolation at 30˚N (W/m2)
Ag
e (
ka B
P)
0 20 40
Organic (%)
25
00
20
00
15
00
De
pth
fro
m s
urf
ace
(cm
)
(a) (b)
Figure2

Silt
Clayey silt
Silt with shells Sand1-cm resolution data
Sandy silt
(a) BDL12Stratigraphy and Chronologic Control
82 - 96
101 - 125
116 - 146
24.3
29.3
30.4
31.5
40.4
44.0
11.9
IRSL Date
14C Date
MIS
1M
IS 2
MIS
3M
IS 4
MIS
5
a
b
c
d
e
25-cm resolution data
50-cm resolution data
clay
silt
san
d
0 1.0 2.0
25
00
20
00
15
00
10
00
50
00
(b) Dry Density (g/cm3)
De
pth
(cm
)
60 80
(c) Bulk Inorganics (%)
100
(d) Mass Accumulation Rate (MAR)
0 25 50 400 500
(e) Grain Size Mode (µm)
0.00 0.05 0.10
Figure3

(i) Ca (ppm)(c) Jun Insolation
at 30˚N (W/m2)
(e) Ti (ppm)
(d) Fe (ppm) (f) BDL12 MS (10-5)
5 10
(a) BSi (wt perc)
15
0 20 40
(b) Organics (%)
460 500 540
0 2000 4000
10,000 30,000 50,000
0 10 20 30
0 150,00075,000
0 10 20 60 100
12
01
30
10
08
06
04
02
01
0
0 1 2
(g) Mn:Ti
(h) Carbonates (%)
MIS
21
MIS
3M
IS 4
5a
5e
5d
5c
5b
Figure4
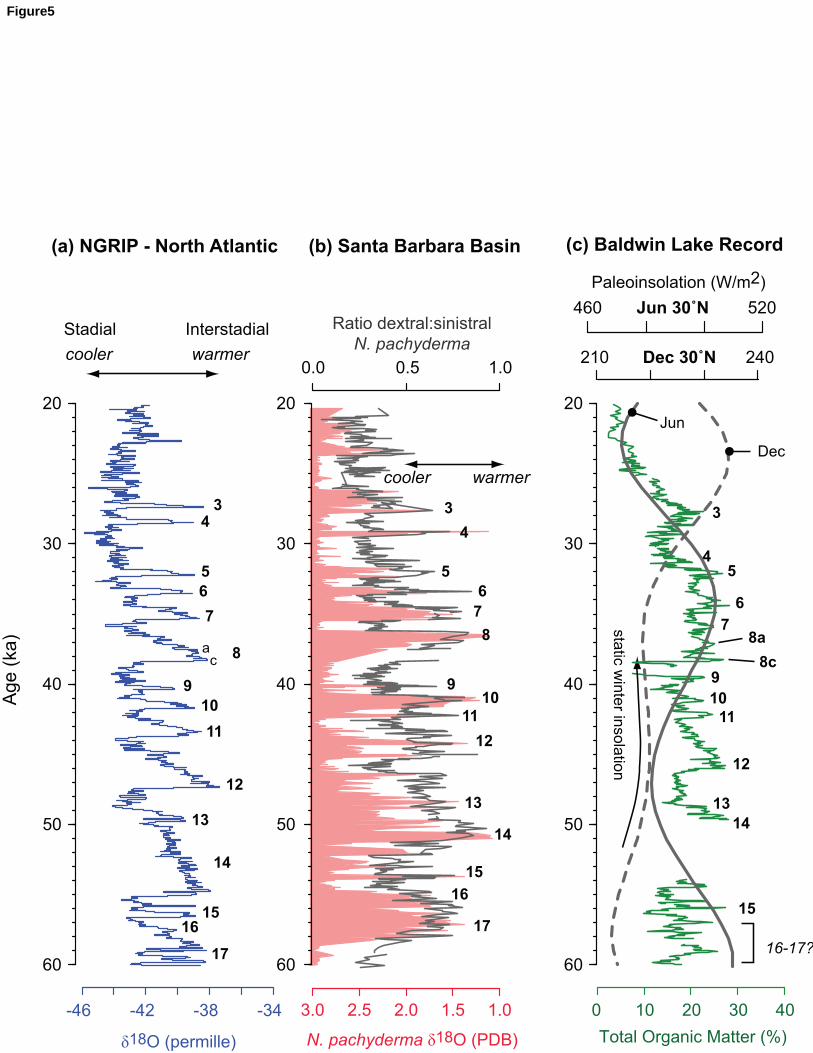
-46 -42 -38 -34
60
50
40
30
20
δ18O (permille)
Ag
e (
ka
)
60
50
40
30
20
60
50
40
30
20
0 10 20 30 40
Total Organic Matter (%)
sta
tic w
inte
r inso
latio
n
Paleoinsolation (W/m2)
(c) Baldwin Lake Record (b) Santa Barbara Basin (a) NGRIP - North Atlantic
34
5
6
7
8ac
9
10
11
12
13
14
1516
17
3.0 2.5 2.0 1.5 1.0
N. pachyderma δ18O (PDB)
3
4
5
6
7
8
910
11
12
13
14
15
16
17
warmer
InterstadialStadial
cooler
warmercooler
0.0 0.5
Ratio dextral:sinistral
N. pachyderma
1.0
54
3
6
7
9
10
11
13
12
14
15
16-17?
8c
8a
Dec
Dec 30˚N210 240
460 Jun 30˚N 520
Jun
Figure5

Esri, HERE, DeLorme, MapmyIndia, © OpenStreetMap contributors, and the GIS user community
125˚W 120˚W 115˚W 110˚W 105˚W
125˚W 120˚W 115˚W 110˚W 105˚W
40˚N
35˚N
30˚N
40˚N
35˚N
30˚NMapmyIndia, MapEsri, HERE, DeLorme,
tributors, and tors,© OpenStreetMap contryythe GIS user communitythe GIS user community
0 150 300 450 60075Kilometers
MIS 3 N. AtlanticInterstadial Response
State change towards:
Wetter Drier
Warmer Colder
Site Types
Marine
Mediterranean
Lake
Speleothems
Groundwater
Deposit or Soil
Precipitate
Ecoregion
Temperate Desert
Temperate Steppe
Tropical-Subtropical
Steppe
Tropical-Temperate
Desert
Franklin
Babicora
Mono
Pyramid
Owens
Fort Stanton
Devil’s
Death Valley/L. Manly
Yucca Mtn
Barstow
Newark
Diamond
Leviathan
Pinnacle
Las Vegas Valley
Valley Wells
Elsinore
Carlsbad
Searles
Baldwin
ODP 893/Santa Barbara Basin
Cave of Bells
Manix
Lehman
McLean
Walker
Hay
Harper
1014
1012
1017
1018
San Ped
ro V
alle
y
Figure6

wet m
arg
inal sites
Esri, HERE, DeLorme, MapmyIndia, © OpenStreetMap contributors, and the GIS user community
125˚W 120˚W 115˚W 110˚W 105˚W
125˚W 120˚W 115˚W 110˚W 105˚W
40˚N
35˚N
30˚N
40˚N
35˚N
30˚N
0 150 300 450 60075Kilometers
MIS 3 N. AtlanticInterstadial Response
State change towards:
Wetter Drier
No D-O response detected
Millennial-scale events with uncertain response
Dry interstadials
Wet interstadials
MIS 3 N. Atlantic
Interstadials Response
warm
er SST
s
widespread Southwestern aridity
Lack of D-O
response in
Great Basin interior
Figure7

Figure 1. Map of Big Bear Valley, San Bernardino Mountains, California. Cores taken in
include Lower Bear Lake (BBLVCV05-1; Kirby et al., 2012), Baldwin Lake (BDLC04-
2; Kirby et al., 2006; Blazevic et al., 2009) and a second core from Baldwin Lake
(BDL12; this study). Contour interval = 200 m
FigureCaptions_Text

Figure 2. a) Bacon 2.2 age-depth model from radiocarbon dates, luminescence dates, and
tie-points (Table 1). b) Tie-points established between insolation peaks and troughs from
summer values at 30˚N (Laskar, 2004), and corresponding maxima and minima in a 5-
point moving average of high-resolution organic content data throughout BDL12.

Figure 3. Stratigraphy, age horizons, and sedimentological data for BDL12, with
approximate boundaries of Marine Isotope Stages after Lisiecki and Raymo (2005). The
age range for three pairs of post-IR IRSL dates are shown. Substage lettering (MIS 5e –
5a) is not bracketed at specific time points, due to this age uncertainty.
Figure 4. Physical and geochemical data, plotted by age and with Marine Isotope Stage
boundaries noted. (a) Biogenic silica. (b) Bulk organic content, determined with loss-on-
ignition. (c) Summer insolation at 30˚N. (d) Trace element iron (Fe). (e) Trace element
titanium (Ti). (f) BDL12 magnetic susceptibility (SI). (g) Manganese to titanium ratio
(Mn:Ti). (h) Bulk carbonate content (CaCO3), determined with loss-on-ignition. (i) Trace
element calcium (Ca).
Figure 5. (a) NGRIP 18O shifts from 60 – 20 ka, with Greenland Interstadial (GI)
numbers (i.e. Dansgaard-Oschger events, Rasmussen et al., 2014). While many GIs have
substages, only GI-8 has the substages shown for simplicity’s sake. (b) Santa Barbara
Basin core ODP-893, with interstadials labeled after Hendy and Kennett (2000) and latest
age model (Hendy et al., 2007). (c) Baldwin Lake core BDL12 bulk organic content from
60 – 20 ka, with summer and winter insolation (Laskar, 2004), and proposed D-O
interstadial numbering.

Figure 6. Paleoclimatic sites discussed in this review, with North American ecoregions
shown (Bailey, 2009). See text for references.

Figure 7. Response of regional sites to Dansgaard-Oeschger (D-O) interstadials during
MIS 3 (57 – 29 ka).

Glover et al. – Alpine Southern California climatic change since 125 ka – QSR submission
Highlights: • A new multi-proxy record from Baldwin Lake, San Bernardino Mountains, California dates from 125-10 ka. • Baldwin Lake’s changes in primary productivity, determined with correlated loss-on-ignition and biogenic silica, were likely influenced over long timescales by subtropical summer insolation. • Shorter, millennial-scale oscillations in primary productivity at Baldwin Lake coincide with Dansgaard-Oeschger events in the North Atlantic, and those detected at other California records. • We thus hypothesize that alpine Southern California climate is sensitive to orbitally-induced insolation shifts, and rapid climate change in the North Atlantic. • A review of paleoclimate sites throughout Southern California, the Great Basin, and the Southwest show that widespread hydrologic state change occurred at the MIS 4/3 transition (60 – 57 ka), and Dansgaard-Oeschger events during MIS 3 coincide with warmer SSTs, and enhanced aridity in Southern California and Southwestern deserts.
*Highlights (for review)
Response to Reviewers for QSR submission #JQSR-D-16-00445R1 (Glover et al., “Evidence for orbital and North Atlantic climate forcing in alpine Southern California between 125 - 10 ka from multi-proxy analyses of Baldwin Lake”) Response to individual comments re. numbered lines of manuscript are in italics. Please note that the line numbering of the resubmitted manuscript is different in most places. Reviewer #1: Major comments The revised manuscript by Glover et al is improved from the previous version, and has significantly clearer conclusion. The science is pretty solid. I don't see any scientific issues that are barriers to the work being eventually published in QSR. But the writing still needs substantial improvement, as detailed extensively below. I had hoped the senior authors would have spent some more time (so the volunteer reviewers didn't need to) helping to improve the writing, but there are so many typos and unclear sentences that it seems this hasn't happened extensively. In general, a useful pro-tip for writing is to provide context and rationale before a conclusion. Here's an example of how line 150-1 could be improved to make the writing clearer: "Because a significant correlation between BSi - which is primarily produced in lake waters - and organic content can best be explained by in situ lake productivity, the observed correlation (r = 0.80) between them at Baldwin Lake supports our interpretation that organic content does not reflect an influx of terrestrial organic material into the lake". Remember that your reasoning is not always apparent to the reader, who may not be a specialist in paleolimnology. Examples abound throughout the manuscript that would benefit from similar improvements. I've tried to provide a few prominent examples. Thank you for the careful read-through for suggested examples. We have looked thoroughly through the manuscript for typos and unclear sentences. We also have made use of the suggested structure (context->rationale->conclusion) as noted below. Minor comments L44: change to "Pacific southwest"? Sounds better than "coastal" and has a better-known counterpart in Pacific Northwest. “U.S. Coastal Southwest” has been a problematic phrase while writing this paper. Southern California seems the best, most clear way to name the area discussed in this section. This is referenced in the previous sentence. This sentence noted here has been changed to just say “towards the coast” to differentiate it from interior desert regions. L78 needs some context to begin, like "Following initial short-core extractions in 200x,…"
*Response to Reviewers
I interpreted this to mean: provide context of prior work on the site. I added a lead-in sentence referencing Matt Kirby’s coring and work at Baldwin Lake from 2004-2006. 116: needs some clarification. Describe why would BSi not reflect terrestrial input, provide context for the reader. I would rephrase this sentence along the lines of "Because BSi is only produced within lake waters, a significant correlation to organic content would indicate that lake primary productivity, not influx of terrestrial organic material from the watershed, is the dominant control of organic production". This section has been rephrased, utilizing some of the suggested language. Some nuance was necessary, however, and emerged from discussion between the authors about BSi as a proxy. High primary productivity can derive from both enhanced light intensity and terrestrial runoff (which will lead to enhanced nutrient loading, and terrestrial sources of amorphous silica e.g. phytoliths, though these tend to be minimal). I aimed to keep interpretative statements about the proxy limited in the “Methods” section where I could. The exception to this is the ensuing “Chronologic Control” section (3.4), where I did feel this was important to discuss lake processes, as this understanding is important for the assumptions made. I changed the name of 3.4 to “Chronologic Control – assumptions and approach” to signal that this is a longer-then-usual discussion for “Methods.” Section 4.3 later in the paper was also written with the original intend of interpreting and defending how proxies are responding in this particular basin, given the evidence and literature. 140-8: present your reasoning for the local insolation/organic proxy age model tuning. It seems reasonable, but there should be more justification than just "other studies do it". I changed the order of the paragraph to lead with prior work/interpretation on this site, and the new dataset, in order to emphasize these and elaborate a little more. Examples of other studies then follow. 141: was not were 142 replace "-" with "to" 146: Line beginning with "We hypothesize" belongs with next paragraph. 150-1 explain why this correlation suggests it. 155: alge are the source of organics? Provide some context. Also, insolation does not equal "available light", which can be influenced by other parameters like water clarity and ice cover. Do you mean potential light intensity? I think it might be better to rephrase this as "Because we expect light intensity reaching Baldwin Lake to be a primary control on algal organic matter production, we use local (30°N) summer insolation as a proxy for light intensity to establish age estimates for organic matter peaks and troughs". 158 "…possible other influences on organic matter production…" (again, be clear what you are referring to so the reader doesn't have to try to guess.)

This section (“Chronologic Control”) has been substantially rewritten to clarify the approach, and be clear about underlying assumptions made for the age model. I also addressed the concern from line 208 here about the immediate response to insolation we assume, vs. the ~3 kyr lag established for the Great Basin (about More detail below under that comment.) 159 where not were. edited 167: what are "default priors" and how are they relevant? This may be clear to a BACON user, but not to all readers. Thanks for this suggestion. This level of detail did not seem the norm in other literature using Bacon modeling, but since this is an unusually long core (and unusual use of Bacon), these details have now been included. I’ve also cited the paper that originally set the default priors for accumulation rates. Bacon suggested some alternatives for core section and memory, so I was clear in the text that we used these. 170-1: rewrite "We interpreted the presence of a hiatus at 2596 cm because of a sharp break…" Rewritten, though with a different syntax (I noted a few other words/phrases that didn’t make sense) 173: "modern" means the age is certain, so as-written this is a non-sequiter. What you are probably referring to is "the uppermost sediments have an uncertain age" because of the lack of information on when the lake dessicated. Sentence has been rewritten with suggestions (and elimination of word “modern”) 183 how much longer? Provide numbers. A sentence was added to note the uppermost-dated horizon from the prior study (~20.3 ka at ~114 cm, compared to new results of ~11.9 ka at 152 cm) 200: add period done 208: Paleotemperature lagged insolation in the southwest by a few thousand years, but you are assuming without presenting any evidence that they do not. Why? There is not yet enough evidence that the drivers (e.g. boreal insolation with a millennial-scale lag) and processes that produce this in the Great Basin and Southwest are appropriate for California sites. In recent literature, local or subtropical insolation is
typically invoked for comparison with California paleorecords. The assumption in these studies is that there is an immediate response, or it is noted that age uncertainties are too large at present to detect a lag. This description/argument has been added to the text, with supporting citations. I acknowledged that nearby physiographic regions (i.e. Great Basin) demonstrated a ~3 kyr lag with insolation earlier, in the “Methods: Chronologic Control” as part of the rationale for the age model, and why we used tie-points with no lag. I have added language (again, in this earlier section) that this is a set of assumptions supporting a first-pass interpretation of climate drivers and an age model (open to revision with future work on California paleorecords that can produce better-resolved chronologies prior to the LGM). 211: coincided with not corroborated. Also "low dry density"? It isn't clear. Suggested word change made, and dry density (which has low values here) clarified. 216-8: provide evidence supporting this interpretation. No concrete sedimentary evidence for this interpretation, so language has been tempered to indicate this is our hypothesis for a process that could produce low values (despite initial expectations for higher values). 221: change to "We interpret relatively higher values of Ti, and in part, Fe, to phases of increased detrital, non-biogenic sediment deposition". Edited to reflect changes 222-5 I don't understand how Ca and Mg/Ti are linked, or should this sentence be split in two? Ca and Mg/Ti are generally phased in this system and co-occur, but this comment is correct to point out that their interaction with each other is unknown. I have split this into separate sentences. 229: re-write: "Taken together, we interpret the increased …. to reflect a warmer and ventilated lake. This warming may have also resulted from shallowing." Suggestions have been incorporated 231: what evidence is there for anoxia? Good pollen preservation (and the smell!). However, these are lines of evidence that have continually been problematic to mention in this ms (see comments re. line 276). Sentence has been changed to suggest that anoxia is possible when the trace elements

mentioned in prior sentence are all low, yet organic matter values indicate productivity (phytoplankton deposition -> bacterial decay which depletes oxygen). 235: rewrite "A luminescence age of xxx yr BP from a depth of yyy cm shows that sediment deposition at the base of the core began in MIS 5e…" Rewritten, though suggested syntax had to be adjusted to note there are two possible age ranges, depending on at which temperature the signal was measured. 245: provide evidence to support this statement. Most supporting evidence for this statement in prior sentence – I have added additional evidence, and made the transition between sentences more clear. 254: "indicate" not "indicates" edited 273: change "suppressed" to "show low concentrations" edited 276: provide citation for pollen preservation observation. I eliminated mention of the fossil pollen. Manuscript about it is not yet submitted to provide a citation, and Reviewer #2 had also noted this would need elaboration in this work. 279: should read "organic matter concentrations" Edited 288: should read "One possible interpretation for this high MS excursion is an increase (decrease?) in reducing conditions…" Edited to include this language (and clarified that reducing conditions decrease as a possible explanation for a high magnetic signal. 290-1 should read "Shallow-water indicators Ca, CaCO3, and Mn:Ti increased suddenly around 12 ka, after which time Baldwin Lake likely transitioned to an intermittent, playa surface as summer insolation rose from 23 to 11 ka". Text edited to combine sentences and reflect the suggested syntax.
301-2: does Owens lake have the chronology to make this statement? Or is it assumed based on visual curve matching? Sentence removed; likely a carry-over from prior draft where these data re. Owens Lake were shown (and subsequently removed, due to age model concerns expressed by both reviewers). 305-8: what evidence? This seems to be circular, as there is not an independent chronology for the core to detect a difference between local insolation and paleotemperature (which lags insolation). Language here has been simplified, though I did not substantially change content. The statement (from earlier in the manuscript) that organic matter is a relative indicator of paleotemperature throughout the basin’s history was eliminated in these revisions. 320-4: these sentences need to be re-written clearly. These have been rephrased, along with a few of the subsequent sentences, for clarity. Basically we want to make a comparison between two periods of high summer insolation (over 510 W/m2) and explain why the site desiccated in the Early Holocene (but not before), with basin infilling likely playing a role. 354: "… in Baldwin Lake's proxies for paleoproductivity (BSi and organic content) and temperature (what proxy?..." rephrased, and “temperature” eliminated based on rationale described above. 400 "close to"? and 401 "at sites 1014…" both fixed 438 "The Great Basin…." fixed 498: "High-temperature low SST" doesn't make any sense. This has been rephrased
Reviewer #2: This paper has been improved in many ways over the original submittal.

SuppData_SedDescriptionClick here to download Supplementary Data: SuppInfo_SedDescription.docx

SuppDataClick here to download Supplementary Data: BDL12_DataForQSR_Mar2017.xls