
Electrophysiological analysis of cortical mechanisms of selective attention to high and low spatial...
19
Electrophysiological analysis of cortical mechanisms of selective attention to high and low spatial frequencies A. Martı ´nez a , F. Di Russo b,c , L. Anllo-Vento b , S.A. Hillyard b, * a Department of Radiology, University of California, San Diego, La Jolla, CA 92093-8756, USA b Department of Neurosciences, University of California, San Diego, La Jolla, CA 92093-0608, USA c Fondazione Clinica Santa Lucia IRCCS, Rome, Italy Accepted 25 July 2001 Abstract Objectives: This study investigated whether short-latency (,100 ms) event-related potential (ERP) components were modulated during attention to spatial frequency (SF) cues. Methods: Sinusoidally modulated checkerboard stimuli having high (5 cycles per degree (cpd)) or low (0.8 cpd) SF content were presented in random order at intervals of 400–650 ms. Subjects attended to either the high or low SF stimuli, with the task of detecting targets of slightly higher or lower SF, respectively, than the above standards. ERPs were recorded from 42 scalp sites during task performance and spatio-temporal analyses were carried out on sensory-evoked and attention-related components. Results: Attended high SF stimuli elicited an early negative difference potential (ND120) starting at about 100 ms, whereas attended low SF stimuli elicited a positivity (PD130) in the same latency range. The neural sources of both effects were estimated with dipole modeling to lie in dorsal, extrastriate occipital areas. Earlier evoked components evoked at 60–100 ms that were modeled with striate and extrastriate cortical sources were not affected by attention to SF. Starting at 150 ms, attended stimuli of both SFs elicited a broad selection negativity (SN) that was localized to ventral extrastriate visual cortex. The SN was larger over the left/right cerebral hemisphere for attended stimuli of high/low SF. Conclusions: These results support the view that attention to SF does not involve a mechanism of amplitude modulation of early-evoked components prior to 100 ms. Attention to high and low SF information involves qualitatively different and hemispherically specialized neural processing operations. q 2001 Elsevier Science Ireland Ltd. All rights reserved. Keywords: Event-related potentials; Visual attention; Spatial frequency; Electrophysiology; Hemispheric asymmetries; Source analysis; Magnetic resonance imaging 1. Introduction An important cue for visual selective attention is the size or spatial scale of a stimulus. For example, attention can be directed to emphasize perception of the parts (‘trees’) or the wholes (‘forest’) of a scene, both of which may occur in common regions of the visual field but at different spatial scales. One way to account for the attentional selection of parts and wholes is in terms of the selective enhancement of different spatial frequencies (SFs). There is abundant evidence suggesting that early in visual processing, retinal images are filtered by parallel SF selective channels (Corns- weet, 1970; De Valois and De Valois, 1990), and that attending selectively to gratings of a particular SF improves their detection and discrimination (Davis and Graham, 1981; Watson and Robson, 1981; Graham et al., 1985). Experiments using hierarchical stimuli comprised of a global figure made up of local elements have also provided evidence that high or low SFs (associated with the local and global levels, respectively) may be attended selectively (Shulman et al., 1986; Robertson, 1999). Accordingly, it has been proposed that the ability to selectively attend to high or low SFs is critical for visual object recognition (Ivry and Robertson, 1998). The visual–cortical mechanisms underlying attention to SF have been studied by recordings of event-related poten- tials (ERPs). In the first such study, Harter and Previc (1978) recorded ERPs while presenting randomized sequences of checkerboards having 6 different check sizes as subjects attended to one check size at a time. Differences in the ERP waveforms elicited by attended vs. unattended stimuli were observed beginning at a latency of 160 ms in the form of an enlarged selection negativity (SN) to stimuli having the attended check size. Similar results were obtained in a series of studies in which gratings of high and low SF were Clinical Neurophysiology 112 (2001) 1980–1998 1388-2457/01/$ - see front matter q 2001 Elsevier Science Ireland Ltd. All rights reserved. PII: S1388-2457(01)00660-5 www.elsevier.com/locate/clinph CLINPH 2000193 * Corresponding author. Tel.: 11-858-534-2385; fax: 11-858-534-5562. E-mail address: [email protected] (S.A. Hillyard).
Transcript of Electrophysiological analysis of cortical mechanisms of selective attention to high and low spatial...

Electrophysiological analysis of cortical mechanisms of selective attentionto high and low spatial frequencies
A. Martı́neza, F. Di Russob,c, L. Anllo-Ventob, S.A. Hillyardb,*
aDepartment of Radiology, University of California, San Diego, La Jolla, CA 92093-8756, USAbDepartment of Neurosciences, University of California, San Diego, La Jolla, CA 92093-0608, USA
cFondazione Clinica Santa Lucia IRCCS, Rome, Italy
Accepted 25 July 2001
Abstract
Objectives: This study investigated whether short-latency (,100 ms) event-related potential (ERP) components were modulated during
attention to spatial frequency (SF) cues.
Methods: Sinusoidally modulated checkerboard stimuli having high (5 cycles per degree (cpd)) or low (0.8 cpd) SF content were
presented in random order at intervals of 400–650 ms. Subjects attended to either the high or low SF stimuli, with the task of detecting
targets of slightly higher or lower SF, respectively, than the above standards. ERPs were recorded from 42 scalp sites during task
performance and spatio-temporal analyses were carried out on sensory-evoked and attention-related components.
Results: Attended high SF stimuli elicited an early negative difference potential (ND120) starting at about 100 ms, whereas attended low SF
stimuli elicited a positivity (PD130) in the same latency range. The neural sources of both effects were estimated with dipole modeling to lie in
dorsal, extrastriate occipital areas. Earlier evoked components evoked at 60–100 ms that were modeled with striate and extrastriate cortical
sources were not affected by attention to SF. Starting at 150 ms, attended stimuli of both SFs elicited a broad selection negativity (SN) that was
localized to ventral extrastriate visual cortex. The SN was larger over the left/right cerebral hemisphere for attended stimuli of high/low SF.
Conclusions: These results support the view that attention to SF does not involve a mechanism of amplitude modulation of early-evoked
components prior to 100 ms. Attention to high and low SF information involves qualitatively different and hemispherically specialized neural
processing operations. q 2001 Elsevier Science Ireland Ltd. All rights reserved.
Keywords: Event-related potentials; Visual attention; Spatial frequency; Electrophysiology; Hemispheric asymmetries; Source analysis; Magnetic resonance
imaging
1. Introduction
An important cue for visual selective attention is the size
or spatial scale of a stimulus. For example, attention can be
directed to emphasize perception of the parts (‘trees’) or the
wholes (‘forest’) of a scene, both of which may occur in
common regions of the visual field but at different spatial
scales. One way to account for the attentional selection of
parts and wholes is in terms of the selective enhancement of
different spatial frequencies (SFs). There is abundant
evidence suggesting that early in visual processing, retinal
images are filtered by parallel SF selective channels (Corns-
weet, 1970; De Valois and De Valois, 1990), and that
attending selectively to gratings of a particular SF improves
their detection and discrimination (Davis and Graham,
1981; Watson and Robson, 1981; Graham et al., 1985).
Experiments using hierarchical stimuli comprised of a
global figure made up of local elements have also provided
evidence that high or low SFs (associated with the local and
global levels, respectively) may be attended selectively
(Shulman et al., 1986; Robertson, 1999). Accordingly, it
has been proposed that the ability to selectively attend to
high or low SFs is critical for visual object recognition (Ivry
and Robertson, 1998).
The visual–cortical mechanisms underlying attention to
SF have been studied by recordings of event-related poten-
tials (ERPs). In the first such study, Harter and Previc (1978)
recorded ERPs while presenting randomized sequences of
checkerboards having 6 different check sizes as subjects
attended to one check size at a time. Differences in the
ERP waveforms elicited by attended vs. unattended stimuli
were observed beginning at a latency of 160 ms in the form
of an enlarged selection negativity (SN) to stimuli having
the attended check size. Similar results were obtained in a
series of studies in which gratings of high and low SF were
Clinical Neurophysiology 112 (2001) 1980–1998
1388-2457/01/$ - see front matter q 2001 Elsevier Science Ireland Ltd. All rights reserved.
PII: S1388-2457(01)00660-5
www.elsevier.com/locate/clinph
CLINPH 2000193
* Corresponding author. Tel.: 11-858-534-2385; fax: 11-858-534-5562.
E-mail address: [email protected] (S.A. Hillyard).

presented in random order, with one of the frequencies
being attended on any given run (Previc and Harter, 1982;
Kenemans et al., 1993; Heslenfeld et al., 1997). Although
ERPs to high and low SFs differed markedly in early-evoked
components in the 60–140 ms range, selective attention did
not reliably modulate these early components.
In the studies reviewed above, the earliest consistent
effects of attention to SF cues were manifest as a broad SN
over occipito-temporal scalp sites that onset in the 160–
220 ms range accompanied by a frontal selection positivity
(SP) beginning at 150–200 ms. Recently, however, Zani and
Proverbio (1995) reported modulations of early, stimulus-
evoked ERPs as a function of attention to SF. In their
study, random sequences of 6 different checkerboards vary-
ing in SF (from 0.5 to 6 cycles per degree (cpd)) were
presented. On different runs, subjects selectively attended
to checkerboards of a single SF and ignored the remaining
5. The ERPs elicited by each checkerboard when it was task-
relevant were compared to the averaged waveforms elicited
by the same stimulus when it was task-irrelevant. Specifi-
cally, attended checkerboards yielded significantly enhanced
amplitudes for a positive component peaking at 90 ms post-
stimulus (termed P1 or P90). This component was largest at
lateral occipital scalp sites and was also present in the unat-
tended waveforms. Attended high SF checkerboards addi-
tionally elicited a significantly larger negativity with a
medial occipital distribution peaking at 115 ms (N115). An
SN with a peak latency of 270 ms was elicited by both high
and low frequency patterns when attended.
The attention effects on these short-latency P90 and N115
components were interpreted by Zani and Proverbio (1995)
as evidence that attention to SF involves an amplitude
modulation of early-evoked cortical ERP components.
They proposed that these attention effects reflected a modu-
lation of sensory information flowing into SF channels and
further that the enhanced N115 component might reflect
attentional selection of SF information in the primary visual
(striate) cortex, whereas the P90 modulation may originate
in extrastriate visual cortex.
The findings of Zani and Proverbio (1995) stand in contrast
with a number of previous studies, which concluded that
early visual ERP components are only modulated during
selective attention to location and not by attention to other
stimulus features such as SF or color (reviewed in Mangun,
1995; Heslenfeld et al., 1997; Wijers et al., 1997; Hillyard
and Anllo-Vento, 1998; Martinez et al., 2001). In these
studies, stimuli at attended locations were found to elicit a
characteristic ERP pattern that included an amplitude
enhancement of the P1 (latency 80–120 ms) and N1 (140–
200 ms) components relative to when the same stimuli were
outside the ‘spotlight’ of spatial attention. Based on these
findings, several authors have proposed that spatial attention
acts by a sensory gain control mechanism reflected in P1/N1
amplitude modulations, which operates at an earlier stage of
visual processing than does attention to non-spatial attributes
(Hillyard and Munte, 1984; Heslenfeld et al., 1997; Wijers et
al., 1997; Hillyard et al., 1998). Source localization studies
have indicated that this enhancement of early P1/N1 activity
during spatial attention takes place in extrastriate visual areas
rather than in the primary visual cortex (Heinze et al., 1994;
Clark and Hillyard, 1996; Gratton, 1997; Mangun et al.,
1997; Woldorff et al., 1997; Martinez et al., 1999).
The findings reported by Zani and Proverbio (1995, 1997)
call into question the proposed uniqueness of spatial atten-
tion in exerting a gain control over sensory-evoked activity
at the earliest levels of the visual pathways. To investigate
this question further, the present experiment carried out
multi-channel recordings and source localization of ERPs
elicited during attention to sinusoidal gratings differing in
SF. The task was designed to produce a state of highly
focused attention to SF by presenting stimuli at a rapid
rate and by requiring subjects to make a difficult discrimina-
tion of targets. The aim was to see whether early-evoked
sensory activity is modulated by attention to SF in a manner
resembling spatial attention effects.
A secondary aim of the present study was to obtain ERP
evidence bearing on the hypothesis of hemispheric speciali-
zation for the processing of SF information (Christman et al.,
1991; Kitterle et al., 1992). Behavioral studies using unilat-
eral hemifield presentations have shown that when attention
is selectively engaged in the right visual field (RVF) high SF
stimuli are discriminated more readily than those of low SF
content, and vice versa when attention is directed to the left
visual field (LVF) (reviewed in Ivry and Robertson, 1998).
Electrophysiological studies of attention to hierarchical letter
stimuli have reported that selection of global targets is asso-
ciated with a negative component (N2) having a greater
amplitude over the right hemisphere (Heinze and Munte,
1993; Heinze et al., 1998); in contrast, the N2 was larger
over the left hemisphere for local-level targets. The present
study aimed to determine whether ERPs elicited during atten-
tion to sinusoidally modulated gratings of high and low SF
are differentially distributed over the left and right hemi-
spheres and to ascertain whether such asymmetries occur at
early or late stages of processing (Ivry and Robertson, 1998).
2. Methods
2.1. Subjects
Twelve subjects (7 females, age range 19–33 years) parti-
cipated as paid volunteers in the experiment. All subjects
were right-handed as assessed by a brief questionnaire and
had normal or corrected-to-normal vision. Each subject
gave informed consent to participate in this experimental
protocol, which was approved by the UCSD committee on
human subject investigations.
2.2. Stimuli and task
Stimuli were sinusoidally modulated black and white
checkerboard patterns, circular in overall form, presented
A. Martı́nez et al. / Clinical Neurophysiology 112 (2001) 1980–1998 1981

on a high-resolution video monitor. At a viewing distance of
70 cm, the checkerboards had a SF of either 0.8 cpd (low
frequency standards) or 5 cpd (high frequency standards).
The checks were aligned with the horizontal and vertical
axes of the screen. Each circular stimulus subtended 6.58
of visual angle from the center to its outer edge. The stimuli
were presented against a gray field of 25 cd/m2 that was
isoluminant with the mean luminance of the checkerboards,
which had a light/dark contrast of 70%. Target stimuli
consisted of infrequent ðP ¼ 0:2Þ checkerboards having a
slightly higher (6 cpd, high frequency targets) or slightly
lower (0.5 cpd, low frequency standards) SF than their
respective standards ðP ¼ 0:8Þ. All checkerboards were
presented at the center of gaze with 100 ms durations and
stimulus onset asynchronies (SOAs) varying randomly
between 400 and 650 ms. Subjects were instructed to main-
tain eye fixation on a central point, which was visible on the
screen at all times.
Subjects were seated in a sound-attenuated, electrically
shielded, and dimly illuminated recording chamber facing
the video monitor. Two attention conditions (attend-high
SF and attend-low SF) were administered in separate runs.
Each run lasted 4 min (with two 20 s breaks interspersed after
1.5 and 3 min). At the start of each run, subjects were
instructed as to which SF was task-relevant (high or low).
The subjects’ task was to respond with a button press to target
checkerboards, which deviated slightly from the attended
standard frequency. Reaction times (RT) and false alarm
rates were monitored and recorded. Each subject performed
5 attend-low and 5 attend-high frequency runs presented in
counterbalanced order. This resulted in a total of 875 presen-
tations of each SF standard when attended and unattended.
The standard and target stimuli were closer together in SF
(0.26 octave apart for the high SF stimuli, 0.68 octave apart
for the low SF) than the bandwidths generally estimated for
peripheral SF channels based on psychophysical procedures
of adaptation and masking, which range from 1 to 2 octaves
(Ginsburg, 1986; Olzak and Thomas, 1986). Moreover, esti-
mates of attentional tuning to SF based on ERP recordings
obtained by Harter and Previc (1978) ranged from 1.9 to
2.7 octaves at 160–200 ms post-stimulus, with progres-
sively sharper tuning at longer latencies. Since the compo-
nents of major interest here occurred well before 160 ms, it
would follow that early attentional tuning to SF should be
broad enough to encompass both standards and targets with
little difference in extent of processing.
2.3. ERP recordings and data analysis
ERPs were recorded from 42 scalp locations including the
principal sites of the 10-20 system (Fz, F3, F4, F7, F8, Cz,
C3, C4, Pz, P3, P4, O1, O2, T3, T4, T5, T6 and the left
mastoid) and 24 additional scalp sites (IPz, INz, IN3, IN4,
IN5, IN6, PO1, PO2, TO1, TO2, CP1, CP2, CT5, CT6, FP1,
FP2, FC1, FC2, FC5, FC6, C1, C2, C5, C6) (see Anllo-
Vento et al., 1998). All scalp channels were referenced to
an electrode placed on the right mastoid. Bipolar recordings
of the horizontal electro-oculogram (EOG) were made from
two electrodes placed on the left and right outer canthi to
record horizontal eye movements. Blinks were recorded
from an electrode below the left eye, also referenced to
the right mastoid. The electroencephalogram (EEG) data
from each recording site was digitized at 250 Hz with an
amplifier bandpass of 0.01–80 Hz.
Due to the short SOAs used in this study, the ERP wave-
forms elicited by successive stimuli overlapped in time,
leading to distortions in the ERP averages. The ADJAR
procedure (Woldorff, 1993) was used to remove the esti-
mated overlap of preceding stimuli from the ERP wave-
forms. The absence of significant ERP activity in the
baseline prior to stimulus presentation is indicative of
successful overlap removal.
ERPs from each electrode site were averaged separately
for standard and target stimuli of each SF under each atten-
tion condition (attend-high SF or attend-low SF). To avoid
hemispheric biases, the ERP waveforms were algebraically
re-referenced to the average of the left and right mastoids
prior to data analyses. Artifact rejection was also performed
prior to averaging in order to eliminate trials contaminated
with eye movements, blinks, excessive muscular activity, or
amplifier blocking. Additionally, ERPs elicited by stimuli
that were preceded by a target stimulus within 1000 ms or
followed by a target stimulus within 200 ms were removed
from the average in order to reduce contamination by large
ERPs related to target detection and/or motor responses. On
an average, 11% of the trials were rejected on one or more of
these grounds.
Mean amplitude measures of ERP components and atten-
tion effects were taken within specified time windows with
respect to the mean baseline voltage over 100 ms preceding
stimulus onset. Attentional difference waves (i.e. waveforms
resulting from the subtraction of ERPs elicited by unattended
stimuli from the waveforms elicited by the same stimuli
when attended) were calculated and analyzed separately for
each SF because the early attention effects were qualitatively
different for high and low SF stimuli. ERPs to standards and
targets of each SF were also analyzed separately. The
presence of SF-related attention effects was examined by
testing the mean amplitude of each difference wave within
successive 40 ms intervals against the mean voltage of the
preceding 100 ms baseline period in a repeated measures
analysis of variance (ANOVA) with factors of attention
and electrode site. To simplify the analyses, ANOVAs
were performed on 12 posterior electrode sites (O1, O2,
TO1, TO2, PO1, PO2, IPz, INz, IN3, IN4, IN5, and IN6)
where the early attention effects were maximal. A separate
analysis was carried out on ERPs from 10 anterior sites (Fp1,
Fp2, F3, F4, F7, F8, Fz, C3, C4 and Cz) to examine the SP.
For tests of lateral asymmetry, hemisphere (right vs. left) and
lateral electrode sites (5 in each hemisphere) were included
as factors in the ANOVA, with the midline sites omitted. All
statistical analyses including more than two electrode loca-
A. Martı́nez et al. / Clinical Neurophysiology 112 (2001) 1980–19981982

tions employed the Greenhouse–Geisser sphericity correc-
tion (Vasey and Thayer, 1987).
In addition, for comparing the scalp distributions of differ-
ent posterior ERP components, the raw amplitudes were
scaled to a common mean value across electrode locations
within each condition prior to ANOVA according to the
method described by McCarthy and Wood (1985). These
comparisons also included hemisphere as factor and were
based on the 5 lateral posterior sites in each hemisphere as
noted above.
Attention effects were tested statistically for both stan-
dard and target ERPs, but major emphasis was given to the
standard ERPs in the spatio-temporal analyses of the early
components. This was done because the more frequent stan-
dard ERPs had a higher signal/noise ratio, resulting in more
reliable comparisons of component scalp distributions and
estimates of source locations (as well as more powerful tests
of attention effects). This emphasis on the standard ERPs
was based on our finding of virtually identical early atten-
tion effects for standard and target stimuli (see Section 3) as
well as on considerations of the bandwidth of SF channels
(discussed above).
2.4. Modeling of ERP sources
A Polhemus Isotrak digitizer was used to record the 3-
dimensional (3D) position of each electrode site and 3 fidu-
cial landmarks (the nasion, and left and right preauricular
points) for each individual subject. The digitized coordi-
nates were used to calculate a best-fit sphere that encom-
passed the locations of all recording electrodes. These
spherical coordinates were used for modeling the dipolar
sources of the major ERP components and attention effects
using the brain electrical source analysis (BESA) algorithm
(Scherg, 1990; Miltner et al., 1994). The general approach
was to fit symmetrical pairs of dipoles that were mirror-
constrained in location but not in orientation over restricted
time intervals corresponding to the components of interest,
as described in Section 3. The dipole models obtained were
little affected by using different symmetry constraints or
different starting locations in the dipole fitting.
To relate the estimated dipole locations to brain anatomy,
high-resolution anatomical magnetic resonance imagings
(MRIs) were obtained for 7 of the subjects in this experiment
using a 1.5 T Siemens Vision MR scanner, equipped with a
quadrature head-coil. Two hundred and twenty coronal slices
(1 mm thick) were acquired using a 3D magnetization
prepared rapid gradient echo sequence (TR ¼ 11.4 ms,
TE ¼ 4.4 ms, flip angle ¼ 108, matrix ¼ 256 £ 256). This
protocol covered the entire brain and provided equal resolu-
tion in all 3 planes. The acquired coronal images were used to
compute a 3D volume package that was transformed into the
standard coordinate system of Talairach and Tournoux
(1988) using the AFNI software package (Cox, 1996). For
each subject, the cranial fiducial landmarks (nasion, left and
right preauricular points) were identified on their respective
MRIs, which enabled co-registration of the BESA sphere
with the MRI images. The locations of each dipole in the
group-average BESA models were projected on each
subject’s MRI scan, converted into Talairach coordinates
and averaged across all subjects (see Anllo-Vento et al.,
1998 for details of this co-registration procedure). In this
way, the average anatomical position of each dipole could
be estimated, subject to the well-known limitations of the
inverse dipole modeling (Scherg, 1990; Miltner et al., 1994).
3. Results
3.1. Behavioral performance
Responses to target stimuli of the attended SF made
between 200 and 1200 ms following stimulus onset were
considered ‘hits’. On an average, subjects correctly detected
85% of the high SF targets and 84% of the low SF targets.
The mean RTs for detection of high and low SF targets were
533 and 545 ms, respectively. False alarms were calculated
as the percentage of standard stimuli (of either the attended
or unattended SF) that were followed by a response. The
mean false alarm rate during the attend-high SF condition
was 5% and during the attend-low SF runs was 3%. Neither
hit rates, RTs nor false alarm rates differed significantly for
high vs. low SFs.
3.2. Event-related potentials
As seen in the grand-averaged ERP waveforms (Fig. 1,
top), the earliest component evoked by high SF stimuli was
a posterior midline negativity onsetting at 50–60 ms and
peaking at 90–100 ms. This component was termed C1
following Jeffreys and Axford (1972). A positive compo-
nent onsetting at approximately 70 ms (P1) was elicited
over lateral occipito-temporal recording sites. Neither C1
nor P1 amplitude was affected by attention (measured in
the window 60–100 ms) for either the standard or target
stimuli, as is evident in the attentional difference waves
(attended minus unattended ERPs) to high SF stimuli
shown in Fig. 2. Neither the C1 nor the P1 showed signifi-
cant hemispheric asymmetry.
The significance levels of the attention effects in the stan-
dard and target difference waves over the 12 posterior sites
are given in Table 1. Also shown in Table 1 are the signifi-
cance levels for the attention £ electrode site interaction,
indicating the extent to which the attention effects differed
among the scalp sites. Table 2 provides attended and unat-
tended ERP amplitudes at medial and lateral occipital sites
and averaged over all posterior sites for the key early time
windows.
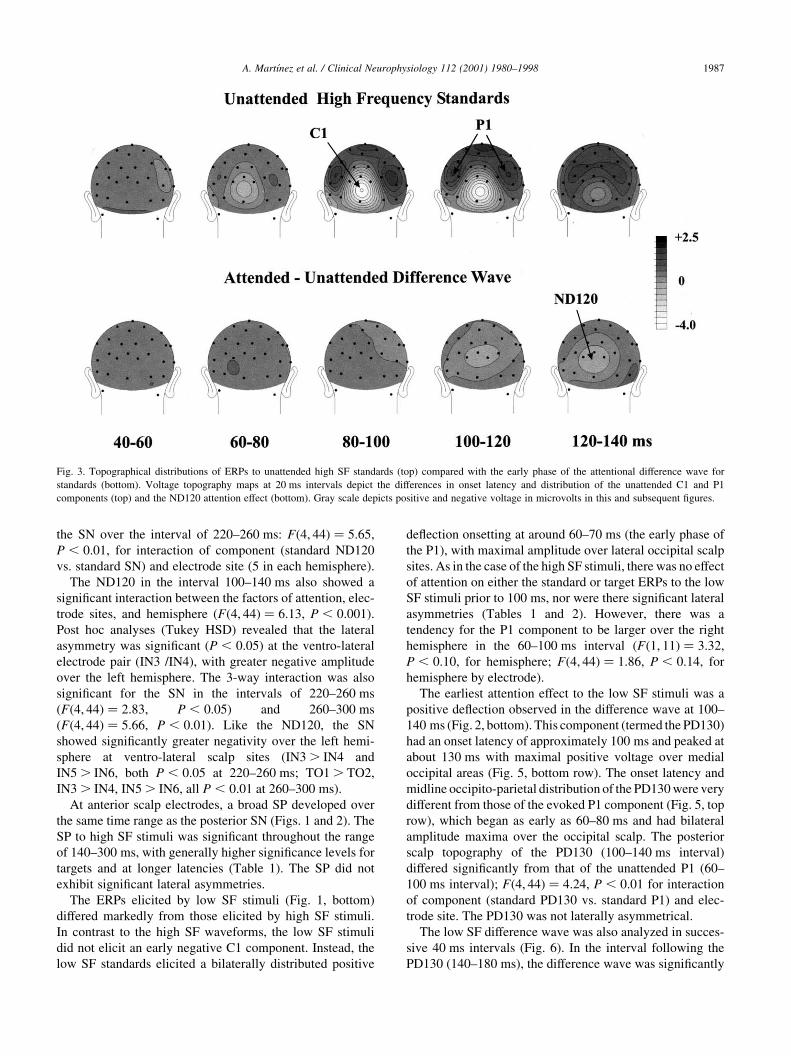
The first significant effect of attention to high SF stimuli
was an increased negativity over the latency range of 100–
140 ms in both standard and target ERPs. This early attention
effect (labeled ND120) peaked at about 120 ms and was
maximally negative over medial occipital scalp sites. The
A. Martı́nez et al. / Clinical Neurophysiology 112 (2001) 1980–1998 1983

onset latency and scalp distribution of the ND120 differed
from those of the C1 component. Fig. 3 compares the sequen-
tial scalp topographies of the ERP elicited by unattended high
SF standard stimuli (top row) with those of the high SF stan-
dard attentional difference wave (bottom row). The unat-
tended C1 component had its onset in the latency range 60–
80 ms and peaked in amplitude between 80 and 100 ms over
ventro-medial occipital sites. The ND120, on the other hand,
A. Martı́nez et al. / Clinical Neurophysiology 112 (2001) 1980–19981984
Fig. 1. ERPs elicited by high and low SF standards. Grand-averaged ERPs to high SF (top) and low SF standard stimuli (bottom) are shown for 8 posterior
electrode sites. Black tracings depict ERPs to attended stimuli and gray tracings show the ERPs elicited by the same stimuli when unattended.

did not appear until 100–120 ms and was distributed more
broadly and dorsally over the occipital scalp. The scalp topo-
graphies of these two components differed significantly over
the posterior electrode array; this was tested by comparing
the distribution of the C1 in the interval of 60–100 ms with
that of the ND120 in the interval of 100–140 ms:
Fð4; 44Þ ¼ 3:98, P , 0:01, for interaction of component
(standard ND120 vs. standard C1) £ electrode site (5 in
A. Martı́nez et al. / Clinical Neurophysiology 112 (2001) 1980–1998 1985
Fig. 2. Attentional difference waves. The grand-averaged difference waves for high (top) and low (bottom) SF standards (black line) and targets (gray line)
were formed by subtracting the ERPs elicited by standard or target stimuli when they were unattended from those elicited by the same stimuli when they were
attended.

each hemisphere). This interaction was also significant
during the interval 80–120 ms ðFð4; 44Þ ¼ 3:45, P , 0:05),
which encompassed the peaks of both components.
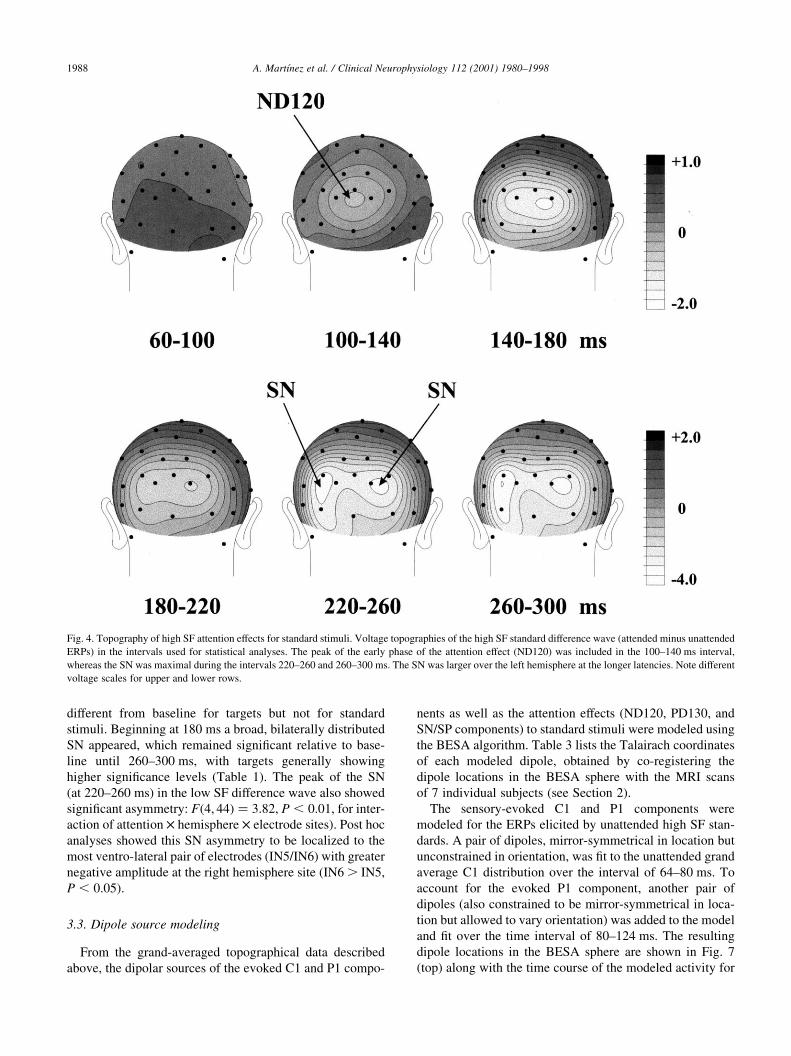
The most prominent ERP effect produced during atten-
tion to high SF was a broad SN that was bilaterally distrib-
uted over ventro-lateral scalp sites beginning at
approximately 140 ms and persisting for 200 ms or more
(Fig. 2). The SN amplitude was significant in the high SF
difference waves for all intervals between 140 and 300 ms
(see Table 1), with the targets generally producing more
significant effects than standards at posterior sites. The
scalp distribution of the high frequency standard SN showed
bilateral occipital maxima and differed markedly from the
mid-occipital distribution of the shorter-latency ND120
attention effect (Fig. 4). The posterior scalp distribution of
the ND120 at 100–140 ms differed significantly from that of
A. Martı́nez et al. / Clinical Neurophysiology 112 (2001) 1980–19981986
Table 2
Mean amplitude values for attended and unattended ERPs in early time windows at medial (O1, O2) and lateral (TO1, TO2) scalp sites and overall posterior
sites
High SF Low SF
O1 O2 TO1 TO2 All posterior sites O1 O2 TO1 TO2 All posterior sites
Standards 60–100 ms Attended 21.46 21.78 0.32 0.23 20.68 1.89 1.91 2.10 2.18 1.44
SE 0.20 0.31 0.14 0.10 0.15 0.32 0.33 0.33 0.37 0.24
Unattended 21.66 21.90 0.39 0.28 20.79 1.91 1.86 2.09 2.06 1.40
SE 0.17 0.27 0.17 0.17 0.15 0.32 0.34 0.34 0.36 0.24
100–140 ms Attended 21.33 22.35 0.59 0.38 20.87 2.02 1.67 3.21 2.98 1.99
SE 0.34 0.46 0.09 0.20 0.26 0.24 0.15 0.29 0.19 0.17
Unattended 20.82 21.81 0.96 0.48 20.30 1.82 1.45 2.79 2.57 1.67
SE 0.37 0.48 0.17 0.14 0.26 0.15 0.18 0.28 0.20 0.16
Targets 60–100 ms Attended 21.49 21.81 0.40 0.31 20.72 1.87 1.95 2.29 2.22 1.62
SE 0.18 0.17 0.18 0.21 0.22 0.18 0.16 0.39 0.29 0.22
Unattended 21.70 21.77 0.58 0.34 20.86 1.95 1.82 2.11 2.13 1.56
SE 0.11 0.18 0.19 0.10 0.18 0.28 0.26 0.17 0.22 0.22
100–140 ms Attended 21.49 22.51 0.64 0.35 20.98 2.25 1.86 3.64 3.17 2.31
SE 0.27 0.33 0.15 0.12 0.24 0.27 0.13 0.35 0.22 0.12
Unattended 20.81 21.79 1.05 0.58 20.32 1.94 1.51 3.01 2.48 1.69
SE 0.27 0.19 0.19 0.18 0.15 0.17 0.15 0.27 0.28 0.15
SE, standard error.
Table 1
Significance levels (P values) of the attention effects and attention £ electrode site interactions (in parenthesis) for ERPs to standard and target stimuli at
successive latency intervals
Time interval d.f. 60–100 ms 100–140 ms 140–180 ms 180–220 ms 220–260 ms 260–300 ms
Posterior electrodes
High SF Standards 1,11 N.S. , 0.05 , 0.05 , 0.01 , 0.01 , 0.01
11,121 (N.S.) (,0.005) (,0.001) (,0.001) (,0.001) (,0.001)
Targets 1,11 N.S. , 0.05 , 0.01 , 0.005 , 0.001 , 0.005
11,121 (N.S.) (,0.01) (N.S.) (N.S.) (N.S.) (N.S.)
Low SF Standards 1,11 N.S. , 0.05 N.S. , 0.05 , 0.05 , 0.01
11,121 (N.S.) (,0.05) (N.S.) (,0.05) (N.S.) (,0.05)
Targets 1,11 N.S. , 0.05 , 0.05 , 0.05 , 0.01 , 0.005
11,121 (N.S.) (,0.05) (,0.005) (N.S.) (N.S.) (N.S.)
Anterior electrodes
High SF Standards 1,11 N.S. N.S. , 0.05 , 0.05 , 0.05 , 0.05
9,99 (N.S.) (N.S.) (N.S.) (N.S.) (N.S.) (N.S.)
Targets 1,11 N.S. N.S. , 0.05 , 0.05 , 0.005 , 0.01
9,99 (N.S.) (N.S.) (N.S.) (N.S.) (N.S.) (N.S.)
Low SF Standards 1,11 N.S. N.S. N.S. , 0.05 , 0.01 , 0.05
9,99 (N.S.) (N.S.) (N.S.) (N.S.) (N.S.) (N.S.)
Targets 1,11 N.S. N.S. , 0.05 , 0.05 , 0.001 , 0.001
9,99 (N.S.) (N.S.) (,0.05) (N.S.) (N.S.) (N.S.)
the SN over the interval of 220–260 ms: Fð4; 44Þ ¼ 5:65,
P , 0:01, for interaction of component (standard ND120
vs. standard SN) and electrode site (5 in each hemisphere).
The ND120 in the interval 100–140 ms also showed a
significant interaction between the factors of attention, elec-
trode sites, and hemisphere (Fð4; 44Þ ¼ 6:13, P , 0:001).
Post hoc analyses (Tukey HSD) revealed that the lateral
asymmetry was significant ðP , 0:05Þ at the ventro-lateral
electrode pair (IN3 /IN4), with greater negative amplitude
over the left hemisphere. The 3-way interaction was also
significant for the SN in the intervals of 220–260 ms
ðFð4; 44Þ ¼ 2:83, P , 0:05) and 260–300 ms
(Fð4; 44Þ ¼ 5:66, P , 0:01). Like the ND120, the SN
showed significantly greater negativity over the left hemi-
sphere at ventro-lateral scalp sites (IN3 . IN4 and
IN5 . IN6, both P , 0:05 at 220–260 ms; TO1 . TO2,
IN3 . IN4, IN5 . IN6, all P , 0:01 at 260–300 ms).
At anterior scalp electrodes, a broad SP developed over
the same time range as the posterior SN (Figs. 1 and 2). The
SP to high SF stimuli was significant throughout the range
of 140–300 ms, with generally higher significance levels for
targets and at longer latencies (Table 1). The SP did not
exhibit significant lateral asymmetries.
The ERPs elicited by low SF stimuli (Fig. 1, bottom)
differed markedly from those elicited by high SF stimuli.
In contrast to the high SF waveforms, the low SF stimuli
did not elicit an early negative C1 component. Instead, the
low SF standards elicited a bilaterally distributed positive
deflection onsetting at around 60–70 ms (the early phase of
the P1), with maximal amplitude over lateral occipital scalp
sites. As in the case of the high SF stimuli, there was no effect
of attention on either the standard or target ERPs to the low
SF stimuli prior to 100 ms, nor were there significant lateral
asymmetries (Tables 1 and 2). However, there was a
tendency for the P1 component to be larger over the right
hemisphere in the 60–100 ms interval (Fð1; 11Þ ¼ 3:32,
P , 0:10, for hemisphere; Fð4; 44Þ ¼ 1:86, P , 0:14, for
hemisphere by electrode).
The earliest attention effect to the low SF stimuli was a
positive deflection observed in the difference wave at 100–
140 ms (Fig. 2, bottom). This component (termed the PD130)
had an onset latency of approximately 100 ms and peaked at
about 130 ms with maximal positive voltage over medial
occipital areas (Fig. 5, bottom row). The onset latency and
midline occipito-parietal distribution of the PD130 were very
different from those of the evoked P1 component (Fig. 5, top
row), which began as early as 60–80 ms and had bilateral
amplitude maxima over the occipital scalp. The posterior
scalp topography of the PD130 (100–140 ms interval)
differed significantly from that of the unattended P1 (60–
100 ms interval); Fð4; 44Þ ¼ 4:24, P , 0:01 for interaction
of component (standard PD130 vs. standard P1) and elec-
trode site. The PD130 was not laterally asymmetrical.
The low SF difference wave was also analyzed in succes-
sive 40 ms intervals (Fig. 6). In the interval following the
PD130 (140–180 ms), the difference wave was significantly
A. Martı́nez et al. / Clinical Neurophysiology 112 (2001) 1980–1998 1987
Fig. 3. Topographical distributions of ERPs to unattended high SF standards (top) compared with the early phase of the attentional difference wave for
standards (bottom). Voltage topography maps at 20 ms intervals depict the differences in onset latency and distribution of the unattended C1 and P1
components (top) and the ND120 attention effect (bottom). Gray scale depicts positive and negative voltage in microvolts in this and subsequent figures.
different from baseline for targets but not for standard
stimuli. Beginning at 180 ms a broad, bilaterally distributed
SN appeared, which remained significant relative to base-
line until 260–300 ms, with targets generally showing
higher significance levels (Table 1). The peak of the SN
(at 220–260 ms) in the low SF difference wave also showed
significant asymmetry: Fð4; 44Þ ¼ 3:82, P , 0:01, for inter-
action of attention £ hemisphere £ electrode sites). Post hoc
analyses showed this SN asymmetry to be localized to the
most ventro-lateral pair of electrodes (IN5/IN6) with greater
negative amplitude at the right hemisphere site (IN6 . IN5,
P , 0:05).
3.3. Dipole source modeling
From the grand-averaged topographical data described
above, the dipolar sources of the evoked C1 and P1 compo-
nents as well as the attention effects (ND120, PD130, and
SN/SP components) to standard stimuli were modeled using
the BESA algorithm. Table 3 lists the Talairach coordinates
of each modeled dipole, obtained by co-registering the
dipole locations in the BESA sphere with the MRI scans
of 7 individual subjects (see Section 2).
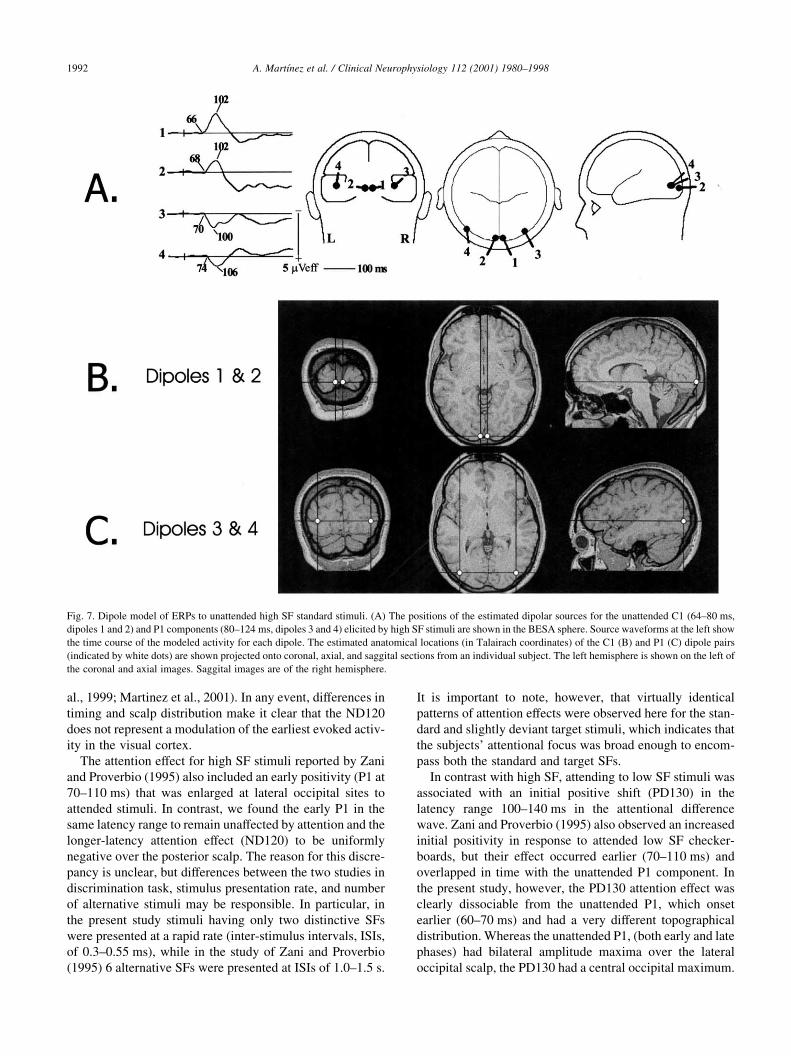
The sensory-evoked C1 and P1 components were
modeled for the ERPs elicited by unattended high SF stan-
dards. A pair of dipoles, mirror-symmetrical in location but
unconstrained in orientation, was fit to the unattended grand
average C1 distribution over the interval of 64–80 ms. To
account for the evoked P1 component, another pair of
dipoles (also constrained to be mirror-symmetrical in loca-
tion but allowed to vary orientation) was added to the model
and fit over the time interval of 80–124 ms. The resulting
dipole locations in the BESA sphere are shown in Fig. 7
(top) along with the time course of the modeled activity for
A. Martı́nez et al. / Clinical Neurophysiology 112 (2001) 1980–19981988
Fig. 4. Topography of high SF attention effects for standard stimuli. Voltage topographies of the high SF standard difference wave (attended minus unattended
ERPs) in the intervals used for statistical analyses. The peak of the early phase of the attention effect (ND120) was included in the 100–140 ms interval,
whereas the SN was maximal during the intervals 220–260 and 260–300 ms. The SN was larger over the left hemisphere at the longer latencies. Note different
voltage scales for upper and lower rows.

each dipole. Fig. 7 (bottom) shows the locations of the
modeled dipoles projected onto the corresponding brain
sections of a single subject. This projection is intended to
give only an approximation of the anatomical region of
component origin. The dipoles corresponding to C1 (1 and
2) were situated in medial occipital cortex in or near the
calcarine fissure, whereas the dipoles accounting for P1 (3
and 4) were localized to lateral extrastriate cortex in or near
the middle occipital gyrus. Together, these paired C1 and P1
dipoles accounted for 96.3% of the variance in the scalp
distribution of the unattended high frequency ERPs over
the latency range of 64–124 ms.
The attentional difference wave for the high SF standard
stimuli was fit sequentially with paired dipoles over the
intervals of 102–120 ms (to account for the ND120) and
186–274 ms (to account for the SN). A pair of location-
symmetrical dipoles situated in medial dorsal occipital
cortex, lateral to the calcarine fissure, accounted for the
ND120 attention effect, whereas the SN dipole pair was
localized in ventral occipital cortex within the fusiform
gyrus (Fig. 8). This BESA model accounted for 98.5% of
the variance in the 102–274 ms latency range. Interestingly,
the source waveform for the dipole accounting for the
ND120 extended well beyond the 102–120 ms interval for
which it was fit, suggesting that the early attention-related
activity was sustained and overlapped with the SN.
The ERPs elicited by unattended low SF standards were
also modeled sequentially with two pairs of dipoles symme-
trically constrained in location. The first pair, fit in the
latency range of 54–80 ms, accounted for the early phase
of the evoked P1 component and was localized in dorso-
medial occipital cortex. The late phase of the evoked P1 was
modeled over the interval 72–128 ms and was localized to
more lateral portions of dorsal extrastriate cortex (Fig. 9).
Together, these two dipole pairs accounted for 97.4% of the
total variance in the data across the interval 54–128 ms.
The low SF standard attentional difference wave was
modeled in two successive latency ranges, 106–142 and
142–278 ms in order to account for the PD130 and the
longer-latency SN, respectively. Both attention effects
were fit with pairs of dipoles constrained to be mirror-
symmetrical in location. The PD130 dipoles were situated
in dorsal occipital cortex, whereas the SN dipole pair was
localized to ventral occipital cortex within the fusiform
gyrus (Fig. 10). This dipole model for the low SF attention
effects accounted for 96.4% of the total variance in the
latency interval of 106–278 ms.
4. Discussion
The present experiment investigated the spatio-temporal
A. Martı́nez et al. / Clinical Neurophysiology 112 (2001) 1980–1998 1989
Fig. 5. Topographical distributions of ERPs to unattended low SF standards (top) compared with the early phase of the attentional difference wave for standards
(bottom). Voltage topography maps at 20 ms intervals show the differences in onset latency and distribution of the unattended P1 component (top) and the
PD130 attention effect (bottom).

characteristics of the brain processes underlying selective
attention to SF. The major focus was on finding out whether
attention to SF produces a modulation of sensory-evoked
neural activity beginning at the earliest stages of visual
processing, as has been reported previously for attention to
location. This issue was investigated by recording ERPs in a
paradigm that required highly focused attention on the SF
content of attended stimuli in order to discriminate infre-
quent targets. The behavioral results obtained in this experi-
ment indicate that subjects were able to effectively focus
attention on a given SF and accurately detect targets. A
detailed spatio-temporal analysis of the ERP attention
effects, however, did not support the hypothesis that the
earliest sensory-evoked components were modulated by
attention. Rather, the ERP attention effects occurred at longer
latencies and arose from different neural generators than the
early sensory-evoked responses. In addition, lateral asymme-
tries were observed in the ERPs associated with attention to
high and low SF stimuli that were indicative of hemispheric
specialization for the processing of SF information.
4.1. Short-latency evoked components
The high and low SF stimuli evoked distinctly different
early sensory components as seen both in the attended and
unattended waveforms. The high SF standards evoked a
short-latency (onset at 50–60 ms, peak at 90–100 ms) nega-
tive component, here termed the C1, which had a narrowly
focused midline occipital scalp distribution. A similarly
distributed early negativity peaking at around 115 ms (the
N115) was observed by Zani and Proverbio (1995) in
response to high SF checkerboards. Inverse dipole modeling
of the neural generators of the C1 was in accord with recent
evidence (Clark et al., 1995; Clark and Hillyard, 1996;
Bruin et al., 1998; Lange et al., 1998; Martinez et al.,
1999; Kenemans et al., 2000) that this early negativity
(sometimes called the NP80) originates from sources in
primary visual (striate) cortex and probably represents the
initial volley of sensory information into the primary visual
cortex. The ERP to the high SF stimuli also included an
early positive (P1) component in the latency range 70–
A. Martı́nez et al. / Clinical Neurophysiology 112 (2001) 1980–19981990
Fig. 6. Topography of low SF attention effect for standard stimuli. The voltage topography of the attentional difference wave formed by subtracting unattended
low SF standards from attended low SF standards is shown for the same 40 ms intervals used for statistical analyses. The PD130 was maximal in the 100–
140 ms latency range, whereas the SN peaked at 220–260 ms. The SN at longer latencies showed greater negative amplitude over the right hemisphere at
ventral–lateral scalp sites.
130 ms that was more laterally distributed over the occipital
scalp and had dipolar sources estimated to lie in lateral
extrastriate occipital cortex.
In contrast with the ERPs to the high SF stimuli, no
midline C1 component was evoked by the low SF stimuli.
Instead, low frequency stimuli evoked only a prominent P1
component during the interval 60–150 ms, which had bilat-
eral amplitude maxima over the lateral occipital scalp. This
P1 included early and late phases (peaking at roughly 80 and
120 ms, respectively) that could be modeled accurately by
pairs of dipolar generators localized to medial and lateral
occipital extrastriate visual cortex, respectively.
Many previous studies have demonstrated waveform
differences between early ERP components evoked by high
and low SF stimuli similar to those observed here (reviewed
in Kenemans et al., 2000). The general finding has been that
higher SF stimuli (both checkerboards and linear gratings)
elicit a larger early negativity (C1) over midline occipital
areas in the interval 50–110 ms. On the basis of a dipole
modeling analysis, Kenemans et al. (2000) concluded that
this early negativity to higher SF stimuli had a likely origin in
striate cortex, while the bilaterally distributed positivity (P1)
to low SF stimuli arose from more lateral extrastriate sources;
this accords well with the present analysis. These ERP differ-
ences as a function of SF may be related to the mapping of SF
in the visual cortex. In an fMRI study, Tootell et al. (1998)
found that the foveal representations in the retinotopic visual
areas were selectively activated by high SFs, whereas the
cortical representations of the peripheral retina responded
preferentially to low SFs. Since the foveal projection in stri-
ate cortex is at the occipital pole, it might be expected that
midline-recording sites over the pole would pick up a large
early response to high SF stimuli. Given the close spatial and
temporal proximity of early striate and extrastriate activa-
tions, however, it is possible that the earliest ERP compo-
nents represent an amalgam of these sources, which would
vary in location according to the mapping of SF onto the
different visual–cortical areas.
4.2. Short-latency attention effects
The earliest effect of attention on the ERP to high SF was
an increased negativity over midline occipital sites in the
latency range 100–140 ms (ND120). Zani and Proverbio
(1995) observed a similar effect, which they interpreted as
a modulation of early sensory-evoked neural activity,
perhaps in primary visual cortex. The evidence reported
here, however, shows a clear temporal dissociation between
the ND120 attention effect and the earliest evoked compo-
nent (C1) that has been ascribed to primary visual cortex
generators. Whereas the C1 had an onset latency of 60 ms
following stimulus presentation, the ND120 seen in the
attentional difference wave did not begin until around
100 ms. This latency difference indicates that the earliest
effect of attention to high SF (i.e., the ND120) does not
represent a modulation of the initial sensory-evoked neural
response in striate cortex. The lack of attentional modula-
tion of the C1 component found here is consistent with
previous studies showing no attention effects on C1
(NP80) in spatial attention tasks (Clark and Hillyard,
1996; Wijers et al., 1997; Bruin et al., 1998; Martinez et
al., 1999).
The scalp topography of the ND120 attention effect was
similar to that of the earlier C1 component but differed
significantly from it in being distributed more broadly and
superiorly over midline occipital areas. The resulting dipole
model accounting for the ND120 placed the sources in
dorsal extrastriate cortex superiorly and lateral to the calcar-
ine fissure, whereas the dipoles fit to the C1 distribution
were situated more medially, within or adjacent to the
calcarine fissure. Considering the inherent uncertainties of
inverse dipole modeling, however, the possibility cannot be
ruled out that the C1 and ND120 arise in part from common
neural generators, perhaps in both striate and extrastriate
areas. If this were the case, the ND120 would evidently
reflect delayed activity in those early visual areas, perhaps
resulting from feedback from higher areas (see Martinez et
A. Martı́nez et al. / Clinical Neurophysiology 112 (2001) 1980–1998 1991
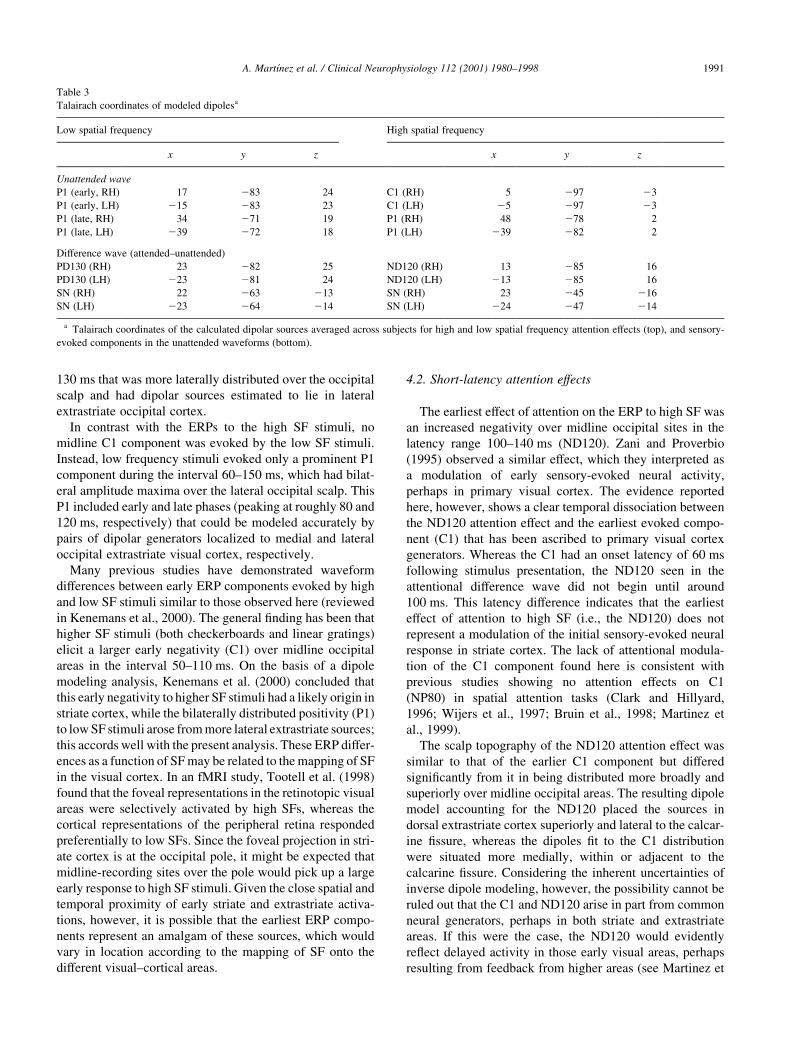
Table 3
Talairach coordinates of modeled dipolesa
Low spatial frequency High spatial frequency
x y z x y z
Unattended wave
P1 (early, RH) 17 283 24 C1 (RH) 5 297 23
P1 (early, LH) 215 283 23 C1 (LH) 25 297 23
P1 (late, RH) 34 271 19 P1 (RH) 48 278 2
P1 (late, LH) 239 272 18 P1 (LH) 239 282 2
Difference wave (attended–unattended)
PD130 (RH) 23 282 25 ND120 (RH) 13 285 16
PD130 (LH) 223 281 24 ND120 (LH) 213 285 16
SN (RH) 22 263 213 SN (RH) 23 245 216
SN (LH) 223 264 214 SN (LH) 224 247 214
a Talairach coordinates of the calculated dipolar sources averaged across subjects for high and low spatial frequency attention effects (top), and sensory-
evoked components in the unattended waveforms (bottom).
al., 1999; Martinez et al., 2001). In any event, differences in
timing and scalp distribution make it clear that the ND120
does not represent a modulation of the earliest evoked activ-
ity in the visual cortex.
The attention effect for high SF stimuli reported by Zani
and Proverbio (1995) also included an early positivity (P1 at
70–110 ms) that was enlarged at lateral occipital sites to
attended stimuli. In contrast, we found the early P1 in the
same latency range to remain unaffected by attention and the
longer-latency attention effect (ND120) to be uniformly
negative over the posterior scalp. The reason for this discre-
pancy is unclear, but differences between the two studies in
discrimination task, stimulus presentation rate, and number
of alternative stimuli may be responsible. In particular, in
the present study stimuli having only two distinctive SFs
were presented at a rapid rate (inter-stimulus intervals, ISIs,
of 0.3–0.55 ms), while in the study of Zani and Proverbio
(1995) 6 alternative SFs were presented at ISIs of 1.0–1.5 s.
It is important to note, however, that virtually identical
patterns of attention effects were observed here for the stan-
dard and slightly deviant target stimuli, which indicates that
the subjects’ attentional focus was broad enough to encom-
pass both the standard and target SFs.
In contrast with high SF, attending to low SF stimuli was
associated with an initial positive shift (PD130) in the
latency range 100–140 ms in the attentional difference
wave. Zani and Proverbio (1995) also observed an increased
initial positivity in response to attended low SF checker-
boards, but their effect occurred earlier (70–110 ms) and
overlapped in time with the unattended P1 component. In
the present study, however, the PD130 attention effect was
clearly dissociable from the unattended P1, which onset
earlier (60–70 ms) and had a very different topographical
distribution. Whereas the unattended P1, (both early and late
phases) had bilateral amplitude maxima over the lateral
occipital scalp, the PD130 had a central occipital maximum.
A. Martı́nez et al. / Clinical Neurophysiology 112 (2001) 1980–19981992
Fig. 7. Dipole model of ERPs to unattended high SF standard stimuli. (A) The positions of the estimated dipolar sources for the unattended C1 (64–80 ms,
dipoles 1 and 2) and P1 components (80–124 ms, dipoles 3 and 4) elicited by high SF stimuli are shown in the BESA sphere. Source waveforms at the left show
the time course of the modeled activity for each dipole. The estimated anatomical locations (in Talairach coordinates) of the C1 (B) and P1 (C) dipole pairs
(indicated by white dots) are shown projected onto coronal, axial, and saggital sections from an individual subject. The left hemisphere is shown on the left of
the coronal and axial images. Saggital images are of the right hemisphere.

These differences in timing and topography are not consis-
tent with the hypothesis that attention to SF involves an
amplitude enhancement of the early sensory-evoked P1
under the conditions of the present study.
The PD130 attention effect observed here was not only
delayed in relation to the P1 attention effect reported by
Zani and Proverbio (1995), but its midline scalp topography
contrasted with the lateral occipital maxima of their P1
effect. Kenemans et al. (1993) also reported a small but
significantly enlarged early positivity (70–110 ms) to
attended SF stimuli in a design where subjects attended
jointly to SF and orientation; this enlarged positivity,
however, was recorded at medial occipital sites, at which
Zani and Proverbio had found reduced early positivity. This
picture is further complicated by reports of Heslenfeld et al.
(1997) and Kenemans et al. (in press), who used designs
very similar to that of Kenemans et al. (1993) and failed
to replicate such an early positive modulation. Clearly,
further work is needed to define the conditions under
which early positivity in the P1 range may be enhanced
by attention to SF and to establish its reliability.
4.3. Mechanisms of early attention effect
The present ERP data strongly suggest that paying atten-
tion to high and low SFs is mediated by distinctive brain
mechanisms indexed by the ND120 and PD130, respec-
tively. It is not clear, however, whether these components
reflect qualitatively different selection operations, or
whether they differ in polarity because of the cortical
geometry associated with the mapping of high and low
SFs onto the visual areas. It is also difficult to determine
whether these distinctive ERP patterns represent endogen-
ous cortical activity related to attention or an amplitude
modulation of longer-latency exogenous (evoked) compo-
nents in the 100–150 ms range. Although exogenous
components having a similar time course and scalp distribu-
tion to the ND120 and PD130 attention effects were not
A. Martı́nez et al. / Clinical Neurophysiology 112 (2001) 1980–1998 1993
Fig. 8. Dipole model of standard high SF attention effects. (A) The early and late phases of the attentional difference wave for high SF standard stimuli were
modeled in the latency ranges of 102–120 and 186–274 ms, respectively. The source waveforms of the ND120 (dipoles 1 and 2) and the SN (dipoles 3 and 4)
are shown on the left. The estimated locations of these dipoles are projected onto anatomical images of an individual subject in (B, C), respectively, with
registration procedures and image orientations as in Fig. 7.

evident in the unattended waveforms, the presence of such
components at low amplitude cannot be ruled out. If these
attention effects do represent a modulation of SF-specific
evoked neural activity, however, it should be emphasized
that this was not evident for the earliest frequency-specific
components in the 60–100 ms range. Rather, the initial
selection for SF was manifested in neural activity beginning
at about 100 ms after stimulus onset with estimated sources
in dorsal extrastriate visual cortex.
An alternative mechanism to consider is that spatial atten-
tion makes a contribution to the ND120/PD130 effects
observed here. This possibility derives from the close simi-
larity of the scalp distributions of the ND120 and PD130
attention effects, which suggests that they could arise at
least in part from a common source of neural activity.
Indeed, the scalp topographies of the ND120 and PD130
did not differ significantly (after conversion to a common
polarity), as evidenced by a non-significant component £
electrode site interaction in the 100–140 ms interval;
Fð4; 44Þ , 1. According to one scenario, a component that
is elicited in the 100–140 ms range by both high and low SF
stimuli might be increased in positive amplitude during the
attend-low SF condition and reduced in positive amplitude
during attention to high SF. Such an effect could occur, as
was recently proposed by Heinze et al. (1998), if attention to
low SF stimuli entailed an expansion of the diameter of the
‘spotlight’ of spatial attention, thereby facilitating visual
input over a broader area and increasing the relative ampli-
tude of the positive-going component in that condition.
Again, however, it should be cautioned that no such compo-
nent with a midline distribution was evident at 100–140 ms
in the unattended waveforms.
Another possible mechanism to consider is that subjects
might attend to some small portion of the display that distin-
guished the high and low SF stimuli rather than to the over-
all SF cue. This is conceivable because each of the 4 types of
stimuli (high and low SF, standards and targets) was iden-
tical on every presentation, such that some small region of
A. Martı́nez et al. / Clinical Neurophysiology 112 (2001) 1980–19981994
Fig. 9. BESA model of ERPs to unattended low SF standard stimuli. (A) The early and late phases of the P1 component elicited by unattended low SF standards
were modeled in the latency intervals of 54–80 and 72–128 ms, respectively. The symmetrical dipole pairs (dipoles 1 and 2, early phase; dipoles 3 and 4, late
phase) are projected onto anatomical images of an individual subject in (B, C), respectively. Co-registration procedures and image orientations are as in Fig. 7.

the display might have a light/dark pattern that differen-
tiated among the attended and unattended stimuli. Such a
possibility also exists in previous studies of attention to SF
where the check phase was also kept constant from one
presentation to the next of each stimulus. In the present
study, however, the finding that the attention-related ERP
modulations were nearly identical for the standards and
targets at each SF greatly reduces the possibility that a
small patch of the display was used as the basis for selecting
high from low SF stimuli. Since the standards and targets
differed slightly in SF, the phase difference between them
shifted continuously across the display, and subjects would
be hard-pressed to locate a small zone of the display that
would easily differentiate both the standards and targets of
one SF from both the standards and targets of the other SF.
Thus, the ERP results indicate that the subjects did indeed
use the SF cues to distinguish between relevant and irrele-
vant stimuli.
A variant on the above mechanism might come into play
if subjects attempted to perform the task by directing atten-
tion to one side of the display rather than by maintaining
attention centered on the stimulus. This also would seem to
be an unlikely strategy, primarily because the reduction in
visual acuity at increased eccentricities would impair
performance. Moreover, if attention were directed laterally,
this would be revealed in a particular ERP signature – an
enlarged P1 component over the hemisphere contralateral to
the attended visual field (Heinze et al. 1990, 1994). The
expected result would be that this contralateral P1 would
be elicited by stimuli of both SFs that were presented during
runs when attention was so lateralized. If attention was
differentially lateralized during the attend-high and attend-
low SF conditions, then P1 asymmetries of opposite polarity
would be seen in the attentional difference waves for the
high and low SF stimuli. Since no such pattern was discern-
able in the data, we suggest that lateralized spatial attention
A. Martı́nez et al. / Clinical Neurophysiology 112 (2001) 1980–1998 1995
Fig. 10. BESA model of standard low SF attention effects. (A) The PD130 attention effect for low SF standard stimuli was modeled in the interval 106–142 ms
(dipoles 1 and 2), and the longer-latency SN associated with attention to low SFs was fit in the interval 142–278 ms. These dipole positions are projected onto
anatomical images of an individual subject in (B, C), respectively, with registration procedures and image orientations as in Fig. 7.

was not likely to have played a role in the ERP asymmetries
that were found in this study.
4.4. Selection negativity
As in previous reports (Harter and Previc, 1978; Kene-
mans et al., 1993; Zani and Proverbio, 1995, 1997; Heslen-
feld et al., 1997), the most prominent ERP manifestation of
attention to SF was a broad SN extending over the latency
range of 150–350 ms post-stimulus onset. For both high and
low SFs, the SN was bilaterally distributed over the occipital
scalp and dipole modeling identified bilateral generators
located within ventral occipital cortex in or near the fusi-
form gyrus. Previous dipole modeling studies have also
localized the SN associated with attention to color (Anllo-
Vento et al., 1998) and SF (Heslenfeld et al., 1997) to
ventral occipital cortex.
Variations in scalp topography have been reported for
SNs elicited by the selection of different types of stimulus
features (Anllo-Vento and Hillyard, 1996), suggesting that
these SNs may reflect activity within different ventral visual
areas specialized for processing the specific task-relevant
feature dimension. In the present study, however, it is
important to note that the earliest attention effects (ND120
and PD130) differed markedly in scalp topography (and in
estimate source location) from the later SN, indicating that
the initial selection for SF is carried out by different
mechanisms from those manifest in SN.
4.5. Hemispheric asymmetries
The SNs associated with attending to high and low SFs
were found to be asymmetrically distributed between the
cerebral hemispheres in the 220–300 ms range. The SN
elicited by attended high SF standards was enhanced at
ventral–lateral electrode sites of the left hemisphere,
whereas low SF standards elicited a SN with greater nega-
tive amplitude over ventral–lateral right hemispheric scalp
sites. These hemispheric asymmetries are consistent with
numerous behavioral and neuropsychological studies
suggesting that the cerebral hemispheres are differentially
biased for processing high and low SF. In particular, it has
been hypothesized that the right hemisphere preferentially
processes low SF information, whereas the left hemisphere
is specialized for processing information contained in high
SFs (see Ivry and Robertson, 1998).
A significantly asymmetrical distribution was also
observed for the early phase of the high SF attention effect
(ND120), with greater amplitude over ventro-lateral scalp
sites of the left hemisphere. Zani and Proverbio (1995) simi-
larly found their N115 to be more prominent over the left
hemisphere for higher SFs, but this asymmetry was not
related to attention. In general, these results are concordant
with proposals that some degree of hemispheric specializa-
tion exists for processing high vs. low SF information.
Moreover, the present ERP data suggest that this lateralized
specialization affects the earliest phases of attentional selec-
tion as well as longer-latency processing in the ventral
visual–cortical areas.
5. Conclusions
In contrast with the reports of Zani and Proverbio (1995,
1997) but in agreement with the studies of Heslenfeld et al.
(1997), de Ruiter (1998) and Kenemans et al. (in press), we
found no evidence that attention to SF involves modulation
of early-evoked activity in size-specific neural pathways in
the 60–100 ms range. Instead, the earliest ERP signs of
selection for SF began at around 100 ms in the form of
increased negativity (ND120) to attended high SF stimuli
and increased positivity (PD130) for attended low SF
stimuli. This polarity difference plus the lateralization of
the ND120 to the left hemisphere suggests that specialized
cortical mechanisms participate in the selection of high and
low SF information. Following this initial selective proces-
sing, which was estimated to take place in dorsal extrastriate
occipital cortex, a broad SN was elicited by attended stimuli
of both SFs in ventral visual areas in or near the fusiform
gyrus. This SN resembles that elicited by stimuli that are
selected on the basis of other non-spatial stimulus features
and may index neuronal activity within ventral visual
stream areas specialized for the processing of different
visual features including SF information. The SNs elicited
during attention to high and low SF were asymmetrically
lateralized to the left and right hemispheres, respectively,
consistent with current models of hemispheric specializa-
tion for SF processing.
The present results add to the body of evidence indicat-
ing that only spatial attention involves a mechanism of
amplitude modulation of the early-evoked components
prior to 100 ms. Studies employing scalp topography and
source localization techniques have found that the increase
in P1 amplitude for attended-location stimuli represents at
least in part an amplitude modulation of the P1 elicited by
unattended stimuli (reviewed in Mangun, 1995; Heslenfeld
et al., 1997; Hillyard and Anllo-Vento, 1998). Indeed, the
ERP pattern of enhanced occipital P1 (70–120 ms) together
with occipital N1 (160–190 ms) and frontal N1 (140–
160 ms) amplitudes has been proposed to be a unique
index of spatial attention (Hillyard and Anllo-Vento,
1998). The increased P1 amplitude reported by Zani and
Proverbio (1995, 1997) during attention to SF appears to
represent an exception to this proposal, however, at least
insofar as P1 is concerned. Another apparent exception is
the finding by Valdes-Sosa et al., (1998) of increased P1
(115–180 ms) and N1 (215–290 ms) amplitudes to attended
color–motion conjunctions, although the latencies here
were longer than those generally observed in spatial atten-
tion experiments. These important findings need to be
followed up to determine the conditions under which
such early ERP effects may occur during attention to
non-spatial features and to carry out the spatio-temporal
A. Martı́nez et al. / Clinical Neurophysiology 112 (2001) 1980–19981996
analyses required to verify a mechanism of amplitude
modulation of early-evoked components.
Acknowledgements
This work was supported by NIMH grant MH-25594. We
thank Matt Marlow for the technical assistance and 3 refer-
ees for their helpful comments on the manuscript.
References
Anllo-Vento L, Hillyard SA. Selective attention to the color and direction
of moving stimuli: electrophysiological correlates of hierarchical
feature selection. Percept Psychophys 1996;58:191–206.
Anllo-Vento L, Luck SJ, Hillyard SA. Spatio-temporal dynamics of atten-
tion to color: evidence from human electrophysiology. Hum Brain
Mapp 1998;6:216–238.
Bruin K, Kenemans J, Verbaten M, Van der Heijden A. Localization of
spatial attention processes with the aid of a probe technique. Electro-
enceph clin Neurophysiol 1998;108:110–122.
Christman S, Kitterle FL, Hellige J. Hemispheric asymmetry in the proces-
sing of absolute versus relative spatial frequency. Brain Cogn
1991;16:62–73.
Clark VP, Hillyard SA. Spatial selective attention affects early extrastriate
but not striate components of the visual evoked potential. J Cogn
Neurosci 1996;8:387–402.
Clark VP, Fan S, Hillyard SA. Identification of early visually evoked
potential generators by retinotopic and topographic analysis. Hum
Brain Mapp 1995;2:170–187.
Cornsweet TN. Visual perception, New York, NY: Academic Press, 1970.
Cox RW. AFNI – software for analysis and visualization of functional
magnetic resonance neuroimages. Comput Biomed Res 1996;29:162–
173.
Davis E, Graham N. Spatial frequency uncertainty effects in the detection of
sinusoidal gratings. Vision Res 1981;21:705–713.
De Valois RL, De Valois KK. Spatial vision, Oxford: Oxford University
Press, 1990.
Ginsburg AP. Spatial filtering and visual form perception. In: Boff KR,
Kaufman L, Thomas JP, editors. Handbook of perception and human
performance. Volume 2. Cognitive processes and performance, New
York: John Wiley and Sons, 1986. pp. 34.1–34.41.
Graham N, Kramer P, Haber N. Attending to spatial frequency and spatial
position of near-threshold visual patterns. In: Posner MI, Marin OSM,
editors. Attention and performance, Hillsdale, NJ: Erlbaum, 1985. pp.
269–284.
Gratton G. Attention and probability effects in the human occipital cortex:
an optical imaging study. NeuroReport 1997;8:1749–1753.
Harter MR, Previc FH. Size-specific information channels and selective
attention: visual evoked potential and behavioral measures. Electroen-
ceph clin Neurophysiol 1978;45:628–640.
Heinze HJ, Munte TF. Electrophysiological correlates of hierarchical
stimulus processing: dissociation between onset and later stages of
global and local target processing. Neuropsychologia 1993;31:841–
852.
Heinze HJ, Luck SJ, Mangun GR, Hillyard SA. Visual event-related poten-
tials index focussed attention with bilateral stimulas arrays. I: Evidence
for early selection. Electroenceph clin Neurophysiol 1990;75:511–527.
Heinze HJ, Mangun GR, Burchert W, Hinrichs H, Scholz M, Munte TF,
Gos A, Scherg M, Johannes S, Hundeshagen H, Gazzaniga MS, Hill-
yard SA. Combined spatial and temporal imaging of brain activity
during visual selective attention in humans. Nature 1994;372:543–546.
Heinze HJ, Hinrichs H, Scholz M, Burchert W, Mangun GR. Neural
mechanisms of global and local processing. A combined PET and
ERP study. J Cogn Neurosci 1998;10:485–498.
Heslenfeld DJ, Kenemans JL, Kok A, Molenaar PCM. Feature processing
in the human visual system: an overview. Biol Psychol 1997;45:183–
215.
Hillyard SA, Anllo-Vento L. Event-related brain potentials in the study of
visual selective attention. Proc Natl Acad Sci USA 1998;95:781–787.
Hillyard SA, Munte TF. Selective attention to color and location cues: an
analysis with event-related potentials. Percept Psychophys
1984;36:185–198.
Hillyard SA, Vogel EK, Luck SJ. Sensory gain control (amplification) as a
mechanism of selective attention: electrophysiological and neuroima-
ging evidence. Philos Trans R Soc Biol Sci 1998;353:1–14.
Ivry RB, Robertson LC. The two sides of perception, Cambridge, MA: MIT
Press, 1998.
Jeffreys DA, Axford JG. Source location of pattern-specific components of
human visual evoked potentials. Exp Brain Res 1972;16:1–21.
Kenemans JL, Kok A, Smulders FT. Event-related potentials to conjunc-
tions of spatial frequency and orientation as a function of stimulus
parameters and response requirements. Electroenceph clin Neurophy-
siol 1993;88:51–63.
Kenemans J, Baas J, Mangun G, Lijffijt M, Verbaten M. On the processing
of spatial frequencies as revealed by evoked-potential source modeling.
Clin Neurophysiol 2000;111:1113–1123.
Kenemans JL, Lijffijt M, Camfferman G, Verbaten MN. Split-second
sequential selective activation in human secondary visual cortex. J
Cog Neuro 2001 in press.
Kitterle FL, Hellige JB, Christman S. Visual hemispheric asymmetries
depend on which spatial frequencies are task relevant. Brain Cogn
1992;20:308–314.
Lange JJ, Wijers AA, Mulder LJM, Mulder G. Color selection and location
selection in ERPs: differences, similarities and ‘neural specificity’. Biol
Psychol 1998;48:153–182.
Mangun GR. Neural mechanisms of visual selective attention. Psychophy-
siology 1995;32:4–18.
Mangun GR, Hopfinger J, Kussmaul CL, Fletcher E, Heinze HJ. Covaria-
tions in ERP and PET measures of spatial selective attention in human
extrastriate visual cortex. Hum Brain Mapp 1997;5:273–279.
Martinez A, Anllo-Vento L, Sereno MI, Frank LR, Buxton RB, Dubowitz
DJ, Wong EC, Hinrichs H, Heinze HJ, Hillyard SA. Involvement of
striate and extrastriate visual cortical areas in spatial attention. Nat
Neurosci 1999;2:364–369.
Martinez A, Di Russo F, Anllo-Vento L, Sereno M, Buxton RB, Hillyard
SA. Putting spatial attention on the map: timing and localization of
stimulus selection processes in striate and extrastriate visual areas.
Vision Res 2001;41:1437–1457.
McCarthy G, Wood CC. Scalp distributions of event-related potentials: an
ambiguity associated with analysis of variance models. Electroenceph
clin Neurophysiol 1985;62:203–208.
Miltner M, Braun C, Johnson Jr R, Simpson GV, Ruchkin DS. A test of
brain electrical source analysis (BESA): a simulation study. Electroen-
ceph clin Neurophysiol 1994;91:295–310.
Olzak LA, Thomas JP. Seeing spatial patterns. In: Boff KR, Kaufman L,
Thomas JP, editors. Handbook of perception and human performance.
Volume 1. Sensory processes and perception, New York: John Wiley
and Sons, 1986. pp. 7.1–7.56.
Previc FH, Harter MR. Electrophysiological and behavioral indicants of
selective attention to multifeature gratings. Percept Psychophys
1982;32:462–472.
Robertson LC. Spatial frequencies as a medium for guiding attention:
comment on Lamb, Yund, and Pond (1999). J Exp Psychol Gen
1999;128:95–98.
de Ruiter MB, Kok A, van der Schoot M. Effects of inter- and intramodal
selective attention to non-spatial visual stimuli: an event-related poten-
tial analysis. Biol Psychol 1998;49:269–294.
Scherg M. Fundamentals of dipole source analysis. In: Grandori F, Hoke M,
A. Martı́nez et al. / Clinical Neurophysiology 112 (2001) 1980–1998 1997
Roman GL, editors. Auditory evoked magnetic fields and electric
potentials, Basel: Karger, 1990. pp. 40–69.
Shulman GL, Sullivan MA, Gish K, Sakoda WJ. The role of spatial
frequency channels in the perception of local and global structure.
Perception 1986;15:259–273.
Talairach J, Tournoux P. Co-planar stereotaxic atlas of the human brain: 3-
dimensional proportional system: an approach to cerebral imaging,
New York, NY: Thieme, 1998.
Tootell RB, Hadjikhani NK, Mendola JD, Marrett S, Dale AM. From
retinotopy to recognition: fMRI in human visual cortex. Trends Cogn
Sci 1998;2:174–183.
Valdes-Sosa M, Bobes MA, Rodriguez V, Pinilla T. Switching attention
without shifting the spotlight: object-based attentional modulation of
brain potentials. J Cog Neuro 1998;10:137–151.
Vasey MW, Thayer JF. The continuing problem of false positives in
repeated measures ANOVA in psychophysiology: a multivariate solu-
tion. Psychophysiology 1987;24:479–486.
Watson AB, Robson JG. Discrimination at threshold: labelled detectors in
human vision. Vision Res 1981;21:1115–1122.
Wijers AA, Lange JJ, Mulder G, Mulder LJM. An ERP study of visual
spatial attention and letter target detection for isoluminant and noniso-
luminant stimuli. Psychophysiology 1997;34:553–565.
Woldorff M. Distortion of ERP averages due to overlap from temporally
adjacent ERPs: analysis and correction. Psychophysiology 1993;30:98–
119.
Woldorff MG, Fox PT, Matzke M, Lancaster JL, Veeraswamy S, Zamarripa
F, Seabolt M, Glass T, Gao JH, Martin CC, Jerabek P. Retinotopic
organization of the early visual–spatial attention effects as revealed
by PET and ERPs. Hum Brain Mapp 1997;5:280–286.
Zani A, Proverbio AM. ERP signs of early selective attention effects to
check size. Electroenceph clin Neurophysiol 1995;95:277–292.
Zani A, Proverbio AM. Attention modulation of short latency ERPs by
selective attention to conjunction of spatial frequency and location. J
Psychophysiol 1997;11:21–32.
A. Martı́nez et al. / Clinical Neurophysiology 112 (2001) 1980–19981998