
Electrophysiological Feedback in Adaptive Human Computer Interfaces
14
Computer Science at Kent Electrophysiological Feedback in Adaptive Human Computer Interfaces Brad Wyble, Patrick Craston and Howard Bowman Technical Report No. 8-06 September 2006 Copyright © 2006 University of Kent Published by the Computing Laboratory, University of Kent, Canterbury, Kent CT2 7NF, UK
Transcript of Electrophysiological Feedback in Adaptive Human Computer Interfaces
Computer Science at Kent
Electrophysiological Feedback in Adaptive Human Computer Interfaces
Brad Wyble, Patrick Craston and Howard Bowman
Technical Report No. 8-06 September 2006
Copyright © 2006 University of Kent Published by the Computing Laboratory, University of Kent, Canterbury, Kent CT2 7NF, UK

Electrophysiological Feedback in Adaptive Human Computer Interfaces1
Brad Wyble, Patrick Craston and H. Bowman
Centre for Cognitive Neuroscience and Cognitive Systems and the Computing Laboratory,
University of Kent at Canterbury, Canterbury, Kent, CT2 7NF, United Kingdom
Abstract
This paper explores the feasibility of using EEG in the context of Stimulus Rich Reactive Interfaces
(SRRI’s), as a source of feedback on the cognitive state of the user. We have run experiments to evaluate the utility of two potential EEG measures of whether a stimulus has been perceived: 1) reduced EEG power in the alpha band at posterior brain areas and 2) a P3-like positive deflection over parietal areas. Such measures would enable re-presentation of a critical stimulus that has been missed.
This paper considers whether, in the context of SRRIs, these measures can be reliably extracted online, i.e. in real-time. To determine this, we have investigated the extent to which online extraction of these measures predicts target report. Our results are positive, and suggest that a combination of multiple approaches can be used to improve the reliability of single trial discrimination. We also discuss possible ways in which such a system could be implemented and integrated into a head-mounted wearable display that is electrically isolated from the surroundings by optical input and output.
Introduction
One of the fundamental problems involved in real-time processing is information overload. A system has to pick and choose which stimuli to attend, before it has expended the resources to process them. The human brain has evolved a sophisticated attentional mechanism to pick and choose what information is selected for further processing. As a consequence, the designer of a computer interface is not always able to ensure that what the interface knows is important (such as a low altitude warning on an aircraft) is selected by the human user’s attention system. HCI design has learned a great deal of tricks to increase the inherent salience of input signals to a human user (using warning lights and sounds, for example), but accidents still occur due to critical information that is ignored.
If described using computer networking as a metaphor, this situation is akin to transmitting information over a communication channel without acknowledgement of receipt. The computer is transmitting information to the user with the intent that it be received, but the system has no way of verifying that this transmission was successfully completed. No well-designed computer-computer interface operates in this way. Acknowledgement of packet receipt is a core element of any modern networking technology.
The goal of this research is to record an acknowledgement signal from scalp recorded brain waves. Electrophysiological neuroscience has identified a number of electrical signals produced by the brain when information is encoded into working memory that could serve this role. In this paper, we explore a novel use of recorded brain signals, to enhance the reliability of information transmission from computer to user.
Brain Computer Interface: The direct brain to computer interface (e.g. Vidal 1973, Levine, et al 2000, Beverina, Palmas, Silvoni,
Piccione, & Giove 2000) has been one of the most useful applications to have arisen from electrophysiological neuroscience. By recording brain waves from human subjects with motor impairments, it has been possible to give the severely disabled a means of communication with the world (e.g. Cilliers & Van Der Kouwe 1993) Using these techniques, a subject can passively view a matrix of characters and guide a computer interface that is recording and analyzing EEG signals to the intended words he or she wishes to communicate. For some people, the electrical signal produced by their brain is
1 The full reference for this article is, B. Wyble, P. Craston and H. Bowman. "Electrophysiological feedback in adaptive human computer interfaces." Technical Report 8-06, Computing Lab, University of Kent at Canterbury, September 2006.

the only means by which they can consciously communicate with the world. The Brain-Computer-Interface (BCI) field is now quite mature, using cutting edge technology to maximize the accuracy and speed of the information that can be read from the disabled subject’s brain (Meinicke, Kasper, Hoppe, Heumann & Ritter 2003; Hochberg, et al 2006)
Work in the BCI field has almost exclusively focused on human-to-computer information transfer. However, recording brain signals can also serve to enhance the reliability of information flow in the opposite direction, an application that is virtually unexplored. We will describe a system that can use brainwaves to warn a computer that its user may have missed a critical piece of information. This warning will allow the computer to re-present missed information until it is perceived.
The algorithms described in this report are simpler than those commonly used in BCI research. The intent of our approach is to develop a device with has the following characteristics:
o Implementable with currently available electrical components o Small enough to be enclosed within a helmet o Easily shielded from nearby interference o Power consumption sufficiently low to run on lightweight battery power o Extremely rapid response (response within less than 1 second of target onset) o Easy to set up
These restrictions presently rule out both sophisticated waveform analyses and multi-electrode arrays.
This paper focuses on whether an uncomplicated analysis of data recorded from a single pair of electrodes can provide useful information to the computer about whether a target was detected.
We will focus on two elements of the human EEG signal as indicators of target perception: the P3 component of the Event Related Potential (ERP) and changes in the power of oscillations near 10 hz, known as the Alpha power band.
The P3 Component: When one records EEG from the human scalp, the signal measured is deflected by ongoing cognitive
operations. In the EEG literature, these deflections are referred to as components, which are observed in the Event Related Potential (ERP) that emerges from averaging together a large number of trials, time locked to the onset of a salient stimulus.
ERP components can be manipulated experimentally; hence, they have been associated with particular cognitive processes. Whereas the early part of the waveform is associated with sensory processing of target stimuli, the later part is associated with high-level processing of a stimulus. This component is typically called the P3 (i.e., the third positive peak of the ERP, also referred to as the P300 due to its typical latency of 300ms post-stimulus). Although some researchers have identified a frontally located P3a component, which is elicited by infrequent but task-irrelevant stimuli, we focus on the P3b, which has its maximum over parietal electrode sites. The P3b (called P3 from here on) is present for stimuli that are both infrequent and relevant to the task (Squires et al. 1975), As the P3 is only observed in the ERP for target stimuli that are detected by the subject (Vogel et al. 1998), it can be assumed to be an indication of an item being encoded into working memory (Donchin, 1981).
Depending on the amount of noise in the signal, one normally has to average across a considerable number of trials to obtain a clean ERP waveform. However, the P3 component is often large enough to be detected even in the raw EEG. Of course, one cannot draw conclusions about P3 latency and shape from raw P3s; however, they are often clear enough to be detected on a trial-by-trial basis. The algorithm used in our approach focuses on these raw P3s.
Alpha Waves: During scalp EEG recording, alpha oscillations (in the 8-12 hz band) are prominent in posterior areas
of the brain and this is especially true when the subject’s eyes are closed. Alpha activity is so large that it can easily be discerned in the raw, unfiltered signal and is generally much larger than the P3 component, within an individual trial. However, because alpha activity is poorly phase locked to external events, it is not visible in most event triggered average plots, as employed in ERPs. However, if alpha activity is computed within individual waveforms, using FFT’s, strong changes in this oscillation can be observed in relation to cognitive events.
One prominent relationship between oscillations and mental activity is that alpha power tends to
diminish at the onset of a cognitive event, such as detecting a target, encoding something into memory, or initiating a movement. This is called an ERD or Event Related Desynchronization (see Pfurtshellter & da Silva 1999 for a review). It is thought that alpha activity may reflect an area of cortex that is being held in idling state.
Experiments and Data: To test our ideas, we used data from another experiment, which presented targets embedded in a
stream of distractors. We were able to record prominent P3 ERP’s as well as alpha waves. This EEG data serves as a test of the ability of online algorithms to determine wether a target was seen or missed.
The experiment involved Rapid Serial Visual Presentation (RSVP), a presentation method commonly used in the visual attention field (Weichselgartner & Sperling 1987). In RSVP, a subject fixates on the center of the screen and views a stream of constantly changing stimuli, which contains one or more targets. In the experiments reported here, subjects viewed a stream of digits in search for any uppercase letter, which was reported at the end of a trial. The subjects did not know when the letter would appear, and stimuli changed every 47 ms. EEG data were compared with target detection on corresponding trials, to gauge the ability of EEG to discriminate between target seen and target missed trials for a random group of 12 subjects.
Method Participants: Twelve under- and postgraduate university students (mean age 24.1, Std. Dev. 2.9; 6 male and 6
female; 11 right- and 1 left-handed) provided written consent and received 10 GBP for participation. Participants were free from neurological disorders and had normal or corrected-to-normal vision. The study was approved by the local ethics committee.
Stimulus presentation: We presented alphanumeric characters (Arial font, 5cm mean height) at a distance of 100cm (2.86
visual angle) on a 21" CRT computer screen (1024x768 @ 85Hz) using the Psychophysics toolbox (Brainard 1997) running on Matlab version 6.5 under Microsoft Windows XP. A photodiode verified exact stimulus presentation timing.
Participants viewed four blocks (3 RSVP/1 skeletal) of 100 trials. Within each block, there were 96 trials containing a single target and four catch-trials consisting only of distractors. Five practice trials preceded the first block in both the RSVP and skeletal conditions. The underlying structure and timing of RSVP and skeletal streams was equal. However, whereas in RSVP, the target was embedded into a continuous stream of distractors, unmasked skeletal streams contained only the target and masked skeletal streams consisted of the target and a following distractor. The target for each trial was chosen at random from a list of 14 capital letters (’B’,’C’,’D’,’E’,’F’,’G’,’J’,’K’,’L’,’P’,’R’,’T’,’U’,’V’); distractors could be any digit except ’1’ or ’0’. The target item’s position in the stream varied between 10 and 55. A fixation cross presented for 500ms preceded each stream. Stimuli were presented at a rapid rate of approx. 20 items per second (SOA 47.1ms; no inter-stimulus interval) to ensure participants missed a considerable number of targets. The RSVP stream was made up of 70 items (total stream length 3.3 seconds); Each stream ended with a dot or a comma (present for 47.1ms) as final item.
Following stream presentation, subjects used a computer keyboard to enter the target letter or press space if they had not seen a target. Subsequently, they pressed dot or comma depending on what the last item of the stream was. The second task was included to ensure that subjects maintained their attention on the stream after the target had passed.
Recording & Analysis: Electroencephalographic (EEG) recording was made using a Quickamp (BrainProducts, Munich,
Germany) amplifier, with a 22-bit analog-to-digital converter. The sampling rate was 2000Hz and the data was digitally filtered at low-pass 85Hz and high-pass 0.5Hz at recording. Twenty electrodes were placed at standard locations according to the international 10/20 system Jasper(1958). Electrooculographic (EOG) activity was recorded from below and to the right side of the right eye. The data was referenced to a common average online and re-referenced to linked earlobes offline. Left mastoid acted as ground. Eye movement artefacts were removed by rejecting data in the window of 200ms before and after an eye blink.
Subsequently, all data was inspected for sudden high and consistently low activity and data from 500ms prior to 500ms after an artefact was marked as bad and removed from further analysis. In total, 17% of RSVP and 20% of skeletal trials had to be excluded due to artefacts. For this paper, we focus on the data from two regions of interest, namely occipital (channels O1, O2) and parietal (channels P3, Pz, P4) regions for the study of early components and the P3 wave of the ERP respectively. After segmentation and averaging, an 8Hz low pass filter was applied to enhance visualisation of ERP components. EEG data was analysed using the BrainProducts Analyzer software and the Matlab EEGLab toolbox (Delorme & Makeig 2004).
Signal Detection: For each trial, an algorithm determined whether subjects did or did not see a target based on the EEG
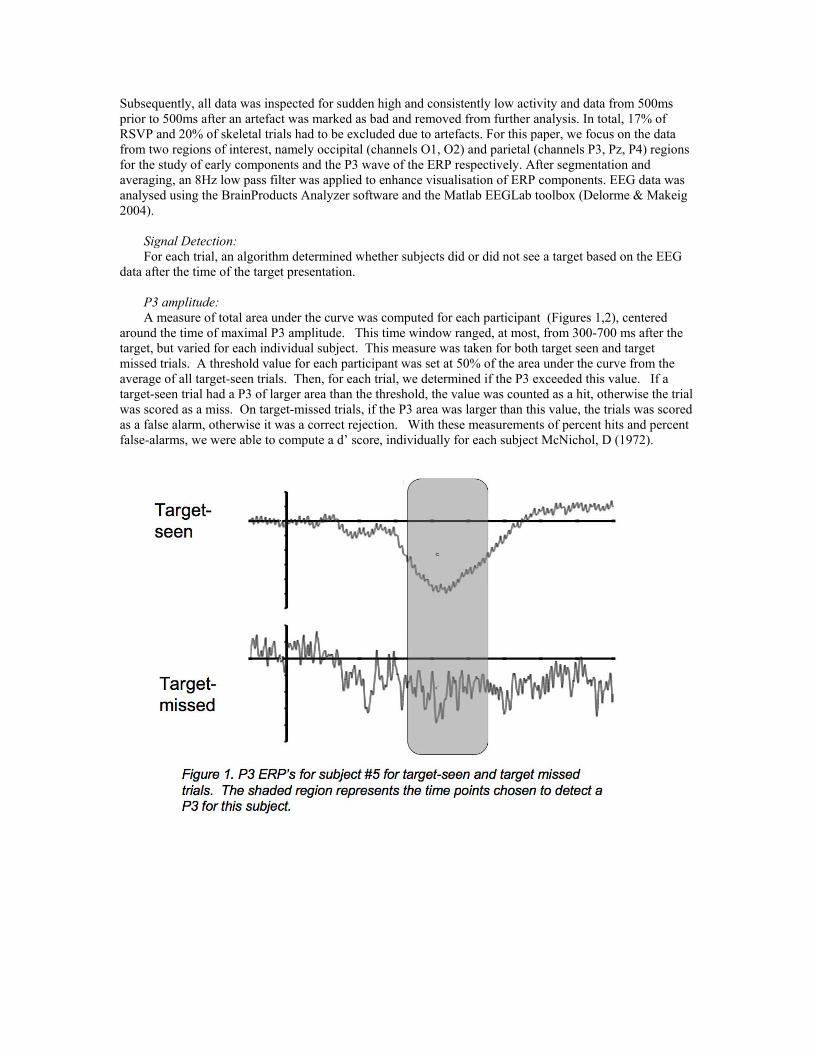
data after the time of the target presentation. P3 amplitude: A measure of total area under the curve was computed for each participant (Figures 1,2), centered
around the time of maximal P3 amplitude. This time window ranged, at most, from 300-700 ms after the target, but varied for each individual subject. This measure was taken for both target seen and target missed trials. A threshold value for each participant was set at 50% of the area under the curve from the average of all target-seen trials. Then, for each trial, we determined if the P3 exceeded this value. If a target-seen trial had a P3 of larger area than the threshold, the value was counted as a hit, otherwise the trial was scored as a miss. On target-missed trials, if the P3 area was larger than this value, the trials was scored as a false alarm, otherwise it was a correct rejection. With these measurements of percent hits and percent false-alarms, we were able to compute a d’ score, individually for each subject McNichol, D (1972).
Alpha Power: This analysis had the same form as the P3 analysis, except that alpha power was used to determine
whether a target was seen instead of P3 area. For each trial, alpha power was taken as the sum of components of a Fourier transform in the range of 8-12 hz for a time window 400 to 900 ms after target presentation. For each participant, the sum of the alpha power in this window was computed for target-seen trials and target missed trials. A threshold was set for each participant equal to the average alpha power in this window for target-seen trials, multiplied by 1.5. This threshold was used to discriminate between hits and misses for target-seen trials; and false alarms and correct rejections for target-missed trials. A trial would be classified as a hit or false alarm if the total of alpha power was less than this threshold.
Results
When the above criteria were applied to data from each subject, measures of hits, misses, false alarms
and correct rejections were computed, providing us with d’ scores indicating the sensitivity of the algorithm.
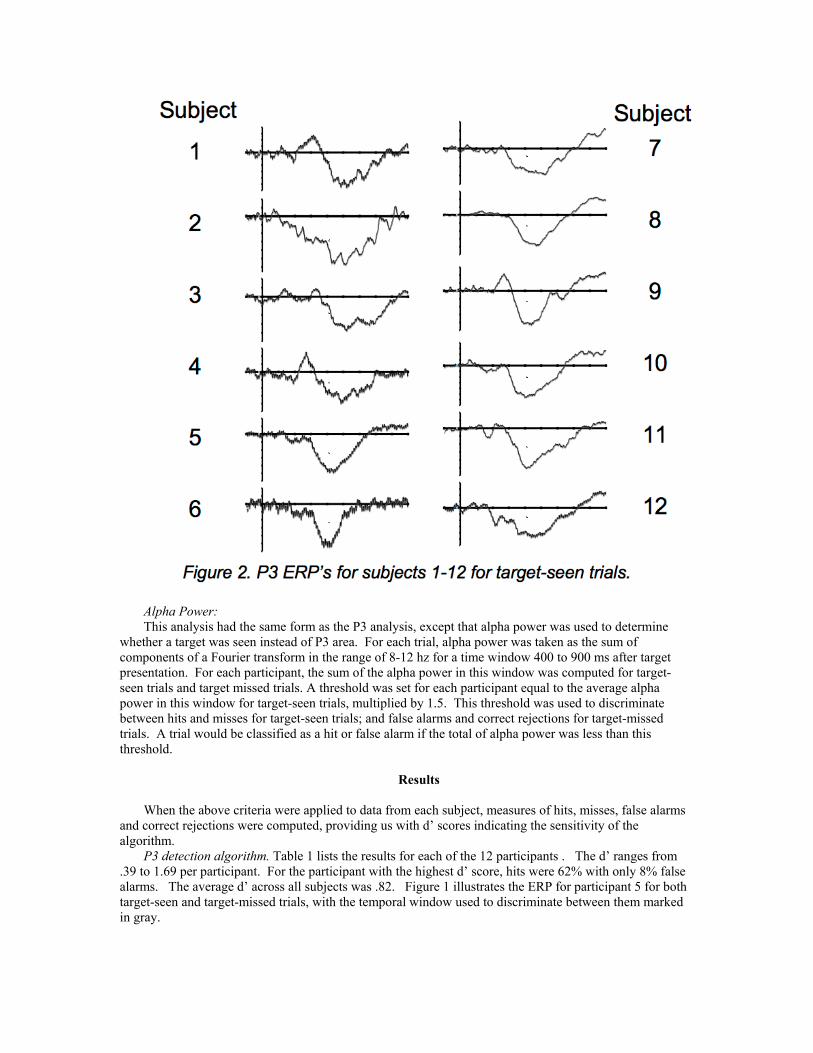
P3 detection algorithm. Table 1 lists the results for each of the 12 participants . The d’ ranges from .39 to 1.69 per participant. For the participant with the highest d’ score, hits were 62% with only 8% false alarms. The average d’ across all subjects was .82. Figure 1 illustrates the ERP for participant 5 for both target-seen and target-missed trials, with the temporal window used to discriminate between them marked in gray.

Subject % Hit % Miss % Cr % FA d’
1 56 44 63 37 .48 2 57 43 66 34 .59 3 58 42 66 34 .61 4 56 44 83 17 1.09 5 62 38 92 8 1.69 6 61 39 61 39 .56 7 64 36 56 44 .53 8 62 38 82 18 1.21 9 65 35 75 25 1.07
10 64 36 71 29 .93 11 60 40 56 44 .39 12 60 40 68 32 .73
Average 60 40 70 30 .82
SE 0.91 0.91 3.23 3.23 .11 Table 1 P3 detection algorithm results across participants. SE refers to Standard Error. Alpha power detection algorithm. For each trial, for each participant, the amount of alpha power was
compared for a time window after (spanning 400ms to 900ms) the target onset, and compared with a threshold, as described in the methods. The alpha analysis alone was a relatively poor predictor of whether targets were detected. The average d’ score is much lower than that produced by the P3 analysis, and, for some participants, it was near zero or slightly negative. Scores for each participant are shown in Table 2.
Subject % Hit % Miss % Cr % FA d'
1 92 8 8 92 .03 2 88 12 23 77 .43 3 89 11 34 66 .80 4 89 11 30 70 .70 5 92 8 0 100 -- 6 89 11 19 81 .38 7 88 12 41 59 .92 8 95 5 8 92 .23 9 94 6 0 100 --
10 94 6 5 95 -
.09 11 93 7 10 90 .20 12 92 8 21 79 .56
Average 91 9 17 83 .42
SE 0.73 0.73 3.91 3.91 .09 Table 2. Alpha power detection algorithm results across participants.

Minimizing False Alarms: A third analysis combined both analyses, such that a trial had to pass both the P3 area test and the alpha power test to be considered either a hit or a false alarm. The results from this combined analysis produced an average d’ score of .86, which was higher than either detection algorithm alone.
More importantly, with both P3 and Alpha detection criteria, it is more difficult for a target to be classified as either a hit, or a false alarm, as each trial now has to pass two tests. Thus, combining these approaches provides an additional means by which to limit false alarms. If an intended application of this analysis is to allow a computer interface to ensure that the user has consciously perceived a target presented, reducing false alarms is of primary importance.
To set the threshold for P3 and Alpha power in the analyses described above, the intent was to maximize the d’ score (maximizing the difference between hits and false alarms). What we do now is increase these thresholds dramatically (.9 for P3 amplitude and 1.0 for alpha power), reducing the frequency of false alarms, but at the expense of decreasing the number of hits.
Table 3 demonstrates hit and false alarm rates from the combined P3 and alpha analysis with higher thresholds. P3 area had to exceed 90% (rather than 50%) of the average P3 area and alpha power had to be less than 100% of the average alpha power (rather than 150%). Results vary across subjects, but for four of them, false alarms are below 10%, with hit rates above or equal to 25%.
Subject % Hit % FA
1 28 14 2 33 10 3 33 10 4 29 3 5 25 8 6 29 12 7 33 12 8 24 4 9 25 5
10 25 16 11 31 27 12 29 12
Average 29 11
SE 0.97 1.85 Table 3. Results from combined P3 and alpha detection algorithm with a high threshold.
Building An Interface Device As mentioned above in the introduction, a common method of ensuring that a critical piece of
information is perceived by the user is to use a salient visual or auditory cue to capture attention. However, if an environment is particularly rich in such critical signals, the user can be faced with an overwhelming number of such alerts, forcing some alerts to be ignored. Information overload thus renders all of the inputs at the same level of salience relatively less informative.
The Brainwave Based Receipt Acknowledgement (BBRA) device attempts to use brainwaves generated by a user to provide the computer controlling the interface with feedback about whether the user did or did not see a particular piece of information. In theory, this sort of device allows the computer to avoid the use of frequent alarm signals in information rich environments, by simply re-presenting stimuli until they have been successfully noticed, much as packets are retransmitted over a noisy network.
The BBRA signal must operate quickly to be useful in a time-critical environment, such as a pilot cockpit. Therefore the acknowledgement must be presented almost immediately after the occurrence of the

cognitive events in the mind of the user. The algorithms described above are ideal for this sort of application. They are simple enough to be
executable on minimal hardware platforms in realtime, using off the shelf IC components with minimal power requirements. Below we will describe how the algorithms above can be implemented with a mixture of analog and digital elements.
The System: The system we describe (Figure 3) is intended to fit within a head-mounted system. It requires 3
electrodes held against the scalp with an elastic headband, a small circuit-board (perhaps 6 by 6 centimeters in size) with components powered by a battery pack. The system communicates with the outside world by infrared, thus isolating the user from any electric currents or ground loops, and allowing for free movement.
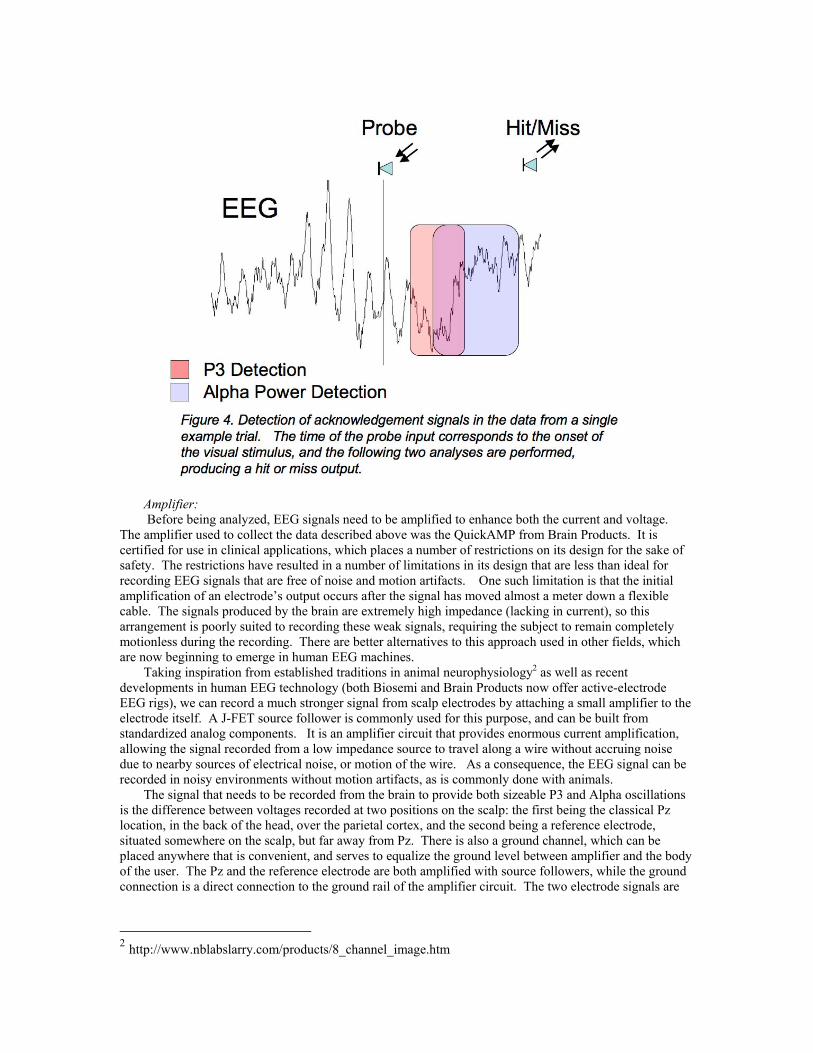
When presenting a target to the user, the computer interface device sends a stimulus time-locked probe
(e.g. an infrared input) to the input port of the BBRA system, triggering the detection of P3 and alpha correlates of receipt acknowledgement. The system replies to the interface with a single flash of its LED if it has determined that the target was seen. The detection algorithms described above will be used, as depicted in Figure 4.
Amplifier: Before being analyzed, EEG signals need to be amplified to enhance both the current and voltage.
The amplifier used to collect the data described above was the QuickAMP from Brain Products. It is certified for use in clinical applications, which places a number of restrictions on its design for the sake of safety. The restrictions have resulted in a number of limitations in its design that are less than ideal for recording EEG signals that are free of noise and motion artifacts. One such limitation is that the initial amplification of an electrode’s output occurs after the signal has moved almost a meter down a flexible cable. The signals produced by the brain are extremely high impedance (lacking in current), so this arrangement is poorly suited to recording these weak signals, requiring the subject to remain completely motionless during the recording. There are better alternatives to this approach used in other fields, which are now beginning to emerge in human EEG machines.
Taking inspiration from established traditions in animal neurophysiology2 as well as recent developments in human EEG technology (both Biosemi and Brain Products now offer active-electrode EEG rigs), we can record a much stronger signal from scalp electrodes by attaching a small amplifier to the electrode itself. A J-FET source follower is commonly used for this purpose, and can be built from standardized analog components. It is an amplifier circuit that provides enormous current amplification, allowing the signal recorded from a low impedance source to travel along a wire without accruing noise due to nearby sources of electrical noise, or motion of the wire. As a consequence, the EEG signal can be recorded in noisy environments without motion artifacts, as is commonly done with animals.
The signal that needs to be recorded from the brain to provide both sizeable P3 and Alpha oscillations is the difference between voltages recorded at two positions on the scalp: the first being the classical Pz location, in the back of the head, over the parietal cortex, and the second being a reference electrode, situated somewhere on the scalp, but far away from Pz. There is also a ground channel, which can be placed anywhere that is convenient, and serves to equalize the ground level between amplifier and the body of the user. The Pz and the reference electrode are both amplified with source followers, while the ground connection is a direct connection to the ground rail of the amplifier circuit. The two electrode signals are
2 http://www.nblabslarry.com/products/8_channel_image.htm
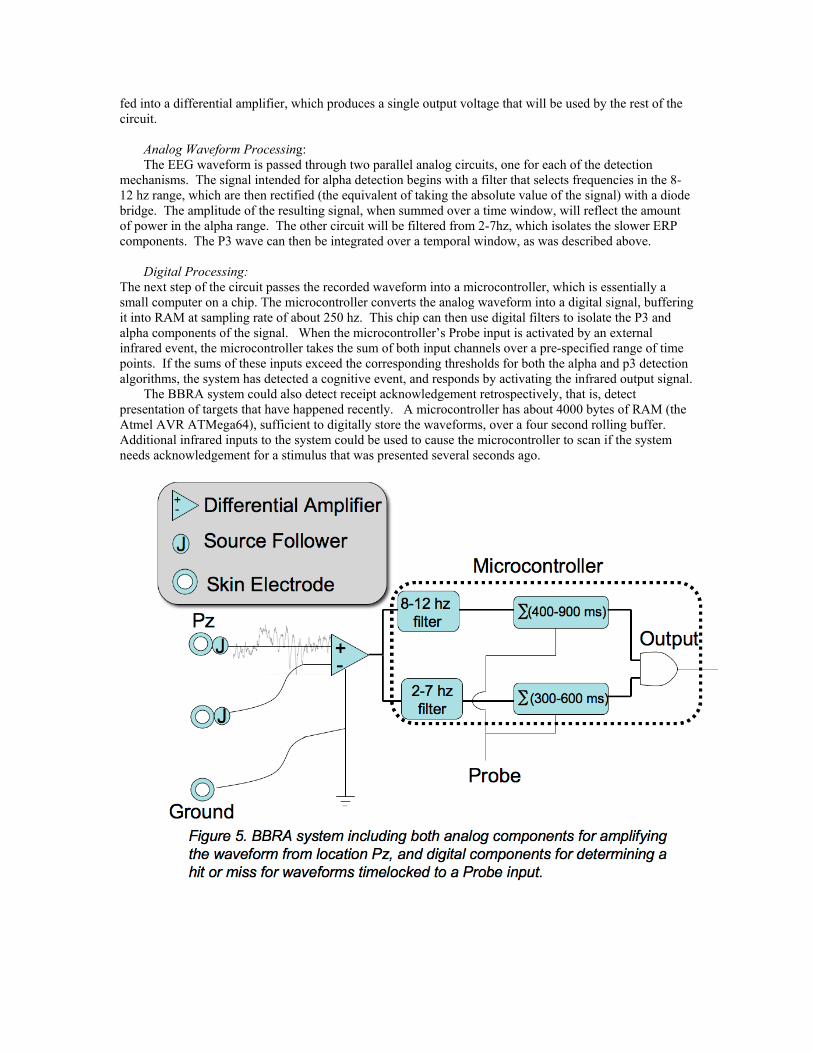
fed into a differential amplifier, which produces a single output voltage that will be used by the rest of the circuit.
Analog Waveform Processing: The EEG waveform is passed through two parallel analog circuits, one for each of the detection
mechanisms. The signal intended for alpha detection begins with a filter that selects frequencies in the 8-12 hz range, which are then rectified (the equivalent of taking the absolute value of the signal) with a diode bridge. The amplitude of the resulting signal, when summed over a time window, will reflect the amount of power in the alpha range. The other circuit will be filtered from 2-7hz, which isolates the slower ERP components. The P3 wave can then be integrated over a temporal window, as was described above.
Digital Processing:
The next step of the circuit passes the recorded waveform into a microcontroller, which is essentially a small computer on a chip. The microcontroller converts the analog waveform into a digital signal, buffering it into RAM at sampling rate of about 250 hz. This chip can then use digital filters to isolate the P3 and alpha components of the signal. When the microcontroller’s Probe input is activated by an external infrared event, the microcontroller takes the sum of both input channels over a pre-specified range of time points. If the sums of these inputs exceed the corresponding thresholds for both the alpha and p3 detection algorithms, the system has detected a cognitive event, and responds by activating the infrared output signal.
The BBRA system could also detect receipt acknowledgement retrospectively, that is, detect presentation of targets that have happened recently. A microcontroller has about 4000 bytes of RAM (the Atmel AVR ATMega64), sufficient to digitally store the waveforms, over a four second rolling buffer. Additional infrared inputs to the system could be used to cause the microcontroller to scan if the system needs acknowledgement for a stimulus that was presented several seconds ago.

Eye Tracking: Modern eye trackers are becoming increasingly small, and it is now possible to build one with off the
shelf components3. It is possible to embed one inside a helmet, which provides a stable mounting platform for the cameras and infrared lights. Adding eye-tracking to a computer interface offers potential benefits in simply allowing the interface computer to know where the user is currently attending.
With regard to this application, eye tracking has a very specific benefit; users in an information rich environment are subjected to many stimuli, producing a constant string of cognitive events, making it difficult to determine whether changes in P3’s or alpha waves correspond to the intended stimulus, or some other stimulus. With eye tracking, the system will be able to tell where the subject was looking when a detected cognitive event is generated.
The Practicalities of the Real Interface: We expect the results from a real working prototype of this system will be superior to the results
reported here in a number of respects. First of all, a head-mounted EEG recording setup, with amplification applied locally to each electrode will produce more robust data than the more conventional, unamplified recording setup that we have used to obtain this data. Furthermore, the entire apparatus, including both the electrodes and the amplifier can be contained in a single piece of metallic shielding that should reduce interference further.
The participants we have used in this study were not selected, but were simply the volunteers we happened to get. It will always be the case that some participants will be better candidates than others in EEG experiments, as evidenced by large variation in the d’ scores we get. Research on a BBRA system can progress more effectively on selected subjects that make ideal candidates for this sort of interface.
Finally, while the current state of the art in embedded systems restricts us to a relatively simple analysis at present, the field is constantly evolving. In the future, it will be possible to fit more complex analyses onto a battery powered microcontroller, including such techniques as support-vector-machines, which have been used to produce superior characterization of P3’s than we have obtained here (Meinicke et al 2000).
References
Beverina, F., Palmas, G., Silvoni, S., Piccione, F., & Giove, S. (2003). User adaptive BCIs: SSVEP and P300 based Interfaces. Psychnology, 1(4), 331-354.
Brainard, D. H. (1997). The Psychophysics Toolbox. Spat Vis, 10(4), 433-436. Cilliers, P. J., & Van Der Kouwe, A. J. W. (1993). a VEP-based computer interfcae
for C2-Quadriplegics. Eng Med Biol, 15(pt 3), 1263-1624. Delorme, A., & Makeig, S. (2004). EEGLAB: an open source toolbox for analysis of
single-trial EEG dynamics including independent component analysis. J Neurosci Methods, 134(1), 9-21.
Donchin, E. (1981). Presidential address, 1980. Surprise!...Surprise? Psychophysiology, 18(5), 493-513.
Hochberg, L. R., Serruya, M. D., Friehs, G. M., Mukand, J. A., Saleh, M., Caplan, A. H., et al. (2006). Neuronal ensemble control of prosthetic devices by a human with tetraplegia. Nature, 442(7099), 164-171.
Jasper, H. H. (1958). The ten-twenty electrode system of the International Federation., Electroencephalography & Clinical Neurophysiology, 10, 371–375.
3 http://hcvl.hci.iastate.edu/cgi-bin/openEyeswiki/index.cgi

Levine, S. P., Huggins, J. E., BeMent, S. L., Kushwaha, R. K., Schuh, L. A., Rohde, M. M., et al. (2000). A direct brain interface based on event-related potentials. IEEE Trans Rehabil Eng, 8(2), 180-185.
McNichol, D. (1972). A Primer of Signal Detection Theory. London: George Allen & Unwin.
Meinicke, P., Kaper, M., Hoppe, F., Heumann, M., & Ritter, H. (2003). Improving transfer rates in brain computer interfacing: a case study. Paper presented at the Advances in Neural Information Processing Systems.
Pfurtscheller, G., & Lopes da Silva, F. H. (1999). Event-related EEG/MEG synchronization and desynchronization: basic principles. Clin Neurophysiol, 110(11), 1842-1857.
Squires, N. K., Squires, K. C., & Hillyard, S. A. (1975). Two varieties of long-latency positive waves evoked by unpredictable auditory stimuli in man. Electroencephalogr Clin Neurophysiol, 38(4), 387-401.
Vidal, J. J. (1973). Toward direct brain-computer communication. Annu Rev Biophys Bioeng, 2, 157-180.
Vogel, E. K., Luck, S. J., & Shapiro, K. L. (1998). Electrophysiological evidence for a postperceptual locus of suppression during the attentional blink. J Exp Psychol Hum Percept Perform, 24(6), 1656-1674.
Weichselgartner, E., & Sperling, G. (1987). Dynamics of automatic and controlled visual attention. Science, 238(4828), 778-780.