A test strategy for spurious spatial regression, spatial nonstationarity, and spatial cointegration

Electricity Demand AnalysisUsing Cointegration and Error-Correction Models
with Time Varying Parameters:The Mexican Case 1
Yoosoon Chang Eduardo Martinez-ChomboDepartment of Economics Department of Economic Research
Rice University Banco de Mexico
Abstract
We specify and estimate a double-log functional form of the demand equation,using monthly Mexican electricity data for residential, commercial and industrialsectors. Income, prices and a nonparametric temperature measure are used as ex-planatory variables, and the income elasticity is allowed to evolve slowly over timeby employing the time varying coefficient (TVC) cointegrating model. The speci-fication of the proposed TVC cointegrating model is justified by testing it againstthe spurious regression and the usual fixed coefficient (FC) cointegratin regression.The estimated coefficients suggest that the income elasticity has followed a pre-dominantly increasing path for all sectors during the entire sample period, andthat electricity prices do not significantly affect in the longrun the residential andcommercial demand for electricity in Mexico.
First Draft : June 4, 2001This version: July 23, 2003
JEL Classification: C51, C52, C53, Q41.Key words and phrases : Electricity demand, time varying coefficients, cointegration, canonicalcointegrating regression, error-correction model, and series estimation.
1The authors thank Joon Y. Park for many helpful discussions and comments. Correspondence address to:Yoosoon Chang, Department of Economics - MS 22, Rice University, 6100 Main Street, Houston, TX 77005-1892,Tel: 713-348-2796, Fax: 713-348-5278, Email: [email protected].
1

1. Introduction
Cointegration analysis and error correction models (ECM) have become the standard tech-
niques for the study of electricity demand since their formal development by Engle and Granger
(1987) and their early application to the forecast of the electricity demand in Engle et al.
(1989). Subsequent developments related to this approach have relied on the use of new
techniques to identify cointegrating relationships (for example, the Johansen’s method (1988,
1991)), as well as on the inclusion of more specific energy-related variables in the model. Some
recent examples of these extensions include the work by Beenstock, et al. (1999) which analyzes
the demand for electricity in Israel, and the one by Silk and Joutz (1997) which constructs an
appliance stock index to study US residential electricity demand. In most of these kinds of
analyses the demand equation is specified as a linear double-log function, as a way to obtain
elasticities directly from its coefficients, and the parameters are estimated using data whose
time span is rather long, going beyond forty years in some cases.
Despite the relative popularity of the above techniques, the long time span covered by these
studies raises serious concerns about the validity of the fixed coefficients (FC) assumption in
the electricity demand equation. This assumption in a double-log functional form of demand
simply implies constant elasticities for the entire sample period under study. This feature of
the model is indeed questionable in light of the changes that could have taken place in the
economy over such a long period of time affecting the demand for electricity. See Hass and
Schipper (1998) for more discussions on this issue. Specific examples of the determinants for
such changes include the efficiency improvements in electrical equipments, the developmental
stage of the economy (whether the economy is in transition to later stages of development and
industrialization), and even the government energy policy and the habit persistence of con-
sumers. These determinants are not static, but rather tend to evolve slowly through time and
thus they constantly modify the responses of the aggregated electricity demand to variations
in income and prices. Therefore, if we use data collected over a relatively long time period to
estimate an electricity demand function, we should at least consider the possibility that the
parameters in the regression may not be constant.
As a way to capture this evolving nature of the electricity demand, some studies have
employed alternative functional forms for the demand equations, such as linear functions, to
indirectly calculate the elasticities as functions of the current levels of the variables and the
parameters of the demand equation (see, for example, Chang and Hsing (1991)). However,
these studies fail to see the possibility of allowing the relevant parameters to vary over time.
Another alternative suggested in the literature is to introduce some structural changes into
the model, but this approach has obvious shortcomings. Among others, it can neither handle
the dynamics of the parameter changes nor provide the perspective of their possible future
2

evolution. To our knowledge, these alternatives have been applied in the energy literature
without cointegration analysis, which is necessary to properly identify the longrun relationships
among the relevant variables (see, for example, Hass and Schipper (1998)).
In this paper, we estimate the electricity demand function for Mexico by applying a new
alternative model that combines cointegration analysis with time varying coefficients in the
demand equation. In other words, we look for cointegrating relationships in the electricity
market that change over time. Park and Hahn (1999) have developed the idea of the time
varying coefficients cointegrating regression, which we employ here to estimate the time varying
coefficient (TVC) on the income variable in a double-log functional form of the electricity
demand. The underlying assumption in the model is that the TVC is generated by a smooth
function that can be approximated by a series of functions which expands appropriately as the
sample size grows. Taking into account the intrinsically slow changes in the general factors
that affect electricity demand, such as technology, developmental stage of the economy and
habit persistency, this basic assumption seems plausible. Park and Hahn (1999) demonstrated
that under some regularity conditions the estimators of general TVC cointegration models
are consistent, efficient and asymptotically Gaussian. Thus, in addition to the advantage of
allowing for flexible coefficients, this approach exploits the available information efficiently to
estimate the parameters of the model, and gives a valid basis for forecasting the possible future
path of the TVC.
To highlight the essence of the TVC cointegrating model we use a basic electricity demand
equation with electricity prices and income as explanatory variables. In particular we focus
our analyses on the models with time varying income elasticities for three Mexican sectors:
residential, commercial and industrial, and work with the data that span fifteen years from
1985 to 2000. As a proxy for the income variable, we use private consumption for the resi-
dential and commercial sectors and industrial production for the industrial sector. As we use
monthly data to estimate longrun relationships, we need to properly model the seasonality
present in the electricity demand data. For this, we construct a seasonal variable from what
we call the temperature response function, which is estimated nonparametrically using intra-
day temperature data, such as the measures taken every three hours. This seasonal variable
provides a temperature measure that reflects the variations in electricity demand due to the
factors related to the changes in temperature.
The resulting demand equation is then estimated by the canonical cointegrating regression
(CCR) method developed in Park (1992) to effectively deal with the endogeneity and the serial
dependence of the error introduced as we approximate TVC by a series of functions. The
validity of the proposed TVC cointegration model is examined by performing the specification
tests against the spurious regression with TVC and also against the usual FC cointegration
model, using Wald-type variable addition tests. The results support the cointegration against
3

spuriousness and TVC against the FC specification. The presence of TVC in the cointegrating
relationship also allows for more flexible formulation of ECM which may include more than
one lags of the error correction term. The usual ECM based on a FC cointegration model
is limited to include only one lagged error correction term due to the collinearity with the
lags of the error correction terms and the lagged differences of the other included variables.
Finally, we conduct an out-of-sample forecast exercise over a twelve-month forecast horizon
to evaluate the performance of our proposed TVC cointegration model, compared to those
of the FC cointegration model and the ECM derived from our TVC cointegration model.
Based on the root mean square error criterion, the TVC cointegration performed better than
the FC cointegration model for all three sectors. On the other hand, the ECM performed
better than the TVC cointegration model for the residential and commercial sectors, which
was expected since the forecast horizon is relatively short. In the industrial sector, however,
the ECM was outperformed by the TVC cointegration model, indicating that the industrial
electricity demand is more responsive to long term changes than to temporal shocks. This may
be explained by the rigidities and the constraints present in the energy market, such as the
inflexibilities of the industrial equipments to switch among different energy sources and the
limited infrastructure for the distribution of alternative energy sources.
The rest of the paper is organized as follows. Section 2 introduces the theoretical back-
ground for the TVC cointegrating regression model, the CCR methodology, and the model for
the seasonality of electricity demand along with the temperature response function. In Section
3, we present the empirical results from the estimation of the temperature response function,
the TVC cointegrating regression, the ECM derived from the TVC cointegration model and
the FC cointegration model. Also provided are the out-of-sample forecast comparison among
the three models for each sector. Finally, some concluding remarks are provided in Section 4.
2. The Model
2.1 The Time Varying Cointegrating Regression Model
The prototype electricity demand model used in the literature takes the form
dt = π + γyt + δpt + φzt + ut,
where dt denotes the demand for electricity, yt the income or production, pt the real price
of electricity, zt the variable that captures the seasonal component of the demand,2 ut the
stationary error and π, γ, δ and φ the parameters to be estimated. All of the economic variables
are expressed in natural logarithms.
2A detailed description on how to construct this seasonal variable zt is given in Section 2.3.
4

Let xt = (yt, pt, zt)0, and α = (γ, δ,φ)0. Then we may rewrite the above model as
dt = π + α0xt + ut. (1)
In this linear double-log functional form of the demand, the parameters in the vector α rep-
resents the elasticities, and they are assumed to be constant over the entire sample period
under study. However there is a possibility that the longrun relationships among the variables
change through time, especially when we are analyzing the model over a relatively long time
period. In order to take into account the time varying nature of the elasticities, we may allow
the parameters to evolve over time and accordingly specify the model as
dt = π + α0txt + ut, (2)
where the coefficients αt are now allowed to change over time.
Furthermore, given that the responses of the electricity demand to the changes in the
exogenous variables could be affected by slowly evolving factors such as the degree of economic
development or the habit persistence of the agents, it is assumed that αt changes in a smooth
way. Specifically we let
αt = α
µt
n
¶, (3)
where n is the sample size, t ∈ 0, 1, 2, ..., n and α is a smooth function defined on the unit
interval [0,1]. Note that the subscript indicating the dependence of αt on n has been suppressed
for notational simplicity. As an estimand of the function α, we define the functional
Π(α) = (α(r1), ......,α(rd))0, (4)
where ri is a number in the interval [0,1].
If the function α in (3) is sufficiently smooth, then it is well known that α can be approx-
imated arbitrarily well by a linear combination of a sufficiently large number of polynomial
and/or trigonometric functions on [0,1]. For our study, we consider the Fourier Flexible Form
(FFF) functions, which include a constant, a linear function, ϕ(r) = r, and k pairs of trigono-
metric series functions, (ϕi(r))ki=1, where each pair ϕi(r) is defined as ϕi(r) = (cosλir, sinλir)
0
with λi = 2πi. That is, we assume that the smooth function α can be approximated by the
function αk defined as
αk(r) = βk,1 + βk,2 r +kXi=1
(βk,2i+1,βk,2(i+1))ϕi(r), (5)
with βk,j ∈ R3 for j = 1, 2, . . . , 2(k + 1) and for some k. In fact, Park and Hahn (1999)
showed that the function α given in (3) can be arbitrarily well approximated by (αk) by
5

increasing the number k of the included trigonometric pairs.3 Alternatively, if we define fk(r) =
(1, r,ϕ01(r), ...,ϕ0k(r))0 with r ∈ [0, 1] and βk = (β0k,1,β0k,2, ...,β0k,2(k+1))0, the function αk defined
in (5) can be rewritten as
αk = (f0k ⊗ I3)βk, (6)
and the estimand Π(αk) as
Π(αk) = (αk(r1)0, ...,αk(rd)0)0 = Tkβk, (7)
where Tk is the matrix given by Tk = Fk ⊗ I3 with Fk = (fk(r1), ..., fk(rd))0 for k ≥ 1.Estimation of αk and Π(αk) involves the estimation of the parameters in βk, as can be seen
from (6) and (7). A natural way to estimate these parameters is to apply the ordinary least
squares (OLS) to the regression
dt = π + β0kxkt + ukt, (8)
where
xkt = fk
µt
n
¶⊗ xt,
ukt = ut + (α− αk)
µt
n
¶0xkt,
using the notations defined earlier. Note that the new error ukt includes an additional term
representing the error from approximating the original smooth function α in (3) by the series
function αk introduced in (5). From the OLS estimators βnk = (β0nk,1, β
0nk,2, . . . , β
0nk,2(k+1))
0
of βk from regression (8), the sample estimates of αk and Π(αk) can be easily obtained by
substituting βk with its sample estimate βnk in (6) and (7). They are given by αnk = (f0k ⊗
I3)βnk and Π(αnk) = Tkβnk, where the subscript n is used to make it explicitly that the
parameter estimates depend on the sample.
Park and Hahn (1999) showed that Π(αnk) is a consistent estimator of Π(α) if the number
k of the trigonometric pairs included in the series (5) increases along with the sample size n
at an appropriate rate. The required expansion rate for k is determined by the smoothness
of the function α and the moment conditions of the underlying time series. The required rate
becomes slower as the function becomes smoother or as the number of the existing moments
of the underlying time series gets smaller.4 Of course, the conditions on the smoothness of
the function α cannot be verified, since α is not observable, and therefore the validity of the
3This result holds if it is assumed that α is at least twice differentiable, with bounded derivatives on [0,1].See Park and Hahn (1999, Lemma 2).
4The explicit assumption is that k = cnr with 2/(2q − 1) < r < (p− 2)/3p, where c is a constant, n is thesample size, p is the number of moments of the underlying variables and q the number of derivatives of α. SeePark and Hahn (1999, Assumption 4).
6

resulting estimators is based on our perception of the way the time varying coefficients evolve
through time. They also showed that the convergence rate of the series estimators is n−1k,which is slower, by a factor of k, than the convergence rate of the OLS estimators for the usual
FC models.
Due to the endogeneity of the error term, the OLS estimators of the TVC cointegration
model (8) are asymptotically inefficient, and in general non-Gaussian,5 which invalidates the
standard OLS-based inferential procedures. To obtain efficient estimators and a valid inferen-
tial basis for the parameters in our TVC model (8), we employ, as in Park and Hahn (1999),
the canonical cointegrating regression (CCR) method developed by Park (1992). The CCR
method is based on the transformations of the variables that are correlated in the longrun with
the error term, which effectively remove the longrun endogeneity and the serial correlation ef-
fects in the errors. In the following section, we layout the CCR procedure for the estimation
of our TVC cointegrating model (2) or (8).
2.2 CCR Estimation
For the estimation the TVC cointegrating model (8) by the CCR method, we first construct the
required transformations for the variables dt, yt and pt using their stationary components. Let
xt = (yt, pt)0, vt = ∆xt and wt = (ut, v0t)0, where (ut) are the stationary errors in the original
TVC model (2). For the process wt, we also need to define the long run covariance matrix
Ω =P∞k=−∞Ewtw
0t−k, the contemporaneous covariance matrix Σ = Ew0w
00, and the one-sided
longrun covariance matrix ∆ =P∞k=0Ewtw
0t−k. We partition Ω, Σ and ∆ conformably with
the partition of wt into cell submatrices Ωij , Σij and ∆ij , for i, j = 1, 2. Note that Σ11 and
Ω11 represent, respectively, the short and longrun variances of the error ut.
The CCR estimation of the TVC cointegrating model (8) is based on the regression
d∗t = π + β0kx∗kt + u
∗kt, (9)
whose elements are defined by
d∗t = dt −µfk
µt
n
¶⊗∆2Σ−1wt
¶0βk − (0,Ω12Ω−122 )wt,
x∗kt =
µfk
µt
n
¶⊗ x∗t , zt
¶,
u∗kt = u∗t + (α− αk)
µt
n
¶xkt,
using the transformed nonstationary explanatory variables x∗t and the modified error u∗t givenbelow
x∗t = xt −∆2Σ−1wt, u∗t = ut − Ω12Ω−122 ∆xt,5See Park and Hahn (1999, Theorem 7).
7

where ∆2 = (∆012,∆022). We note that the longrun variance of the CCR error (u∗t ) is given by
$2∗ = Ω11 − Ω12Ω−122 Ω21, (10)
which is the conditional longrun variance of the error (ut) given the innovations (vt) of the
regressors (yt, pt)0, and is strictly less than the longrun variance Ω11 of ut, unless the regressorsare strictly exogeneous. Hence the CCR estimation, i.e., the OLS estimation of the CCR
transformed model (9), yields efficient and optimal estimators. In practice, non-parametric
methods can be employed to compute consistent estimates of Ω and ∆ using the fitted residuals
from the OLS estimation of model (8).6 Denote by π∗ and β∗nk the CCR estimators, which are
the OLS estimators of model (9). Then we may use them to obtain the efficient estimators
α∗nk = (f 0k ⊗ I3)β∗nk and Π(α
∗nk) = Tkβ
∗nk for αk and Π(α) from the relationships given in (6)
and (7). Park and Hahn (1999) demonstrated that the CCR estimator Π(α∗nk) is a consistentestimator of Π(α) and that its limit distribution is normal.7
The consistency and efficiency of the CCR estimators of the TVC cointegrating model (9)
are attained presuming that the original time varying coefficient model (2) or (8) is correctly
specified. Hence it remains to justify the adequacy of the model (2), and we will do so by
performing two specification tests proposed in Park and Hahn (1999), which are Wald-type
variable addition tests introduced originally in Park (1990). The first statistic τ∗ tests whetheror not the TVC model (2) is cointegrated against the alternative that the model is spurious.
Specifically, the test is defined as
τ∗ =RSSTV C −RSSsTV C
$2∗, (13)
where $2∗ is the long run variance estimate of (u∗t ) given in (10), and RSSTV C and RSSsTV Care the sums of squared residuals, respectively, from the CCR transformed TVC model (9)
and from the same regression augmented with s additional superfluous regressors. Under the
null hypothesis that the true model is a TVC cointegration model, the limit distribution of
the test τ∗ is a chi-square with s degrees of freedom. The basic idea underlying the test τ∗ isto exploit the tendency of the unit root processes to be correlated with superfluous variables
6Denote such residuals (ukt) and define wkt = (ukt, v0t)0. Then the components of the autocovariance function
can be estimated nonparametrically as
Ωnk =1
n
X|j|≤hn
K
µj
n
¶Xt
wktw0k,t−j (11)
∆nk =1
n
X0≤j≤hn
K
µj
n
¶Xt
wktw0k,t−j (12)
where K is the kernel function and hn the window width. Commonly used kernels, such as Barlett, Parzen orthe rectangular kernel, would lead to consistent estimators.
7See Park and Hahn (1999, Theorem 10).
8

with deterministic or stochastic trend. If indeed the model (2) is spurious, it is well known
that including such superfluous variables will significantly improve the fit of the regression, and
therefore reduce the sum of squared residuals, even when they are known to be irrelevant. On
the other hand, if the model (2) is an authentic cointegrating regression, the inclusion of such
variables will hardly affect the estimation results. The choice of the superfluous regressors
plays an important role for the actual performance of the test. In this paper, we use time
polynomials t, t2, t3, . . . , ts as superfluous regressors, following the suggestion given in Park
(1990).
To motivate the statistic we will use for testing the validity of the TVC cointegration
model (2) against the FC cointegration model (1), we note that the FC cointegration model
(1) becomes a FC spurious regression if indeed the true cointegrating relation contains time
varying coefficients. Hence, we may test for the validity of the model (2) against the FC
cointegration model (1) simply by testing whether the FC model is cointegrated. For this, we
define the statistic τ∗1τ∗1 =
RSSFC −RSSsFC$2∗
, (14)
analogously as τ∗ given in (13), where RSSFC and RSSsFC denote the sums of squared resid-uals, respectively, from the fixed coefficient cointegrating model (1)8 and from the same re-
gression augmented with s additional superfluous regressors, and $2∗ is an estimate of thelong-run variance computed from the TVC cointegrating model (9).9 Park and Hahn (1999)
showed that the statistic τ∗1 has the same limiting null distribution as τ∗, and also that τ∗1 isa consistent test which diverges under the TVC cointegrating model.
Before proceeding to estimate the demand model for the Mexican case, we discuss how we
may specify and estimate the variable zt in our TVC model (2) that captures the seasonal
component of the electricity demand.
2.3 Modeling Seasonality
We observe strong seasonality in the electricity demand, especially in high frequency data such
as monthly, which needs to be properly modelled for the consistent estimation of the demand
equation. Engle et al. (1989) have indeed shown that the parameters in a cointegrating
regression will generally be inconsistent if the seasonality is stochastic. The standard approach
to overcome such inconsistency problem has been to filter the data either by changing its
periodicity (for example, from monthly to annual data) or by taking differences of the variables
at the seasonal frequencies. The obvious consequences from using such solutions are reduction
8To deal with models with general error specifications the statistics τ∗1 are based on CCR transformed models.9They show that the use of the long-run variance from the FC model reduces the divergence rate of the
statistic, and recommend to use the more efficient estimate $2∗ computed from the TVC cointegrating model
(9)
9

in the sample size and/or elimination of some long-run variations in the level variables, which
we want to avoid due to data limitations and the slow convergence rate of the series estimators
for the parameters in our TVC cointegrating model. An alternative approach is to directly
model the seasonality by choosing a variable that captures the seasonal component of the
electricity demand. Traditional candidates for such variable are temperature related-measures
such as the number of heating and cooling days per period (for example, in a month) and the
average temperature. Certainly, this approach will neither reduce the sample size nor eliminate
the elements of the long-run variations in the data. However, this approach may introduce
the risk of incorrectly estimating the effect of temperature on the rate of electrical equipment
usage, if based on a broad temperature measure such as those mentioned above. For example,
the use of an air conditioner is determined by the high temperatures during the day time, not
by the overall daily average temperature. In this paper we take the latter approach, but with
a new and more flexible temperature measure.
We assume that the seasonality of the electricity demand is mainly due to the weather
conditions, and construct a variable that captures such seasonality using intraday temperature
data. Specifically, we model the seasonality of the electricity demand using a temperature
response function that relates seasonal variations of the demand with the current tempera-
ture levels. As a guide to construct such a function, we consider three general patterns that
characterize the influence of the temperature on electricity demand. First, we observe that
extreme temperatures, either high or low, increase the demand for electricity. This means we
would see a U-shape graph, if we plot the demand versus current temperature. Second, we also
observe that the response of the electricity demand to change in temperature is larger when
the temperature is high compared to when it is low. That is, the response of the demand is
different depending on the current temperature level. This phenomenon would be reflected in
an asymmetric U-shape graph when the demand is plotted against the temperature. Third,
when comparing the responses by sectors, we observe that the residential demand shows the
strongest responsiveness, while the industrial sector demand exhibits the weakest responsive-
ness to the same change in temperature. These general characteristics are what we attempt
to capture with a temperature response function, which will be used later to construct the
seasonal component zt of the demand. We assume that the temperature response function, say
g, takes the FFF functional form given by
g(τp) = c0 + c1τp + c2τ2p + c3 cos(2πτp) + c4 sin(2πτp) + · · · , (15)
where τp ∈ [0, 1] is the normalized temperature at time p (ideally with hourly data) andci, i = 0, 1, 2, 3, . . . , are the parameters to be estimated.
Although in principle the parameters of the above temperature response function g could
be estimated by regressing a measure of the seasonal component of the electricity demand
10

against the terms on the right hand side of equation (15), the data limitations we face gen-
erally shape the way in which those coefficients are estimated in practice. It is important to
notice that the temperature response function (15) is defined in terms of current temperature
in order to extract the information about extreme temperatures and duration. In general any
intraday data such as temperature readings taken every hour or every three hours can be used
to estimate the function g. Although temperature data are available at such high frequencies,
it is often difficult to find data for the electricity demand at a frequency higher than monthly.
Consequently, we need to come up with a new measure computed from the available temper-
ature data at the frequency that matches with the available electricity demand data. As the
required measure, we use the “expected” value of the temperature response function computed
over the period of time determined by the frequency of the demand data. It is given more
explicitly byZp∈tg(τp)ft(τp)dτp = c0 + c1
Zp∈t
τpft(τp)dτp + c2
Zp∈t
τ2pft(τp)dτp
+ c3
Zp∈tcos(2πτp)ft(τp)dτp
+ c4
Zp∈tsin(2πτp)ft(τp)dτp + · · · , (16)
where t is the period in which the demand data is indexed (for example, a month) and ft is the
density function of the temperature data over the period t. Notice that the density functions ftof the temperature data are indexed by t, indicating that we allow the temperature densities to
differ across different time periods to capture the changing weather conditions from one period
to another in the same year or across different years.
Computing the terms in equation (16) is relatively straightforward. Using intraday tem-
perature data (around 720 observations per month if the data is hourly or 240 if the data are
collected every three hours) we can estimate the densities ft by a non-parametric technique,
such as kernel estimation, at each t. Once we obtain the estimates ft for the densities, we can
easily compute the Riemann sum approximations of the integrals in the right hand side of the
expected temperature response function given in (16). Finally, the estimates for the parame-
ters in (16) are obtained by regressing the seasonal component of the electricity demand (as
will be discussed in the empirical section) against a constant term and the temperature vari-
ables represented by some of the integrals on the right hand side of the expected temperature
11
response function. That is, we estimate the regression
dst = c0 + c1
Zp∈t
τpft(τp)dτp + c2
Zp∈t
τ2pft(τp)dτp
+
qXi=1
µc2i+1
Zp∈tcos(i2πτp)ft(τp)dτp
+
qXi=1
µc2(i+1)
Zp∈tsin(i2πτp)ft(τp)dτp
¶+ εt, (17)
where dst is the seasonal component of the electricity demand, q the number of trigonometric
pairs, εt the error term, and the other variables and parameters are defined as in (16). The
OLS estimators (c0, c1, c2, . . . , c2(q+1))0 of the parameters (c0, c1, c2, . . . , c2(q+1))0 can thus bereadily obtained. With these estimators we can construct an estimate g for the temperature
response function g defined in (15) as
g(τp) = c0 + c1τp + c2τ2p + c3 cos(2πτp) + c4 sin(2πτp) + · · ·
+ c2q+1 cos(2πτp) + c2(q+1) sin(2πτp), (18)
and in turn use this to define the seasonal variable zt of our TVC model (2) as
zt =
Zp∈tg(τp)ft(τp)dτp. (19)
One advantage of our seasonality modelling described above is that it is general and flexible
enough to encompass other approaches seen in the literature. For example, the approaches
that use the first moment of the temperature distribution as their weather-related variable can
be easily formulated in our framework simply by imposing the parameter restrictions, ci = 0
for i ≥ 2, in the temperature response function (15).
3. Empirical Implementation of the Model: The Mexican Case
3.1 Description of the Data
We use the TVC cointegrating model (2) to estimate the demand for electricity in Mexico
for the residential, commercial and industrial sectors. Taking into account the fact that the
estimators of the parameters in the TVC models converge at a slower rate compared to those
in the usual FC models, we work with a relatively large sample consisting of the monthly
data from 1985:01 to 2000:05, with 185 monthly observations in total. The electricity data
are obtained from the Comision Federal de Electricidad (CFE), and include monthly sales and
12

prices.10 To identify the demand11 by sector we follow the CFE’s classification that categorizes
the customers by their energy consumption. For instance, private customers who demand low
voltage are classified into the commercial sector and those who demand medium to high voltage
are classified into the industrial sector. In the case of the residential sector, CFE has a specific
classification for these types of customers. It is important to mention that the reported CFE’s
data in general do not correspond to the energy consumption of the reported month because
of the lag between the month when the consumption was realized and the month when the
transaction was actually registered. This is mainly a result of the routine schedule of payments
followed by the government. Accordingly we adjust the demand data before the estimation of
the model.
In our study, we use a weighted average of electricity prices, since there are differences
in the prices across regions of the country and among the levels of energy consumption per
customer. Also, to analyze the impact of the price of substitute goods, such as natural gas
and diesel, we use relative prices in our regressions.12 As a proxy for the disposable income,
we use private consumption13 for the residential and commercial sectors, and an indicator
for the industrial production that includes mining, manufacturing and construction for the
industrial sector.14 Regarding the frequencies of the data, the indicators for the industrial
production are reported on a monthly basis, while the private consumption data are reported
on a quarterly basis. To work with monthly data for our estimation, we therefore transform
the quarterly consumption data into monthly, using as a pattern the behavior of the monthly
industrial production index. Finally, given that Mexico is a relatively large country, we divide
the country into five regions and collect the temperature data from their representative cities15
to obtain the input variables for the temperature response function. Although the frequencies
at which the temperature data are collected vary across regions and over time, we were able
to obtain the temperature data taken every three hours for all regions and the months covered
in our sample period.
3.2 Estimation of the Temperature Response Function
For the estimation of the temperature response function defined in (15), we need a measure
for the seasonal component of the electricity demand, and estimates for the terms in the
10The sales of the CFE represents around 80% of the total in the country. The remaining 20% of the sales isfrom Luz y Fuerza, also a stated owned company, whose data were not completely available to us.11Because the demand and supply of electricity are always in balance, we use without distinction the terms
sales and demand throughout the paper.12All prices are obtained from the components of the Producer Price Index generated by Banco de México.13Here we implicitly assume that consumers first decide the amount of their income that is saved and con-
sumed, and later they decide how much to consume of each good and service.14All the real variables are obtained from INEGI (Instituto Nacional de Estadística, Geografía e Informática).15Source of the temperature data, Comisión Federal del Agua, México.
13

Table 1: Temperature Response Functions
Residential Sector Commercial Sector Industrial SectorCoefficients t-values Coefficients t-values Coefficients t-values
c0 -0.096 -1.129 -0.241 -3.405 -0.042 -0.980c1 -1.251 -3.272 -0.188 -0.590 -0.410 -2.150c2 2.418 6.356 1.088 3.428 0.822 4.326R2 0.829 0.801 0.706
expected temperature response function given in (16). To estimate the terms in (16), we
first estimate the temperature densities by kernel estimation, and use them to approximate
the integrals in (16) for each region. Then, using the regional electricity consumption as
weight, we obtain their weighted averages over regions, and use them as the terms on the
right hand side of the expected temperature response function (16) for the whole country.
A normal kernel with optimal16 fixed bandwidth is used for the estimation of the density
functions. On the other hand, as the measure for the seasonal component of the demand,
we use the detrended series of the sectorial electricity sales, with the trend estimated as the
centered 12 month moving average of the original series. Given that all of the involved variables
are stationary, by nature (temperature) or by construction (seasonal component of demand),
standard econometric techniques are applied to estimate the parameters of the regression (17).
In light of the three general observed patterns on the ways temperature influences the
electricity demand, we find from our Mexican data that the best specification for the temper-
ature response function (15) turns out to be a simple quadratic function of temperature with
no trigonometric pair, i.e., g(τp) = c0 + c1τp + c2τ2p, for all sectors with the standardization
τp = (sp+5)/50 for the actual temperature sp at time p. The OLS estimators for the parame-
ters in the temperature response function for all sectors are presented in Table 1 and the shapes
of the functions are shown in Figure 1. To facilitate the interpretations, they are converted
as functions of the actual temperature s. Moreover, for easy comparisons across three sectoral
demands, the estimated temperature response functions are given in terms of the deviations
from the mean. If we denote by g as earlier the estimated temperature response function
of the standardized temperature, then the function g presented in Figure 1 can be written
as g(sp) = (g((sp + 5)/50) − g)/g, where g is the mean value of the estimated temperatureresponse function g, i.e., g =
R 10 g(τp) dτp.
The shapes of the temperature response functions are as expected. They show the asym-
metric U-shape in the range of temperatures that we observe, with the scale of the estimated
parameters reflecting the fluctuations of the seasonal component of the demand around its
16Optimal in the sense that it minimizes the Approximation of the Mean Integrated Squared Error (AMISE)for normal kernels.
14

-0.4
-0.2
0
0.2
0.4
0.6
0.8
1
1.2
-5 0 5 10 15 20 25 30 35 40Temperature
Dev
iatio
n fr
om th
e m
ean
(per
cent
age
poin
ts)
Residential Commercial Industrial
Figure 1: Temperature Response Functions by Sectors
mean. We illustrate in the following examples how one may interpret the results in Table 1. If
we look at the residential sector at 250C, the estimated value of the response function is 0.0281
and at 260C, 0.0617. Hence, if there is an increase in the average temperature from 250C to
260C, the expected result is that the electricity demand will grow by around 3.27 percent.17
On the other hand, if the temperature drops from 50C to 40C, the expected increase in the
demand will be only 0.74 percent. For the industrial sector, the corresponding percentages for
the same temperature references will be 1.17 and 0.18 percents, respectively, for an increase and
a drop in the current temperature by one Celsius degree. These examples show the differences
in the responses within the sector, which depend on the current temperature level, as well as
the differences across the sectors, with the residential demand being the most responsive to the
temperature variations. It is also worth noting from Table 1 that the squared temperature as
well as the level temperature are important in explaining the seasonal patterns of the demand
data. Indeed, the coefficient on the squared temperature is statistically significant, even the
one on the level temperature is not, for the commercial sector temperature response function.
3.3 Estimation of the TVC Model
In order to properly specify the model for the estimation, we first analyze the nonstationary
characteristics of the data. The presence of unit roots in the variables involved is tested using
Augmented Dickey-Fuller (ADF) test with the shortrun dynamics determined by the Schwartz
Information Criterion (BIC). According to the results reported in Table 2, there is evidence in
17Since the temperature response functions are given in terms of the deviations from their means, thepercentage effect on the electricity demand of the temperature change from s1 to s2 may be computed as(1 + g(s2))/(1 + g(s1))− 1.
15
favor of the presence of unit roots in the private consumption, the industrial production and
all the electricity demand series. The results for the price series are, however, mixed and thus
inconclusive, which is not surprising given the fact that the electricity prices in Mexico are
controlled and heavily regulated by the CFE. Based on these results, we treat the income (yt)
and demand (dt) series as known to be nonstationary variables, while we allow the price series
(pt) to be either stationary or nonstionary. Then we accordingly specify our TVC model as
dt = π + γtyt + δpt + φzt + ut. (20)
Notice that we allow the coefficient γt on the known to be nonstationary regressor yt to vary
over time to capture its evolving longrun relationship with the dependent variable dt, which
is also known to be nonstationary.18 On the other hand, the coefficient δ on the potentially
nonstationary regressor pt is modelled as a fixed parameter. We note here that the CCR
methodology, which we will use for the efficient estimation of our TVC model (20), is robust to
the misspecification about the nonstationarity characteristics of the data, as shown in Kim and
Park (1998). Thus, we may just regard the variable pt, whose nonstationary characteristics is
uncertain, as nonstationary and directly apply the CCR procedure introduced in Section 2.2.
We specify the time varying coefficient γt as a smooth function as in (5), and approximate
it by a series of functions that include a constant, a linear time trend and k trigonometric
pairs, as in ( 5). To determine the number k of the trigonometric pairs to be used in the series
estimation of the time varying coefficient γt, we use BIC to pick a parsimonious model since it
is known to favor simpler models by giving heavier penalties to the models with larger number
of parameters. The CCR transformations are based on the differences of the detrended yt and
pt, and the nonparametric estimators of the long-run variance Ω and the one-sided long-run
variance ∆ matrices defined in (11) and (12).19 Table 3 reports the results obtained after
removing the statistically insignificant variables from the models.
Before we analyze the results of our model (20), we first examine the validity of the model.
To this end, we use the specification tests τ∗1 and τ∗ introduced in Section 2.2, which areconstructed here by using four time polynomial terms (t, t2, t3, t4) as the additional superfluous
regressors. Table 4 reports the results from estimating the fixed coefficient model needed to
construct the test τ∗1, while Table 5 presents the computed test statistics τ∗ and τ∗1 for allsectors. The results of τ∗1 clearly show that the FC cointegrating model is rejected in favor18Working with logs of the series, γt can be regarded as the “instantaneous elasticity” of dt with respect to
yt. To see this, notice that taking the total differential and fixing pt and zt we have
ddt = γtdyt + ytdγt orddtdyt
= γt +ytdyt
dγt
As ∆t→ 0, dγt → 0 faster than dyt → 0 (due to the smoothness assumption on γt) and therefore ddt/dyt → γt.19For the nonparametric estimation, we used the Parzen window with the lag truncation number selected by
using the data-dependent selection rule suggested by Andrews (1991).
16
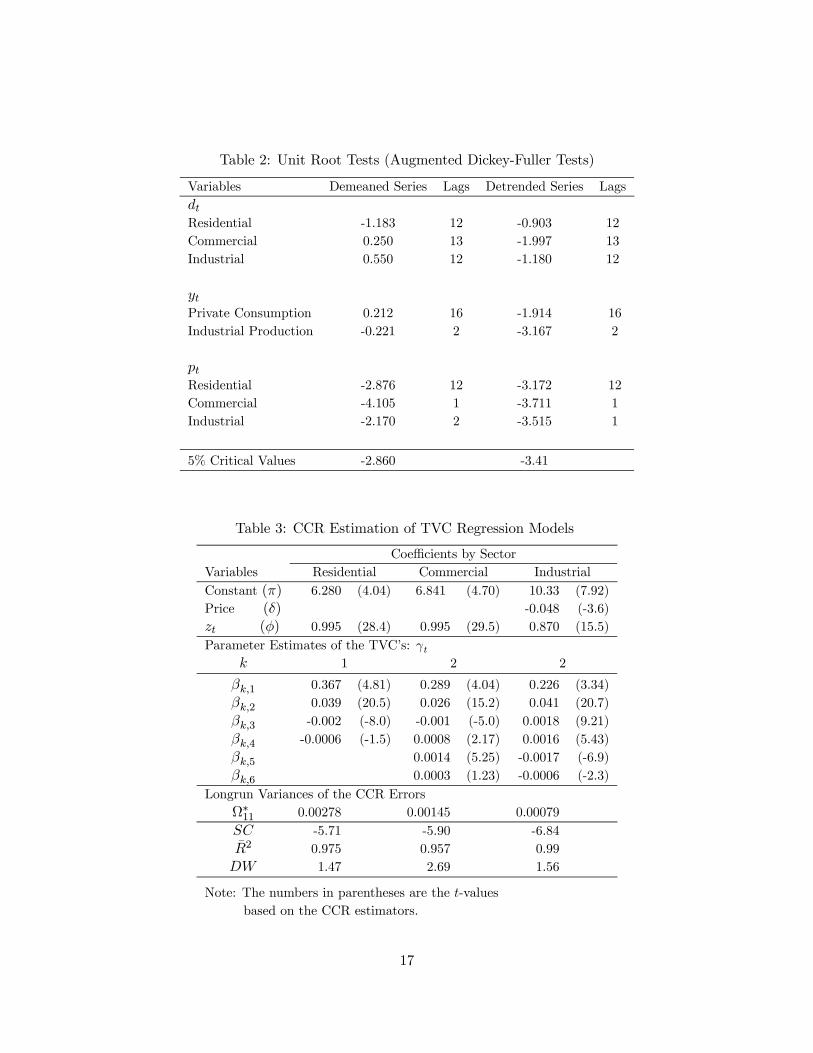
Table 2: Unit Root Tests (Augmented Dickey-Fuller Tests)
Variables Demeaned Series Lags Detrended Series LagsdtResidential -1.183 12 -0.903 12Commercial 0.250 13 -1.997 13Industrial 0.550 12 -1.180 12
ytPrivate Consumption 0.212 16 -1.914 16Industrial Production -0.221 2 -3.167 2
ptResidential -2.876 12 -3.172 12Commercial -4.105 1 -3.711 1Industrial -2.170 2 -3.515 1
5% Critical Values -2.860 -3.41
Table 3: CCR Estimation of TVC Regression Models
Coefficients by SectorVariables Residential Commercial IndustrialConstant (π) 6.280 (4.04) 6.841 (4.70) 10.33 (7.92)Price (δ) -0.048 (-3.6)zt (φ) 0.995 (28.4) 0.995 (29.5) 0.870 (15.5)Parameter Estimates of the TVC’s: γt
k 1 2 2
βk,1 0.367 (4.81) 0.289 (4.04) 0.226 (3.34)βk,2 0.039 (20.5) 0.026 (15.2) 0.041 (20.7)βk,3 -0.002 (-8.0) -0.001 (-5.0) 0.0018 (9.21)βk,4 -0.0006 (-1.5) 0.0008 (2.17) 0.0016 (5.43)βk,5 0.0014 (5.25) -0.0017 (-6.9)βk,6 0.0003 (1.23) -0.0006 (-2.3)
Longrun Variances of the CCR ErrorsΩ∗11 0.00278 0.00145 0.00079SC -5.71 -5.90 -6.84R2 0.975 0.957 0.99DW 1.47 2.69 1.56
Note: The numbers in parentheses are the t-valuesbased on the CCR estimators.
17

Table 4: CCR Estimation of FC Regression Models
Coefficients by SectorVariables Residential Commercial IndustrialConstant (π) -25.82 (-9.64) -15.73 (-16.84) -9.99 ( -7.80)Price (δ) -0.44 (-3.47) -0.07 (-1.09) -0.25 (-5.82)Income (γ) 1.95 (14.93) 1.40 (30.80) 1.29 (19.57)zt (φ) 0.70 (5.09) 0.83 (11.63) 0.43 ( 1.59)Longrun Variances of the CCR Errors
Ω∗11 0.0406 0.0068 0.0203SC -4.212 -5.041 -5.028R2 0.875 0.875 0.928DW 1.097 1.867 0.923
Note: The numbers in parentheses are the t-valuesbased on the CCR estimators.
Table 5: Specification Tests
Sectors τ∗1 τ∗
Residential 663.97 6.74Commercial 438.73 2.47Industrial 1042.36 11.66
1% Critical Values 13.28 13.28
of the time varying coefficient (TVC) cointegrating model (20). The statistic τ∗ also suggeststhat the TVC model is well cointegrated in all sectors at one percent significance level. The
evidence is especially strong for the commercial and residential sectors. Notice that in the case
of the fixed coefficient model, which specification was rejected, the elasticity of the electricity
demand with respect to the income or production is higher than one, and the price elasticity is
significant in the residential and industrial sector. Now that our TVC model (20) is tested to be
an authentic cointegration model, we may now meaningfully interpret the coefficient estimates
reported in Table 3 as the parameters of the longrun relationships among the variables.
We first note that contrary to the results of the fixed coefficient model, the parameter esti-
mates for the prices are not statistically significant in the demand functions for the residential
and commercial sectors. This is still the case even when we include as explanatory variables
the indices for the relative electricity prices with respect to the prices of its close substitutes,
such as natural gas for domestic use. One possible explanation for this finding is the price dis-
tortions from the government subsidies to the electricity prices. Indeed there have been large
amount of governmental subsidies in most of the developing countries. In Mexico, for instance,
a government report estimates the implicit subsidies to the electricity prices during the year
18

2000 is in the amount of 4.5 billions of dollars, which amounts to an overall 31 percent subsidy
to Mexican electricity prices.20 The subsidy to the residential customers was approximately 61
percent, while the subsidy to the commercial and industrial customers was only 7 percent with
respect to the real cost of electricity. These figures justify very well the lack of explanatory
power of the prices in the residential demand for electricity. When there is large amount of
subsidy in electricity prices, prices would naturally become weak determinants of the demand
for electricity. In such cases, the factors related to electricity availability would become more
relevant.
In the commercial sector, on the other hand, much of the burden from the price increases
can be treated as cost and eventually passed on to final customers, thereby generating a
significant amount of relief for the commercial customers. This along with the lack of flexibility
to use alternative energy sources in the commercial sector may explain why the prices are not
significant determinants for the commercial demand for electricity. Also in the industrial sector,
we find that the electricity demand does not respond to the electricity prices. However, it turns
out that the industrial demand responds to the relative price with respect to the price of diesel,
although it did not respond to other relative prices related to the price of natural gas. These
findings suggest that generators run by diesel were the main back source of the electricity used
by the industrial plants for the whole sample period from 1985 to 2000. It is also consistent
with the fact that the use of the generators run by natural gas was promoted only in the last
few years. According to our results in Table 3, the price elasticity of the industrial electricity
demand is around −0.05, which is not nearly as big as those reported for other countries inearlier studies relying on the models with fixed coefficients,21 and also those produced by the
fixed coefficient model estimated from our Mexican data. See Table 4. In general it is observed
that once the TVC is introduced, the estimates for all coefficients in the electricity demand
equation become lower than those obtained from the usual FC models used in other studies
(see, Westley (1992)).
The estimated values of the time varying coefficient γt on the income variable yt are pre-
sented by sector at some representative months in Table 6, and Figure 2 plots these coefficients
for the whole sample period. One consistent result comes out of these estimations is that for
all sectors the TVC follows a predominantly increasing path during the entire fifteen years of
our study. Since the values of γt are less than one but increasing, we may say that in all sectors
the demand for electricity is becoming less inelastic with respect to the variable yt (private
consumption for the residential and commercial sectors, and industrial production for the in-
dustrial sector). This suggests either that the stock of electrical equipments and appliances was
becoming less efficient in the consumption of energy,22 or that the new ones are more intensive20SHCP, Source: La Jornada, newspaper, Mexico, March 14, 2001.21They are between -0.5 and -1. See, for instance, Westley(1992), pp 86.22For example, consider the case when the electrical equipment and appliances are becoming old.
19

Table 6: Values of the TVC’s (γt)
SectorsResidential Commercial Industrial
Coefficients Values a* b* Values a* b* Values a* b*γ1985:02 0.37 0.29 0.23γ1990:01 0.38 4.2 4.2 0.30 2.8 2.8 0.24 6.6 6.6γ1995:01 0.39 3.7 8.0 0.31 2.8 5.7 0.25 3.7 10.6γ2000:01 0.40 2.2 10.4 0.31 2.9 8.7 0.27 6.3 17.5γ2000:05 0.40 0.2 10.6 0.32 0.3 9.0 0.27 0.3 17.9
a* Increments with respect to the previous values (%)b* Accumulated increments (%)
in the use of electricity. These perspectives are related to the growth sources of the economy
and the characteristics of the stock of the electrical equipments. In any case, the changes that
have occurred in the values of the time varying income elasticities seem irreversible.
Across the sectors, however, we find remarkable differences in the behaviors of the estimated
time varying coefficients γt (income elasticities), and also in the paths they have taken over the
sample period. See Table 6. In the residential sector, the total increments in the values of the
income elasticities over the entire sample period is 10%. The path of the elasticity also shows
a clear tendency of slowing down. The increments are reduced from 4% in the first five years
of the sample to only 2.2% in the last five years, from January 1995 to January 2000. On the
other hand, the income elasticity of the commercial electricity demand increased on average
2.8% every five years, and by 8% for the entire fifteen years of the study. We observe much
more noticeable variations in the estimates for the TVC (production elasticity) in the industrial
sector. The total increments in values of the TVC here is approximately 18% over the entire
sample period, which is far greater than those in the residential and commercial sectors. In
May 2000, the last period of our sample, the value of the production elasticity reaches the
level 0.267; however, it is still much smaller than the figures reported in other studies on the
electricity demand for Latin America and the US. They report essentially unitary production
elasticity, see Westley (1992, p 87) for example.
In the industrial sector, we find similar patterns of the estimated values of the production
elasticity for two sub-periods: the first from 1985 to 1992, and the other from 1993 to 2000. In
each sub-sample, the values of the production elasticity increases rapidly for the first 3-4 years,
but the increments become smaller for the subsequent years and eventually are stabilized.
In both sub-samples, the values of the production elasticity increased by around 6.5%. It
is interesting to note that the beginning of the rapid increase in the production elasticity
coincides with the periods of recession in the economy (1985 and 1993) as well as with two
20

Re s ide ntial Se ctor
0.36
0.37
0.38
0.39
0.40
0.41
1985 1987 1989 1991 1993 1995 1997 1999
Com m e r cial Se ctor
0.24
0.25
0.26
0.27
0.28
1985 1987 1989 1991 1993 1995 1997 1999
Indus tr ial Se ctor
0.20
0.22
0.24
0.26
0.28
0.30
0.32
0.34
0.36
0.38
0.40
1985 1987 1989 1991 1993 1995 1997 1999
Figure 2: Time Varying Coefficients by Sector
21

events that significantly impacted the industrial structure: the inclusion of Mexico to the
General Agreement on Tariff and Trade (GATT) in 1985 and the negotiation of the North
America Free Trade Agreement (NAFTA) in 1993. The recessions may have been reflected in
low production levels that did not allow an efficient use of the electrical equipments. If that
was the case, then the electricity demand response is different depending on the state of the
economy: the increment in electricity demand due to an increment in production would be
higher when the economy is in recession than when the economy is in expansion. However, the
increasing path of the production elasticity would be better explained in terms of the specific
characteristics of the industry. In this regards the inclusion of Mexico to the international trade
agreements may have triggered industrial expansion, which in turn triggered an intensive use
of electricity.
Besides its ability to allow for flexible coefficients, the TVC model also provides a tool
for forecasting the future path of the coefficients. The function that is used to model the
time varying income elasticity takes the form given in (5), which involves only deterministic
functions. Hence, we may readily obtain the time profile of the time varying coefficient, as
reported in Table 3, and use them to forecast the path of the income or production elasticity
for the forthcoming months.
3.4 ECM and Forecast Comparison
The ECM is formulated based on the TVC cointegrating model of the electricity demand
specified in (20). From the results on the CCR estimation of the TVC model (20), we first
obtain the following error correction terms
ect = dt − π∗ − γ∗t yt − δ∗pt − φ
∗zt,
which is nothing but the fitted residuals, and where the values of π∗, γ∗t , δ∗and φ
∗are reported
in Table 3. To focus our analysis on the dynamics of the electricity demand growth driven
by those of the economic factors only, we define the following mean and seasonality adjusted
demand series
dt = dt − π∗ − φ∗zt,
which extracts the component of the electricity demand explained by income/production and
prices (when they appear to be statistically significant).
Then we formulate an ECM for dt as
∆dt =
qXk=1
b1kect−k +p1Xk=1
b2k∆dt−k +p2Xk=1
b3k∆yt−k +p3Xk=1
b4k∆pt−k + εt. (21)
Note that here we may have more than one lags of the error correction term ect as the right
hand side variables. This is in contrast to the usual ECM based on a FC cointegration model,
22

Table 7: Error Correction Coeficients
SectorsResidential Commercial Industrial
Coefficient b11 -0.918 (-6.487) -0.759 (-5.526) -0.791 (-5.520)
Note: The numbers in the parentheses are the associated t-values
for which only one lagged error correction term is allowed due to the multi-collinearity problem
between its lags and the lagged differences of the other included variables. In our ECM (21),
the presence of the time varying coefficient (γt) in the lagged error correction terms (ect−k)eliminates such multi-collinearity problem. The coefficients (b1k) of the lagged error correction
terms (ect−k) characterize the adjustment path over q time periods toward the equilibriumvalue of the demand after an external shock. Thus, we are now able to learn more about the
adjustment path, including how long it takes to reach the long-run equilibrium. For estimation,
we set the lag orders p1, p2 and p3 at 12 since the data are monthly, and focus our attention on
the statistical significance of the coefficients (b1k) on the lagged error correction terms, which
are the new feature of the model. To determine the number of lags q of the error correction
terms, we estimated the model (21) for several choices of q. We found that including more
than one lag of the error correction term tends to make all the coefficients (b1k) statistically
not different from zero. However if we include only the first lag, then the coefficient b11becomes significantly different from zero with the expected negative sign, which is consistent
with a stable adjustment process toward the long run equilibrium. The result suggests that the
adjustment of the electricity demand is concentrated in the period that follows immediately
after an external shock. The value of the estimated error correction coefficient b11 and the
associated t-value are reported in Table 7 for each sector.
Finally, we conduct an out-of-sample forecast exercise for each sector to evaluate the per-
formance of our proposed TVC cointegration model (TVCCM) in (20) in relation to those of
the FC cointegration model (FCCM) in (4), and the ECM derived from our TVC cointegration
model (ECM) in (21). The data are divided into two subsets: the first set covering the obser-
vations from 1985:01 to 1999:05 is used to fit the model, and the second set, including those
from the remaining twelve months (1999:06 - 2000:05), is reserved for the forecast evaluation.
For each model and sector, the given model is estimated using the first subset of the data,
and subsequently the forecasts for the last twelve months are computed using the estimated
parameters, along with the actual data on the exogenous variables, yt, pt, and zt, and the
forecasted values of the time varying coefficients γt. The forecasts from the three competing
models, FCCM, TVCCM, and ECM, are presented in Table 8 along with the actual values of
the observed electricity demand from the second subset of the data. We also compute the root
23

Table 8: Out-of-Sample Forecast Comparison between FCCM, TVCCM and ECM
Residential Sector Commercial Sector Industrial Sector
Forecast Forecast Forecast
Period dt FCCM TVCCM ECM dt FCCM TVCCM ECM dt FCCM TVCCM ECM
1999:06 14.807 14.876 14.720 14.713 13.404 13.455 13.428 13.379 15.671 15.717 15.636 15.6411999:07 14.837 14.785 14.681 14.744 13.502 13.389 13.398 13.468 15.649 15.720 15.629 15.6161999:08 14.787 14.831 14.749 14.779 13.405 13.427 13.443 13.436 15.650 15.716 15.652 15.6761999:09 14.679 14.758 14.667 14.633 13.421 13.370 13.390 13.424 15.621 15.701 15.629 15.6161999:10 14.542 14.807 14.569 14.528 13.279 13.404 13.331 13.265 15.582 15.653 15.592 15.5961999:11 14.589 14.689 14.494 14.507 13.296 13.350 13.270 13.284 15.591 15.645 15.572 15.5751999:12 14.563 14.631 14.461 14.498 13.227 13.293 13.227 13.198 15.575 15.646 15.564 15.5232000:01 14.513 14.512 14.471 14.477 13.314 13.219 13.237 13.289 15.656 15.656 15.578 15.5722000:02 14.550 14.585 14.535 14.522 13.303 13.281 13.292 13.266 15.625 15.679 15.603 15.5842000:03 14.650 14.825 14.659 14.639 13.416 13.466 13.396 13.417 15.699 15.816 15.657 15.6412000:04 14.763 14.786 14.708 14.676 13.446 13.434 13.424 13.389 15.709 15.753 15.667 15.6502000:05 14.845 15.038 14.805 14.769 13.551 13.576 13.500 13.510 15.733 15.852 15.709 15.703
RMSE 0.119 0.071 0.062 0.067 0.047 0.030 0.073 0.033 0.043
mean square error (RMSE) for each model and sector as a basis for the comparison.
Based on the RMSE criterion, the TVC cointegration model clearly outperformed the FC
cointegration model in all three sectors. The forecasts produced by the TVCCM have much
smaller RMSE’s compared to those produced by the FCCM. Indeed, the use of the TVCCM
leads to the reduction in the RMSE by 30 to 55%. The results from comparing the models
TVCCM and ECM are, however, mixed. In the residential and commercial sectors, the ECM
predicts better the path of the electricity demand than the cointegration model, and overall
the demand forecasts produced by the ECM follow closely the observed levels. This is not
surprising since our forecast horizon is relatively short and the ECM is designed to explain the
short-run behavior better than the cointegration model which focuses on modelling long-run
relationship.
In the industrial sector, however, the TVC cointegration model performs better than the
ECM. The RMSE obtained from the TVC cointegrating model is smaller than the one from
the ECM, as it is shown in Table 8. This result suggests that the adjustment of the industrial
electricity consumption is more responsive to the long term changes than to the temporal
shocks in the industry. Part of the reason for this pattern is the inflexibility of the industrial
equipments to switch among different energy sources. Another reason may be the lack of
available alternative energy sources, such as natural gas, which is not readily available in
Mexico because of the limited infrastructure for its distribution. However, we expect that
there will be more economic incentives to adjust the industrial electricity consumption more
promptly and continuously, as the market becomes more competitive and the substitutes for
electricity become more available. An external shock would then have not only the lasting long-
24

run impact but also the short-run adjustment effect on the pattern of the industrial electricity
demand.
4. Concluding Remarks
In this paper we analyze the electricity demand for the residential, commercial and industrial
sectors in Mexico, using a new approach by Park and Hahn (1999) that allows for time varying
coefficients (TVC) in the cointegrating relationships in electricity demand equation. The de-
mand equation is specified in a double log functional form with income/production, electricity
prices and a measure for seasonal fluctuations as explanatory variables. The income/production
elasticity is in particular specified as a TVC, and with this flexibility we may model the evolving
relationship between the electricity demand and the level of income/production, which was not
possible in the previous models with fixed coefficients. To reflect the intrinsically slow changes
in the factors affecting the electricity demand, such as technology, developmental stage of the
economy and habit persistency, the TVC is modelled as a smooth function and approximated
by a series of functions. As a measure for the seasonality in our monthly electricity demand
data, we use a seasonal variable constructed from the temperature response function which is
estimated nonparametrically from intraday temperature data.
Validity of the proposed TVC cointegration model specification is tested against the alter-
natives of the spurious regression and the fixed coefficient cointegration model, using the Wald
type variable addition tests. The specification tests support the TVC cointegration model
against both of the alternatives, favoring the notion of a changing relationship between elec-
tricity demand and its main determinants over time. The resulting TVC cointegration model
is estimated by the cannonical cointegration regression method to deal with the endogeneity
and serial dependence of the error resulted from the aforementioned approximation.
We find the following three evidences from the estimation of the TVC cointegration model
for the electricity demand. First, the inclusion of the TVC in the model significantly reduces
the levels of the estimated coefficients, which represent the elasticities, compared to those
obtained from the usual fixed coefficient models. In particular, the income/production elasticity
is substantially less than unity for all sectors, indicating that the demand is inelastic with
respect to the changes in income/production in all sectors. This is quite surprising, since
many earlier studies in the literature reported that the income/production elasticity of the
electricity demand is near unity. Second, in the last fifteen years such elasticities have taken
predominantly increasing paths in all sectors, and do not show any evidence of returning to
their previous levels. Third, once we assume a TVC in the demand equation, price becomes
statistically irrelevant as an explanatory variable for the long run behavior of the electricity
demand, except for the industrial demand which weakly responded to the relative price of
25

electricity with respect to the price of diesel. The lack of explanatory power of the prices in
the electricity consumption of the residential and commercial sectors may be explained by the
rigidities of the prices which have been determined and heavily subsidized by the government.
A direct consequence of having a TVC in the cointegration model is that the derived ECM
can now include more than one lags of the error correction terms, thereby allowing us to learn
more about the adjustment path toward the long-run equilibrium. Presence of a TVC in the
error correction terms eliminates the multicollinearity problem observed in the usual ECM
based on the fixed coefficient model. We finally conduct an out-of-sample forecast comparison
between the TVC cointegrating model, the ECM derived from the TVC cointegration model
and the usual fixed coefficient model. As expected, the TVC cointegrating model outperforms
the fixed coefficient model in forecasting electricity demand for the twelve-month horizon in
all sectors: sometimes reducing the root mean square error by more than 50%. Moreover,
the ECM outperforms the TVC cointegrating model in the residential and commercial sectors,
and this is also well expected since the forecast horizon is relatively short. However, the TVC
cointegrating model performs better than the ECM in the industrial sector, which may be
explained by the inflexibilities in the industrial equipments to swich among different energy
sources and the limited infrastructure for the distribution of the alternative energy sources,
hindering the industrial demand to adjust quickly.
References
[1] Andrews, D.W.K. (1991). “Heteroskedasticity and autocorrelation consistent covariancematrix estimation,” Econometrica 59: 817-858.
[2] Beenstock, M., E. Goldin and D. Nabot (1999). “The demand for electricity in Israel,”Energy Economics 21: 168-183.
[3] Bentzen, J. and T. Engsted (1993). “Short and long-run elasticities in energy demand: acointegration approach,” Energy Economics 15: 9-16.
[4] Chang, H. and Y. Hsing (1991). “The demand for residential electricity: new evidence ontime-varying elasticities,” Applied Economics 23: 1251-1256.
[5] Engle, R.F. and C.W.J. Granger (1987). “Cointegration and error-correction: representa-tion, estimation and testing,” Econometrica 55: 251-276.
[6] Engle, R.F., C.W.J. Granger and J.S. Hallman, J.S. (1989). “Merging short and long-runforecasts: an application of seasonal cointegration to monthly electricity sales forecasting,”Journal of Econometrics 43: 45-62.
[7] Halvorsen, B. and B. Larsen (2001). “The flexibility of household electricity demand overtime,” Resource and Energy Economics 23: 1-18.
[8] Hass, R. and L. Schipper (1998). “Residential energy demand in OECD-countries and therole of irreversible efficiency improvements,” Energy Economics 20: 421-442.
26

[9] Johansen, S. (1988). “Statistical analysis of cointegrating vectors,” Journal of EconomicDynamics and Control 12: 231-54.
[10] Johansen, S. (1991). “Estimation and hypothesis of cointegration vectors in gaussian vec-tor autoregressive models,” Econometrica 59: 1551-80.
[11] Kim, C. and J.Y. Park (1998). “Efficient Estimation of Models with Unknown Mixtures ofStationary and Integrated Time Series," Journal of Economic Theory and Econometrics4: 69-103.
[12] Park, J.Y. (1992). “Canonical Cointegrating Regressions," Econometrica 60: 119-143,1992.
[13] Park, J.Y. and S.B. Hahn (1999). “Cointegrating regressions with time varying coeffi-cients,” Econometric Theory 15: 664-703.
[14] Phillips, P.C.B. (1986). “Understanding spurious regressions in econometrics,” Journal ofEconometrics 33: 311-340.
[15] Silk, J. I. and F. Joutz (1997). “Short and long-run elasticities in US residential electricitydemand: a cointegration approach,” Energy Economics 19: 493-513.
[16] Westley, G.D. (1992). “New directions in econometric modeling of energy demand. Withapplications to Latin America,” Inter-American Development Bank, the John HopkinsUniversity Press.
27
Copyright © 2022 FDOKUMEN