Electrically Elicited Force Response Characteristics of ... - MDPI
Upload
independentCategory
view
0download
0
1
The following article appeared in Applied Physics Letters (American Institute of
Physics) and may be found at A. B. Golovin, O. D. Lavrentovich, Appl. Phys. Lett.
95, 254104 (2009).
Copyright (2009) American Institute of Physics. This article may be downloaded
for personal use only. Any other use requires prior permission of the author and the
American Institute of Physics.
Electrically Reconfigurable Optical Metamaterial Based on
Colloidal Dispersion of Metal Nano-Rods in Dielectric Fluid
Andrii B. Golovin1 and Oleg D. Lavrentovich
1,2
1Liquid Crystal Institute and
2Chemical Physics Interdisciplinary Program,
Kent State University, Kent, Ohio, 44242.
E-mail: [email protected]
Optical metamaterials capture the imagination with breathtaking promises of nanoscale resolution in
imaging and invisibility cloaking. We demonstrate an approach to construct a metamaterial in which metallic
nanorods, of dimension much smaller than the wavelength of light, are suspended in a fluid and placed in a
nonuniform electric field. The field controls the spatial distribution and orientation of nanorods because of
the dielectrophoretic effect. The field-controlled placement of nanorods causes optical effects such as varying
refractive index, optical anisotropy (birefringence), and reduced visibility of an object enclosed by the
metamaterial.

2
Optical metamaterials represent artificial composites with metal and dielectric
elements intertwined at subwavelength scale. Different spatial architectures lead to
fascinating optical properties such as negative refraction, subwavelength imaging, and
cloaking [1-5]. Typically, the metastructures are fabricated by a nano lithography approach
that has limited applicability when complex three dimensional (3D) arrangements or
switching are required. So far, only two-dimensionsl (2D) non-switchable structures have
been produced [4,5].
We demonstrate that 2D and 3D reconfigurable optical metamaterials can be produced
by applying a non-uniform AC electric field to a dispersion of gold (Au) nanorods (NRs) in
an isotropic dielectric fluid. Previously, manipulation in a non-uniform field, also known
as dielectrophoretic effect [6], was demonstrated for metal nanowires of much larger supra-
micron length, see, e.g., [7-11]. We show that the dielectrophoretic control of NRs that are
only (50-70) nm long, leads to optical effects such as spatially varying refractive index,
birefringence and reduced visibility of an object enclosed by the metamaterial.
We used two sets of Au NRs: (1) “long” NRs with average diameter d =12 nm, length
L =70 nm, and an absorption peak due to the longitudinal plasmon at ~1050 nm and (2)
“short” NRs, d =20 nm, L =50 nm, and an absorption maximum at ~725 nm. The short
NRs are well suitable to explore the spatial distribution and orientation of NRs through
light absorption while the long NRs are better suited to observe cloaking and birefringence
effects in the visible part of spectrum. The NRs, functionalized with polystyrene (PS) [12,
13] were dispersed in toluene with a refractive index tn 1.497 at 589 nm . The
volume fraction of NRs was (4-8) 410 . We experimented with flat and cylindrical cells;
the latter produce 3D configurations similar to the optical cloak of Cai et al. [3].

3
(1). A flat cell is formed by two glass plates, confining two mutually perpendicular
electrodes, Figs.1. The ground electrode (3) is a copper wire of diameter 2 =3μma in a
borosilicate glass shell of diameter 20 m that determines the separation between the glass
plates. The second electrode (2) is a similar wire, connected to the waveform generator,
with the glass shell etched out along the last portion, about 1 mm long, near the electrode’s
tip. The cell is filled with the dispersion of Au NRs in toluene and sealed.
At zero voltage, the NRs are distributed uniformly across the area and show no
alignment. In crossed polarizers, the texture is dark, Fig.1(b). When the AC voltage
rms=170 VU , frequency f 100 kHz is applied, the Au NRs, being more polarizable than
toluene, move into the regions of high electric field and align, creating an optically
birefringent cloud near the electrode (2), Fig.1(d). By inserting an optical compensator one
establishes [14] that in the birefringent region, the index of refraction for light polarized
perpendicular to the electrode (2) is smaller than for parallel polarization, || 0n n n ,
consistent with the alignment of NRs along the field, Fig.1(c). The latter is also confirmed
by absorption of linearly polarized light near the peak of longitudinal plasmon absorption.
To characterize the concentration variation of NRs along the axis x crossing the
electrode (2) near its tip, Fig.1(d), we measured the transmittance ||T of linearly polarized
(along x ) light as a function of x . The wavelength was chosen at 460 nm, for which the
anisotropy of light absorption is small, so that the variation of ||T is determined mostly by
the concentration gradients. We determine the ratio ||
0 ||,0
ln
ln
UT xx
k xT
as the

4
measure of how much the local filling factor U x of Au NRs in the field is larger than
the filling factor 0 const in zero field. The spatial variation k x clearly indicates that
the NRs are accumulated in the region of high field, Fig.2(a). The maximum k is ~20,
corresponding to ~U 0.01 0.02 , Fig.2(a) [15].
To quantify birefringence near the electrode, maxn , we selected a small circular region
of diameter 5 μm (marked in Fig.1(d)), centered at the point of the maximum k x and
measured transmission of light polarized parallel to the x axis ( ||T ), perpendicular to it (T
) and at the angle of 45 degrees ( 45T ), as the function of , and calculated the quantify
4514
cos2 2
II
II
T T T
T T
, Fig.2(b). is a quantitative equivalent of the true optical
retardation of an absorbing material [16] ( would represent a true retardation if all NRs
are aligned in the plane of the cell). is significant, reaching (-190) nm at 650 nm,
Fig.2(b). By approximating as maxh n , where h (2-4) μm is the effective pathway of
light trough the assembled NRs, one estimates max ~ / ~ 0.1 0.05n h at 650 nm
, comparable to birefringence of liquid crystals [14]. When the electric field is on, n x
changes from 0n at large distance 10μmx from the electrode surface, to
max ~ 0.1 0.05n at 1μmx ; for smaller 1μmx , the value of n x might drop
again because of the apparent depletion effect [15]. In the field off state, 0n for all
distances x . The gradients created by the field-induced concentration and orientation of

5
NRs near the central electrode are sufficient to cause experimentally observed effects in the
cylindrical cells described below.
(2). Cylindrical capillary. A cavity of diameter 14 μm in a cylindrical glass capillary
of diameter 57 μm is filled with a dispersion of Au NRs, Figs.3 and 4. The electric field is
created by coaxial cylindrical electrodes, one being a copper wire (2) of diameter 2 =3μma
running along the axis and the second one formed by a transparent indium tin oxide (ITO)
deposited on the external surface (3) of the capillary. The radial field 1/rE r decreases
with the distance r a from the wire. The field accumulates and aligns the NRs near the
central electrode (2), Figs.3 (b) and 3 (c).
The most striking optical feature is that the applied field weakens the shadow of non-
transparent central electrode (2), observed in the orthoscopic mode under the microscope
with parallel polarizers. The effect is wavelength and polarization dependent. Fig.3(d)
shows light transmittance for the red component of the RGB signal measured by the video
camera, 550-700 nm . The shadow reduction is noticeable for light polarized
perpendicularly to the capillary, see Fig. 3(d) and video Fig.4 but not for parallel
polarization, Fig.3(e). The effect in Fig.4 is an “imperfect” experimental version of the
cloak model proposed by Cai et al. [3]. The local refractive index changes from a smaller
value ||n x n near the central electrode, to a larger value || tn n n at the periphery.
This index gradient bends the light rays around the electrode, thus reducing its visibility.
Propagation of light with parallel polarization is hardly affected by the electric field, as
tn n const .

6
The contribution of Au NRs to the effective ||n can be roughly estimated as
2 2
|| 1 U t U NRn n n , where 2
NRn is the (real part of) dielectric permittivity of Au at
optical frequencies, e.g., 2 20NRn at 700 nm [17] (NRs do not change n tn , since
their response to the perpendicular light polarization is weak [3]). For U 0.01 0.02 ,
one finds || 1.34 1.42n and thus 0.16 0.09n , similar to the experimental data.
If PS is aligned around the NRs, it can influence n , too. For stretched PS,
0.0006PSn [18]. If the entire 20 μm thick cell is filled with such a birefringent PS, its
phase retardation would contribute only about 12 nm to the much larger values of in
Fig.2(b).
Let us estimate the dielectrophoretic force acting on a NR. In dipole approximation [6],
* *22
,*Re
8
NR tDEP t e rms
t
F d L E
, where 2 /8d L
23 3~ 10 m, 02.4t ,
12
0 8.854 10 C/(Vm) , 2 2 2* *
* 2 2 2Re
NR t t NR t tNR t
t t t
is the real part
of the function of complex permittivities * /i of the NR and the medium
(subscripts “NR” and “t”, respectively), is conductivity, 2 f . With 06.9NR ,
74.5 10 S/mNR [16], 11~ 5 10 S/mt
[19],
510 Hzf , 6~10 V/meE , and the scale
of gradients 10 100 μm , one estimates ~ 10-100 pNDEPF , above the random forces of
Brownian nature, ~ ~ 0.1-1 pNBk TF
d at room temperature T . Note that field-induced

7
condensation of NRs takes place over extended regions of space; it is also reversible, as the
NRs randomize their orientation and position once the field is switched off. The structures
in Figs.1(d) and 3(c)-3(e) are stationary: once established within a few seconds after the
field is applied, they do not evolve if the field is kept constant. These features suggest that
the NRs repel each other. The natural mechanisms are steric and electrostatic; they exist
even when the field is zero. An interesting source of repulsion is the external field itself: the
field-induced dipoles in NRs repel each other if the NRs are located side-by-side.
Experiments above demonstrate that a non-uniform electric field applied to a colloidal
dispersion of submicron Au NRs, is capable of concentrating the particles in the region of
the maximum field and also to align them parallel to the field. The effect induces gradient
refractive index for polarized light that is decreasing from the high-field region to the low-
field region. In the cylindrical sample, the effect represents an imperfect experimental
realization of the theoretical cloak model proposed by Cai et al. [3], as evidenced by a
mitigated shadow of a non-transparent object, in our case the central electrode (2), see
Figs.3, 4 and Ref. [20].
This work was supported by DOE DE-FG02-06ER46331 and AFOSR MURI
FA9550-06-1-0337 grants. We thank N.A. Kotov and P. Palffy-Muhoray for providing us
with Au NRs dispersions; A. Agarwal, J. Fontana, P. Luchette, H.-S. Park, B. Senyuk, H.
Wonderly, and L. Qiu for help in sample preparations. We thank P. Palffy-Muhoray, V. M.
Shalaev, C. Y. Lee, A. V. Kildishev, S.V . Shiyanovskii and V. P. Drachev for fruitful
discussions.

8
References
1. J. B. Pendry, D. Schurig, D. R. Smith, Science 312, 1780 (2006).
2. U. Leonhardt, Science 312, 1777 (2006).
3. W. Cai, U. K. Chettiar, A. V. Kildishev, V. M. Shalaev, Nature Photonics 1, 224
(2007).
4. I. I. Smolyaninov, Y. J. Huang, C. C. Davis, Optics Letters 33, 1342 (2008).
5. J. Valentine, J.S. Li, T. Zentgraf, G. Bartal, X. Zhang, Nature Materials 8, 568 (2009).
6. H. Morgan, N. G. Green, AC Electrokinetics: Colloids and nanoparticles (Research
Studies Press Ltd., Baldock, England (2003).
7. P. A. Smith, C. D. Nordquist, T. N. Jackson, T. S. Mayer, B. R. Martin, J. Mbindyo,
and T. E. Mallouk, Appl. Phys. Lett. 77, 1399 (2000)
8. H. W. Seo, C. S. Han, S. O. Hwang, J. Park, Nanotechnology 17, 3388 (2006).
9. S. J. Papadakis, Z. Gu, D.H. Gracias, Appl. Phys. Lett. 88, 233118 (2006).
10. B. Edwards, N. Engheta, S. Evoy, J. Appl. Physics 102, 024913 (2007).
11. J.J. Boote, S.D. Evans, Nanotechnology 16, 1500 (2005).
12. J. Fontana, A. Agarwal, N. Kotov, and P. Palffy-Muhoray, American Physical Society
March Meeting, Pittsburgh, PE, 16 March 2009.

9
13. Z. Nie, D. Fava, E. Kumacheva, S. Zou, G.C. Walker, M. Rubinstein, Nature Materials
6, 609 (2007).
14. M. Kleman, O. D. Lavrentovich, Soft Matter Physics: An Introduction (Springer New
York, 2003), pp. 96-98.
15. Interestingly, k x decreases near the very surface of electrodes, which might indicate
a NR-depleted thin layer associated with osmotic or electrostatic surface effects.
16. Yu. A. Nastishin, H. Liu, T. Schneider, V. Nazarenko, R. Vasyuta, S. V. Shiyanovskii,
O. D. Lavrentovich,. Phys. Rev. E 72, 041711 (2005).
17. I. El-Kady, M. M. Sigalas, R. Biswas, K. M. Ho, C. M. Soukoulis, Phys. Rev. B 62,
15299 (2000).
18. M. Jiao, S. Gauza, Y. Li, J. Yan, S. T. Wu, T. Chiba, App. Phys. Lett. 94, 101107
(2009).
19. M. V. Sapozhnikov, Y. Tolmachev, I. S. Aranson, W.K. Kwok, Phys. Rev. Lett. 90,
114301 (2003).
20. See EPAPS supplementary material at A. B. Golovin, O. D. Lavrentovich, Appl. Phys.
Lett. 95, 254104 (2009) for the detailed experimental procedures and electrically
controlled optical effects.
10
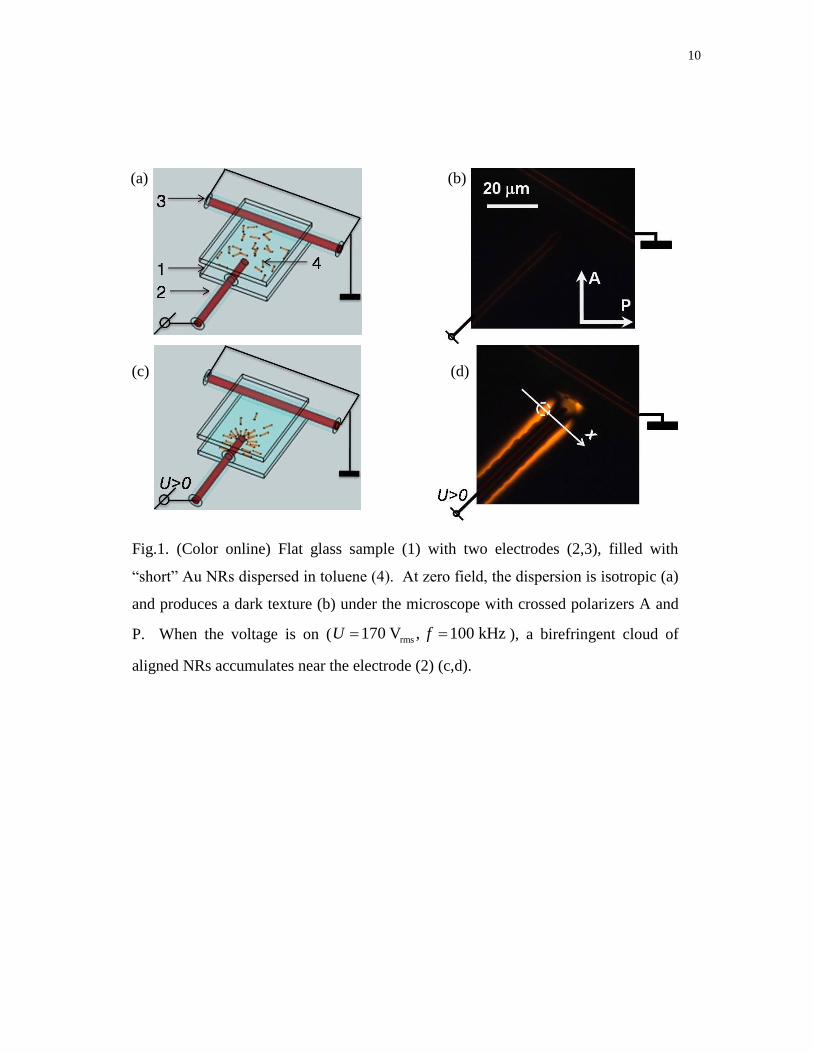
Fig.1. (Color online) Flat glass sample (1) with two electrodes (2,3), filled with
“short” Au NRs dispersed in toluene (4). At zero field, the dispersion is isotropic (a)
and produces a dark texture (b) under the microscope with crossed polarizers A and
P. When the voltage is on ( rms170 V , 100 kHzU f ), a birefringent cloud of
aligned NRs accumulates near the electrode (2) (c,d).
(a) (b)
(c) (d)

11
Fig.2. (a) Applied voltage rms170 V , 100 kHzU f causes an increase in the
filling factor that changes along the axis x marked in Fig.1(d); data are presented
for “short” NRs; (b) the “long” NRs assembly is birefringent near the electrode (2);
the effective optical phase retardation is measured as a function of in the
circular region marked in Fig.1(d).
(a) (b)

12
Fig.3. (Color online) (a) Cylindrical glass capillary (1) with an axial copper wire
electrode (2) and a transparent electrode at the outer surface (3), filled with “long”
Au NRs in toluene (4), and fixed in polymerized optical adhesive (5). Microscope
textures (parallel polarizers) of a capillary filled with the long NRs when the field is
off (b) and on, rms170 V , 100 kHzU f (c). Electric field-induced redistribution
of Au NRs changes the profile of light transmission through the capillary for the light
polarization E perpendicular to the capillary (d), but not for E
parallel to the
capillary (e). Red trace: field on, black dashed trace: field off.
(a) (b) (c)
(d) (e)

13
U=0 U=170 Vrms, f=100 kHz
Fig.4. (Color online) Two frames of a video file demonstrating periodic change in
visibility of the central electrode (2) in a cylindrical capillary (1) filled with
dispersion of “short” Au NRs in toluene, under the applied voltage 170 Vrms, 100
kHz, modulated with a frequency of 0.5 Hz. Observation under the microscope with
light polarized normally to the capillary axis. The corresponding video file is
available at aip.org.
1
2

14
Supplementary Information
Materials and Methods
We used borosilicate glass round capillaries (GW Lab, Canoga Park, California),
refractive index at =588 nm (close to ), with outer diameter 57 m and
inner diameter 14 m. A thin conductive layer of ITO was deposited at the outer surface
(Genvac AeroSpace Inc.). The second electrode was a copper wire of diameter 3 (GW
Lab) inserted into the capillary along the axis. The sample was fixed at 1 mm thick
borosilicate glass substrates by a clear optical adhesive NOA76 (Norland) with a matching
refractive index . The ends of capillary were sealed by epoxy glue to slow down
evaporation of toluene.
Nikon polarizing microscope Eclipse E 600, Nikon objective (Plan Apo 60xA/1.40 Oil,
DIC H, /0.17, WD 0.21), CCD camera Hitachi HV-C20U-S4, and Nikon photometry
system G70 with photo-detector P100S were used for optical measurements. Images
captured by CCD camera were analyzed with a computer program Image-Pro Plus 6.2
(Media Cybernetics Inc.). Arbitrary waveform generator Keithley 3390 50 MHz and
wideband amplifier Krohn-Hite 7602M were used to apply AC sinusoidal voltage
waveform.
Fig.S1. Transmission electron microscope image of dried “long” Au NRs (a).
Absorption spectra of toluene dispersions of “long” (b) and “short” (c) Au NRs. The
spectrum (b) was measured by Dr. P. Luchette.
1.517n tn
m
1.51n

15
Fig.S2. (Color online) A flat glass cell (1) with two mutually perpendicular electrodes (2, 3),
filled with “short” Au NRs dispersed in toluene (4) when the field is off (a, b) and on (c, d).
Orientation of Au NRs is random when the field is off (a, b). When the field is on (
rms170 V , 100 kHzU f ), the NRs accumulate in the regions of the highest field, near
the vertical electrode (c, d). The effect is evident when the cell is observed in linearly
polarized light with wavelength 700 nm, close to the longitudinal absorption peak for “short”
NRs, see Fig. S1(c). When the field is on, and the polarization E of light is horizontal, the
condensed and aligned NRs are seen as a dark cloud around the vertical electrode, right part
of (d). Only a portion of this cloud is visible when E is vertical, left part of (d); since E is
normal to most of NRs in this case. No clouds of NRs are observed when the field is off,
regardless of light polarization (b).
Fig.S3. (Color online) (a) Polarizing microscopy texture of a flat cell when there is no field;
the “short” Au NRs dispersion is isotropic and appears dark between the crossed analyzer
and polarizer. The applied electric field creates a birefringent zone around the electrode
(b,c), as observed in the regime of crossed polarizers (b) or crossed polarizers with an optical
compensator, a 530 nm waveplate (c).
(a) (b) (c) (d)

16
Fig.S4. (Color online) Polarizing microscopy of a capillary similar to the one in Fig.3 but
filled with “short” Au NRs when the electric field is off (a) and on (b).
Green (480-610) nm
Fig.S5. (Color online) The effect of enhanced visibility of an object placed behind the
switchable metamaterial. The object is a stripe pattern of a cured photoresist Shipley S1818
on a flat glass plate. The capillary with toluene dispersion of “long” Au NRs is placed
directly on top of it. The axis is drawn along the axis of the electrode. The stripe pattern
is observed through the capillary, with linearly polarized light, under an optical microscope,
when the voltage is off (a) and on, rms170 V , 100 kHzU f (b). At zero voltage, the
central electrode (2) blocks the image of the stripes beneath it (a). However, once the field is
applied, the visibility of stripes is enhanced (b,c), as evidenced by the profile of light
transmittance along the axis of electrode (c). Similarly to the experiment in Fig.3, the
gradient refractive index bends the optical rays around the obstacle (the central electrode),
reducing its shadow.
y
Copyright © 2022 FDOKUMEN