Electrical Network’s Modeling & Simulation Tools: The State of the Art. (Case Study of NMSS...
12
Journal of Electrical and Control Engineering JECE JECE Vol. 3 No. 5, 2013 PP. 1-12 www.joece.org/ © American V-King Scientific Publishing 1 Electrical Network’s Modeling & Simulation Tools: The State of the Art. (Case Study of NMSS platform). TAMALI Mohammed *1 , ALLALI Malika 2 , BOUZIDI Boumediene 3 , & TOUMI Toufik 4 ENERGARID Lab./Bechar University, URER/MS Adrar, Algeria, SONELGAZ Bechar, Algeria Po Box 417, Kenadsa St., Bechar, Algeria *1 [email protected]; 2 [email protected]; 3 [email protected]; 4 [email protected] Abstract: Scientific Software are classified into three categories, business-specific tools designed by company itself and for its proper needs and uses, industrial products planned and designed for general/commercial uses and finally those institutional designed by academic institutions depending on research need of their laboratories. For the first category, platform should meet purely localized and specific tasks of company. Generally used by company itself and named proprietary solution. Second category, tools are planned and manufactured to meet a lot of tasks. These platforms are a licensed solution. Third case is an institutional category where specific codes are written first to meet a specific need in a very specialized problem and then supercharged with additional modules in next versions and updates until a complete software would be born. These are called institution-made solution. Our paper discusses in a general overview about structural and functional characteristics of commonly used software for modelling & simulation of electrical networks. Solutions from the three categories are studied and their main features are described and compared according to criteria of performance evaluation. We introduce later, our NMSS solution (Network Modelling & Simulation System). The modules and their functionalities are exposed to highlight similarities and disparities with other solutions. Keywords: Modelling; Simulation; Numerical Library; GUI Software Component; Electrical Network I. INTRODUCTION The proposal of a specialized product may, in most occasions, be more general and meets to a part of the customer's request. Therefore, the client uses must comply with the conditionings of the platform. In case of an academic solution, it should be noted that the need for a development team is much needed. Major obstacle to initiate research, since no support and stimulation are observed unless this represents a major topic of tasks to be performed by research Laboratory. Many software products for modelling and simulating electrical networks already exist. Products efficiency, used to design an eventual electrical network is significantly dependent on modules set to predict the behavior of studied system under normal or abnormal operating. Manual evaluation is possible for small electrical systems but is expensive in engineering time. In addition, the manual computation methods are not obvious for safety reasons and under cases where the all design is much more expensive and requires more efforts. The consequences of a faulty design of electrical network model can induce: • Danger threatening human lives if adopted. • Increase of total costs of design and its implementation. • Poor Reliability/robustness of outcomes • High costs for repair operations and maintainability. • Causing damage to the network (incorrect decision due to misalignment of the load level with respect to supply request). For designing reliable electrical networks, engineer needs specialized potential human resources and appropriate set of tools. Modern numerical methods provide a fast and accurate calculation of electrical system behaviours and network topologies, once data and parameters were given to platform running required software. Study of electrical network can be quite large and it is very desirable that the engineer has a reliable software tool that uses GUI to acquire data. In the same way, engineer must have access to calculation results in a clear, and unambiguous report. In this paper, we examine some-well known platforms software issued from academic and/or commercial category and designed by professionals of electrical engineering field and their development team. These teams have acquired practice over the time. Software products are presented in what follows without any classification or preference ordering but just an enumeration as an example. Notifications of characteristics are even reported. NMSS, a solution we developed is exposed and compared according to the same criteria. II. EVALUATION CRITERIA MODEL Software tools studied are technically compared under the following criteria and recommendations: - The Graphical User Interface, GUI - Accessibility to visual components - Modularity of all platform
-
Upload
univ-bechar -
Category
Documents
-
view
1 -
download
0
Transcript of Electrical Network’s Modeling & Simulation Tools: The State of the Art. (Case Study of NMSS...
Journal of Electrical and Control Engineering JECE
JECE Vol. 3 No. 5, 2013 PP. 1-12 www.joece.org/ © American V-King Scientific Publishing
1
Electrical Network’s Modeling & Simulation Tools: The State of the Art. (Case Study of NMSS platform).
TAMALI Mohammed*1, ALLALI Malika2, BOUZIDI Boumediene3, & TOUMI Toufik4 ENERGARID Lab./Bechar University, URER/MS Adrar, Algeria, SONELGAZ Bechar, Algeria
Po Box 417, Kenadsa St., Bechar, Algeria *[email protected]; [email protected];[email protected]; [email protected]
Abstract: Scientific Software are classified into three categories, business-specific tools designed by company itself and for its proper needs and uses, industrial products planned and designed for general/commercial uses and finally those institutional designed by academic institutions depending on research need of their laboratories.
For the first category, platform should meet purely localized and specific tasks of company. Generally used by company itself and named proprietary solution. Second category, tools are planned and manufactured to meet a lot of tasks. These platforms are a licensed solution. Third case is an institutional category where specific codes are written first to meet a specific need in a very specialized problem and then supercharged with additional modules in next versions and updates until a complete software would be born. These are called institution-made solution.
Our paper discusses in a general overview about structural and functional characteristics of commonly used software for modelling & simulation of electrical networks.
Solutions from the three categories are studied and their main features are described and compared according to criteria of performance evaluation.
We introduce later, our NMSS solution (Network Modelling & Simulation System). The modules and their functionalities are exposed to highlight similarities and disparities with other solutions.
Keywords: Modelling; Simulation; Numerical Library; GUI Software Component; Electrical Network
I. INTRODUCTION
The proposal of a specialized product may, in most occasions, be more general and meets to a part of the customer's request. Therefore, the client uses must comply with the conditionings of the platform.
In case of an academic solution, it should be noted that the need for a development team is much needed. Major obstacle to initiate research, since no support and stimulation are observed unless this represents a major topic of tasks to be performed by research Laboratory.
Many software products for modelling and simulating electrical networks already exist.
Products efficiency, used to design an eventual electrical network is significantly dependent on modules set to predict the behavior of studied system under normal or abnormal operating.
Manual evaluation is possible for small electrical systems but is expensive in engineering time. In addition, the manual computation methods are not obvious for safety reasons and under cases where the all design is much more expensive and requires more efforts. The consequences of a faulty design of electrical network model can induce:
• Danger threatening human lives if adopted. • Increase of total costs of design and its
implementation. • Poor Reliability/robustness of outcomes • High costs for repair operations and maintainability. • Causing damage to the network (incorrect decision
due to misalignment of the load level with respect to supply request).
For designing reliable electrical networks, engineer needs specialized potential human resources and appropriate set of tools.
Modern numerical methods provide a fast and accurate calculation of electrical system behaviours and network topologies, once data and parameters were given to platform running required software. Study of electrical network can be quite large and it is very desirable that the engineer has a reliable software tool that uses GUI to acquire data. In the same way, engineer must have access to calculation results in a clear, and unambiguous report.
In this paper, we examine some-well known platforms software issued from academic and/or commercial category and designed by professionals of electrical engineering field and their development team. These teams have acquired practice over the time. Software products are presented in what follows without any classification or preference ordering but just an enumeration as an example. Notifications of characteristics are even reported.
NMSS, a solution we developed is exposed and compared according to the same criteria.
II. EVALUATION CRITERIA MODEL
Software tools studied are technically compared under the following criteria and recommendations:
- The Graphical User Interface, GUI - Accessibility to visual components - Modularity of all platform
Journal of Electrical and Control Engineering JECE
JECE Vol. 3 No. 5, 2013 PP. 1-12 www.joece.org/ © American V-King Scientific Publishing
2
- Presence of standard data libraries - Possibilities for comprehensive reports - The portability of the tool - Interoperability - The ability to exchange data.
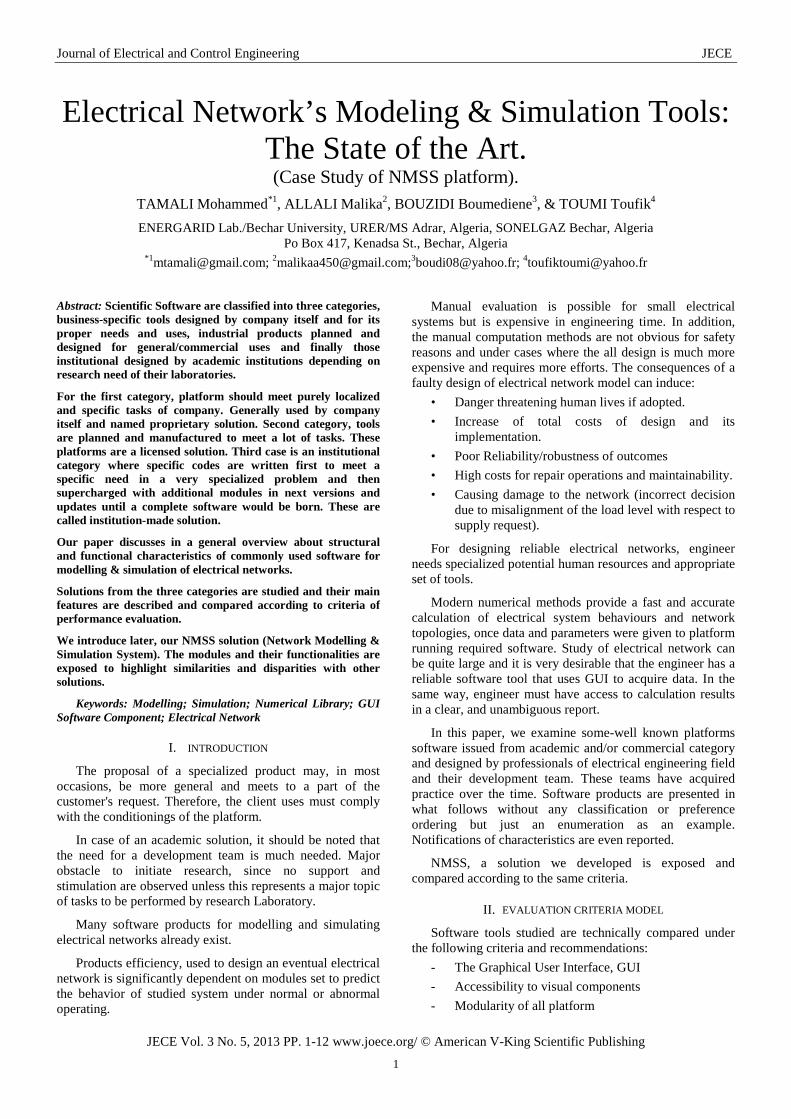
To understand, scientific software, we need to see from a specific point view where structure is exposed in the following illustration given at Fig. 1:
Fig. 1. The main structure of scientific software.
In general, a scientific application must respond effectively to requests emitted by user who needs to manipulate the object model under study. These objects are represented by two models, in one hand a description in data format to reprocessing and in other a visual format to display and manipulate on a screen.
The application can organize the requests according to synchronous and asynchronous modes. Queries are issued and then sent to the inference engine to be processed after which results emerge and then re-emitted to user and/or saved in database under a new knowledge and rules format (Fig. 1).
In the following sections different products will be displayed and then a technical description is given. Available characteristics are given and thus discussed.
The qualifying order of exposed solutions is efficiency or not against of academic use, to manipulate electrical network models on a computer screen.
III. OVERVIEW ON PROPRIETARY SOLUTIONS
A. Case of Powerworld Simulator (From Powerworld Inc):
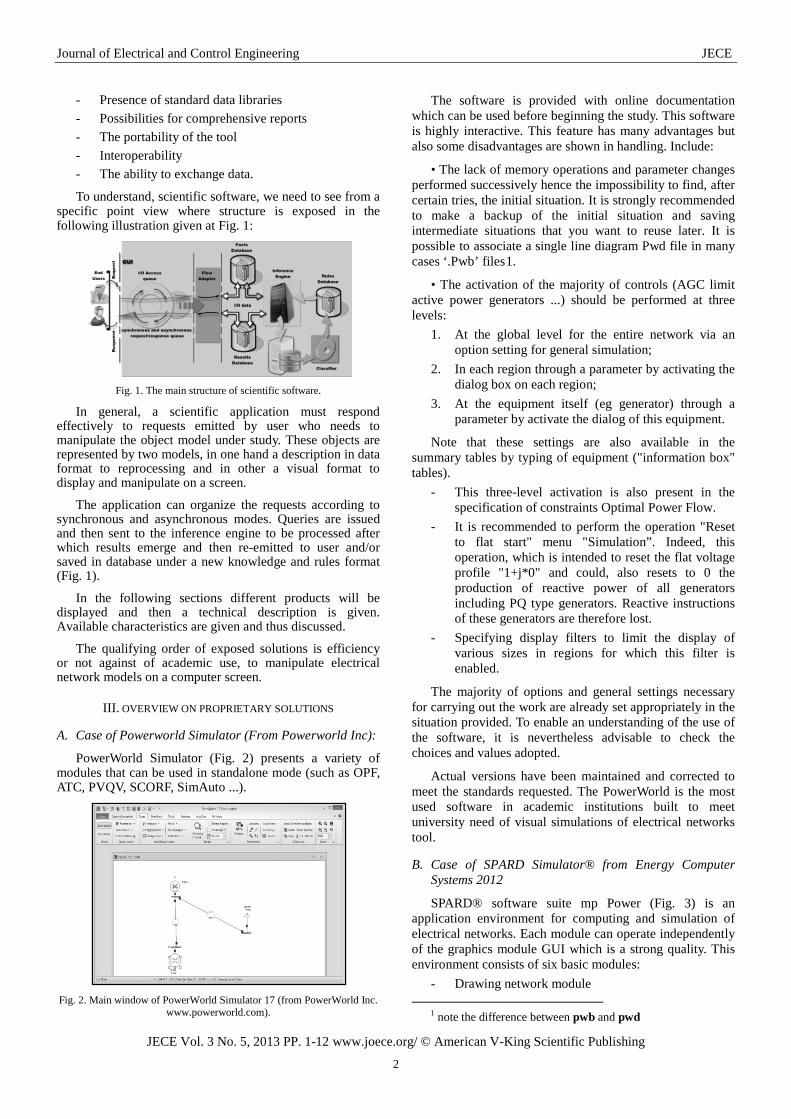
PowerWorld Simulator (Fig. 2) presents a variety of modules that can be used in standalone mode (such as OPF, ATC, PVQV, SCORF, SimAuto ...).
Fig. 2. Main window of PowerWorld Simulator 17 (from PowerWorld Inc.
www.powerworld.com).
The software is provided with online documentation which can be used before beginning the study. This software is highly interactive. This feature has many advantages but also some disadvantages are shown in handling. Include:
• The lack of memory operations and parameter changes performed successively hence the impossibility to find, after certain tries, the initial situation. It is strongly recommended to make a backup of the initial situation and saving intermediate situations that you want to reuse later. It is possible to associate a single line diagram Pwd file in many cases ‘.Pwb’ files1.
• The activation of the majority of controls (AGC limit active power generators ...) should be performed at three levels:
1. At the global level for the entire network via an option setting for general simulation;
2. In each region through a parameter by activating the dialog box on each region;
3. At the equipment itself (eg generator) through a parameter by activate the dialog of this equipment.
Note that these settings are also available in the summary tables by typing of equipment ("information box" tables).
- This three-level activation is also present in the specification of constraints Optimal Power Flow.
- It is recommended to perform the operation "Reset to flat start" menu "Simulation”. Indeed, this operation, which is intended to reset the flat voltage profile "1+j*0" and could, also resets to 0 the production of reactive power of all generators including PQ type generators. Reactive instructions of these generators are therefore lost.
- Specifying display filters to limit the display of various sizes in regions for which this filter is enabled.
The majority of options and general settings necessary for carrying out the work are already set appropriately in the situation provided. To enable an understanding of the use of the software, it is nevertheless advisable to check the choices and values adopted.
Actual versions have been maintained and corrected to meet the standards requested. The PowerWorld is the most used software in academic institutions built to meet university need of visual simulations of electrical networks tool.
B. Case of SPARD Simulator® from Energy Computer Systems 2012
SPARD® software suite mp Power (Fig. 3) is an application environment for computing and simulation of electrical networks. Each module can operate independently of the graphics module GUI which is a strong quality. This environment consists of six basic modules:
- Drawing network module
1 note the difference between pwb and pwd
Journal of Electrical and Control Engineering JECE
JECE Vol. 3 No. 5, 2013 PP. 1-12 www.joece.org/ © American V-King Scientific Publishing
3
- Data entry module - Simulations based module - Coordination and Protection module - Additional applications (Engine Start, Optimal
reconfiguration, placement of sub-stations, Service Restoration, and probabilistic fault simulation, etc...)
- Reports editing module.
The individual modules are simultaneously available to the end-user. If the network system state is, for example, in its steady state, so that a transmission line can be added and configured graphically with new data. Graphical area model is immediately updated accordingly to changes made. Without any experience, the end-user can easily handle and manipulate GUI 2 with ease, drawing nodes, transmission lines, transformers ...etc. by a simple drag & drop operation from the toolbar. Any changes occurred thereafter is run, with the same flexibility, and reflected by equivalent drawing updates.
SPARD Power system is "intelligent". If the screen data option is displayed, just select an object (node, relays ...) on the graph related and then appear properties automatically.
The same data can be imported from module SPARD® Distribution and even from the Microsoft Excel spreadsheet.
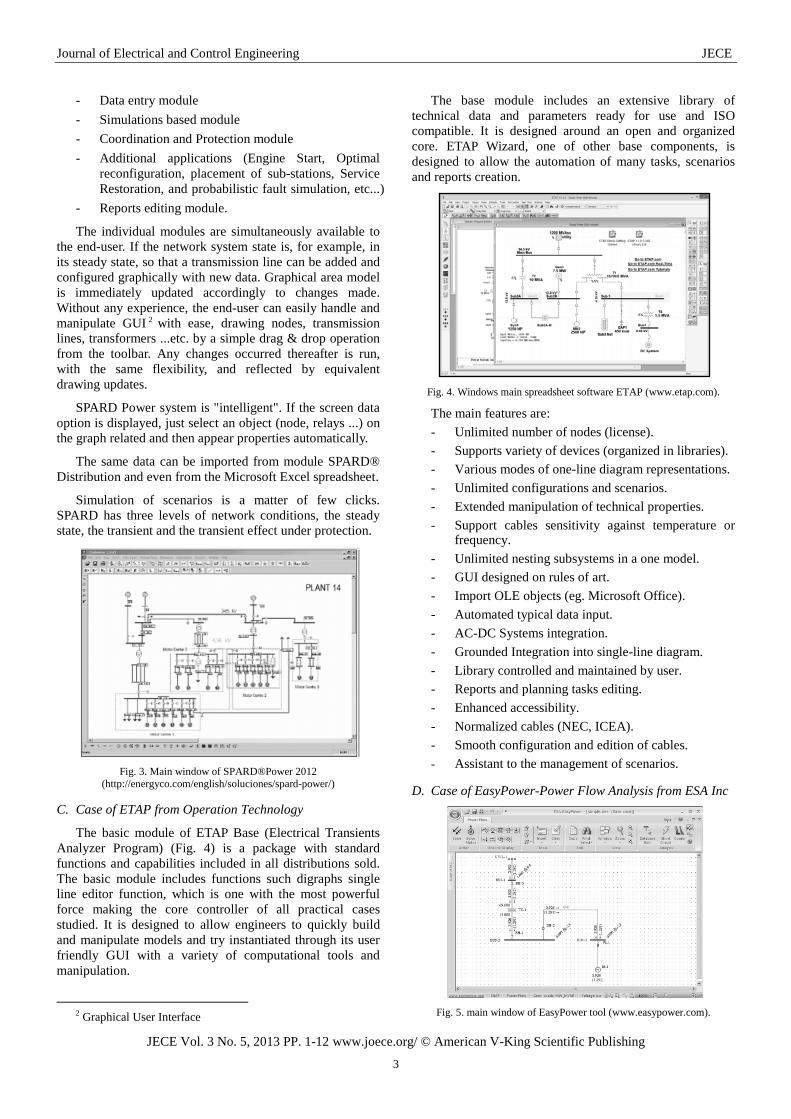
Simulation of scenarios is a matter of few clicks. SPARD has three levels of network conditions, the steady state, the transient and the transient effect under protection.
Fig. 3. Main window of SPARD®Power 2012
(http://energyco.com/english/soluciones/spard-power/)
C. Case of ETAP from Operation Technology
The basic module of ETAP Base (Electrical Transients Analyzer Program) (Fig. 4) is a package with standard functions and capabilities included in all distributions sold. The basic module includes functions such digraphs single line editor function, which is one with the most powerful force making the core controller of all practical cases studied. It is designed to allow engineers to quickly build and manipulate models and try instantiated through its user friendly GUI with a variety of computational tools and manipulation.
2 Graphical User Interface
The base module includes an extensive library of technical data and parameters ready for use and ISO compatible. It is designed around an open and organized core. ETAP Wizard, one of other base components, is designed to allow the automation of many tasks, scenarios and reports creation.
Fig. 4. Windows main spreadsheet software ETAP (www.etap.com).
The main features are: - Unlimited number of nodes (license). - Supports variety of devices (organized in libraries). - Various modes of one-line diagram representations. - Unlimited configurations and scenarios. - Extended manipulation of technical properties. - Support cables sensitivity against temperature or
frequency. - Unlimited nesting subsystems in a one model. - GUI designed on rules of art. - Import OLE objects (eg. Microsoft Office). - Automated typical data input. - AC-DC Systems integration. - Grounded Integration into single-line diagram. - Library controlled and maintained by user. - Reports and planning tasks editing. - Enhanced accessibility. - Normalized cables (NEC, ICEA). - Smooth configuration and edition of cables. - Assistant to the management of scenarios.
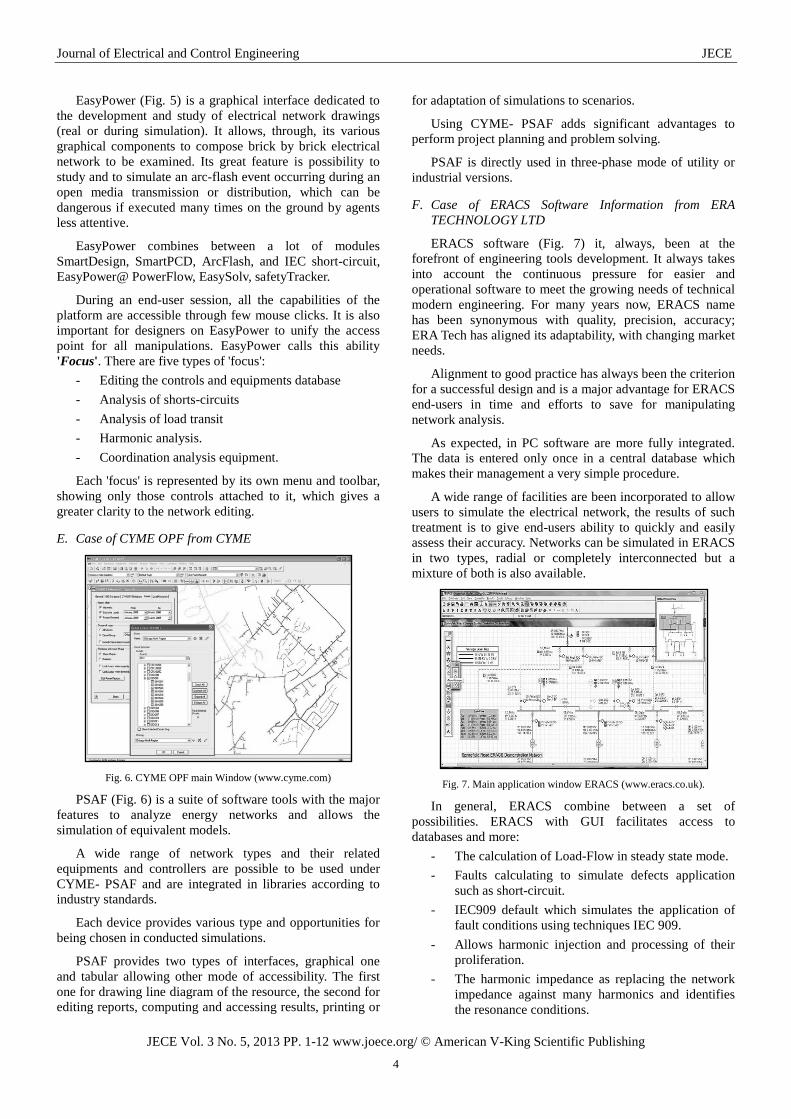
D. Case of EasyPower-Power Flow Analysis from ESA Inc
Fig. 5. main window of EasyPower tool (www.easypower.com).
Journal of Electrical and Control Engineering JECE
JECE Vol. 3 No. 5, 2013 PP. 1-12 www.joece.org/ © American V-King Scientific Publishing
4
EasyPower (Fig. 5) is a graphical interface dedicated to the development and study of electrical network drawings (real or during simulation). It allows, through, its various graphical components to compose brick by brick electrical network to be examined. Its great feature is possibility to study and to simulate an arc-flash event occurring during an open media transmission or distribution, which can be dangerous if executed many times on the ground by agents less attentive.
EasyPower combines between a lot of modules SmartDesign, SmartPCD, ArcFlash, and IEC short-circuit, EasyPower@ PowerFlow, EasySolv, safetyTracker.
During an end-user session, all the capabilities of the platform are accessible through few mouse clicks. It is also important for designers on EasyPower to unify the access point for all manipulations. EasyPower calls this ability 'Focus'. There are five types of 'focus':
- Editing the controls and equipments database - Analysis of shorts-circuits - Analysis of load transit - Harmonic analysis. - Coordination analysis equipment.
Each 'focus' is represented by its own menu and toolbar, showing only those controls attached to it, which gives a greater clarity to the network editing.
E. Case of CYME OPF from CYME
Fig. 6. CYME OPF main Window (www.cyme.com)
PSAF (Fig. 6) is a suite of software tools with the major features to analyze energy networks and allows the simulation of equivalent models.
A wide range of network types and their related equipments and controllers are possible to be used under CYME- PSAF and are integrated in libraries according to industry standards.
Each device provides various type and opportunities for being chosen in conducted simulations.
PSAF provides two types of interfaces, graphical one and tabular allowing other mode of accessibility. The first one for drawing line diagram of the resource, the second for editing reports, computing and accessing results, printing or
for adaptation of simulations to scenarios.
Using CYME- PSAF adds significant advantages to perform project planning and problem solving.
PSAF is directly used in three-phase mode of utility or industrial versions.
F. Case of ERACS Software Information from ERA TECHNOLOGY LTD
ERACS software (Fig. 7) it, always, been at the forefront of engineering tools development. It always takes into account the continuous pressure for easier and operational software to meet the growing needs of technical modern engineering. For many years now, ERACS name has been synonymous with quality, precision, accuracy; ERA Tech has aligned its adaptability, with changing market needs.
Alignment to good practice has always been the criterion for a successful design and is a major advantage for ERACS end-users in time and efforts to save for manipulating network analysis.
As expected, in PC software are more fully integrated. The data is entered only once in a central database which makes their management a very simple procedure.
A wide range of facilities are been incorporated to allow users to simulate the electrical network, the results of such treatment is to give end-users ability to quickly and easily assess their accuracy. Networks can be simulated in ERACS in two types, radial or completely interconnected but a mixture of both is also available.
Fig. 7. Main application window ERACS (www.eracs.co.uk).
In general, ERACS combine between a set of possibilities. ERACS with GUI facilitates access to databases and more:
- The calculation of Load-Flow in steady state mode. - Faults calculating to simulate defects application
such as short-circuit. - IEC909 default which simulates the application of
fault conditions using techniques IEC 909. - Allows harmonic injection and processing of their
proliferation. - The harmonic impedance as replacing the network
impedance against many harmonics and identifies the resonance conditions.
Journal of Electrical and Control Engineering JECE
JECE Vol. 3 No. 5, 2013 PP. 1-12 www.joece.org/ © American V-King Scientific Publishing
5
- Transient stability for the dynamic study of perturbations applied to the network.
- Protection and coordination analyzes and the placement of protective devices and their interfacing under fault conditions.
- Universal Dynamic Modeling (UDM) used to create the model controller (AVRs and governors) built around a range of construction sets which are validated and easily understood by engineers.
- 150 sets of busbars in standard mode and 1,500 busbars for the ERACS extended version are available.
- A network-distributed version for collaborative tasks is also available.
- A rich library of electric components data.
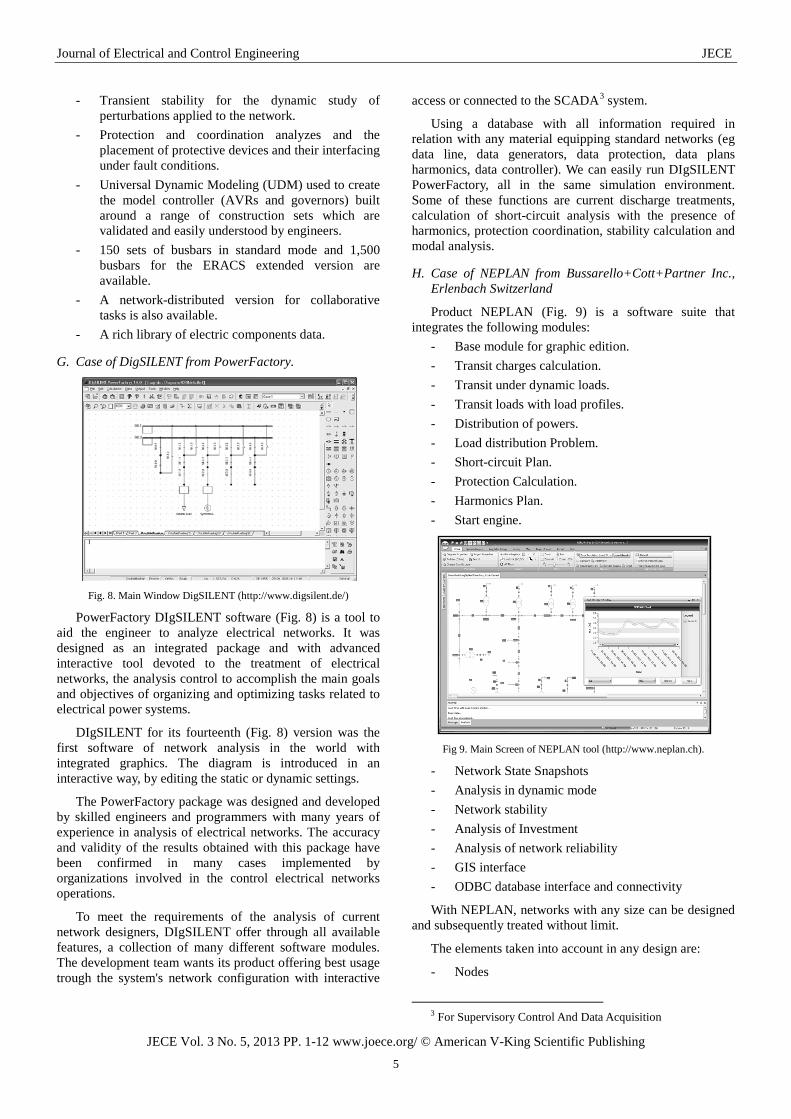
G. Case of DigSILENT from PowerFactory.
Fig. 8. Main Window DigSILENT (http://www.digsilent.de/)
PowerFactory DIgSILENT software (Fig. 8) is a tool to aid the engineer to analyze electrical networks. It was designed as an integrated package and with advanced interactive tool devoted to the treatment of electrical networks, the analysis control to accomplish the main goals and objectives of organizing and optimizing tasks related to electrical power systems.
DIgSILENT for its fourteenth (Fig. 8) version was the first software of network analysis in the world with integrated graphics. The diagram is introduced in an interactive way, by editing the static or dynamic settings.
The PowerFactory package was designed and developed by skilled engineers and programmers with many years of experience in analysis of electrical networks. The accuracy and validity of the results obtained with this package have been confirmed in many cases implemented by organizations involved in the control electrical networks operations.
To meet the requirements of the analysis of current network designers, DIgSILENT offer through all available features, a collection of many different software modules. The development team wants its product offering best usage trough the system's network configuration with interactive
access or connected to the SCADA3 system.
Using a database with all information required in relation with any material equipping standard networks (eg data line, data generators, data protection, data plans harmonics, data controller). We can easily run DIgSILENT PowerFactory, all in the same simulation environment. Some of these functions are current discharge treatments, calculation of short-circuit analysis with the presence of harmonics, protection coordination, stability calculation and modal analysis.
H. Case of NEPLAN from Bussarello+Cott+Partner Inc., Erlenbach Switzerland
Product NEPLAN (Fig. 9) is a software suite that integrates the following modules:
- Base module for graphic edition. - Transit charges calculation. - Transit under dynamic loads. - Transit loads with load profiles. - Distribution of powers. - Load distribution Problem. - Short-circuit Plan. - Protection Calculation. - Harmonics Plan. - Start engine.
Fig 9. Main Screen of NEPLAN tool (http://www.neplan.ch).
- Network State Snapshots - Analysis in dynamic mode - Network stability - Analysis of Investment - Analysis of network reliability - GIS interface - ODBC database interface and connectivity
With NEPLAN, networks with any size can be designed and subsequently treated without limit.
The elements taken into account in any design are:
- Nodes
3 For Supervisory Control And Data Acquisition
Journal of Electrical and Control Engineering JECE
JECE Vol. 3 No. 5, 2013 PP. 1-12 www.joece.org/ © American V-King Scientific Publishing
6
- Stations - Transmission Lines - Coupling devices according to database - Reactors - Transformers - Transformers with 3/4-windings - Shunts - Network feeder - Synchronous machines - Asynchronous machines - Central - Filter elements with R/L/C - Protection devices - Current and voltage transformers - Sources of harmonic - Load model - Equivalent model of electrical network - General Elements
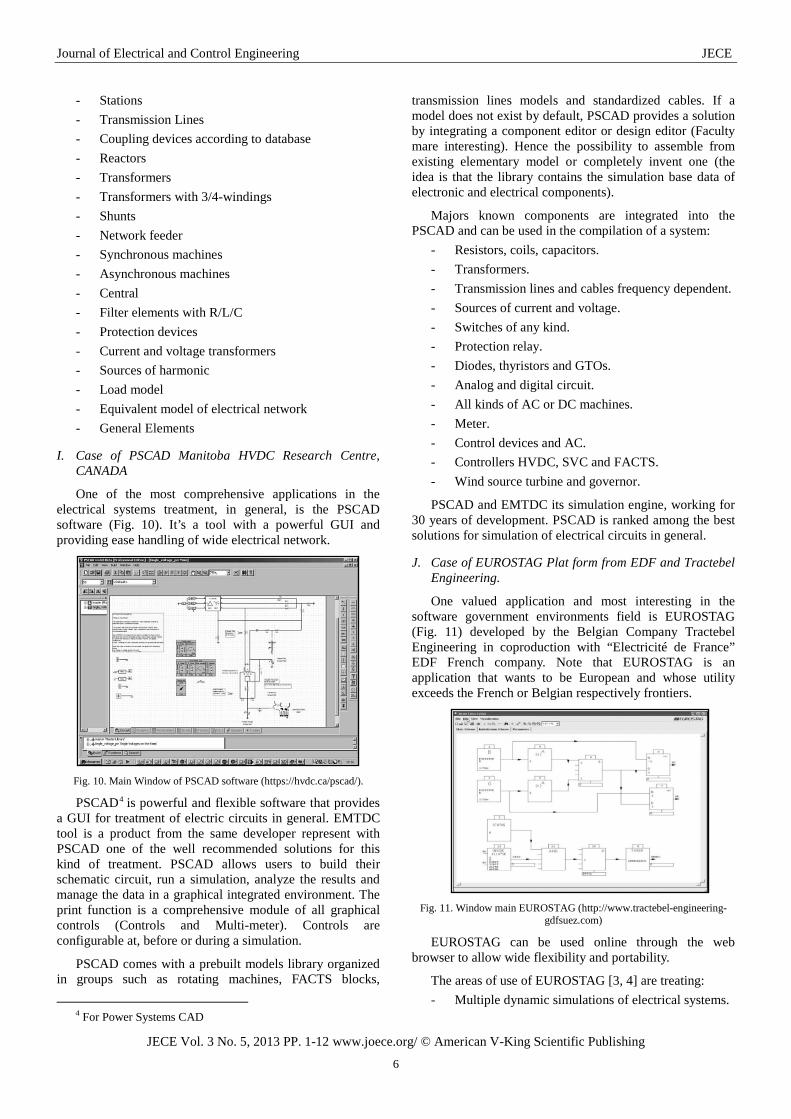
I. Case of PSCAD Manitoba HVDC Research Centre, CANADA
One of the most comprehensive applications in the electrical systems treatment, in general, is the PSCAD software (Fig. 10). It’s a tool with a powerful GUI and providing ease handling of wide electrical network.
Fig. 10. Main Window of PSCAD software (https://hvdc.ca/pscad/).
PSCAD4 is powerful and flexible software that provides a GUI for treatment of electric circuits in general. EMTDC tool is a product from the same developer represent with PSCAD one of the well recommended solutions for this kind of treatment. PSCAD allows users to build their schematic circuit, run a simulation, analyze the results and manage the data in a graphical integrated environment. The print function is a comprehensive module of all graphical controls (Controls and Multi-meter). Controls are configurable at, before or during a simulation.
PSCAD comes with a prebuilt models library organized in groups such as rotating machines, FACTS blocks,
4 For Power Systems CAD
transmission lines models and standardized cables. If a model does not exist by default, PSCAD provides a solution by integrating a component editor or design editor (Faculty mare interesting). Hence the possibility to assemble from existing elementary model or completely invent one (the idea is that the library contains the simulation base data of electronic and electrical components).
Majors known components are integrated into the PSCAD and can be used in the compilation of a system:
- Resistors, coils, capacitors. - Transformers. - Transmission lines and cables frequency dependent. - Sources of current and voltage. - Switches of any kind. - Protection relay. - Diodes, thyristors and GTOs. - Analog and digital circuit. - All kinds of AC or DC machines. - Meter. - Control devices and AC. - Controllers HVDC, SVC and FACTS. - Wind source turbine and governor.
PSCAD and EMTDC its simulation engine, working for 30 years of development. PSCAD is ranked among the best solutions for simulation of electrical circuits in general.
J. Case of EUROSTAG Plat form from EDF and Tractebel Engineering.
One valued application and most interesting in the software government environments field is EUROSTAG (Fig. 11) developed by the Belgian Company Tractebel Engineering in coproduction with “Electricité de France” EDF French company. Note that EUROSTAG is an application that wants to be European and whose utility exceeds the French or Belgian respectively frontiers.
Fig. 11. Window main EUROSTAG (http://www.tractebel-engineering-
gdfsuez.com)
EUROSTAG can be used online through the web browser to allow wide flexibility and portability.
The areas of use of EUROSTAG [3, 4] are treating: - Multiple dynamic simulations of electrical systems.
Journal of Electrical and Control Engineering JECE
JECE Vol. 3 No. 5, 2013 PP. 1-12 www.joece.org/ © American V-King Scientific Publishing
7
- Long term simulation of transient stability using the same graphical representation of system.
Virtually, all features as mentioned in the resource lists of all software described above exist in with a plus, EUROSTAG can be used online.
Fig. 12: Evolution of the voltage at a critical node treated on EUROSTAG.
The software EUROSTAG works under Adobe Flash (Adobe Inc), it’s an Object-oriented environment of high efficiency and which interest is versatile and holds its strength from very powerful language C/C++ with which a base kernel is written.
The presence of Abode Flash plug-in is almost complete on all peripherals with OS system.
IV. OVERVIEW ON ACADEMIC TOOLS
For a good understanding of things at the microscopic level, study of Load flow problem can only be, in major cases, a specific task of the university and research laboratories.
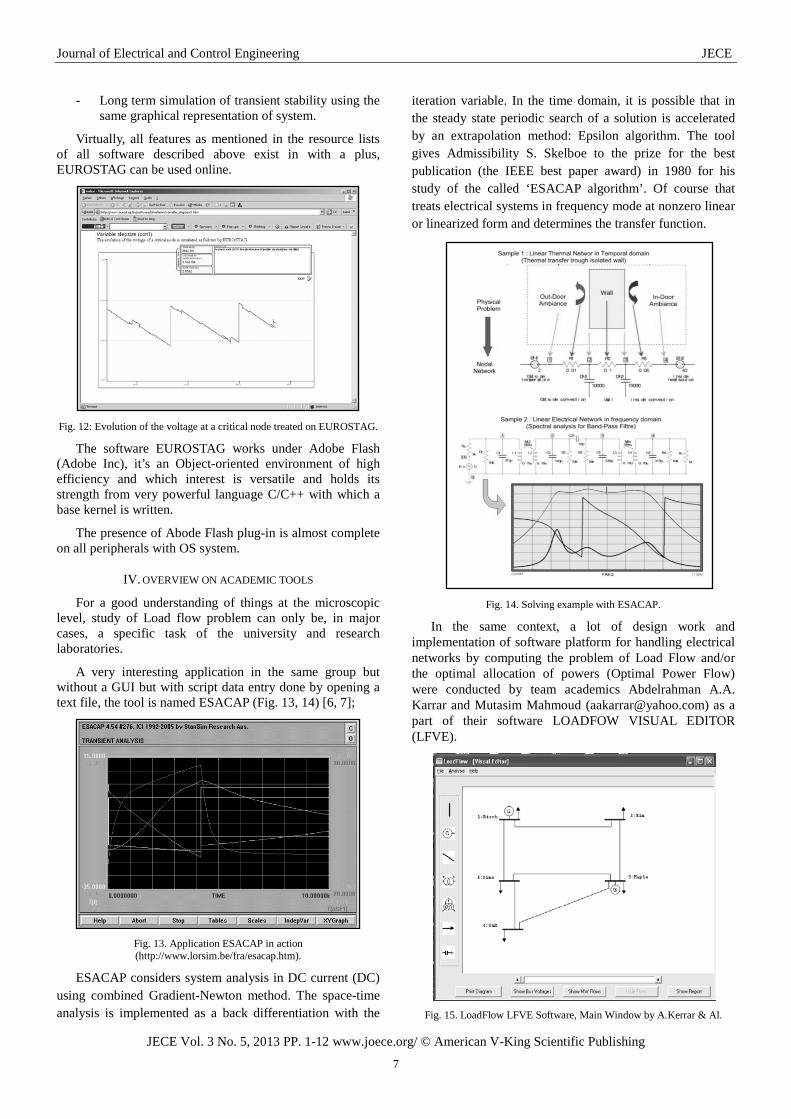
A very interesting application in the same group but without a GUI but with script data entry done by opening a text file, the tool is named ESACAP (Fig. 13, 14) [6, 7];
Fig. 13. Application ESACAP in action (http://www.lorsim.be/fra/esacap.htm).
ESACAP considers system analysis in DC current (DC) using combined Gradient-Newton method. The space-time analysis is implemented as a back differentiation with the
iteration variable. In the time domain, it is possible that in the steady state periodic search of a solution is accelerated by an extrapolation method: Epsilon algorithm. The tool gives Admissibility S. Skelboe to the prize for the best publication (the IEEE best paper award) in 1980 for his study of the called ‘ESACAP algorithm’. Of course that treats electrical systems in frequency mode at nonzero linear or linearized form and determines the transfer function.
Fig. 14. Solving example with ESACAP.
In the same context, a lot of design work and implementation of software platform for handling electrical networks by computing the problem of Load Flow and/or the optimal allocation of powers (Optimal Power Flow) were conducted by team academics Abdelrahman A.A. Karrar and Mutasim Mahmoud ([email protected]) as a part of their software LOADFOW VISUAL EDITOR (LFVE).
Fig. 15. LoadFlow LFVE Software, Main Window by A.Kerrar & Al.
Journal of Electrical and Control Engineering JECE
JECE Vol. 3 No. 5, 2013 PP. 1-12 www.joece.org/ © American V-King Scientific Publishing
8
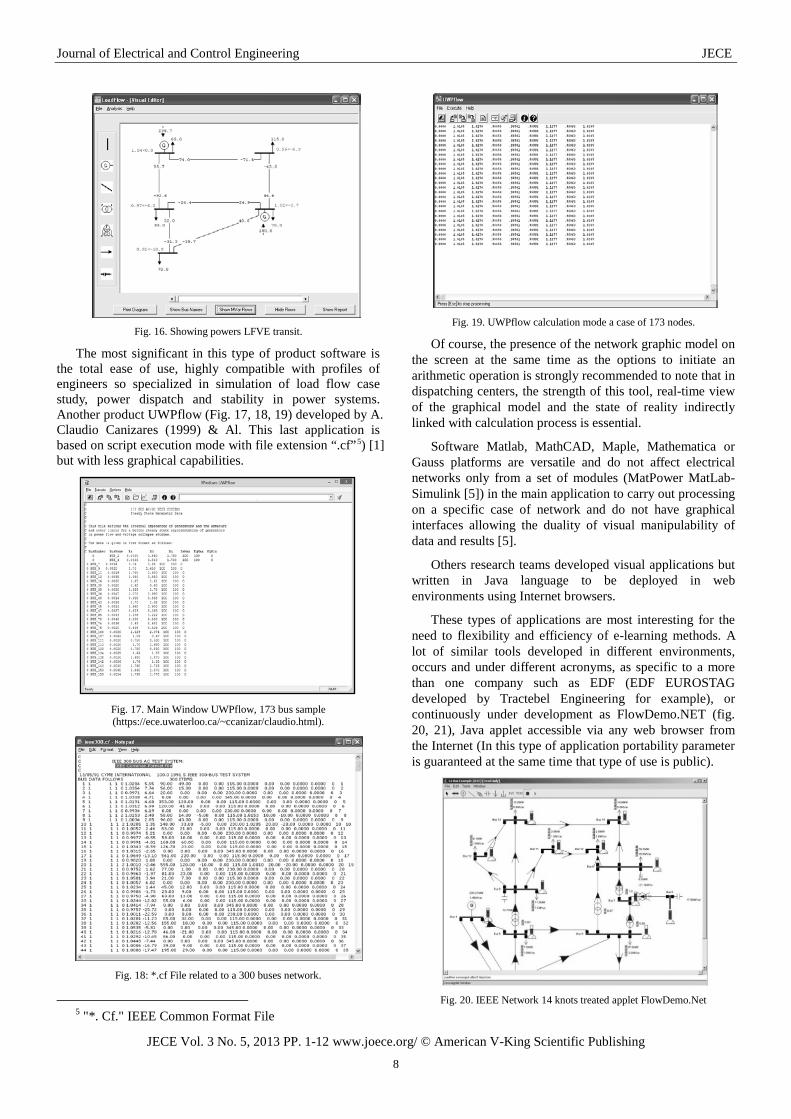
Fig. 16. Showing powers LFVE transit.
The most significant in this type of product software is the total ease of use, highly compatible with profiles of engineers so specialized in simulation of load flow case study, power dispatch and stability in power systems. Another product UWPflow (Fig. 17, 18, 19) developed by A. Claudio Canizares (1999) & Al. This last application is based on script execution mode with file extension “.cf”5) [1] but with less graphical capabilities.
Fig. 17. Main Window UWPflow, 173 bus sample (https://ece.uwaterloo.ca/~ccanizar/claudio.html).
Fig. 18: *.cf File related to a 300 buses network.
5 "*. Cf." IEEE Common Format File
Fig. 19. UWPflow calculation mode a case of 173 nodes.
Of course, the presence of the network graphic model on the screen at the same time as the options to initiate an arithmetic operation is strongly recommended to note that in dispatching centers, the strength of this tool, real-time view of the graphical model and the state of reality indirectly linked with calculation process is essential.
Software Matlab, MathCAD, Maple, Mathematica or Gauss platforms are versatile and do not affect electrical networks only from a set of modules (MatPower MatLab-Simulink [5]) in the main application to carry out processing on a specific case of network and do not have graphical interfaces allowing the duality of visual manipulability of data and results [5].
Others research teams developed visual applications but written in Java language to be deployed in web environments using Internet browsers.
These types of applications are most interesting for the need to flexibility and efficiency of e-learning methods. A lot of similar tools developed in different environments, occurs and under different acronyms, as specific to a more than one company such as EDF (EDF EUROSTAG developed by Tractebel Engineering for example), or continuously under development as FlowDemo.NET (fig. 20, 21), Java applet accessible via any web browser from the Internet (In this type of application portability parameter is guaranteed at the same time that type of use is public).
Fig. 20. IEEE Network 14 knots treated applet FlowDemo.Net
Journal of Electrical and Control Engineering JECE
JECE Vol. 3 No. 5, 2013 PP. 1-12 www.joece.org/ © American V-King Scientific Publishing
9
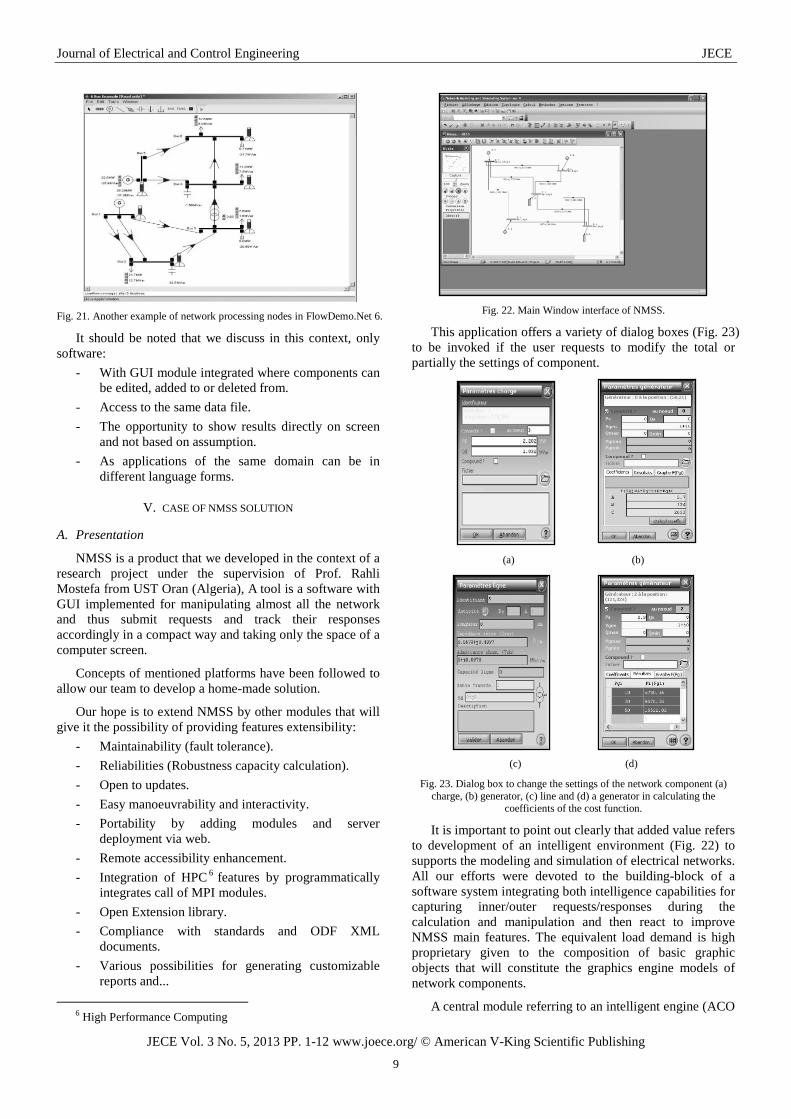
Fig. 21. Another example of network processing nodes in FlowDemo.Net 6.
It should be noted that we discuss in this context, only software:
- With GUI module integrated where components can be edited, added to or deleted from.
- Access to the same data file. - The opportunity to show results directly on screen
and not based on assumption. - As applications of the same domain can be in
different language forms.
V. CASE OF NMSS SOLUTION
A. Presentation
NMSS is a product that we developed in the context of a research project under the supervision of Prof. Rahli Mostefa from UST Oran (Algeria), A tool is a software with GUI implemented for manipulating almost all the network and thus submit requests and track their responses accordingly in a compact way and taking only the space of a computer screen.
Concepts of mentioned platforms have been followed to allow our team to develop a home-made solution.
Our hope is to extend NMSS by other modules that will give it the possibility of providing features extensibility:
- Maintainability (fault tolerance). - Reliabilities (Robustness capacity calculation). - Open to updates. - Easy manoeuvrability and interactivity. - Portability by adding modules and server
deployment via web. - Remote accessibility enhancement. - Integration of HPC 6 features by programmatically
integrates call of MPI modules. - Open Extension library. - Compliance with standards and ODF XML
documents. - Various possibilities for generating customizable
reports and...
6 High Performance Computing
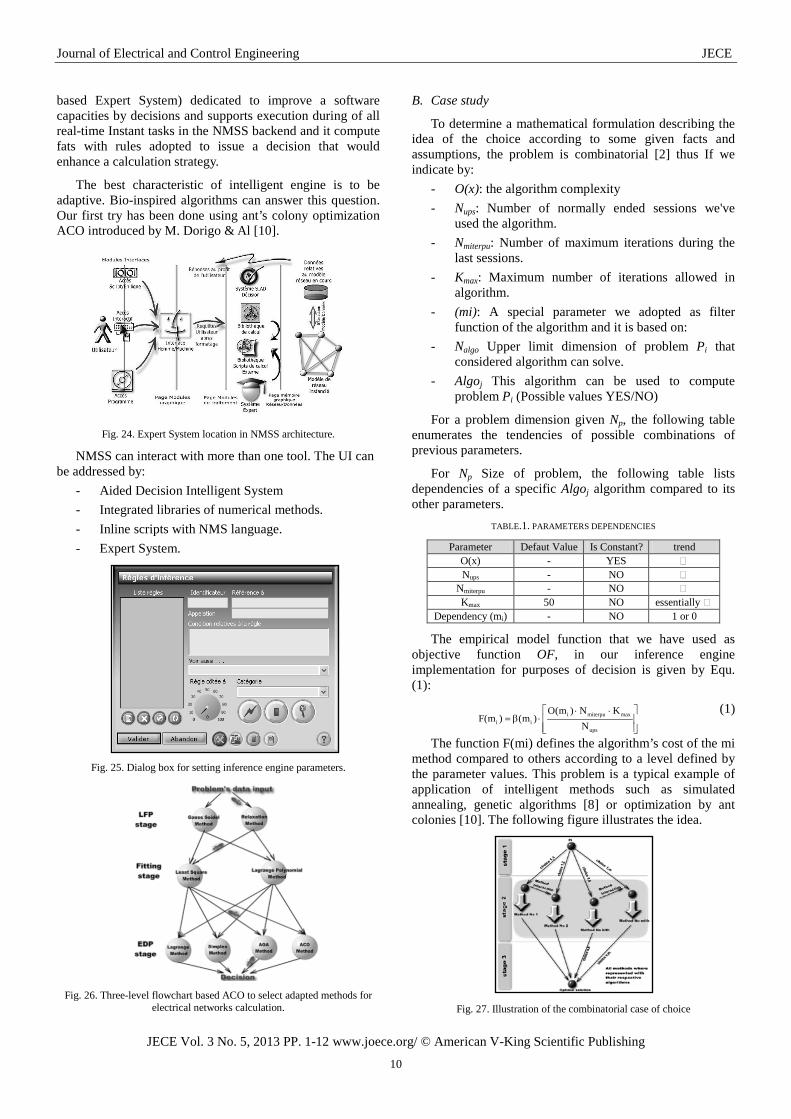
Fig. 22. Main Window interface of NMSS.
This application offers a variety of dialog boxes (Fig. 23) to be invoked if the user requests to modify the total or partially the settings of component.
(a) (b)
(c) (d)
Fig. 23. Dialog box to change the settings of the network component (a) charge, (b) generator, (c) line and (d) a generator in calculating the
coefficients of the cost function.
It is important to point out clearly that added value refers to development of an intelligent environment (Fig. 22) to supports the modeling and simulation of electrical networks. All our efforts were devoted to the building-block of a software system integrating both intelligence capabilities for capturing inner/outer requests/responses during the calculation and manipulation and then react to improve NMSS main features. The equivalent load demand is high proprietary given to the composition of basic graphic objects that will constitute the graphics engine models of network components.
A central module referring to an intelligent engine (ACO
Journal of Electrical and Control Engineering JECE
JECE Vol. 3 No. 5, 2013 PP. 1-12 www.joece.org/ © American V-King Scientific Publishing
10
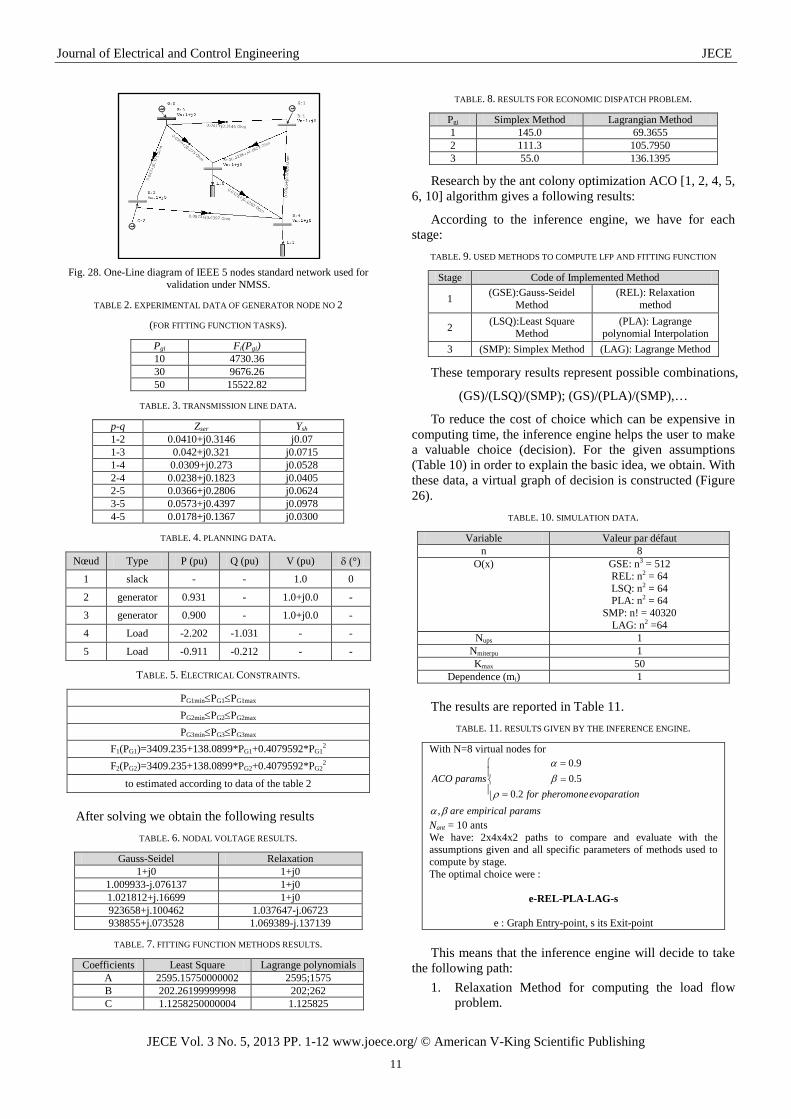
based Expert System) dedicated to improve a software capacities by decisions and supports execution during of all real-time Instant tasks in the NMSS backend and it compute fats with rules adopted to issue a decision that would enhance a calculation strategy.
The best characteristic of intelligent engine is to be adaptive. Bio-inspired algorithms can answer this question. Our first try has been done using ant’s colony optimization ACO introduced by M. Dorigo & Al [10].
Fig. 24. Expert System location in NMSS architecture.
NMSS can interact with more than one tool. The UI can be addressed by:
- Aided Decision Intelligent System - Integrated libraries of numerical methods. - Inline scripts with NMS language. - Expert System.
Fig. 25. Dialog box for setting inference engine parameters.
Fig. 26. Three-level flowchart based ACO to select adapted methods for
electrical networks calculation.
B. Case study
To determine a mathematical formulation describing the idea of the choice according to some given facts and assumptions, the problem is combinatorial [2] thus If we indicate by:
- O(x): the algorithm complexity - Nups: Number of normally ended sessions we've
used the algorithm. - Nmiterpu: Number of maximum iterations during the
last sessions. - Kmax: Maximum number of iterations allowed in
algorithm. - (mi): A special parameter we adopted as filter
function of the algorithm and it is based on: - Nalgo Upper limit dimension of problem Pi that
considered algorithm can solve. - Algoj This algorithm can be used to compute
problem Pi (Possible values YES/NO)
For a problem dimension given Np, the following table enumerates the tendencies of possible combinations of previous parameters.
For Np Size of problem, the following table lists dependencies of a specific Algoj algorithm compared to its other parameters.
TABLE.1. PARAMETERS DEPENDENCIES
Parameter Defaut Value Is Constant? trend O(x) - YES Nups - NO
Nmiterpu - NO Kmax 50 NO essentially
Dependency (mi) - NO 1 or 0
The empirical model function that we have used as objective function OF, in our inference engine implementation for purposes of decision is given by Equ. (1):
i miterpu maxi i
ups
O(m ) N KF(m ) (m )
N ⋅ ⋅
= β ⋅
(1)
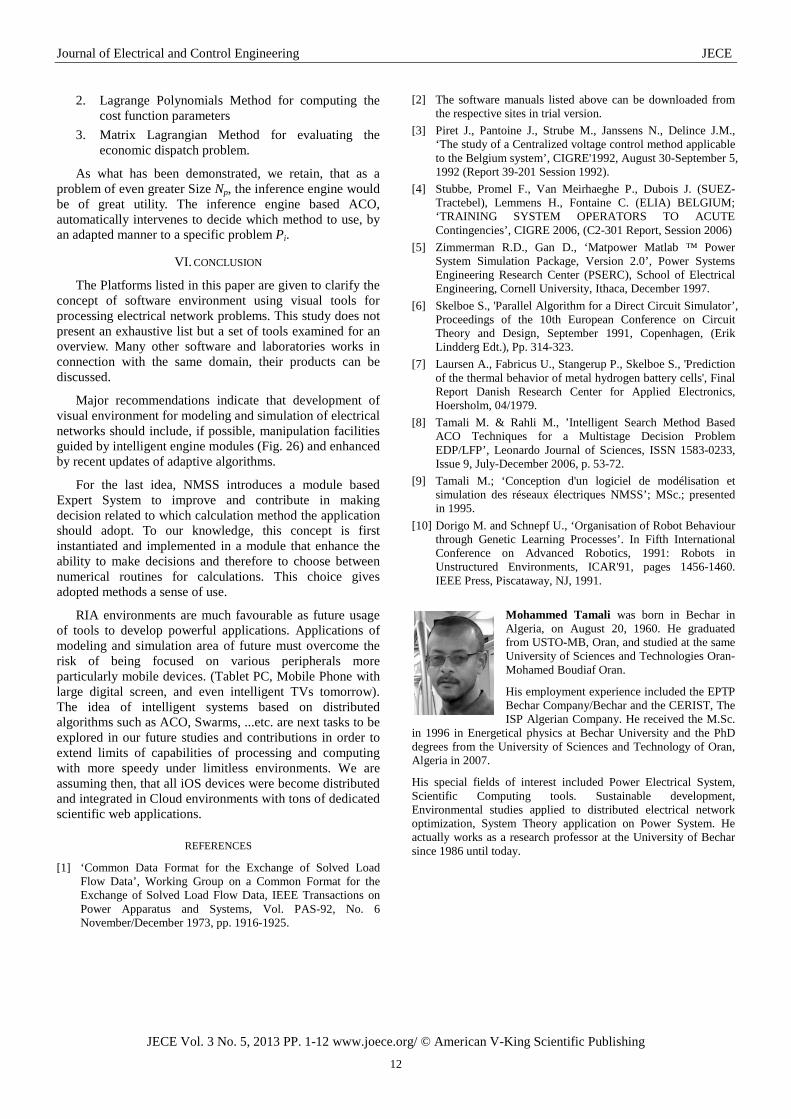
The function F(mi) defines the algorithm’s cost of the mi method compared to others according to a level defined by the parameter values. This problem is a typical example of application of intelligent methods such as simulated annealing, genetic algorithms [8] or optimization by ant colonies [10]. The following figure illustrates the idea.
Fig. 27. Illustration of the combinatorial case of choice
Journal of Electrical and Control Engineering JECE
JECE Vol. 3 No. 5, 2013 PP. 1-12 www.joece.org/ © American V-King Scientific Publishing
11
Fig. 28. One-Line diagram of IEEE 5 nodes standard network used for
validation under NMSS.
TABLE 2. EXPERIMENTAL DATA OF GENERATOR NODE NO 2
(FOR FITTING FUNCTION TASKS). Pgi Fi(Pgi) 10 4730.36 30 9676.26 50 15522.82
TABLE. 3. TRANSMISSION LINE DATA. p-q Zser Ysh 1-2 0.0410+j0.3146 j0.07 1-3 0.042+j0.321 j0.0715 1-4 0.0309+j0.273 j0.0528 2-4 0.0238+j0.1823 j0.0405 2-5 0.0366+j0.2806 j0.0624 3-5 0.0573+j0.4397 j0.0978 4-5 0.0178+j0.1367 j0.0300
TABLE. 4. PLANNING DATA. Nœud Type P (pu) Q (pu) V (pu) δ (°)
1 slack - - 1.0 0
2 generator 0.931 - 1.0+j0.0 -
3 generator 0.900 - 1.0+j0.0 -
4 Load -2.202 -1.031 - -
5 Load -0.911 -0.212 - -
TABLE. 5. ELECTRICAL CONSTRAINTS. PG1min≤PG1≤PG1max PG2min≤PG2≤PG2max PG3min≤PG3≤PG3max
F1(PG1)=3409.235+138.0899*PG1+0.4079592*PG12
F2(PG2)=3409.235+138.0899*PG2+0.4079592*PG22
to estimated according to data of the table 2
After solving we obtain the following results
TABLE. 6. NODAL VOLTAGE RESULTS. Gauss-Seidel Relaxation
1+j0 1+j0 1.009933-j.076137 1+j0 1.021812+j.16699 1+j0 923658+j.100462 1.037647-j.06723 938855+j.073528 1.069389-j.137139
TABLE. 7. FITTING FUNCTION METHODS RESULTS. Coefficients Least Square Lagrange polynomials
A 2595.15750000002 2595;1575 B 202.26199999998 202;262 C 1.1258250000004 1.125825
TABLE. 8. RESULTS FOR ECONOMIC DISPATCH PROBLEM. Pgi Simplex Method Lagrangian Method 1 145.0 69.3655 2 111.3 105.7950 3 55.0 136.1395
Research by the ant colony optimization ACO [1, 2, 4, 5, 6, 10] algorithm gives a following results:
According to the inference engine, we have for each stage:
TABLE. 9. USED METHODS TO COMPUTE LFP AND FITTING FUNCTION
Stage Code of Implemented Method
1 (GSE):Gauss-Seidel Method
(REL): Relaxation method
2 (LSQ):Least Square Method
(PLA): Lagrange polynomial Interpolation
3 (SMP): Simplex Method (LAG): Lagrange Method
These temporary results represent possible combinations,
(GS)/(LSQ)/(SMP); (GS)/(PLA)/(SMP),…
To reduce the cost of choice which can be expensive in computing time, the inference engine helps the user to make a valuable choice (decision). For the given assumptions (Table 10) in order to explain the basic idea, we obtain. With these data, a virtual graph of decision is constructed (Figure 26).
TABLE. 10. SIMULATION DATA.
Variable Valeur par défaut n 8
O(x) GSE: n3 = 512 REL: n2 = 64 LSQ: n2 = 64 PLA: n2 = 64
SMP: n! = 40320 LAG: n2 =64
Nups 1 Nmiterpu 1 Kmax 50
Dependence (mi) 1
The results are reported in Table 11. TABLE. 11. RESULTS GIVEN BY THE INFERENCE ENGINE.
With N=8 virtual nodes for
paramsempiricalarenevoparatiopheromonefor
paramsACO
βα
ρβα
,2.0
5.09.0
===
Nant = 10 ants We have: 2x4x4x2 paths to compare and evaluate with the assumptions given and all specific parameters of methods used to compute by stage. The optimal choice were :
e-REL-PLA-LAG-s
e : Graph Entry-point, s its Exit-point This means that the inference engine will decide to take
the following path: 1. Relaxation Method for computing the load flow
problem.
Journal of Electrical and Control Engineering JECE
JECE Vol. 3 No. 5, 2013 PP. 1-12 www.joece.org/ © American V-King Scientific Publishing
12
2. Lagrange Polynomials Method for computing the cost function parameters
3. Matrix Lagrangian Method for evaluating the economic dispatch problem.
As what has been demonstrated, we retain, that as a problem of even greater Size Np, the inference engine would be of great utility. The inference engine based ACO, automatically intervenes to decide which method to use, by an adapted manner to a specific problem Pi.
VI. CONCLUSION
The Platforms listed in this paper are given to clarify the concept of software environment using visual tools for processing electrical network problems. This study does not present an exhaustive list but a set of tools examined for an overview. Many other software and laboratories works in connection with the same domain, their products can be discussed.
Major recommendations indicate that development of visual environment for modeling and simulation of electrical networks should include, if possible, manipulation facilities guided by intelligent engine modules (Fig. 26) and enhanced by recent updates of adaptive algorithms.
For the last idea, NMSS introduces a module based Expert System to improve and contribute in making decision related to which calculation method the application should adopt. To our knowledge, this concept is first instantiated and implemented in a module that enhance the ability to make decisions and therefore to choose between numerical routines for calculations. This choice gives adopted methods a sense of use.
RIA environments are much favourable as future usage of tools to develop powerful applications. Applications of modeling and simulation area of future must overcome the risk of being focused on various peripherals more particularly mobile devices. (Tablet PC, Mobile Phone with large digital screen, and even intelligent TVs tomorrow). The idea of intelligent systems based on distributed algorithms such as ACO, Swarms, ...etc. are next tasks to be explored in our future studies and contributions in order to extend limits of capabilities of processing and computing with more speedy under limitless environments. We are assuming then, that all iOS devices were become distributed and integrated in Cloud environments with tons of dedicated scientific web applications.
REFERENCES
[1] ‘Common Data Format for the Exchange of Solved Load Flow Data’, Working Group on a Common Format for the Exchange of Solved Load Flow Data, IEEE Transactions on Power Apparatus and Systems, Vol. PAS-92, No. 6 November/December 1973, pp. 1916-1925.
[2] The software manuals listed above can be downloaded from the respective sites in trial version.
[3] Piret J., Pantoine J., Strube M., Janssens N., Delince J.M., ‘The study of a Centralized voltage control method applicable to the Belgium system’, CIGRE'1992, August 30-September 5, 1992 (Report 39-201 Session 1992).
[4] Stubbe, Promel F., Van Meirhaeghe P., Dubois J. (SUEZ-Tractebel), Lemmens H., Fontaine C. (ELIA) BELGIUM; ‘TRAINING SYSTEM OPERATORS TO ACUTE Contingencies’, CIGRE 2006, (C2-301 Report, Session 2006)
[5] Zimmerman R.D., Gan D., ‘Matpower Matlab ™ Power System Simulation Package, Version 2.0’, Power Systems Engineering Research Center (PSERC), School of Electrical Engineering, Cornell University, Ithaca, December 1997.
[6] Skelboe S., 'Parallel Algorithm for a Direct Circuit Simulator’, Proceedings of the 10th European Conference on Circuit Theory and Design, September 1991, Copenhagen, (Erik Lindderg Edt.), Pp. 314-323.
[7] Laursen A., Fabricus U., Stangerup P., Skelboe S., 'Prediction of the thermal behavior of metal hydrogen battery cells', Final Report Danish Research Center for Applied Electronics, Hoersholm, 04/1979.
[8] Tamali M. & Rahli M., ’Intelligent Search Method Based ACO Techniques for a Multistage Decision Problem EDP/LFP’, Leonardo Journal of Sciences, ISSN 1583-0233, Issue 9, July-December 2006, p. 53-72.
[9] Tamali M.; ‘Conception d'un logiciel de modélisation et simulation des réseaux électriques NMSS’; MSc.; presented in 1995.
[10] Dorigo M. and Schnepf U., ‘Organisation of Robot Behaviour through Genetic Learning Processes’. In Fifth International Conference on Advanced Robotics, 1991: Robots in Unstructured Environments, ICAR'91, pages 1456-1460. IEEE Press, Piscataway, NJ, 1991.
Mohammed Tamali was born in Bechar in Algeria, on August 20, 1960. He graduated from USTO-MB, Oran, and studied at the same University of Sciences and Technologies Oran-Mohamed Boudiaf Oran.
His employment experience included the EPTP Bechar Company/Bechar and the CERIST, The ISP Algerian Company. He received the M.Sc.
in 1996 in Energetical physics at Bechar University and the PhD degrees from the University of Sciences and Technology of Oran, Algeria in 2007.
His special fields of interest included Power Electrical System, Scientific Computing tools. Sustainable development, Environmental studies applied to distributed electrical network optimization, System Theory application on Power System. He actually works as a research professor at the University of Bechar since 1986 until today.