Elastic Rebound Theory Jerky motions on faults produce EQs
47
Stick-slip: Elastic Rebound Theory Jerky motions on faults produce EQs Three Fs of earthquakes: forces, faults, and friction. Slow accumulation and rapid release of elastic energy. Earthquake Machine
-
Upload
khangminh22 -
Category
Documents
-
view
0 -
download
0
Transcript of Elastic Rebound Theory Jerky motions on faults produce EQs

Stick-slip: Elastic Rebound Theory Jerky motions on faults produce EQs
Three Fs of earthquakes: forces, faults, and friction. Slow accumulation and rapid release of elastic energy.
Earthquake Machine

Three Basic Types of Plate Boundaries
Transform (e.g. San Andreas Fault) Strike-slip faulting
Magnitudes generally < 7
Three Basic Types of Plate Boundaries
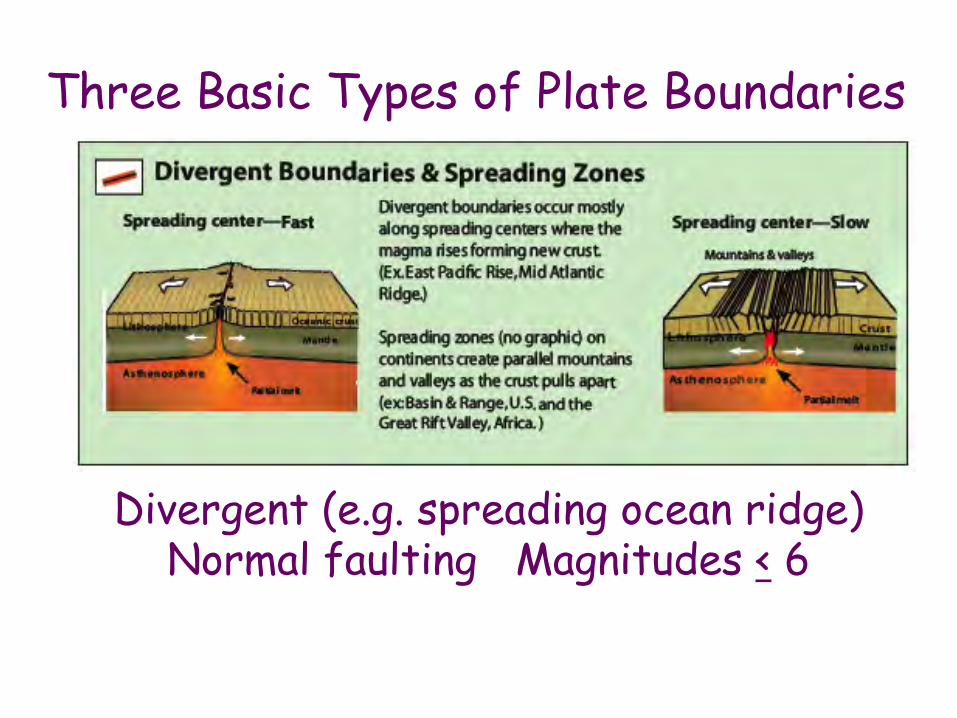
Divergent (e.g. spreading ocean ridge) Normal faulting Magnitudes < 6

Three Basic Types of Plate Boundaries
Convergent (e.g. subduction zone) Magnitudes up to 9 or larger
Depths to 700 km

Hypocenter or Focus: Point WITHIN Earth where EQ occurred.
Epicenter: Location on Earth’s surface directly ABOVE the EQ.
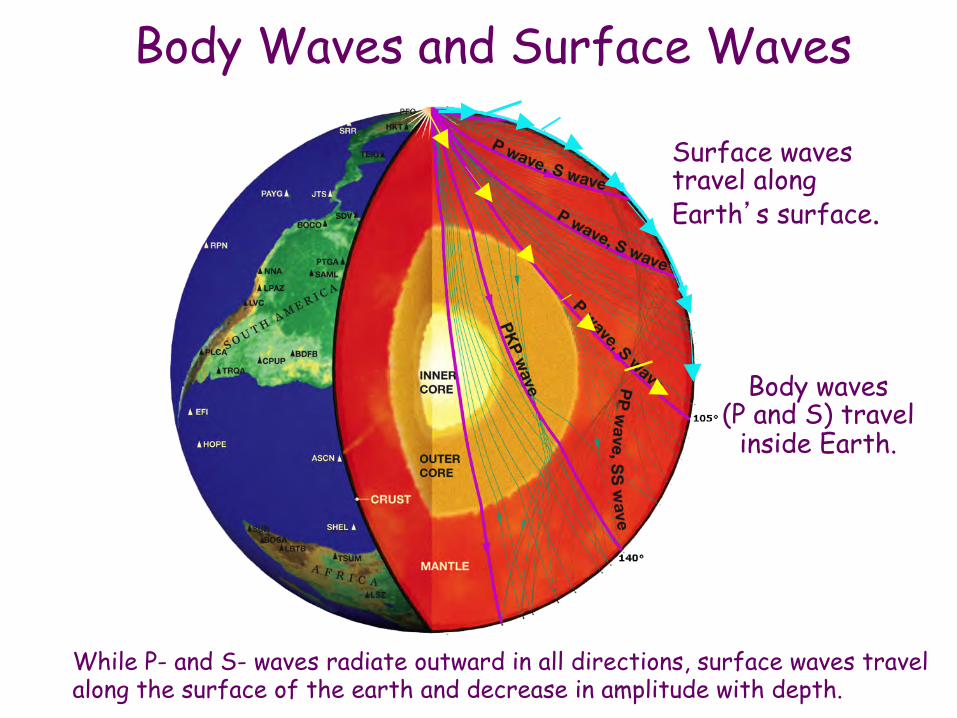
Body waves (P and S) travel
inside Earth.
Surface waves travel along Earth’s surface.
Body Waves and Surface Waves
While P- and S- waves radiate outward in all directions, surface waves travel along the surface of the earth and decrease in amplitude with depth.

P Waves Are Pressure Waves
P waves are fastest seismic waves.
Seismic Slinky

S Waves Are Shear Waves
S waves are slower than P waves but faster than surface waves.
Seismic Slinky
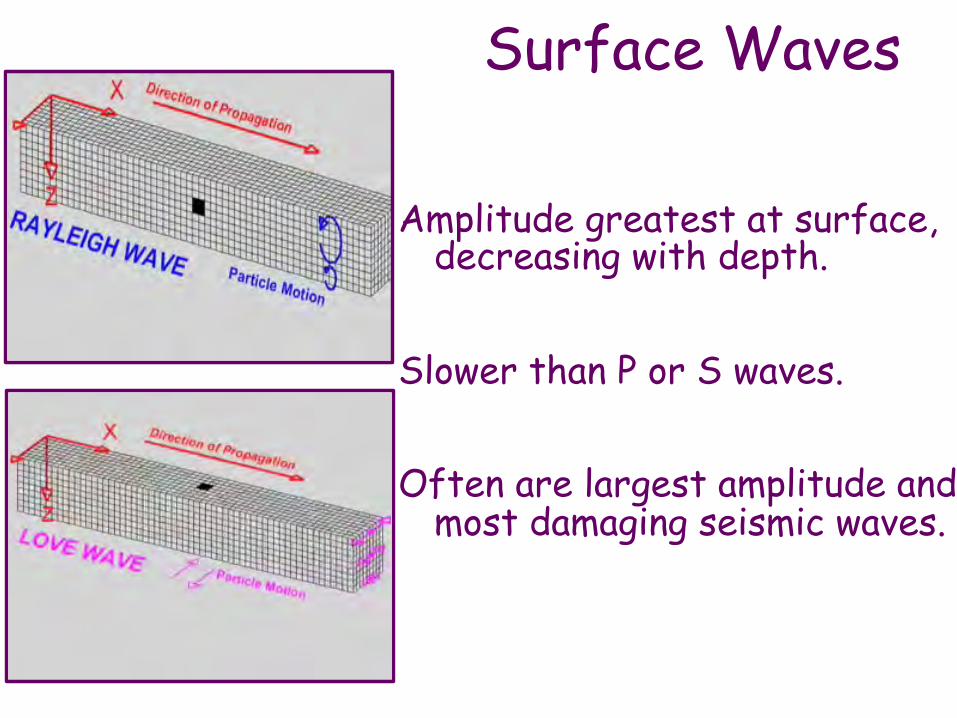
Amplitude greatest at surface, decreasing with depth.
Slower than P or S waves. Often are largest amplitude and
most damaging seismic waves.
Surface Waves

Human Waves Modeling P, S, and Surface Waves
Seismic Slinky
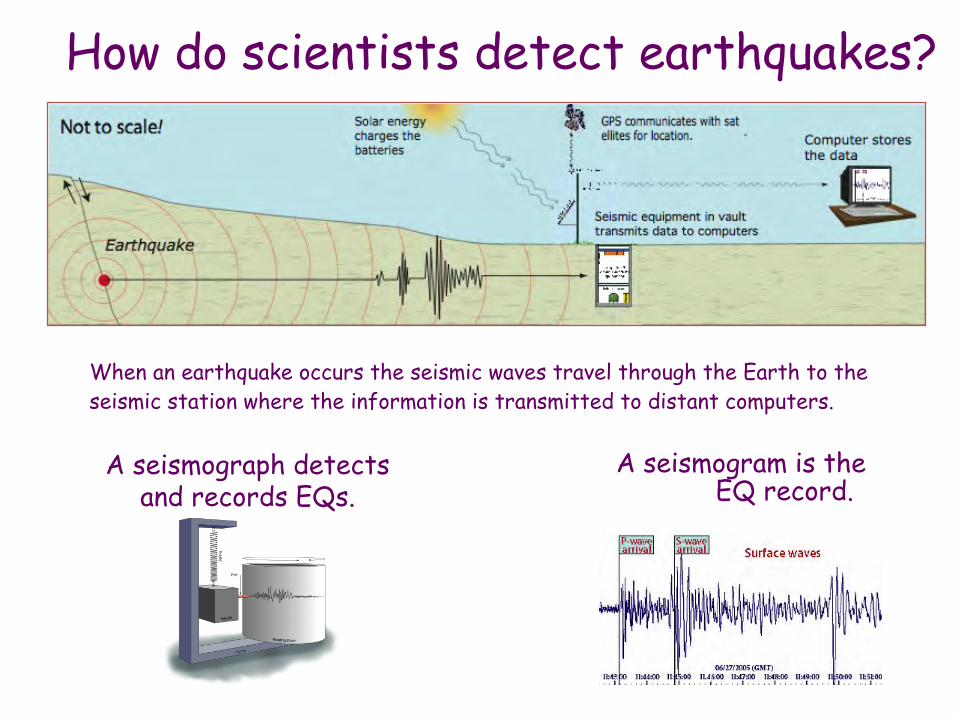
A seismograph detects and records EQs. A seismogram is the
EQ record.
How do scientists detect earthquakes?
When an earthquake occurs the seismic waves travel through the Earth to the seismic station where the information is transmitted to distant computers.
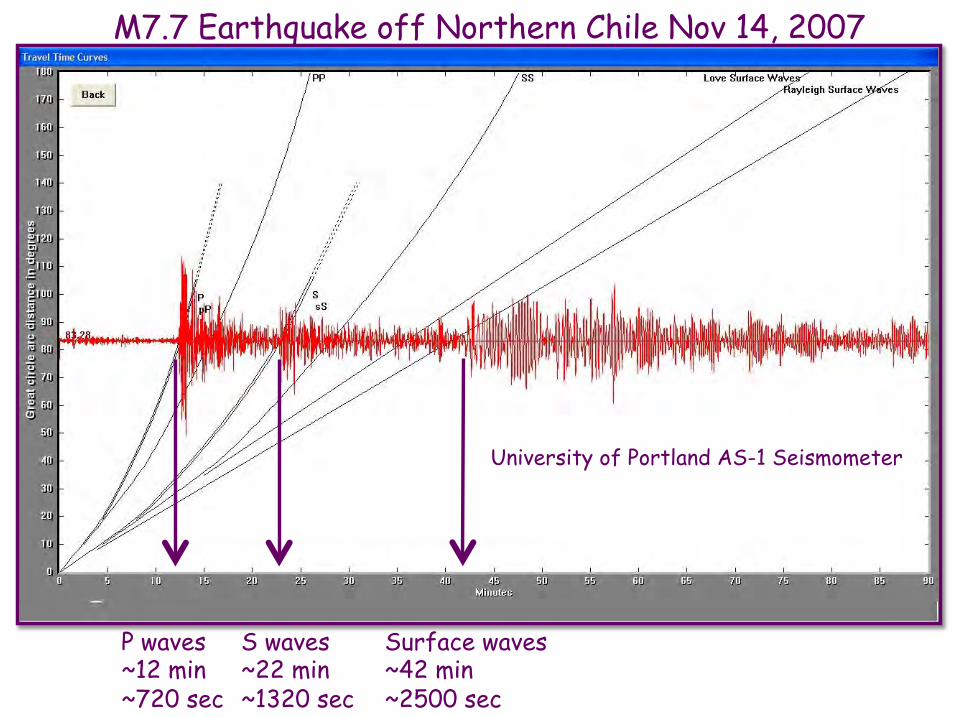
University of Portland AS-1 Seismometer
M7.7 Earthquake off Northern Chile Nov 14, 2007
P waves ~12 min ~720 sec
S waves ~22 min ~1320 sec
Surface waves ~42 min ~2500 sec
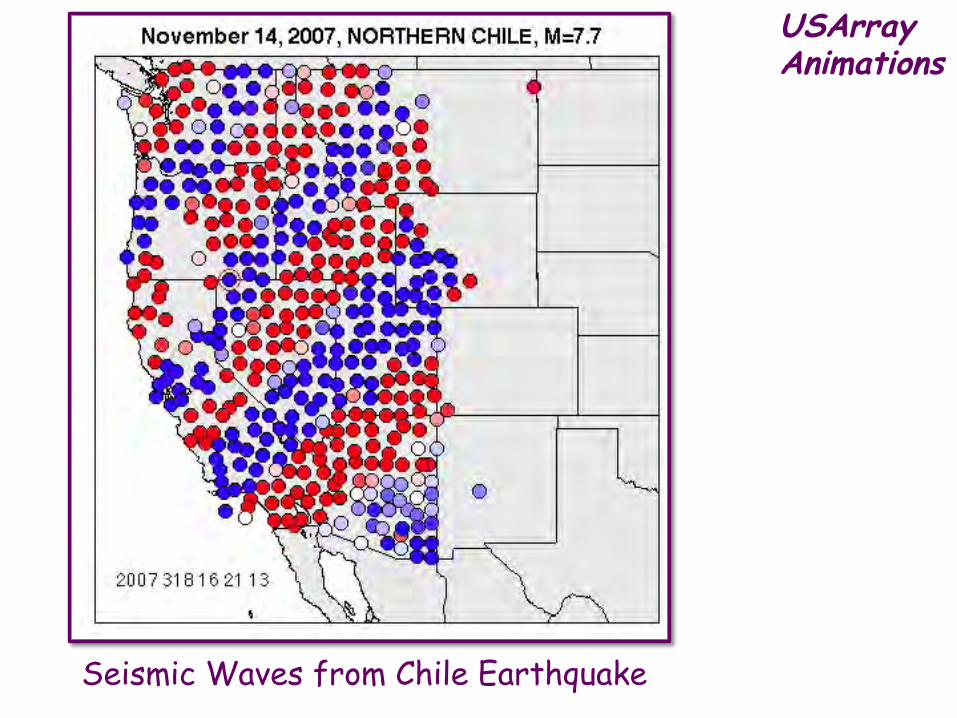
Seismic Waves from Chile Earthquake
USArray Animations

Distance of EQ from seismometer?
Determined from S arrival time - P arrival time.

Locating an Earthquake 1) Determine distance of EQ from
three seismic stations by calculating the S minus P arrival times.
2) Plot them on the travel-time graph.
3) Intersection of the circles gives the location.
1
23

Moment Magnitude Pasta Quake
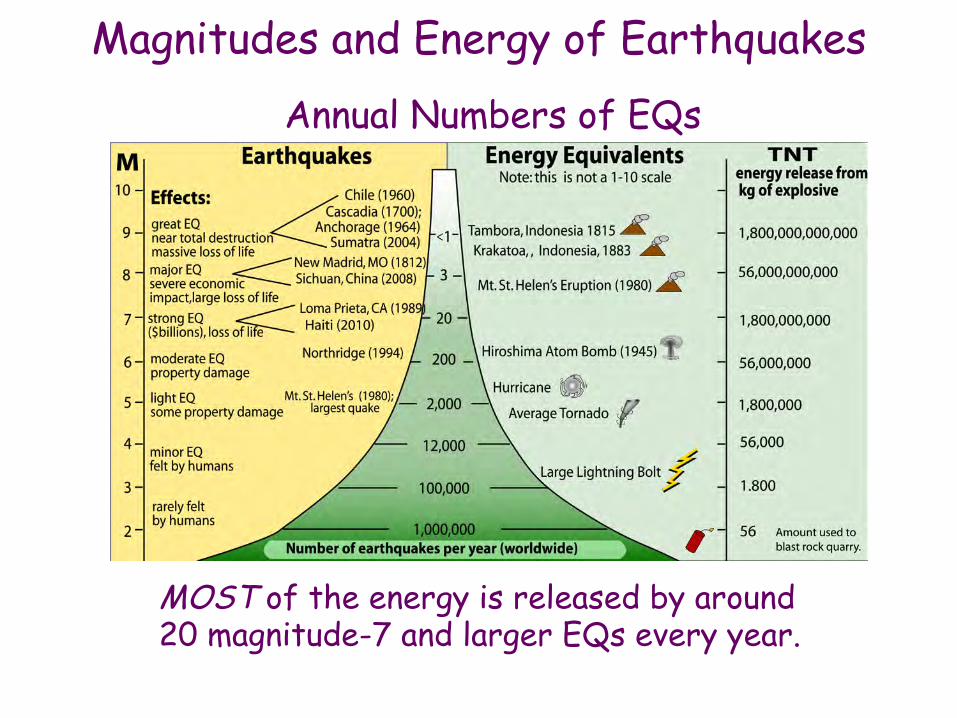
Magnitudes and Energy of Earthquakes Annual Numbers of EQs
MOST of the energy is released by around 20 magnitude-7 and larger EQs every year.

Earthquake Intensity: Violence and Effects of Ground Shaking.
I. Not felt. II. Felt only by a few people. III. Felt noticeably by people indoors. IV. Felt indoors by many, outdoors by few people. V. Felt by nearly everyone; many awakened. Some dishes, windows broken. VI. Felt by all; some heavy furniture moved. VII. Considerable damage in poorly-built structures; No damage to well-built structures. VIII. Great damage to poorly-built structures; considerable damage to ordinary buildings. IX. Damage great in substantial buildings, with partial collapse. X. Some well-built wooden structures destroyed; most masonry and frame structures destroyed. XI. Few masonry structures remain standing; Bridges destroyed. XII. Damage total.
Magnitude/Intensity Comparison Intensities typically observed at locations near epicenter.
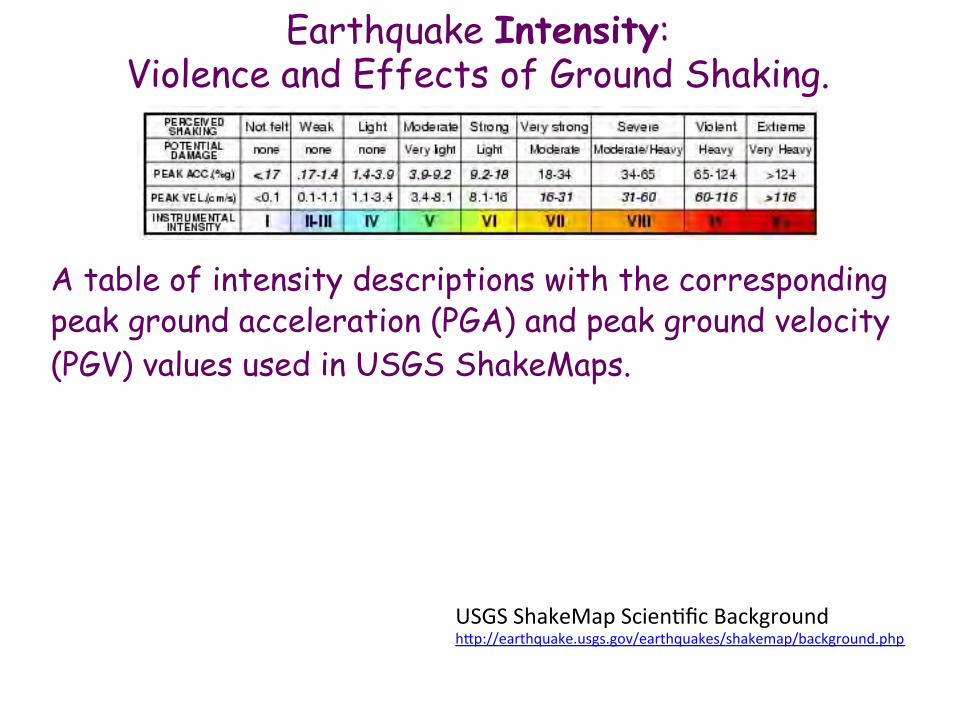
Earthquake Intensity: Violence and Effects of Ground Shaking.
A table of intensity descriptions with the corresponding peak ground acceleration (PGA) and peak ground velocity (PGV) values used in USGS ShakeMaps.
USGS ShakeMap Scien.fic Background h6p://earthquake.usgs.gov/earthquakes/shakemap/background.php

Earthquake Intensity: Violence and Effects of Ground Shaking.
What controls Intensity?
Magnitude—More energy released.
Distance—Shaking decays with distance.
Depth—Deeper EQ yields less shaking at the surface.
Geology—Weak sediments can amplify shaking.
Building style
Duration of shaking. Image courtesy of the US Geological Survey


Three kinds of Cascadia EQs = Triple Trouble
Magnitude 9 Subduction Zone Earthquake
Ground shaking for 4 – 6 minutes!
Magnitude 7 “Deep” Earthquake
20 – 30 seconds of ground shaking.
Magnitude 7 Crustal Earthquake
20 – 30 seconds of ground shaking.

Effects of Near-Surface Geology
Amplitude of oscillation increasing
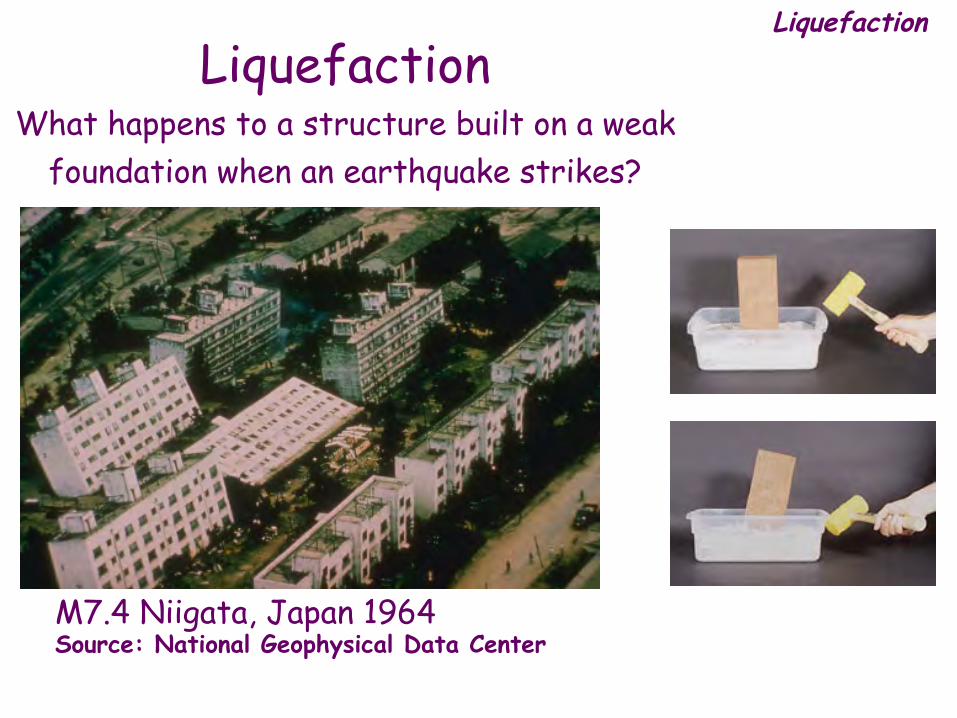
Liquefaction What happens to a structure built on a weak
foundation when an earthquake strikes?
M7.4 Niigata, Japan 1964 Source: National Geophysical Data Center
Liquefaction

Ground Shaking Amplification
Seismic waves are amplified as they pass from bedrock into basins filled with sedimentary rock.

Earthquake-Induced Landslides
El Salvador January 2001 M7.6
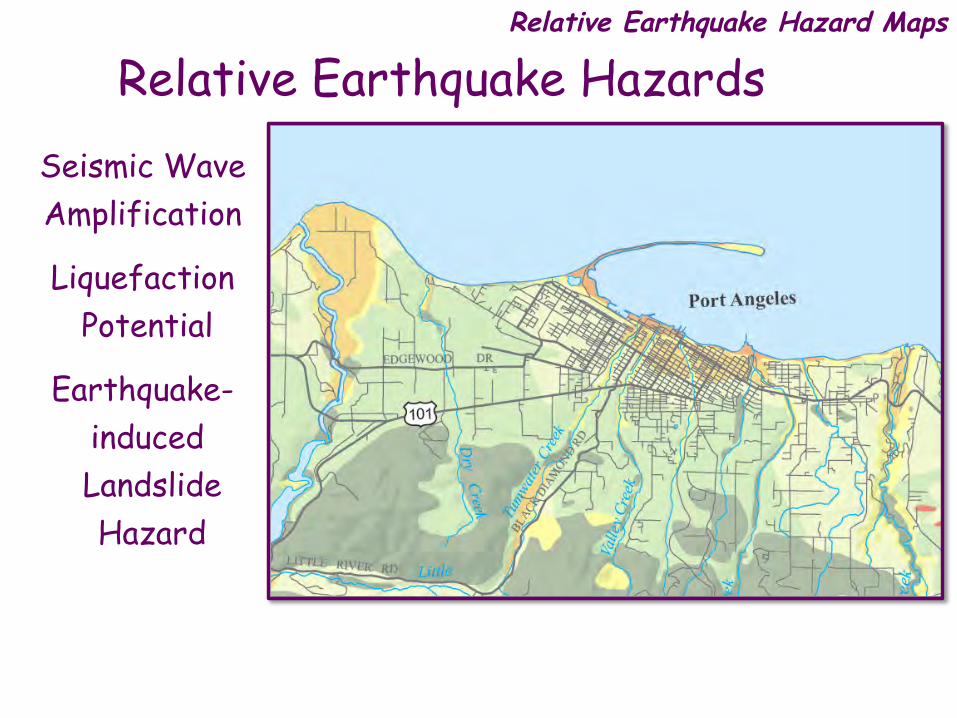
Relative Earthquake Hazards Seismic Wave Amplification
Liquefaction Potential
Earthquake- induced
Landslide Hazard
Relative Earthquake Hazard Maps

Resistance to shear is critical.
“Earthquakes don’t kill people ……. buildings that collapse during earthquake ground shaking kill people.”
Build a Better Wall
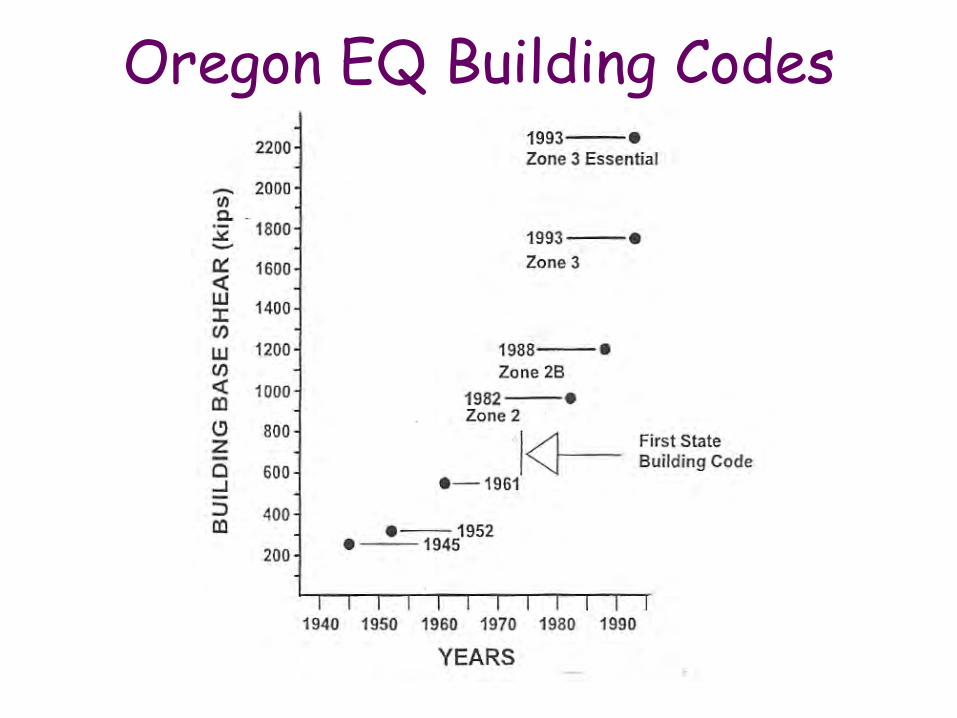
Oregon EQ Building Codes
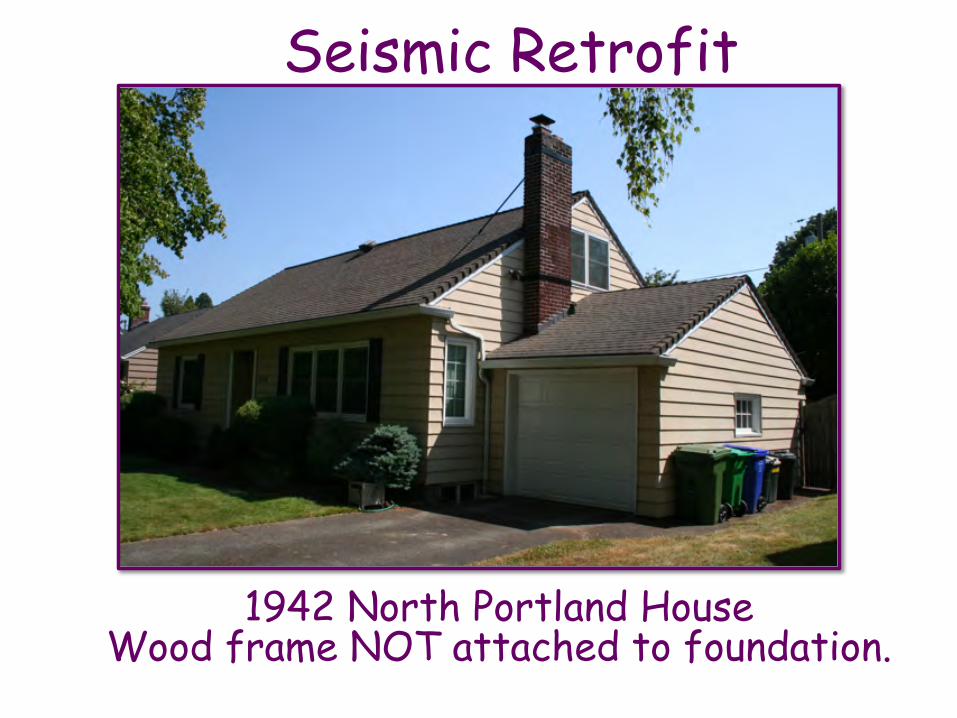
Seismic Retrofit
1942 North Portland House Wood frame NOT attached to foundation.
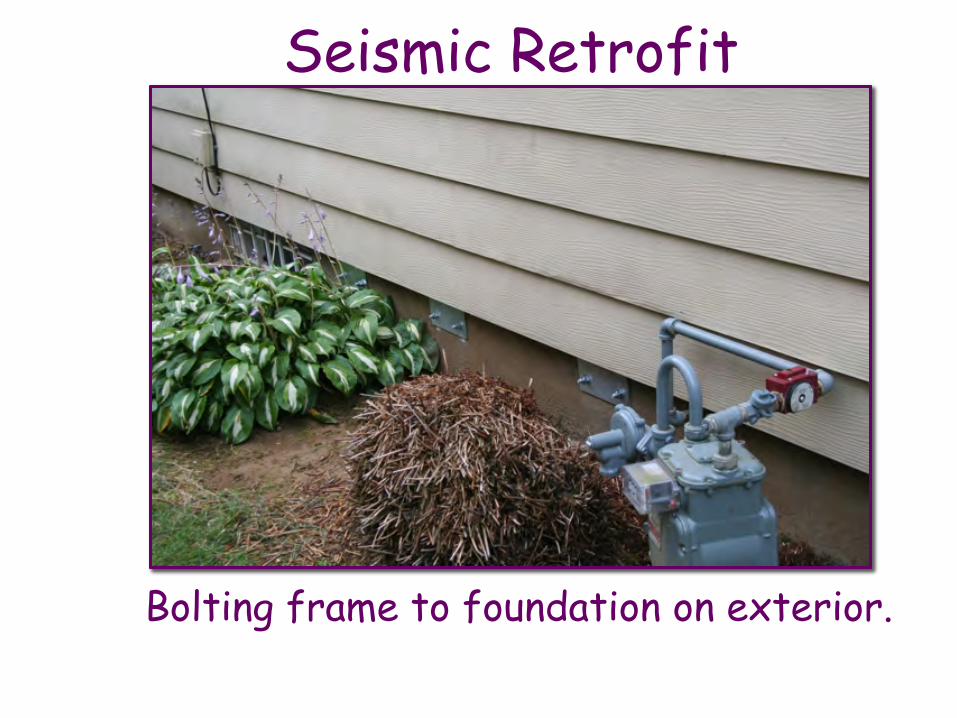
Seismic Retrofit
Bolting frame to foundation on exterior.
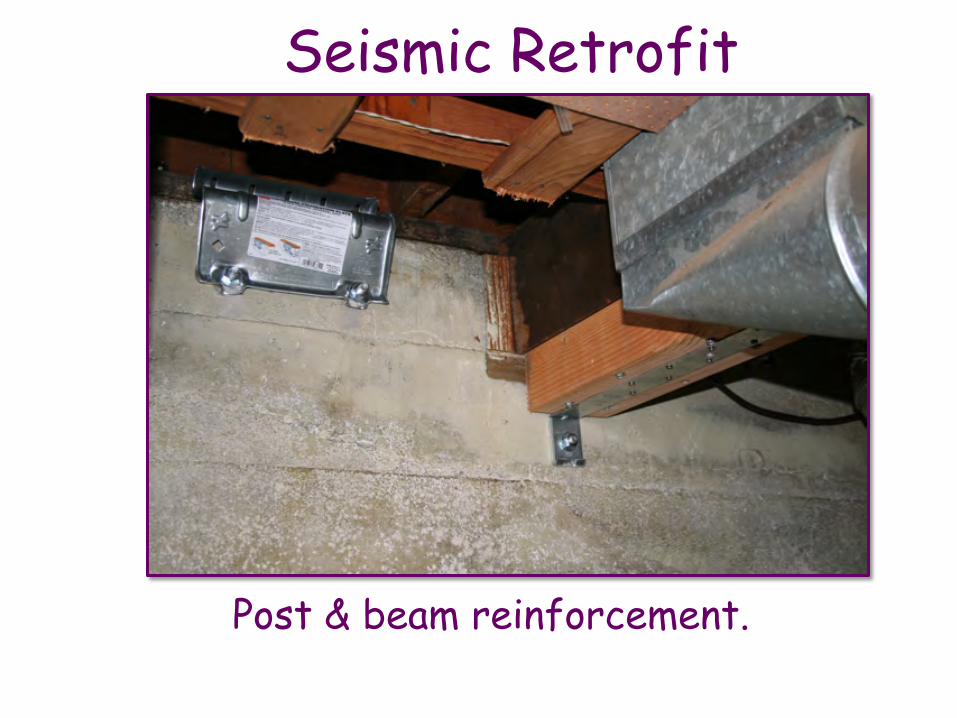
Seismic Retrofit
Post & beam reinforcement.
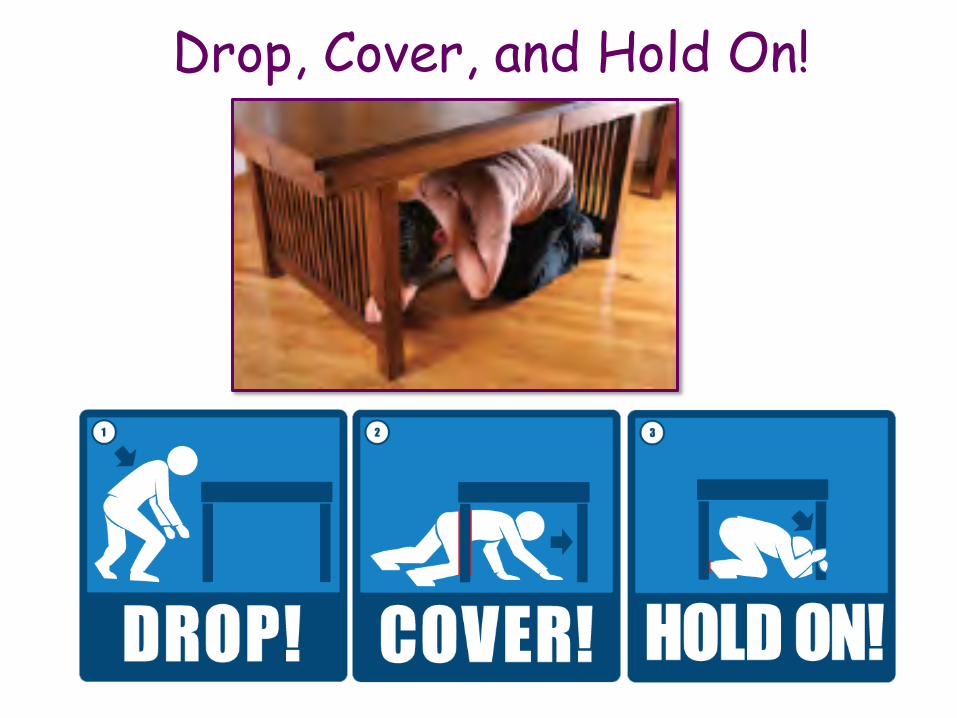
Drop, Cover, and Hold On!

• Divergent
• Transform
• Convergent
(subduction zones)
Three Types of Plate Boundaries
Tsunami

2011 Tohoku Earthquake and Tsunami
15,883 people killed; 6,145 missing; 2,671 injured; Recovery, Cleanup, and Rebuilding Cost = $235 Billion.
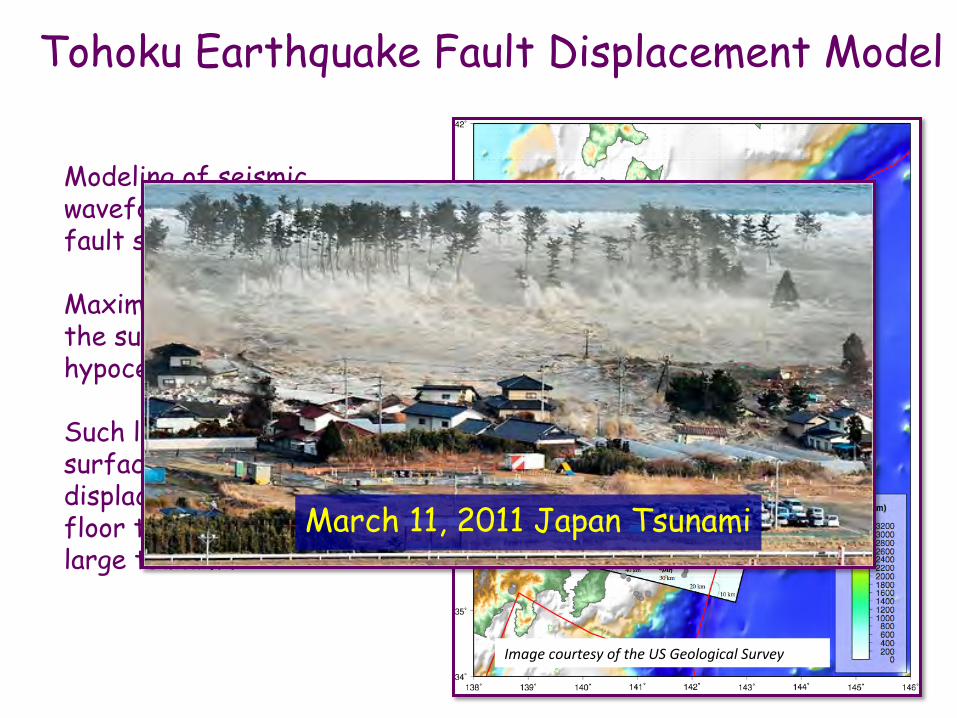
Modeling of seismic waveforms shows maximum fault slip over 30 meters! Maximum slip region is toward the surface from the hypocenter. Such large fault slip near the surface resulted in large displacement of the ocean floor that in turn generated a large tsunami.
Image courtesy of the US Geological Survey
Tohoku Earthquake Fault Displacement Model
March 11, 2011 Japan Tsunami

GPS Displacements During the Earthquake
4.42 meters (14.5 feet) of horizontal displacement
0.75 meters (2.5 feet) of subsidence
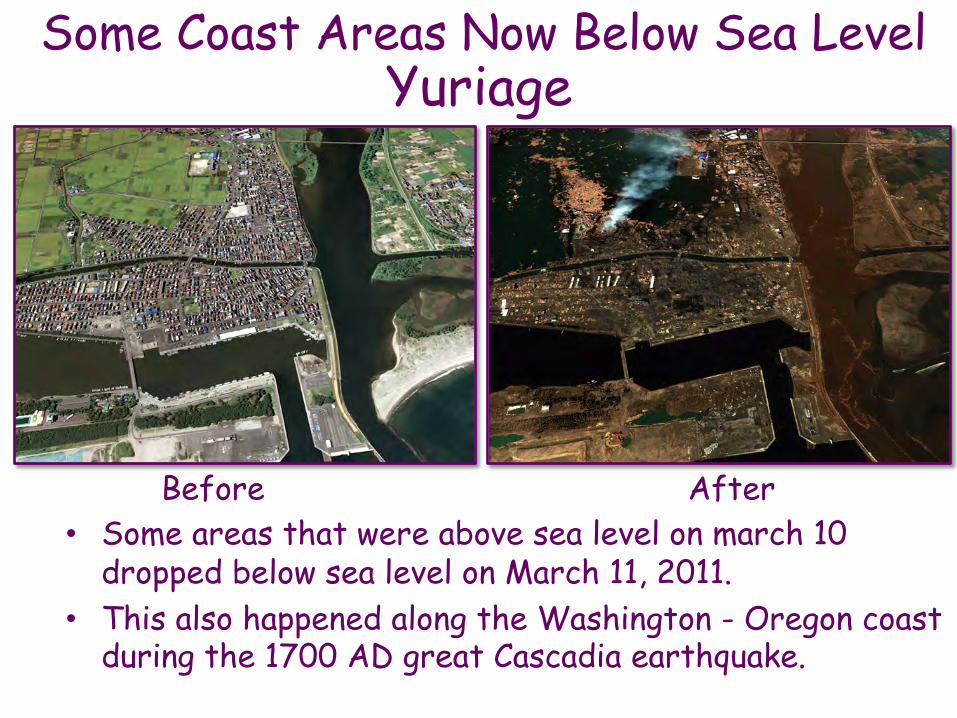
Some Coast Areas Now Below Sea Level Yuriage
Before After • Some areas that were above sea level on march 10
dropped below sea level on March 11, 2011. • This also happened along the Washington - Oregon coast
during the 1700 AD great Cascadia earthquake.

Tsunami Produced by Earthquake
Important points: LONG period: 20 - 60 minutes. Can flood on shore for 10 – 15 minutes. LONG wavelength: >800 kilometers (520 miles) Moves seawater all the way to floor of ocean.
In deep ocean, tsunami has small amplitude and travels with speed of jet airliner.
When approaching land, speed slows and amplitude increases dramatically. A tsunami is a SERIES of waves, not a single wave.

Tsunami Produced by Subduction Zone Earthquake
Why are tsunamis rarely produced by earthquakes along divergent and transform plate boundaries?

• Earthquake engineering works. Few buildings collapsed during the Tohoku earthquake. Cascadia must construct earthquake-resilient built environment.
• Earthquake and tsunami hazards education improves public safety. Tohoku tsunami inundation zone had 95% survival rate while Banda Aceh inundation zone had 10% survival rate.
Lessons from Tohoku, Japan
Tsunami Stones on Hillsides Message: “Do not build below this level.”
Cascadia Great Earthquakes and Tsunamis After Field Trip


Relative Earthquake Hazards Relative EQ Hazard
= Seismic Wave Amplification
+ Liquefaction Potential
+ Earthquake- induced Landslide Hazard
Relative Earthquake Hazard Maps


Relative Earthquake Hazards Relative EQ Hazard
Seismic Wave Amplification
Liquefaction Potential
Earthquake- induced
Landslide Hazard
Relative Earthquake Hazard Maps