
Motions, forces and mode transitions in vortex-induced ...
40
HAL Id: hal-03000247 https://hal.archives-ouvertes.fr/hal-03000247 Submitted on 12 Nov 2020 HAL is a multi-disciplinary open access archive for the deposit and dissemination of sci- entific research documents, whether they are pub- lished or not. The documents may come from teaching and research institutions in France or abroad, or from public or private research centers. L’archive ouverte pluridisciplinaire HAL, est destinée au dépôt et à la diffusion de documents scientifiques de niveau recherche, publiés ou non, émanant des établissements d’enseignement et de recherche français ou étrangers, des laboratoires publics ou privés. Distributed under a Creative Commons Attribution| 4.0 International License Motions, forces and mode transitions in vortex-induced vibrations at low mass-damping Asif Khalak, Charles Williamson To cite this version: Asif Khalak, Charles Williamson. Motions, forces and mode transitions in vortex-induced vibra- tions at low mass-damping. Journal of Fluids and Structures, Elsevier, 1999, 13 (7-8), pp.813-851. 10.1006/jfls.1999.0236. hal-03000247
-
Upload
khangminh22 -
Category
Documents
-
view
3 -
download
0
Transcript of Motions, forces and mode transitions in vortex-induced ...
HAL Id: hal-03000247https://hal.archives-ouvertes.fr/hal-03000247
Submitted on 12 Nov 2020
HAL is a multi-disciplinary open accessarchive for the deposit and dissemination of sci-entific research documents, whether they are pub-lished or not. The documents may come fromteaching and research institutions in France orabroad, or from public or private research centers.
L’archive ouverte pluridisciplinaire HAL, estdestinée au dépôt et à la diffusion de documentsscientifiques de niveau recherche, publiés ou non,émanant des établissements d’enseignement et derecherche français ou étrangers, des laboratoirespublics ou privés.
Distributed under a Creative Commons Attribution| 4.0 International License
Motions, forces and mode transitions in vortex-inducedvibrations at low mass-damping
Asif Khalak, Charles Williamson
To cite this version:Asif Khalak, Charles Williamson. Motions, forces and mode transitions in vortex-induced vibra-tions at low mass-damping. Journal of Fluids and Structures, Elsevier, 1999, 13 (7-8), pp.813-851.�10.1006/jfls.1999.0236�. �hal-03000247�
MOTIONS, FORCES AND MODE TRANSITIONS
IN VORTEX-INDUCED VIBRATIONS AT LOW
MASS-DAMPING
A. KHALAK* AND C. H. K. WILLIAMSON
Mechanical and Aerospace Engineering, Upson Hall, Cornell University, Ithaca,
NY 14853, U.S.A.
These experiments, involving the transverse oscillations of an elastically mounted rigid cylinderat very low mass and damping, have shown that there exist two distinct types of response insuch systems, depending on whether one has a low combined mass-damping parameter (lowm*�), or a high mass-damping (high m*�). For our low m*�, we "nd three modes of response,which are denoted as an initial amplitude branch, an upper branch and a lower branch. For theclassical Feng-type response, at high m*�, there exist only two response branches, namely theinitial and lower branches. The peak amplitude of these vibrating systems is principallydependent on the mass-damping (m*�), whereas the regime of synchronization (measured by therange of velocity ;*) is dependent primarily on the mass ratio, m*. At low (m*�), the transitionbetween initial and upper response branches involves a hysteresis, which contrasts with theintermittent switching of modes found, using the Hilbert transform, for the transition betweenupper}lower branches. A 1803 jump in phase angle � is found only when the #ow jumpsbetween the upper}lower branches of response. The good collapse of peak-amplitude data, overa wide range of mass ratios (m*"1}20), when plotted against (m*#C
�)� in the &&Gri$n'' plot,
demonstrates that the use of a combined parameter is valid down to at least (m*#C�)�
&0)006. This is two orders of magnitude below the &&limit'' that had previously been stipulatedin the literature, (m*#C
�)�'0)4. Using the actual oscillating frequency ( f ) rather than the
still-water natural frequency ( f�), to form a normalized velocity (;*/f* ), also called &&true''
reduced velocity in recent studies, we "nd an excellent collapse of data for a set of responseamplitude plots, over a wide range of mass ratios m*. Such a collapse of response plots cannotbe predicted a priori, and appears to be the "rst time such a collapse of data sets has been madein free vibration. The response branches match very well the Williamson}Roshko (Williamson& Roshko 1988) map of vortex wake patterns from forced vibration studies. Visualization of themodes indicates that the initial branch is associated with the 2S mode of vortex formation, whilethe Lower branch corresponds with the 2P mode. Simultaneous measurements of lift and draghave been made with the displacement, and show a large ampli"cation of maximum, mean and#uctuating forces on the body, which is not unexpected. It is possible to simply estimate the liftforce and phase using the displacement amplitude and frequency. This approach is reasonableonly for very low m*. � 1999 Academic Press.
REVIEW AND PRELIMINARY RESULTS
VORTEX-INDUCED vibration of structures is of practical interest to many "elds of engineering;for example, it can cause vibrations in heat exchanger tubes, it in#uences the dynamics ofriser tubes bringing oil from the seabed to the surface, it is important to the design of civil
*Current address: Gas Turbine Laboratory, M.I.T., Cambridge, 02139, U.S.A.
1
engineering structures such as bridges and chimneys stacks, as well as to the design ofmarine and land vehicles, and it can cause large-amplitude vibrations of tethered structuresin the ocean. These examples are but a few in a large number of problems where vortex-induced vibrations (VIV) are important. The practical signi"cance of vortex-induced vibra-tion has led to a large number of fundamental studies, many of which are discussed in thecomprehensive reviews of Sarpkaya (1979), Gri$n & Ramberg (1982), Bearman (1984),Parkinson (1989), and in the books by Blevins (1990), Naudascher & Rockwell (1993), andSumer & Freds+e (1997). In the present work, we are concerned with the transverseoscillations of an elastically mounted rigid cylinder, where there is presently a renewedinterest to investigate experimental conditions of very low mass and damping, and tocompare with the many direct numerical simulations (DNS) of this #ow, now beingconducted, where mass and damping can actually be set to zero. Related studies on #exiblecylinders [for example, Vickery and Watkins (1964), Fujarra et al. (1998), Saltara et al.(1998), Pesce & Fujarra (1999)], on articulated or pivoted cylinders [for example, Atsavap-ranee et al. (1998)], and on cylinders in a shear #ow (Stansby 1976; Gri$n 1985; Balasub-ramanian & Skop 1996) have also received renewed attention, fuelled in part by the presentinterest in dynamics of o!shore structures and tethered bodies.
In the relatively simple case of the elastically mounted cylinder there exist, however, somefundamental questions concerning vibration phenomena for very low mass and damping,for which there are very few laboratory investigations. Four of these questions, which shallform the main backbone to this introductory review and to the rest of this paper, and whichare a stimulus to our ongoing research, are listed below.
(i) Combined mass}damping parameter: Under what conditions does the classically em-ployed combined &&mass}damping parameter'' collapse peak amplitude data? What is thefunctional shape for a plot of peak amplitude versus mass}damping?
(ii) Maximum amplitude: What is the maximum amplitude attainable for a cylinderundergoing vortex-induced vibration, for conditions of extremely small mass and damping?
(iii) Response modes and mode jumps: What modes of response exist, and what are thecorresponding wake vortex dynamics? How (and why) do the #ow transitions occurbetween di!erent modes?
(iv) De,nition of synchronization: How does one usefully de"ne synchronization orlock-in for this problem?
Before addressing these questions in the light of previous investigations and the presentwork, we need "rst to introduce an equation of motion generally used to represent thevortex-induced vibrations of a cylinder oscillating in the transverse y-direction (normal tothe #ow), as follows:
myK#cyR #ky"F, (1)
where m is the total oscillating structural mass, c the structural damping, k the springconstant, and F the #uid force in the transverse direction. In the regime where the body
oscillation frequency is synchronized with the periodic vortex wake mode (or synchronizedwith the frequency of induced force on the body), a good approximation to the force and theresponse is given by
F (t)"F�sin (�t#�), (2)
y(t)"y�
sin (�t), (3)
where �"2�f, and f is the body oscillation frequency. We shall see shortly that the phaseangle � is vitally important in governing the body response in this problem, as has beenshown clearly in the many reviews [e.g. Sarpkaya (1979), Bearman (1984)]. The response of
2
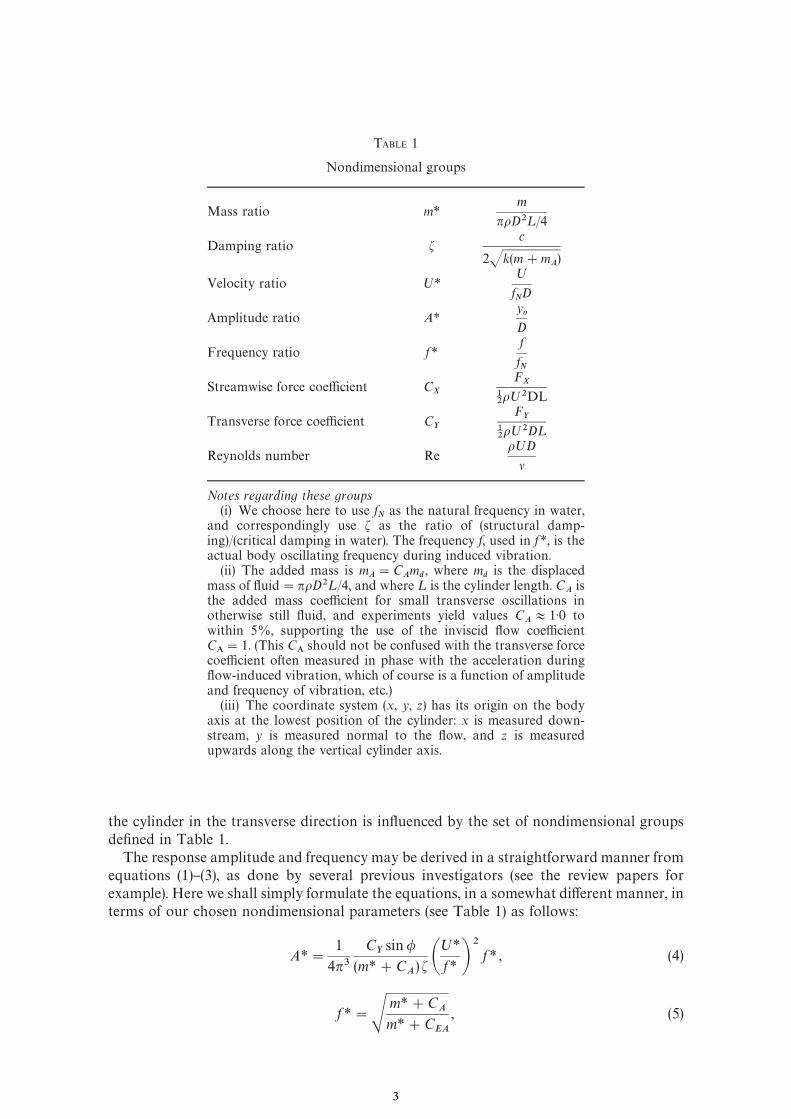
TABLE 1
Nondimensional groups
Mass ratio m*m
��D�¸/4
Damping ratio �c
2�k(m#m�)
Velocity ratio ;*;
f�D
Amplitude ratio A*y�
D
Frequency ratio f *f
f�
Streamwise force coe$cient C�
F�
���;�DL
Transverse force coe$cient C�
F�
���;�D¸
Reynolds number Re�;D
�
Notes regarding these groups(i) We choose here to use f
�as the natural frequency in water,
and correspondingly use � as the ratio of (structural damp-ing)/(critical damping in water). The frequency f, used in f *, is theactual body oscillating frequency during induced vibration.
(ii) The added mass is m�"C
�m
�, where m
�is the displaced
mass of #uid"��D�¸/4, and where ¸ is the cylinder length. C�
isthe added mass coe$cient for small transverse oscillations inotherwise still #uid, and experiments yield values C
�+1)0 to
within 5%, supporting the use of the inviscid #ow coe$cientC
�"1. (This C
�should not be confused with the transverse force
coe$cient often measured in phase with the acceleration during#ow-induced vibration, which of course is a function of amplitudeand frequency of vibration, etc.)
(iii) The coordinate system (x, y, z) has its origin on the bodyaxis at the lowest position of the cylinder: x is measured down-stream, y is measured normal to the #ow, and z is measuredupwards along the vertical cylinder axis.
the cylinder in the transverse direction is in#uenced by the set of nondimensional groupsde"ned in Table 1.
The response amplitude and frequency may be derived in a straightforward manner fromequations (1)}(3), as done by several previous investigators (see the review papers forexample). Here we shall simply formulate the equations, in a somewhat di!erent manner, interms of our chosen nondimensional parameters (see Table 1) as follows:
A*"1
4��
C�sin�
(m*#C�) � �;*
f* ��
f * , (4)
f *"�m*#C
�m*#C
��
, (5)
3
where C�
is the potential added mass coe$cient, and C��
is an &&e!ective'' added masscoe$cent that includes an apparent e!ect due to the total transverse #uid force in-phasewith the body acceleration (C
�cos � ):
C��
"1
2��
C�cos�
A* �;*
f * ��. (6)
It should be noted that the amplitude A* is proportional to the transverse force componentthat is in phase with the body velocity (C
�sin�), and we shall see experimentally that, for
small mass and damping, the precise value of the phase angle � has a large e!ect on theresponse amplitude.
One of the most fundamental questions listed at the start of the introductory review is the"rst: How is the maximum response amplitude a function of system mass and damping?Generally, in the literature, this information has been plotted as A*
���versus a parameter,
S, proportional to the product of mass and damping, following the "rst comprehensive
compilation of existing data by Gri$n and co-workers in the 1970s, and labelled here forconvenience as the &&Gri$n'' plot. This classical plot has recently been updated by Skop &Balasubramanian (1997), and their compiled data is included in Figure 1, showing thecharacteristic shape whereby the amplitude reaches some limiting value as mass anddamping (or S
) become small. The logic in choosing a combined parameter involving the
product of mass and damping comes from observation of equation (4) for A*, and has beendiscussed in many previous papers. Bearman (1984), for example, discusses in his review thatfor large mass ratios (m*�1), the actual cylinder oscillation frequency ( f ) at resonance willbe close to the vortex-shedding frequency for the static cylinder ( f
�), and also close to the
system natural frequency (f�), i.e. f+f
+f
�, and thus f *+1)0 [see equation (5), for large
m*]. Thus at resonance, the parameter (;*/ f*)"(;/ fD)+(;/ fD)"1/S, where S is the
Strouhal number of the static cylinder, yielding an expected resonance of cylinder response,over a wide range of Re, to occur at the normalized velocity, ;*+5}6. The assumption istherefore often made that both (;*/ f *) and f * are constants, under resonance conditions,giving
A*���
JC
�sin �.
(m*#C�) �
. (7)
One should note that, if (;*/f *) is assumed constant, the excitation (C�sin �) is a
function of �A*� only. Therefore, under these assumptions, A*���
is a function onlyof the product of mass and damping (m*#C
�) �. Incidentally, one may then derive,
from the Gri$n plot data in Figure 1, the functional relationship between (C�sin�) and
A*���
. One must stress that equation (7) is of course dependent on the earlier assumptionsremaining reasonable (i.e. f *+1)0), which is not self-evident over a large range of mass anddamping.
A number of mass}damping parameters have been introduced and are in general use.Vickery & Watkins (1964), who considered an equation of motion for #exible cantilevers,plotted their peak amplitudes versus a &&stability parameter'', K
�, de"ned as
stability parameter"K�"�� (m*�). (8)
Scruton (1965) used a parameter, proportional to K�, for his experiments on elastically
mounted cylinders, which has since been termed the Scruton number, [Sc]:
Scruton number"Sc"�
2(m*�). (9)
4
A slightly di!erent parameter was independently derived from a response analysisinvolving the van der Pol equation by Skop and Gri$n (1973), and they began to compiledata from several di!erent experiments as a means to usefully predict response amplitudes.The combined response parameter was subsequently termed S
in Skop (1974), and we
de"ne it here as follows:
Skop}Gri$n parameter"S"2��S� (m*�). (10)
The "rst extensive compilations of many di!erent investigations was made in Gri$n et al.(1975), using S
, and subsequently the classical log}log form of the plot (Gri$n 1980) has
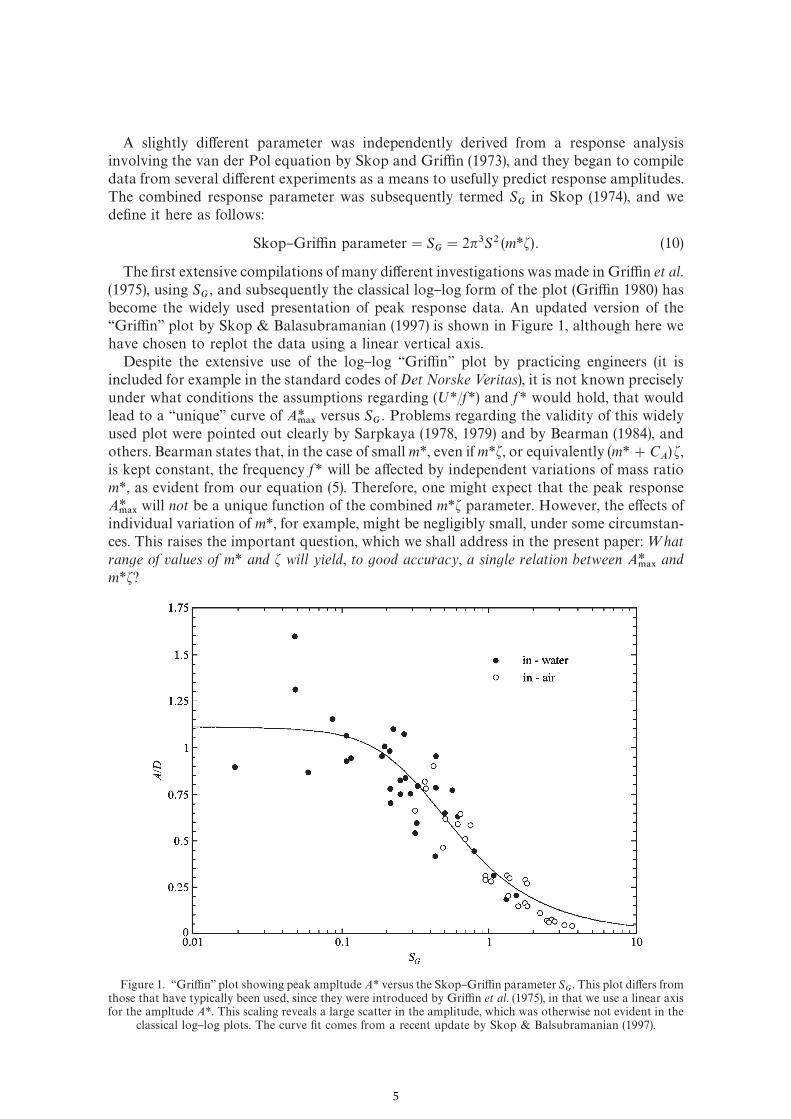
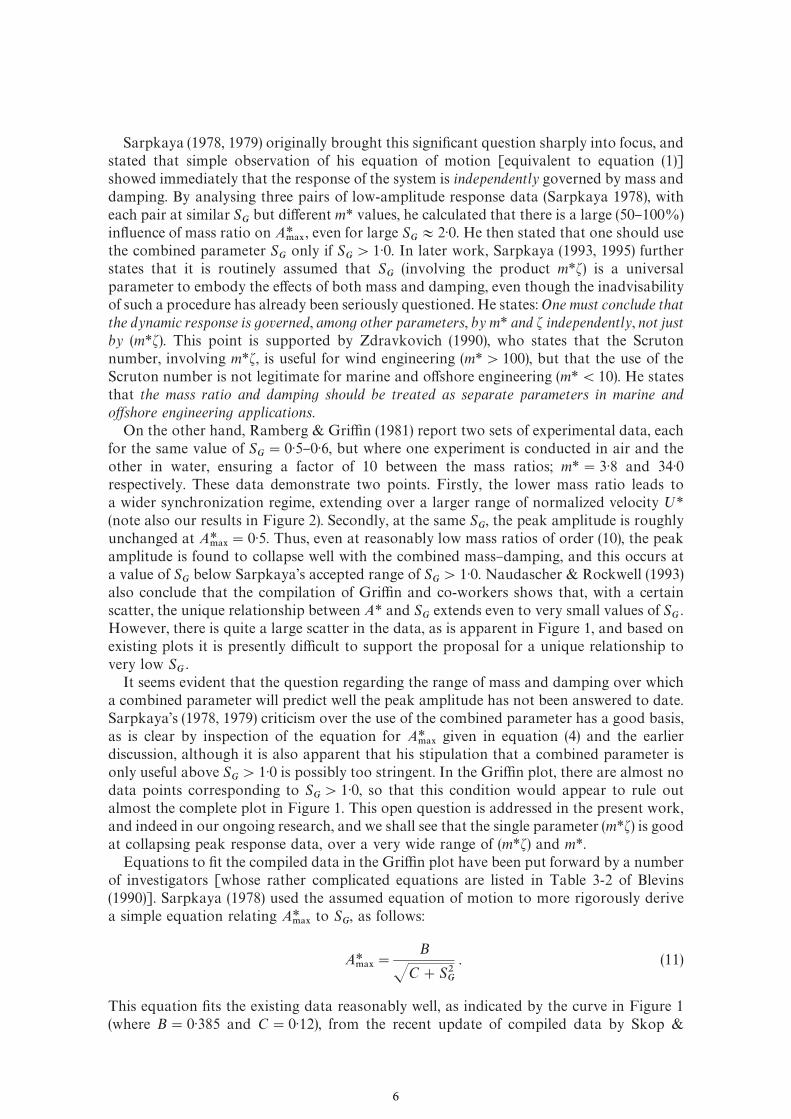
become the widely used presentation of peak response data. An updated version of the&&Gri$n'' plot by Skop & Balasubramanian (1997) is shown in Figure 1, although here wehave chosen to replot the data using a linear vertical axis.
Despite the extensive use of the log}log &&Gri$n'' plot by practicing engineers (it isincluded for example in the standard codes of Det Norske <eritas), it is not known preciselyunder what conditions the assumptions regarding (;*/f*) and f * would hold, that wouldlead to a &&unique'' curve of A*
���versus S
. Problems regarding the validity of this widely
used plot were pointed out clearly by Sarpkaya (1978, 1979) and by Bearman (1984), andothers. Bearman states that, in the case of small m*, even if m*�, or equivalently (m*#C
�)�,
is kept constant, the frequency f * will be a!ected by independent variations of mass ratiom*, as evident from our equation (5). Therefore, one might expect that the peak responseA*
���will not be a unique function of the combined m*� parameter. However, the e!ects of
individual variation of m*, for example, might be negligibly small, under some circumstan-ces. This raises the important question, which we shall address in the present paper:=hat
range of values of m* and � will yield, to good accuracy, a single relation between A*���
and
m*�?
Figure 1. &&Gri$n'' plot showing peak ampltude A* versus the Skop}Gri$n parameter S. This plot di!ers from
those that have typically been used, since they were introduced by Gri$n et al. (1975), in that we use a linear axisfor the ampltude A*. This scaling reveals a large scatter in the amplitude, which was otherwise not evident in the
classical log}log plots. The curve "t comes from a recent update by Skop & Balsubramanian (1997).
5
Sarpkaya (1978, 1979) originally brought this signi"cant question sharply into focus, andstated that simple observation of his equation of motion [equivalent to equation (1)]showed immediately that the response of the system is independently governed by mass anddamping. By analysing three pairs of low-amplitude response data (Sarpkaya 1978), witheach pair at similar S
but di!erent m* values, he calculated that there is a large (50}100%)
in#uence of mass ratio on A*���
, even for large S+2)0. He then stated that one should use
the combined parameter S
only if S'1)0. In later work, Sarpkaya (1993, 1995) further
states that it is routinely assumed that S
(involving the product m*�) is a universalparameter to embody the e!ects of both mass and damping, even though the inadvisabilityof such a procedure has already been seriously questioned. He states: One must conclude that
the dynamic response is governed, among other parameters, by m* and � independently, not just
by (m*�). This point is supported by Zdravkovich (1990), who states that the Scrutonnumber, involving m*�, is useful for wind engineering (m*'100), but that the use of theScruton number is not legitimate for marine and o!shore engineering (m*(10). He statesthat the mass ratio and damping should be treated as separate parameters in marine and
o+shore engineering applications.On the other hand, Ramberg & Gri$n (1981) report two sets of experimental data, each
for the same value of S"0)5}0)6, but where one experiment is conducted in air and the
other in water, ensuring a factor of 10 between the mass ratios; m*"3)8 and 34)0respectively. These data demonstrate two points. Firstly, the lower mass ratio leads toa wider synchronization regime, extending over a larger range of normalized velocity ;*
(note also our results in Figure 2). Secondly, at the same S, the peak amplitude is roughly
unchanged at A*���
"0)5. Thus, even at reasonably low mass ratios of order (10), the peakamplitude is found to collapse well with the combined mass}damping, and this occurs ata value of S
below Sarpkaya's accepted range of S
'1)0. Naudascher & Rockwell (1993)
also conclude that the compilation of Gri$n and co-workers shows that, with a certainscatter, the unique relationship between A* and S
extends even to very small values of S
.
However, there is quite a large scatter in the data, as is apparent in Figure 1, and based onexisting plots it is presently di$cult to support the proposal for a unique relationship tovery low S
.
It seems evident that the question regarding the range of mass and damping over whicha combined parameter will predict well the peak amplitude has not been answered to date.Sarpkaya's (1978, 1979) criticism over the use of the combined parameter has a good basis,as is clear by inspection of the equation for A*
���given in equation (4) and the earlier
discussion, although it is also apparent that his stipulation that a combined parameter isonly useful above S
'1)0 is possibly too stringent. In the Gri$n plot, there are almost no
data points corresponding to S'1)0, so that this condition would appear to rule out
almost the complete plot in Figure 1. This open question is addressed in the present work,and indeed in our ongoing research, and we shall see that the single parameter (m*�) is goodat collapsing peak response data, over a very wide range of (m*�) and m*.
Equations to "t the compiled data in the Gri$n plot have been put forward by a numberof investigators [whose rather complicated equations are listed in Table 3-2 of Blevins(1990)]. Sarpkaya (1978) used the assumed equation of motion to more rigorously derivea simple equation relating A*
���to S
, as follows:
A*���
"B
�C#S�
. (11)
This equation "ts the existing data reasonably well, as indicated by the curve in Figure 1(where B"0)385 and C"0)12), from the recent update of compiled data by Skop &
6
Balsubramanian (1997). It should be noted, however, that B and C are not constants. Thevalue of B is proportional to force coe$cient C
�, for example, and Sarpkaya noted that
C�
evidently depends on A* (in fact, it strongly depends on A*). Therefore, one cannotassume that such a formulation will accurately "t the data, a priori. In fact, an even simplerformulation is put forward in Triantafyllou & Grosenbaugh (1995), where they empiricallyrepresent C
�sin� as a linear function of A*:
A*���
"D
E#S
, (12)
which also "ts the Gri$n plot data reasonably well. The question of how well suchformulations "t the data, when A* is evaluated systematically over a range of mass anddamping in a single set of experiments, has not been addressed before, and this provides partof the impetus for the present and ongoing work.
We now return to the second question addressed at the start of Section 1, which isperhaps the most basic question one may ask of such an elastically mounted system:=hat
is the absolute largest attainable amplitude? Despite the very large number of investigationson this problem, the precise answer to this question does not appear to be known. Anestimate of this largest amplitude is given by the limit of A* as mass and damping tend tozero, or in the case of DNS computations, when m* or � are set precisely to zero.
Peak amplitudes, evaluated from the curve "ts in the &&Gri$n'' plots under the limit ofzero mass}damping, yield values of A*"1)3 (Gri$n & Ramberg 1982; Sarpkaya 1978),whereas the most recent update of compiled data by Skop & Balasubramanian (1997) givesA*"1)1, as indicated in Figure 1. From both forced oscillations and &&equivalent'' freevibration experiments, Hover et al. (1997, 1998) give maximum possible amplitudes for zeromass-damping as A*"0)8. Predictions of the peak amplitude are also given by plots ofmaximum &&excitation'' C
�sin � versus A* [see Gri$n (1980), Bearman's (1984) Figure 5].
The peak expected amplitude for zero damping is to be found when the excitation C�sin� is
also zero, which is found when roughly A*"1)5, as mentioned by Bearman (1984) and byNaudascher & Rockwell (1993). From the above evidence, one may conclude that thelargest attainable amplitude lies anywhere between 0)8 and 1)5. The large disparity concern-ing this amplitude limit was the subject of much debate at the recent Conference on Blu+
Body=akes and <ortex-Induced <ibration (Washington, DC, June 1998); see Bearman &Williamson (1998).
By studying the data listed here, we conclude that the surprisingly large range of typicallyquoted peak amplitude is caused by the inherent large scatter in the existing data, and alsoby the fact that the Gri$n plot and the excitation plot (involving C
�sin �), both tradition-
ally used for prediction purposes, actually comprise data for cantilevers and for pivotedcylinders, as well as for elastically mounted cylinders. Compiling all of these results, fromquite di!erent physical experiments, into a single plot, with the hope that a single curve ofdata may ensue, might not therefore be reasonable.
To clarify this point, we present, in Table 2, an updated compilation of peak amplitudedata from previous experiments conducted in water facilities (only), where mass ratios m*
are typically much smaller (and responses typically larger) than found in air facilities. Muchof the data is very recent, and we also include direct numerical simulations (DNS) results.Some deductions may be made from this assembled data; for example, Table 2(A) suggeststhat in no experiment for elastically mounted rigid cylinders to-date, does the peakamplitude actually exceed A*"1)13. Correspondingly, the data in Table 2(C), showing thepeak amplitudes at which the excitation force (C
�sin�) for oscillating rigid cylinders
becomes zero, also indicates an upper limit, for all the previous studies, of roughly A*"1)1.
7
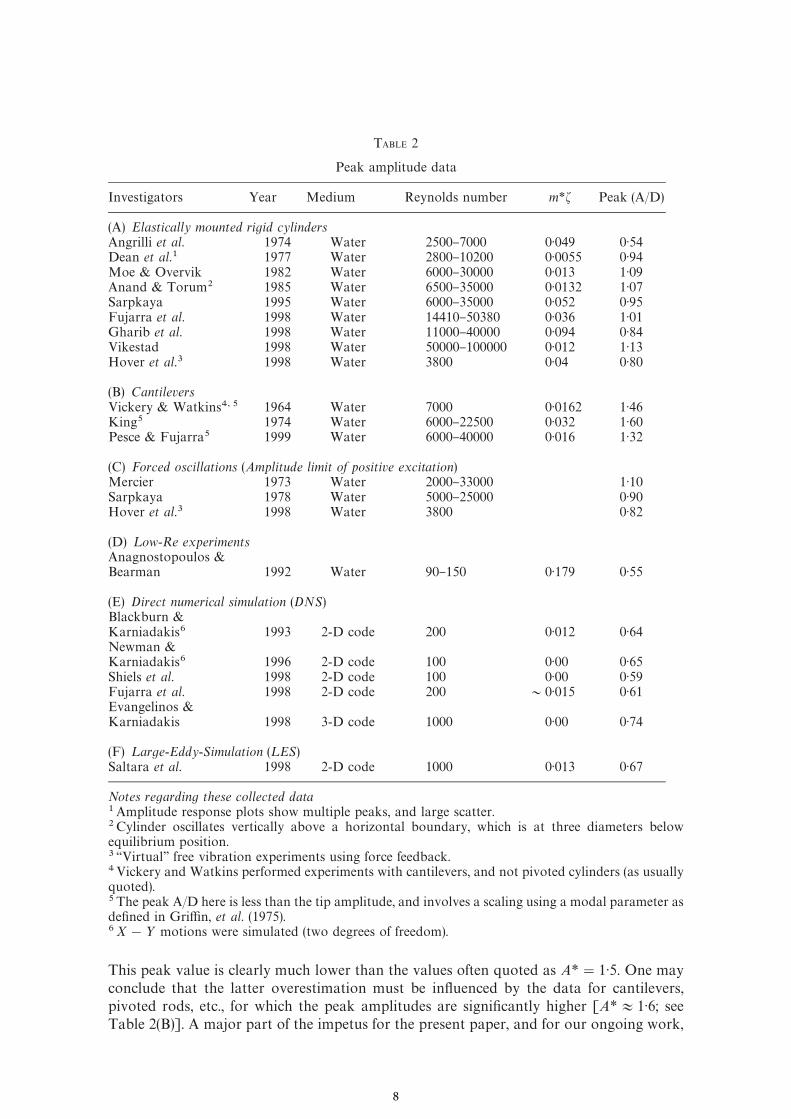
TABLE 2
Peak amplitude data
Investigators Year Medium Reynolds number m*� Peak (A/D)
(A) Elastically mounted rigid cylindersAngrilli et al. 1974 Water 2500}7000 0)049 0)54Dean et al.� 1977 Water 2800}10200 0)0055 0)94Moe & Overvik 1982 Water 6000}30000 0)013 1)09Anand & Torum� 1985 Water 6500}35000 0)0132 1)07Sarpkaya 1995 Water 6000}35000 0)052 0)95Fujarra et al. 1998 Water 14410}50380 0)036 1)01Gharib et al. 1998 Water 11000}40000 0)094 0)84Vikestad 1998 Water 50000}100000 0)012 1)13Hover et al.� 1998 Water 3800 0)04 0)80
(B) CantileversVickery & Watkins�� 1964 Water 7000 0)0162 1)46King 1974 Water 6000}22500 0)032 1)60Pesce & Fujarra 1999 Water 6000}40000 0)016 1)32
(C) Forced oscillations (Amplitude limit of positive excitation)Mercier 1973 Water 2000}33000 1)10Sarpkaya 1978 Water 5000}25000 0)90Hover et al.� 1998 Water 3800 0)82
(D) ¸ow-Re experimentsAnagnostopoulos &Bearman 1992 Water 90}150 0)179 0)55
(E) Direct numerical simulation (DNS)Blackburn &Karniadakis 1993 2-D code 200 0)012 0)64Newman &Karniadakis 1996 2-D code 100 0)00 0)65Shiels et al. 1998 2-D code 100 0)00 0)59Fujarra et al. 1998 2-D code 200 &0)015 0)61Evangelinos &Karniadakis 1998 3-D code 1000 0)00 0)74
(F) ¸arge-Eddy-Simulation (¸ES)Saltara et al. 1998 2-D code 1000 0)013 0)67
Notes regarding these collected data�Amplitude response plots show multiple peaks, and large scatter.�Cylinder oscillates vertically above a horizontal boundary, which is at three diameters belowequilibrium position.� &&Virtual'' free vibration experiments using force feedback.�Vickery and Watkins performed experiments with cantilevers, and not pivoted cylinders (as usuallyquoted).The peak A/D here is less than the tip amplitude, and involves a scaling using a modal parameter asde"ned in Gri$n, et al. (1975).X!> motions were simulated (two degrees of freedom).
This peak value is clearly much lower than the values often quoted as A*"1)5. One mayconclude that the latter overestimation must be in#uenced by the data for cantilevers,pivoted rods, etc., for which the peak amplitudes are signi"cantly higher [A*+1)6; seeTable 2(B)]. A major part of the impetus for the present paper, and for our ongoing work,
8
has been triggered by the need to precisely determine the maximum possible amplitude atvery small mass and damping.
It should also be noted from the data in Table 2(E,F) that DNS computations ofvortex-induced vibrations all yield a maximum of around A*"0)6}0)7, which is signi"-cantly lower than the peak response found in experiment. One possibility is that this #ow isReynolds number dependent for the low Reynolds numbers, Re"100}200, typically usedin the simulations. (This is contrasted with typical values of Re"10�}10 for the experi-mental data). Support for this present suggestion of a Reynolds number e!ect comes alsofrom the experiments of Anagnostopoulos & Bearman (1992), who "nd low peak responsesimilar to the simulations, A*"0)55, when they use similar low Reynolds numbers in therange, Re"90}150. This disparity between high-Re experiment and low-Re simulation willbe further discussed in the present paper, in the light of our own response measurements,and remains a very interesting unanswered question.
We shall now consider the third question posed at the start of Section 1, namely thequestion:=hat modes of response exist, as a function of mass ratio and damping? Previousinvestigations of the response amplitude as a function of normalized velocity ;* revealed,not only a resonance near the condition where f+f
�+f
�, but also a hysteresis whereby the
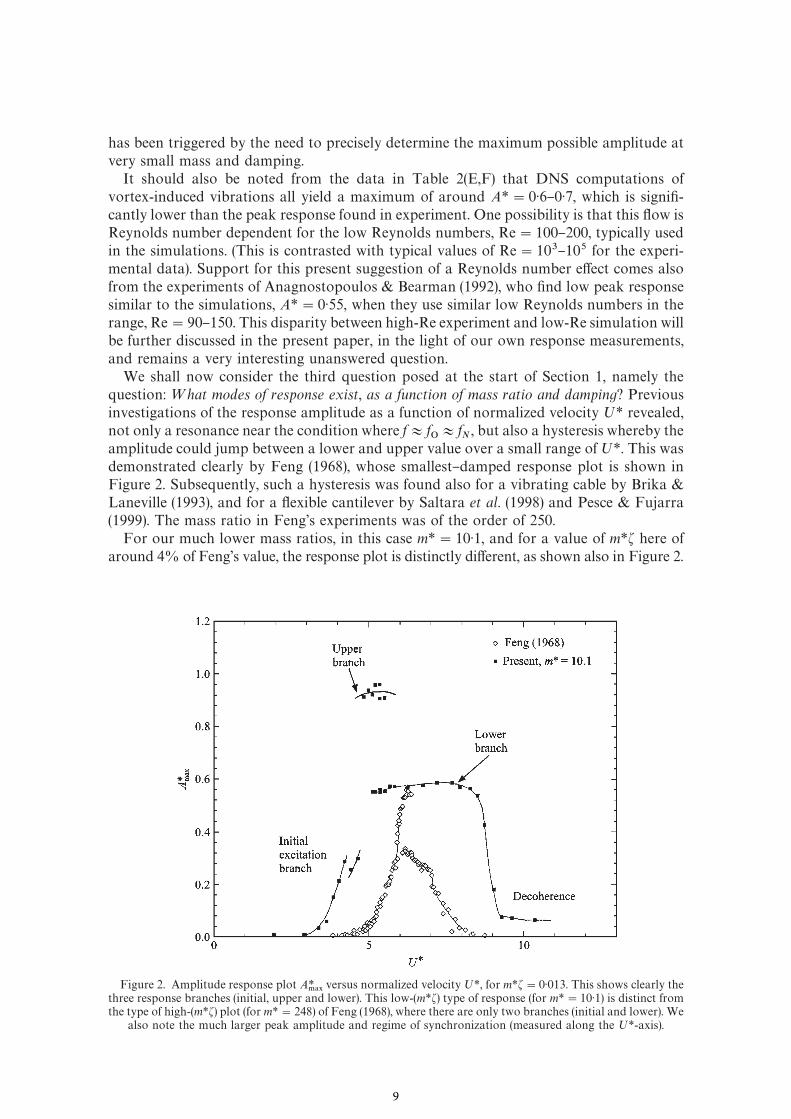
amplitude could jump between a lower and upper value over a small range of;*. This wasdemonstrated clearly by Feng (1968), whose smallest}damped response plot is shown inFigure 2. Subsequently, such a hysteresis was found also for a vibrating cable by Brika &Laneville (1993), and for a #exible cantilever by Saltara et al. (1998) and Pesce & Fujarra(1999). The mass ratio in Feng's experiments was of the order of 250.
For our much lower mass ratios, in this case m*"10)1, and for a value of m*� here ofaround 4% of Feng's value, the response plot is distinctly di!erent, as shown also in Figure 2.
Figure 2. Amplitude response plot A*���
versus normalized velocity;*, for m*�"0)013. This shows clearly thethree response branches (initial, upper and lower). This low-(m*�) type of response (for m*"10)1) is distinct fromthe type of high-(m*�) plot (for m*"248) of Feng (1968), where there are only two branches (initial and lower). We
also note the much larger peak amplitude and regime of synchronization (measured along the ;*-axis).
9
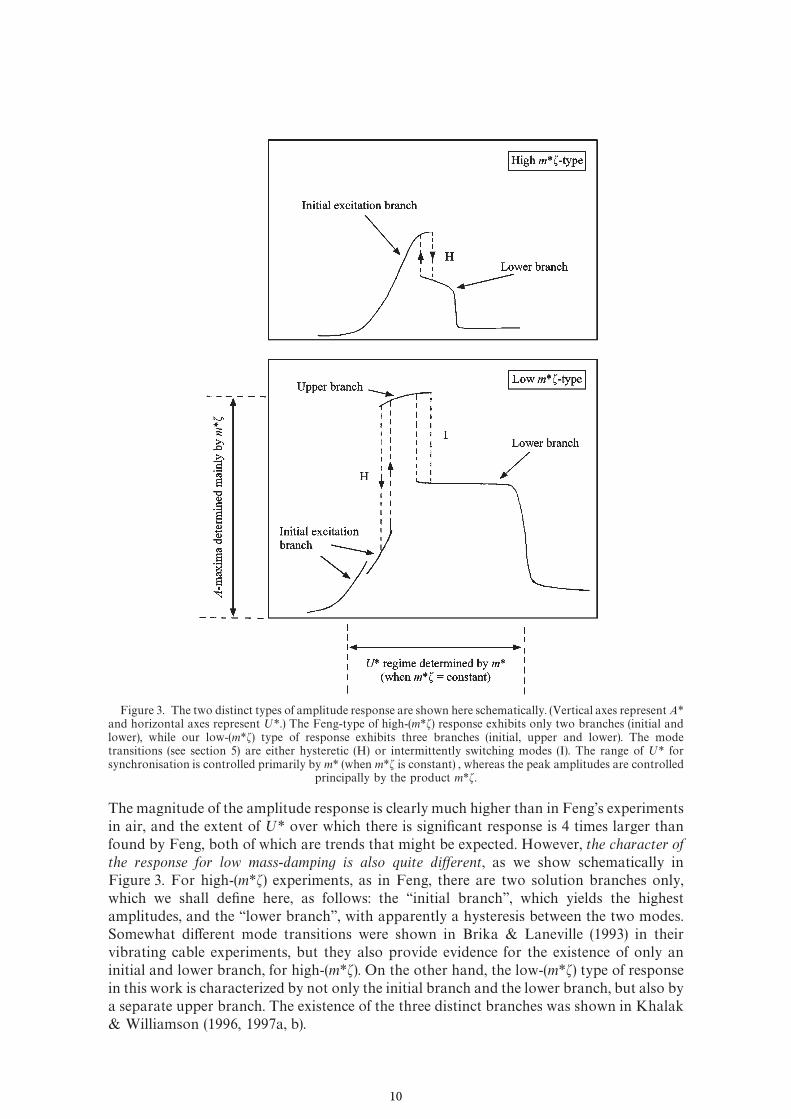
Figure 3. The two distinct types of amplitude response are shown here schematically. (Vertical axes represent A*and horizontal axes represent ;*.) The Feng-type of high-(m*�) response exhibits only two branches (initial andlower), while our low-(m*�) type of response exhibits three branches (initial, upper and lower). The modetransitions (see section 5) are either hysteretic (H) or intermittently switching modes (I). The range of ;* forsynchronisation is controlled primarily by m* (when m*� is constant) , whereas the peak amplitudes are controlled
principally by the product m*�.
The magnitude of the amplitude response is clearly much higher than in Feng's experimentsin air, and the extent of ;* over which there is signi"cant response is 4 times larger thanfound by Feng, both of which are trends that might be expected. However, the character of
the response for low mass-damping is also quite di+erent, as we show schematically inFigure 3. For high-(m*�) experiments, as in Feng, there are two solution branches only,which we shall de"ne here, as follows: the &&initial branch'', which yields the highestamplitudes, and the &&lower branch'', with apparently a hysteresis between the two modes.Somewhat di!erent mode transitions were shown in Brika & Laneville (1993) in theirvibrating cable experiments, but they also provide evidence for the existence of only aninitial and lower branch, for high-(m*�). On the other hand, the low-(m*�) type of responsein this work is characterized by not only the initial branch and the lower branch, but also bya separate upper branch. The existence of the three distinct branches was shown in Khalak& Williamson (1996, 1997a, b).
10
It is most interesting and relevant to mention here some early experiments ofMeier}Windhorst (1939), who measured the response of a very short cylinder sectionpartially immersed in a shallow &&water table'' #ow, giving a length/diameter of only 1)8. Hisexperimental arrangement is also quite distinct from ours and recent studies in that hiscylinder does not translate strictly transverse to the #ow, and instead moves in an arc.Correspondingly, the arrangement leads to a contribution to the e!ective restoring forcecoming from the drag force, thereby leading to nonlinearities in spring sti!ness. Despitethese obvious basic di!erences in the experiment, and the fact that there are discrepancies ofaround 100% in amplitude when plotted against recent data in the &&Gri$n'' plot, this earlydata indicates the appearance of an upper branch for su$ciently low damping; see alsoFigure 6.15 of Naudascher & Rockwell (1993). Zdravkovich (1990) suggests, in his interest-ing selective review, that the appearance of a jump to an upper branch in Meier-Windhorst(1939), and the lack of such a jump in other studies (also involving quite di!erent experi-mental con"gurations), is a Reynolds number e!ect, connected with the variation of thevortex formation length with Re. While there is clearly an in#uence of Reynolds number atlow Re values, especially in the laminar shedding regime (Re of order 100), our studies hereand in Govardhan & Williamson (1999), for Re"3500}10000, indicate that it is principallythe parameter (m*�) which in#uences whether the upper branch will appear or not.However, evidence for this deduction at higher Re of order 10�}10 would require furtherexperiments.
With respect to the mode transitions, preliminary results in Khalak & Williamson(1997b) show that the initial�upper branch transition is hysteretic, while the up-per� lower transition involves instead an intermittent switching. It will be shown in thepresent work that the peak amplitude is governed by the combined parameter m*�, overa wide range of m* and �, whereas for experiments where m*� is kept constant, we show thatthe width of the synchronization regime is governed by the mass ratio m*. These threemodes, and their transitions, will be studied in detail in the present paper. The fact that bothan upper and lower branch exist, quite aside from the initial branch, led to two distinctcurves of response in the &&Gri$n'' plot, as suggested in the preliminary work of Khalak &Williamson (1997a), and shown comprehensively in the present paper.
We shall address now the last question posed at the start of Section 1, concerningthe de"nition of &&synchronization'' or &&lock-in'', which has apparently led to somerecent confusion in the literature. One might consider how the response frequency ratio f *
behaves for di!erent mass ratios, as may be seen in Figure 4, taken for referencefrom Khalak & Williamson (1997b). The phenomenon of &&lock-in'' or synchronization[see Blevins (1990), and Sumer and Freds�e (1997)] means that as the #uid velocity ;* isincreased, a speed is reached at which the vortex-shedding frequency ( f
�) becomes close to
the natural frequency of the structure ( f�), and the two frequencies synchronize.
Further increase of;*, over a range of synchronization, pulls the shedding frequency awayfrom its nonoscillating value. The shedding frequency and the oscillation frequency ( f )remain close to f
�, and thus the ratio f *"f/f
�remains close to unity. This may be seen in
Figure 4, for the moderate mass ratios, m*"10}20. This classic scenario is approximatelycorrect for large mass, m*, but it can be seen that, even in Figure 4, f* is not precisely equalto unity.
The frequency f *, within the regime of signi"cant amplitude response, increases as m* isreduced. This is very clearly seen in the upper plot for m*"2)4 where, over the synchroniza-tion range ;*"4}11, the frequency f* rises to 1)4. Initially, we viewed this in Khalak &Williamson (1997b) as &&surprising'', but the use of this word is inappropriate, as thisphenomenon certainly must be expected, as pointed out clearly in Bearman's (1984) review.The extensive &&added mass'' coe$cients measured by Sarpkaya (1978) would suggest that
11
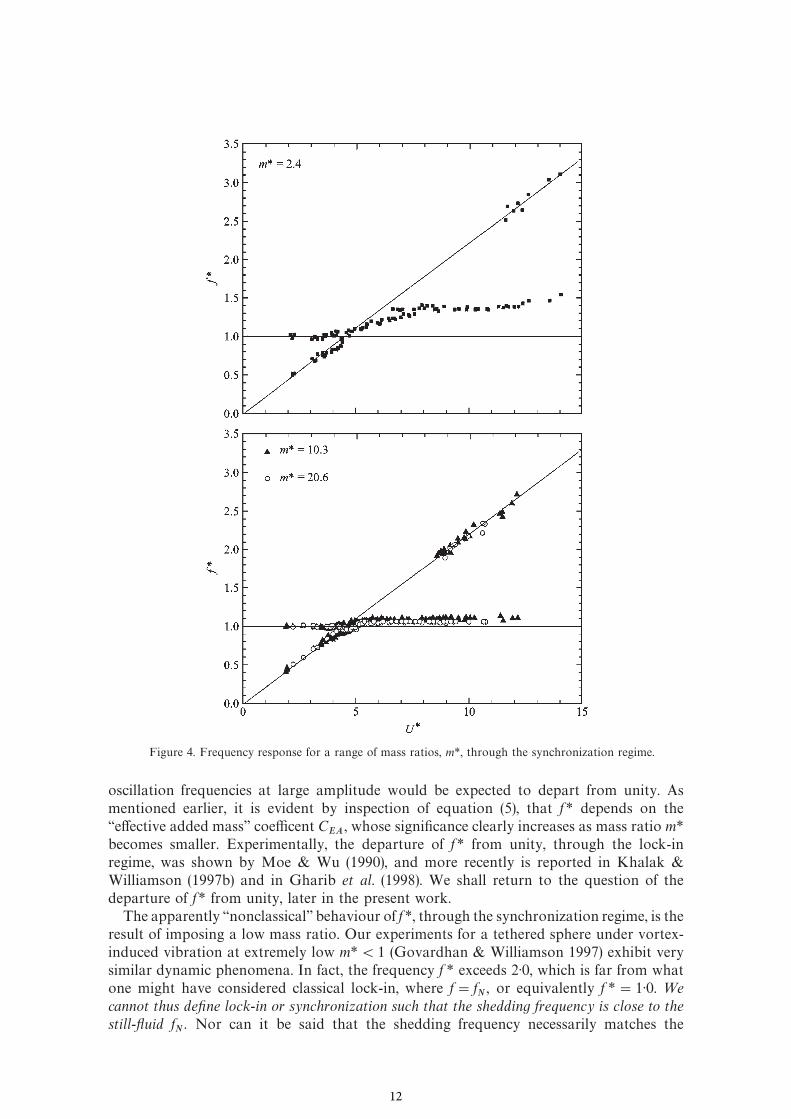
Figure 4. Frequency response for a range of mass ratios, m*, through the synchronization regime.
oscillation frequencies at large amplitude would be expected to depart from unity. Asmentioned earlier, it is evident by inspection of equation (5), that f * depends on the&&e!ective added mass'' coe$cent C
��, whose signi"cance clearly increases as mass ratio m*
becomes smaller. Experimentally, the departure of f * from unity, through the lock-inregime, was shown by Moe & Wu (1990), and more recently is reported in Khalak &Williamson (1997b) and in Gharib et al. (1998). We shall return to the question of thedeparture of f* from unity, later in the present work.
The apparently &&nonclassical'' behaviour of f *, through the synchronization regime, is theresult of imposing a low mass ratio. Our experiments for a tethered sphere under vortex-induced vibration at extremely low m*(1 (Govardhan & Williamson 1997) exhibit verysimilar dynamic phenomena. In fact, the frequency f * exceeds 2)0, which is far from whatone might have considered classical lock-in, where f"f
�, or equivalently f *"1)0. =e
cannot thus de,ne lock-in or synchronization such that the shedding frequency is close to the
still--uid f�. Nor can it be said that the shedding frequency necessarily matches the
12
oscillation frequency, because the wake mode might involve more than two vortices percycle (as discussed below). We can, however, usefully de"ne synchronization as the matching
of the frequency of the periodic wake vortex mode with the body oscillation frequency.Correspondingly, the transverse force frequency must match the oscillation frequency,which is the de"nition of lock-in now used by Sarpkaya (1995). [In fact, Sarpkaya de"neshis natural frequency f
�to be equal to the body oscillation frequency f, such that f/f
�"1
automatically throughout the lock-in regime. We choose here a "xed f�
to serve as a usefulreference frequency.] With these considerations in mind, the lock-in, which is reported inGharib et al. (1998) to be &&absent'' for small mass ratios, is therefore not actually absent, ifwe use the de"nition above and in Sarpkaya (1995).
It is expected that the sharp changes in phase angle through resonance, as velocity;* isincreased, will be matched by a switch in the timing of vortex shedding relative to bodydisplacement, and this was shown for the "rst time by Zdravkovich (1982), using visualiz-ations from previous studies. This has been con"rmed by Gu et al. (1994) from forcedvibrations at small A*"0)2, with further agreement from the simulations of Meneghini& Bearman (1995) and Lu & Dalton (1996). Gri$n & Ramberg (1974) showed, forlarger-amplitude forced vibration experiments, that an asymmetric mode occurred wherebythree vortices form per cycle, as A* increases from 0)5 to 1)0. Subsequent studies over a verywide variation of A* and ;* by Williamson & Roshko (1988), found a selection of vortexformation modes, which were de"ned as &&2S'' indicating 2 single vortices shed per cycle,&&2P'' meaning 2 pairs of vortices per cycle, and the pattern comprising three vortices percycle thus was termed &&P#S''. Ongoren & Rockwell (1988) found the equivalent of the 2Pmode, but only for streamwise vibrations, although subsequent DPIV (digital particleimage velocimetry) measurements con"rm the 2P mode in forced lateral vibrations (Sher-idan et al. 1998), and in forced motions of a tapered cylinder where a &&hybrid'' mode wasfound comprising 2P and 2S modes occurring simultaneously along the span (Techet et al.1998).
The observation in Williamson & Roshko that forced oscillations corresponding to theinitial branch of Feng (1968) formed the 2S mode and those on the lower branch formed the2P mode, has since been con"rmed by Brika & Laneville (1993), who were the "rst to showvisual evidence of these distinct modes in free vibration, and was more recently shown fromthe DPIV measurements of free vibration modes by Govardhan & Williamson (1998, 1999).The ingenious virtual free vibration experiments by Hover et al. (1998), whereby themass}spring}damper is simulated in real time on a computer, and where the #uid force ismeasured, produces a complete response plot which collapses well onto the map of vortexmodes from Williamson & Roshko, again suggesting the initial branch is 2S mode, and thelower branch is the 2P mode. These vortex modes will be shown to be in accordance withobservations in the present paper.
In the ensuing sections, following the experimental details in Section 2, we shall presenta set of data in the &&Gri$n'' plot in Section 3, which demonstrate that the combined mass-damping parameter collapses very well the peak amplitude data, over a wide range of(m*#C
�)�. We study the vortex-shedding modes, in brief, and also the collapse of the complete
amplitude response plot using the normalized velocity (;*/f*). In Section 4, we present lift anddrag force measurements, followed by the discussion of response dynamics for the di!erentmodes and their transitions in Section 5. Finally, Section 6 comprises the conclusions.
2. EXPERIMENTAL DETAILS
We have constructed a custom hydroelastic apparatus, for particular application to verylow mass and damping conditions, which operates in conjunction with the Cornell-ONR
13
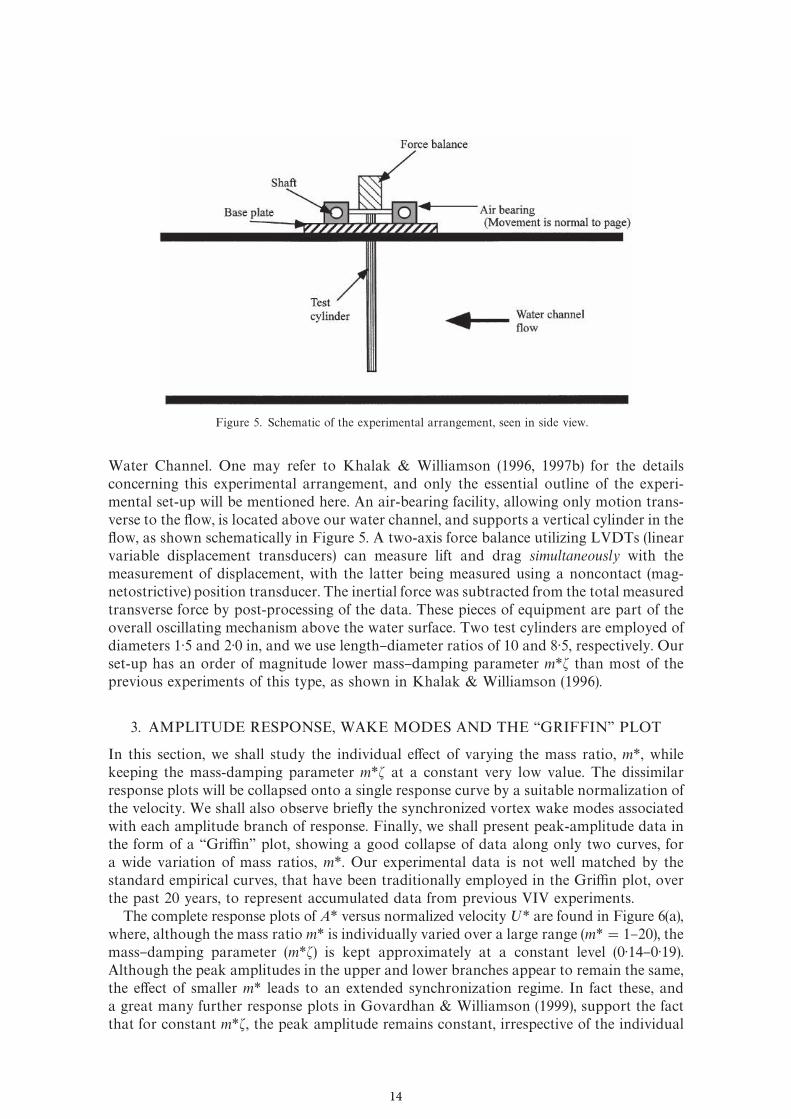
Figure 5. Schematic of the experimental arrangement, seen in side view.
Water Channel. One may refer to Khalak & Williamson (1996, 1997b) for the detailsconcerning this experimental arrangement, and only the essential outline of the experi-mental set-up will be mentioned here. An air-bearing facility, allowing only motion trans-verse to the #ow, is located above our water channel, and supports a vertical cylinder in the#ow, as shown schematically in Figure 5. A two-axis force balance utilizing LVDTs (linearvariable displacement transducers) can measure lift and drag simultaneously with themeasurement of displacement, with the latter being measured using a noncontact (mag-netostrictive) position transducer. The inertial force was subtracted from the total measuredtransverse force by post-processing of the data. These pieces of equipment are part of theoverall oscillating mechanism above the water surface. Two test cylinders are employed ofdiameters 1)5 and 2)0 in, and we use length}diameter ratios of 10 and 8)5, respectively. Ourset-up has an order of magnitude lower mass}damping parameter m*� than most of theprevious experiments of this type, as shown in Khalak & Williamson (1996).
3. AMPLITUDE RESPONSE, WAKE MODES AND THE &&GRIFFIN'' PLOT
In this section, we shall study the individual e!ect of varying the mass ratio, m*, whilekeeping the mass-damping parameter m*� at a constant very low value. The dissimilarresponse plots will be collapsed onto a single response curve by a suitable normalization ofthe velocity. We shall also observe brie#y the synchronized vortex wake modes associatedwith each amplitude branch of response. Finally, we shall present peak-amplitude data inthe form of a &&Gri$n'' plot, showing a good collapse of data along only two curves, fora wide variation of mass ratios, m*. Our experimental data is not well matched by thestandard empirical curves, that have been traditionally employed in the Gri$n plot, overthe past 20 years, to represent accumulated data from previous VIV experiments.
The complete response plots of A* versus normalized velocity;* are found in Figure 6(a),where, although the mass ratio m* is individually varied over a large range (m*"1}20), themass}damping parameter (m*�) is kept approximately at a constant level (0)14}0)19).Although the peak amplitudes in the upper and lower branches appear to remain the same,the e!ect of smaller m* leads to an extended synchronization regime. In fact these, anda great many further response plots in Govardhan & Williamson (1999), support the factthat for constant m*�, the peak amplitude remains constant, irrespective of the individual
14
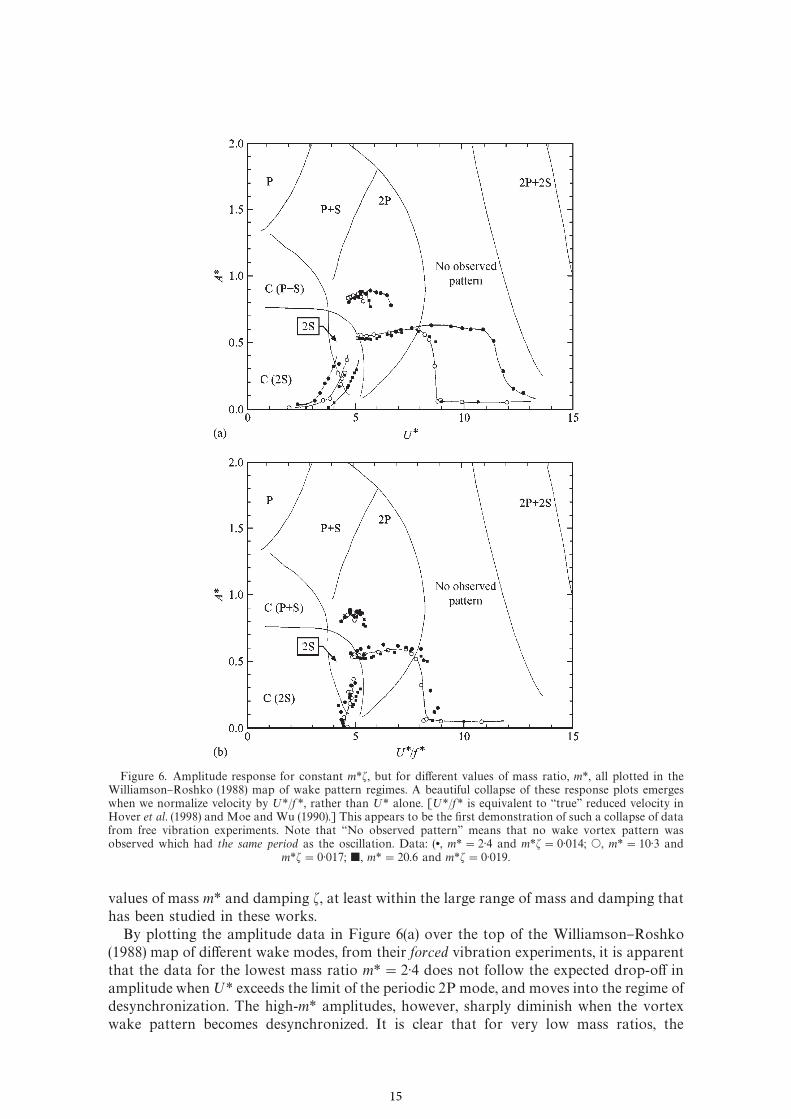
Figure 6. Amplitude response for constant m*�, but for di!erent values of mass ratio, m*, all plotted in theWilliamson}Roshko (1988) map of wake pattern regimes. A beautiful collapse of these response plots emergeswhen we normalize velocity by ;*/f *, rather than ;* alone. [;*/f * is equivalent to &&true'' reduced velocity inHover et al. (1998) and Moe and Wu (1990).] This appears to be the "rst demonstration of such a collapse of datafrom free vibration experiments. Note that &&No observed pattern'' means that no wake vortex pattern wasobserved which had the same period as the oscillation. Data: (z, m*"2)4 and m*�"0)014; �, m*"10)3 and
m*�"0)017; �, m*"20.6 and m*�"0)019.
values of mass m* and damping �, at least within the large range of mass and damping thathas been studied in these works.
By plotting the amplitude data in Figure 6(a) over the top of the Williamson}Roshko(1988) map of di!erent wake modes, from their forced vibration experiments, it is apparentthat the data for the lowest mass ratio m*"2)4 does not follow the expected drop-o! inamplitude when;* exceeds the limit of the periodic 2P mode, and moves into the regime ofdesynchronization. The high-m* amplitudes, however, sharply diminish when the vortexwake pattern becomes desynchronized. It is clear that for very low mass ratios, the
15
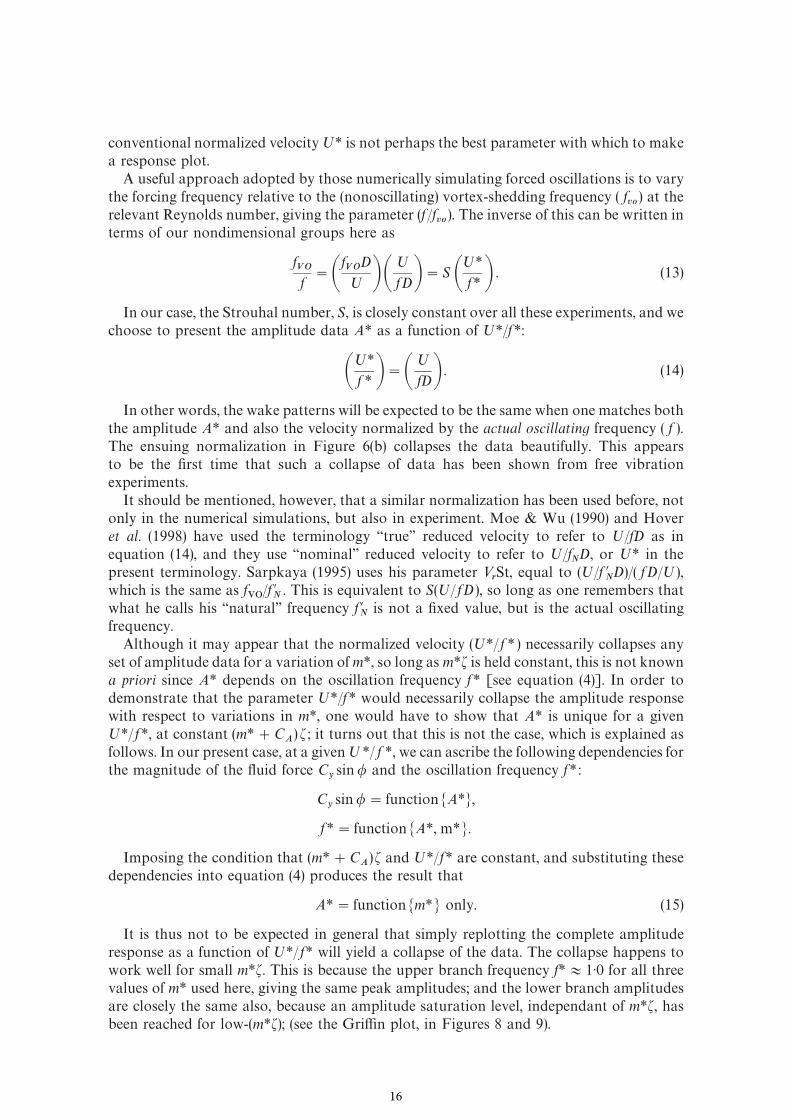
conventional normalized velocity;* is not perhaps the best parameter with which to makea response plot.
A useful approach adopted by those numerically simulating forced oscillations is to varythe forcing frequency relative to the (nonoscillating) vortex-shedding frequency ( f
�) at the
relevant Reynolds number, giving the parameter (f /f �
). The inverse of this can be written interms of our nondimensional groups here as
f�f
"�f�
D
; ��;
fD�"S �;*
f* � . (13)
In our case, the Strouhal number, S, is closely constant over all these experiments, and wechoose to present the amplitude data A* as a function of ;*/f*:
�;*
f * �"�;
fD� . (14)
In other words, the wake patterns will be expected to be the same when one matches boththe amplitude A* and also the velocity normalized by the actual oscillating frequency ( f ).The ensuing normalization in Figure 6(b) collapses the data beautifully. This appearsto be the "rst time that such a collapse of data has been shown from free vibrationexperiments.
It should be mentioned, however, that a similar normalization has been used before, notonly in the numerical simulations, but also in experiment. Moe & Wu (1990) and Hoveret al. (1998) have used the terminology &&true'' reduced velocity to refer to ;/fD as inequation (14), and they use &&nominal'' reduced velocity to refer to ;/f
�D, or ;* in the
present terminology. Sarpkaya (1995) uses his parameter <�St, equal to (;/f
�D)/( fD/;),
which is the same as f��
/f �. This is equivalent to S(;/ fD), so long as one remembers that
what he calls his &&natural'' frequency f �
is not a "xed value, but is the actual oscillatingfrequency.
Although it may appear that the normalized velocity (;*/ f * ) necessarily collapses anyset of amplitude data for a variation of m*, so long as m*� is held constant, this is not knowna priori since A* depends on the oscillation frequency f * [see equation (4)]. In order todemonstrate that the parameter ;*/f* would necessarily collapse the amplitude responsewith respect to variations in m*, one would have to show that A* is unique for a given;*/ f *, at constant (m*#C
�) � ; it turns out that this is not the case, which is explained as
follows. In our present case, at a given;*/ f *, we can ascribe the following dependencies forthe magnitude of the #uid force C
�sin� and the oscillation frequency f * :
C�sin�"function�A*�,
f *"function�A*, m*�.
Imposing the condition that (m*#C�)� and ;*/f* are constant, and substituting these
dependencies into equation (4) produces the result that
A*"function�m*� only. (15)
It is thus not to be expected in general that simply replotting the complete amplituderesponse as a function of ;*/ f* will yield a collapse of the data. The collapse happens towork well for small m*�. This is because the upper branch frequency f*+1)0 for all threevalues of m* used here, giving the same peak amplitudes; and the lower branch amplitudesare closely the same also, because an amplitude saturation level, independant of m*�, hasbeen reached for low-(m*�); (see the Gri$n plot, in Figures 8 and 9).
16
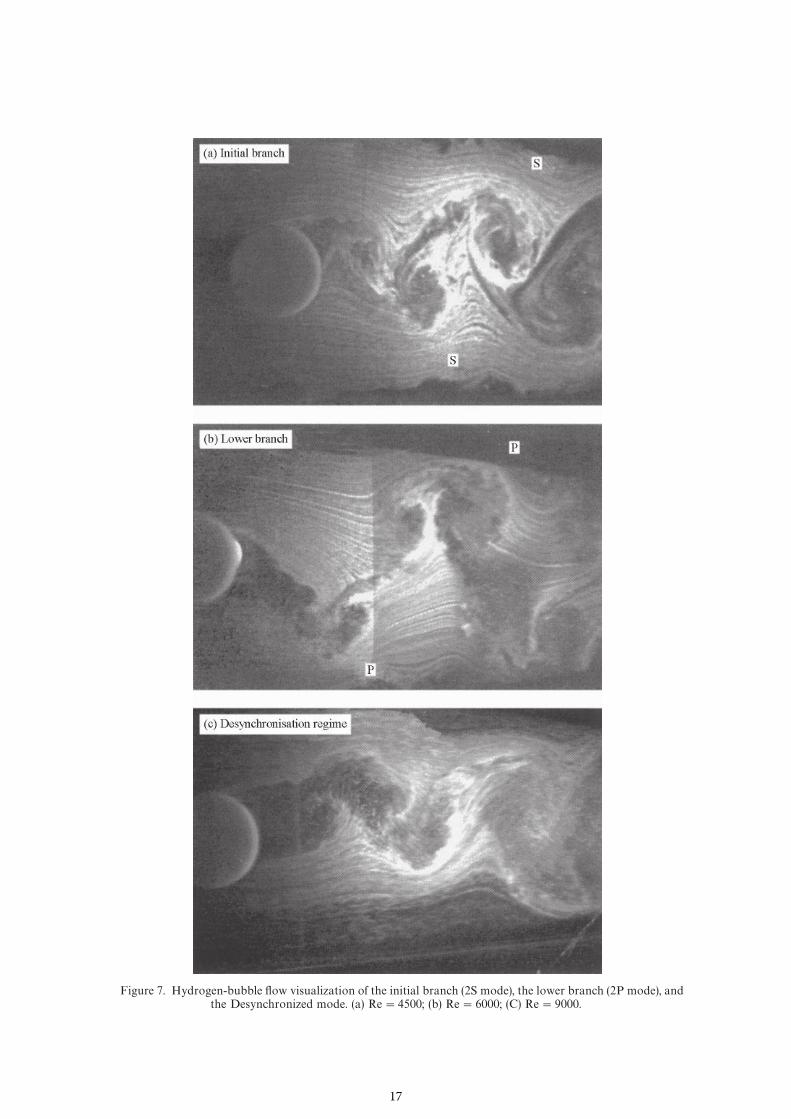
Figure 7. Hydrogen-bubble #ow visualization of the initial branch (2S mode), the lower branch (2P mode), andthe Desynchronized mode. (a) Re"4500; (b) Re"6000; (C) Re"9000.
17
The amplitude branches are found to correspond with di!erent synchronized vortexwake patterns, as shown in Figure 7. The initial branch in the amplitude response appearsto lie in the 2S mode of the Williamson}Roshko map of wake patterns, meaning two singlevortices formed per cycle, and this is supported by the hydrogen bubble visualization inFigure 7(a). The lower branch seems to be in the 2P mode regime, and this corresponds wellwith the visualization in (b), indicating two pairs of vortices being formed per cycle. Thissupports the scenario put forward, from forced oscillation experiments, in Williamson andRoshko (1988). The visualizations in Figure 7 are in accordance with Brika & Laneville(1993) for their cable vibrations, who were the "rst to con"rm that the 2S�2P modetransition corresponds with the initial� lower branch of body dynamics, in free vibrations.Further visualization of the upper branch appeared to be the 2S mode as in (a), although itis not evident from this somewhat unclear visualization technique whether it could bedistinct from the initial branch. Despite the observations made here, the somewhat uncleardye or bubble visualizations that are possible at these Re of order 10�}10� should not beused as "rm proof of the vortex dynamics modes. Subsequent DPIV vorticity measurementsto be found in Govardhan & Williamson (1999) clarify "rmly the vortex dynamics asso-ciated with the di!erent amplitude branches, including the upper branch.
Finally, in this section, we look at the Gri$n plot of peak-amplitude data. An importantquestion that has been debated for about 20 years is whether a combined mass}dampingparameter m*� could reasonably collapse peak amplitude data A*
���in what we denote here
the &&Gri$n'' plot. On the one hand, Sarpkaya (1978, 1995) has "rmly stated that theresponse is governed by m* and � independently, and not by the combined mass}dampingm*�. Zdravkovich also states that a combined m*� paramater is not legitimate for m*(10.On the other hand, Naudascher & Rockwell (1993) suggest that even down to low m*�, theGri$n plot does quite well to collapse A*
���data. However, as can be seen in the Gri$n plot
of Figure 1, when the vertical axis for A* is plotted as a linear scale (rather than by theconventional logarithmic scale), the scatter in the data is evidently large.
Previous scattered results, in Figure 1, would lead one to deduce that the Gri$n plot doesnot collapse peak-amplitude data, but one must note that all these data are from markedly
di!erent experimental set-ups, and there also will exist di!erences in measurement accuracyand procedure. In the present study, we set out to plot A*
���versus (m*#C
�)� in a Gri$n
diagram in Figure 8, for a wide variation of mass ratios, m*, and for a uniformly similar setof experiments. Only in this fashion, might one expect to accurately question whether theamplitude data may be collapsed in the Gri$n plot. We choose to plot the peak-amplitudedata both for the Upper branch and also for the Lower branch in Figure 8.
The collapse of the data appears to be very good; the data sets lie along only two distinctcurves, one curve for the upper branch and one for the lower branch. In fact, the Gri$n plotappears to give a clear functional relationship between A*
���and (m*#C
�)� over a wide
range of parameters; for m*'2, and for (m*#C�)�'0)006. The use of the Gri$n plot to
collapse peak-amplitude data versus the mass}damping is con"rmed over a much largerregime of (m*#C
�)� than could be validated by the previous scattered data, and is
a regime that extends to two orders of magnitude lower (m*#C�)� than proposed by
Sarpkaya, and often quoted in the literature, namely S'1, or equivalently
(m*#C�)�'0)40.
It was indicated in Section 1 that the peak response A*���
is a function of m*, as well as of(m*#C
�)�. The in#uence of m* comes from the frequency f * in equation (4), but it is to be
noted that, in determining the maximum amplitude throughout the present work, it turnsout that f *+1)0, and therefore A*
��is a function only of (m*#C
�)�, to good approxima-
tion. However, it must be expected that there will be limits when the independent value ofm* will in#uence the peak response, although the limits set by Sarpkaya seem to be
18
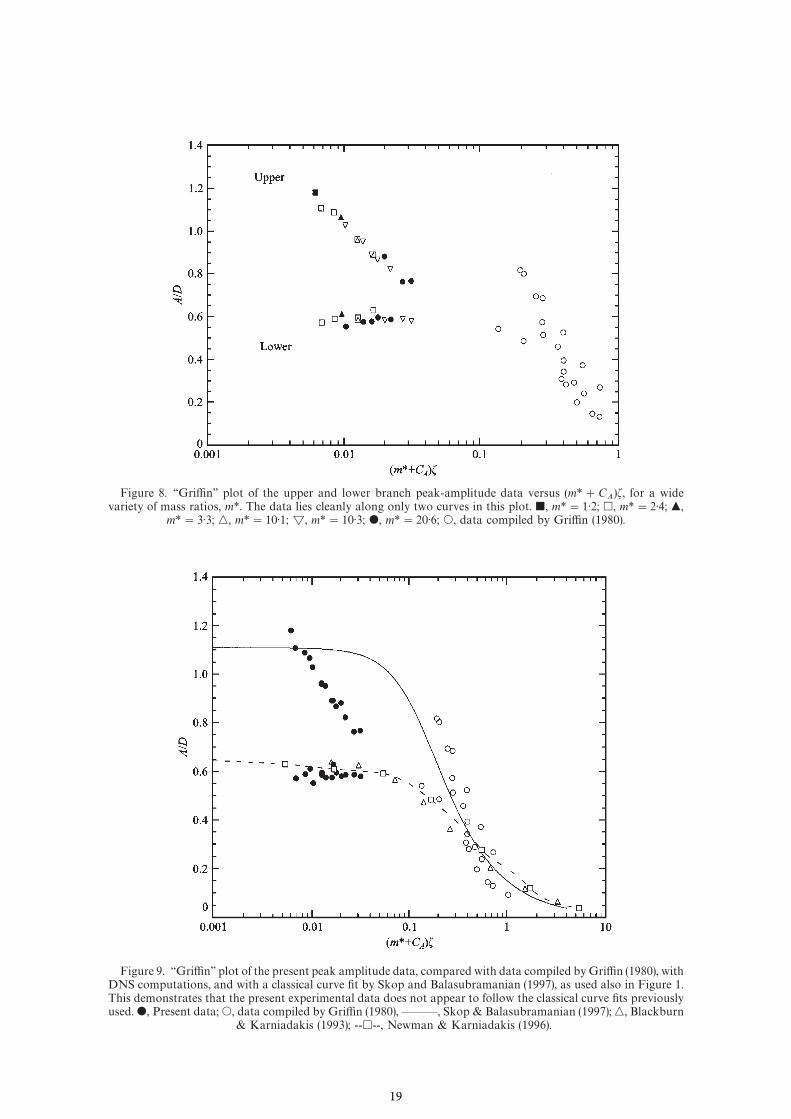
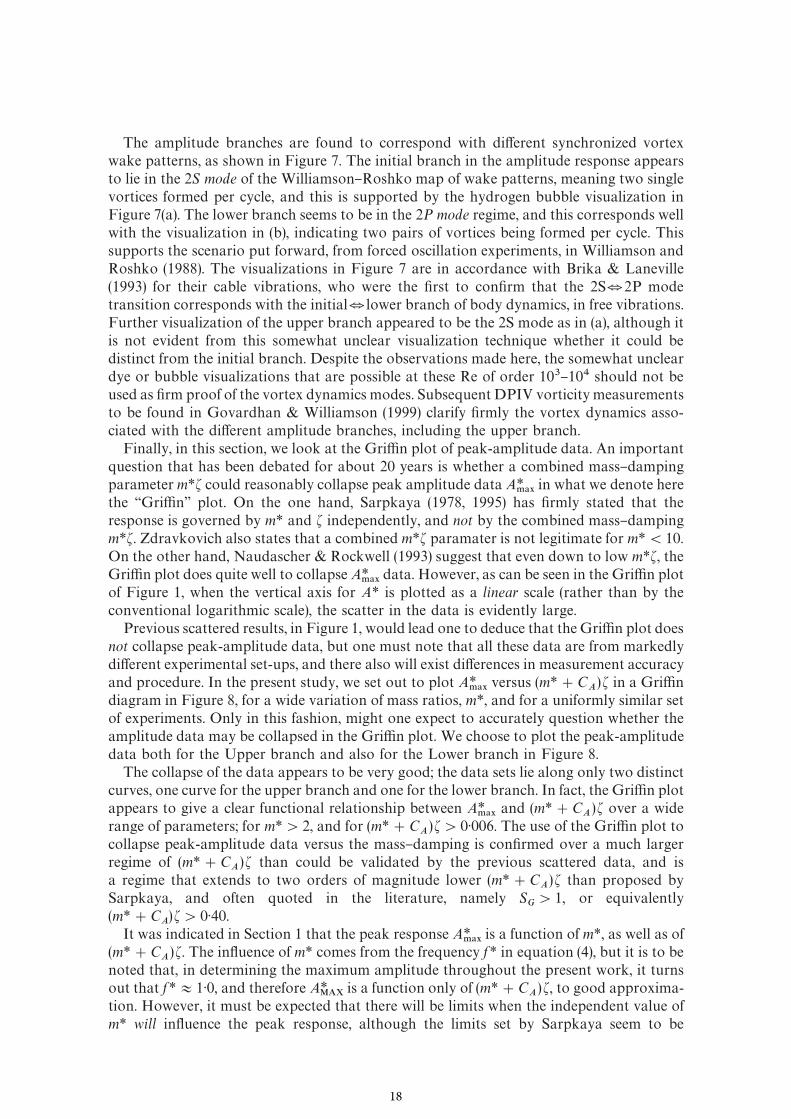
Figure 8. &&Gri$n'' plot of the upper and lower branch peak-amplitude data versus (m*#C�)�, for a wide
variety of mass ratios, m*. The data lies cleanly along only two curves in this plot. �, m*"1)2; �, m*"2)4; �,m*"3)3; �, m*"10)1; £, m*"10)3; �, m*"20)6; �, data compiled by Gri$n (1980).
Figure 9. &&Gri$n'' plot of the present peak amplitude data, compared with data compiled by Gri$n (1980), withDNS computations, and with a classical curve "t by Skop and Balasubramanian (1997), as used also in Figure 1.This demonstrates that the present experimental data does not appear to follow the classical curve "ts previouslyused. �, Present data; �, data compiled by Gri$n (1980),***, Skop & Balasubramanian (1997); �, Blackburn
& Karniadakis (1993); --�--, Newman & Karniadakis (1996).
19
somewhat restrictive. Further ongoing measurements are being conducted to probe thelimits within which (m*#C
�)� remains a valid parameter to predict peak response A*
���.
We now compare the peak-amplitude data with direct numerical simulation results in theGri$n plot of Figure 9. The extensive two-dimensional simulation data from Blackburn &Karniadakis (1993) and by Newman & Karniadakis (1996), for the low Reynolds number of200 and 100 respectively, are shown in this plot. It is immediately apparent that themaximum amplitudes coming from the simulations lie close to the lower branch, A*&0)6.Coupled with the fact that the low-Re experiments (Anagnostopoulos & Bearman 1992)also do not exhibit an upper branch, one might deduce that there are di!erences in thevortex dynamics at low Reynolds numbers, which prohibit the jump to an upper branch.Evidence for this also comes from Williamson & Roshko (1988), who found only the P#Smode of vortex formation, in place of the whole 2P-mode region in Figure 6, when theReynolds number was below about 300. In fact, the classical smoke visualizations of Gri$n& Ramberg (1974) demonstrate only the P#S mode for Re(190, and they never observedthe 2P mode in their laminar-regime studies.
One might then ask what are the vortex dynamics found in the low-Re simulations. Forthe whole synchronization regime, corresponding to A*(0)6, several simulations for free
vibration "nd only the 2S mode throughout the lock-in regime (Fujarra et al. 1998; Newman& Karniadakis 1996). (This shows that, although the maximum amplitudes from thesimulations lie closely along the lower branch experimental data, one should not then inferthat the DNS results correspond to a lower branch or to the 2P mode found in thehigher-Re experiments.) On the other hand, in low-Re simulations of forced oscillations,either for higher amplitudes roughly A*'0)6, or for frequencies below a critical value, onlythe P#S mode has been found (Meneghini & Bearman 1995; Blackburn & Henderson1995). One may conclude that the absence of the upper branch in the simulations is due tothe fact that the P#S mode does not give a net energy transfer from #uid to body motionover a cycle, unlike the 2P mode at higher Re. It remains to decisively prove this point withfree and forced vibration studies at low-Re, a study which we are pursuing.
Finally, the data in Figure 9 is also compared with the curve "t adapted from Skop &Balasubramanian (1997), using the functional relationship derived by Sarpkaya (1978), as inequation (11). It seems clear that our experimental data here does not follow such a func-tional representation. Even for the smallest (m*#C
�)�&0)006, the peak amplitudes are
not close to saturating to a speci"c value, as they do in the functional curve. Further intensework is being conducted to answer what is perhaps the most fundamental question in thistype of study: What is the limit of peak amplitude as (m*#C
�) � gets ever smaller? In fact,
our largest peak amplitude, A*"1)20, has already exceeded the largest value found in anyprevious experiment (A*
���&1)10), and yet it remains steadily increasing, with no signs of
amplitude saturation, as mass}damping is diminished.
4. LIFT AND DRAG FORCE
Despite the extensive force measurements for a cylinder undergoing transverse forcedvibration [see, for example, Sarpkaya (1978), Staubli (1983), Gopalkrishnan (1993), andothers], there have appeared almost no direct lift force measurements in the literature forsuch an elastically mounted arrangement, with the exception of Khalak & Williamson(1997b). One should note, however, that Sarpkaya (1995) recently presented a set of dragmeasurements for a cylinder which can oscillate both in-line and transverse to the #ow.Such a two-degree-of-freedom arrangement, as pioneered by Sarpkaya, should yield usefulnew results, and several groups are now working on this problem. We should also note thatHover et al. (1997, 1998), in conjunction with the research group of Michael S. Triantafyllou
20
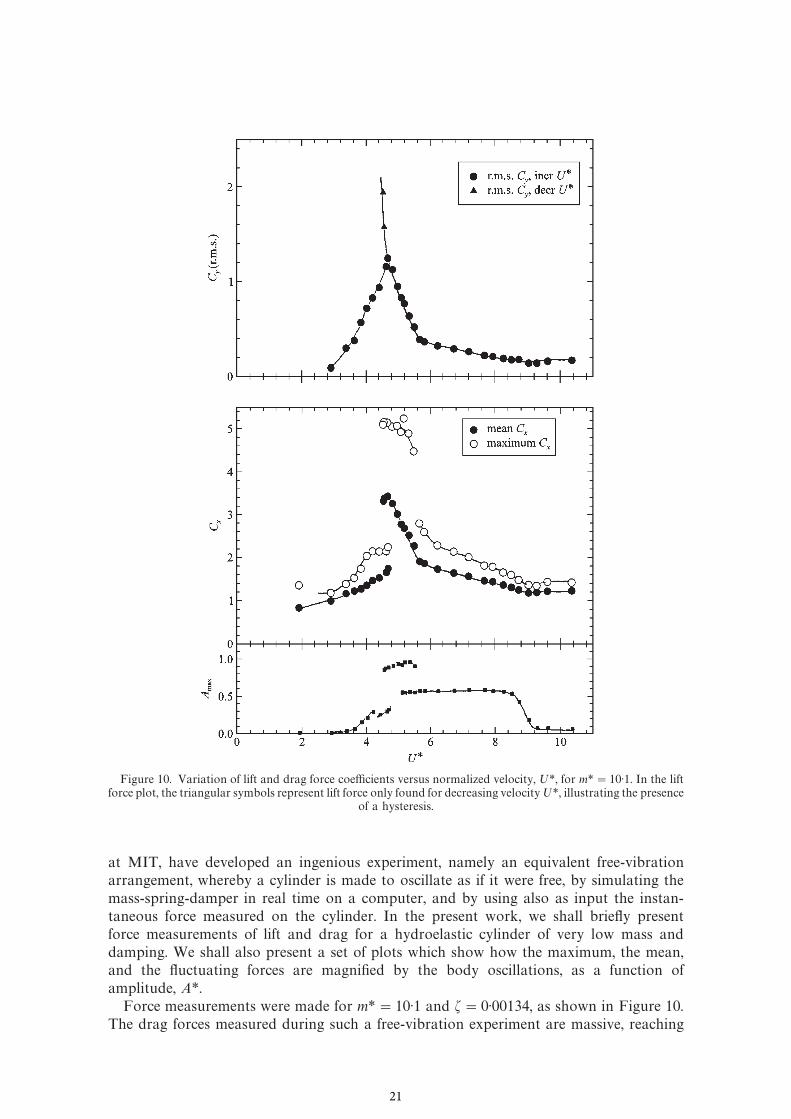
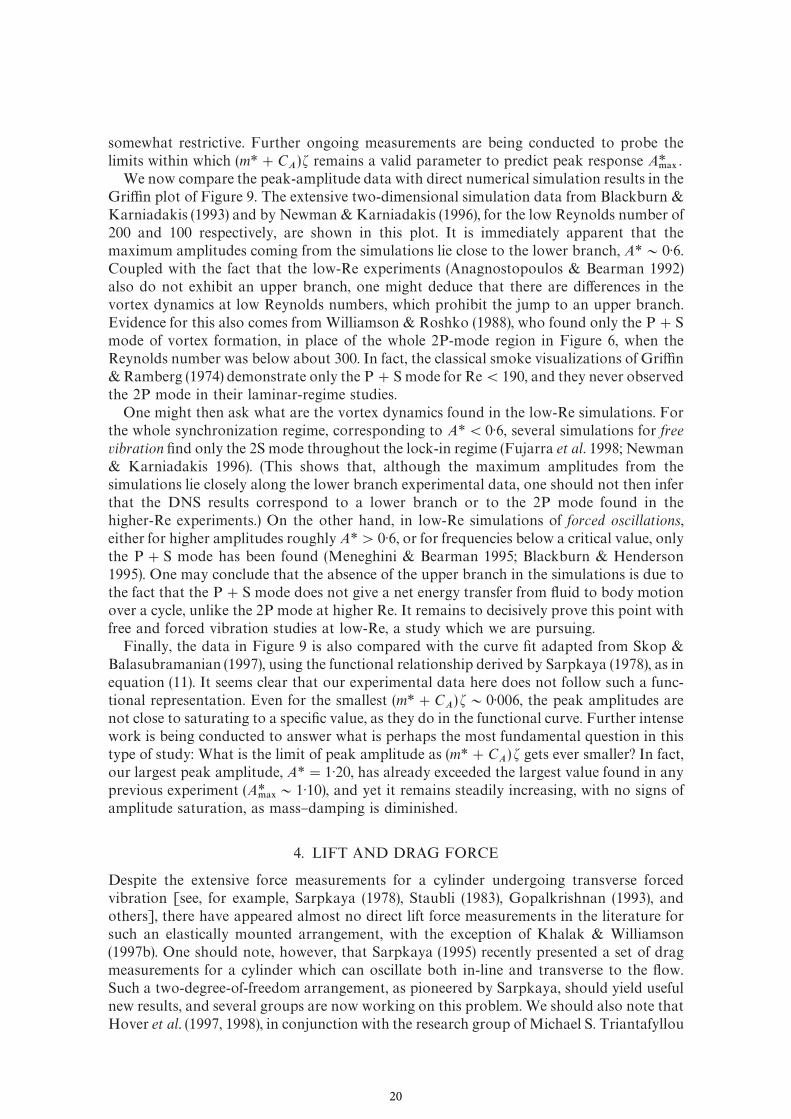
Figure 10. Variation of lift and drag force coe$cients versus normalized velocity, ;*, for m*"10)1. In the liftforce plot, the triangular symbols represent lift force only found for decreasing velocity;*, illustrating the presence
of a hysteresis.
at MIT, have developed an ingenious experiment, namely an equivalent free-vibrationarrangement, whereby a cylinder is made to oscillate as if it were free, by simulating themass-spring-damper in real time on a computer, and by using also as input the instan-taneous force measured on the cylinder. In the present work, we shall brie#y presentforce measurements of lift and drag for a hydroelastic cylinder of very low mass anddamping. We shall also present a set of plots which show how the maximum, the mean,and the #uctuating forces are magni"ed by the body oscillations, as a function ofamplitude, A*.
Force measurements were made for m*"10)1 and �"0)00134, as shown in Figure 10.The drag forces measured during such a free-vibration experiment are massive, reaching
21
a maximum C������
of 5)2, with mean C�������
of around 3)5. This is a three-fold increaseover the stationary case (denoted as C
��), but the di!erence between the maximum and
mean drag values also indicates the large drag force #uctuations, which we mention furtherbelow. The lift force C
������reaches 2)0, which corresponds to a maximum C
�near 3,
suggesting a "ve-fold increase in lift force over the stationary cylinder case. As we increase;*, both the drag and lift rapidly increase through the initial excitation regime, they peak atthe beginning of the upper branch region, they decrease rapidly throughout the upperbranch, and then gradually diminish through the lower branch region. The most strikingfeature of the r.m.s. lift plot is the very sharp peak, which occurs right at the transitionbetween initial excitation region and the upper branch. Before the transition, the lift israpidly increasing, while after the transition in the di!erent mode of response, the lift israpidly decreasing, thus yielding our very sharp lift peak. Surprisingly, the lift in the lowerbranch is very low, even smaller than the stationary case at equivalent Reynolds numbers(around 6000).
4.1. AMPLIFICATION OF FORCES DUE TO VIBRATION
The forced vibration of a structure can yield larger #uid-induced forces than for "xedcylinders, a result which is well-known from past works referenced in the reviews mentionedearlier, although the extent of the increase is certainly very large. In the case of biharmonicfree vibrations, involving simultaneous oscillations in-line and transverse to the #ow,Sarpkaya (1995) "nds that the mean drag for an oscillating cylinder can become 3)5 timesthat for the static cylinder, which is comparable to values found here. He also gives a meandrag around three times the static case, if the cylinder is forced into transverse vibration(Sarpkaya 1978). The recent work of Hover et al. (1998), using their equivalent free-vibration experiment, gives a r.m.s. lift coe$cient of roughly 1)6}2)0, when themass}damping is set to zero (m*�"0), which is comparable to the present values (wecomputed their value from their power spectral density of the signal, taken near the liftfrequency).
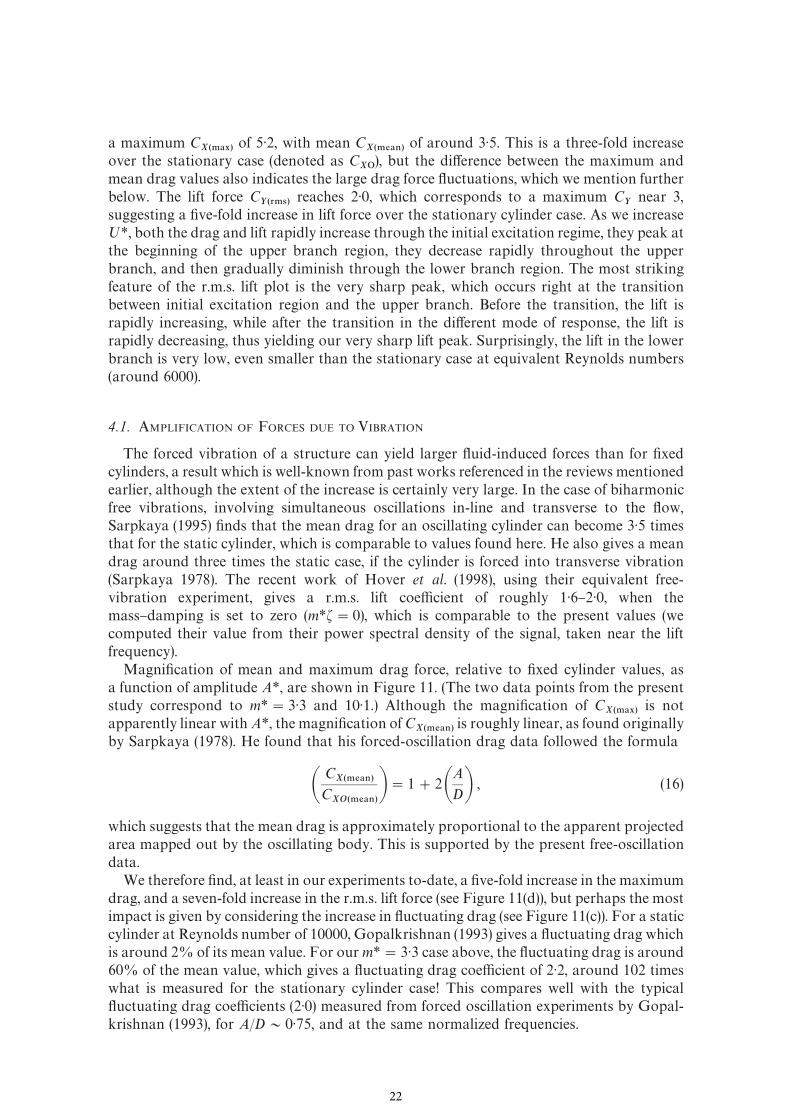
Magni"cation of mean and maximum drag force, relative to "xed cylinder values, asa function of amplitude A*, are shown in Figure 11. (The two data points from the presentstudy correspond to m*"3)3 and 10)1.) Although the magni"cation of C
������is not
apparently linear with A*, the magni"cation of C�������
is roughly linear, as found originallyby Sarpkaya (1978). He found that his forced-oscillation drag data followed the formula
�C
�������C
��������"1#2�
A
D� , (16)
which suggests that the mean drag is approximately proportional to the apparent projectedarea mapped out by the oscillating body. This is supported by the present free-oscillationdata.
We therefore "nd, at least in our experiments to-date, a "ve-fold increase in the maximumdrag, and a seven-fold increase in the r.m.s. lift force (see Figure 11(d)), but perhaps the mostimpact is given by considering the increase in #uctuating drag (see Figure 11(c)). For a staticcylinder at Reynolds number of 10000, Gopalkrishnan (1993) gives a #uctuating drag whichis around 2% of its mean value. For our m*"3)3 case above, the #uctuating drag is around60% of the mean value, which gives a #uctuating drag coe$cient of 2)2, around 102 timeswhat is measured for the stationary cylinder case! This compares well with the typical#uctuating drag coe$cients (2)0) measured from forced oscillation experiments by Gopal-krishnan (1993), for A/D&0)75, and at the same normalized frequencies.
22
Figure 11. (a) Ampli"cation of maximum drag force and (b) mean drag force, versus amplitude A*, in freevibration.
4.2. DERIVATION OF FORCE BY USING RESPONSE DATA (A* AND f * )
In our studies of vortex-induced vibration of a sphere (Govardhan & Williamson 1999), ithas been found di$cult to measure the #uctuating lift force directly, although it is simple toestimate the lift force using displacement response data (A* and f * ), using an assumedequation of motion. It is possible to determine the conditions when such a simple approachis useful, in the present study with the cylinder, by comparing estimated forces with thedirectly measured forces. We set �;*, m*, ��, and measure �A*, f *�. We can then "nd(C
�sin�) and (C
�cos �) from a rearrangement of equations (4) and (5):
C�sin �"
4��A* (m*#C�)�
(;*/ f * )� f *(17)
C�cos�"
2��A*
(;*/ f * )�C
��(18)
We can solve for the two unknowns �C�,�� since all the other variables are known:
C�"�(C
�sin�)�#(C
�cos�)�, (19)
23
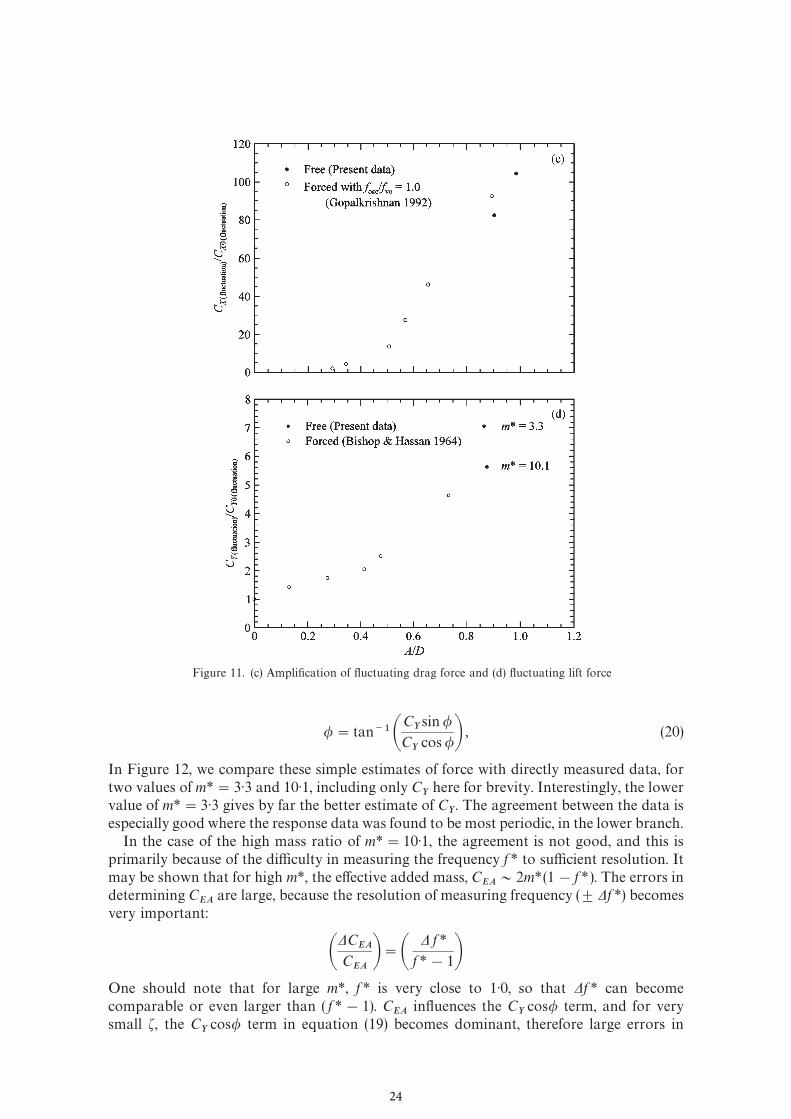
Figure 11. (c) Ampli"cation of #uctuating drag force and (d) #uctuating lift force
�"tan���C
�sin�
C�cos�� , (20)
In Figure 12, we compare these simple estimates of force with directly measured data, fortwo values of m*"3)3 and 10)1, including only C
�here for brevity. Interestingly, the lower
value of m*"3)3 gives by far the better estimate of C�. The agreement between the data is
especially good where the response data was found to be most periodic, in the lower branch.In the case of the high mass ratio of m*"10)1, the agreement is not good, and this is
primarily because of the di$culty in measuring the frequency f * to su$cient resolution. Itmay be shown that for high m*, the e!ective added mass, C
��&2m*(1!f * ). The errors in
determining C��
are large, because the resolution of measuring frequency ($�f *) becomesvery important:
��C
��C
���"�
� f *
f *!1�One should note that for large m*, f * is very close to 1)0, so that �f * can becomecomparable or even larger than ( f *!1). C
��in#uences the C
�cos� term, and for very
small �, the C�cos� term in equation (19) becomes dominant, therefore large errors in
24
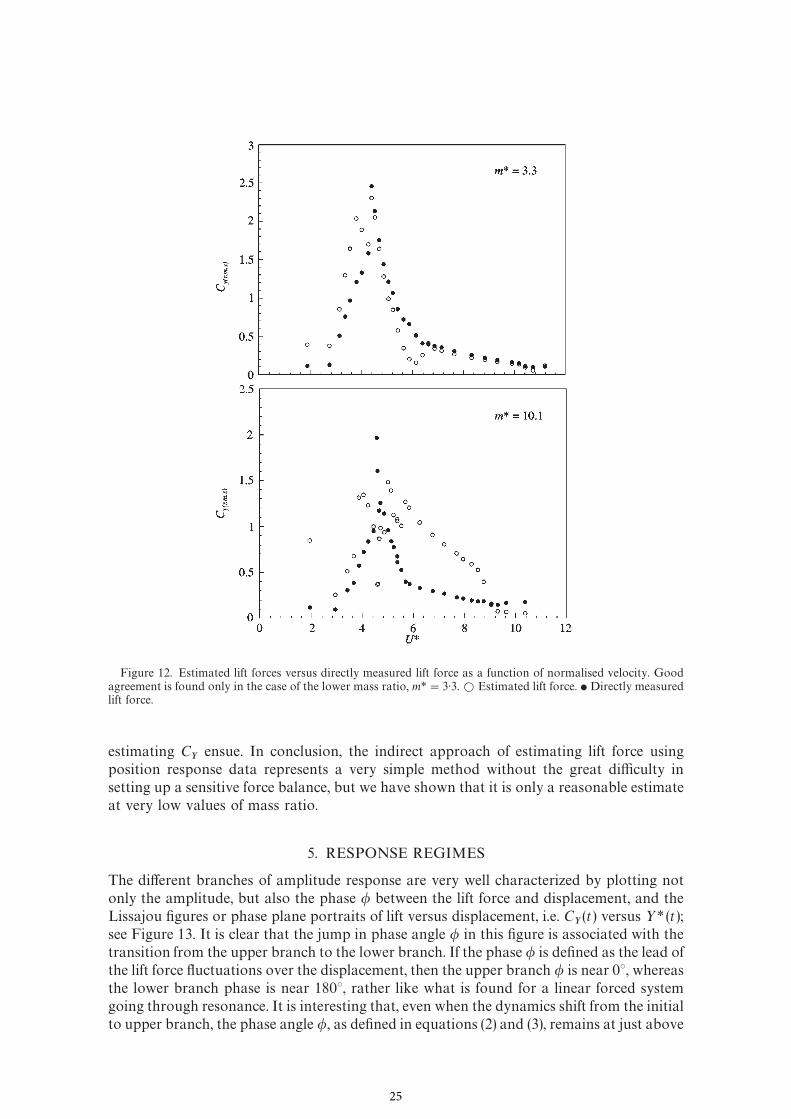
Figure 12. Estimated lift forces versus directly measured lift force as a function of normalised velocity. Goodagreement is found only in the case of the lower mass ratio, m*"3)3. � Estimated lift force. � Directly measuredlift force.
estimating C�
ensue. In conclusion, the indirect approach of estimating lift force usingposition response data represents a very simple method without the great di$culty insetting up a sensitive force balance, but we have shown that it is only a reasonable estimateat very low values of mass ratio.
5. RESPONSE REGIMES
The di!erent branches of amplitude response are very well characterized by plotting notonly the amplitude, but also the phase � between the lift force and displacement, and theLissajou "gures or phase plane portraits of lift versus displacement, i.e. C
�(t) versus >* (t);
see Figure 13. It is clear that the jump in phase angle � in this "gure is associated with thetransition from the upper branch to the lower branch. If the phase � is de"ned as the lead ofthe lift force #uctuations over the displacement, then the upper branch � is near 03, whereasthe lower branch phase is near 1803, rather like what is found for a linear forced systemgoing through resonance. It is interesting that, even when the dynamics shift from the initialto upper branch, the phase angle �, as de"ned in equations (2) and (3), remains at just above
25
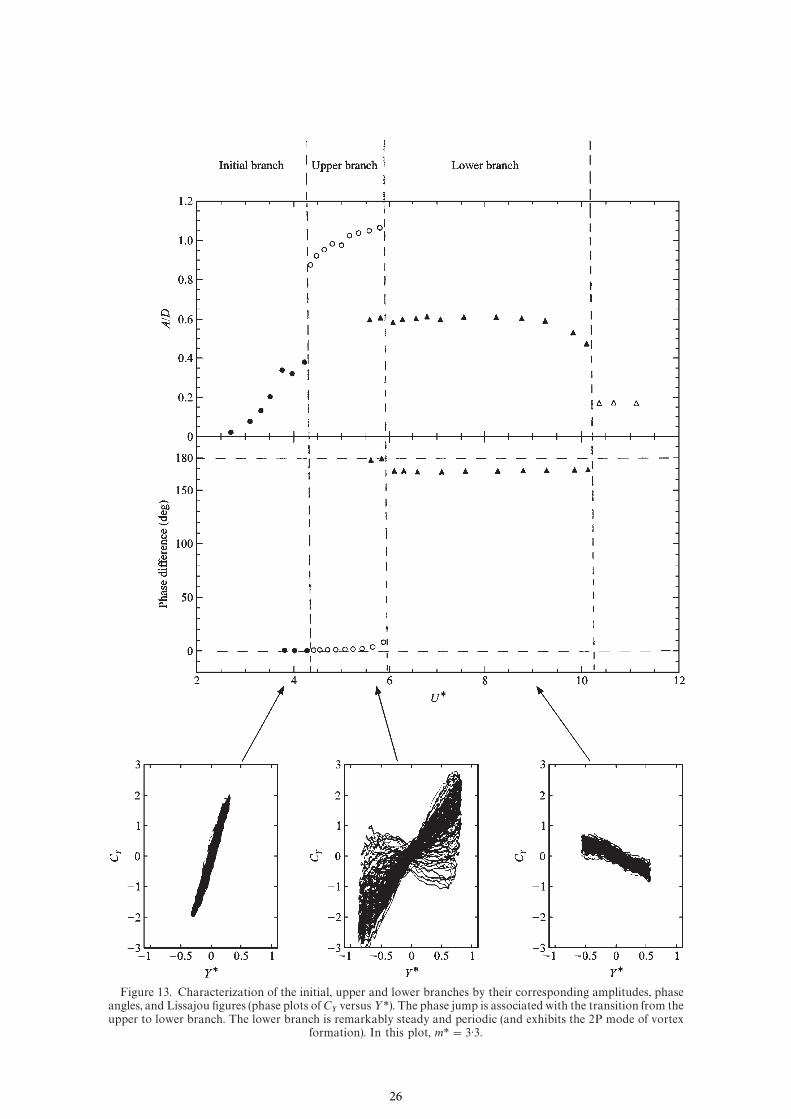
Figure 13. Characterization of the initial, upper and lower branches by their corresponding amplitudes, phaseangles, and Lissajou "gures (phase plots of C
�versus>*). The phase jump is associated with the transition from the
upper to lower branch. The lower branch is remarkably steady and periodic (and exhibits the 2P mode of vortexformation). In this plot, m*"3)3.
26
03. The Lissajou "gures indicate the very periodic nature of the oscillations in the lowerbranch example, and the relatively less steady dynamics of the upper branch example. Inthe latter case, shown by the central Lissajou "gure, the phase changes by around#1803 as the oscillations seem to wander to the smaller amplitude of the lower branch, andthen back by !1803 as the oscillations switch back to the larger amplitude of the upperbranch. There is an intermittent switching between the upper and lower branch amplitudesand phases, whereas we shall "nd a hysteretic change from the initial to the upper branch.These mode transitions are thus quite distinct.
5.1. INITIAL EXCITATION REGIME
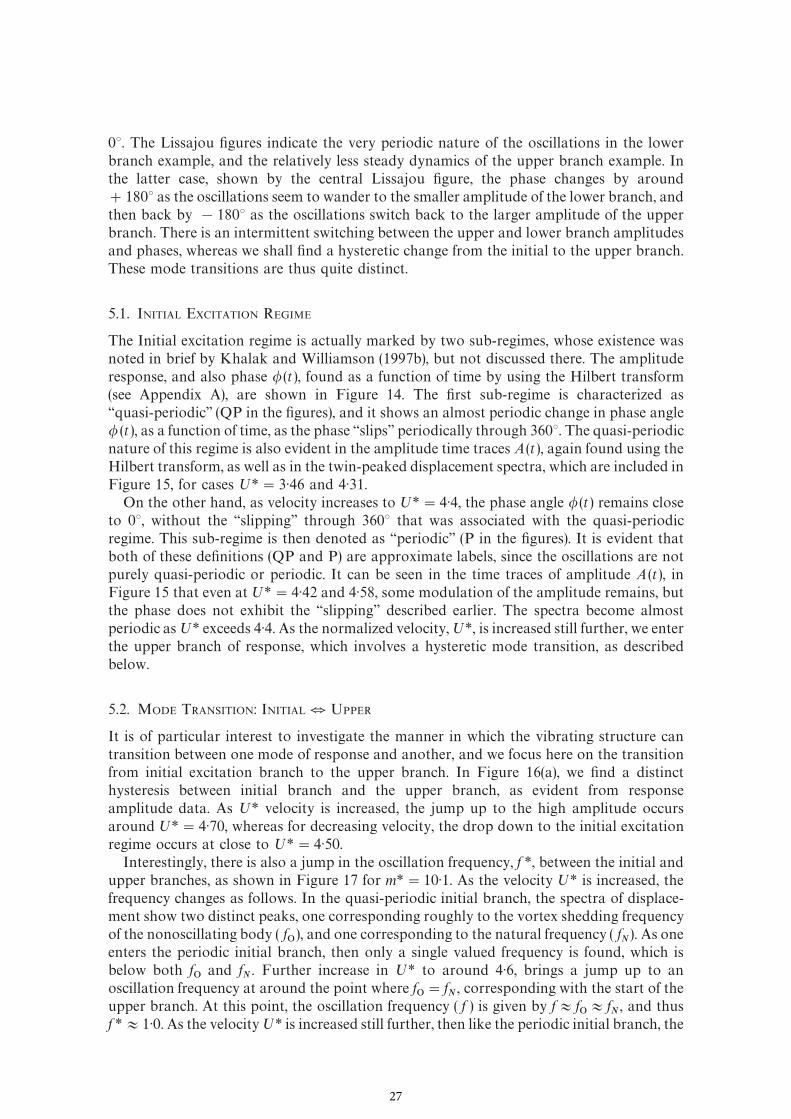
The Initial excitation regime is actually marked by two sub-regimes, whose existence wasnoted in brief by Khalak and Williamson (1997b), but not discussed there. The amplituderesponse, and also phase �(t), found as a function of time by using the Hilbert transform(see Appendix A), are shown in Figure 14. The "rst sub-regime is characterized as&&quasi-periodic'' (QP in the "gures), and it shows an almost periodic change in phase angle� (t ), as a function of time, as the phase &&slips'' periodically through 3603. The quasi-periodicnature of this regime is also evident in the amplitude time traces A(t), again found using theHilbert transform, as well as in the twin-peaked displacement spectra, which are included inFigure 15, for cases ;*"3)46 and 4)31.
On the other hand, as velocity increases to ;*"4)4, the phase angle �(t) remains closeto 03, without the &&slipping'' through 3603 that was associated with the quasi-periodicregime. This sub-regime is then denoted as &&periodic'' (P in the "gures). It is evident thatboth of these de"nitions (QP and P) are approximate labels, since the oscillations are notpurely quasi-periodic or periodic. It can be seen in the time traces of amplitude A (t), inFigure 15 that even at;*"4)42 and 4)58, some modulation of the amplitude remains, butthe phase does not exhibit the &&slipping'' described earlier. The spectra become almostperiodic as;* exceeds 4)4. As the normalized velocity,;*, is increased still further, we enterthe upper branch of response, which involves a hysteretic mode transition, as describedbelow.
5.2. MODE TRANSITION: INITIAL � UPPER
It is of particular interest to investigate the manner in which the vibrating structure cantransition between one mode of response and another, and we focus here on the transitionfrom initial excitation branch to the upper branch. In Figure 16(a), we "nd a distincthysteresis between initial branch and the upper branch, as evident from responseamplitude data. As ;* velocity is increased, the jump up to the high amplitude occursaround ;*"4)70, whereas for decreasing velocity, the drop down to the initial excitationregime occurs at close to ;*"4)50.
Interestingly, there is also a jump in the oscillation frequency, f *, between the initial andupper branches, as shown in Figure 17 for m*"10)1. As the velocity ;* is increased, thefrequency changes as follows. In the quasi-periodic initial branch, the spectra of displace-ment show two distinct peaks, one corresponding roughly to the vortex shedding frequencyof the nonoscillating body ( f
�), and one corresponding to the natural frequency ( f
�). As one
enters the periodic initial branch, then only a single valued frequency is found, which isbelow both f
�and f
�. Further increase in ;* to around 4)6, brings a jump up to an
oscillation frequency at around the point where f�"f
�, corresponding with the start of the
upper branch. At this point, the oscillation frequency ( f ) is given by f+f�+f
�, and thus
f *+1)0. As the velocity;* is increased still further, then like the periodic initial branch, the
27
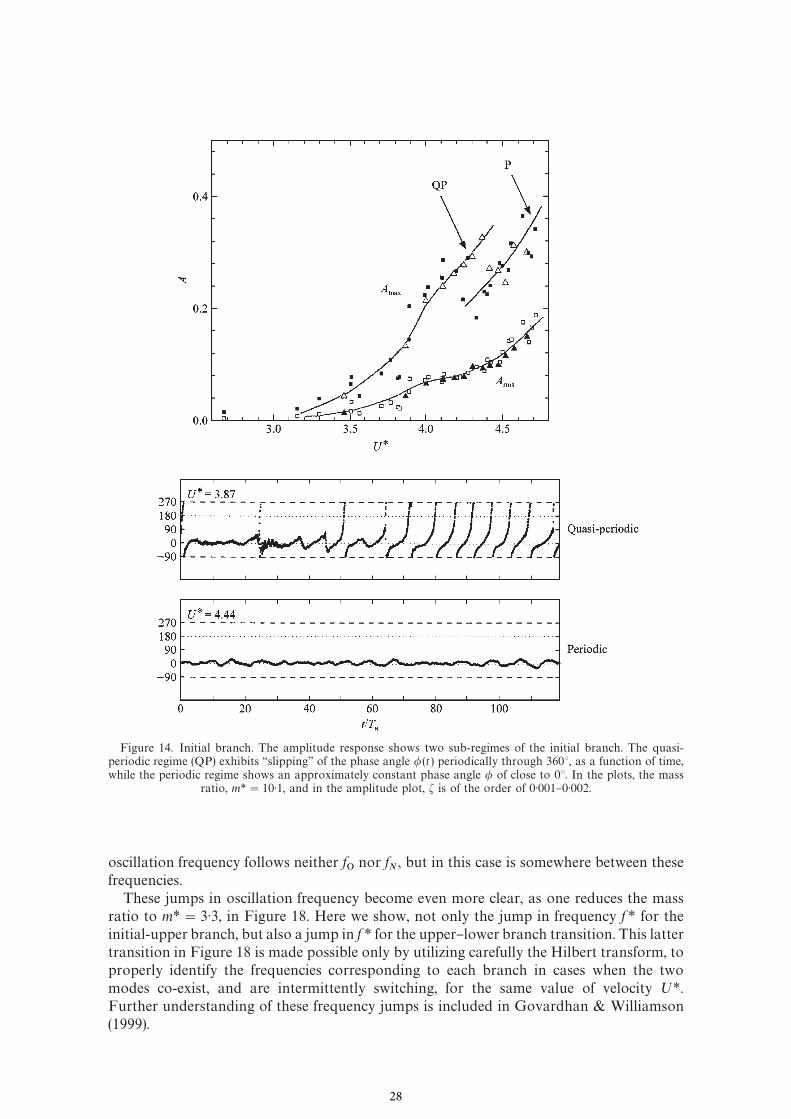
Figure 14. Initial branch. The amplitude response shows two sub-regimes of the initial branch. The quasi-periodic regime (QP) exhibits &&slipping'' of the phase angle �(t) periodically through 3603, as a function of time,while the periodic regime shows an approximately constant phase angle � of close to 03. In the plots, the mass
ratio, m*"10)1, and in the amplitude plot, � is of the order of 0)001}0)002.
oscillation frequency follows neither f�
nor f�, but in this case is somewhere between these
frequencies.These jumps in oscillation frequency become even more clear, as one reduces the mass
ratio to m*"3)3, in Figure 18. Here we show, not only the jump in frequency f * for theinitial-upper branch, but also a jump in f * for the upper}lower branch transition. This lattertransition in Figure 18 is made possible only by utilizing carefully the Hilbert transform, toproperly identify the frequencies corresponding to each branch in cases when the twomodes co-exist, and are intermittently switching, for the same value of velocity ;*.Further understanding of these frequency jumps is included in Govardhan & Williamson(1999).
28
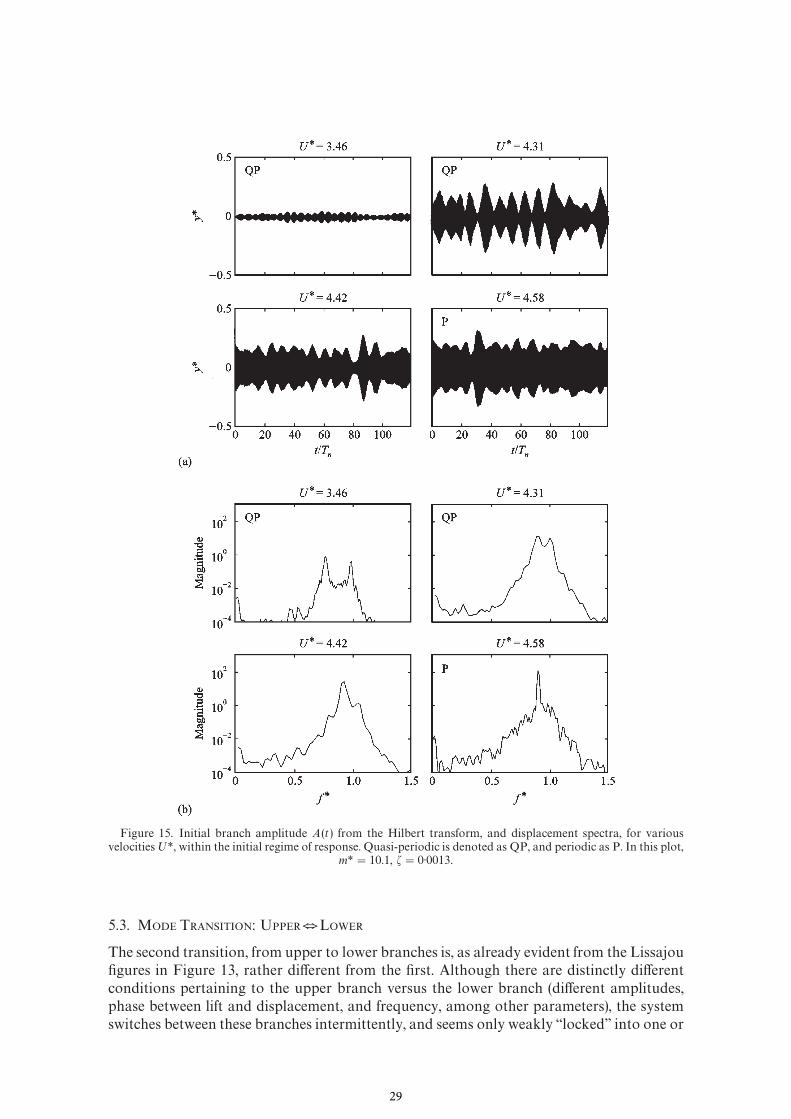
Figure 15. Initial branch amplitude A(t) from the Hilbert transform, and displacement spectra, for variousvelocities;*, within the initial regime of response. Quasi-periodic is denoted as QP, and periodic as P. In this plot,
m*"10.1, �"0)0013.
5.3. MODE TRANSITION: UPPER�LOWER
The second transition, from upper to lower branches is, as already evident from the Lissajou"gures in Figure 13, rather di!erent from the "rst. Although there are distinctly di!erentconditions pertaining to the upper branch versus the lower branch (di!erent amplitudes,phase between lift and displacement, and frequency, among other parameters), the systemswitches between these branches intermittently, and seems only weakly &&locked'' into one or
29
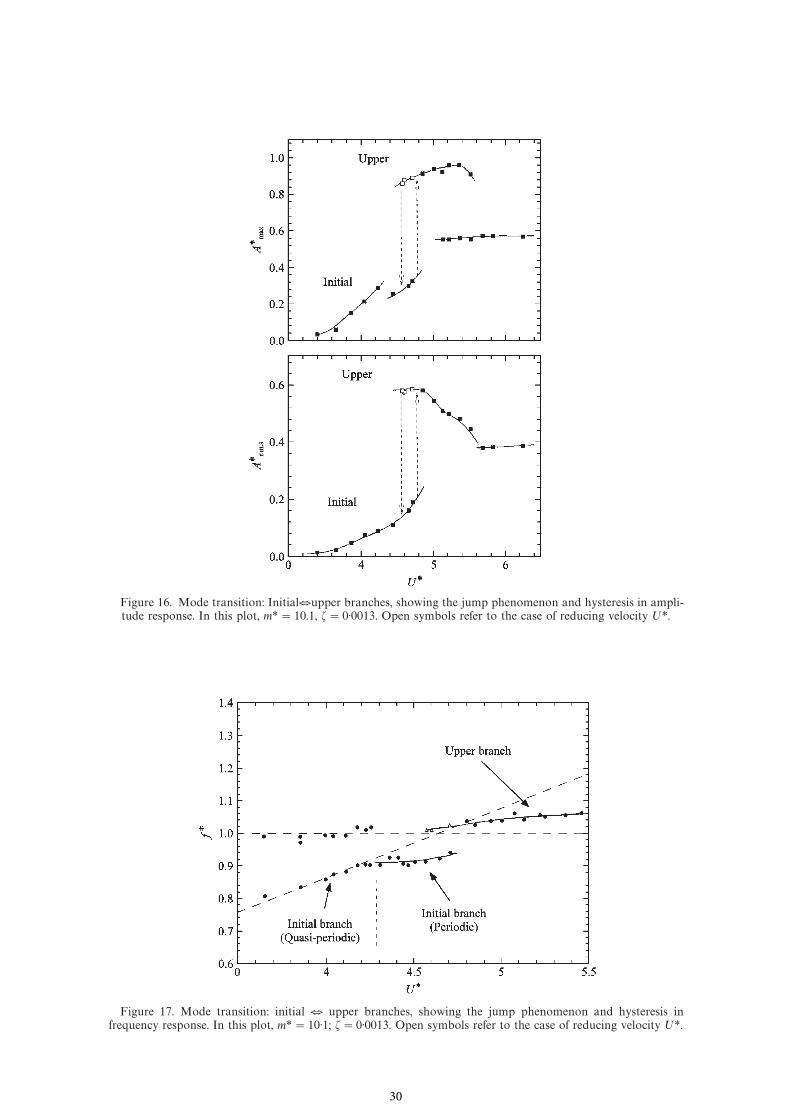
Figure 16. Mode transition: Initial�upper branches, showing the jump phenomenon and hysteresis in ampli-tude response. In this plot, m*"10.1, �"0)0013. Open symbols refer to the case of reducing velocity ;*.
Figure 17. Mode transition: initial � upper branches, showing the jump phenomenon and hysteresis infrequency response. In this plot, m*"10)1; �"0)0013. Open symbols refer to the case of reducing velocity ;*.
30
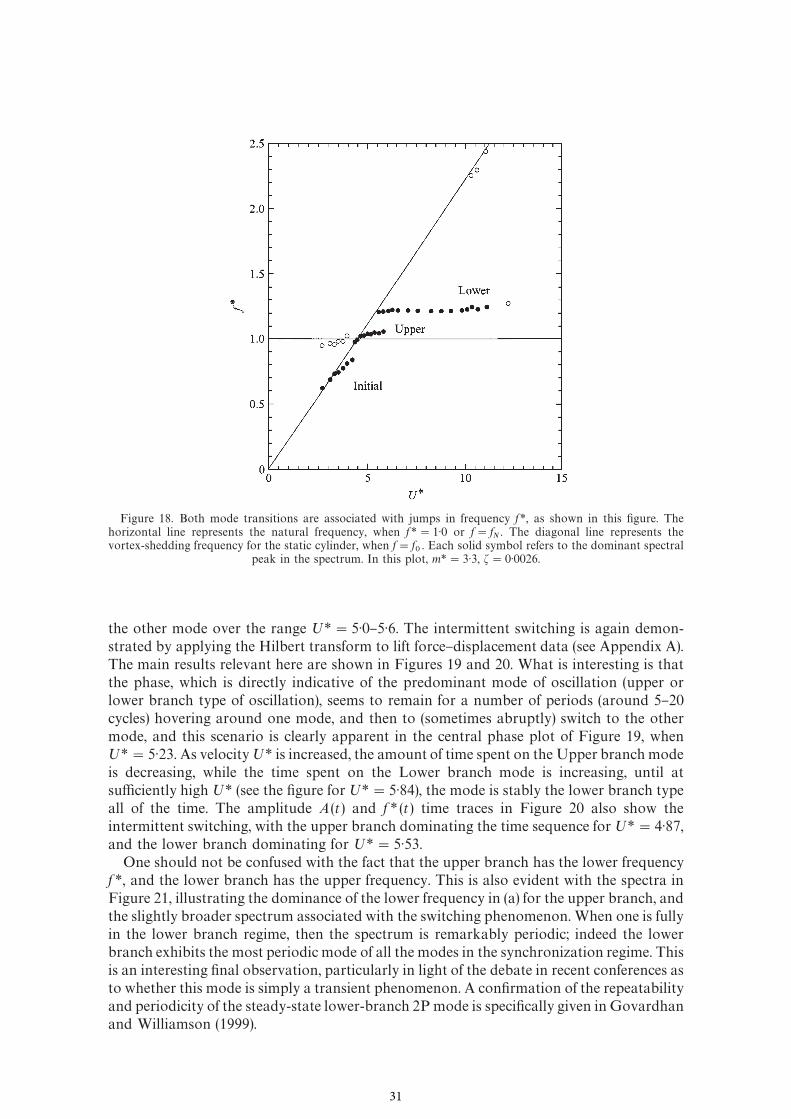
Figure 18. Both mode transitions are associated with jumps in frequency f *, as shown in this "gure. Thehorizontal line represents the natural frequency, when f *"1)0 or f"f
�. The diagonal line represents the
vortex-shedding frequency for the static cylinder, when f"f�. Each solid symbol refers to the dominant spectral
peak in the spectrum. In this plot, m*"3)3, �"0)0026.
the other mode over the range ;*"5)0}5)6. The intermittent switching is again demon-strated by applying the Hilbert transform to lift force}displacement data (see Appendix A).The main results relevant here are shown in Figures 19 and 20. What is interesting is thatthe phase, which is directly indicative of the predominant mode of oscillation (upper orlower branch type of oscillation), seems to remain for a number of periods (around 5}20cycles) hovering around one mode, and then to (sometimes abruptly) switch to the othermode, and this scenario is clearly apparent in the central phase plot of Figure 19, when;*"5)23. As velocity;* is increased, the amount of time spent on the Upper branch modeis decreasing, while the time spent on the Lower branch mode is increasing, until atsu$ciently high ;* (see the "gure for;*"5)84), the mode is stably the lower branch typeall of the time. The amplitude A(t) and f * (t) time traces in Figure 20 also show theintermittent switching, with the upper branch dominating the time sequence for;*"4)87,and the lower branch dominating for ;*"5)53.
One should not be confused with the fact that the upper branch has the lower frequencyf *, and the lower branch has the upper frequency. This is also evident with the spectra inFigure 21, illustrating the dominance of the lower frequency in (a) for the upper branch, andthe slightly broader spectrum associated with the switching phenomenon. When one is fullyin the lower branch regime, then the spectrum is remarkably periodic; indeed the lowerbranch exhibits the most periodic mode of all the modes in the synchronization regime. Thisis an interesting "nal observation, particularly in light of the debate in recent conferences asto whether this mode is simply a transient phenomenon. A con"rmation of the repeatabilityand periodicity of the steady-state lower-branch 2P mode is speci"cally given in Govardhanand Williamson (1999).
31
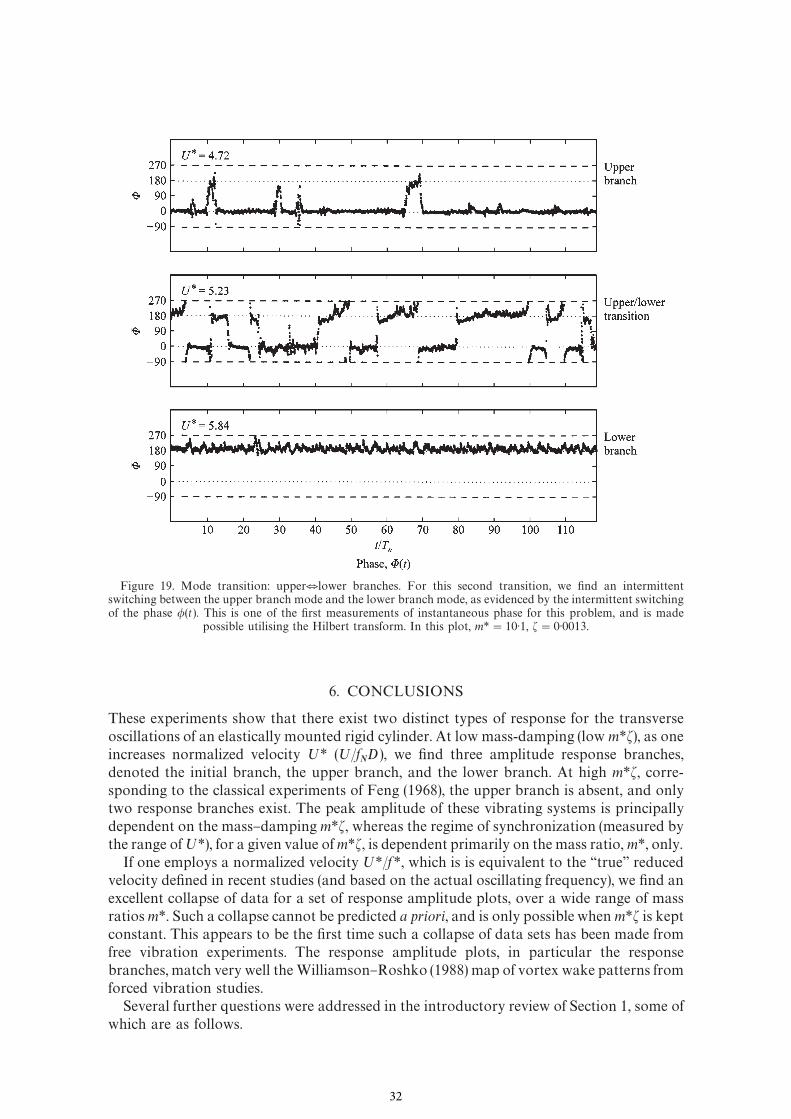
Figure 19. Mode transition: upper�lower branches. For this second transition, we "nd an intermittentswitching between the upper branch mode and the lower branch mode, as evidenced by the intermittent switchingof the phase �(t). This is one of the "rst measurements of instantaneous phase for this problem, and is made
possible utilising the Hilbert transform. In this plot, m*"10)1, �"0)0013.
6. CONCLUSIONS
These experiments show that there exist two distinct types of response for the transverseoscillations of an elastically mounted rigid cylinder. At low mass-damping (low m*�), as oneincreases normalized velocity ;* (;/f
�D ), we "nd three amplitude response branches,
denoted the initial branch, the upper branch, and the lower branch. At high m*�, corre-sponding to the classical experiments of Feng (1968), the upper branch is absent, and onlytwo response branches exist. The peak amplitude of these vibrating systems is principallydependent on the mass}damping m*�, whereas the regime of synchronization (measured bythe range of;*), for a given value of m*�, is dependent primarily on the mass ratio, m*, only.
If one employs a normalized velocity ;*/f*, which is is equivalent to the &&true'' reducedvelocity de"ned in recent studies (and based on the actual oscillating frequency), we "nd anexcellent collapse of data for a set of response amplitude plots, over a wide range of massratios m*. Such a collapse cannot be predicted a priori, and is only possible when m*� is keptconstant. This appears to be the "rst time such a collapse of data sets has been made fromfree vibration experiments. The response amplitude plots, in particular the responsebranches, match very well the Williamson}Roshko (1988) map of vortex wake patterns fromforced vibration studies.
Several further questions were addressed in the introductory review of Section 1, some ofwhich are as follows.
32
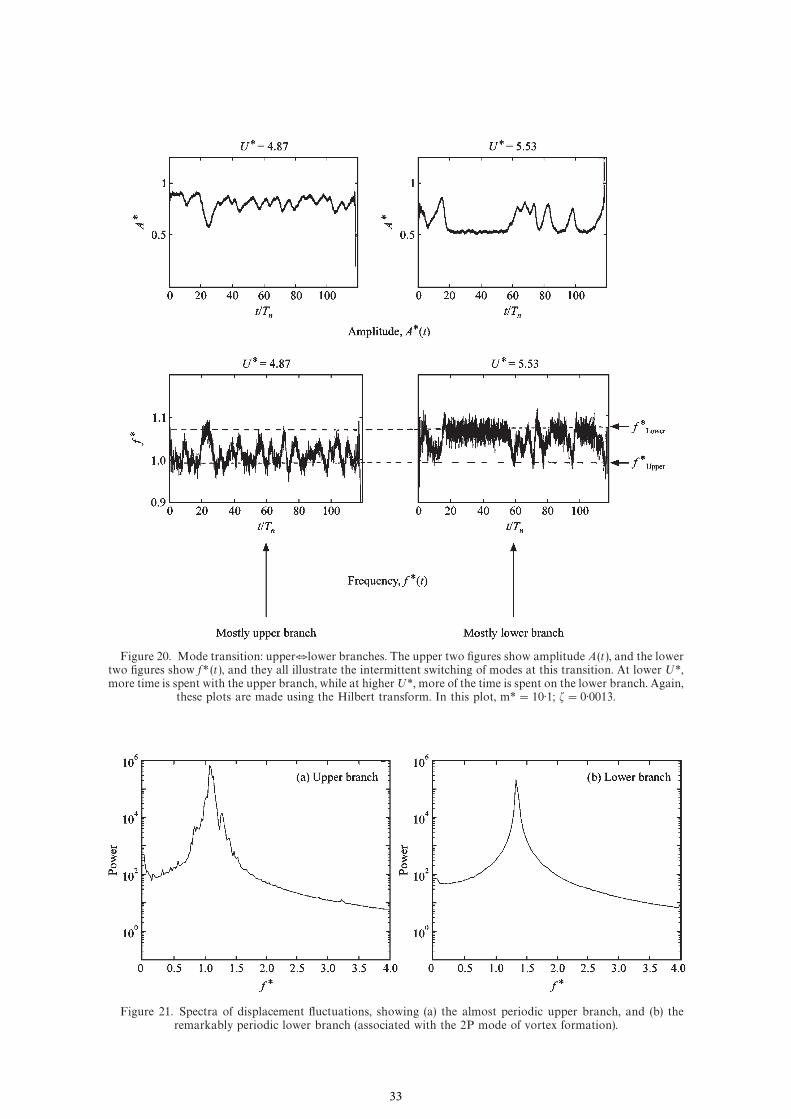
Figure 20. Mode transition: upper�lower branches. The upper two "gures show amplitude A(t), and the lowertwo "gures show f * (t), and they all illustrate the intermittent switching of modes at this transition. At lower ;*,more time is spent with the upper branch, while at higher;*, more of the time is spent on the lower branch. Again,
these plots are made using the Hilbert transform. In this plot, m*"10)1; �"0)0013.
Figure 21. Spectra of displacement #uctuations, showing (a) the almost periodic upper branch, and (b) theremarkably periodic lower branch (associated with the 2P mode of vortex formation).
33
How do the mode transitions occur? The transitions between the modes of response arediscontinuous. At low m*�, the mode change between initial and upper response branchesinvolves a hysteresis. This contrasts with the intermittent switching of modes found for thetransition between upper-lower branches. The temporal #uctuations of phase angle �,response amplitude A*, and frequency f *, have been found utilizing the Hilbert transform,which allows us to clearly illustrate these transitions, in a manner not otherwise possibleusing averaged quantities. Both of the mode transitions are associated with jumps inamplitude and frequency, but the 1803 jump in phase angle � is found only when the #owjumps between the upper}lower branches of response.
=hat are the wake vortex dynamics for each mode? Flow visualization of the modesindicates that the initial branch is associated with the 2S mode of vortex formation, whilethe lower branch corresponds with the 2P mode [con"rming the visualizations of Brika &Laneville (1993)]. There has been some debate recently as to whether the 2P mode isa transient phenomenon or is a steady-state wake mode. Interestingly, the present worksuggests that the 2P mode is the most periodic of any of the wake patterns in thesynchronization regime. However, the present #ow visualization and response/force dataare not su$cient to prove repeatability, or to clarify the vortex mode for the upper branch.These points are speci"cally addressed in Govardhan & Williamson (1999), where the use ofthe DPIV technique yields clearly the vorticity dynamics.
;nder what conditions does the classically employed &&mass}damping parameter'' collapse
peak amplitude data? One of the problems in answering this question to-date has been incomparing data coming from quite dissimilar experiments from the last 20 years. The largescatter in such data has been masked to some extent by the standard use of &&log}log'' plotsfor presenting peak ampitude data. It was our intention to conduct a set of experiments,over a range of m* and �, but under the same experimental conditions, to determine thevalidity of using the combined parameter (m*#C
�)�. The excellent collapse of peak-
amplitude data, over a wide range of mass ratios (m*"1}20), when plotted against(m*#C
�)� in the &&Gri$n'' plot, demonstrates that the use of a combined parameter is valid
down to at least (m*#C�)� &0)006. This is two orders of magnitude below the &&limit'' that
had previously been stipulated in the literature [S'1, or equivalently (m*#C
�)�'0)4].
One expects, nevertheless, that there will exist conditions under which the mass m* willindependently in#uence the peak response amplitude, even when m*� is kept constant.
=hat is the maximum attainable amplitude for a cylinder undergoing vortex-induced
vibrations, for conditions of extremely low mass and damping? A "rm numerical answer tothis question is not yet available from experiment. In the present study, the peak amplitudeis found to increase steadily as we reduce mass}damping, reaching a value A*"1)20. Thisexceeds all peak values from previous experiments of this type, and we "nd no signs yet ofamplitude saturation. Interestingly, in the Gri$n plot, our amplitude data are found tocross over, and do not appear to follow even qualitatively, recent empirical curve "ts foraccumulated data from previous vortex-induced vibration experiments. One can say, at thispoint, that the maximum attainable amplitude (A*) will be larger than 1)20 for a mass-damping (m*#C
�)� of less than 0)006. A precise evaluation of this maximum amplitude is
the subject of ongoing research. One would imagine that computer simulation, where it ispossible to set damping precisely to zero, would yield the largest possible amplitude.However, the low Re in recent simulations yield wake dynamics and response markedlydi!erent from the high-Re experiments, and maximum amplitudes are only aroundA*"0)6.
34
Further work is being conducted to probe the limits of the absolute largest amplitudethat is attainable for such a system, at extremely low values of mass and damping, and tocomplete the set of peak-amplitude data de"ning the Gri$n plot. It is expected that someform of limit to the mass ratio will be found, beyond which the combined mass}dampingm*� will not, on its own, be able to de"ne the peak amplitude. Much further workremains to be done concerning a clear understanding of the #uid physics of the vortexwake modes, and their e!ect on the force and dynamics of the structure, amongst otherstudies.
ACKNOWLEDGEMENTS
Immense thanks are due to Raghuraman Govardhan for superb help and enthusiasm withthis work, and for his rare joie de vivre. The support from the Ocean Engineering Division ofthe O.N.R., monitored by Dr Tom Swean, is gratefully acknowledged (O.N.R. ContractNos. N00014-94-1-1197 and N00014-95-1-0332).
REFERENCES
ANAGNOSTOPOULOS, P. & BEARMAN, P. W. 1992 Response characteristics of a vortex-excited cylinder atlow Reynolds numbers. Journal of Fluids and Structures 6, 39}50.
ANAND, N. M. & TORUM, A. 1985 Free span vibration of submerged pipelines in steady #ow and waves.In Proceedings of International Symposium on Separated Flow Atround Marine Structures, pp.155}199, Trondheim, Norway.
ANGRILLI, F. DISILVIO, G. & ZANARDO, A. 1974 Hydroelasticity study of a circular cylinder in a waterstream. In Flow Induced Structural <ibrations (ed. E. Naudascher), pp. 504}512. Berlin: Spring-er}Verlag.
ATSAVAPRANEE, P., BENAROYA, H. & WEI, T. 1998 Vortex dynamics in the near wake of an oscillatingcylinder. In Paper Proceedings Conference on Blu+ Body=akes and <ortex-Induced <ibrations,Washington, DC, 21}23 June 1998 (eds P. W. Bearman & C. H. K. Williamson), Paper Number 5;also Paper FEDSM98-5170 in CD-ROM from ASME.
BALASUBRAMANIAN, S. & SKOP, R.A. 1996 A nonlinear oscillator model for vortex shedding fromcylinders and cones in uniform and shear #ows. Journal of Fluids and Structures 10, 197}214.
BEARMAN, P. W. 1984 Vortex shedding from oscillating blu! bodies. Annual Review of Fluid Mechanics16, 195}222.
BEARMAN, P. W. & WILLIAMSON, C. H. K. (eds) 1998 Paper Proceedings Conference on Blu+Body=akesand<ortex-Induced<ibrations, Washington, DC, 21}23 June 1998. Printed at Cornell University,NY (Also, in highly segmented form on CD-ROM for the ASME Fluids Engineering SummerMeeting, FEDSM98.)
BLACKBURN, H. & HENDERSON, R. 1995 Wake dynamics in #ow past an oscillating cylinder. In 9thConference on Numerical Methods in ¸aminar and ¹urbulent Flow, Atlanta, GA, U.S.A., July1995.
BLACKBURN, H. & KARNIADAKIS, G. E. 1993 Two and Three dimensional simulations of vortex-inducedvibration of a circular cylinder. In 3rd International O+shore and Polar Engineering Conference,Vol. 3, pp. 715}720.
BLEVINS, R. D. 1990 Flow-Induced <ibrations. New York: Van Nostrand Reinhold.BRACEWELL, R. 1986. ¹he Fourier ¹ransform and its applications. New York: McGraw-Hill.BRIKA, D. & LANEVILLE, A. 1993 Vortex-induced vibrations of a long #exible circular cylinder. Journal
of Fluid Mechanics 250, 481}508.CUI, E. J. & DOWELL, E. H. 1981 An approximate method for calculating the vortex-induced oscillation
of blu! bodies in air and water. In Proceedings of Structures and Materials Conference, ASMEWinter Annual Meeting, Washington, DC, 15}20 November pp. 155}173.
DEAN, R. B., MILLIGAN, R. W. & WOOTTON, L.R. 1977 Study of #ow-induced vibration. Atkins Researchand Development Report, London, U.K.
EVANGELINOS, C. & KARNIADAKIS, G. E. 1998 Dynamics and #ow structures in a turbulent wake ofrigid and #exible cylinders subject to vortex-induced vibration. Journal of Fluid Mechanics(submitted).
35
FENG, C. C. 1968 The measurement of vortex-induced e!ects in #ow past a stationary and oscillatingcircular and D-section cylinders. Master's Thesis, University of British Columbia, Vancouver,B.C., Canada.
FUJARRA, A. L. C., MENEGHINI, J. R., PESCE, C. P. & PARRA, P. H. C. C. 1998 An investigation ofvortex-induced vibration of a circular cylinder in water. In Paper Proceedings Conference onBlu+ Body=akes and <ortex-Induced <ibrations, Washington, DC, 21}23 June 1998. (eds P. W.Bearman & C. H. K. Williamson), Paper Number 13; also Paper FEDSM98-5195 in CD-ROMfrom ASME.
GHARIB, M. R., LEONARD, A., GHARIB, M. & ROSHKO, A. 1998. The absence of lock-in and the role ofmass ratio. In Paper Proceedings Conference on Blu+ Body=akes and<ortex-Induced<ibrations,Washington, DC, 21}23 June 1998. (eds P. W. Bearman & Williamson C. H. K.), Paper Number24; also Paper FEDSM98-5312 in CD-ROM from ASME.
GOPALKRISHNAN, R. 1993 Vortex-induced forces on oscillating blu! cylinders. Ph.D. Thesis, MIT,Cambridge, MA, U.S.A.
GOVARDHAN, R. & WILLIAMSON, C. H. K. 1997 Vortex induced motions of a tethered sphere. Journal of=ind Engineering and Industrial Aerodynamics 69}71, 375}385.
GOVARDHAN, R. & WILLIAMSON, C. H. K. 1998 2P or not 2P. American Physical Society -51st AnnualMeeting of the DFD. Conference Summary, p. 11. Philadelphia, 22}24 November
GOVARDHAN, R. & WILLIAMSON, C. H. K. 1999 Modes of vortex formation and frequency response fora freely-vibrating cylinder. Journal of Fluid Mechanics (submitted).
GRIFFIN, O. M. 1985 Vortex shedding from blu! bodies in a shear #ow. ASME Journal of FluidsEngineering 107, 298}306.
GRIFFIN, O. M. 1980 Vortex-excited cross-#ow vibrations of a single cylindrical tube. ASME Journal ofPressure <essel ¹echnology 102, 158}166.
GRIFFIN, O. M., SKOP, R. A. & RAMBERG, S. E. 1975 The resonant vortex-excited vibrations of structuresand cable systems. In 7th O+shore ¹echnology Conference. OTC Paper 2319. Houston, Texas,U.S.A.
GRIFFIN, O. M. & RAMBERG, S. E. 1974 The vortex street wakes of vibrating cylinders. Journal of FluidMechanics 66, 553}576.
GRIFFIN, O. M. & RAMBERG, S. E. 1982 Some recent studies of vortex shedding with application tomarine tubulars and risers. ASME Journal of Energy Resources ¹echnology 104, 2}13.
GU, W, CHYU, C. & ROCKWELL, D. 1994 Timing of vortex formation from an oscillating cylinder.Physics of Fluids 6, 3677}3682.
HOVER, F. S., MILLER, S. N. & TRIANTAFYLLOU, M. S. 1997 Vortex-induced vibration of marine cables:experiments using force feedback. Journal of Fluids and Structures 11, 307}326.
HOVER, F. S., TECHET, A. H. & TRIANTAFYLLOU, M. S. 1998 Forces on oscillating uniform and taperedcylinders in cross#ow. Journal of Fluid Mechanics 363, 97}114.
HOVER, F. S. & TRIANTAFYLLOU, M. S. 1999 Spanwise vortex structures behind a vibrating cylinder incross#ow. Submitted to Journal of Fluids and Structures.
KHALAK, A. & WILLIAMSON, C. H. K. 1996 Dynamics of a hydroelastic cylinder with very low mass anddamping. Journal of Fluids and Structures 10, 455}472.
KHALAK, A. & WILLIAMSON, C. H. K. 1997a Investigation of the relative e!ects of mass and damping invortex-induced vibration of a circular cylinder. Journal of =ind Engineering and IndustrialAerodynamics 69}71, 341}350.
KHALAK, A. & WILLIAMSON, C. H. K. 1997b Fluid forces and dynamics of a hydroelastic structure withvery low mass and damping. Journal of Fluids and Structures 11, 973}982.
KING, R. 1974 Vortex-excited structural oscillations of a circular cylinder in #owing water. Ph.D.Thesis, Loughborough University of Technology, Loughborough, England.
LU, X-Y. & DALTON, C. 1996 Calculation of the timing of vortex formation from an oscillatingcylinder. Journal of Fluids and Structures 10, 527}541.
MEIER-WINDHORST, A. 1939 Flatterschwingungen von Zylindern im gleichmassigen Flussigkeits-strom. Mitteilungen des Hydraulischen Instituts der ¹echnischen Hochschule, MuK nchen 9,
3}39.MENEGHINI, J. R. & BEARMAN, P. W. 1995. Numerical simulation of high amplitude oscillatory #ow
about a circular cylinder. Journal of Fluids and Structures 9, 435}455.MERCIER, J. A. 1973 Large amplitude oscillations of a circular cylinder in a low speed stream. Ph.D.
Thesis, Stevens Institute of Technology, NJ, USA.MOE, G. & WU, Z-J. 1990 The lift force on a cylinder vibrating in a current. ASME Journal of O+shore
Mechanics and Arctic Engineering 112, 297}303.
36
MOE, G. & OVERVIK, T. 1982 Current-induced motions of multiple risers. In Proceedings of BOSS-82,Behaviour of O+shore Structures, Vol. 1, pp. 618}639. Cambridge, MA, U.S.A.
NAUDASCHER, E. & ROCKWELL, D. 1993 Flow-Induced <ibrations: An Engineering Guide. Rotterdam:Balkema.
NEWMAN, D. & KARNIADAKIS, G. E. 1996 Simulations of #ow over a #exible cable: Comparison offorced and #ow-induced vibration. Journal of Fluids and Structures 10, 439}453.
ONGOREN, A. & ROCKWELL, D. 1988 Flow structure from an oscillating cylinder. Part 2. Modecompetition in the near wake. Journal of Fluid Mechanics 191, 225}245.
PARKINSON, G. 1989 Phenomena and modelling of #ow-induced vibrations of blu! bodies. Progress inAerospace Sciences 26, 169}224.
PESCE, C. P. & FUJARRA, A. L. C. 1999 Vortex-induced vibrations and jump phenomenon: experimentswith a clamped #exible cylinder in water. International Journal of O+shore and Polar Engineering(to appear).
RAMBERG, S. E. & GRIFFIN, O. M. 1981 Hydroelastic response of marine cables and risers. InHydrodynamics in Ocean Engineering, pp. 1223}1245. Norwegian Institute of Technology, Tron-dheim, Norway.
SALTARA, F., MENEGHINI, J. R., SIQUEIRA, C. R. & BEARMAN, P. W. 1998 The simulation of vortexshedding from an oscillating circular cylinder with turbulence modelling. In Bearmanand Williamson (1998), Paper Number 25; also Paper FEDSM98-5189 in CD-ROM fromASME.
SARPKAYA, T. 1978 Fluid forces on oscillating cylinders. ASCE Journal of =aterway, Port, Coaastal,and Ocean Division 104, 275}290.
SARPKAYA, T. 1979 Vortex-induced oscillations. Journal of Applied Mechanics 46, 241}258.SARPKAYA, T. 1993 O!shore hydrodynamics. ASME Journal of O+shore Mechanics and Arctic Engin-
eering 115, 2}5.SARPKAYA, T. 1995 Hydrodynamic damping, #ow-induced oscillations, and biharmonic response.
ASME Journal of O+shore Mechanics and Arctic Engineering 117, 232}238.SCRUTON, C. 1965 On the wind-excited oscillations of towers, stacks and masts. In Proceedings of the
Symposium on =ind E+ects on Buildings and Structures, Paper 16, pp. 798}836. London: HerMajesty's Stationery O$ce.
SHERIDAN, J., CARBERRY, J., LIN, J.-C. & ROCKWELL, D. 1998. On the near wake topology of an oscillatingcylinder. Journal of Fluids and Structures 12, 215}220.
SHIELS, D., LEONARD, A. & ROSHKO, A. 1998 Flow-induced vibration of a circular cylinder at limitingstructural parameters. Journal of Fluids and Structures (submitted).
SKOP, R. A. 1974 On modelling vortex-excited oscillations. NRL Memorandum Report 2927.SKOP, R. A. & BALASUBRAMANIAN, S. 1997 A new twist on an old model for vortex-excited vibrations.
Journal of Fluids and Structures 11, 395}412.SKOP, R. A. & GRIFFIN, O. M. 1973 An heuristic model for determining #ow-induced vibrations of
o!shore strcutures. In 5th O+shore ¹echnology Conference, OTC Paper 1843, Houston, Ts, U.S.A.STANSBY, P. K. 1976 The locking-on of vortex shedding due to the cross-stream vibration of circular
cylinders in unform and shear #ows. Journal of Fluid Mechanics 74, 641}655.STAUBLI, T. 1983 Calculation of the vibration of an elastically-mounted cylinder using experimental
data from forced oscillation. ASME Journal of Fluids Engineering 105, 225}229.SUMER, B. M. & FREDS"ZE, J. 1997 Hydrodynamics around Cylindrical Structures. Singapore: World
Scienti"c.TECHET, A. H., HOVER, F. S. & TRIANTAFYLLOU, M. S. 1998 Vortical patterns behind a tapered cylinder
oscillating transversely to a uniform #ow. Journal of Fluid Mechanics 363, 79}96.TRIANTAFYLLOU, M. S. & GROSENBAUGH. 1995 Prediction of vortex-induced vibrations in sheared #ows.
In Flow-Induced <ibration (ed. P.W.Bearman), pp. 73}82. Rotterdam: Balkema.VICKERY, B. J. & WATKINS, R. D. 1964 Flow-induced vibrations of cylindrical structures. In Proceedings
of the First Australian Conference on Hydraulics and Fluid Mechanics (ed. R. Silvester). New York:Pergamon Press.
VIKESTAD. 1998 Multi-frequency response of a cylinder subjected to vortex shedding and supportmotions. Ph.D. Thesis Norwegian Institute of Technology, Trondheim, Norway. Data providedto the authors by K. Vandiver, Private Communication.
WILLIAMSON, C. H. K. & ROSHKO, A. 1988. Vortex formation in the wake of an oscillating cylinder.Journal of Fluids and Structures 2, 355}381.
ZDRAVKOVICH, M. M. 1982 Modi"cation of vortex shedding in the synchronization range. ASMEJournal of Fluids Engineering 104, 513}517.
37
ZDRAVKOVICH, M. M. 1990 On origins of hysteretic responses of a circular cylinder induced by vortexshedding. Zeitschrift fur Flugwissenschaften=eltraumforschung 14, 47}58.
APPENDIX A: COMPUTATION OF INSTANTANEOUS AMPLITUDE ANDPHASE BY MEANS OF THE HILBERT TRANSFORM
The de"nitions of instantaneous amplitude and instantaneous phase of the signal are intuitive, but arenot obvious to precisely de"ne. We can generate precise de"nitions for these quantities using theHilbert transform, which is related to the Fourier transform. An extensive treatment of transforms isgiven in Bracewell (1986).
A single complex-valued quantity can embody both instantaneous amplitude and instantaneousphase. That is, for a real-valued signal, x(t) , we can de"ne z(t) a complex-valued signal such that theamplitude and phase of z(t) are actually the instantaneous amplitude and phase of x(t). That wediscuss the instantaneous phase of the signal indicates that this procedure is relevant for signals thatare primarily monochromatic. For signals which do not have a dominant frequency, more generaltechniques such as wavelet analysis may be more applicable.
We impose the constraint on z (t) that its phase should be monotonic with time. That is, if we followz(t) in the complex plane as it rotates about zero, corresponding to the oscillations in x(t) , then thesense of the rotation should always be counter-clockwise. Continuing the image of z (t) in the complexplane, the instantaneous amplitude is simply the distance of z(t) from the origin. For example, one mayconstruct the complex-valued signal z(t)"e�� from the real-valued signal x(t)"cos(�t).
A monotonically increasing phase demands that the frequency content of z (t) be solely positive.This can be generated from the original signal, x (t), as follows. De"ne X(�),F(x), where F denotesthe operator for the Fourier transform. Then, de"ne z(t) such that Z(�),F(z) has the property
Z(�)"�2X(�),
0
�*0,
�(0.
This can also be written asZ(�)"X (�)#sgn (�)X(�),
where sgn is the signum function. The quantity z (t), given x(t), then becomes
z (t),F���X (�)#sgn(�) X (�)� (A1)
"x (t)#F���sgn (�) X(�)� . (A2)
To continue further, we need to introduce the Hilbert transform, H, which is de"ned as
H(x),1
� ��
���
x (t)
t!s�dt, (A3)
where s is the transformed variable. Since this integral has a singularity at t"s, we take the Cauchyprinciple value (i.e. around a contour integral in the complex plane on a path which is perturbed neart"s). The Hilbert transform can also be written in terms of a convolution
H (x)"!1
�t* x(t).
where * represents the convolution operator. We can rewrite the Hilbert transform in terms of themore familiar Fourier transform as follows:
H (x)"F���F�!1
�t* x�� (A4)
"F���F�!1
�t �F(x)� (A5)
"!iF���sgn (�)F (x)� (A6)
38
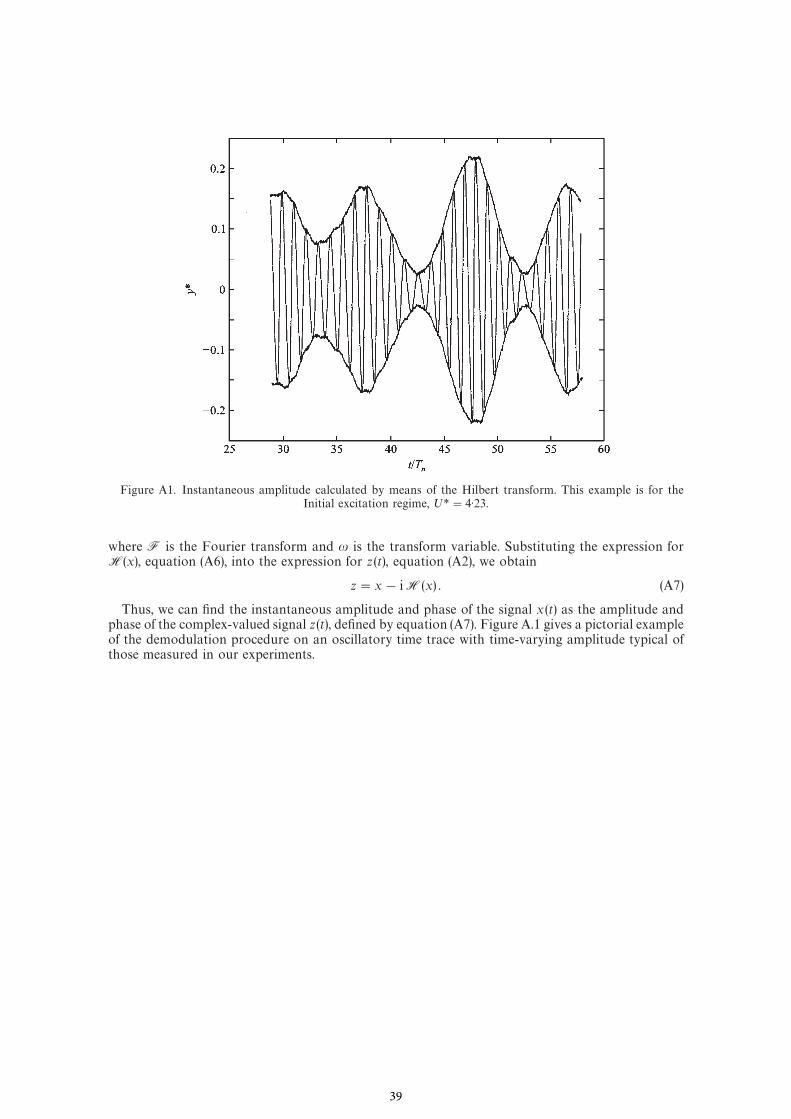
Figure A1. Instantaneous amplitude calculated by means of the Hilbert transform. This example is for theInitial excitation regime, ;*"4)23.
where F is the Fourier transform and � is the transform variable. Substituting the expression forH(x), equation (A6), into the expression for z (t), equation (A2), we obtain
z"x!iH(x) . (A7)
Thus, we can "nd the instantaneous amplitude and phase of the signal x (t) as the amplitude andphase of the complex-valued signal z(t), de"ned by equation (A7). Figure A.1 gives a pictorial exampleof the demodulation procedure on an oscillatory time trace with time-varying amplitude typical ofthose measured in our experiments.
39