Honda Aircraft Company, Inc. Form 442 STA application for ...
Upload
khangminh22Category
view
1download
0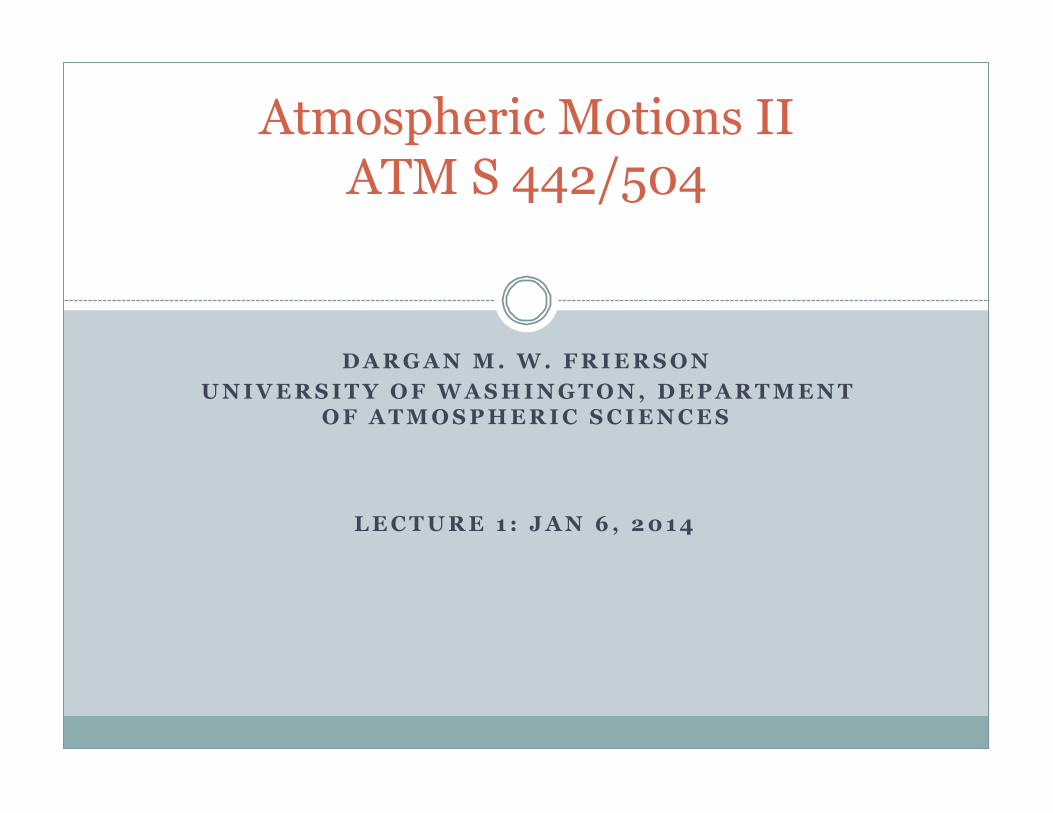
D A R G A N M . W . F R I E R S O N U N I V E R S I T Y O F W A S H I N G T O N , D E P A R T M E N T
O F A T M O S P H E R I C S C I E N C E S
Atmospheric Motions II ATM S 442/504
L E C T U R E 1 : J A N 6 , 2 0 1 4
Atmospheric Motions
� Fluid motion on the sphere!
Water vapor global composite (U Wisc)
Class Summary
� Looking for ways to interpret atmospheric circulations ¡ Understanding of why different classes of motions occur
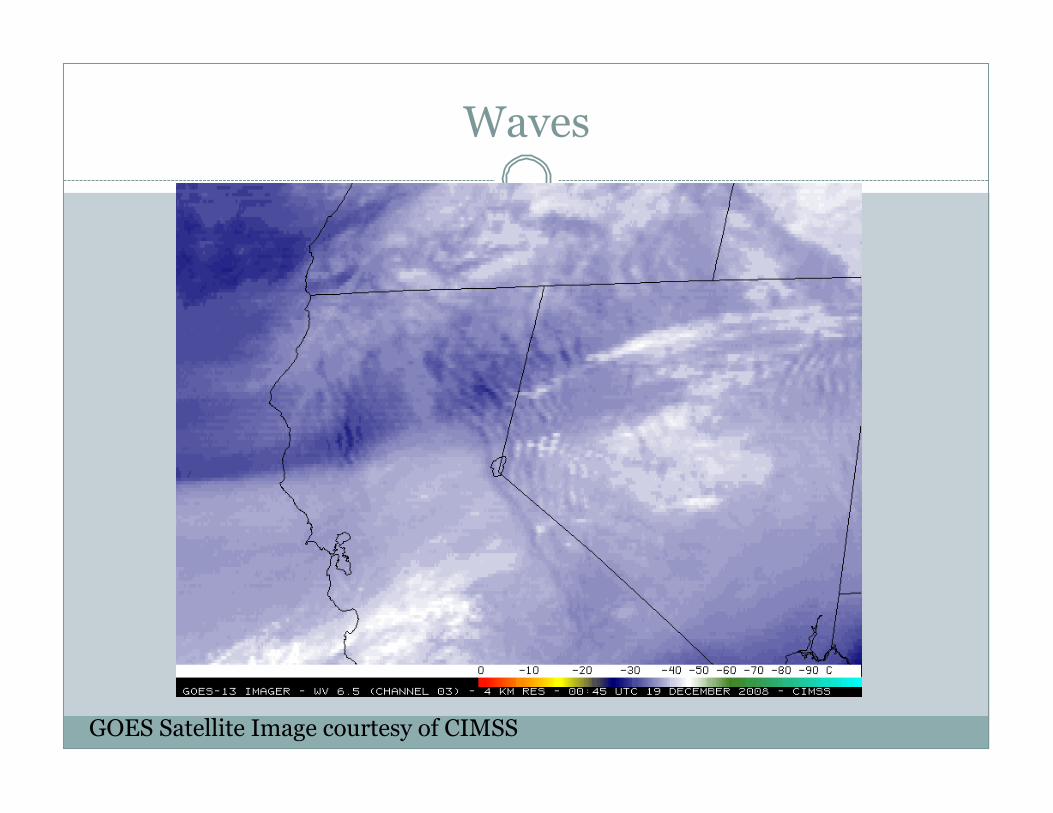
Waves
GOES Satellite Image courtesy of CIMSS
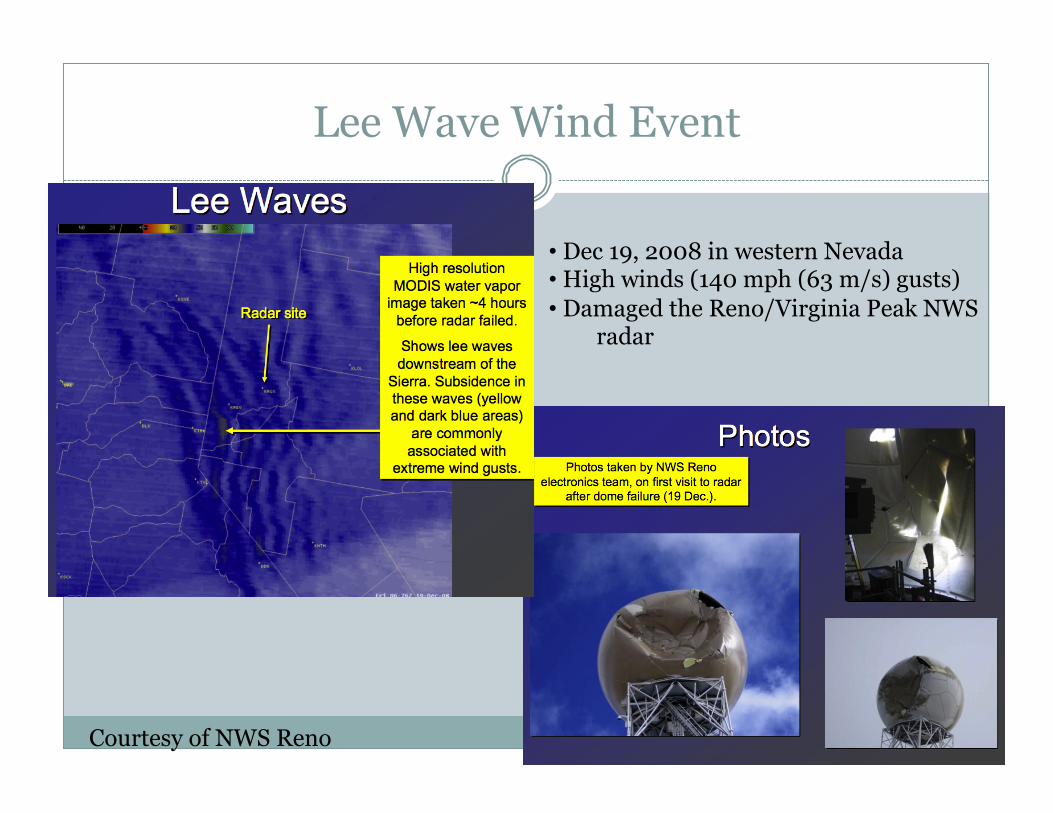
Lee Wave Wind Event
• Dec 19, 2008 in western Nevada • High winds (140 mph (63 m/s) gusts) • Damaged the Reno/Virginia Peak NWS
radar
Courtesy of NWS Reno
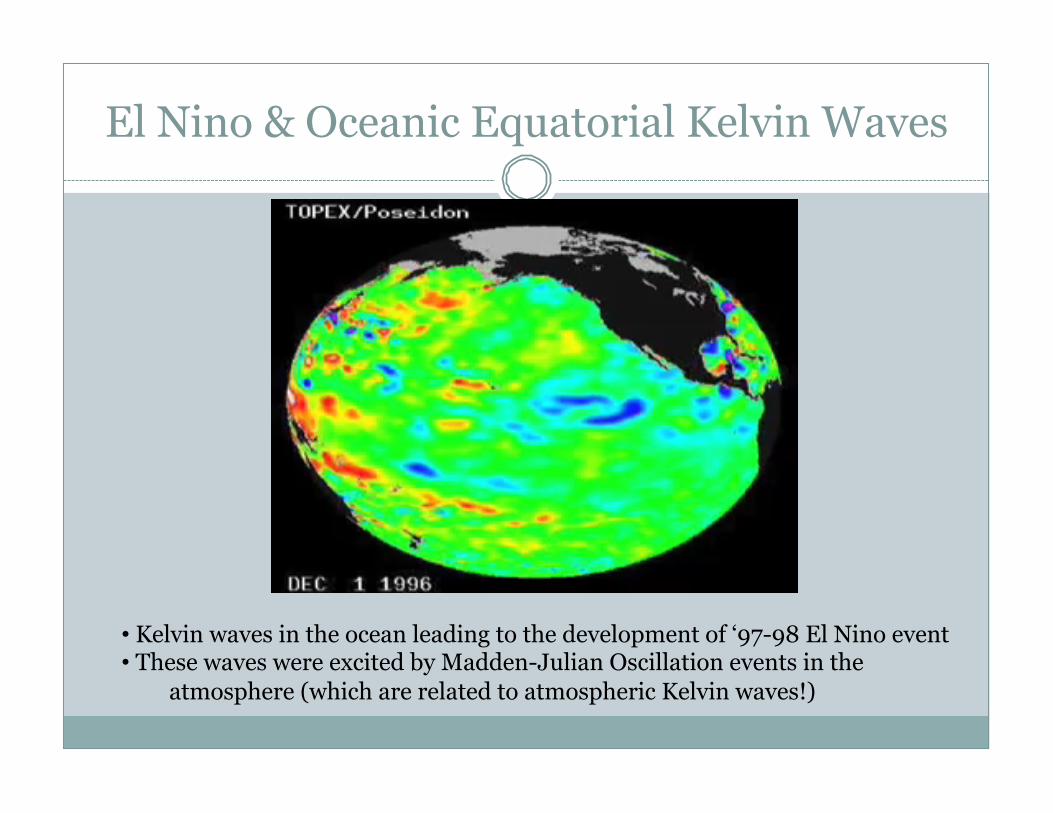
El Nino & Oceanic Equatorial Kelvin Waves
• Kelvin waves in the ocean leading to the development of ‘97-98 El Nino event • These waves were excited by Madden-Julian Oscillation events in the
atmosphere (which are related to atmospheric Kelvin waves!)
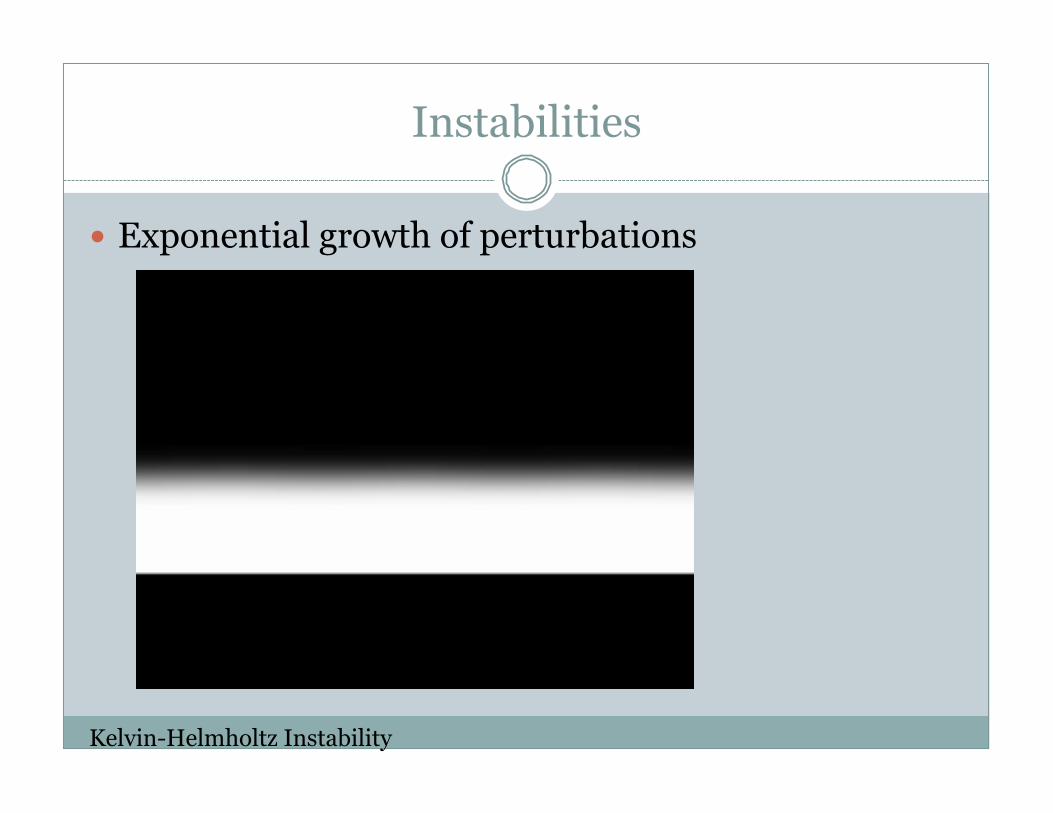
Instabilities
� Exponential growth of perturbations
Kelvin-Helmholtz Instability
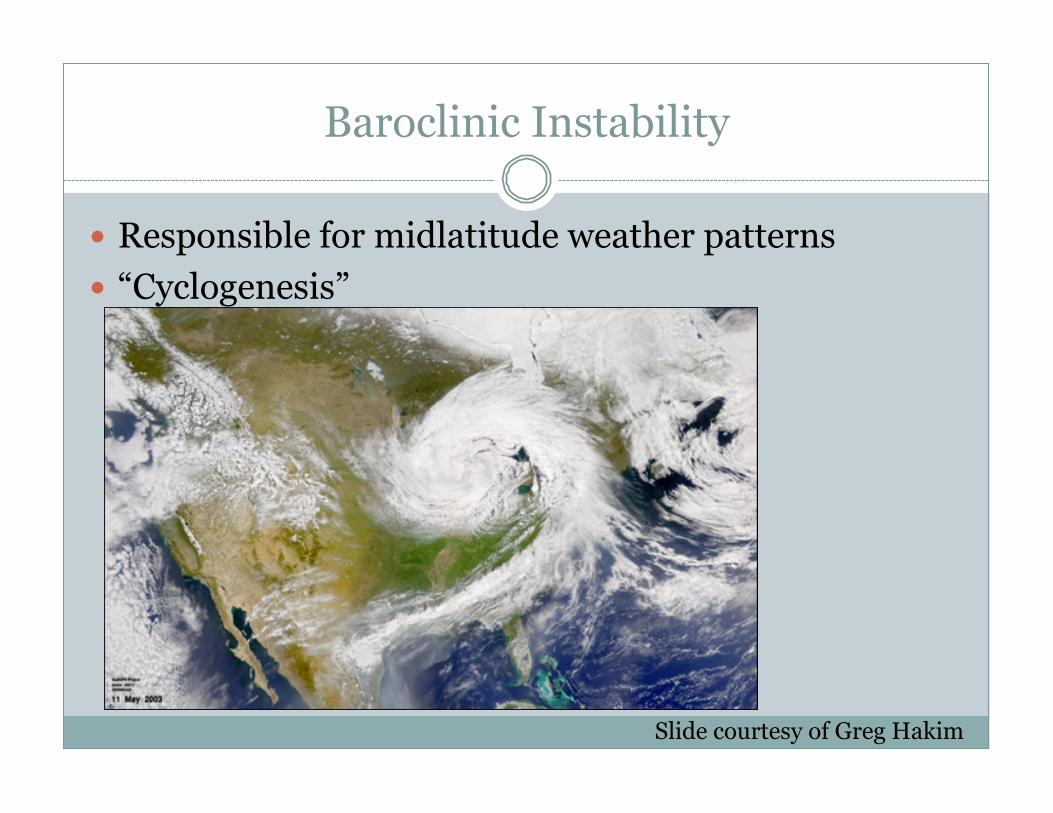
Baroclinic Instability
� Responsible for midlatitude weather patterns � “Cyclogenesis”
Slide courtesy of Greg Hakim
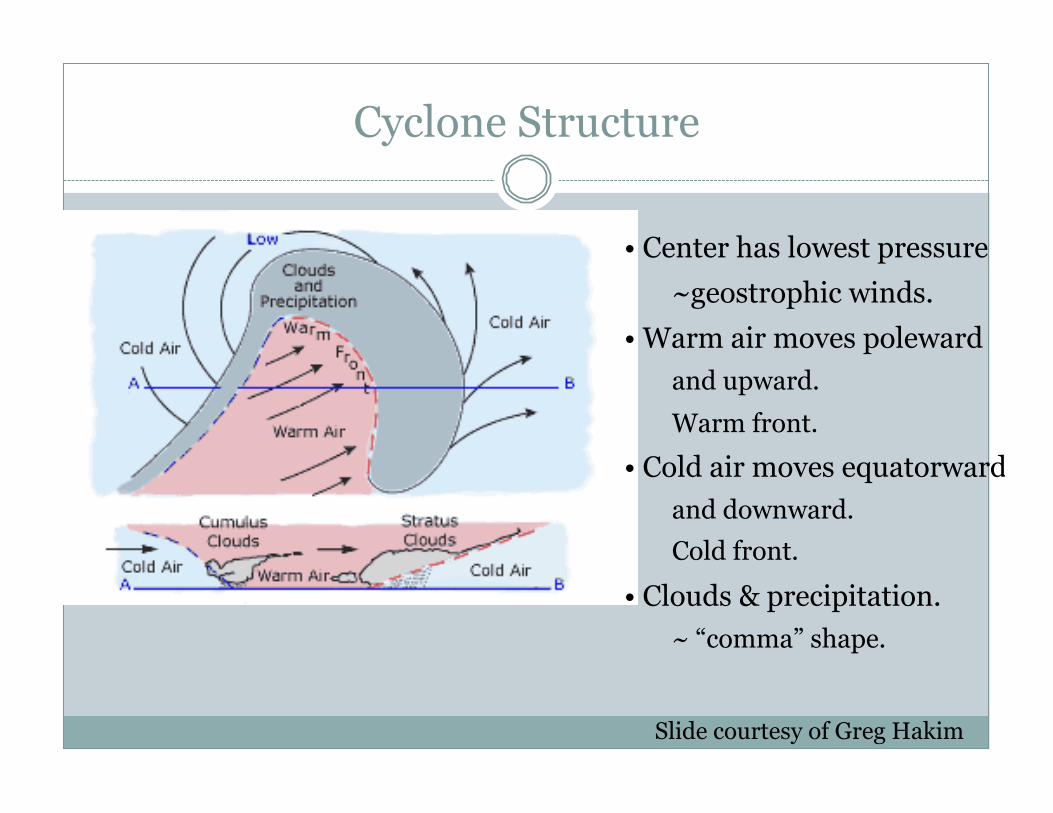
• Center has lowest pressure ~geostrophic winds.
• Warm air moves poleward and upward.
Warm front.
• Cold air moves equatorward and downward. Cold front.
• Clouds & precipitation. ~ “comma” shape.
Cyclone Structure
Slide courtesy of Greg Hakim
10
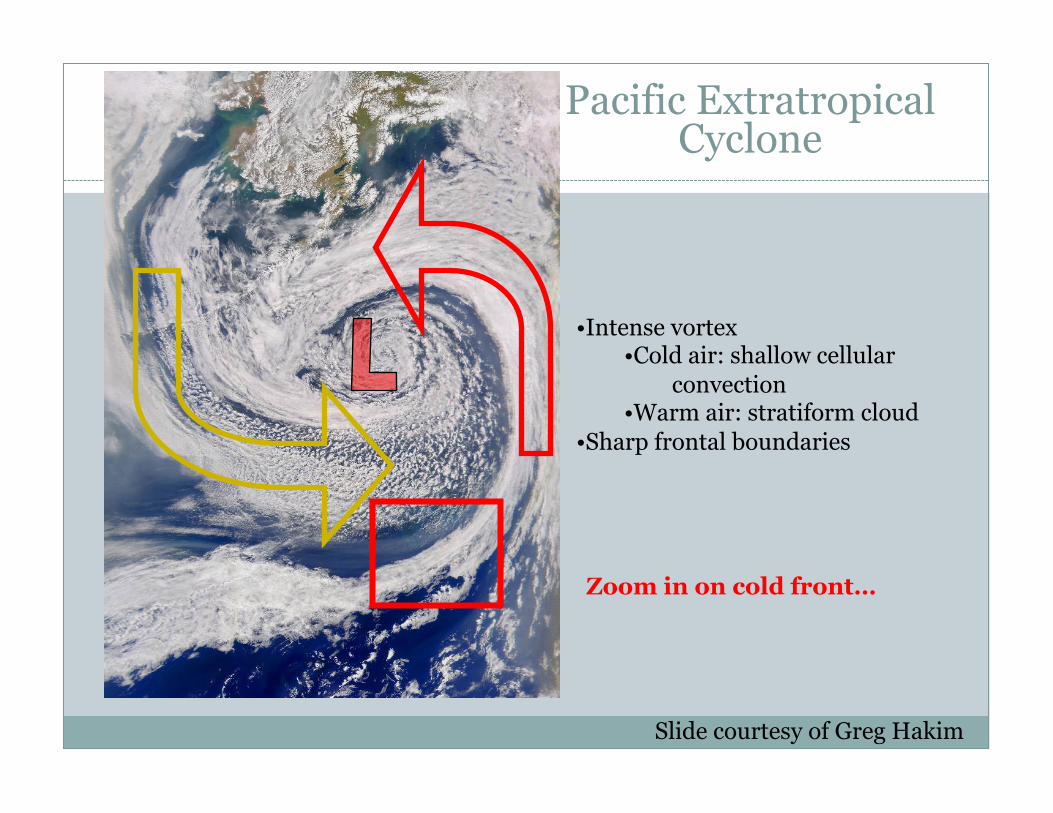
• Intense vortex • Cold air: shallow cellular
convection • Warm air: stratiform cloud
• Sharp frontal boundaries
Zoom in on cold front…
Pacific Extratropical Cyclone
Slide courtesy of Greg Hakim
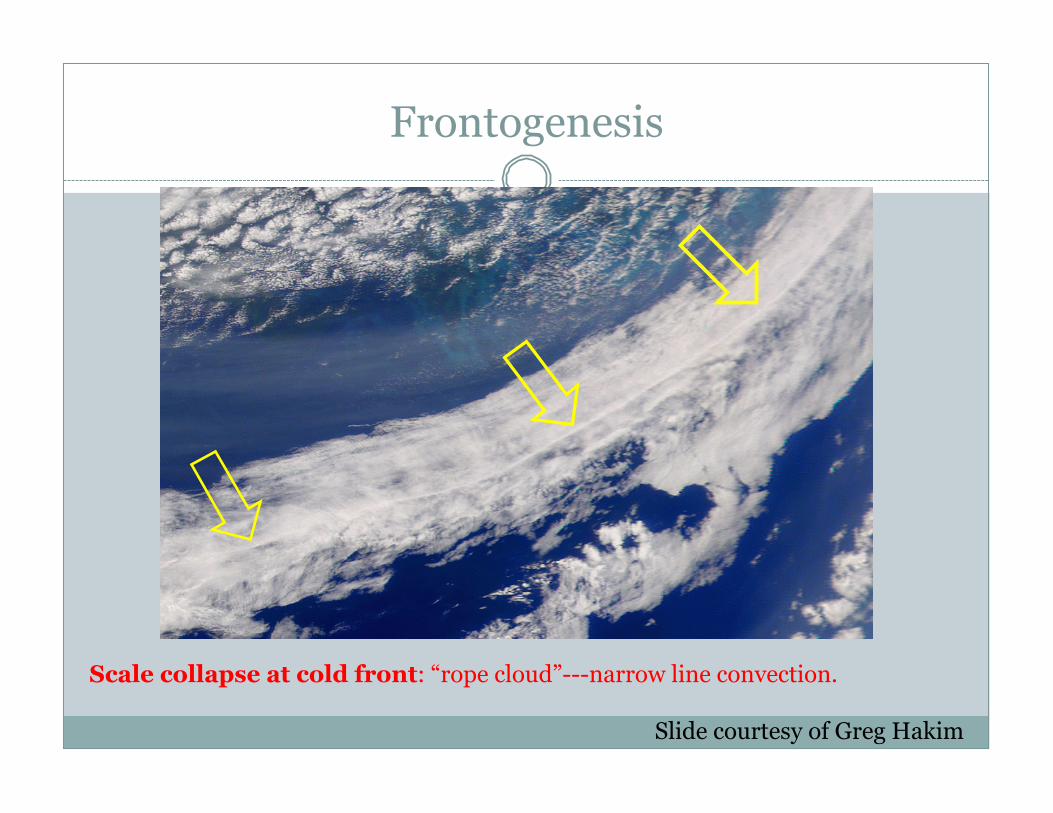
Scale collapse at cold front: “rope cloud”---narrow line convection.
Slide courtesy of Greg Hakim
Frontogenesis
Why study “balanced models” like QG?
� We’ll illustrate this with some history: ¡ The first NWP experiment (Richardson, 1922) ¡ The first successful NWP model (Charney, Fjortoft, & von
Neumann, 1950)
All info on this topic is from Peter Lynch: Check out his book “The Emergence of NWP”!
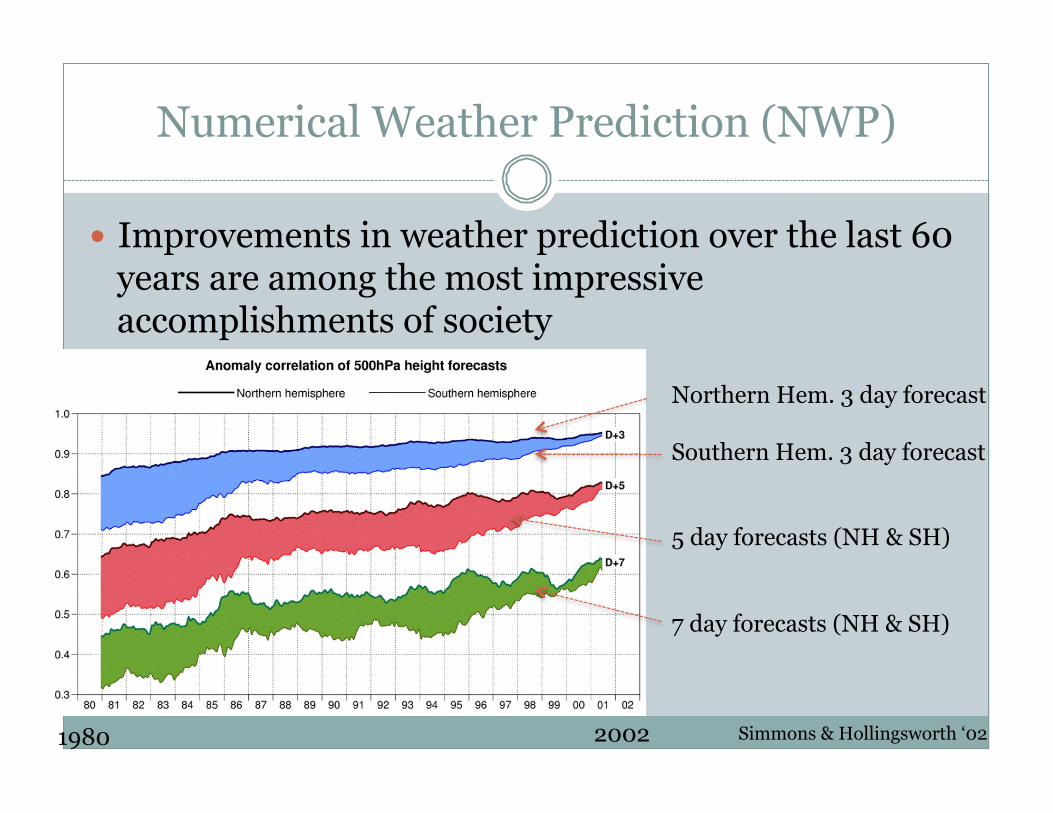
Numerical Weather Prediction (NWP)
� Improvements in weather prediction over the last 60 years are among the most impressive accomplishments of society
Simmons & Hollingsworth ‘02
Northern Hem. 3 day forecast Southern Hem. 3 day forecast 5 day forecasts (NH & SH) 7 day forecasts (NH & SH)
1980 2002
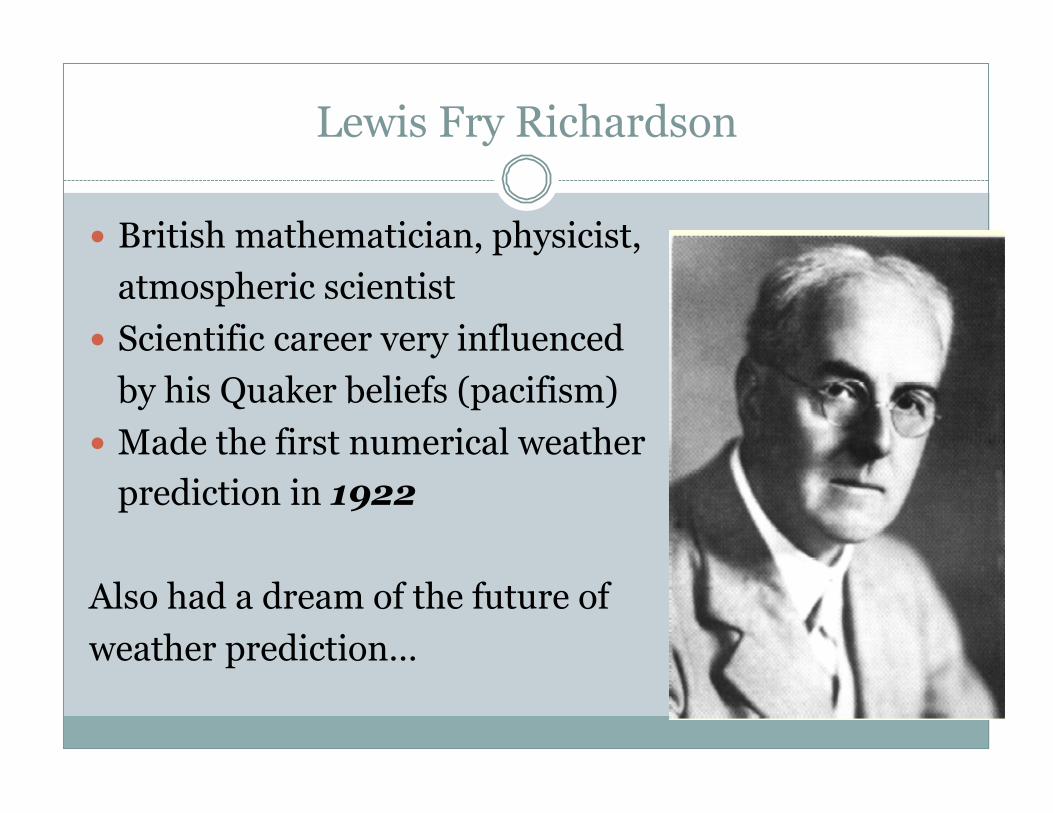
Lewis Fry Richardson
� British mathematician, physicist, atmospheric scientist
� Scientific career very influenced by his Quaker beliefs (pacifism)
� Made the first numerical weather prediction in 1922
Also had a dream of the future of weather prediction…
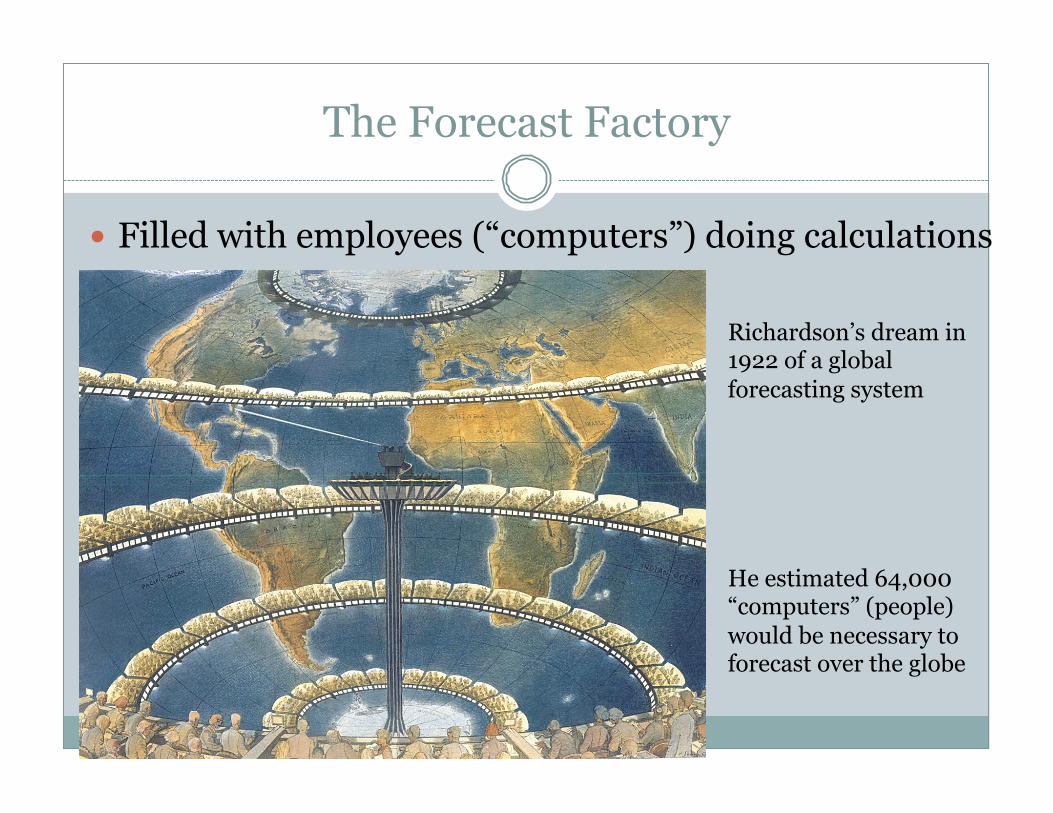
The Forecast Factory
� Filled with employees (“computers”) doing calculations
He estimated 64,000 “computers” (people) would be necessary to forecast over the globe
Richardson’s dream in 1922 of a global forecasting system
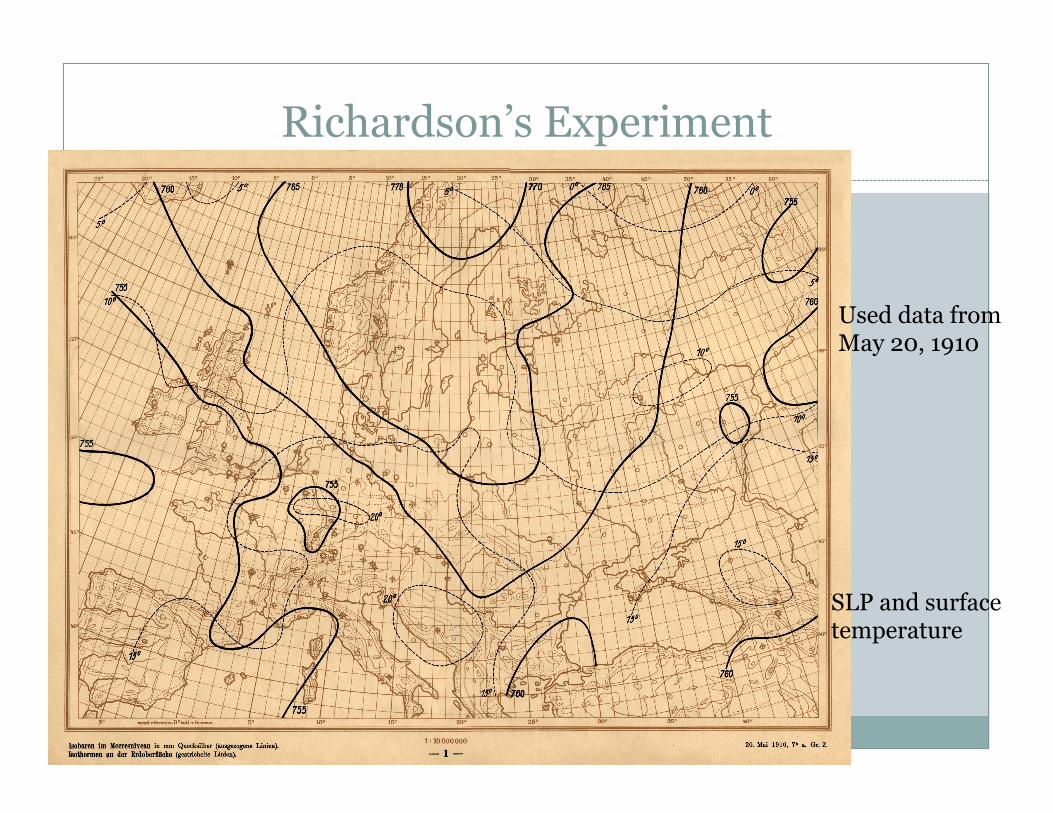
Richardson’s Experiment
SLP and surface temperature
Used data from May 20, 1910
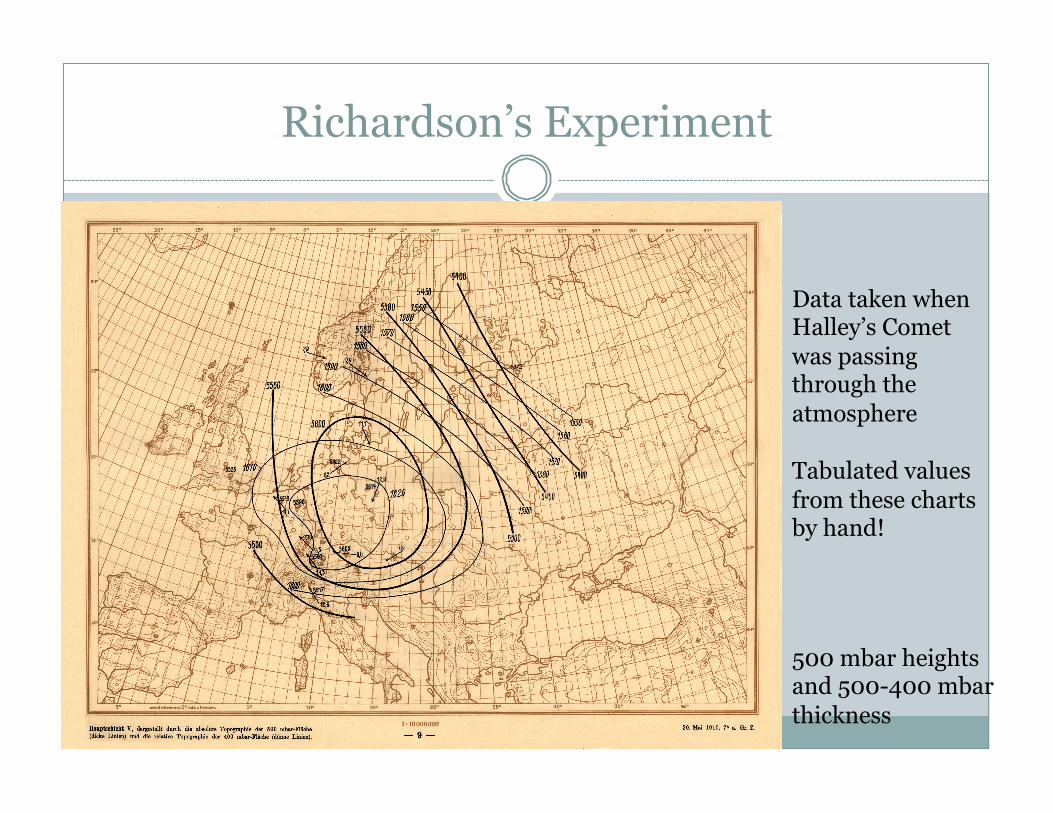
Richardson’s Experiment
500 mbar heights and 500-400 mbar thickness
Data taken when Halley’s Comet was passing through the atmosphere Tabulated values from these charts by hand!
Richardson’s Calculations
� Served as ambulance driver with the Friends’ Ambulance Unit in France during WWI ¡ Transported injured soldiers, often under heavy fire
� Took six weeks to perform the calculations ¡ “My office was a heap of hay in a cold rest billet” ¡ Peter Lynch thinks he meant 6 weeks*7 days*24 hours = 1000 hours
of computation! ÷ I.e., it took him the whole time he was in France, 2 years
� Calculation book was lost during the battle of Calculation book was lost during the battle of Champagne ¡ But recovered months later under a heap of coal
� Eventually published in 1922

Richardson’s Calculations
� Goal: calculate the surface pressure tendency at one point (in Bavaria), 6 hours in the future
� Discretized into five layers in the vertical � Used primitive equations
¡ Assuming hydrostatic balance
� Used finite differences to calculate changes in momentum, temperature, and pressure
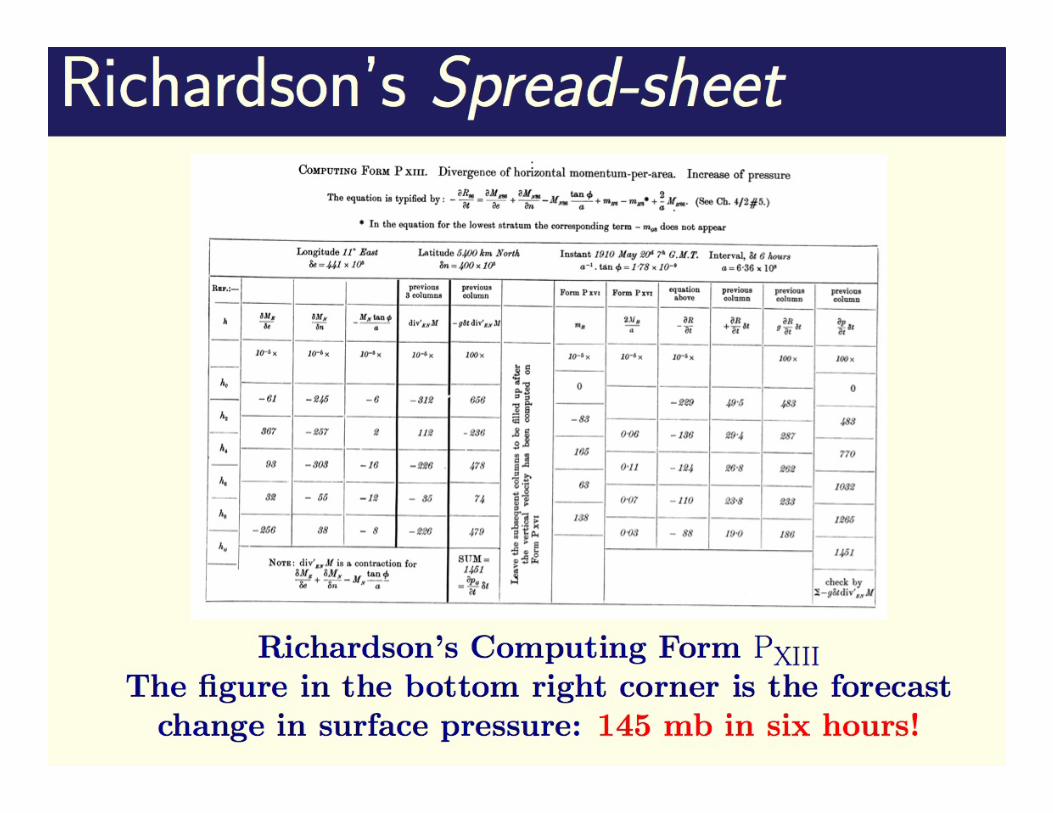
Richardson’s results
Richardson’s Forecast Bust
� Why such a failure? � Not due to bad numerics, as many claim
¡ He only took one time step, so numerical instabilities can’t develop
� Rather it has to do with unbalanced motions
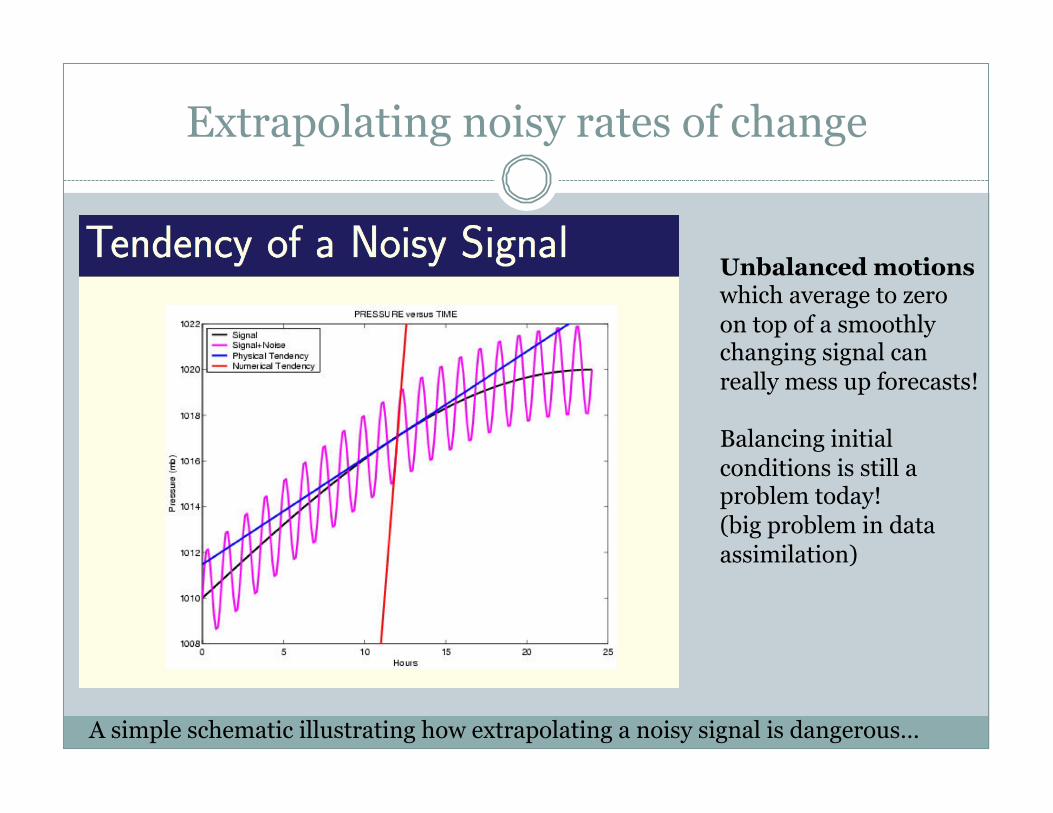
Extrapolating noisy rates of change
Unbalanced motions which average to zero on top of a smoothly changing signal can really mess up forecasts! Balancing initial conditions is still a problem today! (big problem in data assimilation)
A simple schematic illustrating how extrapolating a noisy signal is dangerous…
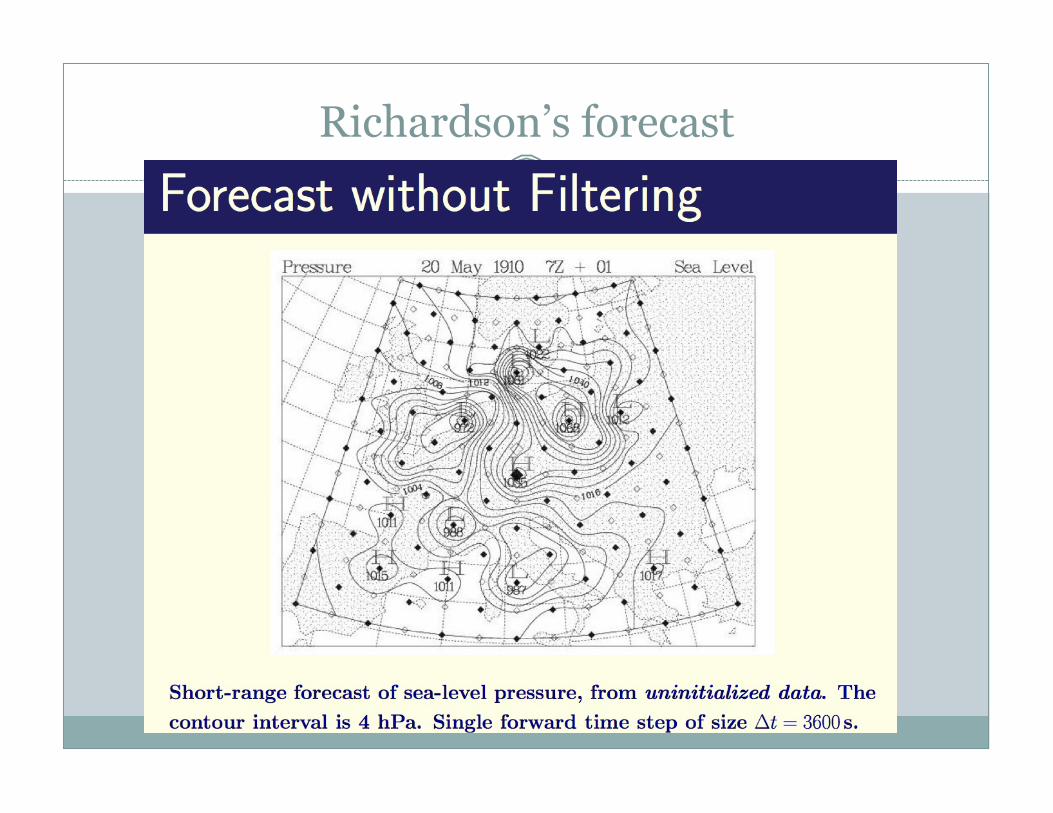
Richardson’s forecast
Richardson’s Forecast
� Richardson himself realized that gravity waves (“imbalanced initial conditions”) were the problem
� He suggested smoothing of initial conditions ¡ And proposed 5 different methods for this
� Unfortunately he couldn’t implement them due to computational expense ¡ But we can reproduce the results using today’s computers…
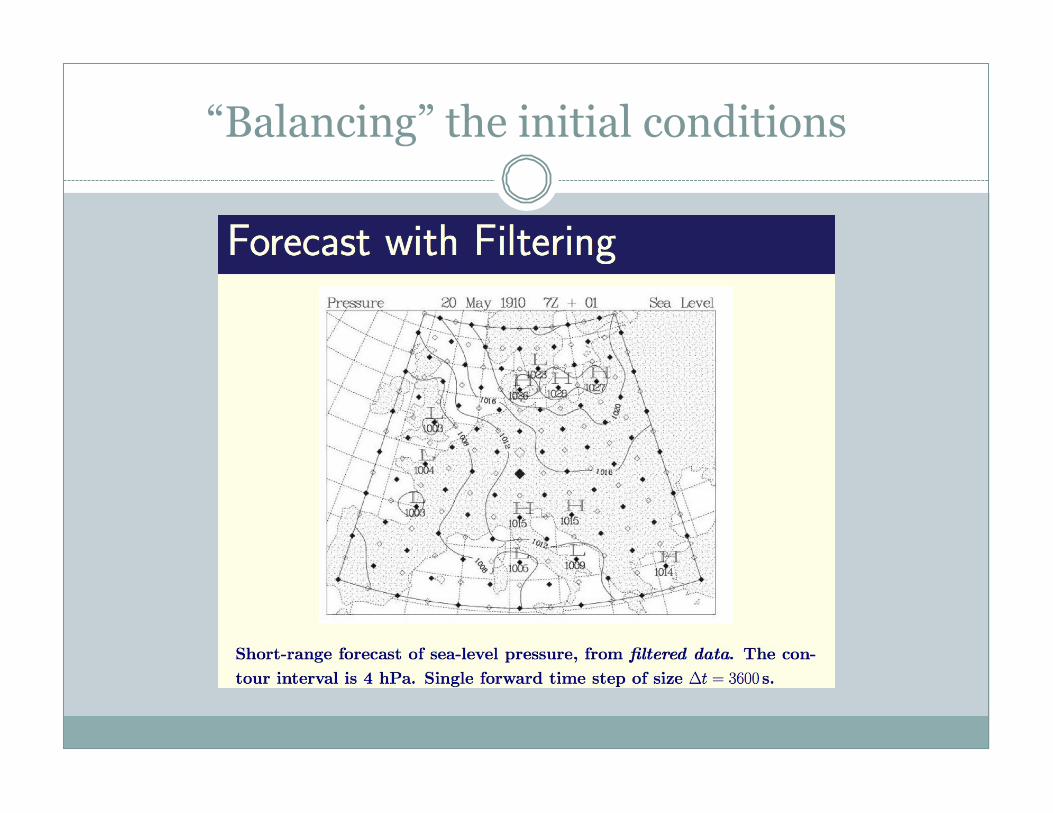
“Balancing” the initial conditions
The First Successful NWP Experiment
� Fast gravity waves were the problem: ¡ Why not try predicting with a model that has no gravity waves?
� John von Neumann, Jule Charney, Ragnar Fjortoft � Research proposal proposed three uses for NWP:
¡ Weather prediction (duh) ¡ Planning where to take observations ¡ Weather modification!
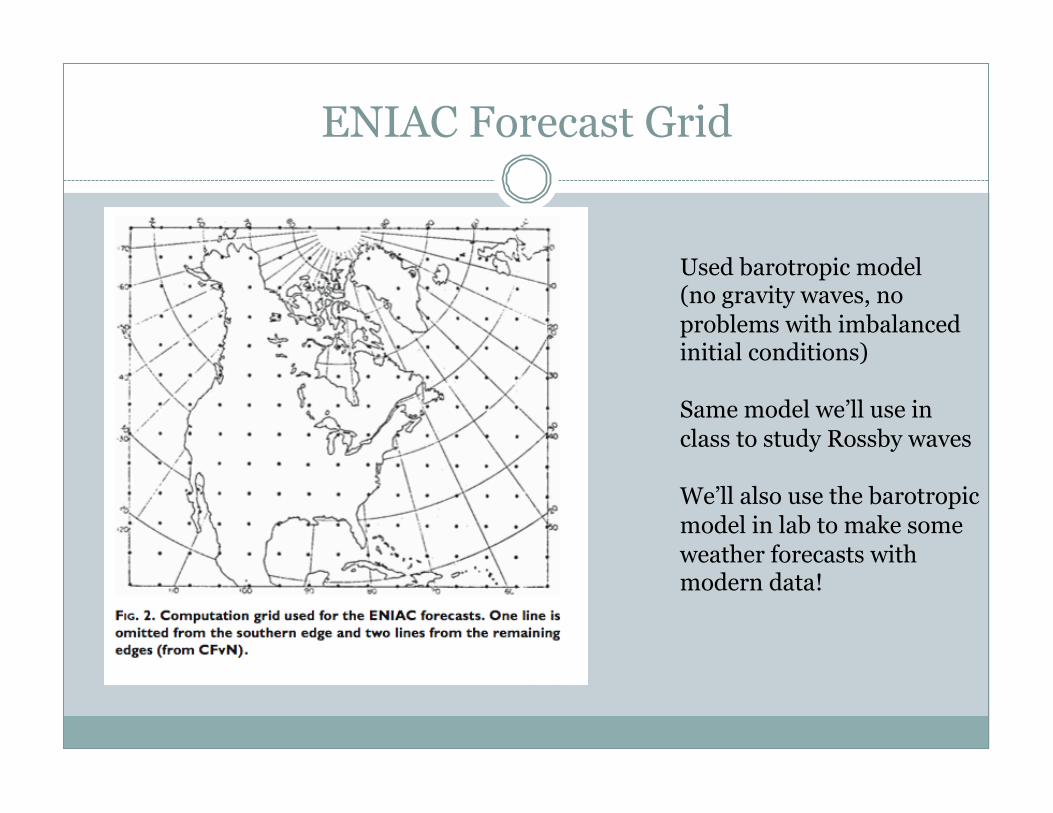
ENIAC Forecast Grid
Used barotropic model (no gravity waves, no problems with imbalanced initial conditions) Same model we’ll use in class to study Rossby waves We’ll also use the barotropic model in lab to make some weather forecasts with modern data!
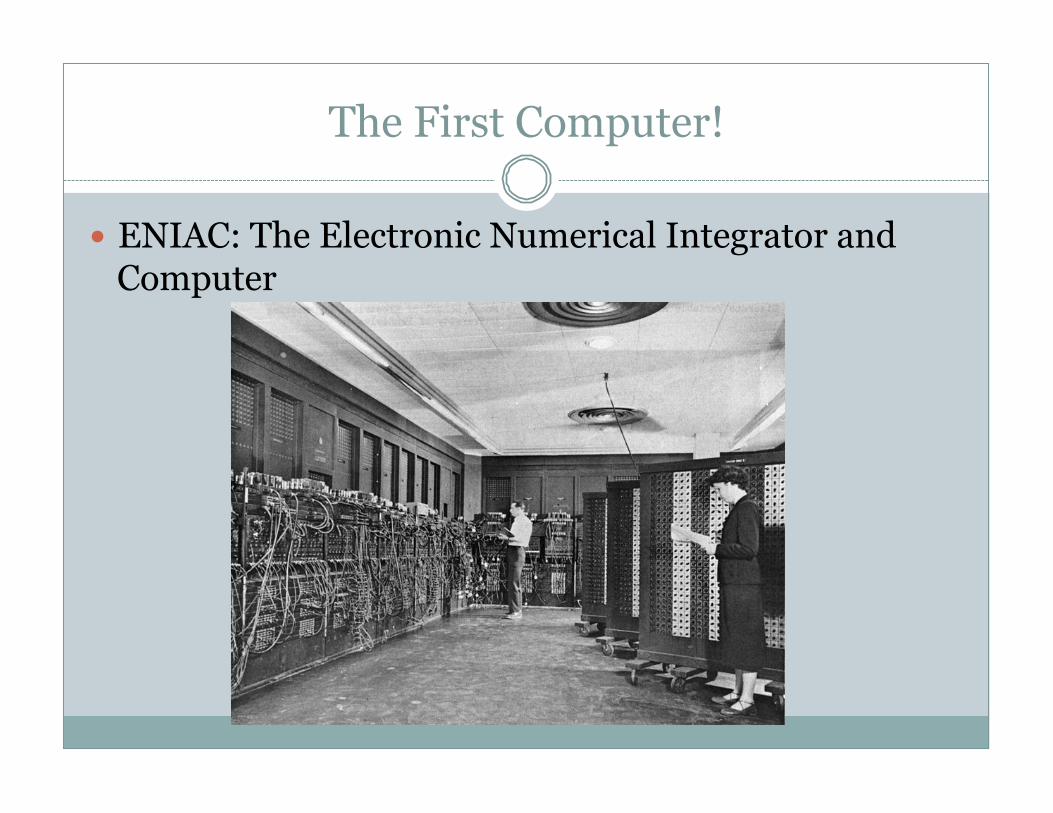
The First Computer!
� ENIAC: The Electronic Numerical Integrator and Computer

The First Computer!
� ENIAC: The Electronic Numerical Integrator and Computer
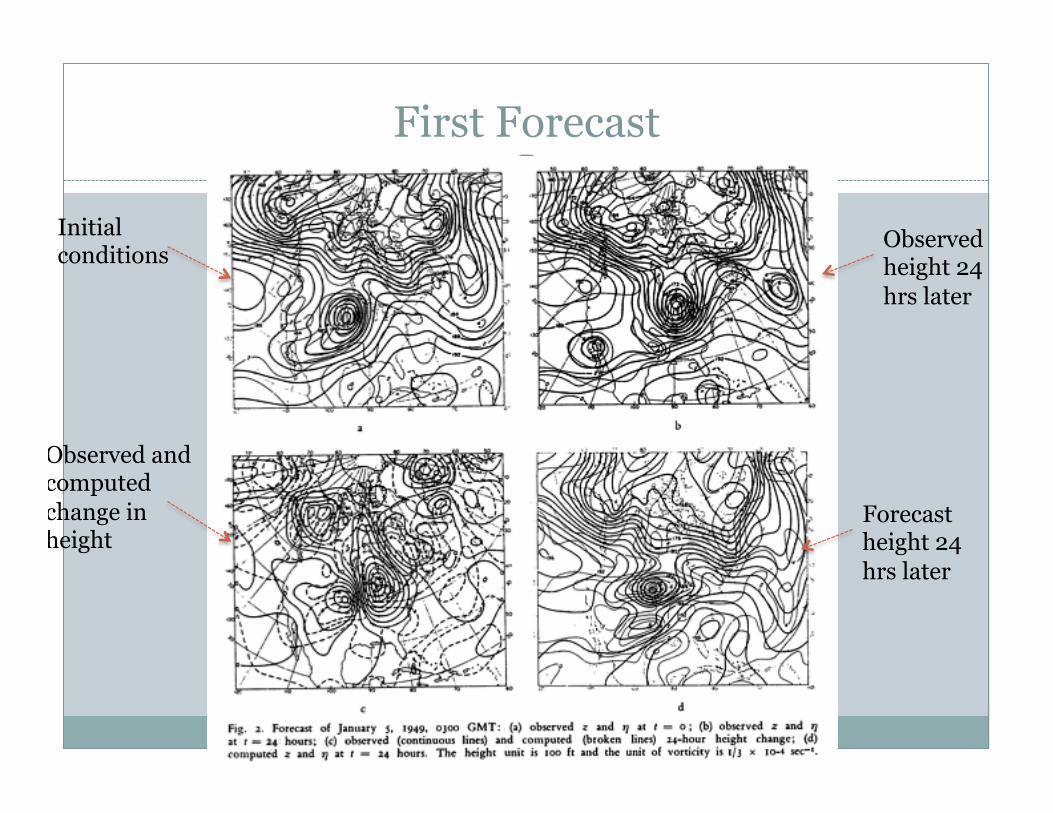
First Forecast
Initial conditions
Observed height 24 hrs later
Observed and computed change in height
Forecast height 24 hrs later
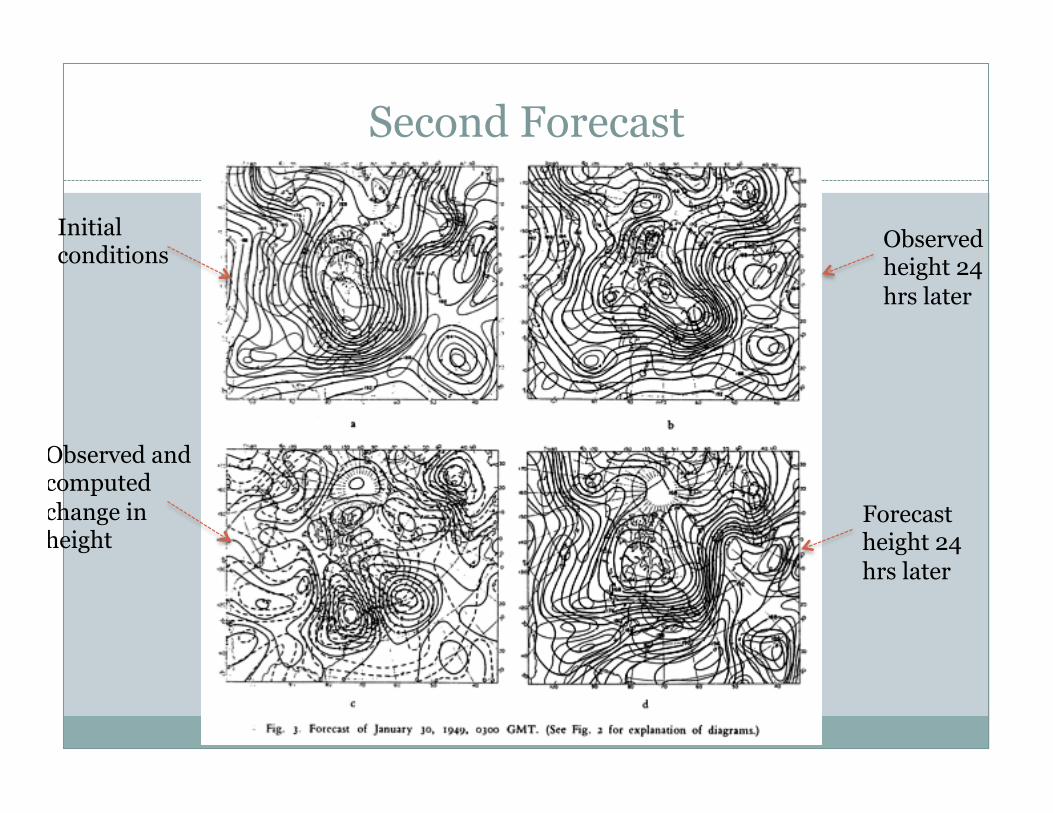
Second Forecast
Initial conditions
Observed height 24 hrs later
Observed and computed change in height
Forecast height 24 hrs later
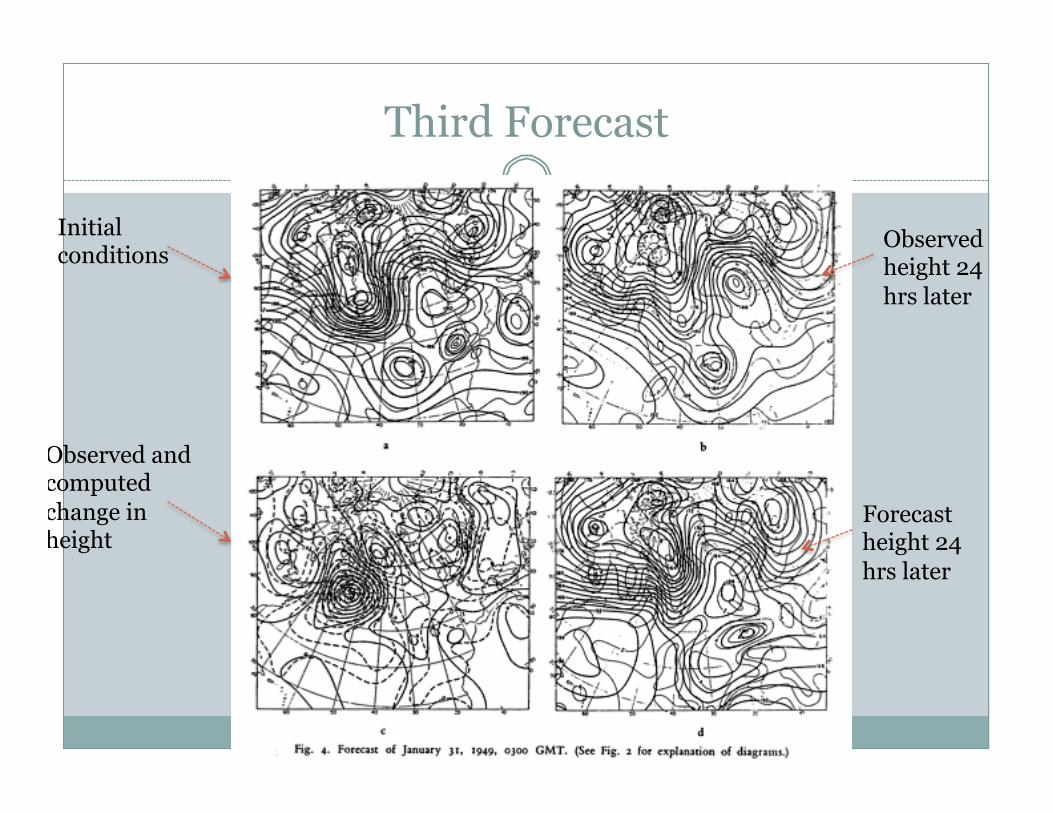
Third Forecast
Initial conditions
Observed height 24 hrs later
Observed and computed change in height
Forecast height 24 hrs later
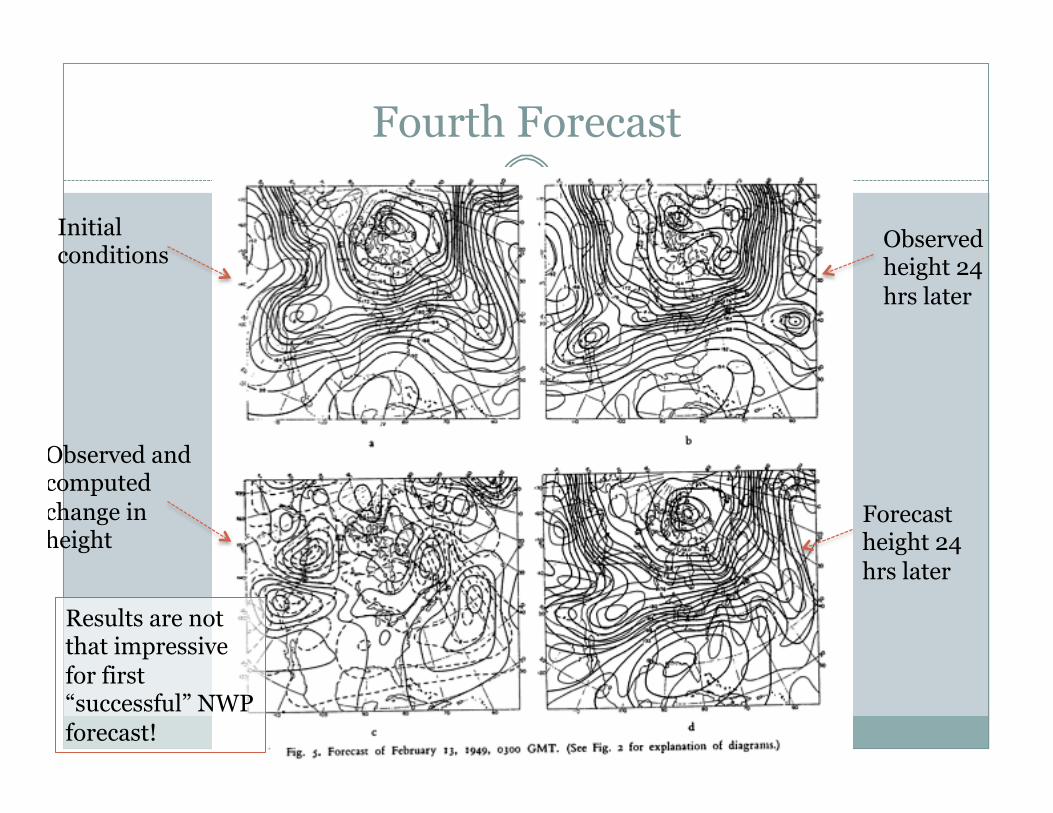
Fourth Forecast
Initial conditions
Observed height 24 hrs later
Observed and computed change in height
Forecast height 24 hrs later
Results are not that impressive for first “successful” NWP forecast!
First Operational NWP Systems
� NWP really took off though & quickly improved! � December 1954: Royal Swedish Air Force Weather
Service in Stockholm ¡ Model developed at the Institute of Meteorology at the
University of Stockholm (Rossby, etc) ¡ Barotropic model, 3 forecasts per week of North Atlantic
� May 1955: Joint Numerical Weather Prediction Unit, Maryland ¡ 3 level QG model
� 1966: US uses 3-level primitive equation model � Global coverage since 1973
Copyright © 2022 FDOKUMEN