
Course-504 Learning Mathematics at Elementary Level - SSA
189
DIPLOMA IN ELEMENTARY EDUCATION (D.El.Ed.) Course-504 Learning Mathematics at Elementary Level Block -2 Enriching Contents and Methodology NATIONAL INSTITUTE OF OPEN SCHOOLING A - 24/25, Institutional Area, Sector – 62,NOIDA Gautam Buddha Nagar, UP – 201309 Website: www.nios.ac.in
-
Upload
khangminh22 -
Category
Documents
-
view
1 -
download
0
Transcript of Course-504 Learning Mathematics at Elementary Level - SSA

DIPLOMA IN ELEMENTARY EDUCATION
(D.El.Ed.)
Course-504
Learning Mathematics at
Elementary Level
Block -2
Enriching Contents and Methodology
NATIONAL INSTITUTE OF OPEN SCHOOLING A - 24/25, Institutional Area, Sector – 62,NOIDA
Gautam Buddha Nagar, UP – 201309
Website: www.nios.ac.in

EXPERT COMMITTEE
Dr. Sitansu S. Jena
Chairman, NIOS, NOIDA
Sh. B.K.Tripathi
IAS, Principal Secretary, HRD,
Govt. of Jharkhand, Ranchi
Prof. A.K. Sharma Former Director, NCERT, New Delhi
Prof. S.V.S. Chaudhary
Former Vice Chairperson, NCTE,
New Delhi
Prof.C.B. Sharma
School of Education, IGNOU, New
Delhi
Prof. S.C. Agarkar Professor, Homi Bhabha Centre for
Science Education , Mumbai
Prof.C.S. Nagaraju Former Principal,
RIE (NCERT),Mysore
Prof. K. Doraisami Former Head, Department of Teacher
Education and Extension, NCERT,
New Delhi
Prof.B. Phalachandra,
Former Head, Dept of Education &
Dean of Instruction, RIE
(NCERT),Mysore
Prof. K.K.Vashist Former Head, DEE, NCERT,
New Delhi
Prof. Vasudha Kamat
Vice Chancellor,
SNDT Women's University, Mumbai
Dr. Huma Masood Education Specialist, UNESCO,
New Delhi
Prof. Pawan Sudhir Head, Deptt. of Art & Aesthtic
Education, NCERT,New Delhi
Sh. Binay Pattanayak Education Specialist, UNICEF, Ranchi
Dr. Kuldeep Agarwal
Director(Academic), NIOS,NOIDA
Prof. S.C. Panda
Sr. Consultant(Academic),
NIOS, NOIDA
Dr. Kanchan Bala
Executive Officer(Academic),
NIOS,NOIDA
COURSE COORDINATOR AND EDITOR
Dr. Mohit Mohan Mohanty, Former Director, SIEMAT, Odisha, Bhubneswar
LESSON WRITERS
Dr. Mohit Mohan Mohanty,
Former Director ,SIEMAT, Odisha,
Bhubneswar
Sri Tapas Kumar Nayak,
Senior Teacher Educator,
Directorate of Teacher Education and
SCERT, Odisha, Bhubaneswar
Dr. Bamadev Tripathy, Senior Teacher Educator, DIET,
Deogarh, Odisha
Dr. Rajendra Kumar Nayak,
Lecturer, Department of Education,
Ravenshaw University, Cuttack,
Odisha
Sri Madan Mohan Mohanty,
Former Mathematics Expert and
Deputy Secretary, Board of Secondary
Education, Odisha, Cuttack
Sri Sachidananda Mishra,
Senior Teacher Educator, DIET,
Cuttak, Narasinghpur, Odisha
CONTENT EDITOR
Prof. G. Ravindra, Former Director, NCERT, New Delhi
LANGUAGE EDITOR
Dr. Anil Teotia
Senior Lecturer, DIET, SCERT,
Delhi
Dr. Satyavir Singh
Principal, Shri Nehru Inter College,
Pilana Baghpat, U.P.
Sh. Parmod
Kendriya Vidyalaya,
Kamla Nehru Nagar Gaziabad (UP)
PROGRAMME COORDINATOR
Dr. Kuldeep Agarwal
Director(Academic), NIOS,
NOIDA
Prof.S.C.Panda
Sr. Consultant (Teacher Education),
Academic Department, NIOS,
NOIDA
Dr. Kanchan Bala
Executive Officer (Teacher
Education), Academic Department,
NIOS, NOIDA
COVER CONCEPTUALISATION
& DESIGNING
TYPESETTING SECRETARIAL ASSISTANCE
Mr. D.N. Upreti
Publication Officer, Printing,
NIOS,NOIDA
Mr. Dhramanand Joshi
Executive Assistant, Printing, NIOS
NOIDA
M/S Shivam Graphics
431, Rishi Nagar, Delhi-34 Ms. Sushma
Junior Assistant, Academic,
Department, NIOS, NOIDA

The Chairman's Message .....
Dear Learner The National Institute of Open Schooling (NIOS) is an autonomous organization under the
Government of India, Ministry of Human Resource Development(MHRD). It is the largest open
schooling system in the world with around 2.02 million learners currently on roll at the
secondary and senior secondary level. NIOS has national and international network with more
than 15 Regional Centres, 2 Sub-Centres and about 5,000 study centres for its Academic and
Vocational Programme within and outside the country.It provides access to learner centric
quality education, skill up-gradation and training through open and distance learning mode. The
delivery of its programmes is through printed material coupled with face to face tutoring
(Personal Contact Programmes), supplemented by use of Information and Communication
Technology- Audio/Video Cassettes, Radio Broadcast and Telecast etc.
NIOS has been vested with the authority to train the untrained teachers at Elementary Level. The
training package for D.El.Ed. Programme has been developed by the NIOS in collaboration with
other agencies working in field. The Institute offers a very innovative and challenging Two-year
Diploma in Elementary Education Programme for in-service untrained teachers in different
states according to RTE 2009.
I take the pleasure of welcoming you all to this Diploma Course in Elementary Education
Programme of National Institute of Open Schooling (NIOS). I appreciate your contribution in
elementary schooling of the children of your state. As per RTE Act 2009, it becomes essential
for all school teachers to be professionally trained. We understand that your experience as a
teacher has already given you requisite skills needed to be a good teacher. Since it is now
mandatory by law, you will have to complete this course. I am sure your knowledge and
experience, so far accumulated by you, will certainly help you in this Programme.
This D.El.Ed. Programme is through Open Distance Learning (ODL) mode and provides you
ample opportunity to be professionally trained without being disturbed from your regular
working as a teacher.
The self-instructional materials developed specifically for your use would be helpful in creating
understanding and help you in becoming a good teacher apart from becoming qualified for your
job.
Best of luck in this great endeavour!!
S.S. Jena Chairman (NIOS)

Credit points (4=3+1)
Block Unit Name of Unit Theory Study
Hours
Practical Study
Content Activity
Block-1:
Importance of
Learning
Mathematics at
the Elementary
Stage of
Schooling
U1
How children learn
mathematics
3 2 Seminar on mathematics is
for all, mathematics phobia
U2 Mathematics and
Mathematics Education -
Importance, Scope
and Relevance
4 2 -
U3 Goals and Vision of
Mathematics Education
4 2 Taking mathematics learning
beyond classroom
Identification of problems in
mathematics education in
your class
U4 Learner and Learning –
centered methodologies 5 3 Organizing mathematics club
in your school
Block 2:
Enriching
Contents and
Methodology
U5 Numbers, Operations on
Numbers
5 2 -
U6 Shapes and Spatial
Relationships 5 2 -
U7 Measures and
Measurements
4 2 -
U8 Data Handling 4 3 Statistical analysis of data
U9 Algebra as generalized
Arithmetic
4 2 -
Block 3: Learner
Assessment in
Mathematics
U10 Approaches to Assessment
of Learning Mathematics
3 2 Development of a lesson
plans and preparation of
concept maps in
mathematics
U11 Tools and Techniques of
Assessment
4 3 Development of exhibits for
mathematics laboratory
U12 Follow up of Assessment
of Learning Mathematics
3 2 Identification of problems
and preparation of remedial
measures in learning
mathematics
Tutoring 15
Total 63 27 30
Grand Total 63+27+30=120 hrs.

Block 2
Enriching Contents and Methodology
Block Units
Unit 5 Numbers, Operations on Numbers
Unit 6 Shapes and Spatial Relationships
Unit 7 Measures and Measurements
Unit 8 Data Handling
Unit 9 Algebra as generalized Arithmetic

BLOCK INTRODUCTION
You as a leaner will study Block2: Enriching Contents and Methodology. This Block consist
five units relating to content enrichment and methodology. Every unit is divided into sections
and sub-sections. You have already studied about importance of learning mathematics at the
elementary stage, how children learn mathematics and how mathematics teaching can be made
more joyful.
UNIT-5 This unit will empower you to understand numbers and operation on Numbers. There
will be acquaintance with different sets of numbers like counting numbers and whole numbers,
integers and rational numbers. Understanding will also be gained about Properties of operation
on numbers. An answer to question that what are common factors and common multiple and
concept of HCF & LCM will be found?
UNIT-6 This unit will empower you to understand the concept of Basic Geometrical figures.
You will be acquainted with Two dimension closed figure like Triangle and quadrille. The
understanding of circle, congruence and Similarity, Reflection and Symmetry and Three
dimensional shapes will be developed.
UNIT-7 This unit will enable you to understand the concept of Measurement and Measure. How
length, area, volume weight is measured by Non standardized and standardized units. There will
be acquaintance with metric system of Measurement and measurement of time.
UNIT-8 This unit will empower you to understand the data handling. You will learn different
aspects like collection of data and Tabular representation of data, pictorial depiction of data with
the help of Bar graph, Histogram, pie-chart. The understanding will be developed, pie-chart. The
understanding will be developed about how data is analyzed through measures of central
tendency and measures of variations?
UNIT-9 You will be acquainted with using symbol for numbers, Algebraic terms and
Expressions Algebra holds an important place in mathematics and same as its operations like
addition, subtractions etc the understanding about linear equations and how they get solved will
also be developed.

CONTENTS
Sr.No. Unit Name Page No.
1. Unit 5 Numbers, Operations on Numbers 1
2. Unit 6 Shapes and Spatial Relationships 40
3. Unit 7 Measures and Measurements 88
4. Unit 8 Data Handling 122
5. Unit 9 Algebra as generalized Arithmetic 152

1
Numbers and the Operation on Numbers
Notes
Block 2 : Enriching Contents and Methodology
UNIT 5 NUMBERS AND THE OPERATIONON NUMBERS
Structure5.0 Introduction5.1 Learning Objectives5.2 Different Sets of Numbers
5.2.1 Counting Numbers and Whole Numbers5.2.2 Integers5.2.3 Rational Numbers
5.3 Properties of Operations on Numbers5.3.1 Operations on Natural and Whole Numbers5.3.2 Operations on Integers5.3.3 Operations on Rational Numbers
5.4 Factors and Multiples5.4.1 Common Factors and the Highest Common Factor5.4.2 Common Multiples and the Lowest Common Multiple
5.5 Arithmetic and Application5.6 Let Us Sum Up5.7 Model Answers to Check Your Progress5.8 Suggested Readings and References5.9 Unit-End Exercises
5.0 INTRODUCTIONIn our day to day life we need to quantify several things that we use or come across.Members in the family, students in the class/school, money for purchasing clothes,weight of vegetables and groceries, books for the children, distance of the school fromhome, length and breadth of the room so on. For quantification numbers are essential.For counting objects, expressing the different quantities, measuring length, weight,volume, expressing time etc numbers are essential. Numbers have been so intimatelyassociated with our life that we cannot think of anything without them. But the numbersthat we use to-day were not invented at the beginning of civilization. Different systemsof numbers were developed in different ancient civilizations. Let us have a look intosome of the number systems developed in different ancient civilizations.

2
Notes
Numbers and the Operation on Numbers
Diploma in Elementary Education (D.El.Ed)
Mayan System:
Babylonian System :
Roman System:
I II III IV V VI VII VIII IX X1 2 3 4 5 6 7 8 9 10
XI XII XIII XIV XV XVI XVII XVIII XIX XX11 12 13 14 15 16 17 18 19 20
XXX XL L LX LXX LXXX XC C CC CCC30 40 50 60 70 80 90 100 200 300
CD D M400 500 1000
In these systems of numbers, it was difficult to remember the numerals for differentnumbers. Further, it was difficult at the time of working out various operations likeaddition, subtraction etc.
India’s Contribution: The present decimal system i.e. the numbers based on tendigits i.e.,0, 1, 2, 3, 4, 5, 6, 7, 8, and 9 was designed basically by Indians and it wascarried by Arabic people to their country and subsequently to western world. Thus,this system of numeration is named as Hindu-Arabic Numerals.
This system has a unique advantage over other system of numbers that any largenumber can be expressed using these 10 digits.
Place-Value in a Number: These ten digits could give rise to ten single-digit numbers.If we need a number more than 9, then we create two digit numbers like 10, 11, 12,…,25,…., 59, …,98 and 99. You are quite familiar as to how these numbers are

3
Numbers and the Operation on Numbers
Notes
Block 2 : Enriching Contents and Methodology
created. There are two places in such two digit numbers, the right hand side place isthe unit- place and the left hand side place is the tenth-place.
The digits in the unit place have unitary value i.e. in 26, the number in the unit place is6 and its value is also 6. The digit in the tenth place i.e. 2 in the number 26 has the placevalue of two tens (i.e. 20) instead of the face value of 2. Similarly, the place value of adigit in the hundredth place of a number is 100 times the face value of the digit. You arequite familiar with such place values.
But, there is one digit which has the same place value irrespective of the place itoccupies in the number. You know the number i.e. 0(zero). Zero is the uniquecontribution of the Hindu number system. Its place value is zero in which ever place itis posted. Then what is its importance?
Consider any three-digit number like 308. The place value of the digit 0 in the tenthplace is zero. But imagine, had there be no 0 what would have happened to thenumbers like 308? The number would have reduced to 38 and there would have beentotal confusion. Here, 0 keeps the place intact and gives proper identity to the number.Hence, 0 is called the place holder in the decimal system of numbers.
We shall be discussing about some very fundamental system of numbers which we usein our daily life and the properties of four basic operations on the systems of numbersin this unit.
To complete this unit, you shall require at least 10(ten) study hours.
5.1 LEARNING OBJECTIVESAfter study of this unit you will be able to
understand the importance of numbers in the decimal system.
recognize different sets of numbers e.g. natural numbers, integers and rationalnumbers.
know the property of fundamental operations, like addition, subtraction,multiplication and division on different sets of numbers.
determine the factors and multiples in a natural number set.
5.2 DIFFERENT SETS OF NUMBERS
5.2.1 Counting Numbers and Whole NumbersThe prime objective with which the early man wanted a system of numbers was tocount the objects. Thus he created the counting numbers 1, 2, 3, 4, 5, 6, 7, 8, 9, 10,11….. These are also called the ‘Natural Numbers’.

4
Notes
Numbers and the Operation on Numbers
Diploma in Elementary Education (D.El.Ed)
He associated numbers with the set of objects as follows:
Thus, each number is uniquely associated with a set of objects in the system of countingnumbers. You can observe that:
(i) 1 is the smallest counting number.
(ii) Every counting number has a successor and the successor of a number is 1 morethan the number concerned i.e successor of 4 is 5 and successor of 29 is 30.
(iii) Every counting number (except 1) has a predecessor i.e. predecessor of 7 is 6and predecessor of 60 is 59.
It follows from (ii) that there exists a counting number greater than any counting numberhowever large.
Whole Numbers: You might have observed that 0 is not included in the set of naturalnumbers. It is because counting of objects always starts from 1. But when we representnumbers by numerals, we use 0 in representing numbers 10, 20. 30… 100 etc. Tomake the things simpler, 0 is included along with the set of the Natural Numbers toconstitute the set of ‘Whole Numbers’ and is denoted by ‘W’.
Check your progress before proceeding further:
E1. Why the counting number 1 has no predecessor?E2. What is the smallest whole number?E3. What is the difference between the place value and face value of 8 when it occupies
(i) Unit’s place(ii) Ten’s place(iii) Hundred’s place
5.2.2 IntegersWhile dealing with various situations faced in the daily life, people came across somemeasurements with opposite characters likeProfit-LossAsset-LiabilityCredit-DebitUpward-Down ward
two

5
Numbers and the Operation on Numbers
Notes
Block 2 : Enriching Contents and Methodology
In respect of such pair of measurements with opposite characters of the above kinds,there exists a balancing position as shown in the table below.
Measurement with Balancingopposite characters position
Profit- Loss no Profit nor LossAsset- Liability no Asset nor LiabilityCredit- Debit no Credit nor DebitUpward-Downward neither Up ward nor Downward
It can be seen that the balancing position in respect of each of the examples aboverepresent the zero-level.
Thus people thought of creating numbers opposite in nature to 1, 2, 3 and so on. Sowe got the following pairs of number with opposite nature.
+1 and –1+2 and –2+3 and –3 and so on.
Zero is the balancing number in between each of the opposite pairs of numbers givenabove. Hence we got-
(+1) + (–1) = 0(+2) + (–2) = 0(+3) + (–3) = 0 and so on
The series of numbers which we now have are-
……………–4, –3, –2, –1, 0, +1, +2, +3, +4, ……..
This set of numbers is known as Integers.
+1, +2, +3, +4……………. etc are known as positive integers and –1, –2, –3,–4……….. etc. are known as negative integers.
The set of integers is denoted by the symbol Z.
(i) There is no integer which can be said as the greatest. Any big integer you thinkof, there exists an integer greater than that.
(ii) There is no integer which can be said as the smallest. Any small integer youthink of, there exists an integer smaller than that.
(iii) For every +p in the integer series, there exists –p in it, such that (+p) + (–p) =0. +p and –p are known as opposite of each other.
(iv) Zero (0) is neither positive nor negative.

6
Notes
Numbers and the Operation on Numbers
Diploma in Elementary Education (D.El.Ed)
Ordering integers and their representation on a number line:
The series of integers written below go on increasing towards the right and go ondecreasing towards the left.
…………….., –3, –2, –1, 0, +1, +2, +3, ……………….
Thus ..............……< –3 < –2 < –1 < 0 < +1 < +2 < +3 <……………
We also consider that the points on a straight line can be used to represent the integers.Following is the procedure –
(i) Draw a straight line and name it as L (Here L denotes the entire line. It does notname any point or the line).
(ii) Mark points on it at equal intervals.
(iii) Name any of the points marked above as O and represent zero by it.
(iv) Now represent the numbers +1, +2, +3 etc. by the points towards right of 0successively.
(v) Represent the numbers –1, –2, –3 etc by the points towards left of 0 successively.
Now we say the line L as a number line
5.2.3 Rational NumbersNow let us look at the parts of a whole.
The numbers created to represent the parts of an object as shown above are asfollows:
One part out of 2 equal parts of an object :1 2 (half, one by two)
One part out of 3 equal parts of an object :1 3 (one third, one by three)
One part out of 4 equal parts of an object :1 4 (a quarter, one by four)

7
Numbers and the Operation on Numbers
Notes
Block 2 : Enriching Contents and Methodology
Similarly, the shadowed portion of the following figure
represents 3 4 [3 is the numerator and 4 is the denominators.]
represents 2 3 [2 is the numerator and 3 is the denominator]
represents 4 6 [4 is the numerator and 6 is the denominator]
The numbers that are found to have been constructed to measure different parts of acomplete object are known as fractional numbers (or fractions).
There are various types of fractions:
(i) Proper fraction: 75,
83,
32
are proper fractions, where numerator < denominator.
(ii) Improper fraction: 528,
711,
35 are improper fractions, where numerator >
denominator.
(iii) Mixed number : 723,
312 etc. are mixed numbers and each of them can be
changed into an improper fraction and an improper fraction can be changed intoa mixed number, such as
723
723,
37
312
(iv) Unit Fraction: A fraction with numerator as 1 is a unit-fraction. 91,
51,
21
are
examples of unit fractions.
(v) Equivalent Fractions: When both the numerator and the denominator of afraction are multiplied by a positive integer, the fraction changes in shape butdoes not change in value. Thus the resulting fraction is equal to the original fraction.

8
Notes
Numbers and the Operation on Numbers
Diploma in Elementary Education (D.El.Ed)
Fractions having same value are equivalent fractions. As for example
(a)2 4 83 6 12 Thus
2 4 8, ,3 6 12 are equivalent fractions.
(b)40 20 10 516 8 4 2
Thus
40 20 10 5, , ,16 8 4 2 are equivalent fractions.
(vi) Like fractions: Fractions with equal denominators are known as like fractions.
1 2 3 4, , ,15 15 15 15 are examples of like fractions.
Rational numbers: Number written in the form pq where p and q are integers
and 0q , are known as rational numbers. Rational numbers are denoted by the symbolQ. Obviously a fraction is a rational number.Examples of rational numbers are :
2 3 0 4, , ,7 4 5 9
Observe the following :
3 10 8 01 , 2 , 4 , 03 5 2 9
Thus we find that all the integers could be written in the form pq
where ‘p’ and q’’ are
integers and 0q .
Thus we see that each integer is a rational number.
The diagram alongside shows the inter-relationship connecting the Natural numbers(N), Whole numbers (W), Integers (Z) and Rational numbers (Q).
Q includes all integers and also the non-integral numbers like 83,
72,
21
etc.,
9
Numbers and the Operation on Numbers
Notes
Block 2 : Enriching Contents and Methodology
Z includes all whole numbers and also the negative integers like –1, –2, –3 ……W includes all natural numbers and also zero.
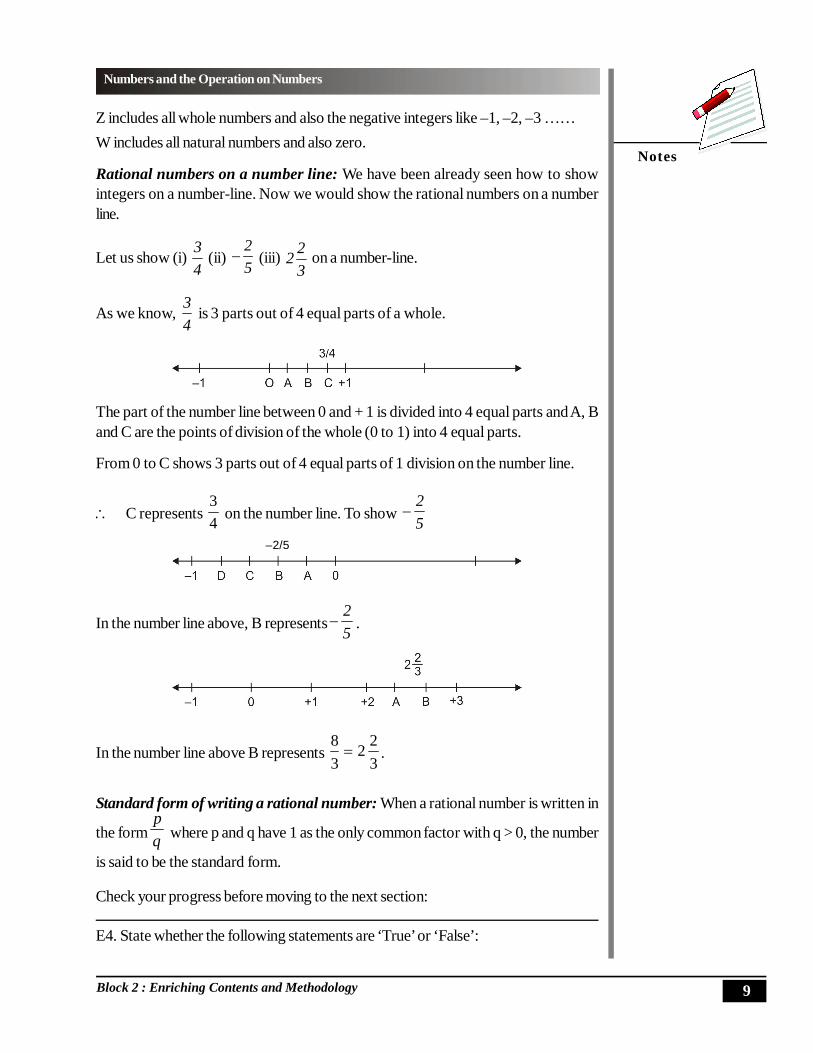
Rational numbers on a number line: We have been already seen how to showintegers on a number-line. Now we would show the rational numbers on a numberline.
Let us show (i) 43
(ii) – 25 (iii)
322 on a number-line.
As we know, 43
is 3 parts out of 4 equal parts of a whole.
The part of the number line between 0 and + 1 is divided into 4 equal parts and A, Band C are the points of division of the whole (0 to 1) into 4 equal parts.
From 0 to C shows 3 parts out of 4 equal parts of 1 division on the number line.
C represents 34 on the number line. To show 5
2
In the number line above, B represents 52
.
In the number line above B represents 322
38 .
Standard form of writing a rational number: When a rational number is written in
the form qp
where p and q have 1 as the only common factor with q > 0, the number
is said to be the standard form.
Check your progress before moving to the next section:
E4. State whether the following statements are ‘True’ or ‘False’:
–2/5

10
Notes
Numbers and the Operation on Numbers
Diploma in Elementary Education (D.El.Ed)
(a) All natural numbers are integers.
(b) All integers are whole numbers.
(c) Whole numbers are not rational numbers.
(d) Negative integers cannot be rational numbers.
(e) All rational numbers are not integers.
5.3 PROPERTIES OF OPERATIONS ON NUMBERSWe are quite familiar and competent in carrying out four fundamental operations-addition, subtraction, multiplication and division. In this section you will know theproperties of these operations when those are performed on different sets of numbers.
5.3.1 Operations on Natural Numbers and Whole NumbersAs you have already known that the set of whole numbers differ from the set of naturalnumbers by inclusion of ‘0’, the properties of four operations on the numbers of thesetwo sets are nearly same and hence discussed together in this sub-section.
(a) Addition: When two collections of similar objects are put together, how to findthe total number of objects in the new collection? Suppose 2 match sticks are tobe added to 5match sticks. We can teach the children to add it in two ways. Oneway is to put together the two collections and then count the total number ofmatch sticks in the mixed collection. The second way is to put one collectionintact (say the collection having 5 match sticks) and add one match stick from theother at a time as shown below:
5 + 2
= (5+1) +1
= (6+1)
= 7Some properties of addition in natural and whole numbers:
(i) Closure property: Sum of two natural/whole numbers is also a natural/whole number.
(ii) Commutative Property: p + q = q + p where p and q are any two natural/whole numbers.
(iii) Associative property: (p + q) + r = p + (q + r) = p + q + r . This propertyprovides the process for adding 3 (or more) natural/whole numbers.

11
Numbers and the Operation on Numbers
Notes
Block 2 : Enriching Contents and Methodology
(iv) Additive Identity in Whole Numbers: In the set of whole numbers, 4 + 0= 0 + 4 = 4. Similarly, p + 0 = 0 + p = p (where p is any whole number).Hence, 0 is called the additive identity of the whole numbers.
(b) Subtraction: Subtraction means taking away. From a group of objects, we cantake away some or all. For example from 5 objects we can take away less than5 objects or all the 5 objects. From a group of objects when all are taken away,nothing is left over and since nothingness is represented by zero, p – p = 0(where p is a whole number)
Multiplication:
Multiplication represents repeated addition of a number with itself. For example:3 + 3 is represented as 3 × 23 + 3 + 3 is represented as 3 × 33 + 3 + 3 + 3 is represented as 3 × 4 and so on.
Properties of Multiplication:(i) Commutative property: Observe the tables below:
5 flowers in each row.There are 4 rows.Total number of flowers = 5 + 5 + 5 + 5 or 5 × 4 = 20
The above collection is shown below:
4 flowers in each column.

12
Notes
Numbers and the Operation on Numbers
Diploma in Elementary Education (D.El.Ed)
There are 5 columns.
Total number of flowers = 4 + 4 + 4 + 4 + 4 = 4 × 5 = 20
But both the collections show the same number of flowers.
Thus it is found that: 5 × 4 = 4 × 5
In other words, if p and q are any two natural/whole numbers, then
p × q = q × p.
Thus multiplication is commutative in natural and whole numbers.
(ii) Closure property: If p and q are natural or whole numbers then p × q is also anatural or whole number. We say natural/whole numbers are closed undermultiplication.
(iii) Associative property: (p × q) × r = p × (q × r) (where p, q, and r are any threenatural/whole numbers)
(iv) Identity of multiplication: The number ‘1’ has the following special property inrespect of multiplication.
p × 1= 1 × p = p (where p is a natural number)
Thus we say : The number ‘1’ is the identity of multiplication.
(v) Distributive property of multiplication over addition:
p × (q + r) = p × q + p × r
We say, “multiplication distributes over addition.
Examples: 5 × (3 + 4) = 5 + 7 = 35
And 5 × 3 + 5 × 4 = 15 + 20 = 35
5 × (3 + 4) = 5 × 3 + 5 × 4.
(d) Division:
When p and q are natural numbers and p × q = r,
We say :
‘r’ is divisible by ‘p’ and ‘r’ is divisible by ‘q’.
Each of ‘p’ and ‘q’ is a factor of ‘r’.
‘r’ is a multiple of each of ‘p’ and ‘q’.
We use the symbol ‘÷’ and write r ÷ p = q and r ÷ q = p
For example : 3×5 = 15. Thus we say :
(i) 15 is divisible by each of 3 and 5.

13
Numbers and the Operation on Numbers
Notes
Block 2 : Enriching Contents and Methodology
(ii) Each of 3 and 5 is a factor of 15.
(iii) 15 is a multiple of each of 3 and 5.
We write: 15 ÷ 3 = 5 and 15 ÷ 5 = 3
It can be further seen that
(a) 1 × 12 = 12, (b) 2 × 6 = 12 (c) 3 × 4 = 12
Thus (a), (b) and (c) show that 1, 2, 3, 4, 6 and 12 each is a factor of 12.
What about the natural numbers 1, 2 and 3 ?
There are no two different numbers whose product is 1. Hence-
1 has only one factor and it is 1.
As 1× 2 = 2 and there is no second pair of numbers which product is 2,hence-
2 has only 2 factors and those are 1 and 2.
Similarly there are many other natural numbers each of which has only 2 factors.2, 3, 5, 7, 11, 13….. are examples of such natural numbers each of which has 2factors only. These are called prime numbers.
A natural number having exactly two distinct factors 1 and the numberitself is called a Prime Number.
A natural number like 4, 6, 8, 9,…12,15… which has more than 2 factors isknown as a composite number.
Prime number is defined on natural number greater than one number like
0,1,-1,-2,…,1 1,2 3 etc. are neither a prime number nor a composite number..
Prime factorization of composite numbers:
Writing a composite number as the product of prime numbers is known as the primefactorization of it. Such as-
12 = 2 × 2 × 3
Working process :
Thus 12 = 2 × 2 × 3

14
Notes
Numbers and the Operation on Numbers
Diploma in Elementary Education (D.El.Ed)
Some terms related to primes:
Co-Primes (or Mutually Primes):
Two natural numbers are co-primes if those do not have a common factor. Followingare the examples-
(i) 8 and 27 are co-primes (even if each of them is composite).
(ii) 17 and 20 are co-primes.
Twin Primes: Two prime numbers, the difference between is 2, are known as twinprimes.
3 and 5, 5 and 7, 11 and 13, 17 and 19 are examples of twin primes.
Even Prime: 2 is the only prime which is even. It is also the Smallest Prime.
Identification of primes within a certain range :
The following is the process to find the prime numbers between 1 and 100.
[The Sieve of Eratosthenes. Eratosthenes was Greek Mathematician]
Procedure :
(i) Strike out all multiples of 2 greater than 2.
(ii) Strike out all multiples of 3 greater than 3.
(iii) Strike out all multiples of 5 greater than 5.
(iv) Strike out all multiples of 7 greater than 7.

15
Numbers and the Operation on Numbers
Notes
Block 2 : Enriching Contents and Methodology
All numbers (except 1) that are not struck off are prime numbers.
Why the process stops at 7 ?
Square root of 100 is 10.
Prime number just less than 10 is 7. Hence the process continues up to 7.
Thus, the prime numbers between 1 and 100 are:
2, 3, 5, 7, 11, 13, 17, 19, 23, 29, 31, 37, 41, 43, 47, 53, 59, 61, 67, 71, 73, 79, 83,89, 97.
Now, check your progress:
E5. What is the natural number that is neither prime nor composite?
E6. What is the additive identity in the set of whole numbers?
E7. The difference between two prime numbers is odd. If their sum is 15, what arethose two prime numbers?
E8. How many pairs of twin primes occur between 10 and 30?
E9. If the divisor, quotient and the remainder in a division are 8, 12 and 5 respectively,what is the dividend?
5.3.2 Operations on IntegersA. Addition : All the properties of addition in whole numbers such as (i) Closure
property (ii) Commutative property (iii) Associative property (iv) Existence ofadditive identity also occur in integers.
The extra property that occurs in integers is the following:-
(v) Existence of additive inverse: If ‘+p’ is an integer, then there exists aninteger ‘-p’ such that (+p) + (-p) = 0
‘+p’ and ‘-p’ are known as the additive inverse of each other.
Now let us discuss the operation of addition on integers as a process.
(a) Addition of positive integers :
Addition of positive integers is the same as addition of natural numbers.Such as (+5) + (+3) = +8
(b) Addition of a positive integer and a negative integer :
Such as : (+5) + (–3)

16
Notes
Numbers and the Operation on Numbers
Diploma in Elementary Education (D.El.Ed)
We know that –
+5 = (+1) + (+1) + (+1) + (+1) + (+1)
Similarly, –3 can be written as-
–3 = (–1) + (–1) + (–1)
Now (+5) + (–3) = (+1) + (+1) + (+1) + (+1) + (+1) + (–1) + (–1) + (–1)
= {(+1) + (–1)} + {(+1) + (–1)} + {(+1) + (–1)} + (+1) + (+1)
= 0 + 0 + 0 + (+2)
= 0 + (+2) = +2
A shortcut process :
(+5) + (–3) = (+2) + (+3) + (–3) [+5 is replaced by (+2) + (+3)]
= (+2) + {(+3) + (–3)}
= (+2) + 0 = +2
Another example :
(+4) + (–7) = (+4) + (–4) + (–3) [-7 is replaced by (–4) + (–3)]
= {(+4) + (–4)} + (–3)
= 0 + (–3) = –3
(c) Addition of two negative numbers:
(–2) + (–3) = (–1) + (–1) + (–1) + (–1) + (–1)
= –5
B. Subtraction:
Subtraction in Integers is the addition of the opposite numbers (i.e. additive inverse).
Thus, if ‘p’ and ‘q’ are two integers, then p – q = p + (–q)
For example-
(i) (+5) – (+8) = (+5) + (–8)
(ii) (+4) – (–3) = (+4) + (+3)
(iii) (–5) – (+2) = (–5) + (–2)
(iv) (–7) – (–3) = (–7) + (+3)

17
Numbers and the Operation on Numbers
Notes
Block 2 : Enriching Contents and Methodology
And in course of addition, we knew the above results.
A special feature of subtraction in Integers is the following –
In Natural numbers p – q was a meaningful operation, if q < p. But inintegers p – q is also meaningful when q < p, q = p or q > p as well.
Operation of addition and subtraction on number lines :
Number lines can be used to work out addition and subtraction as shown below:-
(a) Addition : (to add we move towards the right)
(i) (+5) + (+8) = +13
(ii) (–3) + (+5) = +2
(iii) (+4) + (–6) = (–6) + (+4) = –2 [By commutative property]
(b) Subtraction : (to subtract we move to the left)
(i) (+6) – (+8) = –2 [from +6 we count 8 intervals leftward]
(ii) (–5) – (–7) = –5 + 7 = 7 – 5 = +2

18
Notes
Numbers and the Operation on Numbers
Diploma in Elementary Education (D.El.Ed)
(c) Multiplication : Multiplication of two integers is the addition if one of integer isa non negative integer.Such as :(i) (+5) + (+5) + (+5) + (+5) = (+5) × 4
Thus (+5) × (+4) = + 20 [as was done with natural numbers](ii) (–3) + (–3) + (–3) + (–3) + (–3) = (–3) × 5
Thus (–3) × 5 = (–3) + (–3) + (–3) + (–3) + (–3) = –15Sign rules for multiplication of Integers:
p q p × q
Positive Positive PositiveP > 0 q > 0 p × q > 0
Negative Negative PositiveP < 0 q < 0 p × q > 0
Positive Negative NegativeP > 0 q < 0 p × q < 0
Negative Positive NegativeP < 0 q > 0 p × q < 0
Positive Zero ZeroP > 0 q = 0 p × q = 0
Negative Zero ZeroP < 0 q = 0 p × q = 0
Properties of multiplication in Integers(i) Multiplication is closed.(ii) Multiplication is associative.(iii) Existence of multiplicative identity. The multiplicative identity in integers is 1.(iv) Multiplication distributes over addition.
ACTIVITY - 1
Verify the above stated properties of multiplication in integers taking concreteexamples....................................................................................................................................................................................................................................................................................................................................................
19
Numbers and the Operation on Numbers
Notes
Block 2 : Enriching Contents and Methodology
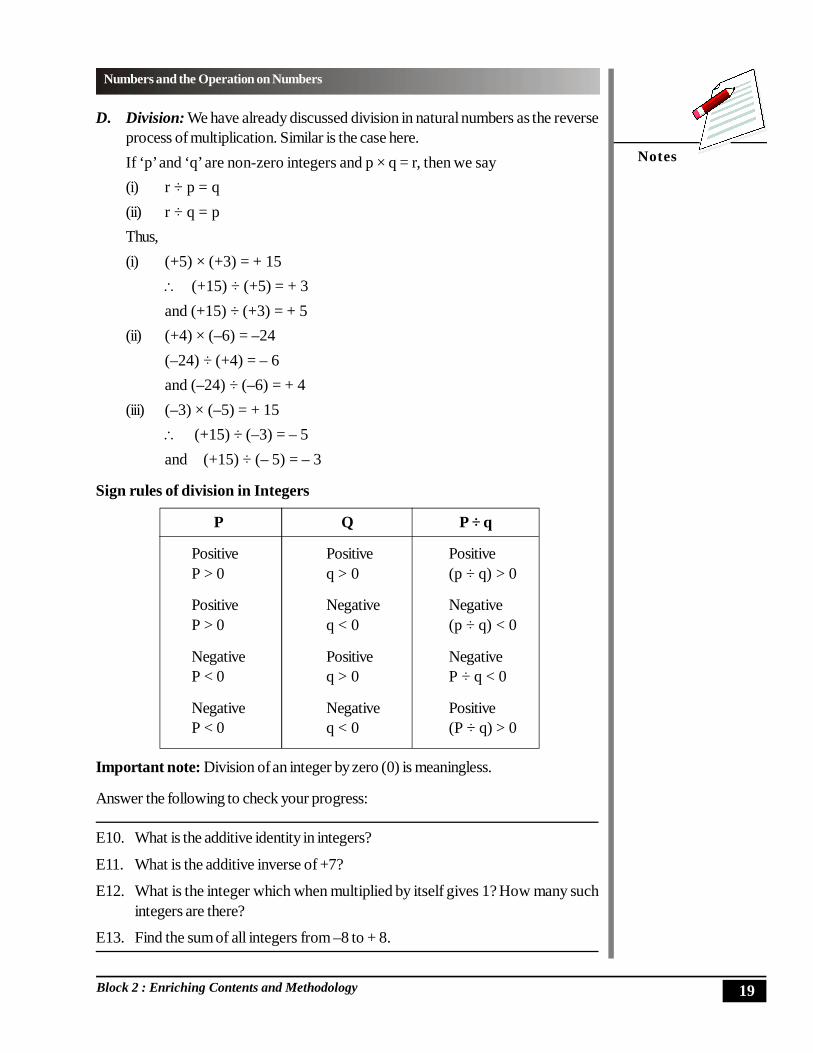
D. Division: We have already discussed division in natural numbers as the reverseprocess of multiplication. Similar is the case here.If ‘p’ and ‘q’ are non-zero integers and p × q = r, then we say(i) r ÷ p = q(ii) r ÷ q = pThus,(i) (+5) × (+3) = + 15
(+15) ÷ (+5) = + 3and (+15) ÷ (+3) = + 5
(ii) (+4) × (–6) = –24(–24) ÷ (+4) = – 6and (–24) ÷ (–6) = + 4
(iii) (–3) × (–5) = + 15 (+15) ÷ (–3) = – 5and (+15) ÷ (– 5) = – 3
Sign rules of division in Integers
P Q P ÷ q
Positive Positive PositiveP > 0 q > 0 (p ÷ q) > 0
Positive Negative NegativeP > 0 q < 0 (p ÷ q) < 0
Negative Positive NegativeP < 0 q > 0 P ÷ q < 0
Negative Negative PositiveP < 0 q < 0 (P ÷ q) > 0
Important note: Division of an integer by zero (0) is meaningless.
Answer the following to check your progress:
E10. What is the additive identity in integers?
E11. What is the additive inverse of +7?
E12. What is the integer which when multiplied by itself gives 1? How many suchintegers are there?
E13. Find the sum of all integers from –8 to + 8.

20
Notes
Numbers and the Operation on Numbers
Diploma in Elementary Education (D.El.Ed)
5.3.3. Operations on Rational NumbersA. Addition:
(i) We add rational numbers after changing them into like fractions :
2410
249
125
83
(Both the rational numbers are changed into like fractions.)
24109
2419
(ii) We add rational numbers by applying the following rule
qsrqps
sr
qp
For example –
1571
1522
151210
534352
54
32
Note : (–8) ÷ 4 = –2, 8 ÷ (–4) = –2
Hence qp
qp
qpThus;
48
48
48
Properties of addition:
(i) Addition in rational numbers is closed.(ii) Addition in rational numbers is commutative.(iii) Addition is associative.(iv) Existence of additive identity. Zero is the additive identity in Q.
(v) Existence of additive inverse. and are additive inverse of each other..
Hence 0p pq q

21
Numbers and the Operation on Numbers
Notes
Block 2 : Enriching Contents and Methodology
ACTIVITY - 2
Verify the above mentioned properties of addition of rational numbers withconcrete examples..................................................................................................................
.................................................................................................................
.................................................................................................................
B. Subtraction:
(i) We subtract one rational number from another by changing them to like fractions.Example:
2414
2415
127
85
241
241415
(ii) To subtract a rational number from another, we follow the rule given for additionafter expressing the subtraction into addition.Thus,
sr
qp
sr
qp
qsqrps
As for example,
54
425352
43
52
43
207
20815
C. Multiplication:
If qp
and sr
are two rational numbers, then
sqrp
sr
qp

22
Notes
Numbers and the Operation on Numbers
Diploma in Elementary Education (D.El.Ed)
Example
(i) 158
5342
54
32
(ii) 143
286
7423
72
43
Properties of multiplication in rational numbers:
(i) Multiplication is closed.
(ii) Multiplication is commutative.
(iii) Multiplication is associative.
(iv) Existence of multiplicative identity.(Multiplicative identity in Q is 1).
(verify these properties with concrete examples)
(v) Existence of multiplicative inverse.
pq and p
q are multiplicative inverses of each other as
1
pq
qp
qp
and pq
are also known as reciprocals of each other..
For example, multiplicative inverse of 32
is 23
, multiplicative inverse of 5 is 51
.
(vi) Multiplication distributes over addition.
Such as , lk
qp
nm
qp
lk
nm
qp
Example:
76
32
54
32
76
54
32
Sign-rules of multiplication are the same as in case of integers.

23
Numbers and the Operation on Numbers
Notes
Block 2 : Enriching Contents and Methodology
ACTIVITY - 3
Verify the properties (i) to (iv) of multiplication of rational numbers as statedabove with concrete examples....................................................................................................................................................................................................................................................................................................................................................
D. Division:Division of a given rational number by another is to multiply the first rationalnumber with the multiplicative inverse of the second.That is
qrps
rs
qp
sr
qp
Such as-
611
67
1214
47
32
74
32
Note : (i) Division by 0 is meaningless.(ii) Sign-rules of division are the same as those in case of integers.
Decimal equivalence of Rational numbers: Rational numbers with denominatorsequal to 10 or some power of 10 can have a different kind of representation. Thefollowing are the examples :
7.0107,2.0
102,1.0
101
14.010014,02.0
1002,01.0
1001
Let us look to some other rational numbers.
5.0105
5251
21
75.010075
254253
43

24
Notes
Numbers and the Operation on Numbers
Diploma in Elementary Education (D.El.Ed)
625.01000625
12581255
85
4.0104
2522
52
Thus it can be seen that rational numbers of which the denominators have no factorother than 2 or 5, can be represented as decimal numbers. Such decimal numbers are
known as terminating decimals. What about 72,
61,
31
etc.? In such cases the
denominator cannot be changed into a power of 10 by multiplying it with any numberwhatsoever.Hence we divide 1 by 3 to get a decimal equivalence, if any.
The division will never come to an end as at every phase of division the remainder isthe same as the original dividend. So we go on getting 3 successively.
Thus we say-
......3333.031
As the result never terminates and the digit 3 goes on occurring repeatedly, we say theresult as a non-terminating and recurring decimal number.
Some other examples of the above kind are :
0.232323………
2.537373737……….
1.342342342………..
The above numbers are also written in the following symbolic form.
0.3333 …………… = 3.0
0.232323 …………… 23.0

25
Numbers and the Operation on Numbers
Notes
Block 2 : Enriching Contents and Methodology
2.5373737 …………… 375.2
1.342342342…………… 342.1
We may also have non-terminating and nonrecurring decimal numbers. Followingare the examples.
0.12112111211112…………….
3.201001000100001……………….
It can be seen that neither a single digit, nor a group of digits are found occurringrepeatedly.
Expressing a non-terminating and recurring decimal number in rational form :
Example : Express in rational form :
(i) 0.4 (ii) 0.23
Solution :
(i) Let 0.4 be x.
0.444 …… = x ...(1)
0.444 …… × 10 = x × 10 (multiplying 10 on both sides)
4.444 …… = 10 x ...(2)
From (1) and (2) we get,
4.444…–0.444…= 10x - x , 4 = 9x,
49
x
Hence 40.49
(ii) Let 0.23 be x
0.232323……. = x ...(1)
0.232323……. × 100 = x × 100
26
Notes
Numbers and the Operation on Numbers
Diploma in Elementary Education (D.El.Ed)
23.232323……. = 100 x ...(2)
substructing e.q. (1) from eq. (2) we get 23 = 99 x
x = 2399
Note : A terminating and a non-terminating and recurring decimal each represents arational number. But a non-terminating and non-recurring decimal number does notrepresent a rational number.
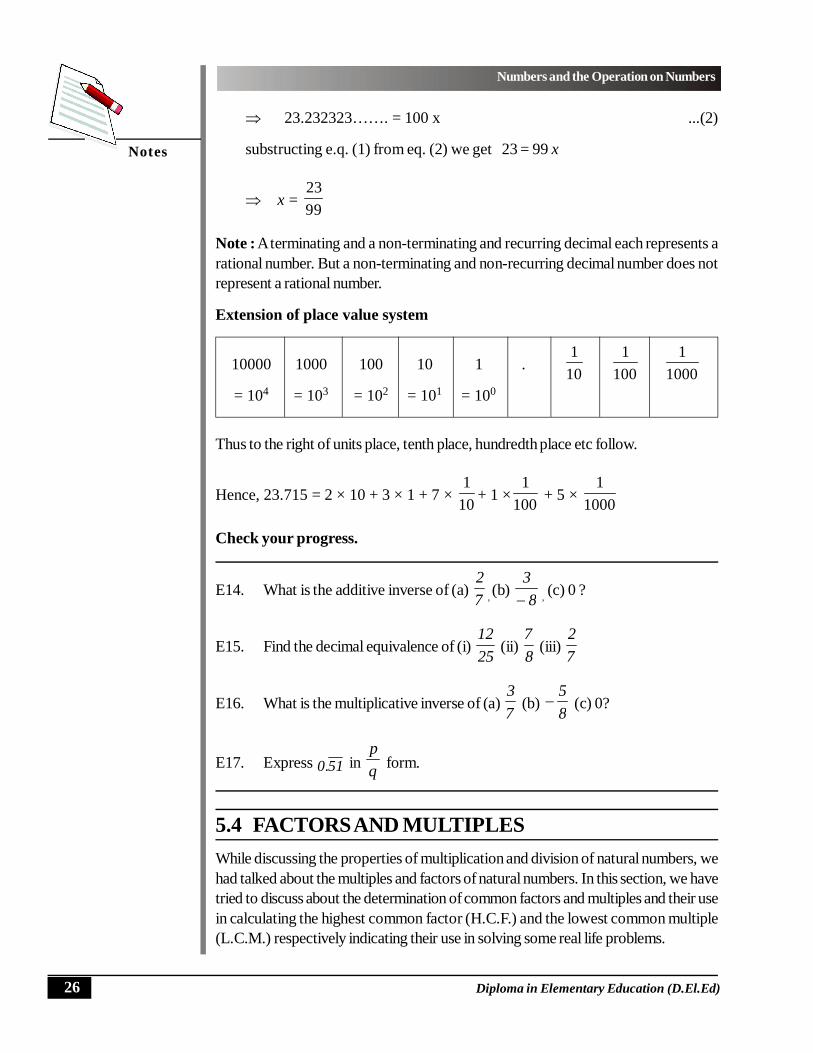
Extension of place value system
10000 1000 100 10 1 .1
101
1001
1000= 104 = 103 = 102 = 101 = 100
Thus to the right of units place, tenth place, hundredth place etc follow.
Hence, 23.715 = 2 × 10 + 3 × 1 + 7 × 1
10 + 1 ×1
100 + 5 × 1
1000
Check your progress.
E14. What is the additive inverse of (a) 72
, (b) 83 , (c) 0 ?
E15. Find the decimal equivalence of (i) 2512
(ii) 87
(iii) 72
E16. What is the multiplicative inverse of (a) 73
(b) 85
(c) 0?
E17. Express 51.0 in qp
form.
5.4 FACTORS AND MULTIPLESWhile discussing the properties of multiplication and division of natural numbers, wehad talked about the multiples and factors of natural numbers. In this section, we havetried to discuss about the determination of common factors and multiples and their usein calculating the highest common factor (H.C.F.) and the lowest common multiple(L.C.M.) respectively indicating their use in solving some real life problems.

27
Numbers and the Operation on Numbers
Notes
Block 2 : Enriching Contents and Methodology
5.4.1 Common Factor and the Highest Common FactorLet us take the numbers 12 and 18.
Factors of 12 are : 1, 2, 3, 4, 6 and 12 ….. (a)
Factors of 18 are : 1, 2, 3, 6, 9 and 18 …… (b)
From (a) and (b) it can be seen that
1, 2, 3 and 6 are the factors that commonly occur in the two lists above.
Hence 12 and 18 are said to have 1, 2, 3 and 6 as their common factors.
The highest of the common factors is 6.
Hence 6 is known as the highest common factor (or H.C.F) of 12 and 18.
Determination of H.C.F :
Process (i) : After writing the list of factors of each of the numbers the H.C.F. can bedetermined (as was done for 12 and 18 above).
Process (ii) : Prime factorization method :
12 = 2 × 2 × 3 = 22 × 31
18 = 2 × 3 × 3 = 21 × 32
H.C.F is the product of the lowest powers of each of the prime factors thatcommonly occurs in both the numbers.
H.C.F. of 12 and 18 =21×31 = 6
Process (iii) : Continued division method :
Step - 1 : Larger of the 2 numbers is divided by the smallerand the remainder is determined.
Step - 2 : Division of the previous division is taken as thedividend and it is divided by the remainder of theprevious division.
This process continues till the remainder becomes zero.
Divisor of the last division, where the remainder is zero, becomes the required H.C.F.
Application of H.C.F. (word problems)
Let us see the example below:There are 24 boys and 30 girls in a class. Separate lines of girls and boys are to beprepared with equal number of students in each line. What should be the greatest

28
Notes
Numbers and the Operation on Numbers
Diploma in Elementary Education (D.El.Ed)
number of boys (or girls) with which the lines are to be made so that all girls and allboys get accommodated?
The greatest no. of children (boys or girls) in each row is the HCF of 24 and 30.
We then find the H.C.F. of 24 and 30 i.e. 6. Thus we get the answer.
5.4.2 Common Multiples and the Lowest Common MultiplesLet us take the numbers 8 and 12.
Multiple of 8 is a number which is divisible by 8.
Hence 8×1, 8×2, 8×3, 8×4 and so on are the multiples of it.
Thus the multiples of 8 are : 8, 16, 24, 32, 40, 48, 56, 64, 72…………….
(and it is a non-ending list)
Similarly, the multiples of 12 are : 12, 24, 36, 48, 60, 72………..
(a non- ending list too)
Now it can be seen that the common multiples of 8 and 12 are : 24, 48, 72………….
The list of common multiple is also non-ending.
The lowest common multiple (or L.C.M.) of 8 and 12 is 24.
Determination of L.C.M.
Process (i) After writing the lists of multiples of each of the numbers, the commonmultiples and the lowest common multiple (L.C.M.) can be determinedas above.
Process (ii) Prime factorization method : Suppose we want to determine theL.C.M. of 12 and 18.
12 = 2×2×3 = 22 × 31
18 = 2×3×3 = 21 × 32
L.C.M is the product of the maximum number of each prime factor that occursin either of the numbers.
Thus the L.C.M. = 22 ×32= 2×2×3×3 = 36
Relation between the L.C.M. and H.C.F of Two Numbers:
Let us observe the following examples:

29
Numbers and the Operation on Numbers
Notes
Block 2 : Enriching Contents and Methodology
Numbers Product of H.C.F. L.C.M. Product ofthe numbers H.C.F. and
L.C.M.
12 & 18 216 6 36 216
16 & 28 448 4 112 448
25& 35 875 5 175 875
Thus we see that
Product of two positive numbers = Product of their H.C.F. and L.C.M.
E18 What is the H.C.F of two mutually prime numbers?
E19 H.C.F and L.C.M of two numbers are 8 and 96 respectively. If one of the twonumbers is 24, what is the other number?
5.5 ARITHMETIC AND APPLICATIONA. Unitary Method
There are 20 children to be divided equally into five groups. Now we perform thework of division.
Five Places are marked for five groups and one child is made to stand in eachspace.
Group - A Group - B Group - C Group - D Group - E
5 children have gone out of 20.Thus 20 – 5 = 15 are left.A second child is made to stand in each space.
Group - A Group - B Group - C Group - D Group - E
5 more children have gone out of the 15 left earlier.Thus 15 – 5 = 10 are left.

30
Notes
Numbers and the Operation on Numbers
Diploma in Elementary Education (D.El.Ed)
A third child is made to stand in each space.
Group - B Group - D Group - E
5 more children have gone out of the 10 left earlier.Thus 10 – 5 = 5 are left.A fourth child is made to stand in each space.
Group - A Group - B Group - C Group - D Group - E
Now 5 – 5 = 0 left.Thus we see that there are 4 children in each group.
But we know that the number of times 5 can be taken from 20 is 20 ÷ 5.
So we say-
If 5 groups will have 20 children, then 1 group will have 20 ÷ 5 = 4 children. Of coursethe groups are of equal size.
Other examples –
(i) If 5 vessels (of equal size) contain 20l of milk, then1 vessel would contain 20l ÷ 5 = 4l
(ii) If 5m of ribbon cost ̀ 20.00, then1m of ribbon costs ` 20.00 ÷ 5 = ` 4.00Now let us calculate for many when we know for one.One pen costs `8.00What is the cost for 3 pens ?Obviously the total cost of all 3 pens = ̀ 8.00 + ̀ 8.00 + ̀ 8.00But we know that 8 + 8 + 8 is the same as 8 × 3.
We can say that 3 pens cost `8.00 × 3Thus we came to know that-If 1 pen costs ̀ 8.00Then 3 pens cost `8.00 × 3 = `24.00Other similar examples are-

31
Numbers and the Operation on Numbers
Notes
Block 2 : Enriching Contents and Methodology
(iii) If 1 packet of salt weighs 600g.
Then 4 packets of salt weigh 600g. × 4 = 2400g. = 2.400kg
(iv) If one jar of oil containts 12kg
Then 5 jars of oil contain 12kg × 5 = 60 kg
Let us analyze the examples discussed above.
In every example given above there were two variables.
Examples 1st variable 2nd variable
(i) no of vessels capacity
(ii) length cost
(iii) no of packets weight
(iv) no of jars capacity
In each of the examples above as many times becomes the 1st variable so many timesbecomes the 2nd variable.
Such as –
Twice is the number of vessels; twice would be their capacity;
3 times is the length; 3 times is the cost and so on.
Thus –
(i) While knowing for many and we calculate for one, we divide.
(ii) While knowing for one and we calculate for many, we multiply.
Such pairs of variables between which, as many times becomes one, so many timesbecomes the other, are said to have direct variation between them.
Variables having inverse variation in them
Let us consider the following situations:3 workers can complete a work in 5 days.If one worker has to work alone, how many days would he take to complete ?Our experience shows that he can complete it in 5 + 5 + 5 = 5 × 3 daysHence it is seen that –If 3 worker complete a work in 5 days then,1 worker completes the work in 5 × 3 = 15 daysOther examples of the same kind follow:-

32
Notes
Numbers and the Operation on Numbers
Diploma in Elementary Education (D.El.Ed)
(i) 8 persons consume a certain quantity of food in 5 days, then
1 person will consume the same food 5 × 8 = 40 days.
(ii) If 1 person can complete a work in 24 days, then
3 persons will complete the work in 24 ÷ 3 = 8 days
(iii) If 1 person consumes a certain stock of food in 30 days, then
5 persons will consume the stock in 30 ÷ 5 = 6 days
The variables in the above examples are –
No. of persons Time required to do a work
No. of persons to consume a certain Time they take to consumestock of food
As we have seen –If the first variable is made twice the second becomes half.If the first variable become one fourth, the second variable becomes 4 times.The above pairs of variables are said to have inverse variation between them.
Application of unitary method in work and time.
Let us see the example below:
Example : A can complete a work in 24 days and B can complete the same work in18 days. A and B started doing the work together. After 4 days A discontinued working.How many days would the work take to be completed?
Solution:A can do the work in 24 days
the work done by A in 1 day = 241
B can do the work in 16 days
the work done by B in 1 day = 181
Work done by A and B together in 1 day 727
7243
181
241
Work done by A and B in 4 days 1874
727

33
Numbers and the Operation on Numbers
Notes
Block 2 : Enriching Contents and Methodology
Work left incomplete 1811
18718
1871
Work done by B in 1 day 181
the time required by B to complete 1811
of the work 111
181811
181
1811
Total time taken = 4 + 11 = 15 days
In course of calculation by unitary method, the following generalization is required tobe done.
(i) Work done in unit time work done
timetaken to do the work
(ii) Time required timeunitindonework
donebetowork
(B) Percentage calculation
Meaning of the Term “Percentage”
‘Percentage’ means ‘out of hundred’. But when is it used?
Let us see the situation below.
A and B are two students. A appeared in an examination with total mark 80 and hesecured 64. B appeared another examination with total mark 75 and he secured 63.
Whose performance is better, 64 out of 80 or 63 out of 75? Had the total mark in boththe examinations been the same, then we could compare the marks easily.
So we think of the total mark as 100.
Out of the total of 80, A gets 64
Out of 100, A gets 801008064
.
Now we say, A’s marks are 80 out of 100 i.e. 80 percent or 80%.
Similarly, out of 75, B gets 63
Out of 100, B gets 841007563

34
Notes
Numbers and the Operation on Numbers
Diploma in Elementary Education (D.El.Ed)
Now we say, B’s mark is 84 out of 100 i.e. 84 percent or 84%
B’s performance is better than A.
Thus we come to know –
Percentage is a comparison of one number with another.
While comparing, we treat the 2nd number as 100.
While comparing ‘p’ with ‘q’, we get %100qp
Application of Percentage:
The following are the occasions when application of percentage is made:-
In a business, profit or loss is expressed as a percentage of the cost price.
‘Profit is 12%’ means profit is 12% of C.P.
In case of Loan, interest paid is expressed as a percentage of the principle.‘Interest rate is 10%’ means interest in a year is 10% of the principle.
In case of increase or decrease (in production), increase or decrease is expressedas a percentage of the original.
(a) Profit and Loss
In a business –Profit = S. P. – C. P.Loss = C.P. – S. P.
Profit % = Profit as a percentage of C.P.
= 100.P.C
ofitPr
= 100P.C
P.C.P.S
Loss % = Loss as a percentage of C.P.
= 100.P.C
Loss
= 100.P.C
.P.S.P.C

35
Numbers and the Operation on Numbers
Notes
Block 2 : Enriching Contents and Methodology
Note : If after buying the article, some money is spent on transportation or for someother purpose, then the net cost = C.P. + Other expenditure. For calculatingthe profit or loss, net-cost is to be utilized instead of C.P.
For convenience of calculation of S. P. or C.P. the following rules may be used:-
100.P.C
%ofitPr100.P.S
100.P.C
%Loss100.P.S
(b) Interest Calculation
We save money in a Bank, we also borrow money form a bank.
When we save money, we get interest from the bank. When we borrow moneyfrom a bank, we pay interest to the bank.
How is the interest calculated ?
During transaction with a bank, the bank declares the rate of interest.
We decide –
(i) How much money we are to borrow (or deposit).
(ii) For what time we are to borrow (or deposit).
Supposing the money borrowed is ‘P’ and it is borrowed for ‘t’ years.
The rate of interest declared by the bank is r%.
How much of interest is to be given at the end of the loan period ?
What is the total money to be refunded back ?
Calculation :
Rate of interest is r%. That is,
on a principle of 100 ‘ in one year, interest in r ‘.
On a principle of 1 ‘ in 1 year, interest 100r
‘
On a principle of P ‘ in 1 year, interest 100PrP
100r
‘

36
Notes
Numbers and the Operation on Numbers
Diploma in Elementary Education (D.El.Ed)
On a principal of P ‘ in ‘t’ years, interest 100tPrt
100Pr
‘
Thus Interest (I) =100prt
Rule I [I.P.t.r- rule]
Total money to be refunded at the end of the loan period that is,
Amount IPA
100tPrPA
100rt1PA Rule II [A.P.t.r - rule]
Application of Rule – I
P, t, r given, to find I;P, r, I given, to find t;P, I, t given, to find r;I, t, r given, to find P.
Application of Rule – II
P, t, r given, to calculate A;P, r, A given, to calculate t;P, t, A given, to calculate r;A, t, r given, to calculate P.
Check your progress:
E20 A text book of mathematics costs 2 rupees more than a text book of literature.If 5 literature books cost 38 rupees more than 3 mathematics books, what isthe cost of each literature book ?
E21 Three persons completed half of a work in 8 days. If one of them discontinuesworking, how many days would they take to do the remaining half ?
E22 Gopal borrowed some money at 12% simple interest. If he had to pay back1280 rupees after 5 years, in order to clear off the loan, how much did heborrow?

37
Numbers and the Operation on Numbers
Notes
Block 2 : Enriching Contents and Methodology
5.6 LET US SUM UPFour types of number systems which are included in the Mathematics curriculumat the elementary school stage are:
– Natural numbers (N) : 1, 2, 3, 4, …………
– Whole numbers (W) :0, 1, 2, 3…….
– Integers (Z) : …………. –4, –3, –2, –1, 0, +1, +2, +3, ………..
– Rational numbers (Q) : Numbers of the form qp
where p, q are integers
and 0q are rational numbers.
Various properties of addition in different sets of numbers are :
(i) Addition is closed in N, W, Z and Q.
(ii) Addition in N, W, Z and Q is commutative and associative.
(iii) Additive identity exists in W, Z and Q. 0 is the additive identity.
(iv) Additive inverse exists in Z and Q.
Various properties of multiplication in the four types of number sets are:
(i) Multiplication is closed in N, W, Z and Q.
(ii) Multiplication in N, W, Z and Q is commutative.
(iii) Multiplication in N, W, Z and Q is associated.
(iv) Multiplicative identity exists in N, W, Z and Q.
(v) Multiplicative inverse exists in Q.
(vi) Multiplication in N, W, Z and Q distributes over addition.
Rational number can be represented as (i) terminating decimal if the denominatorhas no factor other than 2 or 5; (ii) non- terminating decimal if the denominatorhas any factor other than 2 or 5.
Prime common factors can be used to determine H.C.F. of two or more naturalnumber. Similarly, common multiples common multiples are used to determinethe L.C.M. of two or more natural numbers.
5.7 MODEL ANSWERS TO CHECK YOURPROGRESS
E1 The smallest counting number is 1.
E2 0

38
Notes
Numbers and the Operation on Numbers
Diploma in Elementary Education (D.El.Ed)
E3 (i) 0, (ii) 72. (iii) 792.
E4 (a) True, (b) False, (c) False, (d) False, (e)True
E5 1, E6. 0, E7. 2 and 13, E8. 2, E9. 101, E10. 0,
E11 -7, E12, -1 and +1, E13. 0, E14. (a) - 72
, ( b) 83
, (c) 0,
E15 (i) 0.48, (ii) 0.875, (iii) 0.285714 E16. (a) 37
( b ) 58
, (c) does not exist
E17 9951
E18. 1, E19. 32
E20 22 rupees, E21. 12 days, E22. 800 Rupees‘,
5.8 SUGGESTED READINGS AND REFERENCEMathematics text books prepared and published by
N.C.E.R.T. for Class-VI, VII and VIII.
5.9 UNIT-END EXERCISES1. How many integers between –30 and +30 are the multiples of 3 ?
2. What is the sum of
(i) 1 – 2 + 3 – 4 + 5 – 6 ………………. + 45
(ii) 1 + 2 – 3 + 4 + 5 – 6 + 7 + 8 – 9 + ………………….. – 48
3. (i) Score out the composite numbers from the table belows and identify theprime numbers that occur between20 and 69.
(iii) How marks pairs of twin prime are included among them?
20 21 22 23 24 25 26 27 28 29
30 31 32 33 34 35 36 37 38 39
40 41 42 43 44 45 46 47 48 49
50 51 52 53 54 55 56 57 58 59
60 61 62 63 64 65 66 67 68 69

39
Numbers and the Operation on Numbers
Notes
Block 2 : Enriching Contents and Methodology
4. A bought 200kg of rice at 18 ‘ per kg and sold 150 kg of them at 22‘ per kg andrest at 19‘ per kg.
B bought 250 kg of rice at 20‘ per kg and sold them all at 23‘ per kg.
Determine who had a greater profit ?
5. P borrowed a sum of ‘80,000.00 from a bank at 8% simple interest. How muchhas he to pay after3 years if he is to clear his debt completely ?

40
Notes
Shapes and Spatial Understanding
Diploma in Elementary Education (D.El.Ed)
UNIT 6 SHAPES AND SPATIALUNDERSTANDING
Structure6.0 Introduction6.1 Learning Objectives6.2 Basic Geometrical Figures
6.2.1 Undefined Terms6.2.2 Basic Figures
6.3 Two Dimensional Closed Figures6.3.1 Triangles6.3.2 Quadrilaterals6.3.3 Circle6.3.4 Congruence and Similarity6.3.5 Reflection and Symmetry
6.4 Three Dimensional Shapes6.5 Construction using Geometrical Tools6.6 Let Us Sum Up6.7 Check Your Progress6.8 Suggested Reading &Reference6.9 Unit End Exercises
6.0 INTRODUCTIONWhenever we look around us, we see various objects. Some show a shape which hassome regular features on it, such as a guava hanging on a tree, a lemon seen on a treeetc., and some others do not have any regular feature on them like a broken piece ofstone.
Fig. 6.1
41
Shapes and Spatial Understanding
Notes
Block 2 : Enriching Contents and Methodology
Let us consider a piece of brick. It has extensions in 3 directions and hence it is a bodyof 3 dimensions. (also known as 3-D objects).
There are 6 surfaces, 12 edges and 8 corners or vertices on it.
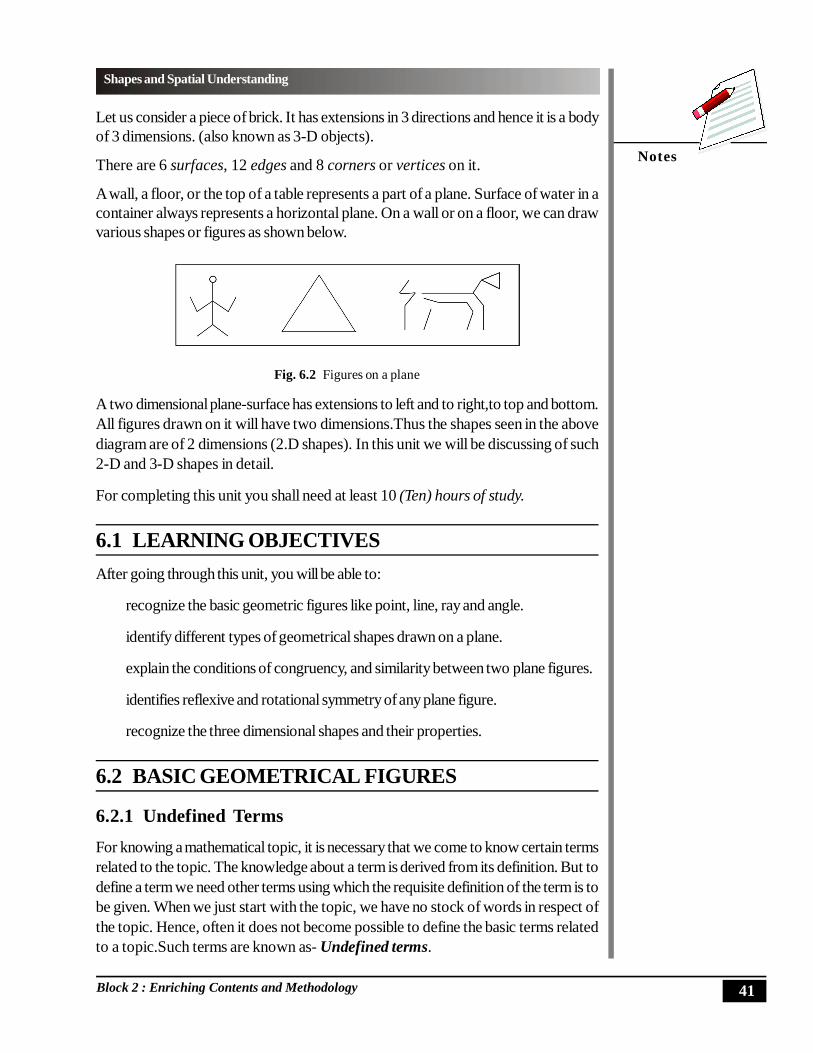
A wall, a floor, or the top of a table represents a part of a plane. Surface of water in acontainer always represents a horizontal plane. On a wall or on a floor, we can drawvarious shapes or figures as shown below.
Fig. 6.2 Figures on a plane
A two dimensional plane-surface has extensions to left and to right,to top and bottom.All figures drawn on it will have two dimensions.Thus the shapes seen in the abovediagram are of 2 dimensions (2.D shapes). In this unit we will be discussing of such2-D and 3-D shapes in detail.
For completing this unit you shall need at least 10 (Ten) hours of study.
6.1 LEARNING OBJECTIVESAfter going through this unit, you will be able to:
recognize the basic geometric figures like point, line, ray and angle.
identify different types of geometrical shapes drawn on a plane.
explain the conditions of congruency, and similarity between two plane figures.
identifies reflexive and rotational symmetry of any plane figure.
recognize the three dimensional shapes and their properties.
6.2 BASIC GEOMETRICAL FIGURES
6.2.1 Undefined TermsFor knowing a mathematical topic, it is necessary that we come to know certain termsrelated to the topic. The knowledge about a term is derived from its definition. But todefine a term we need other terms using which the requisite definition of the term is tobe given. When we just start with the topic, we have no stock of words in respect ofthe topic. Hence, often it does not become possible to define the basic terms relatedto a topic.Such terms are known as- Undefined terms.

42
Notes
Shapes and Spatial Understanding
Diploma in Elementary Education (D.El.Ed)
Some of the undefined terms in Geometry are:Point, Line, Plane (to define theseterms we have to come back to the terms)
Since no definition has been given about the above terms, to enable us to use the termsrightly, the following axioms are given:
Basic Axioms of Geometry
I: Every line (i.e. straight line) and plane is a set of points.II: Through one point innumerable lines can be drawn.III: Through two different points one and only one straight line can be drawn.IV: The line drawn through two given points in a plane also lies in the plane.V: There exists only one plane containing three points not lying in a line.VI: If two planes intersect, their intersection is a straight line.
The above axioms provide us with the inter-relations connecting the three undefinedterms.These axioms will help us in understanding and expressing geometrical factswherein the undefined terms (point, line and plane) are used.
6.2.2 Basic FiguresPoint: A dot mark given on a piece of paper using a pencil or a pen is treated as apoint. We should not have any concept about its size in our mind.
Line: When we speak of a line we mean a straight line
Fig. 6.3
The figure above represent a straight line. It is drawn with the help of a straight edge.The two arrow heads shown at the two extremities speak of unlimited extension ofthe line either way.
Plane: Floor of a room, surface of a wall, a page of a book represent planes. A planeis unlimited in its extension.
Distance between two Points: If A and B are two points, then the distance betweenthem is a unique non- negative real numbers and is denoted by the symbol AB.
Betweenness (definition) : If A, B and C are 3 distinct points, that lie in a straightline and AB + BC = AC, then B is said to lie between A and C and in symbol we writeit as A - B - C or C - B - A.
Fig. 6.4

43
Shapes and Spatial Understanding
Notes
Block 2 : Enriching Contents and Methodology
The diagram above shows 3 points A, B and C such that A - B - C (i.e. B lies betweenA and C).
Line-segment (definition) : The set of two distinct points A, B and the points betweenthem is known as the line-segment determined by A and B and it is represented by thesymbol AB .
A and B are known as the end points of AB .
A line segment is always a part of a line and has two end points. A line segment with theend points A,B is denoted by AB and its length is AB.
Length of a line segment (definition): The distance between the end points of aline-segment is known as the length of the line segment.Thus length of AB is AB.
Ray (Definition): A portion of a line which starts at a point and goes off in a particulardirection to unlimited distance. In the Fig. 6.5 the line starts at the point A and extendsin the direction of B to infinity. In this figure the ray is indicated by AB
and is read as"ray AB". The arrow over the two letters indicates it is a ray, and the arrow directionindicates that A is the point where the ray starts.
Fig. 6.5
The point A is known as the origin or vertex of AB
.
Fig. 6.6
Oppositerays:
The Fig. 6.6 shows a line AB , OA and OB are two rays both of which are parts ofAB . O is the only point common to both the rays OA and OB . In such a case OAand OB are known as two opposite rays. Obviously two opposite rays togetherform a line.A pair of lines:Three pairs of lines are shown in the figures below.
(I) (II) (III)
Fig. 6.7

44
Notes
Shapes and Spatial Understanding
Diploma in Elementary Education (D.El.Ed)
The lines AB and CD shown in the Fig. 6.7 (I) are such that those, being extended,in either way, will never meet. Such lines which do not have any point common to themare known as parallel lines.
Fig. 6.7 (II) shows a pair of lines EF and GH which will be found having a pointcommon to them if EF and GH are extended towards F and H respectively..
Fig. 6.7 (III) shows a pair of lines JK and LM which have a point O common toboth of them.
Thus the pair of lines EF and GH in fig-6.7 (II) and pair of lines JK and LM infig-6.7 (III) are known as non-parallel linesorintersecting lines. The point O inFig-6.7 (III) is known as the point of intersection of the lines JK and LM . The pointof intersection of the lines EF and GH , in fig. 6.8 (II), can be obtained on extendingthe lines EF and GH towards F and H respectively..
Symbolic representation of parallel lines: For a pair of parallel lines AB andCD , we write AB II CD in symbol.
Transversal of a pair of lines:
Fig. 6.8 (I) shows a pair of non-parallel lines AB and CD . Fig-6.8 (II) shows a pairof parallel lines PQ and RS .
EF is a line seen in Fig. 6.8 (I) and this line is found intersecting AB and CD as well.Similarly a line TV is seen in Fig. 6.8 (II) and it is found intersecting PQ and RS aswell.
(I) (II)
Fig. 6.8
EF in Fig. 6.8 (I) and TV in Fig. 6.8 (II) are known as transversals. EF intersect apair of non-parallel lines whereas TV intersects a pair of parallel lines.
Characteristic of parallel lines :
In the figure along side AB CD
. Three transversals are shown in the diagram andeach of the 3 transversals makes right angle with AB .

45
Shapes and Spatial Understanding
Notes
Block 2 : Enriching Contents and Methodology
Fig. 6.9
P, Q, R are the points where the transversal cuts AB and S, T, V are the points wherethe transversal cuts CD . PS , QT and RV will have equal lengths.
Each of PS, QT and RV represents the distance between the parallel lines AB andCD . It can be verified by actual drawing that PS = QT = RVV
Thus we see that the distance between two parallel lines is the same everywhere. Sowe say there exists a fixed distance between two parallel lines.
Angle(definition) : If A, B and C are 3 non-collinear points, then the figure formedby the rays AB
and AC
is known as an angle BAC. (written as BAC )
AB
and AC
are known as the arms of BAC and A is its vertex.
Fig. 6.10
Depending up on the situations of the points A, B and C, the angle can have differentshapes (as shown below).
Fig. 6.11
Measure of an angle :
Protractor, provided in the geometry set (instrument box), is the instrument that helpsus measuring an angle and the units of measure obtained using a protractor is degree.
AP
Q
R

46
Notes
Shapes and Spatial Understanding
Diploma in Elementary Education (D.El.Ed)
In the diagram alongside,
AOB measures 40° and COB measures 135°
Fig. 6.12
Degree measure of ABC is denoted as m ABC .
If ABC in Fig- 6.13 is of measure 70°, we write 70m ABC
Fig. 6.13
Axiom: With each angle a real number greater than 0 and less than 180 isassociated.
This number is known as the measure of the angle (in degrees).
Lines Perpendicular to each other:
In Fig. 6.14 (I), 90m AOB . In such a situation OA and OB are known as raysperpendicular to each other and we write BOOA or AOOB
Fig. 6.14
In Fig-6.14 (II), 90m CFE and hence we write CDFE . In Fig. 6.14 (III),90m GLJ and we write GHJK or JKGH
Angle Bisector: If P is a point in the interior of BAC and PACmBAPm ,then AP is known as the bisector of BAC (Fig.6.15).
(i) (ii)(iii)

47
Shapes and Spatial Understanding
Notes
Block 2 : Enriching Contents and Methodology
Fig. 6.15
Classification of angles: From measure point of view, angles are classified into thefollowing categories-(i) An angle of measure less than 90° and more than 0° is known as an acute angle.(ii) An angle of measure 90° is known as a right-angle.(iii) An angle of measure greater than 90°and less than 180° is known as an obtuse
angle.
Fig. 6.16
Pairs of angles:Adjacent angles:If two angles have a common vertex and a common arm andfurther their interiors have no common point, then the pair of such angles areknown as adjacent angles.
(I) (II) (III)
Fig. 6.17
A
A

48
Notes
Shapes and Spatial Understanding
Diploma in Elementary Education (D.El.Ed)
In each of the three diagrams above, you find a pair of angles BAP and CAPsuch that A is their common vertex, AP is their common arm and there is no commonpoint in their interior.
Hence BAP and CAP form a pair of adjacent angles.
Complementary angles: Two angles are said to be complementary if the sum oftheir measures is 90°. Obviously each of them would be an acute angle.
(I) (II)
Fig. 6.18
In Fig. 6.18 (I), 90m ABC m DEF .
Thus ABC and DEF are complementary angles.
In Fig. 6.18(II), 90m PAR m RAQ .
Thus PAR and RAQ are complementary angles.
Note : A pair of complementary angles may or may not be a pair of adjacent angles.
Supplementary angles:A pair of angles are said to be supplementary angles ifthe sum of their measures is 180°.
(I) (II)
Fig. 6.19
In Fig. 6.19 (I) above, 180m ABC m DEF
Hence ABC and DEF form a pair of supplementary angles.
In figure 6.19(II) 180m PQS m RQS
Hence PQS and RQS form a pair of adjacent supplementary angles.
Note : A pair of supplementary angles may or may not be adjacent.

49
Shapes and Spatial Understanding
Notes
Block 2 : Enriching Contents and Methodology
Vertically opposite angles:
In the figure 6.20 alongside AB and CD intersect each other at O. Thus four anglesare formed and AOD is one of the 4 angles formed by OA and OD .OB andOCare opposite rays of OA and OD respectively..
Fig. 6.20
The angle formed by OB and OC i.e. BOC and the angle formed by OA andOD i.e. AOD are known as a pair of vertically opposite angles. For similarreasons, BOD and AOC also form a pair of vertically opposite angles.
Thus two pairs of vertically opposite angles are formed when two straight lines intersecteach other.
Angles formed when a transversal cuts two lines
In Fig. 6.21(i), AB and CD are two nonparallel lines and the transversal PQ cutsthem. The angles formed at the points of intersections are marked by the numbers 1,2, 3, 4, 5, 6, 7 and 8.
Fig. 6.21 (i) Fig. 6.21 (ii)
In Fig. 6.21(ii) EF and GH are two parallel lines and the transversal KL cuts them.The angles formed at the points of intersections are marked by the letters a, b, c, d, e,f, g and h.
In Fig. 6.21 (i), angles marked as 1 and 5, 2 and 6, 4 and 8, 3 and 7 are known aspairs of Corresponding angles.
Angles marked as 1 and 7, 2 and 8 are known as exterior alternate angles whereasangles marked as 3 and 5, 4 and 6 are known as interior alternate angles.

50
Notes
Shapes and Spatial Understanding
Diploma in Elementary Education (D.El.Ed)
In Fig. 6.21 (ii) angles marked as a and h, b and e , d and g, c and f are correspondingangles.You can measure the angles formed when a transversal cuts a pair of parallel lines andobserve that(i) Exterior alternate angles are of equal measure and interior alternate angles
are of equal measure.(ii) Corresponding angles are of equal measure.
Check your progress:
E1. In the diagram in Fig. 6.22, O is a point common to AB andOD , measures ofAOD and DOB in degrees are x+30 and x-25 respectively. Find the
measures of the two angles in degrees.
Fig. 6.22 Fig. 6.23
E2. In the figure 6.23, 72m AOC . Find the measure of BOC,AOD andBOD .
E3. See Fig. 6.24 below and name the following kinds of angles.(i) A pair of corresponding angles.(ii) A pair of co-interior angles.(iii) A pair of alternate angles.
Fig. 6.24 Fig. 6.25
E4. In the figure 6.25, CDAB and PQ cuts them. The measures of angles formedare indicated as a, b, c, d, e, f, g and h. If g = 35°, find the values of a, b, c, d, e,f and h.

51
Shapes and Spatial Understanding
Notes
Block 2 : Enriching Contents and Methodology
6.3 TWO DIMENSIONAL CLOSED FIGURESIn this section we discuss the types and properties of three types of two dimensionalclosed figures i.e. triangles, quadrilaterals and circle.
6.3.1 Triangle
(Definition) If A, B, C are three non-collier points, then the figure formed byAB , BC and CA is known as triangle ABC (written as ABC).
A, B and C are known as the vertices of it. AB , BC and CA are the sides and ABC ,BCA and BAC (written in short as B , C and A ) are the angles of
ABC.Interior and Exterior of a Triangle :The region of the page enclosed within theABC (Fig. 6.26) is known as the interior of the triangle.Triangle ABC and its interiortaken together are known as the triangular region.
Fig. 6.26
In Fig 6.27, points P and R are in the interior of ABC. Point M and N are on ABCand points Q, S and T are in the exterior of ABC. The region on the page outsideABC. (Which contain points Q, S, T) is known as the exterior of ABC.
Fig : 6.27
Classification of Triangle:
(a) Classification in respect of angle-measure :
(i) Acute angled triangle: If all the three angles of a triangle are acute angles,then it is an acuteangled triangle. Such a triangle is show in Fig. 6.28 (a)below.
(ii) Right angled triangle: A triangle in which one angle is a right angle,it isa right angled triangle. Such a triangle is shown in Fig. 6.28 (b) below.

52
Notes
Shapes and Spatial Understanding
Diploma in Elementary Education (D.El.Ed)
(iii) Obtuse angled triangle: A triangle in which one angle is obtuse, it is anobtuse angled triangle. Such a triangle is shown in Fig. 6.28(c) below.
(a) (Acute angled triangle) (b) (Right angled triangle) (c) (Obtuse angled triangle)
Fig. 6.28
(b) Classification in respect of the relative lengths of sides :(i) Isosceles triangle : A triangle in which two sides are equal is an isosceles
triangle (Fig.6.29 (I))(ii) Scalene triangle : A triangle in which no two sides are equal is a scalene
triangle (Fig- 6.29 (II))(iii) Equilateral triangle: A triangle in which all the three sides are equal is
an equilateral triangle (Fig.6.29 (III)).
[I] [II] [III](Isosceles triangle) (Scalene triangle) (Equilateral triangle)
Fig.6.29
6.3.2 QuadrilateralsSee the diagram below.
(i) (ii)
Fig. 6.30

53
Shapes and Spatial Understanding
Notes
Block 2 : Enriching Contents and Methodology
In Fig. 6.30(i), there are four point A, B, C and D. No three of those four points liealong a straight line.
In Fig. 6.30(ii), traced copy of the same four point occur and the line-segmentCD,BC,AB and DA are drawn.
The line segments CD,BC,AB and DA are such that no two of them meet at anypoint other than their end-points.
Under such conditions, the figure formed by CD,BC,AB and DA is said to be aquadrilateral. The quadrilateral formed is named as ABCD.
A, B, C and D are the vertices of it; CD,BC,AB and DA are the sides of it.
Quadrilateral ABCD has four angles and those are CDA,BCD,ABC andDAB . AC and BD are the diagonals of ABCD.
Let us see the figure 6.31 (a) A, B, C and D in a plane and no 3 of them are collinear.
(a) (b) (c)
Fig. 6.31
But AD and BC meet at a point other than their end-points. Hence CD,BC,ABand DA do not form a quadrilateral. Fig 6.32 (b) is a convex quadrilateral and 6.32(c) is known as a reentrant quadrilateral. We discuss of a convex quadrilateral only.
Categories of Quadrilaterals :
(i) Trapezium : A quadrilateral with one pair of opposite sides parallel, is known as
a trapezium. Fig. 6.32 (I) below shows a trapezium in which DCAB .
(I) (Trapezium) (II) (Parallelogram)
Fig. 6.32

54
Notes
Shapes and Spatial Understanding
Diploma in Elementary Education (D.El.Ed)
(ii) Parallelogram: A quadrilateral with both pairs of opposite sides parallel, is aparallelogram.In Fig. 6.32 (II), GHEF and EHFG . Thus EFGH is aparallelogram.
(iii) Rectangle: A quadrilateral with all 4 angles to be right angles is a rectangle.
If can also be said that a parallelogram with one angle right angle is a rectangle.
(I) [Rectangle] (II) [Rhombus] (III) [Square]
Fig. 6.33
In Fig. 6.33 above ,D,C,B,A are right angles. Thus ABCD is a rectangle.
(iv) Rhombus: A quadrilateral with all 4 sides of equal length is a rhombus.
(v) Square: A quadrilateral with all sides of equal length and all angles right angles isa square.In Fig. 6.33(III) above AB = BC = CD = DA and ,D,C,B,A are all right angles. Thus ABCD is a square.
Flow chart showing the inter relation connecting all categories of quadrilaterals:
Note : The properties of various kinds of quadrilaterals can be known throughexperiments.

55
Shapes and Spatial Understanding
Notes
Block 2 : Enriching Contents and Methodology
Perimeter of a quadrilateral = sum of the lengths of all 4 sides.
Area of a quadrilateral = sum of the areas of the pair of triangles obtained bydrawing a diagonal.
Perimeter of a trapezium = sum of the lengths of all 4 sides
Area of the Trapezium ABCD (Fig. 6.34)
= Area of ABC + Area of BCD
= ½ AB × h + ½ CD × h
= ½ h (AB + CD)
= ½h (sum of the lengths of the parallel sides)
Perimeter of a parallelogram = AB + BC + CD + DA (in Fig.6.35)
= AB + BC + AB + BC
= 2AB + 2BC = 2 (AB + BC)
Area = base × height
(base is DC and height is h)
Perimeter of a rectangle = AB + BC + CD + DA (in Fig.6.36)
= l + b + l + b = 2l + 2b = 2 (l + b)
[where l : length AB, b : breadth AD]
Area of a rectangle = l ×b
Perimeter of a rhombus = AB + BC + CD + DA (Fig.6.37)
= AB + AB + AB + AB = 4 AB = 4 × length of a side
In a rhombus, the diagonals bisect each other at right angles.
Area of the rhombus ABCD
= Area of ABC + Area of ACD
= ½ AC × BO + ½ AC × DO
= ½ AC (BO + DO)
= ½ AC × BD
= ½ (product of the lengths of two diagonals)
Fig. 6.34
Fig. 6.35
Fig. 6.36
Fig. 6.37

56
Notes
Shapes and Spatial Understanding
Diploma in Elementary Education (D.El.Ed)
Perimeter of a square= 4 × length of a side (like a rhombus)Area of a square= AB × AD (like a rectangle) (Fig.6.38)= AB × AB (as all sides are of equal length)= AB2 = Square of the length of a side.
6.3.3 CircleCircle is a two dimensional shape made up of a curved line and it encloses a part of theplane on which it is drawn.
Definition:A circle is a collection of points in a plane such that each of them lies at afixed distance from a fixed point in the same plane.
The fixed point is known as the centre of the circle and the fixed distance is known asthe radius of it.
Fig. 6.39
The linesegment joining any two points of a circle is known as a chord of it. A chordthat contains the centre is known as a diameter of the circle. Thus in fig 6.39, AB isa diameter. AB (i.e, the length of AB )is the diameter of the circle (denoted as ‘d’).
OA and OB each is a radius of the circle.Hence r2d .
In Fig. 6.40 (a), A and C are two points on the circle ABC. These two points dividethe circle into two parts and each part is known as an arc of the circle with end pointsA and C. AC is a chord of the circle. P and Q are two points on the circle other thanA and C.P and O lie on opposite sides of the chord AC where as Q and O lie on thesame side of AC .
Fig. 6.40(a) Fig. 6.40 (b)
Fig. 6.38
P
O

57
Shapes and Spatial Understanding
Notes
Block 2 : Enriching Contents and Methodology
The arc that contains P is named as arc APC and denoted as APC and the other arcthat contains Q is known as arc AQC and is denoted as AQC. APC is known as aminor arc and AQC is known as a major arc. APC and AQC are known as a pair ofopposite arcs.
In the circle ABC shown in fig 6.40(b), radii AO and BO are drawn at the endpoints A and B of ADB which is a minor arc. Thus AOB is formed at the centre O.
AOB is known as the angle subtended by ADB at the centre.
Measure of AOB is known as the degree measure of ADB. (Bigger is thearc, bigger is its degree measure. The degree measure of an arc ADB iswritten as mADB .The degree-measure of a major arc =360° — the degree major of its oppositearc.Such as, m ACB (in Fig. 6.40 (b) ) = 360° — m ADB
In Fig. 6.41, AC is a diameter of the circle APC As such each of the two arcs APCand AQC is known as a semicircle. The degree-measure of a semicircle is 90°.
Fig. 6.41
In Fig. 6.42 (I), P and Q are two interior points of the minor arc with A and B as endpoints. Each of the angles APB and AQB is known as an angle inscribed inAPB. Similarly ARB and ASB are the angles inscribed in ARB.
(I) (II)
Fig. 6.42
C

58
Notes
Shapes and Spatial Understanding
Diploma in Elementary Education (D.El.Ed)
In Fig. 6.42 (II) AB is a diameter of the circle. M and N are the interior points in thesemicircles with the A and B as end points AMB and ANB each is known as anangle in a semicircle.
Cyclic Quadrilateral:
A quadrilateral in which vertices lie on a circle (as shown in fig- 6.43 is known as acyclic quadrilateral. Thus, ABCD is a cyclic quadrilateral.
Fig. 6.43
Interior points and exterior points of a circle:
In fig 6.44, O is the centre of the circle KLM. So obviously K, L, M are points on thecircle.
Fig. 6.44
P and Q are two points in the plane of the circle KLM such that PO < r (where r is theradius of the circle) QO > r. P is said to be a point in the interior of the circle KLMand Q is said to be in the exterior of the circle KLM.
The set of all points on a circle and the points in its interior taken together is known asthe circular region.
Segment of a circle:
In Fig. 6.45, AB is a chord of the circle ABC. AB divides the circular region intotwo parts and each part is known as a segment. The segment that does not containthe centre O, is known as the minor segment and segment that contains the centre Ois known as the major segment.
L

59
Shapes and Spatial Understanding
Notes
Block 2 : Enriching Contents and Methodology
Fig. 6.45
Some properties of circle:
1. Angles inscribed in the same arc (i.e, angles inthe same segment) are equal.
ACDmABDm , BDCmBACm
2. Angle in a semicircle is a right angle. AB is adiameter. Thus APB is a semicircle.
90m APB .
3. Opposite angles of a cyclic quadrilateral aresupplementary. ABCD is a cyclic quadrilateralas its vertices lie on the circle.
180m A m C m B m D
4. The degree measure of an arc is equal to twicethe measure of angle inscribed in the oppositearc.
2m APB m ADB
ACBm2
Fig. 6.46
Fig. 6.47
Fig. 6.48
Fig. 6.49
D
AP

60
Notes
Shapes and Spatial Understanding
Diploma in Elementary Education (D.El.Ed)
Check your progress:
E5. Fill up the blanks
(a) A parallelogram with its two adjacent sides of equal length is a ………. .
(b) A radius of a circle is the linesegment that joins a point of the circle tothe………….. of it.
(c) If the degree measure of an arc of a circle is 640, then the measure of anangle inscribed in the opposite arc is …….
(d) The sum of the measuresof theopposite angles of a cyclic quadrilateralis………degrees.
6.3.4 Congruence and SimilarityCongruentfigures:
Two plane- figures (figures drawn in a plane) are said to be congruent if the tracedcopy of one coincides with the other exactly. But the description of congruence givenabove involves a practical work. To make the work logical, we will give some definitionsand some conditions under which figures (triangles) become congruent. The symbolthat represents‘is congruent to’is .
(i) Congruence of line-segments :
If the lengths of two line segments are equal, thenthe line segments are said to be congruent. Thustwo congruent linesegments are of equal in length.
PQABPQAB
and PQABPQAB
(ii) Congruence of angles :Two angles are congruent if their measures are equal. Thus two congruent angleshave equal measures.
PQRABCPQRmABCm
and PQRABC PQRmABCm
Fig. 6.51
Fig. 6.50

61
Shapes and Spatial Understanding
Notes
Block 2 : Enriching Contents and Methodology
Congruence of triangles:
Two triangles become congruent under the following conditions:
(i) Two triangles are congruent if two sides of one triangle are congruent to thecorresponding sides of another and the angles included between them arecongruent. This condition of congruence is known as, S-A-S postulate.
Note : Postulate is something which cannot be proved, but is accepted.
In triangles ABC and PQR, if ,PQAB
QRBC and PQRABC ,
then PQRABC
Fig. 6.52
(ii) Two triangles are congruent if three sides of one triangle are congruent to thecorresponding sides of the other triangle.
This condition is known as SSS congruence.In ABC and PQR , if PQAB ,
QRBC , RPCA , then PQRABC
Fig. 6.53
(iii) Two triangles are congruent if two angles of one triangle are congruent to thecorresponding angles of the other triangle and the sides included between themare congruent.
In ABC and PQR,
if QB , RC , QRBC
then PQRABC

62
Notes
Shapes and Spatial Understanding
Diploma in Elementary Education (D.El.Ed)
Fig. 6.54
It can be reasoned out using the above condition that if two angles of one triangleare congruent to corresponding two angles of another triangles and one pair ofcorresponding sides are congruent, the triangles are congruent.
This is known as “A-A-S congruence.”
(iv) Two right angled triangles are congruent if the hypotenuse and one side of onetriangle are respectively congruent to the hypotenuse and the corresponding sideof the other.
This is known as ‘RHS congruence’.
Fig. 6.55
In ABC , B is a right-angle and in PQR , Q is a right angle. Ifhypotenuses PRAC and sides PQAB , then PQRABC .
Note : Areas of two congruent triangles are equal.
Application of congruence.
When it is required to prove two sides or two angles of two triangles to be congruent,we try to prove the triangles to be congruent.
Thus congruence of triangles is an important tool that helps us solving many problemsin geometry.An example is given below.
Example : In the adjoining figure, CDAB ,
BCDABC . Prove that AC BD
Proof : In ABC and BCD
CDAB (given) Fig. 6.56

63
Shapes and Spatial Understanding
Notes
Block 2 : Enriching Contents and Methodology
BC is the side common to both triangles
BCDABC (given)
BCDABC (S-A-S congruence)
BDAC [as corresponding parts of congruent triangles]
Similarity of triangles
A plane figure has two aspects in it. Those areshape and size.
If two plane-figures have the same shape and the same size, then those becomecongruent, i.e. trace-copy of one coincides with the other.
Now we take two plane-figures which have the same shape. Some such examples aregiven below.
(i) Two photographs of the same person prepared from the same negative but withdifferent magnification look to be exactly alike i.e., those are of the same shape,but those are different in size.
(ii) One map of India printed on the page of a book and another wall-map of India.Those are both of the same shape but of different sizes.
(iii)
(a) (b) (c)
Fig. 6.57
Two circles shown in Fig. 6.57(a) of Ex (iii) look exactly alike and hence those aresimilar.
Two squares are similar. Two equilateral triangles are similar.
Note: Congruent figures are similar. But similar figures may not be congruent.
6.3.5 Reflection and SymmetryWe know that reflection occurs in a plane mirror and consequently an image is formed.The concept of reflection in geometry is very much similar to the reflection in plane-mirror.

64
Notes
Shapes and Spatial Understanding
Diploma in Elementary Education (D.El.Ed)
(a) Reflection in a line :
(i) Reflection of a point in a line: In figure 6.58(a) ‘L’ is a line (at times wename a line by a single letter) and P is a point.
Fig. 6.58 (a) Fig. 6.58(b)
P is reflected in the line L and an image is formed. Which is the image and whereis it formed?
Procedure to get the image:
See Fig. 6.58 (b) From P, PM is drawn perpendicular to L.On PM , a point P’ istaken such that P-M-P’ and PM = MP’.Thus we get the image P’ of the point Pobtained under reflection in L.
Line L is known as the mirror line.
In Fig. 6.65., P’1 is the image of P1 in L.
P’2 is the image of P2 in L.
P’3 is the image of P3 in L.
Fig. 6.59
As the point is being nearer L, the image is also being nearer to L.
P4 is a point that lies in L. Where is the image of P4 in L?
Distance of P4 from L is zero as P4 is in L.
The distance of the image of P4 from L is also zero.
P

65
Shapes and Spatial Understanding
Notes
Block 2 : Enriching Contents and Methodology
Hence the image of P4 is also to lie in L.
Thus P4 is its own image.
Hence we say-
The image of a point lying in the mirror line is its own image.
(ii) Reflection of a line-segment :
L is the mirror line and AB is to be reflected (see fig.6.60)
The image of AB in the mirror line L is 'B'A where A’ and B’ are the images of A andB respectively in the line L.
Fig. 6.60 Fig. 6.61
(iii) Reflection of a triangle:As seen in fig 6.61 above, the image of ABC in themirror-line L is 'C'B'A where , andA B C are the images of A, B and Crespectively in the line L.
Symmetry : The shape of some objects and some designs appeal us very much. Wesay those objects or the designs look beautiful. Some such things are shown below.
[A betel leaf] [A design] [A butterfly]
Fig. 6.62
In each of the diagrams above, we can think of drawing a line suitably, so that-If we take a trace-copy of the figure,

66
Notes
Shapes and Spatial Understanding
Diploma in Elementary Education (D.El.Ed)
cut along the outline of the figure,
fold along the line we have drawn (or thought of drawing),
The two parts of the figure coincide with each other exactly. Then the figure is said tobe a symmetric figure and it is symmetric about the line we have drawn.
The line drawn is known as theline (or axis) of symmetry of the figure. The figure issaid to have line-symmetry.
The line of symmetry of each of the above figures is shown below:
Fig. 6.63
Examples of some letters which are symmetric about a line.
A B D ETry to write the others.
Geometric figures with line-symmetry:
ABC is an isosceles triangle and PQ is its line of symmetry. PQ is the line that passesthrough the vertex A and the midpoint Q of the base BC (Fig. 6.64).
Fig. 6.64 Fig. 6.65
ABCD is a rectangle and it has 2 lines of symmetry. Those are PQ and RS where P,,Q, R and S are the mid-points of sides AB,BC,AD and CD respectively (fig 6.65).
ABC is an equilateral triangle. It has 3lines of symmetry and those are PQ , RSand TV . Each of them joins a vertex with the mid point of the opposite side(Fig. 6.66)
Q

67
Shapes and Spatial Understanding
Notes
Block 2 : Enriching Contents and Methodology
Fig. 6.66 Fig. 6.67
ABCD is a square (fig. 6.67). It has 4 lines of symmetry and those are PQ,BD,ACand RS where P, Q, R and S are the mid points of sides AB,BC,AD and CDrespectively.
A line passing through the center of a circle is a line of symmetry for the circle.
Thus we can have geometric figures having one or more than one lines of symmetry.
Rotational symmetry :
Look to the toy of a paper-made-wind-mill that rotates when shown against the wind.
Fig. 6.68
4 blades of it are named as A, B, C and D. If it is made to rotate through a right angle(in an anti clock wise manner), A will be found occupying the position now occupiedby B. B, C and D will, in turn, be occupying the positions now occupied by C, D andA respectively.
Thus the wind-mill looks exactly like its first position. Hence during a complete rotation,there occur 4 positions when it looks to have the original situation. Hence we say thatthe wind-mill, shown in Fig6.68 has rotational symmetry of order 4. The point aroundwhich the wind-mill rotates is known as the point of symmetry.
Check if the shapes given below have rotational symmetry and if yes, state the orderof symmetry in each case.

68
Notes
Shapes and Spatial Understanding
Diploma in Elementary Education (D.El.Ed)
(a) (b) (c) (d) (e)
Fig. 6.69
Check your progress
E6. Fill in the blanks
(a) Two line segments are congruent if their .................. are equal.
(b) Two angles are congruent if their .................. are equal.
(c) If triangles are congruent then their .................. angles are equal in measure.
(e) Two similar triangles have the same ..................
E7. In ABC and PQR , AB = 4cm, BC = 7cm., PQ = 6cm, QR = 10.5cm. and
QmBm
(a) Find PR if AC = 8cm.
(b) Find the ratio of areas of ABC and PQR .
6.4 THREE DIMENSIONAL BODIESWe have already discussed of three dimensional bodies earlier. There we said that thebodies with extensions in three directions like left to right, nearer to farther and top tobottom are known as bodies of 3 dimensions.
Bodies with extensions in three directions mutually at right angles are knownas 3D bodies.
Different regular 3-D shapes:
(a) Cuboid
A box, a piece of a brick and bodies of the like has the shape which is known as acuboid.
A cuboid is shown in Fig. 6.70.It has 8 vertices (A, B, C, D, E, F, G, H), 12 edges
DGandCF,BE,AH,HE,GH,FG,EF,DA,CD,BC,AB , and 6 Faces (ABCD,EFGH, ABEH, BEFC, CFGD and AHGD)

69
Shapes and Spatial Understanding
Notes
Block 2 : Enriching Contents and Methodology
Each of BC, EF, HG and AD represents the length ( ) of the cuboids.nEach of AB,CD, EH and FG represents its breadth (b).Each of AH, BE, CF and DG representsits height (h).
Fig. 6.70
Surface area of a cuboid = area of top and bottom surfaces + area of left and rightsurfaces + area of front and back surfaces= 2l × b + 2 b × h + 2lh = 2(lb + bh + lh)square units
Volume of a cuboidis the measure of the space occupied by the body and it is theproduct of the length, breadth and height in case of a cuboid.
Thus V = l × b × h cubic unit.
(b) Cube: A cuboid of which the length, breadth andheight are equal is known as a cube.
Thus, all its edges are of equal length and all of itsfaces are squares.
Unit of volume measure :
The unit to measure volume of a 3-D body is thevolume of a unit cube i.e, a cube each side of which is of unit length.If the length of each side of a unit-cube is 1cm, then the volume of the unit-cube is1cm3.
Fig. 6.72
Fig. 6.71
[Unit - cubeVolume = 1 m3]

70
Notes
Shapes and Spatial Understanding
Diploma in Elementary Education (D.El.Ed)
A unit-cube, each side of which is 1cm, is known as a cm-cube.
A unit-cube, each side of which is 1m, is known as a m-cube.
The shaded part of the m-cube (Fig.6.72b) is a cm-cube i.e. each edge of it is oflength 1cm. Thus if the m-cube is cut into cm-cubes we will get 100 cubes along theedge AB ,100 cubes along the edge AC and100 cubes along the edge AD .
Hence the total number of cm-cubes available will be 100 × 100 × 100 = 10,00,000.
Thus 1m3 = 10, 00,000 cm3 = 106 cm3
1 cm3, 1 m3 etc. are known as cubic units.
Note :
(i) The area of cm-square and a m-square have not been calculated, those havebeen defined as 1cm2 and 1m2 respectively.
(ii) The volumes of a cm-cube and a m-cube have been defined as 1cm3 and 1m3
respectively.
(iii) 1cm2 is the unit of area-measure, but a cm-square is a square each side of whichis 1 cm long.
Thus 1cm2 and a cm-square represent completely different concepts.
Area of a cm-square = 1cm2
Like wise, 1m3 and a m-cube are different.
Vol. of a m-cube = 1m3.
(b) Prisms :
3-D body shown in Fig. 6.73 (i) have the following features.
(i) (ii)
Fig. 6.73

71
Shapes and Spatial Understanding
Notes
Block 2 : Enriching Contents and Methodology
It has 2 triangular faces (one at the top and one at the bottom). We usually name thoseas the bases.
Further it has 3 rectangular faces each of which is
perpendicular to the triangular end.
These surfaces are known as lateral faces.
The distance between the two triangular ends is known as the height of the prism (it isalso said as the length if the prism lies horizontally).
The Fig. 6.73 (ii) presents the diagram of a prism with a hexagon as its base.
Surfacearea of a prism:
Lateral surface area = AB × h × BC + h + CA × h sq-units (where ‘h’ represents theheight)
= h (AB + BC + CA) sq-units (‘h’ taken common)
= h × perimeter of the base
Area of the ends = 2 × area of each end.
Total surface area of a prism
= lateral surface area + area of the ends
= h × perimeter of the base + 2 × area of each end.
Volume of a prism = base area × height
Note : These rules apply to prisms of bases in the shape of polygons of any no. ofsides.
(c) Cylinder :A cylinder is the geometrical shape that we see in a log of wood.
Fig. 6. 74
The cylinder has two circular ends (also known as bases). Except the bases, it has acurved face all around.
The distance between the two ends is known as the height (or length) of the cylinder(denoted as h).

72
Notes
Shapes and Spatial Understanding
Diploma in Elementary Education (D.El.Ed)
Surface area of a cylinder :
Curved surface area : Curved surface area of a cylinder is equal to the area of arectangular sheet of paper which can exactly cover the curved surface of it. Such apiece of paper is shown in Fig. 6.75(b).
(a) (b)
Fig. 6.75
The length (l) of the rectangular paper sheet
= circumference of the basecircle = r2 and breadth (b) of the sheet
= height of the cylinders = h
The area of the sheet = l × b = r2 × h = r2 sq. unit.
The curved surface area of a cylinder = rh2 sq. unit.
Volume of a cylinder = base area × height = hr2 cubic units
Note : A cylinder is a special form of a prism with circular base.
(d) Pyramid : Pyramids are the tombs of Pharaohs (Kings and queens) of Egypt.
The base of a pyramid is a triangle or a polygon and it ends in a point at the top. Somesuch shapes are shown below.
(a) (b)
Fig. 6.76
Pyramid with triangular basehas 4 vertices6 edges and 4 faces each of which is atriangle.

73
Shapes and Spatial Understanding
Notes
Block 2 : Enriching Contents and Methodology
Pyramid with quadrilateral basehas 5 vertices, 8 edges and 5 faces of which slantfaces are triangular and the base is a quadrilateral.
The surface area of a pyramid = slant surface area + base area
Volume of a pyramid = 31
× base area × ht.
(e) Cone :
A joker’s cap as seen in a circus, a funnel without its stem have the a shape which isknown as a cone.
It has one vertex, one circular edge and 2 faces of which one is curved and the otherone is flat and circular in shape.
Fig. 6.77
Total surface area = Curved surface area + area of the base- circle
rrhrrrhr 22222
[where ‘r’ is the radius of the circular base and ‘h’ is the height of the cone as shownin the diagram]
Slant height 22 hr
(f) Sphere: The shape of a football represents a sphere.
It has no vertex and it has no edge too.But it has one curved face.
Surface area of a sphere= 2r4
Volume of a sphere= 3r34 (r is the length of theradius of the sphere and π is to be
taken as 722
or 3.14 as suitable.)
Fig. 6.78
Fig.6.78Fig.6.78

74
Notes
Shapes and Spatial Understanding
Diploma in Elementary Education (D.El.Ed)
Net for building some 3-D shapes
A net is an outline in 2-D which when folded results in 3-D shape. On an artpaper (thick sheet of paper) an outline is so drawn that when cut along the outline,the piece of paper that comes out, can be folded suitably to give rise to a 3-Dfolded shape.
(i)To get a cube of edge 5cm :
The net shown above have all angles right angles and the edge-measurements areshown in the diagram.
(ii) Net to get a cylinder of base radius 3.5cm and height 10cm :
‘a’ and ‘b’ represent two circles each of radius 3.5cm and the remaining part is arectangle with measurements as show in the diagram.
Check your progress
E9. What will be the length of each edge of the greatest cube that can be obtainedby cutting a woolen cuboid of length 175cm breadth 105cm and height 63cm ?
E10. Determine the ratio of the volumes of the two cylindrical shapes that can beprepared using a rectangular sheet of paper of length 33cm and breadth 22cmentirely?
6.5 CONSTRUCTION USING GEOMETRICALTOOLS
The set of geometrical instruments include a scale, a pair of dividers, a pair of compassesand a pair of setsquares (one 45°-45° setsquare and the other 60°-30° setsquare).

75
Shapes and Spatial Understanding
Notes
Block 2 : Enriching Contents and Methodology
When we use only the straight edge of the scale, we consider it as a ruler i.e., a ruler isa rectangular plate with only straight edges.
Use of ruler and compasses:
There was a time, when mathematicians thought that many basic mathematical workscan be done using ruler and compasses. However, the following geometric figures canbe drawn using ruler and compass:
(i) A line segment of given length.
(ii) Perpendicular bisector of a given linesegment.
(iii) A line parallel / perpendicular to a given line,
(a) at a given point on it.
(b) from a given point outside it.
(iv) An angle equal in measure to a given angle.
(v) Bisector of a given angle.
(vi) Angles of measure 60°, its multiples and submultiples.
(vii) Divide a given line segment into equal parts.
(viii) Draw triangles, quadrilaterals and circles of given measure.
You must have drawn these figures in your school days. To reinforce your learning ofthese constructions, we have presented here the processes in brief.
(i) To construct a line segment of a given length.
(a) A st-line is drawn using a straight edge of a scale [Fig 6.79 (a)].
(b) The given length is taken as the radius in the compass. With some point on the line(A) as centre, an arc is drawn to cut the line (at B as shown in Fig.6.79 (b)]
(a) (b)
Fig. 6.79
(c) AB is the required linesegment of given length.
(ii) To draw the perpendicular bisector of a given line segment AB .
Step 1: Radius equal to more than half the length of the given line segment is taken onthe compass. With A as centre, two arcs are drawn on the two sides of AB[as shown in Fig. 6.80]

76
Notes
Shapes and Spatial Understanding
Diploma in Elementary Education (D.El.Ed)
Step 2: With B as centre and with the same radius as taken in step-1, two more arcsare drawn to cut the arcs drawn earlier.
Fig. 6.80
Step 3: A line is drawn joining the two points of intersections of the arcs obtained instep-2. Let us name the line as PQ . PQ is the perpendicular bisector ofAB . O,the point of intersection of PQ and AB , is the mid-point of AB .
Examine what happens when the radius taken on the compass is exactly halfor less than half of the length of AB .
(iii) (a) To draw a line perpendicular to a given line at a given point on thegiven line :
To draw a line perpendicular to AB atat a point P on it:
Step 1: With P as centre and with a suitable radius an arc is drawn to cut the line ABat 2 points. Name the points as M and N.
Fig. 6.81
Step 2: With a radius greater than the radius taken in step-1, two arcs are drawnsuccessively with M and N as centres so that those arcs intersect each other
on one side of the line AB . Name the point as K.
Step 3: Draw the line PK . PK is the required line such that ABPK .
Q

77
Shapes and Spatial Understanding
Notes
Block 2 : Enriching Contents and Methodology
(iii) (b) To draw a line perpendicular to a given line at a given point outsideof it :
To draw a line perpendicular to AB through a point P outside of it.
AB is a given line and P is a point outside AB .Step 1: With P as centre and with a suitable radius an arc is drawn to cut AB at 2
points. Name the points as M and N.
Fig. 6.82
Step 2: With M and N as centres and with a radius greater than half of MN, arcs arcdrawn to cut each other on one side of AB (opposite to the side where Plies). Name the point of intersection as K. Draw the line PK .
PK is the line perpendicular to AB and passes through the point P..
(iii) (c) To draw a line parallel to a given line through a given point outsideit.
To draw a line parallel to AB through P..
RS is the line required to be drawn parallel to AB .
MN is any line drawn through P intersecting AB at T.T.
As alternate angles ATPmSPTm .
Fig. 6.83(a) Fig. 6.83 (b)

78
Notes
Shapes and Spatial Understanding
Diploma in Elementary Education (D.El.Ed)
Fig. 6.83 (c)
Step 1: Any line MN is drawn through P which intersects AB at some point. Thepoint of intersection is named as T.
Step 2: An angle, equal in measure to BTN is drawn on PR at P. following thesteps discussed in construction (iii).
Thus we get a line through P parallel to AB . The line, named as RS , is therequired line.
To draw a line parallel to a given line at a given distance from it.
AB is the given line. To draw line parallel to AB at a given distance (say 5 cm)from it.
Step 1: A point is taken on AB . Name the point as P. At P a line is drawnperpendicular to AB following the process discussed in iv (a) above. Nameit as PQ .
(a) (b)
Fig. 6.84
Step 2: Taking a radius of 5 cm, draw an arc with P as centre such that it cuts PQ .Name the point as R.
Step 3: Draw an angle equal in measure to RPB at R on RP following the method
discussed in C (iii) such that it become alternate to RPB .Extend the arm

79
Shapes and Spatial Understanding
Notes
Block 2 : Enriching Contents and Methodology
of the angle drawn. It gives you the required line parallel to AB at a given
distance (5cm) from AB .
(iv) To draw an angle equal in measure to a given angle at a given point on agiven line.
ABC is the given angle and PQ is a given line.
(a) (b) (c)
Fig. 6.85
To draw an angle equal to ABC at P on another line PQ :
Step-1: With some radius taken on the compass, an arc is drawn with B as centre sothat the arc cuts BA and BC . Name the points of intersection as M and Nrespectively (Fig.6.85a).
Also draw an arc of the same radius as above with P as centre so that the arccuts PQ . Name the point of intersection as R (as shown in Fig.6.85b).
Step-2: Take the distance between M and N as radius on the compass and with R ascentre, draw an arc to cut the arc drawn in step-1. Name the point ofintersection as S (Fig.6.85c)
Step-3: Draw the ray PS . SPR is the required angle which is equal in measure toABC .
(v) To draw the bisector of a given angle:
ABC is the given angle. To draw the bisector of it.
(a) (b) (c)
Fig. 6.86

80
Notes
Shapes and Spatial Understanding
Diploma in Elementary Education (D.El.Ed)
Step- 1: An arc is drawn with B as centre and with a suitable radius so that if cuts thearms BA and BC of ABC . The points of intersection be named as Pand Q.
Step- 2: Arcs are drawn with P and Q as centers and with radius equal to greaterthan half of PQ, so that the arcs intersect each other. Name the point ofintersection as R.
Step-3: The ray BR is drawn. BR is the bisector of ABC . ThusCBRmABRm
(vi) To draws angles of specific measure (Angles of measure 60°, its multiplesand submultiples)
(a) To draw angle measuring 60°.
AB is a given ray. To draw an angle measuring 60° at A on AB .
Step-1: With A as centre and with a suitable radius an arc is drawn so that it cutsAB . Name the point of intersection as P..
(a) (b) (c)
Fig. 6.87
Step-2: With P as centre and with the same radius as taken in step-1, an arc isdrawn to cut the arc drawn in step-1. Name the point of intersection as Q.
Step-3: The ray AQ is drawn. QAB is the required angle which measures 600.
(a) To draw an angle of measure 120°.
Step-1: A ray is drawn and named as AB . An arc of a suitable radius is drawn withA as centre such that it cuts AB and point of intersection is named as P..
(a) (b) (c)
Fig. 6.88

81
Shapes and Spatial Understanding
Notes
Block 2 : Enriching Contents and Methodology
Step-2: An arc of the same radius as before is drawn with P as centre so that it cutsthe arc drawn in step-1 and the point of intersection is named as Q.Anotherarc is drawn with Q as centre so that it cuts the arc drawn is step-1 and thepoint of intersection is named as R.
Step-3: Ray AR is drawn. RAB is the required angle and it is of measure 120°.(b) To draw an angle of measure 90°:Step-1: We draw the figure as shown in Fig. 6.89.
Fig. 6.89
Step-3: Draw the bisector of RAQ . Name the bisector as AS. SAB is therequired angle which measures 90°. Angle of measure 45° can also beobtained by bisecting an angle of measure 90°.
To draw an angle of measure 22½ we draw an angle of measure 45° andthen bisect it.
E 11State how can you draw an angle measuring (a) 30°, (b) 15°, (c) 105°.
(vii) To divide a given line segment into any number of parts of equal length :AB is a given line segment and it is to be divided into 3 parts of equal length.X
Step-1: With one of its ends (say A) as origin we draw a ray not coinciding with it.Thus AX is drawn.
(a) (b)
Fig. 6.90

82
Notes
Shapes and Spatial Understanding
Diploma in Elementary Education (D.El.Ed)
Step-2: Ray BY is drawn at parallel to AX by drawing ABY equal in measure toBAX .
Step-3: Draw an arc of a suitable radius with A as centre which cuts AX . Name thepoint as P. Again with P as centre and with the same radius draw an arc to cut
AX . Name the point as Q. Thus we get 2 equal divisions AP and PQ. (i.e,.1 less than the number equal parts into which AB is to be divided).With thesame radius cut off equal division an BY and name the points of intersectionas P1 and Q1. [as shown in Fig. 6.90(c)]
Step-4: Name the points where 1QP and 1PQ cut AB as C and D respectively [as
in Fig- 6.101 (c)] . Thus AB is divided at C and D into 3 equal parts.
Fig. 6.90 (c)
Check your progress.
E12 Into how many parts of equal length can a line segment be divided by drawingthe perpendicular bisector of the line segment?
E13 Can you use perpendicular bisector method to divide a given line segment into-
(a) 4 parts of equal length ?
(b) 8 parts of equal length ?
(c) 12 parts of equal length ?
(VIII) (a) Construction of triangles:When one acquires the understanding and skillsof constructing line segments, and angles of specific measures, he/she can draw thetriangles using only ruler and compass.
Minimum data required for constructing a triangle:Out of 3 sides and 3 anglescontained in a triangle, the triangle can be constructed when any of the followingconditions are given.

83
Shapes and Spatial Understanding
Notes
Block 2 : Enriching Contents and Methodology
(a) lengths of three sides (S-S-S),
(b) lengths of any two sides and measure of their included angle (S-A-S),
(c) lengths of any two sides and measure of any one angle (S-S-A),
(d) measures of any two angles and the length of one side (A-S-A) or (A-A-S)
You can observe that in all the above conditions of drawing a triangle you require atleast three measures. Through manipulation of these constructions you can drawseveral triangles.
ACTIVITY
State the procedure how to construct a right angled triangle when the lengthsof any two of its sides are given.
(b) Construction of quadrilaterals: Once you know the construction of differenttriangles, it would not be difficult to construct the quadrilaterals. This is because of thefact that every quadrilateral is divided into two triangles by each of its two diagonals.Therefore, while constructing a quadrilateral first you have to complete constructing itscomponent triangle and then complete the quadrilateral.
Fig. 6.91
As for example, when the lengths of the four sides of the quadrilateral ABCD and thelength of AC, one of its diagonals are given, you can draw any of the two triangles, saythe triangle ABC and then complete the triangle ADC . Thus, you have completedtheconstruction of the required quadrilateral.
Similarly, you can undertake the construction of other variations of the quadrilaterals.
E14 Under which of the following conditions, construction of quadrilateral is possible?(a) lengths of four sides are given,(b) lengths of two diagonals of a rhombus are given,(c) measures of 2 angles and lengths of 3 sides are given,(d) lengths of two adjacent sides of a parallelogram and measure of any one of
its angles are given.

84
Notes
Shapes and Spatial Understanding
Diploma in Elementary Education (D.El.Ed)
6.6 LET US SUM UPPoint, line and plane are thethree undefined terms in the plane-geometry.
Line-segment, ray, angle, triangle, quadrilateral etc. are basic terms that are definedusing undefined terms.
Adjacent angles, complementary angles, supplementary angles, vertically oppositeangles are different examples of paired angles.
Triangles areclassified in respect of (a) the relative measure of sides: Isoscelestriangle, equilateral triangle and scalene triangle, (b) the angle-measure: Acuteangled, right angled and obtuse angled triangles. Sum of the three angles of atriangle is 1800.
In case of a triangle (a) Perimeter = sum the lengths of the 3 sides, and (b) Area= ½ base × height.
Trapezium, parallelogram, rectangle, rhombus and square are the different kindsof quadrilaterals.Sum of the measures of all 4 angles of a quadrilateral is 3600.
A circle is defined as a collection of points in a plane such that each of them lies ata fixed distance from a fixed point in the same plane. The fixed point is known asthe centre of the circle and the distance between the centre and any point on thecircle is the radius of the circle.
The linesegment joining any two points taken on a circle is a chord of it.Each ofthe two parts into which a circular region is divided by a chord, is known as asegment of the circle.
Angles inscribed in an arc of a circle are of equal measure.Angle in a semicircle isa right angle.
The angle made by the radii drawn at the end points of a minor arc is known asthe angle subtended by the arc at the centre.The degree measure of a minor arcis the measures of the angle subtended by the arc at the centre.
Sum of the measures of the opposite angles of a cyclic quadrilateral is 1800.
Line-segments of equal length are congruent while angles of equal measuresarecongruent.Under different conditions (such as S-A-S, S-S-S, A-S-A andRHS) triangles can be congruent.
Congruent figures are similar but the reverse is always not true.Areas of twosimilar triangles are proportional to the squares of their corresponding sides.
Concept of reflection in geometry is similar to the reflection in mirror. Reflectionscreate symmetry in figures.
85
Shapes and Spatial Understanding
Notes
Block 2 : Enriching Contents and Methodology
Using the formulae for calculating area of plane figures, the surface areas of the3-D shapes like cuboid, cube, cylinders, cone, prism and pyramid can becalculated.
Using only ruler compass, the following basic geometrical figures can beconstructed :
(i) A line segment of a given length.
(ii) The perpendicular bisector of a given linesegment.
(iii) A circle of a given radius.
(iv) An angle equal in measure to a given angle at a given point and on a givenray.
(v) A line parallel/perpendicular to a given .
(vi) Bisector of a given angle.
(vii) Angles of measure 60°, its multiples and submultiples
(viii) Closed geometrical figures like triangles and quadrilateral and circles.
6.7 CHECK YOUR PROGRESSE1. 92½°
E2. 108°, 108°, 72°
E3. (i) ,, CDSACQ (ii) ,CDR,PCD (iii) ,CDR,QCD
E4. a = c = f = h = 1450, e = d = b= 350
E5. (a) rhombus, (b) centre, (c) 320, (d)1800
E6. (a) Length, (b) Measures, (c) Corresponding (d) shape
E7. PR = 12 cm,
E8. ABC : 9:4 PQR
E9. 63 cm
E10. The ratio of the volumes will be 3 : 2 .
E11. (a) By drawing the bisector of the angle measuring 60°,
(b) By drawing the bisector of the angle measuring 30°,

86
Notes
Shapes and Spatial Understanding
Diploma in Elementary Education (D.El.Ed)
(c) By constructing 90 , 120 ,ABC CBD then drawing BE, thebisector of ABD , Measure of EBC = 105°.
E12. 2 equal parts.
E13. (a) yes, (b) yes, (c) no.
E14. (a) No, (b) Yes, (c) No, (d) Yes.
6.8 SUGGESTED READINGS & REFERENCESMathematics Textbooks for classes V to VIII developed by NCERT.
6.9 UNIT END EXERCISE1. Using ruler and compasses, draw the shape
shown in the figure along side with the followingmeasurements.
AP = 3cm, BP = 4cm, BC = 7cm, PQ = 5cm,QD = 2cm, ADBP and ADCQ .Complete a figure which has line symmetry with
AD as the line of symmetry..
2. In the diagram along side
AC = BD = PF = DE = 8 cm., , ,ABC BCD CDA BDE and
BPC each is a right angle.
Fig. 6.93
Using setsquare and scale, draw the shape with the measurements given. Calculateand compare the areas of the shaded regions separated by APD .
Fig. 6.92

87
Shapes and Spatial Understanding
Notes
Block 2 : Enriching Contents and Methodology
3. Fill in the blanks in the table below.
Shape Centre of rotation Order of symmetry
Rhombus
Equilateral triangle
Regular hexagon
Square
4. Take a piece of wire of length 20cm. Bend it into shapes of rectangles of differentlength as indicated in the table below. Determine the area enclosed in each caseand complete the table.
Rectangle of length Breadth Area
8cm
7cm
6cm
5cm
5. Three measures are given in each of the sets below. Which of them can be takenas the lengths of 3 sides to construct a triangle ?
(a) 5.5cm, 6.8 cm and 7.2cm
(b) 4.7cm, 5.3cm and 10.0cm
(c) 8.0cm, 7.5cm and 9.2cm
(d) 5.8cm, 12.2 cm and 6.0cm
6. To construct an angle of measure 52.5° using ruler and compasses, what shouldbe the breakup of the given measure?

88
Notes
Measures and Measurements
Diploma in Elementary Education (D.El.Ed)
UNIT 7 MEASURES AND MEASUREMENTS
Structure
7.0 Introduction
7.1 Learning Objectives
7.2 Concept of Measurement and Measures
7.3 Non-standard and Standard Measures
7.3.1 Measuring Length
7.3.2 Measuring Area
7.3.3 Measuring Volume
7.3.4 Measuring Weight
7.4 Metric System of Measurement
7.5 Measurement of Time
7.6 Let Us Sum up
7.7 Model Answers to Check Your Progress
7.8 Suggested Readings and References
7.9 Unit-End Exercise
7.0 INTRODUCTION
We have already discussed in the previous unit that every physical object that we seearound us has two characteristics. Those are the shape and the size. Shape speaks ofwhat the figure or object looks like. We say, “The figure looks like a circle”. The termcircle here speaks of the shape. Similarly when we see a sculpture made of stone infront of a temple, we say, “It is a stone-made lion”. The term ‘lion’ here speaks of theshape of the object that we see.
But when we say that the square drawn on the page is too big, the term ‘big’ speaks ofthe size. The light house, made long back near the sea shore, is quite high. Here, ‘quitehigh’ speaks of the size of the light house.
Let us see the statement below:
“Between the two jokers playing in the circus one is too bulky and the other one is tooshort”.

89
Measures and Measurements
Notes
Block 2 : Enriching Contents and Methodology
Can we say the extent of shortness of the joker?
Can we say the extent to which the joker is bulky?
We cannot say exactly.
The characteristic of an object that helps us knowing the bigness or the smallnessof it is the measure of it.
Similar characteristics of different objects have a certain measure and othercharacteristics, not similar to the characteristics spoken of earlier have a differentmeasure. For example, how much space a figure covers on a plane is its area measure,whereas how much water a solid body displaces when submersed in a vessel containingwater, speaks of its volume-measure.
In this unit we shall be discussing about various types of measures, the units and scalesof those measures and the process of measuring different aspects of physical objectsand some common phenomena.
For completing the study of this unit you will need about 7 (seven) hours.
7.1 LEARNING OBJECTIVES
After studying this unit, you will be able to
● know different units of measurement of different aspects of objects and processes.
● using units of different measures in your daily life activities.
● make calculations relating to length, area, volume, capacity, weight, and time.
7.2 CONCEPT OF MEASUREMENT ANDMEASURES
Everyone is familiar with measurement. In our daily life, we are required to measuresomething or other. For instance, the length of the cloth required to make a shirt, theweight of vegetables or groceries required to be purchased from the daily market,amount of water one drinks per day, the height and weight of the children in a class, thesize of the classroom or our bedroom, the area of the school garden, the time yourequire to reach school from your home, your body temperature, etc. In all such caseswe are to measure something. In all these situations, measurement means to expressthe attribute in terms of a quantity comparable to a unit. In other words, measurementis quantification of the size or some definite aspects of the size of an object like length,area and volume. Measurement is an application of numbers and helps children to seethat mathematics is useful in everyday life, and to develop many mathematical conceptsand skills.

90
Notes
Measures and Measurements
Diploma in Elementary Education (D.El.Ed)
Children in primary school need to learn about several kinds of measure. Length, area,volume, time are some important measures that are included in elementary schoolcurriculum. But for a child of 7 to 9 years, these appear to be quite abstract. Therefore,as a teacher you need to make child familiar with these concepts.
A child, from the beginning of experiencing the world, is familiar with the 3-Dimensional(3-D) solid objects like fruits, toys, coloured blocks, cubes, rectangular solids, matchbox, cylindrical solids such as chalk sticks, rollers etc. By handling the 3-D objects,the child gains ideas about the 2-dimensional (2-D) figures. As for example, playingwith cubes or handling match boxes or drawing the diagrams of these objects on apaper (a 2-D object), he/she recognizes the surfaces of these solids to be plane figureswhich can be spread on a surface of a table or on a paper. Either observing thesurfaces of the 3-D objects or their representation on 2-D planes (like drawing thefigures of 3-D objects on a plane like paper or wall or floor), the child experiences thefeatures of 2-D objects. Further, observing the edges of 3-D solids and the sides ofthe 2-D figures, and from some common objects like thin threads and wires onegathers the experience of 1-Dimension.
Engaging children in activities like sorting different common objects into groups anddrawing the figures of 3-D and 2-D objects, you can help them in strengthening theirconceptions of the dimensions of the objects. From such activities, they willconceptualize that with 1-dimensional objects only one number i.e. length is associated,with 2-dimensional objects two numbers i.e. length and breadth are associated andwith 3- dimensional objects length, breadth, and height (or thickness) are associated.Involving children on such activities with several variations with different shapes andsizes, developing understanding of the notions of length, area, volume and theirmeasurement becomes easier.
The following are the measures that commonly used and the child in the elementaryschool can experience through different activities and from the real life experiences. Inthe next section, we shall be discussing these measures in detail.
1. Distance measure: Length, breadth, height, radius are all distance measures.Each of them represents the distance between two specific points.
L ML M
L M
(a) (b) (c)
Fig. 7.1
We see three blocks of wood in the Fig.7.1. Each of them has 2 end (L, M).There is some distance between the two ends. It can be seen that the distancebetween the two ends of the block in (b) is more than the distance between thetwo ends of each of the other two.

91
Measures and Measurements
Notes
Block 2 : Enriching Contents and Methodology
Thus the distance between the two ends of the blocks is a common characteristicof the blocks. This is known as the length-measure.
2. Area - measure: Each 2-D shape encloses some region on a plane. The measureof enclosed region is known as the area-measure.
(a) (b) (c)
Fig. 7.2
Each of the figures above encloses a part of the page of paper. Thus each 2-Dshape has an area measure.
3. Volume–measure: 3-D bodies occupy a portion of the space. The extent ofspace occupied by a 3-D body is its volume-measure. A 3-D body (not solublein water) displaces a certain quantity of water when submersed in it. The quantityof water it displaces is known as the volume-measure.
4. Weight – measure: When we carry a body or lift it above the ground, in case ofsome, we are not to strain too much, whereas in case of some others, it strains ustoo much. 3-D bodies also show a force with which those are pulled towards theearth. The bigness or the smallness of the pull of the earth on 3-D bodies representstheir weight-measure. The characteristic of the body that gives the feeling ofheaviness speaks of the weight-measure.
5. Time – measure: When did an event happen during the day? How long do wetake to complete a work? To answer such question we need to be acquaintedwith the time measure.
Measurement as comparison of two similar entities:
● Naresh was helping his students in classVI in preparing a plot in the school garden.While demarcating the boundary of the plot the group decided to carve out arectangular plot from the school premises that the longer side would be twice inlength than the shorter side. While some students were searching for a measuringdevice, Nitin took a stick of two cubits long and took two stick lengths on oneside and took four stick lengths on the adjacent side and completed the plot.
● It was Monday and it was the turn of students of classV of the school to bringdrinking water from the nearby tube well and fill up the storage container. Theywere given only one small bucket to fill the container. They found that the containerwas completely filled with 18 buckets of water.
Let us examine the above two examples of measurement. In the first example, a stickwas used to decide the measure the lengths of the sides of a plot of land. In other

92
Notes
Measures and Measurements
Diploma in Elementary Education (D.El.Ed)
words, the lengths of sides were compared with that of the stick and the specificationthat one side would be twice in length of the adjacent side was duly met. In the secondexample, the capacity of the container was compared with that of the given bucket.Can you use bucket as a measure of the length of the side of the plot or the stick tomeasure the capacity of the container?
From these examples you can realize that measurement is a process of comparisonbetween two similar entities. The length or breath of the plot can be measured byanother object known to have some definite length like a meter scale, or a stick of adefinite length. Similarly the volume of the container can be measured by comparing itwith another known measure of volume like a liter can or a bottle or bucket withknown capacity. Since meter scale and the liter can are not similar measures, theycannot be used interchangeably.
Comparison of two similar entities can be done using any one or more than one of thefive methods usually employed for the purpose. These are:
a. By observation.
b. By superimposition,
c. By indirect methods,
d. Using non-standard units, and
e. Using standard units.
The last two methods will be discussed separately in the next units. Let us see how wecan use the first three methods for comparing two similar entities for measurementpurposes.
You can try this activity with children in class I or II. Give them 10 coloured sticks ofdifferent lengths and ask them to arrange them in increasing order of their lengths. Youwill find that most of them arrange them by simply comparing them as to which oneappears to be longer and which one appears to be shorter. Similarly you can showthem five pebbles of different sizes and ask them to arrange them in order of theirheaviness- the heaviest of them to be placed first and the lightest in the last place. Youwill find how quickly and how easily they can complete task correctly. These aresimple examples of measuring by observation.
In a class the teacher was showing two coloured ribbons, red one in the right handand green one in her left hand and asked children to point out the longer of the tworibbons. Some told the red ribbon is longer while some other pointed to the green oneto be longer. Mere observation could not produce the correct measure. Then theteacher asked, “How can you check which one is longer?” One student proposed tosuperimpose one on the other. When it was done, green ribbon was found to belonger than the red one.

93
Measures and Measurements
Notes
Block 2 : Enriching Contents and Methodology
There are situations where observation or superimposition cannot be employed forcomparison. For example, take a narrow glass and a wide glass of slightly differentheights ans ask whose capacity is more. One method may be filling up one of theglasses full with water and pour it into the second glass. If completely emptying the firstglass and it does not fill the second glass completely then we can conclude that thesecond glass has more capacity than the first one.
7.3 NON-STANDARD AND STANDARD MEASURES
Any sort of measure is always associated with a number, as numbers are the mediathrough which bigness or smallness is expressed. The number associated with a measurecomes out of a comparison. For example, to associate a number with the length of theblock shown in fig.6.1 (a) we need to compare the length of the block with the lengthof another body. Thus a specific length is chosen with which the length of the bodyunder observation is required to be compared. That specific length is known as theunit length. The ratio between the length of a body and the unit length is a numberwhich expresses the length of the body.
Similarly unit area, unit volume/capacity, and unit weight are also used to measurearea, volume/capacity and weight respectively. Each of these is taken as a unit ofmeasurement of the specific attribute. These units can be of different forms as per thesituation and requirement. This can be clearer from the following example:
A screen rod used to hang window-screen was broken and required a replacement tobe purchased from the market. What should you do so that you can get the rod of rightlength from the market? Possible actions are that
1. The broken rod can be taken to the shop and a new rod of equal length can bepurchased.
2. The length of the rod can be measured by using a stick and the new rod can bepurchased by using the stick for ascertaining the required length.
3. You can measure the rod by your foot and can determine how many ‘feet’ thelength of the rod is and accordingly you get the rod of equal length.
4. You can cut a thread equal in length of the rod and can procure a new rod of thelength of the thread.
5. You can use a meter scale to determine the required length of the rod.
The solutions provided in 2, 3, and 4 are situation or person specific and are subject tovary from person to person who uses these measures. These are examples of non-standard units of measurement the examples of which will be discussed for differentattributes in the next sections. In contrast to these measures, a meter scale is a standardmeasure used in almost all countries throughout the world. Any where the length of a

94
Notes
Measures and Measurements
Diploma in Elementary Education (D.El.Ed)
meter is fixed and does not depend on the person or situation or time. Hence, it is anexample of a standard unit of measuring length.
Standard units are comparatively easier to use as it is simple and is understood easilyby everybody throughout the world. The standard units, although do not have anystrong logical basis, have evolved through common acceptance and scientific refinementsover the ages. Thus these units have been nearly perfected for accurate measurements.Sub-units (e.g., centimeter and millimeter are sub-units of meter) and compound units(e.g., kilometer is a compound unit of meter) are well defined in most of the standardunits which are usually not available with non-standard units.
Non-standard units of measurements have been evolved to meet some immediate orsome local needs. If you are preparing a sweet dish, you do not always go for themeasures of rice, sugar and milk by the cooking manuals. By experience you can havehandful of rice, five spoonful sugar and two glasses of milk and yet the dish would beas tasteful as the dish prepared by following the accurate measures of those ingredients.These non-standard measures may work well for you, but may not be as useful foranother person who might have different measures fulfilling his/her requirements.
In a locality/community, some commonly agreed units are used to measure length,weight, area and volume since a long time. These are standardized units within thatlocality/community or culture. You will find such units in every culture. However, suchunits are confined to one culture and may not be intelligible in another culture.
ACTIVITY - 1
Prepare a list of non-standard units of measurement use in your locality,the equivalence of each with the respective standard units and the advantagesand limitations of those non-standard units for the people of your locality.
.....................................................................................................................
.....................................................................................................................
.....................................................................................................................
Check Your Progress
E1 State any three differences between standard and non-standard units ofmeasurement.
E2 What are the needs for the standard units of measurement?

95
Measures and Measurements
Notes
Block 2 : Enriching Contents and Methodology
ACTIVITY - 2
Use string to measure the distance around your wrist and neck. How manywrists make a neck? Compare your findings with those of your class mates.
.....................................................................................................................
.....................................................................................................................
.....................................................................................................................
ACTIVITY - 3
Draw several different rectangles on a squared paper. State a rule for findingthe area of a rectangle given its length and width.
.....................................................................................................................
.....................................................................................................................
.....................................................................................................................
In spite of the advantages of the standard units, at the beginning stage of learning tomeasure, the non-standard units need to be used. Because of the familiarity with thesetypes of units, the children would know the different ways of comparing and graduallybecome aware of the need of standard units.
There are mainly two categories of non-standard unit. One category of units variesaccording to person like the hand or cubit. You can try such units for measuring thelength of any object in the classroom (say the length of the table). You can ask thechildren to measure it by their hand with cubits and fingers as the unit of measurement.Record the length of the table so measured by different children in a tabular form.
Estimation and measurement: Ask the children to guess the length of any one edgeof the table in terms of the measure of hand or stick before they actually measure usingthe particular unit of measurement. Let them realize the accuracy of their guessing orestimating the size. They can be asked to estimate the height of a plant, the capacity ofa bucket in terms of the capacity of a given mug etc. How does estimation helps inmeasuring objects in the long run?
Estimation plays an important role in measurement. It helps in detecting and eliminatingthe errors committed by the child. By making estimation as a habit before measuringany attribute helps the child in choosing proper units, making mental comparisons of

96
Notes
Measures and Measurements
Diploma in Elementary Education (D.El.Ed)
the attributes with the chosen unit of measurement and thus makes the process andoutcome of the measurement more meaningful and accurate for the children.
Children could be asked to estimate the measures before they actually measure anyparticular attribute of the object of measurement because then they will understand thesignificance of the numbers that they obtain as the result of measurement. For example,if a child measures the length of a desk (which is actually 37cms ) to be 63 cms holdingthe meter scale in the opposite way, then he/she can immediately realize the mistakehad he/she earlier estimated its length to be around 40cms.
Check Your Progress
E3. State any two benefits of using non-standard units at the early stage of learning tomeasure.
E4. Give two instances when the ability to estimate the size is useful.
7.3.1 Measuring Length
As discussed earlier, learning to measure begins with measuring with familiar non-standard units. While children are engaged in measuring with non-standard units, theyshould be encouraged to estimate and to develop the skills of using the units properly.
Quite a large number of objects from the immediate environment of the child can beused as non-standard units of length like sticks, wires, threads, leaves, tendrils, papersetc . Most frequently the body parts are used as the non-standard units in everyculture throughout the world (see the box below). The names of these measures aredifferent as they are called in different languages.
Body parts used as non-standard units of length
Finger: the width across your first finger.
Hand: h- the width across your hand with your fingers together.
Cubit:::c length of your arm from the end of your middle finger to your elbow.
Pace: length of a step or stride.l.eide
Fathom:f distance from fingertips of left hand to right hand with arms outstretched.
Inch:in- distance from the tip of your thumb to the first knuckle.
(Diagram for each measure may be given for each measure 7.3)

97
Measures and Measurements
Notes
Block 2 : Enriching Contents and Methodology
In comparison with measurement of area and volume or capacity, the use of largenumber of non-standard units is much more and more frequent in the measurement oflength by all irrespective of age and education. The use of non-standard units at theearly stage of schooling is important for a number of reasons:
a. Objects that are familiar to children are used as non-standard units and as suchthey are not burdened with acquiring new names and terms while getting used tothe skills of measuring objects. Further, these units because of their familiaritywith children become more meaningful than the abstract units like centimeter, ormeter.
b. The non-standard units are more appropriate size of a unit ,for the first practicalmeasuring tasks that young children undertake. Centimeter may be too small andtherefore too numerous for the children to measure their familiar objects likelength of the desk, height of a friend.
c. The experience of measuring with non-standard units can encourage children tothe idea that scales can be invented for a particular measuring task when a standardscale is not available or when the standard scale is inappropriate.
d. Through using non-standard units children become aware of the need for astandard scale. For example, when they discover that the length of the table byusing their hand is around 2 cubits becomes one and half cubits when their teacheruses her hand to measure the same length. Measuring the length of various objectsaround using the body parts as measuring units by all children in the class mayhelp the children to realize that these units give different results when used tomeasure the length of a particular object by different persons. This realizationarouses the necessity for searching for a standard unit for measurement.
ACTIVITY - 4
List the materials available in the immediate environment which can beused as non-standard unit of measuring length.
.....................................................................................................................
.....................................................................................................................
.....................................................................................................................
Standard units of length: At the elementary school level, the standard units of lengththat are frequently used in mathematics text are meter, centimeter, millimeter andkilometer. At the initial stage, kilometer is a very long distance beyond the normalconception of the child. Therefore, at the stage of introduction of the standard units of

98
Notes
Measures and Measurements
Diploma in Elementary Education (D.El.Ed)
length, children should be made familiar with meter and its sub-units centimeter andmillimeter.
When and how to introduce the standard units of length to children?
Standard units like meter and centimeter should be introduced only when the childrenneed for a standard scale for measurement. At the first stage, provide sufficient scopefor children to practice with the non-standard units to develop the skills of measuringlength of different objects i.e. selecting a unit of measurement, comparing the length ofthe body with that of the unit length and expressing the result of comparison using thenumber and the unit like 3 cubits, 2 sticks, 5 paces etc.
In the second stage, when the children are skillful in measuring objects with non-standard units and realize that with these units it is not always possible to determine theexact measure of an object and feel troubled to decide which one is the correct measure,at that time non-standard units like the stick with a fixed length can be used. And whenthey are familiar with the use of stick to measure the length of different entities withvery near accuracy, as we have discussed in the earlier example, then the standardscale i.e. meter scale can be introduced. If we introduce the standard unit in thismanner, it would be quite meaningful for the children.
Measuring with a meter scale: While the children are practicing to measure with astick, you should ensure that one end of the stick coincides with one end of the objectbeing measured. In the measurement of the length of the desk, the stick should beplaced close to one of the edge (longer edge) of the desk and one end of the stickshould coincide with the beginning point of the edge being measured. A mark shouldbe given on the edge of the desk at the other end point of the stick. And after it thestick should be removed and placed coinciding the edge such that the beginning end ofthe stick should coincide with the mark that you have put on the edge of the desk andput a mark on the edge of the desk at the other end point of the stick. This processshould continue in succession till the total length of the edge is measured by the stick.The number of sticks covering the total length of the desk is the measurement of thelength of the desk. When the children are well conversant with this process, they arenow ready to use the standard meter scale.
(A diagram with two pictures may be given at this place depicting theabove mentioned process Fig. 7.4).

99
Measures and Measurements
Notes
Block 2 : Enriching Contents and Methodology
Measuring with a standard scale is nearly similar to the process just described above.Some additional care as suggested below need to be taken to enable the children tolearn using the scale correctly:
● Familiarizing children with the marking of sub-units on the scale. They needto be clear about the division marked on the scale at equal distances. On a meterscale, to begin with, they should be able to identify the centimeter marks. Afterthey become familiar with using centimeter in measuring length, they may beintroduced to meter and millimeter.
(Diagram of a meter scale with centimeters marked on oneof its edge to be given here Fig.7.5).
● Appropriately placing the scale with the object of measurement. Placing thescale correctly and closely alongside the object to be measured is very important.
■ Demonstrate to children to place the scale alongside the object so that the‘0’ mark of the scale coincide with one end/edge of the object. This is veryimportant for the beginners. They should also be shown how disturbing suchplacement may change the scale reading of the other end point of the object.
(At least 2 to 3 diagrams to be given here showing the correct coincidenceof the ‘0’ point with one end/edge of the object (preferably a pencil)
and incorrect placements away from ‘0’ point. Fig.7.6).

100
Notes
Measures and Measurements
Diploma in Elementary Education (D.El.Ed)
■ Allow the children to place the scale such that one end point of the objectcoincides with any point on the scale other than the ‘0’ point (say 1, 2, or 3)and mark the difference in the reading of the scale, coinciding with the otherend point of the object.
(appropriate diagram may be given here Fig. 7.7).
● Estimating the length before exactly determining it. As discussed earlier,always encourage children to estimate the length of the object being measuredbefore going to determine the exact length of the object using the standard scale.
● Correctly calculating the length. The children should be led through severalinstances of measuring different objects with a ruler or a scale to determine theexact length of the object they are measuring.
■ At first, when the child aligns the ‘0’ point of the scale with one end point ofthe object being measured, then the figure on the scale coinciding with theother end point of the object determines its length.
■ When the child aligns any point other than the ‘0’point (say 1, 2, or 3, etc.),then difference in readings on the scale at the two end points determines thelength of the scale.
■ While using a particular unit of length for the first time, for example, thecentimeter, the children should be provided with materials like wires, rods,sticks, paper strips etc whose length could be measured by complete units(i.e. 3cm, 5cm, 10cm etc.) without using any part of the unit. When theybecome competent in such measurements, they can be given objects wherethey can use the sub-units or parts of the unit (for example millimeters).
● Developing the measuring skills. Measuring with a standard scale requiressome basic skills like alignment of the scale with the object, taking correct readingsand calculating the differences of readings. None of these is a difficult skill toacquire, but children very often commit mistakes due to seer carelessness. Takingcare at the early stage would help the children in developing these skills withease.

101
Measures and Measurements
Notes
Block 2 : Enriching Contents and Methodology
● Choosing appropriate ruler or scale. Scales of different lengths and forms areavailable in market. Scales of 1meter, 30 centimeter and 15 centimeter lengthsare commonly available and used in the schools. Besides, children may be exposedto measuring tapes of different lengths used by carpenters and masons, iron rodsused in measuring clothes in shops and such other scales.
At the early stage of measuring length with standard units in the classroom, scales orrulers of 30 cm length would be handy for use by children as this scale would beappropriate for measuring most of the familiar objects around them. Scales or tapes oflarger lengths may be required, depending on the length of the objects to be measured.If the length of the classroom or verandah of the school is going to be measured meterscales of larger length need to be selected for use and when small lines drawn on thenote books or small objects are required to be measured, then scale of 15cm lengthwould be more appropriate.
Measuring lengths of objects is comparatively easier for children to understand and toperform. You can encourage children in this through different activities in and out ofclassrooms. Some such activities are as follows:
● Preparing non-standard scales using coloured sticks with equal parts markedwith contrast colours.
● Preparing centimeter scales of different measures like 10cm, 15 cm, 20 cm etc.with each centimeter portion of the strip coloured differently from the other.
● Demarcating play field for playing games like Kabdadi, Kho Kho, Badmintonetc.
● Participating in long jump, high jump, and measure distances or heights jumpedfor each jump.
● Drawing designs using straight lines of different lengths.
7.3.2 Measuring Area
Before going to measure the area of an object, let us see what is exactly meant byarea. We have seen that the measurement is done on a straight line segment. The linesegment which is one dimensional (1-D) could be represented by the edge of a table,a straight wire, lines in a map, a pencil etc. Now, let us consider the figures givenbelow:
(a) (b) (c) (d)
Fig. 7.8

102
Notes
Measures and Measurements
Diploma in Elementary Education (D.El.Ed)
With our knowledge of measuring length, which aspects/parts of the figures shownabove can we measure?
● “The lengths of the lines constituting the boundaries of the figures, of course.”
● “But do the lengths of the boundaries describe the shapes and sizes of the figures?”
The boundary of a figure tells about the shape of the figure, but is not sufficient to giveany idea of the size of the figure. As for example, compare the pairs of figures givenbelow:
(a) (b) (c)
Fig. 7.9
In each pair of figures, you can find striking similarity in their shapes.
“But what is the difference between the two figures in each pair?”
The two figures in each pair are similar in shapes but are not of same size. If you askchildren to identify the bigger of the two in each pair, nearly all of them can point to thebigger one correctly.
When a group of children were asked as to why they chose one to be bigger or largerthan the other, some of the responses were:
“One looks bigger than the other.”
“When I place one figure on the other, I can distinguish the larger one.”
“The one that covers more portion of the paper is the larger one.”
“One figure that spreads more on the table than the other is the bigger one.”
From the responses, it seems that the children could perceive correctly about thelargeness and smallness of figures and are very near to the idea of area.
Area is a characteristic of a plane figure. It is the spread of the figure on a plane orthe portion of the plane covered by the figure ; the plane may be a paper, the surfaceof a table or a glass plate or of some such objects.
But, difficulty arises when the children are asked to compare two different figureswhich are not similar like the two figures given below:
(a) (b)
Fig. 7.10

103
Measures and Measurements
Notes
Block 2 : Enriching Contents and Methodology
How to know which one of the above two figures has more space coverage or, to bespecific, has more area?
By superimposing one on the other, we cannot compare their areas as we did in casesof similar figures in the previous example. In such cases, it becomes necessary toestimate the area of each figure by using an object which can be considered to be theunit for measuring area. Let us take match boxes of a particular size and of a definitebrand (such a collection would have match boxes of nearly equal surface area). Nowplace the match boxes close to each other on the two figures such that there would beno gap or no overlapping in between the match boxes as shown below:
(a) (b)
Fig.7.11
You can see that the figure 7.11(a) is covered by 16 match boxes whereas the otherfigure is totally covered by 14 match boxes of same size. Therefore, you can now saywith reason that the figure 7.11(a) has more area than the figure 7.11(b). Besidescomparing the areas of the two figures, we could estimate the area of each figure withthe help of a smaller unit like the surface area of a match box.
Can you estimate the area of the following figures?
S
(a) (b) (c) (d) (e)
Fig.7.12
We cannot calculate the area of these figures as there is no region in the plane boundedby any of these figures. Unlike our concepts of closed figures like triangles, quadrilateralsor circles, these are open figures and do not enclose any region.
At the initial stage of learning area of a plane figures, you should use familiar materialslike match boxes of any particular brand, plastic squares of equal size, squares ofequal size cut out of coloured papers, the books or note books of same size. Some

104
Notes
Measures and Measurements
Diploma in Elementary Education (D.El.Ed)
activities of measuring with such objects that can be practiced in the classroom aregiven here:
● Covering the teacher’s table with note books of equal size and calculate howmany such note books are required for the purpose.
● Covering the top surface of the students’ desks by books of equal size.
● Covering the surface of a book or a note book with the match boxes (you canchange the style of placing the match box by changing the faces of the match boxand ask the students to calculate the number of match boxes required in eachcase).
● Decorating a portion of the classroom floor or wall with coloured papers of equalsize.
In estimating or comparing areas of plane figures we use smaller units like match boxesof same size such that the figures are entirely covered by the chosen unit. But whathappens when some portion of the figure remains uncovered by the unit of measurementi.e. the match box in our example. For this purpose, we follow a common practice i.e.if the portion of the figure is less than the half of one unit we do not take that portioninto calculation of area. And when the portion is equal to or more than half of the unit,then it is taken as a full unit for calculation of the area of the figure.
From the above discussion we can conclude that area relates to 2-D objects and tocompare or estimate the area of the closed figures, we fill up the figures with smallerunits in such a way that no unit should overlap another and no gap should be left inbetween. Several small plane objects of equal sizes can be used as estimating areameasure. In calculation of the area of a figure, the portions of the figure left out afterbeing covered by the full units of measurement are calculated as one unit if the portionis equal to half or more than half of a unit.
Standard Units of Area Measure: The area of a squareis considered suitable for any standard unit for measuringarea. As for example, a square, each side of which is oflength 1metre, is shown in Fig. 7.13.
Area of such a square is taken as 1 square meter anddenoted in symbol as 1 sq m, or 1m2.
Note: The area of 1metre-square is defined as 1m2.
If you are measuring area of your classroom, the surface area of the wall of yourschool, the area of a plot in the garden and such other large closed spaces, the unit of1sq m is the appropriate unit for measuring the areas.
But, for measuring small areas like the figures drawn on your note books, size of thepaper required for covering a book, or the size of your handkerchief, you need a
1m
1m
Fig. 7.13 A meter square

105
Measures and Measurements
Notes
Block 2 : Enriching Contents and Methodology
smaller unit of area as the unit of 1sq m would be too large to measure such smallareas. For those purposes 1sq cm or 1cm2 would be a befitting unit.
How to determine the areas of geometrical figures using standard units?
Observe the rectangular figure ABCD of length measuring 5cm and breadth 3 cm.Since the lengths of sides are measured in cm–scale, the appropriate unit of measuringarea in this case would be 1sq cm or 1cm2.
A D5cm
3cm
B C
Fig. 7.14
Let us arrange the pieces of square-size papers of area 1sq cm each without overlappingeach other nor would having any gap between them, then the picture wil be similar tothe Figure 7.14. It requires three rows with 5 small squares (1cm2 each) in each row.That means we require 15 small squares (5 small squares in each row × 3 rows) tocompletely cover the rectangle ABCD. Therefore, the area of the rectangle ABCD is15 time of the unit of 1sq cm or simply 15sq cm or 15 cm2.
The method of determining the area of a rectangular figure using 1cm2 as the unit canbe as follows:
In order to calculate the area of the rectangle ABCD (Fig.7.14), line- segments are
drawn parallel to AB and parallel to AD , such that the rectangle is divided into
centimeter-squares.
No. of squares in 1 row = 5 and no. of squares in 3 rows = 5 × 3 = 15
Thus we see that the area of a rectangle = no of units along its length × no. of unitsalong its breadth.
In short, we write:
Area of a rectangle = (l × b) cm2
Where ‘l’ represents the no. of units along the length and ‘b’ represents the no. ofunits along the breadth . In the above figure (Fig. 6.14), l = 5 (not 5cm) and b= 3(not 3 cm)
Hence, area of the rectangle ABCD = (l × b) cm2 = (5 × 3) cm2 = 15 cm2
Similarly, area of a square = (l × l) cm2

106
Notes
Measures and Measurements
Diploma in Elementary Education (D.El.Ed)
Check Your Progress:
E5. What is the area of each of the following figures where each small square representsthe area of 1cm2?
(a) (b) (c)
Areas of other geometrical shapes like triangle, quadrilaterals, and polygons arecalculated making use of the area-rule for a rectangle.
Area of Irregular Figures: For measuring area of irregular figures, you can usecentimeter graphs or centimeter thread graphs. Both of these work on same principle.Place the irregular figure, say a leaf, on the graph and draw the outline of the leaf on thegraph (or place the figure under the thread graph (Fig.7.15). To calculate the area ofthe leaf, count the squares covered in the outline of the leaf. If the outline of the leafcovers half the cell or more than the half, it should be taken as a full square. If it coversless than half of a square, then that square is not taken into account. The total numberof squares counted gives an approximate area of the figure in centimeter squares. Thisis a crude approximation. One of the best ways of finding the area of a irregular closedregion is to take the sum of the areas of very large number of vertical or horizontalrectangular strips partitioning the region.
(Please draw the picture as suggested).
Higher and lower area-units: ABCD is a metre-square (Fig. 7.16). It is dividedinto centi-metre-squares by drawing line segments parallel to AB and parallel to ADat intervals of 1cm.Thus there are 100 small squares along each of the sides ABand AD of ABCD.

107
Measures and Measurements
Notes
Block 2 : Enriching Contents and Methodology
∴ The total no. of small squares in ABCD = 100 × 100 = 10,000
Each small square is of area 1cm2 [as it is a centimeter-square]
Thus we see that 1m2 = 10,000cm2
Similarly, it can be proved that 1cm2 = (10 ×10) mm2 = 100 mm2
B C
A D
QP
M
K
N
1m
1m
Fig. 7.16
Land measure: Usually the standard unit of measuring area of land in the traditionalsystem of measurement is ‘Acre’.
In metric system, ‘Hectare’ is the unit of measuring area of land along with ‘Are’.hectare is equal 1hectare = 10,000m2 and 1 are = 100m2 . From these you cancalculate to find that 1 hectare = 100 are and 100 hectares = 1 km2
. Incidentally, 1hectare = 2.471 acres
7.3.3 Measuring Volume
We have so far discussed about measurement of 1-D (measurement of length), and2-D (measurement of length as well as area) objects. Let us discuss the measurementof different aspects of a 3-D object. Most of the objects around us have threedimensions – length, breadth and height or thickness. Name any object around you -be it a table, chair, desk, book, ball, bat, pencil, chalk- it must be a 3-D object andeach occupies some definite portion of the space.
The amount of space occupied by an object is the volume of that object.
How to determine the quantity of space occupied by an object? Before trying toanswer this question, first we should ensure whether children have grasped this senseof volume of an object by simple guessing through visual comparison of objects.
“Does a pencil occupy more space than a ruler?”
“Does a cricket ball occupy more space than a foot ball?”
“Does a piece of chalk occupy more space than a duster?”

108
Notes
Measures and Measurements
Diploma in Elementary Education (D.El.Ed)
“Does a mango occupy more space than a lemon?”
“Does a cow occupy more space than a buffalo?”
After you become sure that children can compare the objects, you can show themsome wooden blocks of cubes and cuboids as shown in the Fig 7.17 and ask them tocompare the volumes of these blocks.
(a) (b) (c)
Fig. 7.17
Here, the children face the difficulty to estimate the volumes of the blocks. For thisthey need to know the ways of determining the volume of an object.
As in the cases of length and area, the standard unit for measuring volume needs to beintroduced. Small unit of cube of 1cm× 1cm ×1cm is usually used as a standard unitfor volume measurement.
4cm
5cm
3cm
(a) (b)
Fig. 7.18
This unit cube with each edge measuring 1cm is called a centimeter cube (Fig.6.18a).Its volume is taken as one cubic centimeter and is denoted by 1cm3.
For measuring large objects, larger unit of volume like one cubic meter or 1m3 mayalso be used.
Let us see how we can measure the volume of a regular solid like a cuboid as shownin Fig. 6.18(b). As shown in the figure the cuboid is of 3cm× 4cm ×5 cm size. You can

109
Measures and Measurements
Notes
Block 2 : Enriching Contents and Methodology
observe that there are the cuboid consists of 5 slabs of 1cm thickness and in each slabthere are 3 rows with each row having 4 centimeter cubes. That means each slab has(4 × 3=) 12 cm cubes and in 5 slabs there are altogether 60 cm cubes. Hence thevolume of a (3cm × 4cm × 5cm) cuboid is 60 cubic cm or 60cm3.
From this example we may deduce that
The volume of a cuboid = (l × b × h) cubic units, where l= the length, b= thebreadth and h = the height of the cuboid.
In a cube, we know that l = b = h, hence the volume of a cube = l3 cubic units.
If we have solid objects in the form of cuboids or are regular 3-D objects, we cancalculate their volumes using or appropriately modifying the formula for determiningthe volume of a cuboid.
There is a common method of measuring volume of any solid object. This is derivedfrom the meaning of volume as the space occupied by the object. If you totally submergethe object in a liquid, it will displace equal volume of the liquid.
ACTIVITY - 5
Take a glass trough or a transparent plastic bucket and fill it with water.Mark the level of water on it. Then take piece of stone or pebble tied with athread and lower it inside water in the pot. Mark the level of water when theobject remains inside water (name it as w1). Take another bigger piece andsubmerge it in water inside the pot and mark the level of water in the pot(w2). Can you find the difference between levels of water (between w1 andw2)?
.....................................................................................................................
.....................................................................................................................
.....................................................................................................................
(Please give two diagrams as per the descriptiongiven in this activity)

110
Notes
Measures and Measurements
Diploma in Elementary Education (D.El.Ed)
Using this property, the volumes of solid objects are measured using cylindrical glassjars with calibration of volume expressed in cubic centimeter (cc). In this method, thecalibrated glass jar is filled with water or some other liquid to some extent and theinitial level of the liquid is noted. Then the object which volume is to be determined istotally submerged in the liquid and the level of the liquid in the jar is noted. The differencebetween the two levels gives the volume of the object.
The other way is to fill any vessel completely with water or any liquid in such a waythat any additional drop of the liquid will overflow out of the vessel. Then submergethe object into the liquid in the vessel and take care to collect every drop of the liquiddisplaced out of the vessel due to the submergence of the object. The volume of thedisplaced liquid is equal to the volume of the object.
Capacity and Volume: We discussed the ways to measure volume of the solid objectsby the method of submergence in liquid. But, this method cannot be used for measuringthe volume of liquids. Moreover, liquid substances have no definite shape. They takethe shape of the vessel in which they are kept. The capacity of a vessel or a containerrefers to the volume of liquid, or sand, or salt or some such substance that it can hold.If a bucket can be filled completely with 20 bottles (of equal size) of water, then thecapacity of the bucket is 20 such bottles of water. And if the capacity of each suchbottle is 1 liter, then the capacity of the bucket is 20 liters.
At the initial stage of learning, the children should be given a lot of opportunities to usenon-standard units of measuring capacities of different vessels. Some such activitiesthat can be conducted by children in and out of school are:
● Using cups to fill the tea pots /kettles, or any other pots used as utensils withwater.
● Filling pots with water using a fixed bottle.
● Filling drinking water storage in the school with water using a bucket.
● Filling sugar in the can using a small cup.
● Measuring sand with a tin can.
● Measuring volume of rice/paddy/wheat/any seeds with a small tin/plastic can.
While practicing with the non-standard units like spoon, cup, jug, tin can, plastic mugetc, always insist on the use of one measure in measuring a particular item. You can trydifferent cups to measure an amount of rice, and also measure the same amount of ricewith only one cup. You can find the difference in the two measures.
It is only when the children become quite adept in using non-standard units of measuringvolumes, then the standard units of cubic centimeter (cc) and liter can be meaningfullyintroduced. They may be familiarized with the devices used to measure oil in the retailgrocery shops.

111
Measures and Measurements
Notes
Block 2 : Enriching Contents and Methodology
The standard unit of measuring the liquid is a litre or liter. One litre is equal to 1000cubic centimeters or 1000 cm3.
E6. What is the standard unit that you will use while measuring the volume of a solid bymeasuring that of the displaced water by the solid?
E7. A water reservoir is 3 m long, 2 m broad and 1m high. How many litres of waterdoes it hold?
7.3.4 Measuring Weight
The children, from a very young age, are familiar with the process of weighing theobjects by experiencing heaviness of an object the activities in the market. The childmight have experienced the weighing of rice, vegetables, groceries and other fooditems using standard weights and common balance. But, at the beginning stage, childrenshould be familiarized with the process of weighing with a balance using non-standardweights like small stones, pieces of brick, wood, iron or any metal. At this stagechildren may be encouraged to perform the following activities:
● Preparing a model of common balance with a beam and two pans hangingfrom the two extremes of the beam: A thread is attached at the exact middlepoint of the beam. When equal weights are placed on the two pans the beamremains horizontal to the ground when it is raised with the thread at the middle ofthe beam.
● Weighing with non-standard units: Children should be encouraged to use theimprovised balance they have made in weighing different materials like sand,leaves, seeds, etc. with non-standard units. Through such activities, they woulddevelop the skills of using the balance properly in two main ways. First, theywould master the mechanics of the balance like properly lifting the balance, puttingthe weight and the things to be weighed in proper pans, and keeping the beamhorizontal by adjusting the materials being weighed. Second, using balance theycan divide and subdivide the materials into two, four or eight equal parts.
When they become well versed with using the improvised scales and non-standardweights, they will feel the need of a proper balance and the standard weights. As theygrow up, they should be exposed to different types of weighing devices like springbalance, electronic weighing machines, machines to weigh very small and very largeweights.
Gram and kilogram are commonly used units to measure weights of familiar objects.Children are more exposed to weighing vegetables and groceries in kilograms, half-kilogram (500grams) and quarter kilograms (250 grams).

112
Notes
Measures and Measurements
Diploma in Elementary Education (D.El.Ed)
7.4 METRIC SYSTEM OF MEASUREMENT
There are two major systems of standard measuring units used in different countries.These are the Metric System and the British or Imperial System. In every system thereare two types of measuring units – the base units and the derived units. The units forlength, mass, and time, ( along with those for temperature, electric current, luminousintensity and amount of substance) are called the base units because the units for othermeasures like area, volume, capacity, and velocity etc. can be expressed in terms ofthese base units. For example, the unit of area can be cm2, that of volume can be cm3
or that for velocity can be kilometer per hour (expressed shortly as km/hour). Usingthese base units of measurement, the Metric system is also called c-g-s (centimeter-gram-second) system or sometimes as m-k-s (meter-kilogram-second) system.Similarly, the British system is known as f-p-s (foot-pound-second) system.
Metric system is internationally accepted system and is known as ‘InternationalSystem of Units or SI Units’ (SI stands for the French version of the InternationalSystem of Units i.e. Système international d’unités). The SI includes two classesof units which are defined and agreed internationally. The first of these classes are theseven SI base units for length, mass, time, temperature, electric current, luminousintensity and amount of substance. The second of these are the SI derived units.These derived units are defined in terms of the seven base units. All other quantities(e.g. work, force, power) are expressed in terms of SI derived units.
In this section we shall be confining our discussion on the SI units of length, capacityand mass (commonly used as weight). The units of area and volume are closely associatedwith and are reported using the unit of length as indicated earlier in this unit. At times,we have tried to compare these measures with the corresponding units of traditionaland the British system as in some areas of measurement in our country those systemsare also used and makes sense to common people.
The History of Metric System
The Metric System was developed in France during the sixteenth and seventeenthcentury and Gabriel Mouton, the vicar of St. Paul’s Church in Lyons, France, isthe “founding father” of the metric system. He proposed a decimal system ofmeasurement in 1670.
In 1790, during the hectic period of the French Revolution, the National Assemblyof France requested the French Academy of Sciences to “deduce an invariablestandard for all the measures and all the weights.” The Commission appointed bythe Academy created a system that was, at once, simple and scientific.
● The unit of length was to be a portion of the Earth’s circumference.
● Measures for capacity (volume) and mass were to be derived from the unit oflength, thus relating the basic units of the system to each other and to nature.

113
Measures and Measurements
Notes
Block 2 : Enriching Contents and Methodology
● The larger and smaller multiples of each unit were to be created by multiplyingor dividing the basic units by 10 and its powers.
The Commission assigned the name “metre” (in the U.S. spelled “meter”) to theunit of length. This name was derived from the Greek word, metron, meaning “ameasure.” The physical standard representing the meter was to be constructedso that it would equal one ten-millionth of the distance from the North Pole tothe equator along the meridian running near Dunkirk on English Channelin France and Barcelona in Spain.
A surveying team under the direction of two men, Pierre-Francois-Andre Mechainand Jean- Baptiste-Joseph Delambre, spent 6 years in measuring the “arc” thatthe earth made in a line between Dunkirk in France on the English Channel andBarcelona in Spain. The surveyors underwent much harassment and even werejailed, at times, while making their measurements, because some of the citizensand area officials resented their presence and felt they were up to no good. It waslater found that Delambre and Mechain had not properly accounted for the earth’sflattening in correcting for oblateness. However, the meter remains the invariablestandard for the metric system, and its length has not changed even though theofficial expression of the definition the meter has changed several times to improvethe accuracy of its measurement.
Meanwhile, scientists were given the task of determining the other units, all ofwhich had to be based upon the meter.
The initial metric unit of mass, the “gram,” was defined as the mass of one cubiccentimeter ( a cube that is 0.01 meter on each side) of water at its temperature ofmaximum density (about 40C). For capacity, the “litre” (spelled “liter” in the U.S.)was defined as the volume of a cubic decimeter — a cube 0.1 meter on eachside.
After the units were determined, the metric system underwent many periods offavor and disfavor in France. Napoleon once banned its use. However, the metricsystem was officially adopted by the French government on 7 April 1795. Ascientific conference was held from 1798 to 1799 (with representatives from theNetherlands, Switzerland, Denmark, Spain, and Italy) to validate the metricsystem’s foundation and to design prototype standards. Permanent standards forthe meter and the kilogram were made from platinum. These standards becameofficial in France by an act of 10 December 1799.
Although the metric system was not accepted with enthusiasm at first, adoptionby other nations occurred steadily after France made its use compulsory in 1840.Most of the countries around the world adopted this system around 1950 and1960’s. There are a few countries including U.S.A. which have not adopted themetric system as yet.
The metric system in weights and measures was adopted by the Indian Parliamentin December 1956 with the Standards of Weights and Measures Act, whichtook effect from October 1, 1958.

114
Notes
Measures and Measurements
Diploma in Elementary Education (D.El.Ed)
The Units in the Metric System: In metric system, the sub-units (smaller units) are
taken as 100
1,
10
1 etc. of the unit and the super-units (higher units) are taken as 10
times, 100 times etc. of the basic unit. This makes the calculations convenient.
The system is as follows:
Kilo unit = 1000 units
Hecto unit = 100 units
Higher Units Deca unit = 10 units
Unit
Sub-Units Deci unit =10
1 units
Centi unit =100
1 units
Milli unit =1000
1 units
Let us see how this structure of the metric units are uniformly used in defining the unitsof measurement in length, capacity and mass (or weight)
Unit for Length Measure: Unit of length measure the metric system is metre ormeter.
Kilo metre (km) = 1000 m
Higher Units Hecto metre (hm) = 100 m
Deca metre (dam) = 10 m
Unit : Metre (m)
Sub-Units Deci metre (dm) =10
1 m
Centi metre =100
1 m
Milli metre =1000
1 m
From among these, kilometer, metre, and centimetre are frequently used in measurementof lengths of varying distances and commonly understood.

115
Measures and Measurements
Notes
Block 2 : Enriching Contents and Methodology
Although metric system has been adopted in our country since 1958, yet the unit oflength like inch (=2.54 cm), foot (=12 inch) and yard (=3 feet) are still used in severalevents of measurement like in land measurement and also by tailors for measuringcloth for making dress.
Units for capacity measure: It is a common experience that liquid has no shape. Ittakes the shape of the container in which it is kept. Thus for deciding the unit formeasuring the quantity of liquid we either use weight measure unit or we use volumemeasure unit.
Litre is the unit of capacity measure (i.e., volume-measure).
The volume-unit is known as 1 litre (equal to 1000 cm3). Different containers aremade of different capacity measures.
Kilo litre (kl) = 1000 l
Higher Units Hecto litre (hl) = 100 l
Deca litre (dal) = 10 l
Unit: Litre (l)
Sub-Units Deci litre (dl) =10
1 l
Centi litre (cl) =100
1l
Milli litre (ml) =1000
1l
Litre is the most frequently used unit to measure the liquid substances like milk, waterand oils
Units for measure of Mass (Weight): The basic unit is gram. Other higher andsub-units are given below.
Kilogram (kg) = 1000gm
Higher Units Hectogram (hm) = 100g
Decagram (dag) = 10g
Unit: Gram (g)
Lower Units Decigram (dg) = 10
1g
Centigram (cg) = 100
1g
Milligram (mg) =1000
1 g

116
Notes
Measures and Measurements
Diploma in Elementary Education (D.El.Ed)
From among these, kilogram, gram and milligram are commonly used.
Besides these units of mass, ‘quintal’ and ‘metric ton’ are used to weigh very heavymaterials. One quintal is equal to 100 kilograms and 1 Ton = 1000 kg or 10 quintals.
Check Your Progress:
E8. State the major advantage of the Metric system over the British system ofmeasurement.
E9. If 1 kg of rice costs Rs.25, what is price of 5 quintals? If this quantity of rice ispacked in smaller packets each containing 20kg, how many packets can bemade?
7.5 MEASUREMENT OF TIME
Time-measure is related to the revolution of the earth about its axes and rotation of theearth around the sun.
The duration between two consecutive sunrises is commonly known as a day. But thescientists count a day as the duration between two consecutive mid-nights. Thus, aday starts at a mid-night and ends at the next midnight. This duration is known as asolar-day.
A solar day is the time which the earth takes to rotate once about its axis.
A complete rotation in degree- measure system, has a measure of 360 degrees.
To bring in coherence between the time-measure and degree measure (as these areboth related to rotation), unit divisions are made on the basis of sub-multiples of 360.
Thus, the duration of a solar day is divided into 24 equal divisions and each division isknown as an hour. 1 hour = 60 minutes and 1 minute has been taken to have 60seconds.
Thus :
1 solar day = 24 hours
1 hr = 60 minutes
1 minute = 60 seconds.
Solar year : The duration in which the earth completes one rotation about thesun is known as a
Relation between a solar year and a solar-day.
1 solar year = 365 days 5 hours 48 minutes 47 secondsRoughly, 1 solar year = 365¼ days

117
Measures and Measurements
Notes
Block 2 : Enriching Contents and Methodology
A calendar year is taken to have 365 days
Thus every year we lose about 6 hrs i.e., ¼ of a day.
Hence in 4 years we lose 1 day. To make it up, in every 4 years, one year is taken tohave 366 days and this year is known as a leap year.
The year number which is divisible by 4 is a leap year and the month of February istaken to have 29 days instead of 28 as in case of other years. So in a calendar, wehave 31 days in each of the moths of January, March, May, July, August, October andDecember; 30 days in each of the moths of April, June, September and November,28 days in February with one extra day (i.e. 29 days) in every leap year. The childrencan easily remember the days of the calendar months in different ways. Singing a songon the months may be one interesting way.
A Song of the Months
Thirty days hath September
April, June and November
All the rest have thirty one
Except for February alone
And that has twenty-eight days clear
And twenty-nine in each leap year
Exceptions :
The year numbers that have zeroes at the ten’s place and unit’s placeand are merelydivisible by 4 only are not leap years. But from among them which are multiples of 400are leap years.
Thus, 2000 was a leap year, whereas 1900, 1800, 2100, 2200, 2300 etc. are notleap years.
Clock time : There are two types of clock: 12 hour-clock and 24 hour-clock.
● Ordinarily we use 12 hour- clocks. In such a clock, the numbering of hours onthe dial of the clock are limited within 1 to 24. The hour hand rotates once overthe clock-face in 12 hours and the minute hand rotates once in 1 hour.
● Mid-night and noon are indicated by 12. We say: 12 Mid-night, and 12 Noon.
The time strictly between 12-midnight and 12-noon is indicated as am, such as inthe morning we say 5 am or 6.30am or 8 am and the time strictly between 12-

118
Notes
Measures and Measurements
Diploma in Elementary Education (D.El.Ed)
noon and 12-midnight is indicated by p.m. like 4 pm in the afternoon, 7pm in theevening.
● 24 hour clocks are used in railways and airways.
Midnight is indicated as 24hr and the subsequent hours are counted as 1 hr., 2hr., 3hr., and so on till the following midnight. There is no use of am and pm. Inthis system, the clock-face shows the numbers from 1 to 24 and the hour handrotates once over the clock face in 24 hours.
Time Sense: Before the child could read the clock and calendar, he/she should havedeveloped a sense of time i.e. the sense of past, present and future. When the childrencome to the school for the first time at about 6 years of age, they have developed suchsense to a considerable extent. They can talk in terms of what happened yesterday orlast week, what they are doing now and what they are going to do tomorrow. Beginningwith the idea of yesterday, today and tomorrow, you can lead them to express in termsof last month or last year or some years back arrange the events in terms of the date oftheir occurrence. Similarly, you can discuss with them regarding the events that aregoing to happen tomorrow, next week, next months and in years to come. For allthese purposes, you can in different times involve them in formal or informal discussionson the questions related to events occurring in past, present and future. Some suchquestions are:
● What is the day to-day?
● What was it yesterday or what it will be tomorrow?
● Who are absent in your class to-day?
● Who were absent yesterday?
● In which period tomorrow mathematics is going to be taught in your class?
● What day is to-day?
● What day will be tomorrow?
● Who is older, you or your friend?
The more you discuss with children along these lines, you will be able to sharpen theirsense of time. In addition to such discussions, provide situations when they can beable to arrange three or more events in serial order of time, beginning from the distancepast to immediate past and proceed to immediate and distant future. In other words,they try to arrange events on a time line. Once they understand and successfully arrangethe events chronologically, you can then proceed to acquaint them with clock andcalculation of time.
Instant and Duration of Time
The recording of time depends on your requirement of the type of period of eventsyou want to record. For example study the three situations:

119
Measures and Measurements
Notes
Block 2 : Enriching Contents and Methodology
1. How many years have passed since India got independence?
2. What is the difference in the ages of two of your friends Seema and Sehna?
3. How much time did Rohit take in answering the classroom test completely inMathematics?
The first question requires knowing the year in which India got its independence(1947A.D.) and the present year from which the difference is to be calculated (say2011A.D.). Simply deducting 1947 from 2011 you get the answer.
The second situation requires the exact dates of birth in terms of the year, month, anddate of birth of each of the two friends. It is slightly more complex than the first one.
Suppose the dates of birth of the two friends are as follows:
Seema was born on 18th Ocober 1999 and Sehna was born on 12th September2000.
You can calculate the difference in their ages in two different manners: (i)Calculate thepresent age as on a definite date (say, 1st. April, 2012) and find the difference betweentheir present age, (ii) Calculate the differences between their dates of birth whichwould be equal to their age at any instant of time. We have taken the second methodto calculate the difference in their ages.
To find out the difference between their dates of birth you arrange their dates of birthas shown below and calculate the difference in their
Year M Day
Sehna: 2000 09 12
Seema: 1999 10 18
00 10 24
You can explain how to calculate the difference when months and days are involved.Since in this case 12 days are less than 18 days, therefore, we have to borrow 1month (=30days) from the 9 months and calculate the difference between( 30+12 =)42 days and 18 days to be 24 days, Again, we are left with 8 months from which 10months cannot be deducted and hence we borrow 1 year(=12 months) and subtracting10 months from (12 + 8 = 20) months we get 10 months. Thus we get the differencebetween the dates of birth of two friends and on that basis we can say that Seema is10 months 24 days older than Sehna.
In brief, in order to help your students to develop skill in measuring time, you need toplan several types of activities that include reading the clock accurately, stating thetime in am and pm, calculating difference of time between two events.

120
Notes
Measures and Measurements
Diploma in Elementary Education (D.El.Ed)
Check your progress
E10. Rama left for her hostel in her college on the morning of 11.11.1911 and is likelyto come back at the night of 12.12.2012. How many days would she be absentfrom her home?
E11. From among the following years, identify the leap years.
1536, 1600, 1682, 1700, 1820, 1980, 2000, 2006, 2012.
E12. On the 10th January 2008, the repair work of a school building started andcontinued for a period of 65 days. On which day was the work completed?
7.6 LET US SUM UP
● Measurement is quantification of some particular aspects of objects arrived atthrough comparison of the particular aspect with another similar object of fixeddimension( a unit).
● Length is one dimensional, while area and volume are associated with 2-D and3-D objects respectively.
● While observation, superimposition and indirect methods are used for measuringobjects, non-standard and standard units are predominantly employed for thepurpose.
● Non-standard units using body parts or locally available materials may not be asaccurate as the standard units, but are more meaningful and beneficial for thebeginners to anchor the concepts of units and processes of measurement.
● Before acquainting with the standard units of measuring length, area, volume,capacity and weight, children should be made familiar with the processes ofmeasuring the attributes. When standard units are introduced, children should beencouraged to employ their experiences gained by using non-standard units.
● Every child in elementary schools should be facilitated to acquire skills in usingthe standard metric units of length, area, volume, capacity and weight after gainingknowledge of the units, sub-units, and higher units in each of the aspects.
● Metric system has been accepted as the international standards (SI) ofmeasurement with seven base units for length, mass, time, temperature, electriccurrent, luminous intensity and amount of substance.
● Time is measured in terms of solar year, solar months, days, clock hours, minutesand seconds.
● Children should be provided scope for developing skills in recording time ofevents and calculating duration of events.

121
Measures and Measurements
Notes
Block 2 : Enriching Contents and Methodology
7.7 MODEL ANSWERS TO CHECK YOURPROGRESS
E1. State any three differences
E2. They are accurate, uniform across the world, and are used in scientificmeasurements.
E3. State the examples
E4. Non-standard units are familiar to children, hence they are meaningful and canbe easily handled by children before they could try standard scales.
E5. (A) 8cm2 (B) 9cm2 (C) 24cm2
E6. Cubic centimeter (not in litre as it is the unit of capacity measurement or ofmeasuring liquids)
E7. 6000 litres
E8. In Metric system the higher units and sub-units are stated in multiples or sub-divisions of 10 of the main unit of measurement.
E9. Rs. 12500.00; 25 packets
E10. 398 days
E11. 1536, 1600, 1820, 2000, and 2012.
E12. On 14th March, 2008
7.8 SUGGESTED READINGS AND REFERENCES
IGNOU (2008). Teaching of primary school mathematics(vol.5): Measurement.New Delhi: IGNOU.
7.9 UNIT-END EXERCISE
1. Describe the methods of comparison as a means to measuring different objects.
2. Compare nature and utility of the non-standard and standard units of measurementwith suitable examples.
3. Why the metric units of length, mass and time are considered as the SI base unitsand other units like those of area, volume, capacity and mass as derived units?

122
Notes
Data Handling
Diploma in Elementary Education (D.El.Ed)
UNIT 8 DATA HANDLING
Structure8.0 Introduction8.1 Learning Objectives
8.2 Collection and representation of data8.2.1 Collection of data
8.2.2 Tabular representation of data8.3 Pictorial depiction of data
8.3.1 Pictorial8.3.2 Bar graph
8.3.3 Histogram8.3.4 Pie Chart
8.4 Data Analysis
8.4.1 Measures of Central Tendency8.4.1.1 Arithmetic Mean
8.4.1.2 Median8.4.1.3 Mode
8.4.2 Measures of Variability8.5 Let Us Sum Up
8.6 Model Answers to Check Your Progress8.7 Suggested Readings and References
8.8 Unit-End Exercises
8.0 INTRODUCTION You know that for planning developmental activities, information or data on severalaspects like land, revenue, agricultural products, manpower etc. are collected in regularintervals and records in respect of those information are maintained at different levels.In your daily life, you must have seen several kinds of data consisting of numbers,figures, names etc are also collected and used. Collecting data, arranging or processingthem and drawing inferences from these data and using those to solve different problemshave been regular features in the management of all developmental activities includingschool education. Children too are often engaged in activities that require basic

123
Data Handling
Notes
Block 2 : Enriching Contents and Methodology
knowledge of handling data. They also often generate data through their own gamesand activities. Thus, we need to help children acquire some techniques which will beuseful in handling data.
In this unit, we will discuss about the basic ideas involved in introducing the handling ofdata required for primary classes.
For completing this unit, you shall need about 07 (seven) study hours.
8.1 LEARNING OBJECTIVESAfter studying this unit, you will be able to
describe how to collect data and classify these data;
represent data in tables and graphs;
prepare different types of graphs of data such as Pictograph, Bar graphs, Histogramand Pie chart; and
draw inferences from representation of data.
8.2 COLLECTION AND REPRESENTATION OFDATA
In our daily life, there is a need to collect information to fulfill our various requirements.You need to plan for your monthly expenditure when you get your monthly salary.Usually you list the different items of expenditure like purchasing daily commodities,paying electricity bills, purchasing dresses, tuition fees of children, medical expenses,and travel expenditures. For preparing the estimates on these items you usually gothrough the expenditures on these aspects during last few months. In short you arecollecting information on the expenditure on different heads for the last few months toplan for the recent month.
ACTIVITY -1
Prepare a list of information that you need to collect in your school dailyand annually.
.................................................................................................................
.................................................................................................................
.................................................................................................................
As a teacher you are collecting some information several data on daily, weekly, monthly,quarterly and annual basis like number of students enrolled in each class during an

124
Notes
Data Handling
Diploma in Elementary Education (D.El.Ed)
academic year, number of boys, girls in each class, number of SC and ST children ineach class, number of students present on each day, number of working days in amonth, monthly expenditure on salaries etc. All these information are expressed innumbers. Such numerical description of the required information is called data. Thus adata is a collection of numbers gathered to give some useful information.
The data may be collected from different sources directly and indirectly. The collecteddata are to be recorded in a systematic manner which would be convenient for furtheruse. We have to learn how to collect data, tabulate and put them in pictorial form. Thecollection, recording and presentation of data help us in organizing our experiencesand draw inferences from them.
8.2.1 Collection of DataData are information collected in a systematic manner with the aim of deriving certainrelated conclusion. Let us discuss the sources for collection of data. Consider thefollowing examples:-
Ex.1: The students of classVII are preparing for a picnic. The class teacher askedthem to give their choice of fruits out of apple, orange, banana or guava. The teacherprepared a list by asking individually the choices which will help the teacher to distributefruits according to the choice.
Here the data are collected directly from the source i.e., from the students. This is aninstance of the data being collected from the primary source.
Ex.2: Suppose we want to know the number of persons in various income groups in atown/village.
Here the sources of information about the income groups are the records (censusreport) available in the Municipality/ Panchayat office. This is not a direct source ofinformation. Thus the data which are collected indirectly i.e., from the documentscontaining the information collected for some other purpose. Such indirect sources arecalled secondary source.
The collected data from different sources which are not arranged or organized in anymanner are called raw data.
Ex .3: Runs scored by Tendulkar in different innings of a Test series are 16, 56, 25, 8,3, 33, 23, 107.
Here the runs are not organized in any manner and hence are examples of raw data.
The data are arranged in groups on the basis of certain aspect is called distribution.The number indicating different aspects of information such as marks, age, height,income etc. are called the scores of the distribution. The raw data is to be organizedafter it is collected.

125
Data Handling
Notes
Block 2 : Enriching Contents and Methodology
8.2.2 Tabular Representation of DataIf the raw data consists of few scores, then we arrange them in ascending (increasing)or descending (decreasing) order. Then it is called arrayed data.
Ex.4: Raw data: Marks secured by 12 students in a Unit Test (Full mark- 25)
16, 7, 23, 10, 18, 9, 21, 20, 12, 17, 16, 21
Arrayed data: 7, 9, 10, 12, 16, 16, 17, 18, 20, 21, 21, 23 (arranged in an increasingorder).
ACTIVITY - 2
(1) Arrange the above data in decreasing order.
(2) Arrange 88, 25, 16, 43, 7, 70, 16, 34, 61, 52, 97 in ascending anddescending order.
.................................................................................................................
.................................................................................................................
.................................................................................................................
N.B. Equal marks are kept successively.
It is difficult to draw inference when a large no. of data are arranged in an arrayedform. So, we have to arrange the scores in different ways where a precise picture ofthe distribution becomes clear and drawing inference becomes easier. Let us nowthink of the following example.
Ex. 5: Esma collected the data for size of shoes of students of her class. The differentsizes of shoes are as below:
5 4 7 5 6 7 6 5 6 6
4 5 6 8 7 4 6 5 6 4
5 7 6 7 5 6 6 4 8 7
Esma prepared the following table using tally marks

126
Notes
Data Handling
Diploma in Elementary Education (D.El.Ed)
Table 8.1 Size of Shoes
Size of Shoes Tally mark No. of students ( f )
4 5
5 7
6 10
7 6
8 2
Total 30
Now drawing inference from the table will be easier.
Do you know?The mark (bar) used to represent the no. of occurrence of the score is called tallymark.The no. of occurrence of a particular score or a group of scores is known asfrequency (f) of the score or group of scores.The above is an example of an ungrouped frequency distribution.
ACTIVITY - 2
Collect the following data and prepare frequency distribution table: (a) Age of the students in a class. (b) Height of the students of a class...................................................................................................................................................................................................................................................................................................................................................
Let us observe another type of arranging the raw scores.Ex. 6: The marks secured by 40 students of Class VI in a test of Mathematics are:8, 48, 55, 52, 78, 42, 93, 85, 7, 37, 94, 66, 72, 73, 66, 91, 52, 78, 85, 9, 68, 81, 64,60, 75, 84, 78, 10, 63, 21, 14, 30, 19, 25, 93, 33, 15, 29, 25, 13Arranged in an ascending order, the distribution of scores become (in Arrayed form):7, 8, 9, 10, 13, 14, 15, 19, 21, 25, 25, 29, 30, 33, 37, 42, 48, 52, 52, 55, 60, 63, 64,66, 66, 68, 72, 73, 75, 78, 78, 78, 81, 84, 85, 85, 91, 93, 93, 94.

127
Data Handling
Notes
Block 2 : Enriching Contents and Methodology
Arranging the large number of scores in such a fashion does not help us very much forobserving any trend. Similarly, arranging these scores in an ungrouped frequencydistribution would be of very limited utility for us.Let us try another mode of arrangement of these scores:In this arrangement, instead of arranging the scores individually with their respectivefrequencies, we make groups (or pockets) of scores and place the scores of thisdistribution in those groups. For example, let there be a group of 10 scores as 10, 11,12, 13, 14, 15, 16, 17, 18, and 19 or shortly we can represent the group as 10-19otherwise called a class interval (C.I.). The size or the length of this class interval is10 i.e. the number of consecutive scores constituting the C.I.How many scores of our distribution are there within this class interval? There are only5 scores of the distribution i.e. 10, 13, 14, 15, and 19 within the class interval of10-19.The process of arranging the scores of the distribution is as follows:In this distribution, the scores range from minimum 7 to maximum of 94.Range of scores in the distribution or simply Range = Highest score – Lowest score= 94-7=87The range helps us to decide the no. and length of the class intervals (C.I).If we take the length of the C.I. to be 10, then the no. of C.Is. would then be 10.
Table 8.2 Grouped Frequency Distribution
Class Interval (C.I.) Tally Marks Frequency (f)
0-9 03
10-19 05
20-29 04
30-39 03
40-49 02
50-59 03
60-69 06
70-79 06
80-89 04
90-99 04
Total (N) 40

128
Notes
Data Handling
Diploma in Elementary Education (D.El.Ed)
This is an example of a grouped frequency distribution. Here the length of the classinterval, as explained above, is 10. This can be determined in another way. For example,let us take any class interval say, 60-69.
The upper and lower limits of the C.I. are respectively 69 and 60.
The length of the C.I. = 69-60+1= 10.
You can observe that the lengths of all class intervals in one grouped frequencydistribution are equal.
Sometimes, the class intervals are represented in the following manner:
0-10 in place of 0-9
10-20 in place of 10-19
20-30 in place of 20-29
30-40 in place of 30-39 and the like.
In such type of arrangement, the score indicating the upper limit of each C.I. is notincluded in that C.I.
Further, the length of the C.I. in this case is equal to the difference of the upper limitand the lower limit of the C.I. For example, the length of the C.I. 30-40= 40-30=10.
ACTIVITY -3
Measure the weights of the students of Class VII of your school. Prepare asuitable of grouped frequency distribution table of their weights.
.................................................................................................................
.................................................................................................................
.................................................................................................................
8.3 PICTORIAL DEPICTION OF DATAYou know pictures are generally eye-catching, easier to understand and leave a morelasting impression on the mind of the observer. Hence a variety of methods have beendeveloped to present numerical data pictorially/graphically. In this section we discussfour such representations i.e. the pictographs, bar graphs, histogram, and pie charts.
8.3.1 PictographWe can use picture symbols to denote numerical data. These pictographs have animmediate visual impact. Let us present the following numerical data in a pictograph.

129
Data Handling
Notes
Block 2 : Enriching Contents and Methodology
Ex.7 The number of girls studying in different classes of a school are given below.
Table 8.3 No. of Girls in the School
Class I II III IV V
No. of girls 25 20 30 10 15
The above data is presented by pictograph as follows:
Classes No. of girl students
V
IV
III
II
I
The figure represents 5 girls
Fig. 8.5 Pictograph of No. of Girl Students in the School.
Pictographs give a visual impression about the distribution.
N.B : (i) Pictographs are often used in magazine, newspaper etc.
(ii) Drawing pictograph is time consuming.
Drawing a Pictograph: Sometimes in a pictograph, a symbol is used to representone or more objects and may be difficult to draw. In such cases simple symbols may
be used. For example, if represents 5 students then will represent 4 students,
represents 4 students, represent 2 students and represents 1 student.
Thus, the task of representation will be easier.
ACTIVITY - 4
(a) Collect 2 to 3 pictographs from the newspapers or magazines anddisplay those in your class.

130
Notes
Data Handling
Diploma in Elementary Education (D.El.Ed)
(b) Draw a picture of no. of absentees in different classes of your schoolon any day.
.................................................................................................................
.................................................................................................................
.................................................................................................................
8.3.2 Bar GraphDrawing pictograph is sometimes difficult and time consuming. Let us look for someother way of representing numerical data visually. The bar graph on the data used inEx-7 can be shown as :
Fig. 8.6 Class-wise No. of girls in the school
Let us observe the above graph keenly. You may have the following observation:Bars of uniform width are drawn vertically.Gaps left between the pairs of consecutive bars are of equal width.The length of each bar represents the given nos.
Such a figure of representing data is called bar graph or bar diagram.
Do you know?Bars can be drawn horizontally also by changing the axes.All bars shall have same colour or shaded in the same way.
Steps to draw a bar graph :Step-I : Draw a horizontal line and a vertical line.Step-II : On the horizontal line put marks (scores) to draw bars representing each
item.

131
Data Handling
Notes
Block 2 : Enriching Contents and Methodology
Step-III: On the vertical line write numerals representing no. of items. (after selectionof suitable scale)
Step-IV: Use columns of equal width to represent the item.
Step-V: The column representing the same item should be shaded in the same way.
ACTIVITY - 5
The number of students who remained absent in your school during a weekis given below. Prepare a bar graph on this data.
Days Sun Mon Tue Wed Thu Fri Sat
No. of Absentees 25 7 16 11 9 18 20
.................................................................................................................
.................................................................................................................
.................................................................................................................
Multiple bar diagram:
Sometimes two or more sets of data are given for visualizing a comparison amongthose three. Let us discuss the following example where the performance of a studenton different subjects taught in Class VII in Half-yearly and Annual Examinations havebeen given. The graph would demonstrate the change in performance on the subjectsduring two examinations.
Ex.8
Table 8.4 Marks in Different Subjects
Subjects M.I.L. English Maths. Science Social Study
Exam.
Half Yearly 61 65 90 70 58
Annual 68 72 80 57 76
The bar graph of the data consists of two bars for each subject. To differentiate thetwo exams, we use different colours or different shades for two bars under eachsubject.
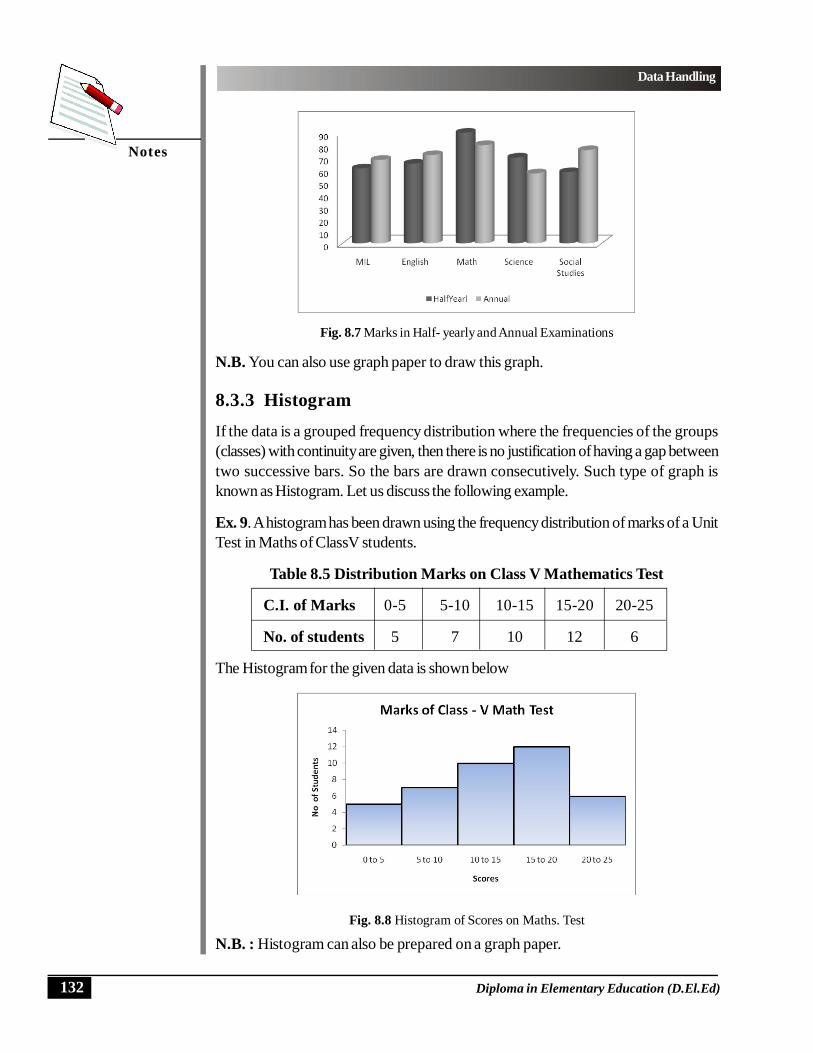
132
Notes
Data Handling
Diploma in Elementary Education (D.El.Ed)
Fig. 8.7 Marks in Half- yearly and Annual Examinations
N.B. You can also use graph paper to draw this graph.
8.3.3 HistogramIf the data is a grouped frequency distribution where the frequencies of the groups(classes) with continuity are given, then there is no justification of having a gap betweentwo successive bars. So the bars are drawn consecutively. Such type of graph isknown as Histogram. Let us discuss the following example.
Ex. 9. A histogram has been drawn using the frequency distribution of marks of a UnitTest in Maths of ClassV students.
Table 8.5 Distribution Marks on Class V Mathematics Test
C.I. of Marks 0-5 5-10 10-15 15-20 20-25
No. of students 5 7 10 12 6
The Histogram for the given data is shown below
Fig. 8.8 Histogram of Scores on Maths. Test
N.B. : Histogram can also be prepared on a graph paper.

133
Data Handling
Notes
Block 2 : Enriching Contents and Methodology
8.3.4 Pie-chartWe can also draw a pie chart to represent an ungrouped data. In a pie-chart, a circlerepresents the whole data. Each division of the data is shown by a sector. We have tofind the central angle for each sector which is given by
360fN
where f = frequency of the division, and N = Sum of the frequencies (total).
Ex.10. Let us draw a pie-chart for the following example.
Table 8.6 shows the monthly expenditure of Mitali’s family on various items.
Table 8.6 (Monthly Expenditure)
Items of Expenditure Expenditure(in hundreds of Rupees)
House rent 21Electricity 03Education 36Transport 06Food 42Miscellaneous 12
Total 120
We have to prepare a pie chart to represent the given data. So we have to calculatethe sector angle of each item. Let us construct the following table showing thisrelationship.
Table 8.7 Monthly Expenditure
Items of Expenditure CentralExpenditure (in hundreds of Rs.) Angle
House Rent 21360 21 63120
Electricity 03360 03 9120
Education 36360 36 108120

134
Notes
Data Handling
Diploma in Elementary Education (D.El.Ed)
Transport 06360 06 18120
Food 42360 42 126120
Miscellaneous 12360 12 36120
The pie-chart of the above data is shown below.
Fig. 8.9 Pie chart showing monthly expenditure
Steps to draw a pie-chart :
Step-I: Calculate the central angle of each sector..
Step-II: Draw a circle with suitable radius.Step-III: Draw radii showing the central angles either in clockwise or in anti clockwise
mannerStep-IV: Shade (or colour) the sectors differently.
Before proceeding further, try to respond to the following:
E1. Total number of animals in five villages are as follows :
Naraharipur Purunakote Patla Sanamunda Kantimili
80 100 60 120 50
Prepare a pictograph of these animals using symbol to represent 10 animals
1
2
3
4
5
6
1.
2.
3.
4.
5.
6.

135
Data Handling
Notes
Block 2 : Enriching Contents and Methodology
E2. The no. of books sold by a shopkeeper in a week is shown below :
Days Sunday Monday Tuesday Wednesday Thursday Friday Saturday
No. of 60 40 35 50 25 70 30books
Draw a bar graph choosing a proper scale.
E3. Number of persons in different age groups in state like Odisha e.g. Dhenkanaltown is given below:
Age group 1-15 15-30 30-45 45-60 60-75 75 and above
No. of 24 30 42 36 18 12persons
Draw a histogram to represent the above information.
E4. The following table shows the no. of students of a school who came to the schoolon a certain day by using different kinds of conveyances. Draw a pie chart forthis.
Kinds of School Bus Cycle Motor Car Othersconveyance cycle/Scooter
No. of students 160 80 60 20 40
8.4 DATA ANALYSISWe have learnt the ways one can record the collected data and display those datausing pictorial forms and graphs. Apart from visual representation of data, can wemake any other analysis of data in order to comprehend the trend of the distribution ofscores?
If you study closely any frequency distribution discussed so far (either ungrouped orgrouped), you would observe two features of the distribution:
The scores or observations tend to cluster around a specific value which is nearerto the middle of the distribution. This characteristic of the distribution of data iscalled its central tendency. A measure of central tendency refers to a centralvalue which is representative of the entire set of data to which it belongs.
Only knowing the measure of central tendency is not sufficient to study the natureof the distribution of data. Besides the central value, we have to know the natureof spread of individual observations around the central value. Look at the twodistribution shown below:

136
Notes
Data Handling
Diploma in Elementary Education (D.El.Ed)
(a) 10, 11, 12, 13, 14, 15, 16
(b) 5, 9, 10, 13, 19, 17, 18
In both the above distributions, the central value is 13. But , in the distribution (a), thescores are clustered nearer to the central value 13 than the score in the distribution (b).This is a very simple example to show that we need to know the spread of scores orvariation of scores around the central value for a complete analysis of the distribution.The spread or variability nature of data is otherwise called variation or dispersion. Ameasure of variability or dispersion of data relates to quantifying how closely individualobservations are scattered around the central value.
In this section we shall discuss about some measures of central tendency and dispersion.
8.4.1 Measures of Central TendencyCentral tendency is a statistical measure which identifies a representative value (score)of an entire distribution. The literal meaning of the term central tendency is the scorewhere all the scores tend to centralize. The goal of central tendency is to find the singlescore that is most typical or most representative of the entire group. In this section weshall discuss about three principal measures of central tendency. These are (i) ArithmeticMean, (ii) Median, and (iii) Mode
Let us now discuss the methods of determining these three measures.
8.4.1.1 ARITHMETIC MEAN
The most common measure of central tendency is the arithmetic mean or simplymean. It is also commonly known as average.(a) Mean of Ungrouped Data : The mean of some given observations ( x1, x2,
x3,…, xn ) is defined as
nx
nxxxxX n
....321 ( is symbol used for summation)
sum of the observations (scores)Mean = no. of observations (scores)
Ex.11: Dhoni scored 33, 17, 60, 25 and 45 runs in a one-day series. Calculate themean score.
Total runs = 33 + 17 + 60 + 25 + 45 = 180No. of matches = 5
So, mean score = 365
180matchesof.no
runsTotal
Thus the mean runs per match is 36.

137
Data Handling
Notes
Block 2 : Enriching Contents and Methodology
ACTIVITY -6
Calculate the mean of your study hours in a particular week.
Find the mean of your sleeping hours during one week
.................................................................................................................
.................................................................................................................
.................................................................................................................
(b) Mean of an Ungrouped Frequency Distribution:
Let us discuss the following example.
Ex.12. The daily wages of Ranjit in a month are shown in the following table. Calculatethe mean of his daily wages.
Daily wages (in `) 120 130 140 145 150
No. of days 5 4 7 6 8
For calculating the mean daily wage, we have to prepare the following table:
Table 8.8 Daily wages of a month
Daily wages No. of days f × x(in ̀ ) (x) (frequency = f)
120 5 600
130 4 520
140 7 980
145 6 870
150 8 1200
30 f 4170 fx
So, mean = sum of the wages
No. of daysfxf
= 139
304170
The mean daily wages of Ranjit is ̀ 139.00.

138
Notes
Data Handling
Diploma in Elementary Education (D.El.Ed)
ACTIVITY - 7
Calculate the mean of the following distribution of marks:
Marks obtained 15 17 20 22 24 25
No. of students 3 5 9 4 7 2
(c) Mean of Grouped Frequency Distribution: In case of a grouped frequencydistribution, each group (class interval) is replaced by a single number which isthe mid point of the group.
So, midpoint of a class interval = 1 2
2l l
, where l1 and l2 are the lower and upper
limit respectively of the class interval.
Ex.13. Let us now calculate the mean of the following distribution:
Table 8.9 Grouped Frequency Distribution
Scores Frequency Midpoint f × x(C.I.) (f) (x)
0-10 5 5 25
10-20 6 15 90
20-30 12 25 300
30-40 8 35 280
40-50 10 45 450
50-60 6 55 330
60-70 6 65 390
50 f 1865fx
So, mean. 1865 37.3
50fxf
Note: Replacing the classes by the midpoints, the grouped distribution changes toungrouped distribution, and the midpoints of the classes take the place of scores.

139
Data Handling
Notes
Block 2 : Enriching Contents and Methodology
ACTIVITY - 8
Calculate the mean of the following distribution:
Class Interval 0-10 10-20 20-30 30-40 40-50 50-60
Frequency 8 12 15 9 11 5
E5. What is the mean of the first ten natural numbers?
Do you know?
In a normal distribution without having any unusual extreme scores, mean is themost reliable measure of central tendency.Mean is influenced by the size of every score in the group. If any one score isincreased (or decreased) by c units, the mean is increased (or decreased) by c/n units.
If a constant, say c is added to each score in a group which means X , theresulting scores will have a mean equal to X + c. (You can verify this property ofmean taking small distribution). Verify what will happen to mean when each scoreis multiplied by a constant c.
8.4.1.2 MedianThe middle value of the data when arranged in ascending (increasing) ordescending(decreasing) order is called as Median. Thus Median refers to the valuewhich lies in the middle of the data with half of the observations above it and the otherhalf below it. In other words, median divides the distribution in two equal halves.
(a) Median from ungrouped data:
After arranging the given data either in ascending or descending order of magnitude,the value of the middle observation is called the median of the data.Method for finding the median of an ungrouped data: Arrange the scores in ascendingor descending order. Suppose the total no of observation is ‘n’.Case – (i) when n is odd
Median = Value of th1n21
observation.
Case – (ii) when n is even, there occur two midpoints
Median =
nobservatio1
2nnObservatio
2n
21 thth

140
Notes
Data Handling
Diploma in Elementary Education (D.El.Ed)
Let us study the following examples:
Ex.14. The ages (in years) of 10 teachers in a school are 37, 34, 52, 45, 50, 41, 31,40, 36, and 55. Find their median age.
Arranging the ages in ascending order, we have 31, 34, 36, 37, 40, 41, 45, 50, 52,and 55
Here n = 10 which is even.
So the scores in the middle of the distribution are 40 and 41.
Median = mean of 40 and 41
= 5.4081214140
21
Hence the median age of the teachers is 40.5 years.
Ex 15. The runs scored by the Indian cricket team in a one-day match are 95, 40, 2,55, 10, 38, 33, 22, 0, 18, 8 find the median score.
Arranging the runs in descending order we have 95, 55, 40, 38, 33, 22, 18, 10, 8,2, 0Here n = 11 which is old.
So, the median score = value of nobservatio11121 th
= value of the 6th observation = 22
Hence the median score is 22.
(b) Median from the ungrouped frequency distribution: The steps of finding themedian of an ungrouped frequency distribution are:
Step I: Arrange the scores in ascending or descending order.
Step II: Determine the cumulative frequency which is the added up frequencies fromthe beginning upto the score concerned.
Step III: Find the sum of the frequencies N.
If N is odd, then median = size of the score2N th
Let us observe the following example

141
Data Handling
Notes
Block 2 : Enriching Contents and Methodology
Ex. 16. Find the median of the following distribution.Marks obtained 17 20 15 22 18 25
No. of students (f) 5 8 6 7 10 3
Now, preparing the cumulative frequency table, we haveTable 8.10 Cumulative Frequency Distribution
Marks obtained (x) No. of students (f) Cumulative frequency (cf)
15 6 617 5 6 + 5 = 1118 10 11 + 10 = 21*20 8 21 + 8 = 2922 7 29 + 7 = 3625 3 36 + 3 = 39
N = 39f
*The 20th position
So, Median position is the 1
2N
th position i.e. the 39 1
2
th or 20th position. This
means the mid-point falls in the 20th position of the distribution. In this example thescore 18 occupies all the positions from 12th to 21st,i.e. the mark which each one inthe 12th, 13th, 14th……21st rank gets is 18.Hence the median of marks = score ofthe median position = 18
(c) Median from Grouped Frequency Distribution:
Consider the following grouped distribution of marks obtained in Mathematics of classVII students:
Table 8.11 Median for Grouped DataC.I. of Marks Number of Cum. f
Obtained Students(f)30-39 1 140-49 3 450-59 8 1260-69 15 2770-79 10 3780-89 9 4690-99 4 50
N = 50

142
Notes
Data Handling
Diploma in Elementary Education (D.El.Ed)
For a grouped frequency distribution, the median is calculated using the followingformula:
Median = 2m
m
N FL i
f
Where, Lm = The exact lower limit of the class interval in which the median lies.N = Total number of scores,F = Total frequency below Lm, fm = frequency within the class interval in which the median lies, andi = length of the class interval.
In the above example, N= the total number of scores = 50.
Hence, the median lies in between 25th and 26th positions i.e. within the class interval60-69.
Here, Lm = exact lower limit of 60-69= 59.5,
F = 12, fm= 15, and i = 10.
Median = 59.5 +
50 122 10
15
= 59.5+8.67= 68.17
Steps of calculating median in grouped distribution:
1. Calculate the Cum. f and locate the C.I. in which the median lies.
2. Determine the exact lowest limit of the C.I.( Lm) in which the median lies.
3. From the calculations of the Cum. f , determine the total frequency below theexact lower limit of the C.I.(F) in which the median lies.
4. Find the difference N/2 - F , divide the difference with the frequency of thescores within the C.I. in which the median lies and multiply it with the length of theC.I.
5. Add the result in 4 with the exact lower limit Lm to get the median.
Before proceeding further answer find the median in the following two cases:
E6. Find the median of the first 8 odd natural numbers.
E7. Find the median weight for the following data.
Weight (in kg) 40 42 45 46 48 50 52
No. of students 8 5 6 9 7 4 2

143
Data Handling
Notes
Block 2 : Enriching Contents and Methodology
Do you know?
The median is the score that occupies the exact middle position of the distributionwhen the observations are arranged in ascending or descending order.
Median is a locational or positional observation and hence not affected by anyextreme score. If you increase or decrease the scores that lie at the extremes, themedian does not change.
Median is preferred when the distribution has number of extremely small and/orlarge scores which would affect mean.
Median is used when a quick estimate of central tendency is required.
8.4.1.3 ModeOther than Mean and Median there is also another measure of central tendency whichis called ‘Mode’. For different requirements relating to a data, this measures of centraltendency is used. Now look at the following example.
Ex.17. To find out the monthly demand for different sizes of shoes a shopkeeper keptrecords of sales. Following is the record for a month:
Size 5 6 7 8 9 10 Total
Pair of shoes sold 20 51 70 35 10 6 192
Mean of the shoes sold = 326
192sizedifferentof.No
soldshoesTotal
Should the shopkeeper obtain 32 pairs of shoes of each size? If he does so, will he beable to meet the needs of largest group of the customers?
On looking at the record, the shopkeeper decides to procure shoes of sizes 6 and 7and 8 more.
The size of shoes that has maximum number of customers is 7.
Observe that the shopkeeper is looking at the shoe size that is sold most.
This is another representative value for the data.
This representative value is called the Mode of the data. Thus the mode of a set ofscores is that which occurs most often.
Mode : Mode is the score which occurs most frequently in the distribution.
Let us discuss some more examples.
Ex.18. The ages of cricket players of India are given below. Find their modal age.
29, 38, 19, 24, 34, 29, 24, 38, 23, 28, 24, 25, 21, 26, 24

144
Notes
Data Handling
Diploma in Elementary Education (D.El.Ed)
Arranging the ages with same age together we get 19, 21, 23, 24, 24, 24, 24, 25, 26,28, 29, 29, 34, 38, 38
Mode of this data is 24, because it occurs more frequently than other observations.
Ex.19. Determine the mode of the following data.
Marks secured 10 12 13 15 18 19 20
No. of students 3 4 5 2 5 2 1
Mode of marks i.e. mark(s) of highest frequency are 13 and 18
Note : A distribution can have multiple modes i.e. more than one mode.
If the no. of observations is large, we have to prepare an ungrouped frequencydistribution table by putting tally marks. Thereafter, we can determine the mean, medianand mode of the distribution.
Do you know?
Formula for calculating an approximate value of mode in a perfectly symmetricaldistribution is : Mode = 3 × median – 2 × mean
Mode is used when we wish to know what the most typical case is.
Mode is most unstable measure of central tendency.
Mode is a score of the distribution and not a frequency.
8.4.2 Measures of VariabilityThere are two types of measures of variability or dispersion – distance measuresand measures of average deviation.
Distance Measures: Distance measures describe the variation in data in terms ofthe distance between selected measurements. Here, we discuss two such measures-Range and Inter-Quartile Range.
Range: Range is the simplest measure of variability both from the point of view ofcalculation and understanding. It is the difference between the largest and the smallestobservations in the data.
For example, the range of scores 2, 5, 6, 4, 12, 10, 9 and 8 is 12-2 = 10.
Similarly, -2, 0, 3, 7 and 9 has the range = 9-(-2) =11.
This type of range is called ‘Exclusive Range’. But when we determine the rangethrough the difference between the upper real limit (URL) of the highest score andthe lower real limit (LRL) of the lowest score, we call it ‘Inclusive Range’.

145
Data Handling
Notes
Block 2 : Enriching Contents and Methodology
In the above example, the URL of the highest score 12 is 12.5 and the LRL of thelowest score 2 is 1.5 (Every observation in social science is not absolute and fixed.Rather it is assumed to be stretched over an interval of 0.5 before and after the score.Therefore the score 12 is any value in the interval of 11.5 - 12.5, the extreme points ofthe interval determines the upper and lower real values of 12). Hence, the inclusiverange of the distribution is 12.5 – 1.5=11 while its exclusive range is 10.
E8 . Calculate the inclusive range of - 1, 2, 5, -5, 4, 6, and 7.
E9 . What is the difference between the inclusive and exclusive ranges of a distribution?
Although range, either exclusive or inclusive, is easier to calculate and the simplestmeasure of variability, it does not reflect the spread or scatter of scores. For example,if 100 scores are spread evenly between 1 to 10, the inclusive range is 10. But if onescore is 1 and another is 10 and in between these two scores the score 5 is repeated98 times, then the total number of scores remaining 100 the inclusive range would stillbe 10. This goes to show that range may be the quickest estimate of variability but notan accurate measure of it.
Interquartile Range: Interquartile range or specifically semi-interquartile range isanother distance measure of the variability of distribution. Earlier, we had definedmedian as the score that divides a distribution exactly in half. In a similar way, adistribution can be divided into four equal parts using quartiles. By definition, the firstquartile (Q1) is the score that separates the lower 25% of the distribution from therest. The second quartile (Q2) is the score that has exactly two quarters, or 50%, ofthe distribution below it. Notice that the second quartile and the median are the same.Finally, the third quartile (Q3) is the score that divides the bottom three-fourths of thedistribution from the top quarter.
The interquartile range is defined as the distance between the first and the thirdquartile.
Interquartile Range = Q3-Q1When the interquartile range is used to describe variability, it commonly is transformedinto the semi- interquartile range. It is simply one-half of the interquartile range:
Semi-interquartile Range = 2)13( QQ
Ex. 20 Find the semi interquartile range for the following data:
3, 4, 6, 9, 11, 12, 14, 15.
The total number of scores in the distribution is 8. Its 25% is 2 and 75% is 6. Thatmeans Q1 is a point under which the first two scores i.e.3 and 4 will lie. Such a point

146
Notes
Data Handling
Diploma in Elementary Education (D.El.Ed)
will be the mid point of the distance between 4 and 6, i.e. 5. Hence Q1=5, SimilarlyQ3, below which first 6 scores will lie, is equal to 13 the mid point between 12 and 14.
Hence, semi-interquartile range = 2)13( QQ
= 2)513(
= 4
Since, semi-interquartile range focuses on the middle 50% of a distribution; it is lesslikely to be influenced by extreme scores. But, since it does not take into account theactual distance between individual scores, it does not give a complete picture of howscattered or clustered the scores are. Therefore, like the range, the semi-interquartilerange is considered to be a somewhat a crude measure of variability.
Measures of Average Deviation: Deviation of a score is its distance from themean. When the average of such deviation scores are taken into consideration, themeasure of variability becomes more accurate and reliable. We discuss here two suchmeasures based on the average deviation scores – Average Deviation and StandardDeviation.
When the scores are nearer to the mean i.e. when the distribution is compact, themeasure of average deviations would be small and vice versa. This helps us to understandthe nature of distribution. For example, in a class examination, the mean of scores inMathematics test was 65 and the standard deviation was 10, while the mean of Languagetest scores was 60 and the standard deviation was 5. We find majority of studentsscored nearer to 60 in Language. But in Mathematics the scores are spread muchwider than that of the scores on Language. There would be quite a number of studentssecuring lower marks in Mathematics ; below the minimum score in Language. Withoutthe measures of average deviations, we cannot draw any valid conclusions from themeasures of central tendency alone.
Average Deviation: Deviation score (x) = Score – Mean = X X
If in a distribution the mean is 50, the deviation of the score 55 is given by
X X = 55 – 50 = 5,And the deviation of the score 45 = 45-50= - 5.
Notice that there are two parts to a deviation score: the sign (+ or -) and the number.The sign tells whether the score is above the mean (+) or below it (-). The numbergives the actual distance of the score from the mean.
Average or mean deviation is the mean of deviations of all scores from the mean of thescores in the distribution. In calculating the mean deviation, no account is taken ofsigns, and all deviations +ve or –ve are treated as positive.
Let us calculate the average deviation (AD) of five scores 5, 8, 11,12, 14 whichmeans 10.

147
Data Handling
Notes
Block 2 : Enriching Contents and Methodology
Table 8.12 Average Deviation of Ungrouped Data
Score (X) Deviation X X– X X–
5 5-10= -5 5
8 8-10= -2 2
11 11-10=1 1
12 12-10=2 2
14 14-10=4 4
X X = 14
Average Deviation (AD) = X XN = 5
14 = 2.8.
Notice the sum of deviation scores is 0. Why?
Average Deviation for Grouped Data: Observe the process of calculation of ADfor the grouped frequency distribution shown below:
Table 8.13 Average Deviation of Grouped Data
C.I. f Mid-point of X X f X X
C.I.(X)
30-34 3 32 10.38 31.1435-39 9 37 5.38 48.4240-44 15 42 0.38 5.7045-49 8 47 4.62 36.9650-54 5 52 9.62 48.10
N = 40 170.32
Here N = 40, and Mean (X) = 42.38 and f X X = 170.32.
The average deviation (AD) of the grouped frequency distribution is calculated byusing the formula:
AD = f X X
N

148
Notes
Data Handling
Diploma in Elementary Education (D.El.Ed)
In the above example, AD = f X X
N = 40
32.170= 4.26.
Standard Deviation: The widely used measure of variability is the standard deviation.
From the calculation point of view the standard deviation is called ‘Root-mean-squared-deviation’. From this we can state the steps of computation of standarddeviation (SD):
1. Calculate the mean of the distribution for which you have to find the SD.
2. Determine the deviations of the scores from the mean.
3. Square each deviation. The deviation may be positive of negative, but the squareof the deviation is always positive.
4. Find out the mean of the squared deviations. This mean of the squared deviationis called ‘variance’ which has wider use in higher statistics.
5. Determine the positive square root of the variance and the result is the standarddeviation.
Let us calculate the SD, usually signified by the Greek letter ‘?’(sigma) or s, of thefollowing set of scores: 5. 6, 8, 10, 11,14 with mean of 9.
Table 8.14 Standard Deviation of Ungrouped Data
Score Deviation Squared(x = X – X) Deviation (x2)
5 - 16
6 - 9
8 - 1
10 1 1
11 2 4
14 5 25
Sum of the squared deviations = 2x = 16 + 9 + 1 + 1 + 4 + 25 = 56
Variance = Mean of squared deviations = N
x 2
= 656
=9.33
Standard Deviation (SD)=N
x 2
= 33.9 = 3.05

149
Data Handling
Notes
Block 2 : Enriching Contents and Methodology
Standard Deviation for Grouped Data: Let us take the grouped data of Table8.13 and calculate the standard deviation.
Table 8.15 Standard Deviation of Grouped Data
C.I. f Mid-point Deviation fx fx2
of C.I. (X) x X X
30-34 3 32 -10.38 -31.14 323.2332
35-39 9 37 -5.38 -48.42 260.4996
40-44 15 42 -0.38 -5.70 2.166
45-49 8 47 4.62 36.96 170.7552
50-54 5 52 9.62 48.10 462.722
f =N=40 2fx =1219.3760
Standard deviation of the grouped frequency distribution is calculated using the formula:
SD = Nfx 2
Where x is the deviation of the midpoint of C.I. from the mean,
f is the frequency of scores in the respective C.I., and
N is the total number of scores.
From the above table, we get
SD = Nfx 2
= 40
3760.1219= 4844.30 = 5.52
Use of Measures of Variability
Range is used when we want a quick estimate of the spread of scores which arevery small in number and there are no extreme scores.
When there are some extreme scores in a distribution and median is the measureof central tendency, semi-interquartile range is preferred.
When the scores are too scattered which would influence SD unduly, averagedeviation is used to give us a reasonable estimate of the spread of scores.
Among all the measures of variability, SD is most stable and accurate.

150
Notes
Data Handling
Diploma in Elementary Education (D.El.Ed)
Try this
E10. Calculate the SD of the following scores
11,13,15,17,19,21,23
8.5 LET US SUM UPSome data can be collected directly from the primary sources while some arecollected from secondary sources like records, journals, census etc.
Scores can be arranged in the form of ungrouped and grouped frequencydistributions.
Data can be presented through pictures and graphs for easy understanding andanalysis Pictographs, bar graphs, histogram and pie charts are simple graphicalforms.
Arithmetic mean, median and mode are the three measures of central tendencyused for basic statistical treatment of data.
As measures of variability, range and semi-interquartile range are measure ofdistances while mean deviation and standard deviation are measures on averagedeviations.
8.6 MODEL ANSWERS TO CHECK YOURPROGRESS
E1: Draw the pictograph taking name of the villages on the Y axis and no. of animalsof the X axis.
E2: Draw a bar graph choosing the scale 1 c.m. is 10 units. You can draw horizontalor vertical bars.
E3: Prepare histogram taking C.I. for age groups on X axis and no. of persons on Yaxis.
E4: Prepare pie-chart by drawing a circle of radius 3 or 4 c.m. Here central angle
)studentsof.no(3603600
for each conveyance mode.
E5: Mean = 5.5
E6: Median = 8
151
Data Handling
Notes
Block 2 : Enriching Contents and Methodology
E7. Median weight = 45kg
E8. 13
E9. 1
E10. 4
8.8 SUGGESTED READINGS AND REFERENCESNCERT Maths Text Book for Classes VI, VII, VIII
Teaching of Maths of Upper Primary Level Vol-I, An IGNOU Publication
8.7 UNIT-END EXERCISES1. Prepare (i) Pictograph (ii) Histogram and of the data on the marks secured by
Lily on the subjects shown below:
Subject MIL English Math Science S.Study
Marks Secured 60 55 80 55 50
2. Determine the (i) Mean (ii) Median and (iii) Mode of the following data :
16, 24, 14, 10, 20, 14, 15, 21, 15, 12, 13, 15, 16, 19, 17
3. Determine the mean, median and mode of the following distribution:
Scores 5 6 7 8 9 10 11 12
Frequency 8 10 15 20 16 12 9 10
4. Calculate the standard deviation of the following group data:
C.I. 30-39 40-49 50-59 60-69 70-79 80-89 90-99
Scores 6 9 15 25 13 7 5

152
Notes
Algebra as Generalized Arithmetic
Diploma in Elementary Education (D.El.Ed)
UNIT 9 ALGEBRA AS GENERALIZEDARITHMETIC
Structure9.0 Introduction
9.1 Learning Objectives
9.2 Using Symbols for Numbers
9.3 Algebraic Terms and Expressions
9.3.1 Algebraic Expressions
9.3.2 Variable and Constant
9.3.3 Terms of an Algebraic Expression
9.3.4 Product, Factor and Coefficients
9.3.5 Like and Unlike Terms
9.4 Operation on Algebraic Expressions
9.4.1 Addition
9.4.2 Subtraction
9.4.3 Multiplication
9.4.4 Division
9.5 Linear Algebraic Equation and its Solution
9.5.1 Linear Algebraic Equations
9.5.2 Solving Linear Equations
9.6 Application of Algebraic Methods
9.7 Let Us Sum Up
9.8 Key points
9.9 Answers to Check Your Progress
9.10 Suggested Readings & References
9.11 Unit- End Exercise
9.0 INTRODUCTIONYou are quite familiar with Arithmetic, a branch of Mathematics. It deals with concretenumbers like 1, 2, 25, 37, 456,…. and various operations on the numbers like addition,

153
Algebra as Generalized Arithmetic
Notes
Block 2 : Enriching Contents and Methodology
subtraction, multiplication, division. But instead of numbers if we use symbols likeletters for indicating quantity and perform different arithmetic operations with theseletters as was done with the numbers, we are generalizing Arithmetic and name it asAlgebra.
Thus, Algebra is a branch of Mathematics where the principles of Arithmetic aregeneralized by using letter symbols representing numbers. Algebra is very interestingand useful when we try to express a quantity without necessarily attaching any numericalvalue and solving problems with the operations as we used in Arithmetic.
The Origin of AlgebraThe word “Algebra” is derived from an Arabic word ‘al-jabar’ means reunion,used in a mathematical treatise entitled “Al-Kitab al-mukhta ? ar fi hisab al-gabarwa’l-muqabala” (Arabic for “The compendious Book on calculation by completionand Balancing”) written by the Persian Mathematical Muhammed ibn Musa alKhwarizmi of Baghdad in 820 A.D.
The famous Greek mathematician Diophantus living in Alexandria in 3rd centuryA.D. is regarded as the “Father of Algebra” for his seminal work entitled“Arithmetica”.
For completing this unit you will need approximately 7 (seven) study hours.
9.1 LEARNING OBJECTIVESAfter going through this unit, you will be able to :
Explain algebraic terms, expressions and categorize algebraic expressions;
Differentiate between variable and constant, like and unlike terms;
Perform different operations on algebraic expressions;
Solve linear algebraic equations in one variable;
Apply algebraic methods in solving mathematical problems.
9.2 USING SYMBOLS FOR NUMBERSThe main feature of Algebra is to use symbols to represent numbers, quantities ormathematical relations in a general situation rather than only in a particular case as inArithmetic. Use of letters will allow us to write rules and formulae in a general way.Consider the following examples:
Ex.1. Ayesha has 3 pens and her brother Arvin has 2 pens. So they both have3 + 2 = 5 pens.

154
Notes
Algebra as Generalized Arithmetic
Diploma in Elementary Education (D.El.Ed)
In this example, numbers are involved in representing the quantities and in the calculationprocess. Let us suppose that Ayesha has x number of pens and Arvin has y no. ofpens. Can we find the total no. of pens they have? We can say that they have (x + y)no. of pens
Here x and y represent two definite numbers.
Ex. 2. (a) Fig 9.1 is a square whose length of each side is 2 cm.
Its perimeter = AB + BC + CD + DA
= (2 + 2 + 2 + 2) cm
= 2 × 4 cm = 4 × 2 cm = 8 cm
(b) Find out the perimeter of the square in fig 9.2
Perimeter of KLMN = KL + LM + MN + KN
= (5 + 5 + 5 + 5) cm
= 5 × 4 cm = 4 × 5 cm = 20 cm
Thus we can find out the perimeter of any square of given length.
From the above example we can conclude that the perimeter of a square is 4 times thelength of each side of it.
Perimeter of square = 4 × length of a side.
If the length of a sides of a square is ‘a’, then its perimeter ‘P’ can be expressed as
P = 4 × a
Here ‘a’ represents the number that denotes the length of a side of a particular squareand we can find out the perimeter of any square for different values of a.
Thus, with the help of symbols as representation for numbers, a number relation canbe generalized. Letters a, b, c ….. x, y, z are used as symbols to represent numberswhich are unknown quantities. As a result, various word problems can be expressedas symbolic statements. Since letters represent nos. they follow all the rules andproperties of the four arithmetic operations.
9.3 ALGEBRAIC TERMS AND EXPRESSIONS
9.3.1 Algebraic ExpressionsIn arithmetic we have come across expressions like
(3 × 8) + 2 ; (10 ÷ 5) + (3 × 20) – 7 etc.
Fig. 9.1
Fig. 9.2
D
B C

155
Algebra as Generalized Arithmetic
Notes
Block 2 : Enriching Contents and Methodology
In these examples we can observe :
(i) Expressions are formed from nos.
(ii) All the 4 fundamental operations such as addition, subtraction, multiplication anddivision or some of them are used in an expression
We can form an expression using variables also.
Let us discuss the following examples :
Ex. 3: Babulu is in Class-VI. In his class there are ‘m’ girl students. Number of boysis 7 less than the girls. Calculate the total no. of students in his class.
No. of girl students = m
No. of boy students = m – 7
Total no. of students = m + (m – 7) = 2m – 7
Here 2m – 7 is an expression which is formed using variable m and constant 2 and 7.Subtraction and multiplication operations are used here.
2x + 3 is an expression, variable x and constants 2 and 3 are used in forming theexpression. Addition and multiplication operations are also used.
The expressions, as we got in both the examples above are called algebraic expressionssince both variables and constants are used in their formation.
So, a combination of constants and variables connected by some or all of the fourfundamental operations +, -, × and ÷ is called an algebraic expression.
For example : 7m, 2p y + 1 , 52a , m + n – 2 are algebraic expressions.
We can write an expression when instruction about how to form it is given. Nowobserve the example and fill up the table.
Instruction Expression
16 added to p P + 16
25 subtracted from r
P multiplied by (-6)
X divided by 3
‘m’ multiplied by 3 and 8is added to the product

156
Notes
Algebra as Generalized Arithmetic
Diploma in Elementary Education (D.El.Ed)
Also, when an algebraic expression is given we can tell how it is formed. Now readthe example and fill up the blank boxes
Expression How it is formed
s – 1 1 subtracted from st + 2511a
5b2
2n – 4
We have seen that the expression have one or more than one term. An algebraicexpression is classified into different categories depending upon the no. of termscontained in it.
Monomial : An expression which contains only one term is called a monomial. For
example: 7xy, 2x, -4n, -8, 23a b
Binomial : An expression which contains two unlike terms is called a binomial.For example: x + y , 2p – 3q, z + 1, 3xy + 2x
Trinomial : Expression having 3 unlike term is called a trinomial. For example: 2a– 5b + 3c, x + y – 3, pq + p – 2q
Polynomial : An expression with one or more terms is known as a polynomial ingeneral. For example: 5x, 2a + 3b, m + n – 3
Do you know ?
3xy is not a binomial. It is rather a monomialm + n – 3 is not a binomial. It is a trinomial.2a + 3a is not a binomial. Here the terms are not unlike term.Monomial, binomial, trinomial are all polynomial.
9.3.2 Variables and ConstantsLet us examine mathematical statement P = 4a
Here, when a = 1, then p = 4 × 1 = 4
when a = 2, then p = 4 × 2 = 8
when a = 3, then p = 4 × 3 = 12

157
Algebra as Generalized Arithmetic
Notes
Block 2 : Enriching Contents and Methodology
Thus, we see that for different values taken for ‘a’, the value of ‘p’ changes. I.e. Pvaries with the change in the value of a. We say that ‘a’ and ‘p’ both are changeable orvariable. Hence we can say:
A symbol which does not have any fixed value for it, but may be assignedany numerical value according to the requirement is known as a variable.
Well, can the number of sides of a triangle be anything other than 3 ? Definitely not.Therefore, the number of sides of a triangle is a fixed number and thus it is a constant.Thus we can say:
A symbol having a fixed numerical value is called a constant.
In the statement P = 4a, ‘a’ and ‘p’ are called variables and ‘4’ is a constant.
Do you know ?
A variable has no fixed value.The letters x, y, z, p, q, r are usually taken to represent variables.All real nos. are constant.Algebraic expressions are formed from variables and constants.
Let us discuss the following examples :
Ex. – 5: Papulu purchased 2 similar pens costing 10 rupees each. How much he hasto pay to the shopkeeper?
Clearly the cost of 2 pens = Rs. 10 × 2 = Rs. 20., which Papulu has to pay
Here we have, Total cost = cost of each item × no. of items
If we take c for total cost and n for no. of items, the above statement can be written asC = 10n
Here n and c both are variables and 10 is a constant.
Ex. – 6: Esma and Reshma are sisters. Esma is older than Reshma by 4 years. Nowread the table and fill the blank boxes.
Reshma’s Age in Years Esma’s Age in Years
7 7 + 4 = 119x
Your answer in the last box will be (x + 4) means Esma’s age will be (x + 4) yearswhen Reshma’s age is ‘x’ years. Here (x + 4) is an algebraic expression where x is avariable and 4 is a constant.

158
Notes
Algebra as Generalized Arithmetic
Diploma in Elementary Education (D.El.Ed)
Now write the variables and constant involved in the following expressions :
Expression Variables Constant
y – 7
32s
2p + 3q
9.3.3 Terms of an Algebraic Expression
From earlier discussion we know that an algebraic expression consists of one or moreterms. Let us consider the following examples :
Ex. 7 2p + 3 is an expression.
In forming the expression we first formed 2p separately as a product of 2 and p andthen 3 is added to it.
Ex. 8 xy + 3z – 5 is an expression.
To form this expression we first formed xy separately as a product of x and y. Then weformed 3z separately as a product of 3 and z. We then added them (xy and 3z) andthen added (-5) to it to get the expression.
You will find that the expressions have parts which are formed separately and thenadded. Such parts of an expression which are formed separately first and then addedare called as terms.
In Example 7, 2p and 3 are terms and in Example 8, xy, 3z and 5 are terms
The different parts of the algebraic expression separated from each otherby the sign ‘+’ or ‘-’ are called the terms of the expression.
Do you know?Terms are added to form expressions.
The sign before a term belongs to the term itself.

159
Algebra as Generalized Arithmetic
Notes
Block 2 : Enriching Contents and Methodology
Can you find the terms and their number in the following expressions :
Expression No. of term Name of the term
2ab – 3 2 2ab, -3
13k
2xyz
2y3x16
Try this
Write two expressions each having four terms.
9.3.4 Product, Factor and CoefficientWe know from the previous chapters that in the multiplication 2 × 5 = 10, 10 is theproduct and 2 and 5 are the factors of 10.
When two variables are multiplied, what is the product ?
We write the product of 3 and z = 3 × z = 3z
And product of y and z = y × z = yz
We saw above that an expression consist of one or more terms. For example expression2ab – 3 has 2 terms namely 2ab and -3. Here 2ab is the product of 2, a and b. We saythat 2, a and b are the factors of the term 2ab.
We can represent any algebraic expression into its constituent terms and terms into thefactors by a tree diagram.
Try these : Draw the tree diagram for(i) 3xy + 5y(ii) 7ab – 5a + 2

160
Notes
Algebra as Generalized Arithmetic
Diploma in Elementary Education (D.El.Ed)
Do you know ?
A constant factor is called a numeric factor.
A variable factor is called is a literal (algebraic) factor.
Ex.- 9: The expression 3xy-5y has two terms 3xy and -5y. The numerical factor of aterm calls it numerical coefficient or simply coefficient. 3 is the coefficient of 3xy and -5 is the coefficient of y.
Try these : Identify the coefficient of the terms in the following expressions:
(i) -6ab (ii)3pq
9.3.5 Like and Unlike Terms
Let us examine the factors of the terms 2pq. –pq, 5pq, 12
pq
. These terms have
same literal (algebraic) factors pq but different numerical factors. But the terms 2p,3pq, -5q have different literal factors. We say the terms having the same algebraicfactors as similar or like terms. When the terms do not have the same algebraicfactors are called unlike terms.Ex - 1: In the expression 2a + 5ab – 3a – b , the terms 2a, -3a have same algebraicfactor a. So they are like terms. But the terms 2a, 5ab have different algebraic factors,they are unlike terms. Similarly the terms 5ab and -4 are unlike terms.Try these :1. Group the like terms together from. : 7x, 7, -8x, 8y, x, -y, 15y2. Fill up the table for each group.
Terms Factors Algebraic Factor Like/Unlike TermSame or different
15x 15, x Different unlike12y 12, y
9z
–13z
6xy
2x
–2ab
5ba

161
Algebra as Generalized Arithmetic
Notes
Block 2 : Enriching Contents and Methodology
Check Your Progress :
Now try to assess your understanding of the concepts covered so far by answeringthe following questions:
E1. Write any 2 algebraic expressions using the variables p and q.E2. Write down the expression in the following cases.
(i) 3 added to 5 times the product of x and y(ii) Sum of a and b subtracted from their product.
E3. Identify the variables and constant in 2y – 3z + 5E4. Write down the coefficient of x in each term.
(i) –x(ii) 2xy+y2+z2
(iii) yx32 2
E5. Identity the like terms in the following:
2p, -3pq, pqr21
, -5, 3p
, 3pqr, 5pq
E6. Write the factors in each of the following monomials:(i) 5xy(ii) -3abc
E7. Identity the terms and factors in each expression:(i) 3xy – 5y(ii) ab + 2a – 3y
9.4 OPERATION ON ALGEBRAIC EXPRESSIONSWe are acquainted with the four fundamental operations – addition, subtraction,multiplication and division on numbers. Here we will move systematically from arithmeticto algebra and learn how these operations are worked on letters representing numbers.Since letters represent nos. they follow all the rules and properties of addition, subtraction,multiplication and division of number.
We will perform different operations in algebra in two phases :
(i) Operations on letters
(ii) Operations on expression

162
Notes
Algebra as Generalized Arithmetic
Diploma in Elementary Education (D.El.Ed)
9.4.1 AdditionThere are a number of real life problems in which we need to use algebraic expressionsand apply arithmetic operations on them. Let us see how expressions are added.
(a) Addition of letters/monomials
We have learnt that 2 + 2 + 2 = 2 × 3 = 3 × 2
similarly we can have x + x + x = x × 3 = 3 × x = 3x
and x + x + x + x + x = 5 × x = 5x
Now sum of 3x and 5x = 3x + 5x
= (x + x + x) + (x + x + x + x + x)
= x + x + x + x + x + x + x + x = 8x
Also 3x + 5x = (3 × x) + (5 × x)
= (3 + 5) × x (distributive law)
= 8 × x = 8x
Let us see the following example :
Ex-10: Find the sum of 5ab, 7ab and ab
Solution : The sum = 5ab + 7ab + ab
= (5 × ab) + (7 × ab) + (1 × ab)
= (5 + 7 + 1) × ab = 13 × ab = 13ab
So, 5ab + 7ab + ab = 13ab
Try these :
Find the following sum.
(i) 3p, p and 7p
(ii) 6xyz and 12xyz
Thus we know how two or more like terms can be added. Now think of the additionof unlike terms.
Let us find the sum of 5 mangoes and 3 oranges.
We can not say that the sum is 8 mangoes or 8 oranges
Similarly, the sum of 5x and 3y can not be a single term. We write the result as 5x + 3ywhere both the terms are retained.

163
Algebra as Generalized Arithmetic
Notes
Block 2 : Enriching Contents and Methodology
(b) Addition of Algebraic Expressions : Let us discuss the following examples :
Ex-11: Find the sum of 5a + 7 and 2a – 5.
The sum = 5a + 7 + 2a – 5= (5a + 2a) + (7 – 5) (putting the like terms together)
= 7a + 2Ex-12: Add 4x + 3y, 8 + 2x and 2y – 5
The sum = 4x + 3y + 8 + 2x + 2y – 5
= (4x + 2x) + (2y + 3y) + (8 – 5) (rearranging terms)
= 2x + 5y + 3
Try these :
Add the expressions : (i) mn + 5 and 2nm – 7 (ii) 2a + 3b – 1; 3a + 7 and 5b - 3
Note : Expressions obey closure, commutative, associative, properties in addition.It also has additive identify and additive inverse
9.4.2 SubtractionWe know how to subtract integers earlier. The same principle also works with algebraicexpressions.
(a) Subtraction of Monomials : Let us subtract 2x from 5x
5x – 2x = (x + x + x + x + x) – (x + x)
= x + x + x + x + x – x – x
= x+ ( – x) + x + ( – x) + x + x + x [As x and –x are additive
= 0 + 0 + x + x + x inverse of each other]
= 0 + 3x = 3x
In brief, we can also do the work as follows:
5x – 2x = 5 × x – 2 × x
= (5 – 2) × x = 3 × x = 3x
Let us see another example:
Ex-13 Subtract 7mn from 16mn.
16mn – 7mn = 16 × mn – 7 × mn = (16 – 7)mn = 9 × mn = 9mnBut the difference of two unlike terms is not a monomial rather it will be a binomial.For example, difference of 5x and 3y = 5x – 3y

164
Notes
Algebra as Generalized Arithmetic
Diploma in Elementary Education (D.El.Ed)
Try these :
Subtract
(i) 5 m from 11 m, (ii) 6ab from 10ab (iii) 5xy from 3xy
(b) Subtraction of Algebraic Expressions: The process of subtraction is similarto that of addition. Let us observe the following examples.
Ex-14 Subtract 3a + 2b from 4a + 5b -2Solution: (4a + 5b - 2) – (3a + 2b)
= 4a +5b -2 – 3a - 2b= (4a-3a) + (5b-2b) – 2 (Putting the like terms together)= a + 3b – 2
Alternative method : We shell write the expressions one below the other with the liketerms remaining in one column and perform subtraction on each of the terms separatelyas shown below:
4a + 5b – 2
– 3a 2b
a + 3b – 2
Try these :
Subtract (i) 5x – 9 from 10x + 7b - 3
(ii) 4pq – 5p + 2 from 6pq - 1 + 3q
9.4.3 Multiplication(a) Multiplication of monomials
a×a = a2 where 2 is the number that represents the number of a’s.
The number 2 in a2 is known as index or exponent or power of a and ‘a’ is the base.
Try to fill up the table
No. of a’s Product Base Index
Product of 3 a’ s a3 a 3
a × a × a × a
a × a × a × a × a

165
Algebra as Generalized Arithmetic
Notes
Block 2 : Enriching Contents and Methodology
Let us learn to multiply two terms.
The product of a and b, that is a × b can briefly be written as ‘ab’
Similarly, a × a × b = a2b
a × a × b × b = a2b2 and so on.
What is (i) x × x × x × y × y = ..................................
(ii) m × m × m × n × n × n = ..................................
Now let us discuss some more examples.
Ex-15 Multiply 2x by 3y2x × 3y = 2 × x × 3 × y
= 2 × 3 × x × y = 6 xy (by commutativity of multiplication)Ex-16 Multiply 3mn by -5mn
3mn × (-5mn) = 3 × m × n × (-5) × m × n= 3 × (-5) × (m×m) × (n×n)= -15 × m2 × n2 = -15 m2n2
Ex-17 Find the product of -5pq, 4pqr and 2r(-5pq) × (4pqr) × 2r = (-5) × p × q × 4 × p × q × r × 2 × r
= (-5) × 4 × 2 × p × p × q × q × r × r (rearranging the factors)= -40 × p2 × q2 × r2 = -40 p2 q2 r2
Try these :Find the product(i) 4xy × 2x2
(ii) 5m × 3n × 7mn
(b) Multiplication of a monomial with a polynomial
For this multiplication commutative, associative and distributive properties are used asand when required.
Ex-18 Multiply : (3x – 5) with 2xProduct = (3x- 5) × 2x
= 3x × 2x – 5 × 2x (distributive law)= 3 × 2 × x × x – 5 × 2 × x= 6x2 – 10x

166
Notes
Algebra as Generalized Arithmetic
Diploma in Elementary Education (D.El.Ed)
Ex-19 Multiply 3a with (5a - 2b + 4)
Product = 3a × (5a – 2b + 4)
= 3a × 5a + 3a × (-2b) + 3a × 4 (distributive Law)
= 3 × a × 5 × a + 3 × a × (-2) × b + 3 × a × 4
= 3 × 5 × a × a + 3 × (-2) × a × b + 3 × 4 × a
= 15a2 – 6ab + 12a
Try these :Find the product of(i) 2x – 3y and 5xy(ii) 3mn and (5m – 7mn + 3n)
(c) Multiplication of a polynomial by a polynomial:
Here also we use distributive property.
Ex-20 Multiply ( a + b ) by (3a – 5b)
Solution : (a + b) (3a – 5b)
= a (3a – 5b) + b( 3a – 5b) (distributive Law)
= a × 3a – a × 5b + b × 3a + b × (-5b)
= 3 × a × a – 5 × a × b + 3 × a × b – 5 × b × b
(associative and commutative property)
= 3a2 – 5ab + 3ab – 5b2
= 3a2-2ab – 5b2
Ex-21 Multiply (2x + 5) by (x2 – 3x + 2)
Solution : (2x + 5) × (x2 – 3x + 2)
= 2x × (x2 – 3x + 2) + 5 (x2 – 3x + 2) (distributive Law)
= 2x × x2 – 2x × 3x + 2x × 2 + 5 × x2 – 5 × 3x + 5 × 2
= 2x3 – 2× 3 × x × x + 2 × 2x + 5 x2 – 15x + 10
= 2x3 - 6x2 + 5x2 + 4x – 15x + 10
= 2x3 + (-6 + 5) x2 + (4 – 15) x + 10
= 2x3 – x2 – 11x + 10

167
Algebra as Generalized Arithmetic
Notes
Block 2 : Enriching Contents and Methodology
Try these :
Find the poduct of
(i) (2m + 3n) and (m-2n)
(ii) (pq-1) and (2p + 3q – 5)
9.4.4 DivisionYou know the procedure for division of numbers. Similar procedure is also followedwhile dividing an algebraic expression by another
(a) Division of monomial by a monomial:
Algorithm :
(i) Write the dividend as numerator and divisor as denominator.
(ii) Express the numerator and denominator both as the product of factors.
(iii) Simplify the fraction by cancelling the common factors from the numerator anddenominator.
Now observe the following examples:
Ex-22
(i) Division of 15mn by 5m = m5mn15
n3m5
nm53
(ii) xy6yx18 22 yx6yyxx63
xy6yx18
22
xy3
Try these :
Divide (i) 25xy by -5y (ii) 30a2b2c by 6ab
(b) Division of polynomial by a monomial:
Here the dividend is a polynomial and the divisor is a monomial. The working rulefor division is :
Divide each term of the dividend by the divisor.
Simplify each fraction as earlier.

168
Notes
Algebra as Generalized Arithmetic
Diploma in Elementary Education (D.El.Ed)
Let us workout the following examples:
Ex-23
(i) Divide 9x2 – 15xy by 3x
Now, (9x2 – 15xy) ÷ (3x) =x3
xy15x9 2 y5x3
x3xy15
x3x9 2
(ii) Divide 8a2b - 12ab2 + 20ab by (-4ab)
Now, (8a2b – 12ab2 + 20ab) ÷ (-4ab) = -2a + 3b – 5
Try these :
Divide (i) 6m2n – 9mn2 by 3mn
(ii) 10x3y - 15x2y2 – 5x2y3 by 5xy
(c) Division of Polynomial by a Polynomial:
In case of numbers, we know how to divide the dividend by a divisor by the longdivision process. we have to follow the similar procedure here.
Consider the following examples.
Ex-24: Divide 12x15x11 2 by 3x5
Step-1
Arrange the terms of the dividend and dvisorin descending order of powers of a certainvariable contained in the polynomials.
Step-2
Divide the 1st term of the dividend by the 1stterm of divisor and get the 1st term of thequotient.
Here x3x5x15 2
Step-3
Multiply 3x with each term of the divisor andwrite the result below the dividend. Thensubtract it from the dividend.

169
Algebra as Generalized Arithmetic
Notes
Block 2 : Enriching Contents and Methodology
Step-5
Repeat the process from step 2 to 3considering 20x – 12 as the new dividend.
Here the 2nd term of the quotient 4x5x20
Product of 2nd term of the quotient and thedivisor is now to be subtracted from the newdividend. Result is ‘0’.
Hence the quotient = 3x + 4 and the remainder = 0
215 11 12x x 5 3 3 4x x
Thus we can divide a polynomial by another polynomial in the above mentioned longdivision process.
Note : The 1st term of the dividend should not be of a lower power than the 1st termof the divisor.
Now try to Check Your Progress:
E8. Simplify: 222222 xy2xy2y3x2yxy6x5
E9. Subtract 3m – 5n + 7 from the sum of 2m – 3n + 5 and 8 + 4n.E10. Fill in the blank space:
2 5 3 7a ab a ................ 23 2 5 2a ab b
E11. Multiply(a) (3x – 2) by (2x + 3)
(b) 22 qpqp by (p – q)
E12. Divide aaa 2120163 23 by (a + 4).
9.5 LINEAR ALGEBRAIC EQUATION AND ITSSOLUTION
An equation can be compared with a balance in equilibrium. The two sides of thebalance being compared with the two sides i.e. LHS and RHS of an equation. Theequality sign indicates that the scale pans are balanced. For example in the equation

170
Notes
Algebra as Generalized Arithmetic
Diploma in Elementary Education (D.El.Ed)
3x – 5 = 16, the LHS 3x – 5 is in the left pan and RHS 16 is in the right pan of thebalance. Also the balance is in equilibrium as the values of the two sides of the equationare equal. x in the equation is known as the unknown.
In the sub-unit the most basic form of algebraic equations i.e. the linear equation willbe extensively discussed. The process of solving these equations will also be discussed.
9.5.1 Linear Algebraic EquationLet us discuss a simple problem, ‘to find a number which, when doubled and thenadded to 5 gives 15.’
To write the mathematical statement, in this case, we take the unknown as x, thendouble it and obtain 2x. When 5 is added to this, the result is 2x + 5. We know thatthis equals to 15. Hence the mathematical statement is 2x + 5 = 15, which is theequation in the above case.
When a polynomial is formed using a certain symbol (taken for an unknown) and isequated to a certain number, the statement formed is an equation.
So, 2x + 5 = 15 is one of the simple forms of algebraic equations. Let us observe theexample and write the equation in the table.
Statement Equation
Sum of a number x and 7 is 16 x + 7 = 16
3 subtracted from y is 10
9 times of n is 36
Three – fourth of m is 12
The equations you write in the above table are known as a linear equation with oneunknown and the power of unknown is 1. Hence we say :
An equation involving only a linear polynomial is called a linear equation. A linearequation in one variable generally is of the form ax + b = 0 where a, b are numbers andx is unknown
Linear equations are also known as first degree equations. We shall restrict ourpresent discussion to such equations only.

171
Algebra as Generalized Arithmetic
Notes
Block 2 : Enriching Contents and Methodology
Note :The equation 06x7x2 is not linear because the exponent of the unknownis 2.The equation x + 2y = 5 is linear but it contains 2 unknowns x & y.
9.5.2 Solution of Linear EquationsConsider the linear equation x + 7 = 16. Now what is the value of x ? We will go ontrying the integer 1, 2, 3……… for ‘x’ till we get both sides equal. It can be seen bytrial that only when x = 9, at that point, equality of both sides of the equation occur.For no other value of x the equation is satisfied.
Thus we know that the equation is satisfied i.e. both the sides have equal value only forone value of the unknown.
For example, the equation 2y = 6 is satisfied only for y = 3. Similarly the equationm – 3 = 4 is satisfied only for m = 7.
The value of the unknown which makes the equation a true statement is called thesolution or root of the equation.
To solve an equation is to find the value of the unknown which satisfies the equation.
Process of Solving a Linear Equation :
(a) Process of Trial :
Let us complete the table and by inspection of the table find the solution to the equationx + 7 = 16.
x 1 2 3 4 5 6 7 8 9 10
x + 7
Here we go on trying with the integers for ‘x’ till the equation holds good. In this waywe can obtain the value of the unknown. We say this process as the process of trial.You have seen that after so many unsuccessful trials we got the value of the unknownwhich satisfies the equation. Hence, this process is tedious, time consuming and oftenwe fail to find the solution if it is a large number.
Try these :
Solve the equation by process of trial.
(i) m – 5 = 16
(ii) 2y – 1 = 17

172
Notes
Algebra as Generalized Arithmetic
Diploma in Elementary Education (D.El.Ed)
(b) Process of Adding or Subtracting :
An equation, as already said can be compared to a balance in equilibrium. The twosides of the equation are like the two pans and the equality sign indicates that the pansare balanced. Doing an arithmetic operation on an equation is like adding weights orremoving weights from the pans of the balance. If we add the same weights to both thepans the beam of the balance remains horizontal. Similarly, if we remove equal weightsfrom the pans, the beam also remains horizontal. On the other hand, if we add orremove different weights, the balance is tilted, that is the beam of the balance does notremain horizontal. We use this principle for solving an equation.
Supposing ‘x’ represents the weight of packet of rice kept on the left pan and a weight‘w’ kept on the right pan and the balance remains in equilibrium, then we say : x = w.
Case – IIf we add a weight ‘c’ on both the pans, whether the beam remains horizontal ortilted ?Surely it will remain horizontal.Thus we get, x + c = w + c
Case – IIHad we removed weight ‘c’ from both of the pans, in what state would the beamremain ?
Definitely horizontal.
Thus we get x – c = w – c
Case – IIISimilarly, if we make the weights on both the pans ‘c’ times, the beam would stillremain horizontal.
The mathematical representation of this situation is
xc = wc
Case – IVAlso if we make the weights on both the pans ‘ c
1’, (where oc ) times then the
beam would remain balanced.
Thus we get, cw
cx (when 0c )

173
Algebra as Generalized Arithmetic
Notes
Block 2 : Enriching Contents and Methodology
From the above properties of weighing with a balance, we got four rules of equality forsolving an equation. Those rules help in solving linear equations in precise manner. Therules state as follows :
The same quantity can be added to both sides of an equation and it does notchange the equality.The same quantity can be subtracted from both sides of an equation and it doesnot change the equality.Both sides of an equation may be multiplied by the same number and it does notchange equality.Both sides of an equation may be divided by a non-zero number and it does notchange the quality.
Let us apply the above rules in solving the linear equations :
Ex-25 Solve: y – 5 = 11
Solution : Solving an equation means finding the value of the unknown.
So, y – 5 = 11
51155 y (Adding 5 on both the sides)
1655 y (Associativity)
610 y (Additive inverse)
61 y (Additive identity)
Ex-26 Solve z + 4 = 8Solution : z + 4 = 8
4844z (Subtracting 4 from both the sides)
444z (Associativity)
40z (Additive inverse)
4z (Additive Identity)
Ex-27 Solve : 123x
Solution : 123x
31233x
(Multiplying 3 to both sides)

174
Notes
Algebra as Generalized Arithmetic
Diploma in Elementary Education (D.El.Ed)
36331x
(Associativity)
361x (Multiplicative inverse)
36x (Multiplicative identity)
Ex-28 Solve : 5x – 2 = 28
Solution : Here the numerical term (constant) is to be eliminated first.So, 5x – 2 = 28
22822x5 (Adding 2 to both the sides)
3022x5 (Associativity)
300x5 (Additive inverse)
30x5 (Additive identity)
530
5x5 (Dividing both sides by 5)
6x (Answer)
Note :In practice we shall not show the steps where the rule/properties are applied.
Try these :
Solve the following equation :
(i) 3x + 2 = 14 (ii) 514x
(c) Process of Transposition
While solving a linear equation, we can transpose a number from LHS to RHS or viceversa instead of adding or subtracting it from both sides of the equation. In doing so,the operation that connects the number on one side of the equation changes as it isremoved to the other side. That is on transposing a term from one side to the other theoperation of :(i) Addition changes to subtraction(ii) Subtraction changes to addition(iii) Multiplication changes to division(iv) Division changes to multiplication

175
Algebra as Generalized Arithmetic
Notes
Block 2 : Enriching Contents and Methodology
These are called the Rules of Transposition.Let us apply these rules in solving the following equations.
Ex-29 Solve: 2x – 7 = 5Solution: 2x – 7 = 5
75x2 (Transposing 7 to RHS)
12x2
212x (Transposing 2 to RHS)
6x
Ex-30 Solve : 63
2y5
Solution: 63
2y5
362y5
182y5
218y5
20y5
4520y
4y
Try these :
Solve by transposition
(i) 3p + 2 = 17 (ii) 2 (x + 4) = 12
(d) Rule of Cross Multiplication
If the equation involves a fraction, let us learn an easier method to remove the fractionwithout disturbing the equality.
Suppose the equation is of the form dc
ba
bdca (Transposing ‘b’ to RHS)

176
Notes
Algebra as Generalized Arithmetic
Diploma in Elementary Education (D.El.Ed)
dbca
bcda (Transposing ‘c’ to LHS)
Thus we find: bcdadc
ba
Otherwise – dc
ba
bddcbd
ba
(Multiplying ‘bd’ on both sides)
cbad
This is known as Rule of Cross Multiplication.Let us observe some examples for a better understanding.
Ex-31 Solve : 47x
21x3
Solution: 47x
21x3
27x41x3 (By cross multiplying)
14x24x12 (Distribute law)
414x2x12 (Bringing unknown terms to LHS and
Constants to RHS)
10x10
1010x (Transposing 10 to RHS)
1x
Ex-32 Solve : 75
3y21y3
Solution:75
3y21y3
532713 yy (cross multiplication)

177
Algebra as Generalized Arithmetic
Notes
Block 2 : Enriching Contents and Methodology
1510721 yy7151021 yy
2211 y
21122
y
Thus we have discussed four processes of solving a linear equation with one unknown.Among those, processes of transposition and cross multiplication are widely used.
Now try to answer the following questions to Check Your Progress:
E13 Solve the following equations.
(i) 7x = 28 (ii) 3y - 2 = 19 (iii) 632
x
E14 Solve the following equations.(i) 28 = 4 + 3 (t + 5) (ii) 2(2p – 3) = 6
E15 Solve the following equations.
(i) 34
638
xx
(ii) 85
7x33x2
9.6 SOLUTION OF WORD PROBLEMS/APPLICATION OF ALGEBRAIC METHODS
We have learnt how to convert a mathematical statement into a simple equation. Alsowe have learnt how to solve simple equations. The algorithm (method) involved insolving real life problems is to :(i) Understand the situation expressed in the word problem.(ii) Choose a symbol and substitute it for the unknown to be determined.(iii) Write an equation from the given relation in the problem.(iv) Solve the equation and find the value of the unknown.(v) Verify the correctness of the solution.Let us discuss the following examples:
Ex- 33 Mita thinks of a number. If she takes away 7 from 4 times of the number, theresult is 17. What is the number ?Solution :
Suppose Mita thinks of the number x.4 times of the number = 4x

178
Notes
Algebra as Generalized Arithmetic
Diploma in Elementary Education (D.El.Ed)
After taking away 7 from 4x, Mita has 4x - 7.According to the problem, 4x - 7 = 17Hence we got the equation for x.Let us now solve the equation 4x - 7 = 17
7174 x 244 x
424x
6x
So, the required number is 6
Checking the answer :
LHS = 4x – 7 = 4 × 6 – 7 = 24 – 7 = 17 = RHS as required
Ex-34 Vicky is 5 years older than Ricky. 15 years back Vicky’s age was 2 times thatof Ricky. What are their present ages ?
Solution :
Among them, Ricky is younger.
So let us take the present age of Ricky to be z
The present age of Vicky = (z + 5) years
15 years back, the age of Vicky was z + 5 – 15 = z – 10 years.
And the age of Ricky then was (z – 15) years.
According to the given relation.
Vicky’s age is 2 times of Ricky’s age
z – 10 = 2 (z - 15)
z – 10 = 2z – 30
z – 2z = -30 + 10 z = 20
So, the present age of Ricky = 20 years and that of Vicky = 20 + 5 = 25 years.
Solve the following to Check Your Progress:
E16. The sum of two numbers is 64. One number is 14 more than the other. Whatare the numbers ?
E17. Solve the following problems.
(a) Sachin scores twice as many runs as Dhoni. Together their runs fell oneshort of a century. How many runs did each one score?

179
Algebra as Generalized Arithmetic
Notes
Block 2 : Enriching Contents and Methodology
(b) People of Naraharipur planted 102 trees in the village garden. The numberof non-fruit trees ware 2 more than three times the number of fruit trees.What is the number of fruit trees planted?
(c) Sania’s age is half the age of her father and her father’s age is half the ageof her grand father. After twenty years her age will be equal to the presentage of her father. What are the present ages of Sania, her father and hergrand father?
E18. Solve the following equation:
2 3 53 7 8
xx
9.7 LET US SUM UPAlgebra is generalized arithmetic where letters are used as symbols to representnumbers. Every number is a constant and every symbol can be assigned differentvalues in different situations.
Algebraic expressions are formed using symbols and constants. We also use fourfundamental operations on the symbols and constants to from expressions.
Terms are parts of an expression which are separated by ‘+’ or ‘_’ sign. It maybe a constant, a variable or combination of both.
Any expression having one or more terms is called a Polynomial. Specificallyexpression having one term is called monomial, having two terms is a binomialand degree of the polynomial is the highest degree of the term among all the terms
The two sides of an equation are like the two pans of a balance
Linear equations can be solved by using any of the four methods : by trial, additionand subtraction of equal quantity to both the sides, transposition and crossmultiplication.
9.8 MODEL ANSWERS TO CHECK YOURPROGRESS
E1. p + q, 2p – q, 3p + 2q – 1 or any three similar expressions.
E2. (i) 5xy + 3 (ii) ab - (a + b)
E3. Variables = y & z, Constant = 2, 3, 5

180
Notes
Algebra as Generalized Arithmetic
Diploma in Elementary Education (D.El.Ed)
E4. (i) -1, (ii) 2y (iii) xy32
E5.
3p,p2 , (-3pq, 5pq),
pqr3,pqr
21
E6. (i) coefficient of xy = 5 , that of 5 = xy etc.
(ii) Coefficient of 3 = -abc, that of abc = -3 etc.
E7. (i) Terms = 3xy, 5y ; Factors of 3xy = 3, x, y ; Factors of 5y = 5, y
(ii) Terms = ab, 2a and 3y
E8. 4x2 – 4xy – 6y2
E9. - m+ 6n + 6
E10. 2a2 + 7ab + 3a - 5b – 5
E11. (a) 6x2 + 5x – 6 (b) p3 – q3
E12. (i) 3a2 + 4a + 5
E13. (i) x = 4 (ii) y = 7 (iii) x = 18
E14. (i) t = 3 (ii) p = 3
E15. (i) x = 2 (ii) x = 11
E16. 25 and 39
E17. (a) Dhoni = 33, Sachin = 66 (b) 25 (c) 20 ,40, 80
E18. x = 11
9.9 SUGGESTED READINGS AND REFERENCESBansal, R.K. (2007). Middle school mathematics. New Delhi: Selina Publication.
NCTM (1999). Activities for Junior High School and Middle School Mathematics,Vol.2, The National Council of Teachers of Mathematics(NCTM), INC, USA.
Teaching of Maths at Upper Primary Level, Vol.- II Published by DEP-SSA, IGNOU,New Delhi
Text Book of Cl- VI, Vii and VIII published by NCERT, New Delhi.

181
Algebra as Generalized Arithmetic
Notes
Block 2 : Enriching Contents and Methodology
9.10 UNIT-END EXERCISE1. Write the expression for the followings.
(i) One third of the sum of numbers p and q.
(ii) Sum of the nos. a and b subtracted from their product.
(iii) 8 added to 2 times the product of x & y.
2. Find the coefficient (i) of xy in – 5xyz, (ii) of m2 in 2 m2n2 (iii) 9 in – 9 pqr.
3. Identify the numerical coefficient of (i) –t (ii) pq32
(iii) – 8 x2y2
4. Give one example of (i) Monomial (ii) Binomial (iii) Trinomial.
5. Write the like terms together in separate groups
(i) ab2, - 4ab, 2a2b, ab, - 3ab2, 32
ab, -5a2b, a2b2
(ii) 2x, - 5xy, - x, 2xy
, 3y
6. Add the following expressions :
(i) a + b – 5, b – a + 3 and a – b + 6
(ii) 4x + 3y – 7xy, 3xy – 2x and 2xy – y
(iii) m2 – n2 – 1, n2 – 1 – m2 and 1 – m2 – n2
7. Subtract :
(i) x (y – 3) from y (3 – x)
(ii) m2 + 10m – 5 from 5m – 10.
(iii) 5a2 – 7ab + 5b2 from 2ab – 3a2 – 3b2
8. Simplify the expression :
(i) 10x2 – 8x + 5 + -5x – 4x2 – 6m – 10
(ii) 20mn – 10n – 17m – 12n + 14m + 2
9 Multiply :
(i) (a – b) by (a2 + ab + b2)
(ii) (p + q – 5) by (p - q)

182
Notes
Algebra as Generalized Arithmetic
Diploma in Elementary Education (D.El.Ed)
10. Divide:
(i) (8m2 + 4m – 60) by (2m – 5)
(ii) (6 a2b2 – 7abc – 3b2) by (3ab + c)
11. Solve the following equations:
(i) 2y – 5 = 9 (ii) 513
53
x
(iii) 4053
zz(iv) 3
436
8
xx
12. Solve the following problems :
(i) The length of a rectangular plot exceeds its breadth by 5m. The perimeterof the plot is 70m. Find the length of the plot.
(ii) In an isosceles triangle the base angles are equal. The vertex angle is 15°
more than each of the base angles. Find the measure of the angles of thetriangle.