Effluents with soluble metabolites generated from acidogenic and methanogenic processes as substrate...
9
Effluents with soluble metabolites generated from acidogenic and methanogenic processes as substrate for additional hydrogen production through photo-biological process S. Srikanth, S. Venkata Mohan*, M. Prathima Devi, M. Lenin Babu, P.N. Sarma Bioengineering and Environmental Centre, Indian Institute of Chemical Technology, Tarnka, Hyderabad 500 007, Andhra pradesh, India article info Article history: Received 16 October 2008 Received in revised form 17 November 2008 Accepted 18 November 2008 Available online 21 January 2009 Keywords: Mixed culture Acidophilic Dark fermentation Wastewater treatment Total volatile fatty acids abstract The feasibility of utilizing effluents generated from acidogenic [producing biohydrogen (H 2 )] and methanogenic [producing methane] processes was studied for additional H 2 production by terminally integrating with photo-biological process employing enriched mixed culture. Experimental data has depicted enhanced process efficiency with respect to additional H 2 production and substrate degradation through photo-biological process. However, the efficiency was found to depend on the process used in the first stage along with nature and composition of the substrate. Acidogenic process in the first stage had more positive influence on photo-biological H 2 production [synthetic wastewater – 14.40 mol/Kg COD R and 15.16 mol/Kg COD R (with vitamins); dairy wastewater – 13.29 mol/ Kg COD R and 13.70 mol/Kg COD R (with vitamins)] over the corresponding methanogenic process. Effluent generated from acidogenic treatment of dairy wastewater yielded high substrate degradation rate (SDR) [1.20 Kg COD/m 3 day and 1.34 Kg COD/m 3 day (vitamins)] followed by synthetic wastewater [0.92 Kg COD/m 3 day and 1.05 Kg COD/m 3 day (vitamins)]. Among the studied experimental variations chemical wastewater evidenced poor H 2 production and SDR. Vitamin solution showed positive influence on both H 2 production and wastewater treatment irrespective of the experimental variations studied. ª 2008 International Association for Hydrogen Energy. Published by Elsevier Ltd. All rights reserved. 1. Introduction Increasing demand for energy and the resulting crisis in asso- ciation with the green house pollution from the combustion of fossil fuels led for search towards alternative and eco-friendly energy sources. In this direction, a great deal of attention is being focused on the usage of hydrogen (H 2 ) as an alternative energy source which may play a pivotal role in future energy supply. H 2 production by biological route is considered to be advantageous compared to traditional methods due to its environmental friendly nature. Biological H 2 production processes can be classified as biophotolysis by algae/ cyanobacteria, photodecomposition by photosynthetic bacteria and dark fermentation by anaerobic bacteria [1–6]. Most of these processes occur at ambient temperatures and pressures, are less energy intensive and more environmental friendly and thus opening a new avenue for the utilization of renewable energy sources such as wastewater which are inexhaustible [1,6–11]. A practical and efficient H 2 generation process is a growing concern among the research fraternity [9] and various strat- egies in this direction were reported [3–6,12–17]. Light- dependent (photo-biological) or light independent (dark) fermentative conversions of organic substrates manifest * Corresponding author. E-mail address: [email protected] (S. Venkata Mohan). Available at www.sciencedirect.com journal homepage: www.elsevier.com/locate/he 0360-3199/$ – see front matter ª 2008 International Association for Hydrogen Energy. Published by Elsevier Ltd. All rights reserved. doi:10.1016/j.ijhydene.2008.11.060 international journal of hydrogen energy 34 (2009) 1771–1779
-
Upload
ewi-vlaanderen -
Category
Documents
-
view
0 -
download
0
Transcript of Effluents with soluble metabolites generated from acidogenic and methanogenic processes as substrate...
i n t e r n a t i o n a l j o u r n a l o f h y d r o g e n e n e r g y 3 4 ( 2 0 0 9 ) 1 7 7 1 – 1 7 7 9
Avai lab le a t www.sc iencedi rec t .com
j ourna l homepage : www.e lsev ier . com/ loca te /he
Effluents with soluble metabolites generated from acidogenicand methanogenic processes as substrate for additionalhydrogen production through photo-biological process
S. Srikanth, S. Venkata Mohan*, M. Prathima Devi, M. Lenin Babu, P.N. Sarma
Bioengineering and Environmental Centre, Indian Institute of Chemical Technology, Tarnka, Hyderabad 500 007, Andhra pradesh, India
a r t i c l e i n f o
Article history:
Received 16 October 2008
Received in revised form
17 November 2008
Accepted 18 November 2008
Available online 21 January 2009
Keywords:
Mixed culture
Acidophilic
Dark fermentation
Wastewater treatment
Total volatile fatty acids
* Corresponding author.E-mail address: [email protected] (S
0360-3199/$ – see front matter ª 2008 Interndoi:10.1016/j.ijhydene.2008.11.060
a b s t r a c t
The feasibility of utilizing effluents generated from acidogenic [producing biohydrogen
(H2)] and methanogenic [producing methane] processes was studied for additional H2
production by terminally integrating with photo-biological process employing enriched
mixed culture. Experimental data has depicted enhanced process efficiency with respect to
additional H2 production and substrate degradation through photo-biological process.
However, the efficiency was found to depend on the process used in the first stage along
with nature and composition of the substrate. Acidogenic process in the first stage had
more positive influence on photo-biological H2 production [synthetic wastewater –
14.40 mol/Kg CODR and 15.16 mol/Kg CODR (with vitamins); dairy wastewater – 13.29 mol/
Kg CODR and 13.70 mol/Kg CODR (with vitamins)] over the corresponding methanogenic
process. Effluent generated from acidogenic treatment of dairy wastewater yielded high
substrate degradation rate (SDR) [1.20 Kg COD/m3 day and 1.34 Kg COD/m3 day (vitamins)]
followed by synthetic wastewater [0.92 Kg COD/m3 day and 1.05 Kg COD/m3 day (vitamins)].
Among the studied experimental variations chemical wastewater evidenced poor H2
production and SDR. Vitamin solution showed positive influence on both H2 production
and wastewater treatment irrespective of the experimental variations studied.
ª 2008 International Association for Hydrogen Energy. Published by Elsevier Ltd. All rights
reserved.
1. Introduction cyanobacteria, photodecomposition by photosynthetic bacteria
Increasing demand for energy and the resulting crisis in asso-
ciation with the green house pollution from the combustion of
fossil fuels led for search towards alternative and eco-friendly
energy sources. In this direction, a great deal of attention is
being focused on the usage of hydrogen (H2) as an alternative
energy source which may play a pivotal role in future energy
supply. H2 production by biological route is considered to be
advantageous compared to traditional methods due to its
environmental friendly nature. Biological H2 production
processes can be classified as biophotolysis by algae/
. Venkata Mohan).ational Association for H
and dark fermentation by anaerobic bacteria [1–6]. Most of these
processes occur at ambient temperatures and pressures, are
less energy intensive and more environmental friendly and
thus opening a new avenue for the utilization of renewable
energy sources such as wastewater which are inexhaustible
[1,6–11].
A practical and efficient H2 generation process is a growing
concern among the research fraternity [9] and various strat-
egies in this direction were reported [3–6,12–17]. Light-
dependent (photo-biological) or light independent (dark)
fermentative conversions of organic substrates manifest
ydrogen Energy. Published by Elsevier Ltd. All rights reserved.
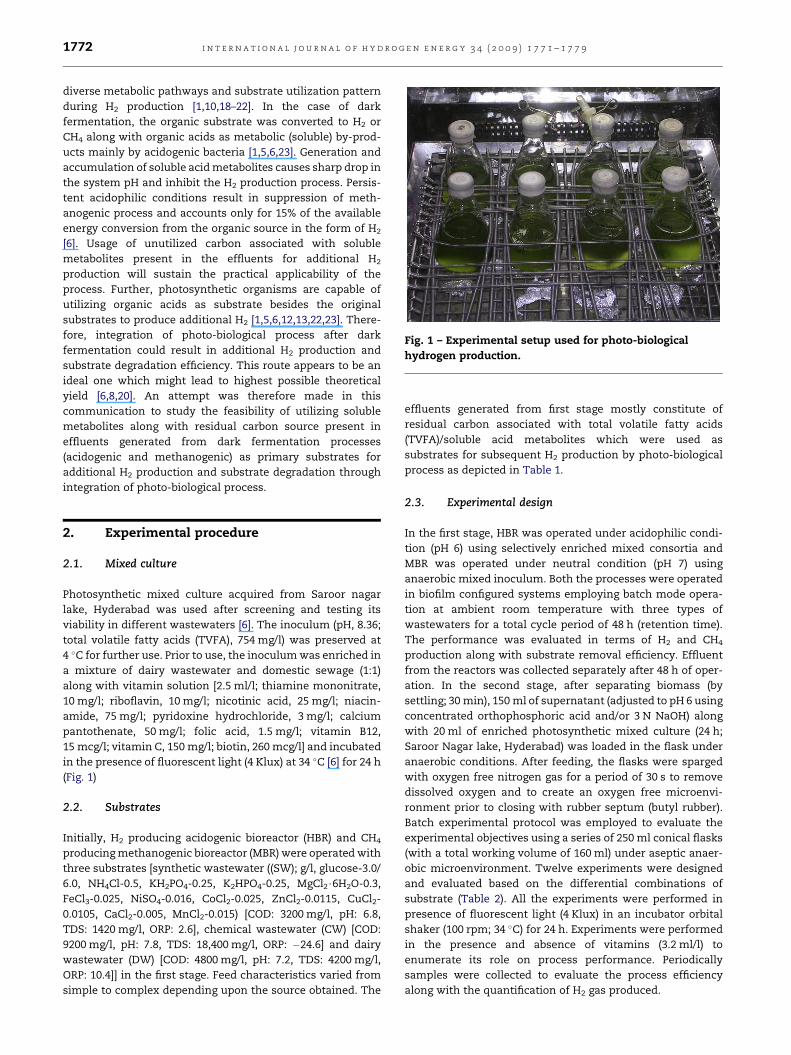
Fig. 1 – Experimental setup used for photo-biological
hydrogen production.
i n t e r n a t i o n a l j o u r n a l o f h y d r o g e n e n e r g y 3 4 ( 2 0 0 9 ) 1 7 7 1 – 1 7 7 91772
diverse metabolic pathways and substrate utilization pattern
during H2 production [1,10,18–22]. In the case of dark
fermentation, the organic substrate was converted to H2 or
CH4 along with organic acids as metabolic (soluble) by-prod-
ucts mainly by acidogenic bacteria [1,5,6,23]. Generation and
accumulation of soluble acid metabolites causes sharp drop in
the system pH and inhibit the H2 production process. Persis-
tent acidophilic conditions result in suppression of meth-
anogenic process and accounts only for 15% of the available
energy conversion from the organic source in the form of H2
[6]. Usage of unutilized carbon associated with soluble
metabolites present in the effluents for additional H2
production will sustain the practical applicability of the
process. Further, photosynthetic organisms are capable of
utilizing organic acids as substrate besides the original
substrates to produce additional H2 [1,5,6,12,13,22,23]. There-
fore, integration of photo-biological process after dark
fermentation could result in additional H2 production and
substrate degradation efficiency. This route appears to be an
ideal one which might lead to highest possible theoretical
yield [6,8,20]. An attempt was therefore made in this
communication to study the feasibility of utilizing soluble
metabolites along with residual carbon source present in
effluents generated from dark fermentation processes
(acidogenic and methanogenic) as primary substrates for
additional H2 production and substrate degradation through
integration of photo-biological process.
2. Experimental procedure
2.1. Mixed culture
Photosynthetic mixed culture acquired from Saroor nagar
lake, Hyderabad was used after screening and testing its
viability in different wastewaters [6]. The inoculum (pH, 8.36;
total volatile fatty acids (TVFA), 754 mg/l) was preserved at
4 �C for further use. Prior to use, the inoculum was enriched in
a mixture of dairy wastewater and domestic sewage (1:1)
along with vitamin solution [2.5 ml/l; thiamine mononitrate,
10 mg/l; riboflavin, 10 mg/l; nicotinic acid, 25 mg/l; niacin-
amide, 75 mg/l; pyridoxine hydrochloride, 3 mg/l; calcium
pantothenate, 50 mg/l; folic acid, 1.5 mg/l; vitamin B12,
15 mcg/l; vitamin C, 150 mg/l; biotin, 260 mcg/l] and incubated
in the presence of fluorescent light (4 Klux) at 34 �C [6] for 24 h
(Fig. 1)
2.2. Substrates
Initially, H2 producing acidogenic bioreactor (HBR) and CH4
producing methanogenic bioreactor (MBR) were operated with
three substrates [synthetic wastewater ((SW); g/l, glucose-3.0/
6.0, NH4Cl-0.5, KH2PO4-0.25, K2HPO4-0.25, MgCl2$6H2O-0.3,
FeCl3-0.025, NiSO4-0.016, CoCl2-0.025, ZnCl2-0.0115, CuCl2-
0.0105, CaCl2-0.005, MnCl2-0.015) [COD: 3200 mg/l, pH: 6.8,
TDS: 1420 mg/l, ORP: 2.6], chemical wastewater (CW) [COD:
9200 mg/l, pH: 7.8, TDS: 18,400 mg/l, ORP: �24.6] and dairy
wastewater (DW) [COD: 4800 mg/l, pH: 7.2, TDS: 4200 mg/l,
ORP: 10.4]] in the first stage. Feed characteristics varied from
simple to complex depending upon the source obtained. The
effluents generated from first stage mostly constitute of
residual carbon associated with total volatile fatty acids
(TVFA)/soluble acid metabolites which were used as
substrates for subsequent H2 production by photo-biological
process as depicted in Table 1.
2.3. Experimental design
In the first stage, HBR was operated under acidophilic condi-
tion (pH 6) using selectively enriched mixed consortia and
MBR was operated under neutral condition (pH 7) using
anaerobic mixed inoculum. Both the processes were operated
in biofilm configured systems employing batch mode opera-
tion at ambient room temperature with three types of
wastewaters for a total cycle period of 48 h (retention time).
The performance was evaluated in terms of H2 and CH4
production along with substrate removal efficiency. Effluent
from the reactors was collected separately after 48 h of oper-
ation. In the second stage, after separating biomass (by
settling; 30 min), 150 ml of supernatant (adjusted to pH 6 using
concentrated orthophosphoric acid and/or 3 N NaOH) along
with 20 ml of enriched photosynthetic mixed culture (24 h;
Saroor Nagar lake, Hyderabad) was loaded in the flask under
anaerobic conditions. After feeding, the flasks were sparged
with oxygen free nitrogen gas for a period of 30 s to remove
dissolved oxygen and to create an oxygen free microenvi-
ronment prior to closing with rubber septum (butyl rubber).
Batch experimental protocol was employed to evaluate the
experimental objectives using a series of 250 ml conical flasks
(with a total working volume of 160 ml) under aseptic anaer-
obic microenvironment. Twelve experiments were designed
and evaluated based on the differential combinations of
substrate (Table 2). All the experiments were performed in
presence of fluorescent light (4 Klux) in an incubator orbital
shaker (100 rpm; 34 �C) for 24 h. Experiments were performed
in the presence and absence of vitamins (3.2 ml/l) to
enumerate its role on process performance. Periodically
samples were collected to evaluate the process efficiency
along with the quantification of H2 gas produced.
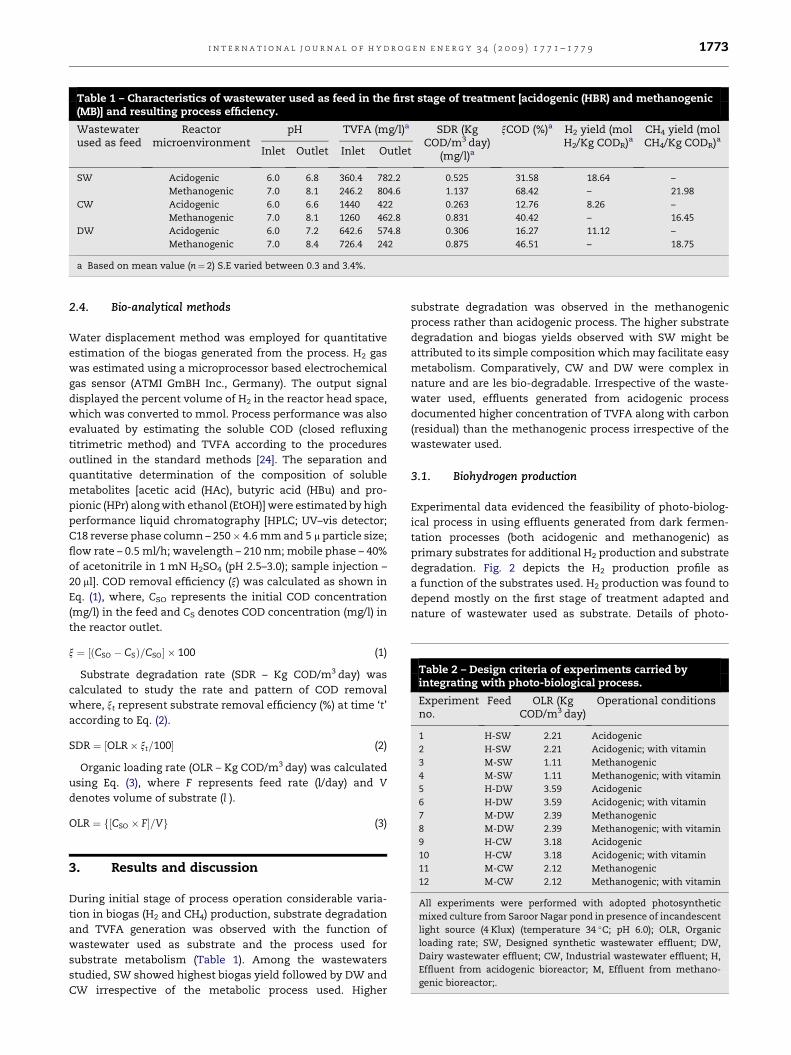
Table 1 – Characteristics of wastewater used as feed in the first stage of treatment [acidogenic (HBR) and methanogenic(MB)] and resulting process efficiency.
Wastewaterused as feed
Reactormicroenvironment
pH TVFA (mg/l)a SDR (KgCOD/m3 day)
(mg/l)a
xCOD (%)a H2 yield (molH2/Kg CODR)a
CH4 yield (molCH4/Kg CODR)a
Inlet Outlet Inlet Outlet
SW Acidogenic 6.0 6.8 360.4 782.2 0.525 31.58 18.64 –
Methanogenic 7.0 8.1 246.2 804.6 1.137 68.42 – 21.98
CW Acidogenic 6.0 6.6 1440 422 0.263 12.76 8.26 –
Methanogenic 7.0 8.1 1260 462.8 0.831 40.42 – 16.45
DW Acidogenic 6.0 7.2 642.6 574.8 0.306 16.27 11.12 –
Methanogenic 7.0 8.4 726.4 242 0.875 46.51 – 18.75
a Based on mean value (n¼ 2) S.E varied between 0.3 and 3.4%.
Table 2 – Design criteria of experiments carried byintegrating with photo-biological process.
Experimentno.
Feed OLR (KgCOD/m3 day)
Operational conditions
1 H-SW 2.21 Acidogenic
2 H-SW 2.21 Acidogenic; with vitamin
3 M-SW 1.11 Methanogenic
4 M-SW 1.11 Methanogenic; with vitamin
5 H-DW 3.59 Acidogenic
6 H-DW 3.59 Acidogenic; with vitamin
7 M-DW 2.39 Methanogenic
8 M-DW 2.39 Methanogenic; with vitamin
9 H-CW 3.18 Acidogenic
10 H-CW 3.18 Acidogenic; with vitamin
11 M-CW 2.12 Methanogenic
12 M-CW 2.12 Methanogenic; with vitamin
All experiments were performed with adopted photosynthetic
mixed culture from Saroor Nagar pond in presence of incandescent
light source (4 Klux) (temperature 34 �C; pH 6.0); OLR, Organic
loading rate; SW, Designed synthetic wastewater effluent; DW,
Dairy wastewater effluent; CW, Industrial wastewater effluent; H,
Effluent from acidogenic bioreactor; M, Effluent from methano-
genic bioreactor;.
i n t e r n a t i o n a l j o u r n a l o f h y d r o g e n e n e r g y 3 4 ( 2 0 0 9 ) 1 7 7 1 – 1 7 7 9 1773
2.4. Bio-analytical methods
Water displacement method was employed for quantitative
estimation of the biogas generated from the process. H2 gas
was estimated using a microprocessor based electrochemical
gas sensor (ATMI GmBH Inc., Germany). The output signal
displayed the percent volume of H2 in the reactor head space,
which was converted to mmol. Process performance was also
evaluated by estimating the soluble COD (closed refluxing
titrimetric method) and TVFA according to the procedures
outlined in the standard methods [24]. The separation and
quantitative determination of the composition of soluble
metabolites [acetic acid (HAc), butyric acid (HBu) and pro-
pionic (HPr) along with ethanol (EtOH)] were estimated by high
performance liquid chromatography [HPLC; UV–vis detector;
C18 reverse phase column – 250� 4.6 mm and 5 m particle size;
flow rate – 0.5 ml/h; wavelength – 210 nm; mobile phase – 40%
of acetonitrile in 1 mN H2SO4 (pH 2.5–3.0); sample injection –
20 ml]. COD removal efficiency (x) was calculated as shown in
Eq. (1), where, CSO represents the initial COD concentration
(mg/l) in the feed and CS denotes COD concentration (mg/l) in
the reactor outlet.
x ¼ ½ðCSO � CSÞ=CSO� � 100 (1)
Substrate degradation rate (SDR – Kg COD/m3 day) was
calculated to study the rate and pattern of COD removal
where, xt represent substrate removal efficiency (%) at time ‘t’
according to Eq. (2).
SDR ¼ ½OLR� xt=100� (2)
Organic loading rate (OLR – Kg COD/m3 day) was calculated
using Eq. (3), where F represents feed rate (l/day) and V
denotes volume of substrate (l ).
OLR ¼ f½CSO � F�=Vg (3)
3. Results and discussion
During initial stage of process operation considerable varia-
tion in biogas (H2 and CH4) production, substrate degradation
and TVFA generation was observed with the function of
wastewater used as substrate and the process used for
substrate metabolism (Table 1). Among the wastewaters
studied, SW showed highest biogas yield followed by DW and
CW irrespective of the metabolic process used. Higher
substrate degradation was observed in the methanogenic
process rather than acidogenic process. The higher substrate
degradation and biogas yields observed with SW might be
attributed to its simple composition which may facilitate easy
metabolism. Comparatively, CW and DW were complex in
nature and are les bio-degradable. Irrespective of the waste-
water used, effluents generated from acidogenic process
documented higher concentration of TVFA along with carbon
(residual) than the methanogenic process irrespective of the
wastewater used.
3.1. Biohydrogen production
Experimental data evidenced the feasibility of photo-biolog-
ical process in using effluents generated from dark fermen-
tation processes (both acidogenic and methanogenic) as
primary substrates for additional H2 production and substrate
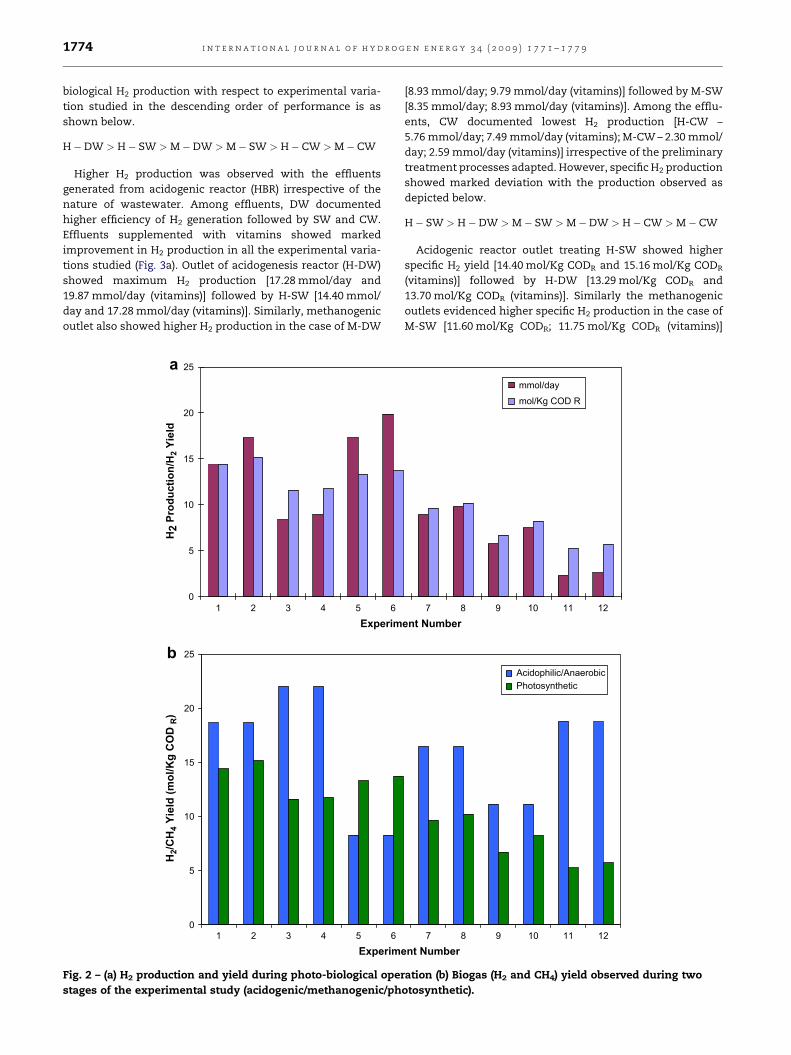
degradation. Fig. 2 depicts the H2 production profile as
a function of the substrates used. H2 production was found to
depend mostly on the first stage of treatment adapted and
nature of wastewater used as substrate. Details of photo-
i n t e r n a t i o n a l j o u r n a l o f h y d r o g e n e n e r g y 3 4 ( 2 0 0 9 ) 1 7 7 1 – 1 7 7 91774
biological H2 production with respect to experimental varia-
tion studied in the descending order of performance is as
shown below.
H�DW > H� SW > M�DW > M� SW > H� CW > M� CW
Higher H2 production was observed with the effluents
generated from acidogenic reactor (HBR) irrespective of the
nature of wastewater. Among effluents, DW documented
higher efficiency of H2 generation followed by SW and CW.
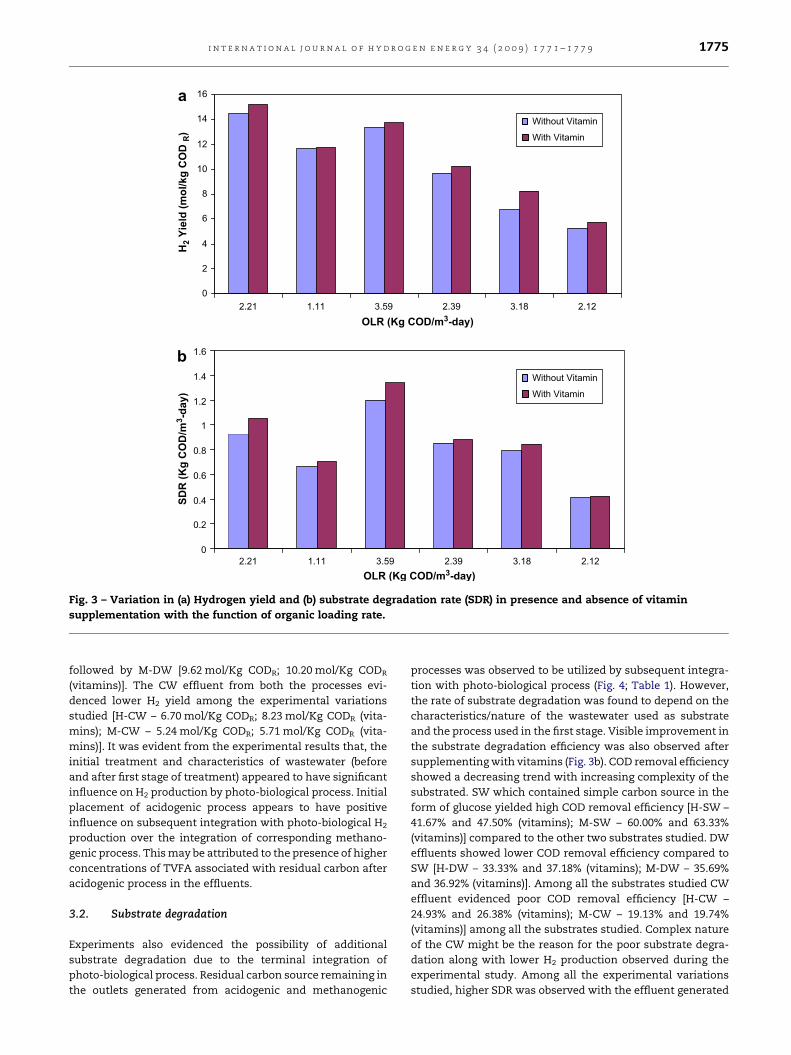
Effluents supplemented with vitamins showed marked
improvement in H2 production in all the experimental varia-
tions studied (Fig. 3a). Outlet of acidogenesis reactor (H-DW)
showed maximum H2 production [17.28 mmol/day and
19.87 mmol/day (vitamins)] followed by H-SW [14.40 mmol/
day and 17.28 mmol/day (vitamins)]. Similarly, methanogenic
outlet also showed higher H2 production in the case of M-DW
0
5
10
15
20
25
1 2 3 4 5 6
Experim
1 2 3 4 5 6
Experim
H2 P
ro
du
ctio
n/H
2 Y
ield
0
5
10
15
20
25
H2/C
H4 Y
ield
(m
ol/K
g C
OD
R)
b
a
Fig. 2 – (a) H2 production and yield during photo-biological oper
stages of the experimental study (acidogenic/methanogenic/ph
[8.93 mmol/day; 9.79 mmol/day (vitamins)] followed by M-SW
[8.35 mmol/day; 8.93 mmol/day (vitamins)]. Among the efflu-
ents, CW documented lowest H2 production [H-CW –
5.76 mmol/day; 7.49 mmol/day (vitamins); M-CW – 2.30 mmol/
day; 2.59 mmol/day (vitamins)] irrespective of the preliminary
treatment processes adapted. However, specific H2 production
showed marked deviation with the production observed as
depicted below.
H� SW > H�DW > M� SW > M�DW > H� CW > M� CW
Acidogenic reactor outlet treating H-SW showed higher
specific H2 yield [14.40 mol/Kg CODR and 15.16 mol/Kg CODR
(vitamins)] followed by H-DW [13.29 mol/Kg CODR and
13.70 mol/Kg CODR (vitamins)]. Similarly the methanogenic
outlets evidenced higher specific H2 production in the case of
M-SW [11.60 mol/Kg CODR; 11.75 mol/Kg CODR (vitamins)]
7 8 9 10 11 12
ent Number
7 8 9 10 11 12
ent Number
mmol/day
mol/Kg COD R
Acidophilic/AnaerobicPhotosynthetic
ation (b) Biogas (H2 and CH4) yield observed during two
otosynthetic).
0
2
4
6
8
10
12
14
16
2.21 1.11 3.59 2.39 3.18 2.12OLR (Kg COD/m
3-day)
H2 Y
ield
(m
ol/kg
C
OD
R)
0
0.2
0.4
0.6
0.8
1
1.2
1.4
1.6
2.21 1.11 3.59 2.39 3.18 2.12OLR (Kg COD/m
3-day)
SD
R (K
g C
OD
/m
3-d
ay)
b
a
Without Vitamin
With Vitamin
Without Vitamin
With Vitamin
Fig. 3 – Variation in (a) Hydrogen yield and (b) substrate degradation rate (SDR) in presence and absence of vitamin
supplementation with the function of organic loading rate.
i n t e r n a t i o n a l j o u r n a l o f h y d r o g e n e n e r g y 3 4 ( 2 0 0 9 ) 1 7 7 1 – 1 7 7 9 1775
followed by M-DW [9.62 mol/Kg CODR; 10.20 mol/Kg CODR
(vitamins)]. The CW effluent from both the processes evi-
denced lower H2 yield among the experimental variations
studied [H-CW – 6.70 mol/Kg CODR; 8.23 mol/Kg CODR (vita-
mins); M-CW – 5.24 mol/Kg CODR; 5.71 mol/Kg CODR (vita-
mins)]. It was evident from the experimental results that, the
initial treatment and characteristics of wastewater (before
and after first stage of treatment) appeared to have significant
influence on H2 production by photo-biological process. Initial
placement of acidogenic process appears to have positive
influence on subsequent integration with photo-biological H2
production over the integration of corresponding methano-
genic process. This may be attributed to the presence of higher
concentrations of TVFA associated with residual carbon after
acidogenic process in the effluents.
3.2. Substrate degradation
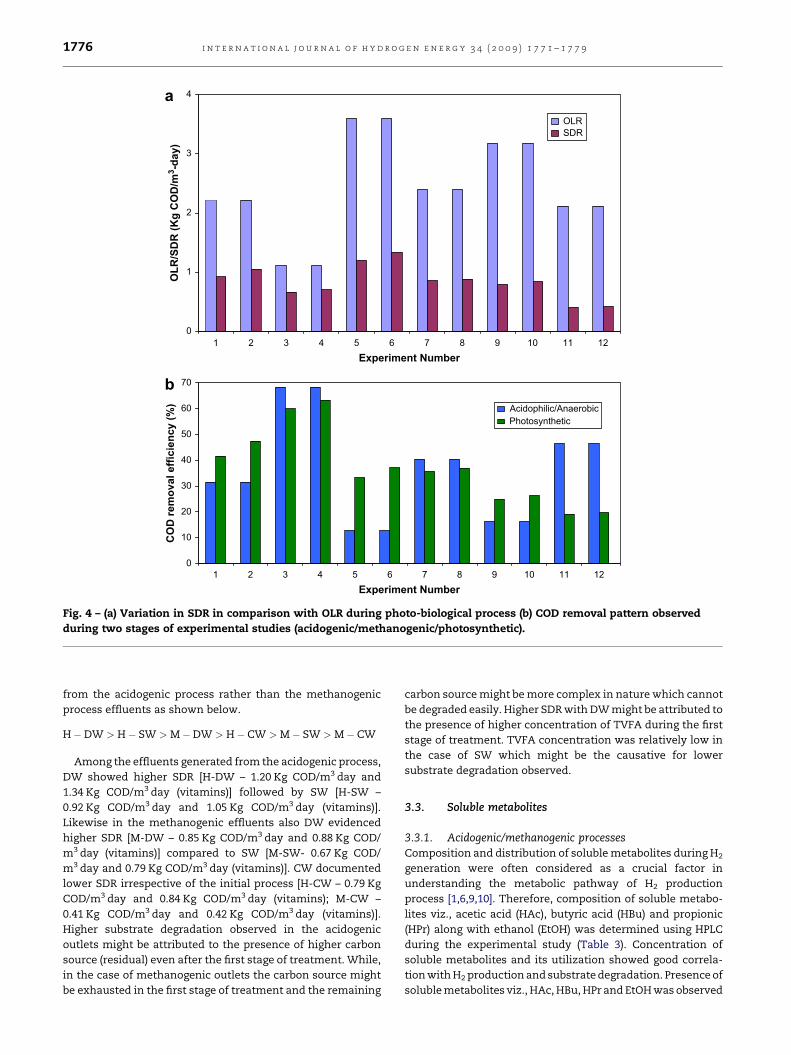
Experiments also evidenced the possibility of additional
substrate degradation due to the terminal integration of
photo-biological process. Residual carbon source remaining in
the outlets generated from acidogenic and methanogenic
processes was observed to be utilized by subsequent integra-
tion with photo-biological process (Fig. 4; Table 1). However,
the rate of substrate degradation was found to depend on the
characteristics/nature of the wastewater used as substrate
and the process used in the first stage. Visible improvement in
the substrate degradation efficiency was also observed after
supplementing with vitamins (Fig. 3b). COD removal efficiency
showed a decreasing trend with increasing complexity of the
substrated. SW which contained simple carbon source in the
form of glucose yielded high COD removal efficiency [H-SW –
41.67% and 47.50% (vitamins); M-SW – 60.00% and 63.33%
(vitamins)] compared to the other two substrates studied. DW
effluents showed lower COD removal efficiency compared to
SW [H-DW – 33.33% and 37.18% (vitamins); M-DW – 35.69%
and 36.92% (vitamins)]. Among all the substrates studied CW
effluent evidenced poor COD removal efficiency [H-CW –
24.93% and 26.38% (vitamins); M-CW – 19.13% and 19.74%
(vitamins)] among all the substrates studied. Complex nature
of the CW might be the reason for the poor substrate degra-
dation along with lower H2 production observed during the
experimental study. Among all the experimental variations
studied, higher SDR was observed with the effluent generated
0
1
2
3
4
10987654321 11 12Experiment Number
10987654321 11 12Experiment Number
OL
R/S
DR
(K
g C
OD
/m
3-d
ay)
0
10
20
30
40
50
60
70
CO
D rem
oval efficien
cy (%
)
a
b
OLRSDR
Acidophilic/AnaerobicPhotosynthetic
Fig. 4 – (a) Variation in SDR in comparison with OLR during photo-biological process (b) COD removal pattern observed
during two stages of experimental studies (acidogenic/methanogenic/photosynthetic).
i n t e r n a t i o n a l j o u r n a l o f h y d r o g e n e n e r g y 3 4 ( 2 0 0 9 ) 1 7 7 1 – 1 7 7 91776
from the acidogenic process rather than the methanogenic
process effluents as shown below.
H�DW > H� SW > M�DW > H� CW > M� SW > M� CW
Among the effluents generated from the acidogenic process,
DW showed higher SDR [H-DW – 1.20 Kg COD/m3 day and
1.34 Kg COD/m3 day (vitamins)] followed by SW [H-SW –
0.92 Kg COD/m3 day and 1.05 Kg COD/m3 day (vitamins)].
Likewise in the methanogenic effluents also DW evidenced
higher SDR [M-DW – 0.85 Kg COD/m3 day and 0.88 Kg COD/
m3 day (vitamins)] compared to SW [M-SW- 0.67 Kg COD/
m3 day and 0.79 Kg COD/m3 day (vitamins)]. CW documented
lower SDR irrespective of the initial process [H-CW – 0.79 Kg
COD/m3 day and 0.84 Kg COD/m3 day (vitamins); M-CW –
0.41 Kg COD/m3 day and 0.42 Kg COD/m3 day (vitamins)].
Higher substrate degradation observed in the acidogenic
outlets might be attributed to the presence of higher carbon
source (residual) even after the first stage of treatment. While,
in the case of methanogenic outlets the carbon source might
be exhausted in the first stage of treatment and the remaining
carbon source might be more complex in nature which cannot
be degraded easily. Higher SDR with DW might be attributed to
the presence of higher concentration of TVFA during the first
stage of treatment. TVFA concentration was relatively low in
the case of SW which might be the causative for lower
substrate degradation observed.
3.3. Soluble metabolites
3.3.1. Acidogenic/methanogenic processesComposition and distribution of soluble metabolites during H2
generation were often considered as a crucial factor in
understanding the metabolic pathway of H2 production
process [1,6,9,10]. Therefore, composition of soluble metabo-
lites viz., acetic acid (HAc), butyric acid (HBu) and propionic
(HPr) along with ethanol (EtOH) was determined using HPLC
during the experimental study (Table 3). Concentration of
soluble metabolites and its utilization showed good correla-
tion with H2 production and substrate degradation. Presence of
soluble metabolites viz., HAc, HBu, HPr and EtOH was observed
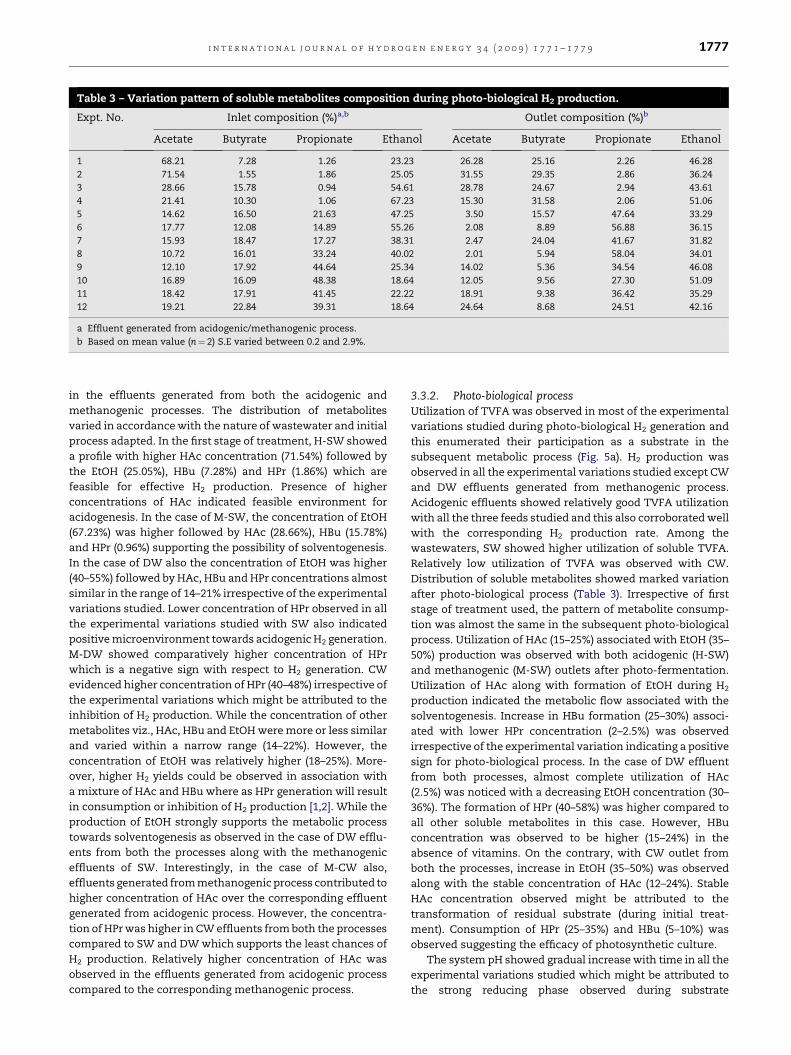
Table 3 – Variation pattern of soluble metabolites composition during photo-biological H2 production.
Expt. No. Inlet composition (%)a,b Outlet composition (%)b
Acetate Butyrate Propionate Ethanol Acetate Butyrate Propionate Ethanol
1 68.21 7.28 1.26 23.23 26.28 25.16 2.26 46.28
2 71.54 1.55 1.86 25.05 31.55 29.35 2.86 36.24
3 28.66 15.78 0.94 54.61 28.78 24.67 2.94 43.61
4 21.41 10.30 1.06 67.23 15.30 31.58 2.06 51.06
5 14.62 16.50 21.63 47.25 3.50 15.57 47.64 33.29
6 17.77 12.08 14.89 55.26 2.08 8.89 56.88 36.15
7 15.93 18.47 17.27 38.31 2.47 24.04 41.67 31.82
8 10.72 16.01 33.24 40.02 2.01 5.94 58.04 34.01
9 12.10 17.92 44.64 25.34 14.02 5.36 34.54 46.08
10 16.89 16.09 48.38 18.64 12.05 9.56 27.30 51.09
11 18.42 17.91 41.45 22.22 18.91 9.38 36.42 35.29
12 19.21 22.84 39.31 18.64 24.64 8.68 24.51 42.16
a Effluent generated from acidogenic/methanogenic process.
b Based on mean value (n¼ 2) S.E varied between 0.2 and 2.9%.
i n t e r n a t i o n a l j o u r n a l o f h y d r o g e n e n e r g y 3 4 ( 2 0 0 9 ) 1 7 7 1 – 1 7 7 9 1777
in the effluents generated from both the acidogenic and
methanogenic processes. The distribution of metabolites
varied in accordance with the nature of wastewater and initial
process adapted. In the first stage of treatment, H-SW showed
a profile with higher HAc concentration (71.54%) followed by
the EtOH (25.05%), HBu (7.28%) and HPr (1.86%) which are
feasible for effective H2 production. Presence of higher
concentrations of HAc indicated feasible environment for
acidogenesis. In the case of M-SW, the concentration of EtOH
(67.23%) was higher followed by HAc (28.66%), HBu (15.78%)
and HPr (0.96%) supporting the possibility of solventogenesis.
In the case of DW also the concentration of EtOH was higher
(40–55%) followed by HAc, HBu and HPr concentrations almost
similar in the range of 14–21% irrespective of the experimental
variations studied. Lower concentration of HPr observed in all
the experimental variations studied with SW also indicated
positive microenvironment towards acidogenic H2 generation.
M-DW showed comparatively higher concentration of HPr
which is a negative sign with respect to H2 generation. CW
evidenced higher concentration of HPr (40–48%) irrespective of
the experimental variations which might be attributed to the
inhibition of H2 production. While the concentration of other
metabolites viz., HAc, HBu and EtOH were more or less similar
and varied within a narrow range (14–22%). However, the
concentration of EtOH was relatively higher (18–25%). More-
over, higher H2 yields could be observed in association with
a mixture of HAc and HBu where as HPr generation will result
in consumption or inhibition of H2 production [1,2]. While the
production of EtOH strongly supports the metabolic process
towards solventogenesis as observed in the case of DW efflu-
ents from both the processes along with the methanogenic
effluents of SW. Interestingly, in the case of M-CW also,
effluents generated from methanogenic process contributed to
higher concentration of HAc over the corresponding effluent
generated from acidogenic process. However, the concentra-
tion of HPr was higher in CW effluents from both the processes
compared to SW and DW which supports the least chances of
H2 production. Relatively higher concentration of HAc was
observed in the effluents generated from acidogenic process
compared to the corresponding methanogenic process.
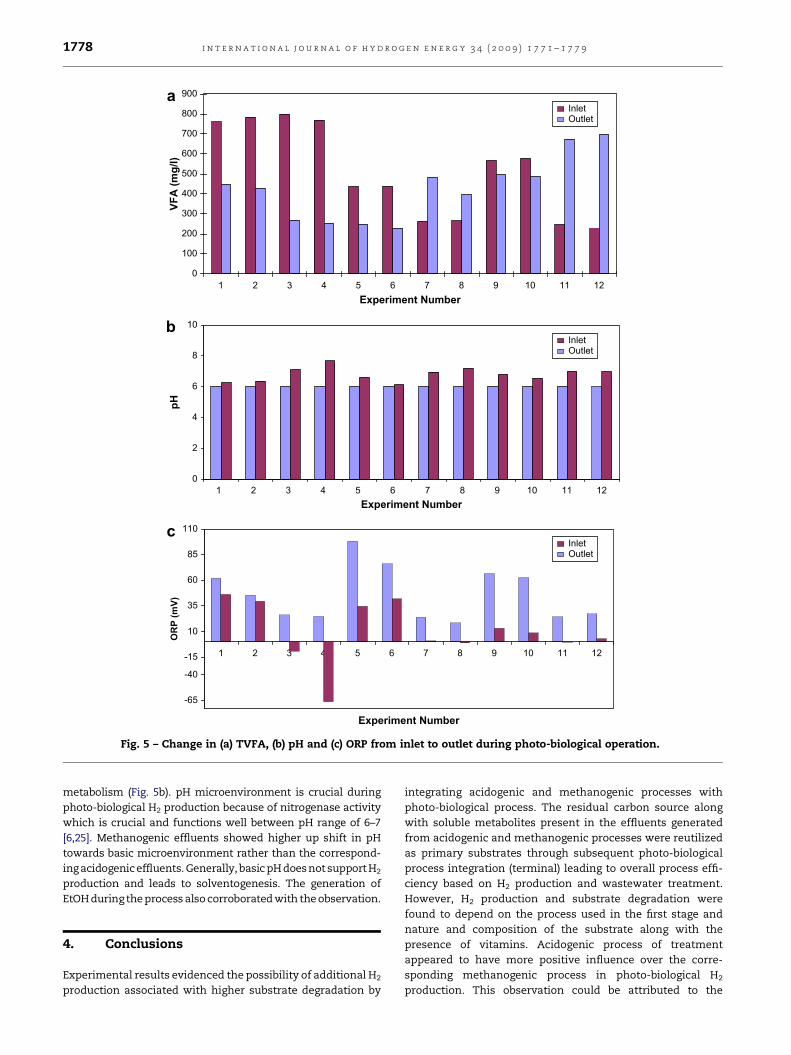
3.3.2. Photo-biological processUtilization of TVFA was observed in most of the experimental
variations studied during photo-biological H2 generation and
this enumerated their participation as a substrate in the
subsequent metabolic process (Fig. 5a). H2 production was
observed in all the experimental variations studied except CW
and DW effluents generated from methanogenic process.
Acidogenic effluents showed relatively good TVFA utilization
with all the three feeds studied and this also corroborated well
with the corresponding H2 production rate. Among the
wastewaters, SW showed higher utilization of soluble TVFA.
Relatively low utilization of TVFA was observed with CW.
Distribution of soluble metabolites showed marked variation
after photo-biological process (Table 3). Irrespective of first
stage of treatment used, the pattern of metabolite consump-
tion was almost the same in the subsequent photo-biological
process. Utilization of HAc (15–25%) associated with EtOH (35–
50%) production was observed with both acidogenic (H-SW)
and methanogenic (M-SW) outlets after photo-fermentation.
Utilization of HAc along with formation of EtOH during H2
production indicated the metabolic flow associated with the
solventogenesis. Increase in HBu formation (25–30%) associ-
ated with lower HPr concentration (2–2.5%) was observed
irrespective of the experimental variation indicating a positive
sign for photo-biological process. In the case of DW effluent
from both processes, almost complete utilization of HAc
(2.5%) was noticed with a decreasing EtOH concentration (30–
36%). The formation of HPr (40–58%) was higher compared to
all other soluble metabolites in this case. However, HBu
concentration was observed to be higher (15–24%) in the
absence of vitamins. On the contrary, with CW outlet from
both the processes, increase in EtOH (35–50%) was observed
along with the stable concentration of HAc (12–24%). Stable
HAc concentration observed might be attributed to the
transformation of residual substrate (during initial treat-
ment). Consumption of HPr (25–35%) and HBu (5–10%) was
observed suggesting the efficacy of photosynthetic culture.
The system pH showed gradual increase with time in all the
experimental variations studied which might be attributed to
the strong reducing phase observed during substrate
0
100
200
300
400
500
600
700
800
900
1 2 3 4 5 6 7 8 9 10 11 12Experiment Number
1 2 3 4 5 6 7 8 9 10 11 12Experiment Number
1 2 3 4 5 6 7 8 9 10 11 12
Experiment Number
VF
A (m
g/l)
0
2
4
6
8
10
pH
-65
-40
-15
10
35
60
85
110
OR
P (m
V)
a
b
c
InletOutlet
InletOutlet
InletOutlet
Fig. 5 – Change in (a) TVFA, (b) pH and (c) ORP from inlet to outlet during photo-biological operation.
i n t e r n a t i o n a l j o u r n a l o f h y d r o g e n e n e r g y 3 4 ( 2 0 0 9 ) 1 7 7 1 – 1 7 7 91778
metabolism (Fig. 5b). pH microenvironment is crucial during
photo-biological H2 production because of nitrogenase activity
which is crucial and functions well between pH range of 6–7
[6,25]. Methanogenic effluents showed higher up shift in pH
towards basic microenvironment rather than the correspond-
ing acidogenic effluents. Generally, basic pH doesnot support H2
production and leads to solventogenesis. The generation of
EtOH during the process also corroborated with the observation.
4. Conclusions
Experimental results evidenced the possibility of additional H2
production associated with higher substrate degradation by
integrating acidogenic and methanogenic processes with
photo-biological process. The residual carbon source along
with soluble metabolites present in the effluents generated
from acidogenic and methanogenic processes were reutilized
as primary substrates through subsequent photo-biological
process integration (terminal) leading to overall process effi-
ciency based on H2 production and wastewater treatment.
However, H2 production and substrate degradation were
found to depend on the process used in the first stage and
nature and composition of the substrate along with the
presence of vitamins. Acidogenic process of treatment
appeared to have more positive influence over the corre-
sponding methanogenic process in photo-biological H2
production. This observation could be attributed to the
i n t e r n a t i o n a l j o u r n a l o f h y d r o g e n e n e r g y 3 4 ( 2 0 0 9 ) 1 7 7 1 – 1 7 7 9 1779
presence of excessive concentration of soluble metabolites
along with higher concentration of residual carbon source.
The presence of vitamins showed a positive influence on both
H2 production and substrate degradation. The process
described in this study documented the possibility of higher
rates of H2 generation and substrate removal. This was made
possible by reusing the unutilized substrate from acidogenic
and methanogenic processes by integrating with photo-bio-
logical process.
Acknowledgments
The authors wish to thank the Department of Biotechnology
(DBT), Government of India, New Delhi for funding the pre-
sented research study (Project No. BT/PR/4405/BCE/08/312/
2003). The authors also wish to thank the Director, IICT, for his
encouragement in carrying out this work.
r e f e r e n c e s
[1] Venkata Mohan S. Fermentative hydrogen production withsimultaneous wastewater treatment: influence ofpretreatment and system operating conditions. J Sci Ind Res2008;67(11):950–61.
[2] Hawkes FR, Dinsdale R, Hawkes DL, Hussy I. Sustainablefermentative hydrogen production: challenges for processoptimisation. Int J Hydrogen Energy 2002;27:1339–47.
[3] Venkata Mohan S, Vijaya Bhaskar Y, Murali Krishna P,Chandrasekhara Rao N, Lalit Babu V, Sarma PN. Biohydrogenproduction from chemical wastewater as substrate byselectively enriched anaerobic mixed consortia: influence offermentation pH and substrate composition. Int J HydrogenEnergy 2007;32:2286–95.
[4] Venkata Mohan S, Mohanakrishna G, Raghuvulu SV,Sarma PN. Enhancing biohydrogen production fromchemical wastewater treatment in anaerobic sequencingbatch biofilm reactor (AnSBBR) by bioaugmenting withselectively enriched kanamycin resistant anaerobic mixedconsortia. Int J Hydrogen Energy 2007;32(15):3284–92.
[5] Venkata Mohan S, Lalit Babu V, Srikanth S, Sarma PN.Bio-electrochemical behavior of fermentative biohydrogenproduction process with the function of pHmicroenvironment. Int J Hydrogen Energy 2008;33(17):4533–46.
[6] Venkata Mohan S, Srikanth S, Dinakar P, Sarma PN.Photobiological hydrogen production by the adopted mixedculture: data enveloping analysis. Int J Hydrogen Energy2008;33:559–69.
[7] Ren NQ, Liu BF, Ding J, Guo WQ, Li GC, Xie GJ. The effect ofconcentration on photo-hydrogen production from acetateby Rhodopseudomonas faecalis RLD-53. Int J Hydrogen Energy2008;33(21):5981–5.
[8] Zhu H, Beland M. Evaluation of alternative methods ofpreparing hydrogen producing seeds from digestedwastewater sludge. Int J Hydrogen Energy 2006;31(14):1980–8.
[9] Fascetti E, D’addario E, Todin O, Robertiello A. Photosynthetichydrogen evolution with volatile organic acids derived from
the fermentation of source selected municipal solid wastes.Int J Hydrogen Energy 1998;23(9):753–60.
[10] Levin DB, Lawrence PL, Love M. Biohydrogen production:prospects and limitations to practical application. Int JHydrogen Energy 2004;29(2):173–85.
[11] Oh Y, Seol E, Kim MSM, Park S. Photoproduction of hydrogenfrom acetate by a chemoheterotrophic bacteriumRhodopseudomonas palustris P4. Int J Hydrogen Energy 2004;29(11):1115–21.
[12] Venkata Mohan S, Bhaskar YV, Sarma PN. Biohydrogenproduction from chemical wastewater treatment byselectively enriched anaerobic mixed consortia in biofilmconfigured reactor operated in periodic discontinuous batchmode. Wat Res 2007;41:2652–64.
[13] Venkata Mohan S, Veer Raghavulu S, Mohanakrishna G,Srikanth S, Sarma PN. Optimization and evaluation offermentative hydrogen production and wastewatertreatment processes using data enveloping analysis (DEA)and Taguchi design of experimental (DOE) methodology. Int JHydrogen Energy doi:10.1016/j.ijhydene.2008.09.044.
[14] Asada Y, Tokumoto M, Aihara Y, Oku M, Ishimi K,Wakayama T, et al. Hydrogen production by co-cultures ofLactobacillus and a photosynthetic bacterium, Rhodobactersphaeroides RV. Int J Hydrogen Energy 2006;31:1509–13.
[15] Shi X, Yu H. Continuous production of hydrogen from mixedvolatile fatty acids with Rhodopseudomonas capsulate. Int JHydrogen Energy 2006;31:1641–7.
[16] Melis A, Melnicki MR. Integrated biological hydrogenproduction. Int J Hydrogen Energy 2006;31:1563–73.
[17] Burgess G, Fernandez-Velasco JG. Materials, operationalenergy inputs, and net energy ratio for photobiologicalhydrogen production. Int J Hydrogen Energy 2007;32(9):1225–34.
[18] Venkata Mohan S, Lalit Babu V, Sarma PN. Anaerobicbiohydrogen production from dairy wastewater treatment insequencing batch reactor (AnSBR): effect of organic loadingrate. Enzyme Microb Technol 2007;41(4):506–15.
[19] Kim MS, Baek JS, Yun YS, Sang JS, Park S, Kim SC. Hydrogenproduction from Chlamydomonas reinhardtii biomass usinga two-step conversion process: anaerobic conversion andphotosynthetic fermentation. Int J Hydrogen Energy 2006;31:812–6.
[20] Miyake J, Mao XY, Kawamura S. Photoproduction ofhydrogen from glucose by a co-culture of a photosyntheticbacterium and Clostridium butyricum. J Ferment Technol 1984;62(6):531–5.
[21] Hillmer P, Gest H. H2 metabolism in the photosyntheticbacterium Rhodopseudomonas capsulate: H2 production bygrowing culture. J Bacteriol 1977:209–22.
[22] Kim JS, Ito K, Takahashi H. The relationship betweennitrogenase activity and hydrogen evolution inRhodopseudomonas palustris. Agric Biol Chem 1980;44(4):827–33.
[23] Sasaki K. Hydrogen and 5-aminolevulinic acid production byphotosynthetic bacteria. In: Zaborsky OR, editor.Biohydrogen. London: Plenum Press; 1998. p. 133–42.
[24] APHA. Standard methods for the examination of water andwastewater. 20th ed. Washington, DC: American PublicHealth Association, American Water Works Association,Water Pollution Control Federation; 1998.
[25] Kawaguchi H, Hashimoto K, Hirata K, Miyamoto K. H2production from algal biomass by a mixed culture ofRhodobium marinum A-501 and Lactobacillus amulovorus.J Biosci Bioeng 2001;91(3):277–82.