Effects of temperature and circulation on the population dynamics of Calanus finmarchicus in the...
22
Effects of temperature and circulation on the population dynamics of Calanus finmarchicus in the Gulf of St. Lawrence and Scotian Shelf: Study with a coupled, three-dimensional hydrodynamic, stage-based life history model Bruno A. Zakardjian, 1 Jinyu Sheng, 2 Jeffrey A. Runge, 3 Ian McLaren, 4 Ste ´phane Plourde, 5,6 Keith R. Thompson, 2 and Yves Gratton 7 Received 27 March 2002; revised 23 January 2003; accepted 28 May 2003; published 4 November 2003. [1] We developed a physical-biological model for the Gulf of St. Lawrence (GSL) and Scotian Shelf (SS) by coupling a stage-based life-history model of the planktonic copepod Calanus finmarchicus to a three-dimensional ocean circulation model. The life-history model consists of 13 morphologically distinct life stages of C. finmarchicus, with stage- specific and temperature-dependent molting rates. The model also includes stage-specific vertical distribution and seasonally varying diapause, egg production, and stage-specific mortality rates. The model domain covers the eastern Canadian shelf from 55°W to 72°Wand from 39°N to 52°N, including the Gulf of St. Lawrence, Scotian Shelf, and Gulf of Maine. A comparison of a 1-year simulation with observations indicates that the physical-biological model reasonably describes the observed abundance and distribution of C. finmarchicus in this region. To determine the effects of ocean circulation in the C. finmarchicus population dynamics, we divided the GSL-SS region into eight sub-areas and compared the net fluxes of C. finmarchicus across lateral boundaries to the net production in each sub-area. We found that the annual cross-boundary exchange rates constitute from <1% to 39% of the local net production, indicating that the horizontal transport of C. finmarchicus by the ocean currents can play a very important role in the dynamics of local C. finmarchicus populations. The results provide insights into the mechanisms of exchange in the GSL-SS system, as put forward in recent hypotheses. INDEX TERMS: 4855 Oceanography: Biological and Chemical: Plankton; 4532 Oceanography: Physical: General circulation; 4255 Oceanography: General: Numerical modeling; KEYWORDS: Calanus finmarchicus, GLOBEC, hydrodynamic model, life-cycle model, Gulf of St. Lawrence, Scotian Shelf Citation: Zakardjian, B. A., J. Sheng, J. A. Runge, I. McLaren, S. Plourde, K. R. Thompson, and Y. Gratton, Effects of temperature and circulation on the population dynamics of Calanus finmarchicus in the Gulf of St. Lawrence and Scotian Shelf: Study with a coupled, three-dimensional hydrodynamic, stage-based life history model, J. Geophys. Res., 108(C11), 8016, doi:10.1029/2002JC001410, 2003. 1. Introduction [2] Calanus finmarchicus is a dominant zooplankton species in the North Atlantic Ocean [e.g., Marshall and Orr, 1955; Colebrook, 1982; Planque et al., 1997; Planque and Batten, 2000] and its adjacent seas including the Gulf of St. Lawrence and Scotian Shelf [Tremblay and Roff, 1983; Runge and Simard, 1990; de Lafontaine et al., 1991]. It is an important prey for early life stages of several commer- cially important fish stocks, mainly cod and redfish, both in the eastern [e.g., Hansen et al., 1994; Fossum and Ellertsen, 1994] and western North Atlantic [ Anderson, 1994; Albikovskaya and Gerasimova, 1993; Sameoto et al., 1994; Runge and de Lafontaine, 1996]. The population dynamics of C. finmarchicus are greatly affected by ocean currents that may transport it from the deep North Atlantic, where it over-winters at depth, to the relatively shallow shelf regions [e.g., Backhaus et al., 1994; Aksnes and Blindheim, 1996; Slagstad and Tande, 1996; Bryant et al., 1998; Gaard, 1999, JOURNAL OF GEOPHYSICAL RESEARCH, VOL. 108, NO. C11, 8016, doi:10.1029/2002JC001410, 2003 1 Institut des Sciences de la Mer de Rimouski (ISMER), Universite ´ du Que ´bec a ` Rimouski, Rimouski, Quebec, Canada. 2 Department of Oceanography, Dalhousie University, Halifax, Nova Scotia, Canada. 3 Ocean Process Analysis Laboratory, University of New Hampshire, Durham, New Hampshire, USA. Copyright 2003 by the American Geophysical Union. 0148-0227/03/2002JC001410$09.00 GLO 17 - 1 4 Department of Biology, Dalhousie University, Halifax, Nova Scotia, Canada. 5 De ´partement de Biologie, Universite ´ Laval, Sainte-Foy, Quebec, Canada. 6 Now at Fisheries and Ocean Canada, Maurice Lamontagne Institute, Mont-Joli, Quebec, Canada. 7 INRS-Eau, Sainte-Foy, Quebec, Canada.
Transcript of Effects of temperature and circulation on the population dynamics of Calanus finmarchicus in the...

Effects of temperature and circulation on the population dynamics of
Calanus finmarchicus in the Gulf of St. Lawrence and Scotian Shelf:
Study with a coupled, three-dimensional hydrodynamic, stage-based
life history model
Bruno A. Zakardjian,1 Jinyu Sheng,2 Jeffrey A. Runge,3 Ian McLaren,4
Stephane Plourde,5,6 Keith R. Thompson,2 and Yves Gratton7
Received 27 March 2002; revised 23 January 2003; accepted 28 May 2003; published 4 November 2003.
[1] We developed a physical-biological model for the Gulf of St. Lawrence (GSL) andScotian Shelf (SS) by coupling a stage-based life-history model of the planktonic copepodCalanus finmarchicus to a three-dimensional ocean circulation model. The life-historymodel consists of 13 morphologically distinct life stages of C. finmarchicus, with stage-specific and temperature-dependent molting rates. The model also includes stage-specificvertical distribution and seasonally varying diapause, egg production, and stage-specificmortality rates. Themodel domain covers the easternCanadian shelf from55�Wto72�Wandfrom 39�N to 52�N, including the Gulf of St. Lawrence, Scotian Shelf, and Gulf of Maine.A comparison of a 1-year simulation with observations indicates that the physical-biologicalmodel reasonably describes the observed abundance and distribution of C. finmarchicusin this region. To determine the effects of ocean circulation in theC. finmarchicus populationdynamics, we divided the GSL-SS region into eight sub-areas and compared the net fluxes ofC. finmarchicus across lateral boundaries to the net production in each sub-area. Wefound that the annual cross-boundary exchange rates constitute from<1% to 39%of the localnet production, indicating that the horizontal transport of C. finmarchicus by the oceancurrents can play a very important role in the dynamics of localC. finmarchicus populations.The results provide insights into the mechanisms of exchange in the GSL-SS system, as putforward in recent hypotheses. INDEX TERMS: 4855 Oceanography: Biological and Chemical:
Plankton; 4532 Oceanography: Physical: General circulation; 4255 Oceanography: General: Numerical
modeling; KEYWORDS: Calanus finmarchicus, GLOBEC, hydrodynamic model, life-cycle model, Gulf of St.
Lawrence, Scotian Shelf
Citation: Zakardjian, B. A., J. Sheng, J. A. Runge, I. McLaren, S. Plourde, K. R. Thompson, and Y. Gratton, Effects of temperature
and circulation on the population dynamics of Calanus finmarchicus in the Gulf of St. Lawrence and Scotian Shelf: Study with a
coupled, three-dimensional hydrodynamic, stage-based life history model, J. Geophys. Res., 108(C11), 8016,
doi:10.1029/2002JC001410, 2003.
1. Introduction
[2] Calanus finmarchicus is a dominant zooplanktonspecies in the North Atlantic Ocean [e.g., Marshall andOrr, 1955; Colebrook, 1982; Planque et al., 1997; Planqueand Batten, 2000] and its adjacent seas including the Gulf ofSt. Lawrence and Scotian Shelf [Tremblay and Roff, 1983;Runge and Simard, 1990; de Lafontaine et al., 1991]. It isan important prey for early life stages of several commer-
cially important fish stocks, mainly cod and redfish, both inthe eastern [e.g., Hansen et al., 1994; Fossum and Ellertsen,1994] and western North Atlantic [Anderson, 1994;Albikovskaya and Gerasimova, 1993; Sameoto et al., 1994;Runge and de Lafontaine, 1996]. The population dynamicsof C. finmarchicus are greatly affected by ocean currentsthat may transport it from the deep North Atlantic, where itover-winters at depth, to the relatively shallow shelf regions[e.g., Backhaus et al., 1994; Aksnes and Blindheim, 1996;Slagstad and Tande, 1996; Bryant et al., 1998; Gaard, 1999,
JOURNAL OF GEOPHYSICAL RESEARCH, VOL. 108, NO. C11, 8016, doi:10.1029/2002JC001410, 2003
1Institut des Sciences de la Mer de Rimouski (ISMER), Universite duQuebec a Rimouski, Rimouski, Quebec, Canada.
2Department of Oceanography, Dalhousie University, Halifax, NovaScotia, Canada.
3Ocean Process Analysis Laboratory, University of New Hampshire,Durham, New Hampshire, USA.
Copyright 2003 by the American Geophysical Union.0148-0227/03/2002JC001410$09.00
GLO 17 - 1
4Department of Biology, Dalhousie University, Halifax, Nova Scotia,Canada.
5Departement de Biologie, Universite Laval, Sainte-Foy, Quebec,Canada.
6Now at Fisheries and Ocean Canada, Maurice Lamontagne Institute,Mont-Joli, Quebec, Canada.
7INRS-Eau, Sainte-Foy, Quebec, Canada.

2000; Pedersen et al., 2001]. Copepod production may act asa link between hydrodynamic effects of climatic variabilityand fisheries productivity [Cushing, 1984; Runge, 1988;Anderson, 1994; Hansen et al., 1994; Skreslet, 1997; Rungeet al., 1999; Sundby, 2001]. Because of this potential forphysical-biological linkage,C. finmarchicuswas identified asone of the key species inGlobalOcean EcosystemsDynamics(GLOBEC) research programs for the North Atlantic, includ-ing U.S. GLOBEC [e.g., Wiebe et al., 1996], the Trans-Atlantic Study of Calanus [Tande and Miller, 2000], andGLOBEC-Canada [Mackas and deYoung, 2001], all with amajor focus on interactions between circulation andC. finmarchicus population dynamics.[3] The Atlantic component of GLOBEC-Canada exam-
ined the role of circulation and temperature on the distri-bution and abundance of C. finmarchicus in easternCanadian waters, in particular the Gulf of St. Lawrence(hereinafter GSL) and Scotian Shelf (SS). Variations incirculation and other environmental features, such as tem-perature and surface winds, influence the distribution andabundance of zooplankton, notably C. finmarchicus [Runge,1988; Herman et al., 1991; Sameoto et al. 1994; Rungeand Simard, 1990; Head et al., 1999]. Geographically, theGSL-SS can be considered as an extended estuarine shelfsystem under the influence of the freshwater discharge fromthe St. Lawrence River watershed. The inshore and offshorebranches of the Labrador Current and the north-bound ofthe Gulf Stream also play an important role in controlling itscirculation. Plourde and Runge [1993] hypothesized that theLower Estuary acts as a zooplankton ‘‘pump,’’ supplyingyoung individuals to the summer population of Calanus inthe Gulf of St. Lawrence. Transport from the Gulf of St.Lawrence, in turn, was thought to be the dominant source ofzooplankton to the Scotian Shelf [Herman et al., 1991],although more recent observations implicate an importantrole of immigration from the slope water offshore [Head etal., 1999].[4] As part of the GLOBEC-Canada program, we de-
veloped a physical-biological model for the GSL-SS(Figure 1) system by linking a three-dimensional (3D)ocean circulation model (CANDIE [Sheng, 2001; Sheng etal., 1998, 2001; J. Sheng et al., Seasonal mean circulationover the eastern Canadian shelf, with emphasis on the Gulfof St. Lawrence and Scotian Shelf, manuscript in revisionfor Journal of Geophysical Research, 2003 (hereinafterreferred to as Sheng et al., manuscript in revision, 2003])that predicts regional temperature, salinity, and flow to aseasonal life-history model of C. finmarchicus. Our mainobjective is to determine how C. finmarchicus maintainsitself in the extended shelf system given the strong,seasonal variations in the large-scale hydrography andcirculation. To what extent does the estuarine advectiveflow distribute C. finmarchicus among regions of the shelfsystem? What are the major sources and sinks for thepopulation within this advective regime? The model andthe results we describe here are directed toward answeringthese questions through a ‘‘climatological run’’ coveringan annual cycle with both realistic regional circulation andC. finmarchicus abundance and stage-structure for theGSL-SS region. We present the physical-biological modelin section 2. The model results are described in section 3.In this section, we compare the model results to observed
life history cycles and seasonal abundance patterns in theGSL-SS and we estimate the effects of circulation on thedynamics of local C. finmarchicus populations. We discussthe implications and future directions leading from theseresults in section 4.
2. Model Formulation
[5] Given the main objective or our study, which is toquantify advection-induced mixing of sub-populations in alarge-scale system, we use a stage-based model embeddedin an Eulerian framework. In an Eulerian approach, thebiological rates (development, mortality, reproduction)depend on the local environmental conditions but neglectindividual histories. While this approach is less efficient indescribing individual growth than individual-based modelsused in other studies of copepod population dynamics [e.g.,Tande and Slagstad, 1992; Miller and Tande, 1993; Carlottiand Radach, 1996; Miller et al., 1998], it does allow easierquantitative description of exchange between sub-popula-tions at regional scale. The stage-based model we developedfollows the pioneering work of Wroblewski [1982] in a formsimilar to the model described by Lynch et al. [1998] for thelife history of C. finmarchicus in the Gulf of Maine (GOM).The life-history model comprises the egg, six naupliar (NIto NVI), and six copepodid (CI to CVI) stages of theC. finmarchicus life cycle [Marshall and Orr, 1955]. Adults(stage CVI) are further divided into males (CVIm) andreproductively immature (CVIfj) and mature females(CVIfm). In addition, the model accounts for mortalityand development during the diapausing CV (CVd) stage.The time-varying abundance at each stage (number percubic meter) is determined by the combined effects of(1) advection, (2) turbulent mixing, (3) stage-specific
Figure 1. Locations and bathymetry of the sub-areasdiscussed in the text: Lower St. Lawrence Estuary (LSLE),northwest Gulf of St. Lawrence (NWG), northeast Gulf(NEG), southern Gulf (SG), central Gulf (CG), LaurentianChannel (LC), Scotian Shelf (SS), and Gulf of Maine(GOM). Boundaries indicate sites of flux calculations.
GLO 17 - 2 ZAKARDJIAN ET AL.: TEMPERATURE AND CIRCULATION EFFECTS

vertical distribution and swimming behavior (except eggs),(4) stage-specific and temperature-dependent molting rates,(5) stage-specific, seasonally varying, and temperature-dependent mortality rates, and (6) for eggs, seasonallyvarying spawning by CVI females. Description of theCANDIE results that set environmental conditions, C.finmarchicus life history model and coupling with theCANDIE fields are detailed in the subsequent sections.
2.1. Environmental Conditions: The CANDIE 3DHydrodynamic Model
[6] The hydrodynamic model used in this study is the 3Dnonlinear z-level ocean circulation model known asCANDIE [Sheng et al., 1998]. This model has been sub-jected to rigorous testing (D. Wright, personal communica-tion, 2002) and successfully applied to various modelingproblems on the shelf, which include wind-driven circula-tion over an idealized coastal canyon [Sheng et al., 1998],nonlinear dynamics of the Gaspe Current [Sheng, 2001],tidal circulation in the GSL [Lu et al., 2001], seasonalcirculation over the northwest Atlantic Ocean [Sheng et al.,2001], and most recently, seasonal circulation in the westernCaribbean Sea [Sheng and Tang, 2003]. In the present study,CANDIE was applied to the eastern Canadian shelf between55�W and 72�W and between 41�N and 52�N (Figure 1).The model horizontal resolution is about 13 km in longitudeand 9 km in latitude. There are 21 unevenly spaced z-levelsin the vertical, with higher resolution near the surface.[7] CANDIE was run in diagnostic mode with the model
temperature and salinity at each time step interpolatedlinearly from the two nearest values for the seasonal-meanclimatology (Sheng et al., manuscript in revision, 2003).Wind stress was set to zero in the momentum equation, but12-hourly wind fields with a resolution of 2.5� obtainedfrom the European Centre for Medium-Range WeatherForecasts were used to estimate the surface mixing depthand the vertical mixing coefficients. A time-varying east-ward flow was introduced at the head of St. LawrenceEstuary to represent freshwater runoff from the St. Law-rence River. At the model lateral closed boundaries thenormal flow and tangential stress of the currents were set tozero (free-slip conditions). Along the model open bound-aries, an explicit Orlanski radiation condition [Orlanski,1976] was first used to determine whether the open bound-ary is passive (outward propagation) or active (inwardpropagation). If the open boundary is passive, the normalflow at the open boundary is radiated outward to allow anyperturbation generated inside the model domain to propa-gate outward as freely as possible. If the open boundary isactive, the normal flow at the open boundary is restored tothe seasonal mean climatology at each z-level with thetimescale of 15 days. In addition, three steady barotropicjets were specified at the eastern open boundary to simulatethe influence of the Labrador Current: one through the Straitof Belle Isle, and the other two near St. Pierre Bank to thesouth of Newfoundland.[8] Figure 2 shows the temperature fields at the model’s
top z-level (centered at 5 m from surface) interpolated fromthe seasonal mean climatology constructed for the region bySheng et al. (manuscript in revision, 2003). The near-surface waters in the GSL-SS region are relatively coldand spatially uniform in winter (January to March), and
warm up gradually from south to north in spring (April toJune). With continuous surface heating, the near-surfacetemperature in the region reaches its maximum in summer(July to September) and then decreases gradually in fall(October to December). The time-depth distributions ofwater temperatures in the upper 300 m averaged horizon-tally over sub-regions (Figure 3) exhibit a gradual estab-lishment of the upper-ocean stratification in spring andsummer, and relatively rapid establishment of cold andweakly stratified waters in fall and winter. This is consistentwith the fact that the upper ocean in this region hasrelatively weak vertical mixing in spring and summer fromthe stable stratification associated with surface heating, butstrong convective mixing in fall and winter associated withsurface cooling (Sheng et al., manuscript in revision, 2003).The interpolated temperature and salinity fields are charac-terized as the time evolution from a two-layer system inwinter (a cold, relatively fresh surface layer overlying awarmer and saltier bottom layer) to a three-layer system insummer (a warm, relatively fresh surface layer, a coldintermediate layer, and a warmer and saltier bottom layer)in the LSLE and GSL, as described by Koutitonsky andBugden [1991]. The maximum and minimum interpolatedtemperatures at each z-level also agree reasonably well withthe previous estimates in the region [e.g., Koutitonsky andBugden, 1991; Petrie et al. 1996]. The model calculated 3Dcurrents reproduce many well-known large-scale circulationfeatures in the region (Figure 4), including a year-roundcyclonic gyre over the northwestern GSL, southeastwardoutflow through the western Cabot Strait, and southwest-ward flow on the SS with relatively strong coastal and shelf-break jets.
2.2. C. finmarchicus Life-History Model
[9] The generic formulation for the abundance of stagesNII to CV can be written as equations (1)–(5) in Table 1,where ~U is the 3D velocity vector from the CANDIE model,Kz represents vertical mixing, and the terms in the second setof brackets on the right-hand side represent the biologicalprocesses (development, mortality, swimming, etc.). Theterms mNi and mCi represent stage-specific molting rates, mNi
and mCi are mortality rates, and WNi or WCi are verticalswimming speeds of the life stages (here the subscripts N andC represent naupliar and copepodid stages, respectively).[10] Stage-specific molting rates act as cascading transfer
functions from eggs to diapausing CV, adult males andimmature females. The molting rates were defined in termsof stage-specific, temperature-dependent development times(Table 2) estimated from laboratory experiments [Campbell etal., 2001b], which differ only slightly from estimates byMcLaren et al. [1988]. We assume that development time,to stage i(either naupliar or copepodid), has a correspondingstage-specific molting rate mi = ln(2)/(Di � Di�1). The termln(2) in the numerator follows from (1/Ci) dCi/dt = mi and theexperimental convention that 1
2of the population of stage
i� 1 molts to stage i after the time (Di�Di�1). We tested theability of this formulation to simulate cohort development in asimple preliminary simulation assuming constant tempera-ture, an initial egg population, no mortality, and sterile adults.Figure 5 shows that themodel preserves the initial stock as thecohort matures. Development time to adult is somewhatlonger (10–20 days) than predicted by the theoretical
ZAKARDJIAN ET AL.: TEMPERATURE AND CIRCULATION EFFECTS GLO 17 - 3

Figure 2. Simulated seasonal patterns of the sea-surface temperature produced by the CANDIEphysical model.
GLO 17 - 4 ZAKARDJIAN ET AL.: TEMPERATURE AND CIRCULATION EFFECTS

Belehradek function; on the other hand, prematurematuration, which is inherent in the Eulerian approach, isless than 20% in all cases.[11] The governing equations for the abundance of eggs,
adults, and CV in diapause are different from the generic
equations (1)–(5), in order to include specific biologicalprocesses for these stages. First, at the end of their intermoltperiod, CVs were allocated either to enter diapause or to moltto adult in percentages determined by a seasonally varyingfunction, Diap (equation (11)) where t is time and LagT
Figure 3. Seasonal trends, as simulated by CANDIE, of the vertical distribution of temperature in theupper 300 m. Regional abbreviations as in Figure 1.
ZAKARDJIAN ET AL.: TEMPERATURE AND CIRCULATION EFFECTS GLO 17 - 5
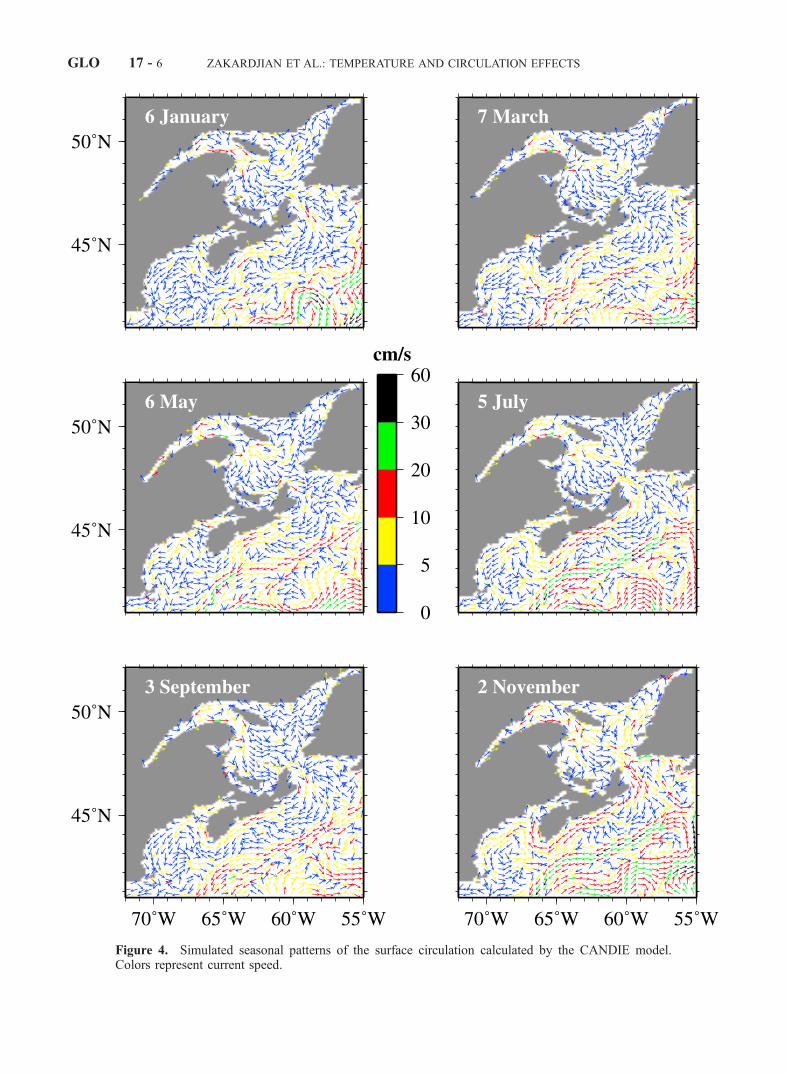
Figure 4. Simulated seasonal patterns of the surface circulation calculated by the CANDIE model.Colors represent current speed.
GLO 17 - 6 ZAKARDJIAN ET AL.: TEMPERATURE AND CIRCULATION EFFECTS

Table 1. System of Differential Equations and Biological and Climatological Functions Used for the Spatial and Temporal Evolution of
the State Variablesa
Equation Number
@
@tEggsð Þ þ r ~U:Eggs
� �¼ @
@zKz
@
@zEggsð Þ
� �þ �mEggs:Eggsþ Spawn:CVIfm�mEggs:Eggsh i
(1)
@
@tNIð Þ þ r ~U:NI
� �¼ @
@zKz
@
@zNIð Þ
� �þ �mNI:NIþ mEggs:Eggs�mNI:NIþ
@
@zWNINIð Þ
� �(2)
@
@tNIIð Þ þ r ~U:NII
� �¼ @
@zKz
@
@zNIIð Þ
� �þ �mNII:NIIþ mNI:NI�mNII:NIIþ
@
@zWNIINIIð Þ
� �(3)
@
@tCIð Þ þ r ~U:CI
� �¼ @
@zKz
@
@zCIð Þ
� �þ �mCI:CIþ mNVI:NVI�mCI:CIþ
@
@zWCICIð Þ
� �(4)
@
@tCIIð Þ þ r ~U:CII
� �¼ @
@zKz
@
@zCIIð Þ
� �þ �mCII:CIIþ mCI:CI�mCII:CIIþ
@
@zWCIICIIð Þ
� �(5)
@
@tCVdð Þ þ r ~U:CVd
� �¼ @
@zKz
@
@zCVdð Þ
� �þ � 1� Diapð Þ:mCVd:CVdþ Diap:mCV:CV� mCVd:CVdþ
@
@zWCVdCVdð Þ
� �(6)
@
@tCV Imð Þ þ r ~U:CV Im
� �¼ @
@zKz
@
@zCV Imð Þ
� �
þ 1� Diapð Þ2
mCV:CVþ mCVd:CVd½ � � mCVIm:CV Im þ @
@zWCV ImCV Imð Þ
� �(7)
@
@tCVIfjð Þ þ r ~U:CVIfj
� �¼ @
@zKz
@
@zCVIfjð Þ
� �þ 1� Diapð Þ
2mCV:CVþ mCVd:CVd½ �
�� mCVIfj:CVIfj
�mCVIfj:CVIfjþ@
@zWCVIfjCVIfj� ��
(8)
@
@tCVIfmð Þ þ r ~U:CVIfm
� �¼ @
@zKz
@
@zCVIfmð Þ
� �þ mCVIfj:CVIfj�mCVIfj:CVIfj þ
@
@zWCVIfjCVIfj� �� �
(9)
mi tð Þ ¼ mi: 1þ Diap tð Þ½ �: 1þ T� 12ð Þ=2½ � (10)
Diap tð Þ ¼ 1� exp �50 sin p tþ LagTð Þ=360ð Þj j � 1½ �2h i
(11)
Spawn tð Þ ¼ 1� Diap tð Þ½ �: EPRmax (12)
Wi ¼ Wmi tanh a z� Zið Þ½ � (13)
aEquations for NIII to NVI and CIII to CV are very similar to that of NII (equation (3)) and CII (equation (5)), respectively, and are not detailed further.
ZAKARDJIAN ET AL.: TEMPERATURE AND CIRCULATION EFFECTS GLO 17 - 7

defines regional variation in the timing of the over-winteringphase, both in units of days. All the CVs were assumed toenter diapause in autumn and inversely to molt to adults inlate winter/spring. The fraction of CVds exiting diapause issimply equal to (1-Diap). Laboratory experiments haveshown that the final molting of diapausing CVs in adultsmay take 6 to 20 days, depending on food conditions and sex[Grigg and Bardwell, 1982]. The so-called ecdysis timevaries also seasonally but tends to a mean value of 15 daysin late winter [Grigg and Bardwell, 1982]. High-resolutiontime series of population structure show a longer timescale(4 to 6 weeks) for the decrease of CVd and the peak of adult[e.g., Diel and Tande, 1992; Bamstedt, 2000]. In our model,CVs exiting diapause molt to adults with an equivalentmolting time of 20 days (mCVd = 0.035 d�1). The springdecrease and autumn increase of the Diap function thendetermines the timing of the resting phase. Previous obser-vations indicate that the active period of C. finmarchicusvaries from late December to early June in the Gulf of Maine[Durbin et al., 1997, 2000a], March to July in the ScotianShelf [McLaren et al., 2001], March to August in the Gulf ofSt. Lawrence [Filteau and Tremblay, 1953], and May toSeptember in the Lower St. Lawrence Estuary [Plourde andRunge, 1993; Plourde et al., 2001]. For simplicity, the lagtime (lagT) was set to vary linearly with latitude on the basisof timing in the GOM (southernmost population, LagT =30 days) and NEG (northernmost population, LagT =�60 days) in order to simulate these observed area-specifictimings.[12] Final molting to the adult stage, from either CV or
CVd, was evenly distributed between female and male.Sexual maturation within CVI was assumed to take 10 days[Plourde and Runge, 1993], implying a sexual maturationrate for immature females of mCVIfj = 0.069 d�1. Thespawning function, with a maximum set at 50 eggs perfemale per day, was assumed to be in phase with thediapausing function. The predicted range of maximal pro-duction rates between 5� and 10�C for females 2.5–3 mm inprosome length is 23–64 eggs per day [McLaren and
Leonard, 1995]. The choice of 50 eggs per female perday is based on the median observed rate for activelyreproducing populations in the study region [Plourde andRunge, 1993; Runge and Plourde, 1996]. Because theevidence for temperature dependence of egg productionrate in the ambient environment is weak [Runge andPlourde, 1996; Campbell and Head, 2000a, 2000b], weassumed egg production rates were independent of temper-ature in the standard run.[13] Mortality rates (Table 2) were set to decay exponen-
tially from eggs (mEggs = 0.25 d�1) to adults (mCVI =0.01 d�1) at all the C. finmarchicus stages except CVdand CVIm (Table 2). This formulation represents asmoothed expression of observations of mortality ofC. finmarchicus on Georges Bank [Ohman et al., 2003];note that here we have separated egg and NI mortality rates.The mortality rates at stages CVd and CVIm were set tovalues that were, respectively, ten-fold lower and two-foldhigher than those of the active CV and females. The lowmortality rates of diapausing CV (0.001 d�1) is consistentwith an estimate made by McLaren et al. [2001] on the SSover-wintering stock (0.001–0.009 d�1). During the over-wintering period, the mortality rates at all the stages exceptCVd were set to be two-fold higher. In addition, the mortalityrates were further increased over areas with water temper-atures higher than 12�C (equation (10)) to eliminate anunrealistic acceleration of successive generations in warmwaters, mainly in the Gulf Stream waters where activelyreproducing population have never been observed [e.g.,
Table 2. Set of Common Stage-Specific Biological Parameters
Used in the Simulationa
Belehradek a,days
Mortality,d�1
Wmax,m h�1
Zopt,m
Eggs 595 0.250 – –NI 387 0.200 0.5 5NII 582 0.150 0.7 5NIII 1387 0.125 1.1 5NIV 759 0.100 1.6 5NV 716 0.080 2.2 5NVI 841 0.060 2.7 5CI 966 0.040 3.2 25CII 1137 0.030 4.7 25CIII 1428 0.020 6.1 25CIV 2166 0.015 7.6 75CV 4083 0.010 9.4 75CVd – 0.001 10.8 second bottom layerCVIm – 0.020 10.8 second bottom layerCVI fj – 0.010 10.8 25CVI fm – 0.010 10.8 25
aStage-specific, temperature-dependent development time rate arecomputed as Di = ai (T � b)a where b = �9.11�C and a = �2.05.Parameters Wmax and Zopt are used to define stage-specific swimmingbehaviors as described in the text.
Figure 5. Single cohort development at 4�, 8�, and 12�C;each simulation starts with 100 eggs and assumes nomortality or reproduction. The bold vertical line in eachpanel shows the temperature-dependent development timeto adult as predicted by the Belehradek function.
GLO 17 - 8 ZAKARDJIAN ET AL.: TEMPERATURE AND CIRCULATION EFFECTS

Planque and Batten, 2000]. This is supported by laboratoryobservations showing increasing mortality in naupliar andearly copepodid stages at temperatures higher than 12�C(J. Runge and I. McLaren, unpublished observations, 1998).As unrealistic mortality rates may lead to a continuouslydecreasing or increasing population, we verified that the setof mortality rates we used gave stable populations in multi-year 1D simulations (not shown) for the LSLE, Gulf and SStemperature regimes (as on Figure 3); that is, the annual cycleand over-wintering stock are conserved from year to year.[14] Given the vertical current shears in the GSL-SS
system [e.g., Koutitonsky and Bugden, 1991], verticalontogenic migration of C. finmarchicus may be of first-order importance for the estimation of transport betweensub-areas of the system. Vertical distribution also specifiesthe temperature conditions experienced by the organismsduring their development. We include this constraint by theuse of a formulation for stage-specific swimming behaviorand vertical distribution, in which vertical swimming speedis expressed in terms of stage-specific preferential depths(Zopt) and stage-specific maximum swimming velocities(Wmax), as Wswim = Wmax tanh [a(z � Zopt)] [Zakardjianet al., 1999]. In this formulation, C. finmarchicus swimsdownward from the surface and upward from the bottomtoward its specified preferential (optimal) depth. Theparameter a in this formulation controls the decrease ofthe swimming velocities near the optimal depth Zopt. Wmax
for each stage is set to one body length (BL) per second,which is sufficient for late copepodids to achieve knownontogenetic migration rates [Zakardjian et al., 1999].[15] Table 2 lists the values of Zopt for eachC. finmarchicus
stage. These values were estimated from the observed springand summer vertical distributions in the GSL [Plourde et al.,2001; J. Runge et al., unpublished data, 2003]. For females,the preferential depth was set at 25 m, and for males andCVd, the preferential depth was set to the center of the layerimmediately above the bottom layer. This allows the CVdand males to be distributed in a deep layer (500–600 m) onthe shelf slope, as observed in the northeast Atlantic [e.g.,Heath et al., 2000], but without significant accumulation inthe deeper layer. For all stages other than CVd and CVIm, ifthe bottom is locally less than the standard Zopt, the prefer-ential depth is changed to be the middle of the bottom layer.Note that only the ontogenetic migration is considered in thispaper. Diel vertical migration behavior of C. finmarchicus,however, could readily be incorporated as more data becomeavailable.
2.3. Coupling the C. finmarchicus Life Model to the3D CANDIE Temperature and Currents
[16] The main feature of the physical-biological modelused in this study is the coupling of the stage-basedC. finmarchicus life-history model to the 3D, time-varyingcirculation and temperature fields produced by the CANDIEphysical model. The physical-biological model has the samehorizontal and vertical resolutions as CANDIE, but islimited only to the top 13 levels (top 750 m). A semi-implicit Crank-Nicolson numerical scheme derived from thecontrol-volume approach (CVA [see Roache, 1976]) wasused to solve the set of differential equations shown inTable 1, with the Choleski’s double-scanning method (orThomas algorithm [see Roache, 1976]) in the alternate
direction. To close the system, an iterative procedure wasused to equate the derived abundance of mature femalesfrom equation (9) to the abundance of mature females usedin the egg equation (1). Horizontal mixing was not consid-ered in the model equation because we assume that thesystem is advection-dominated. Hence the small amount ofhorizontal mixing introduced by the discrete scheme foradvection we used is already sufficient.[17] We did not consider the turbulent diffusivity from the
CANDIE model because the swimming ability of marineplanktonic copepods is typically higher than turbulent veloc-ity fluctuations; hence copepod movement is, in general,independent of oceanic turbulent activity in the upper ocean[Yamazaki and Squires, 1996]. The swimming behavior ofmarine zooplankton, however, is often nonlinear and multi-directional [e.g., Paffenhofer et al., 1996] in response toexternal and internal factors such as food availability, gutfullness, presence of predators, etc. As discussed byZakardjian et al. [1999] these factorswould act on individualsas dispersion functions and can be introduced as a biologicaldiffusivity. This approach is implicitly used by Wroblewski[1982] in his modeling study of Calanus marshallae in theOregon upwelling zone where he used a ten-fold higherdiffusivity coefficient (86.4 m2 d�1 instead of 8.64 m2 d�1)for swimming copepodite stages in order to avoid unrealisticaggregation. We followed the same approach and the verticaldiffusion in the transport equations (1)–(9) was set uniformlyto 100 m2 d�1 in order to avoid unrealistic aggregation ofanimals around their preferential depth.[18] The vertical boundary conditions for the concentra-
tions are zero fluxes at the sea surface and at the boundarybetween sea and land grid points. The lateral and bottomopen-boundary conditions are Dirichlet conditions with zeroconcentrations for all the stages, i.e., no animals at depthgreater than 750 m and no import from the Labrador Sea,mid-Atlantic bight, and the North Atlantic at large. At eachtime step, the physical-biological model calculates thefluxes through the open boundaries, spatially integratedtotal abundance, total spawning production, and mortality.A comparison of total abundance with the balance-sheet ofthe boundary fluxes, total spawning production, and mor-tality was used to check the accuracy of numerical integra-tion. The typical relative errors, normalized by the change intotal abundance, were found to be on the order of 10�6 forthe results presented in this paper. Note that the relativeerrors were largely dependent on the threshold value (10�3
in this study) used to test the convergence of the solutionscalculated in the alternate directions at each time step. Afiner threshold improved slightly the accuracy of numericalresults, but greatly increased the computation time withoutmuch change in results. Last, we verified that the openbottom boundary off the shelf break was not subject to asignificant loss of organisms, as the swimming behaviorimposed for CVd and male prevents accumulation in thedeeper layer.
3. Results
3.1. Simulated Distribution and Abundance ofC. finmarchicus: The Climatological Run
[19] The physical-biological model was initialized witha spatially uniform, shelf-diapausing CV population on
ZAKARDJIAN ET AL.: TEMPERATURE AND CIRCULATION EFFECTS GLO 17 - 9

28 October, a time when all the sub-populations in the studyregion are assumed to be in diapause. The initial CVdconcentration was set to 30 per cubic meter for water depthsof less than 1000 m and zero elsewhere. The depth-inte-grated abundance in early January (Figure 6) reflects thecontinuing diapause of the initial C. finmarchicus sub-populations from October to December throughout theregion. CVd are concentrated mainly in the deeper areasof the shelf, including the Laurentian Channel and itsbranches in the GSL, shelf break and SS deep basins. Thehigher depth-integrated abundance in the deeper areas atthis time results largely from the initial conditions of thespatially uniform initial CVd concentrations, but the abilityof CVd to migrate toward its deep preferential depth furtherreinforces these patterns.[20] From January to March, the total C. finmarchicus
abundance does not change much in the GSL, but increasesgreatly in the GOM and then later on the SS, due primarilyto early arousal and spawning by the local populations.Over the western SS and GOM, the total C. finmarchicusabundance reaches a maximum in May and graduallydecreases after July. In contrast, the total abundance in theGSL reaches a maximum in July and decreases graduallyafter September to near-initial values. Slightly higher over-wintering CV abundances remain in the SG and GOM, forreasons to be discussed below.[21] The simulation predicts relatively high C. finmarch-
icus abundance in spring and summer in the deep waters offthe SS and GOM. This area was initially empty of animalsand is populated by the immigration at depth of the initialCVd population that drifts eastward to the southeast bound-ary of the model and offshore (Figure 6, January 6). Asignificant portion of these diapausing CVs, which origi-nated along the shelf break or in the deep areas of theLaurentian Channel, becomes trapped in this offshoreregion due to re-circulation between the Labrador Currentand the Gulf Stream. After arousal, females ascend to thesurface layers and are dispersed northward to the slope-water region, where water temperatures are favorable forrapid growth of the spring generation.[22] Vertical distributions of stage-grouped abundance at
different locations along a north-south transect at roughly63�W on 16 May (Figure 7) reflect their stage-specificpreferential depth and swimming behavior. Eggs andweakly mobile early naupliar are distributed in the top60 m with a slight mode around 25 m whereas later naupliar(NIII–NVI) and early copepodids (CI–CIII) aggregate forthe most part near sea surface and around 25 m, respective-ly. The CIV–CV abundance has two modes in the vertical,one near 75 m for active animals and the other at depth fordiapausing individuals. The high abundance between 500and 600 m in offshore waters consists mostly of diapausingCV while onshore the depth of CVd abundance maximum islimited by the bathymetry. The adults also have two modesin the vertical: one near the surface for females and the otherat depth for males.[23] The predicted seasonal variation in stage structure
and mean abundance (Figure 8) is generally consistent withknowledge of C. finmarchicus life cycles in the region(detailed comparison in the next section). The CVd of theinitial generation (G0) exits from diapause, molts to adult,and starts to spawn to produce the new generation (G1) in
January in the GOM, February in the SS, late March in theSG (southern GSL), April in the NWG (northwestern GSL),and May–June in the LSLE and NEG (northeastern GSL),respectively. The active season of C. finmarchicus ends withthe increase of the CVd stocks and disappearance ofthe naupliar and early copepodids in June–July in theGOM, July–August in the SS, August in the SG and CG,and August–September in LSLE, NWG, and NEG, respec-tively. Figure 8 also shows a second generation (G2)produced by a small fraction of adults of (G1) at the endof the first-year reproduction in these sub-areas. However,recruitment of diapausing CV’s was made up mostly of G1.The model results also correctly simulate that CVd andfemales dominate during the period from late fall to latewinter or early spring, with their over-wintering abundanceslightly decreasing gradually with time.[24] The depth-integrated CVd abundance over the eight
sub-areas at days 30 and 390 (Table 3) are representative ofthe over-wintering stocks initially and at the end of the1-year simulation. Over the SS and in the deeper areas ofthe GSL (i.e., LSLE, NWG, CG, and NEG), the over-wintering stocks at day 390 are very similar to the initialconcentrations, despite very different environmental con-ditions (timing of diapause, temperature and circulation)prevailing in those sub-areas. In the GOM and SG,however, the over-wintering stocks at day 390 are muchhigher than the initial conditions, although they are in therange of observed values for the GOM [e.g., Durbin et al.,2000a]. The increased population in the GOM is in responsein part to rapid development times at the relatively highambient temperatures and in part from continuous importsof C. finmarchicus from the SS and the adjacent shelf breakin the Nova Scotia and Labrador Currents, as shown below.The increase of the over-wintering stocks in the SG region,on the other hand, is principally the result of an inadequateformulation of the swimming behavior of deep-dwellingstages CIV–V in shallow water <75 m, in which thepreferred depth is forced to be the middle of the bottomlayer. Since the currents at this depth are relatively weak dueto bottom friction, the deep-dwelling stages are unable toescape from these shallow areas and would likely besubjected to higher mortality rates, a factor not includedin the present model. In the Laurentian Channel, the 70%decrease in simulated over-wintering stock (Table 3) islikely due to the absence of immigration of C. finmarchicusfrom the Labrador and Newfoundland shelves through theeastern open boundary, which was set at zero in this study.
3.2. Comparison With ObservedLife-History and Abundance
[25] The results of the climatological run are compared tofour different data sets describing the annual life cycle ofC. finmarchicus in the study region. The first data setderives from a monitoring program in the LSLE in whicha fixed station 330 m deep located 16 km north of Rimouskiwas visited each week from May to November in 1994,1996, and 1997 [Plourde et al., 2001]. Eggs were notenumerated from preserved samples, and older naupliarstages (clearly identified as C. finmarchicus) and youngercopepodid stages were grouped as NIII–VI and CI–III,respectively. The second data set originates from a fieldstudy conducted between 1945 and 1949 in the Baie des
GLO 17 - 10 ZAKARDJIAN ET AL.: TEMPERATURE AND CIRCULATION EFFECTS

Figure 6. Seasonal trends of the total C. finmarchicus population plotted as log10 of depth-integratedabundance over the 1-year simulation.
ZAKARDJIAN ET AL.: TEMPERATURE AND CIRCULATION EFFECTS GLO 17 - 11

Chaleurs (SG) at a sampling site 7 km south of GrandeRiviere [Filteau and Tremblay, 1953]. All C. finmarchicusstages except eggs were counted; we calculated the meanstage abundance from these data. The third data set repre-sents detailed observations gathered in Bonne Bay [Starr etal., 1994; M. Starr, unpublished data, 1994], a deep fjord onthe western shore of Newfoundland in the northern Gulf ofSt. Lawrence (NEG). The fourth data set, representative ofthe SS, was obtained from (1) monthly plankton samplescollected between March 1991 and March 1992 during theOcean Production Enhancement Network (OPEN) programon and around Western Bank, (2) plankton hauls in 1995–1996 from seven stations on the ‘‘Halifax transect’’ acrossEmerald Basin to deep water beyond the shelf break, and(3) plankton samples from Emerald Basin between 1984and 1992. Sample collection and analysis are described inMcLaren et al. [2001]. We calculated depth-integratedabundance (number per square meter) from mean concen-tration (number per cubic meter) by assuming a mean shelfdepth of 75 m.[26] Figure 8 summarizes the comparison with the model
results. In the LSLE, the simulated life cycle, particularly
the seasonal trend in stage-structure, agrees reasonably wellwith the data and the model reproduces the right order ofrelative abundance of CV and CVIf during the period ofreproduction. However, the simulated reproduction beginsabout 1 month earlier than observed and the modeledabundance of early life stages does show the persistenceinto late summer and autumn as seen in the observations.[27] In the SG, the timing of the observed maximum of
CI–CIII in June and the increase of CV in late summer areconsistent with the observations. The model results overes-timate the abundance of CIV–V and adults in this area butunderestimate the relative abundance of early stages in latesummer and autumn. Note that the simulated life cycle andabundance in Figure 8 represents a mean for the entiresouthern Gulf whereas the station used by Filteau andTremblay [1953] was situated in relatively shallow water(76 m) near the coast. Over this shallow water area, theinput of G0 females from arousal of the over-wintering stockin deeper water of the Laurentian channel should depend onlocal circulation, including input from the coastal jet round-ing the Gaspe Peninsula. Because the spatial resolution ofthe model is too large to resolve the details of the nearshore
Figure 7. Vertical distributions of eggs to NII, NIII–VI, CI–III, CIV–V, and adults of C. finmarchicusat different locations along a south-north section (63�W) extracted at day 200 of the simulation (May 16).Only the upper 200 m is shown for the young stages (e.g., gs-CIII). The depth axis is reduced in shallowareas. Note change in abundance scale among regions.
Figure 8. (opposite) (left panels) Simulated mean abundance and stage structure of C. finmarchicus in each sub-area(abbreviations as in Figure 1) compared with (right panels, except GOM) observations in that sub-area. Log absoluteabundance is shown for stages NIII–NVI (CI–CIII in NEG), total CV, and adult females. Stage structure is expressed aspercent of the population between Nauplius III to adults. Both legends appear at bottom right.
GLO 17 - 12 ZAKARDJIAN ET AL.: TEMPERATURE AND CIRCULATION EFFECTS

ZAKARDJIAN ET AL.: TEMPERATURE AND CIRCULATION EFFECTS GLO 17 - 13

circulation where the sampling station was located, thelocation of the Filteau and Tremblay [1953] study site initself could account for differences between the model andthe observations in the early life stages and females.[28] In the NEG, the simulated CV and CVIf abundance
and the timing and duration of seasonal production agreereasonably well with the Bonne Bay observations (thenaupliar stages were not counted and hence do not showup in the observed stage structure). The NEG data wereused to set the coefficients in the general equation describ-ing latitudinal variation in the reproductively active season(equation (11) in Table 1); hence the simulation of thetiming of the life cycle in this area is not strictly indepen-dent of the empirical data. The simulated percentages ofstage CI–IV in the NEG are however much lower than theobservations at the beginning of the spawning season. TheBonne Bay sampling station was in the fjord’s externalbasin, which connects to the GSL across a shallow sill about50 m deep. The marked contrast between the very low adultabundance and very high abundance of early copepodids insummer suggests imports of Calanus from neighboringopen waters where the winter resting stock of C. finmarch-icus resides. The physical model would not provide fine-scale simulations of water exchange between the externalbasin and the neighboring open waters. Moreover, similarlyto the SG data set, as the modeled life-cycle represents amean for the entire northeast Gulf, the sampling location ofthe Bonne Bay data set contributes to discrepancies betweensimulated and observed C. finmarchicus abundance.[29] On the SS, there is good agreement in the timing of
maximum relative abundance of adults in mid-February andmaximum absolute abundance of naupliar and stages CI-CIII between mid-March and mid-April. The decline innaupliar abundance in summer, between June and mid-August, is simulated. However, the model indicates nonaupliar stages present in September, whereas the observa-tions show persistence of early life stages throughout theyear (although at levels 2 orders of magnitude less than thespring). The generation originating from the March–Augustspawning is the main contributor to recruitment of the over-wintering stocks in the simulation.
3.3. Flux Estimates and Impacts on Area Budgets
[30] To evaluate the importance of horizontal exchangerelative to local C. finmarchicus population dynamics, wecalculated the cross-boundary fluxes of abundance acrossthe 10 regional boundaries shown in Figure 1, LSLE/NWG,NWG/CG, NEG/CG, SG/CG, CG/LC, eastern LC, southern
LC, LC/SS, southern SS, and SS/GOM (Figure 9) andcompared the corresponding annual sum to the annual totalnet production in each area (Table 4). The total net produc-tion is defined here as the difference between the total eggproduction and total mortality of all life history stages(including eggs). For all the areas identified in Figure 1,except the NWG, where the net flux is negligible, theannual net fluxes are 17 to 40% of an area’s net production(Table 4), suggesting that transport of C. finmarchicus is offirst-order importance for the GSL-SS stock. The cross-boundary fluxes are for the main part due to the transport ofyoung stages. This is due to the greater abundance of youngstages and higher surface current velocities, although deep-dwelling stages (CIV–V and CVd) can also be subject tostrong transport (Figures 9a, 9b, and 9j).[31] The flux across the LSLE/NWG boundary plays a
very minor role in the NWG, where it is no more than 2% ofannual mean net production. Conversely, it is important inthe LSLE budget (18.2%). Stage-specific fluxes across theLSLE boundary (Figure 9a) are globally consistent with theprevailing estuarine-like circulation in spring. Surface-dwelling stages (eggs, nauplii, and females) are flushedfrom the estuary in spring/early summer while deeper-dwelling stages (CI–V) are imported from the NWG later.Nevertheless, the flows of eggs and stages NI–II reverse insummer due to the combination of (1) a different verticaldistribution than NIII –VI (Figure 7), (2) a greaterC. finmarchicus abundance in the NWG, and (3) a gyre-like circulation that sets up seasonally in the transitionregion between the LSLE and NWG (Figure 4) as describedby El-Sabh [1979], Koutitonsky [1979], and Ingram andEl-Sabh [1990]. As the annual flux is cumulative acrossstages, stage-specific differential transports compensate,with a final balance sheet showing net import into theLSLE. Hence, while there is flushing of early life stagesfrom the LSLE in late spring and early summer, our modelresults show that this transport is not significant to the NWGproduction. While the LSLE/NWG boundary surface isrelatively insignificant compared to the large surface areaof the NWG, it is important compared to the much smallersurface area of the LSLE.[32] The seasonal and stage-specific variability of the
calculated fluxes between NWG and CG (Figure 9b) isdue to a strongly sheared circulation between the GaspeCoast and Anticosti Island that results from the adjustmentof two cyclonic gyres occurring north (the NWG Gyre) andsouth (the CG Gyre) of the Gaspe-Anticosti channel(Figure 4). The surface circulation is downstream to thewest and near the center of the Laurentian Channel (theGaspe Current) and upstream east of the channel. At greaterdepths (>25 m), upstream-east currents prevail, but themean circulation again reverses at depths >150 m. In springand summer, there is a net upstream flux of eggs, earlynaupliar stages (NI–NII), and early copepodids (CI–CIII)from the CG to the northwestern NWG, but there is a slightnet downstream flux in late summer. In contrast, NIII–VIare continuously exported to the CG, from late spring toearly autumn, due again to their marked aggregation in thesurface layer. Diapausing CV and males, on the other hand,are always exported from the NWG to the CG, whileintermediate deep-dwelling stages (CIV and active CV)are transported from the CG to the NWG. Again stage-
Table 3. Mean Abundance (number per m�2) of the Over-
wintering Stocks After 30 and 390 Days of Simulation by Areas
Defined in Figure 1
Area Day 30 Day 390
LSLE 2845 2951NWG 6729 7627NEG 3837 7027SG 3976 8652CG 6644 9037LC 7278 2237SS 3977 3197
GOM 3066 16261
GLO 17 - 14 ZAKARDJIAN ET AL.: TEMPERATURE AND CIRCULATION EFFECTS

specific and seasonal variations lead to a low annuallycumulative value that is slightly positive (+1.6%) for theNWG budget and not significant for the CG (<1%).[33] Calculated fluxes between NEG and CG show a net
export from the CG to the NEG for all stages except CVdand males (Figure 9c), with annual sum about 10–20% ofthe two areas’ budgets. Transports are generally in agree-ment with the known circulation in the northeastern part ofthe Gulf [e.g., Koutitonsky and Bugden, 1991]: a mainlycyclonic surface circulation with a much more markednorthward component along the west coast of Newfound-land (Figure 4) and a reversed net flow at depth (>100 m).
Hence eggs, nauplii, and early copepodids (CI–CIV) movenortheastward from the CG to the NEG, with maximumfluxes in June for eggs and naupliar and in July August forthe early copepodids. In contrast, there is a constantsouthwestward flux of the deep-dwelling, diapausing CVand of adult males from the NEG to the CG; however, thesurface northeast fluxes dominate and the balance sheet ismainly an export from the CG to the NEG.[34] The annual cumulative transport across the SG/CG
boundary shows a net import to the SG from the CG whichis 17% of the SG annual net production but is not asimportant to the CG budget (8%). The transport is domi-
Figure 9. Seasonal variations of stage-grouped transport across the ten boundaries shown Figure 1:(a) LSLE/NWG, (b) NWG/CG, (c) NEG/CG, (d) SG/CG, (e) CG/LC, (f) east LC, (g) SS/LC, (h) SS/GOM,(i) south LC, and south (j) SS. For each panel the direction of the transport (depending on sign) isindicated.
ZAKARDJIAN ET AL.: TEMPERATURE AND CIRCULATION EFFECTS GLO 17 - 15

nated by a constant import of eggs and naupliar stages fromthe CG to the SG, whereas transport of older stages is moreseasonally variable (Figure 9d). The inflow of young stagesis mainly from transport by the Gaspe Current and the CGcyclonic gyre. Outflow from the eastern side of the SGresults in a net outward flux of CI–CIII in early summerand diapausing CV are always exported from the SG, butboth at a low rates.[35] The cumulative annual transport across Cabot Strait
accounts for only 0.2 and 2% of the CG and LC annual netproduction, respectively. The circulation in Cabot Strait isstrongly sheared and shows marked seasonal variations thatexplain this low relative exchange across all life historystages. The computed fluxes show a strong transport intothe GSL of naupliar stages in May–June which reverses in
July–August (Figure 9e). The May–June peak results fromthe surface inflow of LC population along the northern sideof Cabot Strait. There is a summer outflow of copepodidstages C1–C3, which is consistent with previous findingsshowing high concentrations of stages C1–C3 near theentrance to the Gulf of St. Lawrence in June [Sameotoand Herman, 1992]. In winter and spring, there is a nettransport of deep-dwelling stages (CIV–CV and males)from the CG to the LC whereas in summer the same stagesare transported into the GSL from the south.[36] Fluxes in the LC, SS, and GOM show a net south-
westward transport of all stages of C. finmarchicus from theNewfoundland Shelf to the LC and along the SS to theGOM, reflecting the residual circulation of the LabradorCurrent along the shelf break and of the Nova Scotia
Figure 9. (continued)
GLO 17 - 16 ZAKARDJIAN ET AL.: TEMPERATURE AND CIRCULATION EFFECTS

Current over the inner Scotian Shelf (Figures 9f–9h). Thesouthwestward annual transport is about 26% of the LCannual net production but more than 60% of SS annual netproduction, which includes both the import from the LC andthe export to the GOM. The exchange with slope waterthrough the LC south boundary is low (less than 3% of theannual net production) but is much more marked on the SSshelf-break. Transport is mainly out of LC for all stages(Figure 9i), except for import of CVd in winter, which maybe an artifact of the spin-up from initial conditions. Alongthe SS south boundary, there is more seasonal variability,mostly in the fluxes of early life stages (Figure 9j), becausethe Labrador Current follows the shelf break and fluctuatesseasonally in overlap with the boundary. The model predictsan outward flux of early life stages (eggs to NVI) in latewinter and then a reversal and substantially higher input ofearly life stages onto the SS in April–June. Older copepo-did stages (CIV–CV) are transported in large numbers ontothe SS in summer and autumn, in particular a massiveimport of CVd that reflects the abundance of the slope-water stock. The balance consequently shows a significantimport from the slope water that contributes about 28% ofthe SS annual net production.
4. Discussion
[37] Our objective in this study was to estimate therelative importance of transport in relation to biologicalproduction in sub-areas of the GSL and SS. For thatpurpose, we used a simplified stage-based model thatfocused on vertical distribution, advection-induced mixingof sub-populations in a large-scale model, and estimation ofthe resulting fluxes. We did not focus on individual growthas we were concerned here with first-order biophysicalinfluences on numbers of C. finmarchicus rather thanbiomass. Although our mathematical model differs frommore detailed life-history models, such as age-within-stagemodels, the model we present here yielded a realisticontogeny and annual abundance pattern, i.e., a cascadingof the population through eggs to adults with consistentlylower abundance, by an order of magnitude or more, from
eggs and naupliar to copepodids as in previous modelingstudies [e.g., Tande and Slagstad, 1992; Miller and Tande,1993; Carlotti and Radach, 1996]. The resemblance of thesimulated and observed life stage abundance and a finalCVd population similar in abundance to the initial popula-tion and with a realistic distribution, show the ability of thissimplified model to simulate a mean climatological state ofthe populations of C. finmarchicus in the eastern Canadianwaters. As both the seasonal evolution of abundance andcirculation are reasonably represented in the model, weargue that it captures, within the right order of magnitude,the relative importance of transport in relation to biologicalproduction.[38] It is recognized that this simplified stage-based
approach does not include aspects of C. finmarchicuspopulation dynamics that may have a significant, althoughwe believe second-order, influence on results of the simu-lations. First, our simplified model does not explicitlyaccount for variability in the availability of food resourcesthat would influence development and reproduction duringthe active season. While development in Calanus is lessinfluenced than growth rate by food [e.g., Vidal, 1980;Campbell et al., 2001b], there is the possibility, not con-sidered in our model simulations, that development duringthe active season may be retarded during low chlorophyll,post-bloom periods [e.g., Campbell et al., 2001a]. This mayexplain, for example, a mismatch between predicted andobserved development rates on Western Bank on the SSduring late spring [McLaren et al., 2001]. Likewise, weused here a ‘‘climatological mean’’ state of reproduction ofC. finmarchicus during the active season with a constantrate of 50 eggs female�1 d�1, the median rate of eggproduction from observations in the Gulf of St. Lawrence[Runge and Plourde, 1996]. Empirical studies indicate thatC. finmarchicus in this system is capable of sustaining eggproduction not only during periods of high phytoplanktonbiomass but also during the low-chlorophyll, post-bloomperiod [Ohman and Runge, 1994; Runge and de Lafontaine,1996]. We believe that food limitation is not of first orderfor a climatological view of the system but would befundamental for subsequent studies on interannual or inter-
Table 4. Magnitude of Annual Cumulative Boundary Fluxes Relative to Net Production in Each Sub-Areaa
LSLE NWG NEG SG CG LC SS
TEP 7.95E + 14 1.23E + 16 1.83E + 16 9.45E + 15 2.78E + 16 2.16E + 16 2.21E + 16TM �6.57E + 14 �1.11E + 16 �1.65E + 16 �8.07E + 15 �2.48E + 16 �1.93E + 16 �1.97E + 16NP 1.39E + 14 1.28E + 15 1.81E + 15 1.38E + 15 3.01E + 15 2.31E + 15 2.44E + 15Yearly cumulated fluxLSLE/NWG �2.39E + 13 +0.172 �0.019NWG/CG 1.99E + 13 +0.016 �0.007NEG/CG 3.28E + 14 +0.181 �0.109SG/CG �2.42E + 14 +0.176 �0.080LC/CG �5.81E + 12 �0.002 +0.003East LC �5.97E + 14 +0.259South LC �5.62E + 13 �0.024LC/SS �1.50E + 15 �0.651 +0.615South SS 6.82E + 14 +0.280SS/GOM �1.67E + 15 �0.684Balance +0.172 �0.003 +0.181 +0.176 �0.198 �0.414 +0.211
aSee Figure 1. Column headings indicate sub-area. The first three rows show total egg production (TEP), total mortality (TM), and net production (NP)for each sub-area as number per year (no. yr �1). Annual cumulative fluxes (no. yr �1) are provided in row 4. Subsequent row headings indicate location ofboundary flux. Bold numbers give proportion of annual cumulative flux relative to NP for each sub-area and boundary (positive and negative valuesindicate import and export, respectively). Bottom row shows the overall balance of annual flux/NP for each sub-area.
ZAKARDJIAN ET AL.: TEMPERATURE AND CIRCULATION EFFECTS GLO 17 - 17

decadal variability. As data become available, future modelversions will explore the sensitivity of the annual patterns ofC. finmarchicus abundance and distribution to food-limitedreproduction that may occur at particular times in differentareas of the system.[39] Mortality is stage-specific and varies in time and
space with temperature or ecological conditions [e.g.,Ohman and Hirche, 2001; Ohman et al., 2003; McLarenet al., 2001] and consequently may deviate from the singlemortality schedule that we applied to all areas. An alterna-tive approach is to use area-specific mortality rates sinceecological conditions obviously differ between the GOMand GSL with respect to temperature, food limitation [e.g.,Durbin et al., 2000a; Campbell et al., 2001a] and, undoubt-edly, predator fields. In the coupled model of C. finmarch-icus dynamics on Georges Bank, Miller et al. [1998] had toimpose higher mortality rates on the simulated secondgeneration (G2) in order to scale the overall developmentof the population. Lynch et al. [1998] found it necessary todelay or temporarily limit G1 reproduction, by invokingfood limitation, in order to scale the development of G2.The closure of biological models by mortality is not a newproblem in ecological modeling [e.g., Edwards and Yool,2000] but there is no ideal solution for this problem at thistime because information on temporal and spatial variabilityof C. finmarchicus mortality is too sparse to permit adeterministic parameterization of mortality. We applied auniform mortality regime over the entire region so thatdifferences in simulated life cycles and abundance weretherefore only due to the effects of circulation and temper-ature prevailing in each of the sub-areas.[40] A major problem in modeling the population dynam-
ics of C. finmarchicus is the quantitative description of theover-wintering phase of the seasonal life cycle. In our modelit is assumed that the life cycle of C. finmarchicus is drivenby an optimal window for reproduction outside of which thepopulation waits in a dormant phase for favorable condi-tions. This is done by imposing a seasonality function thatdetermines the time window during which the sub-popula-tions emerge from diapause and spawn and within whichthe temperature-dependent molting rates and stage-specificmortality rates drive the population growth rate. Thisformulation captures the main patterns of the life cycle ofC. finmarchicus off eastern Canada including the impor-tance of seasonality as a major driving factor for itsdynamics. We have based the area-specific seasonalityfunctions on empirical observations of life cycle timing inthe GOM and NEG; hence the model simulations and fieldobservations are not completely independent with respect totiming of reproduction. In reality, the match between thetiming of arousal and the seasonal variation of environmen-tal conditions, mainly temperature and food abundance,may crucially influence interannual variation in the dynam-ics of C. finmarchicus populations [e.g., Hirche, 1996a;Head et al., 2000]. Here we assumed that the simulatedsystem represents an idealized seasonal reproductive cyclefor each sub-region, with no other local effects other thanthose due to the circulation.[41] The simplified seasonality function defining the
dormant period during which development and reproductionare dormant has the effect of limiting the simulation of theC. finmarchicus population to one generation per year. In
general, the first generation (G1), hatched in the cold watersof spring, develops more slowly than a subsequent gener-ation later in summer. Too short a reproduction and devel-opment window in our model would limit the developmentof the second generation mainly by preventing molting ofG1 from CV to adults, but in addition would suppress thespawning of the small stocks of G1 females that are foundin both the simulations and observations (Figure 8). Onegeneration annually is typical in most northern populationsof C. finmarchicus [Tande, 1982; Tande and Slagstad, 1992;Bamstedt, 2000; Head et al., 2000], whereas in warmerwaters, there are often two full generations, as on theIceland Shelf [Gislasson et al., 2000; Gislasson andAstthorsson, 1996], weather station India [Irigoien, 2000],and the GOM and Georges Bank [Durbin et al., 1997,2000a; Meise and O’Reilly, 1996]. The LSLE and GSL arecold environments where the one-generation scenario isgenerally observed [Plourde et al., 2001]. McLaren et al.[2001] considered that two generations would be the generalrule on the SS; however, they also suggest that the relativeimportance of the two generations for recruitment of over-wintering stocks may vary in different parts of the shelf.Nevertheless, as the one generation simulated by the modelgave relative and absolute abundance similar to the obser-vations, we believe that this limitation would not stronglyaffect either the robustness of the estimated transports ortheir importance relative to the annual net production. Amore refined model description of this process awaitsanalysis of long-time series data [e.g., Therriault et al.,1998] and a better understanding of factors that drive theontogenetic timing of entry and emergence from diapause inC. finmarchicus populations in the western Atlantic Ocean[Miller et al., 1991; Hirche, 1996b; Hind et al., 2000].[42] Some physical processes were not resolved by the
hydrodynamic model. First, the CANDIE model was run indiagnostic mode in which the conservation equations fortemperature and salinity are not calculated. Such diagnosticcalculations are robust in long-term integration, but unable toresolve the interactions of temperature and salinity with theflow field. Second, the wind stress was not used directly inthe momentum equation to drive the flow. Therefore, themodel results presented in this study excluded the Ekmantransport and coastal upwelling events associated directlywith the wind. Third, the CANDIE model generated anestuarine-like circulation in the LSLE, but did not producethe spring flushing of the surface layer in this area due to thecoarse model resolution. Zakardjian et al. [2000] discussedthe important role of flushing of the euphotic zone driven byfreshwater runoff in controlling the timing of the phyto-plankton bloom in the area. This flushing should also applyto surface-dwelling nauplii and females, and reinforcethe delay of the C. finmarchicus reproduction observed inthe LSLE [e.g., Plourde et al., 2001]. The same constraintsapply to the GOM, where small-scale circulation stronglycontrols C. finmarchicus distribution and abundance[e.g., Hannah et al., 1998; Shore et al., 2000]. The apparentexcessive model population of C. finmarchicus in the GOMmay partly result from too little export to Georges Bank,which leads to local trapping of C. finmarchicus importedfrom the SS. This shows the present limitation of the modelfor describing local-scale processes even though the regionalcirculation is globally well represented in CANDIE.
GLO 17 - 18 ZAKARDJIAN ET AL.: TEMPERATURE AND CIRCULATION EFFECTS

[43] Modeling the influence of transport and advection onC. finmarchicus population dynamics requires understand-ing of vertical distribution and migration behavior [e.g.,Hannah et al., 1998; Zakardjian et al., 1999]. In our modelthe vertical distribution is stage-specific and is achievedthrough the imposed swimming behavior. Our modeldescription of vertical distribution derives from observa-tions; however, there may also be local exceptions orchanges in distribution due to local environmental condi-tions [e.g., Tande, 1988]. For example, it is not clearwhether deep-dwelling stages in shallow waters would betrapped on shallow areas like the SG. The shallower waterlikely promotes higher mortality rates in later stages, be-cause of higher predation on the larger copepodids thatcannot escape predators by migrating to deeper water. Theimposed swimming behaviors of NI–NII and NIII–VI mayhave caused artifacts in the advection of these stages, whichare generally assumed to be transported as a whole. Whileeggs and early naupliar are evenly distributed in the upper50 m, the weak swimming capacity of NIII–VI allows themto aggregate in the upper surface layer, as observed byDurbin et al. [2000b]. In strongly vertically sheared areas,such as the LSLE, and the Gaspe-Anticosti and CabotStraits, this slight difference in mobility and vertical distri-bution is enough to create different flux patterns. Moreempirical observations in sub-areas of the GSL-SS systemare needed to increase our knowledge about swimmingbehavior and vertical distribution.[44] Despite the limitations of the model in its present
form, as discussed in the previous sections, the results fromthis climatological run serve to elaborate existing hypoth-eses and suggest new ones about the effects of basin-scale physical processes in the dynamics of regionalC. finmarchicus populations. Plourde and Runge [1993]and Plourde et al. [2001] put forward the hypothesis that theLower Estuary/Gaspe Current serves as a Calanus ‘‘pump,’’exporting to the GSL naupliar and copepodid stagesproduced in the Lower Estuary in late spring and summer.While the spatial resolution of the model does not clearlyresolve the seaward circulation in the LSLE and NWG, itnevertheless shows a distinct peak in flux of early Calanuslife stages from the LSLE to the NWG in summer and aninflow of diapausing CV into the LSLE during the wintermonths (Figure 9a). As discussed earlier, because of thedifferences in surface area of the LSLE and NWG, the influxof stage CV is relatively much more important to the LSLEthan its contribution of early life stages to the NWG(Table 4). The model results, therefore, do not indicate animportant role for the Calanus ‘‘pump’’ in the dynamics ofthe GSL population, although the NWG/LSLE exchangeswould be of first importance for the LSLE population.[45] An important new hypothesis based on insights from
the model results is that the GSL population is self-sustain-ing. The GSL is connected to the SS by Cabot Strait,through which surface GSL water flows out along thesouthwestern side and surface waters from the Newfound-land and Labrador Shelf flow in along the northeastern side.At depth, Atlantic slope water flows slowly into the GSLthrough the Laurentian Channel. The two inflows arethought to compensate for the outflow from the St. Law-rence. No imports from the Labrador Sea are considered inthe model, so that the large influx of early naupliar stages
in spring, due to the initial population in the LC area(Figure 9e), rapidly decreases and is even reversed later insummer. The inflow of deep dwelling stages (CIV–CV andmales) is less than the outflow of nauplii and early cope-podids. Hence the overall balance shows export (Table 4),yet the GSL maintains its own population based on its localproduction, without any import from the Labrador Sea.[46] Advection is nevertheless still important to the
distribution of C. finmarchicus within the GSL. The fluxesand budgets showed strong exchanges between GSL sub-areas, with the CG being a buffer area between the SG,NWG, and NEG. The CG seems to be the main area forC. finmarchicus production in the GSL and is a source forthe three adjacent sub-areas; only a small export fromthe SG to the CG, of CI–III in June, was revealed by thecalculated fluxes. The literature on C. finmarchicus in theGSL, like our simulated data (Figure 6), indicates highestfemale abundances in the CG, 6000 m�2 [Runge and deLafontaine, 1996] [see also de Lafontaine et al., 1991].The conclusion that the CG is the main source ofC. finmarchicus in the SG is consistent with the resultsof Runge et al. [1999], who found that C. finmarchicusabundance in the SG is inversely correlated to the winter-spring freshwater discharge from the St. Lawrence Riversystem (RIVSUM). On the basis of our model results, wehypothesize that a high RIVSUM increases seaward cir-culation in the SG and its edge, south of the LC, hencefavoring flushing of the SG and limiting the invasion ofthe over-wintering CG population. In a low RIVSUMyear, the slower flushing of the surface layer in the SGand in the south of the LC allows more time for the CGpopulation to invade the SG after arousal.[47] The flux calculations show that transports arising
from the mean southwesterly flow across the SS from theLC and into the GOM (Figures 9f–9h) are equivalent toabout two thirds of the net annual production occurring onthe shelf (Table 4). The large-scale transport from the SS tothe GOM and Georges Bank is noted in earlier studies[Meise and O’Reilly, 1996; Miller et al., 1998; Shore et al.,2000]. The source of input to the SS has been the subject ofseveral studies of Calanus distribution in relation to hydro-graphic features. Herman et al. [1991] concluded that theNova Scotia Current originating from the outflow of theGSL is the major supplier of Calanus to the mid-Scotianshelf. They hypothesized that the copepodids transportedonto the SS would accumulate in the SS basins during theseasonal ontogenetic migration in summer and autumn.Sameoto and Herman [1992] suggested that there are threesources of C. finmarchicus found on the SS: (1) the deep SSbasins harboring the overwintering stock, (2) the NovaScotia Current driven by outflow from the GSL, and(3) C. finmarchicus migrating to the surface layer in earlyspring in the Labrador Current that are transported inintrusion events of slope water onto the Shelf. Head et al.[1999] hypothesized that overwintering C. finmarchicus inthe deep slope waters beyond the shelf break is a majorsource to the central and western SS. C. finmarchicus wouldbe carried onto the SS from the slope region by intrusion ofwarm offshore water onto the mid-shelf in later winter-earlyspring. They put forward as a question whether the offshoresource originates from an over-wintering stock in a localgyre-like system south of the SS or from advection in the
ZAKARDJIAN ET AL.: TEMPERATURE AND CIRCULATION EFFECTS GLO 17 - 19

Labrador Current. They also asked whether C. finmarchicusadvected off the SS are simply transported away from theregion, or does a portion return to the slope to be retained inthe proposed gyre. The model results here provide insightsinto these hypotheses and questions. The simulation showsimportant exchanges at the southern boundaries of both theLC and SS. The LC exported naupliar and early copepodidsin May, when there was mainly import on the southernSS boundary (Figures 9i–9j). This may be a mechanismfor transport from the LC to the SS via the shelf-breakcurrent that captures C. finmarchicus south of LC andtransports them onto the SS. In contrast, deep-dwellingstages (CIV–V, CVd, and males) are imported from slopewater into both the LC and the SS across the shelf break.[48] The model results indicate that a large population
develops in the slope water south of the SS. This area wasinitially devoid of animals, and was seeded by downwardmigration of the initial CVd population that had beencarried to the southwestern boundary of the model domain(Figure 7). After the ascent of the freshly molted females,this stock was transported northward in the slope-water jetand then multiplied in warm (but not lethal) water. Little isknown about the slope-water population of C. finmarchicus,but our simulated population is not unrealistic, as thepresence of C. finmarchicus is known in the slope watersouth of New England [Miller et al., 1991; Ashjian et al.,2001]. C. finmarchicus has even been observed as far southas the mid-Atlantic Bight [Judkins et al., 1979; Smith andLane, 1988; Lane et al., 1994], where it can developvigorously following cold winters [Grant, 1988], and, forlate copepodids and adults, as far east as the Gulf Stream atdepth [Wishner and Allison, 1986; Ashjian and Wishner,1993]. All these observations and analyses argue for ageneral southwestward transport of C. finmarchicus and arecirculation in the slope water, with the Gulf Stream as theultimate southern boundary of its distribution in the NorthAtlantic.[49] These results provide possible answers to the ques-
tions posed by Head et al. [1999] about the source of theshelf-break population and the subsequent fate of the on-shelf population. The hypothesis that emerges is that thereare two sources of the shelf-break population: (1) exportedLC individuals transported in the southwestward flow of theshelf-break current and (2) diapausing stage CV transportedout of the SS in autumn/winter, a portion of which recircu-lates back onto the slope. The model predicts that thesereturning CV molt and reproduce in the slope water. Theslope water south of Newfoundland and the SS is subject tomarked interannual variability in dominance of either thewarmer slope-water jet or the colder Labrador current[Pickart et al., 1999], which would have a profound effecton the slope water C. finmarchicus stock [Greene andPershing, 2000]. More observations are needed in therecirculation gyre south of the SS in order to determinethe actual extent and frequency of reproduction in this area.
5. Concluding Remarks
[50] This study represents a first step in the evolution ofa coupled physical-biological model that describes thedynamics of copepod populations in the GSL-SS system.Future refinements of the life-history model should be able
to relate the diapause and spawning functions to seasonalvariations of environmental variables, in particular phyto-plankton abundance, for more accurate representations ofseasonal and interannual variation in reproductive rates[e.g., McLaren and Leonard, 1995]. More explicit mortalityfunctions, including the potential for increased cannibalismin low-chlorophyll waters [e.g., Ohman and Hirche, 2001],can be used to probe the relative influences of reproductionand mortality on population growth rates and interannualvariation in C. finmarchicus life cycles. Future model runswill benefit as well from advances in physical modeling. Asthe life-cycle model allows multiyear simulations, a prog-nostic version of the physical model could link interannualvariability in circulation and temperature with C. finmarch-icus distribution and abundance. Refinements of the modelwill also require more observations in critical areas such asthe southeast Labrador Sea, Newfoundland Shelf, and theSlope Water recirculation gyre, and observations of verticaldistribution of C. finmarchicus particularly in stronglysheared areas like Cabot Strait and the shelf break.
[51] Acknowledgments. This work is a contribution to theGLOBEC-Canada program and was supported by grants from the NaturalSciences and Engineering Research Council and Fisheries and OceansCanada. The technical contribution of P. Joly, M. Boule, and P. Avendanowho assisted in the collection of data is gratefully acknowledged. We alsothank M. Starr, who kindly provided the C. finmarchicus data set for BonneBay.
ReferencesAksnes, D. L., and J. Blindheim, Circulation patterns in the North Atlanticand possible impact on population dynamics of Calanus finmarchicus,Ophelia, 44, 7–28, 1996.
Albikovskaya, L. K., and O. V. Gerasimova, Food and feeding patterns ofcod (Gadus morhua, L.) and beaked redfish (Sebastes mentella Travin),NAFO Sci. Counc. Stud., 19, 31–39, 1993.
Anderson, J. T., Feeding ecology and condition of larval and pelagic juve-nile redfish Sebastes spp., Mar. Ecol. Prog. Ser., 104, 211–226, 1994.
Ashjian, C. J., and K. F. Wishner, Temporal persistence of copepod speciesgroups in the Gulf Stream, Deep Sea Res., 40, 483–516, 1993.
Ashjian, C. J., C. S. Davis, S. M. Gallager, and P. Alatalo, Distributionof plankton, particles, and hydrographic features across Georges Bankdescribed using the Video Plankton Recorder, Deep Sea Res., Part II, 48,245–282, 2001.
Backhaus, J. O., I. H. Harms, M. Krause, and M. R. Heath, An hypothesisconcerning the space-time succession of Calanus finmarchicus in thenorthern North Sea, ICES J. Mar. Sci., 51, 169–180, 1994.
Bamstedt, U., Life cycle, seasonal vertical distribution and feeding ofCalanus finmarchicus in Skagerak coastal waters, Mar. Biol., 137,279–289, 2000.
Bryant, A. D., D. Hainbucher, and M. Heath, Basin-scale advection andpopulation persistence of Calanus finmarchicus, Fish. Oceanogr., 7,235–244, 1998.
Campbell, R. G., J. A. Runge, and E. G. Durbin, Evidence of food limitationofCalanus finmarchicus production rates on the southern flank of GeorgesBank during April 1997, Deep Sea Res., Part II, 48, 531–549, 2001a.
Campbell, R. G., M. M. Wagner, G. J. Teegarden, C. A. Boudreau, and E. G.Durbin, Growth and development rates of the copepod Calanus fin-marchicus reared in the laboratory, Mar. Ecol. Prog. Ser., 221, 161–183, 2001b.
Campbell, R. W., and E. J. H. Head, Viability of Calanus finmarchicus eggsin situ: Does the presence of intact phytoplankton reduce hatching suc-cess?, ICES J. Mar. Sci., 57, 1780–1785, 2000a.
Campbell, R. W., and E. J. H. Head, Egg production rates of Calanusfinmarchicus in the western North Atlantic: Effect of gonad maturity,female size, chlorophyll concentration and temperature, Can. J. Fish.Aquat. Sci., 57, 518–529, 2000b.
Carlotti, F., and G. Radach, Seasonal dynamics of phytoplankton andCalanus finmarchicus in the North Sea as revealed by a coupled onedimensional model, Limnol. Oceanogr., 41, 522–539, 1996.
Colebrook, J. M., Continuous plankton records: Seasonal variations in thedistribution and abundance of plankton in the North Atlantic and theNorth Sea, J. Plankton Res., 4, 435–462, 1982.
GLO 17 - 20 ZAKARDJIAN ET AL.: TEMPERATURE AND CIRCULATION EFFECTS

Cushing, D. H., The gadoid outburst in the North Sea, J. Cons. Cons. Int.Explor. Mer., 41(2), 159–166, 1984.
de Lafontaine, Y., S. Demers, and J. A. Runge, Pelagic food-web interac-tions and productivity in the gulf of St. Lawrence: A perspective, in Thegulf of St. Lawrence: Small ocean or big estuary?, edited by J.-C.Therriault, Can. Spec. Publ. Fish. Aquat. Sci., 113, 99–123, 1991.
Diel, S., and K. Tande, Does the spawning of Calanus finmarchicus in highlatitude follow a reproducible pattern, Mar. Biol., 113, 21–31, 1992.
Durbin, E. G., J. A. Runge, R. G. Campbell, P. R. Garrahan, M. C. Casas,and S. Plourde, Late fall-early winter recruitment of Calanus finmarch-icus on Georges Bank, Mar. Ecol. Prog. Ser., 151, 103–114, 1997.
Durbin, E. G., P. R. Garrahan, and M. C. Casas, Abundance and distributionof Calanus finmarchicus on the Georges Bank during 1995 and 1996,ICES J. Mar. Sci., 57, 1664–1685, 2000a.
Durbin, E. G., P. R. Garrahan, and M. C. Casas, Depth distribution ofCalanus finmarchicus naupliar on the Georges Bank during 1995 and1996, ICES J. Mar. Sci., 57, 1686–1693, 2000b.
Edwards, A. M., and A. Yool, The role of higher predation in planktonpopulation models, J. Plankton Res., 22, 1085–1112, 2000.
El-Sabh, M. I., The lower St. Lawrence estuary as a physical oceanographicsystem, Nat. Can., 106, 55–73, 1979.
Filteau, G., and J.-L. Tremblay, Ecologie de Calanus finmarchicus dans laBaie des Chaleurs, Nat. Can., 80, 5–79, 1953.
Fossum, P., and B. Ellertsen, Gut content analysis of first-feeding cod larvae(Gadus morhua L.) sampled at Lofoten, Norway, in Cod and ClimateChange: Proceedings of a Symposium Held in Reykjavik, 23–27 August1993, edited by J. Jakobsson et al., ICES Mar. Sci. Symp., 198, 430–437,1994.
Gaard, E., The zooplankton community structure in relation to its biologicaland physical environment on the Faroe shelf, 1989–1997, J. PlanktonRes., 21, 1133–1152, 1999.
Gaard, E., Seasonal abundance and development of Calanus finmarchicusin relation to phytoplankton and hydrography on the Faroe shelf, ICESJ. Mar. Sci., 57, 1605–1611, 2000.
Gislasson, A., and O. S. Astthorsson, Seasonal development of Calanusfinmarchicus along an inshore-offshore gradient southwest of Iceland,Ophelia, 44, 71–84, 1996.
Gislasson, A., O. S. Astthorsson, H. Petursdottir, H. Gudfinnsson, and A. R.Bodvarsdottir, Life cycle of Calanus finmarchicus south of Iceland inrelation to hydrography and chlorophyll a, ICES J. Mar. Sci., 57, 1619–1627, 2000.
Grant, G. C., Seasonal occurrence and dominance of Centropages conge-ners in the Middle Atlantic Bight, USA, in Biology of Copepods, editedby G. A. Boxshall and H. K. Schminke, Hydrobiologia, 167/168, 223–227, 1988.
Greene, C. H., and A. J. Pershing, The response of Calanus finmarchicuspopulations to climate variability in the Northwest Atlantic: Basin-scaleforcing associated with the North Atlantic Oscillation, ICES J. Mar. Sci.,57, 1536–1544, 2000.
Grigg, H., and S. J. Bardwell, Seasonal observations on moulting andmaturation in stage V copepodites of Calanus finmarchicus from theFirth of Clyde, J. Mar. Biol. Assoc. U. K., 62(2), 315–327, 1982.
Hannah, C. G., C. E. Naimie, J. W. Loder, and F. E. Werner, Upper-oceantransport mechanisms from the Gulf of Maine to Georges Bank, withimplications for Calanus supply, Cont. Shelf Res., 15, 1887–1912, 1998.
Hansen, B., E. Gaard, and J. Reinert, Physical effects on recruitment ofFaroe Plateau cod, in Cod and Climate Change: Proceedings of a Sym-posium Held in Reykjavik, 23–27 August 1993, edited by J. Jakobsson etal., ICES Mar. Sci. Symp., 198, 520–528, 1994.
Head, E. J. H., L. R. Harris, and B. Petrie, Distribution of Calanus spp. onand around the Nova Scotia shelf in April-Evidence for an offshoresource of Calanus finmarchicus to the mid- and western regions, Can.J. Fish. Aquat. Sci., 56, 2463–2476, 1999.
Head, E. J. H., L. R. Harris, and R. W. Campbell, Investigations on theecology of Calanus spp. In the Labrador Sea: I. Relationship between thephytoplankton bloom and reproduction and development of Calanusfinmarchicus in spring, Mar. Ecol. Prog. Ser., 193, 53–73, 2000.
Heath, M. R., J. G. Fraser, A. Gislason, S. J. Hay, S. H. Jonasdottir, andK. Richardson, Winter distribution of Calanus finmarchicus in the north-east Atlantic, ICES J. Mar. Sci., 57, 1628–1635, 2000.
Herman, A. W., D. D. Sameoto, S. Chen, M. R. Mitchell, B. Petrie, andN. Cochrane, Sources of zooplankton on the Nova Scotia and their aggre-gations within deep-shelf basins, Cont. Shelf Res., 11, 211–238, 1991.
Hind, A., W. S. C. Gurney, M. Heath, and A. D. Bryant, Overwinteringstrategies in Calanus finmarchicus, Mar. Ecol. Prog. Ser., 193, 95–107,2000.
Hirche, H. J., The reproductive biology of the marine copepod, Calanusfinmarchicus–A review, Ophelia, 44, 111–128, 1996a.
Hirche, H. J., Diapause in the marine copepod, Calanus finmarchicus–Areview, Ophelia, 44, 129–143, 1996b.
Ingram, R. G., and M. I. El-Sabh, Fronts and mesoscale features in theSt. Lawrence estuary, in Oceanography of a Large-Scale Estuarine Sys-tem: The St. Lawrence, edited by M. I. El-Sabh and N. Silverberg, Coast-al Estuarine Stud., 39, 71–93, 1990.
Irigoien, X., Vertical distribution and population structure of Calanus fin-marchicus at Station India (59 degrees N, 9 degrees W) during the pas-sage of the great salinity anomaly, Deep Sea Res., Part I, 47, 1–26, 2000.
Judkins, D. C., C. D. Wirick, and W. E. Esaias, Composition, abundance,and distribution of zooplankton in the New York Bight, September1974–September 1975, Fish. Bull., 77, 669–683, 1979.
Koutitonsky, V. G., Transport de masses d’eau a l’embouchure de l’estuairedu Saint-Laurent, Nat. Can., 106, 75–88, 1979.
Koutitonsky, V. G., and G. L. Bugden, The physical oceanography of theGulf of St. Lawrence: A review with emphasis on the synoptic variabilityof the motion, in The Gulf of St. Lawrence: Small Ocean or Big Estuary?,edited by J.-C. Therriault, Can. Spec. Publ. Fish. Aquat. Sci., 113, 57–90, 1991.
Lane, P. V. Z., S. L. Smith, J. L. Urban, and J. L. Biscaye, Carbon flux andrecycling associated with zooplankton fecal pellets on the shelf of theMiddle Atlantic Bight, Deep Sea Res., Part II, 41, 437–457, 1994.
Lu, Y., K. R. Thompson, and D. G. Wright, Tidal currents and mixing in theGulf of St. Lawrence: An application of the incremental approach to dataassimilation, Can. J. Fish. Aquat. Sci., 58, 723–735, 2001.
Lynch, D. R., W. C. Gentleman, D. J. McGillicuddy Jr., and C. S. Davis,Biological/physical simulations of Calanus finmarchicus populationdynamics in the Gulf ofMaine,Mar. Ecol. Prog. Ser., 169, 189–210, 1998.
Mackas, D. L., and B. de Young, GLOBEC Canada 1996–2000: A sam-pler, Can. J. Fish. Aquat. Sci., 58, 645–646, 2001.
Marshall, S. M., and A. P. Orr, The Biology of A Marine Copepod, Oliverand Boyd, Edinburgh, 1955.
McLaren, I. A., and A. Leonard, Assessing the equivalence of growth andegg production of copepods, ICES J. Mar. Sci., 52, 397–408, 1995.
McLaren, I. A., J.-M. Sevigny, and C. J. Corkett, Body sizes, developmentrates and genome sizes among Calanus species, Hydrobiologia, 167/168,275–284, 1988.
McLaren, I. A., E. Head, and D. D. Sameoto, Life cycles and seasonaldistributions of Calanus finmarchicus on the central Scotian Shelf,Can. J. Fish. Aquat. Sci., 58, 659–670, 2001.
Meise, C. J., and J. E. O’Reilly, Spatial and seasonal patterns in abundanceand age-composition of Calanus finmarchicus in the Gulf of Maine andon Georges Bank: 1977–1987, Deep Sea Res., Part II, 43, 1473–1501,1996.
Miller, C. B., and K. S. Tande, Stage duration estimations for Calanuspopulations: A modelling study, Mar. Ecol. Prog. Stud., 102(1 –2),15–34, 1993.
Miller, C. B., T. J. Cowles, P. H. Wiebe, N. J. Copley, and H. Grigg,Phenology in Calanus finmarchicus: Hypotheses about control mecha-nisms, Mar. Ecol. Prog. Ser., 72, 79–91, 1991.
Miller, C. B., D. R. Lynch, F. Carlotti, W. Gentlemen, and C. V. W. Lewis,Coupling of an individual-based population dynamic model of Calanusfinmarchicus to a circulation model for the Georges Bank region, Fish.Oceanogr., 7, 219–234, 1998.
Ohman, M. D., and H. J. Hirche, Density-dependent mortality in an oceaniccopepod population, Nature, 412(6847), 638–641, 2001.
Ohman, M. D., and J. A. Runge, Sustained fecundity when phytoplanktonresources are in short supply: Omnivory by Calanus finmarchicus in theGulf of St. Lawrence, Limnol. Oceanogr., 39, 21–36, 1994.
Ohman, M. D., J. A. Runge, E. G. Durbin, D. B. Field, and B. Niehoff, Onbirth and death in the sea, Hydrobiologia, 480, 55–68, 2003.
Orlanski, I., A simple boundary condition for unbounded hyperbolic flows,J. Comput. Phys., 21, 251–269, 1976.
Paffenhofer, G.-A., J. R. Strickler, K. D. Lewis, and S. Richman, Motionbehavior of nauplii and early copepodid stages of marine planktoniccopepods, J. Plankton Res., 18, 1699–1715, 1996.
Pedersen, O. P., K. S. Tande, and D. Slagstad, A model study of demo-graphy and spatial distribution of Calanus finmarchicus at the Norwegiancoast, Deep Sea Res., Part II, 48, 567–587, 2001.
Petrie, B., K. Drinkwater, A. Sanstrom, R. Petipas, D. Gregory,D. Gilbert, and P. Sekhon, Temperature, salinity and sigma-t atlasfor the Gulf of St. Lawrence, Can. Tech. Rep. Hydrogr. Ocean Sci.,178, v + 256 pp., 1996.
Pickart, R. S., T. K. McKee, D. J. Torres, and S. A. Harrington, Meanstructure and inter-annual variability of the slope water system south ofNewfoundland, J. Phys. Oceanogr., 29, 2541–2558, 1999.
Planque, B., and S. D. Batten, Calanus finmarchicus in the North Atlantic:The year of Calanus in the context of inter-decadal changes, ICES J. Mar.Sci., 57, 1528–1535, 2000.
Planque, B., G. C. Hays, F. Ibanez, and J. C. Gamble, Large scale variationsin the seasonal abundance of Calanus finmarchicus, Deep Sea Res.,Part I, 44, 315–326, 1997.
ZAKARDJIAN ET AL.: TEMPERATURE AND CIRCULATION EFFECTS GLO 17 - 21

Plourde, S., and J. A. Runge, Reproduction of the planktonic copepodCalanus finmarchicus in the lower St. Lawrence Estuary: Relation tothe cycle of phytoplankton production and evidence for a Calanus pump,Mar. Ecol. Prog. Ser., 102, 217–227, 1993.
Plourde, S., P. Joly, J. A. Runge, B. Zakardjian, and J. J. Dodson, Life cycleof Calanus finmarchicus in the lower St. Lawrence Estuary: The imprintof circulation and late timing of the spring phytoplankton bloom,Can. J. Fish. Aquat. Sci., 58, 647–658, 2001.
Roache, P. J., Computational Fluid Dynamics, revised ed., Hermosa, Albu-querque, N. M., 1976.
Runge, J. A., Should we expect a relationship between primary productionand fisheries? The role of copepod dynamics as a filter of trophic varia-bility, Hydrobiologia, 167/168, 61–71, 1988.
Runge, J. A., and Y. de Lafontaine, Characterization of the pelagic ecosys-tem in surface waters of the northern Gulf of St. Lawrence in earlysummer: The larval redfish-Calanus-microzooplankton interaction, Fish.Oceanogr., 5, 21–37, 1996.
Runge, J. A., and S. Plourde, Fecundity characteristics of Calanus finmarch-icus in coastal waters of eastern Canada, Ophelia, 44, 171–187, 1996.
Runge, J. A., and Y. Simard, Zooplankton in the St. Lawrence Estuary: Theimprint of physical processes on its composition and distribution, inOceanography of a Large-Scale Estuarine System: The St. Lawrence,edited by M. I. El-Sabh and N. Silverberg, Coastal Estuarine Stud.,39, 296–320, 1990.
Runge, J. A., M. Castonguay, Y. de Lafontaine, M. Ringuette, and J.-L.Beaulieu, Covariation in climate, zooplankton biomass and mackerelrecruitment in the southern Gulf of St. Lawrence, Fish. Oceanogr., 8,139–149, 1999.
Sameoto, D. D., and A. W. Herman, Effect of the outflow from the Gulf ofSt. Lawrence on Nova Scotia shelf zooplankton, Can. J. Fish. Aquat. Sci.,49, 857–869, 1992.
Sameoto, D. D., J. Neilson, and D. Waldron, Zooplankton prey selection byjuvenile fish in Nova Scotian shelf basins, J. Plankton Res., 16, 1003–1019, 1994.
Sheng, J. Y., Dynamics of a buoyancy-driven coastal jet: The Gaspe Cur-rent, J. Phys. Oceanogr., 31, 3146–3162, 2001.
Sheng, J., and L. Tang, A numerical study of circulation in the westernCaribbean Sea, J. Phys. Oceanogr., 33, 2049–2069, 2003.
Sheng, J., D. G. Wright, R. J. Greatbatch, and D. E. Dietrich, CANDIE: Anew version of the DieCAST ocean circulation model, J. Atmos. OceanicTechnol., 15, 1414–1432, 1998.
Sheng, J., R. J. Greatbatch, and D. Wright, Improving the utility of oceancirculation models through adjustment of the momentum balance,J. Geophys. Res., 106(C8), 16,711–16,728, 2001.
Sheng, J., K. R. Thompson, M. Dowd, and B. Petrie, Seasonal mean cir-culation over the eastern Canadian shelf, with emphasis on the Gulf ofSt. Lawrence and Scotian Shelf, J. Geophys. Res., (in revision), 2003.
Shore, J. A., C. G. Hannah, and J. W. Loder, Drift pathways on the westernScotian Shelf and its environs, Can. J. Fish. Aquat. Sci., 57, 2488–2505,2000.
Skreslet, S., A conceptual model of the trophodynamical response to riverdischarge in a large marine ecosystem, J. Mar. Syst., 12, 187–198, 1997.
Slagstad, D., and K. S. Tande, The importance of seasonal vertical migra-tion in across shelf transport of Calanus finmarchicus, Ophelia, 44, 189–205, 1996.
Smith, S. L., and P. V. Z. Lane, Grazing of the spring diatombloom in theNewYork Bight by the calanoid copepods Calanus finmarchicus, Metridialucens and Centropages typicus, Cont. Shelf. Res., 8, 485–509, 1988.
Starr, M., J.-C. Therriault, G. Y. Conan, M. Comeau, and G. Robichaud,Larval release in a sub-euphotic zone invertebrate triggered by sinkingphytoplankton particles, J. Plankton Res., 16, 1137–1147, 1994.
Sundby, S., Recruitment of Atlantic cod stocks in relation to temperatureand advection of copepod populations, Sarsia, 85, 277–298, 2001.
Tande, K. S., Ecological investigations on the zooplankton community ofBalsfjorden, Northern Norway: Generation cycles, and variations in bodyweight and body content of carbon and nitrogen related to overwinteringand reproduction in the copepod Calanus finmarchicus (Gunnerus),J. Exp. Mar. Biol. Ecol., 62, 129–142, 1982.
Tande, K. S., An evaluation of factors affecting vertical distribution amongrecruits of Calanus finmarchicus in three adjacent high-latitude localities,Hydrobiologia, 167/168, 115–126, 1988.
Tande, K. S., and C. B. Miller, Population dynamics of Calanus in theNorth Atlantic: Results from the trans-Atlantic study of Calanus fin-marchicus, ICES J. Mar. Sci., 57, 1527, 2000.
Tande, K. S., and D. Slagstad, Regional and inter-annual variations inbiomass and productivity of the marine copepods, Calanus finmarchicus,in sub-arctic environment, Oceanol. Acta, 15, 309–321, 1992.
Therriault, J.-C., et al., Proposal for a northwest Atlantic zonal monitoringprogram, Can. Tech. Rep. Hydrogr. Ocean Sci., 194, vii + 57 pp., 1998.
Tremblay, M. J., and J. C. Roff, Community gradients in the Scotian Shelfzooplankton, Can. J. Fish. Aquat. Sci., 40, 598–611, 1983.
Vidal, J., Physioecology of zooplankton: I. Effects of phytoplankton con-centration, temperature and body size on the growth rate of Calanuspacificus and Pseudocalanus sp., Mar. Biol., 56, 111–134, 1980.
Wiebe, P. H., R. C. Beardsley, D. G. Mountain, and A. Bucklin, GlobalOcean Ecosystem Dynamics-Initial program in northwest Atlantic, SeaTechnol., 37(8), 67–76, 1996.
Wishner, K. F., and S. K. Allison, The distribution and abundance ofcopepods in relation to the physical structure of the Gulf Stream, DeepSea Res., Part A, 33, 705–731, 1986.
Wroblewski, J. S., Interaction of currents and vertical migration in main-taining Calanus marshallae in the Oregon upwelling zone-A simulation,Deep Sea Res., Part A, 29, 665–686, 1982.
Yamazaki, H., and K. D. Squires, Comparison of oceanic turbulence andcopepod swimming, Mar. Ecol. Prog. Ser., 144, 299–301, 1996.
Zakardjian, B. A., J. A. Runge, S. Plourde, and Y. Gratton, A biophysicalmodel of the interaction between vertical migration of crustacean zoo-plankton and circulation in the lower St. Lawrence Estuary, Can. J. Fish.Aquat. Sci., 56, 2420–2432, 1999.
Zakardjian, B. A., Y. Gratton, and A. F. Vezina, Late spring phytoplanktonbloom in the lower St. Lawrence Estuary: The flushing hypothesisrevisited, Mar. Ecol. Prog. Ser., 192, 31–48, 2000.
�����������������������Y. Gratton, INRS-Eau, 2800 rue Einstein, C.P. 7500, Sainte-Foy, Quebec,
G1V 4C7, Canada. ([email protected])I. McLaren, Department of Biology, Dalhousie University, Halifax, N. S.,
B3H 4J1, Canada. ([email protected])S. Plourde, Fisheries and Ocean Canada, Maurice Lamontagne Institute,
850 Route de la Mer, Mont-Joli, Quebec G5H 3Z4, Canada. ([email protected])J. A. Runge, Ocean Process Analysis Laboratory, University of New
Hampshire, 142 Morse Hall, Durham, NH 03824, USA. ( [email protected])J. Sheng and K. R. Thompson, Department of Oceanography, Dalhousie
University, Halifax, N. S., B3H 4J1 Canada. ([email protected];[email protected])B. A. Zakardjian, Institut des Sciences de la Mer de Rimouski (ISMER),
Universite du Quebec a Rimouski, 310 Allee des Ursulines, Rimouski,Que., G5L 3A1, Canada. ([email protected])
GLO 17 - 22 ZAKARDJIAN ET AL.: TEMPERATURE AND CIRCULATION EFFECTS