Effects of manganese on juvenile mulloway ( Argyrosomus japonicus) cultured in water with varying...
29
MURDOCH RESEARCH REPOSITORY http://researchrepository.murdoch.edu.au This is the author's final version of the work, as accepted for publication following peer review but without the publisher's layout or pagination. Partridge, G.J. and Lymbery, A.J. (2009) Effects of manganese on juvenile mulloway (Argyrosomus japonicus) cultured in water with varying salinity-Implications for inland mariculture. Aquaculture, 290 (3-4). pp. 311-316. http://researchrepository.murdoch.edu.au/2232 Copyright © Crown Copyright 2009 It is posted here for your personal use. No further distribution is permitted. 1 of 1 4/08/2011 9:22 AM
Transcript of Effects of manganese on juvenile mulloway ( Argyrosomus japonicus) cultured in water with varying...

MURDOCH RESEARCH REPOSITORY
http://researchrepository.murdoch.edu.au
This is the author's final version of the work, as accepted for publication following peer review but without thepublisher's layout or pagination.
Partridge, G.J. and Lymbery, A.J. (2009) Effects of manganese on juvenile mulloway (Argyrosomusjaponicus) cultured in water with varying salinity-Implications for inland mariculture. Aquaculture, 290
(3-4). pp. 311-316.
http://researchrepository.murdoch.edu.au/2232
Copyright © Crown Copyright 2009It is posted here for your personal use. No further distribution is permitted.
http://tweaket.com/CPGenerator/?id=2232
1 of 1 4/08/2011 9:22 AM

�������� ����� ��
Effects of manganese on juvenile mulloway (Argyrosomus japonicus) culturedin water with varying salinity – implications for inland mariculture
G.J. Partridge, A.J. Lymbery
PII: S0044-8486(09)00149-5DOI: doi: 10.1016/j.aquaculture.2009.02.020Reference: AQUA 628641
To appear in: Aquaculture
Received date: 27 March 2008Revised date: 9 February 2009Accepted date: 13 February 2009
Please cite this article as: Partridge, G.J., Lymbery, A.J., Effects of manganese on juve-nile mulloway (Argyrosomus japonicus) cultured in water with varying salinity – implica-tions for inland mariculture, Aquaculture (2009), doi: 10.1016/j.aquaculture.2009.02.020
This is a PDF file of an unedited manuscript that has been accepted for publication.As a service to our customers we are providing this early version of the manuscript.The manuscript will undergo copyediting, typesetting, and review of the resulting proofbefore it is published in its final form. Please note that during the production processerrors may be discovered which could affect the content, and all legal disclaimers thatapply to the journal pertain.

ACC
EPTE
D M
ANU
SCR
IPT
ACCEPTED MANUSCRIPT1
Effects of manganese on juvenile mulloway (Argyrosomus japonicus) cultured in 1
water with varying salinity – implications for inland mariculture.2
3
4
G. J. Partridge1,2,* and A. J. Lymbery25
6
1. Aquaculture Development Unit, Challenger TAFE, Fremantle, Western 7
Australia.8
2. Fish Health Unit, Centre for Fish and Fisheries Research, Murdoch University, 9
Murdoch, Western Australia.10
11
12
* Corresponding author: Telephone: +61 8 9239 803213
Facsimile: +61 8 9239 808114
Email: [email protected]
16
17
18
19
20
21
ACC
EPTE
D M
ANU
SCR
IPT
ACCEPTED MANUSCRIPT2
Abstract22
23
The effects of 5 mg/L of dissolved manganese on juvenile mulloway at salinities of 5, 24
15 and 45 ppt were determined by comparing their survival, growth and blood plasma25
and organ chemistry with those of fish grown at the same salinities without 26
manganese addition. Survival of mulloway at 45 ppt in the presence of 5 mg/L of 27
manganese (73 ± 13%) was significantly lower than all other treatments, which 28
achieved 100% survival. Those fish grown in water without manganese exhibited 29
rapid growth, which was not affected by salinity (SGR = 4.05 ± 0.29%/day). Those 30
fish grown at 5 ppt and 45 ppt in the presence of manganese lost weight over the two 31
week trial (SGR -0.17 ± 0.42 and -0.44 ± 0.83%/day, respectively), whilst those at 15 32
ppt gained some weight (SGR 1.70 ± 0.20%/day). Manganese accumulated in the 33
gills, liver and muscle of the fish and significant differences in blood plasma34
chemistry were observed. Blood plasma sodium and chloride of fish exposed to 35
manganese were significantly elevated in hyperosmotic salinity (45ppt) and depressed 36
at hyposmotic salinity (5 ppt) compared with unexposed fish at the same salinity; 37
consistent with manganese causing apoptosis or necrosis to chloride cells. We did not, 38
however, observe any gill epithelial damage under light microscopy. Blood plasma39
potassium was significantly elevated at all salinities in the presence of manganese and 40
liver potassium and glycogen reduced. These findings are consistent with manganese 41
interfering with carbohydrate metabolism. 42
43
Keywords: manganese, inland saline aquaculture, mulloway Argyrosomus japonicus,44
carbohydrate metabolism.45
46

ACC
EPTE
D M
ANU
SCR
IPT
ACCEPTED MANUSCRIPT3
1. Introduction47
48
Salt is a natural part of the Australian landscape, having been deposited by rainfall, 49
wind and dust over thousands of years (Zalizniak et al., 2006). In many arid and semi-50
arid areas of southern Australia, human activities including land-clearing and 51
irrigation have led to rising groundwater tables, dissolving stored salts from the soil 52
and bringing them to the surface (Ghassemi et al., 1995; Lambers, 2003). The impacts 53
of such secondary salinisation are many and include the loss of farm production and 54
revenue, the degradation of rural infrastructure and recreational facilities, the 55
salinisation of rivers and associated impacts on irrigation and drinking water56
(Williams, 2001).57
58
As the salt in the Australian landscape is of marine origin, the culture of marine 59
organisms has considerable potential as an adaptive use for saline groundwater 60
(Doupé et al., 2003). Despite its marine origin, however, important deviations in ionic 61
composition occur in saline groundwater compared to seawater (Partridge et al., 62
2008). These deviations depend primarily on the nature of the groundwater systems 63
and the regolith with which they are associated (Mazor and George, 1992). One 64
common deviation in Australian saline groundwater is an elevated concentration of 65
manganese relative to seawater. A recent survey of 315 saline water sources in the 66
wheatbelt of Western Australia, for example, found dissolved manganese 67
concentrations as high as 83 mg/L, with an average value of 3.1 mg/L (George, 68
unpublished data). Sources of dissolved manganese include anaerobic reduction of 69
manganese oxides or the pedogenic weathering of manganese-bearing rock (Howe et 70
al., 2004; Hardie et al., 2007).71

ACC
EPTE
D M
ANU
SCR
IPT
ACCEPTED MANUSCRIPT4
72
Manganese is an essential nutrient for all organisms, including fishes (Underwood, 73
1977; Knox et al., 1981; Gatlin and Wilson, 1984; Maage et al., 2000) and plays 74
critical physiological roles as a constituent of several metaloenzymes and as a75
coactivator of many other enzymes (Underwood, 1977; Cossarini-Dunier et al., 1988). 76
Excess concentrations of manganese, however, can have negative effects including77
the disruption of sodium balance (Gonzalez et al., 1990), the impairment of calcium 78
uptake and mineralisation (Reader et al., 1988), impacts on carbohydrate metabolism 79
(Nath and Kumar, 1987; Barnhoorn et al., 1999), effects on immune response 80
(Cossarini-Dunier et al., 1988; Hernroth et al., 2004) and neurotoxicity (Newland, 81
1999; Gunter et al., 2006). Of those studies on fishes, only freshwater fishes have 82
been investigated, presumably due to the susceptibility of freshwater sources to 83
anthropogenic sources of manganese pollution. Seawater contains a very low 84
concentration of manganese (0.002 mg/L) (Spotte, 1992) and there appears to be no 85
documented studies on the effect of elevated manganese on marine or estuarine fishes.86
Unpublished data from our laboratory collected during bioassays investigating the 87
aquaculture potential of saline groundwater sources suggested that an elevated 88
concentration of manganese may have a chronic effect on the growth of mulloway 89
(Argyrosomus japonicus).90
91
The aim of this study was therefore to investigate the effects of an elevated dissolved 92
manganese (II) concentration (5 mg/L) on the survival, growth, pathology, and blood 93
plasma and organ chemistry of mulloway. Mulloway is a temperate species 94
considered a suitable candidate for inland saline aquaculture based on its euryhalinity,95
well-documented hatchery production techniques, reasonably rapid growth rates and a 96

ACC
EPTE
D M
ANU
SCR
IPT
ACCEPTED MANUSCRIPT5
temperate habitat compatible with the climatic zones where most secondary salinity in 97
Australia occurs (Partridge et al., 2008). Because of the wide range of groundwater 98
salinities found throughout Australia, the effect of elevated manganese in this trial 99
was investigated across the range of salinities that mulloway are known to tolerate, 100
namely 45, 15 and 5 ppt. 101
102
2. Materials and Methods103
104
At each of the three salinities investigated (45, 15 and 5 ppt), the effects of an 105
elevated manganese concentration (5 mg/L) were compared against a control (0 mg/L) 106
in triplicate, flow-through 180 L tanks at 23°C over a period of two weeks. Five 107
juvenile mulloway (9.4 ± 0.2 g) were stocked into each tank with flowing seawater 108
(33 ppt), and then acclimated to their respective salinity over a period of three days. 109
Once the target salinities had been reached, fish were acclimated to the experimental 110
conditions for a further five days, then anaesthetised and reweighed. Prior to 111
transferring fish back to their respective tank, those tanks randomly assigned to a 112
treatment of 5 mg Mn/L were supplemented with laboratory grade MnCl2.6H2O by 113
dissolving the required quantity of salt into 1 litre of tank water. Water flowed 114
through each tank at 8 L/hour from header tanks containing the treatment water.115
Header tanks were emptied and cleaned daily and new treatment water prepared by 116
dissolving the required quantity of MnCl2.6H2O into 1 L of water of the appropriate 117
salinity before mixing this into the header tank. Water of 45 ppt was prepared by the 118
addition of artificial seasalt (Ocean Nature®; Aquasonic Pty Ltd, Wauchope, 119
Australia) to seawater, whilst 5 and 15 ppt water were prepared by diluting seawater 120
with dechlorinated tap water. Seawater (33 ppt) was sourced from a marine bore at 18 121

ACC
EPTE
D M
ANU
SCR
IPT
ACCEPTED MANUSCRIPT6
m depth. This water is filtered to 1 µm and is free of particulate and dissolved organic 122
carbon. Fish were fed daily to satiety and the amount of food consumed was recorded. 123
Water quality parameters including temperature, dissolved oxygen and pH were 124
measured daily. Dissolved manganese was measured four times throughout the trial in 125
all tanks using inductively coupled plasma atomic emission spectroscopy (Vista AX 126
CCD Simultaneous ICP-AES; Varian, Mulgrave, Australia) after filtering water 127
samples to 0.45 µm (Whatman GFC).128
129
At the completion of the two week trial, all fish were anaesthetised and weighed. 130
Blood was immediately taken from the caudal vessels of three fish per replicate and 131
pooled for the determination of plasma sodium, chloride and potassium using an ion-132
specific electrode analyser (Vetlyte, IDEXX, USA). Samples of dorsal muscle, liver 133
and gills were taken for analysis of their ionic composition. These samples were134
freeze-dried, weighed to determine water content, then ground and digested in a 135
combination of hydrogen peroxide, concentrated nitric acid and hydrochloric acid at 136
120°C. Digests were subsequently analysed for manganese, sodium, potassium, 137
calcium, magnesium and iron via ICP-AES. 138
139
Samples of gill and liver were preserved in 10% formalin prepared in seawater, before 140
embedding in paraffin then cutting 5 µm sections. Gill and liver sections were stained 141
with haematoxylin and eosin (H&E) and liver sections with the periodic acid-Schiff142
(PAS) method for glycogen.143
144
2.1. Statistical Analysis 145
146

ACC
EPTE
D M
ANU
SCR
IPT
ACCEPTED MANUSCRIPT7
Growth was expressed as specific growth rate (SGR) using the following equation:147
148
100(days)Time
)Ln(-)(Ln (%/day) SGR x
WiWf
149
150
Where Wf and Wi were the final and initial wet weights of the fish, averaged over all 151
fish in a replicate. Feed intake was calculated as a percentage of the fish’s initial body 152
weight. 153
154
The effects of dissolved manganese concentration and salinity on survival, specific 155
growth rate, feed intake, and blood plasma and organ chemistry were compared using 156
two way ANOVA followed by a post hoc comparison of group LSD (Least Square 157
Difference) means using Tukey’s HSD (Honestly Significant Differences) test. 158
Statements of statistical significance refer to the 0.05 level. Arcsine transformations 159
were performed where necessary to normalise data prior to ANOVA160
161
3. Results162
3.1. Water Quality163
164
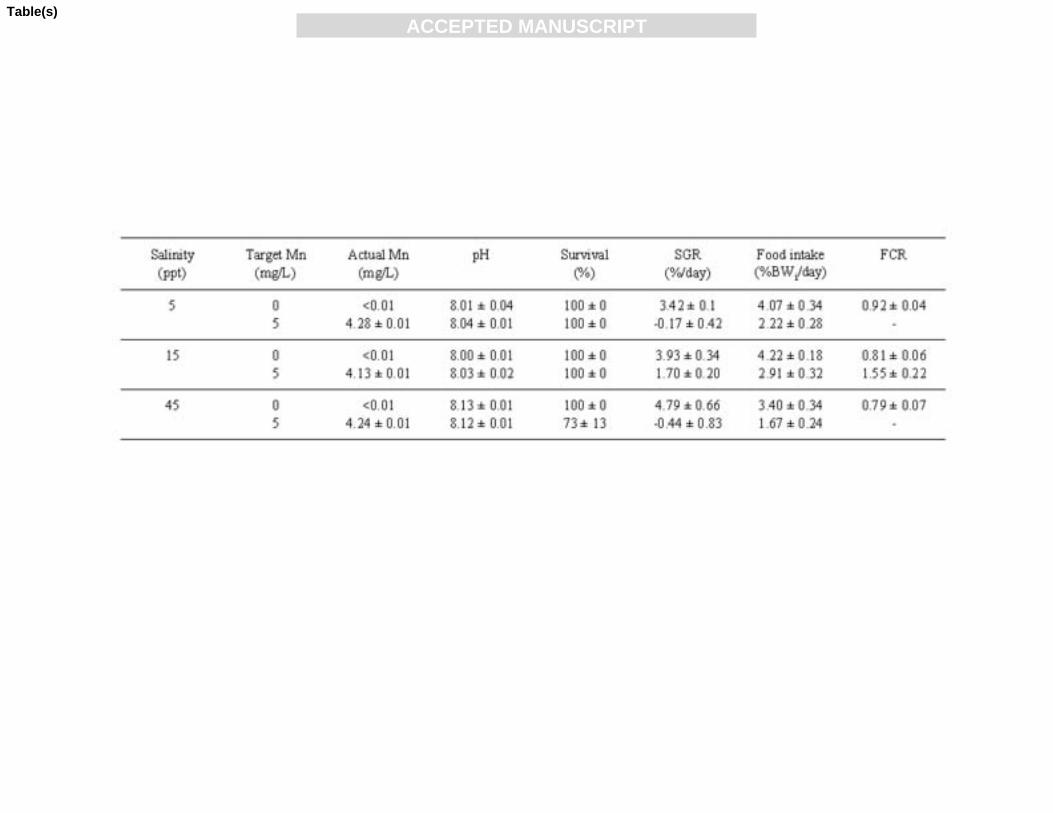
Actual dissolved manganese concentrations were slightly less than the target value of 165
5 mg/L (Table 1). Despite concentrations between treatments differing by no more 166
than 0.15 mg/L, the differences were found to be significant (P < 0.01), with the 167
concentration at 15 ppt (4.13 ± 0.01 mg/L) being significantly lower than at 5 ppt168
(4.28 ± 0.01 mg/L) and 45 ppt (4.24 ± 0.01 mg/L). Manganese concentration in the 169
control treatments were below the detectable limit of 0.01 mg/L. 170

ACC
EPTE
D M
ANU
SCR
IPT
ACCEPTED MANUSCRIPT8
171
Water pH (Table 1) was significantly affected by salinity (P < 0.001), but not 172
manganese concentration (P = 0.24), or the interaction of manganese and salinity (P = 173
0.23). Water pH was significantly higher at 45 ppt (8.13 ± 0.01) than at 15 ppt (8.01 ± 174
0.01) and 5 ppt (8.03 ± 0.01). 175
176
3.2. Survival, Growth, Food Intake and Conversion Ratio177
178
Survival of mulloway over the two week experimental period was 100% in all 179
treatments except 45ppt-5mg Mn/L, with a survival of 73 ± 13%; significantly lower 180
than all other treatments (Table 1).181
182
At all salinities, those fish exposed to manganese grew at a significantly slower rate 183
than those without manganese (Table 1). Two way analysis of variance revealed that 184
salinity did not affect SGR (P = 0.09) but both manganese concentration (P<0.0001) 185
and the interaction of manganese concentration and salinity did (P = 0.03). Those 186
mulloway grown in the presence of manganese at salinities of 5 and 45 ppt lost weight 187
over the 2 week period (SGR -0.17 ± 0.42 and -0.44 ± 0.83%/day, respectively), 188
whereas those at 15 ppt gained some weight (1.70 ± 0.20%/day). Those mulloway 189
grown in the control treatments grew rapidly with an average SGR of 4.05 ± 190
0.29%/day (pooled across three salinities). 191
192
Food intake was affected by both salinity (P = 0.02) and manganese concentration (P193
< 0.0001), but not their interaction (P = 0.63) (Table 1). The post hoc comparison of 194
group LSD means showed that those fish at 45 ppt ate significantly less food than 195
ACC
EPTE
D M
ANU
SCR
IPT
ACCEPTED MANUSCRIPT9
those at 15 ppt and those fish exposed to 5 mg/L of manganese at all salinities ate196
significantly less food than those in the control treatments. 197
198
Due to mulloway’s loss of weight at 5 and 45 ppt in the presence of manganese, we 199
were unable to calculate food conversion ratios for these fish. Fish grown in the 200
presence of manganese at 15 ppt had a significantly higher (poorer) FCR (1.55 ± 0.22) 201
than those cultured at the same salinity without manganese addition (0.81 ± 0.06). 202
203
3.3. Histology204
205
No epithelial damage to the gills was observed in histological sections. PAS-positive 206
cells in the liver were clearly more abundant in manganese exposed fish at all 207
salinities, however, quantification could not be conducted due to a lack of uniform 208
distribution within sections. 209
210
3.4. Blood plasma ionic composition211
212
Concentrations of the electrolytes in the blood plasma of mulloway are shown in 213
Figure 1. Blood plasma potassium and chloride were significantly affected by 214
manganese concentration (P<0.0001 and 0.0073 for K and Cl, respectively), salinity 215
(P = 0.04 and <0.0001, respectively) and the interaction of these terms (P = 0.006 and 216
<0.0001, respectively). Blood plasma sodium concentration was not affected by 217
manganese concentration (P = 0.27) but was affected by salinity (P = 0.0005) and the 218
interaction of manganese concentration and salinity (P = 0.002). 219
220

ACC
EPTE
D M
ANU
SCR
IPT
ACCEPTED MANUSCRIPT10
Because of the significant interaction terms, we conducted one-way analysis of 221
variance, comparing blood plasma ionic concentrations between fish exposed and not 222
exposed to manganese at each salinity. Blood plasma sodium was significantly greater 223
in fish exposed to manganese at 45 ppt (P = 0.002) but significantly lower in those224
exposed at 5 ppt (P = 0.04). There was no difference in blood plasma sodium 225
concentrations between exposed and unexposed fish at 15 ppt (P = 0.11). The same 226
pattern can be seen with blood plasma chloride at the various salinities and manganese 227
concentrations, i.e. a significantly greater chloride concentration in manganese 228
exposed fish at 45 ppt compared with unexposed fish (P = 0.006), with the opposite 229
effect at 5 ppt (P = 0.016) and no significant difference at 15 ppt (P = 0.51). Blood 230
plasma potassium was significantly higher in exposed fish compared with unexposed 231
fish at all salinities (P<0.02).232
233
In order to test the hypothesis that mulloway were osmoregulating well in the absence 234
of manganese across the range of salinities tested, one-way analyses of variance were235
also conducted on the electrolyte data from unexposed fish. These ANOVAs revealed 236
that salinity had no significant effect on blood plasma sodium (P = 0.97), chloride (P 237
= 0.13) or potassium (P = 0.69). 238
239
3.5. Organ Chemistry240
241
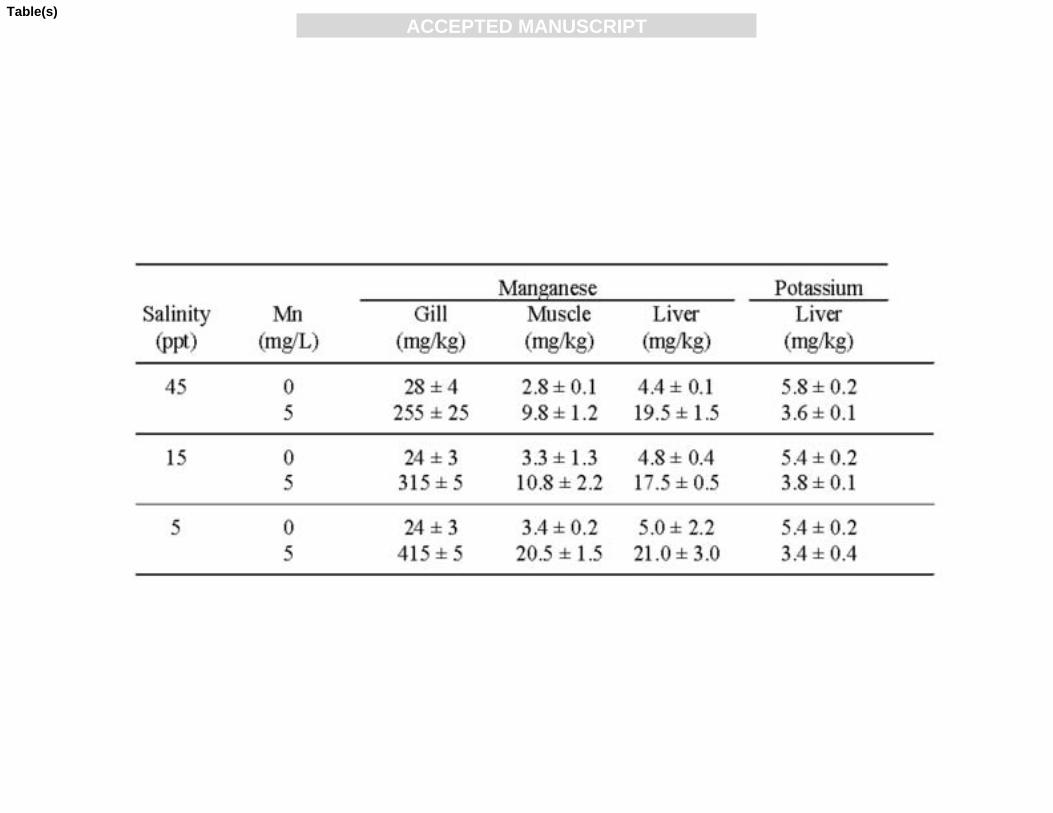
Exposure to manganese resulted in significantly higher concentrations of this metal in 242
the gills, muscle and liver of the fish (Table 2). The manganese content of the gills 243
and muscle were both affected by water manganese concentration (P<0.0001 for both 244
organs), salinity (P = 0.001 and 0.01, respectively) and the interaction (P = 0.0008 and 245

ACC
EPTE
D M
ANU
SCR
IPT
ACCEPTED MANUSCRIPT11
0.015, respectively). Despite fish exposed to manganese at 45 ppt showing the poorest 246
performance in terms of survival and growth, gill and muscle manganese 247
concentrations at this salinity were lower than at the other salinities; significantly 248
more so than at 5 ppt. Liver manganese concentration was not significantly affected 249
by salinity (P = 0.65) or the interaction of salinity and manganese concentration (P = 250
0.70), but was significantly affected by water manganese concentration (P < 0.0001). 251
252
There were no clear trends in other organ chemistry parameters with salinity or 253
manganese concentration, with the exception of the potassium content of liver, which 254
was significantly lower in those fish reared in the presence of manganese (P < 0.0001)255
(Table 2). Salinity (P = 0.30) or the interaction of manganese concentration and 256
salinity (P = 0.41) did not affect liver potassium.257
258
4. Discussion259
260
Dissolved manganese had a significant, detrimental effect on the growth of juvenile 261
mulloway at all salinities tested, with this effect being greater at salinities of 5 and 262
45 ppt. Dissolved manganese only affected survival at the highest salinity.263
264
Our finding of equivalent survival, growth and blood plasma electrolyte 265
concentrations across the control salinity treatments demonstrates that mulloway are 266
capable of efficient osmoregulation across this salinity range. Mulloway’s ability to 267
tolerate 5 ppt has been described previously (Fielder and Bardsley, 1999), however 268
this appears to be the first published data on their performance at a salinity greater 269
than seawater. 270

ACC
EPTE
D M
ANU
SCR
IPT
ACCEPTED MANUSCRIPT12
271
The poor growth performance of fish exposed to manganese was concomitant with a 272
significantly lower food intake. Intakes in the control treatments were similar to that 273
recommended for mulloway of similar size by Collett et al. (2008). Food intake of 274
manganese-exposed fish was approximately half this rate. Similar inhibitory effects of 275
excess manganese on appetite have been described for pigs, cows and sheep 276
(Cunningham et al., 1966; Underwood, 1977). The significantly higher (poorer) FCR 277
in fish exposed to manganese at 15 ppt, compared with unexposed fish at this same 278
salinity, indicates that the reduced growth of manganese exposed fish was contributed 279
to by poor feed utilisation efficiency as well as reduced food intake.280
281
The mode of action of manganese toxicity to fishes has not been well defined. Nyberg 282
et al. (1995) suggested that its toxic action is probably similar to other metals whereby 283
it is deposited onto the gills, causing physiological disruption to iono- and or osmo-284
regulatory functions. Manganese has been shown to deposit on the gills of lobsters 285
(Baden et al., 1990), however, we found no evidence of precipitation of manganese on 286
the gill surface or damage to the gill epithelium. Although chemical analysis of gills 287
in the current study revealed a high concentration of manganese, we are unable to 288
determine whether this was precipitated on the gill surface, within the gills filaments 289
or associated with the cartilaginous gill arches, which have been proposed as a long 290
term fixation site for manganese (Adam et al., 1997).291
292
Rouleau et al. (1995) suggested that uptake of manganese probably occurs mainly via 293
the gills and is then transported by the blood to various organs and tissues, where it 294
accumulates most in those tissues rich in mitochondria such as liver, pancreas and 295

ACC
EPTE
D M
ANU
SCR
IPT
ACCEPTED MANUSCRIPT13
kidney. In their study, Rouleau et al. (1995) found that manganese accumulation in296
freshwater brown trout was greatest in the liver, then gills, then muscle. In our study, 297
manganese concentration was greatest in the gills, followed by the liver then muscle. 298
Our findings are consistent with Capelli et al. (1987) who found higher concentrations 299
of (naturally occurring) manganese in the gills of marine Atlantic bonito, Sarda sarda,300
compared with muscle and liver. These differences in the major target organs for 301
manganese accumulation suggest that different uptake mechanisms occur between 302
freshwater and marine species. These differences may be caused by differences in 303
metal speciation between freshwater and seawater as described in further detail below.304
305
It is well documented that manganese uptake and toxicity in freshwater fishes306
increases with decreasing pH (Bendell-Young and Harvey, 1986; Rouleau et al., 307
1996) and with decreasing freshwater hardness (Reader et al., 1988; Gonzalez et al., 308
1990; Adam et al., 1997; Stubblefield et al., 1997; Reimer, 1999). At low pH, 309
particularly at pH values below 7, a greater proportion of manganese in freshwater310
exists as aqueous, toxic Mn(II), whereas high pH values favour the oxidation of 311
insoluble and inert colloidal oxides (Florence et al., 1992; Rouleau et al., 1996; Zaw 312
and Chiswell, 1999). Although there is a lack of data on the effects of pH on 313
manganese speciation in seawater, our findings are consistent with this freshwater 314
model, given that the pH of 45 ppt water in the current study was significantly higher 315
than at 15 and 5 ppt, and that uptake of manganese at this salinity was significantly 316
lower than at the lower salinities. However, although the difference in pH was 317
significant, it amounted to less than 0.12 pH units and the pH at all salinities was well 318
above the ‘critical’ range of 6 - 7 described by Rouleau et al. (1996). It seems 319
unlikely, therefore, that differences in pH among salinity treatments had a major 320

ACC
EPTE
D M
ANU
SCR
IPT
ACCEPTED MANUSCRIPT14
effect on manganese uptake. As we discuss in further detail below, we believe the far 321
greater differences in salinity between treatments is responsible for the observed 322
differences in toxicity. 323
324
In freshwater, decreases in metal toxicity with increasing hardness have been 325
attributed to the ability of calcium (and to a lesser extent magnesium) to compete with 326
toxic metals for ligand sites on the gill surface, which reduces the permeability of the 327
paracellular pathways to these metals (McDonald et al., 1989). In seawater, the effects 328
of increasing salinity on metal ion toxicity appear to be more complicated and 329
dependent on how the salinity affects metal ion speciation. The freshwater model 330
implies that the higher calcium and magnesium concentrations in seawater should 331
provide even greater protection than hard freshwater and that this protection should 332
increase with increasing salinity. Although supporting data are lacking for manganese, 333
the uptake by fishes of certain other metals, including copper and lead, is inversely 334
proportional to salinity (Somero et al., 1977; Jezierska and Witeska, 2006) and the 335
uptake of manganese by salt water mussels (Mytilus edulis) has been shown to follow 336
this trend (Struck et al., 1997). There are examples, however, where metal 337
bioavailability can increase with salinity. For example, when freshwater containing 338
relatively non-toxic aluminium colloids mixes with seawater, the calcium and 339
magnesium in seawater can displace the aluminium and thereby increase the 340
concentration of toxic, low molecular mass cationic aluminium species (Bjerknes et 341
al., 2003; Teien et al., 2006). Our data showing decreasing manganese concentration342
in gills and muscle with increasing salinity are consistent with the former model, 343
however more research is required to determine the effect of salinity (and pH) on 344
manganese speciation.345

ACC
EPTE
D M
ANU
SCR
IPT
ACCEPTED MANUSCRIPT15
346
Our data also suggest, however, that despite reduced uptake at 45 ppt, toxicity at this 347
salinity was greater compared with lower salinities. We suggest that the greater 348
toxicity of manganese at higher salinity, despite its reduced uptake, is due to the 349
effects of manganese on osmoregulation.350
351
Gonzalez et al. (1990) found that freshwater brook char, Salvelinus fontinalis,352
exposed to 600 mg/L of dissolved manganese experienced a 40% reduction in plasma 353
sodium concentration. Studies have also shown that copper exposure induces 354
hyponatremia in freshwater fishes caused by apoptosis and necrosis of chloride cells 355
(Dang et al., 2000). Given that mulloway in hyposmotic salinities face the same 356
osomotic challenges as freshwater fishes; our findings of hyponatremia in mulloway 357
at 5 ppt are consistent with these studies and suggest that manganese may also induce 358
apoptosis and necrosis of chloride cells. Mulloway held at hyperosmotic salinity 359
(45 ppt) face the opposite osmotic challenges to those in hyposmotic salinity and their 360
chloride cells are responsible for the elimination (rather than uptake) of monovalent 361
ions (Evans et al., 2005). Our data showing elevated blood plasma sodium and 362
chloride in manganese-exposed fish at 45 ppt is therefore consistent with manganese 363
causing apoptosis and necrosis of chloride cells, as the loss of such cells would result 364
in reduced elimination of these ions. Seemingly inconsistent with this theory of 365
manganese causing increased apoptosis and necrosis of chloride cells is the fact that 366
we did not observe any histological changes in H&E sections. Cells dying from 367
apoptosis, however, remain intact, and Dang et al (2000) only observed these changes 368
using immunocytochemistry and electron microscopy.369
370

ACC
EPTE
D M
ANU
SCR
IPT
ACCEPTED MANUSCRIPT16
Given that 15 ppt is closer to iso-osmotic than the other two salinities, uptake and 371
elimination of monovalent ions will be less at this salinity and the effects of chloride 372
cell apoptosis not as detrimental as at the more extreme salinities tested. Indeed the 373
differences in plasma sodium and chloride concentrations between exposed and 374
unexposed fish were smaller and statistically non-significant at this salinity, compared 375
with 5 and 45 ppt. We therefore suggest that the reduced osmotic demands at 15 ppt 376
are the likely reason these fish tolerated manganese exposure better than at 5 and 377
45 ppt. We cannot rule out the possibility that the greater tolerance for manganese 378
exposure at a salinity of 15 ppt was due to the small, but significantly lower 379
manganese concentration at this experimental treatment, compared to the 5 ppt and 45 380
ppt treatments. There are, however, two reasons why we believe that this lower 381
manganese concentration in the 15 ppt treatment was not biologically significant. 382
First, there was a reduction of only 0.15 mg/L at this treatment, 3% of the target value 383
of 5 mg/L. Second, there was no relationship between manganese concentration and 384
fish survival and growth rate in the three replicates within treatments.385
386
Even though the fish exposed to manganese at 15 ppt performed better than those at 5 387
and 45 ppt, they still exhibited significantly slower growth compared with control fish 388
at the same salinity. Blood plasma potassium was significantly elevated in these fish,389
suggesting that there was some disruption to their osmoregulatory capacity. The 390
reduced feed conversion efficiency seen in these fish, compared with unexposed fish 391
at the same salinity, may therefore be the result of the repartitioning of a greater 392
proportion of dietary energy into osmoregulation or, alternatively, the result of 393
impaired carbohydrate metabolism described below. 394
395

ACC
EPTE
D M
ANU
SCR
IPT
ACCEPTED MANUSCRIPT17
We found significant reduction in liver potassium and reduced liver glycogen in fish 396
exposed to manganese. Manganese has been implicated in impaired carbohydrate 397
metabolism in both fishes (Nath and Kumar, 1987; Nath and Kumar, 1988; Barnhoorn 398
et al., 1999) and mammals (Underwood, 1977) and observations of decreased liver 399
glycogen and hyperglycemia in manganese exposed fishes have led to the hypothesis 400
that manganese exposure may inhibit insulin release (Nath and Kumar, 1987) in a 401
similar fashion to that seen in cadmium exposed rats (Ghafghazi and Mennear, 1973). 402
Although the reduced liver glycogen that we observed in manganese exposed fish is 403
consistent with these studies, it would also be the expected response of fish that are 404
losing weight or growing at a sub-optimum rate. The significant reduction in liver 405
potassium of manganese exposed fish, however, is consistent with a lack of insulin, as 406
such a deficiency inhibits potassium absorption by liver cells in rats (Fehlmann and 407
Freychet, 1981).408
409
Cardeilhac et al. (1979) and Cardeilhac and Hall (1977) attributed the death of the 410
marine fishes sheepshead (Archosargus probatocephalus) and pinfish (Lagodon 411
rhomboides) exposed to excess copper to osmoregulatory failure and specifically to an 412
elevated concentration of blood plasma potassium. We found significantly elevated 413
blood plasma potassium in fish exposed to manganese at all salinities. The blood 414
plasma potassium of manganese exposed mulloway at 45 ppt was within the toxic 415
range reported for these two species and is therefore a possible cause of death of 416
mulloway in this treatment.417

ACC
EPTE
D M
ANU
SCR
IPT
ACCEPTED MANUSCRIPT18
418
5. Conclusion419
420
Our results demonstrate that 5 mg/L of dissolved manganese, a concentration typical 421
of many saline groundwater sources in Western Australia, has a significant, 422
detrimental effect on the growth, health and survival of mulloway. It appears that 423
selecting a water source with salinity close to iso-osmotic will minimise the effects of 424
dissolved manganese, however, further studies are required to determine the minimum 425
concentrations at which growth is not affected. Given that this study was conducted at 426
relatively high pH values, the negative impacts of a similar dissolved manganese 427
concentration can be expected to be far greater in aquaculture systems or for 428
groundwater sources which have lower values of pH.429
430
Given that both salinity and the pH values typical of groundwater result in very slow 431
oxidation rates of manganese, its removal from saline groundwater is more 432
complicated than iron; another metal often found in high concentrations in saline 433
groundwater. Significant chemical pre-treatment with strong oxidising agents, or the 434
temporary elevation of pH to above 9,, would be required to oxidise manganese prior 435
to its physical removal; a process that will add significant cost and complexity to the 436
delivery of water, particularly for those production systems using large volumes. 437
Although oxidation is slow, once it does occur, precipitation of manganese oxides 438
onto tanks, pipes and pumps is likely to be problematic and impose a significant 439
management issue if dissolved manganese is not oxidised and removed prior to use. 440
441
442

ACC
EPTE
D M
ANU
SCR
IPT
ACCEPTED MANUSCRIPT19
6. Acknowledgements443
444
This study was funded by Challenger TAFE, the Australian Department of Fisheries, 445
Forestry and Agriculture and the Department of Conservation and Land Management. 446
447
7. References448
Adam, C., Garnier-Laplace, J., Baudin, J.P., 1997. Uptake from water, release and 449
tissue distribution of 54Mn in the Rainbow trout (Oncorhynchus mykiss450
Walbaum). Environ. Pollut. 97, 29-38.451
Baden, S.P., Pihl, L., Rosenberg, R., 1990. Effects of oxygen depletion on the 452
ecology, blood physiology and fishery of the Norway lobster Nephrops 453
norvegicus (L.). Mar. Ecol. Prog. Ser. 67, 141–155.454
Barnhoorn, I., van Vuren, J.H.J., du Preez, H.H., 1999. Sublethal effects of 455
manganese on the carbohydrate metabolism of Oreochromis mossambicus456
after acute and chronic exposure. S. Afr. J. Zool. 34, 102-107.457
Bendell-Young, L.I., Harvey, H.H., 1986. Uptake and tissue distribution of 458
manganese in the white sucker (Catostomus commersoni) under conditions of 459
low pH. Hydrobiologia 133, 117-125.460
Bjerknes, V., Fyllingen, I., Holtet, L., Teien, H.C., Rosseland, B.O., Kroglund, F., 461
2003. Aluminium in acidic river water causes mortality of farmed Atlantic 462
Salmon (Salmo salar L.) in Norwegian fjords. Mar. Chem. 83, 169-174.463
Capelli, R., Minganti, V., Bernhard, M., 1987. Total mercury, organic mercury, 464
copper, manganese, selenium, and zinc in Sarda sarda from the gulf of Genoa. 465
Sci. Total Environ. 63, 83-99.466
Cardeilhac, P.T., Hall, E.R., 1977. Acute copper poisoning of cultured marine 467
teleosts. Am. J. Vet. Res. 38, 525-527.468
Cardeilhac, P.T., Simpson, C.F., Lovelock, R.L., Yosha, S.F., Calderwood, H.W., 469
Gudat, J.C., 1979. Failure of osmoregulation with apparent potassium 470
intoxication in marine teleosts: A primary toxic effect of copper. Aquaculture 471
17, 231-239.472

ACC
EPTE
D M
ANU
SCR
IPT
ACCEPTED MANUSCRIPT20
Collett, P.D., Vine, N.G., Kaiser, H., 2008. The effect of light intensity on growth of 473
juvenile dusky kob Argyrosomus japonicus (Temminck & Schlegel 1843). 474
Aquac. Res. 39, 526-531.475
Cossarini-Dunier, M., Demael, A., Lepot, D., Guerin, V., 1988. Effect of manganese 476
ions on the immune response of carp (Cyprinus carpio) against Yersinia 477
ruckeri. Dev. Comp. Immunol. 12, 573-579.478
Cunningham, G.N., Wise, M.B., Barrick, E.R., 1966. Effect of high dietary levels of 479
manganese on the performance and blood constituents of calves. J. Anim Sci. 480
25, 532-538.481
Dang, Z., Lock, R., Flik, G., Wendelaar Bonga, S., 2000. Na+/K+-ATPase 482
immunoreactivity in branchial chloride cells of Oreochromis mossambicus 483
exposed to copper. J. Exp. Biol. 203, 379-387.484
Doupé, R.G., Lymbery, A.J., Starcevich, M.R., 2003. Rethinking the land: The 485
development of inland saline aquaculture in Western Australia. Int. J. Agric. 486
Sustainabil. 1, 30-37.487
Evans, D.H., Piermarini, P.M., Choe, K.P., 2005. The multifunctional fish gill: 488
dominant site of gas exchange, osmoregulation, acid-base regulation, and 489
excretion of nitrogenous waste. Physiol. Rev. 85, 97-177.490
Fehlmann, M., Freychet, P., 1981. Insulin and glucagon stimulation of (Na+-K+)-491
ATPase transport activity in isolated rat hepatocytes. J. Biol. Chem. 256, 492
7449-7453.493
Fielder, D.S., Bardsley, W., 1999. A preliminary study on the effects of salinity on 494
growth and survival of mulloway Argyrosomus japonicus larvae and juveniles. 495
J. World Aquacult. Soc. 30, 380-387.496
Florence, T.M., Morrison, G.M., Stauber, J.L., 1992. Determination of trace element 497
speciation and the role of speciation in aquatic toxicity. The Science of The 498
Total Environment 125, 1-13.499
Gatlin, D.M., Wilson, R.P., 1984. Studies on the manganese requirement of fingerling 500
channel catfish. Aquaculture 41, 85-92.501
Ghafghazi, T., Mennear, J.H., 1973. Effects of acute and subacute cadmium 502
administration on carbohydrate metabolism in mice. Toxicol. Appl. 503
Pharmacol. 26, 231-240.504

ACC
EPTE
D M
ANU
SCR
IPT
ACCEPTED MANUSCRIPT21
Ghassemi, F., Jakeman, A.J., Nix, H.A., 1995. Salinisation of Land and Water 505
Resources: Human Causes, Extent, Management and Case Studies. University 506
of New South Wales Press, Sydney, 526 pp.507
Gonzalez, R.J., Grippo, R.S., Dunson, W.A., 1990. The disruption of sodium balance 508
in brook char, Salvelinus fontinalis (Mitchell), by manganese and iron. J. Fish 509
Biol. 37, 765-774.510
Gunter, T.E., Gavin, C.E., Aschner, M., Gunter, K.K., 2006. Speciation of manganese 511
in cells and mitochondria: a search for the proximal cause of manganese 512
neurotoxicity. Neurotoxicol. 27, 765-776.513
Hardie, A., Heal, K., Lilly, A., 2007. The influence of pedology and changes in soil 514
moisture status on manganese release from upland catchments: Soil core 515
laboratory experiments. Water Air Soil Pollut. 182, 369-382.516
Hernroth, B., Baden, S.P., Holm, K., Andre, T., Soderhall, I., 2004. Manganese 517
induced immune suppression of the lobster, Nephrops norvegicus. Aquat. 518
Toxicol. 70, 223-231.519
Howe, P.D., Malcolm, H.M., Dobson, S., 2004. Manganese and its compounds: 520
environmental aspects. World Health Organisation. Geneva. Concise 521
International Chemical Assessment Document 63. 72 pp.522
Jezierska, B., Witeska, M., 2006. The metal uptake and accumulation in fish living in 523
polluted water. In: Twardowska, I., Allen, H.E., Häggblom, M.M., Stefaniak, 524
S. (Eds.), Soil and Water Pollution Monitoring, Protection and Remediation, 525
Springer Netherlands, pp. 107-114.526
Knox, D., Cowey, C.B., Adron, J.W., 1981. The effect of low dietary manganese 527
intake on rainbow trout (Salmo gairdneri). Br. J. Nutr. 46, 495-501.528
Lambers, H., 2003. Dryland salinity: a key environmental issue in southern Australia. 529
Plant Soil 257, v-vii.530
Maage, A., Lygren, B., El-Mowafi, A.F.A., 2000. Manganese requirement of Atlantic 531
salmon (Salmo salar) fry. Fisheries Science 66, 1-8.532
Mazor, E., George, R., 1992. Marine airborne salts applied to trace 533
evapotranspiration, local recharge and lateral groundwater flow in Western 534
Australia. J. Hydrol. 139, 63-77.535
McDonald, D.G., Reader, J.P., Dalziel, T.R.K., 1989. The combined effects of pH and 536
trace metals on fish ionoregulation. In: Morris, R., Taylor, E.W., Brown, 537

ACC
EPTE
D M
ANU
SCR
IPT
ACCEPTED MANUSCRIPT22
D.J.A., Brown, J.A. (Eds.), Acid Toxicity and Aquatic Animals. Cambridge 538
University Press, Cambridge, pp. 221-242.539
Nath, K., Kumar, N., 1987. Toxicity of manganese and its impact on some aspects of 540
carbohydrate metabolism of a freshwater teleost, Colisa fasciatus. Sci. Total 541
Environ. 67, 257-262.542
Nath, K., Kumar, N., 1988. Impact of manganese intoxication on certain parameters 543
of carbohydrate metabolism of a freshwater tropical perch, Colisa fasciatus. 544
Chemosphere 17, 617-624.545
Newland, M.C., 1999. Animal models of manganese's neurotoxicity. Neurotoxicol. 546
20, 415-432.547
Nyberg, P., Andersson, P., Degerman, E., Borg, H., Olofsson, E., 1995. Labile 548
inorganic manganese - An overlooked reason for fish mortality in acidified 549
streams? Water Air Soil Pollut. 85, 333-340.550
Partridge, G.J., Lymbery, A.J., George, R.J., 2008. Finfish mariculture in inland 551
Australia: A review of potential water sources, species and production 552
systems. J. World Aquacult. Soc. 39, 291-310.553
Reader, J.P., Dalziel, T.R.K., Morris, R., 1988. Growth, mineral uptake and skeletal 554
calcium deposition in brown trout, Salmo trutta L., yolk-sac fry exposed to 555
aluminium and manganese in soft acid water. J. Fish Biol. 32, 607-624.556
Reimer, P.S., 1999. Environmental Effects of Manganese and Proposed Freshwater 557
Guidelines to Protect Aquatic Life in British Columbia. Master of Science. 558
Department of Chemical and Bio-Resource Engineering. University of British 559
Columbia. 119 pp.560
Rouleau, C., Tjalve, H., Gottofrey, J., 1996. Effects of low pH on the uptake and 561
distribution of 54Mn(II) in brown trout (Salmo Trutta). Environ. Toxicol. 562
Chem. 15, 708-710.563
Rouleau, C., Tjälve, H., Gottofrey, J., Pelletier, É. 1995. Uptake, distribution and 564
elimination of 54Mn(II) in the brown trout (Salmo trutta). Environ. Toxicol. 565
Chem. 14, 483-490.566
Somero, G.N., Chow, T.J., Yancey, P.H., Snyder, C.B., 1977. Lead accumulation 567
rates in tissues of the estuarine teleost fish, Gillichthys mirabilis: salinity and 568
temperature effects. Arch. Environ. Contam. Toxicol. 6, 337-348.569
Spotte, S., 1992. Captive Seawater Fishes: Science and Technology. John Wiley and 570
Sons, New York, 942 pp.571

ACC
EPTE
D M
ANU
SCR
IPT
ACCEPTED MANUSCRIPT23
Struck, B.D., Pelzer, R., Ostapczuk, P., Emons, H., Mohl, C., 1997. Statistical 572
evaluation of ecosystem properties influencing the uptake of As, Cd, Co, Cu, 573
Hg, Mn, Ni, Pb and Zn in seaweed (Fucus vesiculosus) and common mussel 574
(Mytilus edulis). Sci. Total Environ. 207, 29-42.575
Stubblefield, W.A., Brinkman, S.F., Davies, P.H., Garrison, T.D., Hockett, J.R., 576
McIntrye, M.W., 1997. Effects of water hardness on the toxicity of manganese 577
to developing brown trout (Salmo trutta). Environ. Toxicol. Chem. 16, 2082-578
2089.579
Teien, H.C., Standring, W.J.F., Salbu, B., 2006. Mobilization of river transported 580
colloidal aluminium upon mixing with seawater and subsequent deposition in 581
fish gills. Sci. Total Environ. 364, 149-164.582
Underwood, E.J., 1977. Trace elements in human and animal nutrition. Academic 583
Press, New York, 558 pp.584
Williams, W.D., 2001. Anthropogenic salinisation of inland waters. Hydrobiologia 585
466, 329–337.586
Zalizniak, L., Kefford, B.J., Nugegoda, D., 2006. Is all salinity the same? I. The effect 587
of ionic compositions on the salinity tolerance of five species of freshwater 588
invertebrates. Mar. Freshw. Res. 57, 75-82.589
Zaw, M., Chiswell, B., 1999. Iron and manganese dynamics in lake water. Water Res. 590
33, 1900-1910.591
592
593594

ACC
EPTE
D M
ANU
SCR
IPT
ACCEPTED MANUSCRIPT24
Table 1: Water quality and performance parameters for juvenile mulloway 595
grown in the presence or absence or manganese at various 596
salinities for two weeks.597
598
Table 2: Organ chemistry data for juvenile mulloway grown in the presence 599
or absence or manganese at various salinities for two weeks.600
601
Figure 1: Concentrations of (a) sodium, (b) chloride and (c) potassium in the 602
blood plasma of juvenile mulloway grown in the presence or absence603
or manganese at various salinities for two weeks. Columns within 604
salinity sharing the same letter are not significantly different 605
(P>0.05).606
607
608
609
ACC
EPTE
D M
ANU
SCR
IPT
ACCEPTED MANUSCRIPTTable(s)
ACC
EPTE
D M
ANU
SCR
IPT
ACCEPTED MANUSCRIPTTable(s)

ACC
EPTE
D M
ANU
SCR
IPT
ACCEPTED MANUSCRIPTFigure(s)