Lotus japonicus Metabolic Profiling. Development of Gas Chromatography-Mass Spectrometry Resources...
17
Lotus japonicus Metabolic Profiling. Development of Gas Chromatography-Mass Spectrometry Resources for the Study of Plant-Microbe Interactions Guilhem G. Desbrosses 1 , Joachim Kopka, and Michael K. Udvardi* Max Planck Institute of Molecular Plant Physiology, 14476 Golm, Germany Symbiotic nitrogen fixation (SNF) in legume root nodules requires differentiation and integration of both plant and bacterial metabolism. Classical approaches of biochemistry, molecular biology, and genetics have revealed many aspects of primary metabolism in legume nodules that underpin SNF. Functional genomics approaches, especially transcriptomics and proteomics, are beginning to provide a more holistic picture of the metabolic potential of nodules in model legumes like Medicago truncatula and Lotus japonicus. To extend these approaches, we have established protocols for nonbiased measurement and analysis of hundreds of metabolites from L. japonicus, using gas chromatography coupled with mass spectrometry. Following creation of mass spectral tag libraries, which represent both known and unknown metabolites, we measured and compared relative metabolite levels in nodules, roots, leaves, and flowers of symbiotic plants. Principal component analysis of the data revealed distinct metabolic phenotypes for the different organs and led to the identification of marker metabolites for each. Metabolites that were enriched in nodules included: octadecanoic acid, asparagine, glutamate, homoserine, cysteine, putrescine, mannitol, threonic acid, gluconic acid, glyceric acid-3-P, and glycerol-3-P. Hierarchical cluster analysis enabled discrimination of 10 groups of metabolites, based on distribution patterns in diverse Lotus organs. The resources and tools described here, together with ongoing efforts in the areas of genome sequencing, and transcriptome and proteome analysis of L. japonicus and Mesorhizobium loti, should lead to a better understanding of nodule metabolism that underpins SNF. The legume family comprises approximately 700 genera with more than 18,000 species, which occupy niches in almost every environment on earth (Polhill et al., 1981; Doyle and Luckow, 2003). A key to the success of this family was the evolution of mutualistic symbioses with bacteria of the family Rhizobiaceae, which enabled early legumes to utilize atmospheric N 2 as a source of nitrogen, especially when colonizing soils lacking mineral or organic nitrogen. Today, sym- biotic nitrogen fixation (SNF) by rhizobia in legumes takes place in specialized plant organs called nodules. Nodules develop from cortical cells of the root or stem after contact with rhizobia in the soil (Brewin, 1991). Mature, nitrogen-fixing nodules consist of several layers of uninfected plant cells surrounding a central zone of infected and noninfected plants cells. Infected plant cells typically contain thousands of differenti- ated, nitrogen-fixing rhizobia, called bacteroids, which are separated from the cytoplasm, either individually or in small groups, by a unique plant membrane called the peribacteroid or symbiosome membrane (SM; Roth et al., 1988; Udvardi and Day, 1997). Microaerobic conditions within legume nodules result from re- stricted oxygen influx across the outer cell layers of nodules, binding and transport of oxygen by leghe- moglobin in the cytoplasm of plant cells, and high rates of respiration by bacteroids and mitochondria in these cells (Appleby, 1984). Low steady-state oxygen concentrations within nodules (in the nanomolar range) have profound effects on plant and bacterial metabolism in nodules. For instance, microaerobiosis is a prerequisite for activity of the oxygen-labile bac- teroid enzyme, nitrogenase (Robson and Postgate, 1980). SNF involves the mutually beneficial exchange of reduced carbon from the plant for reduced nitrogen from the bacteria (Udvardi and Day, 1997), which requires metabolic differentiation of both organisms. Suc, delivered via the phloem, is the primary source of carbon and energy for nodule metabolism (Gordon et al., 1999). However, genetic studies with rhizobial mutants, together with biochemical studies of metab- olite transport across the SM and bacteroid mem- branes, indicate that dicarboxylic acids, especially malate, rather than sugars, are the main source of carbon supplied to bacteroids for SNF (Ronson et al., 1981; Gardiol et al., 1987; Udvardi et al., 1988). An important aspect of plant differentiation during nod- ule development is the induction of genes and proteins that convert sugars to malate via glycolysis and carbon fixation (Pathirana et al., 1992; Miller et al., 1998; Colebatch et al., 2002, 2004). At about the same time, decreasing oxygen within nodules triggers induction of rhizobial genes for nitrogenase and high-affinity oxidases, which enable bacteroid nitrogen fixation and respiration under these conditions (Batut and Boistard, 1994; Fischer, 1996; Sciotti et al., 2003). 1 Present address: Universite ´ Montpellier 2, CC 002, Place Euge `ne Bataillon, F–34095 Montpellier cedex 05, France. * Corresponding author; e-mail [email protected]; fax 49–331–567–8250. Article, publication date, and citation information can be found at www.plantphysiol.org/cgi/doi/10.1104/pp.104.054957. This article is published in Plant Physiology Online, Plant Physiology Preview Section, which publishes manuscripts accepted for publication after they have been edited and the authors have corrected proofs, but before the final, complete issue is published online. Early posting of articles reduces normal time to publication by several weeks. Plant Physiology Preview, www.aspb.org Ó 2005 American Society of Plant Biologists 1 of 17 www.plant.org on January 13, 2014 - Published by www.plantphysiol.org Downloaded from Copyright © 2005 American Society of Plant Biologists. All rights reserved.
-
Upload
univ-montp2 -
Category
Documents
-
view
1 -
download
0
Transcript of Lotus japonicus Metabolic Profiling. Development of Gas Chromatography-Mass Spectrometry Resources...
Lotus japonicus Metabolic Profiling. Development of GasChromatography-Mass Spectrometry Resources for theStudy of Plant-Microbe Interactions
Guilhem G. Desbrosses1, Joachim Kopka, and Michael K. Udvardi*
Max Planck Institute of Molecular Plant Physiology, 14476 Golm, Germany
Symbiotic nitrogen fixation (SNF) in legume root nodules requires differentiation and integration of both plant and bacterialmetabolism. Classical approaches of biochemistry, molecular biology, and genetics have revealed many aspects of primarymetabolism in legume nodules that underpin SNF. Functional genomics approaches, especially transcriptomics andproteomics, are beginning to provide a more holistic picture of the metabolic potential of nodules in model legumes likeMedicago truncatula and Lotus japonicus. To extend these approaches, we have established protocols for nonbiased measurementand analysis of hundreds of metabolites from L. japonicus, using gas chromatography coupled with mass spectrometry.Following creation of mass spectral tag libraries, which represent both known and unknown metabolites, we measured andcompared relative metabolite levels in nodules, roots, leaves, and flowers of symbiotic plants. Principal component analysis ofthe data revealed distinct metabolic phenotypes for the different organs and led to the identification of marker metabolites foreach. Metabolites that were enriched in nodules included: octadecanoic acid, asparagine, glutamate, homoserine, cysteine,putrescine, mannitol, threonic acid, gluconic acid, glyceric acid-3-P, and glycerol-3-P. Hierarchical cluster analysis enableddiscrimination of 10 groups of metabolites, based on distribution patterns in diverse Lotus organs. The resources and toolsdescribed here, together with ongoing efforts in the areas of genome sequencing, and transcriptome and proteome analysis ofL. japonicus and Mesorhizobium loti, should lead to a better understanding of nodule metabolism that underpins SNF.
The legume family comprises approximately 700genera with more than 18,000 species, which occupyniches in almost every environment on earth (Polhillet al., 1981; Doyle and Luckow, 2003). A key to thesuccess of this family was the evolution of mutualisticsymbioses with bacteria of the family Rhizobiaceae,which enabled early legumes to utilize atmospheric N2as a source of nitrogen, especially when colonizingsoils lacking mineral or organic nitrogen. Today, sym-biotic nitrogen fixation (SNF) by rhizobia in legumestakes place in specialized plant organs called nodules.Nodules develop from cortical cells of the root or stemafter contact with rhizobia in the soil (Brewin, 1991).Mature, nitrogen-fixing nodules consist of severallayers of uninfected plant cells surrounding a centralzone of infected and noninfected plants cells. Infectedplant cells typically contain thousands of differenti-ated, nitrogen-fixing rhizobia, called bacteroids, whichare separated from the cytoplasm, either individuallyor in small groups, by a unique plant membrane calledthe peribacteroid or symbiosomemembrane (SM; Rothet al., 1988; Udvardi and Day, 1997). Microaerobicconditions within legume nodules result from re-stricted oxygen influx across the outer cell layers ofnodules, binding and transport of oxygen by leghe-
moglobin in the cytoplasm of plant cells, and highrates of respiration by bacteroids and mitochondria inthese cells (Appleby, 1984). Low steady-state oxygenconcentrations within nodules (in the nanomolarrange) have profound effects on plant and bacterialmetabolism in nodules. For instance, microaerobiosisis a prerequisite for activity of the oxygen-labile bac-teroid enzyme, nitrogenase (Robson and Postgate,1980).
SNF involves the mutually beneficial exchange ofreduced carbon from the plant for reduced nitrogenfrom the bacteria (Udvardi and Day, 1997), whichrequires metabolic differentiation of both organisms.Suc, delivered via the phloem, is the primary source ofcarbon and energy for nodule metabolism (Gordonet al., 1999). However, genetic studies with rhizobialmutants, together with biochemical studies of metab-olite transport across the SM and bacteroid mem-branes, indicate that dicarboxylic acids, especiallymalate, rather than sugars, are the main source ofcarbon supplied to bacteroids for SNF (Ronson et al.,1981; Gardiol et al., 1987; Udvardi et al., 1988). Animportant aspect of plant differentiation during nod-ule development is the induction of genes and proteinsthat convert sugars to malate via glycolysis and carbonfixation (Pathirana et al., 1992; Miller et al., 1998;Colebatch et al., 2002, 2004). At about the same time,decreasing oxygen within nodules triggers inductionof rhizobial genes for nitrogenase and high-affinityoxidases, which enable bacteroid nitrogen fixationand respiration under these conditions (Batut andBoistard, 1994; Fischer, 1996; Sciotti et al., 2003).
1 Present address: Universite Montpellier 2, CC 002, Place EugeneBataillon, F–34095 Montpellier cedex 05, France.
* Corresponding author; e-mail [email protected];fax 49–331–567–8250.
Article, publication date, and citation information can be found atwww.plantphysiol.org/cgi/doi/10.1104/pp.104.054957.
This article is published in Plant Physiology Online, Plant Physiology Preview Section, which publishes manuscripts accepted for
publication after they have been edited and the authors have corrected proofs, but before the final, complete issue is published
online. Early posting of articles reduces normal time to publication by several weeks.
Plant Physiology Preview, www.aspb.org � 2005 American Society of Plant Biologists 1 of 17 www.plant.org on January 13, 2014 - Published by www.plantphysiol.orgDownloaded from
Copyright © 2005 American Society of Plant Biologists. All rights reserved.

Finally, induction of plant genes for ammonium as-similation facilitates rapid incorporation of nitrogeninto amino acids and other nitrogen compounds forexport to the rest of the plant (Vance et al., 1994;Colebatch et al., 2004). These are some of the principalmetabolic changes that occur during nodule develop-ment and differentiation, and most studies of nodulemetabolism have focused on one or more of theseaspects in a variety of different legumes. Few studieshave attempted to look more broadly at nodulemetabolism in a single, model species. To facilitatesuch studies, we have developed resources for tran-scriptome (Colebatch et al., 2002, 2004) and metabo-lome analyses in the model legume, Lotus japonicus.
In the past, most studies on legume metabolitesanalyzed a few compounds from preselected classessuch as sugars, amino and organic acids, thiols,saponins, and phenolics, using a range of instrumen-tation, including HPLC (Streeter, 1987; Matamoroset al., 1999; Chen et al., 2003), thin layer chromatogra-phy (Khalil and Eladawy, 1994; Steele et al., 1999), andgas chromatography (GC; Streeter and Bosler, 1976;Streeter, 1980; Karoutis et al., 1992). Such studies canbest be described as targeted metabolite analysis(Fiehn, 2002), where analysis concentrates on a few,well-defined metabolites, which are often part of well-characterized metabolic pathways. Relatively littleattention has been focused on unknown compoundsrepresenting potentially novel metabolism. Recent de-velopment or refinement of a variety of analyticalplatforms, including GC-mass spectrometry (GC-MS;Fiehn et al., 2000; Roessner et al., 2000; Wagner et al.,2003) and liquid chromatography-MS (Huhman andSumner, 2002; Tolstikov and Fiehn, 2002; Chen et al.,2003; Tolstikov et al., 2003), together with softwaredevelopments, such as GC-MS chromatogram align-ment tools (Duran et al., 2003) and deconvolutionprograms to extricate MS data from overlappingchromatographic peaks (Stein, 1999), have enabledhigh-throughput, nonbiased analysis of thousands ofmetabolites from plants and other organisms. Thesetools afford not only a much broader view of metab-olites and metabolism but also the opportunity todiscover novel metabolites and previously unknownaspects of metabolism (Fiehn et al., 2000; Sumner et al.,2003). Here, we describe the use of GC-MS to charac-terize the metabolome of the model legume, L. japoni-cus. Following the creation of mass spectral tag (MST)libraries, which represent both known and unknownmetabolites, we measured and compared relativemetabolite levels in nodules, roots, leaves, and flowersof symbiotic plants. Principal component analysis(PCA) and hierarchical cluster analysis (HCA), re-vealed discrete metabolic phenotypes for the differentorgans and led to the identification of metabolitemarkers for each. A large number of novel metabolites,including 2-methylcitrate and many still unidentifiedmetabolites, were uncovered, which alludes to pre-viously unknown aspects of metabolism in nodulesand other organs.
RESULTS
GC-MS Chromatograms of L. japonicus Organs andEstablishment of MST Libraries
Gas chromatograms of nodules, lateral and primaryroots, developing andmature leaves, and flowers fromL. japonicus plants, harvested 12 weeks after germina-tion and inoculation with Mesorhizobium loti strainR7A, revealed reproducible and organ-specific fea-tures (Fig 1). About 40 major polar metabolite deriv-atives were detectable by eye from the GC traces,together with amultitude of minor constituents, whichare barely or not at all visible on the scale shown inFigure 1.
GC separates complex mixtures of metabolite de-rivatives into a series of compounds that enter themass spectrometer and are subsequently ionized,fragmented, and detected. Each metabolite is, there-fore, represented by one or more ionic fragments ofprecise mass, which together can serve as a tag for thatmetabolite. We have termed these MST, by analogy toexpressed sequence tags of genes. Each MST hasproperties that facilitate unequivocal identification ofthe parent metabolite, following comparison to thepure reference compound (Wagner et al., 2003). Theproperties of an MST are: (1) gas chromatographicretention, which is best characterized by a retentiontime index (RI), and (2) a specific composition offragments, which are each characterized by a mass-to-charge ratio (m/z). A library of MSTs was derivedfrom a set of L. japonicus organs using the automatedmass spectral deconvolution and identification sys-tem, AMDIS (Stein, 1999).
Mass fragments that belong to one MST have thesame RI and occur in fixed relative abundance, in-dependent of metabolite concentration. Therefore, anysingle fragment or set of fragments with identical RIcan be used for the quantification of metabolites. Asa rule, choice of mass fragments for quantitative pur-poses must be selective, i.e. only those fragments thatare unique to an MST can be used. Mass fragmentsthat are common to coeluting MSTs, i.e. fragmentswith similar RIs and identicalm/z, must be avoided forquantification purposes.
In this work, fragments used for metabolite quanti-fication were identified bym/z, RI, and name of MST towhich the fragment belongs. If the MST representsa known or identified metabolite, we add the name ofthe respective metabolite derivative. We used thefollowing nomenclature: m/z of the selected GC-MSfragments followed by RI and MST name both sepa-rated by the underline character; for example, massfragment 292_2014_glucaric acid (6TMS) or333_2014_glucaric acid (6TMS; e.g. see Fig. 4). MSTsthat remain unidentified were classified tentatively bybest matching mass spectra from a custom and a com-mercial NIST02 library (Institute of Standards andTechnology, Gaithersburg, MD). A tentative matchrequired a score .600 on a scale of 0 to 1,000. To
Desbrosses et al.
2 of 17 Plant Physiology Preview www.plant.org on January 13, 2014 - Published by www.plantphysiol.orgDownloaded from
Copyright © 2005 American Society of Plant Biologists. All rights reserved.

Figure 1. Typical GC-MS profiles (A) and hierarchical cluster analysis (B) of polar extracts from different organs of L. japonicus.Profiles were generated from nodules (N), lateral roots (LR), primary roots (PR), developing leaves (DL), mature leaves (ML), andflowers (F). Typical major MSTs represent: (1) phosphate, (2) Pro, (3) succinate, (4) glycerate, (5) fumarate, (6) Ser, (7) threonate,(8) citramalate, (9) malate, (10) Asp, (11) Asn (MST with 4 trimethylsilyl groups), (12) Gln, (13) Asn (MST with 3 trimethylsilylgroups), (14) citrate, (15) pinitol, (16) Fru, (17) ononitol, (18) saccharic acid, (19) myoinositol, and (20) Suc. Arrows indicateinternal standard substances, (A) n-pentadecane, (B) n-nonadecane, (C) n-docosane, and (D) ribitol.
Legume Metabolomics
Plant Physiology Preview 3 of 17 www.plant.org on January 13, 2014 - Published by www.plantphysiol.orgDownloaded from
Copyright © 2005 American Society of Plant Biologists. All rights reserved.

Table I. Identified and unidentified metabolites of L. japonicus organs, GC-MS characteristics (fragment mass, RI), influence in principal componentsof Figure 2, differential distribution, and metabolite class membership as shown in Figure 6.
Differences in metabolite levels that were significant at P # 0.01 are indicated in bold format.
m/zRI,
MedianRI, SD
Influence
in PCA
Component
(Metabolite
Lists among
the Top 25
of Loadings
Values)
Response
Ratio
(Nodule/
Plant)
Response
Ratio
(Nodule/
Root)
Response
Ratio
(Root,
Nodule/
Shoot)
Response
Ratio
(Root/
Leaf)
Response
Ratio
(Lateral
Root,
Primary
Root)
Response
Ratio
(Developing
Leaf,
Mature
Leaf)
Response
Ratio
(Flower/
Other
Organs)
Cluster
Membershipc
Amino AcidsGly 248 1,313 1.4 2.6 3.3 1.1 1.4 2.8 6.5 2.3 2L-Asn 116 1,686 3.3 2, 3 17.6 21.4 9.1 2.3 0.6 47.7 0.5 2L-Homoserine 218 1,455 1.9 5.9 4.9 3.5 2.1 0.2 4.4 0.7 2L-Glu 246 1,633 2.9 2 5.2 11.8 1.4 0.4 0.2 2.5 1.3 2L-Cys 220 1,561 3.2 5.6 21.0 1.1 0.2 0.9 0.2 1.0 2L-Ala 116 1,095 3.1 1.5 2.7 0.6 0.5 2.0 1.7 1.8 5Pyroglutamic acid,
L-Gln, L-Glua258 1,528 1.9 1.4 2.2 0.8 0.6 0.2 4.2 1.4 5
2-Aminoadipic acid 260 1,728 1.7 2.0 18.8 0.9 1.8 0.5 18.4 2.1 5L-Val 144 1,221 1.7 0.9 1.9 0.5 0.8 1.1 0.7 5.3 6L-Tyr 218 1,941 2.0 0.9 4.5 0.3 0.4 1.7 1.5 9.7 6L-Met 176 1,523 2.5 1.0 3.0 0.5 0.9 0.3 2.9 6.7 6L-Gln 156 1,786 3.3 1, 2, 3 1.4 291.0 0.3 0.1 1.0 12.7 14.6 6L-Phe 192 1,637 2.8 1.1 2.6 0.5 1.1 0.1 1.7 6.1 6L-Leu 232 1,279 1.8 3 0.4 1.6 0.2 3.2 0.3 0.7 19.5 6L-Pro 142 1,304 1.4 1 0.1 6.2 0.0 0.1 0.5 3.7 27.7 6L-Trp 202 2,217 3.9 2 0.0 12.3 0.0 0.2 0.0 - 67.2 6L-Ser 204 1,371 1.2 0.5 3.2 0.1 0.1 0.5 1.2 5.7 6L-Thr 219 1,395 1.3 0.4 1.3 0.2 0.3 0.6 2.5 4.7 6b-Ala 174 1,432 0.8 0.3 0.3 0.8 1.9 0.7 2.7 3.0 6L-Orn, L-Arg, L-Citrullinea 142 1,822 2.0 3, 4 0.4 0.6 0.4 4.4 0.0 12.8 8.3 6L-Lys 156 1,922 2.9 1.6 7.1 0.7 0.9 0.1 4.3 3.9 6L-Ile 158 1,302 1.9 0.7 3.3 0.2 0.1 0.4 4.3 2.7 7L-Asp 232 1,526 1.8 4 0.9 1.0 0.9 1.4 0.1 3.0 2.1 94-Aminobutyric acid 304 1,531 1.4 0.6 0.8 0.6 0.7 0.3 1.0 1.5 9Organic AcidsLactic acidb 219 1,049 1.3 1.0 0.8 1.5 1.6 1.7 0.9 0.8 1Octadecanoic acid 341 2,247 2.9 2 52.1 110.9 14.1 0.6 0.1 1.2 0.3 22,3,4-Trihydroxybutyricacid (threonic acid)
292 1,570 1.2 6.7 18.4 1.6 0.4 2.1 1.5 1.5 2
Gluconic acid 333 2,003 1.8 4.4 3.7 2.1 3.2 4.4 1.2 1.4 22-Ketoglutaric acid 198 1,593 1.9 1.9 3.4 0.8 0.3 2.0 1.9 0.2 3DL-2-methylcitric acid 287 1,842 0.4 2.3 4.4 0.7 0.5 0.5 0.8 2.1 5Hexadecanoic acid 313 2,052 1.1 1.4 1.6 0.9 0.9 1.0 1.0 1.5 5Glucuronic acid 160 1,938 1.2 0.2 1.9 0.1 0.2 0.8 1.1 13.8 6Malic acid 335 1,493 1.8 0.9 1.8 0.5 0.5 1.1 1.4 2.3 6Glutaric acid 158 1,416 1.7 1.7 4.3 0.5 0.4 1.7 2.4 3.5 6Shikimic acid 204 1,822 0.9 0.8 1.8 0.4 0.3 1.0 2.3 2.1 7Maleic acid 245 1,313 2.3 1.1 1.5 0.8 0.6 0.0 0.4 0.9 82,3,4-Trihydroxybutyricacid (erythronic acid)
292 1,550 1.3 1 0.1 1.6 0.0 0.0 0.6 0.5 1.6 8
Succinic acid 147 1,318 2.0 0.2 0.4 0.2 0.3 1.7 0.4 3.1 8Fumaric acid 245 1,363 0.9 0.6 2.8 0.2 0.2 0.9 0.3 3.9 8D-(-)-Quinic acid 345 1,862 1.1 0.3 2.0 0.1 0.1 1.3 1.1 4.0 8Gulonic acid 333 1,965 1.4 0.2 1.1 0.1 0.1 1.2 0.8 3.5 8cis-Aconitic acid 229 1,763 1.7 0.5 1.1 0.3 0.4 0.9 1.2 2.2 8Glucaric acid 333 2,014 0.9 1 0.1 1.3 0.0 0.0 0.6 1.2 2.8 8Citramalic acid 349 1,474 0.5 0.3 0.2 1.4 2.5 1.0 0.5 1.6 9Citric acid 375 1,829 0.8 0.2 0.2 0.6 0.8 2.4 2.1 1.2 10Isocitric acid 245 1,832 2.2 0.2 0.2 0.7 1.0 – 3.2 1.6 10Galactonic acid 333 1,999 1.4 0.7 1.8 0.3 0.2 0.2 0.3 1.2 11
(Table continues on following page.)
Desbrosses et al.
4 of 17 Plant Physiology Preview www.plant.org on January 13, 2014 - Published by www.plantphysiol.orgDownloaded from
Copyright © 2005 American Society of Plant Biologists. All rights reserved.
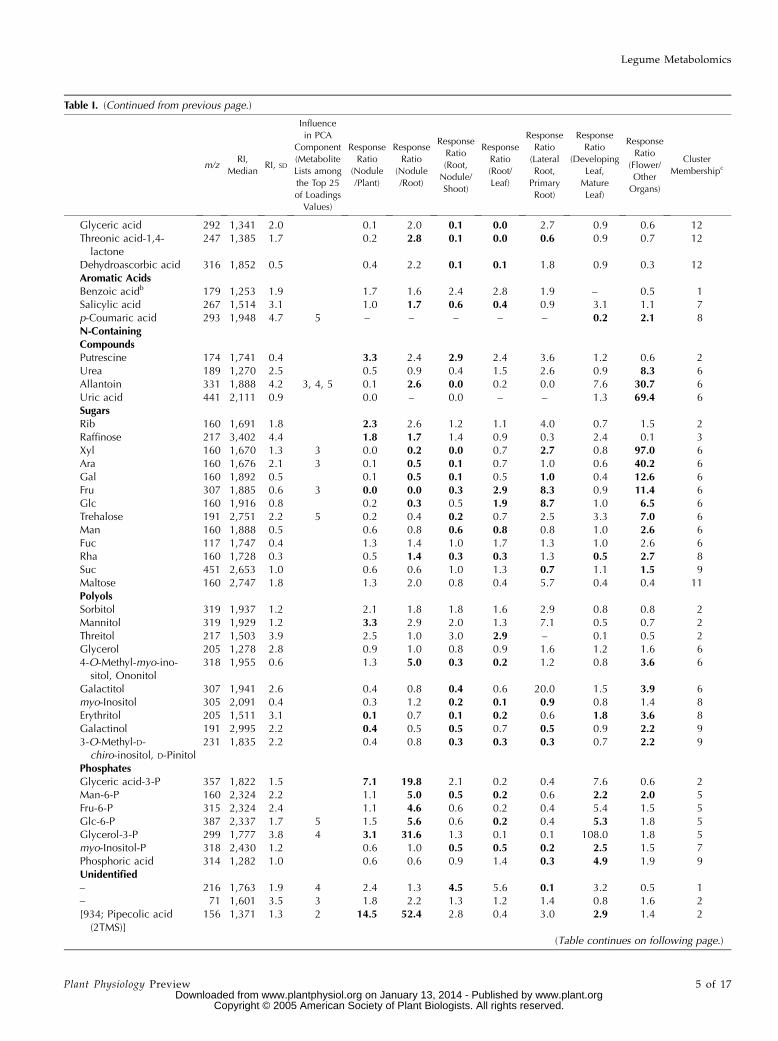
Table I. (Continued from previous page.)
m/zRI,
MedianRI, SD
Influence
in PCA
Component
(Metabolite
Lists among
the Top 25
of Loadings
Values)
Response
Ratio
(Nodule
/Plant)
Response
Ratio
(Nodule
/Root)
Response
Ratio
(Root,
Nodule/
Shoot)
Response
Ratio
(Root/
Leaf)
Response
Ratio
(Lateral
Root,
Primary
Root)
Response
Ratio
(Developing
Leaf,
Mature
Leaf)
Response
Ratio
(Flower/
Other
Organs)
Cluster
Membershipc
Glyceric acid 292 1,341 2.0 0.1 2.0 0.1 0.0 2.7 0.9 0.6 12Threonic acid-1,4-lactone
247 1,385 1.7 0.2 2.8 0.1 0.0 0.6 0.9 0.7 12
Dehydroascorbic acid 316 1,852 0.5 0.4 2.2 0.1 0.1 1.8 0.9 0.3 12Aromatic AcidsBenzoic acidb 179 1,253 1.9 1.7 1.6 2.4 2.8 1.9 – 0.5 1Salicylic acid 267 1,514 3.1 1.0 1.7 0.6 0.4 0.9 3.1 1.1 7p-Coumaric acid 293 1,948 4.7 5 – – – – – 0.2 2.1 8N-ContainingCompoundsPutrescine 174 1,741 0.4 3.3 2.4 2.9 2.4 3.6 1.2 0.6 2Urea 189 1,270 2.5 0.5 0.9 0.4 1.5 2.6 0.9 8.3 6Allantoin 331 1,888 4.2 3, 4, 5 0.1 2.6 0.0 0.2 0.0 7.6 30.7 6Uric acid 441 2,111 0.9 0.0 – 0.0 – – 1.3 69.4 6SugarsRib 160 1,691 1.8 2.3 2.6 1.2 1.1 4.0 0.7 1.5 2Raffinose 217 3,402 4.4 1.8 1.7 1.4 0.9 0.3 2.4 0.1 3Xyl 160 1,670 1.3 3 0.0 0.2 0.0 0.7 2.7 0.8 97.0 6Ara 160 1,676 2.1 3 0.1 0.5 0.1 0.7 1.0 0.6 40.2 6Gal 160 1,892 0.5 0.1 0.5 0.1 0.5 1.0 0.4 12.6 6Fru 307 1,885 0.6 3 0.0 0.0 0.3 2.9 8.3 0.9 11.4 6Glc 160 1,916 0.8 0.2 0.3 0.5 1.9 8.7 1.0 6.5 6Trehalose 191 2,751 2.2 5 0.2 0.4 0.2 0.7 2.5 3.3 7.0 6Man 160 1,888 0.5 0.6 0.8 0.6 0.8 0.8 1.0 2.6 6Fuc 117 1,747 0.4 1.3 1.4 1.0 1.7 1.3 1.0 2.6 6Rha 160 1,728 0.3 0.5 1.4 0.3 0.3 1.3 0.5 2.7 8Suc 451 2,653 1.0 0.6 0.6 1.0 1.3 0.7 1.1 1.5 9Maltose 160 2,747 1.8 1.3 2.0 0.8 0.4 5.7 0.4 0.4 11PolyolsSorbitol 319 1,937 1.2 2.1 1.8 1.8 1.6 2.9 0.8 0.8 2Mannitol 319 1,929 1.2 3.3 2.9 2.0 1.3 7.1 0.5 0.7 2Threitol 217 1,503 3.9 2.5 1.0 3.0 2.9 – 0.1 0.5 2Glycerol 205 1,278 2.8 0.9 1.0 0.8 0.9 1.6 1.2 1.6 64-O-Methyl-myo-ino-sitol, Ononitol
318 1,955 0.6 1.3 5.0 0.3 0.2 1.2 0.8 3.6 6
Galactitol 307 1,941 2.6 0.4 0.8 0.4 0.6 20.0 1.5 3.9 6myo-Inositol 305 2,091 0.4 0.3 1.2 0.2 0.1 0.9 0.8 1.4 8Erythritol 205 1,511 3.1 0.1 0.7 0.1 0.2 0.6 1.8 3.6 8Galactinol 191 2,995 2.2 0.4 0.5 0.5 0.7 0.5 0.9 2.2 93-O-Methyl-D-chiro-inositol, D-Pinitol
231 1,835 2.2 0.4 0.8 0.3 0.3 0.3 0.7 2.2 9
PhosphatesGlyceric acid-3-P 357 1,822 1.5 7.1 19.8 2.1 0.2 0.4 7.6 0.6 2Man-6-P 160 2,324 2.2 1.1 5.0 0.5 0.2 0.6 2.2 2.0 5Fru-6-P 315 2,324 2.4 1.1 4.6 0.6 0.2 0.4 5.4 1.5 5Glc-6-P 387 2,337 1.7 5 1.5 5.6 0.6 0.2 0.4 5.3 1.8 5Glycerol-3-P 299 1,777 3.8 4 3.1 31.6 1.3 0.1 0.1 108.0 1.8 5myo-Inositol-P 318 2,430 1.2 0.6 1.0 0.5 0.5 0.2 2.5 1.5 7Phosphoric acid 314 1,282 1.0 0.6 0.6 0.9 1.4 0.3 4.9 1.9 9Unidentified– 216 1,763 1.9 4 2.4 1.3 4.5 5.6 0.1 3.2 0.5 1– 71 1,601 3.5 3 1.8 2.2 1.3 1.2 1.4 0.8 1.6 2[934; Pipecolic acid(2TMS)]
156 1,371 1.3 2 14.5 52.4 2.8 0.4 3.0 2.9 1.4 2
(Table continues on following page.)
Legume Metabolomics
Plant Physiology Preview 5 of 17 www.plant.org on January 13, 2014 - Published by www.plantphysiol.orgDownloaded from
Copyright © 2005 American Society of Plant Biologists. All rights reserved.

Table I. (Continued from previous page.)
m/zRI,
MedianRI, SD
Influence
in PCA
Component
(Metabolite
Lists among
the Top 25
of Loadings
Values)
Response
Ratio
(Nodule
/Plant)
Response
Ratio
(Nodule
/Root)
Response
Ratio
(Root,
Nodule/
Shoot)
Response
Ratio
(Root/
Leaf)
Response
Ratio
(Lateral
Root,
Primary
Root)
Response
Ratio
(Developing
Leaf,
Mature
Leaf)
Response
Ratio
(Flower/
Other
Organs)
Cluster
Membershipc
[910; Phenylpyruvicacid methoxamine(1TMS)]
250 1,602 2.0 2, 4 40.3 16.4 46.2 4.0 32.1 1.5 0.0 2
[824; 2-O-Glycerol-b-D-galactopyranoside(6TMS)]
263 2,190 3.1 5 13.6 7.8 32.8 7.2 1.0 3.6 0.0 2
[829;Melezitose (11TMS)] 361 3,389 3.0 2 23.3 12.6 31.5 5.2 11.0 1.2 0.0 2[957; Suberylglycine(3TMS]]
188 1,638 4.4 1, 2, 3 202.5 1138.6 129.2 0.7 2.0 9.4 0.0 2
[802; Methylcitricacid (4TMS)]
243 1,930 2.0 2, 4 59.2 42.0 34.0 2.0 7.8 0.7 0.0 2
– 243 1,690 4.2 2 38.0 75.0 7.2 1.3 0.5 0.8 0.3 2– 312 1,803 3.1 4 2.8 16.3 1.2 0.1 0.6 0.1 0.8 2[630; DL-2-Methylcitricacid (4TMS)]
361 1,890 1.8 5 2.8 2.2 2.3 1.5 0.1 0.3 0.6 2
– 281 1,837 3.0 2.0 2.0 – – – – – 4[877; Tetracosamethyl-cyclododecasiloxane]b
279 2,758 4.4 0.7 0.2 10.3 32.3 – 0.2 0.2 4
[795; 3-Deoxy-arabino-hexaric acid (5TMS)]
245 2,115 1.6 1 2.2 6.4 0.8 0.3 0.0 0.9 2.3 5
[816; Hydroquinone-b-D-glucopyranoside(5TMS)]
254 2,607 0.9 5 2.3 4.5 0.7 0.4 1.1 0.2 1.8 5
– 142 1,624 3.6 5 1.1 15.9 0.4 1.6 2.7 2.8 7.3 6[632; Pro (2TMS)] 186 1,594 2.6 1 0.0 0.8 0.0 0.1 0.8 3.9 49.7 6[910; 4-O-D-Glc-b-
D-glucopyranoside(8TMS)]
169 3,068 7.1 5 – – 0.1 0.5 0.3 0.2 21.3 6
[607; L-Asp (3TMS)] 232 1,957 1.8 1, 4 0.3 1.0 0.2 0.3 0.0 10.4 6.7 6[799; Maltose (8TMS)] 361 2,226 2.6 2 0.0 – 0.0 – – 2.0 6.4 6[846; 1-Methyl-b-
D-galactopyranoside(4TMS)]
205 2,102 4.9 1, 4 0.3 0.7 0.3 0.5 0.0 1.8 4.2 6
[674; Gln (4TMS)] 301 1,597 3.8 4 0.9 16.4 0.5 – 0.0 – 2.2 6[817; Glc-6-P methoxy-amine (6TMS)]
299 2,569 3.7 5 0.3 2.3 0.2 0.1 0.4 3.8 0.9 7
[787; Trehalose (8TMS)] 361 2,597 3.1 1, 5 0.1 5.0 0.0 0.0 1.0 3.1 1.1 7[866; Gulose (5TMS)] 364 2,169 2.3 4 0.1 0.4 0.1 0.1 0.2 2.6 1.1 7[746; Gulose (5TMS)] 204 2,431 4.4 4 - - 0.1 0.1 0.2 0.7 1.6 8[810; L-Rha (4TMS)] 249 2,188 2.4 2 0.0 1.6 0.0 0.0 0.0 0.2 2.6 8[802; Gulose (5TMS)] 159 2,443 2.5 1 0.1 2.2 0.0 0.0 1.7 0.4 4.2 8[814; Ribonic acid(5TMS)]
333 1,762 0.4 0.1 0.5 0.2 0.2 1.6 0.7 3.1 8
[914; Ribonic acid(5TMS)]
333 1,774 0.5 0.2 0.6 0.2 0.2 1.3 0.7 2.6 8
[849; 1-Methyl-b-D-galactopyranoside(4TMS)]
174 2,161 3.1 1 0.1 0.9 0.1 0.1 0.1 1.6 2.3 8
[797; Gulose (5TMS)] 91 2,411 2.4 1 0.1 2.4 0.0 0.0 0.8 1.5 3.7 8[841; 1-Methyl-b-
D-galactopyranoside(4TMS)]
230 2,169 2.5 1 0.1 0.3 0.2 0.3 0.0 1.3 2.5 8
[649; L-Ala (2TMS)] 132 1,408 2.3 2, 4 0.0 0.0 0.4 0.6 0.3 1.9 2.5 9[953; Malonic acid(2TMS)]
233 1,213 4.4 1, 3, 4, 5 0.0 17.2 0.0 0.0 5.9 0.3 0.4 11
(Table continues on following page.)
Desbrosses et al.
6 of 17 Plant Physiology Preview www.plant.org on January 13, 2014 - Published by www.plantphysiol.orgDownloaded from
Copyright © 2005 American Society of Plant Biologists. All rights reserved.

address fragments that belong to unidentified MSTs,we use the following nomenclature: match value, andsubstance name of best fit, separated by a semicolonand set into brackets, e.g. 243_1930_[802; Methylcitricacid (4TMS)] (e.g. Fig. 4).
MST-Based Identification of Metabolites in Lotus
Comparison of MSTs derived from Lotus organswith those of pure reference compounds enabled theidentification of 87 compounds among the hundredsrepresented on GC-MS chromatograms (Table I).These included most of the common amino acids aswell as polyamines; many organic acids, includingTCA cycle intermediates; aromatic acids; sugars andsugar phosphates; and polyols (Table I). A number oflikely chemical contaminants, from human or labora-tory sources, or reagent impurities, including lacticacid, benzoic acid, and oligomethyl-cyclosiloxanes,were also identified.
A small set of MSTs was found to represent morethan onemetabolite. For example, pyroglutamic acid isformed from Gln, and, to a lesser extent, from Gluduring extraction and derivatization of metabolites.However, the classification of Gln, Glu, and pyroglu-tamic acid into different clusters (see Fig. 6) indicatedminimal cross-contamination in this analysis. Arg andcitrulline may be converted completely into Ornduring chemical derivatization. In our analyses, nospecific derivatives of Arg or citrulline were found.Thus, the MST of Orn represented the sum of endog-enous Arg, citrulline, and Orn.
Numerical and PCA Analysis of Organ
Metabolic Phenotypes
Manual inspection of GC-MS chromatograms in-dicated major similarities in metabolism of developingand mature leaves, as well as similarities betweenlateral and primary roots (Fig. 1). To analyze similar-
Table I. (Continued from previous page.)
m/zRI,
MedianRI, SD
Influence
in PCA
Component
(Metabolite
Lists among
the Top 25
of Loadings
Values)
Response
Ratio
(Nodule
/Plant)
Response
Ratio
(Nodule
/Root)
Response
Ratio
(Root,
Nodule/
Shoot)
Response
Ratio
(Root/
Leaf)
Response
Ratio
(Lateral
Root,
Primary
Root)
Response
Ratio
(Developing
Leaf,
Mature
Leaf)
Response
Ratio
(Flower/
Other
Organs)
Cluster
Membershipc
[624; Xylulose (4TMS)] 306 1,590 1.2 5 0.2 2.6 0.1 0.0 2.4 0.1 0.9 11[827; Gulose (5TMS)] 204 2,678 5.5 4 - - 0.0 0.0 1.3 0.0 0.2 11[840; Melibiose (8TMS)] 217 2,456 1.9 1 0.0 0.7 0.0 0.0 0.4 0.1 1.6 11[791; 4-O-D-Glc-b-
D-galactopyranoside(8TMS)]
247 2,510 5.3 5 0.1 0.7 0.1 0.1 2.2 0.1 0.4 11
[716; 4-O-D-Glc-b-D-galactopyranoside(8TMS)]
361 2,950 4.0 4 0.0 0.7 0.0 0.0 0.0 0.0 0.6 11
– 204 2,189 2.0 1, 4 0.6 94.9 0.1 0.0 0.2 0.3 1.6 11[851; Gulose (5TMS)] 235 2,191 1.2 2 0.0 1.4 0.0 0.0 1.3 0.2 1.0 11– 117 2,611 2.2 1 0.2 2.0 0.1 0.1 0.0 0.2 1.2 11[690; Raffinose(11TMS)]
361 2,525 2.5 5 0.8 4.2 0.6 0.1 - 0.1 0.2 11
[752; 1-Methyl-6-deoxy-galactoopyranoside(3TMS)]
204 2,071 2.3 5 2.0 4.7 0.7 0.3 0.2 0.1 0.5 11
[625; 2,2,7,7-Tetra-methyl-4,5-diphenyl-3,6-dioxa-2,7-disilaoctane]a
179 2,261 2.7 1, 3, 5 0.0 9.9 0.0 0.0 0.8 1.2 0.7 12
[919; Arabino-Hexos-2-ulose-bis(dimethyl-acetal) (4TMS)]
234 1,485 2.1 3, 5 0.0 0.8 0.0 0.0 0.6 1.5 0.1 12
[827; Suc (8TMS)] 450 2,713 3.5 2 0.0 0.9 0.0 0.0 - 0.5 0.3 12[849; 4-O-D-Gluco
pyranose-b-D-galactopyranoside(8TMS)]
204 2,726 4.7 3 0.1 0.5 0.1 0.1 0.1 0.6 0.3 12
aCombined quantitative information due to chemical interconversion. bNoncorrected artifacts for the detection of jet unknown artifactcompounds. cFor cluster description, refer to Figures 6 and 7 (cluster numbers equal metabolite classes of Figs. 6 and 7).
Legume Metabolomics
Plant Physiology Preview 7 of 17 www.plant.org on January 13, 2014 - Published by www.plantphysiol.orgDownloaded from
Copyright © 2005 American Society of Plant Biologists. All rights reserved.
ities and differences numerically, we performed auto-mated peak integration using 1,046 mass spectralfragments, representative of about 500 MSTs. MSTsrepresenting known or unknown metabolites wereanalyzed, as a rule, using one to four specific massspectral fragments within the respective retention timewindow (see ‘‘Materials and Methods’’ section ‘‘Gen-eration of a Metabolite Response Matrix’’). Choice offragment mass and retention time window was per-formed manually and was facilitated by nonsuper-vised collection of MSTs (Colebatch et al., 2004). Thus,a large matrix of 1,046 fragment responses, whichdescribe 64 samples from 6 organs of L. japonicus, wasgenerated. PCA (Joliffe, 1986) was applied to gaininsight into the nature of the above multivariate data.PCA identifies and ranks major sources of variancewithin data sets and allows clustering of biologicalsamples into both expected and unexpected groupsbased on similarities and differences in the measuredparameters. PCA also identifies those data elements,e.g. MSTs representing known or unknown metabo-lites, which contribute most to each of the principalcomponents that describe the variance in metaboliteprofiling data sets (Roessner et al., 2001a, 2001b).Finally, if sample classes can be clearly distinguishedwhen projected onto any of the principal components,PCA enables identification of those MSTs and metab-olites that distinguish the sample classes.
The first 5 principal components derived from theabove data matrix encompassed 77.3% of the totalvariance from this data set (Fig. 2). The first compo-nent accounted for 37.1% of the variance and alloweddistinction of shoot organs from root organs (Fig. 2A).Nodules exhibited more similarity to roots than toshoot organs according to the first component. How-ever, the second component, which comprised 17.8%of the variance, demonstrated that the data set con-tained metabolite measurements that distinguishedbetween nodule and root profiles (Fig. 2A). Subse-quent principal components revealed other differencesbetween the various organs. Thus, the third and fourthcomponents, encompassing 11.2% and 7.3% of thevariance, respectively, indicated that general markersfor flowers and primary roots exist (Fig. 2B). The fifthcomponent clearly separated developing leaves fromother organs (Fig. 2C). No subsequent componentsallowed a clear discrimination between sample types(e.g. Fig. 2C, component 6).
The organ samples described above were harvestedat one developmental stage, but at different times ofa single day/night cycle. No principal component wasfound that reflected diurnal changes in metabolism.This finding indicated that diurnal changes resulted inonly minor changes in metabolite profiles compared tothose resulting from organ development and differen-tiation. PCA analysis of leaf samples only indicatedsome diurnal changes in this organ (data not shown).However, the small number of samples from each timepoint prohibited identification of significant shifts inleaf metabolism during the diurnal cycle.
To test the robustness of PCA in distinguishingbetween different organs, we analyzed GC-MS datafrom plants harvested over a 10-week period (7–17weeks after germination), following growth underdifferent culture conditions in different seasons (Fig.3A). This data set was expected to be more variablethan the first. In fact, this appeared to be the case, andPCA analysis proved less successful in distinguishingbetween samples of different organs (Fig. 3A). None-theless, nodule and root samples were mostly sepa-rated from shoot organs by component 1 of PCA,which accounted for 22.9% of the total variance. The 2subsequent components covered a sum of 14.6% ofvariance but did not yield distinctions between thesamples that could be linked to organ age or plantgrowth conditions. However, the fourth component,which encompassed 5.5% of the variance, separatednodule samples from those of other organs (Fig. 3A).
PCA Analysis Reveals Specific Metabolites ThatDistinguish Different Organs
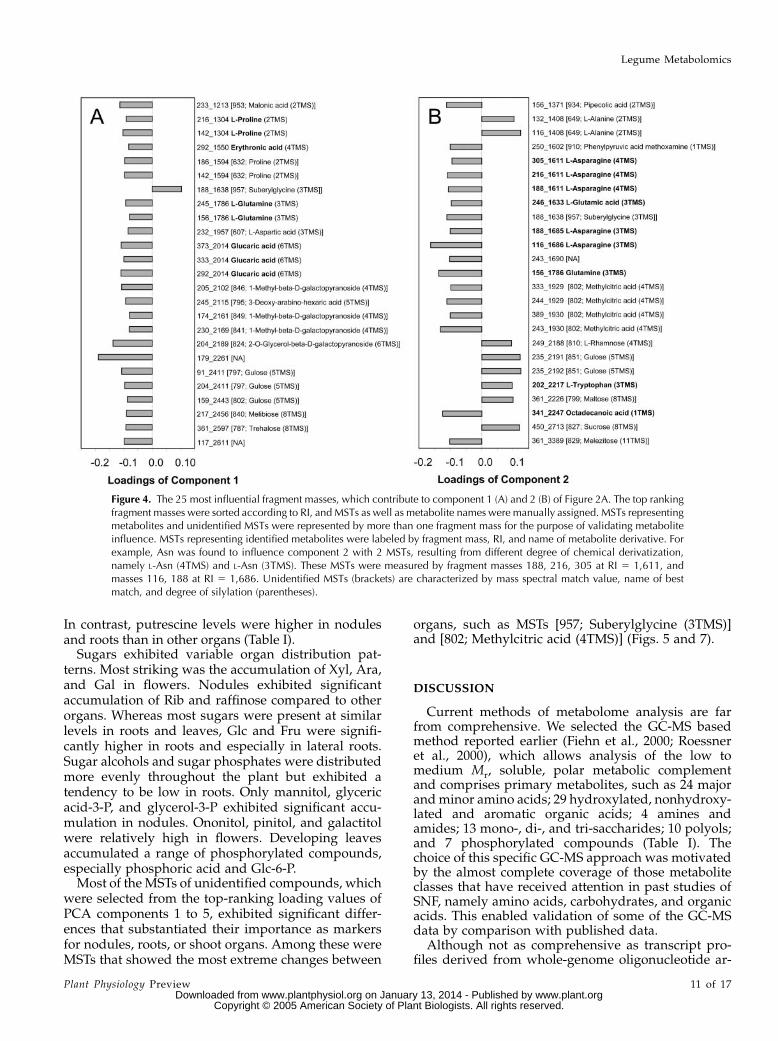
The contribution of each metabolite to a specificcomponent is reflected by the loading value derivedfrom PCA analysis. Those metabolites with highestloading values are indicated to have the strongestinfluence on the respective characteristics of a compo-nent. We focused on the loading values of components1 and 2 of experiment 1 (Fig. 2). The 25 most influentialfragment masses of each component were analyzed(Fig. 4, A and B). The first component, which describedthe root to shoot difference, was influenced mostby Pro, Gln, erythronic acid, and glucaric acid. Thesecond component, which revealed differences be-tween nodules and other organs, was influencedmost by Asn, Gln, Glu, Trp, and octadecanoic acid.Multiple MSTs of unidentified compounds were alsofound to contribute substantially to components 1 and2. We selected MST [802; Methylcitric acid (4TMS)]and an identified metabolite, glucaric acid, to demon-strate the possibility of gaining biological insight abouta compound, even if its chemical identity is unknown.The choice of these two compounds was made withreference to data from the second experiment de-scribed above (Fig. 3). Glucaric acid was found to beimportant for root and shoot distinction: fragmentmasses 292, 333, and 373 at RI 2,014 (Fig. 3B). Theunknown MST [802; Methylcitric acid (4TMS)] wasalso found to be a reproducible marker of nodules:fragment 243 at RI 1,929 (Fig. 3B).
Further Analysis of an Unidentified Metabolite
MST [802; Methylcitric acid (4TMS)], as the nomen-clature indicates, was found to be highly similar toa typical bacterial metabolite, 2-methylcitric acid. Thismatch was found in the commercially availableNIST02 mass spectral library (Ausloos et al., 1999). Incontrast, glucaric acid was immediately identified bymass spectral match with a custom set of replicate
Desbrosses et al.
8 of 17 Plant Physiology Preview www.plant.org on January 13, 2014 - Published by www.plantphysiol.orgDownloaded from
Copyright © 2005 American Society of Plant Biologists. All rights reserved.

mass spectra (match value5 944 to 989) and by low RIdeviation (DRI 5 0.3 to 0.5), as described in (Wagneret al., 2003). Typical mass spectra of both compoundscontained fragment masses that were used for quan-tification (Fig. 5A). In an attempt to identify theunknown MST, standard addition experiments wereperformed with commercially available DL-2-methyl-citric acid. This compound generated an MST withmass spectral similarity (match value 5 779) but highRI deviation (DRI 5 89.0). Thus, we confirmed bysimilarity that MST [802; Methylcitric acid (4TMS)]belongs to the class of methylcitric acids, but wecannot currently define the specific structural positionof the methyl group. In addition, we were able toidentify true DL-2-methylcitric acid by RI and massspectral match (700 to 842 and DRI 5 0.2 to 0.6) witha hitherto unknown MST from the custom MS and RIlibrary of L. japonicus (Colebatch et al., 2004).
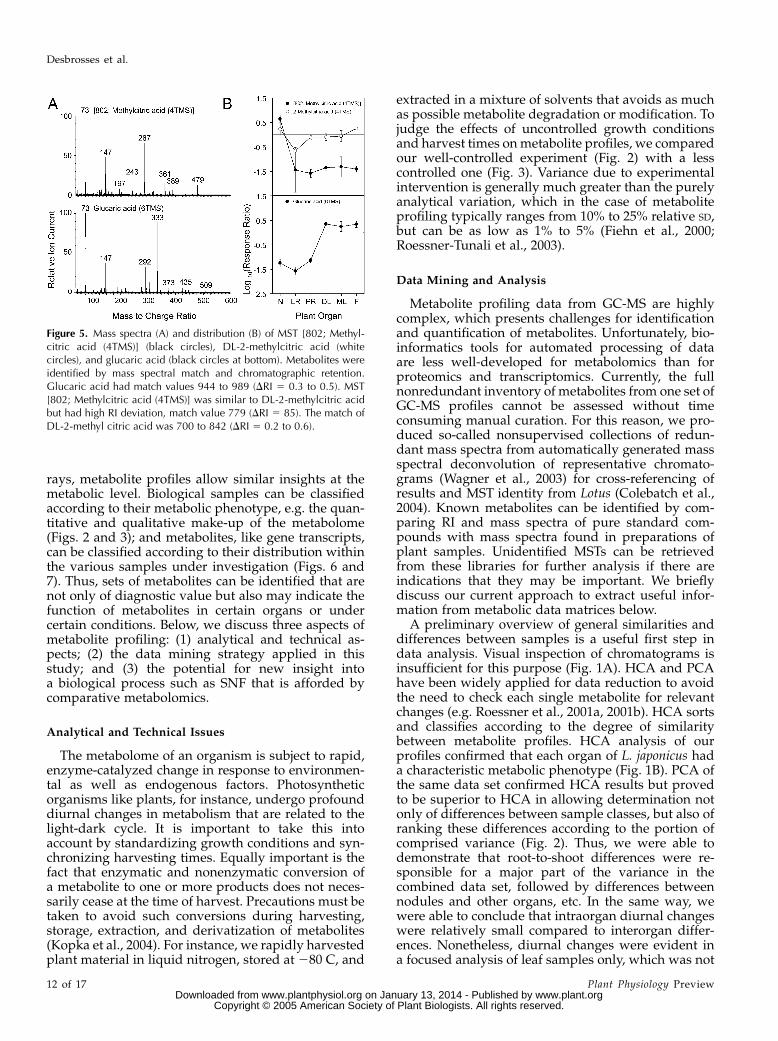
Despite the lack of a specific structure for MST [802;Methylcitric acid (4TMS)], we investigated the distri-bution pattern of the underlying metabolite in Lotusorgans (Fig. 5B). MST [802; Methylcitric acid (4TMS)]was found at high levels in nodule samples, while allother organs contained only traces of this compound.In contrast, DL-2-methylcitric acid was relatively highin nodules and flowers but low in lateral roots (Fig.5B). These results indicate MST [802; Methylcitric acid(4TMS)] is a good marker substance for nodules, whileDL-2-methylcitric acid is more evenly distributedthroughout the plant. Furthermore, we found glucaricacid to be low in roots and nodules but high in leavesand flowers. Thus, this compound was confirmed asa good marker for shoot organs.
Analysis of Metabolite Distribution Patterns
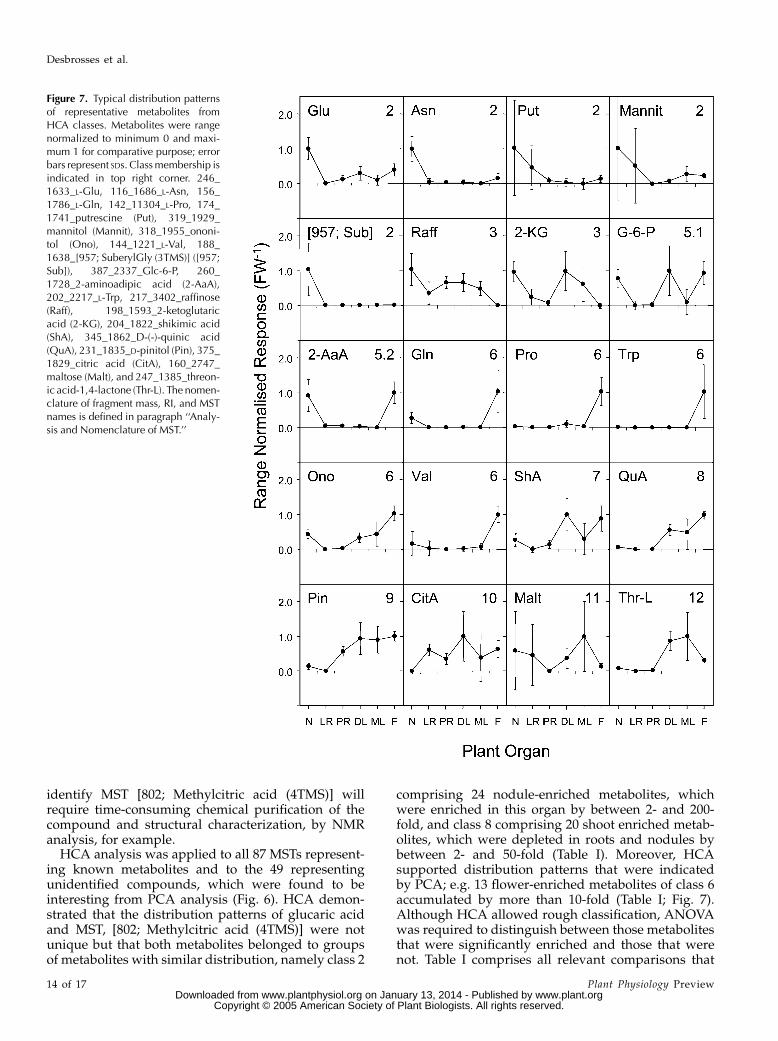
As illustrated in Figure 5B, metabolites were foundto exhibit specific distribution patterns in the organs ofLotus. We applied HCA to the MST distribution of all87 identified and 49 unidentified compounds thatwere among the top 25 most discriminatory fromPCA analysis (Figs. 1 and 4). Only one mass fragmentwas used for each MST in this analysis. FollowingHCA, we grouped the MSTs into 12 classes (Fig. 6).Two of the classes, 1 and 4, were occupied by knownlaboratory contaminants and were excluded from fur-ther analysis. The properties of the remaining 10 classeswere investigated further (Fig. 7).
Class 2 contained metabolites that were present atrelatively high levels in nodules and at low or in-termediate levels in other organs. MST [802; Methyl-citric acid (4TMS)], like Glu, Asn, putrescine, andmannitol, were characteristic members of this class.Class 3 compounds, with relatively high levels in
Figure 2. PCA analysis of GC-MS profiles, which represent polarmetabolites of L. japonicus organs harvested in the course of 1 d at 12weeks after germination. Samples were projected into three bi-plots ofprincipal components that were arranged in descending order ofvariance. Each of the first five principal components allowed cleardistinction of metabolite profiles from specific organs. Component 1separated root from shoot organs, component 2 described thedifference of nodules as compared to plant organs, and components3 to 5 described the distinction of flowers, primary roots, anddeveloping leaves from the remainder of the samples. LR, Lateral
roots (n 5 15); PR, primary roots (n 5 10); F, flowers (n 5 8); DL,developing leaves (n 5 10); ML, mature leaves (n 5 10); and N,nodules (n 5 10).
Legume Metabolomics
Plant Physiology Preview 9 of 17 www.plant.org on January 13, 2014 - Published by www.plantphysiol.orgDownloaded from
Copyright © 2005 American Society of Plant Biologists. All rights reserved.

nodules and leaves, had only 2 members, raffinose and2-ketoglutaric acid. Class 5, which had high levels innodules and flowers, comprised DL-2-methylcitricacid and 10 other compounds, including Glc-6-P and
2-aminoadipic acid. Class 6 was the dominant metab-olite class and comprised metabolites with high levelsin flowers only, for example Pro, Val, Trp, ononitol,and Gln. Classes 7 and 8 were similar and containedmetabolites enriched in shoot organs, such as glucaricacid. However, class 8 contained metabolites that hadhigh levels in all above-ground organs, while class 7metabolites had reduced levels in mature leaves. Class9 metabolites exhibited relatively high levels in shootorgans and in primary roots. Class 10 containedmetabolites with low levels in nodules only. Class 11and 12 metabolites exhibited high levels in matureleaves. While metabolites of class 12 were also presentat high levels in developing leaves, class 11 metaboliteshad only low or medium levels in other organs.Detailed information on the class membership of eachMST, together with short descriptions of each class, isincluded in Table I.
ANOVA
PCA analysis pointed to metabolites that may beimportant for organ differentiation. Metabolite clus-tering by HCA resulted in a rough overview of generalmetabolite distribution patterns. As an extension tothese analyses, ANOVAwas used to assess the statis-tical significance of differences in the distribution ofeach metabolite. Seven comparisons of organs andgroups of organs were performed. These comparisonsweremotivated by sample classificationsmade evidentby PCA analysis: (1) comparison of nodule with allother plant samples; (2) comparison of nodulewith rootsamples; (3) comparison of below-ground with above-ground samples; (4) comparison of root samples withshoot, including flower samples; (5) comparison offlower samples with all other samples; (6) comparisonof lateral and primary roots; and (7) comparison ofdeveloping and mature leaves. Differences in metabo-lite levels were calculated as ratios and compiled inTable I. Differences in metabolite levels that weresignificant at P # 0.01 are indicated in the table.
Amino acids exhibited two major sites of accumu-lation: nodules and flowers. Asn, homoSer, Glu, andCys levels were significantly higher in nodules than inother organs (Table I). In contrast, most other aminoacids, especially Trp, Pro, Leu, Val and Gln, wereenriched in flowers. Most amino acids were present athigher levels in leaves than in roots. Developing leavescontained higher concentrations of most amino acidsthan mature leaves, although most differences werenot significant.
Only 4 identified organic acids accumulated signif-icantly in nodules compared to all other organs:octadecanoic acid, threonic acid, gluconic acid, and2-methylcitric acid. Like amino acids, most organicacids were present at significantly lower levels in rootsthan in leaves. Some organic acids, for example GlcUAand quinic acid, were highly enriched in flowers. Mas-sive accumulation of the N-containing compounds,uric acid, allantoin, and ureawas also found in flowers.
Figure 3. PCA analysis of a second set of GC-MS profiles, whichrepresent polar metabolites of L. japonicus organs that were harvestedin the course of a 6-month period at random stages 7 to 17 weeks aftergermination. PCA analysis of this data set confirmed dominatinginfluence of the root-to-shoot differentiation on the variance observedin GC-MS profiles. In addition, nodule-to-plant differences were de-tectable in the sample scores plot (A). Loadings analysis (B) confirmedimportance of glucaric acid, represented by fragment masses 292, 333,373 at RI 5 2,014 for component 1 and importance of MST [802;Methylcitric acid (4TMS)], represented by fragment mass 243 at RI 52,014, for component 4. Use of fragments may change from data set todata set, because changes in metabolite levels cause fragments of lowabundance to drop below detection limits.
Desbrosses et al.
10 of 17 Plant Physiology Preview www.plant.org on January 13, 2014 - Published by www.plantphysiol.orgDownloaded from
Copyright © 2005 American Society of Plant Biologists. All rights reserved.
In contrast, putrescine levels were higher in nodulesand roots than in other organs (Table I).Sugars exhibited variable organ distribution pat-
terns. Most striking was the accumulation of Xyl, Ara,and Gal in flowers. Nodules exhibited significantaccumulation of Rib and raffinose compared to otherorgans. Whereas most sugars were present at similarlevels in roots and leaves, Glc and Fru were signifi-cantly higher in roots and especially in lateral roots.Sugar alcohols and sugar phosphates were distributedmore evenly throughout the plant but exhibited atendency to be low in roots. Only mannitol, glycericacid-3-P, and glycerol-3-P exhibited significant accu-mulation in nodules. Ononitol, pinitol, and galactitolwere relatively high in flowers. Developing leavesaccumulated a range of phosphorylated compounds,especially phosphoric acid and Glc-6-P.Most of the MSTs of unidentified compounds, which
were selected from the top-ranking loading values ofPCA components 1 to 5, exhibited significant differ-ences that substantiated their importance as markersfor nodules, roots, or shoot organs. Among these wereMSTs that showed the most extreme changes between
organs, such as MSTs [957; Suberylglycine (3TMS)]and [802; Methylcitric acid (4TMS)] (Figs. 5 and 7).
DISCUSSION
Current methods of metabolome analysis are farfrom comprehensive. We selected the GC-MS basedmethod reported earlier (Fiehn et al., 2000; Roessneret al., 2000), which allows analysis of the low tomedium Mr, soluble, polar metabolic complementand comprises primary metabolites, such as 24 majorandminor amino acids; 29 hydroxylated, nonhydroxy-lated and aromatic organic acids; 4 amines andamides; 13 mono-, di-, and tri-saccharides; 10 polyols;and 7 phosphorylated compounds (Table I). Thechoice of this specific GC-MS approach was motivatedby the almost complete coverage of those metaboliteclasses that have received attention in past studies ofSNF, namely amino acids, carbohydrates, and organicacids. This enabled validation of some of the GC-MSdata by comparison with published data.
Although not as comprehensive as transcript pro-files derived from whole-genome oligonucleotide ar-
Figure 4. The 25 most influential fragment masses, which contribute to component 1 (A) and 2 (B) of Figure 2A. The top rankingfragment masses were sorted according to RI, and MSTs as well as metabolite names were manually assigned. MSTs representingmetabolites and unidentified MSTs were represented by more than one fragment mass for the purpose of validating metaboliteinfluence. MSTs representing identified metabolites were labeled by fragment mass, RI, and name of metabolite derivative. Forexample, Asn was found to influence component 2 with 2 MSTs, resulting from different degree of chemical derivatization,namely L-Asn (4TMS) and L-Asn (3TMS). These MSTs were measured by fragment masses 188, 216, 305 at RI 5 1,611, andmasses 116, 188 at RI 5 1,686. Unidentified MSTs (brackets) are characterized by mass spectral match value, name of bestmatch, and degree of silylation (parentheses).
Legume Metabolomics
Plant Physiology Preview 11 of 17 www.plant.org on January 13, 2014 - Published by www.plantphysiol.orgDownloaded from
Copyright © 2005 American Society of Plant Biologists. All rights reserved.
rays, metabolite profiles allow similar insights at themetabolic level. Biological samples can be classifiedaccording to their metabolic phenotype, e.g. the quan-titative and qualitative make-up of the metabolome(Figs. 2 and 3); and metabolites, like gene transcripts,can be classified according to their distribution withinthe various samples under investigation (Figs. 6 and7). Thus, sets of metabolites can be identified that arenot only of diagnostic value but also may indicate thefunction of metabolites in certain organs or undercertain conditions. Below, we discuss three aspects ofmetabolite profiling: (1) analytical and technical as-pects; (2) the data mining strategy applied in thisstudy; and (3) the potential for new insight intoa biological process such as SNF that is afforded bycomparative metabolomics.
Analytical and Technical Issues
The metabolome of an organism is subject to rapid,enzyme-catalyzed change in response to environmen-tal as well as endogenous factors. Photosyntheticorganisms like plants, for instance, undergo profounddiurnal changes in metabolism that are related to thelight-dark cycle. It is important to take this intoaccount by standardizing growth conditions and syn-chronizing harvesting times. Equally important is thefact that enzymatic and nonenzymatic conversion ofa metabolite to one or more products does not neces-sarily cease at the time of harvest. Precautions must betaken to avoid such conversions during harvesting,storage, extraction, and derivatization of metabolites(Kopka et al., 2004). For instance, we rapidly harvestedplant material in liquid nitrogen, stored at 280 C, and
extracted in a mixture of solvents that avoids as muchas possible metabolite degradation or modification. Tojudge the effects of uncontrolled growth conditionsand harvest times onmetabolite profiles, we comparedour well-controlled experiment (Fig. 2) with a lesscontrolled one (Fig. 3). Variance due to experimentalintervention is generally much greater than the purelyanalytical variation, which in the case of metaboliteprofiling typically ranges from 10% to 25% relative SD,but can be as low as 1% to 5% (Fiehn et al., 2000;Roessner-Tunali et al., 2003).
Data Mining and Analysis
Metabolite profiling data from GC-MS are highlycomplex, which presents challenges for identificationand quantification of metabolites. Unfortunately, bio-informatics tools for automated processing of dataare less well-developed for metabolomics than forproteomics and transcriptomics. Currently, the fullnonredundant inventory of metabolites from one set ofGC-MS profiles cannot be assessed without timeconsuming manual curation. For this reason, we pro-duced so-called nonsupervised collections of redun-dant mass spectra from automatically generated massspectral deconvolution of representative chromato-grams (Wagner et al., 2003) for cross-referencing ofresults and MST identity from Lotus (Colebatch et al.,2004). Known metabolites can be identified by com-paring RI and mass spectra of pure standard com-pounds with mass spectra found in preparations ofplant samples. Unidentified MSTs can be retrievedfrom these libraries for further analysis if there areindications that they may be important. We brieflydiscuss our current approach to extract useful infor-mation from metabolic data matrices below.
A preliminary overview of general similarities anddifferences between samples is a useful first step indata analysis. Visual inspection of chromatograms isinsufficient for this purpose (Fig. 1A). HCA and PCAhave been widely applied for data reduction to avoidthe need to check each single metabolite for relevantchanges (e.g. Roessner et al., 2001a, 2001b). HCA sortsand classifies according to the degree of similaritybetween metabolite profiles. HCA analysis of ourprofiles confirmed that each organ of L. japonicus hada characteristic metabolic phenotype (Fig. 1B). PCA ofthe same data set confirmed HCA results but provedto be superior to HCA in allowing determination notonly of differences between sample classes, but also ofranking these differences according to the portion ofcomprised variance (Fig. 2). Thus, we were able todemonstrate that root-to-shoot differences were re-sponsible for a major part of the variance in thecombined data set, followed by differences betweennodules and other organs, etc. In the same way, wewere able to conclude that intraorgan diurnal changeswere relatively small compared to interorgan differ-ences. Nonetheless, diurnal changes were evident ina focused analysis of leaf samples only, which was not
Figure 5. Mass spectra (A) and distribution (B) of MST [802; Methyl-citric acid (4TMS)] (black circles), DL-2-methylcitric acid (whitecircles), and glucaric acid (black circles at bottom). Metabolites wereidentified by mass spectral match and chromatographic retention.Glucaric acid had match values 944 to 989 (DRI 5 0.3 to 0.5). MST[802; Methylcitric acid (4TMS)] was similar to DL-2-methylcitric acidbut had high RI deviation, match value 779 (DRI 5 85). The match ofDL-2-methyl citric acid was 700 to 842 (DRI 5 0.2 to 0.6).
Desbrosses et al.
12 of 17 Plant Physiology Preview www.plant.org on January 13, 2014 - Published by www.plantphysiol.orgDownloaded from
Copyright © 2005 American Society of Plant Biologists. All rights reserved.

presented here because the low number of replicationsper time point prohibited statistical rigor. Anotheradvantage of PCA over HCA is the possibility toderive a list of metabolites that contribute to eachprincipal component. If principal components sepa-rate different sample groups, e.g. components 1 and 2that separate nodules from all other organs (Fig. 2),a rank-ordered list of MSTs representing known andunknown compounds that distinguish between thegroups can be obtained (Fig. 4). In this way, weidentified 136 MSTs from among the initial 500 MSTs,representing 87 known and 49 unknown compounds,which distinguished between sample groups. Obvi-ously, such a list also provides insight into the meta-bolic differences between distinct sample groups suchas organs. Thus, by identifying the most strikingfeatures of a profiling data set, PCA is an efficient firststep of the data mining process.
From the set of 136 MSTs that were identified byPCA to have potential diagnostic properties, we se-lected 2 MSTs representing a known (glucaric acid)and an unknown compound [802; Methylcitric acid(4TMS)] for further analysis (Fig. 5A). Validation of thediagnostic value of these metabolites was performedvia PCA analysis of a second experiment, in whichplants were grown under more variable conditions.Once again, both compounds were among the mostinfluential metabolites separating root from shoot, androot from nodule samples, respectively (Fig. 3B). Asubsequent analysis of the distribution pattern (Fig. 5)clearly supported the diagnostic properties of theselected compounds. After having established com-pound relevance we manually confirmed compoundidentity for glucaric acid and found mass spectralsimilarity of MST [802; Methylcitric acid (4TMS)] tomethylcitric acid. Subsequent standard addition ex-periments with commercially available DL-2-methyl-citric acid confirmed this similarity. As a by-product ofthis work, we discovered true DL-2-methylcitric acidamong the MSTs of unidentified compounds and wereable to add this novel identification and its distributionpattern to the set of fully characterized MSTs (Fig. 5B).In the absence of additional commercially availablecandidate reference substances, further attempts to
Figure 6. HCA analysis of metabolite and MST distribution in L.japonicus organs. HCA sorts and classifies metabolites according totheir distribution pattern. Twelve classes were identified manually(broken lines). Classes 1 and 4 comprised typical laboratory contam-inations and allowed to exclude one MST, fragment 281 at RI 5 1,837,
from further analysis. Class membership and descriptions may be foundin Table I. Typical examples of metabolite distributions are presented inFigure 7. Cluster descriptions are as follows.2: N (high), F (low-high), others (low)3: N, DL, ML (high), others (low-high)5: N, F (high), others (low-high)6: F (high), others (low-medium)7: Root (low), DL, F (high), ML (medium)8: Root (low), Shoot (high)9: N (low), LR (low), others (medium-high)10: N (low), others (medium-high)11: ML (high), others (low-medium)12: ML (high), DL (medium-high), F, Root (low-medium)1: Test for solvent contamination4: test for reagent artifact.
Legume Metabolomics
Plant Physiology Preview 13 of 17 www.plant.org on January 13, 2014 - Published by www.plantphysiol.orgDownloaded from
Copyright © 2005 American Society of Plant Biologists. All rights reserved.
identify MST [802; Methylcitric acid (4TMS)] willrequire time-consuming chemical purification of thecompound and structural characterization, by NMRanalysis, for example.
HCA analysis was applied to all 87 MSTs represent-ing known metabolites and to the 49 representingunidentified compounds, which were found to beinteresting from PCA analysis (Fig. 6). HCA demon-strated that the distribution patterns of glucaric acidand MST, [802; Methylcitric acid (4TMS)] were notunique but that both metabolites belonged to groupsof metabolites with similar distribution, namely class 2
comprising 24 nodule-enriched metabolites, whichwere enriched in this organ by between 2- and 200-fold, and class 8 comprising 20 shoot enriched metab-olites, which were depleted in roots and nodules bybetween 2- and 50-fold (Table I). Moreover, HCAsupported distribution patterns that were indicatedby PCA; e.g. 13 flower-enriched metabolites of class 6accumulated by more than 10-fold (Table I; Fig. 7).Although HCA allowed rough classification, ANOVAwas required to distinguish between those metabolitesthat were significantly enriched and those that werenot. Table I comprises all relevant comparisons that
Figure 7. Typical distribution patternsof representative metabolites fromHCA classes. Metabolites were rangenormalized to minimum 0 and maxi-mum 1 for comparative purpose; errorbars represent SDs. Classmembership isindicated in top right corner. 246_1633_L-Glu, 116_1686_L-Asn, 156_1786_L-Gln, 142_11304_L-Pro, 174_1741_putrescine (Put), 319_1929_mannitol (Mannit), 318_1955_ononi-tol (Ono), 144_1221_L-Val, 188_1638_[957; SuberylGly (3TMS)] ([957;Sub]), 387_2337_Glc-6-P, 260_1728_2-aminoadipic acid (2-AaA),202_2217_L-Trp, 217_3402_raffinose(Raff), 198_1593_2-ketoglutaricacid (2-KG), 204_1822_shikimic acid(ShA), 345_1862_D-(-)-quinic acid(QuA), 231_1835_D-pinitol (Pin), 375_1829_citric acid (CitA), 160_2747_maltose (Malt), and 247_1385_threon-ic acid-1,4-lactone (Thr-L). The nomen-clature of fragment mass, RI, and MSTnames is defined in paragraph ‘‘Analy-sis and Nomenclature of MST.’’
Desbrosses et al.
14 of 17 Plant Physiology Preview www.plant.org on January 13, 2014 - Published by www.plantphysiol.orgDownloaded from
Copyright © 2005 American Society of Plant Biologists. All rights reserved.
were performed and demonstrates a multitude ofsignificant metabolite enrichments with factors .10-fold or ,0.1-fold.
Nodule Metabolism: Some Insights fromGC-MS Analysis
PCA analysis revealed that many compounds wereenriched in nodules compared to other plant organs,including Asn, Glu, Gln, homoSer, Cys, putrescine,mannitol, threonic acid, gluconic acid, glyceric acid-3-P, glycerol-3-P, and octadecanoic acid. Some of thesedifferences were expected and confirm what is knownabout nodulemetabolism. For instance, SNF is a sourceof ammonium for amino acid biosynthesis and manylegumes, including Lotus export fixed nitrogen in theform of amines, especially Asn and Gln (Vance et al.,1987). Therefore, it was reassuring to find these aminoacids at higher levels in nodules than in roots or in theplant as a whole (Table I). In a similar vein, it is knownthat glycolysis is enhanced in nodules compared toroots (Copeland et al., 1989; Day and Copeland, 1991),and this was reflected by the ratio of hexoses to hexose-phosphates in these organs. The relative abundance ofboth Fru-6-P and Glc-6-P were about 5 times higher innodules than in roots, while Fru and Glc were muchlower in nodules than in roots. These changes areindicative of increased flux through glycolysis (Roess-ner et al., 2001; Fernie et al., 2002), even thoughmetabolite levels per se are not a directmeasure of flux.A number of compatible solutes, which typically
accumulate in plants in response to osmotic stress,were found to be elevated in nodules compared toroots and other organs. These included the polyols,ononitol, mannitol, and sorbitol; the amino acid, Pro;and the polyamine, putrescine (Table I). Accumulationof osmoprotectants in nodules may indicate that cellsin this organ are subject to osmotic stress. Hypoxia,which can cause osmotic stress in plant cells via effectson water uptake and loss (Nuccio et al., 1999), could beresponsible for this build-up of compatible solutes.Interestingly, genes encoding putative mannitol trans-porters are among those induced during nodule de-velopment (Fedorova et al., 2002; Colebatch et al.,2004), and these may be involved in importing polyolsderived from photosynthesis in the shoot (Noiraudet al., 2001). On the other hand, a proteomic study ofthe Lotus identified a putative mannitol transporter onisolated peribacteroid membrane/SM (Wienkoop andSaalbach, 2003), which indicates that polyols may betransported between the plant and bacteroids. Sorbitoldehydrogenase, which interconverts D-Fru and D-sor-bitol, is induced in nodules (Colebatch et al., 2004),indicating that de novo synthesis of polyols may alsooccur in this organ. Genes involved in Pro and poly-amine biosynthesis are also induced during noduledevelopment, which could account for accumulationof these compounds (Colebatch et al., 2004; Flemetakiset al., 2004). While this data may indicate that osmoticstress is a normal aspect of nodule physiology, a more
trivial explanation would be that our sand-grownplants were generally water-stressed at the time ofharvest. However, this explanation is at odds with theobservation that roots contained significantly lowerlevels of specific compatible solutes than did nodulesof the same plants.
Relatively high levels of Cys were found in nodules(Table I), which is unusual for plant tissues. Two genesencoding Cys synthases were found to be expressedat higher levels in nodules than in roots of Lotus(Colebatch et al., 2004), which could contribute toelevated Cys levels. It is also noteworthy that severalgenes for sulfate transporters, which presumably de-liver substrate for sulfur metabolism, are highly in-duced during Lotus nodule development (Colebatchet al., 2002, 2004).
While it is not possible to gauge from our GC-MSdata the separate contribution that bacteroids make tomost metabolite pools, some of the unusual and un-identified compounds that accumulate in nodules, e.g.[802; Methylcitric acid (4TMS)], may be exclusivelybacterial products (Table I). Elucidation of the struc-tures of these compounds and their biosynthetic originwill undoubtedly lead to a better understanding ofnodule metabolism and the metabolic interactionsbetween legumes and rhizobia. Another importantarea for future work is metabolic flux determination innodules. The data presented here give a static pictureof metabolite levels averaged over whole organs andprovide little insight into metabolic compartmentationor flux though specific pathways. Nonetheless, theresources developed during this project, e.g. MSTlibraries, will provide a firm basis upon which tobuild such studies in the future.
MATERIAL AND METHODS
Biological Material, Plant Growth, and Harvesting
Lotus japonicus cv. GIFU seeds were scarified 3 3 10 s in liquid nitrogen,
sterilized 10 min in 2% bleach solution, rinsed 5 times with sterile distillated
water, and moved to a petri dish with filter paper soaked in B&D medium
(Broughton and Dilworth, 1971). After germination in a phytotron set to 25�Cand a 16-/8-h day/night cycle, 3-d-old seedlings were transferred to pots, 5
plants each pot, containing coarse quartz sand. Inoculation was performed
with Mesorhizobium loti strain R7A. Inoculated plants were grown in a green-
house with a 16-/8-h day/night cycle, 60% relative humidity, a 21�C/17�Cday/night temperature regime, and 1 watering/d with B&D medium.
Two sets of experiments were performed. The first set comprised plant
material harvested 12 weeks after germination in the course of 1 diurnal cycle,
at 2, 8, and 14 hwithin the light cycle and at 2, 4, and 6 h during the dark period,
respectively.While the diurnal changeswere not a topic of this investigation, an
equal representation of all diurnal stages was generated for a nonbiased organ-
to-organ comparison. A second set of experimentswas performed in the course
of 6 months, early summer to winter. Samples were taken randomly in the
middle of the light cycle at different developmental stages, 7 to 17 weeks after
germination. Plants were cultivated either in an open pot or a closed glass jar.
This experimental set was expected to be highly variable but allowed to verify
persistentmetabolic features ofL. japonicusorgans.At eachharvest, plantswere
carefully pulled from the quartz sand and a complete set of six organ samples
prepared by immediate shock freezing in liquid nitrogen, i.e. nodules, lateral
and primary root, mature and developing leaves, and flowers. Leaves were
separated according tomorphological criteria into a groupof young expanding
leaves from the apex of the plant and a group of mature fully expanded leaves
Legume Metabolomics
Plant Physiology Preview 15 of 17 www.plant.org on January 13, 2014 - Published by www.plantphysiol.orgDownloaded from
Copyright © 2005 American Society of Plant Biologists. All rights reserved.
from the middle of the plant shoot. Senescent leaves were discarded. Whole
flowers were prepared including all floral organs, petals, sepals, carpels,
stamen, and pollen. Lateral roots without visible nodule primordia were
collected, followed by pink nodules sampled in a representative range of
various sizes. The harvest was completed by preparing the primary root, i.e.
2 cm of the main root directly below the hypocotyl. Only samples without
nodules and lateral roots were collected. Primary rootmaterial had to be sliced
before shock freezing to improve subsequent grinding under liquid nitrogen.
Sampleswere stored for amaximumof 4weeks at280�Cuntil GC-MS analysis.
GC-MS Metabolite Profiling of Polar Metabolites
Frozen samples of 25 to 50 mg fresh weight were ground for 2 min in 2-mL
micro vials with a clean stainless steel metal ball (5-mm diameter) using a ball
mill grinder (MM200, Retsch, Haan, Germany) set to 30 cycles/s. All material
was thoroughly precooled in liquid nitrogen. Frozen powder was extracted
with hot MeOH/CHCl3 and the fraction of polar metabolites prepared by
liquid partitioning into water as described earlier (Wagner et al., 2003;
Colebatch et al., 2004). Samples were analyzed by GC-MS using a quadrupole
type GC-MS system (MD800, ThermoQuest, Manchester, UK). Ribitol, iso-
ascorbic acid, and deuterated Ala were added for internal standardization.
Metabolite samples were derivatized bymethoxyamination using a 20- mg/mL
solution of methoxyamine hydrochloride in pyridine and subsequent tri-
methylsilylation with N-methyl-N-(trimethylsilyl)-trifluoroacetamide (Fiehn
et al., 2000; Roessner et al., 2000). A C12, C15, C19, C22, C28, C32, C36 n-alkane
mixture was used for the determination of RIs. Details of GC-MS analysis
were published previously (Colebatch et al., 2004).
MST Definition and Concept
MSTs are defined as full mass spectra obtained from GC-MS chromato-
grams. MSTs are described by chromatographic retention, for example RI, and
mass spectrum, i.e. a set of fragments that are characterized by m/z and
relative fragment intensity and normalized to the most abundant fragment of
the MS. MSTs represent chemical derivatives of metabolites or metabolites
that are not derivatized. MSTs of unidentified compounds can be identified in
later experiments by exploiting the above characteristics in standard addition
experiments of pure reference substances to the complex biological matrix of
interest.
Eachmass fragment that belongs to oneMSTcan be used for quantification,
and we name these fragments through combination of a single m/z and RI
from the MST: for example, fragment 279_2758 below. The best fragment for
quantification is generally the most abundant one. However, since metabolite
profiles comprise hundreds of MSTs of identified and unidentified com-
pounds, mass fragments need to be highly selective. Because metabolite
profiles may contain unexpected, novel MSTs, we analyze multiple fragments
per MSTs. If all fragments of one MST exhibit the same relative change, we
automatically select the most abundant fragment for quantification. If frag-
ment ratios exhibit discrepancies, we manually overrule the automatic choice
and select the next best specific fragment for quantification.
MST Identifications and Test for Artifacts
Reference substances for standard addition experiments were from Sigma-
Aldrich (Schnelldorf, Germany) except for DL-2-methylcitric acid, which was
obtained from C/D/N Isotopes (Pointe-Claire, Quebec, Canada). Lactic acid
and benzoic acid were laboratory contaminations as was oligomethyl-
cyclosiloxane, monitored by mass fragment 279_2758. This compound was
a chemical artifact caused by the N-methyl-N-(trimethylsilyl)-trifluoroaceta-
mide reagent. Mass spectra were analyzed by AMDIS software (http://
chemdata.nist.gov/mass-spc/amdis/; National Institute of Standards and
Technology) and compared with commercial and user libraries in NIST02
format (http://chemdata.nist.gov/mass-spc/Srch_v1.7/index.html; National
Institute of Standards and Technology). L. japonicus MSTs are made available
via the Internet at the CSB.DB resource (http://csbdb.mpimp-golm.mpg.de/
gmd.html).
Generation of a Metabolite Response Matrix
We manually selected one or more specific mass fragments and corre-
sponding retention time windows for identified and still unidentified MSTs
from L. japonicus. The find algorithm of the MassLab 1.4v software (Thermo-
Quest, Manchester, UK) was used to automatically retrieve peak areas and
chromatographic retention from GC-MS metabolite profiles. Peak identifica-
tion and area integration was manually supervised as described above. Peak
areas with low intensity were rejected.
In accordance with Colebatch et al. (2004) peak areas, X, were defined to
represent the fragment responses (Xi of fragment i). Fragment responses were
normalized by fresh weight of the sample and response of the internal
standard, ribitol, (Ni 5 Xi 3 Xribitol-1 3 fresh weight21). This procedure
corrects pipette errors and slight differences in sample amount. The relative
response of a fragment is defined relative to the average normalized response
of all tissue samples (Ri 5 Ni 3 avgN21), namely the average response of
flower, nodule, developing leaf, mature leaf, primary root, and lateral root
samples.
Statistical Analysis
PCA was performed after log10 transformation of the relative responses,
log10(Ri). Missing values were either manually replaced, in the case of
identified MSTs, or defined as average of the respective sample group after
log10 transformation. If no response was retrievable for any of the samples of
a specific organ, log10(Ri) 5 0 was substituted for PCA analysis. HCA was
applied to classify MSTs, which represented identified metabolites and
a selection of unidentified metabolites, according to their relative abundance
in different organs. For this purpose, average normalized responses (avgNi)
were calculated of each MST and organ. Missing data were substituted by the
normalized response at detection limit. HCA was performed after range
normalization using Euclidian distance and average linkage. All procedures
including ANOVA and visualization were performed with EXCEL software
and the S-Plus 2000 software package standard edition release 3 (Insightful,
Berlin Germany), and multivariate and cluster analysis was essentially as
reported earlier (Colebatch et al., 2004).
ACKNOWLEDGMENTS
The authors thank Nicole Gatzke, Cornelia Wagner, and Katrin Bieberich
for their patient assistance and technical expertise. The authors greatly
appreciate Dr. Andreas Richter (Institute of Ecology and Conservation
Biology, Vienna, Austria) for making pinitol and ononitol available for
GC-MS standard addition experiments.
Received October 20, 2004; returned for revision December 8, 2004; accepted
December 12, 2004.
LITERATURE CITED
Appleby CA (1984) Leghemoglobin and rhizobium respiration. Annu Rev
Plant Physiol Plant Mol Biol 35: 443–478
Ausloos P, Clifton CL, Lias SG, Mikaya AI, Stein SE, Tchekhovskoi DV,
Sparkman OD, Zaikin V, Zhu D (1999) The critical evaluation of
a comprehensive mass spectral library. J Am Soc Mass Spectrom 10:
287–299
Batut J, Boistard P (1994) Oxygen control in rhizobium. Antonie Leeu-
wenhoek J Microbiol Serol 66: 129–150
Brewin NJ (1991) Development of the legume root nodule. Annu Rev Cell
Biol 7: 191–226
Broughton WJ, Dilworth M (1971) Control of leghemoglobin synthesis in
snakes beans. Biochem J 125: 1075–1080
Chen F, Duran AL, Blount JW, Sumner LW, Dixon RA (2003) Profiling
phenolic metabolites in transgenic alfalfa modified in lignin biosynthe-
sis. Phytochemistry 64: 1013–1021
Colebatch G, Desbrosses G, Ott T, Krusell T, Montanari O, Kloska S,
Kopka J, Udvardi MK (2004) Global changes in transcription orches-
trate metabolic differentiation during symbiotic nitrogen fixation in
Lotus japonicus. Plant J 39: 487–512
Colebatch G, Kloska S, Trevaskis B, Freund S, Altmann T, Udvardi MK
(2002) Novel aspects of symbiotic nitrogen fixation uncovered by
transcript profiling with cDNA arrays. Mol Plant Microbe Interact 15:
411–420
Desbrosses et al.
16 of 17 Plant Physiology Preview www.plant.org on January 13, 2014 - Published by www.plantphysiol.orgDownloaded from
Copyright © 2005 American Society of Plant Biologists. All rights reserved.
Copeland L, Vella J, Hong ZQ (1989) Enzymes of carbohydrate-
metabolism in soybean nodules. Phytochemistry 28: 57–61
Day DA, Copeland L (1991) Carbon metabolism and compartmentation in
nitrogen-fixing legume nodules. Plant Physiol Biochem 29: 185–201
Doyle JJ, Luckow MA (2003) The rest of the iceberg. Legume diversity and
evolution in a phylogenetic context. Plant Physiol 131: 900–910
Duran AL, Yang J, Wang LJ, Sumner LW (2003) Metabolomics spectral
formatting, alignment and conversion tools (MSFACTs). Bioinformatics
19: 2283–2293
Fedorova M, van de Mortel J, Matsumoto PA, Cho J, Town CD,
VandenBosch KA, Gantt JS, Vance CP (2002) Genome-wide identifica-
tion of nodule-specific transcripts in the model legume Medicago trun-
catula. Plant Physiol 130: 519–537
Fernie AR, Tiessen A, Stitt M, Willmitzer L, Geigenberger P (2002)
Altered metabolic fluxes result from shifts in metabolite levels in
sucrose phosphorylase-expressing potato tubers. Plant Cell Environ
25: 1219–1232
Fiehn O (2002) Metabolomics: the link between genotypes and phenotypes.
Plant Mol Biol 48: 155–171
Fiehn O, Kopka J, Dormann P, Altmann T, Trethewey RN, Willmitzer L
(2000) Metabolite profiling for plant functional genomics. Nat Biotech-
nol 18: 1157–1161
Fischer HM (1996) Environmental regulation of rhizobial symbiotic nitro-
gen fixation genes. Trends Microbiol 4: 317–320
Flemetakis E, Efrose RC, Desbrosses G, Dimou M, Delis C, Aivalakis G,
Udvardi MK, Katinakis P (2004) Induction and spatial organization of
polyamine biosynthesis during nodule development in Lotus japonicus.
Mol Plant Microbe Interact 17: 1283–1293
Gardiol AE, Truchet GL, Dazzo FB (1987) Requirement of succinate
dehydrogenase activity for symbiotic bacteroid differentiation of
Rhizobium meliloti in alfalfa nodules. Appl Environ Microbiol 53:
1947–1950
Gordon AJ, Minchin FR, James CL, Komina O (1999) Sucrose synthase
in legume nodules is essential for nitrogen fixation. Plant Physiol 120:
867–878
Huhman DV, Sumner LW (2002) Metabolic profiling of saponins in
Medicago sativa and Medicago truncatula using HPLC coupled to an
electrospray ion-trap mass spectrometer. Phytochemistry 59: 347–360
Joliffe IT (1986) Principal Component Analysis. Springer-Verlag,
New York
Karoutis AI, Tyler RT, Slater GP (1992) Analysis of legume oligosacchar-
ides by high-resolution gas-chromatography. J Chromatogr 623: 186–
190
Khalil AH, Eladawy TA (1994) Isolation, identification and toxicity of
saponin from different legumes. Food Chem 50: 197–201
Kopka J, Fernie A, Weckwerth W, Gibon Y, Stitt M (2004) Metabolite
profiling in plant biology: platforms and destinations. Genome Biology
5: 109–117
Matamoros MA, Moran JF, Iturbe-Ormaetxe I, Rubio MC, Becana M
(1999) Glutathione and homoglutathione synthesis in legume root
nodules. Plant Physiol 121: 879–888
Miller SS, Driscoll BT, Gregerson RG, Gantt JS, Vance CP (1998) Alfalfa
malate dehydrogenase (MDH): molecular cloning and characterization
of five different forms reveals a unique nodule-enhanced MDH. Plant J
15: 173–184
Noiraud N, Maurousset L, Lemoine R (2001) Transport of polyols in higher
plants. Plant Physiol Biochem 39: 717–728
Nuccio ML, Rhodes D, McNeil SD, Hanson AD (1999) Metabolic engi-
neering of plants for osmotic stress resistance. Curr Opin Plant Biol 2:
128–134
Pathirana SM, Vance CP, Miller SS, Gantt JS (1992) Alfalfa root nodule
phosphoenolpyruvate carboxylase: characterization of the cDNA and
expression in effective and plant-controlled ineffective nodules. Plant
Mol Biol 20: 437–450
Polhill RM, Raven PH, Stirton CH (1981) Evolution and systematics of the
Leguminosae. In RM Polhill, PH Raven, eds, Advances in Legume
Systematics Part 1. Royal Botanic Gardens, Kew, UK pp 1–26
Robson RL, Postgate JR (1980) Oxygen and hydrogen in biological
nitrogen-fixation. Annu Rev Microbiol 34: 183–207
Roessner U, Luedemann A, Brust D, Fiehn O, Linke T, Willmitzer L,
Fernie AR (2001a) Metabolic profiling allows comprehensive pheno-
typing of genetically or environmentally modified plant systems. Plant
Cell 13: 11–29
Roessner U, Wagner C, Kopka J, Trethewey RN, Willmitzer L (2000)
Technical advance: simultaneous analysis of metabolites in potato tuber
by gas chromatography-mass spectrometry. Plant J 23: 131–142
Roessner U, Willmitzer L, Fernie AR (2001b) High-resolution metabolic
phenotyping of genetically and environmentally diverse potato tuber
systems. Identification of phenocopies. Plant Physiol 127: 749–764
Roessner-Tunali U, Hegemann B, Lytovchenko A, Carrari F, Bruedigam C,
Granot D, Fernie AR (2003) Metabolic profiling of transgenic tomato
plants overexpressing hexokinase reveals that the influence of hexose
phosphorylation diminishes during fruit development. Plant Physiol
133: 84–99
Ronson CW, Lyttleton P, Robertson JG (1981) C4-dicarboxylate transport
mutants of rhizobium trifolii form ineffective nodules on trifolium repens.
Proc Natl Acad Sci USA 78: 4284–4288
Roth E, Jeon K, Stacey G (1988) Homology in endosymbiotic systems: the
term ‘symbiosome’. In R Palacios, DPS Verma, eds, Molecular Genetics
of Plant-Microbe Interactions. American Phytopathological Society
Press, St. Paul, pp 220–225
Sciotti MA, Chanfon A, Hennecke H, Fischer HM (2003) Disparate oxygen
responsiveness of two regulatory cascades that control expression
of symbiotic genes in Bradyrhizobium japonicum. J Bacteriol 185:
5639–5642
Steele HL, Werner D, Cooper JE (1999) Flavonoids in seed and root
exudates of Lotus pedunculatus and their biotransformation by Meso-
rhizobium loti. Physiol Plant 107: 251–258
Stein SE (1999) An integrated method for spectrum extraction and
compound identification from gas chromatography/mass spectrometry
data. J Am Soc Mass Spectrom 10: 770–781
Streeter JG (1980) Carbohydrates in soybean nodules. II. Distribution of
compounds in seedlings during the onset of nitrogen fixation. Plant
Physiol 66: 471–476
Streeter JG (1987) Carbohydrate, organic acid and amino acid composition
of bacteroids and cytosol from soybean nodules. Plant Physiol 85:
768–773
Streeter JG, Bosler ME (1976) Carbohydrates in soybean nodules: identi-
fication of compounds and possible relationships to nitrogen fixation.
Plant Sci Lett 7: 321–329
Sumner LW, Mendes P, Dixon RA (2003) Plant metabolomics: large-scale
phytochemistry in the functional genomics era. Phytochemistry 62:
817–836
Tolstikov VV, Fiehn O (2002) Analysis of highly polar compounds of
plant origin: combination of hydrophilic interaction chromatography
and electrospray ion trap mass spectrometry. Anal Biochem 301: 298–
307
Tolstikov VV, Lommen A, Nakanishi K, Tanaka N, Fiehn O (2003)
Monolithic silica-based capillary reversed-phase liquid chromatogra-
phy/electrospray mass spectrometry for plant metabolomics. Anal
Chem 75: 6737–6740
Udvardi MK, Day DA (1997) Metabolite transport across symbiotic
membrane of legume nodules. Annu Rev Plant Physiol Plant Mol Biol
48: 493–523
Udvardi MK, Price GD, Gresshoff PM, Day DA (1988) A dicarboxylate
transporter on the peribacteroid membrane of soybean nodules. FEBS
Lett 231: 36–40
Vance CP, Gregerson RG, Robinson DL, Miller SS, Gantt JS (1994)
Primary assimilation of nitrogen in alfalfa nodules: molecular-features
of the enzymes involved. Plant Sci 101: 51–64
Vance CP, Reibach PH, Pankhurst CE (1987) Symbiotic properties of
Lotus-pedunculatus root-nodules induced by Rhizobium-loti and Bra-
dyrhizobium sp (Lotus). Physiol Plant 69: 435–442
Wagner C, Sefkow M, Kopka J (2003) Construction and application
of a mass spectral and retention time index database generated
from plant GC/EI-TOF-MS metabolite profiles. Phytochemistry 62:
887–900
Wienkoop S, Saalbach G (2003) Proteome analysis. novel proteins iden-
tified at the Peribacteroid membrane from Lotus japonicus root nodules.
Plant Physiol 131: 1080–1090
Legume Metabolomics
Plant Physiology Preview 17 of 17 www.plant.org on January 13, 2014 - Published by www.plantphysiol.orgDownloaded from
Copyright © 2005 American Society of Plant Biologists. All rights reserved.