Scanning Ethyl Methanesulphonate Effects on the Whole Genome of Lotus japonicus Using Second...
30
1 Title: Scanning ethyl methanesulphonate effects on the whole genome of Lotus japonicus using second generation sequencing analysis Authors: Nur Fatihah Mohd-Yusoff *,§ , Pradeep Ruperao †,‡ , Nurain Emylia Tomoyoshi * , David Edwards † , Peter M Gresshoff * , Bandana Biswas * , and Jacqueline Batley *,** . Institutional affiliations: *Centre of Integrative Legume Research, School of Agriculture and Food Science, The University of Queensland, St Lucia, Brisbane QLD 4072, Australia § Department of Cell and Molecular Biology, Faculty of Biotechnology and Biomolecular Sciences, Universiti Putra Malaysia, 43400, Serdang, Selangor, Malaysia † Australian Centre for Plant Functional Genomics, School of Agriculture and Food Science, The University of Queensland, St Lucia, Brisbane QLD 4072, Australia ‡ Centre of Excellence in Genomics (CEG), International Crops Research Institute for the Semi-Arid Tropics (ICRISAT), Patancheru 502324, Telangana, India **School of Plant Biology, University of Western Australia, Crawley, WA 6009, Australia. G3: Genes|Genomes|Genetics Early Online, published on February 6, 2015 as doi:10.1534/g3.114.014571 © The Author(s) 2013. Published by the Genetics Society of America.
-
Upload
independent -
Category
Documents
-
view
0 -
download
0
Transcript of Scanning Ethyl Methanesulphonate Effects on the Whole Genome of Lotus japonicus Using Second...

1
Title: Scanning ethyl methanesulphonate effects on the whole genome of Lotus japonicus
using second generation sequencing analysis
Authors:
Nur Fatihah Mohd-Yusoff*,§, Pradeep Ruperao†,‡, Nurain Emylia Tomoyoshi*, David
Edwards†, Peter M Gresshoff*, Bandana Biswas*, and Jacqueline Batley*,**.
Institutional affiliations:
*Centre of Integrative Legume Research, School of Agriculture and Food Science, The
University of Queensland, St Lucia, Brisbane QLD 4072, Australia
§Department of Cell and Molecular Biology, Faculty of Biotechnology and Biomolecular
Sciences, Universiti Putra Malaysia, 43400, Serdang, Selangor, Malaysia
†Australian Centre for Plant Functional Genomics, School of Agriculture and Food Science,
The University of Queensland, St Lucia, Brisbane QLD 4072, Australia
‡Centre of Excellence in Genomics (CEG), International Crops Research Institute for the
Semi-Arid Tropics (ICRISAT), Patancheru 502324, Telangana, India
**School of Plant Biology, University of Western Australia, Crawley, WA 6009, Australia.
G3: Genes|Genomes|Genetics Early Online, published on February 6, 2015 as doi:10.1534/g3.114.014571
© The Author(s) 2013. Published by the Genetics Society of America.

2
Short running title: EMS effects on the Lotus genome
Keywords: abscisic acid; Lotus japonicus; mutagenesis; second generation sequencing, SNP.
Corresponding author: Peter M Gresshoff
Mailing address: Centre of Integrative Legume Research, School of Agriculture and Food
Science, The University of Queensland, St Lucia, Brisbane QLD 4072, Australia
Email address: [email protected], [email protected], [email protected]
ABSTRACT
Genetic structure can be altered by chemical mutagenesis, which is a common
method applied in molecular biology and genetics. Second generation sequencing provides
a platform to reveal base alterations occurring in the whole genome due to mutagenesis. A
model legume, Lotus japonicus ecotype Miyakojima, was chemically mutated with alkylating
ethyl methanesulphonate for the scanning of DNA lesions throughout the genome. Using
second generation sequencing, two individually mutated third generation progeny (M3,
named AM and AS) were sequenced and analysed to identify single nucleotide
polymorphisms and reveal ethyl methanesulphonate effects on nucleotide sequences in
these mutant genomes. Single nucleotide polymorphisms were found in every 208 kb (AS)
and 202 kb (AM) with a bias mutation of G/C-to-A/T changes at low percentage. Most
mutations were intergenic. The mutation spectrum of the genomes was comparable in their
individual chromosomes however; each mutated genome has unique alterations, which are
useful to identify causal mutations for their phenotypic changes. The data obtained
demonstrate that whole genomic sequencing is applicable as a high throughput tool to
investigate genomic changes due to mutagenesis. The identification of these single point

3
mutations will facilitate the identification of phenotypically causative mutations in EMS
mutated germplasm.
INTRODUCTION
Mutagenesis provides a powerful technique to improve plant breeding and assist
functional and genomic analyses of crop plants. This technique was first introduced using X-
ray and radium radiations followed by fast neutron and gamma radiation (as reviewed in
Sikora et al. 2011). Since such application of physical mutagens required specialised
equipment, chemical mutagens were introduced later. Chemical mutagens are widely
utilised as they are easier to handle and increase mutation frequency (Loveless 1958; Sikora
et al. 2011; Serrat et al. 2014). Various chemical mutagens have been prepared, such as
sodium azide, ethyl methanesulphonate (EMS) and N-ethyl-N-nitrosourea (ENU), which
produce different side effects on the genetic structure of treated populations. These
chemicals can cause point mutations, insertions and/or deletions in the genomic strands
leading to phenotypic changes, which could be desirable traits for important crops (Olsen et
al. 1993; Greene et al. 2003; Flibotte et al. 2010).
EMS, an alkylating agent, is commonly used as a chemical mutagen for DNA lesions.
Unlike ENU, EMS induces a biased spectrum of G/C-to-A/T transitions. These transitions
most likely occur due to the alkylation at the O6 or N7 position of guanine, which leads to the
replacement of cytosine with thymine base pairing (Lawley and Martin 1875; Sega 1984;
Haughn and Somerville 1987; Sikora et al. 2011). Known as EMS canonical base
substitutions, the high frequency of G/C-to-A/T changes has been observed upon EMS
exposure in different organisms including Arabidopsis thaliana (Greene et al. 2003; Till et al.
2011), Oryza sativa (Till et al. 2011), L. japonicus (Perry et al. 2009), Caenorhabditis elegans

4
(Flibotte et al. 2010; Thompson et al. 2013), Solanum lycopersicum (Minoia et al. 2010) and
Saccharomyces cerevisiae (Shiwa et al. 2012) at different rates. EMS also tends to produce
random point mutations and induces a low level of chromosomal breaks and lethal effects
(Greene et al. 2003). These effects provide a competent survival rate and allow subsequent
analyses to be performed for both forward and reverse genetics.
The whole-genome sequence of Lotus japonicus ecotype Miyakojima (MG-20) is
available, covering a total length of 315,073,275 bp (67% of the 472-Mb genome). A total of
91.3% of gene space is located in the genome sequence (Sato et al. 2008). The genome
sequences of the chloroplast (150,519 bp) and mitochondrion (380,861 bp) have also been
assembled, by Kato et al. (2000) and Kazakoff et al. (2012) respectively. Numerous
bioinformatics materials on legume and non-legume plants are also publicly available from
various resources (Sato and Tabata 2005; Goodstein et al. 2012; Li et al. 2012). With the
current high throughput tools, genome sequencing can be performed at an affordable cost
(Thudi et al. 2012). Many programs have also been developed for analysing sequencing data
in silico, offering good strategies to employ our study.
In this study, we applied Illumina second generation sequencing (2GS) to discover
EMS effects and the mutation spectrum in the genome of model legume, L. japonicus
ecotype MG-20. We randomly selected two mutagenised plant genotypes from an M3
population as our subjects that were deep-sequenced. Wild type (WT) MG-20 was also re-
sequenced and mapped to the reference genome from Sato et al. (2008) as a comparison to
subtract natural variations and false positives. We aimed to scan the effects of EMS
throughout the whole genome, regardless of the phenotypic characteristic, which resulted
from the mutations in specific regions. We identified single nucleotide polymorphisms
(SNPs) and compared the base alterations that occurred between both the genomes. The

5
data demonstrate how 2GS works as a high throughput platform for rapidly identifying DNA
changes in each EMS-induced genome. As an advantage over sequencing pooled mutants,
scanning individual mutagenised genomes allows rapid analysis of the mutation spectrum
and gives the actual picture of “corrupted” genetic structure. The output of this study will
also provide information in the identification of genes mutated due to EMS mutagenesis and
demonstrate the distribution of mutation is comparable in different germplasm of MG-20.
MATERIALS AND METHODS
Plant materials
A total of 4,920 seeds of MG-20 were treated with 0.5% (v/v) EMS and grown as
described in (Biswas et al. 2009). One hundred MG-20 seeds were soaked in sterile water as
a germination control. After three weeks, the phenotypes of the plants which survived
(67.3%) were observed to examine physical effects on the plant growth. Physiological tests
were also performed as reported by Biswas et al. (2009) on ABA insensitivity and by Chan et
al. (2013) on ethylene insensitivity. In this study, two mutated germplasms (M3) were
isolated from the ABA assay (called AM and AS) for sequencing to screen EMS effects on
their genome sequences and compare them to the re-sequenced WT MG-20 genome. In
short, AM is a homozygous dominant ABA insensitive mutant (confirmed by stability in
segregating families), while AS is the wild-type ABA phenotype segregant that was
generated from a self-regeneration of a heterozygous ABA insensitive mutant. Thus, AM and
AS should carry the same spectrum of SNPs due to EMS mutagenesis.

6
DNA extraction
Genomic DNA was extracted from each individual plant after one month of growth.
The CTAB extraction method was adapted from Stewart and Via (1993) with minor
modification. Plant tissues (about 1 g) were ground to powder in liquid nitrogen before
adding 1 mL of CTAB extraction buffer. The mixture was incubated at 65oC for 30-60 min.
Five hundred µL of the mixture was transferred into a new 2 mL tube and 500 µL of CTAB
buffer was added to each tube. Both tubes were incubated as before. Chloroform
purification was performed followed by isopropanol precipitation and washing with 70%
ethanol. The nucleic acid containing pellet was air dried and dissolved in 100 µL of sterile
water and subjected to RNase treatment (Sambrook and Russel, 2001). Extracted genomic
DNA was assessed using a spectrophotometer and agarose gel electrophoresis.
Sequencing and SNP identification
Whole genome paired-end, 100 bp, short-sequence reads (>10x coverage) for AM,
AS and WT MG-20 were generated using the Illumina Genome Analyser IIx according to the
manufacturer’s instructions. These three datasets were then mapped to the MG-20
reference genome (www.kazusa.or.jp/lotus/) using SOAP2 v2.21 with the option –r0 to
retain only uniquely mapping read pairs (Li et al. 2009). SNPs were called using SGSautoSNP
2.001 (Lorenc et al. 2012) wherein AM, AS and WT were referred as different cultivars. In
order to avoid false positive output, only homozygous SNPs were selected for further
analysis. The three datasets of paired reads have been deposited into the NCBI Short Read
Archive (SRA) database under accession: SRX719550 (AM), SRX729747 (AS) and SRX131060
(WT). All custom scripts are available on request by email at [email protected].

7
SNP analysis
The re-sequenced WT genome was used for comparison to identify variants or base
changes in the AS and AM genome sequences. The frequency of transitions and
transversions generated in both mutated germplasms was also calculated. SNPs were
categorised using SnpEff 3.0j (Cingolani et al. 2012) according to their effect on L. japonicus
MG-20 annotated genes (Sato et al. 2008).
Selection of genes involved in ABA perception and signaling pathways
A number of ABA candidate genes were also selected to test if a SNP is located in
their sequences. As a preliminary study, a total of 32 genes reported to be involved in ABA
signaling were selected as candidate genes. These genes are commonly reported in the ABA-
gene interaction in ABA perception and signaling pathways (Wasilewska et al. 2008; Cutler
et al. 2010; Kim et al. 2010).
RESULTS
Phenotypic effects
All control seeds successfully germinated and were well-developed. EMS-treated
seeds had a germination rate of 67.3% (3,313/4,920). Among well-developed EMS-treated
plants, 76 M1 plants showed abnormal phenotypes after three weeks of growth. Almost 1%
of these plants (30/3,313) showed an albino phenotype, in which yellow sectors were
observed. Some plants also had pale green patches (0.6%, 23/3,313), early branching (0.2%,
7/3,313) or a looped base (0.39%, 13/3,313). Two other plants showed either unusual leaf
shape or early flowering. Vivipary was also detected on a pod among this population. In this
study, the impaired phenotypes of L. japonicus indicated the successful treatment of

8
mutagenesis using 0.5% EMS, and therefore, the population could be utilised for
subsequent analyses. We chose mutants at the third generation (M3) as subjects to ensure
the mutation is stable and fixed (Serrat et al. 2014).
Sequencing and read mapping output
A total of 32,965,291, 34,020,296, and 25,737,274 paired reads were generated from
the WT, AS and AM genomes, respectively (Table 1). At least 23% of reads from the
sequenced genomes mapped to the reference. The percentage of mapped read pairs was
28.17%, 30.28% and 23.59% from WT, AS and AM, respectively, which resulted in more than
19x genome coverage. As a result, the genome coverage was sufficient to be applied for SNP
calling between mutants and WT reads.
Table 1: Outputs generated from Illumina sequencing to read mapping.
Genome Paired raw reads Read pairs mapped % of read pairs mapped Genome coverage*
MG-20 WT 32,965,291 9,285,440 28.17 29.88X
AS mutant 34,020,296 10,299,840 30.28 33.15X
AM mutant 25,737,274 6,071,230 23.59 19.54X
*Based on mapped reads
Frequency of mutation
After read mapping, homozygous SNPs were predicted, to identify SNPs that are
unique in the mutant genome as opposed to WT. As a result, the frequency of mutation
could be observed in assembled sequences of all chromosomes (Table 2). Chromosomes 1
and 6 have the longest and shortest length of assembled sequences, respectively.
Meanwhile, the unmapped contigs cover approximately 32.9 Mb of total assembled length.

9
Our SNP calling showed that Chromosome 1 has the highest number of SNPs with one
mutation per 170 kb and 165 kb in the AS and AM genomes, respectively. Mutation
frequency was the lowest in Chromosome 6, which had less than 6% of total SNP in both
genomes. The change rates were one mutation per 222 kb for AS and 217 kb for AM. In
total, mutation frequency in AM and AS was nearly identical 1,490 SNPs and 1,447
respectively. This frequency is reflected in the change rate of mutation in the AM genome
(one homozygous mutation in every 202 kb) and AS genome (one homozygous mutation in
every 208 kb).
Table 2: Frequency of SNPs in individual chromosomes and unmapped regions of AS and AM mutants. Total of
assembled length (bp), base changes and change rate of individual chromosomes and unmapped regions are
listed below.
AS genome AM genome
Chromosome Length (bp) Change (SNPs) Change rate Change (SNPs) Change rate
1 66,776,104 391 170,783 404 165,287
2 44,510,304 258 172,521 250 178,041
3 48,258,781 208 232,013 204 236,563
4 43,347,107 176 246,290 195 222,293
5 37,320,184 190 196,422 200 186,601
6 28,216,978 76 371,276 86 328,104
Unmapped 32,912,371 148 222,381 151 217,963
Total 301,341,829 1447 208,253 1490 202,243

10
The frequency of transitions and transversions generated was analysed (Table 3). In
our mutants, EMS has generated 64.7% (AS) and 62.3% (AM) transitions as a percent of total
mutation. Both mutants showed a bias to G/C-to-A/T transitions, which were the most
frequent mutations that occurred (45.0% in AS and 34.9% in AM). Transversion mutation
was also detected, but at lower percentages as listed in Table 3. The lowest percentage of
mutation was C/G-to-G/C changes in AS and A/T-to- T/A changes in AM.
Table 3: Spectrum of base mutation found in the AS and AM genomes. High frequency of transition mutation
was observed as expected.
Mutation
Changes (%)
AS AM
Transition
G/C-to-A/T 45.0 34.9
A/T-to-G/C 19.7 27.4
Transversion
A/C-to-C/A 12.7 15.3
G/T-to-T/G 12.6 13.3
A/T-to- T/A 6.9 4.5
C/G-to-G/C 3.1 4.6
Distribution of transition and transversion mutations
Based on the mutation frequency, how each mutation type was located in individual
chromosomes can be observed by calculating the percentage of mutation type in relation to
the SNP total in each chromosome (Figure 1). Both genomes comprised of C/T or G/A
transitions as the most frequent mutation type in their chromosomes or unmapped regions.
In the AS genome, G/A transitions were the highest in Chromosomes 1, 2, 5 and 6.

11
Chromosomes 3 and 4 and unmapped regions had C/T transitions as the highest percentage
of mutation type. The lowest percentage of mutation type was C/G transversions which
were present the least in all individual chromosomes and unmapped regions of the AS
mutant. The distribution of transitions and transversions in the AM genome was relatively
similar to the AS genome. The highest percentage of mutation type in each chromosome of
the AM genome was C/T transitions except Chromosome 3. Unmapped regions and
Chromosome 3 of AM have G/A transitions as the highest percentage of mutation type.
Meanwhile, the lowest percentage of mutation type was detected to be either A/T or C/G
transversions in the AM genome.
Figure 1: Relative percentage of different mutation types. Our mutated genomes had varied percentages of
base changes in each chromosome and unmapped regions. High percentage of G/A and C/T changes was
observed in both genomes.

12
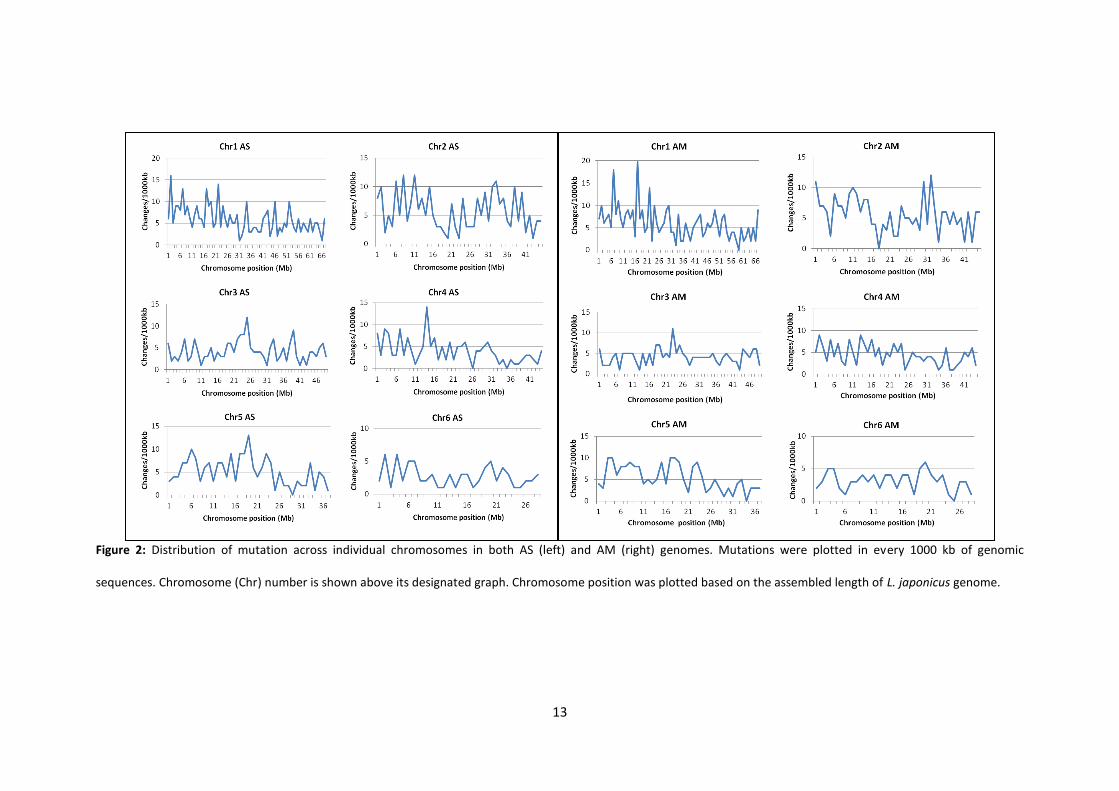
Distribution of SNPs across mutagenised genome
We determined how many SNPs occurred every 1000 kb to show the distribution of
mutations across our mutagenised genomes (Figure 2). Regardless of mutation types, the
distribution of SNPs is unique between AS and AM when comparing the same chromosome.
SNPs were randomly located along the genomes with no specific chromosome position
being particularly abundant or lacking in SNPs for both genomes. However, Chromosomes 1
and 2 were highly ‘corrupted’ in their arms. Meanwhile, some chromosomes (Chromosomes
3, 4 and 5 for AS; Chromosome 3 for AM) have a high peak of SNPs towards their centre.
The density of mutations in every 1000 kb was relatively apparent in Chromosomes 1 and 2
of AS and AM. Meanwhile, Chromosome 6 had less dense mutations for both genomes.
Coding and noncoding effects
Here, we used SnpEff to predict the effect of mutations on coding regions of
annotated genes of L. japonicus for both mutants, as shown in Figure 3. Our results showed
that the highest number of SNPs (34%) was predicted to be located in intergenic regions,
followed by downstream and upstream regions of predicted genes (27% each). Only 7% and
3% of SNPs were located in exon and intron sequences, respectively. Intragenic regions
were also predicted to have low EMS effect. The mutation percentage was very low at splice
site donor and acceptors. In our mutagenised genomes, EMS effects did not contribute to a
high fraction of nonsynonymous and synonymous changes (5% and 2%, respectively).
Candidate genes
As preliminary research, we selected 32 notorious abscisic acid (ABA) genes (Table 4)
to determine if any SNP were located in their sequences. Orthologous genes of L. japonicus
13
Figure 2: Distribution of mutation across individual chromosomes in both AS (left) and AM (right) genomes. Mutations were plotted in every 1000 kb of genomic
sequences. Chromosome (Chr) number is shown above its designated graph. Chromosome position was plotted based on the assembled length of L. japonicus genome.

14
Figure 3: Mutation effects on codon sequences by type and region in our mutant genomes. SNPs were
observed highly located in intergenic regions, upstream and downstream parts of the annotated genes. Only
small percentage of nonsynonymous changes was predicted.
were identified based on A. thaliana and Glyine max sequences. Six were found to have
orthologous sequences, which were positioned in unmapped regions of the MG-20 genome.
The rest of the orthologs were found in the assembled chromosomes. SNPs were identified
in three candidate loci, which were ABI2, ABI3 and ABI4. ABI2 and ABI4 were mutated in
both mutants, whilst SNP was only found in ABI3 of the AS mutant.

15
Table 4: List of ABA candidate genes and their loci in the genome of Arabidopsis, soybean and Lotus.
No. Candidate gene Molecular function Locus
Arabidopsis thaliana Glycine max Lotus japonicus
1 ABA INSENSITIVE 2 (ABI2) Protein phosphatase 2C AT5G57050 Gm17g33410.1 chr1.CM0133.740.r2.m
2 ABI3 Transcription factor AT3G24650 Gm08g47240.1 chr1.CM0147.920.r2.d
3 ABI4 Transcription factor AT2G40220 Gm02g31350.1 chr1.CM0318.160.r2.d
4 ABI5 bZIP transcription factor AT2G36270 Gm19g37910.1 chr1.CM0010.100.r2.d
5 ABI8 Glycosyl transferases AT3G08550 Gm04g26230.1 chr3.CM2163.130.r2.m
6 AGB1 Heterotrimeric G-protein complex
AT4G34460.1 Gm11g12600.1 chr1.CM0113.1970.r2.d
7 AHA1/ OPEN STOMATA 2 (OST2)
ATPase At2G18960.1 Gm13g00840.1 chr4.CM0244.50.r2.m
8 ABA Responsive Element-binding Factor2 (ABF2)/ AREB1
bZIP transcription factor AT1G45249.3 Gm06g04350.1 chr1.CM2113.380.r2.a
9 ATPT2/ PHT1:4 Phosphatase transporter AT2G38940 Gm19g34710.1 chr1.CM0295.140.r2.m
10 Ethylene Response DNA binding factor 3 (EDF3)
Transcription factor AT3G25730 Gm10g34760.1 LjSGA_080421.2
11 Ethylene Response Factor 7 (ERF7)
Transcription factor At3G20310 Gm14g02360.1 LjSGA_013296.1.1
12 Enhanced Response to ABA 1 (ERA1)
Farnesyltransferase activity
AT5G40280 Gm13g23780.1 chr2.CM0081.550.r2.d
13 FUS3 Transcription factor AT3G26790.1 Gm19g27340.1 chr1.CM0104.400.r2.a
14 Gated Outwardly Rectifying K+ Channel (GORK)
Outward rectifier K channel activity
AT5G37500.1 Gm02g41040.1 chr6.CM0508.670.r2.m
15 Stelar K+ Outward Rectifier (SKOR)
Outward rectifier K channel activity
AT3G02850 Gm14g39330.1 Same as GORK
16 GPA1 GTP binding protein AT2G26300.1 Gm06g05960.1 chr5.CM0034.250.r2.m
17 Glutathione peroxidase 3 (GPX3)
Redox transducer & scavenger
AT2G43350.1 Gm11g02630.1 chr4.CM0004.300.r2.m

16
18 GPCR-TYPE G protein 1 (GTG1) ABA receptor AT1G64990.1 Gm12g0174 chr3.CM0127.40.r2.m
19 High Leaf temperature 1 (HT1) Serine/threonine protein kinase
AT1G62400 Gm07g39460.1 chr4.CM0288.800.r2.m
20 Keep On Going (KEG) Ring E3 ligase AT5G13530 Gm11g25680.1 LjSGA_007856.1
21 Potassium Channel In A. thaliana 1 (KAT1)
Cyclic-nucleotide binding AT5G46240 Gm08g24960.1 chr6.CM157.280.r2.a
22 OST1 Serine/threonine protein kinase
AT4G33950.1 Gm02g15330.1 LjSGA_038133.1
23 PLDα1 Phospholipase D/ transphosphatidylase
AT3G15730.1 Gm07g03490.1 chr3.CM0142.570.r2.d
24 Pyrabactin Resistance1-like 2 (PYL2)/ Regulatory Component of ABA Receptor 14 (RCAR14)
Polyketide cyclase/ dehydrase
AT2G26040 Gm04g05380.1 LjSGA_056222.1
25 PYL3/ RCAR13 Polyketide cyclase/ dehydrase
Similar to PYL2 Similar to PYL2 Similar to PYL2
26 PYL4/ RCAR10 Polyketide cyclase/ dehydrase
AT2G38310 Gm18g37410.1 chr3.CM0116.270.r2.m
27 PYL5/ RCAR8 Polyketide cyclase/ dehydrase
AT5G05440 Gm02g42990.1 LjSGA_020312.1
28 Pyrabactin Resistance1 (PYR1) / Regulatory Component of ABA Receptor 11 (RCAR11)
Streptomyces cyclase/ dehydrase
AT4G17870.1 Gm08g36770.1 chr2.CM0177.730.r2.m
29 Regulator of G protein Signaling 1 (RGS1)
G-protein coupled receptor
AT3G26090 Gm11g37540.1 chr6.LjT45M05.110.r2.d
30 TPK10/ CIPK15 CBL-interacting serine/ threonine protein kinase
AT5G01810.1 Gm18g44450.1 chr3.LjT45I18.90.r2.d
31 Slow Anion Channel Associated 1 (SLAC1)
C4-dicarboxylate transporter/ malic acid
transport
AT1G12480 Gm09g23220.1 LjSGA_063103.1
32 MYB44 Transcription factor None Gm04g04490.1 chr5.CM0096.100r2.m

17
DISCUSSION
The effect of EMS mutagenesis can initially be observed through phenotypic changes
of mutagenised plants and numerous reports have been published on the effects. The
abnormal phenotypic variance due to EMS exposure has also been reported previously in L.
japonicus (Perry et al. 2003) and other plants such as Glycine max (soybean; Carroll et al.
1986), Hordeum vulgare L. (barley; Caldwell et al. 2004), Sorghum bicolor (L.) Moench Xin et
al. 2008), Solanum lycopersicum (tomato; Minoia et al. 2010) and Capsicum annuum L. (chilli
pepper; Sri Devi and Mullainathan 2012). The percentage of the abnormal phenotypes
varied in different plants depending on the concentration of EMS used (Xin et al. 2008).
Phenotypic changes are not restricted to plant growth, but also affect their physiological
characteristics. For examples, reduced sensitivity to ABA was reported by Biswas et al.
(2009) in L. japonicus mutagenised by EMS. Response to high temperature was also affected
in EMS-induced Arabidopsis mutants impaired in ABA and salicylic acid syntheses (Zhu et al.
2012).
Sequencing data is often used to mine SNPs or polymorphisms among different
cultivars for identification of traits and allelic variations in crops (Varshney et al. 2012;
Edwards et al. 2013; Zander et al. 2013). The high throughput technology is also applied in
discovering causative mutations by pooling backcrossed segregant populations to increase
SNP frequency and reveal mutated regions (Ashelford et al. 2011; Mokry et al. 2011;
Hartwig et al. 2012). Here, we individually sequenced two selected mutant genomes and
used 2GS data to compare mutation distribution between these mutants.
To our knowledge, this is the first report on the application of SGSautoSNP for
discovery of SNPs induced by EMS mutagenesis. This tool uses assembled reads to identify
homozygous SNPs without using the reference genome, which is only used for mapping
18
reads. SGSAutoSNP was used to identify only homozygous SNPs because the identification
of heterozygote SNPs leads to a high number of false positives, which would lead to an over-
representation of the mutation frequency in the genome (Lorenc et al. 2012). We also
managed to rapidly identify the mutation spectrum occurring in the mutant genomes using
the output data.
Our read mapping has been successfully performed prior to SNP identification in
each genome. However, a low percent of reads was mapped to our reference. A high
percentage of paired reads was reported to map to the reference in other species such as
Caenorhabditis elegans (average 92%; Zuryn et al. 2010) and A. thaliana (average 73%;
Austin et al. 2011). In our case, only an average of 27% paired reads mapped. Similar results
were observed in other species using the same SNP predictionsoftware (for example in
canola, Dalton-Morgan et al. 2014 and wheat, Lai et al. 2015). The number of reads mapped
relies on the parameters set up during the mapping procedure. We only selected paired
reads that mapped and ignored reads that aligned as single reads and only used reads that
mapped to a single unique location to generate more accurate read mapping (Lorenc et al.
2012; Li et al. 2009). The assembled length of pseudomolecules in our MG-20 reference
covers 67% of estimated genome size (Sato et al. 2008), which also influences read mapping
output. In addition, reads that aligned to multiple positions were also removed to increase
SNP calling accuracy and avoid false positives (Lorenc et al. 2012; Shiwa et al. 2012). These
factors have reduced the number of reads mapped in this study.
Chromosome 3 is the largest among the six chromosomes of the MG-20 genome.
However, the assembled length of chromosome 1 is the longest, and presumably more
complete, based on the genome assembly (Sato et al. 2008), allowing for better read
mapping and a higher rate of SNP identification. This reflects the highest number of SNPs

19
predicted in chromosome 1. Chromosome 6 has the lowest number of identified SNPs as it
is the shortest chromosome in assembled length (Sato et al. 2008). In addition,
Chromosome 6 might contain more repetitive sequences and therefore less unique reads
mapped, leading to a lower rate of SNPs being identified. Furthermore, the different rates of
base changes between chromosomes may demonstrate the different capacity levels of each
chromosome in tolerating mutation impact. There is insufficient evidence to reach clear
conclusions, however the presence of selection pressure, such as clustering of house-
keeping genes on chromosomes, could contribute to inability to tolerate mutations.
Additionally, not all SNPs will be identified across the genome due to repetitive regions and
the stringency of read mapping, reflecting SNP/mutation density across chromosomes.
A different number of SNPs between AS and AM was expected as it is impossible to
obtain an exact total of SNPs in different mutated genomes. The mutation rate of our
mutants was 1/208 kb and 1/202 kb, which were higher than previously reported in L.
japonicus (1/502 kb; Perry et al. 2009). Different rates of mutation were also reported in
various plants mutagenised by EMS, as summarised by Sikora et al. (2011). Although only
homozygous SNPs were taken into account in this study, the frequency of mutation was
quite high. If heterozygous mutations were called, the frequency will be higher. Here, the
frequency of mutation demonstrates the effectiveness of EMS to produce high mutagenesis
as reported by many researchers (Dube et al. 2011; Shiwa et al. 2012; Serrat et al. 2014).
The mutation spectrums in our germplasms were not consistent with a previous
report on TILLING work of mutagenised L. japonicus Gifu (Perry et al. 2009) wherein 97.6%
of base changes were G/C-to-A/T mutation upon EMS mutagenesis. Similar to TILLed
Arabidopsis, a high frequency of G/C-to-A/T transition (99%) was also identified (Greene et
al. 2003). A lower rate of G/C-to-A/T base changes was observed in other plants including

20
barley (70%; Caldwell et al. 2004), rice (70%; Till et al. 2007) and tomato (60%; Minoia et al.
2010), showing a possibility of the presence of various base changes upon EMS exposure.
However, transition mutations could not be denied as the most common base mutation in
the EMS sphere as reported previously (Lawley and Martin 1975; Sikora et al. 2011; Shiwa et
al. 2012). In the TLLING analysis, a number of interesting genes with known sequences were
selected for the identification of base changes in pooled mutated genomes (McCallum et al.
2000). In this study, we adopted a high throughput technology (2GS) to scan homozygous
SNPs that are present throughout the individual mutated genomes as compared to our re-
sequenced WT MG-20. This provided a wider range of EMS effects in a genome. Our
approach also neglected natural variation between the reference and the re-sequenced MG-
20 genomes. Our reference was used merely for read mapping and has not been counted
during SNP calling (Lorenc et al. 2012).
Although the percentage of transversion mutations was relatively low in both
genomes, they should not be omitted in a mutation study as they potentially are causal
mutations for phenotypes of interest. Taking into account only homozygous mutations, our
data also show that the presence of specific base changes is comparatively distributed
among individual chromosomes, and not abundantly located in a specific chromosome for
both alleles. Comparing these two genomes, transition and transversion mutations were
present nearly consistently in the same chromosomes. These results reveal that the
frequency of EMS induced transition and transversion mutations is comparable between
different individual mutants that were derived from the same mutagenised population.
As mentioned before, the total assembled length affects the SNP total identified in
each chromosome and consequently, their distributions. The longer the assembled length,
the denser the mutation distribution was found to be along the chromosome. The mutation

21
distribution was also affected by the occurrence of assembled sequences at specific regions
(www.kazusa.or.jp/lotus/). Chromosome 6 is the best example, in which low SNP peaks
were detected and the mutations distributed broadly. Read mapping is very difficult in
centromeric regions and therefore the density in these regions has not been investigated in
this study. Distribution of mutations was scattered due to the effect of EMS as a mutagen
that causes a random mutation (Lawley and Martin 1975; Greene et al. 2003; Sikora et al.
2011; Tagu et al.2014). A random distribution was also reported by Thompson et al. (2013)
in the genome of single C. elegans from different strains, which were mutagenised by EMS.
They propagated mutagenised worms through ten generation to obtain stable mutants.
However, this is time consuming for legumes, which have a longer generation period.
Nevertheless, our 2GS data of third generation mutants could also provide the literal effect
of EMS mutagenesis throughout the individual genomes.
EMS induces base changes or nucleotide substitution, which consequently alter
codon sequences, leading to either nonsynonymous or synonymous effects. In genetics
studies, nonsynonymous change is a favourable mutation effect because it gives a clue on
which gene may be associated with a specific phenotype (Ng and Henikoff 2006). Our results
showed that EMS has arbitrary and broad effects of mutation on codon sequences. Mutated
coding regions could represent nonsynonymous changes, which are useful to identify gene
of interest for desirable phenotypes.
In order to extend the implication of our data, preliminary work has been employed
to specifically detect the presence of mutations in our genes of interest. A total of 32 genes
reported to be involved in ABA signaling were selected as candidate genes. These genes are
commonly reported in the ABA-gene interaction in ABA perception and signaling pathways
(Wasilewska et al. 2008; Cutler et al. 2010; Kim et al. 2010). We chose to use ABA candidate

22
genes because our mutants were isolated from a mutagenised population effected in
response to ABA. We did identify base changes in several candidate genes, indicating a low
rate of EMS effects on these sequences. In addition, identified SNPs were not only in the
ABA insensitive AM mutant, indicating they were background mutations. On the other hand,
comparing mutations between AM and AS mutants would provide clues on the causal
mutation of mutant phenotypes. However, other candidate genes can also be considered
since ABA is involved in a wide range of plant growth and responses to environmental
stresses. Its effects are varied in regulating the events of plant physiology, which require
gene interaction and/or cross talks with other hormones (as reviewed in Kermode 2005;
Fujita et al. 2006; Rock et al. 2010). Since this research worked on an individual genome of
mutants, another strategy has been developed to sequence pooled DNA from different
mutants in order to remove the effect of background mutation and increase the likelihood
of identifying the causative gene.
In conclusion, this scanning revealed a detailed effect of EMS mutation on the whole
genome of an individual mutant. Our results presented an overview of point mutations that
occurred in the genome of mutants, which were usually pooled to identify SNPs. Here, EMS
has produced a number of abnormal plants in our mutant population of L. japonicus. Our
2GS data also revealed how EMS efficiently mutates genomic sequences in an individual
mutagenised plant. As expected, EMS created a random spectrum of mutation across the
whole genome of our mutants and biased to G/C-to-A/T changes. However, other transition
and transversion mutations were also identified with quite apparent fractions. Calling only
homozygous SNPs has put a high confidence in identified base changes occurred. Mutation
distribution apparently is distinct between mutated genomes, which derived from the same
mutagenised population. Effects of SNPs on coding and noncoding regions could be

23
manipulated to identify a causal mutation of a phenotype of interest. Our next question will
be which gene is responsible for our abnormal phenotype of interest. This 2GS data will be
further analysed to discover the causative mutated gene.
ACKNOWLEDGEMENT
Authors would like to acknowledge the Centre of Integrative Legume Research, the
University of Queensland for giving the opportunity to run this work. Special thanks to Dr
Stephen Kazakoff, Queensland Centre for Medical Genomics, the University of Queensland
for the technical support. Scholarship from the Ministry of Higher Education, Malaysia in
financially supporting our student is also acknowledged.
LITERATURE CITED:
Ashelford, K., M.E. Eriksson, C.M. Allen, R. D’Amore, M. Johansson et al., 2011 Full
genome re-sequencing reveals a novel circadian clock mutation in Arabidopsis. Genome
Biol. 12: R28.
Austin, R.S., D. Vidaurre, G. Stamatiou, R. Breit, N.J. Provart et al., 2011 Next-generation
mapping of Arabidopsis. The Plant J. 67: 715-725.
Biswas, B., P.K. Chan, and P.M. Gresshoff, 2009 A novel ABA insensitive mutant of Lotus
japonicus with a wilty phenotype displays unaltered nodulation regulation. Mol. Plant 2:
487-499.
Caldwell, D.G., N. McCallum, P. Shaw, G.J. Muehlbauer, D.F. Marshall et al., 2004 A
structured mutant population for forward and reverse genetics in barley (Hordeum
vulgare L.). Plant J. 40: 143-150.

24
Carroll, B.J., D.L. McNeil, and P.M. Gresshoff, 1986 Mutagenesis of soybean (Glycine max
(L.) Merr) and the isolation of non-nodulating mutants. Plant Sci. 47: 109-114.
Chan, P.K., B. Biswas, and P.M. Gresshoff, 2013 Classical ethylene insensitive mutants of
the Arabidopsis EIN2 orthologue lack the expected ‘hypernodulation’ response in Lotus
japonicus. J. Integr. Plant Biol. 55: 395-408.
Cingolani, P., A. Platts, L.L. Wang, M. Coon, T. Nguyen et al., 2012 A program for
annotating and predicting the effects of single nucleotide polymorphisms, SnpEff: SNPs
in the genome of Drosophila melanogaster strain w1118; iso-2; iso-3. Landes Bioscience 6:
1-13.
Cutler, S.R., P.L. Rodriguez, R.R. Finkelstein and S.R. Abrams, 2010 Abscisic acid:
emergence of a core signalling network. Annu. Rev. Plant Biol. 61: 651-679.
Dalton-Morgan, J., A. Hayward, S. Alamery, R. Tollenaere, A.S. Mason, E. Campbell, D.
Patel, M.T. Lorenc, B. Yi, Y. Long, J. Meng, R. Raman, H. Raman, C. Lawley, D. Edwards
and J. Batley, 2014 A highthroughput SNP array in the amphidiploid species Brassica
napus shows diversity in resistance genes. Func. Int. Genomics 14:643-655.
Dube, K.G., A.S. Bajaj, and A.M. Gawande, 2011 Mutagenic efficiency and effectiveness
of gamma rays and EMS in Cyamopsis tetragonoloba (L.) var. Sharada. Asiatic J.
Biotechnol. Resour. 2: 436-440.
Edwards, D., J. Batley, and R.J. Snowdon, 2013 Accessing complex crop genomes with
next-generation sequencing. Theor. Appl. Genet. 126: 1-11.
Flibotte, S., M.L. Edgley, I. Chaudhry, J. Taylor, S.E. Neil et al., 2010 Whole-genome
sequencing profiling of mutagenesis in Caenorhabditis elegans. Genetics 185: 431-441.
25
Fujita, M., Y. Fujita, Y. Noutoshi, F. Takahashi, Y. Narusaka, et al., 2006 Crosstalk
between abiotic and biotic stress responses: a current view from the points of
convergence in the stress signaling networks. Curr. Opin. Plant Biol. 9: 436-442.
Goodstein, D.M., S. Shu, R. Howson, R. Neupane, R.D. Hayes et al., 2012 Phytozome: a
comparative platform for green plant genomics. Nucleic Acids Res. 40: D1178-D1186.
Greene, E.A., C.A. Codomo, N.E. Taylor, J.G. Henikoff, B.J. Till et al., 2003 Spectrum of
chemically induced mutations from a large-scale reverse genetic screen in Arabidopsis.
Genetics 164: 731-740.
Hartwig, B., G.V. James, K. Konrad, K. Schneeberger, and F. Turck, 2012 Fast isogenic
mapping-by-sequencing of ethyl methanesulfonate-induced mutant bulks. Plant Physiol.
160: 591-600.
Haughn, G., and C.R. Somerville, 1987 Selection for herbicide resistance at the whole-
plant level, pp. 98-107 in Biotechnology in Agricultural Chemistry, ACS Symposium Series
edited by LeBron H et al. American Chemical Society, Washington.
Kato, T., T. Kaneko, S. Sato, Y. Nakamura, S. Tabata, 2000 Complete structure of the
chloroplast genome of a legume, Lotus japonicus. DNA Res. 7: 323-330.
Kazakoff, S.H., M. Imelfort, D. Edwards, J. Koehorst, B. Biswas et al., 2012 Capturing the
biofuel wellhead and powerhouse: the chloroplast and mitochondrial genomes of the
leguminous feedstock tree Pongamia pinnata. PLoS ONE 7: e51687.
Kermode, A.R., 2005 Role of abscisic acid in sed dormancy. J. Plant Growth Regul. 24:
319-344.

26
Kim, T.H., M. Böhmer, H. Hu, N. Nishimura and J.I. Schroeder, 2010 Guard cell signal
transduction network: advances in understanding abscisic acid, CO2 and Ca2+ signalling.
Annu. Rev. Plant Biol. 61: 561-591.
Lai, K, M.T Lorenc, C.L. Hong, P.J. Berkman, P.E. Bayer, P. Visendi, P. Ruperao, T.L.
Fitzgerald, M. Zander, C.K.K. Chan, S. Manoli, J. Stiller, J. Batley and D. Edwards, 2015
Identification and characterisation of more than 4 million intervarietal SNPs across the
group 7 chromosomes of bread wheat. Plant Biotech. J. 13: 97-104.
Lawley, P.D., and C.N. Martin, 1975 Molecular mechanisms in alkylation mutagenesis.
Induced reversion of bacteriophage T4rII AP72 by ethyl methanesulphonate in relation
to extent and mode of ethylation of purines in bacteriophage deoxyribonucleic acid.
Biochem. J. 145: 85-91.
Li, J., X. Dai, T. Liu, P.X. Zhao, 2012 LegumeIP: an integrative database for comparative
genomics and transcriptomics of model legumes. Nucleic Acids Res. 40: D1221-D1229.
Li, R., C. Yu, Y. Li, T.W. Lam, S.M. Yiu et al., 2009 SOAP2: an improved ultrafast tool for
short read alignment. Bioinformatics 25: 1966-1967.
Lorenc, M.T., S. Hayashi, J. Stiller, H. Lee, S. Manoli et al. 2012 Discovery of single
nucleotide polymorphisms in complex genomes using SGSautoSNP. Biology 1: 370-382.
Loveless, A., 1958 Increased rate of plaque-type and host-range mutation following
treatment of bacteriophage in vitro with ethyl methane sulphonate. Nature 181: 1212-
1213.
McCallum, C.M., L. Comai, E.A. Greene, and S. Henikoff, 2000 Targeting induced local
lesions in genomes (TILLING) for plant functional genomics. Plant Physiol. 123: 439-442.
27
Minoia, S., A. Petrozza, O. D’Onofrio, F. Piron, G. Mosca et al., 2010 A new mutant
genetic resource for tomato crop improvement by TILLING technology. BMC Res. Notes
3: 69.
Mokry, M., I.J. Nijman, A. van Dijken, R. Benjamins, R. Heidstra et al., 2011 Identification
of factors required for meristem function in Arabidopsis using a novel next generation
sequencing fast forward genetics approach. BMC Genomic 12: 256.
Ng, P.C. and S. Henikoff, 2006 Predicting the effects of amino acid substitutions on
protein function. Annu. Rev. Genomics Hum. Genet. 7: 61-80.
Olsen, O., X. Wang, and D. von Wettstein, 1993 Sodium azide mutagenesis: Preferential
generation of A·T → G·C transitions in the barley An18 gene. Proc. Natl. Acad. Sci. 90:
8043-8047.
Perry, J., A. Brachmann, T. Welham, A. Binder, M. Charpentier et al., 2009 TILLING in
Lotus japonicus identified large allelic series for symbiosis genes and revealed a bias in
functionally defective ethyl methanesulfonate alleles toward glycine replacements. Plant
Physiol. 151: 1281-1291.
Perry, J.A., T.L. Wang, T.J. Welham, S. Gardner, J.M. Pike et al. 2003 A TILLING reverse
genetics tool and a web-accessible collection of mutants of the legume Lotus japonicus.
Plant Physiol. 131: 866-871.
Rock, C.D., Y. Sakata, and R.S. Quatrano, 2010 Stress signaling I: The role of abscisic acid
(ABA), pp. 33-73 in Abiotic Stress Adaptation in Plants: Physiological, Molecular and
Genomic Foundation, edited by A. Pareek, S.K. Sopory, H.J. Bohnert and Govindjee.
Springer, Dortrecht.

28
Sambrook, J. and D.W. Russel, 2001 Molecular Cloning: A laboratory manual. Third
Edition. Cold Spring Harbor Laboratory Press, New York.
Sato, S., and S. Tabata, 2005 Lotus japonicus as a platform for legume research. Curr.
Opin. Plant Biol. 9: 128-132.
Sato, S., Y. Nakamura, T. Kaneko, E. Asamizu, T. Kato et al., 2008 Genome structure of
the legume, Lotus japonicus. DNA Res. 15: 227-239.
Sega, G.A., 1984 A review of the genetic effects of ethyl methanesulfonate. Mutation
Research 134: 113-142.
Serrat, X., R. Esteban, N. Guibourt, L. Moysset, S. Nogués et al., 2014 EMS mutagenesis
in mature seed-derived rice calli as a new method for rapidly obtaining TILLING mutant
populations. Plant Methods 10: 5.
Shiwa, Y., S. Fukushima-Tanaka, K. Kasahara, T. Horiuchi, H. Yoshikawa, 2012 Whole-
genome profiling of a novel mutagenesis technique using proofreading-deficient DNA
polymerase δ. Int. J. Evol. Biol. 2012: 860797.
Sikora, P., A. Chawade, M. Larsson, J. Olsson, O. Olsson, 2011 Mutagenesis as a tool in
plant genetics, functional genomics and breeding. Int. J. Plant Genom., Article ID 314829,
13 pages, doi: 10.1155/2011/314829.
Sri Devi, A., and L. Mullainathan, 2012 The use of ethyl methanesulfonate to study the
flower development in Capsicum annuum L. mutants. Bot. Res. Intl. 5: 4-9.
Stewart, C.N., and L.E. Via, 1993 A rapid CTAB DNA isolation technique useful for RAPD
fingerprinting and other PCR applications. BioTechniques 14: 748-749.
Tagu, D., G.L. Trionnaire, S. Tanguy, J.P. Gauthier, and J.R. Huynh, 2014 EMS mutagenesis
in the pea aphid Acyrthosiphon pisum. G3 4: 657-667.

29
Thompson, O., M. Edgley, P. Strasbourger, S. Flibotte, B. Ewing et al., 2013 The million
mutation project: A new approach to genetics in Caenorhabditis elegans. Genome Res.
23: 1749-1762.
Thudi, M., Y. Li, S.A. Jackson, G.D. May, and R.K. Varshney, 2012 Current state-of-art of
sequencing technologies for plant genomics research. Brief Funct. Genomics 11: 3-11.
Till, B.J., J. Cooper, T.H. Ti, P. Colowit, E.A. Greene, S. Henikoff et al., 2007 Discovery of
chemically induced mutations in rice by TILLING. BMC Plant Biol. 7: 19.
Till, B.J., S.H. Reynolds, E.A. Greene, C.A. Codomo, L.C. Enns et al., 2011 Large scale
discovery of induced point mutations with high-throughput TILLING. Genome Res. 13:
524-530.
Varshney, R.K., H. Kudapa, M. Roorkiwal, M. Thudi, and M. Pandey et al., 2012 Advances
in genetics and molecular breeding of three legume crops of semi-arid tropics using
next-generation sequencing and high-throughput genotyping technologies. J.
Biosciences 37: 811-820.
Wasilewska, A., F. Vlad, C. Sirichandra, Y. Redko, F. Jammes, et al., 2008 An update on
abscisic acid signalling in plants and more... Mol. Plant 1: 198-217.
Xin, Z., M.L. Wang, N.A. Barkley, G. Burow, C. Franks et al., 2008 Applying genotyping
(TILLING) and phenotyping analyses to elucidate gene function in a chemically induced
sorghum mutant population. BMC Plant Biol. 8: 103.
Zander, M., D.A. Patel, A. Van de Wouw, K. Lai, M.T. Lorenc et al. 2013 Identifying
genetic diversity of avirulence genes in Leptosphaeria maculans using whole genome
sequencing. Funct. Integr. Genomics 13: 295-308.

30
Zhu, Y., H. Mang, Q. Sun, A. Hipps, and J. Hua, 2012 Gene discovery using mutagen-
induced polymorphisms and deep sequencing: application to plant disease resistance.
Genetics 192: 139-146.
Zuryn, S., S.L. Gras, K. Jamet, and S. Jarriault, 2010 A strategy for direct mapping and
identification of mutations by whole-genome sequencing. Genetics 186: 427-430.