Aquatic Food Production in the Coastal Zone: Data-Based Perceptions on the Trade-off Between...
18
17 Aquatic Food Production in the Coastal Zone: Data-Based Perceptions on the Trade-off Between Mariculture and Fisheries Production of the Mahakam Delta and Estuary, East Kalimantan, Indonesia P.A.M. van Zwieten, 1 A.S. Sidik, 2 Noryadi, 2 I. Suyatna 2 and Abdunnur 2 1 Aquaculture and Fisheries Group, Wageningen University, Wageningen, The Netherlands, e-mail: [email protected] 2 Faculty of Fisheries and Marine Sciences, University of Mulawarman, Samarinda, East Kalimantan, Indonesia © CAB International 2006. Environment and Livelihoods in Tropical Coastal Zones (eds C.T. Hoanh, T.P. Tuong, J.W. Gowing and B. Hardy) 219 Abstract In less than two decades, from 45,000 to 70,000 ha, or up to 70% of the mangroves in the Mahakam Delta, East Kalimantan, were converted to shrimp ponds. This is expected to affect the productive and buffer- ing function of intact mangroves, observable as shifts in composition and a possible reduction in produc- tivity of the coastal fisheries. The trade-off between mariculture and fisheries is explored with data from fisheries statistics, surveys and reported information. Analysis of trends and developments in total catch, catch by species category, catch rate, fishing effort, pond production and productivity gave no direct quantitative evidence of reduced coastal production and productivity. Shrimp-pond productivity (125 kg/ha/year) is low, stable and highly variable (CV = 69%) at the aggregated level of the delta. Since 1989, fishing effort increased and fishing patterns diversified, but aggregated catch rates did not decrease. Catches of rays and sharks decreased and the pelagic/demersal catch ratio increased. A shift towards more resilient species categories with a high turnover rate took place from 1993 to 1999, 4 to 10 years after the boom in pond construction. However, these clear shifts are not self-evidently related to man- grove conversion. Reasons for this are discussed. The potential for detection of changes in resource out- come and assessment the trade-off between mariculture and fisheries, at both the local level and through aggregated fisheries statistics, is limited because of the high variability in outcome. This implies a limited capacity for resolution of resource-use conflicts when evaluating competing claims informed by existing data and information on resource change. Introduction Can coastal aquaculture increase the total aquatic production of estuarine and coastal marine areas of the Mahakam Delta in East Kalimantan in a sustainable way? Mangrove forests have important functions in the life histories of fish and crustaceans: as a corridor Tropical chap 17 1/25/06 9:28 AM Page 219
Transcript of Aquatic Food Production in the Coastal Zone: Data-Based Perceptions on the Trade-off Between...
17 Aquatic Food Production in the CoastalZone: Data-Based Perceptions on the Trade-offBetween Mariculture and Fisheries Production
of the Mahakam Delta and Estuary, EastKalimantan, Indonesia
P.A.M. van Zwieten,1 A.S. Sidik,2 Noryadi,2 I. Suyatna2 and Abdunnur21Aquaculture and Fisheries Group, Wageningen University, Wageningen, The
Netherlands, e-mail: [email protected] of Fisheries and Marine Sciences, University of Mulawarman, Samarinda, East
Kalimantan, Indonesia
© CAB International 2006. Environment and Livelihoods in TropicalCoastal Zones (eds C.T. Hoanh, T.P. Tuong, J.W. Gowing and B. Hardy) 219
Abstract
In less than two decades, from 45,000 to 70,000 ha, or up to 70% of the mangroves in the Mahakam Delta,East Kalimantan, were converted to shrimp ponds. This is expected to affect the productive and buffer-ing function of intact mangroves, observable as shifts in composition and a possible reduction in produc-tivity of the coastal fisheries. The trade-off between mariculture and fisheries is explored with data fromfisheries statistics, surveys and reported information. Analysis of trends and developments in total catch,catch by species category, catch rate, fishing effort, pond production and productivity gave no directquantitative evidence of reduced coastal production and productivity. Shrimp-pond productivity (125kg/ha/year) is low, stable and highly variable (CV = 69%) at the aggregated level of the delta. Since 1989,fishing effort increased and fishing patterns diversified, but aggregated catch rates did not decrease.Catches of rays and sharks decreased and the pelagic/demersal catch ratio increased. A shift towardsmore resilient species categories with a high turnover rate took place from 1993 to 1999, 4 to 10 yearsafter the boom in pond construction. However, these clear shifts are not self-evidently related to man-grove conversion. Reasons for this are discussed. The potential for detection of changes in resource out-come and assessment the trade-off between mariculture and fisheries, at both the local level and throughaggregated fisheries statistics, is limited because of the high variability in outcome. This implies a limitedcapacity for resolution of resource-use conflicts when evaluating competing claims informed by existingdata and information on resource change.
Introduction
Can coastal aquaculture increase the totalaquatic production of estuarine and coastal
marine areas of the Mahakam Delta in EastKalimantan in a sustainable way? Mangroveforests have important functions in the lifehistories of fish and crustaceans: as a corridor
Tropical chap 17 1/25/06 9:28 AM Page 219

for diadromous species and as nursery,spawning and feeding areas for coastal pro-ductivity and diversity. Annually, nearly 3000km2,or 2%, of the world mangrove area isconverted, for instance, for pond mariculture.Conversion to ponds changes (essential) fishand crustacean habitats by closing off areas tothe dynamics of sea–river–land interactions.This results in increased cultured production,but there is evidence that it also leads todecreased coastal productivity and diversity(Turner, 1977; Turner and Boesch, 1987;Blaber, 2002; Mumby et al., 2004). Thus, pondculture competes with other natural resource-use claims, such as fisheries and biodiversityconservation in both mangroves and adjacentestuarine and coastal habitats. Informed deci-sion-making in the management of estuarinesystems requires a quantified view on the eco-logical impacts of pond production on adja-cent marine ecosystems that depend onwell-functioning mangroves. The capacity ofstakeholders using and managing aquaticresources to develop an informed view on thetrade-offs in marine resources is hampered bythe high diversity and variability of the estu-arine environment as well as by the highdiversity and adaptability of its uses. A firstrequisite for enabling the development ofevaluative capacity is a thorough examinationof trends, shifts and variabilities of relevantexisting data and information, for instance,from statistical monitoring of fisheries.
Essential in the development of a sharedview by users and managers on the state ofaquatic resources and the assessment oftrade-offs in resource use is the capacity todetect trends and shifts in coastal aquaticproduction, productivity and diversity. Thiscapacity is dependent on the predictabilityand size of the daily, seasonal and inter-annual variability in outcome of the variousresources. Variability in outcome obscuresthe perception of changes and trends, whileaggregation of data or observations reducestemporal and spatial variability. This inher-ently means that different stakeholders usingand managing a resource have differingcapacities to evaluate trends depending ontheir position in the decision-making processwith regard to the flow of information fromthe resource (van Densen, 2001). A high vari-
ability in resource outcome leads to a limitedcapacity to (i) perceive trends and changes asthey occur; (ii) attribute changes to causes;(iii) relate individual experience to aggre-gated information, and, with that, to agreeon the state of a resource and on the causesof change by stakeholders who have differ-ential access to information. This in turnresults in difficulties in communicationbetween and among stakeholders. Ifinformed agreement on states (and causes) ofchanges cannot be reached, the capacity toresolve conflicts will be hampered.
Within 20 years, up to 70% of the man-grove forest of the Mahakam Delta (Fig. 17.1)was converted to shrimp ponds, resulting inthe destruction of large tracts of essential fishhabitat. We can reasonably hypothesize thatthese rapid changes will be reflected in thedaily and annual resource outcome of coastalfishermen and pond farmers as well as in theexisting time-series of fisheries monitoringdata. We explore the capacity for perceptionof changes in resource outcome of pondfarmers, fishermen and fisheries managers inthe Mahakam Delta by examining existingdata and information on fisheries and brack-ish-water mariculture production and pro-ductivity. While shrimp culture in the‘mining mode’ leads to habitat destruction,resulting (potential) shifts in diversity andproductivity of natural resources that couldrepresent a long-term threat to the resourcebase and use options will not appear to beevident.
Time-series of fisheries-dependent datacollected by fisheries management institu-tions through monitoring of catch, fishingeffort and other production statistics, andexisting data and information collectedthrough specific surveys on fisheries andshrimp-pond production, were used toaddress the following questions:
1. What are the developments in fisheries(catch, effort and catch rates) and maricul-ture (area, production and productivity)?2. Is there evidence of a decreased produc-tivity of shrimp ponds (= tambaks) over timefor cultured shrimp (Udang windu, Peneausmonodon) and wild shrimp (U. bintik,Metapeneaus monoceros and M. brevirostris)?
220 P.A.M. van Zwieten et al.
Tropical chap 17 1/25/06 9:28 AM Page 220

3. What is the potential for detection ofchanges in productivity by fishermen andpond farmers given their daily catches andpond harvests?4. What is the potential for detection ofchanges in marine aquatic production andproductivity based on aggregated statisticalfisheries information?5. What are the quantitative indications of atrade-off between the two marine productionactivities?
Study Site: Development of ShrimpCulture and Fisheries
The Mahakam Delta is about 150,000 ha, ofwhich around 110,000 ha are categorized assalt- or brackish-water mangrove.Administratively, it is located in the regencyof Kutai Kartanegara. The landscape is adeltaic plain, with the meanders of the
Mahakam River ending in a complex fan-shaped network of multiple distributionchannels and small rivers subject to tidalinfluence. Before 1950, the natural vegetationwas a typical mangrove forest in anupstream to seashore succession of mixed-freshwater forest to dense Rhizophora spp.,with some degraded forest where oil palmplantations had been present. Nypa standsdominated, with 55% of the area covered,ahead of freshwater mangroves (17%) anddense Avicennia stands.
With the onset of the 20th century, thedelta had few settlements: fishermen andcoconut planters who had settled in its earlydecades largely left during World War II. Thissituation remained until the early 1970s,when oil exploration and production causedan influx of people – mainly from Sarawak –attracted by the labour opportunities. In theirwake, fisheries became important as well.With limited possibilities for preservation
The Trade-off between Mariculture and Fisheries Production 221
Fig. 17.1. Borneo (inset), indicating the position of the Mahakam Delta.
Tropical chap 17 1/25/06 9:28 AM Page 221

and transport, local fishermen did not con-sider shrimp to be valuable – small-sizedshrimp were sun-dried and sold as ebi (salteddried shrimp) – until two cold-storage facili-ties built in the early 1970s provided capitalto fishermen for modernization of their boatsand fishing equipment. Around 1975, theintroduction of trawls increased shrimpcatches considerably. In 1980, a decision bythe Indonesian government put an end to alltrawl fishing, a ruling carried out over thenext few years. A few milkfish ponds, devel-oped with methods from South Sulawesi,were already established in the delta as earlyas 1932: trials for the introduction of shrimpto substitute for the loss of trawl productionand to cater to increased internationaldemand achieved success in the early 1980s.This initiated a new immigration wave fromSulawesi. The pond opening rate increasedafter the introduction of excavators, whichreplaced manual labour around 1989, andagain after the monetary crisis of 1997 (Fig.17.2). The resulting boom in shrimp produc-tion turned the Mahakam Delta into one ofthe wealthiest areas in Indonesia.
Most stakeholders – pond owners, fisher-men, oil companies, government and NGOs– are pessimistic about the future of thedelta, which, in their view, will increasinglybecome ‘an ecological and economic desertunder the combined assault of mangroveclearing, erosion, pond development, dis-eases, salinity, and productivity and incomedecreases’. The most important issues arerelated to land conflicts and erosion.Furthermore, all stakeholders agreed thatmaintaining the sustainability of shrimp-pond production and protecting or improv-ing mangrove areas for the reproduction offish and crustaceans have a high priority,indicating local awareness of potential trade-offs in natural resource use. Nevertheless,when weighing ecological and economicissues, it appeared that mangroves were seenmainly as valuable if cleared for ponds. Onlyfishermen did not appear to be much trou-bled by the concerns expressed by otherstakeholders, except on the issue of protec-tion of nursery and breeding areas, indicat-ing local awareness of potentially conflictingresource use (Bourgeois et al., 2002).
Data and Methods of Analysis
Data
Fisheries monitoring data available from1980 to 2004 in statistical yearbooks wereobtained from the Kelautan dan Perikanan inSamarinda (provincial office) and Tenggarong(regency office). They were used to examinedevelopments in fisheries and mariculture(question 1), trends in overall productivity ofponds (question 2), the potential to detectchanges in marine production (question 3)and evidence of trade-offs between the twoactivities (question 5). The two offices moni-tor catch by species category and gear type,effort by gear type and pond production byspecies category by district and by fresh andmarine waters. All data presented andanalysed refer to the Regency of Kutai thatencompasses the Mahakam Delta.
Detection of trends in pond productivity(question 2) and in changes by pond farmers(question 4) was examined with dataobtained from a survey on the managementand productivity of the tambak culture con-ducted by the Faculty of Fisheries andMarine Science, Mulawarman University,Samarinda (UNMUL-FPIK), commissionedby Total Indonesia. The survey encompassed18 locations distributed over the delta in dif-ferent mangrove habitats, indicated by salin-ity. Between July and September 2003, 125farmers were interviewed. Physical andchemical parameters were measured from aselected pond managed by the people inter-viewed. We used the following data:
● Production of the last harvest (kg/ha) ofstocked P. monodon and wild Metapenaeusspp. (N = 96)
● Total area and number of ponds (n = 125); ● Year of pond construction (pond age) (n =
124); and● Management factors: (i) salinity (n = 125),
pH (n = 124), % water exchange (n = 120);(ii) stocking density of tiger shrimp (n =118); and (iii) input of fertilizers nitrogen,phosphate and potassium (NPK) (n = 59),triple superphosphate (TSP) (n = 49) andlime (n = 15) (all kg/ha).
222 P.A.M. van Zwieten et al.
Tropical chap 17 1/25/06 9:28 AM Page 222

Shrimp ponds are stocked and harvestedtwo to three times a year. All parameters in thesurvey referred to the last harvest period,except for salinity and pH, which were mea-sured in situ. For each factor with n <125, thevalue of the non-recorded observations = 0,except for stocking density, which was notknown when not recorded, as often multiplestockings take place over a harvest periodbecause of the scarcity of shrimp postlarvae.Analysis of variance was used to examine thesignificance of difference (� � 0.05) in the meanharvest of ponds with non-zero values for aparameter vis-à-vis those with observations = 0or not known. This was never the case.
Daily catch variability (question 4) wasexamined for four small shrimp trawlersfrom the village of Muara Badak, located onthe north coast of the delta, based on dailylog-book recordings over a period of 6months.
Estimates of total pond area development,taken from four studies (Table 17.1), arebased on interpretations of satellite imagery.
Dutrieux (2001) and Bourgeois et al. (2002)also based their estimates on aerial photogra-phy and interpretations of old maps, includ-ing historical settlement analysis. These arethe most consistent time-series as the inter-pretations are performed by the same team.However, all studies suffer from a lack of(access to) methodological descriptionsand/or limited ground truthing, hamperingthe evaluation of the discrepancies betweenthe estimates. Despite this, it can be con-cluded that in 2004 at least 50–70% of thetotal brackish- and saltwater mangrove hadbeen converted. We have used the estimatesof Dutrieux (2001), Bourgeois et al. (2002)and Bappeda Kukar (2003) to interpolate andextrapolate the total pond area from 1980 to2004 through
Tambak area (ha) = 6006 x 100.17 (year 1993) (17.1)
and checked the results with information onthe pond opening rate reconstructed byBourgeois et al. (2002) (Fig. 17.2)
The Trade-off between Mariculture and Fisheries Production 223
100
90
80
70
60
50
40
30
20
10
0
20
18
16
14
12
10
8
6
4
0
2
PondsDegraded forestFreshwater mangroveOther mangroveNypa
% la
nd c
over
% new
ponds/total area
Start of oil, gasexploration and
cold storagefacilities Trawling
prohibitedUse of
excavatorsMonetary
crisis
1965 1970 1975 1980 1985 1990 1995 2000 2005
Year
Fig. 17.2. Estimated pond opening rate (bars) related to specific events (arrows) and land cover in theMahakam Delta (lines with markers). Based on a GIS database constructed from historic settlement analysis,maps, aerial photographs and satellite photographs (adapted from Bourgeois et al., 2002).
Tropical chap 17 1/25/06 9:28 AM Page 223

Methods of analysis
Data treatment
The 24 statistical yearbooks contain catchinformation on 60 species (groups); for theregency of Kutai, 39 contain time-series ofdata. Trends analysed were (i) by total catch;(ii) catch of demersal/benthopelagic andpelagic species (Froese and Pauly, 2005); and(iii) catch by 38 categories of fish, crustaceansand molluscs (two categories combined).Catch information is collected for 25 fishingmethods, but we aggregated the numbers ofgears and total catch into the six main cate-gories recorded before 1988: large trawls;small trawls and seines (Pukat kantong:shrimp trawls, lampara and Danish, beachand purse seines); gill nets (Jaring insang:drift nets, encircling nets, shrimp gill nets,stationary gill nets, trammel nets); lift nets(Jaring angkat: boat/raft nets, bagan, scoopnets, other lift nets) and hooks and lines(Pancing: tuna longlines, longlines, set long-lines, other poles and lines, troll lines). A cat-egory ‘traps’ (Perangka: guiding barriers,stow nets, portable traps, other traps) wasalso aggregated with a category ‘others’(Anadara shell fish, muro-ami and others)recorded only occasionally with low levels ofoutput. Catch rate by gear group was calcu-lated by dividing the annual catch per geargroup by the associated number of gears.
The productivity of shrimp ponds wascalculated by dividing the total annual pro-duction and the production by species cate-gory by the estimated area (ha) of ponds inthat year.
Data analysis
Trends were analysed with the polynomialregression model:
G(m)i = a + b*yeari + c*yeari *yeari + ei (17.2)
where G(m) I is the time-series of catch (fish-eries) or production per hectare (tambaks); ais the intercept; b and c are the slope; yeari isthe linear regression term; year I and *year iare the quadratic terms; and � I is the residualerror.
Only significant parts of the model (� �0.05) were retained, resulting in four possiblemodels: mean, linear, quadratic and polyno-mial. Concavity and explained variance ofthe quadratic and linear terms of significantpolynomial models were evaluated to obtainan indication of direction, timing andstrength of the reversal in long-term trends.Trends were tested over the whole periodand over the period from 1989 onward,when pond opening rates increased dramati-cally. An indication of recent change relativeto the long-term trend was obtained byexamining the short-term trend over the last
224 P.A.M. van Zwieten et al.
Table 17.1. Area of the Mahakam Delta covered by mangrove, settlements or shrimp ponds (tambak).All analyses are based on interpretation of satellite imagery and GIS maps (see text for an evaluation ofthe estimates).
Item Year
19841 19912 19921 19962 19981 19991 20012 20013 20044
Mangrove (ha) 105,999 95,096 40,219 – 60,818Settlements 74 125 129 –Tambak (ha) 420 3,629 3,687 14,480 52,300 67,000 69,354 50,000 45,297
(31,000, (2,036,in prep.) in prep.)
Total (ha) 110,000 109,702 110,000 109,702 111,000 110,000 109,702 110,000 108,153
1 Dutrieux (2001).2 Bappeda Kukar (2003).3 Bourgeois et al. (2002).4 From Facultas Perikanan dan Ilmu Kelautan, 2005 (FPIK) (2005). Produktivitas tambak di kawasan
Delta Mahakam (Shrimp pond productivity on Mahakam Delta). Draft Report to Total Indonesia,Balikpapan, March 2005. pag. var.)
Tropical chap 17 1/25/06 9:28 AM Page 224

five years. Serial correlation, producing addi-tional variability obscuring long-term trends,was examined in time-series of shrimp-pondproductivity by cross-correlation at lag = 1(year) of the residuals of the linear trendanalysis.
The effect of age on stocked and wildshrimp productivity was assessed by a two-stage regression analysis using general linearmodelling (SAS-Institute, 1989). The firstvariance reduction was achieved with all sig-nificant (� � 0.05) factors and sensible inter-actions that could have an effect on theproduction of each species and for whichdata were available. In the next step, theresiduals were regressed on age as anexplanatory factor. All time-series wereorthogonalized before analysis. All datawere 10log-transformed to fulfil the assump-tion of normal distribution of residuals.
Variability, expressed as coefficient ofvariation (CV is standard deviation scaled bythe mean), is used here to scale (basic) uncer-tainties in fisheries and aquaculture out-comes. CV is a powerful indicator of thecapacity to perceive trends and shifts. Forinstance, low to medium variabilities (CVs of23–60%) in daily catches are found in trawlfisheries, medium CVs of 50–75% in gill-netfisheries and high to extreme CVs of80–500% in light fisheries (van Densen, 2001;van Zwieten et al., 2002; Oostenbrugge et al.,2002; Jul-Larsen et al., 2003b). After variancereduction of 10log-transformed data byknown (spatial, temporal, management) fac-tors, the residual variance from the models,also called random or basic uncertainty (vanZwieten et al. 2002), can be expressed as CVthrough (Aitchison and Brown, 1957)
where � is the standard deviation in theresiduals of the 10log-transformed data.
All CVs are directly comparable.Variabilities at higher scales of aggregationare estimated by dividing the variability at alower scale by √n, with n as the number ofunits aggregated. Similarly, disaggregation isdone by multiplying by √n. Both proceduresassume independence of observations.
Trend perception can be approximated
statistically through power analysis. Thenumber of years needed to significantlydetect a trend b in the time-series can be cal-culated iteratively given decision limits �and �, and the trend-to-noise (b/s) ratio fol-lowing the inequality (van Zwieten et al.2002):
where b is the trend parameter (slope) in thelinear regression; n is the number of observa-tions (year); and t�/2 and t� are the decisionrules of a t-distribution, where � is the prob-ability of a type I error (a trend is rejectedfalsely) and � the probability of a type IIerror (a trend is accepted falsely). In ouranalysis, � = � = 0.1; s is the standard devia-tion of the residuals.
Data-based Perceptions on Changes inAquatic Food Production
Over 24 years, the total fishery and maricul-ture production in Kutai has increased by3.3% per year from 5700 to 27,200 t. Total fishcatch increased at a slower rate of 2.9% peryear from 5400 to 17,100 t. After a drop inlevels in the late 1980s, crustacean catchesreached 1300 t in 2001, the same level as theaverage catch of 1980 to 1987. The crustaceanfishery decreased in importance from around20% of the total production in the early 1980sto 4–5% at present. From 1980 onward,shrimp culture increased from 5% (285 t) ofthe total production to 29% (7803 t) in 2004(Fig. 17.3).
Mariculture
Total annual pond production increased lin-early with the area under cultivation, whilethe shrimp production increased by a factorof 1.24 (Fig. 17.4). Over a 24-year period,fisheries statistics indicate a shift in maricul-ture from fish to prawns around 1995 (Fig.17.5). Initially, stocked P. monodon dominatedshrimp production. From 1990 to 2000, dur-ing the boom in pond construction, wild
bs
n n nt t
( )( )( ) .
− +≥ + ( )1 1
1217 42α β
CV e= − ( )100 1 17 32 303 2* .. *σ
The Trade-off between Mariculture and Fisheries Production 225
Tropical chap 17 1/25/06 9:28 AM Page 225

Metapeneaus spp. formed 63–81% of the totalproduction. Presently, about 50% of the pro-duction again is stocked P. monodon. Theproduction of mullet and milkfish increasedconcurrently, until 1997, to 1357 and 1059 t,respectively. Mullet decreased to about 300 tand milkfish remained stable. The produc-tion of other fish species (wild stocks of, forinstance, Lates calcarifer), never important, isnow zero. Inter-annual variability in produc-tion is high for all species, ranging from a CVof 93% (P. monodon) to 179% (mullet). Overthe last 5 years, the production of all cate-gories has stabilized.
Tambaks are cultured extensively: with125.4 kg/ha, long-term productivity is stableand low, but with a high inter-annual vari-ability (CV = 69%) at the aggregated level ofthe delta. Since 1980, productivity of both
stocked and wild shrimp has increased by afactor of 1.09 /year, and both have a residualinter-annual CV of, respectively, 76 and125%. Stocked shrimp productivity has stabi-lized at 41 kg/ha over the last 5 years, butwild shrimp decreased to a stable level of 44kg/ha after a peak in 1997. In both cases,only the linear trends were significant (� �0.05), but with low power: the observedtrends could be detected only with 20–26years of data (� = � = 0.1) (Table 17.2). Noevidence of serial correlation was found inthe residual time-series of stocked shrimpproductivity. But the residual productivity ofwild shrimp of subsequent years is stronglycorrelated (� = 0.55, r2 = 0.30, p < 0.01), indi-cating that natural processes regulating theoverall productivity of wild shrimp in thedelta are important for cultured productivity.
226 P.A.M. van Zwieten et al.
Marine and tambak production
TotalTambakCrustaceansDemersalsBentho-pelagicsPelagics
1980 1985 1990 1995 2000
Year
101
102
103
104
105
Pro
duct
ion
(t)
Fig. 17.3. The development of the total marine and brackish-water fisheries and tambak culture productionof the regency of Kutai, East Kalimantan. Closed markers, capture fisheries; open circles, tambak culture;total, aggregated fisheries and culture production (data from statistical yearbooks, Fisheries Service).
Tropical chap 17 1/25/06 9:28 AM Page 226

Average shrimp productivity of one har-vest calculated from the UNMUL-FPIK sur-vey is 66 kg/ha (CVharvest = 119). With two tothree harvests per year, this amounts to anannual productivity of 130–190 kg/ha, witha CVyear = CVharvest/√n = 84 – 68%. The aver-age productivity per harvest of stocked P.monodon is 42.5 kg/ha (CVharvest = 117%;CVyear = 83 – 68%) and of wild Metapeneausspp. is 25 kg/ha (CVharvest = 163%; CVyear =115 – 94%). Thus, the annual average pro-ductivity is higher than the estimate fromfisheries statistics. However, the variabilitiesare in the same order of magnitude, which isunexpected as aggregation of pond produc-tion over the whole delta scaled by the totalpond area should lower variability. The highvariability in fisheries statistics could be dueto data collection methods, to our estimationprocedure of the area under cultivation or tohigh co-variance in the production per pondinducing increased variability. The lattermay result, for example, from overall harvestfailure induced by weather or through vari-
able availability of shrimp larval production.Larger-sized ponds had lower productivity,also noted by Bourgeois et al. (2002), butpond size explained more variation in wildshrimp (13%) than in stocked shrimp (4%)(Table 17.3). None of the management factorshad a significant effect on stocked P. monodonproductivity. Fertilizer application had a sig-nificant positive effect on wild Metapenaeusspp. (Table 17.2). However, as the mean har-vest of fertilized ponds did not differ signifi-cantly from that of non-fertilized ponds, theeffect was cancelled in the overall variability.Lowered productivity with increasing agewas observed with stocked shrimp, but theage effect explained only 5% of the residualvariance after correction for size (Table 17.2).
Fisheries
The fisheries around the delta are small-scaleand multigear and have a limited spatialrange: at present, up to 50% of the vessels are
The Trade-off between Mariculture and Fisheries Production 227
Total (incl. fish)Shrimp
Pro
duct
ion
(t)
10,000
1,000
100
10
110 100 1,000 10,000 100,000
Total pond area (ha)
y = 1.01*x – 1.02r2 = 0.94, P <0.001
y = 1.24*x – 2.25r2 = 0.95, P <0.001
Fig. 17.4. Total and shrimp production in the mariculture of the Mahakam Delta related to area undercultivation (total pond area). See text for the estimation procedure of total pond area.
Tropical chap 17 1/25/06 9:28 AM Page 227

228 P.A.M. van Zwieten et al.
400
300
200
100 0
kg/ha
8000
6000
4000
2000 0
tons
4000
3000
2000
1000 0
4000
3000
2000
1000 0
50 40 20 10 030
100 80 40 20 060
Tota
lP.
mon
odon
Met
apen
aeus
1980
1985
1990
1995
2000
2005
1980
1985
1990
1995
2000
2005
1980
1985
1990
1995
2000
2005
Year
Fis
hC
rust
acea
ns
Fig.
17.
5.D
evel
opm
ent o
f the
tota
l, an
d sh
rim
p, p
rodu
ctio
n (to
p pa
nels
) and
pro
duct
ivity
(bot
tom
pan
els)
in th
e M
ahak
am D
elta
, 198
0–2
004.
The
mea
nof
the
time-
seri
es is
dis
play
ed if
the
tren
d is
not
sig
nific
ant (
��
0.05
) (da
ta fr
om s
tatis
tical
yea
rboo
ks, F
ishe
ries
Ser
vice
).
Tropical chap 17 1/25/06 9:28 AM Page 228

The Trade-off between Mariculture and Fisheries Production 229Ta
ble
17.
2.Tr
end
and
pow
er a
naly
sis
of th
e m
arin
e ca
tch
(198
9–20
04)
and
tam
bak
prod
uctiv
ity (
1980
–200
4). P
DT,
pop
ulat
ion
doub
ling
time
(H, h
igh,
> 4
.4–1
4ye
ars;
M, m
ediu
m, >
1.4
–4.4
yea
rs; L
, low
, < 1
5 m
onth
s); d
f, de
gree
s of
free
dom
; CV,
coe
ffici
ent o
f var
iatio
n; b
, slo
pe o
f the
line
ar tr
end
(sig
nific
ance
��
0.05
);
b/s,
tren
d-to
-noi
se r
atio
; n, n
umbe
r of
yea
rs o
f dat
a ne
eded
to d
etec
t tre
nd b
(�
= �
= 0
.1);
Lin
, lin
ear;
Pol
, pol
ynom
ial;
Qua
, qua
drat
ic; r
2 , c
oeffi
cien
t of
dete
rmin
atio
n; n
s, n
on-s
igni
fican
t; �
, neg
ativ
e sl
ope/
dow
nwar
d co
ncav
ity; +
, pos
itive
slo
pe/u
pwar
d co
ncav
ity. N
umbe
rs a
ssoc
iate
d w
ith n
ames
ref
er to
the
spec
ies
aggr
egat
ions
in F
ig. 1
7.8.
Spe
cies
P
DT
dfC
Vb
b:s
nM
odel
r2Ye
ar o
f tre
nd r
ever
sal
Slo
pe/c
onca
vity
Mar
ine
catc
h (
ton
s)R
ays
(Raj
iform
es)
– 10
H15
70–
0.14
0.49
9Li
n0.
85�
Sha
rks
(Ela
smob
ranc
hii)
– 10
H15
83–
0.06
0.19
16Li
n0.
46�
Cro
aker
s, d
rum
s (S
ciae
nida
e) –
9L
155
–0.
020.
826
Pol
0.67
1995
�G
runt
ers,
sw
eetli
ps (
Hae
mul
idae
) –
5M
1545
0.02
0.12
21P
ol0.
6219
98�
Yello
w-t
ail f
usili
ers
(Cae
sion
idae
) –
9M
1451
–0.
030.
1321
Pol
0.86
1996
�S
kipj
ack
tuna
(S
com
brid
ae)
– 4
M14
540.
030.
1518
Pol
0.57
1999
�B
ig e
yes
(Hol
ocen
trid
ae)
– 9
L15
84P
ol0.
8219
96�
Trev
allie
s (C
aran
gida
e) –
2M
1432
Qua
0.32
1996
/7�
Goa
tfish
(M
ullid
ae)
– 5
L15
69Q
ua0.
5919
96/7
�S
cads
(C
aran
gida
e) –
2L
1511
7Q
ua0.
5419
96/7
�I.
halib
ut (
Ple
uron
ectif
orm
.) –
5M
1513
0Q
ua0.
3719
96/7
�R
ainb
ow s
ardi
ne (
Clu
peid
ae)
– 3
L14
440.
040.
2115
Lin
0.51
+C
omm
on s
quid
(C
epha
lopo
da)
L9
460.
080.
4310
Lin
0.61
+P
ony
f./sl
ipm
outh
s (L
eiog
nath
idae
) –
5L
1487
0.08
0.24
14Li
n0.
55+
Mud
cra
bs (
Por
tuni
dae)
– 1
2L
1593
0.10
0.28
12Li
n0.
66+
Met
apen
eaus
shr
imp
(Pen
aeid
ae)
– 15
L14
950.
080.
2115
Lin
0.50
+G
iant
tige
r pr
awn
(Pen
aeid
ae)
– 13
L13
960.
100.
2912
Lin
0.62
+S
ea c
at-fi
shes
(A
riida
e) –
5M
1537
P
ol0.
6819
95+
Thr
eadfi
ns (
Pol
ynem
idae
) –
11L
1539
0.02
0.12
22P
ol0.
5319
94+
Anc
hovi
es (
Eng
raul
idae
) –
3L
1560
0.05
0.20
16P
ol0.
6819
93+
Frin
gesc
ale
sard
inel
la (
Clu
peid
ae)
– 3
L15
620.
030.
1123
Pol
0.66
1995
+M
ulle
ts (
Mug
ilida
e) –
11
M15
81P
ol0.
6319
98+
Bla
ck p
omfr
ets
(Car
angi
dae)
– 6
M15
63Q
ua0.
4019
96/7
+E
aste
rn li
ttle
tuna
(S
com
brid
ae)
– 4
L15
71Q
ua0.
2919
96/7
+B
arra
mun
di (
Cen
trop
omid
ae)
– 7
H15
81Q
ua0.
5619
96/7
+N
arro
w b
and
king
mac
kere
l M
1511
4Q
ua0.
5919
96/7
+(S
com
brid
ae)
– 4
Indo
pac
king
mac
kere
l M
1412
3Q
ua0.
6019
96/7
+(S
com
brid
ae)
– 4
Oth
er fi
sh
1218
5–
0.14
0.27
13Li
n0.
54�
Oth
er s
hrim
p –
16
1445
0.05
0.28
12Li
n0.
67+
Tota
l cat
ch –
115
100.
006
0.14
19Li
n0.
34+
Tam
bak
prod
uctiv
ity (
kg/h
a)P
enea
us m
onod
on23
760.
040.
1320
Lin
0.44
+M
etap
enea
us s
pp.
2312
60.
040.
0926
Lin
0.29
+To
tal t
amba
k pr
oduc
tivity
2369
Mea
nns
Mea
n m
odel
s w
ere
obta
ined
with
red
sna
pper
(Lu
tjani
dae)
– 8
(C
V, 2
9, P
DT,
M);
Spi
ny lo
bste
r (P
alin
urid
ae)
– 12
(36
, L);
Indi
an m
acke
rel (
Sco
mbr
idae
) –
4 (3
8,L)
; Jac
k tr
eval
lies
(Car
angi
dae)
– 2
(42
, M);
Gro
uper
s (S
erra
nida
e) –
8 (
44, M
); S
ilver
pom
fret
(S
trom
atei
dae)
– 6
(44
, M);
Wol
f her
rings
(C
hiro
cent
ridae
) –
3(5
1, L
); B
anan
a pr
awns
(P
enae
idae
) –
14 (
76, L
); a
nd o
ther
mar
ine
catc
h (2
07).
Tropical chap 17 1/25/06 9:28 AM Page 229

non-motorized; the remainder have dieselengines of < 5 hp or outboard engines. Mostgears are more or less stationary: gill netsand traps/barriers each account for about30% of the gears and lift nets/bagansaccount for another 18%. The active fishinggears, trolls and lines, and trawls eachaccount for about 10% of the gears (Fig.17.6). The annual catch of 1000–3500kg/gear/year is comparable with that of anysmall-scale fishery (Jul-Larsen et al., 2003a).Three gear categories show variable butincreasing catch rates over the past 15 years(gill nets, trawls and lift nets/bagans),whereas those of lines and traps are variablebut stable (Fig. 17.7). This is contrary toexpectation as increased effort generallyleads to decreased catch rates. Changes ingear, catchability resulting from increasedgear efficiency, target species, spatial alloca-tion of effort or changes in carrying capacitydue to environmental forcing could eachresult in the observed developments. As yet,none of these explanations can be excluded.
Since 1980, the marine fisheries showedan increasing and (in recent years) stabilizingcatch of pelagic and demersal/bentho-pelagic species, but with a shift in impor-
tance to pelagics (the ratio of pelagics/dem-ersals increased from 0.4 to 1.6). An overallstable but highly variable catch of shrimpdropped to almost zero around 1988 (Fig.17.5). Trends reveal a clear shift from shrimpto fish species after 1987, possibly as a resultof the trawl ban. After that, shrimp and fishcatches, respectively, initially decreased andincreased rapidly in concurrence for mostspecies (Fig. 17.8, Table 17.2). Since 1989, raysand sharks, highly vulnerable to fishingpressure (Myers and Worm, 2003) and withhigh population doubling times (PDT)(Froese and Pauly, 2005), are the only speciescategories with a significant (� � 0.05) long-term linear decreasing trend. All species witha long-term linear increasing trend had lowPDT. From 1995 to 1999, catches in nine cate-gories started decreasing or stabilizing,whereas from 1993 to 1998 ten categoriesshowed a reversal to increasing trend. Thesereversals indicate a shift from species thatare less resilient to a changing environment,including increased fishing effort(high–medium PDT), to species highlyresilient to changes but also with highlydynamic population sizes (low PDT). Thedistribution of high, medium and low PDT
230 P.A.M. van Zwieten et al.
Table 17.3. Variance reduction in productivity (kg/ha) of wild (Metapenaeus monoceros) and stockedshrimp (Penaeus monodon) in four models with pond size, age and management factors as explanatoryfactors. df, degrees of freedom; MSE, mean square error; r2, coefficient of determination; b, slope; s,standard deviation; Res, residuals; size, pond size; age, number of years since pond construction; TSP,triple superphosphate; NPK, nitrogen, phosphate, potassium; TSP*NPK, interaction term (from FPIK-UNMUL survey on 125 tambaks in the Mahakam Delta).
Wild shrimp Stocked shrimp
Model df MSE r2 b df MSE r2 b Trend tonoise ratio
(b:s)Total 85 0.296 95 0.213Res size 84 0.262c 0.13 �0.579 94 0.207a 0.04 �0.308Res size age 83 n.s. – – 93 0.198a 0.09 �0.021 0.048Total 33 0.379Res TSP 32 0.296b 0.24 0.448TSP size 31 0.274b 0.32 �0.653Total 29 0.515TSP*NPK 28 0.300b 0.30 0.235TSP*NPK size 27 0.224b 0.49 �1.069
a significance [‘less than or equal to’ symbol] 0.05;b significance [same symbol] 0.01;c significance [same symbol] 0.001; n.s., non-significant.
Tropical chap 17 1/25/06 9:28 AM Page 230

is, respectively, 2, 9 and 8 for categories thathave a long-term, a recently decreasing or notrend, and 1, 5 and 10 for those with increas-ing trends (Table 17.2).
Inter-annual variability for all categoriesis extremely high. For instance, the residualinter-annual CV of Metapeneaus spp. of 95%is as high as the daily variability experiencedby four small shrimp trawler fisheries in the
estuary (van Zwieten, unpublished data).Though a shrimp fisher will experience highinter-annual variability because of high vari-ability in annual local shrimp biomass, it canbe demonstrated that the CV from the fish-eries statistics is outside any ordinary experi-ence of a fisherman. Dis-aggregation overabout 1600 (see Fig. 17.7) small-trawler fish-ermen presently fishing in the estuary yields
The Trade-off between Mariculture and Fisheries Production 231
Fig. 17.6. The development in fishing effort around the Mahakam Delta (a) the number of vessels andmotorization of vessels; (b) the number of gears by type (data from statistical yearbooks of the FisheriesService). The number of non-motorized vessels was underestimated before 2003 data collection procedureswere changed (pers. info., Fisheries Service, Samarinda).
Fig. 17.7. The development in catches per unit of effort (= catch rate) for the main gear groups of thefisheries around the Mahakam Delta.
Tropical chap 17 1/25/06 9:28 AM Page 231

232 P.A.M. van Zwieten et al.
Year
1980 1990 2000 1980 1990 2000 1980 1990 2000 1980 1990 2000
800
600
400
200
0
800
600
400
200
0
800
600
400
200
0
1000
600
400
200
0
800
4000
3000
2000
1000
0
1200
9000
6000
3000
0
2000
1500
1000
500
0
1000
600
400
200
0
600
6000
2000
0
4000
1500
500
0
1000
6000
2000
0
4000
1800
600
0
1200
20,000
4000
0
12,000
16,000
8000
5000
1000
0
3000
4000
2000
5000
1000
0
3000
4000
2000
5000
1000
0
3000
4000
2000
1. Total 2. Scad, trevally, jack,pompano, soomber
3. Sardines,anchovies
4. Tunas,mackerals
5. Demersals 6. Pomfrets 7. Baramundi 8. Grouper, snapperemperor
9. Breams, drums,croakers
10. Sharks, rays 11. Mullets, threadfins 12. Crabs, lobsters
13. Tiger prawn 14. Banana prawn 15. White shrimp 16. Other shrimp
Tons
Fig. 17.8. The development of capture fisheries production around the Mahakam Delta, 1980–2004 . Toppanel, total and pelagic species catch; middle panels, demersal species; lower panel, shrimp species. Theaggregation of 39 species categories in the 16 categories presented here is explained in Table 17.2. Themean of the time-series is displayed if the trend is not significant (� � 0.05)(data from statistical yearbooksof the Fisheries Service).
Tropical chap 17 1/25/06 9:28 AM Page 232
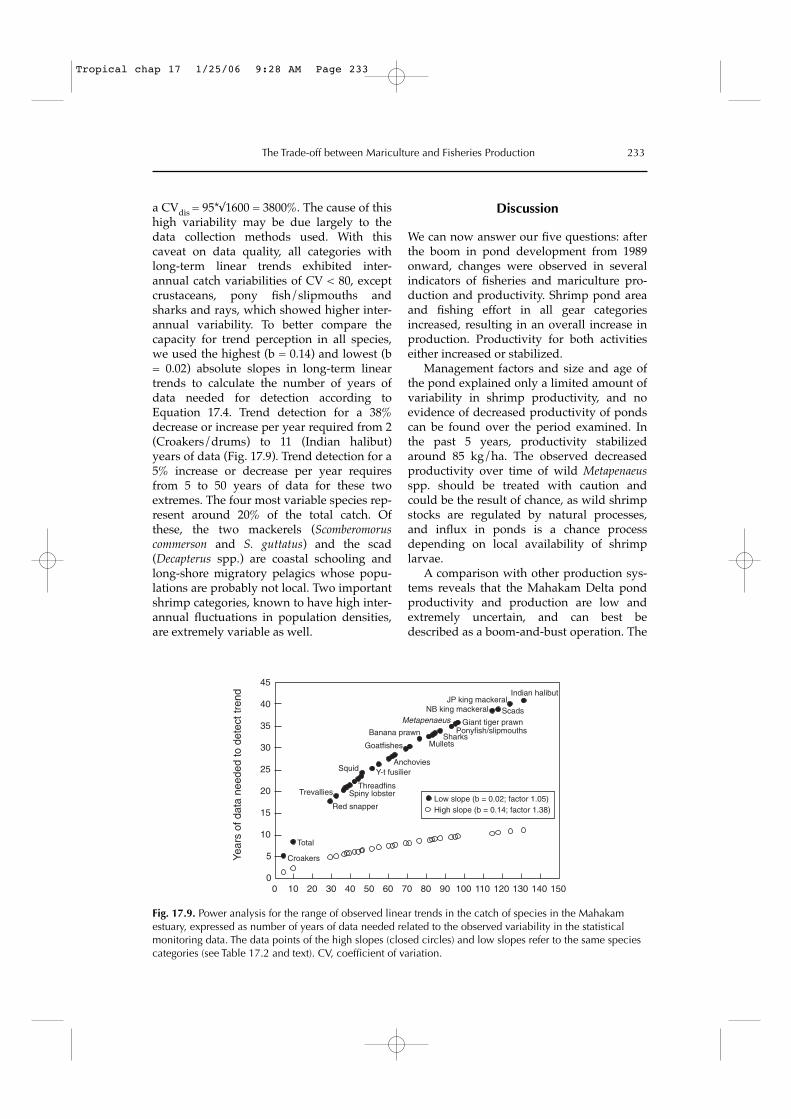
a CVdis = 95*√1600 = 3800%. The cause of thishigh variability may be due largely to thedata collection methods used. With thiscaveat on data quality, all categories withlong-term linear trends exhibited inter-annual catch variabilities of CV < 80, exceptcrustaceans, pony fish/slipmouths andsharks and rays, which showed higher inter-annual variability. To better compare thecapacity for trend perception in all species,we used the highest (b = 0.14) and lowest (b= 0.02) absolute slopes in long-term lineartrends to calculate the number of years ofdata needed for detection according toEquation 17.4. Trend detection for a 38%decrease or increase per year required from 2(Croakers/drums) to 11 (Indian halibut)years of data (Fig. 17.9). Trend detection for a5% increase or decrease per year requiresfrom 5 to 50 years of data for these twoextremes. The four most variable species rep-resent around 20% of the total catch. Ofthese, the two mackerels (Scomberomoruscommerson and S. guttatus) and the scad(Decapterus spp.) are coastal schooling andlong-shore migratory pelagics whose popu-lations are probably not local. Two importantshrimp categories, known to have high inter-annual fluctuations in population densities,are extremely variable as well.
Discussion
We can now answer our five questions: afterthe boom in pond development from 1989onward, changes were observed in severalindicators of fisheries and mariculture pro-duction and productivity. Shrimp pond areaand fishing effort in all gear categoriesincreased, resulting in an overall increase inproduction. Productivity for both activitieseither increased or stabilized.
Management factors and size and age ofthe pond explained only a limited amount ofvariability in shrimp productivity, and noevidence of decreased productivity of pondscan be found over the period examined. Inthe past 5 years, productivity stabilizedaround 85 kg/ha. The observed decreasedproductivity over time of wild Metapenaeusspp. should be treated with caution andcould be the result of chance, as wild shrimpstocks are regulated by natural processes,and influx in ponds is a chance processdepending on local availability of shrimplarvae.
A comparison with other production sys-tems reveals that the Mahakam Delta pondproductivity and production are low andextremely uncertain, and can best bedescribed as a boom-and-bust operation. The
The Trade-off between Mariculture and Fisheries Production 233
Year
s of
dat
a ne
eded
to d
etec
t tre
nd
45
40
35
30
25
20
15
10
5
00 10 20 30 40 50 60 70 80 90 100 110 120 130 140 150
Indian halibutJP king mackeral
ScadsNB king mackeral
Giant tiger prawnPonyfish/slipmouths
Metapenaeus
SharksMullets
Banana prawn
Goatfishes
AnchoviesY-t fusilier
ThreadfinsSpiny lobster
Red snapper
Trevallies
Squid
Total
Croakers
Low slope (b = 0.02; factor 1.05)High slope (b = 0.14; factor 1.38)
Fig. 17.9. Power analysis for the range of observed linear trends in the catch of species in the Mahakamestuary, expressed as number of years of data needed related to the observed variability in the statisticalmonitoring data. The data points of the high slopes (closed circles) and low slopes refer to the same speciescategories (see Table 17.2 and text). CV, coefficient of variation.
Tropical chap 17 1/25/06 9:28 AM Page 233

average harvest in the extensive shrimp cul-ture in Probolingo, East Java, was 300kg/ha/crop (Hariati et al., 1998). With anaverage of 125 kg/ha/year (shrimp: 85 (sta-tistical monitoring) to 130–190 (survey)kg/ha/year) and a mode in farm size in theMahakam of 4–7 ha (Bourgeois et al., 2002),the annual production per farm was 500–875kg. The annual shrimp output, fished inaround 180 days/year, of four small-scaleshrimp trawler fishermen in the estuary isaround 900 kg (van Zwieten, unpublisheddata). The overall CV in their total daily mul-tispecies catch is 75%; taken separately, thefour shrimp species in their catch (range0.15–1.3 kg/day) had a high CV of100–155%. This CV per species per day is com-parable to the CV per harvest for individualpond owners of 119%). Inter-annual CV incatches from a wide range of fish stocksrange from 9% to > 100%; inter-annual CV incrop production ranges from 10% (inten-sively managed agriculture) to 70% (mar-ginal rainfed agriculture) (van Densen, 2001).The extreme variability in the Mahakampond productivity means that the potentialfor detecting changes, for instance, as aresult of better management practices, is lowboth on an aggregated level of fisheries sta-tistics and for individual pond owners. Thisis corroborated by Bourgeois et al. (2002):while causes of variability are readily dis-cussed by stakeholders, there is little consen-sus about them, except for the effect ofrainfall. The importance of better manage-ment practices and mangrove protection ishigh on the list of everyone involved, butexperience is limited on what this couldachieve. It will not be easy to gain this expe-rience barring a long-term commitment tobetter management practices.
Notwithstanding data aggregation, low-ering variability, limited data qualityresulted in high variability in fishery statis-tics, obscuring the potential for detectingchanges in marine production and produc-tivity. Nevertheless, the observed trends,variabilities and shifts in fishery catches dohave biological realism: the described devel-opments in relative species composition aregeneral trends appearing in many fish com-munities under stress. Although a significant
shift in catch towards shorter-lived speciestook place from 1993 to 1999, 4 to 10 yearsafter the start of the boom in pond construc-tion, fishery statistics gave no direct evidenceof a trade-off between the pond productionand fisheries on the aggregated level of thewhole estuary. Catch rates show no indica-tion, at the aggregated level, that the fisheryin its current operational set-up is affected bythe rapidly decreasing mangrove coverage.
The high variabilities in fishery statisticsalone already imply that the observability ofa trade-off is limited. Multiple causes andnon-linearity of the changes taking place willexacerbate the problem. First, the observed6–9 years’ monotonic rise and fall in annualcatch of most categories is more likely due tochanges in the structure of the fish commu-nity through environmental forcing or den-sity-dependent processes (Bjørnstad et al.,1999). Year-class variation in stocks wouldproduce short-term trends of 3–4 years orshorter given the residence time of any yearclass in an exploited stock of most of thespecies examined. Whether these changesare cyclical or represent a more irreversiblechange as a result of mangrove habitatdestruction or upstream processes in theMahakam River cannot be concluded. Next,fishing patterns – gears used, spatial effortallocation – changed with increased effortthroughout the 1990s as well. Changing fish-ing patterns in small-scale fisheries are oftenan adaptation to changing fish communitystructures (Jul-Larsen et al., 2003a). Whetherthe fisheries are adapting to communitychanges as a result of environmental forcingor are themselves a major cause of the com-munity changes depends on their relativeimpact. Lastly, while a certain minimum areaof mangrove is necessary for the mainte-nance of coastal productivity, the mangrovearea/yield relationship is non-linear (Baranand Hambrey, 1998). Many fish and crus-tacean species are transients and are not criti-cally dependent on mangroves (Krummeand Saint-Paul, 2003; Mumby et al., 2004).Where forests extend along a coastline andare connected by coastal currents, impacts oncoastal fisheries may only be noticeablewhen most of the functional part of the foresthas disappeared. Type, spatial arrangements
234 P.A.M. van Zwieten et al.
Tropical chap 17 1/25/06 9:28 AM Page 234

and connectivity of mangrove forest areimportant and patterns of mangrove–waterinterface, tree communities and age of man-grove stands have been suggested as affect-ing fish and crustacean community structure(Primavera, 1997; Ronnback et al., 1999;Manson et al., 2003).
The potential for detection of changes inrelevant indicators as a result of manage-ment action is limited, while the high vari-ability in individual outcome also limits theutility of local observations offishermen/shrimp-pond farmers. Theacceptability of taking measures to protectmangrove habitat could be reduced as anypositive impact will be difficult to observe inthe short term on a local level as well as inaggregate fishery statistics, limiting their usefor evaluation of impacts. Over the longterm, the utility of monitoring data appearsto be high, but improved data quality andcapacity to evaluate information will berequired to increase diagnostic power. Thechallenge is to devise tools for informeddecision-making with limited data in a spa-tially and temporally complex environment
with a high fish and crustacean diversity,starting from what is already available.Better use of existing data, information andknowledge will aid in improving the evalua-tive capacity of those involved in managingcoastal resources.
Acknowledgements
This study was carried out as part of theWOTRO/KNAW/ICOMAR EastKalimantan Pilot Research. The NetherlandsFoundation for the Advancement of TropicalResearch (WOTRO) is thanked for its finan-cial support. LIPI and the University ofMulawarman in Samarinda are thanked fortheir logistical support. Earlier sections ofthe work were commented upon by MarcVerdegem and Leo Nagelkerke. R. Bourgeoisand TotalFinaElf are thanked for makingavailable their socio-economic study. TheKelautan dan Perikanan (Fisheries Service)in Samarinda is thanked for its assistance indisclosing the wealth of information presentin its statistical yearbooks.
The Trade-off between Mariculture and Fisheries Production 235
References
Aitchison, J. and Brown, J.A.C. (1957) The Lognormal Distribution: With Special Reference to Its Uses inEconomics. Monographs, Department of Applied Economics, University of Cambridge 5, CambridgeUniversity Press, Cambridge, UK, 167 pp.
Bappeda Kukar (2003) Rencana Detail Tata Ruang Kawasan Delta Mahakam. Kerjasama antara Bappeda KutaiKartanegara dengan LAPI Institut Teknologi Bandung, Tenggarong. (Detailed spatial planning ofMahakam delta area. Cooperation between Bappeda Kutai Kartanegara and LAPI BandungInstitute of Technology, Tenggarong.) Internal report. 196 pp.
Baran, E. and Hambrey, J. (1998) Mangrove conservation and coastal management in Southeast Asia:what impact on fishery resources. Marine Pollution Bulletin 37(8–12), 431–440.
Blaber, S.J.M. (2002) Fish in hot water: the challenges facing fish and fisheries research in tropical estuar-ies. Journal of Fish Biology 61(1), 1–20.
Bjørnstad, O.N., Fromentin, J.-M., Stenseth, N.C. and Gjøsæter, J. (1999) Cycles and trends in cod popula-tions. Proceedings of the National Academy of Sciences U.S. 96, 5066–5071.
Bourgeois, R., Gouyon, A., Jésus, F., Levang, P., Langeraar, W., Rahmadani, F., Sudiono, E. and Sulistani,B. (2002) Socioeconomic and Institutional Analysis of Mahakam Delta Stakeholders. Final Report toTotalFinaElf. Contract No. 501125/DKI/204. 108 pp.
Dutrieux, E. (2001) The Mahakam Delta Environment from the 80’s up to now: a synthesis of a 15-yearinvestigation. In: Kusumanstanto, T., Bengen, D.G., Widigdo, B. and Soesono, I. (eds). OptimisingDevelopment and Environmental Issues at Coastal Areas. Problems and Solutions for SustainableManagement of Mahakam Delta. Proceedings of international workshop held in Djakarta, 4–5 April2001. Centre for Coastal and Marine Resources Studies, Bogor Agricultural University, Bogor,Indonesia, in association with the Ministry of Marine Affairs and Fisheries and TotalFinaElf,pp. 69–72.
Tropical chap 17 1/25/06 9:28 AM Page 235

Froese, R. and Pauly, D. (eds) (2005) FishBase. World Wide Web electronic publication. <http://www.fish-base.org> (accessed February 2005).
Hariati-A.M., Wiadnya, D.G.R., Prajitno, A., Sukkel, M., Boon, J.H. and Verdegem, M.C.J. (1998) Recentdevelopments of shrimp, Penaeus monodon (Fabricius) and Penaeus merguiensis (de Man), culture inEast Java. Aquaculture Research 26, 819–829.
Jul-Larsen, E., Kolding, J., Overå, R., Nielsen, J.R. and van Zwieten, P.A.M. (2003a) Management, Co-man-agement or no Management? Major Dilemmas in Southern African Freshwater Fisheries 1. Synthesisreport, FAO Fisheries Technical Paper No. 426/1, FAO, Rome, 127 pp.
Jul-Larsen, E., Kolding, J., Overå, R., Nielsen, J.R. and van Zwieten, P.A.M. (2003b) Management, Co-man-agement or no Management? Major Dilemmas in Southern African Freshwater Fisheries 2. Case studies,FAO Fisheries Technical Paper No. 426/2, Rome, 266 pp.
Krumme, U. and Saint-Paul, U. (2003) Observations of fish migration in a macrotidal mangrove channelin Northern Brazil using a 200-kHz split-beam sonar. Aquatic Living Resources 16(3), 175–184.
Manson, F.J., Loneragan, N.R. and Phinn, S.R. (2003) Spatial and temporal variation in distribution ofmangroves in Moreton Bay, subtropical Australia: a comparison of pattern metrics and changedetection analyses based on aerial photographs. Estuarine, Coastal and Shelf Science 574, 653–666.
Mumby, P.J., Edwards, A.J., Arlas-González, J.E., Lindeman, K.C., Blackwell, P.G., Gall, A., Gorczynska,M.I., Harborne, A.R., Pescod, C.L., Renken, H., Wabnitz, C.C.C. and Llewellyn, G. (2004)Mangroves enhance the biomass of coral reef fish communities in the Caribbean. Nature 427,533–536.
Myers, R.A. and Worm, B. (2003) Rapid worldwide depletion of predatory fish communities. Nature 423,280–283.
Oostenbrugge, J.A.E. v., Bakker, E.J., van Densen, W.L.T., Machiels, M.A.M. and van Zwieten, P.A.M.(2002) Characterising catch variability in a multispecies fishery: implications for fishery manage-ment. Canadian Journal of Fisheries and Aquatic Science 59, 1032–1043.
Primavera, J. H. (1997) Fish predation on mangrove-associated penaeids: the role of structures and sub-strate. Journal of Experimental Marine Biology and Ecology 215(2), 205–216.
Ronnback, P., Troell, M. Kautsky, N. and Primavera, J.H. (1999) Distribution pattern of shrimps and fishamong Avicennia and Rhizophora microhabitats in the Pagbilao mangroves, Philippines. Estuarine,Coastal and Shelf Science 48(2), 223–234.
SAS Institute (1989) SAS/STAT® User’s Guide, Version 6, Vol. 2, 4th edition. SAS Institute Inc., Cary,North Carolina.
Turner, R.E. (1977) Intertidal vegetation and commercial yields of penaeid shrimp. Transactions of theAmerican Fisheries Society 106, 411–416.
Turner, R. E. and Boesch, D. F. (1987) Aquatic animal production and wetland relationships: insightsgleaned following wetland loss or gain. In: Hook, B. (ed.) Ecology and Management of Wetlands,Croon Helms Ltd., Beckenham, UK, 592 pp.
van Densen, W.L.T. (2001) On the perception of time trends in resource outcome: its importance in fish-eries co-management, agriculture and whaling. PhD thesis, Twente University, Enschede,Netherlands, 299 pp.
van Zwieten, P.A.M., Roest, F.C., Machiels, M.A.M. and van Densen, W.L.T. (2002) Effects of inter-annualvariability, seasonality and persistence on the perception of long-term trends in catch rates of theindustrial pelagic purse-seine fisheries of Northern Lake Tanganyika (Burundi). Fisheries Research54, 329–348.
236 P.A.M. van Zwieten et al.
Tropical chap 17 1/25/06 9:28 AM Page 236