Effects of Anthropogenic Shoreline Hardening and Invasion by Phragmites australis on Habitat Quality...
33
1 Effects of Anthropogenic Shoreline Hardening and Invasion by Phragmites australis on Habitat Quality for Juvenile Blue Crabs (Callinectes sapidus) W. Christopher Long* ,1 , Jacob N. Grow 2 , John E. Majoris 3 , Anson H. Hines Smithsonian Environmental Research Center P.O. Box 28, Edgewater, Maryland, 21037, USA *To whom correspondence should be addressed: Telephone (907)481-1715, Fax: (907) 481-1701, [email protected], 1 Current Address: Kodiak Laboratory, Resource Assessment and Conservation Engineering Division, Alaska Fisheries Science Center, National Marine Fisheries Service, NOAA, 301 Research Ct., Kodiak, AK 99615 USA 2 Current Address: PO Box 352, Crawfordsville, IN 47933 3 Current Address: 150W. University Blvd., Melbourne, FL 32901 This is the author accepted manuscript and contains all changes made to earlier versions, including all those made as a result of peer-review, except those of copy editing, reformatting, etc. The final version is available at: http://dx.doi.org/10.1016/j.jembe.2011.08.024, or by emailing the corresponding author at the email address above. This paper should be cited as: Long, W. C., Grow, J. N., Majoris, J. E., and Hines, A. H. 2011. Effects of anthropogenic shoreline hardening and invasion by Phragmites australis on habitat quality for juvenile blue crabs (Callinectes sapidus). Journal of Experimental Marine Biology and Ecology, 409: 215-222. Official Elsevier disclaimer: NOTICE: this is the author’s version of a work that was accepted for publication in Journal of Experimental Marine Biology and Ecology. Changes resulting from the publishing process, such as peer review, editing, corrections, structural formatting, and other quality control mechanisms may not be reflected in this document. Changes may have been made to this work since it was submitted for publication. A definitive version was subsequently published in Journal of Experimental Marine Biology and Ecology, 446, 2013, http://dx.doi.org/10.1016/j.jembe.2011.08.024.
Transcript of Effects of Anthropogenic Shoreline Hardening and Invasion by Phragmites australis on Habitat Quality...
1
Effects of Anthropogenic Shoreline Hardening and Invasion by Phragmites australis on Habitat
Quality for Juvenile Blue Crabs (Callinectes sapidus)
W. Christopher Long*,1
, Jacob N. Grow2, John E. Majoris
3, Anson H. Hines
Smithsonian Environmental Research Center
P.O. Box 28, Edgewater, Maryland, 21037, USA
*To whom correspondence should be addressed: Telephone (907)481-1715, Fax: (907) 481-1701,
1Current Address: Kodiak Laboratory, Resource Assessment and Conservation Engineering Division, Alaska
Fisheries Science Center, National Marine Fisheries Service, NOAA, 301 Research Ct., Kodiak, AK 99615 USA
2Current Address: PO Box 352, Crawfordsville, IN 47933
3Current Address: 150W. University Blvd., Melbourne, FL 32901
This is the author accepted manuscript and contains all changes made to earlier versions,
including all those made as a result of peer-review, except those of copy editing, reformatting,
etc. The final version is available at: http://dx.doi.org/10.1016/j.jembe.2011.08.024, or by
emailing the corresponding author at the email address above. This paper should be cited as:
Long, W. C., Grow, J. N., Majoris, J. E., and Hines, A. H. 2011. Effects of anthropogenic
shoreline hardening and invasion by Phragmites australis on habitat quality for juvenile
blue crabs (Callinectes sapidus). Journal of Experimental Marine Biology and Ecology,
409: 215-222.
Official Elsevier disclaimer:
NOTICE: this is the author’s version of a work that was accepted for publication in Journal of Experimental Marine Biology and Ecology.
Changes resulting from the publishing process, such as peer review, editing, corrections, structural formatting, and other quality control
mechanisms may not be reflected in this document. Changes may have been made to this work since it was submitted for publication. A
definitive version was subsequently published in Journal of Experimental Marine Biology and Ecology, 446, 2013,
http://dx.doi.org/10.1016/j.jembe.2011.08.024.

2
Abstract
Unvegetated, shallow water habitats adjacent to marshes are an important nursery for
juvenile blue crabs, Callinectes sapidus, in Chesapeake Bay. Alteration of the shoreline, either
through the replacement of marshes with anthropogenic structures, such as riprap and bulkheads,
or through the replacement of the native marsh grass Spartina sp. (Spartina) with the invasive
Phragmites australis (Phragmites), may affect the value of this habitat as a nursery. In this
study, we compared the effects of four common shoreline types, bulkheads, riprap, Phragmites
marshes, and Spartina marshes, on food availability, feeding, growth, and survival of juvenile
blue crabs in adjacent subtidal areas, as well as on the abundance and size of predators in the
South River, Maryland. Sites with each shoreline type were randomly selected. We used
benthic cores to sample macrobenthic prey and performed gut content analysis on caged crabs to
examine food availability and feeding. Growth was estimated using caged crabs. Survival was
assayed with a tethering experiment and predators were sampled with a seine net. Riprap had a
lower abundance of macrofaunal prey, and the macrofaunal community differed from both marsh
types in that it had it had smaller an more opportunistic species such as nematodes and small
polychaetes compared to more bivalves and larger polychaetes at the marsh sites; however, gut
contents and growth did not vary among shoreline types. Predation pressure on juvenile blue
crabs was highest at bulkhead sites and lowest at riprap. Predator abundance did not vary among
the shoreline types, though piscine predators were smaller in size near Spartina marshes
compared to the other shorelines. We conclude that shoreline hardening substantially reduced
the value of shoreline habitats for juvenile blue crabs, but that Spartina and Phragmites are
functionally equivalent.
3
Keywords: blue crab, Callinectes sapidus, Phragmites australis, predation, Spartina, shoreline
development
1. Introduction
In Chesapeake Bay and elsewhere, shallow, unvegetated habitats, especially those
adjacent to salt marshes, are important secondary nursery habitats for many macrofaunal species
(e.g. Minello et al., 2003) including the ecologically (Baird and Ulanowicz, 1989) and
economically (Lipcius and Stockhausen, 2002) important blue crab, Callinectes sapidus (Lipcius
et al. 2005). These areas provide a refuge from predation (Ruiz et al., 1993; Hines and Ruiz,
1995; Dittel et al., 1995; Clark et al., 2003; Minello et al., 2003), especially for vulnerable
molting crabs (Hines et al., 1987; Ryer et al., 1997), and offer a high abundance of macrofaunal
prey, which contributes to high growth rates (Seitz et al., 2005, 2006). However, these habitats
are changing, both through human development of coastal areas, which includes the alteration of
the shoreline (Peterson and Lipcius, 2003), and through replacement of native salt marsh grasses,
especially Spartina sp. (hereafter Spartina) by the invasive common reed Phragmites australis
(hereafter Phragmites) along the US Atlantic coast (Fell et al., 1998).
Although coastal development, land-use patterns, and eutrophication influence large-
scale abundance and distribution of blue crabs and their prey resources (e.g. Kemp et al., 2005;
King et al., 2005), relatively little is known about small-scale effects of shoreline development.
Fragmentation of marshes through costal development may alter shoot density and faunal
abundance (Long and Burke, 2007). Hardened shorelines, such as riprap and bulkheads, are
associated with a lower abundance of macrofaunal organisms in the adjacent subtidal habitats
when compared to marsh shorelines (Weis et al., 1998; Seitz et al., 2006). In the case of
4
bulkheads, this may be due to toxic chemicals leaching from treated lumber (Weis et al., 1998).
However, because marshes can supply substantial amounts of allochthonous carbon to subtidal
habitats (Roman and Daiber, 1989; Wainright et al., 2000; Quan et al., 2007), replacing them
with riprap or bulkheads, which cannot supply such resources, may lower macrofaunal densities
(Seitz et al., 2006). Additionally, hardened shorelines are frequently associated with lower
densities and smaller sizes of nektonic species (Hendon et al., 2000; Peterson et al., 2000),
though not in all cases (Seitz et al., 2006). However, in Southern California, riprap is
functionally equivalent to the local natural rocky habitats indicating that effect is not always
detrimental (Pister 2009).
Extensive research has been conducted on the ecological effect of Phragmites invasions.
In general, Phragmites differs little from Spartina as a habitat for macrofauna (Weis and Weis,
2003). Most nektonic species use both marsh types similarly (Meyer et al, 2001; Hanson et al.,
2002; Jivoff and Able, 2003; Osgood et al., 2003; Robertson and Weis, 2007), and macrofaunal
densities are equivalent (Osgood et al., 2003; Posey et al., 2003). However, epifaunal abundance
is lower in Phragmites than in Spartina (Robertson and Weis, 2005) and the abundance of some
nektonic species, such as juvenile Fundulus heteroclitus, may be lower (Able et al., 2003). Also,
the hydrology and topology of the marsh differ with Phragmites having reduced tidal flooding
that may limit use by nekton (Osgood et al., 2003). Taken together, these studies suggest that the
replacement of a Spartina marsh with Phragmites is unlikely to have a significant effect on
habitat quality for juvenile blue crabs.
We designed this study to examine the effects of biological and anthropogenic shoreline
changes on the value of the habitats as a nursery for juvenile blue crabs. We hypothesized that
hardened shorelines would be associated with lower densities of macrofaunal organisms, leading
5
to decreased crab growth rate. Also, we expected that unstructured bulkheads would be
associated with higher predation rates than structured habitats such as riprap and salt marshes.
Finally, we anticipated that Phragmites and Spartina marshes would differ little in their
functioning as nursery habitats for blue crabs.
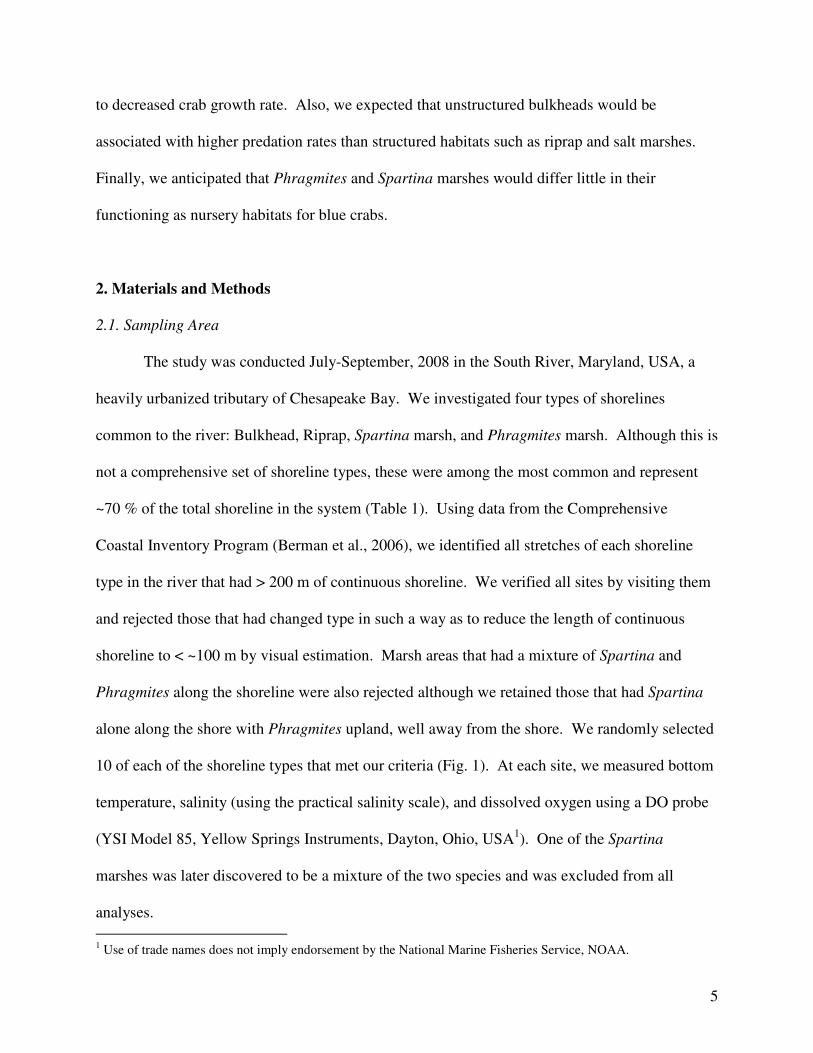
2. Materials and Methods
2.1. Sampling Area
The study was conducted July-September, 2008 in the South River, Maryland, USA, a
heavily urbanized tributary of Chesapeake Bay. We investigated four types of shorelines
common to the river: Bulkhead, Riprap, Spartina marsh, and Phragmites marsh. Although this is
not a comprehensive set of shoreline types, these were among the most common and represent
~70 % of the total shoreline in the system (Table 1). Using data from the Comprehensive
Coastal Inventory Program (Berman et al., 2006), we identified all stretches of each shoreline
type in the river that had > 200 m of continuous shoreline. We verified all sites by visiting them
and rejected those that had changed type in such a way as to reduce the length of continuous
shoreline to < ~100 m by visual estimation. Marsh areas that had a mixture of Spartina and
Phragmites along the shoreline were also rejected although we retained those that had Spartina
alone along the shore with Phragmites upland, well away from the shore. We randomly selected
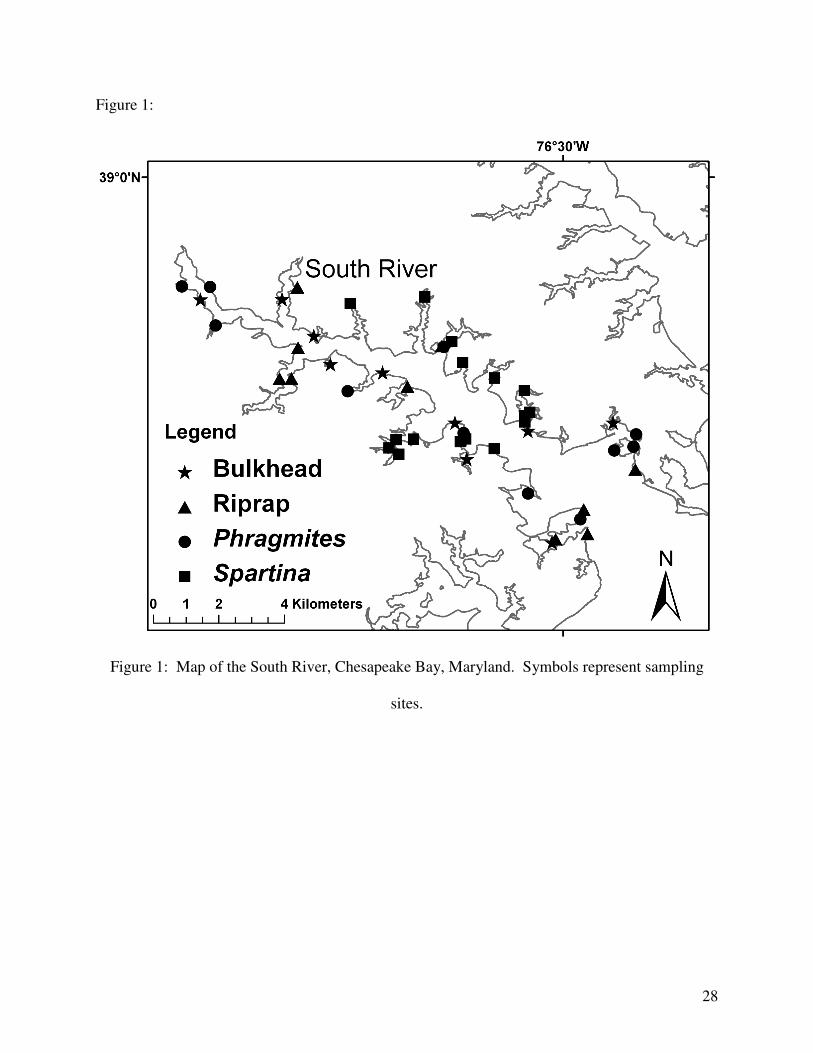
10 of each of the shoreline types that met our criteria (Fig. 1). At each site, we measured bottom
temperature, salinity (using the practical salinity scale), and dissolved oxygen using a DO probe
(YSI Model 85, Yellow Springs Instruments, Dayton, Ohio, USA1). One of the Spartina
marshes was later discovered to be a mixture of the two species and was excluded from all
analyses.
1 Use of trade names does not imply endorsement by the National Marine Fisheries Service, NOAA.
6
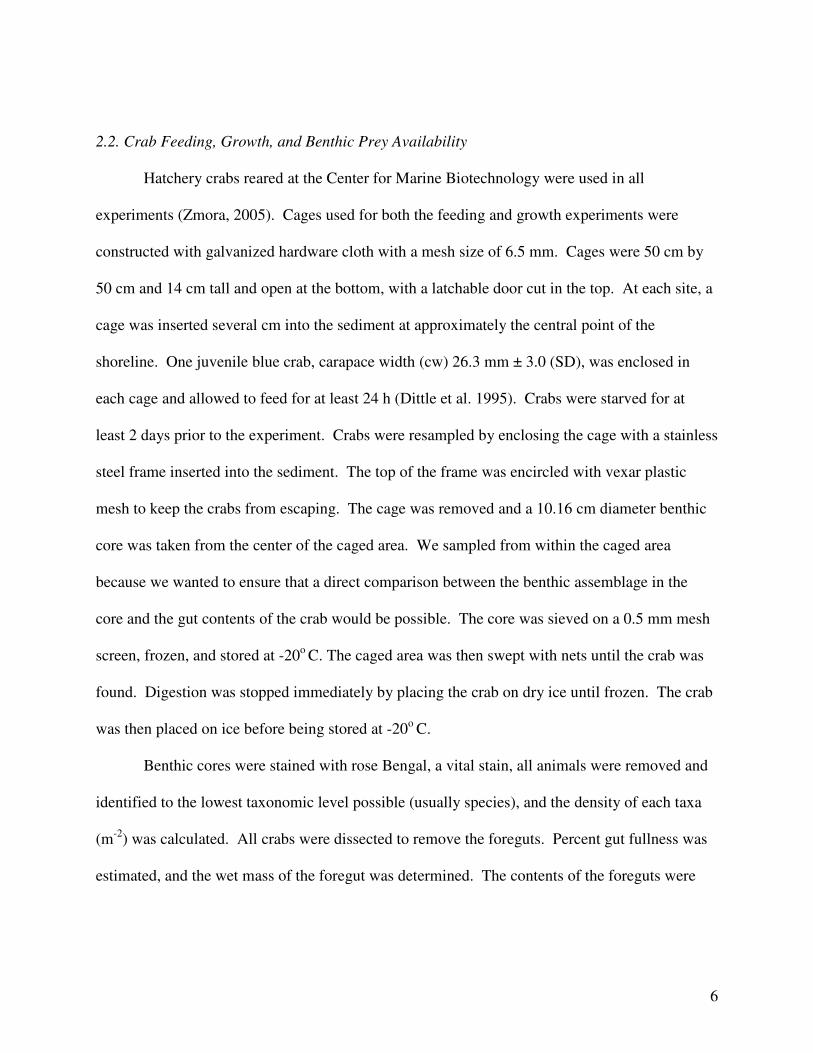
2.2. Crab Feeding, Growth, and Benthic Prey Availability
Hatchery crabs reared at the Center for Marine Biotechnology were used in all
experiments (Zmora, 2005). Cages used for both the feeding and growth experiments were
constructed with galvanized hardware cloth with a mesh size of 6.5 mm. Cages were 50 cm by
50 cm and 14 cm tall and open at the bottom, with a latchable door cut in the top. At each site, a
cage was inserted several cm into the sediment at approximately the central point of the
shoreline. One juvenile blue crab, carapace width (cw) 26.3 mm ± 3.0 (SD), was enclosed in
each cage and allowed to feed for at least 24 h (Dittle et al. 1995). Crabs were starved for at
least 2 days prior to the experiment. Crabs were resampled by enclosing the cage with a stainless
steel frame inserted into the sediment. The top of the frame was encircled with vexar plastic
mesh to keep the crabs from escaping. The cage was removed and a 10.16 cm diameter benthic
core was taken from the center of the caged area. We sampled from within the caged area
because we wanted to ensure that a direct comparison between the benthic assemblage in the
core and the gut contents of the crab would be possible. The core was sieved on a 0.5 mm mesh
screen, frozen, and stored at -20o
C. The caged area was then swept with nets until the crab was
found. Digestion was stopped immediately by placing the crab on dry ice until frozen. The crab
was then placed on ice before being stored at -20o
C.
Benthic cores were stained with rose Bengal, a vital stain, all animals were removed and
identified to the lowest taxonomic level possible (usually species), and the density of each taxa
(m-2
) was calculated. All crabs were dissected to remove the foreguts. Percent gut fullness was
estimated, and the wet mass of the foregut was determined. The contents of the foreguts were

7
identified to the lowest level possible under a stereo-microscope, and percent composition (by
volume) of each food type was estimated.
Crab growth rate was determined at each of the four shoreline types by caging a juvenile
blue crab, cw 12.0 mm ± 1.5 (SD), as above, and remeasuring them after 4 and 12 weeks. The
growth experiment was run immediately after the feeding study using the same cages. After 4
weeks, the crabs were resampled as described previously, and the cw of each was measured. The
cage was then moved to a different location at the same site (to minimize caging effects and
because resampling disturbed the site), and the crab was re-caged. After a further 8 weeks (12
weeks total), the crabs were resampled, and the cw of each was measured.
2.3. Predation Risk and Predator Abundance
Predation risk was estimated by tethering (see Hines and Ruiz, 1995; Lipcius et al.,
2005). Intermolt crabs had a 1 m long monofilament line glued to their carapaces using
cyanoacrylate glue. The tethered crab was tied to a stake that was inserted fully into the
sediment. A small marker float was also tied to the stake to aid in relocation. At each site, two
juvenile blue crabs were tethered. Crabs were placed within 0.5 m of the shoreline at each site to
allow the crabs to utilize any available structure, as long as they remained submerged at low tide.
Otherwise, they were placed as close to the shore as possible. The crabs were checked daily
until they were missing, molted, or dead. Crab were deployed and checked in approximately the
same order each day so while they were deployed and checked at different points during the day
and tidal cycle, they were each checked after about 24 h of deployment and experienced the
same number of tidal cycles. Survival of wild and hatchery crabs does not differ in tethering
experiments (Johnson et al. 2011).

8
Predators of juvenile blue crabs were sampled with a 30.5 m long seine. At each site, the
seine was pulled in a quarter arc up to the shoreline. All potential crab predators were identified,
and the lengths or carapace widths were measured of up to 10 haphazardly selected individuals
of each species. All other species that were not potential predators were identified and their
presence noted.
2.4. Statistical Analyses
Temperature, salinity, and dissolved oxygen were analyzed among shoreline type with a
one-way analysis of variance (ANOVA). In all ANOVA/ANCOVA analyses, homogeneity of
variance was verified using Levene’s test and normality with an Anderson-Darling test. When
the data did not meet these assumptions, the data were transformed. If transformed data failed to
satisfy assumptions a Kruskal-Wallis test was used. Differences in benthic community structure
among the shoreline types were analyzed using a non-metric multidimensional scaling analysis
(MDS) and an analysis of similarity (ANOSIM; Primer v6.1.6; Clarke and Gorley, 2001; Clarke
and Warwick, 2001). Where shoreline types differed significantly, a similarity percentages
(SIMPER) analysis was performed to determine which species contributed most to that
difference. Species richness and benthic abundance were analyzed with a one-way ANOVA.
Differences in gut contents among the shoreline were also analyzed using ANOSIM. Percent gut
fullness was analyzed with a one-way ANOVA.
Crab growth was calculated as the change in cw per day between the initial cw and the
cw at 4 and 12 weeks after caging, square-root transformed to achieve homogeneity of variance,
and then analyzed with an analysis of covariance (ANCOVA) with shoreline as a factor and
initial size as a covariate. Growth after 4 and 12 weeks were analyzed separately.
9
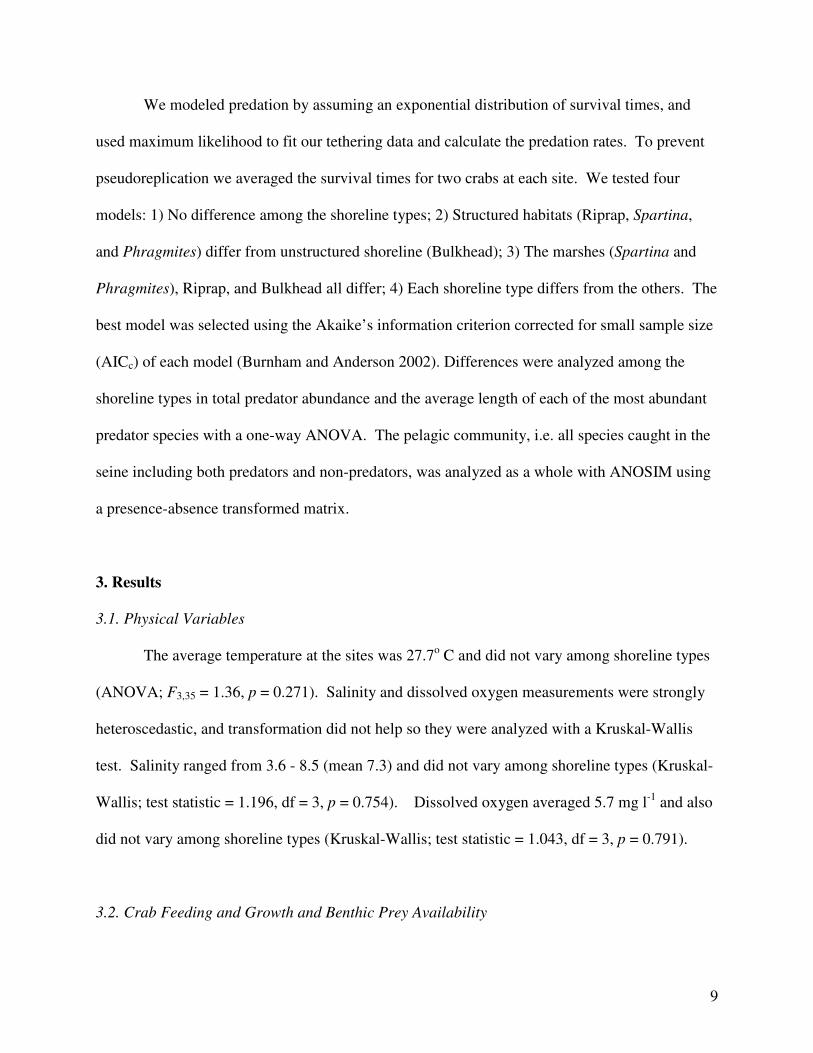
We modeled predation by assuming an exponential distribution of survival times, and
used maximum likelihood to fit our tethering data and calculate the predation rates. To prevent
pseudoreplication we averaged the survival times for two crabs at each site. We tested four
models: 1) No difference among the shoreline types; 2) Structured habitats (Riprap, Spartina,
and Phragmites) differ from unstructured shoreline (Bulkhead); 3) The marshes (Spartina and
Phragmites), Riprap, and Bulkhead all differ; 4) Each shoreline type differs from the others. The
best model was selected using the Akaike’s information criterion corrected for small sample size
(AICc) of each model (Burnham and Anderson 2002). Differences were analyzed among the
shoreline types in total predator abundance and the average length of each of the most abundant
predator species with a one-way ANOVA. The pelagic community, i.e. all species caught in the
seine including both predators and non-predators, was analyzed as a whole with ANOSIM using
a presence-absence transformed matrix.
3. Results
3.1. Physical Variables
The average temperature at the sites was 27.7o C and did not vary among shoreline types
(ANOVA; F3,35 = 1.36, p = 0.271). Salinity and dissolved oxygen measurements were strongly
heteroscedastic, and transformation did not help so they were analyzed with a Kruskal-Wallis
test. Salinity ranged from 3.6 - 8.5 (mean 7.3) and did not vary among shoreline types (Kruskal-
Wallis; test statistic = 1.196, df = 3, p = 0.754). Dissolved oxygen averaged 5.7 mg l-1
and also
did not vary among shoreline types (Kruskal-Wallis; test statistic = 1.043, df = 3, p = 0.791).
3.2. Crab Feeding and Growth and Benthic Prey Availability

10
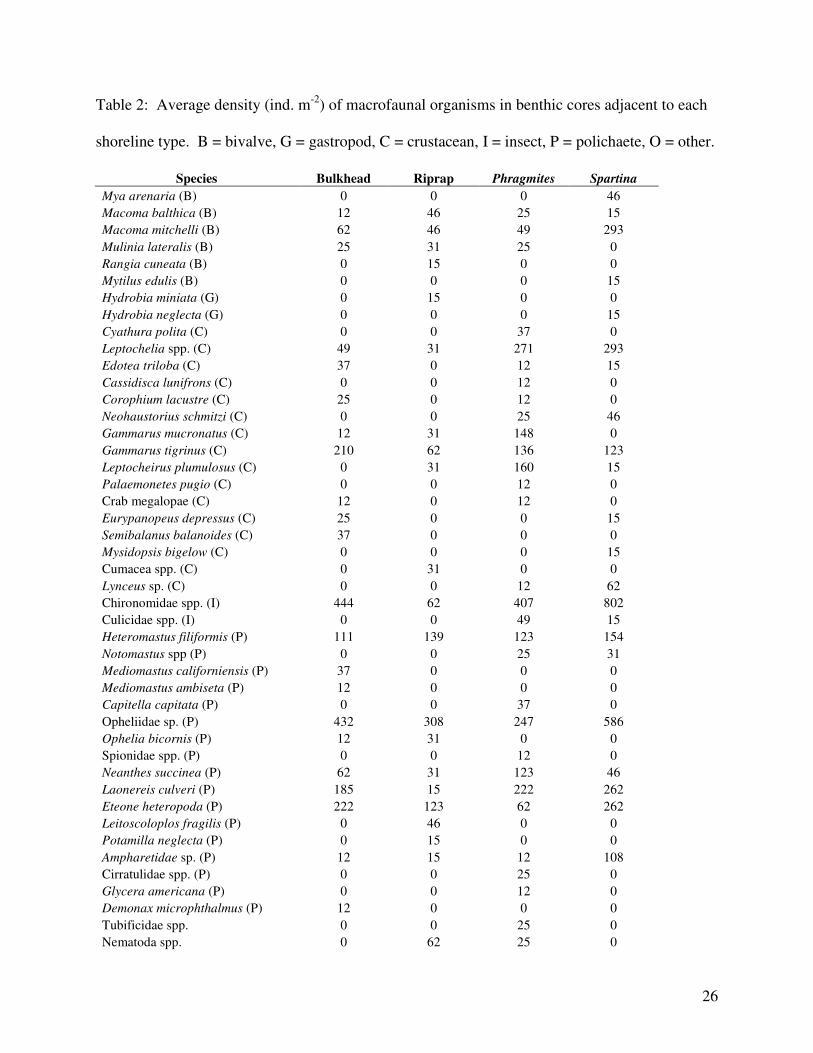
The benthic community structure differed among the shoreline types (ANOSIM; Global
R = 0.082, p = 0.0503). In pairwise comparisons, Riprap and Spartina (Global R = 0.264, p =
0.009) and Riprap and Phragmites (Global R = 0.205, p = 0.024) had significantly different
community structures (Table 2). The average dissimilarity between Riprap and Spartina was
78.45% and between Riprap and Phragmites was 84.04% (SEMPER). Spartina had higher
densities of Chironomidae spp. larvae, the polychaetes Opheliidae sp., Laonereis culveri, and
Eteone heteropoda, Ampharetidae sp., the isopod Leptochelia sp., the amphipod Gammarus
tigrinus, and the bivalve Macoma mitchelli than did riprap, while Riprap had higher densities of
Nematoda spp.(SIMPER, Table 2). Phragmites had higher densities of Chironomidae spp.
larvae, the polychaetes Laonereis culveri and Neanthes succinea, the isopod Leptochelia sp., and
the amphipods Gammarus tigrinus, G. mucronatus, and Leptocheirus plumulosus than did
Riprap, while Riprap had higher densities of the polychaetes Heteromastus filiformis and
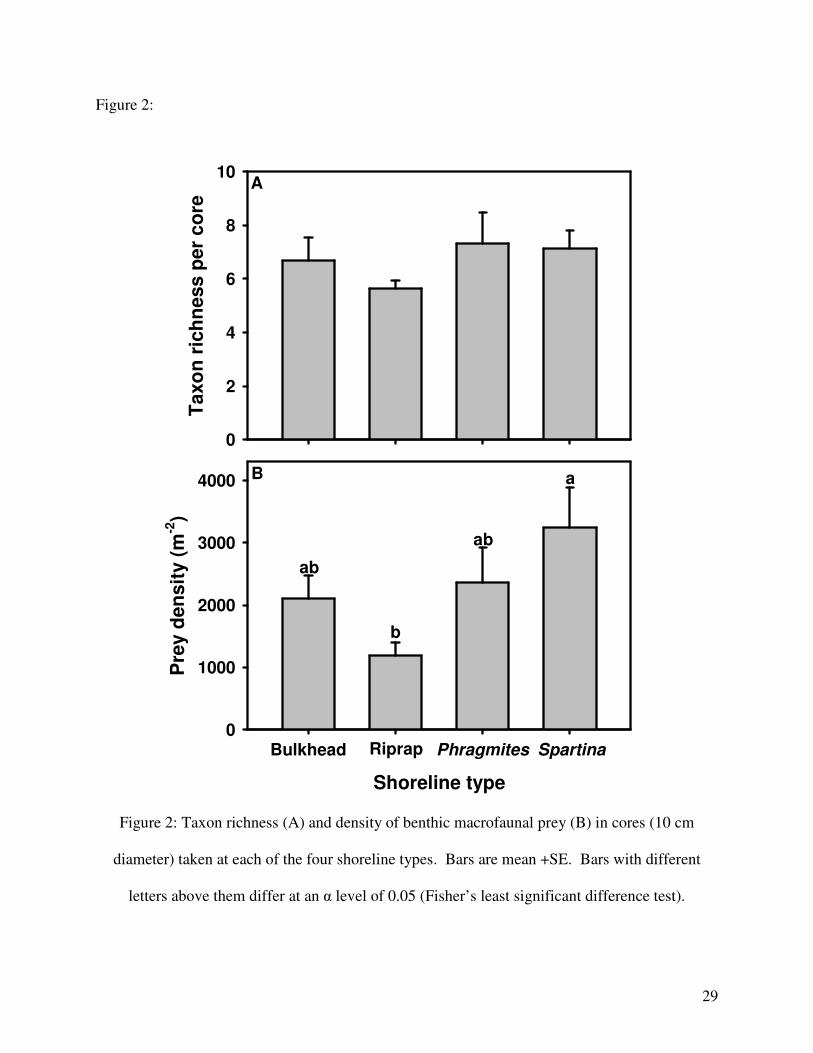
Onuphidae sp., and Nematoda spp. (SEMPER, Table 2). Both prey density and taxon richness
were square-root transformed to meet the assumptions of ANOVA. Shoreline types differed in
prey density (ANOVA; F3,32 = 2.983, p = 0.046) but not taxon richness (ANOVA; F3,32 = 0.443,
p = 0.724; Fig. 2). Prey density was higher in Spartina than in Riprap (Fig. 2).
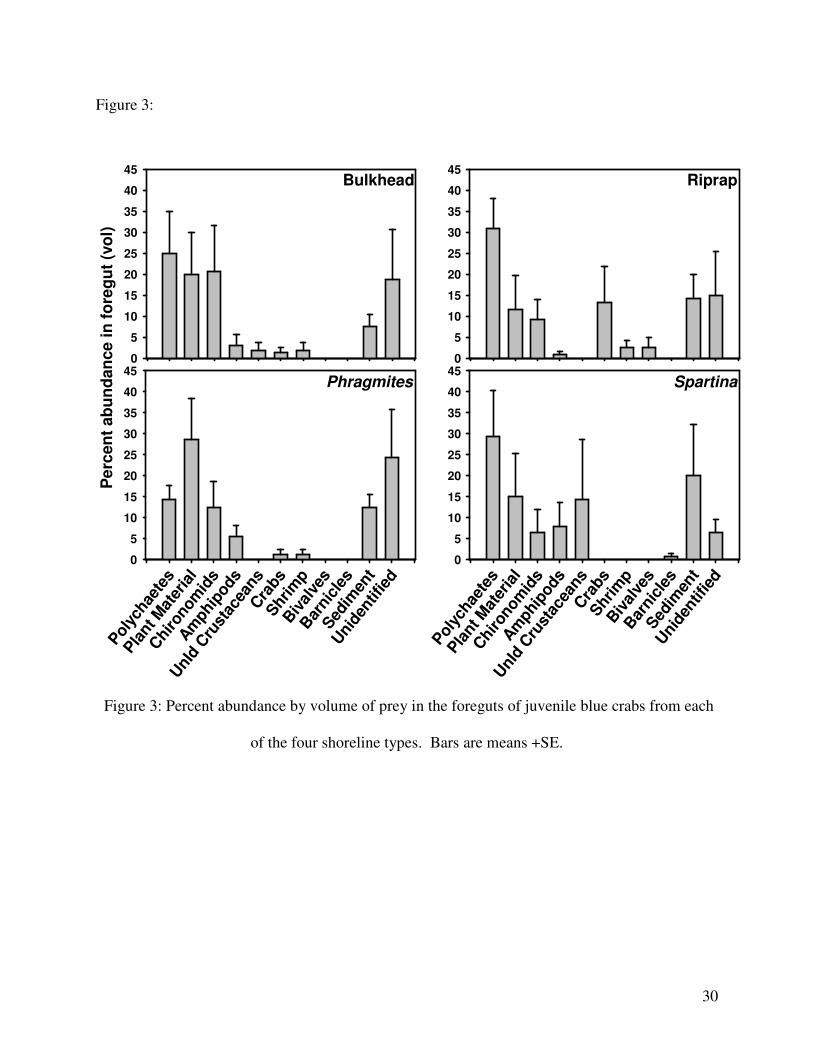
Twenty-nine out of 39 crabs were recovered for gut content analysis (N: Bulkhead = 8,
Riprap = 6, Spartina = 7, Phragmites = 8). Foregut fullness was square root transformed to meet
assumptions of ANOVA. Average foregut fullness was 44 ± 6.6% (SE) and did not differ among
shoreline types (ANOVA; F3,25 = 0.582, p = 0.632). There was no difference in the gut contents
(ANOSIM; Global R = -0.043, p = 0.791). Major food items included polychaetes, plant
material (including detritus and benthic micro-algae), chronomid larvae, and amphipods (Fig. 3).

11
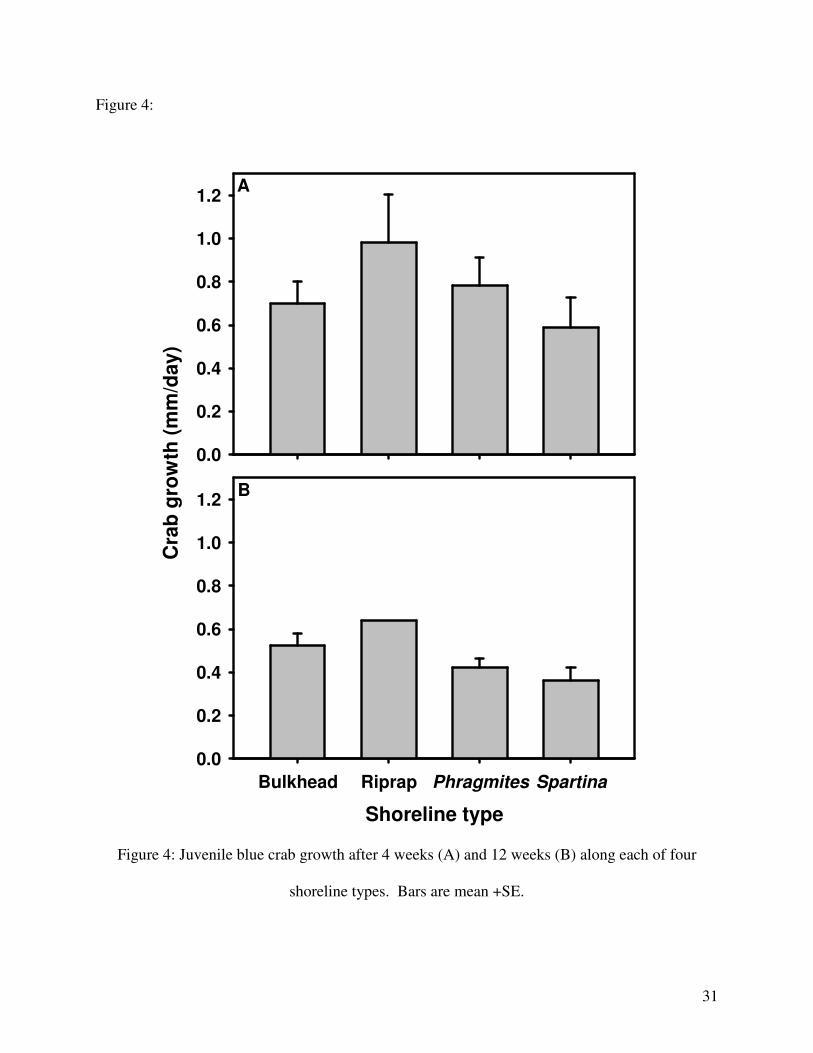
Eighteen out of 39 crabs were recovered for growth analysis after 4 weeks (N: Bulkhead
= 6, Riprap = 3, Spartina = 4, Phragmites = 5), and 10 crabs (out of the recaged 18) after 12
weeks (N: Bulkhead =3, Riprap = 1, Spartina = 3, Phragmites = 3). As Riprap had only one crab
recovered after 12 weeks we did not include it in the analysis. Growth after 4 weeks was square
root transformed to meet assumptions of ANOVA. Growth did not vary among shoreline types
after either 4 weeks (ANCOVA; F3,12 = 0.851, p = 0.490) or 12 weeks (ANCOVA; F2,5 = 2.220,
p = 0.204; Fig. 4).
3.3. Predation Risk and Predator Abundance
In the best model, the loss rates of tethered crabs differed among the Marshes, Riprap,
and Bulkhead; however, there was almost equivalent support for the model with the loss rate
differing among all shoreline types and for the model contrasting structured and unstructured
habitats (Table 3, Fig. 5A). The loss rate was highest at Bulkhead sites and lowest at Riprap
sites. The marshes were intermediate, with Spartina having a slightly lower loss rate than
Phragmites. Potential predators of juvenile blue crabs caught in the seines included white perch,
Morone americana, Atlantic croaker, Micropogonias undulates, striped bass, Morone saxatilis,
blue crab, and brown bullhead, Ameiurus nebulosus. Predator abundance was ln(N+0.1)
transformed to meet assumptions of ANOVA. Predator abundance did not vary among the
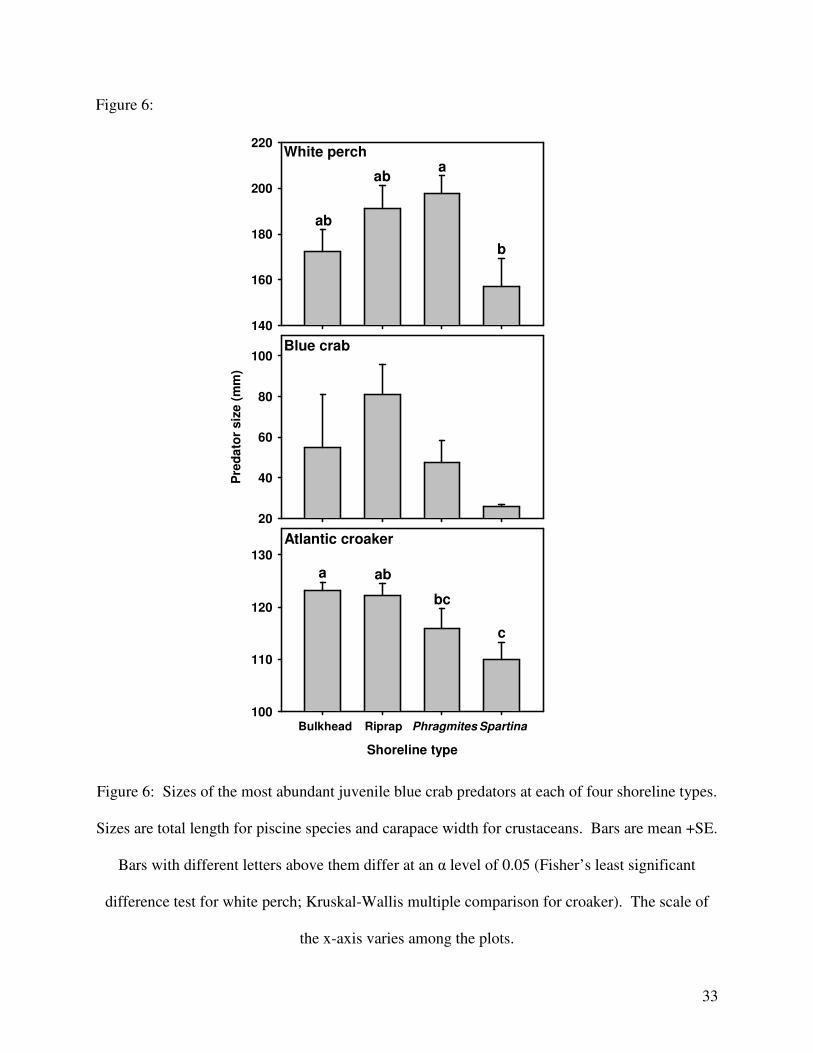
marsh types (ANOVA: F3,35 = 1.406, p = 0.257.; Fig. 5B). The lengths of Atlantic croaker were
heavily heteroscedastic and transformation did not help so we analyzed differences with a
Kruskal-Wallis test. The size of predators did vary among the marsh types for white perch
(ANOVA: F3,58 = 3.216, p = 0.029) and Atlantic croaker (Kruskal-Wallis test statistic = 14.120,
df = 3, p = 0.003) but not for blue crabs (ANOVA: F3,13 = 2.009, p = 0.162; Fig. 6). In general,
12
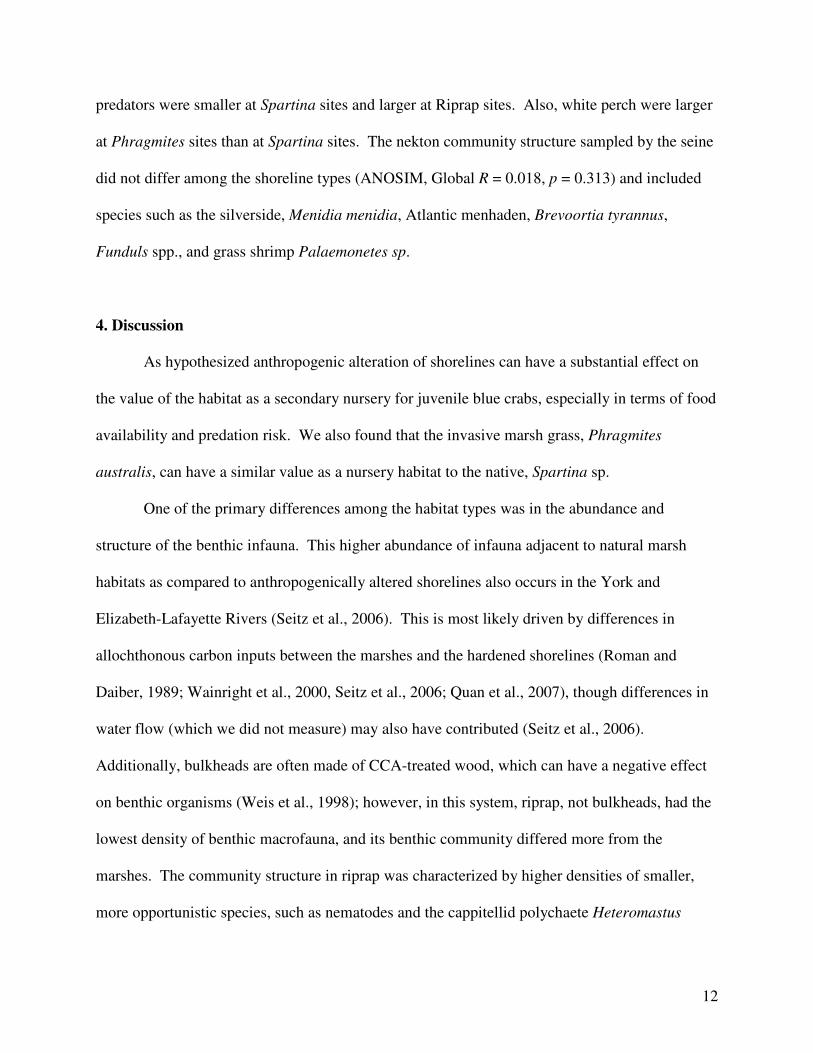
predators were smaller at Spartina sites and larger at Riprap sites. Also, white perch were larger
at Phragmites sites than at Spartina sites. The nekton community structure sampled by the seine
did not differ among the shoreline types (ANOSIM, Global R = 0.018, p = 0.313) and included
species such as the silverside, Menidia menidia, Atlantic menhaden, Brevoortia tyrannus,
Funduls spp., and grass shrimp Palaemonetes sp.
4. Discussion
As hypothesized anthropogenic alteration of shorelines can have a substantial effect on
the value of the habitat as a secondary nursery for juvenile blue crabs, especially in terms of food
availability and predation risk. We also found that the invasive marsh grass, Phragmites
australis, can have a similar value as a nursery habitat to the native, Spartina sp.
One of the primary differences among the habitat types was in the abundance and
structure of the benthic infauna. This higher abundance of infauna adjacent to natural marsh
habitats as compared to anthropogenically altered shorelines also occurs in the York and
Elizabeth-Lafayette Rivers (Seitz et al., 2006). This is most likely driven by differences in
allochthonous carbon inputs between the marshes and the hardened shorelines (Roman and
Daiber, 1989; Wainright et al., 2000, Seitz et al., 2006; Quan et al., 2007), though differences in
water flow (which we did not measure) may also have contributed (Seitz et al., 2006).
Additionally, bulkheads are often made of CCA-treated wood, which can have a negative effect
on benthic organisms (Weis et al., 1998); however, in this system, riprap, not bulkheads, had the
lowest density of benthic macrofauna, and its benthic community differed more from the
marshes. The community structure in riprap was characterized by higher densities of smaller,
more opportunistic species, such as nematodes and the cappitellid polychaete Heteromastus
13
filiformis, whereas, the marsh habitats had larger, longer-lived species such as Neanthes succinea
and Macoma mitchelli. This shift in community structure towards smaller organisms is similar
to what occurs in Chesapeake Bay under stressors such as hypoxia (Llansó, 1992; Long and
Seitz, 2009).
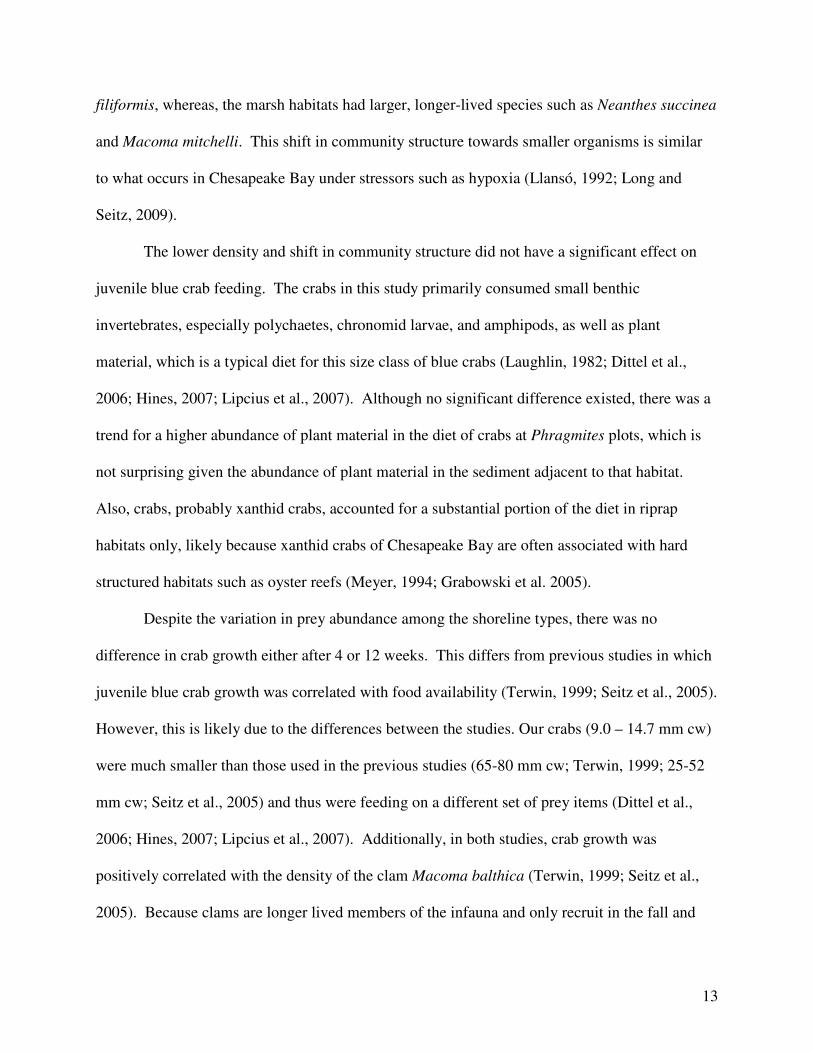
The lower density and shift in community structure did not have a significant effect on
juvenile blue crab feeding. The crabs in this study primarily consumed small benthic
invertebrates, especially polychaetes, chronomid larvae, and amphipods, as well as plant
material, which is a typical diet for this size class of blue crabs (Laughlin, 1982; Dittel et al.,
2006; Hines, 2007; Lipcius et al., 2007). Although no significant difference existed, there was a
trend for a higher abundance of plant material in the diet of crabs at Phragmites plots, which is
not surprising given the abundance of plant material in the sediment adjacent to that habitat.
Also, crabs, probably xanthid crabs, accounted for a substantial portion of the diet in riprap
habitats only, likely because xanthid crabs of Chesapeake Bay are often associated with hard
structured habitats such as oyster reefs (Meyer, 1994; Grabowski et al. 2005).
Despite the variation in prey abundance among the shoreline types, there was no
difference in crab growth either after 4 or 12 weeks. This differs from previous studies in which
juvenile blue crab growth was correlated with food availability (Terwin, 1999; Seitz et al., 2005).
However, this is likely due to the differences between the studies. Our crabs (9.0 – 14.7 mm cw)
were much smaller than those used in the previous studies (65-80 mm cw; Terwin, 1999; 25-52
mm cw; Seitz et al., 2005) and thus were feeding on a different set of prey items (Dittel et al.,
2006; Hines, 2007; Lipcius et al., 2007). Additionally, in both studies, crab growth was
positively correlated with the density of the clam Macoma balthica (Terwin, 1999; Seitz et al.,
2005). Because clams are longer lived members of the infauna and only recruit in the fall and
14
spring, the possibility of short-term local depletion due to predation is much greater than for
smaller polychaetes and amphipods, which recruit many times during the summer (Holland et al.,
1977, 1987; Virnstein, 1977), and which constituted the primary food source for our size class of
crabs. Higher growth rates at 4 weeks than at 12 weeks are probably due to our resampling at
different times during the molt cycle of the crabs.
Although the lower prey density at the riprap sites in this study did not seem to inhibit
crab growth on a small temporal and spatial scale, it nevertheless indicates that the carrying
capacity of these habitats for juvenile blue crabs, in terms of food availability, is likely lower
than the Marsh shorelines. The distribution of blue crabs in Chesapeake Bay is strongly
influenced by bottom up factors (Seitz et al., 2003, King et al., 2005), supporting this conclusion.
However, as the current blue crab population in Chesapeake Bay is recruit limited (Lipcius and
Stockhausen, 2002) and therefore below carrying capacity even in the southern portion of the
bay where recruitment is highest (Seitz et al., 2008) this is currently of little practical concern.
Predation risk for juvenile blue crabs varied greatly among the shoreline types. The clear
difference between the unstructured bulkhead habitats and the structured marsh and riprap
habitats was unsurprising given the predation refuge structured habitats offer in aquatic systems
(Everett and Ruiz, 1993; Heck et al., 2003; Minello et al., 2003). Among the structured habitats,
riprap offered the most protection from predation, and surviving crabs were often found actively
using the structure. This may be partially due to the fact that the structure is available to juvenile
crabs at all times during the tidal cycle, whereas the marshes were only available at high tide.
Additionally, hard, submerged substrate, such as oyster reefs and cobble habitats, generally
provides better refuge than marsh habitat (Stunz and Minello, 2001), even when the marsh
habitat is available throughout the tidal cycle (Barshaw et al., 1994). In the best model, the
15
Spartina and Phragmites marshes had the same loss rate, though there was support for Spartina
having a lower loss rate than Phragmites. There is little evidence that juvenile blue crabs use
Spartina and Phragmites marshes differently; the abundance of blue crabs both within (Able and
Hagan, 2000; Meyer et al., 2001) and near (Jivoff and Able, 2003) the two marshes is equivalent,
as is the use of both marshes by molting crabs (Jivoff and Able, 2003). In our study there was no
evidence that the crabs ever moved into the marshes; tethered crabs were always found in the
water nearby the marshes regardless of tidal cycle. Indeed in many of the marshes, especially the
Phragmites, the stem density is so high it is unlikely that the crabs would have been able to use it
at all.
The differences in crab loss rates among the habitat types cannot be explained by
predator abundance, which did not vary among the shoreline types. This is similar to patterns in
the York and Elizabeth-Lafayette Rivers in the southern portion of Chesapeake Bay, where
predator densities did not differ among Spartina, riprap, and bulkhead shorelines (Seitz et al.,
2006). In contrast, the abundance of blue crabs was lower along altered (bulkhead or riprap)
shorelines than along marsh shorelines in Mississippi estuaries, though this was not true of the
Atlantic croaker (Peterson et al., 2000). In general, the size of piscine predators was lower at
Spartina marshes compared to the other shorelines, which may partially explain the slight
difference in predation rate between the Spartina and Phragmites shorelines. This is the
opposite of trends in Mississippi, where the size of fish tended to be lower at altered habitats
(Peterson et al., 2000). The reason for the difference between the studies is not clear and could
be related to geographic, physical, sampling, or seasonal differences.
5. Conclusions

16
Our findings suggests that Spartina and Phragmites are approximately equivalent in
terms of the nursery habitat they provide for juvenile blue crabs. Although the invasion of
Phragmites does not seem to affect blue crab other aspects of the ecosystem are affected (Able et
al., 2003; Osgood et al., 2003; Robertson and Weis, 2005) so this study should not be taken to
indicate that the invasion is of no ecological concern. In contrast, we show that replacement of
marsh shorelines with riprap or bulkheads substantially reduces the habitat value of shallow
water areas through a reduction in prey density, with a concurrent decrease in the habitat
carrying capacity, and, in the case of bulkheads, the removal of a refuge from predation. This
adds to the growing evidence that anthropogenic shoreline hardening can substantially reduce the
ecosystem services provided by the habitat (Peterson et al., 2000; Seitz et al., 2006). Although
more research into the effects and mechanisms of shoreline hardening is needed, land owners,
policy makers and managers should consider alternative methods of stabilizing shorelines.
Acknowledgements:
We thank M. Kramer, M. Goodison, R. Aguilar, and D. Long for help with field work. We thank
M. Kramer and H. Soulen for help with sorting and identifying benthic organisms in the
laboratory. Critical comments on earlier versions of this paper by J. Long, R. Foy, and two
anonymous reviewers substantially improved the manuscript. Hatchery crabs were provided by
Dr. Yonathan Zohar and Oded Zmora, University of Maryland, Biotechnology Institute, Center
of Marine Biotechnology. Funding for this research came from the NOAA Chesapeake Bay
Program Office to the Blue Crab Advanced Research Consortium including funding for JM.
WCL was supported by a Marine Science Network Fellowship from the Smithsonian. JG was
supported by Wabash College through the Wabash-SERC internship program. The findings and
17
conclusions in the paper are those of the authors and do not necessarily represent the views of the
National Marine Fisheries Service, NOAA.
References:
Able, K.W., Hagan, S.M., 2000. Effects of common reed (Phragmites australis) invasion on
marsh surface macrofauna: response of fishes and decapod crustaceans. Estuaries 23,
633-646.
Able, K.W., Hagen, S.M., Brown, S.A., 2003. Mechanisms of marsh habitat alteration due to
Phragmites australis: response of young-of-the-year mummichog (Fundulus heteroclitus)
to treatment for Phragmites removal. Estuaries 26,484-494.
Baird, D., Ulanowicz, R.E., 1989. The seasonal dynamics of the Chesapeake Bay
ecosystem. Ecol. Monogr. 59, 329-361.
Barshaw, D.E., Able, K.W., Heck, K.L., 1994. Salt marsh peat reefs as protection for postlarval
lobsters Homarus americanus from fish and crab predators: comparisons with other
substrates. Mar. Ecol. Prog. Ser. 106, 203-206.
Berman, M.R., Berquist, H., Killeen, S., Nunez, K., Rudnicky, T., Schatt, D.E., Weiss, D., Reay,
K., 2006. Anne Arundel County, Maryland – Shoreline Situation Report, Comprehensive
Coastal Inventory Program, Virginia Institute of Marine Science, College of William and
Mary, Gloucester Point, Virginia, 23062.
Burnham, K.P., Anderson, D.R., 2002. Model selection and multimodel inference: A practical
information-theoretic approach. Second edition. Springer Science, New York, New
York, USA.

18
Clark, K.L., Ruiz, G.M., Hines, A.H., 2003. Diel variation in predator abundance, predation risk
and prey distribution in shallow water estuarine habitats. J. Exp. Mar. Biol. Ecol. 287,
37-55.
Clarke, K.R., Gorley, R.N., 2001 Primer v. 5, user manual. Plymouth, UK, Plymouth Marine
Laboratory.
Clarke, K.R., Warwick, R.M., 2001. Change in Marine Communities: an approach to statistical
analysis and interpretation. 2nd
edition. Plymouth, UK, Plymouth Marine Laboratory.
Dittel, A.I., Hines, A.H., Ruiz, G.M., Ruffin, K.K., 1995. Effects of shallow water refuge on
behavior and density-dependant mortality of juvenile blue crabs in Chesapeake Bay. Bull.
Mar. Sci. 57, 902-916.
Dittel, A.I., Epifanio, C.E., Fogel, M.L., 2006. Trophic relationships of juvenile blue crabs
(Callinectes sapidus) in estuarine habitats. Hydrobiologia 568, 379-390.
Everett, R.A., Ruiz, G.M., 1993. Coarse woody debris as a refuge from predation in aquatic
communities: an experimental test. Oecologia 93, 475-486.
Fell, P.E., Weissbach, S.P., Jones, D.A., Fallon, M.A., Zeppieri, J.A., Faison, E.K., Lennon,
K.A., Newberry, K.J., Reddington, L.K., 1998. Does invasion of oligohaline tidal
marshes by reed grass, Phragmites australis (Cav.) Trin. Ex Steud., affect the availability
of prey resources for the mummichog, Fundulus heteroclitus L.? J. Exp. Mar. Biol. Ecol.
222, 59-77.
Grabowski, J.H., Hughes, A.R., Kimbro, D.L., Dolan, M.A., 2005. How habitat setting
influences restored oyster reef communities. Ecology 86,1926-1935.
Hanson, S.R., Osgood, D.T., Yozzo, D.J., 2002. Nekton use of a Phragmites australis marsh on
the Hudson River, New York, USA. Wetlands 22, 326-337.
19
Heck, K.L., K.L., Hays, G., Orth, R.J., 2003. Critical evaluation of the nursery role hypothesis
for seagrass meadows. Mar. Ecol. Prog. Ser. 253, 123-136.
Hendon, J.R., Peterson, M.S., Comyns, B.H., 2000. Spatio-temporal distribution of larval
Gobiosoma bosc in waters adjacent to natural and altered marsh-edge habitats of
Mississippi coastal waters. Bull. Mar. Sci. 66, 143-156.
Hines, A.H., 2007. Ecology of juvenile and adult blue crabs. In: Kennedy VS, Cronin LE (eds)
The blue crab, Callinectes sapidus. Maryland Sea Grant, College Park, MD, p 565-654.
Hines, A.H., Lipcius, R.N., Haddon, A.M., 1987. Population dynamics and habitat partitioning
by size, sex, and molt stage of blue crabs Callinectes sapidus in a subestuary of central
Chesapeake Bay. Mar Ecol. Prog. Ser. 36, 55-64.
Hines, A.H., Ruiz, G.M., 1995. Temporal variation in juvenile blue crab mortality: nearshore
shallows and cannibalism in Chesapeake Bay. Bull. Mar. Sci. 57, 884-901.
Holland, A. F., Mountford, N.K., Mihursky, J., 1977. Temporal variation in upper bay and
mesohaline communities: I. The 9-m mud habitat. Ches. Sci. 18, 370-378.
Holland, A.F., Shaughnessy, A.T., Hiegel, M.H., 1987. Long-term variation in mesohaline
Chesapeake Bay macrobenthos: spatial and temporal patterns. Estuaries 10, 227-245.
Jivoff, P.R., Able, K.W., 2003. Blue crab, Callinectes sapidus, response to the invasive common
reed, Phragmites australis: abundance, size, sex ratio, and molting frequency. Estuaries
26, 587-595.
Johnson, E.G., Young, A.C., Hines, A.H., Kramer, M.A., Bademan, M., Goodison, M.R.,
Aguilar, R., 2011. Field comparison of survival and growth of hatchery-reared versus
wild blue crabs, Callinectes sapidus Rathbun. Journal of Experimental Marine Biology
and Ecology 402, 35-42.
20
Kemp, W.M., Boynton W.R., Adolf, J.E., Boesch, D.F., Boicourt, W.C., Brush, G., Cornwell,
J.C., Fisher, T.R., Glibert, P.M., Hagy, J.D., Harding, L.W., Houde, E.D., Kimmel, D.G.,
Miller, W.D., Newell, R.I.E., Roman, M.R., Smith, E.M., Stevenson, J.C., 2005.
Eutrophication of Chesapeake Bay: historical trends and ecological interactions. Mar.
Ecol. Prog. Ser. 303, 1-29.
King, R.S., Hines, A.H., Craige, F.D., Grap, S., 2005. Regional, watershed and local correlates
of blue crab and bivalve abundances in subesuaries of Chesapeake Bay, USA. J. Exp.
Mar. Biol. Ecol. 319, 101-116.
Laughlin, R.A., 1982. Feeding habits of the blue crab, Callinectes sapidus Rathbun, in the
Apalochicola estuary, Florida. Bull. Mar. Sci. 32, 807-822.
Lipcius, R.M., Stockhausen, W.T., 2002. Concurrent decline of the spawning stock, recruitment,
larval abundance, and size of the blue crab Callinectes sapidus in Chesapeake Bay. Mar.
Ecol. Prog. Ser. 226, 45-61.
Lipcius, R.N., Seitz, R.D., Seebo, M.S., Colon-Carrion, D., 2005. Density, abundance and
survival of the blue crab in seagrass and unstructured salt marsh nurseries of Chesapeake
Bay. J. Exp. Mar. Biol. Ecol. 319, 69-80.
Lipcius, R.N., Eggleston, D.B., Heck, K.L., Seitz, R.D., Van Montfrans, J. 2007 Ecology of
postlarvae and young juvenile blue crabs. In: Kennedy VS, Cronin LE (eds) The blue
crab, Callinectes sapidus. Maryland Sea Grant, College Park, MD, p 535-564.
Llansó, R.J., 1992. Effects of hypoxia on estuarine benthos: The lower Rappahannok River
(Chesapeake Bay), a case study. Est. Coast. Shelf Sci. 359, 491-515.
Long, W.C., R.P. Burke. 2007. Habitat size, flora, and fauna: Interactions in a tidal saltwater
marsh. J. Exp. Mar. Biol. Ecol. 353:80-88.
21
Long, W.C., Seitz, R.D., (2009) Hypoxia in Chesapeake Bay tributaries: worsening effects on
macrobenthic community structure in the York River. Est. Coast. 32:287-297.
Meyer, D.L., 1994. Habitat partitioning between the xanthid crabs Panopeus herbstii and
Eurypanopeus depressus on intertidal oyster reefs (Crassostrea virginica) in
Southeastern North Carolina. Estuaries 17, 674-679.
Meyer, D.L., 2001, Johnson, J.M., Gill, J.W., 2001. Comparison of nekton use of Phragmites
australis and Spartina alterniflora marshes in the Chesapeake Bay, USA. Mar. Ecol.
Prog. Ser. 209, 71-84.
Minello, T.J., Able, K.W., Weinstein, M.P., Hays, C.G., 2003. Salt marshes as nurseries for
nekton: testing hypotheses on density, growth and survival through meta-analysis. Mar.
Ecol. Prog. Ser. 246, 39-59.
Osgood, D.T., Yozzo, D.J., Chambers, R.M., Jacobson, D., Hoffman, T., Wnek, J., 2003. Tidal
hydrology and habitat utilization by resident nekton in Phragmites and non-Phragmites
marshes. Estuaries 26, 522-533.
Peterson, C.H., Lipcius, R.N., 2003. Conceptual progress towards predicting quantitative
ecosystem benefits of ecological restorations. Mar. Ecol. Prog. Ser. 264, 297-307.
Peterson, M.S., Comyns, B.H., Hendon, J.R., Bond, P.J., Duff, G.A., 2000. Habitat use by early
life-history stages of fishes and crustaceans along a changing estuarine landscape:
Differences between natural and altered shoreline sites. Wetlands Ecol. Manag. 8:209-
219.
Pister, B., 2009. Urban marine ecology in southern California: the ability of riprap structures to
serve as rocky intertidal habitat. Mar. Biol. 156:861-873.

22
Posey, M.H., Alphin, T.D, Meyer, D.L., Johnson, J.M., 2003. Benthic communities of common
reed Phragmites australis and marsh cordgrass Spartina alterniflora marshes in
Chesapeake Bay. Mar. Ecol. Prog. Ser. 261, 51-61.
Quan, W., Fu, C., Jin, B., Luo, Y., Li, B., Chen, J., Wu, J., 2007 Tidal marshes as energy sources
for commercially important nektonic organisms: stable isotope analysis. Mar. Ecol. Prog.
Ser. 252, 89-99.
Robertson, T.L., Weis, J.S., 2005. A comparison of epifaunal communities associated with the
stems of salt marsh grasses Phragmites australis and Spartina alterniflora. Wetlands 25,
1-7.
Robertson, T.L., Weis, J.S., 2007. Interactions between the grass shrimp Palaemonetes pugio
and the salt marsh grasses Phragmites australis and Spartina alterniflora. Biol. Invasions
9, 25-30.
Roman, C.T., Daiber, F.C., 1989. Organic carbon flux through a Delaware Bay salt marsh: tidal
exchange, particle size distribution, and storms. Mar. Ecol. Prog. Ser. 54:149-156.
Ruiz, G.M., Hines, A.H., Posey, M.H., 1993. Shallow water as a refuge habitat for fish and
crustaceans in non-vegetated estuaries: an example from Chesapeake Bay. Mar. Ecol.
Prog. Ser. 99, 1-16.
Ryer, C.H., van Montfrans, J., Moody, K.E., 1997. Cannibalism, refugia and the molting blue
crab. Mar. Ecol. Prog. Ser. 147, 77-85.
Seitz R.D., Lipcius, R.N., Stockhausen, W.T., Delano, K.A., Seebo, M.S., Gerdes. P.D., 2003.
Potential bottom-up control of blue crab distribution at various spatial scales. Bull. Mar.
Sci. 72, 471-490.
23
Seitz, R.D., Lipcius, R.N., Seebo, M.S., 2005. Food availability and growth of the blue crab in
seagrass and unvegetated nurseries of Chesapeake Bay. J. Exp. Mar. Biol. Ecol. 319, 57-
68.
Seitz, R.D., Lipcius, R.N., Olmstead, N.H., Seebo, M.S., Lambert, D.M., 2006. Influence of
shallow-water habitats and shoreline development on abundance, biomass, and diversity
of benthic prey and predators in Chesapeake Bay. Mar. Ecol. Prog. Ser. 326, 11-27.
Seitz, R. D., Lipcius, R.N., Knick, K.E., Seebo, M.S., Long, W.C., Brylawski, B.J., Smith, A.,
2008. Stock enhancement and ecosystem carrying capacity in blue crab nursery habitats
of Chesapeake Bay. Rev. Fish. Sci. 16, 1-9.
Stunz, G.W., Minello, T.J., 2001. Habitat-related predation on juvenile wild-caught and
hatchery-reared red drum Sciaenops ocellatus (Linnaeus). J. Exp. Mar. Biol. Ecol. 260,
13-25.
Terwin, J.R., 1999. Blue crab, Callinectes sapidus, foraging in Chesapeake Bay: the importance
of intra-specific interactions and prey distributions. Ph.D. Dissertation. University of
Maryland, College Park, MD.
Virnstein, R.W., 1977. The importance of predation by crabs and fishes on benthic infauna in
Chesapeake Bay. Ecol. 58, 1199-1217.
Wainright, S.C., Weinstein, M.P., Able, K.W., Currin, C.A., 2000. Relative importance of
benthic microalgae, phytoplankton and the detritus of smooth cordgrass Spartina
alterniflora and the common reed Phragmites australis to brackish-marsh food webs.
Mar. Eco. Prog. Ser. 200, 77-91.
Weis, J.S., Weis, P., 2003. Is the invasion of the common reed, Phragmites australis, into tidal
marshes of the eastern US an ecological disaster? Mar. Poll. Bull. 46, 816-820.

24
Weis, J.S., Weis, P., Proctor T., 1998. The extent of benthic impacts of CCA-treated wood
structures in Atlantic coast estuaries. Arch. Environ. Contam. Toxicol. 34, 313-322.
Zmora O, Findiesen A, Stubblefield J, Frenkel V., Zohar Y. 2005. Large-scale juvenile
production of the blue crab, Callinectes sapidus. Aquaculture 244, 129-139.
25
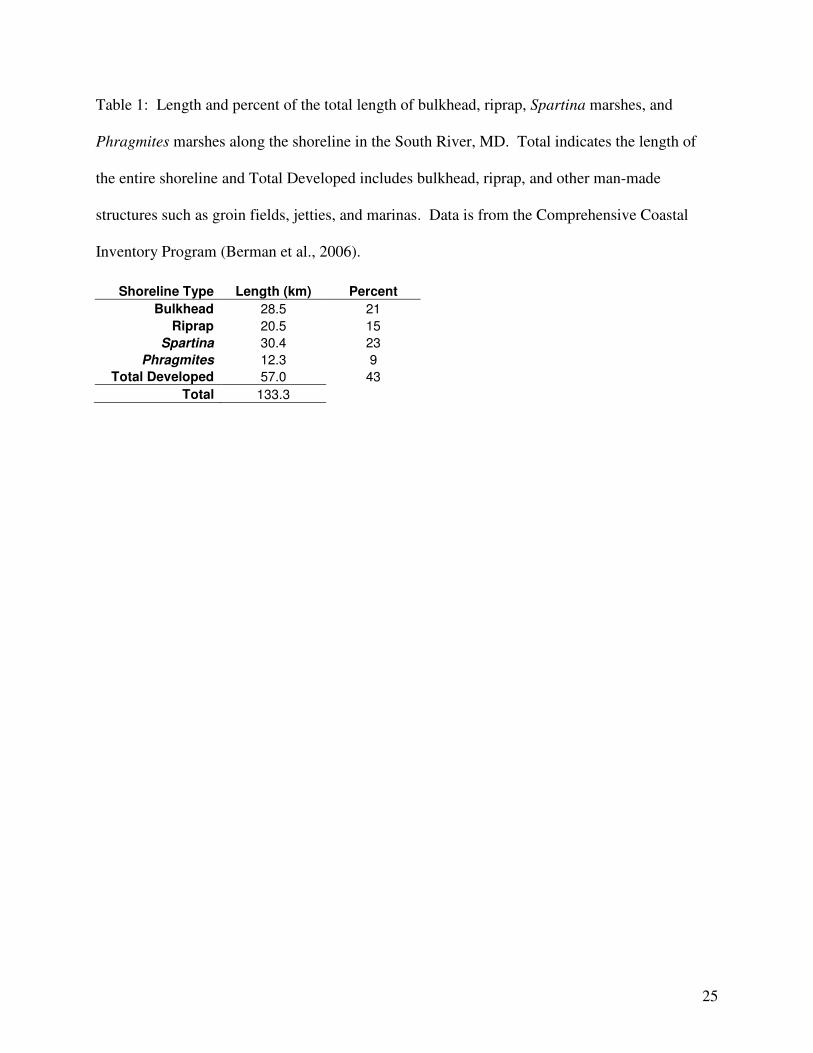
Table 1: Length and percent of the total length of bulkhead, riprap, Spartina marshes, and
Phragmites marshes along the shoreline in the South River, MD. Total indicates the length of
the entire shoreline and Total Developed includes bulkhead, riprap, and other man-made
structures such as groin fields, jetties, and marinas. Data is from the Comprehensive Coastal
Inventory Program (Berman et al., 2006).
Shoreline Type Length (km) Percent
Bulkhead 28.5 21
Riprap 20.5 15
Spartina 30.4 23
Phragmites 12.3 9
Total Developed 57.0 43
Total 133.3
26
Table 2: Average density (ind. m-2
) of macrofaunal organisms in benthic cores adjacent to each
shoreline type. B = bivalve, G = gastropod, C = crustacean, I = insect, P = polichaete, O = other.
Species Bulkhead Riprap Phragmites Spartina
Mya arenaria (B) 0 0 0 46
Macoma balthica (B) 12 46 25 15
Macoma mitchelli (B) 62 46 49 293
Mulinia lateralis (B) 25 31 25 0
Rangia cuneata (B) 0 15 0 0
Mytilus edulis (B) 0 0 0 15
Hydrobia miniata (G) 0 15 0 0
Hydrobia neglecta (G) 0 0 0 15
Cyathura polita (C) 0 0 37 0
Leptochelia spp. (C) 49 31 271 293
Edotea triloba (C) 37 0 12 15
Cassidisca lunifrons (C) 0 0 12 0
Corophium lacustre (C) 25 0 12 0
Neohaustorius schmitzi (C) 0 0 25 46
Gammarus mucronatus (C) 12 31 148 0
Gammarus tigrinus (C) 210 62 136 123
Leptocheirus plumulosus (C) 0 31 160 15
Palaemonetes pugio (C) 0 0 12 0
Crab megalopae (C) 12 0 12 0
Eurypanopeus depressus (C) 25 0 0 15
Semibalanus balanoides (C) 37 0 0 0
Mysidopsis bigelow (C) 0 0 0 15
Cumacea spp. (C) 0 31 0 0
Lynceus sp. (C) 0 0 12 62
Chironomidae spp. (I) 444 62 407 802
Culicidae spp. (I) 0 0 49 15
Heteromastus filiformis (P) 111 139 123 154
Notomastus spp (P) 0 0 25 31
Mediomastus californiensis (P) 37 0 0 0
Mediomastus ambiseta (P) 12 0 0 0
Capitella capitata (P) 0 0 37 0
Opheliidae sp. (P) 432 308 247 586
Ophelia bicornis (P) 12 31 0 0
Spionidae spp. (P) 0 0 12 0
Neanthes succinea (P) 62 31 123 46
Laonereis culveri (P) 185 15 222 262
Eteone heteropoda (P) 222 123 62 262
Leitoscoloplos fragilis (P) 0 46 0 0
Potamilla neglecta (P) 0 15 0 0
Ampharetidae sp. (P) 12 15 12 108
Cirratulidae spp. (P) 0 0 25 0
Glycera americana (P) 0 0 12 0
Demonax microphthalmus (P) 12 0 0 0
Tubificidae spp. 0 0 25 0
Nematoda spp. 0 62 25 0

27
Table 3: Ranking of exponential loss rate models for tethered juvenile blue crabs in four
different shoreline types using Alkaike’s information criterion with small sample size correction
(AICc). The models are as follows: No Difference- all habitats are the same; Structure-
Bulkhead differs from structured shorelines (riprap and marshes); M,R,B- Marshes, riprap, and
bulkhead all differ from each other; All Different- all four shorelines differ. Bold font indicates
the best fit model(s).
Model Parameters AICc ∆AICc Likelihood AICc Weights
No Difference 1 -5.58 9.80 0.01 0.00
Structure 2 -14.90 0.49 0.78 0.35
M,R,B 3 -15.38 0.00 1.00 0.44
All Different 4 -13.82 1.57 0.46 0.20
28
Figure 1:
Figure 1: Map of the South River, Chesapeake Bay, Maryland. Symbols represent sampling
sites.
29
Figure 2:
Shoreline type
Bulkhead Riprap Phragmites Spartina
Pre
y d
en
sit
y (
m-2
)
0
1000
2000
3000
4000 a
ab
ab
b
Taxo
n r
ich
ness p
er
co
re
0
2
4
6
8
10A
B
Bulkhead Riprap Phragmites Spartina
Figure 2: Taxon richness (A) and density of benthic macrofaunal prey (B) in cores (10 cm
diameter) taken at each of the four shoreline types. Bars are mean +SE. Bars with different
letters above them differ at an α level of 0.05 (Fisher’s least significant difference test).
30
Figure 3:
0
5
10
15
20
25
30
35
40
45
0
5
10
15
20
25
30
35
40
45
Pol
ycha
etes
Pla
nt M
ater
ial
Chi
rono
mid
s
Am
phip
ods
UnI
d C
rust
acea
nsCra
bsShr
imp
Biv
alve
sB
arni
cles
Sed
imen
t
Uni
dent
ified
Pe
rcen
t ab
un
dan
ce
in
fo
reg
ut
(vo
l)
0
5
10
15
20
25
30
35
40
45
Pol
ycha
etes
Pla
nt M
ater
ial
Chi
rono
mid
s
Am
phip
ods
UnI
d C
rust
acea
nsCra
bsShr
imp
Biv
alve
sB
arni
cles
Sed
imen
t
Uni
dent
ified
0
5
10
15
20
25
30
35
40
45
Bulkhead
Phragmites
Riprap
Spartina
Figure 3: Percent abundance by volume of prey in the foreguts of juvenile blue crabs from each
of the four shoreline types. Bars are means +SE.
31
Figure 4:
Shoreline type
Bulkhead Riprap Phragmites Spartina
Cra
b g
row
th (
mm
/day)
0.0
0.2
0.4
0.6
0.8
1.0
1.2
Phragmites
0.0
0.2
0.4
0.6
0.8
1.0
1.2A
B
Bulkhead Riprap Spartina
Figure 4: Juvenile blue crab growth after 4 weeks (A) and 12 weeks (B) along each of four
shoreline types. Bars are mean +SE.

32
Figure 5:
Shoreline type
Bulkhead Riprap Phragmites Spartina
Pre
dato
rs p
er
sein
e
0
5
10
15
20
Cra
b lo
ss r
ate
(d
ay-1
)
0
2
4
6
8
10
12
14 99.9995%
81.1%
98.2%
92.4%
Percent lossafter 24 h
A
B
Bulkhead Riprap Phragmites Spartina
Figure 5: A) Maximum likelihood estimates of loss rates (+SE) of tethered crabs at each of four
shoreline types assuming an exponential loss. The number above each bar represents predicted
percent of tethered crabs lost after 24 h. B) Average abundance of predators (+SE) at each of the
shoreline types. Predators include only species likely to prey upon blue crabs (see text for
species included).
33
Figure 6:
Shoreline type
Bulkhead Riprap Phragmites Spartina
100
110
120
130
140
160
180
200
220
ab
ab
a
b
White perch
Pre
da
tor
siz
e (
mm
)
20
40
60
80
100Blue crab
Atlantic croaker
a ab
bc
c
Bulkhead Riprap Phragmites Spartina
Figure 6: Sizes of the most abundant juvenile blue crab predators at each of four shoreline types.
Sizes are total length for piscine species and carapace width for crustaceans. Bars are mean +SE.
Bars with different letters above them differ at an α level of 0.05 (Fisher’s least significant
difference test for white perch; Kruskal-Wallis multiple comparison for croaker). The scale of
the x-axis varies among the plots.