How do disconnected macropores in sloping soils facilitate preferential flow?
Upload
independentCategory
view
7download
0
Preadaptation and post-introduction evolution facilitate theinvasion of Phragmites australis in North AmericaWen-Yong Guo1,2, Carla Lambertini1, Loc Xuan Nguyen1,3, Xiu-Zhen Li2 & Hans Brix1
1Department of Bioscience, Aarhus University, Ole Worms All�e 1, 8000 Aarhus C, Denmark2State Key Laboratory of Estuarine and Coastal Research, East China Normal University, Shanghai 200062, China3College of Environment and Natural Resources, Campus II, Can Tho University, 3/2 Street, Ninh Kieu District, Can Tho City, Vietnam
Keywords
Biomass allocation, common reed, common-
environment experiment, discriminant
analysis, ecophysiological trade-off,
functional traits, invasion ecology, leaf
construction cost, photosynthesis,
standardized major axis (SMA).
Correspondence
Wen-Yong Guo, Department of Bioscience,
Aarhus University, Ole Worms All�e 1, 8000
Aarhus C, Denmark.
Tel: +45 8715 6504;
Fax: +45 8715 4302;
E-mails: [email protected];
Funding Information
This work was funded by the Danish Council
for Independent Research – Natural Sciences,
projects no. 272-07-0633 and 0602-01443.
Received: 5 August 2014; Revised: 8
September 2014; Accepted: 23 September
2014
doi: 10.1002/ece3.1286
Abstract
Compared with non-invasive species, invasive plant species may benefit from
certain advantageous traits, for example, higher photosynthesis capacity and
resource/energy-use efficiency. These traits can be preadapted prior to introduc-
tion, but can also be acquired through evolution following introduction to the
new range. Disentangling the origins of these advantageous traits is a funda-
mental and emerging question in invasion ecology. We conducted a multiple
comparative experiment under identical environmental condition with the inva-
sive haplotype M lineage of the wetland grass Phragmites australis and com-
pared the ecophysiological traits of this invasive haplotype M in North America
with those of the European ancestor and the conspecific North American native
haplotype E lineage, P. australis ssp. americanus. The invasive haplotype M
differed significantly from the native North American conspecific haplotype E
in several ecophysiological and morphological traits, and the European haplo-
type M had a more efficient photosynthetic apparatus than the native North
American P. australis ssp. americanus. Within the haplotype M lineage, the
introduced North American P. australis exhibited different biomass allocation
patterns and resource/energy-use strategies compared to its European ancestor
group. A discriminant analysis of principal components separated the haplotype
M and the haplotype E lineages completely along the first canonical axis, highly
related to photosynthetic gas-exchange parameters, photosynthetic energy-use
efficiency and payback time. The second canonical axis, highly related to
photosynthetic nitrogen use efficiency and construction costs, significantly
separated the introduced P. australis in North America from its European
ancestor. Synthesis. We conclude that the European P. australis lineage was pre-
adapted to be invasive prior to its introduction, and that the invasion in North
America is further stimulated by rapid post-introduction evolution in several
advantageous traits. The multicomparison approach used in this study could
be an effective approach for distinguishing preadaptation and post-introduction
evolution of invasive species. Further research is needed to link the observed
changes in invasive traits to the genetic variation and the interaction with the
environment.
Introduction
The mechanisms that underlie plant invasions are complex,
and no individual mechanism can sufficiently explain bio-
logical invasions (Nentwig 2007; Bennett et al. 2011; Larkin
et al. 2011; Qin et al. 2013). Invasive mechanisms can be
invasion stage and/or species dependent (Zedler and Ker-
cher 2004; Py�sek et al. 2009; Gurevitch et al. 2011). For
example, native-range distributional characteristics can be
dominant in the early stage of the invasion, while biological
ª 2014 The Authors. Ecology and Evolution published by John Wiley & Sons Ltd.
This is an open access article under the terms of the Creative Commons Attribution License, which permits use,
distribution and reproduction in any medium, provided the original work is properly cited.
1

traits1 are more important in later stages of invasions (Nen-
twig 2007; Py�sek et al. 2009). Species with a large native
geographical range generally have the ability to survive
under a wide range of environmental conditions, and as a
consequence also have a suit of preadapted traits allowing
them to establish in new ranges (Py�sek and Richardson
2007; Bucharova and van Kleunen 2009; Py�sek et al. 2009;
van Kleunen et al. 2010b, 2011). In addition, after the
introduction to new areas, the invasion can be stimulated
by rapid adaptive changes in advantageous traits (Py�sek
et al. 2009; Henery et al. 2010). In a recent review of 53
invasive species, Parker et al. (2013) found that nearly half
of the studied species performed similarly across the intro-
duced and native ranges, while the others exhibited traits
that performed better in the introduced range, suggesting
that evolutionary adaptive changes did occur after
introduction to a new range.
Compared to non-invasive species, plant invaders tend
to have a higher photosynthetic capacity, a higher specific
leaf area, higher nitrogen contents and lower leaf
construction costs (Griffin 1994; Feng et al. 2007b, 2011;
Leishman et al. 2007; Zou et al. 2007; Mozdzer and Zi-
eman 2010; Osunkoya et al. 2010; Li et al. 2011; Heber-
ling and Fridley 2013), even though contradictory results
have been reported (McDowell 2002; Feng et al. 2007a,b;
Heberling and Fridley 2013). As discussed by Hierro et al.
(2005), Schlaepfer et al. (2010) and Parker et al. (2013),
the majority of these trait-comparison studies are, how-
ever, based on common-environment experiments with
invasive species and co-occurring native congeners (e.g.,
Feng et al. 2007a,b; van Kleunen et al. 2010b; Mozdzer
and Zieman 2010; Kumschick et al. 2013). While these
studies are fundamental to identify the advantageous
traits of the invader, they are inadequate to pinpoint the
source of such advantages, that is, whether the invasive
traits are preadapted, or evolved post-introduction (Rich-
ardson and Py�sek 2006; Keller and Taylor 2008; van Kle-
unen et al. 2010a,b; Riis et al. 2010; Schlaepfer et al.
2010; Atwood and Meyerson 2011; Bennett et al. 2011;
Gurevitch et al. 2011). Meanwhile, an increasing number
of studies has focused on trait differences between inva-
sive populations and their source populations in the
native range (Bossdorf et al. 2005; Barrett et al. 2008; Kel-
ler and Taylor 2008; Whitney and Gabler 2008; Schlaepfer
et al. 2010; Alexander et al. 2012). This ancestor-descen-
dent comparison (Keller and Taylor 2008) is suitable for
detecting post-introduction evolution, but does not
address preadapted traits. Only multiple comparisons
consisting of the aforementioned two types of compari-
sons simultaneously, that is, comparison of the invader
with its congeneric populations in the introduced range,
and the ancestor-descendent comparison of the invader,
can disentangle the contributions of prior evolutionary
history and post-introduction evolution to invasion. In
addition, comparisons of the respective relationships of
ancestor and descendent of the invader with the native
congener of the invader can give additional information
about the post-introduction evolution and the trade-offs
during the invasion process.
Phragmites australis (Cav.) Trin. ex Steud. is one of the
most widespread perennial grasses in the world (Clevering
and Lissner 1999). Although P. australis is native to North
America, its recent rapid spread has been attributed to a
nonnative haplotype (Haplotype M) of P. australis that is
reported to be introduced from Eurasia in the late 1700s
or early 1800s (Saltonstall 2002). This nonnative P. aus-
tralis lineage has now dramatically altered the composition
and functionality of many estuarine and freshwater wet-
land communities throughout North America, particularly
along the Atlantic coast and in the Chesapeake Bay region
(Saltonstall 2002; Meyerson et al. 2009, 2012; Mozdzer
and Zieman 2010; Guo et al. 2013). The introduced
P. australis exhibits many characteristics of a successful
invasive species, such as rapid growth, high biomass, rhi-
zome fragmentation, and tolerance to high salinities (Mey-
erson et al. 2009). Furthermore, Mozdzer and Zieman
(2010) demonstrated that the invasive lineage displays a
higher rate of photosynthesis, a higher stomatal conduc-
tance and a higher specific leaf area than the native North
American lineage. The cited studies successfully explain
the invasiveness of this Eurasian P. australis in North
America but not the origin of the invasive characteristics.
A global collection of Phragmites genotypes from all
continents is cultured in a common-environment setting
at Aarhus University, Denmark (Lambertini et al. 2006).
We used a subset of Phragmites genotypes from this col-
lection to investigate general questions about preadapta-
tion and post-introduction evolution within this species.
We chose genotypes on a biogeographic scale to compare
the ecophysiological traits of the invasive P. australis in
North America with those of the European ancestor and
the conspecific North American native P. australis
ssp. americanus. The hypotheses tested were: (1) the
native-range haplotype M has some advantageous traits
compared to the native North American congener, which
make it preadapted to be invasive; and (2) the introduced
haplotype M exhibits divergent traits compared with its
ancestor because of post-introduction evolution during
the process of invasion in North America.
Materials and Methods
Plant material
The study was conducted outdoors in the experimental
Phragmites garden at Aarhus University (56°130N,
2 ª 2014 The Authors. Ecology and Evolution published by John Wiley & Sons Ltd.
Preadapted and Evolving Traits with Invasion W.-Y. Guo et al.
10°070E, approximately 64 m above sea level), located
north of Aarhus city, on the east side of the peninsula of
Jutland, Denmark. The location has a temperate oceanic
climate with an average temperature of 0°C in the coldest
month (February) and 17°C in the warmest month (July).
The mean annual precipitation is approximately 700 mm,
without a dry season. During summer, there are up to
18 h of daylight per day.
The plants in the Phragmites garden were obtained
from rhizomes collected in the field from geographically
distant stands of P. australis. Each genotype was kept in
its own 0.65-m diameter pot, containing a mixture of a
commercial soil and quartz sand (approximately 50% of
each). The pots were half-buried into the ground with
the soil surface at level with the surrounding ground
and placed at a distance of about 2 m between pots in
an open area without shade from trees or other struc-
tures. The plants were watered with phreatic water every
second day and fertilized with a commercial NPK fertil-
izer with micronutrients once a week (Lambertini et al.
2012b). To minimize the potential stress from a pot
bound root mass, the plants were replanted every third
year using a fraction of the root system. The Phragmites
genotypes used in this study had been grown in the
garden since 2001 under these conditions and displayed
a comparable vegetative development throughout the
years.
We chose genotypes from temperate Europe as the
native source population of the invasive P. australis, as
the most likely origin of this invasive lineage is temperate
Europe (Plut et al. 2011; Lambertini et al. 2012b). In the
introduced range, we chose genotypes of the invasive line-
age collected along the East Coast of North America, as
the New York City area has been shown to be the landing
site of this lineage (Saltonstall 2002). The native North
American conspecific P. australis ssp. americanus selected
for the study also came from this region. The genotypes
were sequenced (Lambertini et al. 2012a,b) following Sal-
tonstall (2002). The invasive P. australis lineage belongs
to haplotype M (defined by NCBI accession numbers
AY016335 for the trnT-trnL region and AY016327 for the
rbcL-psaI region), and the native North American conspe-
cific P. australis ssp. americanus belongs to haplotype E
(defined by NCBI accession numbers AY016325 for the
trnT-trnL region and AY016333 for the rbcL-psaI region).
In total, we included six genotypes of the native European
population of the invasive haplotype M (hereafter
denoted the EU group), nine genotypes of the introduced
haplotype M population in North America (hereafter
denoted the AM group), and five genotypes of the native
North American conspecific P. australis ssp. americanus
lineage (hereafter denoted the AMn group) in our analy-
ses (Table 1).
Morphological traits
The five tallest shoots of each genotype were measured on
May 30, 2011. We measured the height from the tip of the
shoot to the ground and the basal diameter of each shoot
in the field. Subsequently, the five shoots were cut and
weighed to obtain the fresh shoot mass. The youngest fully
expanded leaf per shoot was cut off, weighed to obtain the
fresh leaf mass, and the length and width at the widest
point of the leaf were measured. The leaf area was deter-
mined using a Li-3000C leaf area meter (LI-COR Inc.,
Lincoln, NE). The leaf and the entire shoot were then
oven-dried at 105°C for 2 h, followed by drying at 60°Cfor at least 48 h for dry mass determination. The dried
shoots were separated into leaf blades, leaf sheaths and
stems, and weighed for biomass allocation determination.
The specific leaf area (SLA) was calculated as the ratio
of the leaf area to the leaf dry mass. The leaf thickness
was calculated according to Vile et al. (2005):
Leaf thickness =1
leaf arealeaf dry mass
� leaf dry massleaf fresh mass
¼ leaf fresh mass
leaf arealmð Þ
(1)
Leaf gas exchange
The leaf gas-exchange rates were measured in situ on the
youngest healthy, fully developed leaves of five shoots per
genotype using a portable photosynthesis system (Li-
6400XT; LI-COR Inc., Lincoln, NE) equipped with CO2-
and temperature-control modules on clear days between
10:00 and 16:00 during the period June 27–July 11, 2011.
The airflow through the leaf chamber was set to
400 lmol�s�1, the chamber temperature to 28°C and the
CO2 concentration to 400 lmol�mol�1. The light-saturated
photosynthetic capacity (A) was measured at a photosyn-
thetic photon flux density (PPFD) of 2000 lmol�pho-tons�m�2�s�1 provided by a blue-red LED light source
mounted above the leaf cuvette. The lamp was switched off
and the chamber darkened (0 lmol�photon�m�2�s�1) to
measure dark respiration (R). Each reading was logged
after a 3–5 min period of stabilization. The area-based sto-
matal conductance (gs), transpiration rate (E), and the
intercellular CO2 concentration (Ci) were recorded by the
Li-6400XT system simultaneously with the photosynthesis
measurements.
Leaf structure and biochemistry
Following the gas-exchange measurements, the leaves used
for the measurement were harvested and brought to the
ª 2014 The Authors. Ecology and Evolution published by John Wiley & Sons Ltd. 3
W.-Y. Guo et al. Preadapted and Evolving Traits with Invasion
laboratory in a cooling box. A leaf disc with an area of
2.14 cm2 was cut with a cork borer from each sampled
leaf, freeze-dried for 24 h, and weighed. Subsequently, the
discs were ground in a ball mill (Mixer Mill MM400;
Retsch, Haan, Germany). Subsamples of 5–10 mg dry
mass were extracted with 8 mL of 96% ethanol in the
dark at room temperature for 24 h for pigment quantifi-
cation. The concentrations of Chl a, Chl b, total Chl
(a + b) and total carotenoid, and xanthophylls in the
leaves were analyzed spectrophotometrically according to
Lichtenthaler (1987). The concentration of total carbon
(C) and nitrogen (N) in the leaves were analyzed by a
CN Analyser (model NA2000; Fisons Instruments, Carlo
Erba, Italy). The leaf ash contents (Ash) were determined
by burning of dry leaf powder samples in a 450°C muffle
furnace for 6 h. The heat of combustion (HC) was mea-
sured in approximately 200 mg of leaf powder using a
Parr bomb calorimeter (model 6725; Parr Instrument
Co., Moline, IL), calibrated with benzoic acid pellets with
known energy contents. For both the Ash and HC mea-
surements, triplicate samples were analyzed and averaged
for each genotype.
Leaf resource/energy-use efficiency
The intrinsic water use efficiency (IWUE) and the photo-
synthetic nitrogen use efficiency (PNUE) were calculated
as the area-based A divided by gs and the area-based N
concentration, respectively (Jiang et al. 2009). The leaf
respiration efficiency (RE) was obtained by dividing A by
the corresponding R. A high RE indicates a low respira-
tion cost for photosynthesis, hence allowing more carbon
to be allocated to growth (Feng et al. 2007b, 2011).
The construction costs (CC), that is, the amount of
glucose needed to form one g of leaf (Williams et al.
1987), was calculated using a formula based on the
growth efficiency of the leaf tissue, the heat of combus-
tion and the ash and nitrogen content (Williams et al.
1987):
CC ¼ ð0:06968HC� 0:065Þð1� AshÞ þ 7:5ð kN14:0067Þ
Eg
g glucose g�1dry mass� �
(2)
where HC is the ash-free heat of combustion (kJ�g�1);
Ash is the ash content (g�g�1 leaf dry mass); N is the total
nitrogen concentration (g�g�1 dry mass); k is the oxida-
tion state of the nitrogen source (+5 for nitrate, �3 for
ammonium); and Eg is the growth efficiency (the fraction
of the energy required to provide a reductant that is con-
sumed during the formation of the tissue, but is not
incorporated into the biomass; Williams et al. 1987;
Poorter et al. 2006). The value of Eg used in this study
was 0.87 (Williams et al. 1987; Griffin 1994). It was
assumed that the nitrogen source for all specimens was
both nitrate and ammonium; CC was therefore calculated
using both k = +5 and �3, and the average values were
used. To calculate the leaf CC per unit leaf area, the
obtained mass-based CC values were divided by the SLA
(CCarea, g�glucose�m�2).
The leaf photosynthetic energy-use efficiency (PEUE)
was calculated as the ratio of Aarea to CCarea (Feng et al.
2011). The payback time, that is, the time needed to
recover the carbon invested in the construction of a leaf
through photosynthesis (Poorter et al. 2006; Karagatzides
and Ellison 2009), was calculated as CCmass/Amass after
converting CCmass from g�glucose�g�1 dry mass to
nmol�g�1 dry mass and Amass from lmol CO2 g�1 dry
mass�s�1 to nmol C�g�1 dry mass�h�1 (Karagatzides and
Ellison 2009).
Data analysis
To assess differences between the three groups, we con-
verted the mass-based parameters (e.g., N, C, chlorophyll)
into area-based parameters via division by the corre-
sponding SLA, while the area-based variables measured
with the LI-COR system (e.g., A, R) were converted into
mass-based variables through multiplication by the corre-
sponding SLA.
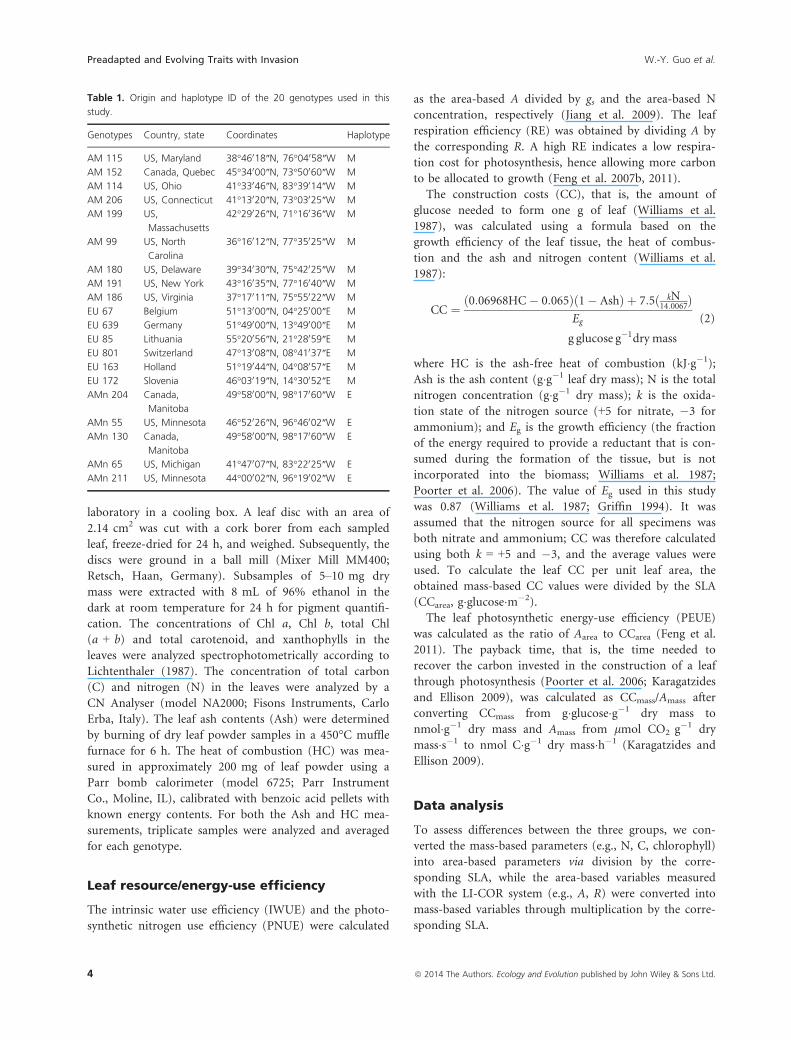
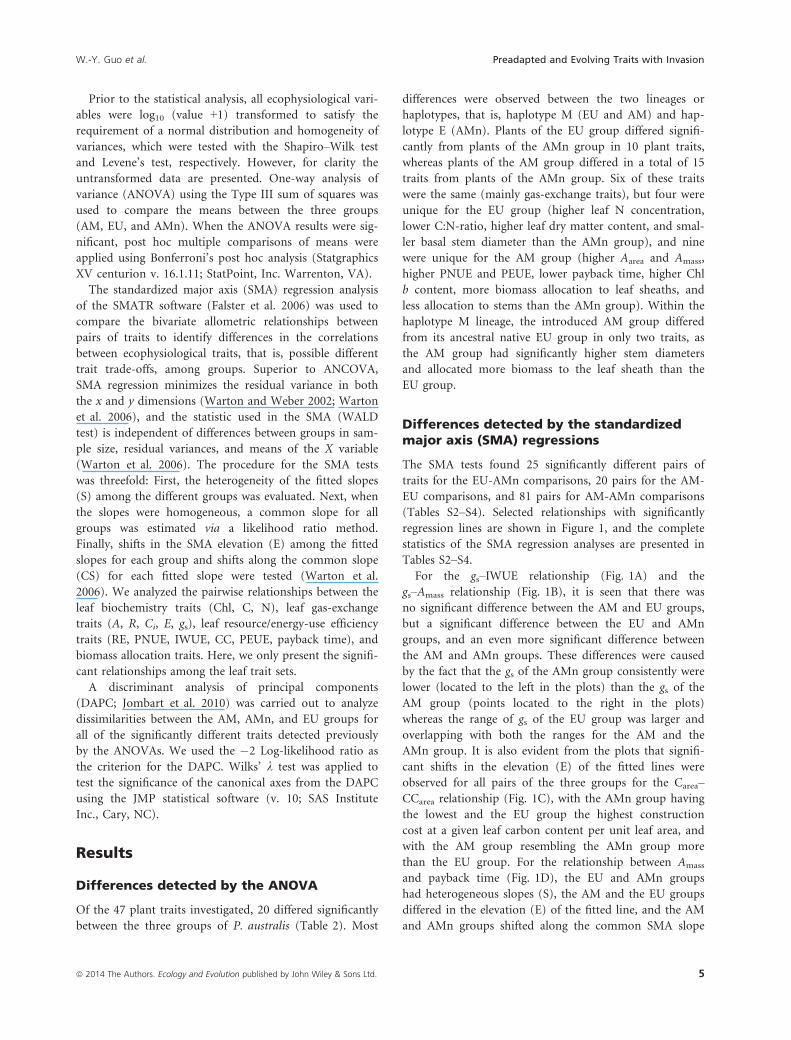
Table 1. Origin and haplotype ID of the 20 genotypes used in this
study.
Genotypes Country, state Coordinates Haplotype
AM 115 US, Maryland 38°46018″N, 76°04058″W M
AM 152 Canada, Quebec 45°34000″N, 73°50060″W M
AM 114 US, Ohio 41°33046″N, 83°39014″W M
AM 206 US, Connecticut 41°13020″N, 73°03025″W M
AM 199 US,
Massachusetts
42°29026″N, 71°16036″W M
AM 99 US, North
Carolina
36°16012″N, 77°35025″W M
AM 180 US, Delaware 39°34030″N, 75°42025″W M
AM 191 US, New York 43°16035″N, 77°16040″W M
AM 186 US, Virginia 37°17011″N, 75°55022″W M
EU 67 Belgium 51°13000″N, 04°25000″E M
EU 639 Germany 51°49000″N, 13°49000″E M
EU 85 Lithuania 55°20056″N, 21°28059″E M
EU 801 Switzerland 47°13008″N, 08°41037″E M
EU 163 Holland 51°19044″N, 04°08057″E M
EU 172 Slovenia 46°03019″N, 14°30052″E M
AMn 204 Canada,
Manitoba
49°58000″N, 98°17060″W E
AMn 55 US, Minnesota 46°52026″N, 96°46002″W E
AMn 130 Canada,
Manitoba
49°58000″N, 98°17060″W E
AMn 65 US, Michigan 41°47007″N, 83°22025″W E
AMn 211 US, Minnesota 44°00002″N, 96°19002″W E
4 ª 2014 The Authors. Ecology and Evolution published by John Wiley & Sons Ltd.
Preadapted and Evolving Traits with Invasion W.-Y. Guo et al.
Prior to the statistical analysis, all ecophysiological vari-
ables were log10 (value +1) transformed to satisfy the
requirement of a normal distribution and homogeneity of
variances, which were tested with the Shapiro–Wilk test
and Levene’s test, respectively. However, for clarity the
untransformed data are presented. One-way analysis of
variance (ANOVA) using the Type III sum of squares was
used to compare the means between the three groups
(AM, EU, and AMn). When the ANOVA results were sig-
nificant, post hoc multiple comparisons of means were
applied using Bonferroni’s post hoc analysis (Statgraphics
XV centurion v. 16.1.11; StatPoint, Inc. Warrenton, VA).
The standardized major axis (SMA) regression analysis
of the SMATR software (Falster et al. 2006) was used to
compare the bivariate allometric relationships between
pairs of traits to identify differences in the correlations
between ecophysiological traits, that is, possible different
trait trade-offs, among groups. Superior to ANCOVA,
SMA regression minimizes the residual variance in both
the x and y dimensions (Warton and Weber 2002; Warton
et al. 2006), and the statistic used in the SMA (WALD
test) is independent of differences between groups in sam-
ple size, residual variances, and means of the X variable
(Warton et al. 2006). The procedure for the SMA tests
was threefold: First, the heterogeneity of the fitted slopes
(S) among the different groups was evaluated. Next, when
the slopes were homogeneous, a common slope for all
groups was estimated via a likelihood ratio method.
Finally, shifts in the SMA elevation (E) among the fitted
slopes for each group and shifts along the common slope
(CS) for each fitted slope were tested (Warton et al.
2006). We analyzed the pairwise relationships between the
leaf biochemistry traits (Chl, C, N), leaf gas-exchange
traits (A, R, Ci, E, gs), leaf resource/energy-use efficiency
traits (RE, PNUE, IWUE, CC, PEUE, payback time), and
biomass allocation traits. Here, we only present the signifi-
cant relationships among the leaf trait sets.
A discriminant analysis of principal components
(DAPC; Jombart et al. 2010) was carried out to analyze
dissimilarities between the AM, AMn, and EU groups for
all of the significantly different traits detected previously
by the ANOVAs. We used the �2 Log-likelihood ratio as
the criterion for the DAPC. Wilks’ k test was applied to
test the significance of the canonical axes from the DAPC
using the JMP statistical software (v. 10; SAS Institute
Inc., Cary, NC).
Results
Differences detected by the ANOVA
Of the 47 plant traits investigated, 20 differed significantly
between the three groups of P. australis (Table 2). Most
differences were observed between the two lineages or
haplotypes, that is, haplotype M (EU and AM) and hap-
lotype E (AMn). Plants of the EU group differed signifi-
cantly from plants of the AMn group in 10 plant traits,
whereas plants of the AM group differed in a total of 15
traits from plants of the AMn group. Six of these traits
were the same (mainly gas-exchange traits), but four were
unique for the EU group (higher leaf N concentration,
lower C:N-ratio, higher leaf dry matter content, and smal-
ler basal stem diameter than the AMn group), and nine
were unique for the AM group (higher Aarea and Amass,
higher PNUE and PEUE, lower payback time, higher Chl
b content, more biomass allocation to leaf sheaths, and
less allocation to stems than the AMn group). Within the
haplotype M lineage, the introduced AM group differed
from its ancestral native EU group in only two traits, as
the AM group had significantly higher stem diameters
and allocated more biomass to the leaf sheath than the
EU group.
Differences detected by the standardizedmajor axis (SMA) regressions
The SMA tests found 25 significantly different pairs of
traits for the EU-AMn comparisons, 20 pairs for the AM-
EU comparisons, and 81 pairs for AM-AMn comparisons
(Tables S2–S4). Selected relationships with significantly
regression lines are shown in Figure 1, and the complete
statistics of the SMA regression analyses are presented in
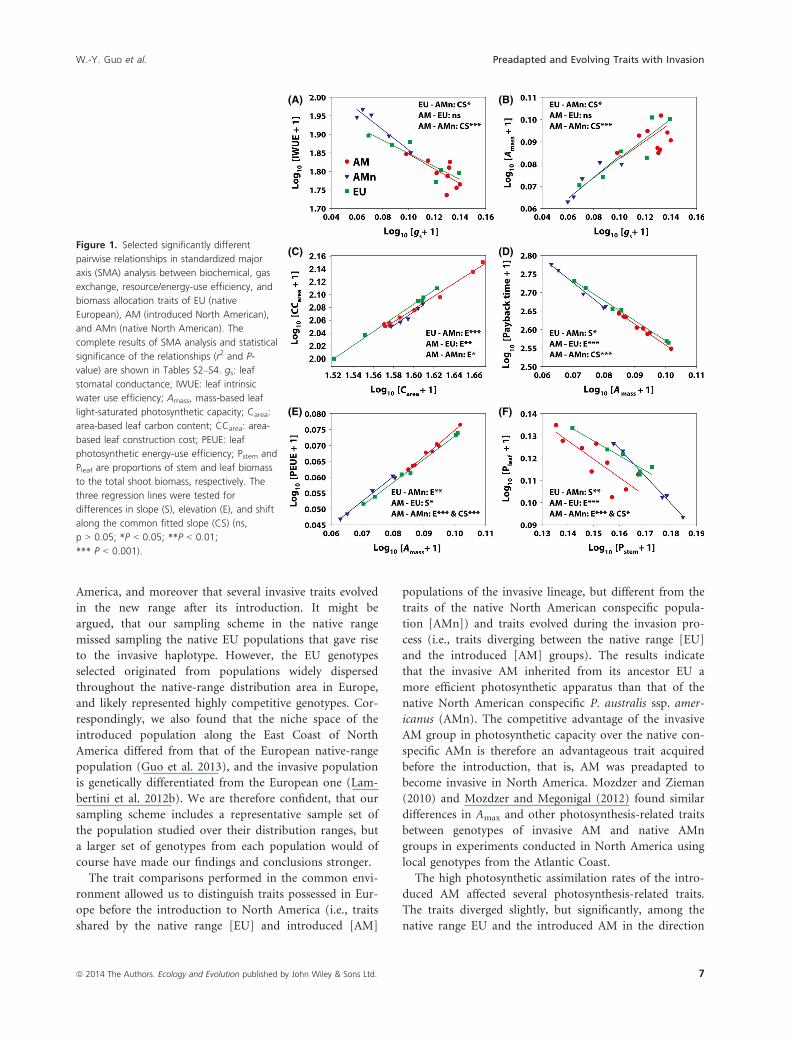
Tables S2–S4.For the gs–IWUE relationship (Fig. 1A) and the
gs–Amass relationship (Fig. 1B), it is seen that there was
no significant difference between the AM and EU groups,
but a significant difference between the EU and AMn
groups, and an even more significant difference between
the AM and AMn groups. These differences were caused
by the fact that the gs of the AMn group consistently were
lower (located to the left in the plots) than the gs of the
AM group (points located to the right in the plots)
whereas the range of gs of the EU group was larger and
overlapping with both the ranges for the AM and the
AMn group. It is also evident from the plots that signifi-
cant shifts in the elevation (E) of the fitted lines were
observed for all pairs of the three groups for the Carea–CCarea relationship (Fig. 1C), with the AMn group having
the lowest and the EU group the highest construction
cost at a given leaf carbon content per unit leaf area, and
with the AM group resembling the AMn group more
than the EU group. For the relationship between Amass
and payback time (Fig. 1D), the EU and AMn groups
had heterogeneous slopes (S), the AM and the EU groups
differed in the elevation (E) of the fitted line, and the AM
and AMn groups shifted along the common SMA slope
ª 2014 The Authors. Ecology and Evolution published by John Wiley & Sons Ltd. 5
W.-Y. Guo et al. Preadapted and Evolving Traits with Invasion

(CS). For the Amass–PEUE relationship (Fig. 1E), the
AMn group also had different relationships with the EU
and AM groups as the photosynthetic energy-use effi-
ciency (PEUE) consistently was higher for a given Amass
for the AM and AMn groups compared to the EU group.
Also, the PEUE of the AM group increased more with
Amass than the EU group, as indicated by the significant
difference in the slope (S) of the regression lines for the
two groups (Fig. 1E). For the relationship between bio-
mass allocation of leaf and stem (Fig. 1F), the EU group
differed in slope (S) from the AMn group, but not the
AM group, while the AM group in general allocated less
biomass to leaves at a given stem biomass than the EU
and AMn groups as indicated by the shifts in elevation
(E) and had lower stem biomass relative to the AMn
group (CS).
Results of the multivariate tests
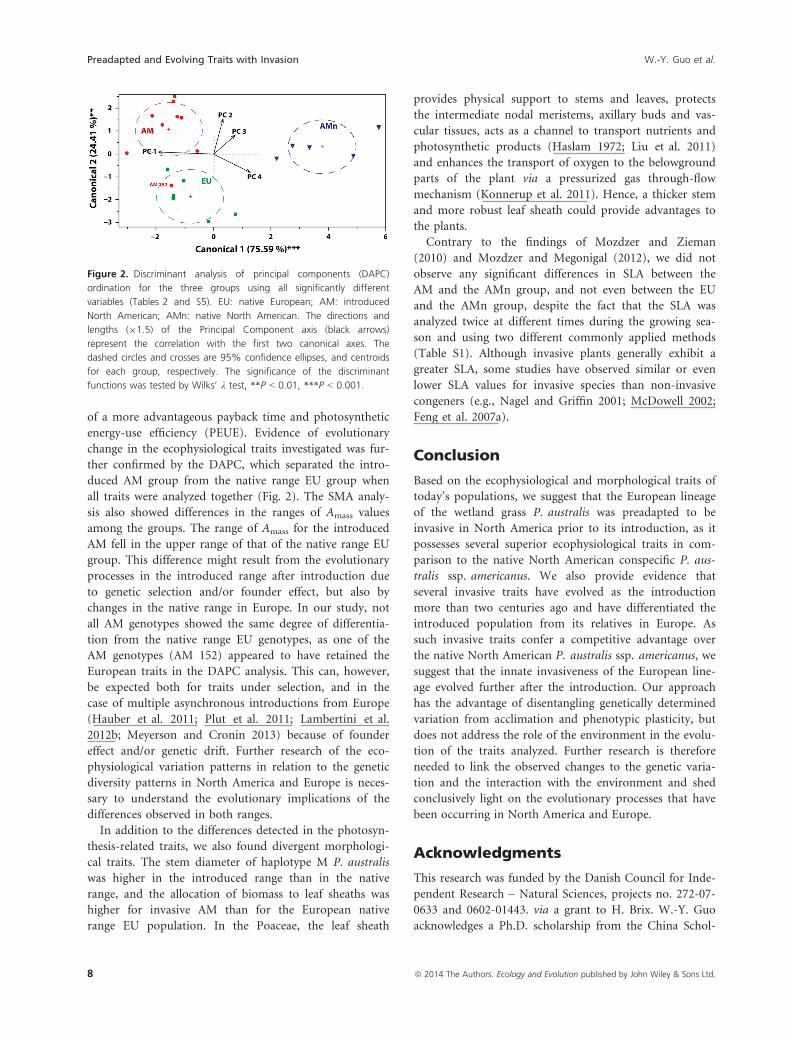
The discriminant analysis of principal components
(DAPC) of the significantly different traits detected by the
ANOVAs identified four significant PC axes that
explained 85.9% of the total variation (Table S5). Using
these four axes as the input variables, the DAPC separated
the haplotype E lineage (the AMn group) as being signifi-
cantly different from the haplotype M lineage (the EU
and AM groups) along the first canonical axis (Fig. 2,
Wilks’ k = 0.05, P < 0.001, 75.3% of variation explained).
This axis had the highest factor loadings for gas-exchange
parameters (A, gs, E, Ci), photosynthetic energy-use effi-
ciency (PEUE), and payback time (all contributing with
loadings higher than 80% to axis 1; Table S5). The DAPC
analysis did not resolve the AM and EU groups com-
pletely, as one AM genotype (AM 152) clustered in the
EU group with a high probability (>93%, Table S6 and
Fig. 2). However, the analysis significantly separated the
EU group from the AM group along the second canonical
axis (Wilks’ k = 0.35, P < 0.01, 24.7% of variation
explained), which had high loadings for photosynthetic
nitrogen use efficiency (PNUE; 59% of variation
explained) and construction costs (CCmass; 46% of varia-
tion explained).
Discussion
We here present some of the first data indicating, that the
Eurasian invasive haplotype M P. australis was preadapted
to become invasive prior to its introduction in North
Table 2. Significantly different ecophysiological traits among the three groups of Phragmites australis (EU: native European; AM: introduced
North American; AMn: native North American) and one-way ANOVA F-ratios.
EU (n = 6) AM (n = 9) AMn (n = 5) F-ratio
Aarea (lmol CO2 m�2�s�1) 18.1 (1.4)ab 20.1 (0.5)b 15.4 (0.8)a 5.86*
Amass (lmol CO2 g�1�s�1) 0.22 (0.01)ab 0.23 (0.01)b 0.18 (0.01)a 6.96**
gs (mol H2O m�2�s�1) 0.28 (0.03)b 0.34 (0.01)b 0.19 (0.02)a 11.46**
E (mmol H2O m�2�s�1) 4.4 (0.3)b 4.9 (0.1)b 3.5 (0.2)a 10.94**
Ci (lmol CO2 mol�1) 244 (4)b 251 (3)b 225 (5)a 11.90**
Leaf N content (mg�g�1) 2.62 (0.11)b 2.50 (0.04)ab 2.22 (0.15)a 4.20*
C:N-ratio 17.7 (0.7)a 18.3 (0.4)ab 20.7 (1.3)b 4.06*
PNUE (lmol CO2 g�1 N�s�1) 8.33 (0.43)ab 9.38 (0.24)b 8.22 (0.22)a 4.82*
IWUE (lmol CO2 mmol�1 H2O) 68 (3)a 62 (2)a 83 (4)b 13.13***
CCmass (g glucose�g�1 dry mass) 1.41 (0.01)b 1.39 (0.01)b 1.36 (0.01)a 13.55***
PEUE (lmol CO2 g�1�glucose�s�1) 0.155 (0.010)ab 0.167 (0.004)b 0.133 (0.007)a 5.88*
Payback time (h) 448 (29)ab 407 (10)a 516 (29)b 6.25**
Chl b (mg�g�1 dry mass) 1.07 (0.05)ab 1.09 (0.03)b 0.86 (0.09)a 5.31*
Chl b (mg�m�2) 90 (6)ab 94 (2)b 73 (7)a 4.80*
Leaf thickness (lm) 19.4 (0.6) 19.4 (0.4) 21.8 (0.9) 4.14*
LDMC (mg�g�1) 368 (6)a 343 (8)ab 327 (10)b 5.02*
Basal stem diameter (mm) 5.4 (0.3)a 6.3 (0.2)b 7.4 (0.3)b 10.82**
Shoot dry matter content (mg�g�1) 284 (4)a 273 (5)a 232 (8)b 19.89***
PLeaf sheath (%) 23.1 (0.7)a 26.8 (0.7)b 22.6 (1.9)a 13.59***
PStem (%) 45.0 (1.5)ab 41.7 (1.2)a 48.6 (1.8)b 5.65*
Values are means (SE). Different letters in the same row indicate significant differences among groups from Bonferroni’s post hoc analysis at the
95.0% confidence level. A, leaf light-saturated photosynthetic assimilation; gs, leaf stomatal conductance; E, leaf transpiration rate; Ci, leaf inter-
cellular CO2 concentration; PNUE, leaf photosynthetic nitrogen use efficiency; IWUE, leaf intrinsic water use efficiency; CCmass, mass-based leaf
construction cost; PEUE, leaf photosynthetic energy-use efficiency; LDMC, leaf dry matter content; Pleaf sheath and Pstem are proportions of leaf
sheath and stem biomass to the total shoot biomass, respectively.
*P < 0.05, **P < 0.01, ***P < 0.001.
6 ª 2014 The Authors. Ecology and Evolution published by John Wiley & Sons Ltd.
Preadapted and Evolving Traits with Invasion W.-Y. Guo et al.
America, and moreover that several invasive traits evolved
in the new range after its introduction. It might be
argued, that our sampling scheme in the native range
missed sampling the native EU populations that gave rise
to the invasive haplotype. However, the EU genotypes
selected originated from populations widely dispersed
throughout the native-range distribution area in Europe,
and likely represented highly competitive genotypes. Cor-
respondingly, we also found that the niche space of the
introduced population along the East Coast of North
America differed from that of the European native-range
population (Guo et al. 2013), and the invasive population
is genetically differentiated from the European one (Lam-
bertini et al. 2012b). We are therefore confident, that our
sampling scheme includes a representative sample set of
the population studied over their distribution ranges, but
a larger set of genotypes from each population would of
course have made our findings and conclusions stronger.
The trait comparisons performed in the common envi-
ronment allowed us to distinguish traits possessed in Eur-
ope before the introduction to North America (i.e., traits
shared by the native range [EU] and introduced [AM]
populations of the invasive lineage, but different from the
traits of the native North American conspecific popula-
tion [AMn]) and traits evolved during the invasion pro-
cess (i.e., traits diverging between the native range [EU]
and the introduced [AM] groups). The results indicate
that the invasive AM inherited from its ancestor EU a
more efficient photosynthetic apparatus than that of the
native North American conspecific P. australis ssp. amer-
icanus (AMn). The competitive advantage of the invasive
AM group in photosynthetic capacity over the native con-
specific AMn is therefore an advantageous trait acquired
before the introduction, that is, AM was preadapted to
become invasive in North America. Mozdzer and Zieman
(2010) and Mozdzer and Megonigal (2012) found similar
differences in Amax and other photosynthesis-related traits
between genotypes of invasive AM and native AMn
groups in experiments conducted in North America using
local genotypes from the Atlantic Coast.
The high photosynthetic assimilation rates of the intro-
duced AM affected several photosynthesis-related traits.
The traits diverged slightly, but significantly, among the
native range EU and the introduced AM in the direction
(A) (B)
(C) (D)
(E) (F)
Figure 1. Selected significantly different
pairwise relationships in standardized major
axis (SMA) analysis between biochemical, gas
exchange, resource/energy-use efficiency, and
biomass allocation traits of EU (native
European), AM (introduced North American),
and AMn (native North American). The
complete results of SMA analysis and statistical
significance of the relationships (r2 and P-
value) are shown in Tables S2–S4. gs: leaf
stomatal conductance; IWUE: leaf intrinsic
water use efficiency; Amass, mass-based leaf
light-saturated photosynthetic capacity; Carea:
area-based leaf carbon content; CCarea: area-
based leaf construction cost; PEUE: leaf
photosynthetic energy-use efficiency; Pstem and
Pleaf are proportions of stem and leaf biomass
to the total shoot biomass, respectively. The
three regression lines were tested for
differences in slope (S), elevation (E), and shift
along the common fitted slope (CS) (ns,
p > 0.05; *P < 0.05; **P < 0.01;
*** P < 0.001).
ª 2014 The Authors. Ecology and Evolution published by John Wiley & Sons Ltd. 7
W.-Y. Guo et al. Preadapted and Evolving Traits with Invasion
of a more advantageous payback time and photosynthetic
energy-use efficiency (PEUE). Evidence of evolutionary
change in the ecophysiological traits investigated was fur-
ther confirmed by the DAPC, which separated the intro-
duced AM group from the native range EU group when
all traits were analyzed together (Fig. 2). The SMA analy-
sis also showed differences in the ranges of Amass values
among the groups. The range of Amass for the introduced
AM fell in the upper range of that of the native range EU
group. This difference might result from the evolutionary
processes in the introduced range after introduction due
to genetic selection and/or founder effect, but also by
changes in the native range in Europe. In our study, not
all AM genotypes showed the same degree of differentia-
tion from the native range EU genotypes, as one of the
AM genotypes (AM 152) appeared to have retained the
European traits in the DAPC analysis. This can, however,
be expected both for traits under selection, and in the
case of multiple asynchronous introductions from Europe
(Hauber et al. 2011; Plut et al. 2011; Lambertini et al.
2012b; Meyerson and Cronin 2013) because of founder
effect and/or genetic drift. Further research of the eco-
physiological variation patterns in relation to the genetic
diversity patterns in North America and Europe is neces-
sary to understand the evolutionary implications of the
differences observed in both ranges.
In addition to the differences detected in the photosyn-
thesis-related traits, we also found divergent morphologi-
cal traits. The stem diameter of haplotype M P. australis
was higher in the introduced range than in the native
range, and the allocation of biomass to leaf sheaths was
higher for invasive AM than for the European native
range EU population. In the Poaceae, the leaf sheath
provides physical support to stems and leaves, protects
the intermediate nodal meristems, axillary buds and vas-
cular tissues, acts as a channel to transport nutrients and
photosynthetic products (Haslam 1972; Liu et al. 2011)
and enhances the transport of oxygen to the belowground
parts of the plant via a pressurized gas through-flow
mechanism (Konnerup et al. 2011). Hence, a thicker stem
and more robust leaf sheath could provide advantages to
the plants.
Contrary to the findings of Mozdzer and Zieman
(2010) and Mozdzer and Megonigal (2012), we did not
observe any significant differences in SLA between the
AM and the AMn group, and not even between the EU
and the AMn group, despite the fact that the SLA was
analyzed twice at different times during the growing sea-
son and using two different commonly applied methods
(Table S1). Although invasive plants generally exhibit a
greater SLA, some studies have observed similar or even
lower SLA values for invasive species than non-invasive
congeners (e.g., Nagel and Griffin 2001; McDowell 2002;
Feng et al. 2007a).
Conclusion
Based on the ecophysiological and morphological traits of
today’s populations, we suggest that the European lineage
of the wetland grass P. australis was preadapted to be
invasive in North America prior to its introduction, as it
possesses several superior ecophysiological traits in com-
parison to the native North American conspecific P. aus-
tralis ssp. americanus. We also provide evidence that
several invasive traits have evolved as the introduction
more than two centuries ago and have differentiated the
introduced population from its relatives in Europe. As
such invasive traits confer a competitive advantage over
the native North American P. australis ssp. americanus, we
suggest that the innate invasiveness of the European line-
age evolved further after the introduction. Our approach
has the advantage of disentangling genetically determined
variation from acclimation and phenotypic plasticity, but
does not address the role of the environment in the evolu-
tion of the traits analyzed. Further research is therefore
needed to link the observed changes to the genetic varia-
tion and the interaction with the environment and shed
conclusively light on the evolutionary processes that have
been occurring in North America and Europe.
Acknowledgments
This research was funded by the Danish Council for Inde-
pendent Research – Natural Sciences, projects no. 272-07-
0633 and 0602-01443. via a grant to H. Brix. W.-Y. Guo
acknowledges a Ph.D. scholarship from the China Schol-
Figure 2. Discriminant analysis of principal components (DAPC)
ordination for the three groups using all significantly different
variables (Tables 2 and S5). EU: native European; AM: introduced
North American; AMn: native North American. The directions and
lengths (91.5) of the Principal Component axis (black arrows)
represent the correlation with the first two canonical axes. The
dashed circles and crosses are 95% confidence ellipses, and centroids
for each group, respectively. The significance of the discriminant
functions was tested by Wilks’ k test, **P < 0.01, ***P < 0.001.
8 ª 2014 The Authors. Ecology and Evolution published by John Wiley & Sons Ltd.
Preadapted and Evolving Traits with Invasion W.-Y. Guo et al.
arship Council (CSC) of the Ministry of Education of
China and support from the S.C. Van Fonden. We thank
the four anonymous referees who improved this manu-
script with their valuable comments.
Conflict of Interest
None declared.
Note1Traits are defined as any morphological, physiological, or phenolog-
ical traits that are measurable at the individual level and that impact
fitness indirectly via their effects on growth, reproduction, and sur-
vival (Violle et al. 2007).
References
Alexander, J. M., M. van Kleunen, R. Ghezzi, and P. J.
Edwards. 2012. Different genetic clines in response to
temperature across the native and introduced ranges of a
global plant invader. J. Ecol. 100:771–781.
Atwood, J., and L. Meyerson. 2011. Beyond EICA:
understanding post-establishment evolution requires a
broader evaluation of potential selection pressures. NeoBiota
10:7–25.
Barrett, S. C. H., R. I. Colautti, and C. G. Eckert. 2008. Plant
reproductive systems and evolution during biological
invasion. Mol. Ecol. 17:373–383.
Bennett, A. E., M. Thomsen, and S. Y. Strauss. 2011. Multiple
mechanisms enable invasive species to suppress native
species. Am. J. Bot. 98:1086–1094.
Bossdorf, O., H. Auge, L. Lafuma, W. E. Rogers, E. Siemann,
and D. Prati. 2005. Phenotypic and genetic differentiation
between native and introduced plant populations. Oecologia
144:1–11.
Bucharova, A., and M. van Kleunen. 2009. Introduction
history and species characteristics partly explain
naturalization success of North American woody species in
Europe. J. Ecol. 97:230–238.
Clevering, O. A., and J. Lissner. 1999. Taxonomy, chromosome
numbers, clonal diversity and population dynamics of
Phragmites australis. Aquat. Bot. 64:185–208.
Falster, D. S., D. I. Warton, and I. J. Wright. 2006. SMATR:
Standardised Major Axis Tests & Routines. Available via
http://bio.mq.edu.au/research/groups/ecology//SMATR/
index.html.
Feng, Y.-L., J. Wang, and W. Sang. 2007a. Biomass allocation,
morphology and photosynthesis of invasive and noninvasive
exotic species grown at four irradiance levels. Acta Oecol.
31:40–47.
Feng, Y.-L., H. Auge, and S. K. Ebeling. 2007b. Invasive
Buddleja davidii allocates more nitrogen to its
photosynthetic machinery than five native woody species.
Oecologia 153:501–510.
Feng, Y.-L., Y.-P. Li, R.-F. Wang, R. M. Callaway, A.
Valiente-Banuet, and Inderjit. 2011. A quicker return
energy-use strategy by populations of a subtropical invader
in the non-native range: a potential mechanism for the
evolution of increased competitive ability. J. Ecol. 99:1116–
1123.
Griffin, K. L. 1994. Calorimetric estimates of construction
cost and their use in ecological studies. Funct. Ecol. 8:552–
562.
Guo, W. Y., C. Lambertini, X. Z. Li, L. A. Meyerson, and H.
Brix. 2013. Invasion of Old World Phragmites australis in
the New World: precipitation and temperature patterns
combined with human influences redesign the invasive
niche. Glob. Change Biol. 19:3406–3422.
Gurevitch, J., G. A. Fox, G. M. Wardle, Inderjit, and D. Taub.
2011. Emergent insights from the synthesis of conceptual
frameworks for biological invasions. Ecol. Lett. 14:407–418.
Haslam, S. M. 1972. Phragmites communis Trin. (Arundo
phragmites L.,? Phragmites australis (Cav.) Trin. ex Steudel).
J. Ecol. 60:585–610.
Hauber, D. P., K. Saltonstall, D. A. White, and C. S. Hood.
2011. Genetic variation in the common reed,
Phragmites australis, in the Mississippi River Delta
Marshes: evidence for multiple introductions. Estuaries
Coasts 34:851–862.
Heberling, J. M., and J. D. Fridley. 2013. Resource-use
strategies of native and invasive plants in Eastern North
American forests. New Phytol. 200:523–533.
Henery, M. L., G. Bowman, P. Mraz, U. A. Treier, E.
Gex-Fabry, U. Schaffner, et al. 2010. Evidence for a
combination of pre-adapted traits and rapid adaptive
change in the invasive plant Centaurea stoebe. J. Ecol.
98:800–813.
Hierro, J. L., J. L. Maron, and R. M. Callaway. 2005. A
biogeographical approach to plant invasions: the importance
of studying exotics in their introduced and native range. J.
Ecol. 93:5–15.
Jiang, L., Y. Luo, J. Chen, and B. Li. 2009. Ecophysiological
characteristics of invasive Spartina alterniflora and native
species in salt marshes of Yangtze River estuary, China.
Estuar. Coast. Shelf Sci. 81:74–82.
Jombart, T., S. Devillard, and F. Balloux. 2010. Discriminant
analysis of principal components: a new method for the
analysis of genetically structured populations. BMC Genet.
11:94.
Karagatzides, J. D., and A. M. Ellison. 2009. Construction
costs, payback times, and the leaf economics of carnivorous
plants. Am. J. Bot. 96:1612–1619.
Keller, S. R., and D. R. Taylor. 2008. History, chance and
adaptation during biological invasion: separating stochastic
phenotypic evolution from response to selection. Ecol. Lett.
11:852–866.
van Kleunen, M., W. Dawson, D. Schlaepfer, J. M. Jeschke,
and M. Fischer. 2010a. Are invaders different? A conceptual
ª 2014 The Authors. Ecology and Evolution published by John Wiley & Sons Ltd. 9
W.-Y. Guo et al. Preadapted and Evolving Traits with Invasion
framework of comparative approaches for assessing
determinants of invasiveness. Ecol. Lett. 13:947–958.
van Kleunen, M., E. Weber, and M. Fischer. 2010b. A
meta-analysis of trait differences between invasive and
non-invasive plant species. Ecol. Lett. 13:235–245.
van Kleunen, M., D. R. Schlaepfer, M. Glaettli, and M. Fischer.
2011. Preadapted for invasiveness: do species traits or their
plastic response to shading differ between invasive and
non-invasive plant species in their native range? J. Biogeogr.
38:1294–1304.
Konnerup, D., B. K. Sorrell, and H. Brix. 2011. Do tropical
wetland plants possess convective gas flow mechanisms?
New Phytol. 190:379–386.
Kumschick, S., R. A. Hufbauer, C. Alba, and D. M.
Blumenthal. 2013. Evolution of fast-growing and more
resistant phenotypes in introduced common mullein
(Verbascum thapsus). J. Ecol. 101:378–387.
Lambertini, C., M. H. G. Gustafsson, J. Frydenberg, J. Lissner,
M. Speranza, and H. Brix. 2006. A phylogeographic study of
the cosmopolitan genus Phragmites (Poaceae) based on
AFLPs. Plant Syst. Evol. 258:161–182.
Lambertini, C., I. A. Mendelssohn, M. H. Gustafsson, B.
Olesen, T. Riis, B. K. Sorrell, et al. 2012a. Tracing the
origin of Gulf Coast Phragmites (Poaceae): a story of
long-distance dispersal and hybridization. Am. J. Bot.
99:538–551.
Lambertini, C., B. K. Sorrell, T. Riis, B. Olesen, and H. Brix.
2012b. Exploring the borders of European Phragmites within
a cosmopolitan genus. AoB Plants pls020. doi: 10.1093/
aobpla/pls1020.
Larkin, D. J., M. J. Freyman, S. C. Lishawa, P. Geddes, and N.
C. Tuchman. 2011. Mechanisms of dominance by the
invasive hybrid cattail Typha 9 glauca. Biol. Invasions
14:65–77.
Leishman, M. R., T. Haslehurst, A. Ares, and Z. Baruch. 2007.
Leaf trait relationships of native and invasive plants:
community- and global-scale comparisons. New Phytol.
176:635–643.
Li, F., Q. Yang, Q. Zan, N. F. Tam, P. K. Shin, L. L. Vrijmoed,
et al. 2011. Differences in leaf construction cost between
alien and native mangrove species in Futian, Shenzhen,
China: implications for invasiveness of alien species. Mar.
Pollut. Bull. 62:1957–1962.
Lichtenthaler, H. K. 1987. Chlorophylls and carotenoids:
pigments of photosynthetic biomembranes. Methods
Enzymol. 148:350–382.
Liu, H., Y. Rao, Y. Yang, Y. Leng, L. Huang, G. Zhang, et al.
2011. Genetic analysis of traits related to leaf sheath in rice
(Oryza sativa L.). Mol. Plant Breed. 9:278–287.
McDowell, S. C. L. 2002. Photosynthetic characteristics of
invasive and noninvasive species of Rubus (Rosaceae). Am.
J. Bot. 89:1431–1438.
Meyerson, L. A., and J. T. Cronin. 2013. Evidence for multiple
introductions of Phragmites australis to North America:
detection of a new non-native haplotype. Biol. Invasions
15:2605–2608.
Meyerson, L. A., K. Saltonstall, and R. M. Chambers. 2009.
Phragmites australis in eastern North America: a historical
and ecological perspective. Pp. 57–82 in B. R. Silliman, E.
Grosholz, and M. D. Bertness, eds. Salt marshes under
global Siege. Univ. of California Press, Berkeley, CA.
Meyerson, L. A., C. Lambertini, M. K. McCormick, and D. F.
Whigham. 2012. Hybridization of common reed in North
America? The answer is blowing in the wind. AoB Plants
pls022. doi: 10.1093/aobpla/pls022.
Mozdzer, T. J., and J. P. Megonigal. 2012. Jack-and-master
trait responses to elevated CO2 and N: a comparison of
native and introduced Phragmites australis. PLoS ONE 7:
e42794.
Mozdzer, T. J., and J. C. Zieman. 2010. Ecophysiological
differences between genetic lineages facilitate the invasion of
non-native Phragmites australis in North American Atlantic
coast wetlands. J. Ecol. 98:451–458.
Nagel, J. M., and K. L. Griffin. 2001. Construction cost and
invasive potential: comparing Lythrum salicaria (Lythraceae)
with co-occurring native species along pond banks. Am. J.
Bot. 88:2252–2258.
Nentwig, W. 2007. Biological invasions. Springer-Verlag, Berlin
& Heidelberg.
Osunkoya, O. O., D. Bayliss, F. D. Panetta, and G.
Vivian-Smith. 2010. Leaf trait co-ordination in relation to
construction cost, carbon gain and resource-use efficiency in
exotic invasive and native woody vine species. Ann. Bot.
106:371–380.
Parker, J. D., M. E. Torchin, R. A. Hufbauer, N. P. Lemoine,
C. Alba, D. M. Blumenthal, et al. 2013. Do invasive species
perform better in their new ranges? Ecology 94:985–994.
Plut, K., J. Paul, C. Ciotir, M. Major, and J. R. Freeland. 2011.
Origin of non-native Phragmites australis in North America,
a common wetland invader. Fundam. Appl. Limnol.
179:121–129.
Poorter, H., S. Pepin, T. Rijkers, Y. de Jong, J. R. Evans, and
C. Korner. 2006. Construction costs, chemical composition
and payback time of high- and low-irradiance leaves. J. Exp.
Bot. 57:355–371.
Py�sek, P., and D. Richardson. 2007. Traits associated with
invasiveness in alien plants: where do we stand? Pp. 97–126
in Nentwig W. ed. Biological invasions. Springer-Verlag,
Berlin & Heidelberg.
Py�sek, P., V. Jaro�s�ık, J. Pergl, R. Randall, M. Chytr�y, I. K€uhn,
et al. 2009. The global invasion success of Central European
plants is related to distribution characteristics in their native
range and species traits. Divers. Distrib. 15:891–903.
Qin, R.-M., Y.-L. Zheng, A. Valiente-Banuet, R. M. Callaway,
G. F. Barclay, C. S. Pereyra, et al. 2013. The evolution of
increased competitive ability, innate competitive advantages,
and novel biochemical weapons act in concert for a tropical
invader. New Phytol. 197:979–988.
10 ª 2014 The Authors. Ecology and Evolution published by John Wiley & Sons Ltd.
Preadapted and Evolving Traits with Invasion W.-Y. Guo et al.
Richardson, D. M., and P. Py�sek. 2006. Plant invasions:
merging the concepts of species invasiveness and
community invasibility. Prog. Phys. Geogr. 30:409–
431.
Riis, T., C. Lambertini, B. Olesen, J. S. Clayton, H. Brix,
and B. K. Sorrell. 2010. Invasion strategies in clonal
aquatic plants: are phenotypic differences caused by
phenotypic plasticity or local adaptation? Ann. Bot.
106:813–822.
Saltonstall, K. 2002. Cryptic invasion by a non-native genotype
of the common reed, Phragmites australis, into North
America. Proc. Natl Acad. Sci. U.S.A. 99:2445–2449.
Schlaepfer, D. R., M. Glattli, M. Fischer, and M. van Kleunen.
2010. A multi-species experiment in their native range
indicates pre-adaptation of invasive alien plant species. New
Phytol. 185:1087–1099.
Vile, D., E. Garnier, B. Shipley, G. Laurent, M. L. Navas, C.
Roumet, et al. 2005. Specific leaf area and dry matter
content estimate thickness in laminar leaves. Ann. Bot.
96:1129–1136.
Violle, C., M.-L. Navas, D. Vile, E. Kazakou, C. Fortunel, I.
Hummel, et al. 2007. Let the concept of trait be functional!.Oikos 116:882–892.
Warton, D., and N. Weber. 2002. Common slope tests for
bivariate structural relationships. Biomet. J. 44:161–174.
Warton, D. I., I. J. Wright, D. S. Falster, and M. Westoby.
2006. Bivariate line-fitting methods for allometry. Biol. Rev.
81:259–291.
Whitney, K. D., and C. A. Gabler. 2008. Rapid evolution in
introduced species, ‘invasive traits’ and recipient
communities: challenges for predicting invasive potential.
Divers. Distrib. 14:569–580.
Williams, K., F. Percival, J. Merino, and H. A. Mooney. 1987.
Estimation of tissue construction cost from heat of
combustion and organic nitrogen content. Plant, Cell
Environ. 10:725–734.
Zedler, J. B., and S. Kercher. 2004. Causes and consequences
of invasive plants in wetlands: opportunities, opportunists,
and outcomes. Crit. Rev. Plant Sci. 23:431–452.
Zou, J., W. E. Rogers, and E. Siemann. 2007. Differences in
morphological and physiological traits between native and
invasive populations of Sapium sebiferum. Funct. Ecol.
21:721–730.
Supporting Information
Additional Supporting Information may be found in the
online version of this article:
Table S1. Traits analysed in the study which were not
statically significantly different in the one-way analysis of
variance (ANOVA) between the groups (EU: native Euro-
pean; AM: introduced North American; AMn: native
North American).
Table S2. Results of standardized major axis (SMA)
regression analysis between EU and AMn.
Table S3. Results of standardized major axis (SMA)
regression analysis between AM and EU.
Table S4. Results of standardized major axis (SMA)
regression analysis between AM and AMn.
Table S5. Factor loadings in PCA.
Table S6. Discriminant analysis for genotypes based on
the groups of origins (EU: native European; AM: intro-
duced North American; AMn: native North American).
ª 2014 The Authors. Ecology and Evolution published by John Wiley & Sons Ltd. 11
W.-Y. Guo et al. Preadapted and Evolving Traits with Invasion
Copyright © 2022 FDOKUMEN