
Applying Market Mechanisms to Facilitate Interpersonal ...
118
Applying Market Mechanisms to Facilitate Interpersonal Information Exchange Gary Hsieh August 2010 CMU-HCII-10-105 Human-Computer Interaction Institute School of Computer Science Carnegie Mellon University Pittsburgh, PA 15213 Thesis Committee: Scott E. Hudson (co-chair), Human-Computer Interaction Institute Robert E. Kraut (co-chair), Human-Computer Interaction Institute Roberto Weber (external member), Social Decision Sciences Laura A. Dabbish, Human-Computer Interaction Institute Submitted in partial fulfillment of the requirements for the Degree of Doctor of Philosophy Copyright © 2010 Gary Hsieh. All rights reserved. This work was supported in part by the National Science Foundation under grants ITR-032535, CNS- 0551554, IIS-0808711. Any opinions, findings, conclusions, or recommendations expressed in this material are those of the author and do not necessarily reflect those of the National Science Foundation. Additional support was provided by Microsoft, IBM, Yahoo!.
-
Upload
khangminh22 -
Category
Documents
-
view
5 -
download
0
Transcript of Applying Market Mechanisms to Facilitate Interpersonal ...

Applying Market Mechanisms to Facilitate Interpersonal Information Exchange
Gary Hsieh
August 2010 CMU-HCII-10-105
Human-Computer Interaction Institute School of Computer Science Carnegie Mellon University
Pittsburgh, PA 15213
Thesis Committee: Scott E. Hudson (co-chair), Human-Computer Interaction Institute Robert E. Kraut (co-chair), Human-Computer Interaction Institute
Roberto Weber (external member), Social Decision Sciences Laura A. Dabbish, Human-Computer Interaction Institute
Submitted in partial fulfillment of the requirements for the Degree of Doctor of Philosophy
Copyright © 2010 Gary Hsieh. All rights reserved.
This work was supported in part by the National Science Foundation under grants ITR-032535, CNS-
0551554, IIS-0808711. Any opinions, findings, conclusions, or recommendations expressed in this
material are those of the author and do not necessarily reflect those of the National Science Foundation.
Additional support was provided by Microsoft, IBM, Yahoo!.

ii
Keywords: Information exchange, information communication, computer-mediated communication,
question and answer (Q&A), market mechanisms, incentives, motivation, social relationship theory,
information overload, spam, interruption, human attention.
iii
Abstract
Requesting and sharing information through computer-mediated technology is an integral part of our lives
in this information age. However, when deciding whether or not and how to engage in information
exchanges, parties involved often have different needs and constraints. In addition, they are often unaware
of each others’ needs and constraints. Such asymmetry in motivation and information leads to suboptimal
allocation of attention and time and contributes to the growing problems of information overload, costly
interruptions and missed opportunities. A potential solution is to employ market mechanisms to support
information exchange. Markets are institutions that allow individuals to trade goods and services
efficiently. Applying markets to information exchange, askers can use pricing to signal the importance of
the information exchange and compensate the answerers for their time. Answerers can use pricing
mechanisms to filter incoming requests, reducing interruption costs and information overload.
This dissertation studies the strengths and weaknesses of using economic markets for interpersonal
information exchange. Are there costs in incorporating markets into our everyday information exchanges?
How do we design these markets to maximize the benefits of market forces while minimizing the costs?
Part 1 of the dissertation examines whether or not economic markets can indeed improve welfare for
people involved. Part 2 studies the use of markets for question and answer (Q&A) services, a specific, but
a popular type of interpersonal information exchange. Part 3 elucidates how using economic markets for
information exchange may affect interpersonal relationships.

iv

v
Acknowledgements
Growing up, I have always been fascinated with the World of Wuxia. I would often daydream about
being a Wuxia protagonist, and through chance, fate and hard work, overcome great obstacles and
become a great Xiake with unparalleled martial arts skills. Now that I am older, it is clear that I will never
become a sword wielding pugilist, but my path to completing my Ph.D. has required the same dedication
and perseverance as one would have needed to become a great Xiake. There are many people along my
Ph.D. path who have taught me, helped me and made me stronger. I want to explicitly thank some of
these people to whom I am most grateful.
First and foremost, I must thank my advisors Scott Hudson and Bob Kraut, two brilliant masters to this
young grasshopper. They were willing to let me find my own path, but were always there when I got lost.
It is with their tutelage that I was able to work on what I think is truly an interdisciplinary project, making
both practical and theoretical contributions. I also thank my committee members, Roberto Weber and
Laura Dabbish, who have along the way provided invaluable feedback and support that have made both
this thesis stronger and me a better researcher.
The journey of Wuxia protagonists often begins by meeting someone who first acknowledged their
potential and taught them the foundations. Jen Mankoff and Anind Dey filled this role for me. If it were
not for them, I would not have had this opportunity to study at the Human-Computer Interaction Institute,
and I would not have known what HCI is. I am extremely grateful.
Every good Wuxia story is filled with colorful adventures that occur along the path to greatness. I have
had the wonderful opportunity to work with many excellent researchers. This includes the many of my
industry collaborators who showed me what it is like to do research in the industry and still to this day,
look out for me – they are Elizabeth Churchill, Ken Wood, Jennifer Lai and Scott Counts. On top of it all,
they have taught me what it means to be a good research manager, which is an important skill to have
learned as I start managing research teams. I also thank many of my co-authors at UC Berkeley and
Carnegie Mellon University: Tara Matthews, Pedram Keyani, Bilge Mutlu, Matthew Easterday, Jodi
Forlizzi, Karen Tang, Wai Yong Low, Jason Hong and Ian Li.
Along the way, the experiences I have accumulated have not always been research related, and these are
the stories that involve people who have kept me sane and insane throughout the years. First, I thank
Carol Pai, who has been too good to me. If she only knew what she was getting herself into, she would

vi
never have talked to me at Berkeley. Second, I thank Ian Li, my other half in Pittsburgh, who has always
refused to agree with me. I must also thank my academic siblings, who have both paved the way for this
work, but also treated me like a little brother outside of research: Daniel Avrhami, Thi Avrahami, Darren
Gergle and James Fogarty. There are also many others that made this path a memorable one: Joe Tullio,
Jeff Nichols, Shannon O’Brien, Katie Bessiere, Andrew Ko, Sara Streng, Scott Davidoff, Amy Ogan,
Erin Walker, Moira Burke, Ruth Wylie, Matthew Lee, Aruna Balakrishnan, Turadg Aleahmad, Min
Kyung Lee, Bryan Pendleton, Stephen Oney, Gabriela Marcu, Niki Kittur, Kun Gao, Kevin Li, Tim Sohn
and Khai Truong. Thanks.
In addition, a big thank you to the amazing HCII faculty and staff who have made this an amazing and
challenging environment to research. Especially, I would like to thank Queenie with her help and support
throughout the process. I also thank Howard Seltman for teaching and helping me with statistical
analyses.
The Wuxia protagonists also have close friends who did not participate in their journeys, but are there to
provide unconditional support. Thanks to Tony Szeto, David Chung, Krishani Fernando, Judy Chen,
Aaron Huang, Dennis Hsieh, Eva Chang, Mee-Jung Jang, Stephen Tse, Stef Chu and Theo Benson. If the
world as we know it ends tomorrow, I would not want to be with anyone else in the post apocalyptic
world other than you guys.
But the journeys all originate from the immediate family. And I owe everything to my parents. They
provided the environment for me to learn, and have taught me the many important virtues. I also have the
best brother in the world, Davin, who taught me how to be a man. Thanks to my sister in law, Kim, who
always goes out of her way to make me feel well accommodated whenever I go home.
Last but not least. The protagonists all end up with the girl of their dreams. Thanks Wendy, for being you,
and loving me.

vii
To My Biggest Fan
My Mom

viii
ix
Table of Contents
Chapter 1 INTRODUCTION ............................................................................... 1
1.1 Interpersonal Information Exchange ......................................................................................... 2
1.2 Existing Technology Solutions ................................................................................................. 5
1.2.1 Reducing Overload ........................................................................................................... 5
1.2.2 Combating Interruption .................................................................................................... 6
1.2.3 Improving Awareness ....................................................................................................... 7
1.3 Regulatory Solutions ................................................................................................................ 8
1.4 Economic Solutions ................................................................................................................. 8
1.4.1 Sender-Sided Pricing Solutions ......................................................................................... 8
1.4.2 Two-Sided Market Solutions ............................................................................................ 9
1.5 Research Problems ................................................................................................................. 10
1.6 Research Approach ................................................................................................................ 11
1.7 Impact .................................................................................................................................... 11
1.8 Dissertation Organization ....................................................................................................... 12
Chapter 2 MARKETS CAN HELP .....................................................................13
2.1 Efficient Interpersonal Exchange ............................................................................................ 13
2.2 Unrealistic Assumptions ......................................................................................................... 15
2.2.1 No Market ...................................................................................................................... 16
2.2.2 Variable-Price Market .................................................................................................... 17
2.2.3 Fixed-Price Market ......................................................................................................... 18

x
2.3 Hypotheses ............................................................................................................................ 20
2.4 Study Setup ............................................................................................................................ 20
2.4.1 Communication Mechanism Manipulations .................................................................... 21
2.5 Results ................................................................................................................................... 24
2.5.1 H1-Help Requests........................................................................................................... 24
2.5.2 H2-Help Exchanges ........................................................................................................ 24
2.5.3 H3-Efficiency of Market versus No-Market .................................................................... 25
2.5.4 H4-Variable-Market versus Fixed-Market....................................................................... 25
2.6 Discussion & Limitations ....................................................................................................... 27
2.6.1 Practical Contributions ................................................................................................... 28
2.6.2 Limitations ..................................................................................................................... 29
Chapter 3 MARKETS FOR Q&A ......................................................................30
3.1 Question and Answer Services ............................................................................................... 30
3.1.1 Non-Productive Usages of Q&A ..................................................................................... 31
3.1.2 Markets for Information Exchange ................................................................................. 33
3.2 Field-Experiment with mimir ................................................................................................. 33
3.2.1 Hypotheses ..................................................................................................................... 34
3.2.2 Design of mimir ............................................................................................................. 35
3.2.3 Deployment and Study ................................................................................................... 37
3.2.4 Results ........................................................................................................................... 39
3.2.5 Discussion ...................................................................................................................... 43
3.2.6 Limitations and Generalizability ..................................................................................... 44
xi
3.3 Longitudinal Study of Mahalo Answers .................................................................................. 44
3.3.1 Hypotheses ..................................................................................................................... 44
3.3.2 Mahalo Answers ............................................................................................................. 46
3.3.3 Data Collection............................................................................................................... 48
3.3.4 Results ........................................................................................................................... 52
3.3.5 Discussion ...................................................................................................................... 57
3.3.6 Limitations and Generalizability ..................................................................................... 59
3.4 Conclusion ............................................................................................................................. 60
Chapter 4 MARKETS & SOCIAL RELATIONSHIPS .......................................61
4.1 Motivation ............................................................................................................................. 61
4.2 Social-Relational Costs of Financial Incentives ...................................................................... 64
4.2.1 Relational Implications of Offering Financial Incentives ................................................. 66
4.2.2 Effect on Social Relationships ........................................................................................ 68
4.3 Re-analysis of mimir .............................................................................................................. 69
4.3.1 Method ........................................................................................................................... 70
4.3.2 Results and Discussion ................................................................................................... 71
4.4 Experiment 2 .......................................................................................................................... 72
4.4.1 Method ........................................................................................................................... 73
4.4.2 Results and Discussion ................................................................................................... 75
4.5 Experiment 3 .......................................................................................................................... 76
4.5.1 Method ........................................................................................................................... 77
4.5.2 Results and Discussion ................................................................................................... 80
xii
4.6 General Discussion ................................................................................................................ 81
4.6.1 Practical Contributions ................................................................................................... 83
4.7 Conclusion ............................................................................................................................. 84
Chapter 5 CONCLUSION ..................................................................................85
5.1 Practical Contributions ........................................................................................................... 85
5.1.1 Why Use Markets ........................................................................................................... 85
5.1.2 Why Not to Use Markets ................................................................................................ 86
5.1.3 How to Best Use Markets ............................................................................................... 86
5.2 Theoretical Contributions ....................................................................................................... 87
5.3 Closing Remarks .................................................................................................................... 88

xiii
List of Figures
Figure 1.1 Examples of exchanges in the information exchanges space .................................................... 4
Figure 2.1 Graphical model of exchange outcomes ................................................................................ 14
Figure 2.2 Game Interface ..................................................................................................................... 21
Figure 2.3 Help requesting options for (a) no-market, (b) variable-market, and (c) fixed-market ............ 23
Figure 2.4 First half earnings versus second half earnings ...................................................................... 26
Figure 3.1 Breakdown of the types of question asked on Live QnA ........................................................ 32
Figure 3.2 Client windows for mimir: (Left) no-market system and (Right) market system .................... 36
Figure 3.3 Market system’s question asking window ............................................................................. 37
Figure 3.4 Breakdown of number of questions asked and mim offered in the market system .................. 40
Figure 3.5 Comparison of types of quesitons asked between mimir systems ........................................... 41
Figure 3.6 Number of answers by quality rating, between mimir systems ............................................... 42
Figure 3.7 Screenshot of Mahalo Answers ............................................................................................. 47
Figure 4.1 Relative price effect on time and effort on task ...................................................................... 65
Figure 4.2 Phases of study ..................................................................................................................... 73
Figure 4.3 Screenshot of transcribe interface: 1) amount of time left, 2)number of characters
transcribed, 3) scanned page from a book, 4) button to advance to the next page, 5) input
text area .................................................................................................................................... 79
xiv
List of Tables
Table 2.1 Help requests and exchanges breakdown ................................................................................ 24
Table 2.2 Breakdown of earnings by components .................................................................................. 25
Table 2.3 Time spent on decision ........................................................................................................... 27
Table 3.1 Live QnA statistics ................................................................................................................. 31
Table 3.2 Usage comparison between mimir and Live QnA ................................................................... 39
Table 3.3 Comparison of per month statistics of Mahalo Answers (both reduced dataset of usage
prior to February 24 and our full dataset) to Google Answers. ................................................... 49
Table 3.4 Rated characteristics of question ............................................................................................ 50
Table 3.5 Correlation table (with significance) of rated characteristics and dependent variables for
all 800 questions ....................................................................................................................... 52
Table 3.6 Random-effects logistic regression model predicting “is paid” (H1 & H3), using
questions posted before February 20 (n=333) ............................................................................ 53
Table 3.7 Ordered logistic regression model predicting reward value (H2), using user-paid half of
the full dataset (n=400) ............................................................................................................. 54
Table 3.8 Random-effects regression model predicting logged average answer length (H4), using
user-paid half of the full dataset (n=400) ................................................................................... 55
Table 3.9 Random-effects negative binominal models predicting answering count (H5), using
user-paid half of the full dataset (n=400) ................................................................................... 56
Table 3.10 Random-effects logistic regression model predicting is best answer rated positively
(H6), using user-paid half of the full dataset (n=400) ................................................................. 57
Table 4.1 General usage statistics .......................................................................................................... 71
Table 4.2 Equity decisions across condition ........................................................................................... 76
Table 4.3 Equity decisions across conditions ......................................................................................... 81

xv

xvi
Chapter 1
INTRODUCTION
Lisa, a young professional, came home late after a long day of work to her nine-year-old Maltese, Marble,
vomiting a yellow substance. Having never encountered this before, Lisa immediately called her good
friend, Brian, for advice. Brian has several dogs and would gladly have helped if had he known the
purpose and urgency of the call, but he was in the middle of a movie when the phone rang, so he ignored
the call. Getting no response, Lisa then sent an instant message (IM) from her laptop to her best friend,
Tara. Unfortunately, Tara is busy working on a presentation and the message notification on the computer
screen interrupts her train of thought. Even though Lisa got Tara’s attention, Tara did not have the
necessary information and was unable to help. Lisa then searched online, but searching the web gave her
no concrete answers. She tried posting a request for help to online question an answer (Q&A) sites, but
her query got lost in a sea of frivolous questions and answers. An hour after she got home, she still had
not figured out what was wrong with Marble, and she did not know what to do.
For years, researchers and inventers have worked hard to enhance the speed, quality, and flexibility of
communication technologies. There is no question that advancing technologies have drastically improved
how we share and exchange information (Eisenberg, 1994; Sproull & Kiesler, 1991; Currid, 1992). With
these technologies, remote collaborators can now update progress near-instantaneously via email and
instant messaging (IM). Friends can coordinate activities using text messaging even while they are in
transit. Couples can video-call each other and chat about their daily encounters when apart. Strangers can
share their knowledge and expertise through online question and answer (Q&A) sites without ever
meeting one another face to face. Like Lisa in the scenario above, we now have the means to engage with
anyone, anywhere, just by pressing a few buttons.
While the speed and bandwidth of these technologies continue to improve, our limited cognitive resources
have not changed. In this increasingly-connected world, technology is no longer the bottleneck of
information exchange. Instead, we are. Our scarce human attention (Simon, 1971) is simply incapable of
managing the millions of gigabytes that are sent and received every day (Coffman & Odlyzko, 2000). In
1998, there were 87.2 billion pieces of direct mail delivered to US mailboxes. By 2009, there were 3
times as many emails sent daily (Radicati Group, 2009), and the number of communication requests and
2
interruptions is only increasing. Given the increasing demand for our attention, mistakes in handling
information exchange requests become costly not just for the person seeking the information, but also for
the person being contacted. As illustrated by the scenario above, information overload, costly
interruption, and missed requests are all real and potentially detrimental problems that we face on a daily
basis when participating in information exchange (Davenport & Beck, 2001). Given our limited cognitive
resources, we must find a way to help to allocate our scarce attention more efficiently so that we can
maximize our gains from information exchange.
1.1 Interpersonal Information Exchange
Interpersonal information exchange is an integral part of our lives. This category covers much of our daily
communication with other people, including the sharing of ideas and opinions, asking for help, and
coordinating activities. Despite the fact that we engage in interpersonal information exchanges frequently,
initializing an exchange is one of the most intricate and error-prone processes in communication
(Goffman, 1959). Two fundamental properties of interpersonal information exchange make this process
prone to error: motivation asymmetry and information asymmetry.
When establishing an information exchange, there are senders and receivers. Senders are individuals
initiating and sending the exchange requests, and receivers are the recipients of the requests and the ones
responding to them. Depending on the communication medium under discussion throughout this thesis,
senders are also referred to as askers, requesters, or callers, while receivers are also referred to as
answerers, helpers, and callees. In an exchange, there may be one or more sender and one or more
receiver. However, there needs to be at least one of each for an exchange to occur. The ideas presented in
this thesis should generalize to all interpersonal information exchange scenarios, but the discussion will
not focus on many-sender to many-receiver exchange scenarii; instead, it will center on one-to-one
information exchanges.
In general, an exchange is beneficial when the value from participation outweighs the cost, i.e., when the
surplus is greater than 0. Previous work has identified exchange importance and urgency as primary
factors in communicators’ valuation of an exchange (Kendon, 1990; Dabbish 2006). The more important
and urgent it is for the communicator to obtain the information, the higher the value. On the cost side,
senders and receivers may incur both accounting and opportunity costs when participating in the
exchange. Accounting costs include operational costs, such as costs of the upkeep of the technology (e.g.,
monthly internet and phone bills). Opportunity costs are the costs that individuals incur from not
allocating their time and attention elsewhere. It is, in other words, the value one could have gotten if he
had not participated in an exchange. This notion of opportunity cost speaks to the fact that, with all else
3
being equal, the cost of participating in an exchange increased with the importance of the task that is not
accomplished because of the information exchange. Opportunity costs also include interruption costs,
such as resumption costs.
It is important to note that intrinsic and social factors may also affect people’s valuation of exchange.
Intrinsic motivators, such as altruism and a desire to demonstrate proficiency, give communicators
additional value for participating in exchanges (Deci, Koestner, & Ryan 1999; Batson, Ahmad, & Tsang,
2002). Hence, people may prefer to participate in exchanges on certain topics than others. Similarly,
social factors, such as status, reciprocity, and affiliation also impact people’s valuation of exchange. An
exchange may be more valuable if it is with someone of higher status (Pfeffer, 1981; Kendon, 1990),
someone on the same team (Gaertner & Insko, 2000), or someone with whom a future relationship is
desirable (Gouldner, 1960).
Some problems in interpersonal information exchange arise because of asymmetries in motivation –
benefits to the senders may not be equivalent to the benefit to the receivers and vice versa. Senders and
receivers often have separate needs and constraints, and they are uniquely affected by the exchanges.
Asymmetry in motivation results in an abundance of exchange requests from senders that only benefit
themselves. This is why spam has been a major problem. The spammers (senders) benefit from the
exchange, so they initiate the request regardless of how costly it may be to the receivers.
However, motivation asymmetry is not the only problem. The other is information asymmetry (Gruen,
1996). Information asymmetry occurs because neither senders nor receivers have all of the information to
make the optimal decision on whether and how to commence the exchange. Senders know the purpose of
the exchange (e.g., what is the needed information) but may not know the receivers’ expertise or their
needs and constraints (e.g., their busyness), whereas the responders know their own current status and
needs, but do not know what the urgency of the exchange or what it is about until they agree to it.
Information asymmetry thus leads to senders initiating exchanges at the wrong time, and receivers
ignoring urgent and important requests.
4
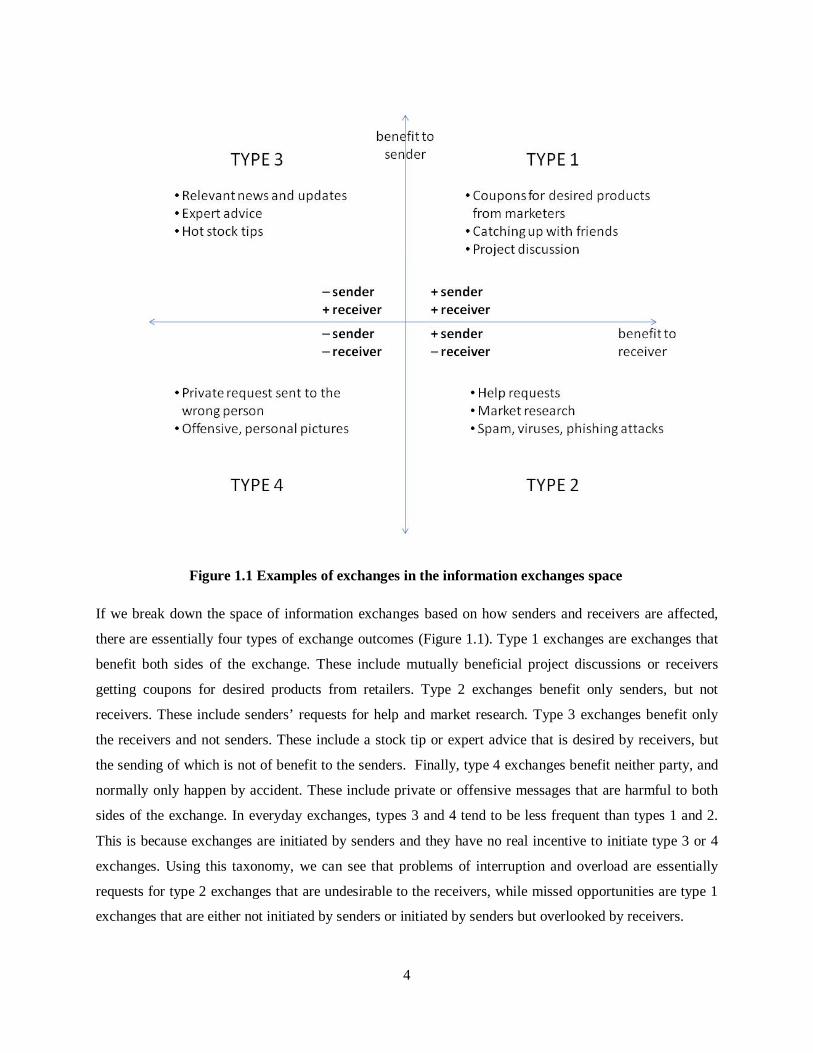
If we break down the space of information exchanges based on how senders and receivers are affected,
there are essentially four types of exchange outcomes (Figure 1.1). Type 1 exchanges are exchanges that
benefit both sides of the exchange. These include mutually beneficial project discussions or receivers
getting coupons for desired products from retailers. Type 2 exchanges benefit only senders, but not
receivers. These include senders’ requests for help and market research. Type 3 exchanges benefit only
the receivers and not senders. These include a stock tip or expert advice that is desired by receivers, but
the sending of which is not of benefit to the senders. Finally, type 4 exchanges benefit neither party, and
normally only happen by accident. These include private or offensive messages that are harmful to both
sides of the exchange. In everyday exchanges, types 3 and 4 tend to be less frequent than types 1 and 2.
This is because exchanges are initiated by senders and they have no real incentive to initiate type 3 or 4
exchanges. Using this taxonomy, we can see that problems of interruption and overload are essentially
requests for type 2 exchanges that are undesirable to the receivers, while missed opportunities are type 1
exchanges that are either not initiated by senders or initiated by senders but overlooked by receivers.
Figure 1.1 Examples of exchanges in the information exchanges space
5
The goal of this thesis is to support interpersonal information exchange so that, despite motivation and
information asymmetry, people will be able to maximize their scarce attention resources and participate in
exchanges that are beneficial and ignore the ones that are not.
1.2 Existing Technology Solutions
Existing technological solutions try to support interpersonal information exchange in three ways: reducing
overload, combating interruptions, and improving awareness.
1.2.1 Reducing Overload
In 1982, then president of Association for Computing Machinery (ACM), Peter J. Denning, described the
problem of “Electronic Junk” in his President’s Letter published in the Communications of ACM.
Denning correctly pointed out that computing has significantly focused on generating information, and
has neglected to pay attention to receiving information. His letter was a call to “save the receivers from
drowning in the rising tide of information...generated” (1982).
Since then, much research has explored ways to reduce communication overload, specifically, in reducing
spam in electronic mail (e.g., Cranor & LaMacchia, 1998). These solutions include white/black/grey lists
(Levine, 2005), human-interaction proofs (Templeton, 2007), and (collaborative and machine learning)
filters (e.g., Gray & Haahr, 2004; Sahami et al., 1998). Despite the increase of spam from 10% of overall
mail volume in 1998 to 80% (from p.26, Goodman, Cormack & Heckerman, 2007), these technology
solutions have been successful in filtering the amount of unsolicited, bulk mail that people face on a daily
basis.
By no means, however, are the existing technology solutions for reducing overload perfect. We still see
spam in our inboxes and, occasionally, important emails are classified as spam. Researchers have
continually to improve the technology to combat the increasingly-sophisticated strategies used by
spammers. It has become a constant arms race (Goodman, Cormack & Heckerman, 2007). Furthermore,
existing top-of-the-line filters only work for electronic mail, and do not work for other communication
media such as instant messaging, phone, or mobile messaging. The primary reason is that spam filtering
relies on analyzing communication purpose through the received message content, which is not available
during communication initiation through most other communication media. For example, a ringing phone
does not provide any information on what the phone call is about. Similarly, a text message may be too
succinct to convey fully the intent of the exchange. Therefore, a good permanent solution to improve
interpersonal exchange efficiency is needed, and it needs to be generalizable to support exchange on
different communication media and channels.

6
1.2.2 Combating Interruption
Interpersonal communication is one of the most common sources of interruption in the workplace
(Sproull, 1991; Perlow, 1999; Hudson et al., 2002; González & Mark, 2004; Mark et al., 2005). These
interruptions can have detrimental effects on people’s primary task performance and wellbeing
(Czerwinski, Cutrell, Horvitz, 2000; Bailey, Konstan, & Carlis, 2001). It is no wonder that much research
has been conducted to understand and reduce the cost incurred from interpersonal communication
interruptions.
One type of technology solution deals with the timing of the interruptions, as research has shown that
timing can affect the cost of interruption (McFarlane, 2002; Cutrell et al. 2001; Zacks et al. 2001;
Adamczyk & Bailey, 2004; Monk, 2004; Robertson et al., 2004; Iqbal et al., 2005). Various technology
prototypes have experimented with deferring the request notification until the user switches tasks (Zacks
et al., 2001; Adamczyk & Bailey, 2004; Iqbal et al., 2005), changes physical locations (Ho & Intille,
2005), transitions to a state of availability (Marx & Schmadt, 1996; Horvitz et al., 2005), or to a context
that is defined by the senders to be relevant (Jung et al., 2005).
Another type of technology solution focuses on situationally-appropriate interruptions. The general
intuition is that the appropriateness of the exchange request notification depends on the context in which
people are at the time of the request. These research prototypes deliver requests through appropriate
communication channels (Van den Berg, S. R., 1993; Marti, S., 1999), vary the notification level to match
the context (Sawhney & Schmandt, 1999; Siewiorek et al. 2003; Horvitz et al. 1999), and use social and
environmental factors to determine whether the request should interrupt or be postponed (Marti, S. &
Schmandt, C., 2005).
To reduce further the attention cost to receivers of handling exchange interruptions on a per-message
basis, technology agents are used to help determine when and how to interrupt. They rely on either user-
set rules (e.g., Matthews et al. 2004), or machine learning models to determine the appropriate context of
interruption (Horvitz et al. 2002; Fogarty et al. 2005; Iqbal et al. 2005).
While combating interruption has the potential to lower interruption costs significantly, they are still far
from being perfected enough to be relied on for everyday communication. But that aside, one of the key
drawbacks of existing technology solutions (including overload filters) is that they tend to be receiver-
side focused; relying solely on receivers’ context to minimize their costs from exchanges. This design
overlooks senders’ needs in exchanges, which may actually affect receivers’ own valuation of the
exchange (Gruen, 1996). As we can all attest to, just because we are “busy,” does not mean we are not
willing to engage in exchanges that are truly important and urgent.
7
1.2.3 Improving Awareness
If a key problem preventing communicators from making sound decisions is information asymmetry, then
perhaps the most straightforward solution is to improve senders’ and receivers’ awareness of each others’
exchange context, so they can themselves make more informed decisions when initiating or receiving
exchange requests.
One type of solution allows senders to convey the purpose of the exchange more clearly and efficiently to
the receivers, so that the receivers may know the purpose of the exchange and can thus better determine
whether and how to engage in the exchange (Milewski & Smith, 2000; Bellotti & Edwards, 2001;
Pedersen, 2001; Dabbish & Kraut, 2004; Avrahami et al., 2007). This includes the use of urgency flags
and caller ID in our existing technologies. Research systems such as the Coordinator used Speech Acts to
allow people to indicate the intent and actions associated with the communication (Winograd & Flores,
1986). In everyday practice, people also use subject tags in emails to differentiate the types of email
messages, which motivated the idea of using tags in IM to support the same function (Hsieh et al., 2008).
On the receivers’ side, research has explored ways to support receivers handling of incoming
communication requests in a lightweight manner. For example, Hudson & Smith (1996) explored
previewing phone calls in a low-cost way. Quiet Calls is a system that allows receivers to respond to calls
without talking aloud by using pre-recorded audio (Nelson et al. 2001).
There is also much research exploring ways to support the sharing of contextual information between
remote collaborators. This includes work on media spaces (Bly et al., 1993). By allowing collaborators to
glance and peek into others’ work spaces (Gaver et al., 1992, Fish et al., 1992), or by creating a joint
public space (Jancke et al., 2001), collaborators are able to gain a lot of informal information that can
support the coordination of communication (Kraut et al., 1990). This set of research also includes
augmenting existing communication technologies with contextual information. Awarenex, ConNexus,
and Hubbub allow communicating parties to share activity-based information and provide lightweight IM
communication request previews (Tang et al., 2001, Issacs et al., 2002). ProjectView IM allows
collaborators to share project status (Scupelli et al., 2005). More recently, the Negotiator provides a light-
weight interface that allows people to negotiate when to commence a synchronous communication
(Wiberg & Whittaker, 2005).
While improving awareness can help senders and receivers to participate in the beneficial
communications and quickly ignore the costly ones, there are two major problems in trying to improve
awareness. First, this type of signaling only works if communicators have an incentive to respect each
other’s signals. This respect may be more prevalent among communicating partners who have existing

8
social relationships, but less so when the communicating partners are strangers. Consider the case of the
spammer: the spammer is likely to send the communication request regardless of what the receiver is
actually doing. The second problem with this type of approach is that full information disclosure has
potential privacy problems. Not everyone is willing to offer full disclosure, at times, not even with loved
ones.
1.3 Regulatory Solutions
Government regulations provide another way to minimize undesired phone and email communication
requests from marketers. For example, the Telephone Consumer Protection Act established in 1991
created national do-not-call and do-not-fax registries. The Controlling the Assault of Non-Solicited
Pornography and Marketing Act in 2004 required e-mailers to provide “opt-out” options, valid subject
lines, and legitimate return addresses. Unfortunately, the impact of these regulations have been limited
(Rainie and Fallows, 2004). Furthermore, even if regulation is able to reduce unwanted requests from
marketers, inefficiencies of information exchange exist regardless of who is initiating an exchange. A
good solution to improve exchange efficiency cannot be based solely on limiting who can or cannot
initiate an information exchange with whom.
1.4 Economic Solutions
The idea of using economic solutions to support information communication has been in existence for a
while. In his 1982 Letter on “Electronic Junk,” Denning proposed a solution in which each user specifies
an asking price and would only receive messages that have higher bid prices than the asking price (1982).
The discussion that follows focuses on research on two general types of economic solutions that can be
used to support interpersonal information exchange: pricing and markets. It will also seek to explain why
market solutions dominate the other solutions presented here.
1.4.1 Sender-Sided Pricing Solutions
Economic solutions have been proposed to reduce spam and information overload. The general solution is
to impose a monetary cost on the senders who are sending messages (Fahlman, 2002; Solan & Reshef,
2005; Krishnamurthy & Blackmond, 2004; Walfish et al., 2006; Back, 2001). The idea is conceptually
analogous to paying with postage stamps when sending mail. Doing so shifts the burden of identifying
unwanted communication to senders, who are knowledgeable about the purpose and content of
communication (van Zandt, 2004). Frivolous requests may be reduced because the incremental costs for
sending a message force the senders to be selective, sending requests only if they believe that the value of
9
the exchange is higher than the cost to send it. This idea of economic pricing has been experimented with
in the forms of stamps, taxes, surcharges and auctions (Dwork & Naor, 1993; Krishnamurthy &
Blackmond, 2004).
However, like filter technologies, these mechanisms are one-sided and do not simultaneously take into
account both parties’ communication contexts. What is valuable to the sender may not be valuable to the
receiver; the sender’s willingness to pay more for a communication does not necessary make the
communication more desirable to the receivers. This is perhaps why Kraut et al.’s empirical study on
using variable rate postage to reduce spam showed that, while such mechanism reduced communication,
receivers did not see postage as a signal of communication value (Kraut et al., 2005). Even though
unwanted exchanges may be reduced, costly interruptions from undesired exchange requests may still
occur.
1.4.2 Two-Sided Market Solutions
Another type of economic solution is the use of two-sided payment markets. Economic markets are social
institutions on which we have relied to organize complex, large-scale production and exchange (Smith,
1776; Hayek, 1945; Fiske, 1992). Similar to the ways in which we use markets to sell and purchase
physical goods, these market mechanisms may also be used to facilitate efficient exchange of information
and attention (Fahlman, 2002; Hermalin & Kats, 2004; Cheng et al., 2007; Reeves et al., 2008). Applied
in this domain, the sender (who is requesting attention and information) is the buyer, and the receiver
(who is providing the commodities) is the seller. Information, attention, and time are the resources
exchanged. The information senders can financially compensate the information receivers for their time,
attention, and information.
In a two-sided market, the decision on how to handle a communication is no longer made by one party;
instead it is made in a distributed way, by all of the parties involved (Hayek, 1945). First, senders use the
offered price to signal how valuable the exchange is to them. The guarantee of financial rewards will then
act as signals, allowing receivers to know, ex ante, the degree to which they will benefit if they participate
in the exchange. The receivers can then make informed decisions about whether or not it is beneficial for
them participate. In standard economic theory, as each parties try to maximize his/her own benefits in the
market, an efficient outcome can be reached (Smith, 1776).
Recently, Loder et al. showed analytically how this type of market can out-perform a simple sender-sided
tax mechanism and even “perfect” technology filters under certain scenarii (Loder et al., 2006).
Conceptually, this two-sided market design is better than single sided markets and technology solutions
because it enables wealth-transfer. Senders are able to share their potential gains from the exchange with
10
the receivers. Suppose the sender values an exchange to be $1,000 while the receiver incurs a $10 cost for
participating in the exchange. Two-sided markets will enable senders to offset receivers’ costs for
participating in these help exchanges. A communication that originally is valuable only to the sender can
be made valuable to both parties.
Therefore, with this market design, not only may there be fewer unwanted exchanges, there may also
more mutually-beneficial exchanges. This solution not only maximizes individual gains from information
exchanges, but also social welfare.
1.5 Research Problems
In theory, market pricing can mitigate the information asymmetry problem, and the transferring of
incentives may reduce motivation asymmetry. If individuals behave as predicted by economic theories,
then the outcome of information exchange will become more efficient.
Standard economic theories and Loder et al.’s proof both make certain psychologically unrealistic
assumptions (Rabin, 2002), though. This is why the field of behavioral economics has arisen from the
joining of economics and psychology to create more realistic models of human behavior. This field of
research suggests that people are not completely rational decision makers and deciding how to use the
prices can introduce additional transaction costs, such as cognitive costs (Simon, 1955; Simon, 1978;
Kahneman, 2003). Furthermore, adding financial incentives to an exchange may actually undermine
people’s intrinsic motivations to participate, resulting in lower effort (Fehr & Gaechter, 2001; Deci et al.,
1999) and changing the fundamental nature of the interaction: a once altruistic, social transaction now
becomes a financial exchange (Gneezy & Rustichini, 2000; Heyman & Ariely, 2004).
However, despite this growing set of behavioral economics research, it is only recently that the advances
in payment technologies make market-based technologies a possible reality. On one hand, this enables us
to advance our theoretical understanding by testing behavioral economic predictions in more realistic
settings. On the other hand, applying market mechanisms in our technologies, such as using them for
information exchange, raises additional human-computer interaction research questions.
The goal of this thesis is to address the following research questions:
1. Can markets actually help? Can people use market pricing to support their information
exchange? Can high cognitive costs from using markets for information exchange undermine
the gains from the improved efficiency?

11
2. How do we design real-time markets for information exchange? If markets can be
integrated with everyday information exchange, what would such markets “look” like? What
sorts of interaction support is needed to improve user experience?
3. What are the conditions under which markets may be most useful for information
exchange? Does using financial incentives crowd out people’s intrinsic motivations for
information exchange? Would a market framing alter interpersonal relationships between
those exchanging information?
1.6 Research Approach
For all intents and purposes, this is a Human-Computer Interaction (HCI) dissertation. What sets HCI
apart from many traditional domains in the sciences or social sciences is its emphasis on technology. It
makes the field applied; research findings will ultimately have an impact on how we interact with
technologies. Furthermore, what is studied and how we must study it is constantly changing since
technology is always advancing. These, I believe, are the primary reasons why HCI has not established a
single standard research approach. If HCI becomes too rigid in its approach, over time, researchers will
not be able to find the interesting research questions or offer insightful and practical answers.
It is in this nature of HCI that this work explores both practical and theoretical questions, drawing on
concepts and theories from a broad range of related domains, including computer science, economics, and
psychology. Answering the practical questions leads to design guidelines that may be immediately
applicable to improving existing technologies, whereas answering the theoretical questions enables us to
leverage new technologies to obtain a better understanding of fundamental human behaviors in ways not
possible before. To answer these research questions appropriately, a mixed method has been employed in
both laboratory and field settings. Laboratory testing provides the control to establish theoretical
understanding of market’s affect on information exchange and social relationships firmly, while field
deployments and studies illuminate the real usage of information exchange markets to generate realistic
design guidelines.
1.7 Impact
Findings from this study provide a better understanding of the strengths and weaknesses of applying
economic markets for interpersonal information exchange. However, it can more broadly elucidate how
humans interact with economic markets. Contributions include:

12
• Empirical support for economic markets’ ability to improve the efficiency of interpersonal
information exchange,
• An understanding of how economic markets affect question and answer behavior, and
• Elucidating the intricate relationship between financial rewards and social relationships.
Findings from this work can improve the design of question and answer systems to support the allocation
of humans’ valuable resources of attention and time. Findings can also be applied to support
communication in general and to the building and sustaining of online communities. Contributions
include:
• Construction of the first-ever real-time, market-based question and answer system (Q&A),
• Providing design guidelines on how to build and improve interpersonal information exchange, and
• Revealing pitfalls and challenges in leveraging financial incentives in social systems.
1.8 Dissertation Organization
The remainder of the dissertation is organized as follows:
Chapter 2 presents an empirical lab study that tests market mechanisms’ ability to improve
communication efficiency. Results support the claim that markets can improve efficiency. However, these
markets need to be carefully designed to minimize cognitive overhead costs from using the market.
Chapter 3 explores the use of markets in a real-world setting – for question and answer (Q&A). It does so
by building and testing a market-based real-time Q&A service through a field deployment and by
analyzing a commercial market-based Q&A site. Findings suggest that paying more may attract more and
longer answers, but perhaps not better answers.
Chapter 4 studies the impacts of financial incentives on social relationships. Findings suggest that using
markets for information exchange may reduce socially-oriented interactions and undermine long-term
interpersonal relationships.
Chapter 5 concludes this dissertation with a discussion of findings and presents several interesting areas
of future work.
13
Chapter 2
MARKETS CAN HELP*
This chapter defines efficiency for interpersonal information exchange and empirically demonstrates that
human users can indeed use markets to improve their exchange efficiencies, even though people are not
completely rational decision makers. It also examines how certain transaction costs (decision costs) can
have an impact on the efficiencies of these markets for information exchange.
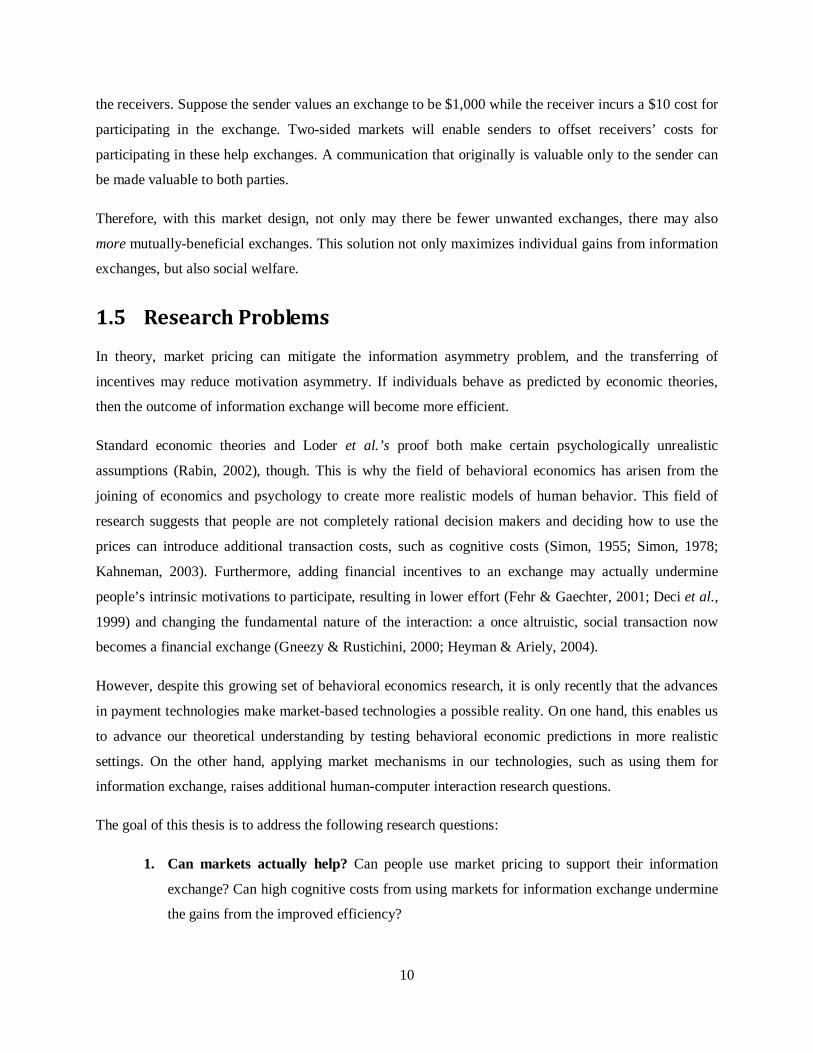
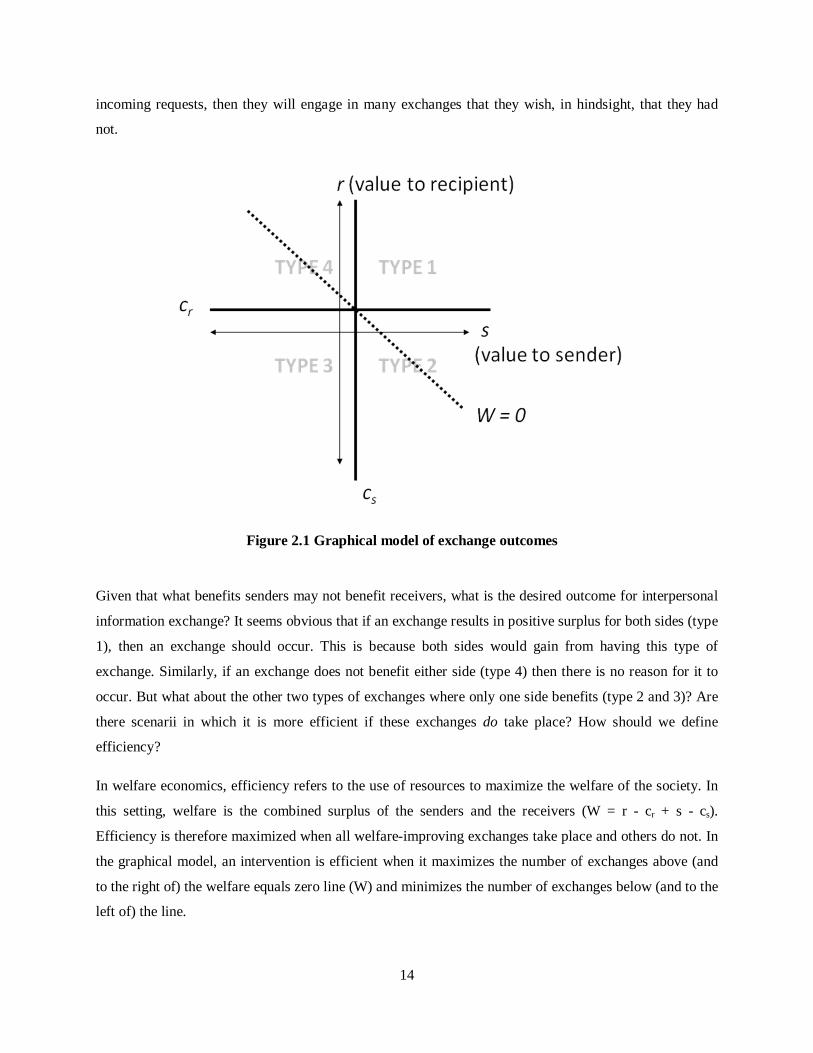
2.1 Efficient Interpersonal Exchange
Loder et al. proved analytically that market mechanisms can be used to facilitate information
communication (2006). Instead of re-presenting the proof here, the graphical model that they presented to
highlight the inefficiencies in information exchange and how market helps is presented below (see Fig.
2.1).
In the graphical model presented, s denotes sender value and r the receiver value, and the <s, r> plane
represents the whole exchange space. Additionally, cs denotes the cost, to the sender, of initiating the
communication while cr denotes the cost of receiving and participating in the exchange for the receivers.
The difference between value and cost is the surplus; SS for sender surplus and RS for receiver surplus.
The cost lines divide up the set of exchanges into the four types of exchange outcomes as presented in
Chapter 1. Senders gain from participating in type 1 and type 2 exchanges, so they have an incentive to
initiate those two types of requests. On the other hand, receivers only benefit from participating in type 1
(out of these two initiated) exchanges. Unfortunately for receivers, because of information asymmetry,
they cannot tell which incoming requests are type 1 and which ones are type 2, ex ante to the exchange.
This leads to real world problems for the receivers, where only some exchanges are desired but they
cannot tell, ex ante, which ones. Not only are they likely to overlook some of the valuable ones, but they
are also susceptible to interruption and overloading from costly and undesired exchanges. If receivers
choose simply to ignore all incoming messages, as they sometimes do when really busy, they may miss
some beneficial or even urgent exchanges. On the other hand, if receivers choose to respond to all
* Parts of this chapter are adapted from Hsieh, G., Kraut, R., Hudson, S.E., & Weber, R. (2008).
14
incoming requests, then they will engage in many exchanges that they wish, in hindsight, that they had
not.
Given that what benefits senders may not benefit receivers, what is the desired outcome for interpersonal
information exchange? It seems obvious that if an exchange results in positive surplus for both sides (type
1), then an exchange should occur. This is because both sides would gain from having this type of
exchange. Similarly, if an exchange does not benefit either side (type 4) then there is no reason for it to
occur. But what about the other two types of exchanges where only one side benefits (type 2 and 3)? Are
there scenarii in which it is more efficient if these exchanges do take place? How should we define
efficiency?
In welfare economics, efficiency refers to the use of resources to maximize the welfare of the society. In
this setting, welfare is the combined surplus of the senders and the receivers (W = r - cr + s - cs).
Efficiency is therefore maximized when all welfare-improving exchanges take place and others do not. In
the graphical model, an intervention is efficient when it maximizes the number of exchanges above (and
to the right of) the welfare equals zero line (W) and minimizes the number of exchanges below (and to the
left of) the line.
Figure 2.1 Graphical model of exchange outcomes
15
To illustrate this idea of welfare more concretely, consider what happened to Lisa, described in the
introduction to Chapter 1. Recall that Lisa’s dog, Marble, is puking a yellow substance and Lisa wants to
know what is wrong with him. In this type of help-seeking exchange, the primary benefactor is Lisa and
responding to it may offer little or no direct reward for the person providing help. This is a type 2, one-
sided exchange. While receivers may not want to be interrupted by and engage in these exchanges, from a
social welfare perspective, as long as Lisa’s value from help outweighs the receivers’ cost to give help,
then this exchange ought to take place. This is because this type of exchange will be able to result in a
positive increase in the welfare of the society as a whole.
Loder et al. demonstrated analytically that two-sided markets can result in higher welfare than when there
is no market intervention (status quo, open access) and than when other alternative solutions, such as
fixed-tax and technology filters, are in place. Their proposed solution, the Attention Bond Mechanism
(ABM), works by having receivers post a take-it-or-leave-it bond price. Senders, in order to engage in the
exchange, must then pay the posted price. Conceptually, this type of market is analogous to consultants
posting their hourly fees and clients paying them if they desire the service. ABM dominates filters and
taxes because the other solutions work by maximizing the mutually beneficial exchanges (type 1) but, in
doing so, also filter out the subset of type 2 and type 3 exchanges that are still welfare-improving. ABM,
on the other hand, enables senders to share their gains from exchange with receivers, which allows
senders and receivers both to benefit from these previously one-sided exchanges. For example, if we
quantify Lisa's surplus from the exchange as $1,000, and a helper incurs a $10 cost. With this type of
market solutions, Lisa can offer some of that gain to the helper (say $100), which will make both Lisa and
the helper (and, of course, the sick dog) better off.
2.2 Unrealistic Assumptions
While, in theory, these markets can improve exchange efficiency, there are some uncertainties about their
usefulness in practice. This is because economic markets and the Attention Bond Mechanism make
standard economic assumptions about the users that are unrealistic.
The first assumption is that humans are homo economicus, or rational and narrowly self-interested actors.
As many prior studies have demonstrated, homo economicus is an over-simplified and often unrealistic
model of actual human actors (e.g., Thaler, 1994; Rabin, 2002). People do not act only to maximize their
own welfare. Research on public goods has shown that people are willing and sometimes do contribute to
public goods even when incurring a cost (Ledyard, 1995; Fehr & Fischbacher, 2004; Benkler, 2002). This
violation of a purely homo economicus model of human behavior raises doubts about the usefulness of
16
financial pricing in a market system. If people are willing to provide help regardless of the financial
rewards offered or costs incurred, pricing (as signals) may be ignored. Prior work has not demonstrated
empirically that using markets for information exchange can actually result in higher efficiency.
The second assumption is that we are perfect Bayesian information processors, and can make all valuation
decisions right away (Rabin, 2002). Research has shown that we do not make instantaneous decisions
(Card, Moran and Newell, 1983), and that making decisions incurs a cost (Simon, 1955; Simon, 1978;
Coombs, 1964, Dawes, 1964, Simon & Newell, 1971; Shugan, 1980; Kahneman, 2003). As Coase points
out, transaction acts may undermine the value of the markets (Coase, 1937), and, perhaps, market
mechanisms that require higher deliberation cost can undermine the potential gains. This can impact the
market design. Perhaps a simpler market with fewer options may result in higher efficiency gains than a
more expressive, but more complex, market mechanism.
Therefore, there are two specific questions that this chapter seeks to answer. One: given that people are
not perfectly rational, can economic markets still improve the overall efficiency of information exchange?
Two: can high cognitive/transaction costs undermine the efficiency of economic markets? To answer
these questions, the study presented herein compares the efficiencies and usages of three information
exchange designs: a no market design as baseline condition, a complex variable-price market design
(similar to that of ABM), and a simple fixed-price market design.
2.2.1 No Market
Consider a simple information exchange scenario between strangers. In this scenario, senders are the
requesters for information and receivers are the potential providers of information. Senders are the
primary benefactors when the exchange occurs, while the receivers gain nothing financially for
participating in the exchange. Let us assume for this experiment that the costs are negligible on a per-
exchange basis, as these costs are often amortized over a period of time. However, there are still
opportunity costs — what the receivers could have gained if they did not provide help and instead
allocated their time and attention resources elsewhere. Thus, senders’ and receivers’ valuations can be
represented by these equations:
sSS =0
rcRS −=0
These equations would predict that senders will always send out exchange requests when they need help
whereas receivers will never engage in the exchange.
17
However, there are often non-direct factors that have impact on valuation. Non-financial motivators such
as altruism may add additional costs to senders when asking for help but may also motivate receivers to
provide help voluntarily, regardless of the lack of gain. Hence, what we would actually expect is that
senders will refrain from bombarding providers with excessive help requests (i.e., help requests will be
less than 100%) and that receivers will offer some help.
SS0 = s − cr _ int rinsic
rIntrinsic crRS −=0
2.2.2 Variable-Price Market
Loder et al. proved analytically that a two-sided variable-price market design can result in higher welfare
than the no market (open access) scenario. In Loder et al.’s Attention Bond Mechanism (ABM), receivers
post a take-it-or-leave-it price and the senders decide whether or not to pay that price for communication.
Here, I use a slightly different variation ABM to contrast against the baseline no market mechanism.
In my variable-price design, senders place a bid on how much they would pay for the exchange, and
receivers set a reservation price on how much they need to be paid to respond to an information exchange
request. Communication occurs when the bid is higher than or equal to the reservation price. The final
payment amount is the reservation price as set by the sender. I chose this market design as it seems more
appropriate for synchronous communication. Receivers’ prices may change many times over time, and
they should not be required to post new prices every few seconds. Instead, this should be done solely on a
need-only basis; whenever there is a request for exchange.
With this model, we can express senders’ and receivers’ valuation as:
HelprinsicrM paymentcsSS −−= int_
HelprrinsicM paymentcrRS +−= int
Rational senders in the variable market should place bids on help requests based on the value the
communication has for them. For example, if they gain $0.25 from receiving the information, senders
should offer to pay up to $0.25, minus the intrinsic costs discussed previously. In my setup, I allow
senders to place $0 help request bids. Since help requests in the no market condition are essentially $0
bids, the variable market condition should result in about the same number of help requests as is in the no
market condition.
18
Rational receivers, in this condition, should dynamically adjust their reserve prices to match their net
costs from providing help. Because receivers in the variable market condition receive greater financial
compensation when they offer help than in the no market condition, help should occur more frequently. I
expect that senders and receivers should be able to use the market to their advantage; both getting help
and giving help should improve their welfare.
2.2.3 Fixed-Price Market
While a variable market may in theory improve exchange efficiency, in practice, the expressiveness of the
mechanism may result in higher cognitive decision costs. Senders and receivers have to make pricing
estimations on a continuous scale, giving them an infinite number of choices. Even if we simplify the
decision to a $0.05 level (as I did for this experiment), there are still many options from which senders
and receivers may choose.
To explore the issue of a cognitive transaction cost, I also studied a fixed-price design. In a fixed market
condition, senders must offer to pay providers a fixed-price for each completed communication. In my
study, the fixed price is set to $0.20. The fixed-price condition represents a less expressive and less
flexible version of the variable-price market. The payment value is restricted to just one value, instead of
being opened to the continuous range of values available under the variable price mechanism. Therefore,
senders and receivers can less precisely express the value and cost of the communication. This is,
actually, identical to the flat-tax mechanism discussed in Loder et al., assuming that the tax payment is
transferred to the receivers. And it is important to note that Loder et al. did demonstrate that the variable
market solution dominates this fixed-price solution.
20.0$int_ −−= rinsicrFM csSS
20.0$int +−= rrinsicFM crRS
In the fixed-market condition, rational senders should ask for help as long as the value of the
communication exceeds the fixed payment threshold and receivers should offer help only if their
opportunity cost to communicate is lower than the fixed payment. Similar to the variable-price condition,
I expect the market to be used rationally and both getting help and giving help will lead to improvements
in task performance. Because it is less fine-grained in this condition, however, the frequency of help
produced by the mechanism will be lower. For example, in the fixed-price market, senders who would
gain $0.19 from receiving help would not ask for help because their gain is less than the $0.20 fixed price.
19
In contrast, in the variable-market, requesters can offer less than $0.19 and enable more welfare-
increasing help to occur.
However, the variable-market may also be less effective than the fixed-market, producing lower overall
welfare. Cognitive limitation may interact with the additional complexity of the variable market to reverse
the potential gains from increased expressiveness. The fine-grained decision that must be made in the
variable market condition is much more complicated and requires more time and attention for the
decision than the coarse-grained decision in the fixed market condition. Instead of the binary decision of
“should I pay $0.20 for help?” senders in the variable market condition are instead faced with two
decisions — “should I pay for help?” and, if so, “how much should I pay?” Similarly, rather than simply
deciding whether or not to accept a $0.20 payment for responding to an exchange request, as in the fixed
market condition, receivers in the variable market condition must determine the precise opportunity cost.
These additional costs for using the market mechanism are a type of transaction cost incurred during the
decision process, so they are hard to model as an independent factor. As Conlisk points out, there is a
regress problem (Conlisk, 1996). We would need to factor in deliberation costs in our deliberation, but
deliberating on deliberation adds additional deliberation costs. This results in an endless regression. Here,
to provide an intuitive understanding of how these costs can impact exchanges, I will simply use cs_decision
and cr_decision as two functions to denote the decision costs to senders and receivers respectively. Some
prior research on choice problems has simply modeled these costs as number of comparisons times the
cost of comparing two options (Shugan, 1980; Conlisk, 1996). Here, I chose to represent these costs,
simply, with a cost function that takes in the number of alternatives (comparisons) as the argument, and
these functions are monotonically increasing against the number of comparisons.
)1(int_0 decisionrinsics ccsSS −−=
)1(int0 decisionrrinsic ccrRS −−=
)(int_ ncpaymentcsSS decisionHelprinsicsM −−−=
)(int ncPaymentcrRS decisionHelprrinsicM −+−=
)1(20.0$int_ decisionrinsicsFM ccsSS −−−=
)1(20.0$int decisionrrinsicFM ccrRS −+−=

20
2.3 Hypotheses
In (Hsieh, 2008) more hypotheses were presented. However, here I focus on the four main hypotheses:
On Market Use:
H1. The percentage of help requests will be higher in both no-market and variable-market conditions
than in the fixed-market condition; the percentage of help requests will not differ between no-
market and variable-market conditions.
H2. The percentage of help exchanges will be highest in the variable-market condition, second
highest in the fixed-market condition.
On Market Efficiency:
H3. Market mechanisms (fixed- and variable-market conditions) will lead to higher welfare than the
no-market condition.
H4. A fixed-price (less expressive, less complicated) system will lead to higher welfare than a
variable-price (more expressive, more complicated) system.
2.4 Study Setup
To test these hypotheses, I developed a study in which participants worked on a task independently in
four-person sessions. Participants broadcasted help request and provided help to other participants in the
session.
Each session was assigned to one of three different communication mechanisms (variable-market, fixed-
market, no-market) and each participant played both the role of requester and provider concurrently.
Tasks were solving memory/concentration puzzles.
The goal of the puzzle was to find the locations of the matching celebrity faces from a set of cards
containing pairs of celebrity faces (Figure 2.2). At the start of each puzzle, the cards were placed face
down. Participants were allowed to flip over two cards at once. If the two cards matched, they would
remain face up; otherwise, they would be turned face down automatically. We selected this game
because: (1) most participants are familiar with it; (2) it provides the participants a good sense of task
progress; (3) it is quick, allowing us to collect data from repeated plays, and (4) most importantly,
interruptions lead to costs similar to real life communication (players cannot continue with their own
work when communicating).
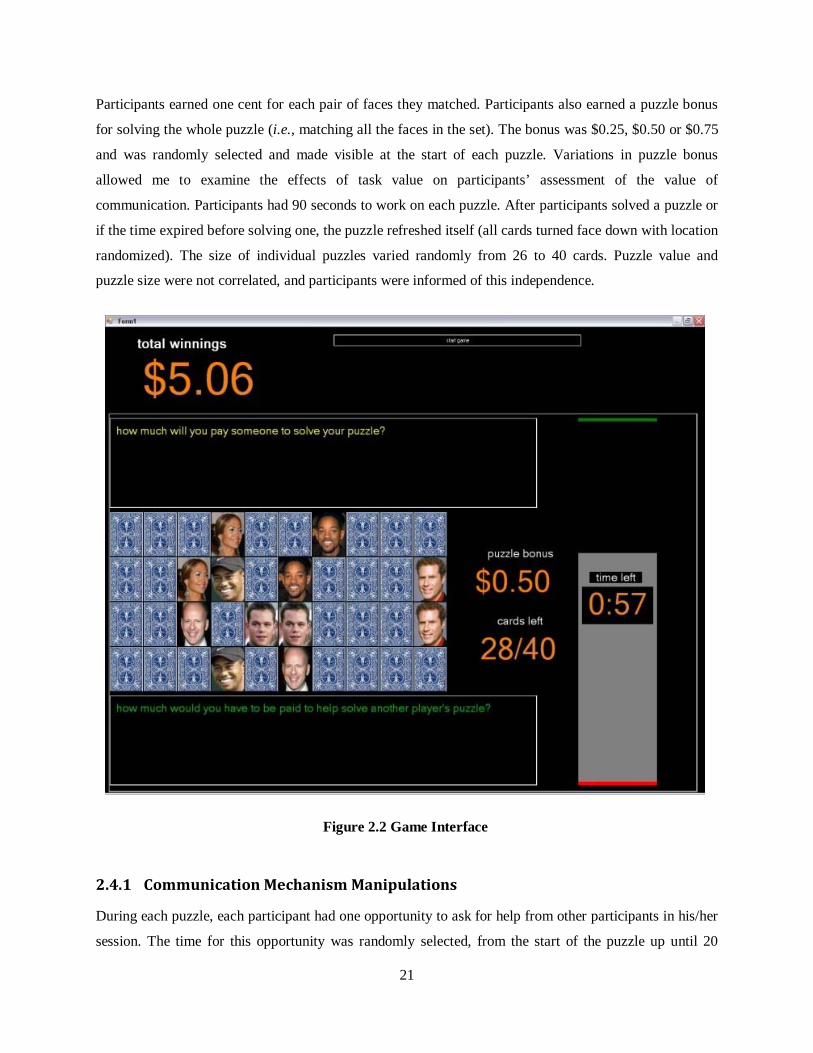
21
Participants earned one cent for each pair of faces they matched. Participants also earned a puzzle bonus
for solving the whole puzzle (i.e., matching all the faces in the set). The bonus was $0.25, $0.50 or $0.75
and was randomly selected and made visible at the start of each puzzle. Variations in puzzle bonus
allowed me to examine the effects of task value on participants’ assessment of the value of
communication. Participants had 90 seconds to work on each puzzle. After participants solved a puzzle or
if the time expired before solving one, the puzzle refreshed itself (all cards turned face down with location
randomized). The size of individual puzzles varied randomly from 26 to 40 cards. Puzzle value and
puzzle size were not correlated, and participants were informed of this independence.
2.4.1 Communication Mechanism Manipulations
During each puzzle, each participant had one opportunity to ask for help from other participants in his/her
session. The time for this opportunity was randomly selected, from the start of the puzzle up until 20
Figure 2.2 Game Interface

22
seconds remained on that particular puzzle. When this “bidding opportunity” occurred, that individual
participant’s puzzle paused. Prior to continuing work on the puzzle, the participant had to decide if s/he
wanted to ask for help. If s/he chose to ask for help, his/her help request was broadcast to all other players
anonymously.
Participants were given one randomly-timed opportunity to ask for help during each puzzle. This design is
different from what we might expect from real-world communication, where people can request for and
decide to provide help at any point in their task. I chose this design because it allowed me to measure the
time spent on making each decision and because it allowed random sampling of choices made at several
points during the puzzle-completion process.
If a request was made, each provider’s puzzle paused. Providers then had to decide how to handle the
request. When providers decided to help the requester, the software controlled the help interaction: all
help exchanges were computerized and took 15 seconds. This controlled help guaranteed help exchanges
when requests were accepted and enabled providers to know beforehand the exact time cost for providing
help. As soon as any one provider agreed to help, all help requests to the other players were canceled.
This design made the setup more representative of the real time nature of the communication — if a
requester receives sufficient help from someone, no subsequent help from others will add value to the
requester.
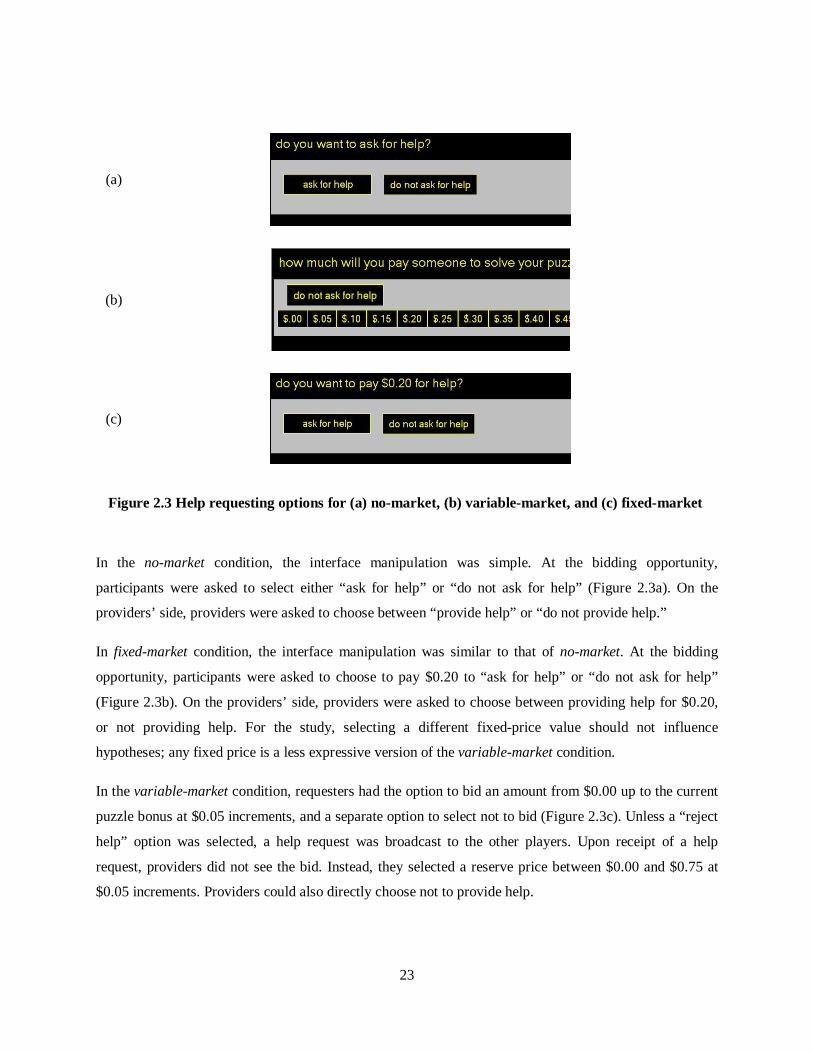
23
In the no-market condition, the interface manipulation was simple. At the bidding opportunity,
participants were asked to select either “ask for help” or “do not ask for help” (Figure 2.3a). On the
providers’ side, providers were asked to choose between “provide help” or “do not provide help.”
In fixed-market condition, the interface manipulation was similar to that of no-market. At the bidding
opportunity, participants were asked to choose to pay $0.20 to “ask for help” or “do not ask for help”
(Figure 2.3b). On the providers’ side, providers were asked to choose between providing help for $0.20,
or not providing help. For the study, selecting a different fixed-price value should not influence
hypotheses; any fixed price is a less expressive version of the variable-market condition.
In the variable-market condition, requesters had the option to bid an amount from $0.00 up to the current
puzzle bonus at $0.05 increments, and a separate option to select not to bid (Figure 2.3c). Unless a “reject
help” option was selected, a help request was broadcast to the other players. Upon receipt of a help
request, providers did not see the bid. Instead, they selected a reserve price between $0.00 and $0.75 at
$0.05 increments. Providers could also directly choose not to provide help.
(a)
(b)
(c)
Figure 2.3 Help requesting options for (a) no-market, (b) variable-market, and (c) fixed-market

24
We chose to restrict the number of options to $0.05 increments to keep the interface consistent. Even with
this simplification, the variable-market condition is still a much more expressive system than the fixed-
market condition.
2.5 Results
One hundred eight (108) students from a university participated in this study for monetary reward (36 per
condition). Participants were randomly assigned into one of the three conditions (between subjects). Each
participant worked on the primary task for 27 minutes.
2.5.1 H1-Help Requests
I hypothesized that requesters in both the no-market and variable-market conditions would ask for help
with roughly the same help request percentage, since requesters in both conditions can broadcast for help
without paying. In contrast, players in the fixed-market condition would ask for help only for a subset of
request opportunities (when their communication value was greater than $0.20).
As I hypothesized, participants made more help requests in the no-market and variable-market conditions
than the fixed-market (F(2, 105)=2.39, p=0.096). It is interesting to note that only about 60% of all
request opportunities in the no-market condition led to help requests (Table 2.1). This may indicate either
the strength of intrinsic motivations or the belief that help requests may go unanswered.
2.5.2 H2-Help Exchanges
I predicted that the variable-market condition would result in the highest percentage of help exchanges,
followed by the fixed-market condition, and then the no-market condition. Surprisingly, as shown in
no-market variable-market fixed-market
Request Opportunities 19.6 19.9 21.1
Actual Help Requests
% help requests/opportunities
11.4
(58%)
11.5
(58%)
9.1
(43%)
Instances of Help
% help exchanges/requests
6.2
(54%)
6.1
(53%)
8.4
(92%)
Table 2.1 Help requests and exchanges breakdown

25
Table 1 line 3, my results disconfirm this hypothesis. The fixed-market actually led to the highest
percentage of help exchanges, while the no-market and variable-market had about the same percentage of
puzzles helped. The results are surprising since the fixed-market condition, the less expressive market, led
to more help exchanges than the variable market condition (F(2,71)=25.6, p<0.001). A possible
explanation is that the more fine-grained decisions in the variable-market leave less room for error in
decision making, and may have resulted in more missed help opportunities.
2.5.3 H3-Efficiency of Market versus No-Market
Given that players in market conditions were able to use the market to improve their welfare, did the
market conditions lead to higher welfare (overall earnings) when compared to the no-market condition?
When grouping the market conditions together, markets did perform better than no-market by a dollar
($9.80 to $8.80, F(1,106) = 3.30, p<0.07). This suggests some modest efficiency gains from applying
market mechanisms in real world communication.
2.5.4 H4-Variable-Market versus Fixed-Market
When analyzing the markets individually, it becomes apparent that the difference in earning between the
market conditions and no-market condition is due mainly to the significant difference between fixed-
market and no-market, and not variable-market and n- market (no-market=$8.81, fixed-market=$10.37,
variable-market=$9.28). Pair-wise analysis shows that earning in fixed-market is significantly higher than
no-market (F(1,105)=5.94, p=0.02) and marginally higher than variable-market (F(1,105)=2.90, p=0.09),
whereas there is no significant difference in earnings between variable-market and no-market
(F(1,105)=0.5, p=0.5).
no-market variable-market fixed-market
Earning from puzzle bonus $3.52 $3.81 $3.75
Earning from matching pairs $2.20 $2.11 $2.17
Earnings from getting help $3.10 $2.31 $2.78
Earnings from giving help $0.00 $1.05 $1.67
Total Earnings $8.81 $9.28 $10.37
Table 2.2 Breakdown of earnings by components
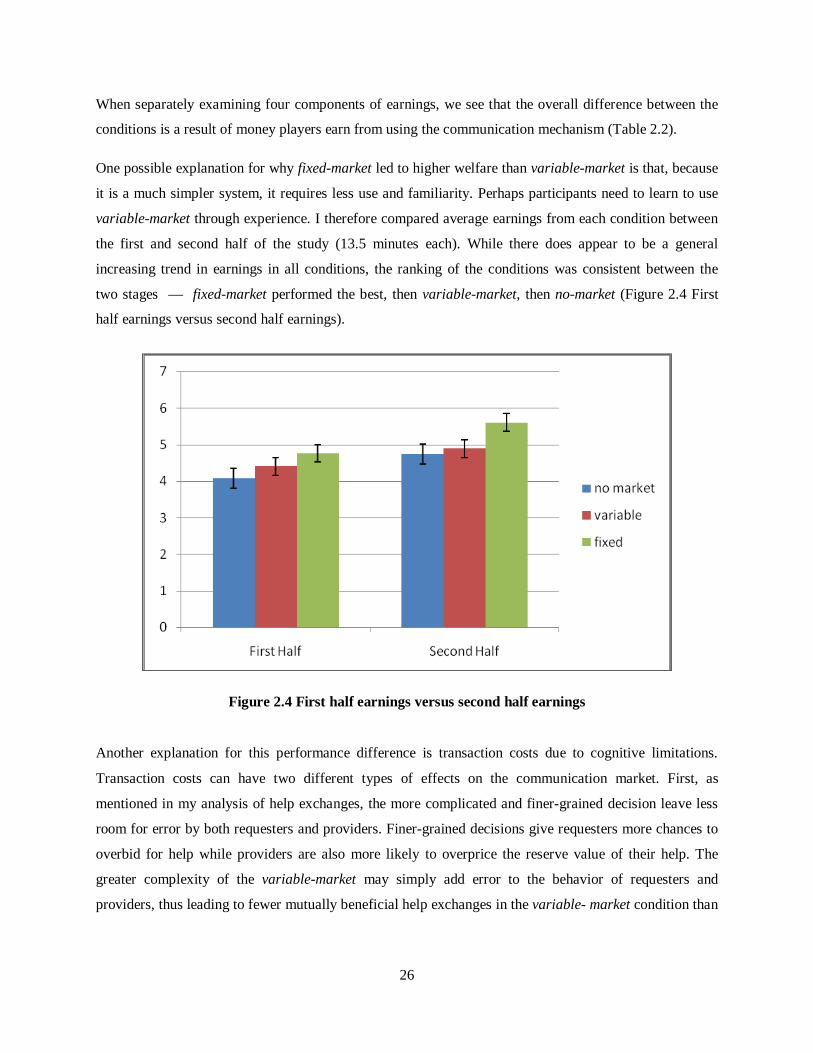
26
When separately examining four components of earnings, we see that the overall difference between the
conditions is a result of money players earn from using the communication mechanism (Table 2.2).
One possible explanation for why fixed-market led to higher welfare than variable-market is that, because
it is a much simpler system, it requires less use and familiarity. Perhaps participants need to learn to use
variable-market through experience. I therefore compared average earnings from each condition between
the first and second half of the study (13.5 minutes each). While there does appear to be a general
increasing trend in earnings in all conditions, the ranking of the conditions was consistent between the
two stages — fixed-market performed the best, then variable-market, then no-market (Figure 2.4 First
half earnings versus second half earnings).
Another explanation for this performance difference is transaction costs due to cognitive limitations.
Transaction costs can have two different types of effects on the communication market. First, as
mentioned in my analysis of help exchanges, the more complicated and finer-grained decision leave less
room for error by both requesters and providers. Finer-grained decisions give requesters more chances to
overbid for help while providers are also more likely to overprice the reserve value of their help. The
greater complexity of the variable-market may simply add error to the behavior of requesters and
providers, thus leading to fewer mutually beneficial help exchanges in the variable- market condition than
Figure 2.4 First half earnings versus second half earnings
27
hypothesized. Unfortunately, given the subjective component of gains and costs for both requesters and
providers, it is impossible to identify precisely such error in their behavior.
Another possible transaction cost effect is that more time and attention may be required to make a
decision. Participants in fixed-market only have to decide whether or not to request/offer help for $0.20,
instead of determining the exact communication value as they do in the variable-market condition. The
simplicity of the decision at hand could significantly reduce the time required for decisions. I, therefore,
compared the time players spent on each decision and found a significant difference in decision time
(Table 2.3). Fixed-market is lowest at 1.774 seconds, then no-market at 2.165 seconds, and then variable-
market at 2.881 seconds (F(2,105)=18.45, p<0.0001). If we compare the total time used on decisions
between the variable-market condition and the fixed-market condition, participants spent, on average, 70
seconds more on their decisions in the variable-market condition. Based on fixed-market participant
performance, having 70 extra seconds can yield an additional $0.40 in earnings. While this alone may not
explain all of the earning difference between fixed-market and variable-market, it does contribute to some
of it.
It is interesting to note that decision time in fixed-market was also significantly faster than no-market.
One possible explanation is that the decision in market mechanisms may be dominated by weighing
extrinsic costs and benefits, while the decision in no-market, based on intrinsic motivation, may be more
convoluted and require more time.
2.6 Discussion & Limitations
If humans are rational self-interested agents, then communication would never occur when receivers have
nothing to gain. In the scenario of questions and answers, no help would be offered, as the sender is the
only party benefiting financially from such an interaction.
But as this study shows, help in the no-market condition occurred as frequently as in the expressive
market condition (variable-market). This means that, even between anonymous strangers, people do not
act solely to maximize their own personal, immediate monetary gain. Prior work on public goods and
no-market variable-market fixed-market
Time Spent on Decisions 2.165s 2.881s 1.774s
Table 2.3 Time spent on decision

28
altruistic behavior provide evidence that people voluntarily help others, especially when they expect
others to do so. In this kind of problem, players face a decision to help others, but at a personal cost that
exceeds one’s personal benefit (e.g., Ledyard, 1995). The results presented herein, like results from these
prior studies, demonstrate that the strong predictions of self-interest and rationality (which postulate that
no voluntary help will occur) are wrong.
Thus, individuals’ willingness to help others voluntarily should be an important factor to remember as we
evaluate market-based communication mechanisms. Often, we use the no-market condition as a baseline
comparison point, but communication behavior in the no-market condition is neither as straightforward
nor as inefficient as traditional economic analyses suggest. Even without explicit incentives, implicit
incentives can have significant impact on communication decisions. Moreover, while this study’s results
assumed a simple additive effect between extrinsic and intrinsic motivations, explicit incentives may
sometimes “crowd out” implicit incentives, thereby reducing the willingness of individuals to help
voluntarily (e.g., Deci & Koestner & Ryan, 1999). Further research is required to explore such effects in
this communication market domain.
Compared to Loder et al.’s analytical proofs, one of the most important findings in this study is that the
fixed-price mechanism led to the most exchanges of help and the highest overall earnings. This is
especially significant because our fixed-market is actually identical to a flat-tax mechanism, where the tax
payment is transferred to the receivers, and that Loder et al. showed analytically that the more expressive
market is superior in comparison. The richer communication available through the variable market should
have led to better allocation of resources.
I put forth two possible explanations for the fixed-market condition outperforming the variable-market.
One is that the additional complexity and extra options available in the variable-market condition may
have led to more errors in requesting or granting help. The other is that the variable-market condition may
have introduced additional decision costs, which I indirectly measured by considering the time it took to
make decisions. As we demonstrated in the results, the more complex decision took longer, resulting in a
$0.40 earnings difference, which explains some of the overall earnings difference.
2.6.1 Practical Contributions
One of the underlying motivations of this work was to test whether people can use market mechanisms in
real-time to improve communication efficiency. My work demonstrates that people can, to a certain
degree, use prices as signals to reflect their communication value and reserve prices to filter out unwanted
communication. However, the fact that a fixed-price mechanism led to better performance than a variable
pricing mechanism poses many implications for human-market communication interactions. First, for
29
real-time synchronous communication, a fixed contract or a limited option market design might be more
suitable to reduce the transaction cost. Having a more expressive market might not be able to offset the
loss in time spent on decision-making. More generally, if highly expressive markets are to be applied to
facilitate resource management in our everyday technologies, designers of human-market communication
interfaces must consider human decision costs, such as time.
Another set of technology implications deals with non-optimal use of markets. To maximize the gain of
efficiency from markets, humans need to act like agents from economic models. When they do not,
technology interventions may be introduced to provide guidance for how markets should be used.
2.6.2 Limitations
The stylized task used in the study exhibits many features representative of everyday tasks (deadline, task
value, and noticeable incremental progress). While it lacks realism, the simplification does allow
communication costs and benefits to be modeled and provides for clear analysis the influences of the
mechanisms on task performance.
There were two specific controls in this study setup that are unrealistic. One is that the content and the
quality of help exchange were controlled. The other is that relationship between communicators is also
controlled – the exchanges were anonymous. To understand fully the strengths and weakness of
employing market mechanisms for information exchange, we must examine the market’s impact on
exchange quality and social relationships.

30
Chapter 3
MARKETS FOR Q&A*
This chapter applies market mechanisms to information exchange in question and answer (Q&A) setting.
It examines how paying for answers affects both the type and the quality of exchanges in Q&A services.
This is accomplished by experimenting on a real-time Q&A service built (mimir) by the author and
through analyzing usage on a commercial pay-for-answer Q&A site (Mahalo Answers).
3.1 Question and Answer Services
Q&A sites are increasingly popular. These sites offer an alternative to traditional search engines and act
as communities where users can contribute and share knowledge. Users can ask questions and have them
answered by other users. The generated content can then provide archival value and support knowledge
searches in the future. Yahoo! Answers, one of the most popular Q&A sites, averaged about 80,000+
questions and 4 million unique visitors daily (Google trends for Yahoo Answers).
Q&A services differ in many subtle yet important ways. One difference is the media in which the
exchanges take place. Most of these Q&A services are asynchronous, where users interact with each other
through a website. However, others like Aardvark and Twitter Answers have expanded to include
synchronous communication media, enabling real-time asking and answering of questions through instant
messaging (IM) and short messaging service (SMS). Another difference is the answerer population. Some
services leverage social networks to decide to whom to target the questions (Aardvark, Quora, Facebook).
Others rely on a group of pre-screened “experts” to answer the questions (Google Answers). The breadth
of topics the Q&As cover also differs. Some Q&A services serve a particular niche (e.g., StackOverflow
for programming questions) while others are broad and general Q&A services (e.g., Yahoo! Answers).
And finally, social Q&A services differ in the incentives offered. Most sites have incorporated some form
of a reputation-based system to motivate contributors in the community, using badges and points. Yet
another subset of social Q&A services, which is the focus of this chapter, use market mechanisms to
facilitate Q&A.
* Parts of this chapter are adapted from Hsieh, G. & Counts, S. (2009) and Hsieh, G., Kraut, R., & Hudson, S.E. (2010).

31
3.1.1 Non-Productive Usages of Q&A
Like other communication media, Q&A services are hindered by motivation and information asymmetry
between askers and answerers. Askers and answerers face similar problems of exchange overload and
missed opportunities. Many have pointed out the overabundance of low-quality and non-productive
exchanges on Q&A services (Leibenluft, 2007). These non-productive usages offer little direct benefit to
the askers and can drown out important and serious questions and germane and useful responses posted.
Without proper support, these frivolous questions may significantly undermine the usefulness of these
Q&A sites for information exchange.
I began this thread of research by examining the makeup of questions in a non-paid Q&A site,
Microsoft’s Live QnA (MSN QnA). Live QnA started in August 2006 and by 2008 had more than
290,000 total registered users, 600,000 questions and 1.8 million answers. For my analysis, I randomly
sampled 200 questions from Live QnA. I analyzed the questions and answers on various measures to
understand the efficiency of this Q&A system (Table 3.1). Note that, in Live QnA, community voters
determined the best answer to a given question, and that additional answers cannot be added to the
question after the best answer has been selected. Question askers could vote as well, with their votes
carrying three times the weight of non-askers.
I analyzed the composition of the questions asked on Live QnA using the question type breakdown
employed by Harper et al. (2008). For this, I recruited 9 coders to categorize each of the 200 questions as
“factual question,” “advice question,” “opinion question,” or “not a question” (inter-rater reliability
# Questions Analyzed 200
Average # of Answers 2.8 (SD=3.27)
% with answers 80%
% with best answers 56%
Average time until first
answer (hh:mm:ss)
2:52:30
Average time until “best”
answer (hh:mm:ss)
4:18:17
Table 3.1 Live QnA statistics

32
α=0.89). Factual questions are questions asking for objective data, pointers to content etc. Opinion
questions are questions asking for others' thoughts on a topic of general interest. Advice questions are
questions asking for personal advice, recommendations based on the questioner's individual situation. Not
questions are discussion-oriented questions and spam.
As suspected, there were a fairly high percentage of submitted inquiries that were not real questions
(13%, Figure 3.1). We also recruited 8 coders to rate the seriousness of the questions asked, using a 5-
point Likert scale where 1 is not serious, 3 is moderately serious and 5 is very serious (inter-rater
reliability α=0.74). A serious question is defined as a question to which the coders believed the question
asker really wanted an answer. I used this to get a sense of the percentage of “real” questions, as opposed
to joking or frivolous questions. I took the median across participant ratings to get the seriousness rating
per question. The mean of these ratings was 2.63 (SD=0.76).
A one-way ANOVA indicated a significant difference for seriousness across the four question types.
Post-hoc analyses showed that advice (M=2.93) and factual (M=2.78) questions were significantly more
serious than opinion (M=2.42) and non-questions (M = 2.13); all pair-wise p’s < .01, except for the
differences between advice and factual, and opinion and non-questions).
Related research on Yahoo! Answers confirm the general concern that a high percentage of exchanges are
not exchanging information, but instead are for social discussion (Adamic et al., 2008) and that these
discussions yield little or no archival value (Harper et al., 2009). As Yahoo! Answers continue to grow,
Figure 3.1 Breakdown of the types of question asked on Live QnA
33
“its overall quality as an information source for factoid question-answering degrades.” (p.737, Liu &
Agichtein, 2008).
3.1.2 Markets for Information Exchange
For the purpose of high quality information exchange, it appears that there is room for improvement. To
maximize the limited answering resources availble, we need to ensure that these resources are allocated to
the most valuable questions. As I have shown in the previous chapter, market models should be able to
improve these exchanges. Applied in this domain, question askers can promise a financial payment for
answers when asking questions. The pricing can act as signals to make the more valuable questions more
prominent. Answerers can then filter questions based on the posted price, and, by answering the higher-
paid questions to maximize their owns gains, also ensure that the most important and urgent questions
receive due attention. This is very similar to the variable-price design presented in the previous empirical
study.
There have been, in fact, a number of market-based Q&A sites launched within the past few years (e.g.,
Google Answers, Mahalo Answers, Just Answers, UClue, AskBright). However, despite commercial
interests, none of the market-based Q&A services has been successful. Google Answers, one of the
earliest pay-for-answer sites, lasted for only three years and was shut down in 2006. The fate of Google
Answers begs the question: are there real benefits in using markets for information exchange? How
should we best utilize the market forces in Q&A? To answer these questions, I examine two aspects of
Q&A that may be altered by a pay-for-answers design: question asking and question answering.
Specifically, will question askers use the markets appropriately and signal their needs through pricing?
Will answerers be motivated by financial incentives?
3.2 Field-Experiment with mimir
In order to study the impact of markets on Q&A through a controlled field experiment, I built my own
Q&A service, mimir. It is the first real-time market-based Q&A system. Therefore, aside from the
theoretical contributions, mimir is also, in and of itself, a research contribution, offering a design
combining markets with real time Q&A services.
34
3.2.1 Hypotheses
3.2.1.1 Question Asking
Research in the general help-seeking domain suggests that people consider the costs and benefits when
deciding whether or not to ask for help (e.g., DePaulo & Fisher, 1980). On one hand, askers must
determine how much they can gain from having the answers: the more useful the answers are to people’s
successful goal attainment, the more likely it is that they will ask for help. On the other hand, there are
costs associated with requesting help. While there are, by definition, no monetary costs associated with
free Q&A sites, there are psychological and social costs. Receiving help may reduce one’s sense of
competence and may also reduce one’s external reputation (e.g., Wills, 1976; Wills, 1978). Prior work
examined how aversion to indebtedness influences people’s willingness to ask questions (e.g., Fisher et
al., 1981; Greenberg & Shapiro, 1971) and showed that people who do not anticipate being able to return
a favor are less willing to ask for help (e.g., Greenberg & Shapiro, 1971). In general, however, the effects
of these costs tend to be weaker for help-seeking on online Q&A sites than in face-to-face exchanges,
because the questions are not targeted to any particular answerer, and because of anonymity.
How is the question-asking decision affected by the availability of payment systems? From a cost-benefit
perspective, paying for help affects whether or not to ask a question in that it raises the cost of asking for
help. Prior work has shown that askers are less likely to ask for help when getting help reduces their gains
(e.g., getting partial credit on an academic task) (DePaulo & Fisher, 1980). Similarly, recent related
research on using financial payments to fight spam has shown that requiring a financial payment when
sending help requests can make senders more selective in the messages they send (Kraut et al., 2005). We
expect the same effects in the Q&A scenario – the additional cost will make askers more selective in the
questions they ask. With all else equal, a market-based system should reduce the number of questions
asked and will especially limit the asking of frivolous questions. Therefore, it will raise the overall
seriousness of the questions. Askers are thus, in a sense, using paying as a way to signal that their need is
non-frivolous.
H1. The market system will lead to higher average seriousness in questions asked, but will result in
fewer total number of questions asked.
3.2.1.2 Question Answering
Paying for answers can also affect question answering. The underlying assumption of a Q&A market is
that people are motivated by financial incentives. People prefer more money to less money and would
35
therefore put in more effort to ensure compensation when more money is offered (e.g., Prendergast,
1999).
However, research in both psychology and experimental economics has shown that monetary incentives
can crowd-out intrinsic and social motivators (Lepper, 1973; Deci & Ryan, 1985; Fehr & Gaechter, 2001;
Frey & Jegen 2000). According to self-determination theory (Deci & Ryan, 1985), financial incentives
may be perceived as controlling; people who are financially rewarded for working on a task may feel that
they are doing so because of the tangible rewards, rather working on the task for its own sake.
Prior studies in the domain of Q&A have found contrasting results. Comparing answer quality on Google
Answers, a pay-for-answer service, to popular free Q&A services, Harper et al. found that higher pay
resulted in better answers (2008). However, another study by Chen et al. showed that while higher pay led
to longer answers (i.e., more effort) it did not result in better answers (2008). Chen et al. pointed out that
a major difference in these studies was the assessment of only the officially-selected answer, while other
studies assessed all answers. It is, therefore, possible that while paying more does not solicit a higher
quality single best answer, it may solicit a higher quantity of high quality answers. My work builds on
prior work by studying the impact of paying on answering effort (answer length) and answer quality in a
controlled field study and through a longitudinal study of a commercial Q&A site. The general hypothesis
is that paying does help.
H2. The market system will result in longer answers.
H3. The market system will have higher overall answer quality.
3.2.2 Design of mimir
mimir is a desktop application running on the users’ computers. It is designed to be similar to a chat
broadcast system such as AOL Instant Messenger (AIM), but it is designed specifically for the purpose of
Q&A. When users have a question, they can broadcast their questions to other users. This is similar to
Zephyr and IBM’s Communication Tools (Ackerman & Palen, 1996; Weisz et al., 2006). By default, all
incoming question will trigger a “toast” notification in the corner of the user’s screen, similar to an
incoming email notification.
All questions are presented in a list view in the main window of the application (Figure 3.2). When a user
clicks on a question in the list, a separate answer window appears to the right of the main window. In this
answer window, users can read selected question and the list of answers in reverse chronological order.
Each answer shows its respective answerer’s alias and the amount of time elapsed since it was posted.

36
Question askers are allowed to “answer” their own questions. This allows the askers to clarify or to add
additional information to the question. However, question askers are not allowed to select their own
answers as the “best answer.” In the version deployed, only the question asker could determine the best
answer, but it is easy to imagine extending a collaborative voting design to this interface. Once a “best
answer” is selected the question is marked as answered.
3.2.2.1 Baseline, No-Market Version (No Market System)
The baseline comparison condition is a no-market system with a simple top ten list. The top ten list
displays the aliases of the top ten users (who provided the highest number of best answers). The list is
viewable by clicking the “top 10” button in the main application window (Figure 3.2, Left). The top ten
list was included in the no-market baseline system because most existing Q&A systems, such as Live
QnA, have some sort of reputation system built-in.
3.2.2.2 Market-Based Version (Market System)
The experimental version was the market-based system, which used an artificial currency called mims.
When asking a question, the question asker attaches an escrow payment (in mims) to the question. By
default, the payment amount is set to 0 mim (Figure 3.3). During the experiment, participants in this
experimental condition were given $5 worth of tokens (20 mim) to begin, and the number of tokens they
had at the end of the study were converted into lunch coupons (4 mim = $1 lunch coupon), whereas the
no-market participants were told that they would receive a $5 lunch coupon at the end of the study for
installing and running the system.
Figure 3.2 Client windows for mimir: (Left) no-market system and (Right) market system
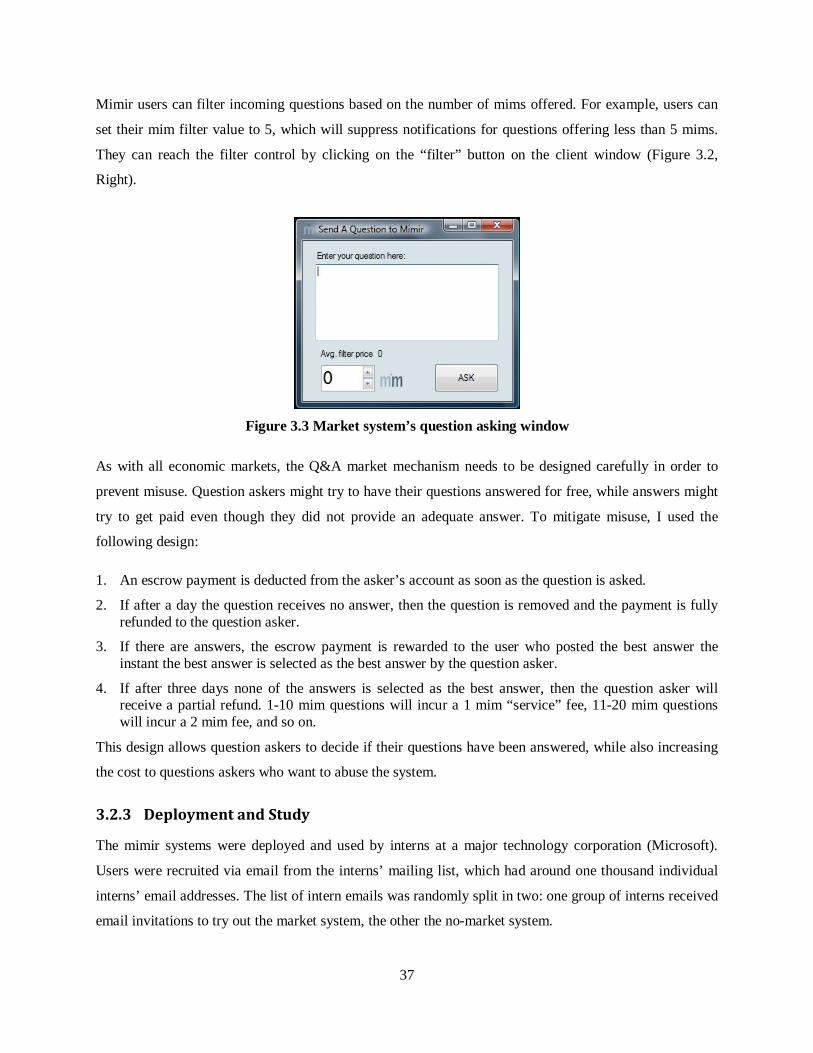
37
Mimir users can filter incoming questions based on the number of mims offered. For example, users can
set their mim filter value to 5, which will suppress notifications for questions offering less than 5 mims.
They can reach the filter control by clicking on the “filter” button on the client window (Figure 3.2,
Right).
As with all economic markets, the Q&A market mechanism needs to be designed carefully in order to
prevent misuse. Question askers might try to have their questions answered for free, while answers might
try to get paid even though they did not provide an adequate answer. To mitigate misuse, I used the
following design:
1. An escrow payment is deducted from the asker’s account as soon as the question is asked.
2. If after a day the question receives no answer, then the question is removed and the payment is fully refunded to the question asker.
3. If there are answers, the escrow payment is rewarded to the user who posted the best answer the instant the best answer is selected as the best answer by the question asker.
4. If after three days none of the answers is selected as the best answer, then the question asker will receive a partial refund. 1-10 mim questions will incur a 1 mim “service” fee, 11-20 mim questions will incur a 2 mim fee, and so on.
This design allows question askers to decide if their questions have been answered, while also increasing
the cost to questions askers who want to abuse the system.
3.2.3 Deployment and Study
The mimir systems were deployed and used by interns at a major technology corporation (Microsoft).
Users were recruited via email from the interns’ mailing list, which had around one thousand individual
interns’ email addresses. The list of intern emails was randomly split in two: one group of interns received
email invitations to try out the market system, the other the no-market system.
Figure 3.3 Market system’s question asking window

38
The usage period lasted for three weeks. To study overall usage and to analyze the questions and answers,
I recorded usage and content posted to mimir. To explore users’ perception of the system, at the end of
the second week of the study, I conducted a questionnaire asking users to rate general Q&A quality along
multiple dimensions, such as the importance of the questions asked, and whether or not they had found
mimir to be valuable. The questionnaire used a 5-point Likert scale, with 1 as strongly disagree, 3 as
neither disagree nor agree, and 5 as strongly agree.
In addition to the community generated questions and answers, I also submitted an identical set of
controlled questions to both systems in order to study answering behavior in a more controlled fashion.
Out of 60 answered questions randomly sampled from Live QnA I selected 24 questions to ask—eight
factual questions, eight advice questions, and eight opinion questions. I posted the questions to each
version of the system over the course of 5 days at the end of the study period. To make the questions
appear more natural, I varied the offered mim value on the controlled questions in the market condition,
based on the question difficulty. Five coders rated the questions on question difficulty (α=0.60); I then
used these ratings as general guidelines to select the offered mim values —low difficulty questions were
offered 0 or 1 mims, medium difficulty questions were offered 2 or 3 mims ,and high difficulty questions
were offered 4 or 5 mims. Alternatively, I could have chosen to randomize the mim values completely,
but if mim values had been randomly assigned, some hard questions would have low value while some
easy questions would have high value, which would have elicited unrealistic answering behavior.
In order to appear as though the test questions were coming from a variety of askers, I used ten different
aliases of real interns who were not participating in the study to post the questions (I obtained their
permission before posting the questions.) The questions were posted at random times during the day; the
same questions were posted to each system at the same time. I minimized the interaction with the two
mimir systems when using these aliases. I did, however, decide that it would be important to select the
best answers occasionally, as a typical user would. Since it is possible that the time when a best answer is
selected would impact the users’ answering behavior, I selected the best answers in the two systems at the
same time.
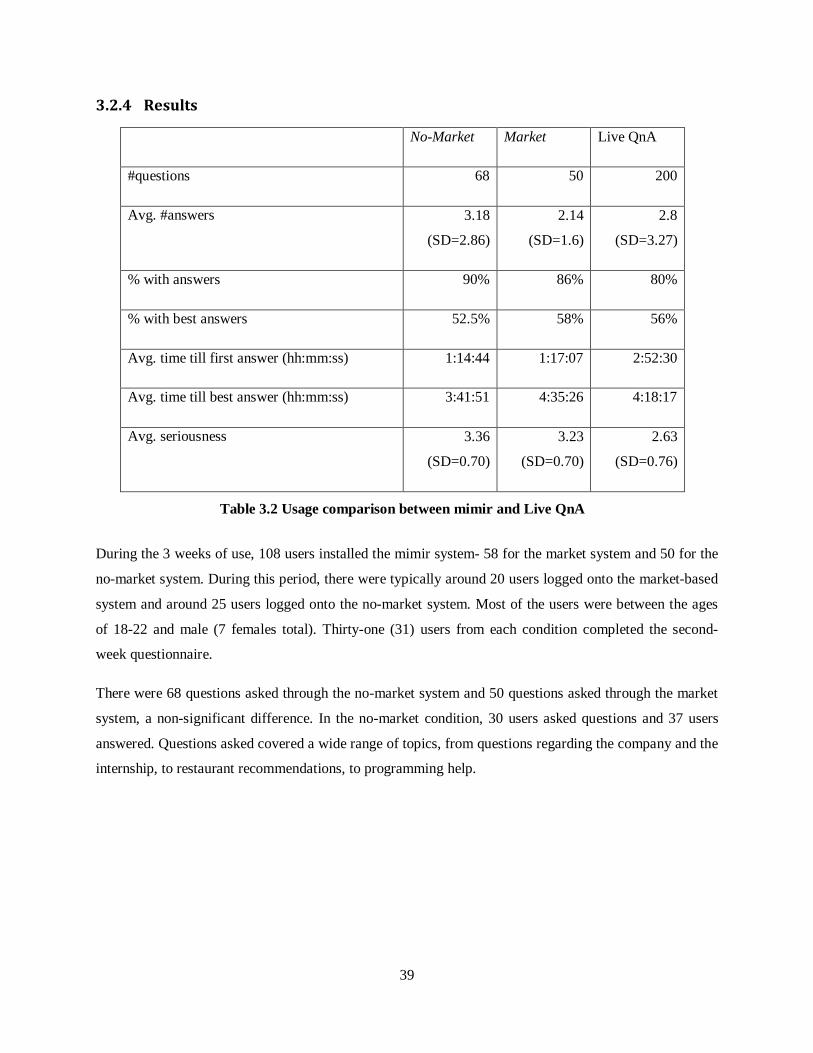
39
3.2.4 Results
During the 3 weeks of use, 108 users installed the mimir system- 58 for the market system and 50 for the
no-market system. During this period, there were typically around 20 users logged onto the market-based
system and around 25 users logged onto the no-market system. Most of the users were between the ages
of 18-22 and male (7 females total). Thirty-one (31) users from each condition completed the second-
week questionnaire.
There were 68 questions asked through the no-market system and 50 questions asked through the market
system, a non-significant difference. In the no-market condition, 30 users asked questions and 37 users
answered. Questions asked covered a wide range of topics, from questions regarding the company and the
internship, to restaurant recommendations, to programming help.
No-Market Market Live QnA
#questions 68 50 200
Avg. #answers 3.18
(SD=2.86)
2.14
(SD=1.6)
2.8
(SD=3.27)
% with answers 90% 86% 80%
% with best answers 52.5% 58% 56%
Avg. time till first answer (hh:mm:ss) 1:14:44 1:17:07 2:52:30
Avg. time till best answer (hh:mm:ss) 3:41:51 4:35:26 4:18:17
Avg. seriousness 3.36
(SD=0.70)
3.23
(SD=0.70)
2.63
(SD=0.76)
Table 3.2 Usage comparison between mimir and Live QnA
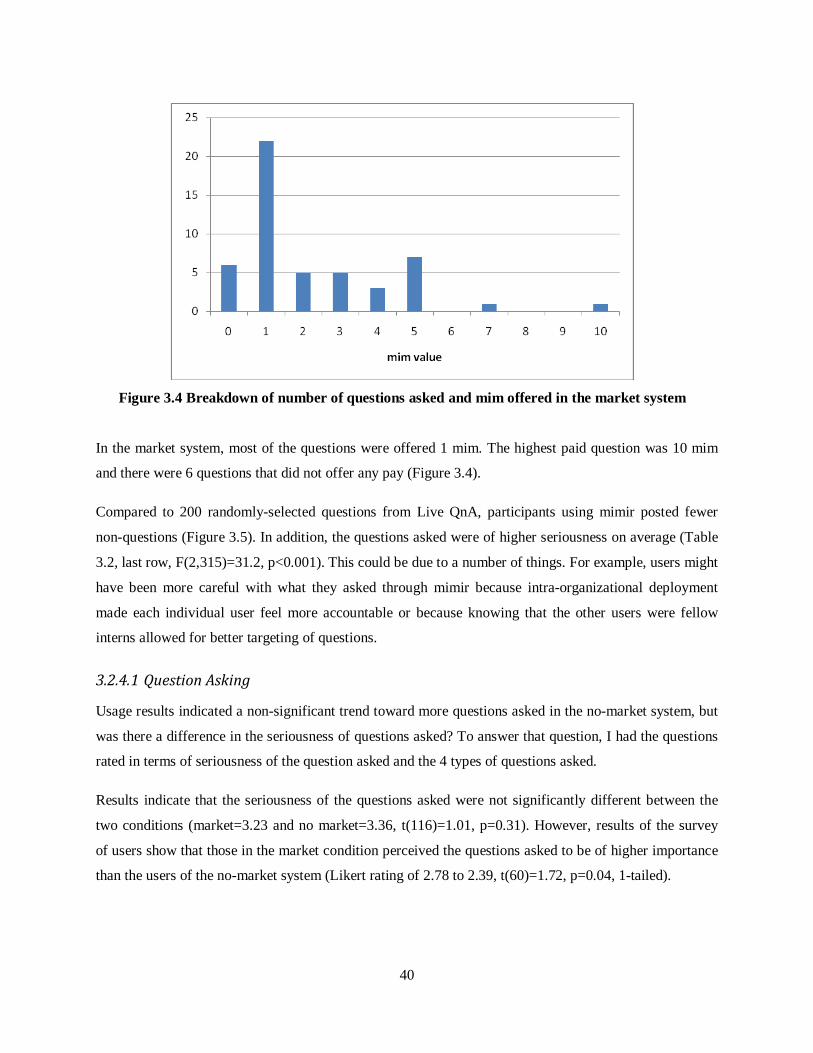
40
In the market system, most of the questions were offered 1 mim. The highest paid question was 10 mim
and there were 6 questions that did not offer any pay (Figure 3.4).
Compared to 200 randomly-selected questions from Live QnA, participants using mimir posted fewer
non-questions (Figure 3.5). In addition, the questions asked were of higher seriousness on average (Table
3.2, last row, F(2,315)=31.2, p<0.001). This could be due to a number of things. For example, users might
have been more careful with what they asked through mimir because intra-organizational deployment
made each individual user feel more accountable or because knowing that the other users were fellow
interns allowed for better targeting of questions.
3.2.4.1 Question Asking
Usage results indicated a non-significant trend toward more questions asked in the no-market system, but
was there a difference in the seriousness of questions asked? To answer that question, I had the questions
rated in terms of seriousness of the question asked and the 4 types of questions asked.
Results indicate that the seriousness of the questions asked were not significantly different between the
two conditions (market=3.23 and no market=3.36, t(116)=1.01, p=0.31). However, results of the survey
of users show that those in the market condition perceived the questions asked to be of higher importance
than the users of the no-market system (Likert rating of 2.78 to 2.39, t(60)=1.72, p=0.04, 1-tailed).
Figure 3.4 Breakdown of number of questions asked and mim offered in the market system
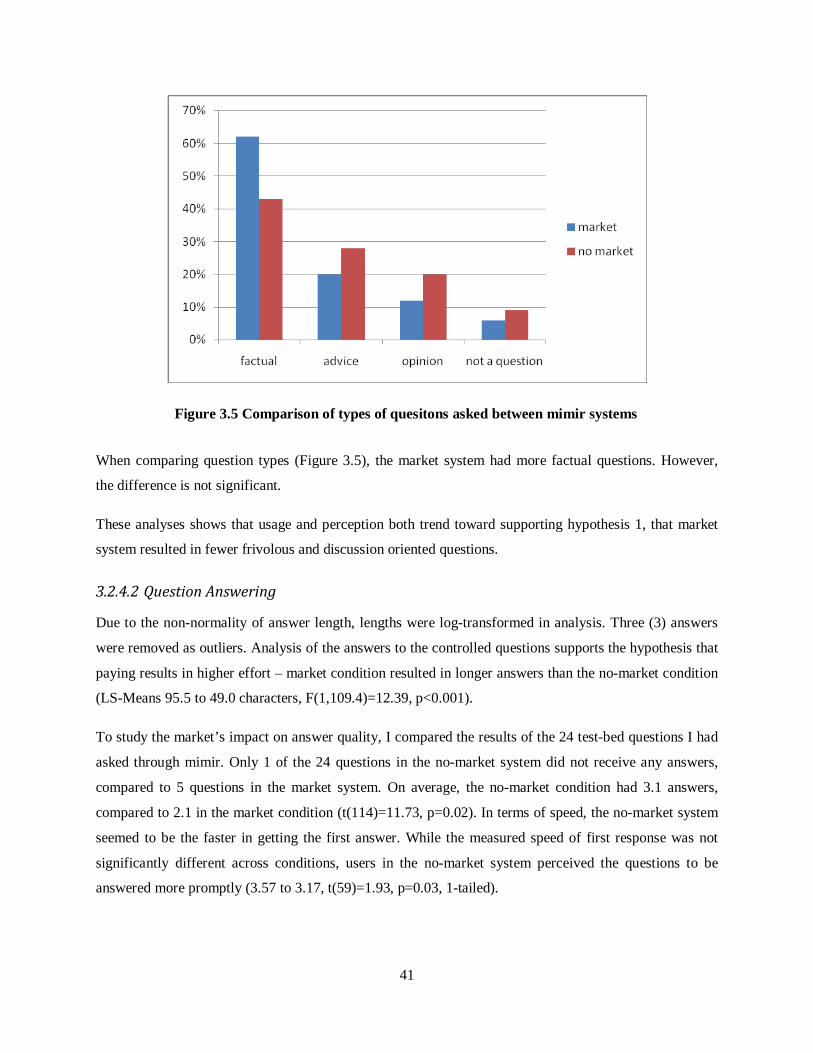
41
When comparing question types (Figure 3.5), the market system had more factual questions. However,
the difference is not significant.
These analyses shows that usage and perception both trend toward supporting hypothesis 1, that market
system resulted in fewer frivolous and discussion oriented questions.
3.2.4.2 Question Answering
Due to the non-normality of answer length, lengths were log-transformed in analysis. Three (3) answers
were removed as outliers. Analysis of the answers to the controlled questions supports the hypothesis that
paying results in higher effort – market condition resulted in longer answers than the no-market condition
(LS-Means 95.5 to 49.0 characters, F(1,109.4)=12.39, p<0.001).
To study the market’s impact on answer quality, I compared the results of the 24 test-bed questions I had
asked through mimir. Only 1 of the 24 questions in the no-market system did not receive any answers,
compared to 5 questions in the market system. On average, the no-market condition had 3.1 answers,
compared to 2.1 in the market condition (t(114)=11.73, p=0.02). In terms of speed, the no-market system
seemed to be the faster in getting the first answer. While the measured speed of first response was not
significantly different across conditions, users in the no-market system perceived the questions to be
answered more promptly (3.57 to 3.17, t(59)=1.93, p=0.03, 1-tailed).
Figure 3.5 Comparison of types of quesitons asked between mimir systems

42
To address answer quality, eight individual coders were presented with the 24 test-bed questions and all
the corresponding answers that were given on Live QnA, as well as the no-market and market systems in
a random order across conditions. The coders were asked to rate the answer as either “not an answer,” or
to use a 1 to 5 Likert scale, where 1 is extremely poor, 3 is average and 5 is excellent. I removed the
answers that were not answers, and then took the median from the coders’ ratings and compared the
answer quality across conditions. Inter-rater reliability was very good (α=0.90).
The results showed that there was a significant difference in answer quality rating. Specifically, the
answer quality in the market system M=3.52) was significantly higher than that of the no-market system
(M=2.93; F(1,207)=11.75, p=0.001). If we look at the breakdown of number of answers by quality rating
(Figure 3.6), we see that higher percentage of the answers in the market condition were above average.
This point is further supported by examining the questions that had an answer in the no-market system,
but did not receive and answer in the market system. One example, taken from our 24 test-bed questions,
is, “Why didn't Daniel Negreanu play very well in 2005?” Daniel Negreanu is a professional poker
player. To answer this question, one would either (1) spend some time researching or (2) actually follow
the professional poker tours in general and Daniel Negreanu’s game specifically. In our market condition,
no answers were given. However, in the no-market condition, within two minutes an answer, the only
answer to the question, was received. The answer, “lol donkaments,” was clearly not helpful and was
rated by our coders as “not an answer.” This goes to show that while questions may be responded to more
quickly in the no-market condition, it did not necessarily help by actually answering the question.
Figure 3.6 Number of answers by quality rating, between mimir systems
43
3.2.5 Discussion
Findings suggest that the market and the no-market systems provided different types of value to Q&A.
The market system, as I had hypothesized, was better able to screen out non-serious questions. It also was
able to reduce the number of low-quality answers. The no-market system, on the other hand, had more
usage: more questions and more answers per question.
By introducing monetary or token-based payments, Q&A becomes a more serious question and answering
service. It becomes less like asking a friend and more like paying for professional help, and this changes
how the system is used. Even though question askers could ask 0 mim questions, most of them did not do
so; instead, they focused on more serious, work-related questions and on factual questions that were more
likely to be answered. As one user put it most succinctly, “it [the market] makes me not want to ask
stupid questions.”
3.2.5.1 Practical Contributions
Just how can a designer build a successful real-time market, then? The discussion below will focus on
how to improve market design based on user feedback.
Users in the market system thought that the market condition was an interesting addition to a Q&A
system and that it could provide added incentives. It was not clear whether the market condition offered
more incentives than a good reputation system, but perhaps it provided incentives to a different group of
users who are extrinsically motivated.
A number of questions arose regarding the payment mechanism. Several participants asked whether it
was possible to split the offered payment to award multiple answerers, since many questions elicit more
than one worthy answer. In fact, during the study, one user actually asked an additional identical question
after receiving answers just so he could pay two answerers who had both provided good answers. Another
user suggested allowing other users to add additional payments to an existing unanswered question if they
also have the same question. Still others have suggested allowing users to place time-based payments. For
example, if the question is answered within a certain time, the user will pay more. While I did not have
time to explore these payment designs, I gladly acknowledge them and other promising variations to
explore in future work.
Given our findings that markets negatively impact the Q&A community, what can we do? One possibility
is to allow two different classes of questions in a Q&A system. One type can be opinion questions, while
another can be factual and advice questions that will require an escrow payment. This differentiation can
allow the socially conducive questions to co-exist with more serious questions that are important and
44
urgent. Reputation can be created for people in both groups: the best opinion posters and the best question
answerers. Users who are only interested in one kind of usage can focus easily on the type of questions
that are of more interest to them.
Another possibility is to remove the monetary incentives altogether and instead use tokens without money
or extrinsic goods attached to them. This could work well within an organization where the users can be
held accountable for their actions. In that case, the token market can still be used for signals and filtering
as social and corporate norms will prevent individuals from exploiting the token system. Earning tokens
can be viewed as a fun intra-corporate activity, as opposed to a professional one. An example of this type
of token system for communication is Attent built by Seriosity, which was shown to help its users to
prioritize email exchanges (Reeves et al., 2008).
3.2.6 Limitations and Generalizability
While this study was able to improve our understanding of markets for information exchange, due to the
limitations in study duration and population size, a follow-up study is needed to understand, fully, the
market’s impact on Q&A in a real-world setting.
3.3 Longitudinal Study of Mahalo Answers
To improve our understanding of how markets impact Q&A, I conducted a longitudinal research on
Mahalo Answers, a new pay-for-answers Q&A site. This allowed me to examine the impact of markets on
Q&A over a longer period of time using a much larger population. In this longitudinal study, I introduce
additional hypotheses to examine and, at the same time, re-examine some hypotheses from the previous
study.
3.3.1 Hypotheses
3.3.1.1 Question Asking
In the mimir work, I found that question askers are influenced by the market system and they are less
likely to ask frivolous questions when they have to pay. However, it is unclear why that is. I had
hypothesized that result, believing that people are making a cost-benefit analysis and that the frivolous
questions are, in general, less valuable. However, it could also be that people find it inappropriate to ask
these frivolous question when they are paying. To what extent is the decision determined by the
economics, and to what extent is it determined by social expectations?

45
In this study, instead of using a single metric of seriousness to represent question value, I focus on metrics
of importance, urgency, and difficulty to approximate the question value. In general, one would expect
factors such as importance (seriousness from the previous study, or how much the asker really wanted an
answer), urgency, and difficulty (how hard it is to acquire the answers) to influence askers’ valuation.
These factors have been shown to affect people’s communication valuation (Dabbish, 2006).
H1. People are more likely to pay for answers to questions that are more valuable —important,
urgent, and difficult to answer.
H2. People offer higher rewards for answers to questions that are more valuable —important, urgent,
and difficult to answer.
Aside from benefits and costs, decisions to pay or not pay may also be influenced by existing social
norms. Prior work has suggested that there are two types of social interactions — exchange and
communal (Clark & Mills, 1993) — and that monetary rewards may be perceived as violation of norms
when used in communal interactions (Clark & Mills, 1993; Aggarwal, 2004). For example, paying for
dinner is expected at a restaurant, but may be insulting when eating a home-cooked meal. This suggests
that if askers’ goals are to acquire commodities (i.e., information), then they may be more willing to pay.
However, if the goals are mainly social in nature (e.g., conversational), then askers may think it is
inappropriate to pay.
Research has classified Q&A questions into categories: factual, advice, opinion, and non-questions
(Harper et al., 2008). Factual questions seek objective data, or pointers to content; advice questions seek
recommendations on an asker’s individual situation; opinion questions seek others’ thoughts on a topic of
general interest; and non-questions are general discussion posts or spam. Factual and advice questions are
informational questions, while opinion questions are categorized as conversational questions — their goal
is to stimulate a discussion (Harper et al., 2009).
Using this classification for questions, if users follow existing social norms when using the payment
system, we would expect question askers to be more willing to pay for informational questions, which
seek facts and advice, than for conversational questions.
H3. People are more likely to pay for answers to questions seeking information than for questions
initiating conversations.
3.3.1.2 Question Answering
Using Mahalo Answers, I re-examined the effects of paying on answer length and quality.

46
H4. The market system results in longer answers.
H5. The market system will have higher overall answer quality.
I also examine the effects of paying on the number of answers. Do higher-paid questions attract more
answerers? Is it worth it to pay more?
H6. The market system results in more answers.
3.3.2 Mahalo Answers
To examine the impact of financial incentives on Q&A, I conducted a study of Mahalo Answers. Mahalo
Answers is a pay-for-answers Q&A site, launched on December 15, 2008. According to Mahalo Answers,
by mid-February 2009, the site had about 15,000-25,000 visitors per day.
Google Answers will be used as a comparison point in this paper since it has been the most often studied
pay-for-answer Q&A site (Chen & Ho, 2008; Edelman, 2004; Harper et al., 2008; Rafaeli et al., 2007).
There are two major differences between these two sites. First, Google Answers used a set of
“researchers” chosen by Google to answer questions, whereas anyone who joins Mahalo Answers can
answer questions and earn the financial rewards. Second, Mahalo Answers allows both free and paid
questions, while Google Answers only allowed paid questions. This enables us to compare the usage
differences when the questions are paid versus when they are not paid, which was not feasible in prior
studies of Google Answers.
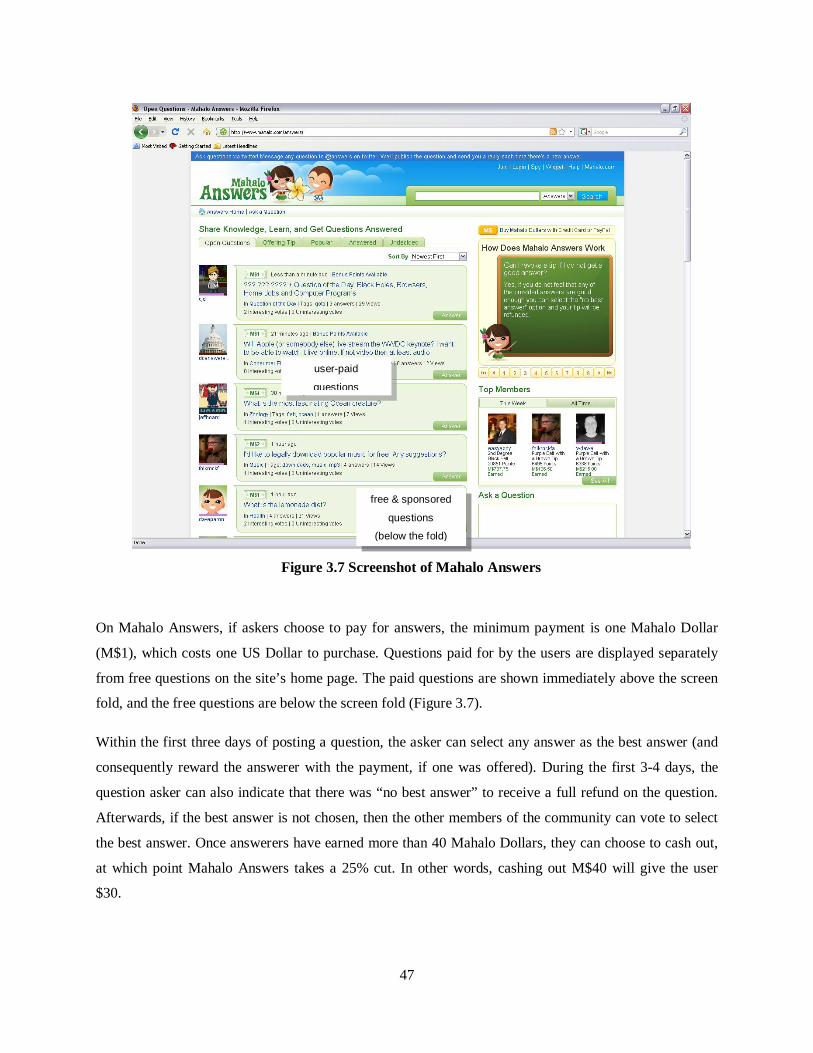
47
On Mahalo Answers, if askers choose to pay for answers, the minimum payment is one Mahalo Dollar
(M$1), which costs one US Dollar to purchase. Questions paid for by the users are displayed separately
from free questions on the site’s home page. The paid questions are shown immediately above the screen
fold, and the free questions are below the screen fold (Figure 3.7).
Within the first three days of posting a question, the asker can select any answer as the best answer (and
consequently reward the answerer with the payment, if one was offered). During the first 3-4 days, the
question asker can also indicate that there was “no best answer” to receive a full refund on the question.
Afterwards, if the best answer is not chosen, then the other members of the community can vote to select
the best answer. Once answerers have earned more than 40 Mahalo Dollars, they can choose to cash out,
at which point Mahalo Answers takes a 25% cut. In other words, cashing out M$40 will give the user
$30.
Figure 3.7 Screenshot of Mahalo Answers
user-paid
questions
free & sponsored
questions
(below the fold)

48
Each answerer can only give one answer per question, but there can be multiple answerers per question. If
an answerer’s answer is selected as the best one, the question asker can choose to rate it on a 5 point
scale, where 3 is “good” and 5 is “above and beyond.”
There were two major changes to Mahalo Answers during our data collection. First, around February 20,
Mahalo Answers started sponsoring, or paying for, the free questions posted on the site as an effort to
increase site traffic. These sponsored questions are still posted to the same place as the free questions.
Mahalo sponsored M$0.25 per question initially, but the value varied over time. Even though Mahalo
Answers automatically sponsored the questions when they were received, Mahalo Answers removed the
sponsored payments at their discretion. The second major change was that around February 24, Mahalo
Answers started accepting questions asked through Twitter. Additionally, Mahalo Answers started
actively pulling in questions that were not intended for Mahalo Answers from public Twitter accounts.
To account for these changes, in one of my analyses on question-asking decisions, I removed questions
posted after February 20 so that I could focus on usage without the influence of company sponsorship,
and also to ensure that questions were intentionally asked by askers.
3.3.3 Data Collection
I contacted Mahalo Answers for their data. While they stated their intent to offer a public API or make
their data available, this did not occur. So instead, I wrote a Java program to gather the questions and
answers posted on Mahalo Answers. Due to site moderation, I was unable to gather some posted
questions that had been deleted. Also, while Mahalo Answers allows users to ask each other direct,
private questions, I was constrained to only the public questions. I was able to gather a total of 22,205
public questions and 71,091 answers posted on Mahalo Answers between Dec. 04, 2008 and May 05,
2009. For analyses, I removed all posts posted before December 15, 2008, before the site was launched
publicly. I also removed all posts after April 27, 2009 to ensure that I analyzed only questions that were
closed to any new answers.
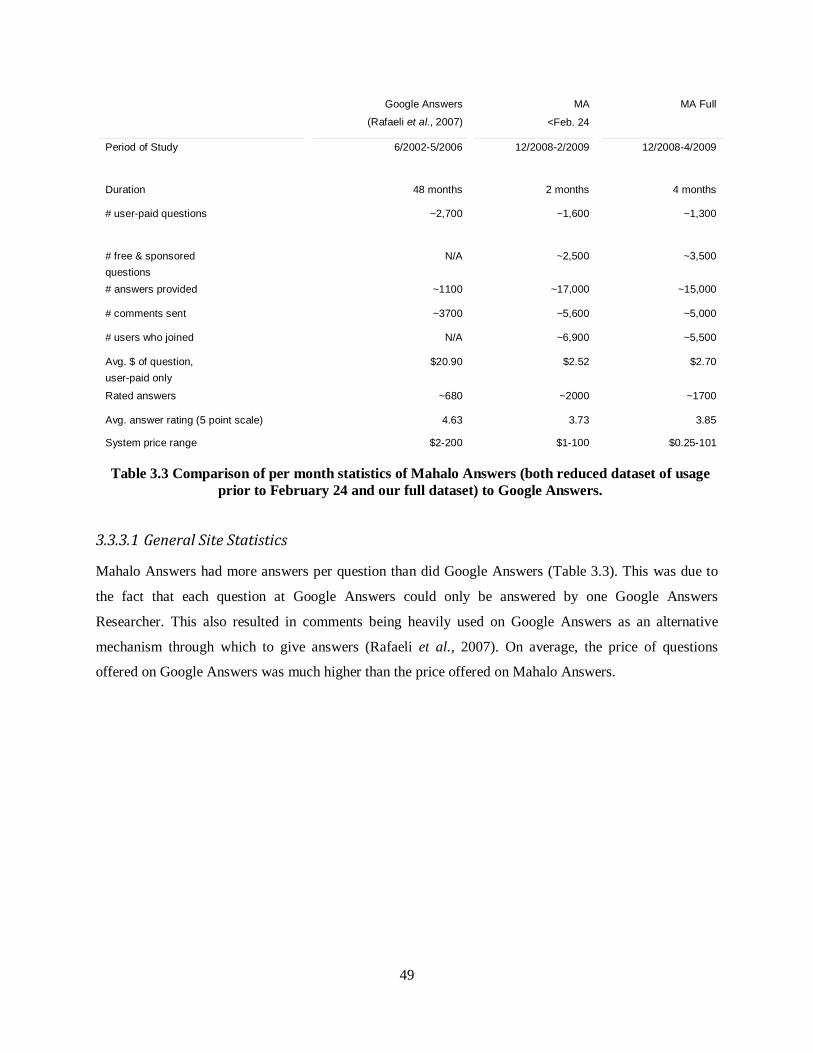
49
3.3.3.1 General Site Statistics
Mahalo Answers had more answers per question than did Google Answers (Table 3.3). This was due to
the fact that each question at Google Answers could only be answered by one Google Answers
Researcher. This also resulted in comments being heavily used on Google Answers as an alternative
mechanism through which to give answers (Rafaeli et al., 2007). On average, the price of questions
offered on Google Answers was much higher than the price offered on Mahalo Answers.
Google Answers
(Rafaeli et al., 2007)
MA
<Feb. 24
MA Full
Period of Study 6/2002-5/2006 12/2008-2/2009 12/2008-4/2009
Duration 48 months 2 months 4 months
# user-paid questions ~2,700 ~1,600 ~1,300
# free & sponsored questions
N/A ~2,500 ~3,500
# answers provided ~1100 ~17,000 ~15,000
# comments sent ~3700 ~5,600 ~5,000
# users who joined N/A ~6,900 ~5,500
Avg. $ of question, user-paid only
$20.90 $2.52 $2.70
Rated answers ~680 ~2000 ~1700
Avg. answer rating (5 point scale) 4.63 3.73 3.85
System price range $2-200 $1-100 $0.25-101
Table 3.3 Comparison of per month statistics of Mahalo Answers (both reduced dataset of usage prior to February 24 and our full dataset) to Google Answers.
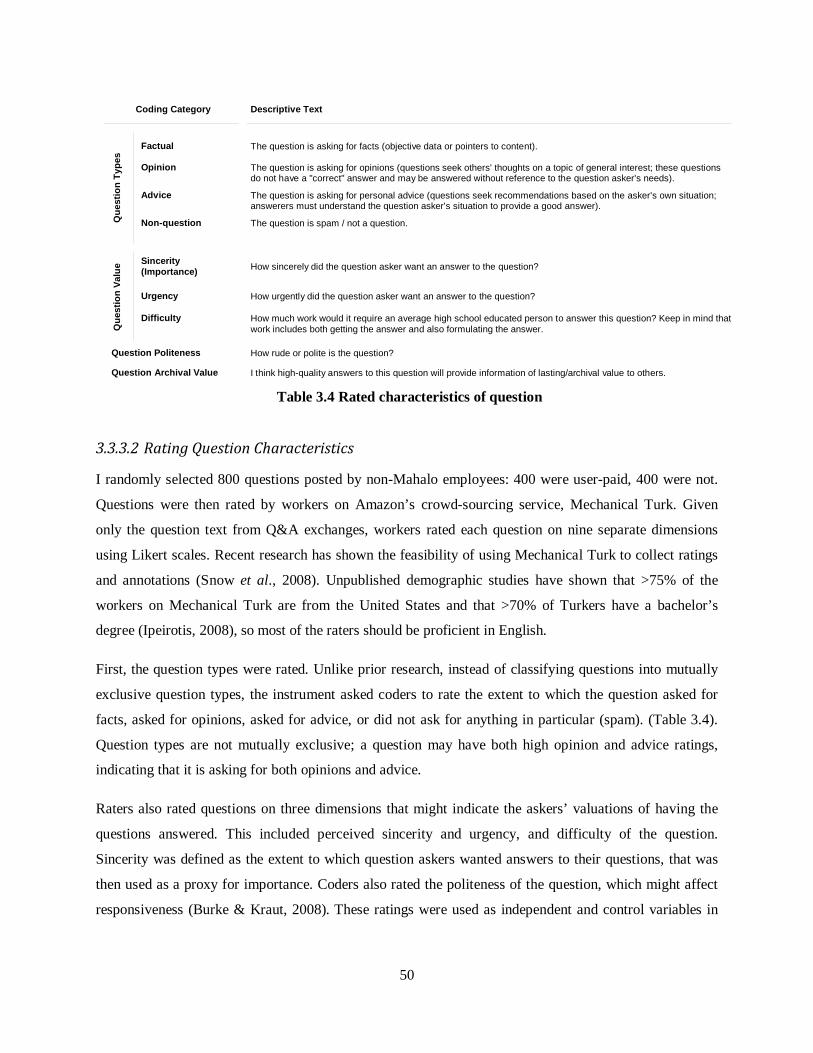
50
3.3.3.2 Rating Question Characteristics
I randomly selected 800 questions posted by non-Mahalo employees: 400 were user-paid, 400 were not.
Questions were then rated by workers on Amazon’s crowd-sourcing service, Mechanical Turk. Given
only the question text from Q&A exchanges, workers rated each question on nine separate dimensions
using Likert scales. Recent research has shown the feasibility of using Mechanical Turk to collect ratings
and annotations (Snow et al., 2008). Unpublished demographic studies have shown that >75% of the
workers on Mechanical Turk are from the United States and that >70% of Turkers have a bachelor’s
degree (Ipeirotis, 2008), so most of the raters should be proficient in English.
First, the question types were rated. Unlike prior research, instead of classifying questions into mutually
exclusive question types, the instrument asked coders to rate the extent to which the question asked for
facts, asked for opinions, asked for advice, or did not ask for anything in particular (spam). (Table 3.4).
Question types are not mutually exclusive; a question may have both high opinion and advice ratings,
indicating that it is asking for both opinions and advice.
Raters also rated questions on three dimensions that might indicate the askers’ valuations of having the
questions answered. This included perceived sincerity and urgency, and difficulty of the question.
Sincerity was defined as the extent to which question askers wanted answers to their questions, that was
then used as a proxy for importance. Coders also rated the politeness of the question, which might affect
responsiveness (Burke & Kraut, 2008). These ratings were used as independent and control variables in
Coding Category Descriptive Text
Que
stio
n Ty
pes
Factual The question is asking for facts (objective data or pointers to content).
Opinion The question is asking for opinions (questions seek others' thoughts on a topic of general interest; these questions do not have a "correct" answer and may be answered without reference to the question asker's needs).
Advice The question is asking for personal advice (questions seek recommendations based on the asker's own situation; answerers must understand the question asker's situation to provide a good answer).
Non-question The question is spam / not a question.
Que
stio
n Va
lue Sincerity
(Importance) How sincerely did the question asker want an answer to the question?
Urgency How urgently did the question asker want an answer to the question?
Difficulty How much work would it require an average high school educated person to answer this question? Keep in mind that work includes both getting the answer and also formulating the answer.
Question Politeness How rude or polite is the question?
Question Archival Value I think high-quality answers to this question will provide information of lasting/archival value to others.
Table 3.4 Rated characteristics of question
51
data analyses. Finally, coders rated the questions on an outcome measure: archival value. Questions with
higher archival values can improve the usefulness of the Q&A repository.
To improve the quality of the ratings, coders who gave ratings with very low variance, used noticeable
patterns, or did not spend enough time determining ratings (<20 seconds per question) were removed.
After this filtering process, there were 401 raters and each rated 19 questions on average. The ratings
were standardized per rater (z-score) by subtracting the rater’s mean ratings determined by the rater’s
standard deviation. When standardized, 0 means an average rating, +1 means a rating that is one standard
deviation above the average, and -1 means a rating that is one standard deviation below the average. The
final dataset had, on average, 9.4 ratings per question. To check the reliability of the ratings, intraclass
correlation reliabilities were calculated, which indicated what proportion of the variance was associated
with questions and not with the judges. The general rule of thumb is that ICC = 0.40 to 0.59 is moderate,
0.60 to 0.79 is substantial and 0.80 is outstanding (Landis & Koch, 1977). Most of our ratings had an
intraclass correlation of around 0.60, except for the “not a question” and politeness ratings (Table 3.5, last
row).
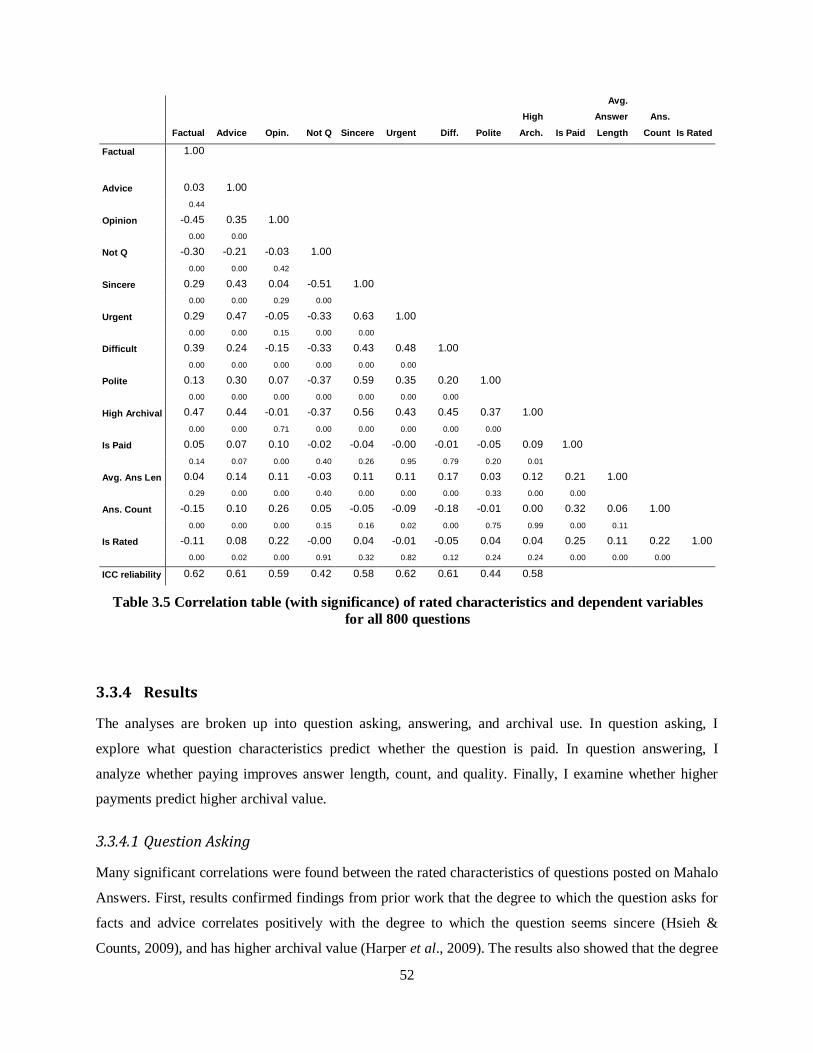
52
3.3.4 Results
The analyses are broken up into question asking, answering, and archival use. In question asking, I
explore what question characteristics predict whether the question is paid. In question answering, I
analyze whether paying improves answer length, count, and quality. Finally, I examine whether higher
payments predict higher archival value.
3.3.4.1 Question Asking
Many significant correlations were found between the rated characteristics of questions posted on Mahalo
Answers. First, results confirmed findings from prior work that the degree to which the question asks for
facts and advice correlates positively with the degree to which the question seems sincere (Hsieh &
Counts, 2009), and has higher archival value (Harper et al., 2009). The results also showed that the degree
Factual Advice Opin. Not Q Sincere Urgent Diff. Polite
High
Arch. Is Paid
Avg. Answer
Length
Ans.
Count Is Rated
Factual 1.00
Advice 0.03 1.00 0.44
Opinion -0.45 0.35 1.00 0.00 0.00
Not Q -0.30 -0.21 -0.03 1.00 0.00 0.00 0.42
Sincere 0.29 0.43 0.04 -0.51 1.00 0.00 0.00 0.29 0.00
Urgent 0.29 0.47 -0.05 -0.33 0.63 1.00 0.00 0.00 0.15 0.00 0.00
Difficult 0.39 0.24 -0.15 -0.33 0.43 0.48 1.00 0.00 0.00 0.00 0.00 0.00 0.00
Polite 0.13 0.30 0.07 -0.37 0.59 0.35 0.20 1.00 0.00 0.00 0.00 0.00 0.00 0.00 0.00
High Archival 0.47 0.44 -0.01 -0.37 0.56 0.43 0.45 0.37 1.00 0.00 0.00 0.71 0.00 0.00 0.00 0.00 0.00
Is Paid 0.05 0.07 0.10 -0.02 -0.04 -0.00 -0.01 -0.05 0.09 1.00 0.14 0.07 0.00 0.40 0.26 0.95 0.79 0.20 0.01
Avg. Ans Len 0.04 0.14 0.11 -0.03 0.11 0.11 0.17 0.03 0.12 0.21 1.00 0.29 0.00 0.00 0.40 0.00 0.00 0.00 0.33 0.00 0.00
Ans. Count -0.15 0.10 0.26 0.05 -0.05 -0.09 -0.18 -0.01 0.00 0.32 0.06 1.00 0.00 0.00 0.00 0.15 0.16 0.02 0.00 0.75 0.99 0.00 0.11
Is Rated -0.11 0.08 0.22 -0.00 0.04 -0.01 -0.05 0.04 0.04 0.25 0.11 0.22 1.00 0.00 0.02 0.00 0.91 0.32 0.82 0.12 0.24 0.24 0.00 0.00 0.00
ICC reliability 0.62 0.61 0.59 0.42 0.58 0.62 0.61 0.44 0.58
Table 3.5 Correlation table (with significance) of rated characteristics and dependent variables for all 800 questions

53
to which the question asks for facts and advice correlates positively with degree of perceived question
urgency and difficulty, but that the opinion nature of the question does not. Furthermore, while factual
and opinion ratings were negatively correlated, advice and opinion ratings were actually positively
correlated (Table 3.5).
To test which question characteristics predict whether a question is paid, a random-effects logistic-
regression model was built (using STATA’s xtlogit command). The dependent variable is whether the
question is paid or not (binary). The question asker is modeled as a random effect and the independent
variables are the four ratings of question types, and value-characteristics of sincerity, urgency, and
difficulty. Two control variables are included: the number of other questions the asker asked previously
(log transformed1
As mentioned previously, I used the set of questions posted before February 20 for this analysis (333
questions: 205 paid, 128 free). This way, I could examine askers’ decisions without the influence of site
sponsorship, and ensure that askers intentionally posted to Mahalo Answers.
) and the amount of Mahalo Dollars the asker had earned through answering (log).
These variables are included because askers’ usage of the system may change over time, especially if they
have learned how valuable help on the site may be, or if they have already earned credits that can be used
to pay for answers.
1 Logarithmic normalization used in our analyses is base 10, after adding a base value of 1
Is Paid 0=free, 1=paid
n=333
Model
Mean SD Odds Ratio† SE Factual -0.04 0.47 5.19*** 3.99
Opinion 0.03 0.44 1.17*** 0.88
Advice -0.01 0.48 3.67*** 3.06
Not Question 0.02 0.38 0.57*** 0.46
Sincerity -0.03 0.48 0.43*** 0.38
Urgency -0.03 0.50 3.38*** 3.01
Difficulty -0.03 0.50 0.24*** 0.20 Prior Q. (log) 1.48 1.40 2.07*** 0.78 Prior Earn (log) 0.84 1.56 2.07*** 0.85
* p < 0.05
Table 3.6 Random-effects logistic regression model predicting “is paid” (H1 & H3), using questions posted before February 20 (n=333)
†Odds ratio is a measure of effect size. It indicates how a unit increase in a variable affects the likelihood of the question being paid, holding all others factors constant.
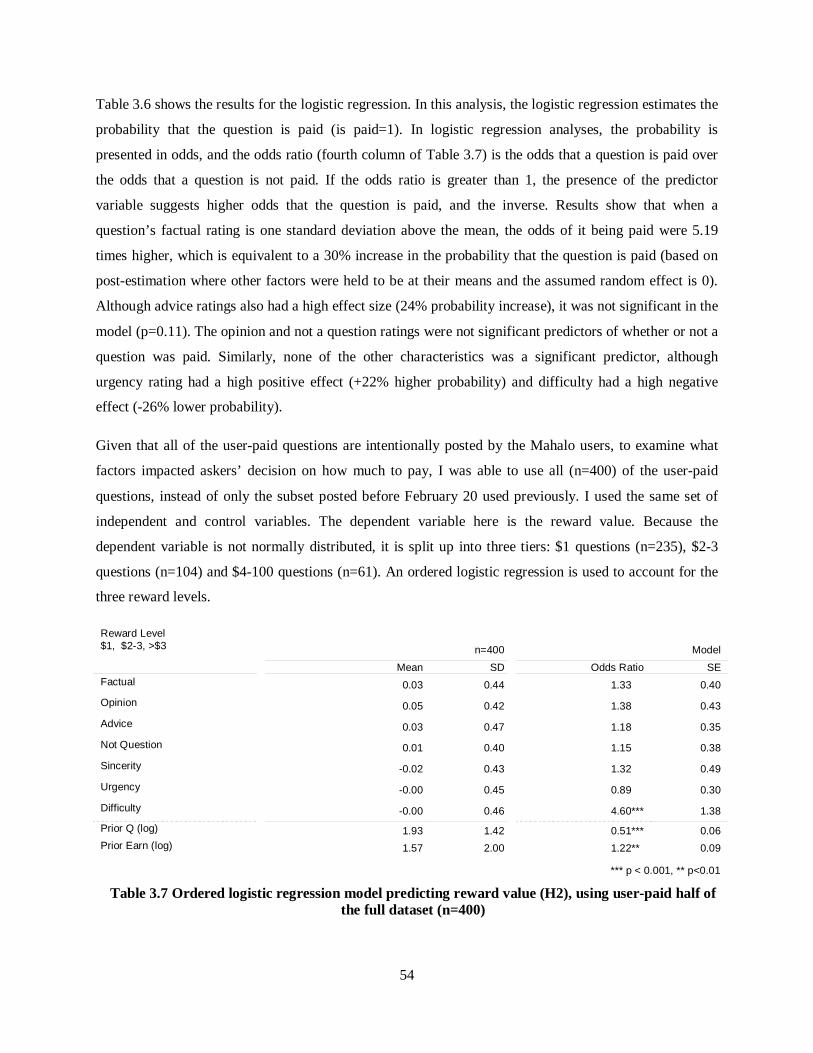
54
Table 3.6 shows the results for the logistic regression. In this analysis, the logistic regression estimates the
probability that the question is paid (is paid=1). In logistic regression analyses, the probability is
presented in odds, and the odds ratio (fourth column of Table 3.7) is the odds that a question is paid over
the odds that a question is not paid. If the odds ratio is greater than 1, the presence of the predictor
variable suggests higher odds that the question is paid, and the inverse. Results show that when a
question’s factual rating is one standard deviation above the mean, the odds of it being paid were 5.19
times higher, which is equivalent to a 30% increase in the probability that the question is paid (based on
post-estimation where other factors were held to be at their means and the assumed random effect is 0).
Although advice ratings also had a high effect size (24% probability increase), it was not significant in the
model (p=0.11). The opinion and not a question ratings were not significant predictors of whether or not a
question was paid. Similarly, none of the other characteristics was a significant predictor, although
urgency rating had a high positive effect (+22% higher probability) and difficulty had a high negative
effect (-26% lower probability).
Given that all of the user-paid questions are intentionally posted by the Mahalo users, to examine what
factors impacted askers’ decision on how much to pay, I was able to use all (n=400) of the user-paid
questions, instead of only the subset posted before February 20 used previously. I used the same set of
independent and control variables. The dependent variable here is the reward value. Because the
dependent variable is not normally distributed, it is split up into three tiers: $1 questions (n=235), $2-3
questions (n=104) and $4-100 questions (n=61). An ordered logistic regression is used to account for the
three reward levels.
Reward Level $1, $2-3, >$3
n=400
Model
Mean SD Odds Ratio SE Factual 0.03 0.44 1.33*** 0.40
Opinion 0.05 0.42 1.38*** 0.43
Advice 0.03 0.47 1.18*** 0.35
Not Question 0.01 0.40 1.15*** 0.38
Sincerity -0.02 0.43 1.32*** 0.49
Urgency -0.00 0.45 0.89*** 0.30
Difficulty -0.00 0.46 4.60*** 1.38 Prior Q (log) 1.93 1.42 0.51*** 0.06 Prior Earn (log) 1.57 2.00 1.22*** 0.09
*** p < 0.001, ** p<0.01
Table 3.7 Ordered logistic regression model predicting reward value (H2), using user-paid half of the full dataset (n=400)

55
Table 3.7 shows that the only significant predictor of reward value (besides the control variables) is the
question difficulty — the more difficult the question, the higher the pay. Recall that, interestingly,
difficulty was not predictive of whether or not a question was paid. This supports the general intuition
that the pay decision is two-staged, and that there are different factors influencing the decisions in each
stage. This is addressed in more detail in the discussion.
3.3.4.2 Question Answering
In general, paid questions had more answers than free questions (4.2 : 2.2 answers), but this might be
because paid questions were immediately visible on the homepage of Mahalo Answers, while free
questions were not (Figure 3.7). Therefore, instead of comparing the answers of paid and free sections, I
focus on how the increase in reward price affects answers. Since there were no significant interface
changes to the paid section of the site during the data collection period, I used the full set of paid
questions (400) and their answers for the following analyses.
All of the models in this section use the same set of independent and control variables. The independent
variable is the question-reward, broken down into three tiers ($1, $2-3, $4-$100). The control variables
include the types of questions asked, sincerity, difficulty, and politeness. All are question characteristics
that might impact answerers’ decision to respond. These models also all use question asker as a random
effect.
Average Answer Length (log) n=399†
Model
Mean SD Coef. SE Reward ($2-3) n=104 0.22*** 0.09
Reward (>$3) n=61 0.25*** 0.11
Factual 0.00 0.47 0.17*** 0.10
Opinion 0.03 0.44 0.33*** 0.10
Advice 0.01 0.47 0.04*** 0.10
Not Question 0.02 0.40 0.04*** 0.11
Sincerity -0.02 0.44 0.31*** 0.13
Difficulty -0.01 0.46 0.14*** 0.10
Urgency -0.00 0.45 -0.06*** 0.12
Politeness -0.02 0.37 -0.19*** 0.12
** p < 0.01, *p < 0.05
Table 3.8 Random-effects regression model predicting logged average answer length (H4), using user-paid half of the full dataset (n=400)
†One of the questions did not have any answers, making it an outlier in the analysis. This question was removed.

56
First, I will explore how question-reward affects answer length. Due to the non-normality of average
answer length, a log transformation was applied. Table 3.8 Random-effects regression model predicting
logged average answer length (H4), using user-paid half of the full dataset (n=400) shows that $2 or more
questions elicit 22%-25% longer answers (on the logged length) than $1 questions. However, the
improvement between middle and high tiers is not significant. The model also showed that both opinion
and sincerity ratings correlated positively with longer answers (Table 3.8).
I then explored the effects of financial rewards on answer count. Two dependent variables were used: the
total number of answers to the question and the number of answers from “star” answerers (defined as
those with average asker-rating above the median, i.e. above 3.66 out of 5). Negative binominal
regressions were used for both of these models and the effects were similar (using STATA’s xtnbreg
command). Table 3.9 shows that middle-tiered rewards did not increase the number of answers a question
received compared to the baseline $1 rewards, although high-tiered rewards (>$3) did. High-reward
questions had 1.25 times more answers than baseline questions and also 1.33 times more answers from
“star” answerers. Control variables show that opinion questions in general got both more answers and
more answers from “star” answerers, while more difficult questions got fewer answers (no significant
impact on number of answers from “star” answerers).
Answer Count n=400 All (μ=4.2)
n=400 Star (μ=3.0)
IRR† SE IRR SE Reward ($2-3) 1.00*** 0.09 0.92*** 0.08
Reward (>$3) 1.25*** 0.14 1.33*** 0.15
Factual 0.93*** 0.09 0.88*** 0.08
Opinion 1.38*** 0.14 1.50*** 0.16
Advice 1.18*** 0.11 1.04*** 0.11
Not Question 1.08*** 0.11 1.08*** 0.12
Sincerity 1.02*** 0.13 0.98*** 0.13
Difficulty 0.81*** 0.10 0.88*** 0.09
Urgency 0.08*** 0.10 0.98*** 0.11
Politeness 0.06*** 0.11 0.90*** 0.10
*** p < 0.001, ** p < 0.01, *p < 0.05
Table 3.9 Random-effects negative binominal models predicting answering count (H5), using user-paid half of the full dataset (n=400)
†IRR is the incidence rate ratio, which gives a relative measure of the effect of a given variable, like odds ratio.

57
The last model in this section explores the relationship between reward value and answer quality. The
preliminary analysis tested two potential measures of quality: whether the asker chose a best answer and
whether the best answer had at least a good rating (>=3). Because the results were similar, only the model
of whether the best answer had at least a good rating will be presented.
Results from the logistic regression model (Table 3.10) show that the reward value may predict whether
or not answer is rated positively. Higher reward value (>$2) resulted in an increase of 8-13% in the
likelihood that the question is rated positively. However, because the effects were not significant, we
cannot reject the null hypothesis that higher-reward questions solicit better answers. It should also be
noted there are two significant variables in this model: opinion rating (+28% higher probability) and
question difficulty (-24% lower probability).
3.3.5 Discussion
The hypothesis that askers may be affected by cultural norms when deciding how to use the pay-for-
answer system is supported by the results, which show that people are more likely to pay for certain types
of questions, but not necessairiy more valuable questions. Also, supporting prior findings, higher financial
rewards on Mahalo Answers did elicit longer answers and a higher number of answers, but not
necessarily improve the “best answers,” as rated by the question askers. Finally, higher payment values
indicate higher archival value. The implications are discussed below in detail.
Is Answer Rated Positively 0=no, 1=yes
n=400
Model
Mean SD Odds Ratio SE Reward ($2-3) n=104 1.76*** 0.74
Reward (>$3) n=61 1.42*** 0.73
Factual 0.03 0.44 0.75*** 0.34
Opinion 0.05 0.42 3.09*** 1.54
Advice 0.03 0.47 0.90*** 0.42
Not Question 0.01 0.40 1.36*** 0.69
Sincerity -0.02 0.43 1.46*** 0.89
Difficulty -0.00 0.46 0.38*** 0.18
Urgency -0.00 0.45 2.21*** 1.16
Politeness -0.02 0.37 1.10*** 0.58
** p < 0.01, *p < 0.05
Table 3.10 Random-effects logistic regression model predicting is best answer rated positively (H6), using user-paid half of the full dataset (n=400)
58
3.3.5.1 Question Asking
How do question askers choose whether to pay for answers in a monetary-enabled Q&A system? The
mimir study has used expected utility to explain why there seem to be more serious questions when askers
have to pay for answers — askers pay more if the questions are more valuable.
However, the results of the studies presented herein suggest that the decision on whether to pay is not
made with a simple cost-benefit analysis; rather, the decision may be impacted by perceptions about how
financial rewards should be used. Past work points out that different types of incentives have different
usages and meanings in different scenarii (Zelizer, 1994). Financial rewards are used primarily in
exchange relationships, but not in social, communal relationships. Applied in the Q&A domain,
information seekers may feel that paying is appropriate when they are purchasing facts (and potentially
advice) from the answerers, but when askers seek to initiate a conversation, which is the intent of the
opinion questions, users may not think that financial compensations are necessary, or even appropriate.
The exchange versus communal relationship does not seem to map directly to the distinction between
informational and conversational questions. Part of the problem is that while factual and advice questions
are both classified as informational, advice questions actually positively correlate with opinion questions
(conversations), as shown by the correlation data presented herein. Perhaps a better way to classify the
question is simply to rate how informational and how social the question is. Informational and social
dimensions may also be a more useful breakdown when designing interaction support. While questions
can be both informational and social, questions with high informational ratings will be more functional,
with emphasis on getting high-quality answers, whereas questions with high social ratings will be more
oriented towards generating interesting discussions. For these social questions, perhaps other types of
recognition, as opposed to a simple best answer selection, may be better employed (e.g., slash dot
ratings – controversial, humorous, etc.).
In addition to deciding whether to pay, askers must also determine how much to pay. Analysis of question
rewards shows that question difficulty predicts how much askers pay. One reason why the measures of
importance and urgency may not predict payment is that they were judged by outsourced raters rather
than the asker. Despite that limitation, the result is still interesting because it shows that whether to pay
and how much to pay are two distinctive decisions in pay-for-answer systems. This is perhaps due to the
two-stage process used in paying for answers — askers first select whether they want to pay, then how
much. More research is needed to explore how interface designs may be affecting the use of e-commerce
services.

59
3.3.5.2 Question Answering
The examination of Mahalo Answers presented herein also builds on prior research in answering research
questions on how financial rewards impact answers. The results support the hypotheses that paying more
can result in longer answers and a greater number of answers, though not higher quality best answers (as
judged by askers, in this study).
As mentioned before, one experiment showed that increasing rewards improved answer quality (Harper et
al., 2008), while one showed that it did not (Chen et al., 2008). One explanation for these conflicting
results is that the studies with positive effects used ratings from all of the answers, while the other study
compared ratings from the single, best/official answer. The findings of the research presented herein
support this explanation. While the reward value did not seem to affect best answer quality, the study
found that questions with higher pay did result in more answers from “star” answerers. Prior work has
found that answerers with higher reputation scores, to whom I refer to as “star” answerers, provide
significantly higher-quality answers (Chen et al., 2008). This would suggest that while paying does not
improve the quality of the individual best answers, higher payment can elicit a higher number of high-
quality answers. Perhaps when judged as a combined whole, the quality may be higher.
There are some subtleties in the results that need to be highlighted. First, analysis of average answer
length shows that there is a diminishing return of reward value on length, perhaps due to a ceiling effect.
But at the same time, only high-value payments increased the number of answers. One potential
explanation is that questions with rewards in the high tier (>$3) are more salient, and therefore more
attractive, since majority of paid questions on Mahalo Answers (80%) fell within the $1 and $3 range.
One major difference between Google Answers and Mahalo Answers is that Google Answers only
allowed for one answerer to provide the official answer. The results of this study suggest that the real
benefits of a pay-for-answer may be realized when more than one answerer is allowed to contribute per
question. Allowing multiple answerers to answer the same question is not only more natural (reducing the
need for other answerers to answer using the comment option, as was done on Google Answers), but can
also be more beneficial to question askers and the extended community of information seekers by
providing them with more answers from “star” answerers on the site and potentially offering more
tangential yet still valuable answers for archival readers.
3.3.6 Limitations and Generalizability
In analysis of answer quality, the asker’s rating was used as a proxy. However, it is a weak measure of
best answers’ actual answer quality because (1) not all questions are rated, (2) askers may use positive

60
ratings to establish rapport with answerers for future interaction, and (3) askers who pay more may over-
rate (cognitive dissonance) or under-rate (have higher standards) the answers they receive. This should be
considered when interpreting the analysis of payment’s effect on answer quality.
Because the questions were randomly selected, the findings should generalize to other questions on
Mahalo Answers. Also, because the questions were collected from a real-world, commercial site, various
site-specific features need to be considered when comparing this study’s findings to other pay-for-answer
Q&A sites. I have already discussed some of the differences attributable to interface differences between
Google Answers and Mahalo Answers, but it is also important to keep in mind that Mahalo Answers is a
fairly recently-launched site. Despite that, most of the findings presented should generalize to other pay-
for-answer services, especially to inform us on how users behave during the early, and important, stage of
adoption.
3.4 Conclusion
In this set of work, I have demonstrated the strengths and weaknesses of markets for information
exchange, both in a controlled field study and through a longitudinal study of a commerical pay-for-
answer Q&A site. This work showed that in general, markets can improve the quality of questions and
answers, but it also results in somes potential drawbacks of imposing financial rewards on social
relationships. In the next chapter, I will more closely examine this intricate relationship between financial
rewards and social relationships

61
Chapter 4
MARKETS & SOCIAL RELATIONSHIPS
This purpose of this chapter is to facilitate understanding of the impact of markets on social relationships.
To do so, I re-analyze the data from the mimir study and present two additional studies on how financial
incentives affect social-orientation.
4.1 Motivation
Suppose you need help translating a paragraph from English to Thai. The translation requires proficiency
in both languages, and it will take time and effort. From everyday experience, you know that financial
rewards can motivate people to work on tasks on which they would otherwise not be willing to work, but
you also know that even strangers are sometimes willing to help each other without any promise of
financial compensation. Would you choose to offer a small financial reward when asking for help? How
might offering financial rewards affect the help you receive and your future interactions with the potential
helper? Should your decision change if this potential helper is a friend versus a stranger?
Financial incentives are commonly used to motivate behavior in our society. Most of our labor force is
motivated by financial incentives in the form of wages and salary. Proponents have long argued that
financial incentives act as strong motivators to influence performance or other desired behaviors and “few
would disagree that money has been and continues to be the primary means of rewarding and modifying
human behavior in industry” (p.94, Opsahl & Dunnette, 1966; see also Jenkins el al., 1998; Locke et al.,
1980). After all, these types of incentives can easily invoke people’s self-interest (Batson & Powell, 2003)
and as Garret Hardin, famous for his “Tragedy of the Commons,” once said, “never ask a person to act
against his own self-interest” (p.27, Hardin, 1977).
Others have argued against the use of financial incentives as motivators. The main argument against
financial incentives is the crowding-out of intrinsic motivation (Deci, Koestner, & Ryan, 1999; Titmuss,
1970; Lepper, 1973). According to Cognitive Evaluation Theory, financial incentives may be perceived as
coercive and reduce people’s sense of autonomy, which can, in turn, lower their intrinsic motivation (Deci
& Ryan, 1985). The offered financial incentives may then cause a change in people’s preferences; the
62
amount of time and effort individuals are willing to offer without payment is decreased (Frey & Jengen,
2000). This effect is used to explain why volunteers, a group of intrinsically motivated individuals, may
volunteer less when paid (Frey & Gotte, 1999).
However, to date, there is no conclusive evidence in support of a general undermining-effect for
performance-contingent financial incentives (Eisenberger et al., 1999; Cameron et al., 2001). In fact, the
evidence seems to suggest that at least for “simple” jobs, for which “the aggregate measures of
performance are available,” pay-for-performance can indeed increase output (Prendergast, 1999). In a
meta-analysis of 39 empirical studies conducted from 1984 to 1996, Jenkins et al. also found that
financial incentives improve performance quantity, although not necessarily performance quality (1998).
While much of the prior research has focused on studying how different financial mechanisms adversely
affect intrinsic motivation and individual output, more recent research has suggested yet another potential
drawback of financial rewards – the potential undermining of social relationships (Gneezy & Rustichini,
2000b; Heyman & Ariely, 2004). In a study involving the administering of monetary fines for parents
who show up late to pick up their children from daycare, researchers found that monetary fines actually
resulted in more late-coming parents (Gneezy & Rustichini, 2000b). Similarly, in a separate study,
researchers found that for small value amounts, people work harder on their tasks when they are given
candies (social gifts) instead of the equivalent amount of money (Heyman & Ariely, 2004). These
researchers explained this phenomenon by arguing that the introduction of financial incentives (fines or
rewards) causes people to adopt a financially-oriented norm of interaction. On the other hand, without
incentives, or when using social rewards, people adopt a socially-oriented norm of interaction. In the
daycare scenario, instead of perceiving the daycare teachers’ staying late to look after their children as a
kind, generous act, when fines are introduced parents started to consider the act as a paid service and felt
justified in picking up their kids late because they were paying for it. Unfortunately, these prior studies
offered this social norm explanation without any direct measures of social relationships or norms of
interaction. Without offering additional evidence, prior findings may be explained by other factors.
Further complicating this issue is that, around the same time as these economists were examining the
effects of financial incentives, Vohs et al. did demonstrate that priming people with money made them
less social, but Vohs et al. offered a different explanation (2006). They found that when primed with
money people prefer to play and work alone, are less likely to seek and provide help, and put more
physical distance between themselves and new acquaintances. Instead of attributing the findings to
changes in social norms, they suggested that the observed behavioral difference is because money brings
about a self-sufficient orientation, that people “put forth effort to attain personal goals and prefer to be
63
separated from others” (p. 1154). While they may be correct in that people are more self-sufficient when
primed with or offered money, this self-sufficiency effect alone cannot explain the aforementioned
daycare-study findings. Increase in self-sufficiency should reduce parents’ reliance on daycare providers
and hence decrease the number of late-coming parents, as opposed to the increase in late-coming parents
that was found. Therefore, I posit that, independent of money’s impact on self-sufficiency, money still
may change people’s social orientation and social relationships.
Understanding how financial incentives affect social relationships is extremely timely. Advancements in
communication technologies and electronic payment services are changing how we seek and give help,
and when we can use financial compensation to obtain help. We now have the ability to broadcast our
everyday questions and help requests to thousands of strangers through increasingly popular question and
answer (Q&A) services. Yahoo! Answers, one of the more popular Q&A services, boasts about 80,000+
questions a day (Harper et al., 2008). At the same time, advancements in electronic payment services
have significantly decreased the transaction costs and made it feasible for us to compensate strangers for
help on even trivial, low-value, tasks. Coupling these technologies together, we can build services that
enable us to get higher-quality help from more people, on a wide-range of tasks.
However, if introducing financial incentives changes people’s social orientation toward a more exchange-
based paradigm, then this may inhibit the long-term success of these services. People in exchange
relationships will focus on the inputs and returns and will contribute only to fulfill the functional, task-
oriented goals of these services, i.e., answering the question. Socially-oriented communication, or
interactions that are off topic and unrelated to productivity may be minimized as they are deemed
frivolous. This might actually be an undesired and undesirable side effect of using financial incentives.
Social interactions are critical in certain types of exchanges, such as in health-related topics where
emotional support is vital (Galegher et al., 1998). In addition, reduction in socially-oriented
communication may also hinder socialization, which is vital for these online services in attracting and
retaining newcomers and for sustaining critical mass (Barge & Schlueter, 2004; Bauer et al., 2007; Saks,
Uggerslev, & Fassina, 2007; Lampe & Johnson, 2004; ). For example, if Q&A services do not have
sufficient answerers, many questions can go unanswered. At the same time, without enough questions
from askers, answerers will have nothing to which to contribute and may turn to participate in other
available Q&A services. Therefore, for these help-exchange services, socially-oriented interactions will
need to be carefully balanced with the task-oriented interactions. Given that these technologies are now
available, the question is no longer whether we can utilize financial incentives to support our many day-
to-day help requests, but rather, should we?

64
Following are three studies on how financial incentives affect interpersonal relationships. The first study,
examines the impact of financial incentives on help exchanges and social relationships in the domain of
Q&A. Results show that, when comparing a market-based Q&A service to a no-market version, financial
incentives encouraged higher effort and resulted in higher-quality help responses. However, people who
receive financial incentives for helping become more exchange-oriented, focusing more on the
instrumental value than the social interactions. They become less likely to engage socially. The second
study revealed that offering financial rewards changes people’s subsequent allocation decision: if
financially rewarded, people are more likely to adhere to exchange-based norms of allocation. They
become more likely to allocate based on equity, or individual input, than equality, splitting it 50-50. The
third study shows that preexisting communal orientation does not blunt the impact of financial incentives.
Friends are just as likely as strangers to change norms of interaction when money is involved. Findings
advance the theoretical understanding of the perception and effects of using financial incentives, and also
provide practical contributions regarding leveraging financial incentives to support interpersonal
exchanges.
4.2 Social-Relational Costs of Financial Incentives
Standard economic theory assumes that individuals act rationally to maximize their utility (homo
economicus). In this standard economic model, individuals have a supply (s) of resources, such as effort
and time that they are able to put into an activity. Given that the supply curve is positively sloped, relative
price theory stipulates that the higher the compensation (price), the more supply people are willing to
commit to the activity. We can see from the graphical representation that the increase of price from p to p’
should increase resources provided from q to q’ (Figure 4.1). If there are other additional types of
incentives offered, the additional incentives should increase the amount of resources people are willing to
commit, at any given price. This would shift the supply out, i.e., from s to s’ (Figure 4.1). Using this
model, we can see why standard economic theory predicts that paying more should result in higher
individual output.
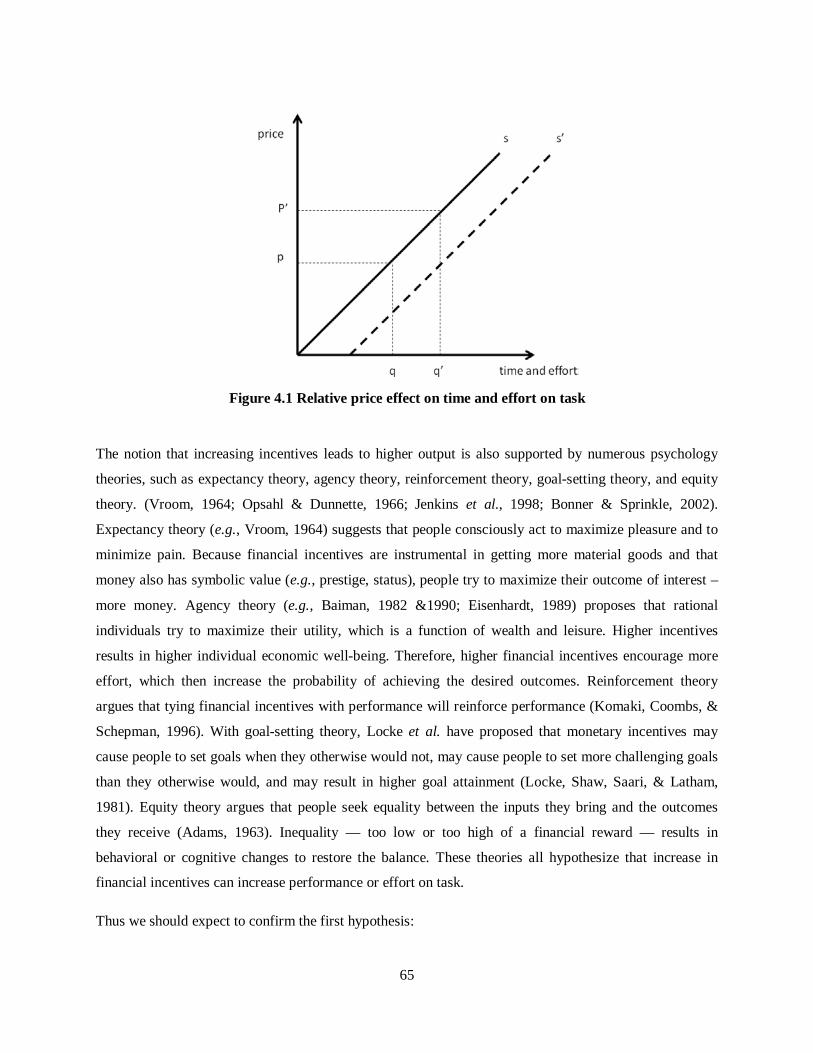
65
The notion that increasing incentives leads to higher output is also supported by numerous psychology
theories, such as expectancy theory, agency theory, reinforcement theory, goal-setting theory, and equity
theory. (Vroom, 1964; Opsahl & Dunnette, 1966; Jenkins et al., 1998; Bonner & Sprinkle, 2002).
Expectancy theory (e.g., Vroom, 1964) suggests that people consciously act to maximize pleasure and to
minimize pain. Because financial incentives are instrumental in getting more material goods and that
money also has symbolic value (e.g., prestige, status), people try to maximize their outcome of interest –
more money. Agency theory (e.g., Baiman, 1982 &1990; Eisenhardt, 1989) proposes that rational
individuals try to maximize their utility, which is a function of wealth and leisure. Higher incentives
results in higher individual economic well-being. Therefore, higher financial incentives encourage more
effort, which then increase the probability of achieving the desired outcomes. Reinforcement theory
argues that tying financial incentives with performance will reinforce performance (Komaki, Coombs, &
Schepman, 1996). With goal-setting theory, Locke et al. have proposed that monetary incentives may
cause people to set goals when they otherwise would not, may cause people to set more challenging goals
than they otherwise would, and may result in higher goal attainment (Locke, Shaw, Saari, & Latham,
1981). Equity theory argues that people seek equality between the inputs they bring and the outcomes
they receive (Adams, 1963). Inequality — too low or too high of a financial reward — results in
behavioral or cognitive changes to restore the balance. These theories all hypothesize that increase in
financial incentives can increase performance or effort on task.
Thus we should expect to confirm the first hypothesis:
Figure 4.1 Relative price effect on time and effort on task
66
H0. Offering higher financial rewards raises the effort and quantity of work.
4.2.1 Relational Implications of Offering Financial Incentives
In addition to affecting people’s decisions on what tasks to work on and how much effort to put in, can
financial incentives also affect social relationships? They can, because of the socially and culturally-
embedded meanings in offering financial incentives.
In interpersonal relationships, what we give to one another symbolizes and conveys meaning (Mauss,
1954; Belk & Coon, 1993). Schwartz points out that “gifts are one of the ways in which the pictures that
others have of us in their minds are transmitted” (1967). Parents choose to give cars to boys and dolls to
girls to express their image of the children as “masculine” car-playing boys, or “feminine” doll-playing
girls. Camerer likens gifts to signals, in that they convey the “intentions of partners in a personal
relationship” (p. 199, 1988). Similarly, Ruth et al. suggest that what is given conveys a vision of the
“trajectory of the interpersonal relationship” to the receiver (1999).
The embedded meanings carried by the goods exchanged make the giving of goods a complicated
process. Levi-Strauss has likened the process to “a skillful game of exchange [that] consists of a complex
totality of maneuvers, conscious or unconscious.” This is apparent when considering the process of
selecting a greeting card. We might spend a considerable length of time selecting the most appropriate
and meaningful card, despite the fact that the prices of the cards are similar (Levi-Strauss 1965; Sherry,
1983). But if offering money also conveys a certain meaning, then what is it? How is offering financial
rewards different from not offering any financial rewards?
Social relationship theory can help to elucidate the difference. This theory distinguishes between two
general types of interpersonal relationships: exchange and communal relationships (Clark & Mills, 1979;
Clark & Mills, 1993). This distinction can be traced back to Goffman’s differentiation between economic
and social exchange (1961). In an exchange relationship, benefits are given in response to or in
expectation of equivalent benefits from another. On the other hand, in a communal relationship,
motivations for the giving of benefits are based primarily on need. Exchange relationships are
“exemplified by relationships between strangers or people who do business with one another,” while
communal relationships are “often exemplified by relationships with friends, family members, and
romantic partners” (Clark et al., 1987). In exchange relationships, people are motivated to gain benefits
for the self, while in communal relationships, people feel a degree of responsibility for the welfare of the
partner (Mills et al., 2004). While Fiske has proposed a more elaborate breakdown of relationship types
(1992), this discussion will focus on the more general breakdown of communal (social) vs. exchange
(financial).

67
Prior work on gift exchange supports the idea of dichotomy in interpersonal exchanges. When studying
giving and reciprocity among the Japanese Americans in Honolulu, Johnson found that the nature of the
gift changed as intimacy decreased, from personal items to specific amounts of money (1974). When
interacting with those closer in intimacy and sociability, a generalized reciprocity is used, where gifts are
exchanged in a flexible and spontaneous manner because they are based on immediate needs of the
recipient. In contrast, for those outside the close circle of family and friends, gift-givers “define the
degree of obligation more exactly, demanding that the debt be repaid in full at the appropriate time” (p.
301).
In contemporary US culture, money is closely associated with the exchange relationship, but not with the
communal relationship. This may be largely due to the western view of monetary exchanges – that money
results in commodification (Marx, 1932), and that financial relationships represent “asocial selfish
individualism” (Sahlin, 1965) and are “heartless” (Simmel, 1950). However, economic pricing also
supports exchange-based relationships from a practical perspective — it affords the tracking of debts and
credits. Money’s ability to support easy calculation of rates of contribution and proportionate distribution
is necessary for the tit-for-tat nature of exchange-based relationships (Fiske, 1992).
This underlying association has resulted in various social rules regarding when and where we should use
money. In general, money is used in business settings where equivalent and prompt exchanges are
preferred, but not in more social and intimate settings. For example, we expect to give financial
compensations after a meal at a restaurant (exchange-oriented relationship) but not after dinner at the
home of a friend (communal-oriented relationship). Fiske & Tetlock also point out that not only do we
find it difficult to estimate the monetary value of loyalty and friendship, we find it morally offensive to
try (1997). Lea & Webley sum this up:
What seems to lie at the root of these social rules is a perhaps-
unformulated belief that to give someone money is to move the
transaction out of the realm of ordinary social exchange into a different,
economic, sphere, so that what should be a gift or a means of thanks
becomes payment – and that is something quite different (p. 165, 2006).
Extending this idea to help-exchanges, requesters may also feel the need to adhere to these existing social
rules when they enter into a market-based system. They may be less likely to pay if their exchange goal is
primarily socially-oriented, as opposed to task-oriented.
H1. People are less likely to offer financial rewards for help when their primary goal is to socialize.
68
4.2.2 Effect on Social Relationships
On the other side of the exchange, due to the aforementioned associations between financial incentives
and exchange-based norms, offering financial incentives may then be perceived as an expectation for
responses that adhere to exchange-based norms. Receivers would feel obliged to respond accordingly,
otherwise, and if what is expected and what is given in return is unbalanced, cognitive tension may be
generated (Seipel, 1971). Therefore, when financial incentives are offered, receivers may now behave in a
less socially-oriented and a more task-oriented way. As Simmel puts it, money turned the world into an
“arithmetic problem” (Quoted in Zelizer 1989, p. 344).
H2. People are less likely to respond socially when financial rewards are offered.
The effect paying, though, does not stop there. It extends beyond a single interaction because what we
experience affects subsequent interactions. Sherry’s model of gift exchange suggests that there are three
stages of gift exchange — the gestation stage (antecedent to the actual exchange), the presentation stage
(exchange process), and the post-exchange reformulation stage. It is after the exchange, during the
reformulation, stage that relationships are “realigned” and that social bonds may be “strengthened,
affirmed, attenuated, or severed” (Sherry, 1983). When financial transactions occur, the exchange-
orientation between those who have just interacted may then increase as both sides try to realign their
relationships to what they believe is appropriate. In addition, because individuals learn what norms to
apply based on their prior interactions, they may further extend their exchanged-based orientations when
interacting with others in similar contexts (Clark & Jordan, 2002).
One way to observe the change in social orientation is by examining people’s subsequent allocation
decisions. In general, exchange-orientation leads to equity-based allocation, where shared resources are
allocated based on individual inputs, and communal-orientation leads to need-based allocation, where
shared resources are given to those in need (Clark & Mills, 1993). When there is an absence of evidence
for differential needs, an equality-based allocation (50-50 even split) is used, since the default assumption
is that the needs are equal (Pataki et al., 1994). Related research has found that pairs of friends are more
likely to divide shared earnings from a task equally, regardless of performance, whereas pairs of strangers
are more likely to divide the rewards based on an equity norm (Austin, 1980). The stronger the existing
communal orientation between friends, the more likely it is that they will come to an equality decision
versus equity (Thompson & DeHarpport, 1998). Similarly, two people are more likely to be perceived as
friends if they divide a restaurant check equally than if they divide it according to what each person has
ordered (Greenberg, 1983). More recently, research showed that the difference in distribution norms is
already visible in elementary school children (Pataki et al., 1994). If offering financial rewards does make
69
helpers more exchange-oriented, we would expect helpers to allocate shared resources based on equity
instead of equality.
H3. Recipients of financial rewards are more likely subsequently to allocate shared resources based
on equity instead of equality.
The effects of financial incentives on social relationships are perhaps the strongest when financial rewards
are used between strangers. This is because, between strangers, the exact relationships and norms of
exchange are relatively undefined; there exists only a partial contract (Gneezy & Rustichini, 2000a). What
is offered then acts as a prototypical contract (van Baal, 1975), and a starting mechanism for social
relationships where certain norms of reciprocity are expected (Gouldner, 1960). While the use of financial
incentives would be a bigger violation of norms in an existing communal relationship and result in drops
in mood (Williamson et al., 1996) and liking (Clark & Mills, 1979), unless exchange norms are
repeatedly violated, we should not expect those in an already established communal relationship to
change their relationship orientation. This is mostly because of self-selection. Those who choose to be in
communal relationships are more likely to believe that communal norms are the ideal for them, therefore,
they would strive to adhere to that ideal (Clark & Jordan, 2002). Hence, we can expect that an existing
relationship orientation may interact with the effects of financial incentives. The change to an equity
allocation should be less likely to occur between friends than strangers.
H4. Recipients of financial rewards are more likely subsequently to allocate shared resources based
on equity instead of equality with strangers, but not with friends.
4.3 Re-analysis of mimir
If offering financial incentives changes people’s relationship orientation as suggested in prior work, then
there should be some measurable social differences. Here, I hypothesize that financial incentives will
reduce the socially-oriented exchanges between people.
To study this, I invited participants to use one of two questions and answers (Q&A) services, where one
service was market-based while the other was not (same experiment as the one presented in Chapter 3). I
then analyzed the questions and answers to investigate whether financial framing reduced the socially-
oriented interactions between askers and answerers.
Q&A is a great domain to use to test my hypotheses for two important reasons. One, these services have
become a mainstream medium for people seeking answers and help. Two, the computer-mediated
interactions allow for recording the content of help interactions so that we may more easily analyze the
70
impact of financial incentives on both the level of effort put forth in providing help and also the social
nature of the interactions.
4.3.1 Method
4.3.1.1 Participants and procedures
Here, I re-analyzed the data collected from the field experiment with mimir, which was presented in
Chapter 3. This was a between-subjects experiment, where half of the participants used a no-market
version of mimir and half of them used the market version. The two interfaces are mostly identical, with
the exception that the market version uses an artificial currency called the mim, and that users have the
option to pay for answers using their mim.
The study lasted for three weeks. There were 58 participants who installed the market system and 50
participants who installed the no-market system. Participants in the market condition were given $5 worth
of tokens (20 mim) to begin, and told that the number of tokens they had at the end of the study would be
converted into lunch coupons (4 mims = $1 lunch coupon). The no-market participants were told that they
would be given $5 lunch coupon at the end of the study for having installed and run the system.
4.3.1.2 Measures
During the study, participants’ usage of the system was recorded, including such information as the
questions asked and answers given. In order to test the answering behavior in a controlled fashion, I
submitted an identical set of 24 questions to both systems.
To determine the social nature of these Q&A exchanges, raters from Mechanical Turk were recruited.
They were presented with the questions and answers individually, and asked to give a -50 to 50 score,
where 50 indicates a strong agreement and -50 a strong disagreement with the statement “the answerer
wants to socialize with others.” I limited the task to workers from the US to ensure that raters would be
proficient in English. After removing outliers from the ratings an Intra-Class Correlation Reliability (ICC)
of 0.65 was achieved.
In addition to these measures, I also conducted a questionnaire asking participants to rate their perception
of the system. One of the questions asked the participants to rate their sense of belonging to their mimir
community.
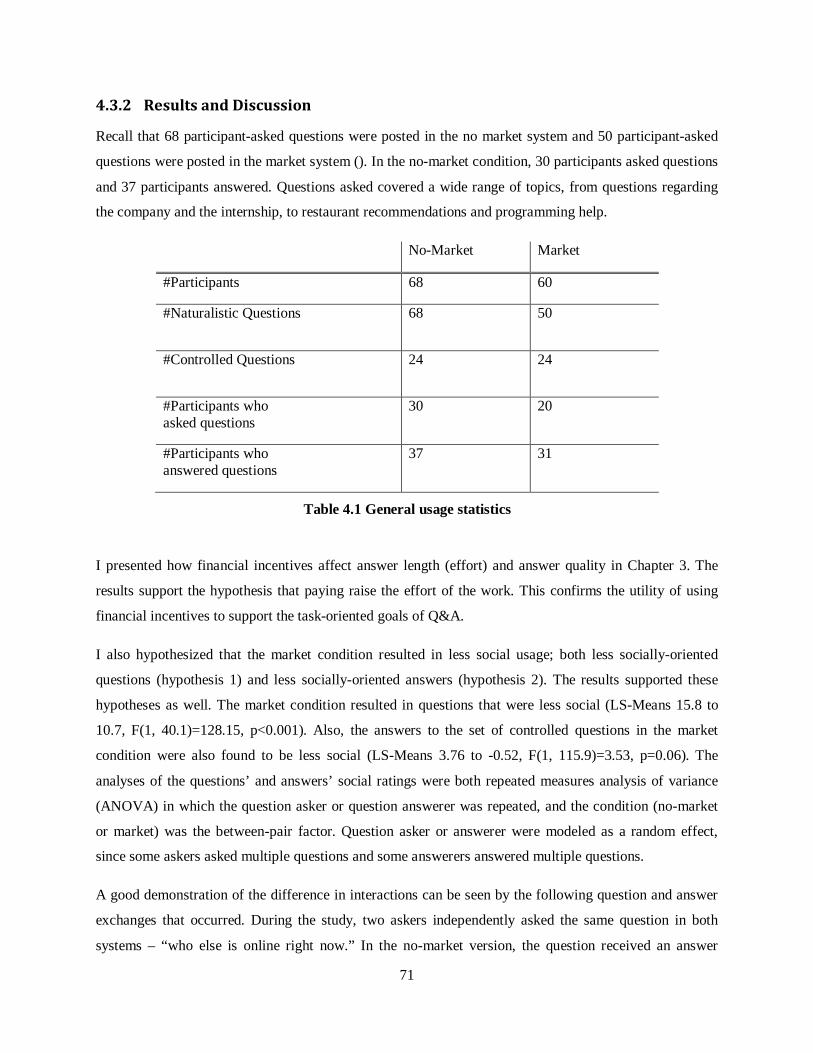
71
4.3.2 Results and Discussion
Recall that 68 participant-asked questions were posted in the no market system and 50 participant-asked
questions were posted in the market system (). In the no-market condition, 30 participants asked questions
and 37 participants answered. Questions asked covered a wide range of topics, from questions regarding
the company and the internship, to restaurant recommendations and programming help.
I presented how financial incentives affect answer length (effort) and answer quality in Chapter 3. The
results support the hypothesis that paying raise the effort of the work. This confirms the utility of using
financial incentives to support the task-oriented goals of Q&A.
I also hypothesized that the market condition resulted in less social usage; both less socially-oriented
questions (hypothesis 1) and less socially-oriented answers (hypothesis 2). The results supported these
hypotheses as well. The market condition resulted in questions that were less social (LS-Means 15.8 to
10.7, F(1, 40.1)=128.15, p<0.001). Also, the answers to the set of controlled questions in the market
condition were also found to be less social (LS-Means 3.76 to -0.52, F(1, 115.9)=3.53, p=0.06). The
analyses of the questions’ and answers’ social ratings were both repeated measures analysis of variance
(ANOVA) in which the question asker or question answerer was repeated, and the condition (no-market
or market) was the between-pair factor. Question asker or answerer were modeled as a random effect,
since some askers asked multiple questions and some answerers answered multiple questions.
A good demonstration of the difference in interactions can be seen by the following question and answer
exchanges that occurred. During the study, two askers independently asked the same question in both
systems – “who else is online right now.” In the no-market version, the question received an answer
No-Market Market
#Participants 68 60
#Naturalistic Questions 68 50
#Controlled Questions 24 24
#Participants who asked questions
30 20
#Participants who answered questions
37 31
Table 4.1 General usage statistics
72
stating that there is a number of users count visible on the mimir application window. It was a succinct
and very functional answer. In the no-market system, on the other hand, the question resulted in a roll
call, where 11 participants responded using emoticons and other symbols. This example shows that not
only did the answerers in the no-market system interpret the same question in a more social manner, they
also responded more socially.
Based on the responses to the questionnaire, this reduction in the socially-oriented usages of mimir may
have impeded the forming of the mimir community. Participant responses about their sense of belonging
in the mimir community, market system participants felt that they belonged to their mimir community
less than the no-market system participants (2.49 to 3.04, t(60)=2.26, p=0.03).
These findings demonstrate the social drawback from using financial incentives. On one hand, financial
incentives may be used to encourage effort and performance on tasks, supporting the task-oriented goals.
However, these financial rewards may reduce socially-oriented interactions, which may then impede
relationship building.
4.4 Experiment 2
To offer additional proof that financial incentives alter social norms, experiment 2 examines how offering
financial incentives affect allocation decisions. Prior work suggests that allocation decision is dependent
on social norms; those under exchange-based norms are more likely to use an equity decision rule, as
opposed to an equality decision rule (Pataki et al., 1994). Therefore, if offering financial incentives leads
to a change in social relationships, from communal to exchange-based, then people who are paid should
be more likely to allocate joint earnings based on equity.
In this experiment, small financial incentives were used for two reasons. First, the impact of financial
incentives on social orientation should be dependent on whether or not financial incentives are offered,
not how much is offered. This is because the signaling effect of money for exchange-based norms should
occur as long as financial incentives are offered. Second, using small incentives may help to tease apart
the proposed social norms effects of money (Gneezy & Rustichini, 2000b; Heyman & Ariely, 2004) from
the self-sufficiency effects of money (Vohs et al., 2006). Similar to the mimir experiment, Vohs et al.
found a reduction in helpful behaviors when people are primed with money. However, this reduction of
helpfulness only occurred when participants were primed with sufficiently high amounts of money. I
argue, however, that their findings are intrinsically different from the social norms effects I am suggesting
in this work. I would be able to validate this point if changes in allocation decisions occur when only
small amounts of money are offered.
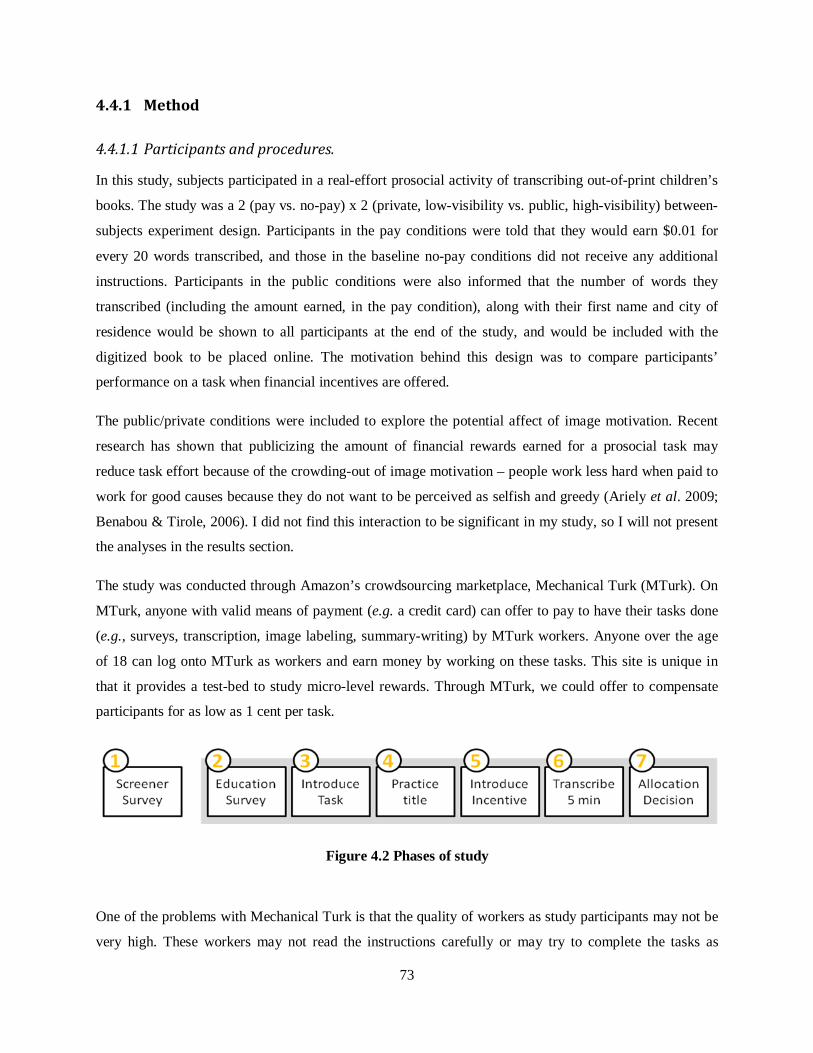
73
4.4.1 Method
4.4.1.1 Participants and procedures.
In this study, subjects participated in a real-effort prosocial activity of transcribing out-of-print children’s
books. The study was a 2 (pay vs. no-pay) x 2 (private, low-visibility vs. public, high-visibility) between-
subjects experiment design. Participants in the pay conditions were told that they would earn $0.01 for
every 20 words transcribed, and those in the baseline no-pay conditions did not receive any additional
instructions. Participants in the public conditions were also informed that the number of words they
transcribed (including the amount earned, in the pay condition), along with their first name and city of
residence would be shown to all participants at the end of the study, and would be included with the
digitized book to be placed online. The motivation behind this design was to compare participants’
performance on a task when financial incentives are offered.
The public/private conditions were included to explore the potential affect of image motivation. Recent
research has shown that publicizing the amount of financial rewards earned for a prosocial task may
reduce task effort because of the crowding-out of image motivation – people work less hard when paid to
work for good causes because they do not want to be perceived as selfish and greedy (Ariely et al. 2009;
Benabou & Tirole, 2006). I did not find this interaction to be significant in my study, so I will not present
the analyses in the results section.
The study was conducted through Amazon’s crowdsourcing marketplace, Mechanical Turk (MTurk). On
MTurk, anyone with valid means of payment (e.g. a credit card) can offer to pay to have their tasks done
(e.g., surveys, transcription, image labeling, summary-writing) by MTurk workers. Anyone over the age
of 18 can log onto MTurk as workers and earn money by working on these tasks. This site is unique in
that it provides a test-bed to study micro-level rewards. Through MTurk, we could offer to compensate
participants for as low as 1 cent per task.
One of the problems with Mechanical Turk is that the quality of workers as study participants may not be
very high. These workers may not read the instructions carefully or may try to complete the tasks as
Figure 4.2 Phases of study
74
quickly as possible. To ensure high-quality workers for the experiment, dummy surveys with duplicate
questions were posted. Those who responded consistently were invited to participate in the main task.
Mechanical Turk does not allow posting tasks that offer no pay. Therefore, in order to create the no-pay
conditions, we made the transcribing task an opt-in task, after participants completed another dummy
survey on education and social networks that offered $0.35. A pre-study showed that digitizing children’s
books is perceived to be an interesting task for a good cause. Participants were told that they did not need
to participate in this optional task to be compensated for the survey they had just completed. This was
meant to ensure a disassociation between the $0.35 financial compensation and the digitizing task. At this
point, participants were also asked to provide their first names and their cities of residence.
One of the main activities of our non-profit organization (Digital Education) is to
digitally transcribe out of print children's books. The digitized versions will allow
children from all over the world to read these wonderful books. You can make a
difference by contributing just 5 minutes to help us digitize a portion of a book.
You may also choose to quit at any time by clicking on the "Exit HIT Now" button. Even
if you choose not to contribute to this project, you will still get paid $0.35 for answering
the education survey.
To help, we ask that you enter just your first name and your location of residence. This
will allow us to keep track of our volunteer contributors and to collect the geographic
demographics of our contributors.
If participants chose to help to digitize the books they were then shown the cover of the book they were
asked to digitize — Doctor Dolittle’s Puddleby Adventures, by Hugh Lofting, published in 1952. For a
practice task, they were asked to type the title and author of the book into the transcribing area. At this
point, participants did not know whether or how they would be compensated for contributing their time
and effort to digitizing. Only after the participants completed the practice task were they randomly
assigned their treatments.
To measure people’s social orientation post the pay/no-pay treatments, a hypothetical allocation question
was posed. In this question, participants were asked to divide up money that was jointly earned with a
stranger. Participants were told that they had completed more work than their partners (the participant was
told that s/he had transcribed 5 pages compared to 3 pages transcribed by his/her work partner, out of a
total of 8 pages that needed to be completed). Furthermore, they were asked to decide how to allocate the
joint earnings of $8. The expectation was that people who perceived their relationship with the stranger as
75
an exchange relationship would distribute the shared-earnings based on equity or individual input,
resulting in giving $3 to the partner. On the other hand, the product of labor is treated as a collective
resource in communal relationships and equality is the default mode of distribution, which means giving
$4 to partner (Pataki et al., 1994). In the setup for this experiment, participants were given 9 choices —
the 9 exhaustive options of how to divide the payment at the $1 level.
Assume that you and a stranger (someone you have never met) are offered $8 to help
transcribe 8 short chapters of a book. You both started on the task at the same time, but
because you are the faster typer, you finished 5 chapters and the other person finished 3
chapters.
You are then asked to determine how the $8 should be divided between the two of you.
What would you do?
Finally, participants in the public conditions were shown all participants’ performances. A few days later,
participants were compensated.
In all, 174 MTurk workers participated in the transcription study. Each of the conditions had more than 38
participants, though due to random assignment, some conditions had more participants than others.
4.4.1.2 Measures
The number of words transcribed and the responses to the allocation decision were recorded. The length
of the transcription was used for our measure of task performance.
4.4.2 Results and Discussion
On average, 136.5 words per participant were digitized, which equated to average earnings of 6.8 cents
when the participant was paid.
Results support the hypothesis at the trend level that paying increases task effort (estimated mean: 144.4
to 123.7, F(1,169)=2.93, p=0.09). This analysis was done with an ANOVA model using pay/no-pay and
private/public as the binary independent variables and the number of words digitized as the dependent
variable. Two outliers were removed after preliminary analysis. The model only explains 2% of the
variance, which may be due to the high variability in typing speed across participants.

76
To study the effects of financial incentives on shared-resource allocation decisions, I examined the
allocation decision. In my setup, sharing $4 was the equality decision, whereas sharing $3 was the equity
decision. The resulting decision distributions were non-normal (most centered on giving $4 and $3), so I
coded up the dependent variable as greater than or equal to $4 (communal-oriented), or less than $4
(exchange-oriented). The logistic-regression model using incentive (pay/no-pay) and image
(public/private) as independent variables shows that getting paid has a significant effect on the allocation
decision (p=0.03). Specifically, the estimates suggest that getting paid resulted in a 2.3 times increase in
likelihood to allocate based on equity (Table 4.2). There was no 2-way or 3-way interaction effect and the
image effect was also not significant.
These results are important findings in two ways. First, these results offer concrete proof that financial
incentives change social orientation into more exchange-based orientations. Second, these results offer
proof that the social norms’ change due to money is different from the self-sufficiency change due to
money. Here, participants only earned 6.8 cents for their 5 minutes of work, which is well below
minimum wage and low for even MTurk standards. The low rewards offered, according to Vohs et al.,
should not have resulted in a sense of self-sufficiency. Yet, a significant effect was found here.
4.5 Experiment 3
Experiment 3 extends experiment 2 by examining whether existing friendship interacts with financial
incentives to affect allocation decisions. The hypothesis is that friends should be less susceptible to
adopting an exchange-based norm of interaction when money is offered because they have already
converged on communal-based norms as the desired norms of interaction.
Pay No-Pay
Public 65% 44%
Private 74% 55%
Table 4.2 Equity decisions across conditions
77
4.5.1 Method
4.5.1.1 Participants and procedures
Participants were recruited through flyers posted around Pittsburgh and through online postings at the
Center for Behavioral Decision Research at Carnegie Mellon University. Participants were told that they
would help to transcribe out-of-print children’s books for a few good causes. First, the transcribed text
would be used for testing education technologies. Second, participants would be studied to improve
existing transcribing interfaces. And finally, these out of print books would be made available online for
kids from all over the world to read. Participants were told that they would be paid $10 for the thirty-
minute long session.
Participants were each asked to invite a friend for this “transcribe campaign.” We explained that this
would provide a more diverse pool of participants, as well as contributions from and study participants
who do not typically participate in these studies. Prior to coming into the study, participants and their
friends were asked to fill out a pre-survey. They were asked how long they have known their friend, and
about their communal orientation with their friend (using a scale developed by Mills et al., 2004) and
their personality (using the Big Five Inventory, John et al., 2008). Participants were not screened based
on their responses to the pre-study survey; instead, all of them were invited to participate in the study and
their responses were used to facilitate analyses.
The study was a 2 (friends vs. strangers) by 2 (no-pay vs. pay) between-subjects design. Participants were
scheduled in a manner such that 4 or 6 persons (2 or 3 pairs of friends) arrived at the lab at the same time.
Within each session, participants were seated either in front of their friends or in front of strangers (i.e.,
another participant’s friend). They were told that pairs seated across from each other would be working
together on transcribing a chapter. They were told that this was to ensure complete coverage on the
chapters. Dividers were used so that participants could not see each other after they were seated.
Participants were given instructions on how to transcribe and what the transcribing interface looked like.
After the instructions, participants were given 60 seconds to practice transcribing. Then, participants were
told which chapter they would be transcribing with their partner. In the study, all participants transcribed
the same material, Chapter 2 of the aforementioned Doctor Dolittle’s Puddleby Adventures. Those in the
pay condition were also told that they would earn an additional 1 cent for every 10 characters transcribed.
78
<In the pay condition>
In addition to the money you will receive for showing up to the study, to thank you for
your help, we will also pay you 1 cent for every 10 characters you transcribe.
<In all conditions>
The book you are asked to transcribe is Dr. Dolittle’s Puddleby Adventures by Hugh
Lofting, published in 1952.
You have been assigned to transcribe Chapter 2 with the person across from you. What
you two are able to transcribe will be merged together later.
Participants were given 10 minutes to transcribe. The transcribing interface provided feedback on how
much time was left, how many characters had been transcribed, and, in the pay condition, how much
participants had earned (Figure 4.3). Immediately after the 10 minutes, participants were asked to make
the allocation decision. They were all told that the amount they had transcribed with their partners
qualified them for a shared bonus of $2.00 and that, since they transcribed more, they should decide how
to split up the bonus. They were shown how many characters they transcribed and were deceived into
believing that their partners transcribed about 3/5 of that amount. In other words, they themselves
transcribed 62% of the total, and their partner transcribed 38% of the total. With this set-up, participants
who used an equity decision rule should keep $1.25 while participants who used an equality rule should
keep $1.00. After the allocation question, participants were asked to fill out a background survey, answer
some open-ended questions about their experiences, and also the manipulation checks questions.

79
In all, 114 participants participated in the study (all conditions had 28 participants, except for the no-pay,
friends condition which had 30). One participant did not complete the study due to a computer
malfunction, so her partner was also excluded from the final analysis. In addition, two other participants
were also excluded because they thought that they had been partnered with their friends, despite having
been specifically informed that they were partnered with the person sitting across from them. In the
manipulation checks, participants reported not knowing anyone else in the study session other than their
friend. Excluding these four participants left 110 participants in the analyses.
Figure 4.3 Screenshot of transcribe interface: 1) amount of time left, 2)number of characters transcribed, 3) scanned page from a book, 4) button to advance to the next page, 5) input text
area
80
It should be noted that the deceptions were not perfect. Some participants expressed doubts that they had
transcribed more than their partners in the post-study questionnaire. This was especially true between
friends who perhaps know more about each other’s typing skills (8 participants in the friend condition and
2 in the stranger condition expressed doubt about their transcription performance having outstripped that
of their partners). Analyses were conducted both with and without these participants, and there were no
differences between the models so the models are presented with them included.
4.5.1.2 Measures
The number of characters participants transcribed and their response to the allocation question were
recorded. The length of the transcription is used for the measure of task performance.
4.5.2 Results and Discussion
On average, participants transcribed 1781 characters in 10 minutes, which equated to an average
additional earning of $1.78 in the pay conditions.
To examine the effect of paying on task effort, an ANOVA model was built using pay/no-pay as the
binary independent variable, the number of characters transcribed in the trial session as a control variable,
and the number of characters digitized as the dependent variable. One outlier was removed. Unlike the
previous experiment, the results showed no difference between the pay and no-pay conditions
(F(2,106)=0.83, p=0.37).
Like experiment 2, the allocation decision was coded into binary outcomes. Deciding to keep more than
or equal to $1.25 was coded as the exchange-oriented decision, and less than or equal to $1 as the
communal-oriented decision. The logistic-regression analysis shows that the interaction of pay and
friendship was not significant, so the model is presented without the interaction term. As expected, the
model shows that friendship has a significant effect on the allocation decision (p<0.001); strangers are 14
times more likely to choose the equity decision. Confirming results from experiment 2, the model also
shows that paying results in a higher likelihood of equity-based decision (p=0.02). People who were in
the pay conditions were 3.1 times more likely to allocate the joint-earnings based on equity. Testing was
conducted to see whether the number of characters transcribed had an impact on the allocation decision;
the effect was not significant.
Since participants were not screened based on the pre-study survey, there is a concern for construct
validity. Participants in the friend condition may have been people with weak ties who decided to
participate in this study together. Therefore, to ensure that the friend condition actually reflected pairs of
people with existing communal relationships, participants across all conditions who had known their
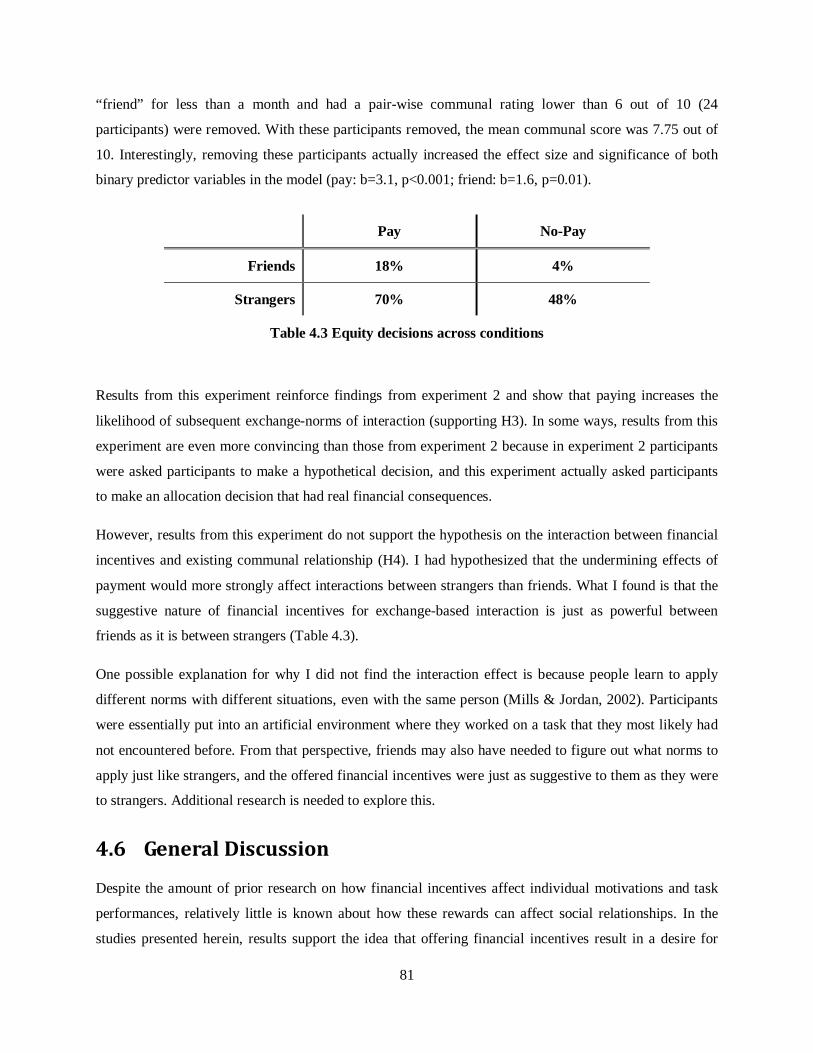
81
“friend” for less than a month and had a pair-wise communal rating lower than 6 out of 10 (24
participants) were removed. With these participants removed, the mean communal score was 7.75 out of
10. Interestingly, removing these participants actually increased the effect size and significance of both
binary predictor variables in the model (pay: b=3.1, p<0.001; friend: b=1.6, p=0.01).
Results from this experiment reinforce findings from experiment 2 and show that paying increases the
likelihood of subsequent exchange-norms of interaction (supporting H3). In some ways, results from this
experiment are even more convincing than those from experiment 2 because in experiment 2 participants
were asked participants to make a hypothetical decision, and this experiment actually asked participants
to make an allocation decision that had real financial consequences.
However, results from this experiment do not support the hypothesis on the interaction between financial
incentives and existing communal relationship (H4). I had hypothesized that the undermining effects of
payment would more strongly affect interactions between strangers than friends. What I found is that the
suggestive nature of financial incentives for exchange-based interaction is just as powerful between
friends as it is between strangers (Table 4.3).
One possible explanation for why I did not find the interaction effect is because people learn to apply
different norms with different situations, even with the same person (Mills & Jordan, 2002). Participants
were essentially put into an artificial environment where they worked on a task that they most likely had
not encountered before. From that perspective, friends may also have needed to figure out what norms to
apply just like strangers, and the offered financial incentives were just as suggestive to them as they were
to strangers. Additional research is needed to explore this.
4.6 General Discussion
Despite the amount of prior research on how financial incentives affect individual motivations and task
performances, relatively little is known about how these rewards can affect social relationships. In the
studies presented herein, results support the idea that offering financial incentives result in a desire for
Pay No-Pay
Friends 18% 4%
Strangers 70% 48%
Table 4.3 Equity decisions across conditions
82
more exchange-oriented interactions, and that being offered financial incentives for help can change the
subsequent norms of interaction to more exchange-transactional and less social-communal.
The results suggest that there are symbolic meanings behind offering financial incentives that affect our
decisions on whether or when to offer these incentives. As pointed out by a growing body of literature,
and in fairly stark contrast to the traditional western view of cash as cold and meaningless, there are
embedded meanings when offering financial rewards (Zelizer, 1994). Money, then, is not much different
from other goods we select and give to one another – they have certain existing social and cultural
meanings embedded. Also, because financial incentives are often associated with a desire for an
exchange-oriented transaction, we are less likely to offer such incentives when seeking social interactions.
In Study 1, when comparing the questions asked in a system supported by financial incentives to
questions asked in a system without a payment system, the questions from the market versus the no-
market system were less social in nature. This finding is consistent with research on relationship norms
and incentives, where financial transfers are perceived to be violations when used in communal
relationships but not when deployed in exchange relationships (Clark & Mills, 1979; Aggarwal, 2004).
The results also show that the use of financial incentives can affect helpers’ subsequent norms of
interaction. This is an important contribution that helps to elucidate the intricate relationship between
financial incentives and social relationships. One set of prior work assumes that money changes social
norms, without offering any proofs that social relationships or social norms were indeed changed (Gneezy
& Rusticini, 2000b; Heyman & Ariely, 2004). Other studies did find that priming people with money
reduced their interaction and increased physical distance to others; however, these researchers relied upon
the concept of self-sufficiency to explain their findings, i.e., that money encourages people to be free of
dependency on and dependent-free from others (Vohs et al., 2006). The study presented herein provides
evidence in support of the social norm hypothesis. It demonstrates two specific ways in which social
norms were altered by the offer of financial incentives. First, people in financial-based systems were less
likely to provide responses that were social in nature. If this were due to an increase in self-sufficiency,
then we should have observed fewer overall interactions between participants, and not only fewer
socially-oriented interactions. Second, people who are offered financial incentives for their help
subsequently allocate shared resources differently from those who are not offered financial incentives.
They are more likely to base their decisions on individual inputs (equity) instead of sharing it evenly with
their partners (equality). In the study setup, the amount rewarded was minimal, much less than the hourly
minimum wage (less than $1 an hour when extrapolated). With such a small amount of money offered, it
is, therefore, unlikely that the results are caused by self-sufficiency.
83
In addition, results from the third experiment advance prior work by improving our understanding of the
connection between financial incentives and existing relationships. As expected, people with existing
communal orientations are more likely to share equally with each other. However, what was surprising
was that friends are just as likely to change their norms of interaction as strangers when money was
introduced. In other words, existing communal relationships do not render people immune to the
undermining effects of financial incentives. It could still be possible that certain types of relationships are
impervious to the effect of financial incentives, however, that would only constitute a small number of
people that with whom we interact.
It is important to note that in the allocation decisions, while the incentives were awarded by the
experimenters, the allocation decision is actually between the participant and another party (not with the
experimenters). Hence the results do not necessarily reflect how people would respond to allocation
decisions when it is the requester who is offering the financial rewards. However, I believe that the effects
of financial incentives have an overall framing effect that changes the payee’s subsequent mindset and
their interaction norms not only with the person or people who paid them, but with third parties as well.
Lastly, re-examining the impact of financial incentives on intrinsic motivation and task performance is
not the primary focus of this work, the results offered no evidence to support crowding-out, either at small
or fairly average payment levels (about $0.25-$0.50 per question and 6.8 cents for 5 minutes of
transcription, or $1.78 for 10 minutes).
4.6.1 Practical Contributions
The most direct application of this study concerns the use of financial incentives in interpersonal
exchanges. Advances in electronic payment services have reduced the overhead costs of financial
exchanges in everyday interactions. PayPal, one of the most popular e-commerce businesses that supports
payments and money transfers online, has 73 million active accounts as of 2009 and boasts a healthy $16
billion total value of transaction in the first quarter of 2009 alone (eBay shareholders’ report). Users of
services such as PayPal can now promise and transfer financial rewards for goods or assistance from afar.
Even though we are empowered with the option of offering financial incentives for help, we must
carefully consider what we want to get out of the interaction and what type of relationship we plan on
establishing with the helper. As the studies presented herein have shown, what is offered may not only
have an impact on the quality of help, but may also alter the relationship.
In addition, findings also have implications for encouraging contributions in online communities, where
under-contribution is a prevalent problem (e.g., Butler, 1999). A growing number of online communities
are experimenting with the use of financial incentives to attract participation and contribution (e.g.,
84
Mahalo, Squidoo, stickK). However, the tradeoff between immediate participation and long-term
relationship building needs to be considered. If financial incentives affect the relational framing between
community members and are changing the nature of the conversations, then these incentives may have an
adverse effect on the creation of social bonds. Much existing work has shown that these types of
socializing between community members are vital for task performance, satisfaction, and the long-term
success of these communities (Barge & Schlueter, 2004; Bauer et al., 2007; Saks, Uggerslev, & Fassina,
2007). Furthermore, the findings presented herein also suggest that financial incentives may corrupt
existing relationships. This implies that existing sites are also susceptible to relationship changes if an
economic system is introduced.
Outside of interpersonal relationships, the findings also have practical implications for branding and
marketing. Research has shown that consumers relate to brands in the same way they do with people in
social contexts (Fournier, 1998; Muniz Jr. & O’Guinn, 2001). Social relationship theory may then be
extended to person-brand relationships. People may adhere to exchange-based norms when interacting
with certain brands and communal-based norms when interacting with other brands. Aggrawal tested this
idea and showed that brand satisfaction is dependent on the company’s ability to behave according to the
expected social norms, just like satisfaction with people is dependent on their ability to behave according
to the norms. My results suggest that brands’ use of financial rewards, perhaps through marketing ploys
or loyalty programs, can affect costumers’ relationship orientations with the brand. Companies that use
financial rewards may alter their customer’s perceived relationship with the brand, from a more
communal-social relationship, to a more exchange-transactional relationship.
4.7 Conclusion
This work provides an important glimpse into the potential social cost of financial incentives. Evidence
presented indicates that financial incentives are indeed more often used in exchange-oriented transactions
than in social-conversational interactions, but, more importantly, offering financial incentives can affect
subsequent relationship orientations. Offering financial rewards for help can lead to fewer social
responses and future interactions that are based on exchanged-norms instead of communal-norms.
Hence, if you ever need help translating a paragraph of from English to Thai, you should not only
consider how financial incentives can impact the likelihood and quality of the help, but also think about
the social cost.
85
Chapter 5
CONCLUSION
The goal of this thesis was to examine the use of market mechanisms to help to allocate our resources for
information exchange efficiently. I presented in this thesis a series of studies and experiments that test the
feasibility and examines the strengths and weaknesses of applying market mechanisms to support
information exchange. Here, I present an overview of the central findings.
5.1 Practical Contributions
From a practical standpoint, I have shown how markets can both support and undermine information
exchange. I also offered guidelines on how to design these markets.
5.1.1 Why Use Markets
In theory, two-sided market solutions differ from other solutions due to their many desired properties.
First, they allow for signaling and screening, which reduce the problems of information asymmetry.
Second, they enable the sharing of wealth and exchange surplus, and the financial rewards help to align
the asymmetrical sender and receiver motivations.
The study presented in chapter 1 is the first to demonstrate empirically that a market condition for
information exchange can improve the welfare of users. This is then followed by my studies of question
and answer (Q&A) services, in which I found that, to a certain extent, question askers can use market
pricing to their advantage. The pricing system reduces the frivolous questions and offers a mechanism for
question askers to raise the salience of the more difficult questions. Also, the addition of financial
incentives can solicit higher answering effort. Furthermore, the added pricing information may be able to
support knowledge search and help to organize the knowledge repository. From a functional perspective,
markets can indeed help information exchange.
86
5.1.2 Why Not to Use Markets
Despite the potential for markets to facilitate information exchange, I also found drawbacks in employing
markets to facilitate information exchange.
First, there is the problem of transaction costs. From the empirical laboratory study presented in Chapter
1, I found that using markets for information exchange can increase deliberation costs, which can
undermine exchange efficiency. Instead of making a binary decision as to whether or not to engage in an
exchange, like we do with our existing communication technologies, using markets for information
exchange may require us first to quantify our exact exchange surplus and then select a bidding or reserve
price. Not only does the increase in the number of decisions required increase opportunities for error, it
also requires more cognitive resources.
Second is the problem of social costs. From the mimir study presented in Chapter 2 and the follow-up
experiments presented in Chapter 3, I carefully examined how using money changes the perception of
exchanges and the subsequent relationships between people. Specifically, I found that, when money is
introduced, it reduces the social interaction between people; it also changes how people share joint
resources — people become more focused on individual inputs. For the purpose of exchanging
information, this may not be a problem. However, we are social beings and, in many cases, social
interactions are desirable. Social interactions are not only vital for our health (e.g., Kaplan, Cassel &
Gore, 1977), but can also lead to long-run productivity benefits (Kraut et al., 1990).
5.1.3 How to Best Use Markets
Given that using markets for information exchange both incurs costs and yields benefits, how and when
should we leverage these markets? Through my studies on mimir and Mahalo Answers, I have presented
various design guidelines to improve Q&A markets.
To reduce transaction costs, pricing support should be incorporated into these markets. An example is to
present feedback on pricing. In mimir, I presented a design that provides user feedback on average reserve
price in the real-time exchange interface. With more data and with the right prediction models, that can be
extended to include much better feedback. For example, senders may be given the option to adjust their
bid price to see how changing the bid price changes the projected number of answers, answer length, and
maybe even answer quality. Alternatively, using those same models, we can simply suggest the bid prices
based on senders’ information needs. Even without intelligent predictions, a design recommendation
based on the empirical study is to offer only a few pre-set price tiers. From the distribution of exchange in
the Q&A dataset, it seems that there should be more tiers at the lower-end price points since there are
87
more low-valued questions (power-law distribution). For example, a four-tiered system (e.g., $1.00,
$2.00, $5.00 and $20.00) may provide sufficient tiers to help to differentiate the information requests
while minimizing deliberation costs.
I believe that the more challenging problem is the social costs that arise from the use of financial
incentives. Experiments in chapter 4 show that this is a real problem that can even affect friendships.
There are some interface design guidelines that I offered, one of which is to soften the financial framing
for these market-based communication technologies. Instead of using words such as “money,” “pay,” and
“cost,” a different set of terms can be used that do not highlight the exchange-oriented nature of the
interactions. Coupled with the aforementioned idea of a tiered pricing system, instead of a “$20.00”
request, it may be referred to as a “VIP” or “urgent” request. This may help to disassociate the money
framing from the interaction, but still help by preserving the signaling and screening aspects of the market
system.
Specific to Q&A communities, my findings suggest that we should design interfaces for two different
usages — information and social. Any information exchange service may support both information and
social exchanges, but they will have different interfaces, different interactions and different incentive
structures. Information exchanges will be market-based, and will have the more standard question and
answer fields and affordances. On the other hand, more discussion-oriented exchanges will use more fun
and social rewards (e.g., badges) and will have more of a discussion-oriented interface. Users will be able
to build social bonds through the more social topics, but can also easily find and respond to serious
informational questions.
5.2 Theoretical Contributions
Economic markets have become such an integral part of our society that we often forget that they are
man-made institutions that we have only relied for a short and recent part of human history. While
research in the field of behavioral economics has significantly improved our understanding of how
humans behave in market situations, our knowledge is still limited, especially when it comes to applying
markets to novel domains.
In Chapter 2, I demonstrated empirically that using markets can improve communication welfare, but
more importantly, findings highlight the tradeoff between the expressiveness of the market and
deliberation costs. More expressive markets should allow us to provide more precise signals, but the
higher precision also demands more deliberation. Even though the notion of deliberation costs in
88
economic decisions is not new, considering it as a factor in markets for communication is. The results
presented herein can help to create more accurate models of communication decisions.
In Chapter 3, I studied how market systems can affect help-seeking and help-giving behaviors. Those
studies contribute to the growing set of literature that shows that while paying solicits more effort, it may
not improve the quality of work. In addition, those studies also demonstrate how social norms can impact
help decisions in market systems. The decision as to whether or not to pay is dependent on the actual
exchange needs and the nature of the exchange. Specifically, it shows that people are more likely to pay
when seeking information than initiating conversation.
In Chapter 4, I presented experiments that elucidate the association between money and social
relationships. Prior work suggests that money changes how people engage tasks, but it does not explicitly
measure how. Here, I showed that money affects social orientation and reduces social interaction. In
addition, money suggests equity-based allocation norms between strangers, and can undermine existing
equality-based allocation norms between friends.
5.3 Closing Remarks
From the printing press to the internet, from the telegraph to the Smartphone, advancements in
communication technologies have been responsible for the accelerated spread of information and
knowledge throughout human history. However, while these technologies have gotten better, our brains
have not changed — we have about the same cognitive prowess as we did a thousand years ago. We have
arrived at a point in human history where the most pressing communication issues are not the engineering
challenges of how to make these technologies faster, richer, and more flexible; instead, we are faced with
the growing human-computer interaction problem of how to maximize users’ benefits from using existing
and future communication technologies, given our limited cognitive resources.
Economic markets offer a solution to this problem. By designing, building and studying markets for
information exchange, this dissertation has demonstrated the feasibility and the benefits of using these
markets. But the studies also highlight some of the drawbacks of employing these types of markets for
interpersonal exchanges. I hope that the knowledge gained from this thesis will help us to design and
develop computer-mediated communication technologies that are sensitive to our limited resources of
attention and time. In the long run, these results will also help to pave the road for novel incentive
mechanisms that are able to leverage both social and economic forces while minimizing their potential to
undercut each other. They will then lead to more efficient interpersonal interactions while preserving the
important social interactions.
89
References
Ackerman, M. S. & Palen, L. (1996). The Zephyr Help Instance: promoting ongoing activity in a CSCW
system. In Proceedings of ACM Conference on Human Factors in Computing Systems (CHI
1996), pp. 268-275. ACM Press.
Adamczyk, P. D., & Bailey, B. P. (2004). If not now, when?: the effects of interruption at different
moments within task execution. In Proceedings of the ACM Conference on Human Factors in
Computing Systems (CHI 2004), pp. 271-278. ACM Press.
Adamic, L. A., Zhang, J., Bakshy, E., & Ackerman, M. S. (2008). Knowledge sharing and yahoo
answers: everyone knows something. In Proceeding of the 17th international Conference on
World Wide Web (WWW 2008), pp. 665-674. ACM Press.
Aggarwal, P. (2004). The Effects of Brand Relationship Norms on Consumer Attitudes and Behavior,
Journal of Consumer Research, 31 (1), 87-101.
Andreoni, J. (1989). Giving with impure altruism: Applications to charity and Ricardian equivalence.
Journal of Political Economy, 97 (6), 1447-1458.
Andreoni, J. (1990). Impure altruism and donations to public goods: A theory of warm-glow giving.
Economic Journal, 100, 464-477.
Ariely, D., Bracha, A., & Meier. S. (2009). Doing Good or Doing Well? Image Motivation and Monetary
Incentives in Behaving Prosocially. American Economic Review. Forthcoming.
Austin, W. (1980). Friendship and Fairness: Effects of Type of Relationship and Task Performance on
Choice of Distribution Rules. Personality and Social Psychology Bulletin, 6(3), 402-408.
Avrahami, D., Gergle, D., Hudson, S. E., & Kiesler, S. (2007b). Improving the match between callers and
receivers: A study on the effect of contextual information on cell phone interruptions. Behaviour
& Information Technology, 26 (3), 247-259.
Back, A. (1997). Hashcash: A denial of service counter-measure.
http://www.hashcash.org/papers/hashcash.pdf.
Bailey, B. P., Konstan, J. A., & Carlis, J. V. (2001). The effects of interruptions on task performance,
annoyance, and anxiety in the user interface. In Proceedings of Human-Computer Interaction
(INTERACT 2001), pp. 593-601. IOS Press.
Barge, J. K., & Schlueter, D. W. (2004). Memorable messages and newcomer socialization. Western
Journal of Communication, 68, 233-257.
Batson, D. C. (1998). Altruism and Prosocial Behavior. In Fiske, S. T., Gilbert, D. T. & Lindzey, G
(Eds.), Handbook of Social Psychology (pp. 282-316). Boston: McGraw-Hill.

90
Batson, C. D., Harris, A.C., McCaul, K.D., Davis, M., & Schmidt, T. (1979). Compassion or Compliance:
Alternative Dispositional Attributions for One's Helping Behavior. Social Psychology Quarterly,
42 (4), 405-409.
Batson, D., Ahmad, N., & Tsang, J. (2002). Four Motives for Community Involvement. Journal of Social
Issues, 58, 429-445.
Batson, C. D., & Powell, A. A. (2003). Altruism and prosocial behavior. In T. Millon & M. J. Lerner
(Eds.), Handbook of psychology, Volume 5: Personality and social psychology (pp. 463-484).
Bauer, T., Bodner T., Erdogan B., Truxillo D., & Tucker J. (2007). Newcomer adjustment during
organizational socialization: A meta-analytic review of antecedents, outcomes, and methods.
Journal of Applied Psychology, 92, 707-721.
Bellotti, V., & Edwards, K. (2001). Intelligibility and Accountability: Human Considerations in Context-
Aware Systems. Human-Computer Interaction, 16, 193-212.
Belk, Russell W. & Gregory S. Coon. (1993). Gift Giving as Agapic Love: An Alternative to the
Exchange Paradigm Based on Dating Experiences. Journal of Consumer Research, 20, 393–417.
Benabou, R. & Tirole, J. (2006). Incentives and Prosocial Behavior. American Economic Review, 96 (5),
1652-78.
Benkler, Y. (2002). Coase's penguin,or Linux and the nature of the firm. Yale Law Journal, 112, 367-445.
Bly, S.A., Harrison, S.R., Irwin, S. 1993. Media spaces: bringing people together in a video, audio, and
computing environment. ACM Communications, 36, 28–46.
Bonner, S. E., & Sprinkle, G. B. (2002). The effects of monetary incentives on effort and task
performance: Theories, evidence, and a framework for research. Accounting, Organizations and
Society, 27, 303–345.
Burke, M., & Kraut R. (2008). Mind your p's and q's: When politeness helps and hurts in online
communities. In Extended Abstracts of ACM Conference on Human Factors in Computing
Systems (CHI 2008), pp. 268-275. ACM Press.
Butler, B. (1999). When is a group not a group: An empirical examination of metaphors for online social
structure. Pittsburgh, PA: Carnegie Mellon University.
Camerer, C. F. (1988). Gifts as Economic Signals and Social Symbols. American Journal of Sociology,
94, 180-214.
Cameron, J., Banko, K. M., & Pierce W. D. (2001). Pervasive Negative Effects of Rewards on Intrinsic
Motivation: The Myth Continues. The Behavior Analyst, 24 (1) 1-44.
Card, S. K., Newell, A., & Moran, T. P. (1983). The Psychology of Human-Computer Interaction. L.
Erlbaum Associates Inc.
Cheal, D. (1988). The Gift Economy. New York: Routledge.
91
Chen, Y. & Ho, T, K, Y. (2008). Knowledge Market Design: A field Experiment at Google Answers.
Journal of Public Economic Theory, forthcoming.
Cheng, H., Phillips, M., Read, L., Reeves, B., Roy, S., & Rubin, D. (2007). “Attention economy for
attention to messages, tasks and resources.” U.S. Patent 7240826, issued July 10, 2007.
Chin, W.W., Salisbury, W.D., Pearson, A.W., & Stollak, M.J. (1999). "Perceived Cohesion in Small
Groups: Adapting and Testing the Perceived Cohesion Scale in a Small Group Setting," Small
Group Research, 30 (6), 751--766.
Clark, M.S. & Jordan, S.D. (2002). Adherence to communal norms: what it means, when it occurs, and
some thoughts on how it develops, New Directions for Child and Adolescent Development, 95
(Spring), 3-25.
Clark, M.S., Ouellette, R., Powell, M. & Milberg, S. (1987). Recipient’s Mood, Relationship Type, and
Helping. Journal of Personality and Social Psychology, 53, 94-103
Clark, M.S. & Mills, J. (1979). Interpersonal Attraction in Exchange and Communal Relationships.
Journal of Personality and Social Psychology, 37, 12-24
Clark, M.S. & Mills, J. 1993, The Difference Between Communal and Exchange Relationships: What It
Is and Is Not, Personality and Social Psychology Bulletin, 19, 684-691.
Coase, R. H. (1937). The Nature of the Firm. Economica, 4 (16), 386-405
Coffman, K.G. & Odlyzko, A.M. (2000). Internet growth: Is there a "Moore's Law" for data traffic?
Conlisk, John. (1996). Why Bounded Rationality? Journal of Economic Literature, 34 (2), 669-700.
Coombs, Clyde H. (1964). A Theory of Date. New York: John Wiley & Sons, Inc.
Cranor, L.F. & LaMacchia, B.A. (1998). Spam! Communications of the ACM, 41(8), 74–83.
Cupach, W. R., & Metts, S. (1994). Facework. Thousand Oaks, CA: Sage.
Currid, C. (1992). In the 'good old days', issuing a memo could take a good week. Popular Computing,
14(38), p, 81.
Cutrell E., Czerwinski M. & Horvitz E. (2001). Notification, disruption, and memory: Effects of
messaging interruptions on memory and performance. In Proceedings of Human-Computer
Interaction (INTERACT 2001), pp. 263-269. IOS Press
Czerwinski, M., Cutrell, E., & Horvitz, E. (2000). Instant Messaging and Interruptions: Influence of Task
Type on Performance. In Proceedings of the Australian Conference on Computer-Human
Interaction (OZCHI 2000), pp. 356-361.
Dabbish, Laura A. (2006). Coordinating Initiation and Response in Computer-Mediated Communication.
Doctoral Thesis. Carnegie Mellon University.
92
Dabbish, L., & Kraut, R. E. (2004). Controlling Interruptions: Awareness Displays and Social Motivation
for Coordination. In Proceedings of the ACM Conference on Computer Supported Cooperative
Work (CSCW 2004), pp. 182-191. ACM Press.
Davenport, T. H.; Beck, J. C. (2001). The Attention Economy: Understanding the New Currency of
Business. Harvard Business School Press.
Dawes, Robyn M. (1964). Social Selection Based on Multidimensional Criteria. Journal of Abnormal and
Social Psychology, 68, 104-109.
Deci, E. L., Koestner, R., & Ryan, R. M. (1999). A Meta-Analytic Review of Experiments Examining the
Effects of Extrinsic Rewards on Intrinsic Motivation. Psychological Bulletin, 125, 627-668.
Deci, Edward L, & Richard M Ryan. (1985). Intrinsic Motivation and Self-Determination in Human
Behavior. New York, NY: Plenum Press.
Denning, Peter J. (1982). ACM president's letter: electronic junk. Communications of the ACM, 25 (3),
163-165.
DePaulo, B. M., & Fisher, J. D. (1980). The costs of asking for help. Basic and Applied Social
Psychology, 1, 23-35.
Dwork, C., & Naor, M. (1993). Pricing via processing for combating junk mail. In Advances in
Cryptology-Crypto ’92: Lecture notes in computer science, 740, 139–147. New York: Springer-
Verlag.
Edelman, B. Earnings and Ratings at Google Answers. (2004). Unpublished Manuscript.
Eisenberg, A. (1994). E-mail and the new epistolary age. Scientific American, 270, 128.
Eisenberger, R., Pierce, W. D., & Cameron, J. (1999). Effects of reward on intrinsic motivation: Negative,
neutral, and positive. Psychological Bulletin, 125, 677-691.
Fahlman, S.E. (2002). Selling Interrupt Rights: A Way to Control Unwanted E-Mail and Telephone Calls.
IBM Systems Journal, 41 (4), 759-766.
Fehr, E. & Fischbacher, U. (2004). Social norms and human cooperation. TRENDS in Cognitive Sciences
8 (4), 185-190.
Fehr, E. & Gaechter, S. (2001) Do Incentive Contracts Crowd out Voluntary Cooperation? IEW -
Working Papers iewwp034, Institute for Empirical Research in Economics - IEW.
Fish R., Kraut R., Root R. & Rice R. (1992) Evaluating video as a technology for informal
communication. In Proceedings of ACM Conference on Human Factors in Computing Systems
(CHI 1992), pp. 37-4. ACM Press.
Fisher, J. D., DePaulo, B. M., & Nadler, A. (1981). Extending Altruism beyond the Altruistic Act: The
effects of Aid on the Help Recipient. In Altruism and Helping behavior.
93
Fiske, A. P. (1992). The Four Elementary Forms of Sociality: Framework for a Unified Theory of Social
Relations. Psychological Review, 99, 689-723.
Fiske, A. P. & Tetlock, P. (1997). Taboo Tradeoffs: Reactions to Transactions that Transgress Spheres of
Exchange. Political Psychology 17, 255–294.
Fogarty, J., Hudson, S. E., Atkeson, C. G., Avrahami, D., Forlizzi, J., Kiesler, S., Lee, J. C., & Yang, J.
(2005). Predicting Human Interruptibility with Sensors. ACM Transactions on Computer-Human
Interaction (TOCHI), 12(1), 119-146.
Fournier, S. (1998), “Consumers and Their Brands: Developing Relationship Theory in Consumer
Research,” Journal of Consumer Research, 24 (March), 343–73.
Frey, B.S., & Götte, L. (1999) “Does Pay Motivate Volunteers?” Institute for Empirical Economic
Research, University of Zurich, Working Paper, 7.
Frey B.S.& Jegen R. (2000). Motivation Crowding Theory: A Survey of Empirical Evidence, Revised.
IEW - Working Papers iewwp049, Institute for Empirical Research in Economics - IEW.
Gaver, W., Moran, T., MacLean, A., Lovstrand, L., Dourish, P., Carter, K., & Buxton, W. (1992).
Realizing a video environment: EuroPARC’s RAVE system. In Proceedings of ACM Conference
on Human Factors in Computing Systems (CHI 1992), pp. 27–35. ACM Press.
Gaertner, L., & Insko, C.A. (2000). Intergroup discrimination in the minimal group paradigm:
Categorization, reciprocation, or fear? Journal of Personality and Social Psychology, 79, 77-94.
Galegher, J., Sproull, L., & Kiesler, S. (1998). Legitimacy, authority, and community in electronic
support groups. Written Communication, 15, 493-530.
Gneezy, U. & Rustichini, A., (2000a). Pay Enough Or Don't Pay At All. The Quarterly Journal of
Economics, 115(3), 791-810. MIT Press.
Gneezy, U. & Rustichini, A. (2000b). A Fine is a Price. Journal of Legal Studies, 29, 1-18.
Goffman, E. (1959). The Presentation of Self in Everyday Life. New York: Doubleday.
Goffman, E. (1961). Encounters: Two Studies in the Sociology of Interaction - Fun in Games & Role
Distance. Indianapolis: Bobbs-Merrill.
Gonzalez, V., & Mark, G. (2004). "Constant, Constant, Multi-tasking Craziness”: Managing Multiple
Working Spheres. In Proceedings of ACM Conference on Human Factors in Computing Systems
(CHI 2004), pp. 113-120. ACM Press.
Goodman, J., Cormack, G. V., & Heckerman, D. (2007). Spam and the ongoing battle for the inbox.
Communnications of the ACM, 50 (2), 24-33.
Google questions need for Google Answers
http://www.computerworld.com/action/article.do?command=viewArticleBasic&articleId=900548
1&intsrc=hm_list
94
Gouldner, A.W. (1960). The norm of reciprocity: A preliminary statement. American Sociological
Review, 25, 161-178.
Gray, A. & Haahr, M. (2004) Personalised, Collaborative Spam Filtering. In Proceedings of Email and
Anti-Spam (CEAS 2004); www.ceas.cc/papers-2004/132.pdf.
Greenberg, J. (1983). Equity and Equality as Clues to the Relationship between Exchange Participants.
European Journal of Social Psychology, 13, 195-196.
Greenberg, M. S. & Shapiro S. P. (1971). Indebtedness: An Adverse Aspect of Asking for and Receiving
Help. Sociometry, 34 (2), 290-301.
Gruen, D. M. (1996). The Role of External Resources in the Management of Multiple Activities, PhD
Dissertation, University of California at San Diego.
Handel, M. & Herbsleb, J. D. (2002). What is Chat doing in the workplace? In Proceedings of the ACM
Conference on Computer-Supported Cooperative Work (CSCW 2002), pp. 1-10. ACM Press.
Hardin, G. 1977. The Limits of Altruism: An Ecologist’s View of Survival. Bloomington: Indiana
University Press.
Harper, F. M., Moy, D., & Konstan, J. A. (2009). Facts or Friends?: Distinguishing Informational and
Conversational Questions in Social Q&A Sites. In Proceedings of ACM Conference on Human
Factors in Computing Systems (CHI 2009), pp. 759-768. ACM Press.
Harper, F. M., Raban, D., Rafaeli, S., & Konstan, J. A. (2008). Predictors of answer quality in online
Q&A sites. In Proceedings of ACM Conference on Human Factors in Computing Systems (CHI
2008), pp. 865-874. ACM Press.
Hayek, F. A. (1945). The uses of knowledge in society. American Economic Review, 35, 519–530.
Hermalin, B. E. and Katz, M. L. (2004). Sender or Receiver: Who Should Pay to Exchange an Electronic
Message? RAND Journal of Economics, 35(3), 423–447.
Heyman, J. & Ariely, D. 2004. "Effort for Payment: A Tale of Two markets," Psychological Science, 15
(11) 787-793.
Ho, J., & Intille, S. S. (2005). Using Context-Aware Computing to Reduce the Perceived Burden of
Interruptions from Mobile Devices. In Proceedings of ACM Conference on Human Factors in
Computing Systems (CHI 2005), pp. 909-918.
Horvitz, E., Apacible, J., & Subramani, M. (2005). Balancing Awareness and Interruption: Investigation
of Notification Deferral Policies. In Proceedings of the Tenth Conference on User Modeling (UM
2005), pp. 433-437. Springer.
Horvitz, E., Jacobs A. & Hovel D. (1999) “Attention sensitive alerting“ In Proceedings of Conference on
Uncertainty and Artificial Intelligence (UAI 1999), pp. 305-313.
95
Horvitz, E., Koch, P., Kadie, C. M., & Jacobs, A. (2002). Coordinate: Probabilistic Forecasting of
Presence and Availability. In Proceedings of the Conference on Uncertainty in Artificial
Intelligence (UAI 2002), pp. 224-233.
Hsieh, G. & Counts, S. (2009). mimir: A Market-Based Real-Time Question and Answer Service. In
Proceedings of ACM Conference on Human Factors in Computing Systems (CHI 2009), pp. 769-
778. ACM Press.
Hsieh, G., Lai, J., Hudson, S.E., & Kraut, R.E. (2008). Using Tags to Assist Near-Synchronous
Communication. In Proceedings of ACM Conference on Human Factors in Computing Systems
(CHI 2008), pp. 223-226. ACM Press.
Hsieh, G., Kraut, R., & Hudson, S.E. (2010). Why pay?: exploring how financial incentives are used for
question & answer. In Proceedings of ACM Conference on Human Factors in Computing Systems
(CHI 1992), pp. 305-314. ACM Press.
Hsieh, G., Kraut, R., Hudson, S.E., & Weber, R. (2008). Can Markets Help?: Applying Market
Mechanisms to Improve Synchronous Communication. In Proceedings of the ACM Conference
on Computer-Supported Cooperative Work (CSCW 2008), pp. 535-544. ACM Press.
Hudson, J. M., Christensen, J., Kellogg, W. A., & Erickson, T. (2002). “I'd be overwhelmed, but it's just
one more thing to do”: Availability and Interruption in Research Management. In Proceedings of
ACM Conference on Human Factors in Computing Systems (CHI 2002), pp. 97-104. ACM Press.
Hudson, S. E. & Smith, I. (1996). Electronic mail previews using non-speech audio. In Proceedings of
ACM Conference on Human Factors in Computing Systems (CHI 1996), pp. 237-238. ACM
Press.
Ipeirotis, P. (2008). Mechanical Turk: The Demographics. http://behind-the-enemy-
lines.blogspot.com/2008/03/mechanical-turk-demographics.html
Iqbal, S. T., Adamczyk, P. D., Zheng, X. S., & Bailey, B. P. (2005). Towards an Index of Opportunity:
Understanding Changes in Mental Workload During Task Execution. In Proceedings of ACM
Conference on Human Factors in Computing Systems (CHI 2005), pp. 311-320. ACM Press.
Isaacs, E., Walendowski, A., & Ranganathan, D. (2002). Hubbub: A Sound-Enhanced Mobile Instant
Messenger that Supports Awareness and Opportunistic Interactions. In Proceedings of ACM
Conference on Human Factors in Computing Systems (CHI 2002), pp. 179–186. ACM Press.
Isaacs, E., Walendowski, A., Whittaker, S., Schiano, D. J., & Kamm, C. (2002). The Character,
Functions, and Styles of Instant Messaging in the Workplace. In Proceedings of the ACM
Conference on Computer-Supported Cooperative Work (CSCW 2002), pp. 11-22. ACM Press.
Janes, J., Hill, C., & Rolfe, A. (2001). Ask-an-Expert Services Analysis. Journal of the American Society
for Information Science and Technology, 52 (13), pp. 1106-1121.
96
Jancke, G., Venolia, G. D., Grudin, J., Cadiz, J. J., & Gupta, A. (2001). Linking Public Spaces: Technical
and Social Issues. In Proceedings of ACM Conference on Human Factors in Computing Systems
(CHI 2001), pp. 530 – 537. ACM Press.
Jenkins, G. D., Jr., Mitra, A., Gupta, N., & Shaw, J. D. (1998). Are financial incentives related to
performance? A meta-analytic review of empirical research. Journal of Applied Psychology, 83,
777–787.
John, O. P., Naumann, L. P., & Soto, C. J. (2008). Paradigm Shift to the Integrative Big-Five Trait
Taxonomy: History, Measurement, and Conceptual Issues. In O. P. John, R. W. Robins, & L. A.
Pervin (Eds.), Handbook of personality: Theory and research (pp. 114-158). New York, NY:
Guilford Press.
Johnson, C. L. (1974). Gift Giving and Reciprocity Among Japanese-Americans in Honolulu. American
Ethnologist, 1(2), 295-308.
Joyce, E. & Kraut, R.E. (2006). Predicting Continued Participation in Newsgroups. Journal of Computer-
Mediated Communication, 11(3), article 3.
Jung, Y., Persson, P., & Blom, J. (2005). DeDe: design and evaluation of a context-enhanced mobile
messaging system. In Proceedings of ACM Conference on Human Factors in Computing Systems
(CHI 2005), pp. 351-360. ACM Press.
Kahneman, Daniel. (2003). Maps of Bounded Rationality: Psychology for Behavioral Economics. The
American Economic Review, 93 (5), 1449-1475.
Kendon, Adam. (1990). Conducting interaction: patterns of behavior in focused encounters, Cambridge
University Press.
Kraut, R. E., Fish, R., Root, R., & Chalfonte, B. (1990). Informal communication in organizations: Form,
function, and technology. In Human reactions to technology: Claremont symposium on applied
social psychology, pp. 145-199.
Kraut, R. E., Sunder, S., Telang, R., & Morris, J. (2005). Pricing electronic mail to solve the problem of
spam. Human Computer Interaction, 20, 195-223.
Krishnamurthy, B. (2004). SHRED: Spam Harassment Reduction via Economic Disincentives. Working
Paper, AT&T Research.
Lampe, C. & Johnston, E. (2005). Follow the (slash) dot: Effects of Feedback on New Members in an
Online Community. In Proceedings of the ACM Conference on Supporting Group Work (GROUP
2005), pp. 11-20.
Landis, J. R. & Koch, G. G. (1977). The Measurement of Observer Agreement for Categorical Data.
Biometrics, 33, 159–174.

97
Lea, S.E.G. & Webley, P. (2006). Money as Tool, Money as Drug. Behavioral and Brain Sciences, 29,
161-209
Ledyard, J. (1995). Public Goods: A Survey of Experimental Research. In Kagel, J. H. & Roth, A. E.
(eds.), The Handbook of Experimental Economics (pp. 111-194). Princeton, NJ: Princeton
University Press.
Leibenluft, J. (2007). A Librarian’s Worst Nightmare. Yahoo! Answers, where 120 Million Users Can be
Wrong. Slate Magazine, Dec. 7, 2007.
Lepper, M. R. & Greene, D., eds. (1978). The Hidden Costs of Reward: New Perspectives on the
Psychology of Human Motivation. New York: Erlbaum.
Levi-Strauss, C. (1965). The Principle of Reciprocity. In Coser L.A. and Rosenberg B. (eds.),
Sociological Theory. New York: Macmillian Co.
Levine, J. & Moreland, R. (1994). Group Socialization: Theory and Research. European Review of Social
Psychology, 283-308.
Levine, J. R. (2005). “Experiences with Greylisting,” Proc. 2nd Conf. Email and Anti-Spam (CEAS 05),
2005; www.ceas.cc.
Ling, K., Beenen, G., Ludford, P. J., Wang, X., Chang, K., Li, X., Cosley, D. Frankowski, D., Terveen,
L., Rashid, A., Resnick, P., & Kraut, R. (2005). Using social psychology to motivate
contributions to online communities. Journal of Computer-Mediated Communication, 10 (4),
article 10.
Liu, Y. & Agichtein, E. (2008). On the evolution of the yahoo! answers QA community. In Proceedings
of the ACM SIGIR Conference on Research and Development in information Retrieval (SIGIR
2008), pp. 737-738. ACM Press.
Locke, E. A., Feren, D. B., McCaleb, V. M., Shaw, K. N., & Denny, A. T. (1980). The relative
effectiveness of four methods of motivating employee performance. In Duncan, K. D.,
Gruneberg, M. M. & Wallis, D. (Eds.), Changes in working life (pp. 363-388). New York:
Wiley.
Loder, T., Van Alstyne, M., & Wash, R. (2006). An Economic Response to Unsolicited Communication.
Advances in Economic Analysis & Policy, 6 (1), Article 2.
Mark, G., Gonzalez, V., & Harris, J. (2005). No Task Left Behind? Examining the Nature of Fragmented
Work. In Proceedings of the ACM Conference on Human Factors in Computing Systems (CHI
2005), pp. 321-330. ACM Press.
Marti, S. (2005). Autonomous Interactive Intermediaries: Social Intelligence for Mobile Communication
Agents. Doctoral Thesis. Massachusetts Institute of Technology.

98
Marti, S. & Schmandt, C. (2005). Giving the caller the finger: collaborative responsibility for cellphone
interruptions. In Extended Abstracts on Human Factors in Computing Systems (CHI 2005), pp.
1633-1636. ACM Press.
Marx, K. (1932) Capital. Dent. (Originally published 1867).
Matthews, T., Dey, A. K., Mankoff, J., Carter, S., & Rattenbury, T. (2004). A Toolkit for Managing User
Attention in Peripheral Displays. In Proceedings of the ACM Symposium on User interface
Software and Technology (UIST 2004), pp. 247-256. ACM Press.
McFarlane, D. (2002). Comparison of four primary methods for coordinating the interruption of people in
human-computer interaction. Human-Computer Interaction, 17 (1), pp. 63-139.
Milewski, A. E., & Smith, T. M. (2000). Providing Presence Cues to Telephone Users. In Proceedings of
the ACM Conference on Computer-Supported Cooperative Work (CSCW 2000), pp. 89-96. ACM
Press.
Mills, J., Clark, M. S., Ford, T., & Johnson, M. (2004). Measuring communal strength. Personal
Relationships, 11, 213-230.
Marx, M. & Schmandt, C. (1996). MailCall: message presentation and navigation in a nonvisual
environment. In Proceedings of the ACM Conference on Human Factors in Computing Systems
(CHI 1996), pp. 165-172. ACM Press.
Mauss, M. (1954). The Gift. London: Cohen & West.
Monk, C. A. (2004). The effect of frequent versus infrequent interruptions on primary task resumption. In
Proceedings of the Human Factors and Ergonomics Society (HFES 2004), pp. 295-299. Human
Factors and Ergonomics Society.
Montgomery, B. (1988). Quality Communication in Personal Relationships. In Duck, S. (ed), Handbook
of Personal Relationships (pp. 343-359). Chichester: Wiley.
Moreland, R. L., & Levine, J. M. (2002). Socialization and trust in work groups. Group Processes &
Intergroup Relations, 5, 185-201.
Muniz, A. M., Jr., & O’Guinn, T. C. (2001). Brand Community. Journal of Consumer Research, 27
(March), 412–32.
Nardi, B. A., Whittaker, S., & Bradner, E. (2000). Interaction and Outeraction: Instant Messaging In
Action. In Proceedings of the ACM Conference on Computer-Supported Cooperative Work
(CSCW 2000), pp. 79-88. ACM Press.
Nelson, L., Bly, S., and Sokoler, T. (2001). Quiet calls: talking silently on mobile phones. In Proceedings
of the ACM Conference on Human Factors in Computing Systems (CHI 2001). pp. 174-181.
ACM Press.
99
Nonnecke, B. & Preece, J. (2000). Lurker Demographics: Counting the Silent. In Proceedings of the ACM
Conference on Human Factors in Computing Systems (CHI 2001). pp. 73-80. ACM Press.
Opsahl, R. L. & Dunnette, M. D. (1966). The Role of Financial Compensation in Industrial Motivation.
Psychological Bulletin, 66, 94-96.
Pataki, S., Shapiro, C., & Clark, M. S. (1994). Acquiring distributive justice norms: Effects of age and
relationship type, Journal of Social and Personal Relationships, 11, 427–442.
Pedersen, E. R. (2001). Calls.calm: Enabling Caller and Callee to Collaborate. In Extended Abstracts of
the ACM Conference on Human Factors in Computing Systems (CHI 2001), pp. 235-236. ACM
Press.
Perlow, L. A. (1999). The Time Famine: Toward a Sociology of Work Time. Administrative Science
Quarterly, 44(1), 57-81.
Pfeffer, J. (1981). Power in Organizations. Marshfield, MA: Pitman Publishing.
Pomerantz, J., Nicholson, S., Belanger, Y., Lankes, R. D. (2004). The Current State of Digital Reference.
Information Processing and Management, 40 (2), 347-363.
Preece, J. (2001). Sociability and usability in online communities: Determining and measuring success.
Behaviour & Information Technology, 20(5), 347-356.
Prendergast, C. (1999). The Provision of Incentives in Firms. Journal of Economic Literature, American
Economic Association, 37(1), 7-63.
Quan-Haase, A., Cothrel, J., & Wellman, B. (2005). Instant messaging for collaboration: A case study of
a high-tech firm. Journal of Computer-Mediated Communication, 10(4), article 13.
Raban, D. R. (2008). "The Incentive Structure in an Online Information Market." Journal of the American
Society for Information Science and Technology, 59(14), 2284-2295.
Rabin, M. (2002). A Perspective on Psychology and Economics. European Economic Review, 46, 657-
685.
Radicati Group. (2009) Email Statistics Report, 2009-2013. (through www.about.com
http://email.about.com/od/emailtrivia/f/emails_per_day.htm)
Rafaeli, S., Raban, D., Ravid, G. 2007. How Social Motivation Enhances Economic Activity and
Incentives in the Google Answers Knowledge Sharing Market. International Journal of
Knowledge and Learning, 3(1), pp. 1-11.
Rainie, L. & Fallows, D. (2004) The CAN-SPAM Act Has Not Helped Most Email Users So Far.
http://www.pewinternet.org/Reports/2004/The-CANSPAM-Act-has-not-helped-most-email-
users-so-far.aspx
100
Reeves, B., Roy, S., Gorman, B., & Morley, T. (2008). A Marketplace for Attention: Responses to
Synthetic Currency Used to Signal Information Importance in E-mail. First Monday [Online], 13
(5).
Regner, T. (2005). Why Voluntary Contributions? Google Answer! CMPO Working Paper Series.
Richins, M. L. & Scott, D. (1992). A Consumer Values Orientation for Materialism and Its Measurement:
Scale Development and Validation. Journal of Consumer Research, 19 (December), 303-316.
Robertson, T. J., Prabhakararao, S., Burnett, M., Cook, C., Ruthruff, J. R., Beckwith, L., & Phalgune, A.
(2004). Impact of Interruption Style on End-User Debugging. In Proceedings of the ACM
Conference on Human Factors in Computing Systems (CHI 2004). pp. 287-294. ACM Press.
Ruth, J.A., Otnes, C. C., & Brunel, F. F. (1999). Gift Receipt and the Reformulation of Interpersonal
Relationships. Journal of Consumer Research, 25 (4), 385 – 400.
Sahami, M., Dumais, S., Heckerman, D., & Horvitz, E. (1998). A Baysian approach to filtering junk e-
mail. AAAI-98 Workshop on Learning for Text Categorization. Tech. Rep. WS-98-05, AAAI
Press. http://robotics.stanford.edu/users/sahami/papers.html.
Sahlins, M. (1965). On the Sociology of Primitive Exchange. In M. Banton (Ed.), The Relevance of
Models for Social Anthropology (Association of Social Anthropologists, Monograph 1, pp. 139-
236).
Saks, A. M., Uggerslev, K. L., & Fassina, N. E. (2007). Socialization tactics and newcomer adjustment: A
meta-analytic review and test of a model. Journal of Vocational Behavior, 70, 413-446.
Sawhney, N. & Schmandt, C. (1999). Nomadic radio: scaleable and contextual notification for wearable
audio messaging. In Proceedings of the ACM Conference on Human Factors in Computing
Systems (CHI 1999). pp. 96-103. ACM Press.
Schwartz, B. (1967). The Social Psychology of the Gift. American Journal of Sociology, 73, 1-11.
Scupelli, P., Kiesler, S., Fussell, S.R., & Chen, C. (2005). Project view IM: a tool for juggling multiple
projects and teams. In Extended Abstracts of ACM Conference on Human Factors in Computing
Systems (SIGCHI), ACM Press, New York.
Seipel C. M. (1971). Premiums-forgotten by theory. Journal of Marketing, 35 (April), 26-34.
Sherry, J. F. Jr. (1983). Gift Giving in Anthropological Perspective. Journal of Consumer Research, 10
(2), 157-168.
Shugan, Steven M. The Cost of Thinking. Journal of Consumer Research, 7(2), pp. 99-111.
Siewiorek, D., Smailagic, A., Furukawa, J., Krause, A., Moraveji, N., Reiger, K., Shaffer, J., and Wong,
F. L. (2003). SenSay: A Context-Aware Mobile Phone. In Proceedings of the 7th IEEE
international Symposium on Wearable Computers (ISWC 2003), pp. 248.
101
Simmel, G. (1950). Sociability. In Kurt Wolff (ed.), The Sociology of Georg Simmel (pp.40-55). New
York: Free Press.
Simon, H.A. (1955). A Behavioral Model of Rational Choice. Quarterly Journal of Economics, 69, 99–
118.
Simon, H. A. (1971). Designing Organizations for an Information-Rich World, written at Baltimore, MD,
in Martin Greenberger, Computers, Communication, and the Public Interest, The Johns Hopkins
Press, ISBN 0-8018-1135-X.
Simon, H.A. (1978). Rationality as process and product of thought. In American Economic Review, 68, 1–
16.
Simon, H.A. & Newell, A. (1971) Human Problem Solving: The State of the Theory in 1970. American
Psychologist, 26, 145-159.
Smith, A. (1776). The Wealth of Nations.
Snow, R., O’Connor, B., Jurafsky, D., & Ng, A. (2008). Cheap and Fast – But is it Good? Evaluation
Non-Expert Annotations for Natural Language Tasks. In Proceedings of Conference on Empirical
Methods in Natural Language Processing (EMNLP 2008), pp. 254-263.
Solan, E. & Reshef, E. (2005). The Effect of Filters on Spam Mail. Discussion Papers 1402, Northwestern
University, Center for Mathematical Studies in Economics and Management Science.
Sproull, L. (1984). The nature of managerial attention. Advances in Information Processing in
Organizations, 1
Sproull, L., & Kiesler, S. (1991). Connections: New Ways of Working in the Networked Organization.
Cambridge, MA: The MIT Press.
, 9-27.
Tang, J.C., Yankelovich, N., Begole, J., Kleek, M.V., Li, F., & Bhalodia, J. (2001). ConNexus to
awarenex: extending awareness to mobile users. In Proceedings of ACM Conference on Human
Factors in Computing Systems (CHI 2001), pp. 221–228. ACM Press.
Templeton, B. (2007). “Proper Principles for Challenge/Response Anti-Spam Systems,” Oct. 2007;
www.templetons.com/brad/spam/challengeresponse.html.
Thaler, R. H. (1994). The Winner's Curse: Paradoxes and Anomalies of Economic Life. Princeton NJ:
Princeton University Press.
Triandis, H. C., & Gelfand, M. J. (1998). Converging measurement of horizontal and vertical
individualism and collectivism. Journal of Personality and Social Psychology, 74, 118-128.
Thompson, L., & DeHarpport, T. (1998). Relationships, goal incompatibility, and communal orientation
relationships in negotiations. Basic and Applied Social Psychology, 20 (1), 33-44.
Titmuss, R. M. (1970). The Gift Relationship. London: Allen and Unwin, 1970.
Trivers, R. L. (1971). The evolution of reciprocal altruism. Quarterly Review of Biology, 46, 35-57.
102
Turner, T. C., Smith, M. A., Fisher, D., & Welser, H. T. (2005). Picturing Usenet: Mapping computer-
mediated collective action. Journal of Computer-Mediated Communication, 10(4), article 7.
Van den Berg, S. R. (1993) Procmail program. Available from ftp.informatik.rwthaachen.de
(137.226.112.172), 1993.
van Baal, J. (1975), Reciprocity and the Position of Women, Assen, The Netherlands: van Gorcum
van Zandt, T. (2004). Information Overload in a Network of Targeted Communication. RAND Journal of
Economics, 35 (3), 542-560.
Vohs, K. D., Mead, N. L., & Goode, M. R. (2006). Psychological consequences of money. Science, 314,
1154–1156.
Viégas, F. B. & Smith, M. (2004). Newsgroup Crowds and AuthorLines: Visualizing the Activity of
Individuals in Conversational Cyberspaces. In Proceedings of the Hawai'i International
Conference on System Sciences (HICSS 2004). IEEE Computer Society, 40109.2.
Walfish, M., Zamfirescu, J., Balakrishnan, H., Karger, D., & Shenker, S. (2006). Distributed quota
enforcement for spam control. In Proceedings of USENIX Symposium on Networked Systems
Design and Implementation (NSDI 2006), pp. 281–296.
Wiberg, M. & Whittaker, S. (2005). Managing availability: Supporting lightweight negotiations to handle
interruptions. ACM Transactions of Computer Human Interaction (TOCHI), 12 (4), 356-387.
Wills, T. A. (1976). Perceptual Consequences of Helping Another Person. Paper presented at the meeting
of the American Psychological Association, Washington, D.C., September 1976.
Wills, T. A. (1978). Perceptions of Clients by Professional Helpers. Psychological Bulletin, 85, 968-1000.
Weisz, J. D., Erickson, T., Kellogg, W. A. (2006). Synchronous broadcast messaging: the use of ICT. In
Proceedings of ACM Conference on Human Factors in Computing Systems (CHI 2006), pp.
1293-1302. ACM Press.
Wentzel, K. R. (1991). Social Competence at School: Relation Between Social Responsibility and
Academic Achievement. Review of Educational Research, 61, 1 - 24.
Williamson, G. M., Pegalis, L., Behan, A., & Clark, M. S. (1996). Affective Consequences of Refusing to
Help in Communal and Exchange Relationships. Personality and Social Psychology Bulletin, 22,
34–47.
Winograd, T. & Flores, F. (1986). Understanding Computers and Cognition: A New Foundation for
Design. Ablex, Norwood.
Zacks, J., Tversky, B., & Iyer, G. (2001). Perceiving, remembering, and communicating structure in
events. Journal of Experimental Psychology: General, 130(1), 29-58.
Zelizer, V.A. (1994). The Social Meaning of Money. Basic Books, New York, NY.