A GAMIFICATION APPROACH APPLICATION TO FACILITATE ...
15
Management and Production Engineering Review Volume 10 • Number 4 • December 2019 • pp. 108–122 DOI: 10.24425/mper.2019.131451 A GAMIFICATION APPROACH APPLICATION TO FACILITATE LEAN MANUFACTURING KNOWLEDGE ACQUISITION Dorota Stadnicka 1 , Ahmed Deif 2 1 Rzeszow University of Technology, Faculty of Mechanical Engineering and Aeronautics, Poland 2 Orfalea College of Business California Polytechnic State University CA, USA Corresponding author: Dorota Stadnicka Rzeszow University of Technology Faculty of Mechanical Engineering and Aeronautics Al. Powstancow Warszawy 12, 35-959 Rzeszow, Poland phone: +48 17 865 14 52 e-mail: [email protected] Received: 19 April 2019 Abstract Accepted: 30 October 2019 Current fast development requires continuous improvement of employees’ skills and knowl- edge. Therefore, companies are looking for the best way for improving the employees’ qual- ifications and understanding of new concepts and tools which have to be implemented in manufacturing areas. One method employs gamification for this purpose. The aim of this paper is to present how gamification can increase the acquisition of knowledge concerning lean manufacturing concept implementation. Gamification is an active learning approach for people who will understand the subject easier by ‘feeling’ and ‘touching’ personally the ana- lysed problems. The research utilized a questionnaire which assessed the game participants’ engagement level. The assessment focused specifically on the participants’ motivation, cogni- tive processing and social aspects. The participants were also examined before and after the game in order to assess the increase of their understanding of different lean manufacturing topics and tools. Five different games with different groups of participants were played. The results confirmed the hypothesis that gamification has a positive impact on the knowledge acquisition as well as on motivation, cognitive processing and social aspects. Finally, various insights on how to better design, conduct and utilize gamification in the similar technical context are presented. Keywords Gamification; knowledge acquisition; lean concept; cognitive processing; motivation; compe- tences. Introduction Companies struggle with the problem of im- proving and updating employees’ knowledge due to the changes continuously implemented, especially in the manufacturing areas of companies. Among such knowledge requirement there is a well-known concept of lean manufacturing which is recognized as an in- creasing transformation trend in industry [1], that supports companies’ development and has a positive effect on their performance [2]. By implementing dif- ferent tools and methods, companies try to increase their leanness and speed their lean transformation in order to reach higher levels [3]. With the implemen- tation of new manufacturing technologies, new or- ganizational methods and new manufacturing tools, the challenge concerning employees’ involvement and their preparation for this new environment in terms of both knowledge and attitude appears. Employees have to be able to undertake new tasks as well as they should be motivated and feel that they can overcome problems that arise in the novelty implementation. Different factors influence the success of lean manu- facturing projects. These include: organizational cul- ture, human factors and internal environment as just examples [4]. Therefore, in any training process, it is important not only to achieve knowledge but also to increase motivation, social skills and understanding of industrial problems. This paper investigates gami- fication as an influential approach which can be used 108
-
Upload
khangminh22 -
Category
Documents
-
view
0 -
download
0
Transcript of A GAMIFICATION APPROACH APPLICATION TO FACILITATE ...

Management and Production Engineering Review
Volume 10 • Number 4 • December 2019 • pp. 108–122DOI: 10.24425/mper.2019.131451
A GAMIFICATION APPROACH APPLICATION TO FACILITATELEAN MANUFACTURING KNOWLEDGE ACQUISITION
Dorota Stadnicka1, Ahmed Deif2
1 Rzeszow University of Technology, Faculty of Mechanical Engineering and Aeronautics, Poland2 Orfalea College of Business California Polytechnic State University CA, USA
Corresponding author:Dorota StadnickaRzeszow University of TechnologyFaculty of Mechanical Engineering and AeronauticsAl. Powstancow Warszawy 12, 35-959 Rzeszow, Polandphone: +48 17 865 14 52e-mail: [email protected]
Received: 19 April 2019 AbstractAccepted: 30 October 2019 Current fast development requires continuous improvement of employees’ skills and knowl-
edge. Therefore, companies are looking for the best way for improving the employees’ qual-ifications and understanding of new concepts and tools which have to be implemented inmanufacturing areas. One method employs gamification for this purpose. The aim of thispaper is to present how gamification can increase the acquisition of knowledge concerninglean manufacturing concept implementation. Gamification is an active learning approach forpeople who will understand the subject easier by ‘feeling’ and ‘touching’ personally the ana-lysed problems. The research utilized a questionnaire which assessed the game participants’engagement level. The assessment focused specifically on the participants’ motivation, cogni-tive processing and social aspects. The participants were also examined before and after thegame in order to assess the increase of their understanding of different lean manufacturingtopics and tools. Five different games with different groups of participants were played. Theresults confirmed the hypothesis that gamification has a positive impact on the knowledgeacquisition as well as on motivation, cognitive processing and social aspects. Finally, variousinsights on how to better design, conduct and utilize gamification in the similar technicalcontext are presented.
KeywordsGamification; knowledge acquisition; lean concept; cognitive processing; motivation; compe-tences.
Introduction
Companies struggle with the problem of im-proving and updating employees’ knowledge due tothe changes continuously implemented, especially inthe manufacturing areas of companies. Among suchknowledge requirement there is a well-known conceptof lean manufacturing which is recognized as an in-creasing transformation trend in industry [1], thatsupports companies’ development and has a positiveeffect on their performance [2]. By implementing dif-ferent tools and methods, companies try to increasetheir leanness and speed their lean transformation inorder to reach higher levels [3]. With the implemen-tation of new manufacturing technologies, new or-
ganizational methods and new manufacturing tools,the challenge concerning employees’ involvement andtheir preparation for this new environment in termsof both knowledge and attitude appears. Employeeshave to be able to undertake new tasks as well as theyshould be motivated and feel that they can overcomeproblems that arise in the novelty implementation.Different factors influence the success of lean manu-facturing projects. These include: organizational cul-ture, human factors and internal environment as justexamples [4]. Therefore, in any training process, it isimportant not only to achieve knowledge but also toincrease motivation, social skills and understandingof industrial problems. This paper investigates gami-fication as an influential approach which can be used
108

Management and Production Engineering Review
to teach/train about complex manufacturing prob-lems. Gamification has already a proven record indifferent educational contexts for many years. Manyexamples of lean education that uses a gamificationapproach in order to increase a company leanness arepresented in the literature [5–8]. This paper focusesmore on how to assess the success of using gamesin a lean manufacturing learning process when ap-plied to both, employees and students (as companiesfuture employees). Furthermore, the study discussesthe idea of what companies should pay special atten-tion to when designing games for their own trainingneeds. Eventually, the analysis offers a set of recom-mendations to the lean manufacturing games devel-opment that will ensure attention, relevance, confi-dence, satisfaction and knowledge acquisition.
First, the paper discusses gamification and itsplace in the learning process. Then, games design-ing problems are deliberated. Next, the games as-sessment framework is discussed. After that, an ex-perimental setup of five selected games is presented.It is followed by the results from the games partic-ipants and the games impact. Finally, observationsand practical recommendations for the lean gamesdesign and training are presented.
Gamification
Gamification is the use of game design elementsand game mechanics in non-game contexts. In an ef-fort to define what a game is, Salen, K. and Zim-merman [9] compared 8 academic definitions, andproposed that a game is “a system in which playersengage in an artificial conflict, defined by rules, thatresults in a quantifiable outcome”. Kim [10] defineda game as: “a structured experience with rules andgoals that’s fun”. Generally, one can claim that gam-ification is attributed to using the game approachto engage a group of people in a designed activ-ity within a specific context. That context can befor example marketing, manufacturing or education.Educational gamification proposes the use of game-like rule systems, player experiences and culturalroles to shape learners’ behaviour. Gaasland [11] re-ported on the wide application of gamification toboth industrial and educational fields. The work [12]presents how different learning styles, defined byFelder-Silverman [13], can be incorporated in games.
In the literature, gamification belongs to a widerfield of studying simulation in learning. Researchwork have identified three categories of simulation-based learning: role play, gaming and computer sim-ulation [14, 15]. These categories are different in theirdesign, objective and scope of application. In a role
playing exercise, participants demonstrate the role ofa specific job or worker in a particular situation fol-lowing a set of rules and interacting with other roleplayers. As for gaming (or gamification as referredto in the rest of this article as), the key elements en-tail interaction within a predetermined context, ofteninvolving forms of competition, cooperation, conflictor collusion. These interactions are constrained bya set of rules and procedures. Finally, computer sim-ulations aim to replicate system characteristics usingmathematics or simple object representations [14].Ellington [16] differentiates between game-based sim-ulations depending on their format. Specifically, hisdifferentiation depends on the distinction made be-tween manual exercises and electronic exercises. Theexamples of manual exercises identified by Elling-ton [16] include card, board and field games. Leanet al. [17] summarise this classification in Fig. 1.
Fig. 1. Typology of simulation(adopted from Lean et al. 2006).
Other recommendations
The questionnaire was developed taking into ac-count important aspects that had arisen from theliterature review. The authors identified the threefollowing design dimensions that need to be consid-ered when gamification is applied as a tool to transferknowledge efficiently.
• Cognitive dimension: Games provide complexsystems of rules for learners to explore through activeexperimentation and discovery. They engage learnersthrough a mastery process and the pre-designed dif-ficult tasks [18]. One critical game design techniqueis to deliver concrete challenges that are tailored toeach learner’s skill level, increasing the difficulty asthe player’s skills expand. Specific, moderately diffi-cult, immediate goals are motivating for learners [19],and they are precisely the sort that games provide[20]. Games also provide multiple routes to success,allowing players to choose their own sub-goals with-in the a larger task. This supports motivation andengagement as well [21].
Volume 10 • Number 4 • December 2019 109

Management and Production Engineering Review
• Emotional dimension: Games invoke a rangeof powerful emotions, from curiosity to frustrationor joy [22]. Furthermore, they help learners over-come negative emotional experiences and sometimesto transform them into positive ones. A clear exam-ple of such transformation in a game is demonstratedin the concept of failure. Since games involve repeat-ed experimentation, they also involve repeated fail-ures. In fact, for many games, the only way to learnhow to play the game is to fail at it repeatedly, learn-ing something each time [20]. Games maintain thispositive relationship with failure by making feedbackcycles rapid and keeping the stakes low. The formermeans that players can keep trying until they suc-ceed; the latter means they risk very little by do-ing so.
• Social dimension: Games permit learners toexperience different roles, asking them to make in-game decisions from their new vantage points [23].Learners can also discover new sides of themselvesin the safe space of play. Gamification can providesocial credibility and recognition for various learningachievements, which, otherwise, might remain invis-ible or even be denigrated by other learners. Recog-nition can be provided by a teacher but gamifica-tion can also allow learners to reward each other[24]. Finally, games enhance various teamwork ethicsamong learners whether in their teams or acrossdifferent teams. This is achieved through promot-ing positive cooperative and competitive social spi-rits.
Gamification assessment methodology
The impact of gamification on the engagementand learning performance of game participants inthis research is captured through the motivational,cognitive and social processing. Different groups ofparticipants were considered for the assessment dur-ing their engagement with various games in theirLean principles training provided by two differentuniversities.
The motivation processing is measured usingthe attention, relevance, confidence, and satisfaction(ARCS) model of motivational design [25, 26]. Thismodel is widely applied in instructional design pro-cesses and connects learning motivation with perfor-mance [19, 27–29]. The model suggests that learn-ing motivation is dependent on four perceptual com-ponents: attention, relevance, confidence and sat-isfaction [29]. Attention refers to the learner’s re-sponse to the perceived instructional stimuli pro-vided by the instruction. Relevance helps learnersassociate their prior learning experience with the
given instruction. Confidence stresses the impor-tance of building learners’ positive expectation to-wards their performance of a learning task. Sat-isfaction comes near the end of the learning pro-cess when learners are allowed to practice new-ly acquired knowledge or skills. ARCS model fo-cuses on the interactions between learners and theinstructional programmes. Its main thesis is root-ed in the expectancy-value theory that views hu-man behaviours as evaluative outcomes among ex-pectations (beliefs), perceived probability for success(expectancy), and perceived impact of success (va-lue) [30].
Cognitive processing was assessed through re-questing the game participants to self-report theirmental effort investment level and the difficulty levelassociated with the learning task on a 9-point sym-metrical Likert scale. The reason for selecting thesetwo cognitive processing dimensions is to try to cap-ture intrinsic cognitive load via the mental effortexperienced as well as the germane cognitive loadvia rating the difficulty the participants encounteredthrough the game.
Social processing was captured with a set ofquestions that integrated both cooperative as wellas competitive interactions. Cooperation will cre-ate many important group dynamics that relateto multiple aspects of lean systems. On the oth-er hand, competitive interaction will increase stu-dents’ engagement enhancing the overall learningexperience.
Lean games characteristics
In order to identify the impact of gamification onthe learning performance through motivational, cog-nitive and social processing, five games were chosento be played by different groups of people. For eachgame, a learning goal, intended learning outcomesand a game scenario were established. Each game ischaracterized by a subject of the game, its duration,a number of rounds, a number of people playing thegame and a number of quality and/or lean tools thatwere incorporated in the game as shown in Tables 1and 2. In Table 2, an additional game complexity cri-terion was presented. It was based on multiplying theduration by the number of rounds and tools incor-porated. This parameter will support a comparativeanalysis that highlights the impact of game design-ing on learning and motivation. When selecting thegames, the following criteria were taken into consid-eration:• all games should concern the same concept: lean
manufacturing,
110 Volume 10 • Number 4 • December 2019

Management and Production Engineering Review
• all games should have incorporated lean tools,• all games should require team work,• the games should have different complexity,• the games should require the similar number of
participants,
• the games with different duration and differentnumber of rounds should be found.All games required from the participants some
lean knowledge in order to solve different manufac-turing problems.
Table 1Games goals and scenarios.
Nameof the gameand subject
Goalof the game
Scenario
Assembly game (AG)– Ball-pens
Understanding the flowand possibilities of increas-ing efficiency with the useof lean tools
1st Round – Performing an assembly process to identify and under-stand existing problems2nd Round – Analysing, with the use of the chosen by participantsquality tools, in order to identify sources of problems and to pro-pose solutions and improvements implementation3rd Round – Performing an assembly process under new conditions4th Round – Assessment of achievements
Manufacturing game (MG)– Christmas tree decoration
Acquiring skills concerningmanufacturing line balanc-ing
1st Round – Performing a manufacturing process and collecting realdata2nd Round – Performing adequate analyses with the use of chosenlean tools to balance the manufacturing line3rd Round – Performing a manufacturing process under new con-ditions4th Round – Assessment of achievements
Push/Pull Game– Automotive assembly
Understanding and prac-ticing the difference be-tween push and pull pro-duction control in an auto-motive assembly line
1st Round: Control production using push scheduling and monitorcost, WIP and lead time.2nd Round: Control production using pull approach and re-designthe layout to facilitate pull flow. The same metrics are monitoredas in round 1.
Value Stream MappingGame– Automotive assembly
Apply value stream map-ping skills to capture theproduction performanceand to be able to improveit using lean tools
1st Round: Capture the current state value added activities andnon-value added activities of an automotive line suffering from highlevel of variability and inefficiencies. In addition, they draw the cur-rent VSM.2nd Round: Develop a future state for the same line through apply-ing different lean tools within a limited budget. Drawing the futureVSM and comparing value added and non-value added times.
Torch Factory Game– Torch assembly
Improve an assembly lineof a torch factory suffer-ing from productivity andquality issues
1st Round: Capture the current performance level of the line andanalyse quality and productivity problems.2nd round: Improve productivity through line balancing and Kan-ban system3rd Round: Improve quality through root cause analysis, quality atthe source and Andon.
Table 2Game goals and scenarios.
Game Durationof the game [hours]
Numberof rounds
Numberof incorporated quality
and/or lean tools
Gamecomplexity
Numberof students playing
the gameAssembly game (AG) 6 4 11 264 12–18
Manufacturing game (MG) 4 4 21 336 14–18
Push/Pull game 3 2 4 24 18
VSM game 4 2 5 40 17
Torch Factory game 3 3 9 81 15
Volume 10 • Number 4 • December 2019 111

Management and Production Engineering Review
Lean gamification approach and setup
As mentioned, this research had two goals. Thefirst was to study the impact of gamification on threeaspects of participants’ engagement that were dis-cussed in section three, namely: ‘Motivational pro-cessing’ (using the Attention, Relevance, Confidence,and Satisfaction model), ‘Cognitive processing’ and‘Social processing’. The second goal was to examineto what extent (if to any) the games can improve theparticipants’ knowledge acquisition about the specif-ic lean subject by playing a related game. The struc-tured methodology of the carried study is outlinedin Fig. 2.
Fig. 2. Lean gamification research plan.
This paper discusses how gamification incorpo-rated in learning process can increase acquisition ofknowledge by games participants. The research wasconducted among the chosen groups of American andPolish students and company employees. The stu-dents study on different levels of education (under-graduate and master). This way, it was possible tosee if there is a significant difference between game
participants engagement depending on the group towhich they belong and their previous experience. Thedifference between students and employees is that theemployees already work in companies and have dif-ferent views on the analysed problems.
The research utilized a questionnaire which as-sessed different groups engagement levels before andafter a game. The assessment focused on game par-ticipants’ motivation, cognitive processing and socialaspects. The authors assumed that participating ingames can change the participants’ attitude and caninfluence motivation, cognitive processing and socialaspects. The participants were examined before andafter the game to assess their increase of understand-ing the information, which had been presented tothem in the form of lectures before the game andduring the game.
The games were played in Poland with masterstudents and employees, and in the USA with under-graduate students. The total number of the question-naires obtained from game participants was 114. Thepercentage of the questionnaires collected in Polandwas 55% and 45% the in USA. The percentage ofquestionnaires received from the undergraduate stu-dents was the largest, and totalled 45%, followed bythe employees with 31% and then master studentswith 24%. Figure 3 outlines the distribution of par-ticipants among the considered games.
Fig. 3. Percentage of questionnaires from different gameparticipants.
The developed questionnaire serving the first ob-jective consisted of 25 questions (see Appendix) de-veloped for all fields: 11 for MA, 3 for MR, 5 for MC,1 for MS, 2 for CO and 3 for SO. For each question,the participants gave a value on a Likert scale from 1to 9, where (1) means ‘Absolutely disagree’ and (9)means ‘Absolutely agree’.
The prepared questionnaires were distributedamong all game participants before the game andafter the game.
The questions were coded with the use of lettersand numbers, what was already mentioned. The firsttwo letters refer to a processing type (MA – Moti-vational processing: Attention, MR – Motivational
112 Volume 10 • Number 4 • December 2019

Management and Production Engineering Review
processing: Relevance, MC – Motivational process-ing: Confidence, MS – Motivational processing: Sat-isfaction, CO – Cognitive processing, SO – Socialprocessing). A number refers to a question numberin a group, the last letter refers to the time whena survey was conducted (B – before a game, A –after a game).
Fig. 4. Results of Anderson-Darling’s normality test.
It is necessary to emphasise that some ques-tions (MC1A, MC2A, MC3A, MC4A, MC5A, CO1A,CO2A) in the questionnaire used after the game wereconstructed that the lower score was the evidence ofbetter results. The survey results were subjected toa statistical analysis.
First, Anderson-Darling’s normality test was per-formed for the results obtained in the mentionedfields for the data obtained before and after thegames in order to choose statistical tests for furtheranalyses. Since the data are characterized by non-normal distribution (Fig. 4) in further analyses, thenonparametric methods such as Kruskal-Wallis test,Mann-Whitney test and Spearman Correlation wereapplied.
In a deeper analysis such factors as a countryand group type (undergraduate students – US, mas-ter students – MS, employees – EM), game duration,a number of rounds and a number of tools incorpo-rated in the game were analysed.
Finally, a discussion of the obtained results wasconducted to derive recommendations for the gamedevelopment and conclusions.
In order to evaluate the participants’ knowledgeacquisition (second objective), tests assessing the un-derstanding of the lean topics and tools incorporatedin the games were developed. The tests were pre-pared for the master students and employees to eval-uate their knowledge before and after the games. Be-fore the games, participants attended a training (lec-ture) session in which the specific lean subjects wereexplained. Thus, they could answer the test beforethe game based on how much they gained from theselectures.
For the reason that in the research the knowl-edge of the game participants was assessed beforethe game and after the game, it was possible to dis-cover whether the participants’ knowledge increasedafter the games. In the research a total of 114 gameparticipants was involved: 35 company employees, 28master students and 51 undergraduate students.
Lean gamification impact analysis
Gamification assessmentwith considered criteria
Basic descriptive statistical analyses were donefor the data collected before and after the games. Themaximum and minimum number of scores, the medi-an, the standard deviation, Q1 and Q3, the range andthe mode for each question and, then, for each anal-ysed field were calculated. The mean values for eachquestion were also calculated and they are furtherexplained in the discussion section. However, an in-
Volume 10 • Number 4 • December 2019 113

Management and Production Engineering Review
teresting initial observation from the results was thatsome questions had the possible maximum range (8)indicating that some answers were ‘absolutely dis-agree’ while others were ‘absolutely agree’.
The descriptive statistics concerning the analysedfactors, namely motivational processing: attention(MAB, MAA), relevance (MRB, MRA), confidence(MCB, MCA), satisfaction (MS1B, MS1A) as wellas cognitive processing (COB, COA) and social pro-cessing (SOB, SOA), are presented in Table 3.
Analysing the first area of investigation in the‘Motivational processing’ which is ‘Attention’ (MAB,MAA), the high scores of the questions before andafter the games point to how just being engaged ina game setup can directly capture the attention ofparticipants. The people expected that the game el-ements as well as obtaining role playing tasks willkeep their attention. It reflects one important as-pect of the positive impact that gamification has onthe learning process over a traditional lecturing ap-proach. The wide range of answers was due to onlyone person. According to this participant’s opinionthe game didn’t keep his attention. Most participantshad high attention towards the games and the resultsshowed that they reported a higher attention levelafter the game.
Another area of ‘Motivational processing’ was‘Relevance’ (MRB, MRA), which was analysed in 3questions. The high constant scores of these ques-tions before and after the games can be attributedto how most of the participants tried to link the gamecomponents (tools) with the things of their interestor which they had experienced before. The relevanceof the studied components plays an important role inthe participants’ engagement and retention of knowl-edge. It adds another positive impact of gamificationin the learning process. After the game, the relevancewas even better.
Confidence was the next area in ‘Motivationalprocessing’ (MCA, MCA), and the scores show thata few people did not feel confident playing somegames. These results suggest that the participants’expectation of success in these games was not alwayshigh or uniform. Confidence, as discussed earlier, ishighly related to the perception of success. Therefore,additional mechanisms that check if all participantsunderstood the topic and the problems well shouldbe incorporated in some games.
Most participants expected that the game willnot contain too much information. Thus, those gameswith too much information or difficult to under-stand or a bit abstract had relatively lower confi-dence scores even after the game completion.
The last area of ‘Motivational processing’ was‘Satisfaction’ (MS1B, MS1A) with only one questionused for the assessment. The high scores for the be-fore and, even higher after the questions, reflect howgames satisfy and cater for the participants’ inter-ests in general. This is another important indicationof a positive gamification impact on the learning pro-cess, at least in this technical context of lean learning.
The next area of assessment was ‘Cognitive pro-cessing’ (COB, COA) with two questions. The scoresshow that a little more than a half of participantsexpected that they would not have to put too muchmental effort to learn the content from the game.After the game more people assessed that they didnot put too much effort to learn the content fromthe game. Furthermore, most participants expectedthat they would be able to learn the content from thegame without difficulties, and the after game scoresconfirm such expectations. Although cognitive loadis always the most challenging aspect for person’slearning, the gamification approach shows throughthese scores that such a challenge can be better ma-
Table 3Descriptive statistics.
Variable N Mean St.Deviation Minimum Q1 Median Q3 Max Range Mode
MAB 108 7.52 1.01 3.27 7.00 7.55 8.36 9.00 5.73 8.64
MAA 108 7.79 0.97 3.18 7.27 7.91 8.55 9.00 5.81 9.00
MRB 109 7.52 1.10 4.33 7.00 7.67 8.33 9.00 4.67 8.33
MRA 108 8.07 0.81 5.00 7.42 8.00 8.67 9.00 4.00 9.00
MCB 108 7.35 1.44 2.20 6.60 7.70 8.40 9.00 6.80 9.00
MCA 106 2.60 1.80 1.00 1.40 2.00 3.20 9.00 8.00 1.00
MS1B 108 7.90 1.43 2.00 7.00 8.00 9.00 9.00 7.00 9.00
MS1A 106 7.98 1.02 5.00 7.00 8.00 9.00 9.00 4.00 9.00
COB 108 6.46 1.44 1.00 6.00 6.50 7.50 9.00 8.00 6.00
COA 106 4.68 1.55 1.00 4.00 5.00 5.50 9.00 8.00 5.00
SOB 108 7.75 0.97 4.33 7.00 8.00 8.33 9.00 4.67 8.00
SOA 106 7.50 1.15 4.67 6.67 7.67 8.33 9.00 4.33 9.00
114 Volume 10 • Number 4 • December 2019

Management and Production Engineering Review
naged through it. Nevertheless, some participantsreported that it was more difficult than they hadexpected.
The last area of the assessment was ‘Social pro-cessing’ (SOB, SOA) with three questions. Most par-ticipants expected a high spirit of teamwork and co-operation in their team. However, the answers afterthe game showed that this spirit was less than whatit had been expected. Although this is a counter in-tuitive to the expected impact of gamification on thesocial processing, a justification for that would bethe level of excitement that games generate amongthe participants before being engaged in the games.The complexity and dynamics of games interactioncan decrease such excitement suggesting the im-portance of setting expectations among participantswhen leading them through gamification.
Gamification assessmentwith considered criteria
The next analysis explored whether the country,type of participant, game duration, number of roundsor number of tools incorporated in the games havean influence on the research results.
Different hypotheses were put and then test-ed with the use of Kruskal-Wallis test, and Mann-Whitney test in Minitab 16 as well as Spearman Cor-relation in Statistica 12. The key parameter, takeninto account in statistical tests for assessing the reli-ability of estimation, is the sample size. In the litera-ture, the suggestion can be found that in order to ob-tain reliable results, it is advisable to analyse a rela-tively large number of data pairs (more than 30) [31].
However, in the work [32] the authors state that inmost cases 10 bootstrap draws is enough to establishbasic behaviours. In the performed statistical teststhe minimal number of data pairs was 16.
In this paper different hypotheses were explored.The results of the performed tests are presented inTables 4–6.
Table 4Results of statistical analyses: Kruskal-Wallis and
Mann-Whitney tests; P-value; TP – type of participants.
Variable Country TP Variable Country TP
MAB 0.023 0.001 MS1B 0.684 0.009
MAA 0.762 0.502 MS1A 0.964 0.215
MRB 0.462 0.003 COB 0.447 0.191
MRA 0.199 0.060 COA 0.783 0.215
MCB 0.294 0.252 SOB 0.281 0.116
MCA 0.165 0.376 SOA 0.005 0.015
The proposed hypotheses are presented and ana-lysed as follows:
Hypothesis A0: There is no difference betweenthe results obtained from Polish and American gameparticipants in the area of social processing.
Hypothesis A1: The results obtained from Polishand American game participants differ significantlyin the area of social processing.
Hypothesis B0: The competition existing in thegames enhanced the engagement of participants fromdifferent types of participants equally.
Hypothesis B1: The competition existing in thegames enhanced the engagement of participants fromdifferent types of participants differently.
Because P-value equals 0.005 (P-value < 0.05),Hypothesis A0 is rejected in favor of Hypothesis A1.
Table 5Results of statistical analyses: Spearman correlation; R Spearman value; GD – game duration,
NR – number of rounds, NT – number of tools.
GD NR NT MAB MAA MRB MRA MCB
GD 1 0.690 0.512 −0.084 −0.152 −0.328 −0.233 −0.076
NR 0.690 1 0.919 0.111 −0.115 −0.115 −0.225 0.044
NT 0.512 0.919 1 0.199 −0.069 −0.015 −0.139 0.065
MAB −0.084 0.111 0.199 1 0.419 0.619 0.461 0.367
MAA −0.152 −0.115 −0.069 0.419 1 0.412 0.594 0.231
MRB −0.328 −0.115 −0.015 0.619 0.412 1 0.363 0.492
MRA −0.233 −0.225 −0.139 0.461 0.594 0.363 1 0.190
MCB −0.076 0.044 0.065 0.367 0.231 0.492 0.190 1
MCA 0.137 −0.028 −0.002 −0.093 −0.006 −0.184 −0.097 −0.169
MS1B −0.248 −0.070 0.049 0.336 0.314 0.469 0.190 0.392
MS1A −0.124 −0.079 −0.006 0.348 0.539 0.260 0.471 0.145
COB −0.098 0.006 0.108 0.370 0.127 0.397 0.180 0.465
COA −0.050 0.084 0.177 0.008 0.224 −0.007 −0.035 0.046
SOB −0.207 −0.130 0.009 0.521 0.384 0.393 0.285 0.303
SOA −0.141 −0.123 −0.047 0.186 0.358 0.041 0.150 0.068
Volume 10 • Number 4 • December 2019 115

Management and Production Engineering Review
Table 6Results of statistical analyses: Spearman correlation; R Spearman value.
MCA MS1B MS1A COB COA SOB SOA
Game duration 0.137 −0.248 −0.124 −0.098 −0.050 −0.207 −0.141
No of rounds −0.028 −0.070 −0.079 0.006 0.084 −0.130 −0.123
No of tools −0.002 0.049 −0.006 0.108 0.177 0.009 −0.047
MAB −0.093 0.336 0.348 0.370 0.008 0.521 0.186
MAA −0.006 0.314 0.539 0.127 0.224 0.384 0.358
MRB −0.184 0.469 0.260 0.397 −0.007 0.393 0.041
MRA −0.097 0.190 0.471 0.180 −0.035 0.285 0.150
MCB −0.169 0.392 0.145 0.465 0.046 0.303 0.068
MCA 1 −0.065 −0.033 −0.065 0.463 −0.168 0.107
MS1B −0.065 1 0.240 0.245 0.094 0.336 0.057
MS1A −0.033 0.240 1 0.026 0.214 0.107 0.309
COB −0.065 0.245 0.026 1 −0.121 0.480 0.062
COA 0.463 0.094 0.213 −0.122 1 0.023 0.154
SOB −0.168 0.336 0.107 0.480 0.023 1 0.309
SOA 0.106 0.057 0.309 0.062 0.154 0.309 1
This means that the country where the games wereplayed in this specific experiment might have an in-fluence on social processing.
Because P-value equals 0.001 (P-value < 0.05),Hypothesis B0 is rejected in favor of Hypothesis B1which means that the type of participants might havean influence on the participants’ engagement.
In further analyses it was discovered that thedifference comes from the questions: ‘I expect thatthe competition can only enhance my engagement inthe game’ (SO2B) and ‘The competition enhancedmy engagement in the game’ (SO2A) (Fig. 5). Afterthe games, the engagement in the game decreasedin some cases. Therefore, it is interesting to considerwhy this happened. Thus, it will be discussed laterin this work.
Table 4 shows that the type of participants hasalso a significant influence on social processing. Thedetails concerning particular questions are presentedin Fig. 6. Figure 6 presents that mostly the employ-ees’ engagement enhancement by competition waslower after the game. Possible reasons will be dis-cussed later in this work. Furthermore, although agame duration has no significant influence on gen-eral social processing, Fig. 7 suggests that when agame duration is 6 hours, the engagement enhancedby competition is much lower.
However, the engagement decreased when a gameduration was 4 hours. Therefore, it can be suggest-ed that the game duration should be 3 hours in or-der to keep the participants engaged. Additionally,in deeper analyses, it was discovered that the loweremployees’ engagement enhancement by competitionoccurred in longer-lasting games.
Fig. 5. Boxplot of the results obtained for the questions‘I expect that the competition can only enhance my en-gagement in the game’ (SO2B) and ‘The competitionenhanced my engagement in the game’ (SO2A) in the
countries.
Fig. 6. Boxplot of the results obtained for the questions‘I expect that the competition can only enhance my en-gagement in the game’ (SO2B), ‘The competition en-hanced my engagement in the game’ (SO2A), for different
types of participants.
116 Volume 10 • Number 4 • December 2019
Management and Production Engineering Review
Fig. 7. Boxplot of the results obtained for the questions‘I expect that the competition can only enhance my en-gagement in the game’ (SO2B) and ‘The competition en-hanced my engagement in the game’ (SO2A) for different
duration of games.
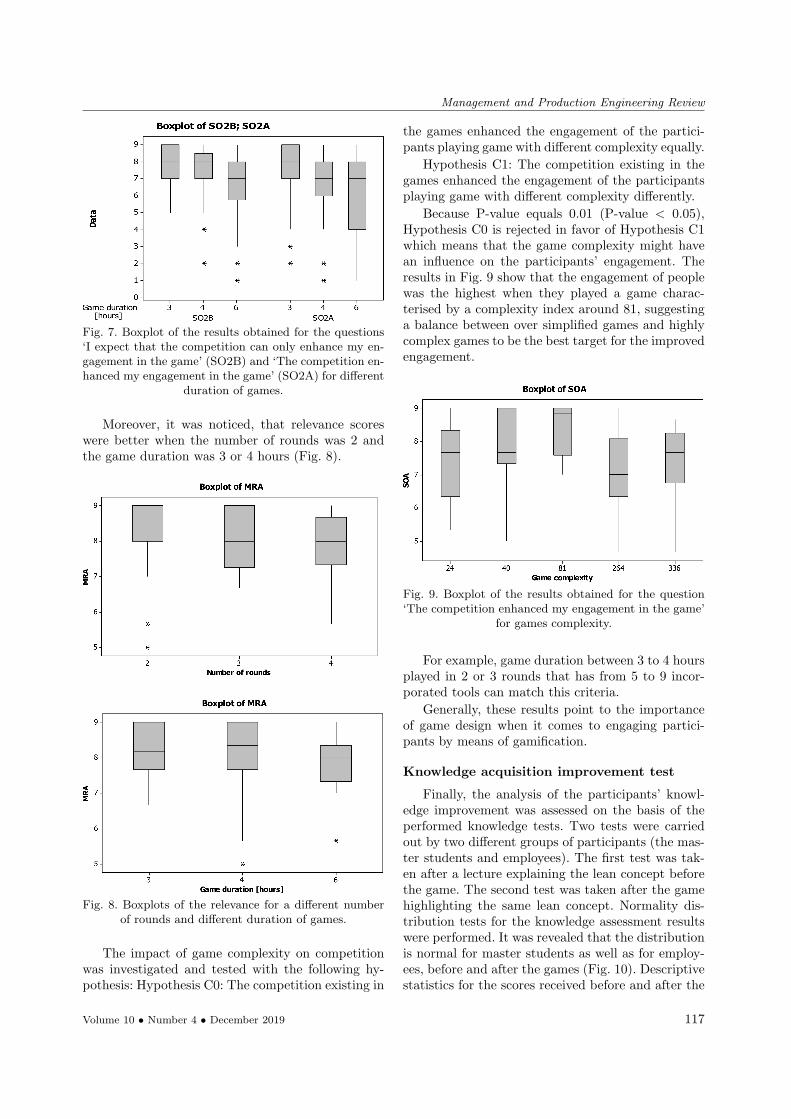
Moreover, it was noticed, that relevance scoreswere better when the number of rounds was 2 andthe game duration was 3 or 4 hours (Fig. 8).
Fig. 8. Boxplots of the relevance for a different numberof rounds and different duration of games.
The impact of game complexity on competitionwas investigated and tested with the following hy-pothesis: Hypothesis C0: The competition existing in
the games enhanced the engagement of the partici-pants playing game with different complexity equally.
Hypothesis C1: The competition existing in thegames enhanced the engagement of the participantsplaying game with different complexity differently.
Because P-value equals 0.01 (P-value < 0.05),Hypothesis C0 is rejected in favor of Hypothesis C1which means that the game complexity might havean influence on the participants’ engagement. Theresults in Fig. 9 show that the engagement of peoplewas the highest when they played a game charac-terised by a complexity index around 81, suggestinga balance between over simplified games and highlycomplex games to be the best target for the improvedengagement.
Fig. 9. Boxplot of the results obtained for the question‘The competition enhanced my engagement in the game’
for games complexity.
For example, game duration between 3 to 4 hoursplayed in 2 or 3 rounds that has from 5 to 9 incor-porated tools can match this criteria.
Generally, these results point to the importanceof game design when it comes to engaging partici-pants by means of gamification.
Knowledge acquisition improvement test
Finally, the analysis of the participants’ knowl-edge improvement was assessed on the basis of theperformed knowledge tests. Two tests were carriedout by two different groups of participants (the mas-ter students and employees). The first test was tak-en after a lecture explaining the lean concept beforethe game. The second test was taken after the gamehighlighting the same lean concept. Normality dis-tribution tests for the knowledge assessment resultswere performed. It was revealed that the distributionis normal for master students as well as for employ-ees, before and after the games (Fig. 10). Descriptivestatistics for the scores received before and after the
Volume 10 • Number 4 • December 2019 117

Management and Production Engineering Review
Fig. 10. Results of Anderson-Darling’s normality test forthe results of a knowledge test; MS – master students,
EM – employees.
games by master students and employees are pre-sented in Table 7, while descriptive statistics for theknowledge improvement (KI) are presented in Ta-ble 8. Figure 11 presents an interval plot of the scoresreceived from a knowledge test before and after thegames of master students and employees.
Table 7Descriptive Statistics for scores; St. Dev. – Standard
Deviation; Me – median, V – variable, B – before, A – after.
V N Mean St. Dev. Min Q1 Me Q3 Max
B-MS 27 21.9 3.6 15 20.0 22 24.0 29
A-MS 27 25.2 3.0 18 23.0 25 27.0 31
B-EM 18 38.4 6.8 23 33.8 39 44.3 48
A-EM 18 43.1 5.7 35 38.0 42 47.5 54
Table 8Descriptive Statistics for knowledge improvement (KI);
V – variable, F – factor.
F N Mean St. Dev. Min Q1 Me Q3 Max
EM 18 4.67 3.43 -1 1.75 5 6 12
MS 27 3.33 2.60 -1 1.00 3 5 9
Fig. 11. Interval plot of scores received from test beforeand after a game; MS – master students, EM - employees.
Based on the previous data, the following hy-potheses were tested in order to explore the relationbetween the knowledge acquisition and type of par-ticipants:
Hypothesis D0: There is no difference betweenthe knowledge acquisition by master students (MS)and employees (EM).
Hypothesis D1: There is a difference between theknowledge acquisition by master students (MS) andemployees (EM).
The results present that there is no statisticallyjustified difference between knowledge acquisition bymaster student and employees, since P-value equals0.171.
On the basis of the performed analyses, it can beconcluded that average improvement of the partici-
118 Volume 10 • Number 4 • December 2019

Management and Production Engineering Review
pants’ knowledge acquisition in case of master stu-dents was 17%, and it was 14% for employees. Maxknowledge improvement was 56% for a master stu-dent and 52% for an employee.
It can also be noted that in almost all cases thetests results after the games were better than beforethe games. Therefore, the positive impact of gam-ification on learning and retention of knowledge ishighlighted.
By playing the game the participants were ableto understand the problems better because they werelearning by doing [33, 34].
Recommendations for gamesdevelopment for lean educationand training
This research analysed different aspects connect-ed to games development and utilization. Taking intoaccount that there is a necessity for games develop-ment for the companies’ specified needs, it is impor-tant to present clear guidelines which can help com-panies to develop their own games (or modify exist-ing ones) in order to reflect the specific problems andenvironment of companies. This way, the employeeswill learn not only how new tools or concepts workbut also why it is important to implement them ina company environment.
Based on these research results, first of all, it canbe concluded that games increase the participants’knowledge significantly. Therefore, games are recom-mended as good tools to train company employees.
Furthermore, the following set of recommenda-tions is suggested to allow for an effective design ofgames in order to ensure attention, relevance, confi-dence, satisfaction and knowledge acquisition:• A game should not be too complex to ensure cog-
nitive processing because the game participantsmight lose their understanding of the situation inthe game:
(a) The recommended game duration should befrom 3 to 4 hours.
(b) The game should have from 2 to 3 rounds.
(c) The game should incorporate from 5 to 9tools that the game participants will learnabout in the game.
• When introducing the game, attention, relevanceand confidence can be enhanced by:
(a) Presenting in a clear way a game goal whichseems to be very difficult or impossible toachieve, what ensures the attention of par-ticipants.
(b) Motivating employees to look for connectionsbetween the game elements and their ownwork environment. Therefore, the relevancecan be noticed by participants.
(c) Presenting a set of tools which are incorpo-rated in the game, hence a participant confi-dence can be ensured.
• At the end of the game, a satisfaction rate canincrease by summarizing the obtained results andcomparing them to the goal.
• By incorporating the elements of competition inthe game, the need of collaboration and commu-nication, as well as social processing can be in-creased.
Conclusions
This research aimed at assessing the impact ofgamification on the lean manufacturing knowledgeacquisition and learning process. The assessment wasbased on exploring motivational, cognitive and so-cial processing associated with gamification as wellas pre and post gamification exams. The attention,relevance, confidence and satisfaction (ARCS) mod-el was used to capture motivation processing of thelearners. Data was gathered from the students andemployees in the US and Poland. The game partic-ipants learned different lean manufacturing princi-ples and tools using physical games that mimic realmanufacturing and service environment. In general,the reported results showed that gamification seemsto enhance participants’ motivation, cognitive andsocial processing as well as the knowledge acquisi-tion, leading to an improved learning process. Thepaper presented recommendations to design effectivegames.
Some further observations and recommendationsare mentioned as follows:
The participants were motivated by the engage-ment of the gamification process as the games man-aged to catch their attention, enabled them to re-late many of theoretical concepts to the real life and,to an acceptable extent, made them confident thatthey would success in their tasks. These factors ledto a high score of satisfaction reported by the par-ticipants and confirming that gamification enhancesmotivational processing during the learning process.
The gamification approach in this study demon-strated an ability to manage the cognitive processingchallenge typically faced in a similar technical learn-ing setup. The participants reported that the playedgames did not require high cognitive load or effort.This could mean that the required mental processing
Volume 10 • Number 4 • December 2019 119

Management and Production Engineering Review
to understand and apply the considered lean manu-facturing tools was achieved with a higher successlevel than the a typical lecturing approach that triesto achieve the same goal.
The social processing assessment of gamificationwas positive as expected in such participants’ con-text. However, the study encountered an interestingobservation regarding how the excitement and so-cial interaction expectation among participants canbe affected by the difficulty of and effort put in thegames. It was one way to explain the slight drop inthe scores of the social processing questions beforeand after the game.
Although gamification had a clear positive im-pact on the learning process as stated above, the re-sults of a further analysis showed that the extent ofsuch impact is also influenced by the participants’learning setup, experience and the game’s design.Undergraduate students with more hands-on educa-tion were more engaged in the games than masterstudents with a less exposure to this type of a learn-ing process. Moreover, games designed with an av-erage challenging level and with ability to have sig-nificant success results tend to be more engaging togame participants. These results should highlight theimportant aspects to be considered by trainers whenendorsing a similar gamification approach.
Gamification also showed, through the pre andpost games tests, that in addition to engaging gameparticipants, it improves knowledge acquisition andretention as well.
It is important to note that the results of thisstudy are bounded by the chosen games which wereplayed only in two countries with the people study-ing on different study levels and employees. More-over, because small samples were used, the results ofstatistical analyses might not be valid for the entirepopulation. Therefore, in future research, the surveycan be performed among more groups of students in-volved in playing the games. Nevertheless, much ofthe general findings can be extended and applied inthe context of gamification application in technicaltrainings.
The limitation of this work is related to the factthat all analysed games concerned the lean conceptimplementation in manufacturing and assembly pro-cesses in order to identify and eliminate waste, im-prove a material flow and solve quality issues to facil-itate production planning and control. Therefore, thepresented research results might not be valid in oth-er contexts. In the future work, it is planned to con-duct similar analyses for other games used in a differ-ent learning context related to the problems such asa product and process design. Additionally, the fu-
ture research would include exploring the interactionbetween different learning components, and extend-ing the analysis to include the impact of more socialaspects to make the game participants even moreopen for collaborative work.
Appendix
Questions used in surveys: before (B) and after (A)a game
Motivational processing: AttentionMA1B: A possibility of topic presentation by attend-ing the game seems to me as an interesting ideaMA1A: There was something interesting at the be-ginning of the game that got my attentionMA2B: The game should be eye-catchingMA2A: The design of the game is eye-catchingMA3B: Playing the game will help me to hold myattention better then attending the lecturesMA3A: The quality of the game kit helped to holdmy attentionMA4B: Playing the game might awaken my curiosityabout this topicMA4A: I enjoyed the game so much that I would liketo know more about this topicMA5B: In the game I should obtain tasks to do tokeep my attentionMA5A: The way the tasks were arranged in the gamehelped keep my attentionMA6B: The game should contain things which willstimulate my curiosityMA6A: The game has things that stimulated my cu-riosityMA7B: It is important to me to really enjoy learningwith the gameMA7A: I really enjoyed learning with the gameMA8B: After the game I expect feedback or com-ments concerning my tasks realization, which willhelp me to feel awarded for my effortMA8A: The wording of feedback or comments afterthe exercises helped me feel rewarded for my effortMA9B: I expect the variety of reading passages, ex-ercises, illustrations, etc., which will help me to keepmy attention on the gameMA9A: The variety of reading passages, exercises,illustrations, etc., helped keep my attention on thegameMA10B: The content of the game should be relatedto things I have seen, done or thought about in myown lifeMA10A: I could relate the content of the game tothings I have seen, done or thought about in my ownlife
120 Volume 10 • Number 4 • December 2019

Management and Production Engineering Review
MA11B: I expect that it will be a pleasure to workon the gameMA11A: It was a pleasure to work on such a well-designed game
Motivational processing: RelevanceMR1B: It should be clear to me how the content ofthe game is related to things I already knowMR1A: It is clear to me how the content of the gameis related to things I already knowMR2B: I think that the game can be important forme and help me to understand game topicMR2A: There were examples that showed me howthe game could be important to some people in thelearning settingMR3B: In the content of the game I should find some-thing what is interesting to meMR3A: The content of the game is relevant to myinterests
Motivational processing: ConfidenceMC1B: I expect that the game will not be difficultto understandMC1A: The game was more difficult to understandthan I would like for it to beMC2B: I expect that the game will not contain toomuch information that will be too hard to pick outand remember the important pointsMC2A: The game had so much information that itwas hard to pick out and remember the importantpointsMC3B: I expect that the game will not be too ab-stract that it would be too hard to keep my attentionon itMC3A: The game is so abstract that it was hard tokeep my attention on itMC4B: I expect that the exercises in the game willbe not too difficultMC4A: The exercises in the game were too difficultMC5B: I expect that I will be able to understandquite a bit of the material in the gameMC5A: I could not really understand quite a bit ofthe material in the game
Motivational processing: SatisfactionMS1B: I expect that the game will be successfullycompletedMS1A: It felt good to successfully complete the game
Cognitive processingCO1B: I expect that I will not have to put too muchmental effort to learn the content from the gameCO1A: How much mental effort did you invest tolearn the content from the game?CO2B: I expect that I will be able to learn the con-tent from the game without difficulties
CO2A: How difficult was it for you to learn the con-tent from the game?
Social processingSO1B: I expect a spirit of teamwork and cooperationin my teamSO1A: A spirit of teamwork and cooperation existsin my teamSO2B: I expect that the competition can only en-hance my engagement in the gameSO2A: The competition enhanced my engagement inthe gameSO3B: I think that my team will be able to commu-nicate effectively with other teamsSO3A: My team communicates effectively with otherteam
References
[1] Jasti N.V.K., Kodali R., Lean production: literaturereview and trends, International Journal of Produc-tion Research, 53, 3, 867–885, 2015.
[2] Negrao L.L.L., Filho M.G., Marodin G., Lean prac-tices and their effect on performance: a literaturereview, Production Planning & Control, 28, 1, 33–56, 2017.
[3] Wong W.P., Ignatius J., Soh K.L., What is the lean-ness level of your organisation in lean transforma-tion implementation? An integrated lean index usingANP approach, Production Planning & Control, 25,4, 273–287, 2014.
[4] DeSanctis I., Mere J.B.O., Bevilacqua M., Ciara-pica F.E., The moderating effects of corporate andnational factors on lean projects barriers: a cross-national study, Production Planning & Control, 29,12, 972–991, 2018.
[5] Ozelkan E., Galambosi A., Lampshade Game forlean manufacturing, Production Planning & Con-trol, 20, 5, 385–402, 2009.
[6] De Vin L.J., Jacobsson L., Karlstad lean factory:an instructional factory for game-based lean manu-facturing training, Production & Manufacturing Re-search, 5, 1, 268–283, 2017.
[7] Jurado P.J.M., Fuentes J.M., Learning to teachlean management through games: Systematic litera-ture review, WPOM-Working Papers on OperationsManagement, 8, 164–170, 2017.
[8] Ruano J.P., Hoyuelos I., Mateo M., Gento A.M.,Lean school: A learning factory for training leanmanufacturing in a physical simulation environ-ment, Management and Production Engineering Re-view, 10, 1, 4–13, 2019.
Volume 10 • Number 4 • December 2019 121

Management and Production Engineering Review
[9] Salen K., Zimmerman E., Rules of play: Game de-sign fundamentals, Cambridge, MA: MIT Press,2003.
[10] Kim A.J., Putting the fun in functional: Applyinggame mechanics to functional software, Google TechTalks, 29, 2009.
[11] Gasland M., Game mechanic based e-learning, Nor-wegian University of Science and Technology, Mas-ter Thesis, 2011.
[12] Sousa R., Stadnicka D., Carvalho J-D, RatnayakeR.M.C., Isoherranen J.V., Gamification based leanknowledge dissemination: A case study, IEEE In-ternational Conference on Industrial Engineeringand Engineering Management (IEEM2016), 4–7.12.2016, Bali, Indonesia, 2016.
[13] Felder R., Silverman L., Learning and teachingstyles in engineering education, Engineering Educa-tion, 78, 7, 674–681, 1998.
[14] Feinstein A.H., Mann S., Corsun D. L., Charting theexperiential territory: clarifying definitions and usesof computer simulation games and role play, Journalof Management Development, 21, 10, 732–44, 2002.
[15] Hsu E., Role event gaming simulation in manage-ment education: a conceptual framework and review,Simulation and Games, 20, 4, 409–38, 1989.
[16] Ellington H., Using games simulations and casestudies to develop key skills, [in:] M. Boyle, Y. Smith[Eds], Simulation and gaming research yearbook,SAGSET, 2001.
[17] Lean J., Moizer J., Towler M., Abbey C., Simula-tions and games: use and barriers in higher edu-cation, Active Learning in Higher Education, 7, 3,227–242, 2006.
[18] Koster R., A theory of fun, Paraglyph Press, NewYork, NY, 2004.
[19] Bandura A., Self-efficacy: The exercise of control,New York: Freeman, 1997.
[20] Gee J.P., Learning and games, [in:] In KatieSalen [Ed.], The ecology of games: Connectingyouth, games, and learning (John D., Catherine T.MacArthur Foundation series on digital media andlearning), Cambridge, MA: The MIT Press, 2008.
[21] Locke E.A., Latham G.P., A theory of goal set-ting & task performance, Englewood Cliffs, NJ, US:Prentice-Hall, Inc, 1990.
[22] Lazzaro N., Why we play games: Four keys tomore emotion without story, retrieved from:http://www.xeodesign.com/xeodesign whyweplay-games.pdf, 2004.
[23] Squire K., From content to context: Videogames asdesigned experience, Educational Researcher, 35, 8,19–29, 2006.
[24] Lee J.J., Hammer J., Gamification in education:What. How. Why Bother?, Academic ExchangeQuarterly, 15, 2, 2011.
[25] Keller J.M., Strategies for stimulating the motiva-tion to learn, Performance & Instruction, 26, 1–7,1987.
[26] Keller J.M., The systematic process of motivationaldesign, Performance & Instruction, 26, 9/10, 1–8,1987.
[27] Ames C., Classroom: goals, structures, and studentmotivation, Journal of Educational Psychology, 84,261–271, 1992.
[28] Anderman E.M., Maehr M.L., Motivation andschooling in the middle grades, review of education-al research, Journal of Educational Psychology, 64,287–309, 1994.
[29] Keller J.M., An integrative theory of motivation,volition, and performance, Technology, Instruction,Cognition, and Learning, 6, 79–104, 2008.
[30] Palmgreen P., Uses and gratifications: A theoreticalperspective, [in:] R. N. Bostrom [Ed.], Communica-tion yearbook, 8, 61–72, Beverly Hills, CA, 1984.
[31] Hamrol A., Quality management. Theory and prac-tice [in Polish], PWN, Warsaw 1998.
[32] Efron B., Hastie T., Computer age statistical infer-ence (Vol. 5), Cambridge University Press, 2016.
[33] Vallat D., Bayart C., Bertezene S., Serious gamesin favour of knowledge management and double-loop learning?, Knowledge Management Research &Practice, 14, 4, 470–477, 2016.
[34] Goerke M., Schmidt M., Busch J., Nyhuis P., Holis-tic approach of lean thinking in learning factories,5TH Conference on Learning Factories. ProcediaCIRP, 32, 138–143, 2015.
122 Volume 10 • Number 4 • December 2019