Connectivity, genetic structure and stress response of Phragmites australis: Issues for restoration...
10
This article appeared in a journal published by Elsevier. The attached copy is furnished to the author for internal non-commercial research and education use, including for instruction at the authors institution and sharing with colleagues. Other uses, including reproduction and distribution, or selling or licensing copies, or posting to personal, institutional or third party websites are prohibited. In most cases authors are permitted to post their version of the article (e.g. in Word or Tex form) to their personal website or institutional repository. Authors requiring further information regarding Elsevier’s archiving and manuscript policies are encouraged to visit: http://www.elsevier.com/copyright
-
Upload
griffithuni -
Category
Documents
-
view
4 -
download
0
Transcript of Connectivity, genetic structure and stress response of Phragmites australis: Issues for restoration...
This article appeared in a journal published by Elsevier. The attachedcopy is furnished to the author for internal non-commercial researchand education use, including for instruction at the authors institution
and sharing with colleagues.
Other uses, including reproduction and distribution, or selling orlicensing copies, or posting to personal, institutional or third party
websites are prohibited.
In most cases authors are permitted to post their version of thearticle (e.g. in Word or Tex form) to their personal website orinstitutional repository. Authors requiring further information
regarding Elsevier’s archiving and manuscript policies areencouraged to visit:
http://www.elsevier.com/copyright
Author's personal copy
Aquatic Botany 104 (2013) 138–146
Contents lists available at SciVerse ScienceDirect
Aquatic Botany
journa l homepage: www.e lsev ier .com/ locate /aquabot
Connectivity, genetic structure and stress response of Phragmites australis: Issuesfor restoration in a salinising wetland system
Charlotte R. Hurrya,∗, Elizabeth A. Jamesb, Ross M. Thompsona
a Australian Centre for Biodiversity and School of Biological Sciences, Monash University, Clayton, VIC. 3800, Australiab Royal Botanic Gardens Melbourne, Private Bag 2000, Birdwood Avenue, South Yarra, VIC. 3141, Australia
a r t i c l e i n f o
Article history:Received 4 November 2011Received in revised form 2 August 2012Accepted 6 August 2012Available online 17 August 2012
Keywords:Chloroplast haplotypeMicrosatellitePlant conditionRestoration techniqueSpatial genetic structureWetland salinity
a b s t r a c t
Plant condition, analysed using fluoroscopy and morphological characteristics and, genetic structureusing microsatellite markers and chloroplast DNA sequences was studied in Phragmites australis in theGippsland coastal wetlands, SE Australia. Gene flow appeared regular and widespread between popula-tions of P. australis in the Gippsland Lakes with some local genetic structure and no clear association withsalinity. There was no genetic evidence of either salt tolerant or introduced variants.
© 2012 Elsevier B.V. All rights reserved.
1. Introduction
Wetland salinisation is considered an environmental problem(Castaneda and Ducrot, 2009; Erwin, 2009) and restoration is oftena policy goal for Australian wetlands (Gosling, 2011). Restorationbenefits from an understanding of processes at the individual plantand landscape level (Matthews et al., 2009). Connectivity is recog-nised as an important function for conservation of biota and theimportance of gene flow studies is apparent in determining howfragmented wetlands are affected by change whilst the individualresponses to environmental stress influence local structure.
In SE Australia, the Gippsland Lakes are a series of interconnect-ing coastal wetlands recognised for their international significance(Ramsar Convention, 1971). Historically the Gippsland Lakes werefreshwater systems intermittently intruded by sea water due tosporadic erosion of sandbanks. In 1889 a permanent openingwas engineered at Lakes Entrance allowing unrestricted marineinflow into the wetlands resulting in elevated salinity (practicalsalinity units; Bird, 1961, 1962; Dept. of Natural Resources andEnvironment, 2001) rising from 16.7 in 1978 (Bird, 1978) to approx-imately 23.7 by the early 1990s (Dept. of Natural Resources andEnvironment, 2001). A major drought (1998–2010) exacerbated the
∗ Corresponding author. Current address: Australian Rivers Institute, Griffith Uni-versity, Nathan, QLD. 4111, Australia. Fax: +61 3 9905 5613.
E-mail address: [email protected] (C.R. Hurry).
impacts of increased saline inflows by reducing freshwater inputsfrom the major river systems supplying the Lakes. As a consequencesalinity has continued to increase in the wetlands, with negativeimpacts on plant growth and community composition (Clucas andLadiges, 1980; Raulings et al., 2007; Salter et al., 2007).
Current restoration projects in the Gippsland Lakes work uponthe assumption that there may be genetic variants of P. australisin the area with high salinity tolerance. Stakeholders have spec-ulated that several clones of P. australis growing in highly salinesites appear to be taller and produce more stems than other clones,possibly representing salt tolerant lineages. There is also a risk thatthese clones represent the genetic variant, Haplotype M, identifiedas invasive in North America (Saltonstall, 2002), where its highersalt tolerance and relative growth rate (Vasquez et al., 2005) haveresulted in a dramatic alteration in the composition of estuarine andfreshwater wetlands (Meadows and Saltonstall, 2007; McCormicket al., 2010a).
Phragmites australis (Cav) Trin. ex Steud. displays a wide range ofsalinity tolerance (≤65) (Hellings and Gallagher, 1992; Lissner andSchierup, 1997; Havens et al., 2003; Howard and Rafferty, 2006).Although several studies have identified P. australis clones that aremore tolerant of salinity than others (Saltonstall, 2003a; Vasquezet al., 2005; Howard and Rafferty, 2006; Takahashi et al., 2007a),experimental results have not always translated to field perfor-mance (Howard and Rafferty, 2006; Howard et al., 2008). In P.australis, variation in specific genes has been associated with physi-ological differences in individuals under salt stress (Takahashi et al.,
0304-3770/$ – see front matter © 2012 Elsevier B.V. All rights reserved.http://dx.doi.org/10.1016/j.aquabot.2012.08.001
Author's personal copy
C.R. Hurry et al. / Aquatic Botany 104 (2013) 138–146 139
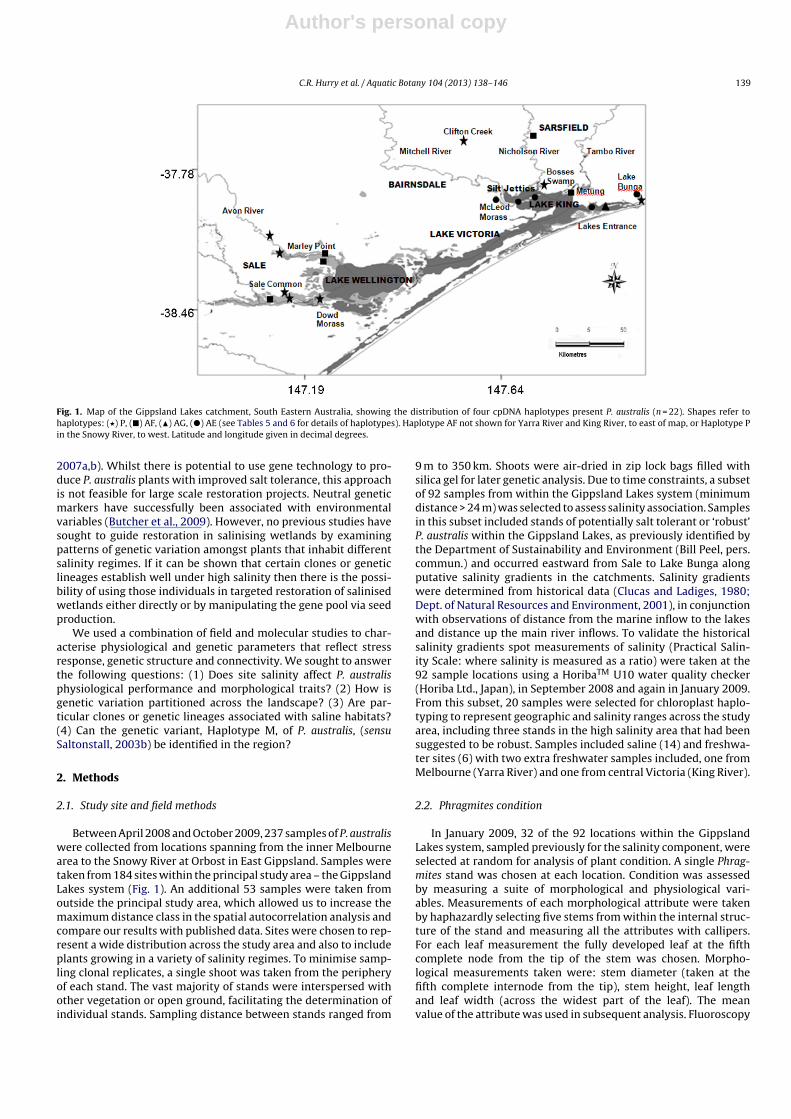
Fig. 1. Map of the Gippsland Lakes catchment, South Eastern Australia, showing the distribution of four cpDNA haplotypes present P. australis (n = 22). Shapes refer tohaplotypes: (�) P, (�) AF, (�) AG, (�) AE (see Tables 5 and 6 for details of haplotypes). Haplotype AF not shown for Yarra River and King River, to east of map, or Haplotype Pin the Snowy River, to west. Latitude and longitude given in decimal degrees.
2007a,b). Whilst there is potential to use gene technology to pro-duce P. australis plants with improved salt tolerance, this approachis not feasible for large scale restoration projects. Neutral geneticmarkers have successfully been associated with environmentalvariables (Butcher et al., 2009). However, no previous studies havesought to guide restoration in salinising wetlands by examiningpatterns of genetic variation amongst plants that inhabit differentsalinity regimes. If it can be shown that certain clones or geneticlineages establish well under high salinity then there is the possi-bility of using those individuals in targeted restoration of salinisedwetlands either directly or by manipulating the gene pool via seedproduction.
We used a combination of field and molecular studies to char-acterise physiological and genetic parameters that reflect stressresponse, genetic structure and connectivity. We sought to answerthe following questions: (1) Does site salinity affect P. australisphysiological performance and morphological traits? (2) How isgenetic variation partitioned across the landscape? (3) Are par-ticular clones or genetic lineages associated with saline habitats?(4) Can the genetic variant, Haplotype M, of P. australis, (sensuSaltonstall, 2003b) be identified in the region?
2. Methods
2.1. Study site and field methods
Between April 2008 and October 2009, 237 samples of P. australiswere collected from locations spanning from the inner Melbournearea to the Snowy River at Orbost in East Gippsland. Samples weretaken from 184 sites within the principal study area – the GippslandLakes system (Fig. 1). An additional 53 samples were taken fromoutside the principal study area, which allowed us to increase themaximum distance class in the spatial autocorrelation analysis andcompare our results with published data. Sites were chosen to rep-resent a wide distribution across the study area and also to includeplants growing in a variety of salinity regimes. To minimise samp-ling clonal replicates, a single shoot was taken from the peripheryof each stand. The vast majority of stands were interspersed withother vegetation or open ground, facilitating the determination ofindividual stands. Sampling distance between stands ranged from
9 m to 350 km. Shoots were air-dried in zip lock bags filled withsilica gel for later genetic analysis. Due to time constraints, a subsetof 92 samples from within the Gippsland Lakes system (minimumdistance > 24 m) was selected to assess salinity association. Samplesin this subset included stands of potentially salt tolerant or ‘robust’P. australis within the Gippsland Lakes, as previously identified bythe Department of Sustainability and Environment (Bill Peel, pers.commun.) and occurred eastward from Sale to Lake Bunga alongputative salinity gradients in the catchments. Salinity gradientswere determined from historical data (Clucas and Ladiges, 1980;Dept. of Natural Resources and Environment, 2001), in conjunctionwith observations of distance from the marine inflow to the lakesand distance up the main river inflows. To validate the historicalsalinity gradients spot measurements of salinity (Practical Salin-ity Scale: where salinity is measured as a ratio) were taken at the92 sample locations using a HoribaTM U10 water quality checker(Horiba Ltd., Japan), in September 2008 and again in January 2009.From this subset, 20 samples were selected for chloroplast haplo-typing to represent geographic and salinity ranges across the studyarea, including three stands in the high salinity area that had beensuggested to be robust. Samples included saline (14) and freshwa-ter sites (6) with two extra freshwater samples included, one fromMelbourne (Yarra River) and one from central Victoria (King River).
2.2. Phragmites condition
In January 2009, 32 of the 92 locations within the GippslandLakes system, sampled previously for the salinity component, wereselected at random for analysis of plant condition. A single Phrag-mites stand was chosen at each location. Condition was assessedby measuring a suite of morphological and physiological vari-ables. Measurements of each morphological attribute were takenby haphazardly selecting five stems from within the internal struc-ture of the stand and measuring all the attributes with callipers.For each leaf measurement the fully developed leaf at the fifthcomplete node from the tip of the stem was chosen. Morpho-logical measurements taken were: stem diameter (taken at thefifth complete internode from the tip), stem height, leaf lengthand leaf width (across the widest part of the leaf). The meanvalue of the attribute was used in subsequent analysis. Fluoroscopy
Author's personal copy
140 C.R. Hurry et al. / Aquatic Botany 104 (2013) 138–146
measurements of maximum quantum yield (Fv/Fm) were used toassess plant physiological condition. Fv/Fm measures photosyn-thetic efficiency (Krause and Weis, 1991). Measurements weretaken using a pulsed amplitude modulation (PAM) chlorophyll flu-orometer (PAM-210, Heinz Walz GmbH, Effeltrich, Germany). Asingle leaf was selected at each location and covered in foil for20 min for dark adaption. Dark adaptation is required to open PSIIreaction centres and to oxidise the electron transport chains (Ralphand Gademann, 2005). Leaves chosen were healthy (no obviousdiscolouration or grazing damage) and mature.
Based on water salinity measures, each location was assignedto one of three salinity groupings: low (≤10), medium (≤20) andhigh (>20). These groupings were used rather than the raw valuesbecause single spot measurements were considered to reflect onlybroad relative patterns rather than representing an integrated anddetailed measure of salinity. Effects of the salinity groupings onthe mean attribute (leaf width, leaf length, stem diameter, stemlength and Fv/Fm) were analysed separately with a single factorANOVA with post hoc Tukey’s tests, performed using R software (RDevelopment Core Team, 2008).
2.3. Genetic analyses
Dried plant tissue, from all samples, was sent to the Aus-tralian Genome Research Facility (AGRF) for DNA isolation andquantification. Ten microsatellite loci were amplified with the poly-merase chain reaction (PCR), using 10 primer pairs developed bySaltonstall (2003b). PCRs were performed in 10 �L reactions con-taining 1 × QIAGEN HotStarTaq Master Mix (QIAGEN Inc., Valencia,CA, USA), ∼7.5 ng genomic DNA and 0.1 �M each forward andreverse primer, under the following conditions: 95 ◦C for 15 min,35 cycles of 94 ◦C for 30 s, 55 ◦C for 30 s and 72 ◦C for 60 s; fol-lowed by 1 cycle of 72 ◦C for 10 min. Capillary electrophoresis wasused for fragment separation, based on size of microsatellites. PCRproducts were run with Applied Biosystems Genescan LIZ500 sizestandard on a 3730 Genetic Analyzer and fragments were scoredusing Genemapper v3.7 or Peak Scanner v1.0 (Applied Biosystems,CA, USA). Studies on hexaploid Phragmites have found that indi-viduals can display a combination of loci with simple “diploid”(disomic) inheritance patterns and loci with more complex patterns(Saltonstall, 2003b; Fér and Hroudová, 2009). The polyploid natureof P. australis meant that individuals could not be genotyped perse. Ambiguity arises in heterozygous loci because it is not possibleto assign allele copy number with confidence. Plants identified asdistinct genetic individuals are referred to here as genetic variantsrather than genotypes to reflect this uncertainty. All chromosomecounts recorded for P. australis in South Eastern Australia indi-cate octoploidy, with two decaploid exceptions in northern Victoria(Clevering and Lissner, 1999). Therefore, we treated all samplesas octoploids with undetected allele copies coded as missing data(Hardy and Vekemans, 2002).
2.4. Maternal lineages
Maternal lineages were characterised in 22 samples usingchloroplast-specific primers (Saltonstall, 2002). The two chloro-plast regions (trnT–trnL and rbcl–psal) were amplified using thefollowing PCR conditions: PCRs were performed in 50 �L reac-tions containing 1 × QIAGEN HotStarTaq Master Mix (QIAGEN Inc.,Valencia, CA, USA), 50–80 ng genomic DNA and 0.4 �M each for-ward and reverse primer. PCR conditions were as described formicrosatellites with the exception of an annealing temperature of53 ◦C instead of 55 ◦C. PCR products were separated on agarose gelsby electrophoresis and visualised with ethidium bromide under UVillumination. The PCR products were purified using the QIAGEN’sQIAquick PCR purification kit, as per manufacturer’s protocols. PCR
products were sequenced at AGRF Melbourne. The contiguous codewas edited with the program Sequencher v.4.1 (Gene Codes Cor-poration) and sequences were aligned manually in BioEdit V.5.0.9(Hall, 1999) before submission to GenBank. Haplotypes were deter-mined for each sequenced individual by comparing them to theGenBank sequences of haplotypes described by Saltonstall (2002).Novel haplotypes were confirmed by replicate sequencing of a sub-set of samples, using the method above. A haplotype parsimonynetwork was generated for Victorian haplotypes identified previ-ously (P and Q; Saltonstall, 2002) and in this study plus HaplotypeM (Saltonstall, 2002) using the program TCS (Clement et al., 2000).
2.5. Genetic data analysis
2.5.1. Relationship between genetic and geographic distancesamongst individuals
To assess spatial autocorrelation, a matrix of geographical dis-tances between all 237 sampled individuals was derived from thedigital latitudes and longitudes at each collection location usingGenAlEx 6.1 (Peakall and Smouse, 2006). Twelve distance classeswere chosen (0.1, 2, 5, 10, 20, 30, 40, 50, 60, 70, 100 and 360 km)to identify possible patterns both within a site and across largerlandscape scales. Using SPAGeDi 1.3 (Hardy and Vekemans, 2002),Moran’s I coefficient was determined for each geographic distanceclass, providing a global measure of correlation between the geneticand geographic distances amongst individuals. A positive Moran’s Iindicates a positive correlation between genotype and geographicdistance whilst a negative value indicates less correlation thanwould be expected if underlying spatial processes are random.Standard errors for the coefficients per distance class were com-puted by a jack-knife procedure over loci (Hardy and Vekemans,2002). To test the significance of the coefficients, 1000 permuta-tions were performed for each distance class, and 95% confidenceintervals were derived from the permutation coefficients.
2.5.2. Genetic distances within and amongst rivers/wetlands, andwithin and amongst salinity profiles
Genetic distances were assessed within and amongst the salinitygroups using 92 samples from the Gippsland Lakes. Each individ-ual was allocated to a salinity group. As the number of samples washigher in the genetic analysis than in the plant condition analy-sis the decision was made to have four salinity groups: high, >20;medium, 10–20; low, 2–10 and fresh, <2. In addition to the salinitygroupings, samples were then assigned to one of 14 rivers/wetlandswhich were classified as discrete systems based upon distancesbetween sample locations and differences in measured salinities.
Microsatellite size data were transformed into binary formatusing the Polysat package (Clark and Jasieniuk, 2011) in R soft-ware (R Development Core Team, 2008). Analysis of MolecularVariance (AMOVA) in GenAlEx 6.1 (Peakall and Smouse, 2006) wasused to compute genetic differences within and amongst the 14rivers/wetlands as discrete systems. A second AMOVA was com-puted to detect genetic differences within and amongst the foursalinity groups. Permutations were performed 999 times to com-pute values of pairwise genetic difference as ˚PT, an analogue ofFST that is based on genetic distances rather than allele frequenciesand preferable for use with binary data (Peakall and Smouse, 2006).Full and partial Mantel tests (Mantel, 1967) were performed withthree distance matrices, which sought to explain genetic differ-ences based on geographic distance between samples, differencesin salinity between sample locations, and a combination of distanceand salinity. Mantel tests were executed using zt Mantel Tester(Bonnet and Van de Peer, 2002). Data were examined further by themultivariate analysis DAPC (Discriminant Analysis using PrincipalComponents; Jombart et al., 2010) implemented in the adegenetpackage for R software (Jombart, 2008; Jombart and Ahmed, 2011).
Author's personal copy
C.R. Hurry et al. / Aquatic Botany 104 (2013) 138–146 141
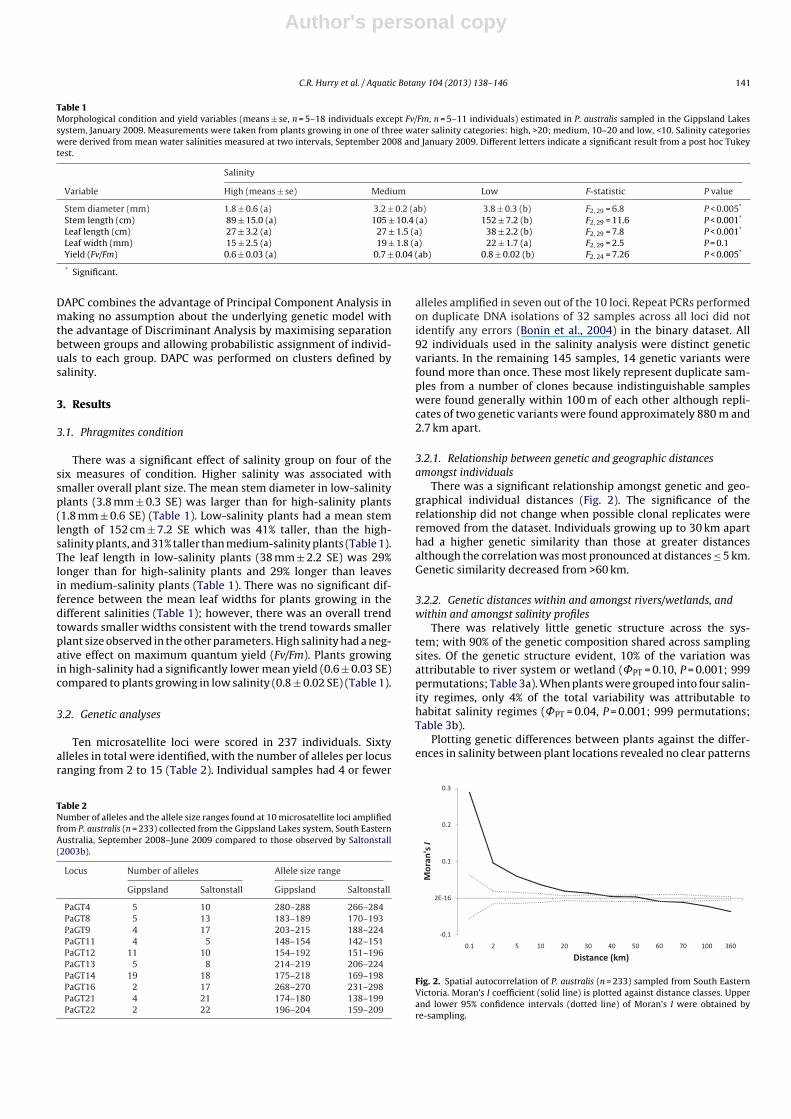
Table 1Morphological condition and yield variables (means ± se, n = 5–18 individuals except Fv/Fm, n = 5–11 individuals) estimated in P. australis sampled in the Gippsland Lakessystem, January 2009. Measurements were taken from plants growing in one of three water salinity categories: high, >20; medium, 10–20 and low, <10. Salinity categorieswere derived from mean water salinities measured at two intervals, September 2008 and January 2009. Different letters indicate a significant result from a post hoc Tukeytest.
Salinity
Variable High (means ± se) Medium Low F-statistic P value
Stem diameter (mm) 1.8 ± 0.6 (a) 3.2 ± 0.2 (ab) 3.8 ± 0.3 (b) F2, 29 = 6.8 P < 0.005*
Stem length (cm) 89 ± 15.0 (a) 105 ± 10.4 (a) 152 ± 7.2 (b) F2, 29 = 11.6 P < 0.001*
Leaf length (cm) 27 ± 3.2 (a) 27 ± 1.5 (a) 38 ± 2.2 (b) F2, 29 = 7.8 P < 0.001*
Leaf width (mm) 15 ± 2.5 (a) 19 ± 1.8 (a) 22 ± 1.7 (a) F2, 29 = 2.5 P = 0.1Yield (Fv/Fm) 0.6 ± 0.03 (a) 0.7 ± 0.04 (ab) 0.8 ± 0.02 (b) F2, 24 = 7.26 P < 0.005*
* Significant.
DAPC combines the advantage of Principal Component Analysis inmaking no assumption about the underlying genetic model withthe advantage of Discriminant Analysis by maximising separationbetween groups and allowing probabilistic assignment of individ-uals to each group. DAPC was performed on clusters defined bysalinity.
3. Results
3.1. Phragmites condition
There was a significant effect of salinity group on four of thesix measures of condition. Higher salinity was associated withsmaller overall plant size. The mean stem diameter in low-salinityplants (3.8 mm ± 0.3 SE) was larger than for high-salinity plants(1.8 mm ± 0.6 SE) (Table 1). Low-salinity plants had a mean stemlength of 152 cm ± 7.2 SE which was 41% taller, than the high-salinity plants, and 31% taller than medium-salinity plants (Table 1).The leaf length in low-salinity plants (38 mm ± 2.2 SE) was 29%longer than for high-salinity plants and 29% longer than leavesin medium-salinity plants (Table 1). There was no significant dif-ference between the mean leaf widths for plants growing in thedifferent salinities (Table 1); however, there was an overall trendtowards smaller widths consistent with the trend towards smallerplant size observed in the other parameters. High salinity had a neg-ative effect on maximum quantum yield (Fv/Fm). Plants growingin high-salinity had a significantly lower mean yield (0.6 ± 0.03 SE)compared to plants growing in low salinity (0.8 ± 0.02 SE) (Table 1).
3.2. Genetic analyses
Ten microsatellite loci were scored in 237 individuals. Sixtyalleles in total were identified, with the number of alleles per locusranging from 2 to 15 (Table 2). Individual samples had 4 or fewer
Table 2Number of alleles and the allele size ranges found at 10 microsatellite loci amplifiedfrom P. australis (n = 233) collected from the Gippsland Lakes system, South EasternAustralia, September 2008–June 2009 compared to those observed by Saltonstall(2003b).
Locus Number of alleles Allele size range
Gippsland Saltonstall Gippsland Saltonstall
PaGT4 5 10 280–288 266–284PaGT8 5 13 183–189 170–193PaGT9 4 17 203–215 188–224PaGT11 4 5 148–154 142–151PaGT12 11 10 154–192 151–196PaGT13 5 8 214–219 206–224PaGT14 19 18 175–218 169–198PaGT16 2 17 268–270 231–298PaGT21 4 21 174–180 138–199PaGT22 2 22 196–204 159–209
alleles amplified in seven out of the 10 loci. Repeat PCRs performedon duplicate DNA isolations of 32 samples across all loci did notidentify any errors (Bonin et al., 2004) in the binary dataset. All92 individuals used in the salinity analysis were distinct geneticvariants. In the remaining 145 samples, 14 genetic variants werefound more than once. These most likely represent duplicate sam-ples from a number of clones because indistinguishable sampleswere found generally within 100 m of each other although repli-cates of two genetic variants were found approximately 880 m and2.7 km apart.
3.2.1. Relationship between genetic and geographic distancesamongst individuals
There was a significant relationship amongst genetic and geo-graphical individual distances (Fig. 2). The significance of therelationship did not change when possible clonal replicates wereremoved from the dataset. Individuals growing up to 30 km aparthad a higher genetic similarity than those at greater distancesalthough the correlation was most pronounced at distances ≤ 5 km.Genetic similarity decreased from >60 km.
3.2.2. Genetic distances within and amongst rivers/wetlands, andwithin and amongst salinity profiles
There was relatively little genetic structure across the sys-tem; with 90% of the genetic composition shared across samplingsites. Of the genetic structure evident, 10% of the variation wasattributable to river system or wetland (˚PT = 0.10, P = 0.001; 999permutations; Table 3a). When plants were grouped into four salin-ity regimes, only 4% of the total variability was attributable tohabitat salinity regimes (˚PT = 0.04, P = 0.001; 999 permutations;Table 3b).
Plotting genetic differences between plants against the differ-ences in salinity between plant locations revealed no clear patterns
-0.1
2E-16
0.1
0.2
0.3
0.1 2 5 10 20 30 40 50 60 70 100 360
Moran
'sI
Distance (km)
Fig. 2. Spatial autocorrelation of P. australis (n = 233) sampled from South EasternVictoria. Moran’s I coefficient (solid line) is plotted against distance classes. Upperand lower 95% confidence intervals (dotted line) of Moran’s I were obtained byre-sampling.
Author's personal copy
142 C.R. Hurry et al. / Aquatic Botany 104 (2013) 138–146
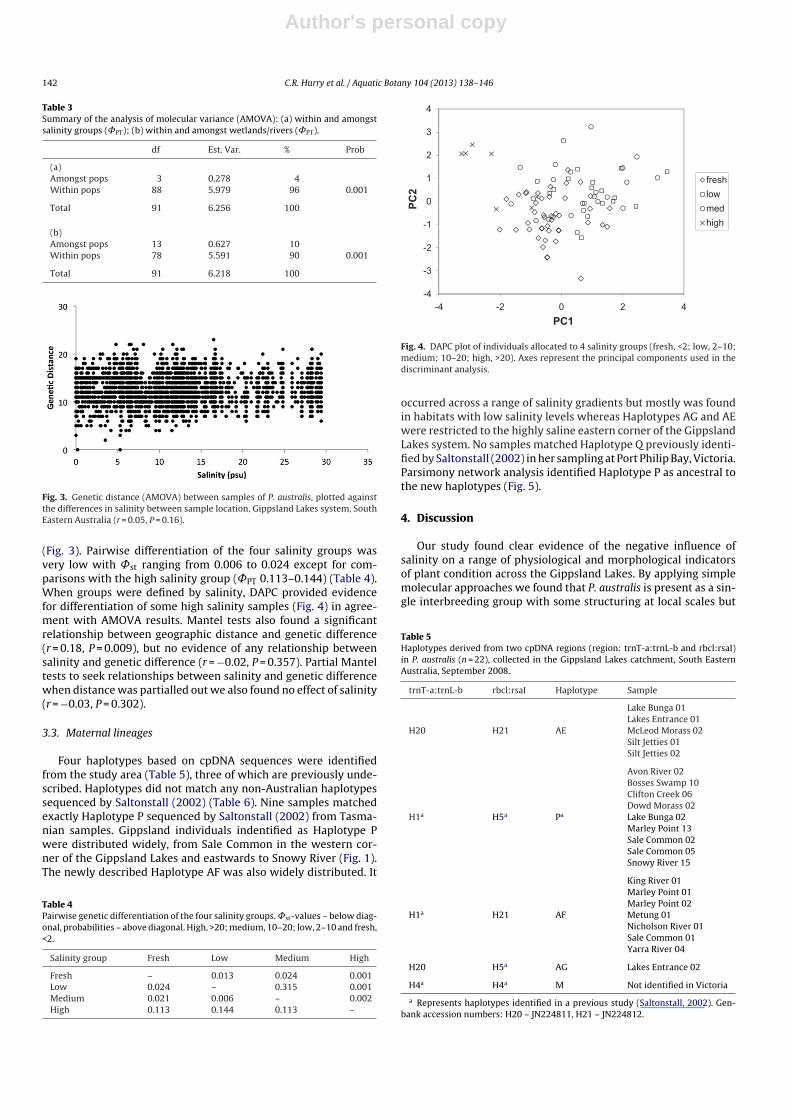
Table 3Summary of the analysis of molecular variance (AMOVA): (a) within and amongstsalinity groups (˚PT); (b) within and amongst wetlands/rivers (˚PT).
df Est. Var. % Prob
(a)Amongst pops 3 0.278 4Within pops 88 5.979 96 0.001
Total 91 6.256 100
(b)Amongst pops 13 0.627 10Within pops 78 5.591 90 0.001
Total 91 6.218 100
Fig. 3. Genetic distance (AMOVA) between samples of P. australis, plotted againstthe differences in salinity between sample location, Gippsland Lakes system, SouthEastern Australia (r = 0.05, P = 0.16).
(Fig. 3). Pairwise differentiation of the four salinity groups wasvery low with ˚st ranging from 0.006 to 0.024 except for com-parisons with the high salinity group (˚PT 0.113–0.144) (Table 4).When groups were defined by salinity, DAPC provided evidencefor differentiation of some high salinity samples (Fig. 4) in agree-ment with AMOVA results. Mantel tests also found a significantrelationship between geographic distance and genetic difference(r = 0.18, P = 0.009), but no evidence of any relationship betweensalinity and genetic difference (r = −0.02, P = 0.357). Partial Manteltests to seek relationships between salinity and genetic differencewhen distance was partialled out we also found no effect of salinity(r = −0.03, P = 0.302).
3.3. Maternal lineages
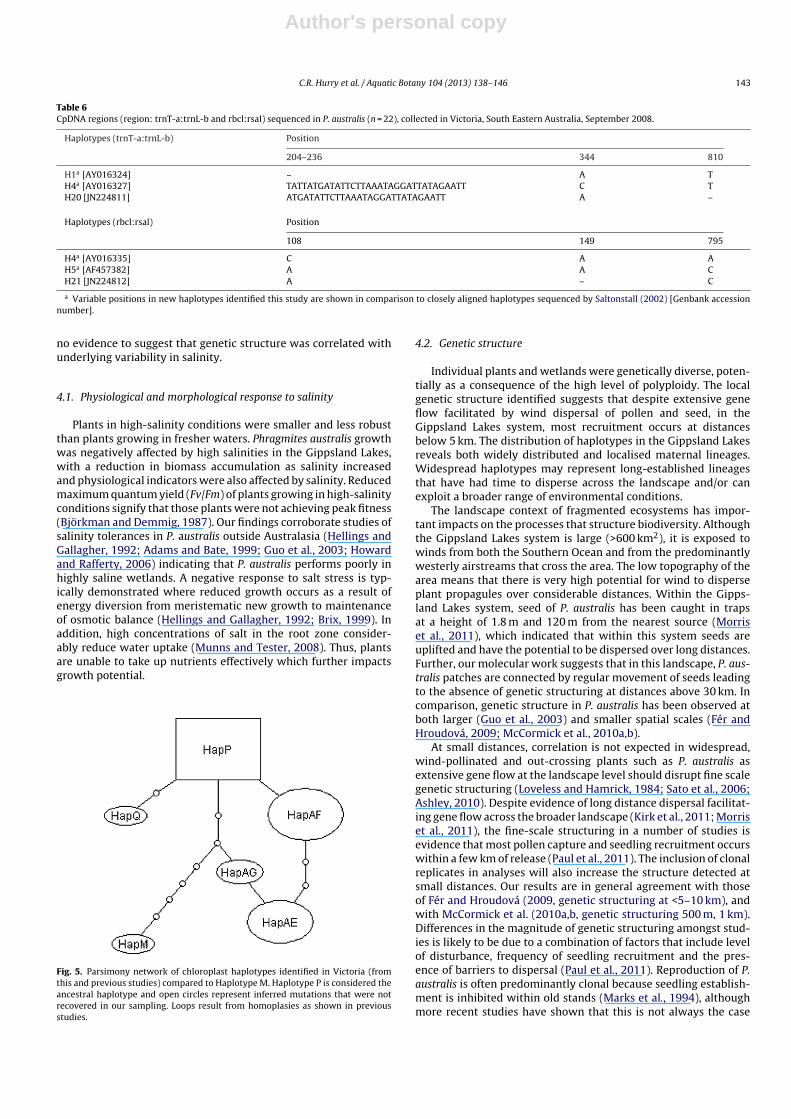
Four haplotypes based on cpDNA sequences were identifiedfrom the study area (Table 5), three of which are previously unde-scribed. Haplotypes did not match any non-Australian haplotypessequenced by Saltonstall (2002) (Table 6). Nine samples matchedexactly Haplotype P sequenced by Saltonstall (2002) from Tasma-nian samples. Gippsland individuals indentified as Haplotype Pwere distributed widely, from Sale Common in the western cor-ner of the Gippsland Lakes and eastwards to Snowy River (Fig. 1).The newly described Haplotype AF was also widely distributed. It
Table 4Pairwise genetic differentiation of the four salinity groups. ˚st-values – below diag-onal, probabilities – above diagonal. High, >20; medium, 10–20; low, 2–10 and fresh,<2.
Salinity group Fresh Low Medium High
Fresh – 0.013 0.024 0.001Low 0.024 – 0.315 0.001Medium 0.021 0.006 – 0.002High 0.113 0.144 0.113 –
-4
-3
-2
-1
0
1
2
3
4
420-2-4
PC2
PC1
fresh
low
med
high
Fig. 4. DAPC plot of individuals allocated to 4 salinity groups (fresh, <2; low, 2–10;medium; 10–20; high, >20). Axes represent the principal components used in thediscriminant analysis.
occurred across a range of salinity gradients but mostly was foundin habitats with low salinity levels whereas Haplotypes AG and AEwere restricted to the highly saline eastern corner of the GippslandLakes system. No samples matched Haplotype Q previously identi-fied by Saltonstall (2002) in her sampling at Port Philip Bay, Victoria.Parsimony network analysis identified Haplotype P as ancestral tothe new haplotypes (Fig. 5).
4. Discussion
Our study found clear evidence of the negative influence ofsalinity on a range of physiological and morphological indicatorsof plant condition across the Gippsland Lakes. By applying simplemolecular approaches we found that P. australis is present as a sin-gle interbreeding group with some structuring at local scales but
Table 5Haplotypes derived from two cpDNA regions (region: trnT-a:trnL-b and rbcl:rsaI)in P. australis (n = 22), collected in the Gippsland Lakes catchment, South EasternAustralia, September 2008.
trnT-a:trnL-b rbcl:rsaI Haplotype Sample
Lake Bunga 01Lakes Entrance 01
H20 H21 AE McLeod Morass 02Silt Jetties 01Silt Jetties 02
Avon River 02Bosses Swamp 10Clifton Creek 06Dowd Morass 02
H1a H5a Pa Lake Bunga 02Marley Point 13Sale Common 02Sale Common 05Snowy River 15
King River 01Marley Point 01Marley Point 02
H1a H21 AF Metung 01Nicholson River 01Sale Common 01Yarra River 04
H20 H5a AG Lakes Entrance 02
H4a H4a M Not identified in Victoria
a Represents haplotypes identified in a previous study (Saltonstall, 2002). Gen-bank accession numbers: H20 – JN224811, H21 – JN224812.
Author's personal copy
C.R. Hurry et al. / Aquatic Botany 104 (2013) 138–146 143
Table 6CpDNA regions (region: trnT-a:trnL-b and rbcl:rsaI) sequenced in P. australis (n = 22), collected in Victoria, South Eastern Australia, September 2008.
Haplotypes (trnT-a:trnL-b) Position
204–236 344 810
H1a [AY016324] – A TH4a [AY016327] TATTATGATATTCTTAAATAGGATTATAGAATT C TH20 [JN224811] ATGATATTCTTAAATAGGATTATAGAATT A –
Haplotypes (rbcl:rsal) Position
108 149 795
H4a [AY016335] C A AH5a [AF457382] A A CH21 [JN224812] A – C
a Variable positions in new haplotypes identified this study are shown in comparison to closely aligned haplotypes sequenced by Saltonstall (2002) [Genbank accessionnumber].
no evidence to suggest that genetic structure was correlated withunderlying variability in salinity.
4.1. Physiological and morphological response to salinity
Plants in high-salinity conditions were smaller and less robustthan plants growing in fresher waters. Phragmites australis growthwas negatively affected by high salinities in the Gippsland Lakes,with a reduction in biomass accumulation as salinity increasedand physiological indicators were also affected by salinity. Reducedmaximum quantum yield (Fv/Fm) of plants growing in high-salinityconditions signify that those plants were not achieving peak fitness(Björkman and Demmig, 1987). Our findings corroborate studies ofsalinity tolerances in P. australis outside Australasia (Hellings andGallagher, 1992; Adams and Bate, 1999; Guo et al., 2003; Howardand Rafferty, 2006) indicating that P. australis performs poorly inhighly saline wetlands. A negative response to salt stress is typ-ically demonstrated where reduced growth occurs as a result ofenergy diversion from meristematic new growth to maintenanceof osmotic balance (Hellings and Gallagher, 1992; Brix, 1999). Inaddition, high concentrations of salt in the root zone consider-ably reduce water uptake (Munns and Tester, 2008). Thus, plantsare unable to take up nutrients effectively which further impactsgrowth potential.
Fig. 5. Parsimony network of chloroplast haplotypes identified in Victoria (fromthis and previous studies) compared to Haplotype M. Haplotype P is considered theancestral haplotype and open circles represent inferred mutations that were notrecovered in our sampling. Loops result from homoplasies as shown in previousstudies.
4.2. Genetic structure
Individual plants and wetlands were genetically diverse, poten-tially as a consequence of the high level of polyploidy. The localgenetic structure identified suggests that despite extensive geneflow facilitated by wind dispersal of pollen and seed, in theGippsland Lakes system, most recruitment occurs at distancesbelow 5 km. The distribution of haplotypes in the Gippsland Lakesreveals both widely distributed and localised maternal lineages.Widespread haplotypes may represent long-established lineagesthat have had time to disperse across the landscape and/or canexploit a broader range of environmental conditions.
The landscape context of fragmented ecosystems has impor-tant impacts on the processes that structure biodiversity. Althoughthe Gippsland Lakes system is large (>600 km2), it is exposed towinds from both the Southern Ocean and from the predominantlywesterly airstreams that cross the area. The low topography of thearea means that there is very high potential for wind to disperseplant propagules over considerable distances. Within the Gipps-land Lakes system, seed of P. australis has been caught in trapsat a height of 1.8 m and 120 m from the nearest source (Morriset al., 2011), which indicated that within this system seeds areuplifted and have the potential to be dispersed over long distances.Further, our molecular work suggests that in this landscape, P. aus-tralis patches are connected by regular movement of seeds leadingto the absence of genetic structuring at distances above 30 km. Incomparison, genetic structure in P. australis has been observed atboth larger (Guo et al., 2003) and smaller spatial scales (Fér andHroudová, 2009; McCormick et al., 2010a,b).
At small distances, correlation is not expected in widespread,wind-pollinated and out-crossing plants such as P. australis asextensive gene flow at the landscape level should disrupt fine scalegenetic structuring (Loveless and Hamrick, 1984; Sato et al., 2006;Ashley, 2010). Despite evidence of long distance dispersal facilitat-ing gene flow across the broader landscape (Kirk et al., 2011; Morriset al., 2011), the fine-scale structuring in a number of studies isevidence that most pollen capture and seedling recruitment occurswithin a few km of release (Paul et al., 2011). The inclusion of clonalreplicates in analyses will also increase the structure detected atsmall distances. Our results are in general agreement with thoseof Fér and Hroudová (2009, genetic structuring at <5–10 km), andwith McCormick et al. (2010a,b, genetic structuring 500 m, 1 km).Differences in the magnitude of genetic structuring amongst stud-ies is likely to be due to a combination of factors that include levelof disturbance, frequency of seedling recruitment and the pres-ence of barriers to dispersal (Paul et al., 2011). Reproduction of P.australis is often predominantly clonal because seedling establish-ment is inhibited within old stands (Marks et al., 1994), althoughmore recent studies have shown that this is not always the case
Author's personal copy
144 C.R. Hurry et al. / Aquatic Botany 104 (2013) 138–146
(McCormick et al., 2010b; Plut et al., 2011; Paul et al., 2011). Indisturbed environments, seed may make a greater contributionthan vegetative pieces to the formation of new stands becausedisturbance can increase the area suitable for seedling establish-ment. It is believed that seed dispersal of Haplotype M underliesthe rapid expansion of P. australis in N. America (Jodoin et al., 2008;McCormick et al., 2010a) where evidence has been found for long-distance dispersal (Kirk et al., 2011). It is likely that the occurrenceof invasive P. australis in N. America with its relatively high geneticdiversity, rapid spread and hybridisation with native North Ameri-can P. australis (Paul et al., 2010) contributes to patterns that differfrom the Gippsland Lakes, Australia.
4.3. Genetic structure and salinity
Despite strong salinity gradients across the study area, we foundno conclusive evidence that individual plants preferentially estab-lished or thrived in high salinity areas. Only 4% of microsatellitevariability was attributable to differences in site salinity levels. Inour study, ˚PT (FST analogue) values were indicative of low levels ofdifferentiation between all but the high salinity group. FST values forP. australis have been used to successfully quantify genetic variationin brackish subestuaries of Chesapeake Bay, USA (McCormick et al.,2010b). Our study area differs from Chesapeake Bay in having rela-tively low levels of seedling recruitment, low levels of disturbanceat most sites and no evidence of the introduced Haplotype M. Whilstthe grouping of five high salinity samples could be interpreted asa tendency for high salinity sites to contain individuals that dif-fer from the norm because they have a high salt tolerance, theseindividuals were found within 6.5 km of each other and thereforewithin the distance for which spatial autocorrelation is high (seeFig. 2). Despite a significant ˚PT between high salinity and lowersalinity groups, it cannot be taken as confirmation of the presenceof salt-tolerant individuals at high salinity sites when consideredin conjunction with evidence of salinity-induced stress and spatialgenetic structure.
Lower disturbance levels in the Gippsland Lakes may restrictrecruitment. In P. australis, established clones are known to beless sensitive than seedlings to increases in salinity (Wijte andGallagher, 1996). Therefore, even though salinity in the Gipps-land Lakes has increased particularly since the 1970s (Bird, 1978;Dept. of Natural Resources and Environment, 2001), the presenceof mature clones may mitigate against rapid turnover of genotypesand delay the establishment of more salt tolerant individuals. It isalso possible that seedling recruitment follows periods of floodingthat both disturb habitat and reduce salinity levels so that indi-viduals avoid the selection pressure of salinity at the vulnerableseedling stage.
Australian P. australis has a higher ploidy level than plants inother studies of this type. Increasing ploidy generally translatesto higher genetic diversity that could moderate any genetic sig-nal related to fitness associated with environmental factors andmay confer higher levels of environmental plasticity on individuals(Otto, 2007). In addition, gene flow is thought to swamp local adap-tation in populations with conflicting selection pressure (Slatkin,1987) and the power of microsatellites to detect population decline,resulting from environmental stress, is reduced when gene flowbetween populations is extensive (Hoffmann and Willi, 2008).
Haplotype P was widespread and common in Gippsland andmay represent an old lineage as it is also found in Asia and has beensuggested by Chu et al. (2011) to be the potential origin of KoreanP. australis. Of the new haplotypes, AF was also widespread andits sequence similarity consistent with it being derived from Hap-lotype P. Haplotypes AG and AE are geographically restricted andvery similar. Their occurrence in highly saline sites possibly reflectsadaptation to environmental variables, including salinity, but could
equally result from limited dispersal. If salinity tolerance couldbe confirmed in these haplotypes their genetic variation could beexploited when sourcing material for revegetation projects. Chuet al. (2011) used the nuclear gene PhaHKT1 to identify hybridsbetween P. australis and Phragmites japonicus in Korea. The methodsthey used may also provide a method to examine the potential salttolerance of haplotypes rather than individual genotypes within P.australis (Takahashi et al., 2007a).
4.4. Non-native haplotypes
Haplotype M (not found in this study) typically displays alag phase between introduction and invasion (McCormick et al.,2010b) and is favoured by high salinities when in competitionwith native N. American haplotypes (Chambers et al., 1999). Incontrast, other studies have found poor performance of Haplo-type M in high salinity treatments in common garden experiments(Howard and Rafferty, 2006) highlighting the complex interactionspossible between genetic background and environmental response.Although Haplotype M was not found in this study, unintentionalspecies introductions both to and from New Zealand and Australia,in addition to the confirmation of Haplotype M in New Zealand(Saltonstall, 2002), make it imperative to check for the presence ofnon-native and potentially invasive variants before commencingany restoration planting projects with P. australis.
4.5. Management actions
For effective wetland restoration, there is a real need to under-stand the processes that determine the distribution of plants withinand between habitat patches. As our genetic results suggest thatpollen donors and seedling establishment are most often from localsources and our physiological measures clearly indicate that all P.australis individuals appeared to be equally stressed by salinity, aneffective approach to restoration might be to exploit natural vari-ation in the species rather than to source material based solely onsite salinity levels.
Restoration should aim to facilitate the long-term adaptivepotential of plants and a broad genetic base provides the frameworkto maintain biodiversity and ecosystem function under changingenvironments (Weeks et al., 2011). The use of genetically diverseseedling material from a range of similar habitats at the land-scape level avoids restricting the genetic base which is a risk whenrelying on clonal material or locally-sourced plants. To enableongoing adaptation, Paul et al. (2011) also proposed maximisinggenetic diversity by maintaining multiple generations within sitesto facilitate recruitment or by periodic augmentation using seed orrhizome fragments. Management efforts targeted at other strate-gies to prevent P. australis dieback such as removing weedy orwoody species from the riparian zone (Silliman and Bertness, 2004)may also be effective. Regular quantification of plant conditionand biomass loss in P. australis could provide an early indicationof deteriorating plant health allowing early intervention to max-imise overall wetland health. In this system there is a clear need todirectly mitigate the effects of water salinity and to improve nat-ural recruitment of genetically variable seedlings rather than riskthe potential problem of invasiveness by using individuals withhigher salinity tolerance and relative growth rates. These resultsmay be useful in predictive models of P. australis colonisation inother wetlands systems.
Ultimately, it may be necessary to reduce water abstraction fromthe wetlands and to introduce environmental freshwater inflowsinto the rivers to mimic the natural flow regimes required to sustainecosystem function and biodiversity values (Richter et al., 2003;Tharme, 2003; Arthington et al., 2006; Merritt et al., 2010).
Author's personal copy
C.R. Hurry et al. / Aquatic Botany 104 (2013) 138–146 145
Acknowledgements
The authors would like to acknowledge the assistance of Prof.John Beardall, Dr Kaylene Morris, Dr Elisa Rawlings, Dr Tim Cav-agnaro and Kristina Ricketts from the School of Biological Sciences,Monash University. Rebecca Jordan from the Royal Botanic Gar-dens Melbourne, Austin Brown from the Victorian Department ofPrimary Industry, Bill Peel from the East Gippsland Catchment Man-agement Authority and Bill Storer from the Victorian Departmentof Sustainability and Environment; all contributed in importantways. Funding was provided by the Australian Research Coun-cil via LP0776494 to Prof. R.C. MacNally and Dr. R.M. Thompson,‘The importance of dispersal in maintaining biodiversity of aquaticplants in landscapes’. This research and publication was supportedby the Australian Centre for Biodiversity, Monash University andthe Royal Botanic Gardens Melbourne. The constructive reviewsfrom three referees are gratefully acknowledged.
Appendix A. Supplementary data
Supplementary data associated with this article can be found,in the online version, at http://dx.doi.org/10.1016/j.aquabot.2012.08.001.
References
Adams, J.G., Bate, G.C., 1999. Growth and photosynthetic performance of Phrag-mites australis in estuarine waters: a field and experimental evaluation. AquaticBotany 64, 359–367.
Arthington, A.H., Bunn, S.E., Poff, N.L., Naiman, R.J., 2006. The challenge of providingenvironmental flow rules to sustain river ecosystems. Ecological Applications16, 1311–1318.
Ashley, M.V., 2010. Plant parentage, pollination, and dispersal: how DNA microsatel-lites have altered the landscape. Critical Reviews in Plant Sciences 29, 148–161.
Bird, E.C.F., 1961. Reed growth in the Gippsland Lakes. Victorian Naturalist 77,262–268.
Bird, E.C.F., 1962. The utilisation of some Australian coastal lakes. Australian Geog-rapher 8, 199–206.
Bird, E.C.F., 1978. The Geomorphology of the Gippsland Lakes Region. PublicationNo.186 Environmental Study Series. Ministry for Conservation, Victoria.
Björkman, O., Demmig, B., 1987. Photon yield of O2 evolution and chlorophyll fluo-rescence characteristics at 77 K among vascular plants of diverse origins. Planta170, 489–504.
Bonin, C., Bellemain, E., Bronken Eidesen, P., Pompanon, F., Brochmann, C., Taberlet,P., 2004. How to track and assess genotyping errors in population genetic studies.Molecular Ecology 13, 3261–3273, http://dx.doi.org/10.1111/j1365-294x2004.2346.x.
Bonnet, E., Van de Peer, Y., 2002. zt: a software tool for simple and partial Manteltests. Journal of Statistical Software 7, 1–12.
Brix, H., 1999. The European research project on reed die-back and progression(EUREED). Limnologica - Ecology and Management of Inland Waters 29, 5–10.
Butcher, P.A., McDonald, M.W., Bell, J.C., 2009. Congruence between environmen-tal parameters, morphology and genetic structure in Australia’s most widelydistributed eucalypt, Eucalyptus camaldulensis. Tree Genetics & Genomes 5,189–210.
Castaneda, C., Ducrot, D., 2009. Land cover mapping of wetland areas in an agri-cultural landscape using SAR and Landsat imagery. Journal of EnvironmentManagement 90, 2270–2277, http://dx.doi.org/10.1016/j.jenvman.2007.06.030.
Chambers, R.M., Meyerson, L.A., Saltonstall, K., 1999. Expansion of Phragmites aus-tralis into tidal wetlands of North America. Aquatic Botany 64, 261–273.
Chu, H., Cho, W.K., Jo, Y., Kim, W.-I., Rim, Y., Kim, J.-Y., 2011. Identification of naturalhybrids in Korean Phragmites using haplotype and genotype analyses. PlantSystematics and Evolution 293, 247–253.
Clark, L.V., Jasieniuk, M., 2011. POLYSAT: an R package for polyploid microsatelliteanalysis. Molecular Ecology Resources 11, 562–566.
Clement, M., Posada, D., Crandall, K.A., 2000. TCS: a computer program to estimategene genealogies. Molecular Ecology 9, 1657–1659.
Clevering, O.A., Lissner, J., 1999. Taxonomy, chromosome numbers, clonal diversityand population dynamics of Phragmites australis. Aquatic Botany 64, 185–208.
Clucas, R.D., Ladiges, P.Y., 1980. Dieback of Phragmites australis (Common reed) andincreased salinity in the Gippsland Lakes. Publication No. 292. Ministry for Con-servation, Victoria.
Dept. of Natural Resources and Environment, 2001. Lake Wellington CatchmentSalinity Management Plan Wetlands Monitoring Project. Part of A: Analysis andinterpretation of wetland monitoring data, Victoria.
Erwin, K.L., 2009. Wetlands and global climate change: the role of wetlandrestoration in a changing world. Wetlands Ecological Management 17, 71–84,http://dx.doi.org/10.1007/s11273-008-9119-1.
Fér, T., Hroudová, Z., 2009. Genetic diversity and dispersal of Phragmites australis asmall river system. Aquatic Botany 90, 165–171.
Gosling, A., 2011. Coastal 20–$2.5 million for the restoration of 20 iconiccoastal wetlands in northern New South Wales and South East Queens-land. Australasian Plant Conservation: Journal of the Australian Networkfor Plant Conservation 20, 3–4, Availability: http://search.informit.com.au/documentSummary;dn=667316528065061;res=IELHSS, ISSN:1039-6500 (cited24.07.12).
Guo, W., Wang, R., Zhou, S., Zhang, S., Zhang, Z., 2003. Genetic diversity and clonalstructure of Phragmites australis in the Yellow River delta of China. BiochemicalSystematics and Ecology 31, 1093–1109.
Hall, T., 1999. BioEdit: a user-friendly biological sequence alignment editor andanalysis program for Windows 95/98/NT. Nucleic Acids Symposium Series 41,95–98.
Hardy, O.J., Vekemans, X., 2002. SPAGeDi: a versatile computer program to ana-lyse spatial genetic structure at the individual or population levels. MolecularEcology Notes 2, 618–620.
Havens, K., Berquist, H., Priest, W., 2003. Common reed grass Phragmites australis,expansion into constructed wetlands: are we mortgaging our wetland future?Estuaries 26, 417–422.
Hellings, S., Gallagher, J., 1992. Effects of salinity and flooding on Phragmites australis.Journal of Applied Ecology 29, 41–49.
Hoffmann, A.A., Willi, Y., 2008. Detecting genetic responses to environmentalchange. Nature Reviews 9, 421–431.
Howard, R.J., Rafferty, P.S., 2006. Clonal variation in response to salinity and floodingstress in four marsh macrophytes of the northern Gulf of Mexico, USA. Environ-mental and Experimental Botany 56, 301–313.
Howard, R.J., Travis, S.E., Sikes, B.A., 2008. Rapid growth of a Eurasian haplotype ofPhragmites australis in a restored brackish marsh in Louisiana, USA. BiologicalInvasions 10, 369–379.
Jodoin, Y., Lavoie, C., Villeneuve, P., Theriault, M., Beaulieu, J., Belzile, F., 2008. Highways as corridors and habitats for the invasive common reed Phrgamites australisin Quebec, Canada. Journal of Applied Ecology 45, 459–466.
Jombart, T., 2008. adegenet: a R package for the multivariate analysis of geneticmarkers. Bioinformatics 24, 1403–1405.
Jombart, T., Devillard, S., Balloux, F., 2010. Discriminant analysis of principal com-ponents: a new method for the analysis of genetically structured populations.BMC Genetics 11, 1–15.
Jombart, T., Ahmed, I., 2011. adegenet 1.3-1: new tools for the analysis of genome-wide SNP data. Bioinformatics, http://dx.doi.org/10.1093/bioinformatics/btr521.
Kirk, H., Paul, J., Straka, J., Freeland, J.R., 2011. Long-distance dispersal and highgenetic diversity are implicated in the invasive spread of the common reedPhragmites australis (Poaceae), in North America. American Journal of Botany98, 1180–1190.
Krause, G.H., Weis, E., 1991. Chlorophyll fluorescence and photosynthesis: the basics.Annual Review of Plant Physiology and Plant Molecular Biology 42, 313–349.
Lissner, J., Schierup, H.H., 1997. Effects of salinity on the growth of Phragmites aus-tralis. Aquatic Botany 55, 247–260.
Loveless, M.D., Hamrick, J.L., 1984. Ecological determinants of genetic struc-ture in plant populations. Annual Review of Ecology and Systematics 15,65–95.
Mantel, N., 1967. The detection of disease clustering and a generalized regressionapproach. Cancer Research 27, 209–220.
Marks, M., Lapin, B., Randall, J., 1994. Phragmites australis (P-communis)—threats,management, and monitoring. Natural Areas Journal 14, 285–294.
Matthews, J.W., Peralta, A.L., Flanagan, D.N., Baldwin, P.M., Soni, A., Kent, A.D.,Endress, A.G., 2009. Relative influence of landscape vs. local factors onplant. community assembly in restored wetlands. Ecological Applications 19,2108–2123.
McCormick, M., Kettenring, K.M., Baron, H.M., Whigham, D.F., 2010a. Extent andreproductive mechanisms of Phragmites australis spread in brackish wetlands inChesapeake Bay, Maryland (USA). Wetlands 30, 67–74.
McCormick, M., Kettenring, K.M., Baron, H.M., Whigham, D.F., 2010b. Spread ofinvasive Phragmites australis in estuaries with differing degrees of develop-ment: genetic patterns, Allee effects and interpretation. Journal of Ecology 6,1369–1378.
Meadows, R.E., Saltonstall, K., 2007. Distribution of native and introduced Phrag-mites australis in freshwater and oligohaline tidal marshes of the Delmarvapeninsula and southern New Jersey. Journal of the Torrey Botanical Society 134,99–107.
Merritt, D.M., Scott, M.L., Poff, N.L., Auble, G.T., Lytle, D.A., 2010. Theory, methodsand tools for determining environmental flows for riparian vegetation: riparianvegetation-flow response guilds. Freshwater Biology 55, 206–225.
Morris, K., Raulings, E., Melbourne, T., Mac Nally, R., Thompson, R.M., 2011. A noveltrap for quantifying the dispersal of seeds by wind. Journal of Vegetation Science22, 807–817.
Munns, R., Tester, M., 2008. Mechanisms of salinity tolerance. Annual Review ofPlant Biology 59, 651–681.
Otto, S.P., 2007. The evolutionary consequences of polyploidy. Cell 131, 452–462.Paul, J., Vachon, N., Garroway, C.J., Freeland, J.R., 2010. Molecular data provide strong
evidence of natural hybridization between native and introduced lineages ofPhragmites australis in North America. Biological Invasions 12, 2967–2973.
Paul, J., Kirk, H., Freeland, J., 2011. Genetic diversity and differentiation of frag-mented reedbeds (Phragmites australis) in the United Kingdom. Hydrobiologia665, 107–115.
Author's personal copy
146 C.R. Hurry et al. / Aquatic Botany 104 (2013) 138–146
Peakall, R., Smouse, P.E., 2006. GENALEX 6: genetic analysis in Excel. Popu-lation genetic software teaching and research. Molecular Ecology Notes 6,288–295.
Plut, K., Paul, J., Ciotir, C., Major, M., Freeland, J.R., 2011. Origin of non-native Phrag-mites australis in North America, a common wetland invader. Fundamental andApplied Limnology 179, 121–129.
R Development Core Team, 2008. R: a Language and Environment for StatisticalComputing. R Foundation for Statistical Computing, Vienna, Austria, ISBN 3-900051-07-0, http://www.R-project.org/.
Ralph, P.J., Gademann, R., 2005. Rapid light curves: a powerful tool to assess photo-synthetic activity. Aquatic Botany 82, 222–237.
Raulings, E.J., Boon, P.I., Bailey, P.C.E., Roache, M.C., Morris, K., Robinson, R., 2007.Rehabilitation of Swamp Paperbark (Melaleuca ericifolia) wetlands in south-eastern Australia: effects of hydrology, microtopography, plant age and plantingtechnique on the success of community-based revegetation trials. WetlandsEcology and Management 15, 175–188.
Richter, B.D., Mathews, R., Wigington, R., 2003. Ecologically sustainable water man-agement: managing river flows for ecological integrity. Ecological Applications13, 206–224.
Salter, J., Morris, K., Bailey, P.C.E., Boon, P.I., 2007. Interactive effects of salinityand water depth on the growth of Melaleuca ericifolia Sm (Swamp paperbark)seedlings. Aquatic Botany 86, 213–222.
Saltonstall, K., 2002. Cryptic invasion by a non-native genotype of the common reedPhragmites australis into north America. Proceedings of the National Academyof Sciences of the United States of America 99, 2445–2449.
Saltonstall, K., 2003a. Genetic variation among North American popula-tions of Phragmites australis: implications for management. Estuaries 26,444–451.
Saltonstall, K., 2003b. Microsatellite variation within and among North Americanlineages of Phragmites australis. Molecular Ecology 12, 1689–1702.
Sato, T., Isagi, Y., Sakio, H., Osumi, K., Goto, S., 2006. Effect of gene flow on spatialgenetic structure in the riparian canopy tree Cercidiphyllum japonicum revealedby microsatellite analysis. Heredity 96, 79–84.
Silliman, B.R., Bertness, M.D., 2004. Shoreline development drives invasion of Phrag-mites australis and the loss of plant diversity on New England salt marshes.Conservation Biology 18, 1424–1434.
Slatkin, M., 1987. Gene flow and the geographic structure of nature populations.Science 236, 787–792.
Takahashi, R., Nishio, T., Ichizen, N., Takano, T., 2007a. Cloning and functional analysisof the K+ transporter PhaHAK2, from salt-sensitive and salt-tolerant reed plants.Biotechnology Letters 29, 501–506.
Takahashi, R., Shenkui, L., Takano, T., 2007b. Cloning and functional comparison ofa high-affinity K+ transporter gene PhaHKT1 of salt-tolerant and salt-sensitivereed plants. Journal of Experimental Botany 58, 4387–4395.
Tharme, R.E., 2003. A global perspective on environmental flow assessment:emerging trends in the development and application of environmental flowmethodologies for rivers. River Research and Applications 19, 397–441.
Vasquez, E.A., Glenn, E.P., Brown, J.J., Guntespergen, G.R., Nelson, S.G., 2005. Salttolerance underlies the cryptic invasion of North American salt marshes byan introduced haplotype of the common reed Phragmites australis (Poaceae).Marine Ecology Progress Series 298, 1–8.
Weeks, A.R., Sgrò, C.M., Young, A.G., Frankham, R., Mitchell, N.J., Miller, K.A.,Byrne, M., Coates, D.J., Eldridge, M.D.B., Sunnucks, P., Breed, M.F., James,E.A., Hoffman, A.A., 2011. Assessing the benefits and risks of translocationsin changing environments: a genetic perspective. Ecological Applications,http://dx.doi.org/10.1111/j.1752-4571.2011.00192.x.
Wijte, H.B.M., Gallagher, J.L., 1996. Effect of oxygen availability and salinity onearly life history stages of salt marsh plants. I. Different germination strategiesof Spartina alternifolia and Phragmites australis (Poaceae). American Journal ofBotany 83, 1337–1347.