MODELLING A WETLAND FOR SUSTAINABLE MANAGEMENT: ULUABAT LAKE
27
MODELLING A WETLAND FOR SUSTAINABLE MANAGEMENT: ULUABAT LAKE Burak Güneralp Yaman Barlas University of Illinois at UC Bogaziçi University Department of Department of Natural Resources and Environmental Sciences Industrial Engineering S. Goodwin Ave. Urbana IL 61801 USA 80850 Bebek, Istanbul, Turkey Telephone:++1 217 384 79 70 Telephone:++90 212 280 15 40, x2073 [email protected] [email protected] This research deals with sustainable management policies in a wetland. The region consists of a shallow lake and its surroundings. Fishing is a major commercial activity. The lake is under high nutrient loads. The goal of this research is to find a balance between ecosystem and economic activities in the region. To this end, a system dynamics model of the wetland is constructed. The results obtained from the model show that there is no threat of eutrophication in the near future. The major problem seems to be a potential decline in the welfare of the inhabitants mainly due to unsustainable population increase. The scenario runs reveal the lake would have become eutrophic, if crayfish population did not collapse due to a fungus disease in 1986. Recovery of crayfish sometime within the model timeframe results increase in crayfish harvest; hence in income from fishing leading to betterment in social conditions. ‘Improved agricultural techniques’ is the only policy that leads to better social conditions through increasing yield per hectare. It is hoped that the dynamic simulation model will serve as a laboratory to analyse different policy alternatives. Keywords: System dynamics, simulation, sustainable management, shallow lakes, eutrophication. 1. INTRODUCTION Wetlands are extremely important and rich ecosystems. They also constitute a great potential for economic, cultural, scientific, and recreational value to human life. Similarly, shallow lakes form one of the most fragile ecosystem types on earth and they are generally the first to perish under development activities (Barbier et al., 1997). Shallow lakes have only recently drawn the attention of scientists; thus their ecology is still not well known. Recent studies on shallow lakes suggest that there may be two alternative equilibria over a range of nutrient concentrations: A clear state dominated by macrophytes and a turbid state dominated by high algal biomass. This has important implications for management of shallow lakes (Scheffer et al., 1993). It is wise to ask: “Do our so-called development activities constitute a true development or are we digging our own graves while degrading our environment?” Achievement of both conservation and effective natural resources utilisation requires careful analysis and well understanding of the system regarding the region under study. The relations amongst wildlife, people, government etc. almost always constitute highly complex dynamic systems. So a holistic/systemic point of view is to be adopted and considerable amount of time must be devoted to field studies to analyse these systems and provide solutions.
Transcript of MODELLING A WETLAND FOR SUSTAINABLE MANAGEMENT: ULUABAT LAKE

MODELLING A WETLAND FOR SUSTAINABLE MANAGEMENT: ULUABAT LAKE
Burak Güneralp Yaman Barlas
University of Illinois at UC Bogaziçi University
Department of Department of Natural Resources and Environmental Sciences Industrial Engineering S. Goodwin Ave. Urbana IL 61801 USA 80850 Bebek, Istanbul, Turkey
Telephone:++1 217 384 79 70 Telephone:++90 212 280 15 40, x2073 [email protected] [email protected]
This research deals with sustainable management policies in a wetland. The region consists of a shallow lake and its surroundings. Fishing is a major commercial activity. The lake is under high nutrient loads. The goal of this research is to find a balance between ecosystem and economic activities in the region. To this end, a system dynamics model of the wetland is constructed. The results obtained from the model show that there is no threat of eutrophication in the near future. The major problem seems to be a potential decline in the welfare of the inhabitants mainly due to unsustainable population increase. The scenario runs reveal the lake would have become eutrophic, if crayfish population did not collapse due to a fungus disease in 1986. Recovery of crayfish sometime within the model timeframe results increase in crayfish harvest; hence in income from fishing leading to betterment in social conditions. ‘Improved agricultural techniques’ is the only policy that leads to better social conditions through increasing yield per hectare. It is hoped that the dynamic simulation model will serve as a laboratory to analyse different policy alternatives. Keywords: System dynamics, simulation, sustainable management, shallow lakes, eutrophication.
1. INTRODUCTION Wetlands are extremely important and rich ecosystems. They also constitute a great potential for economic, cultural, scientific, and recreational value to human life. Similarly, shallow lakes form one of the most fragile ecosystem types on earth and they are generally the first to perish under development activities (Barbier et al., 1997). Shallow lakes have only recently drawn the attention of scientists; thus their ecology is still not well known. Recent studies on shallow lakes suggest that there may be two alternative equilibria over a range of nutrient concentrations: A clear state dominated by macrophytes and a turbid state dominated by high algal biomass. This has important implications for management of shallow lakes (Scheffer et al., 1993). It is wise to ask: “Do our so-called development activities constitute a true development or are we digging our own graves while degrading our environment?” Achievement of both conservation and effective natural resources utilisation requires careful analysis and well understanding of the system regarding the region under study. The relations amongst wildlife, people, government etc. almost always constitute highly complex dynamic systems. So a holistic/systemic point of view is to be adopted and considerable amount of time must be devoted to field studies to analyse these systems and provide solutions.
Three sub-systems are essential elements in a sustainable management practice: Social, ecological and economic. The social sector deals with demographics, and equity and disparity within the human population. The ecological sector considers the ecological conditions on which life depends. Finally, economic sector considers economic development and other non-market activities that contribute to social well-being. Also, the borders of the system under study must be carefully determined not to break any major links between elements (Hardi et al., 1998). A crucial characteristic of a sustainable management practice is the contribution of various disciplines and involvement of all interested groups (Hardi et al., 1998). Systems thinking provides the proper philosophical perspective for sustainable management practices and system dynamics methodology provides a suitable modelling platform. In system dynamics literature, sustainable management studies have a distinct place and System Dynamics offers an important research potential in this area (Saeed et al., 1998).
2. THE STUDY REGION The region modelled is in Temperate Climate Belt. The wetland under study is in Turkey, a developing country. The region consists of a shallow lake named Uluabat (or Apolyont), rivers flowing in and out of the lake, groundwater, and lands surrounding the lake. It is an important nesting place for bird species, some of which are under the threat of extinction. In spite of this crucial role the wetland plays and although it meets the “Ramsar” Criteria, it was not under conservation status until recently. This situation resulted in “development” activities, which damaged the ecosystem and in turn, the habitat of endangered bird species (Uluabat Gölü, 1998). Crayfish population was an important element of the lake ecosystem until 1986, the year when the population was hit by fungi (Yarar et al., 1997). The lake under continuous load of organic wastes is faced with the threat of becoming eutrophic (Inan et al., 1997). The inhabitants rely on fishing, agriculture and -until recently- crayfish harvest. On the one hand, fishing and its related industry is quickly replacing the crayfish harvest and industry; on the other hand, agriculture is the most pervasive way of subsistence among the inhabitants although some villages, such as Gölyazi, almost totally rely on fishing (Inan et al., 1997). Tomato cultivation is significant. The plants near the lake to produce tomato paste process tomato, cultivated on fields around the lake. The production equals 80% of Turkey’s tomato paste production. The irrigation is done by water pumped from the lake and its major inflow. The intensive fertiliser and pesticide use may be potential sources for the pollution of lake’s waters which would in turn affect the agriculture in the wetland. However, no empirical evidence is available yet (Demir et al., 1998, Inan et al., 1997). Another problem about the wetland is intensive fishing. This is one of the major activities that has adverse effects on the fragile wetland ecosystem (Türkiye'deki Içsular ve Balik Çiftlikleri Incelemesi, 1994). The industry in the wetland mainly consists of processing plants. The agricultural yield is processed in these plants. The -mostly organic- wastes of these plants also threaten the wetland ecosystem. On the other hand, installation of treatment facilities is the most important mean to reduce the amount of wastes. Apart from these pollution sources, rivers, carrying the toxic and organic wastes of industrial plants and households, located in their catchment basins, further worsen the state of the lake (Inan et al., 1997).

There are also projects (some in construction phase) of DSI (Devlet Su Isleri-StateHydraulic Works) put forward to regulate the hydrology of the lake. The inhabitants are aware of most of the problems of their region though they do not know the full extend of problems. Hence, it is important to educate the inhabitants and thus raise the awareness to desired levels with the endeavours of local organisations, and NGO’s such as Society for the Protection of Nature (DHKD) and Development Foundation of Turkey (TKV). The ultimate goal of this research is to find a balance between ecosystem and human activities so as to secure a continuous improvement in well-being of the inhabitants while improving or at least maintaining the ecosystem. To this end, using system dynamics methodology, a systemic dynamic model of the wetland system is constructed by identifying the main elements and the interactions among them; after validation, various policies are analysed on the model by altering some parameters and/or relations.
3. MODEL OVERVIEW The model has three sectors as mentioned above. These sectors are Lake Ecology, Economic activities and Social structure on the periphery of the lake. Each sector consists of several sub-sectors (Güneralp, 2000). Ecological elements of the lake and their interactions are modelled as the Lake Ecology sector. In conceptualisation and construction of the ecology sector, limited studies done on shallow lakes have been used. For the purpose of this research, a very detailed model of the lake ecosystem is not needed. The ecosystem is represented detailed enough as to have a meaningful input-output exchange with the other two sectors. Economic sector includes all activities of the inhabitants that have a significant economic value such as industrial facilities, farming around the lake and fishing. Social Structure sector deals with the demographics and well-being of the inhabitants, tightly related with the functioning of other two sectors. 3.1. Main Assumptions for the Model There are eleven major assumptions of the model:
• There are two major species of fish in the lake. • Regeneration of fish and crayfish takes place all year long. • Flood plain mechanism that is flooding of the lake's shoreline during peak seasons of
the lake volume is not included in the model. • Immature pike/carp and immature crayfish are not landed. • Macrophyte cover area is based on lake surface area since there is no available
updated data on lake bottom area. • Dynamics of nitrogen fixation by organisms and dissolved oxygen (DO) in the lake
are not included in the model. • 1995 real prices are used. • In initial conditions, fifty per cent of crops processed in plants come from within the
region and the rest from out of the region. • The effect of rainfall on irrigation is taken as negligible. • Only rural population in the region is considered. • Random effects are ignored in the model because of lack of available data and
because randomness is unlikely to change the major behaviour patterns significantly. Therefore, average values are assigned to all parameters and inputs.

3.2. The Lake Ecology Sector The sector consists of four sub-sectors: Hydrology, nutrients & other indicators, chloro a-zooplankton-macrophyte and Fish & Crayfish. A summarised, “broad” causal-loop diagram of the ecology sector is given in Figure 3.1. Hydrology sub-sector is the skeleton of the lake ecology sector. It is the sub-sector in which the physical state and hydrological dynamics of the lake is modelled. This sub-sector consists of standard stock-flow equations that calculate natural inflows and outflows, mass balance (volume), surface area, depth of the lake, and the irrigation flow (which interacts with the economy sector). Groundwater is not included in the model since lack of available data. Phosphorus (P) and nitrogen (N) are the two major nutrients, bound by plants during photosynthesis. In Lake Uluabat, nitrogen is mainly present in the form of NO2
-, NO3- and
NH4+, whereas phosphorus is mainly present in the form of PO4
-3. Their concentrations in the lake water and the ratio of nitrogen to phosphorus are important parameters. They dictate the “trophic” state of the lake. The sum of nitrogen from all three sources is regarded as total nitrogen in the lake and used as such in the model. The amount of these two nutrients in the lake water is represented as stocks N, and O-PO4. Their unit is milligrams. The concentration of phosphorus and nitrogen in the lake water is calculated by dividing the corresponding stock value, P and N respectively, to the Lake stock (Figure 3.1). A portion of both phosphorus and nitrogen inputs into a water body is stored in sediments. Moreover, phosphorus and nitrogen in sediments are released back to water at a certain rate. This mechanism forms a feedback structure that may act as a buffer mechanism in certain cases. In general, sedimentation rate is higher, which results in nutrient excess in sediments and a nutrient supply to water body internally even if external input no longer exists. The result is prolonged danger of eutrophication, which may be the case in Lake Uluabat. Sewage from urban settlements, industrial areas, and nutrient flow from drainage basin are major sources for both nutrients. Nutrient flow from these sources are formulated as graphical functions and extrapolated to the future. However, another source for nitrogen is agricultural areas. Excess nitrogen, originates from fertilisers and not bound by plants and in the soil, leaks to the lake whereas all the excess phosphorus from fertilisers is stabilised. Nutrient flow from agriculture depends on the cultivated area and the type of crop. It is worth to note that nitrogen fixation mechanism by organisms that may play an important role in nitrogen removal from water body is not included in the model. A toxic, bor concentration although it is not at detrimental levels, is computed in this sub-sector together with BOD (Biological Oxygen Demand), simply as water quality indicators. Dissolved oxygen (DO), whose amount is crucial for living organisms in the lake, is ignored since the decline in DO is significant only at organic waste discharge points and thus the complexities involving its inclusion in the model is not justified. The suspended solid concentration in the lake is also computed in this sub-sector and it affects transparency of the lake water. The diagram of this sub-sector is given in Figure 6.8. Algal, macrophyte and zooplankton biomasses are calculated in the waterplants & zooplankton sector (Related parts in Figure 3.1). Algal biomass is represented by the chloro A content of the lake water which is found by a logarithmic relationship algal biomass, chloro a, P and N concentration of the lake, O PO4 in lake and N in lake (J�rgensen, 1994). The

equations of nutrient concentrations in the lake are given in eqns 3.1a-b and there are three such empirical relationships, each accepted valid for one of three N:P ratios (eqns 3.2, 3.3, 3.4) (J�rgensen, 1994).
O PO4 in lake=IF THEN ELSE(Lake>0, (1-macrophyte use)*(O PO4/Lake),0) (3.1a)
N in lake=IF THEN ELSE(Lake>0, (1-macrophyte use)*(N/Lake),0) (3.1b)
For the case N in lake:P in lake ratio > 12, the relationship is:
log10(chloro a)=1.45*log10[(P in lake)*1000] - 1.14 (3.2);
for the case the ratio < 4:
log10(chloro a)=1.4*log10[(N in lake)*1000] - 1.9 (3.3);
for the case the ratio > 4 and the ratio < 12:
MIN (log10(chloro a)=1.4*log10[(N in lake)*1000]-1.9, log10(chloro a)=1.45*log10[(P in
lake)*1000]-1.14) (3.4)
where N in lake and O PO4 in lake are expressed as mg per litre; chloro a is found in µg per litre.
However, algae is controlled by its predator, zooplankton. So, the actual chloro A is the algal biomass that can be observed in lake, although potential chloro A level “indicated” by P and N concentrations may be higher. The chloro A content is continuously flushed by the outflow of the lake (Figure 3.1). Macrophyte biomass unit is expressed as PVI (Plant Volume Infested). It is a function of P and N concentration of the lake and the P/N ratio. It is also affected by the chloro A content of the lake, since algae is more efficient in getting nutrients from water than macrophyte (Figure 3.1). As the chloro A level gets higher, macrophyte can absorb less nutrient. Algal biomass has also an indirect effect on macrophyte biomass via lake water transparency. Transparency is dictated by actual chloro A level and its unit is SE (“Secchi disk transparency”). The relationship between SE and chloro A is a hyperbolic function as provided in Jørgensen, 1994. Macrophyte is able to colonise the lake water to a depth of three times the SE although the changes in lake transparency are not instantly reflected in the actual macrophyte biomass. It takes some delay time for macrophyte to colonise newly available regions and to perish from regions with insufficient light conditions. This situation is reflected in the model by the use of a third order exponential smoothing, with a delay constant of twelve months. The same is not the case for algae, since it is much more flexible than macrophyte, being able to respond to changes in its environment almost instantly. The struggle between macrophyte and algae is very significant for the overall ecosystem. The outcome of this struggle dictates the trophic state of the lake. Moreover, the outcome largely depends on the positive feedback loop, formed mainly by nutrient concentrations (i.e. N in

lake and O PO4 in lake), algae (i.e. actual chloro a), actual macrophyte, and transparency and depicted by darker arrows and above-mentioned variables in Figure 3.1.
Figure 3.1. The broad causal-loop diagram of the Lake Ecology Sector. Fish & Bird sector constitutes the top of the food chain and it is the sector of the ecology sector, directly linked to economy sector since the fish industry. There are a number of fish species in the lake but two fish species are economically significant: carp and pike (Figure 3.1). Fish that are between zero and two year-old are treated as separate immature fish stocks and are not reproductive. This allows both to differentiate the food needs/sources and to isolate the young fish from reproduction. Reproduction of fish is assumed to take place all year long since the climate conditions in the region are suitable. Pike, a predatory fish species, preys on other fish including carp and crustaceans, such as crayfish and it prefers clear waters. Hence, reproduction and death of pike depend on whether sufficient food is available and whether the lake is turbid or not. Both of these effects are reflected in the model as graphical functions. On the other hand, presence of pike means a grazing pressure on carp and crayfish that is in fact, a predator-controlled mechanism. The crucial point is that pike grazes on more abundant prey. In other words, when density of a prey species falls, grazing pressure on that species also decreases proportionate to the ratio of
Carp Death Carp
Fishing Carp
+Growth Carp+
Pike DeathPike
Fishing Pike
+Growth Pike+
refuge effectfor
zooplankton
Available volume to be colonised
macrophyte actual
P in sediment
Transparency
N in sediment
PO4 P Inflow PO4 P Outflow
PO4 P in lake
+
NH3 N
N InflowN Outflow
N in lake+
+
+
Zooplankton +
decay+
+
actual ChloroAflushed out+
-
+
-
NO3 N
NO2 N+
+
-
+
-
+-
-
+
++ -
-
-
-
+
+
-
++ -
-
+
+
+
-
+
+
+
+
+
+
- -
- lake volume
+
Crayfish Death Crayfish
Harvesting Crayfish
+Growth Crayfish
+
-+
-
-
+
+

it to total density of prey species. Though macrophyte contributes to clear water conditions which is favourable for pike, it also provides refuge for prey species. This refuge effect is represented as refuge against pike for carp in the model. Carp is a planktivorous fish; that is, it feeds mainly on zooplankton. The dynamics of carp is similar to pike. Food affects both reproductive capacity and death rate of carp with graphical functions. However, since carp prefers turbid waters, its reproductive capacity increases as lake water becomes more turbid, i.e. less transparent. Unlike pike, carp, both young and mature stocks, experience a grazing pressure. Since carp feeds on zooplankton, high carp density means low zooplankton density which means suitable growth conditions for algae. Algae cause turbidity which favours reproduction of carp and which in turn puts more grazing pressure on zooplankton. The result is a turbid lake dominated by carp and algal blooms.
Fishing is an external, anthropogenic (i.e. human-induced) factor that has the potential to alter the functioning of the ecosystem. Amount of fish that is landed depends on the number of fishermen and fishing effectiveness. Fishing effectiveness for pike/carp is a function of pike/carp density. As the density falls so does the effectiveness since it is less likely to catch less dense fish than to catch abundant fish (Figure 3.2). Fishing effectiveness is also affected by macrophyte to reflect the negative effect of macrophyte on fishing nets. Although, fungi attack in 1986 has driven the crayfish population near extinction, crayfish is also included in the model. One reason is that there is always a possibility for the crayfish to recover in which case its economic and ecological consequences are worth to analyse. Another is to test a highly debated policy option that is introduction of crayfish to the lake. Lake depth and cover of macrophyte that is main food for crayfish determine its reproductive capacity. Its death rate is a function of macrophyte. Since pike grazes it there is a grazing outflow from both immature crayfish and mature crayfish stocks as in carp. Crayfish harvest is a function of mature crayfish stock and is also affected by macrophyte. Specific data on population dynamics and feeding habits of birds is very limited. Also they are assumed not to have a significant effect on their prey species (insignificant compared to other effects). Two bird species could be selected as indicators of bird presence on the shores of the lake. These species are coot, a herbivorous species and pygmy cormorant, a carnivorous one. Coot feeds on macrophyte; and pygmy cormorant feeds on fish. Therefore, since the conditions of macrophyte and fish in the model also give some insight on the condition of birds they are not included in the model. Macrophyte provides refuge to a certain degree for zooplankton against its predators, carp and small pike, namely planktivorous fish. “Refuge effect” increases with increasing macrophyte biomass. When planktivorous fish biomass is high enough, the refuge effect diminishes considerably no matter how high the macrophyte biomass is (Schriver et al., 1995). Most of the parameter values specific to the lake are unavailable, including carp and pike stocks in the lake. Hence, their values were either estimated from literature or some estimates were done based on interpretations of incomplete data. For example, initial fish and crayfish stocks were estimated based on amount of fish and crayfish sold per year in the local market. Finally, note that there are a number of balancing (negative) feedback loops in the food chain

in addition to the large reinforcing (positive) loop mentioned in the previous section. One can conjecture that the stability of the ecosystem would depend on the relative strength (dominance) of these two types of loops (May, 1977, Scheffer, 1990).
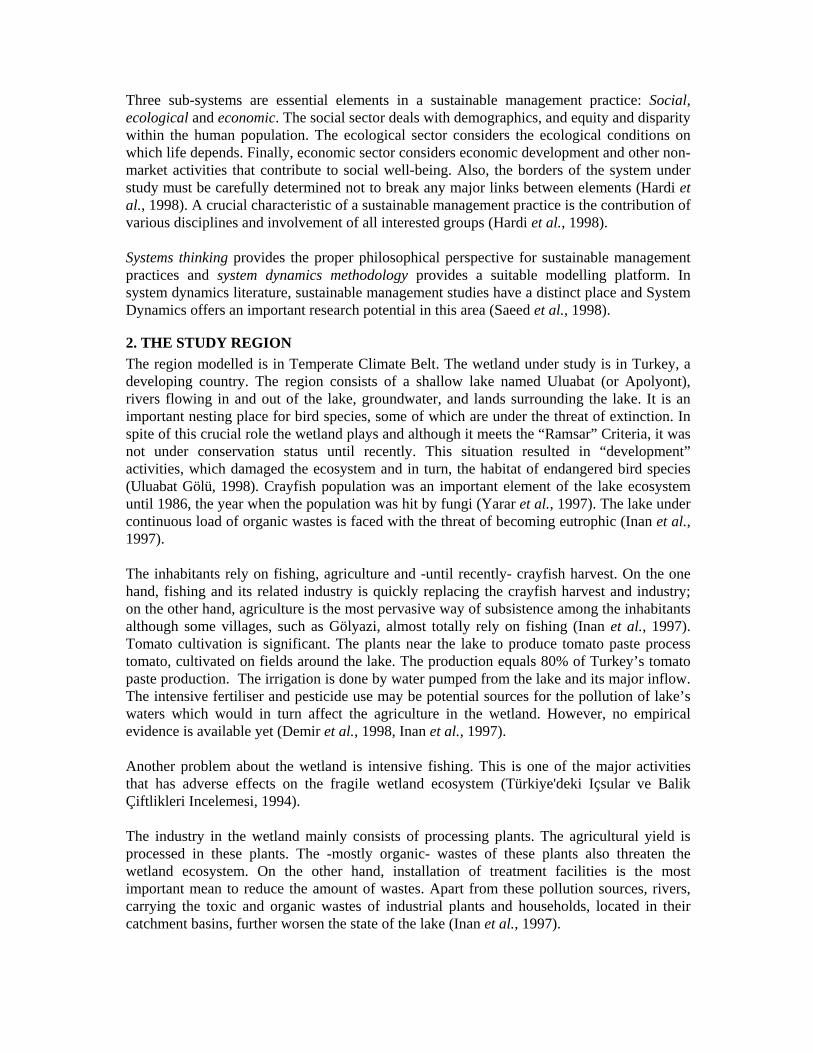
Figure 3.2. Fish-fishing effectiveness graph. 3.2. Economy Sector Three sub-sectors constitute the economy sector: fishing, agriculture and industry sub-sectors. The structures of these sub-sectors resemble each other. There are tomato, vegetable, fruit, and grain cultivation structures in the agriculture sub-sector. The related parameter values, such as yield per hectare and marketprice are estimated from available literature (Madran, 1991, Tarimsal Yapi-1995 (Üretim, Fiyat, Deger), 1997, Ergüler, M., 1994, GAP Bölgesinde Sulu Kosularda Bitkilerin Yetistirme Teknikleri, 1996). The structures of these are also similar. Hence, tomato cultivation sub-sector is explained in detail as an illustration. Figure 3.3 depicts the broad causal-loop diagram for the tomato cultivation sub-sector. Market price of tomato is a fixed constant, whereas tomato cultivated per hectare is a function of irrigation. Tomato harvest also depends on the land allocated to tomato cultivation. Total income increases as total tomato harvested increases. This income increases welfare of the inhabitants relying on tomato cultivation, which in turn increases attractiveness of tomato cultivation for others. But this attractiveness must be “normalised” and compared against the attractiveness of other economic activities. Thus, these normalised values represent how people prefer different economic activities, depending on the relative attractiveness of each. The multiplication of normalised attractiveness of tomato cultivation (which is a number between 0 and 1) with total workforce determines the workforce in tomato cultivation (Figure 3.3). The land on which tomato is cultivated is an increasing function of the workforce. Maximum value it can reach is the total arable land around the lake. The main interactions between the agriculture sub-sector and the lake are irrigation of fields and excess fertilisers returning back to the lake from fertilised lands. It is assumed that fertiliser use is currently three times more than the actual need. Irrigation is affected negatively when the water level in the lake drops down.
Fishing Effectiveness graphical function
1
00 100Fish (kg/ha)
Fishing has a similar structure. Since the lake does not have the capacity to sustain extreme fishing, it is clear from Figure 3.3 that increased income draws more workforces to fishing, so the pressure increases on fish, which in turn inevitably reduces total fish landed as a result of diminished fish stocks. (Fishing from the lake is affected from the fish stock in the lake). This is exactly what is observed in the lake now. This will either virtually exterminate fish from the lake or reduce the fishing workforce to a ‘sustainable’ level depending on the prevailing conditions as a result of the system structure.
Workforce in Tomato Cultivation
Normalised Attractiveness Tomato Cultivation
Attractiveness of Tomato CultivationIncome per Tomato Cult Workforce
Total Income from Tomato Cultivation
Marketprice TomatoTotal Tomato Cultivated
+ +
+ -
+
+
Tomato Cultivated per Hectare
Tomato Cultivation Area
++
+
<Total Workforce>
+
<Attractiveness>
-1
from Social subsystem
from Social subsystem+
+<Irrigation>
+
from Ecology subsystemFertiliser use
+
Figure 3.3. Broad causal loop diagram of Tomato Cultivation from the Economy sector.
In the fishing sub-sector, fishing per workforce is a constant and total fish landed, is multiplication of this constant with fishing workforce, and fishing effectiveness. Fishing effectiveness reflects the effect of fish density and macrophyte. In calculating total income from fishing, actual fishing is computed by summing crayfish harvest, pike and carp landings, which are computed by multiplication of fishing pike/carp with lake surface area, area. Industrial plants near the lake either process crop from agricultural lands or fish (products). Initially, half of the tomato used to come out of the region and increases with the same rate as population. The rest is the yield from tomato cultivation lands in the region, tomato. In a different way, fish processing plants get fish out of the region since almost all fish landed in the lake is consumed in houses. An increase in either crop or fish is directly reflected as an increase on the production of industrial plants. Therefore, in the agricultural and aquacultural industry, the expansion of the industry depends on the amount of harvests and available workforce. If there occurs a decline in harvests, this affects the industrial plants and facilities. The same balancing (negative) feedback structure applies here also, with slight modifications. For example, although marketprice is constant, the production is a linear function of it for validation purposes. In addition, actual workforce is dictated by production amount. If actual workforce is greater than workforce supply, then this indicates a shortage in the area and it is assumed that this shortage is compensated hiring from surplus workforce in the region, surplus wf total and, if necessary, workforce out of the region (eqn. 3.5). If workforce supply is greater than actual workforce then there is a surplus workforce, which has the same meaning as the ones in agriculture sub-sector. However, there is no unmet workforce in agriculture sub-sector since for a land to be cultivated there should be someone to cultivate it. There is no already cultivated land waiting for workforce. Also there is no unmet workforce or surplus workforce in fishing sub-sector.

Unmet Wf Need TP= IF THEN ELSE ((Wf Supply TP-Actual Wf Need TP)<0, (Actual Wf Need TP-Wf Supply TP),0) (3.5)
The main interaction between industrial plants and the lake is the discharge of the plants. Since discharges are mainly organic it is assumed in the model that they are only composed of organic wastes: Organic waste discharge. These discharges may play a significant role in the probable eutrophication of the lake. Also, the discharges of some other industrial facilities outside the periphery of the lake also reach the lake via the inflow river. These discharges are represented as external inputs in the nutrients & other indicators sub-sector of the model.
3.3. Social Sector Demographic indicators are modelled in the social sector (Figure 3.4). Population dynamics, total workforce, average income per workforce of the regional population are all computed in this sector.
Figure 3.4. Diagram of the Social Sector. Only the rural population is considered in the study. Net birth fraction for the region is 1.75 per cent per year (Uluabat Gölü'ne Yakin Köylerin Ekonomik, Sosyal ve Kültürel Yapi Ön Arastirma Raporu, 1998). Assuming an average of five person and one workforce per family, the total workforce in the region is one-fifth of the population. The difference between total surplus workforce and total unmet workforce need gives the unemployed workforce in the region. Surplus workforce from sub-sectors with full employment is employed in sub-sectors with nonzero unmet workforce. However, unmet workforce may be higher than surplus in which case it is assumed that the remaining workforce need is met by hiring workforce outside the region. This is a common practice in the Uluabat region. On the other hand, if unmet workforce is less than surplus than there is nonzero unemployed workforce in the region (eqn. 3.6). The sector also provides parameters required to calculate allocation of workforce amongst competing economic activities, such as fishing, agriculture or industrial processing. This parameter for each economy sub-sector is the ratio of the attractiveness of that economy sub-sector to attractiveness total that is the sum of attractiveness of all economy sub-sectors.
Attractiveness TOTAL
<Attractiveness Grain><Attractiveness Dairy>
<Attractiveness Fishing>
<Attractiveness Fruit><Attractiveness FC>
<Attractiveness PF><Attractiveness Tomato>
<Attractiveness TP><Attractiveness Vegetable>
<Attractiveness VC>
Populationnet birth rate
netbirthfraction Total Workforce
Wf Fraction
Total Actual Cultivated Area Total Indicated Cultivated Area<Indicated GrainArea><Indicated Fruit Cult Area>
<Indicated Tomato Cult Area>
<Indicated Veg Cult Area>
Discrepancy btw Indicated Actual
Total Available Cultivated Area<Actual Grain Cult Area>
<Actual Fruit Cult Area> <Actual Tomato Cult Area>
<Actual Veg Cult Area>
Surplus Wf TOTAL
Intensity Limit for Cult Area
Workers’ Share
Unmet Wf Need TOTAL
Unemployed in the Region
effect of Workers’ Share on production lp
Avg Income per Workforce
<Total Income Dairy to Workers> <Total Income FC to Workers><Total Income Fishing>
<Total Income Fruit>
<Total Income Grain><Total Income PF to Workers>
<Total Income Tomato>
<Total Income TP to Workers>
<Total Income VC to Workers><Total Income Vegetable>

Unemployed in the Region=IF THEN ELSE ((Surplus Wf TOTAL-Unmet Wf Need
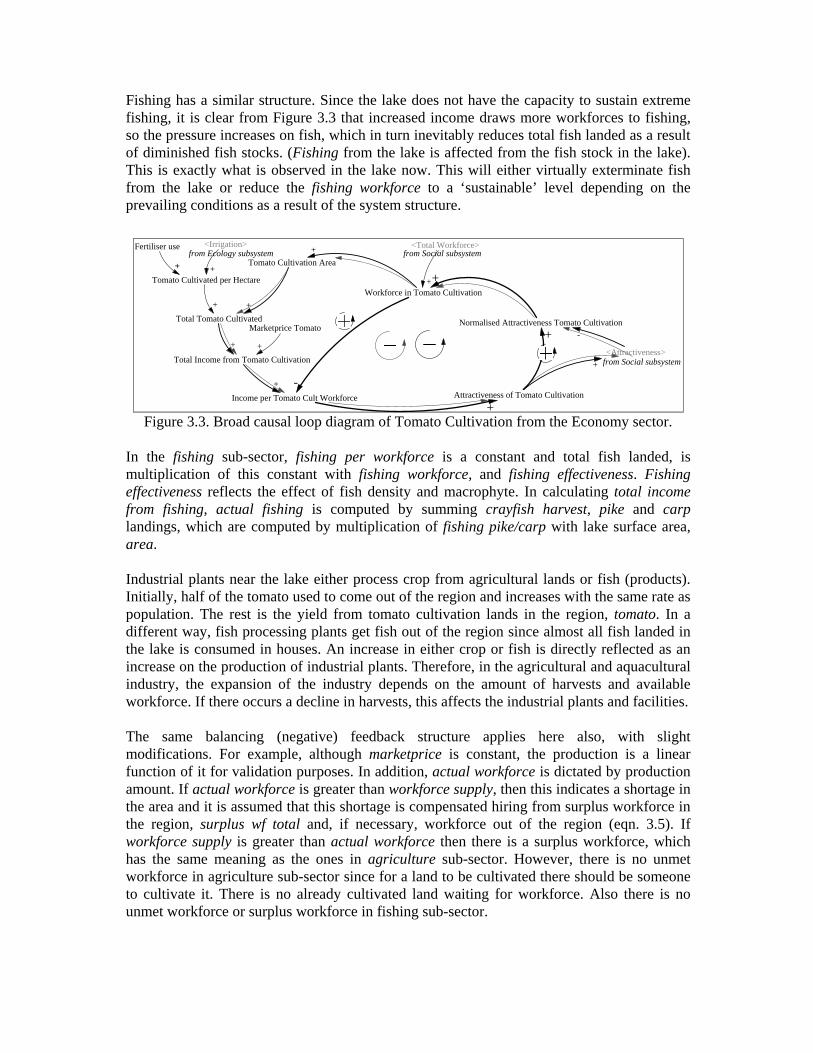
TOTAL)>0,Surplus Wf TOTAL-Unmet Wf Need TOTAL,0) (3.6) 4. VALIDATION AND BASE RUN Verification and validation testing, done by carrying out some standard procedures, follow the model construction (Barlas, 1996). As for verification, the equations that define the relationships between variables are checked and dimensional consistency is ensured on both sides of the equations. Also control variables are used in the model to prevent formulation errors. The lake ecology sector is particularly critical in this respect. Validation tests are carried out both on individual sub-sectors and on the whole model. The model passed these structural and behavioural validation tests. Also the model-generated behaviour patterns of major variables are evaluated based on the literature on shallow freshwater lakes and available data on Lake Uluabat and they are accepted sufficient. Clearly, it would be possible to establish a stronger case if numerical time-series data were present. However, it should be kept in mind that the main purpose of the model is to capture the broad dynamic behaviour patterns of the real system, not point prediction (Güneralp, 2000). 4.1. Base Run Base run of the model is simulated under the pre-mentioned set of assumptions, graphical functions, model structure and parameter values which reflect current conditions prevailing the region. The time frame of the study is 34 years beginning from the year 1982 until 2016 (Güneralp, 2000). Time axis is in months in model-generated graphs; a second scale in years is added below the month scale for explanatory purposes. The discussion in the text is done using years as the time scale. 4.1.1. Social Sector The population and total workforce is increasing as expected. There occurs an increase in unemployed among rural population, which is expected because the arable lands are limited and businesses have limited capacity. Fishing is not able to compensate this unemployed workforce. Total attractiveness of work sectors in the region is contracting. As the total attractiveness, average income per workforce in the region is also declining (Figure 4.1). Thus, the result from the base run simulation is that the welfare of people in the region worsens. In addition to first decline in 1986, there is a faster decline after about 1997. One reason is that the demand for cultivated area increased so much that it exceeds total available cultivated area resulting in less land for each workforce. Another reason is the increase in unemployed. These are reflected in the general welfare of people in the region as a decline in avg income per workforce. It is also worth to note that dry-wet year cycles affect avg income hence the welfare to a certain extent. In dry years, the fishing yield is relatively low hence income from fishing. The avg income per workforce in the beginning of year 2000 is about US$200 in 1995 base prices. Consequently, it is observed that increase in unemployed in the region as a result of limited arable lands and limited capacity of businesses, and as a result of this decline in welfare of inhabitants, especially after the year 1997 (month 180), are the most important dynamics in this sector.
Graph for Avg Income per Workforce
220
204
190
177
164 1 75 149 223 297 371
Time (Month)
Avg Income per Workforce : sustain2015 US$/(Month*person) 1982 2016
Figure 4.1. Average income per workforce in the region.
4.1.2. Economy Sector In agriculture sub-sector, inefficiencies in irrigation during dry years cause a slight fall in yield per hectare, which is reflected in income per workforce. Cultivated areas increase as total workforce increases as a result of population dynamics. On the other hand, a continuous decreasing trend begins in normalised attractiveness of each crop as total cultivated lands reach the available arable lands in year 1996 (month 168). The reason is that while population and hence workforce supply in agriculture keep increasing, the total cultivated area stays constant. As a result income per workforce diminishes and, consequently, normalised attractiveness drops. However since increase in total workforce is greater than the decrease in normalised attractiveness, workforce supply keeps increasing. Furthermore workforce also increases; in fact, it is equal to workforce supply in this case. Namely, every person who is willing to work in agriculture sub-sector finds opportunity to do so. This means the critical intensity limit is not reached in any of the areas in the agriculture sub-sector. The situation in the industry sub-sector is quite different. Although the production in industrial plants, except fish processing plants, experiences a drop during dry years (as a result of drop in yields) this does not affect income per workforce. The reason is that workforce, i.e. workforce to be employed each year, is dictated by the amount of production in the plants. So, attractiveness stays the same and normalised attractiveness begins to increase in the sub-sector as normalised attractiveness of agriculture sub-sector begins to decrease. Fishing workforce while increasing during first few years as a result of high attractiveness amongst inhabitants and population increase, experiences a sharp decline in the year 1986 (month 48) in which the fungi hit mature crayfish stocks in the lake (Figure 4.2). Although it does not follow a smooth pattern, normalised attractiveness of fishing declines throughout the simulation timeframe. However, fishing workforce increases slightly after year 2000 (month 216) mainly because of an overall increase in fish stocks in the lake (Figure 4.5). The most notable dynamics of this sector are the decline in fishing workforce as a result of the collapse of crayfish population in year 1986. Also decline in normalised attractiveness of

agriculture sub-sector as a result of crowding of cultivated areas as opposed to increase in normalised attractiveness of industry sub-sector are worth to mention. On the other hand, normalised attractiveness of fishing stays more or less the same after year 1986 while it was increasing before that year.
Figure 4.2. Fishing workforce. 4.1.3. Lake Ecology Sector The striking outcome obtained from the base run is that eutrophication of the lake will not occur. This statement is crucial since there is a widespread acceptance on eutrophication of the lake in the near future if current conditions persist. However, pike controls carp and macrophyte takes out the nutrients from the lake water, controlling algal growth. So, clear water conditions persist in the lake at least for the next fifteen years. Two types of oscillations are observed in lake hydrological dynamics. The smaller ones are monthly oscillations caused by fluctuations in the major inflow source, i.e. M.Kemalpasa River. The larger oscillations are the result of wet-dry year cycles. 1988-1996, 2003-2008, 2014-2015 periods are dry years (i.e. months 72-168, 252-312, and 384-396). The only notable point in irrigation is the slight decrease in water drained because of the decline in the lake depth. Mean nitrogen concentration and mean phosphorus concentration are not critically high. So P is the limiting nutrient during spring and N, during fall after 1994 while N is the limiting one until that year. Also, suspended solid concentration in the lake is around 100 mg per litre; again a reasonable value due to reduced suspended solid loading from the major inflow in recent years. The fluctuations in these variables are caused by fluctuations in their loading, except suspended solid fluctuations, which are the result of monthly fluctuations in inflow and outflow sources of the lake. Also 5-day BOD and bor concentrations are well below the dangerous levels. Macrophyte cover is approximately 55 PVI during dry years and 40 PVI during wet years. Overall, the average macrophyte cover in the lake bottom is around 50 per cent. Chloro a level in the lake is always below 50 µg per litre, except a period just before the collapse of crayfish population where chloro a concentration reaches 84.7 µg per litre. Chloro a level is controlled by both macrophyte, via nutrient concentrations, and zooplankton that does not experience a high grazing pressure from planktivorous fish (Figure 4.3).
Graph for Workforce Fishing
200
167.5
135
102.5
70 1 75 149 223 297 371
Time (Month)
Workforce Fishing : sustain2015 person 1982 2016
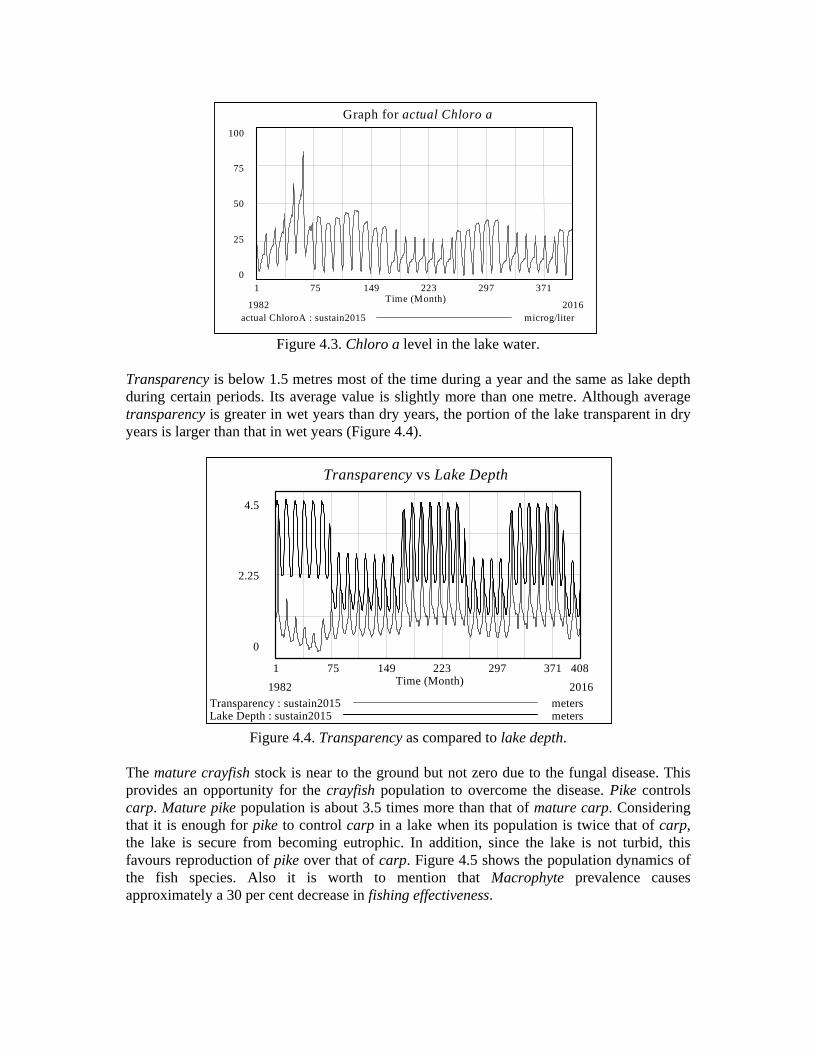
Figure 4.3. Chloro a level in the lake water. Transparency is below 1.5 metres most of the time during a year and the same as lake depth during certain periods. Its average value is slightly more than one metre. Although average transparency is greater in wet years than dry years, the portion of the lake transparent in dry years is larger than that in wet years (Figure 4.4).
Figure 4.4. Transparency as compared to lake depth.
The mature crayfish stock is near to the ground but not zero due to the fungal disease. This provides an opportunity for the crayfish population to overcome the disease. Pike controls carp. Mature pike population is about 3.5 times more than that of mature carp. Considering that it is enough for pike to control carp in a lake when its population is twice that of carp, the lake is secure from becoming eutrophic. In addition, since the lake is not turbid, this favours reproduction of pike over that of carp. Figure 4.5 shows the population dynamics of the fish species. Also it is worth to mention that Macrophyte prevalence causes approximately a 30 per cent decrease in fishing effectiveness.
Transparency vs Lake Depth
4.5
2.25
0
1 75 149 223 297 371 408 Time (Month)
Transparency : sustain2015 meters Lake Depth : sustain2015 meters
1982 2016
Graph for actual Chloro a 100
75
50
25
0 1 75 149 223 297 371
Time (Month)
actual ChloroA : sustain2015 microg/liter 1982 2016

Figure 4.5. Population dynamics of mature pike, carp, and crayfish.
Figure 4.6. Macrophyte cover in the lake. The fast decrease in macrophyte prevalence together with the algal bloom and the up and down in carp population just before crayfish collapse deserves closer inspection. Smaller oscillations in macrophyte is caused by oscillations in nutrient concentrations (Figure 4.6) whereas oscillations in chloro a, transparency, and fish are largely because of monthly fluctuations in hydrological cycle and to a smaller extent as a result of oscillations in nutrient concentrations. The larger oscillations are caused by dry-wet years cycle of hydrological dynamics. Neither small nor large oscillations are the result of predator-prey dynamics. Consequently, pike is able to suppress carp throughout the simulation time frame, in spite of a decrease in its population during first few years, preventing the so-feared algal blooms and hence yielding high level of transparency and broad macrophyte cover on the lake bottom.
Graph for Macrophyte 60
50
40
30
20 1 38 75 112 149 186 223 260 297 334 371 408
Time (Month)
macrophyte actual : sustain2015 PVI 1982 2016
Pike Carp Crayfish
150 80
500
75 40
250
0 0 0
1 75 149 223 297 371 Time (Month)
Mature Pike : sustain2015 kg/ha Mature Carp : sustain2015 kg/ha Mature Crayfish : sustain2015 kg/ha
1982 2016

5. SCENARIO AND POLICY ANALYSES Through scenario and policy analyses, a number of modifications on the base model are discussed in order to reach a better understanding of the system and improve it with design recommendations. 5.1. Scenario Analyses 5.1.1. Crayfish population not collapse in 1986 The fast increase in carp population and the high algal bloom just before crayfish population collapse in year 1986 (month 48) together with the fast decline in pike population deserves closer inspection. Therefore a scenario analysis regarding what if crayfish population did not collapse in 1986 is done, to find out what would happen in the lake ecosystem in that case.
Figure 5.1. Chloro a level dynamics in case of no crayfish disease and disease.
The carp becomes the dominant fish species with the decline of pike and the lake loses its clear water state. It becomes eutrophic and turbid, characterised with high algal blooms and sparse or no macrophyte cover (Figure 5.1). In the figure, run names sustain2015noD and sustain2015 are for the cases where the crayfish is diseased and it is not diseased, respectively. The transition takes place in 1990 (month 96). Thus, surprisingly, it can be concluded that the collapse of crayfish is not a purely negative event as it is often thought. 5.1.2. Crayfish recovers in the future Although the fungi still affect the crayfish population it is reported that there is considerable immature crayfish population in the lake. The fungi affect the species by preventing them to change their outer skeleton. As a result, the crayfish is not totally extinct from the lake and this gives the hope that the crayfish may be able to re-colonise the lake sometime in the future. The recovery, if realised, will most probably have major implications on fishing and the lake ecosystem. The time, at which the crayfish will recover, if it ever recovers, is absolutely uncertain. Hence, possible recovery scenarios are analysed with three different recovery times. It is assumed that recovery takes place abruptly rather than being a gradual process.
Graph for actual Chloro a
3,50090
1,75045
00
1 75 149 223 297 371Time (Month)
actual ChloroA : sustain2015noD microg/liter actual ChloroA : sustain2015 microg/liter
1982 2016

First the recovery in the beginning of year 2000 (month 216) scenario is analysed. With the disappearance of the fungi, mature crayfish stock shows a fast increase and seems to reach steady state at approximately 750 kg per hectare around year 2013 (month 372) (Figure 5.2). Accordingly, immature crayfish stock also shows an increase. pike also flourishes, as does crayfish since more crayfish is available in addition to present carp stock as a food source. Final equilibrium values of both species are higher than their initial stock values before the disease. There is a slight decrease in macrophyte cover due to crayfish feeding but transparency is virtually not affected.
Figure 5.2. Dynamics of mature crayfish in case of recovery in 2000 and no recovery in time frame of the study.
The result explained above is totally different than the result presented in the previous section although there are abundant crayfish populations in the lake in both cases. The reason for this distinction is the pike to carp ratio. If it is less than or equal to three as was the case before the year 1986 (month 48), the presence (or recovery) of crayfish favours carp population. If the ratio is four or more, as was the case after the year 1986, the presence (or recovery) of crayfish favours pike population.
Figure 5.3. Fishing workforce in case of recovery in 2000 and no recovery in timeframe of the study.
Graph for Mature Crayfish800 kg/ha800 kg/ha
400 kg/ha400 kg/ha
0 kg/ha0 kg/ha
1 75 149 223 297 371Time (Month)
Mature Crayfish : sustain2015-p8a kg/haMature Crayfish : sustain2015-p4 kg/ha
1982 2016
Graph for Workforce Fishing600 person600 person
300 person300 person
0 person0 person
1 75 149 223 297 371Time (Month)
Workforce Fishing : sustain2015-p8a personWorkforce Fishing : sustain2015-p4 person
1982 2016

With the increase in crayfish and pike, the fishing workforce reaches almost 600 people toward year 2015 (month 396) (Figure 5.3). The increase in fishing workforce has a positive impact on social structure. The number of unemployed decreases substantially. Scenarios in which recovery takes place in the beginning of year 2005 and 2010 generate similar results. In Figures 5.2-5.3, run names sustain2015-p8a and sustain2015-p4 are for the cases where the recovery takes place in year 2000 and no recovery ever takes place, respectively. Finally, it is concluded that the overall effects of the recovery on the lake ecosystem, trophic and social structure are positive. The runs are done not on the base model but on a modified version in which the planned DSI projects are assumed to be operational in the beginning of year 2000 (month 216). 5.2. Policy Analyses Policy runs are done based on those proposed both in reports on the lake and in literature, regarding hydrological regulations on the lake, agriculture sub-sector, and fishing. The overall results are used to form design recommendations for the management of the lake region. All policies are introduced to the model in the beginning of year 2000 (month 216) and time horizon is taken to be 15 years (i.e. until the beginning of year 2016). 5.2.1. Policy options related to hydrological dynamics of the lake The dramatic decrease in the lake water level during dry years causes several problems regarding irrigation, macrophyte cover, and fishing. Since the water level is diminished, it becomes hard to take water out for irrigation. The macrophyte cover tends to increase in dry years due to increased light penetration to the lake bottom. Combined effect of increased macrophyte cover and low water level is decreased navigation ability for fishing boats. The differences in average water levels between wet and dry years are caused by the fluctuations in main inflow source, i.e. M.Kemalpasa river. To control these fluctuations, DSI began construction of a dam on the main inflow source. When completed, the dam will reduce the fluctuations between dry and wet years to a great extent. In addition, the regulated flow will contain virtually no suspended solids. In conjunction with the dam, it is planned to construct a new regulator to the outflow of the lake. While the dam regulates the fluctuations of the inflow between dry and wet years, the regulator will serve for a similar purpose to regulate the monthly fluctuations in the lake. In addition to these, an extension for Uluabat irrigation is in construction phase. When the extension is completed, 10,828 hectares of cultivated lands will be irrigated in addition to the currently irrigated lands. The policies are brought in to the model one by one. The resulting hydrology sub-sector when all three policies are introduced is provided in Figure 5.4. The time lag required for the dam to stock water is ignored. Also the fact that regulated flow enters the lake from a different point is not represented in the model. Integrated analysis with Geographic Information Systems (GIS) is needed to analyse this last factor. The effect of dam on the lake is as expected. The average lake water level in dry years is increased and has a value close to that of wet years. However, new monthly fluctuations occurring during dry years are larger than in the base run. This is also the case for wet years to a slight extent. The sedimentation rate slows down considerably. The macrophyte cover is about 45 per cent throughout both dry and wet years although it was more than 55 per cent in

dry years (Figure 5.5). However, this is not compensated by an increase in chloro a level as could be expected at first, since the effect of dam on carp is negative, furnishing conditions for zooplankton growth. The overall increase in transparency as a result of decrease in suspended solid concentration is the reason for the carp’s decline. In Figure 5.5, run names sustain2015-p1 and sustain2015 are for the cases where the dam is operational and no dam construction ever takes place (i.e. base run), respectively. The effect of dam on irrigation from the lake is also positive. The mean value of irrigation from the lake increased from 1,193 million to 1,231 million litres per month.
Figure 5.4. Hydrology sub-sector when all three policies are implemented.
Figure 5.5. Macrophyte cover in the lake with and without dam.
Lake
Net Inflow River
Inflow Outflow
AreaKot
Evaporation
MKP River Wet Year lpMKP River Dry Year lp
MKP River
Lake Foot
Backflow Wet Y lp
Backflow
RainfallBackflow Dry Y lp
Irrigation from MKPrationfromMKP
Settled Suspended Solid
Lake Volume lost to SS
SedimentVolume
Lake Volume to Sediment
Settled SS Fraction
Suspended Solid in MKP
Irrigation from Lake
Volume lost to Sediment
lake foot wet lp
lake foot dry lp
Lake DepthResuspension
effect of carp on resuspension
effect of wind on resuspension
ResuspensionAmount
effect of macrophyte on resuspension
MKP River Wet Year Regulated lp
MKP River Dry Year Regulated lp
Flow from Dam
Proposed Kot Level
Proposed Volume Volume lp
Proposed Kot Levels lp
Volume Deficit
Graph for macrophyte actual56
52.25
48.5
44.75
41205 234 263 292 321 350 379 408
Time (Month)
macrophyte actual : sustain2015-p1 PVImacrophyte actual : sustain2015 PVI
1999 2016

Secondly, the activation of the new regulator on the outflow of the lake is analysed. The monthly-regulated lake water levels are proposed by Altinayar (1998) so as to resemble to the monthly lake water levels in wet years (Table 5.1). These proposed levels are to be attained by controlling the major outflow via the new regulator. The results are similar to those of the dam for macrophyte cover. Since suspended solid concentration is not affected as much, light conditions are only slightly improved as a result of the effect of outflow regulation on chloro a flush out. This policy has the greatest effect on carp amongst the three policies analysed in this section (Figure 5.6). There is not much change in sedimentation rate from the base run and the lake water level is close to the one in the presence of the dam case. In Figure 5.6, run names sustain2015-p3 and sustain2015 are for the cases where the regulation is realised and no regulation ever takes place (i.e. base run), respectively.
Table 5.1. Proposed monthly regulated lake water levels (Altinayar, 1998).
Month 1 2 3 4 5 6 7 8 9 10 11 12 Elevation (m) 5 5.5 5.5 5.5 5 4.5 3.8 3.3 3.1 2.7 2.9 3.3
The analysis of the last component, the irrigation extension proves that the lake has a huge irrigation potential. New irrigated lands subject to irrigation extension project are outside the region. Therefore, the activation of the extension project affects only the water level though not substantially. When all three policies are implemented in the model simultaneously, it is observed that the dam has the biggest effect amongst others (Figure 5.7). The major effect of the policies is on lake water conditions and lake ecosystem. Their effect on the social sector is minor. However, it should be noted that flood plain mechanism, which plays an essential role in fish spawning, is not included in the model. The dam would affect both the lake ecology and social structure negatively leading to reduction in the natural flood plain area of the lake with an expected decrease in the fish recruitment. In Figure 5.7, run names sustain2015-p4 and sustain2015 are for the cases where all corresponding policies are implemented and no implementation ever takes place, respectively.
Figure 5.6. Behaviour of mature carp in case of water level regulation and no regulation.
Graph for Mature Carp53
39.75
26.5
13.25
0205 234 263 292 321 350 379 408
Time (Month)
Mature Carp : sustain2015-p3 kg/haMature Carp : sustain2015 kg/ha
1999 2016
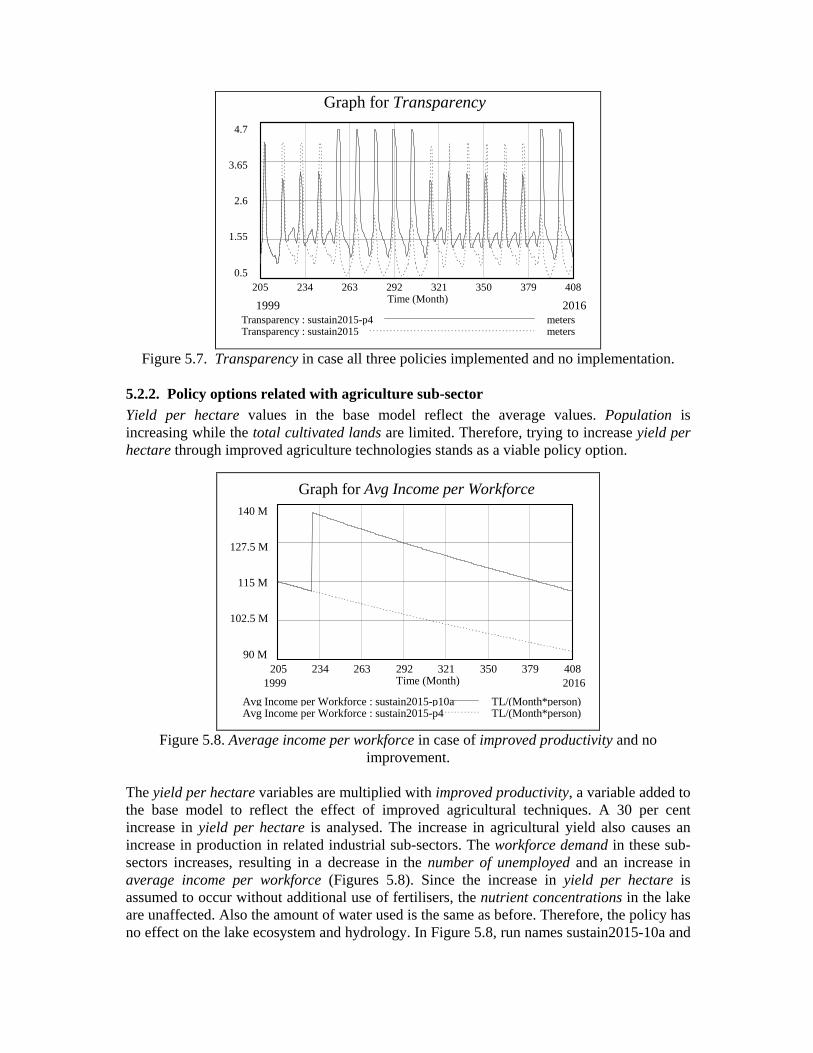
Figure 5.7. Transparency in case all three policies implemented and no implementation. 5.2.2. Policy options related with agriculture sub-sector Yield per hectare values in the base model reflect the average values. Population is increasing while the total cultivated lands are limited. Therefore, trying to increase yield per hectare through improved agriculture technologies stands as a viable policy option.
Figure 5.8. Average income per workforce in case of improved productivity and no improvement.
The yield per hectare variables are multiplied with improved productivity, a variable added to the base model to reflect the effect of improved agricultural techniques. A 30 per cent increase in yield per hectare is analysed. The increase in agricultural yield also causes an increase in production in related industrial sub-sectors. The workforce demand in these sub-sectors increases, resulting in a decrease in the number of unemployed and an increase in average income per workforce (Figures 5.8). Since the increase in yield per hectare is assumed to occur without additional use of fertilisers, the nutrient concentrations in the lake are unaffected. Also the amount of water used is the same as before. Therefore, the policy has no effect on the lake ecosystem and hydrology. In Figure 5.8, run names sustain2015-10a and
Graph for Transparency
4.7
3.65
2.6
1.55
0.5205 234 263 292 321 350 379 408
Time (Month)
Transparency : sustain2015-p4 metersTransparency : sustain2015 meters
1999 2016
Graph for Avg Income per Workforce140 M
127.5 M
115 M
102.5 M
90 M205 234 263 292 321 350 379 408
Time (Month)
Avg Income per Workforce : sustain2015-p10a TL/(Month*person)Avg Income per Workforce : sustain2015-p4 TL/(Month*person)
1999 2016
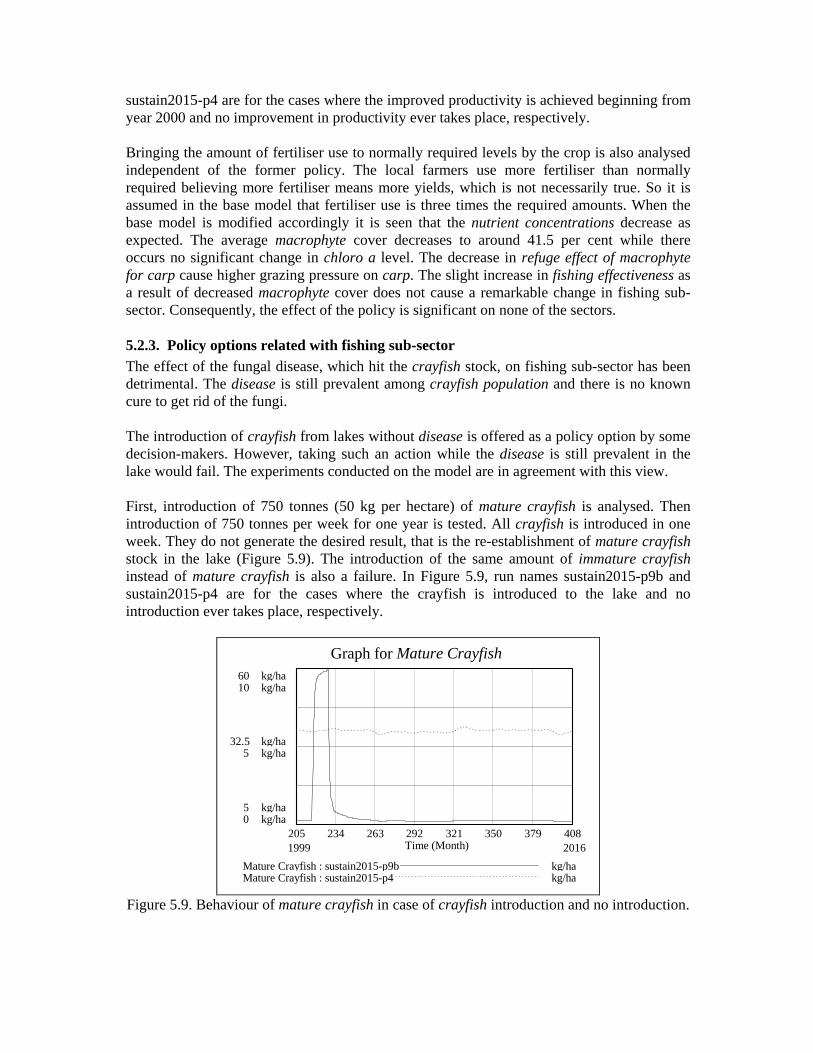
sustain2015-p4 are for the cases where the improved productivity is achieved beginning from year 2000 and no improvement in productivity ever takes place, respectively. Bringing the amount of fertiliser use to normally required levels by the crop is also analysed independent of the former policy. The local farmers use more fertiliser than normally required believing more fertiliser means more yields, which is not necessarily true. So it is assumed in the base model that fertiliser use is three times the required amounts. When the base model is modified accordingly it is seen that the nutrient concentrations decrease as expected. The average macrophyte cover decreases to around 41.5 per cent while there occurs no significant change in chloro a level. The decrease in refuge effect of macrophyte for carp cause higher grazing pressure on carp. The slight increase in fishing effectiveness as a result of decreased macrophyte cover does not cause a remarkable change in fishing sub-sector. Consequently, the effect of the policy is significant on none of the sectors. 5.2.3. Policy options related with fishing sub-sector The effect of the fungal disease, which hit the crayfish stock, on fishing sub-sector has been detrimental. The disease is still prevalent among crayfish population and there is no known cure to get rid of the fungi. The introduction of crayfish from lakes without disease is offered as a policy option by some decision-makers. However, taking such an action while the disease is still prevalent in the lake would fail. The experiments conducted on the model are in agreement with this view. First, introduction of 750 tonnes (50 kg per hectare) of mature crayfish is analysed. Then introduction of 750 tonnes per week for one year is tested. All crayfish is introduced in one week. They do not generate the desired result, that is the re-establishment of mature crayfish stock in the lake (Figure 5.9). The introduction of the same amount of immature crayfish instead of mature crayfish is also a failure. In Figure 5.9, run names sustain2015-p9b and sustain2015-p4 are for the cases where the crayfish is introduced to the lake and no introduction ever takes place, respectively.
Figure 5.9. Behaviour of mature crayfish in case of crayfish introduction and no introduction.
Graph for Mature Crayfish60 kg/ha10 kg/ha
32.5 kg/ha5 kg/ha
5 kg/ha0 kg/ha
205 234 263 292 321 350 379 408Time (Month)
Mature Crayfish : sustain2015-p9b kg/haMature Crayfish : sustain2015-p4 kg/ha
1999 2016

In the light of these analyses, it is concluded that it is best to help the lake ecosystem to recover from the disease by its internal dynamics, instead of anthropogenic interventions, especially when the cost of such interventions is taken into account.
5.2.4. Macrophyte clearance from the lake bottom Macrophyte clearance is a long debated policy option in order to control eutrophication in management of shallow lakes. There are also experiences related to the harvest of macrophyte from the lake bottom. Practices in shallow freshwater lakes have resulted in undesirable outcomes. First of all, clearance of macrophyte is a burdensome process. It requires special equipment developed for this purpose. Even with the equipment, the efficiency is low. The reason is that macrophyte is able to spread fast, especially if the conditions favour macrophyte presence. Second and more importantly, even if the clearance is succeeded, the result is typically a switch to eutrophic state with turbid waters and algal blooms. This also proves that macrophyte presence acts, in fact, as a buffer in front of eutrophication (Schriver et al., 1995). In spite of the facts delineated above, this policy is still being proposed by some decision-makers to control eutrophication in shallow lakes of Turkey. Therefore, to demonstrate the extent of its infeasibility, the policy is tested in the model. In the first case, half of macrophyte cover is harvested per month from the beginning of year 2000 (month 216). This resulted in a decrease in macrophyte cover but the decrease is far from being satisfactory. Macrophyte cover drops to just below 40 per cent whereas chloro a concentration is unaffected. The policy does not cause major changes in other parts of the model. Then, a much more ambitious course of action is adopted: To harvest all macrophyte in the lake bottom every week from the beginning of year 2000 to the beginning of year 2008. This resulted in a dramatic decrease in macrophyte (down to 15 per cent). A short period of time after the deactivation of the policy, all macrophyte is lost from the lake bottom. The macrophyte is cleared, however, just to open way for the dominance of algae (i.e. algal blooms), high turbidity, the loss of pike and the establishment of a stable carp population (Figure 5.10-5.11): Characteristic of an eutrophic lake dominated by phytoplankton! The fishing workforce increases since productivity of the lake is increased resulting in an increase in the total biomass. However, one should keep in mind that carp does not have a high economical value: a fact not represented in the model. In reality the effort required to clear all macrophyte cover may be lower. However, it is evident that the eventual outcome will be the same.
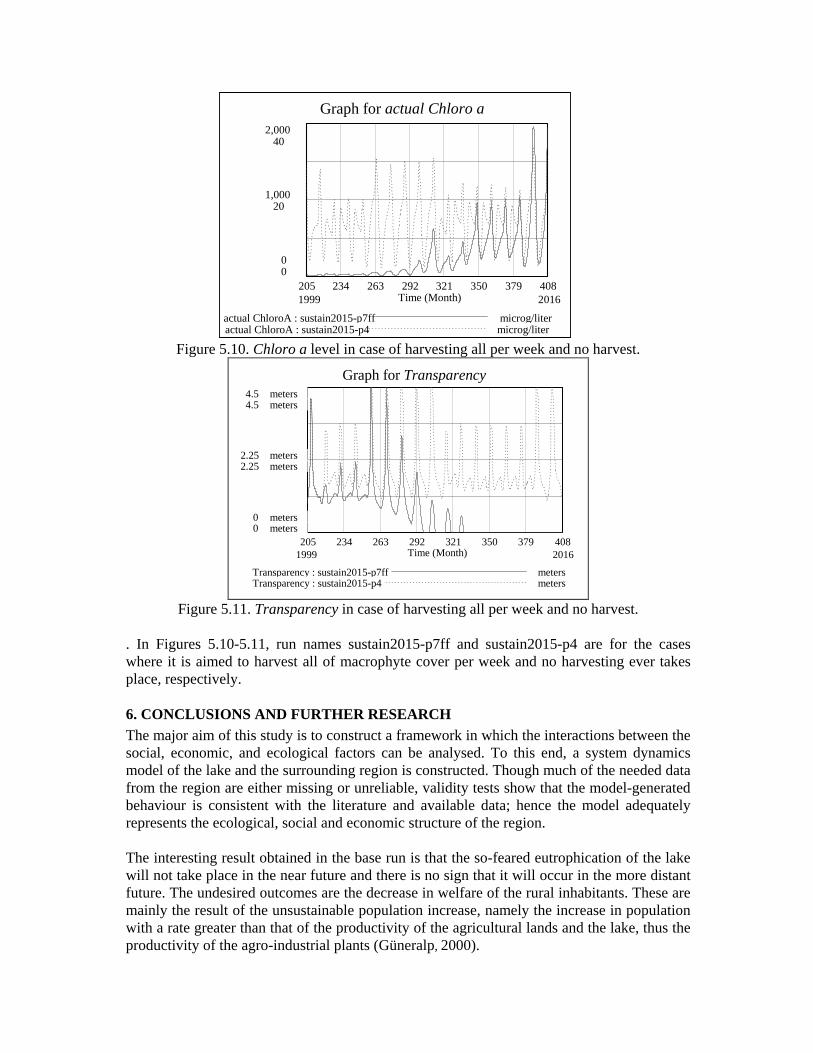
Figure 5.10. Chloro a level in case of harvesting all per week and no harvest.
Figure 5.11. Transparency in case of harvesting all per week and no harvest.
. In Figures 5.10-5.11, run names sustain2015-p7ff and sustain2015-p4 are for the cases where it is aimed to harvest all of macrophyte cover per week and no harvesting ever takes place, respectively.
6. CONCLUSIONS AND FURTHER RESEARCH The major aim of this study is to construct a framework in which the interactions between the social, economic, and ecological factors can be analysed. To this end, a system dynamics model of the lake and the surrounding region is constructed. Though much of the needed data from the region are either missing or unreliable, validity tests show that the model-generated behaviour is consistent with the literature and available data; hence the model adequately represents the ecological, social and economic structure of the region. The interesting result obtained in the base run is that the so-feared eutrophication of the lake will not take place in the near future and there is no sign that it will occur in the more distant future. The undesired outcomes are the decrease in welfare of the rural inhabitants. These are mainly the result of the unsustainable population increase, namely the increase in population with a rate greater than that of the productivity of the agricultural lands and the lake, thus the productivity of the agro-industrial plants (Güneralp, 2000).
Graph for actual Chloro a2,000
40
1,00020
00
205 234 263 292 321 350 379 408Time (Month)
actual ChloroA : sustain2015-p7ff microg/literactual ChloroA : sustain2015-p4 microg/liter
1999 2016
Graph for Transparency4.5 meters4.5 meters
2.25 meters2.25 meters
0 meters0 meters
205 234 263 292 321 350 379 408Time (Month)
Transparency : sustain2015-p7ff metersTransparency : sustain2015-p4 meters
1999 2016

Two scenario analysis runs are conducted. The first one deals with the behaviour of the system if crayfish population did not collapse due to a fungus disease in 1986. The result is that the lake becomes turbid and eutrophic with dominance of carp and seasonal algal dominance. The second scenario analyses the results that would emerge, if crayfish recovers from the disease in the beginnings of years 2000, 2005, or 2010, i.e. at months 216, 276, or 336 . Fishing becomes a major income source once again, improving social conditions. Pike increases, suppressing carp further. Transparency of the lake is almost not affected. The projects, planned and being currently constructed by DSI are introduced into the model. It is observed that they have no significant effect on the lake ecosystem, except the decrease in macrophyte cover. There is no major betterment in economic and social conditions. The introduction of healthy crayfish is suggested in some platforms to overcome the disease. However, application of this policy in the model proved to be ineffective. Mature crayfish population is still barely existent since the disease still prevails. Fearing eutrophication of the lake, clearance of macrophyte is proposed by some policy makers. Simulation runs show that the application of clearance for a short period of time is not enough, since macrophyte is able to re-colonise with a fast rate. On the other hand, application for a long period of time (seven years) in the model does result in clearance of macrophyte, yet such removal intensity is practically near impossible. Moreover, this results in eutrophication of the lake with dominance of phytoplankton, and turbid waters: a counter result. These results are in agreement with the hypotheses found in the literature. None of the above-mentioned policy options results in the betterment of social conditions. On the other hand, the use of improved agricultural techniques, another policy tested in the model, does provide better social conditions, with no adverse effects on the lake ecosystem, and hydrology. The model is expected to provide a laboratory, where different sustainable management strategies regarding shallow freshwater lakes in particular and wetlands in general can be tested. The research results are hoped to make some contribution to the general theory/literature of sustainable management. These results will be shared with Ramsar Convention Bureau, DHKD, TKV and other interested institutions. The model itself will also be made available to these institutions. Further research may concentrate on improved representations of social and economy sectors. Collecting field data in order to improve the estimates of certain model parameters and integrated analysis with Geographic Information Systems (GIS) would also be useful further research. The lake ecosystem sector may also be enhanced, as more information on shallow lake ecology becomes available. The inclusion of processes such as nitrogen fixation mechanism by organisms, dissolved oxygen level, inbreeding in case of low population densities would improve the model. Further elaboration of the model performance under random effects also stands as a challenge for future study (Güneralp, 2000). References -. 1996. GAP Bölgesinde Sulu Kosullarda Bitkilerin Yetistirme Teknikleri. T.C. Basbakanlik Köy Hizmetleri Genel Müdürlügü: Ankara.

-. 1994. Türkiye'deki Içsular ve Balik Çiftlikleri Incelemesi. 6: 91-110. -. 1997. Tarimsal Yapi-1995 (Üretim, Fiyat, Deger). T.C. Basbakanlik Devlet Istatistik Enstitüsü: Ankara. -. 1998. Uluabat Gölü'ne Yakin Köylerin Ekonomik, Sosyal ve Kültürel Yapi Ön Arastirma Raporu. Development Foundation of Turkey-TKV: Ankara. -. 1998. Uluabat Gölü. T.C. Çevre Bakanligi: Ankara. Altinayar, G. 1998. Uluabat Göü Su Bitkileri Sorunlari, Nedenleri ve Çözüm Yöntemleri Üzerinde Çalismalar. Devlet Su Isleri (State Hydraulic Works)-DSI: Ankara. Barbier, E.B., Acreman M., and Knowler, D. 1997. Economic Valuation of Wetlands: A Guide for Policy Makers and Planners. Ramsar Convention Bureau: Switzerland. Barlas, Y. 1996. Formal aspects of model validity and validation in system dynamics. System Dynamics Review. 3: 183-210. Demir, A.O., Aksoy, E., and Torunoglu, T. 1998. Uluabat Gölü'nün Çevresel Sorunlari ve Çözüm Önerileri, Devlet Su Isleri (State Hydraulic Works)-DSI: Bursa. Güneralp, B. 2000. Modelling A Wetland For Sustainable Development: Uluabat Lake. MS Thesis. Bogaziçi University: Istanbul. Hardi, P., and Zdan, T. 1998. Assessing Sustainable Development-Principles in Practice. International Institute for Sustainable Development: Quebec. Inan, M., Bektas, R., and Ergün, B. 1997. Uluabat Gölü Çevre Durum Raporu. Ministry of Environment, Bursa Provincial Principality of Environment: Bursa. J�rgensen, S.E. 1994. Fundamentals of Ecological Modelling. Elsevier: New York.
Madran, N. 1991. Yeni Tarim Klavuzu: Teknik Ziraatin El Kitabi. Hacettepe-Tas Yayinlari: Ankara. Ergüler, M. 1994. Cropping Techniques Guidelines for Field Crops and Vegetables. GAP Bölge Kalkinma Idaresi Baskanligi: Ankara.
May, R.M. 1977. Thresholds and breakpoints in ecosystems with a multiplicity of stable states. Nature. 269: 471-477. Saeed, K., and Radzicki, M. 1998. Foreword. System Dynamics Review. 2-3: 105-106.
Scheffer, M. 1990. Multiplicity of stable states in freshwater systems. Hydrobiologia 200/201: 475-786. Scheffer, M., Hosper, S.H., Meijen, M-L., Moss, B., and Jeppesen, E. 1993. Alternative equilibria in shallow lakes. Trends in Ecology and Evolution. 8(8): 275-279.

Schriver, P., B�genstrand, J., Jeppesen, E., and S�ndergaard, M. 1995. Impact of submerged macrophytes on fish-zooplankton-phytoplankton interactions: Large-scale enclosure experiments in a shalow eutrophic lake. Freshwater Biology. 33: 255-270. Yarar, M., and Magnin, G. 1997. Türkiye'nin Önemli Kus Alanlari. Society for Protection of Nature-DHKD: Istanbul.