
Terminal Lake Flooding and Wetland Expansion in Nelson County, North Dakota
18
68 Physical Geography, 2004, 25, 1, pp. 68–85. Copyright © 2004 by V. H. Winston & Son, Inc. All rights reserved. TERMINAL LAKE FLOODING AND WETLAND EXPANSION IN NELSON COUNTY, NORTH DAKOTA Paul E. Todhunter and Bradley C. Rundquist Department of Geography University of North Dakota Grand Forks, North Dakota 58202-9020 Abstract: The Devils Lake Basin of North Dakota, an interior drainage basin located within a dry, subhumid environment, has experienced pervasive flood conditions since the 1993 onset of a wet spell of unprecedented magnitude and duration. This unique natural- hazard environment has resulted in flooding from both the expansion of the surface area of the basin’s terminal lakes (Devils Lake and Stump Lake) and increases in the number and size of rural wetlands. To assess the relative extent of both terminal lake and rural wetland flooding, we focused on Nelson County, which contains Stump Lake and is rep- resentative of other counties in the basin. Remotely sensed data acquired by Landsat The- matic Mapper was used to map open-water extent in 2001, and results were compared to 1992 land-cover data provided by the United States Geological Survey (USGS). Our anal- ysis indicates a 53% increase in the size of Stump Lake and a 426% increase in the area of rural wetland ponds. Stump Lake flooding is spatially restricted and has had limited impact upon the surrounding lakeshore environment. Rural wetland flooding is pervasive and has a deleterious effect upon the region’s agricultural economic base. [Key words: flooding, wetlands, terminal lake, Prairie Pothole Region, North Dakota.] INTRODUCTION Approximately 27% of the land-surface area of Earth is characterized by drainage systems that lack a surface water outlet (de Martonne, 1927). In these closed or inte- rior drainage basins, surface waters drain either to terminal lakes (also called saline or closed lakes) or to local depressions lacking any clearly defined drainage pattern (Williams, 1996). Water volume increases in terminal lakes occur by direct precipi- tation on the lake, surface inflows, and groundwater seepage, while water volume decreases are limited to lake evaporation and minor seepage outflows (Williams, 1996). Because of their unique hydrology terminal lakes are especially sensitive to natural climatic variability, human-induced climatic change, and human modifica- tion of the land-surface hydrology, and their water levels are naturally and inherently unstable, making them one of the most dynamic hydrological systems in the world. One of the most recent terminal lake natural disasters has been at Devils Lake in North Dakota. The Devils Lake Basin is an 8599-km 2 closed basin that drains to Devils Lake (Fig. 1), a shallow perennial terminal lake (Langbein, 1961). Its location within a dry, subhumid environment places it at the humid boundary for closed basins, which are normally found in arid and semi-arid moisture regimes (de Martonne, 1927; Thornthwaite, 1948). Three critical water-surface elevations (WSE) define the hydrologic bounds of Devils Lake. The lower bound at 426.70 m marks the elevation of the bottom of the
-
Upload
independent -
Category
Documents
-
view
2 -
download
0
Transcript of Terminal Lake Flooding and Wetland Expansion in Nelson County, North Dakota

TERMINAL LAKE FLOODING AND WETLAND EXPANSION IN NELSON COUNTY, NORTH DAKOTA
Paul E. Todhunter and Bradley C. RundquistDepartment of GeographyUniversity of North Dakota
Grand Forks, North Dakota 58202-9020
Abstract: The Devils Lake Basin of North Dakota, an interior drainage basin located within a dry, subhumid environment, has experienced pervasive flood conditions since the 1993 onset of a wet spell of unprecedented magnitude and duration. This unique natural-hazard environment has resulted in flooding from both the expansion of the surface area of the basin’s terminal lakes (Devils Lake and Stump Lake) and increases in the number and size of rural wetlands. To assess the relative extent of both terminal lake and rural wetland flooding, we focused on Nelson County, which contains Stump Lake and is rep-resentative of other counties in the basin. Remotely sensed data acquired by Landsat The-matic Mapper was used to map open-water extent in 2001, and results were compared to 1992 land-cover data provided by the United States Geological Survey (USGS). Our anal-ysis indicates a 53% increase in the size of Stump Lake and a 426% increase in the area of rural wetland ponds. Stump Lake flooding is spatially restricted and has had limited impact upon the surrounding lakeshore environment. Rural wetland flooding is pervasive and has a deleterious effect upon the region’s agricultural economic base. [Key words: flooding, wetlands, terminal lake, Prairie Pothole Region, North Dakota.]
INTRODUCTION
Approximately 27% of the land-surface area of Earth is characterized by drainage systems that lack a surface water outlet (de Martonne, 1927). In these closed or inte-rior drainage basins, surface waters drain either to terminal lakes (also called saline or closed lakes) or to local depressions lacking any clearly defined drainage pattern (Williams, 1996). Water volume increases in terminal lakes occur by direct precipi-tation on the lake, surface inflows, and groundwater seepage, while water volume decreases are limited to lake evaporation and minor seepage outflows (Williams, 1996). Because of their unique hydrology terminal lakes are especially sensitive to natural climatic variability, human-induced climatic change, and human modifica-tion of the land-surface hydrology, and their water levels are naturally and inherently unstable, making them one of the most dynamic hydrological systems in the world.
One of the most recent terminal lake natural disasters has been at Devils Lake in North Dakota. The Devils Lake Basin is an 8599-km2 closed basin that drains to Devils Lake (Fig. 1), a shallow perennial terminal lake (Langbein, 1961). Its location within a dry, subhumid environment places it at the humid boundary for closed basins, which are normally found in arid and semi-arid moisture regimes (de Martonne, 1927; Thornthwaite, 1948).
Three critical water-surface elevations (WSE) define the hydrologic bounds of Devils Lake. The lower bound at 426.70 m marks the elevation of the bottom of the
68
Physical Geography, 2004, 25, 1, pp. 68–85.Copyright © 2004 by V. H. Winston & Son, Inc. All rights reserved.
NORTH DAKOTA WETLANDS 69
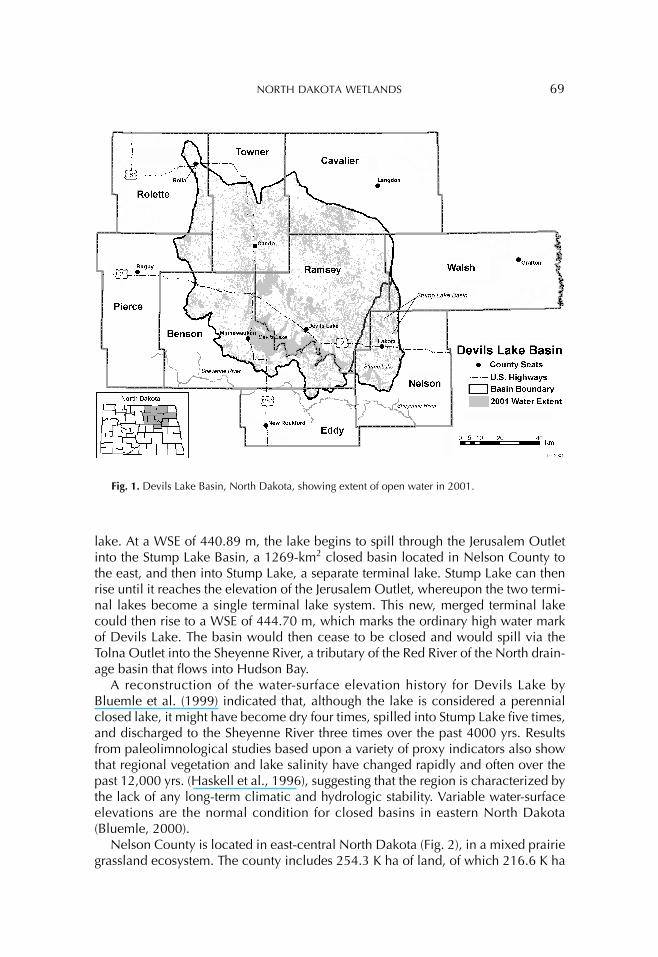
lake. At a WSE of 440.89 m, the lake begins to spill through the Jerusalem Outlet into the Stump Lake Basin, a 1269-km2 closed basin located in Nelson County to the east, and then into Stump Lake, a separate terminal lake. Stump Lake can then rise until it reaches the elevation of the Jerusalem Outlet, whereupon the two termi-nal lakes become a single terminal lake system. This new, merged terminal lake could then rise to a WSE of 444.70 m, which marks the ordinary high water mark of Devils Lake. The basin would then cease to be closed and would spill via the Tolna Outlet into the Sheyenne River, a tributary of the Red River of the North drain-age basin that flows into Hudson Bay.
A reconstruction of the water-surface elevation history for Devils Lake by Bluemle et al. (1999) indicated that, although the lake is considered a perennial closed lake, it might have become dry four times, spilled into Stump Lake five times, and discharged to the Sheyenne River three times over the past 4000 yrs. Results from paleolimnological studies based upon a variety of proxy indicators also show that regional vegetation and lake salinity have changed rapidly and often over the past 12,000 yrs. (Haskell et al., 1996), suggesting that the region is characterized by the lack of any long-term climatic and hydrologic stability. Variable water-surface elevations are the normal condition for closed basins in eastern North Dakota (Bluemle, 2000).
Nelson County is located in east-central North Dakota (Fig. 2), in a mixed prairie grassland ecosystem. The county includes 254.3 K ha of land, of which 216.6 K ha
Fig. 1. Devils Lake Basin, North Dakota, showing extent of open water in 2001.

70 TODHUNTER AND RUNDQUIST
(85%) is in farms and 187.1 K ha (74%) is considered base agricultural land by the Farm Services Agency. Nelson County has been included on 10 presidential disaster declarations over the 9-yr. period from 1993–2001, of which 9 were flood-related (Todhunter and Rundquist, 2003).
The purpose of this paper is to examine the physical dimensions of two co-located but distinct flood hazards—terminal lake flooding and wetland flooding—in the Stump Lake closed subbasin within the prairie landscape in north-central North Dakota. We review the physical basis of each flood threat, and the spatial extent of flooding produced by each flood type. This analysis will establish the mag-nitude of wetland flooding in comparison to terminal lake flooding in the study area. Although terminal lake flooding and desiccation have received considerable global attention in recent decades, wetland flooding remains a poorly understood and unrecognized flood hazard. Results from the smaller Stump Lake subbasin study may provide insight to the relative magnitude of terminal lake and wetland flooding in the larger and more widely publicized Devils Lake Basin.
HYDROCLIMATOLOGY
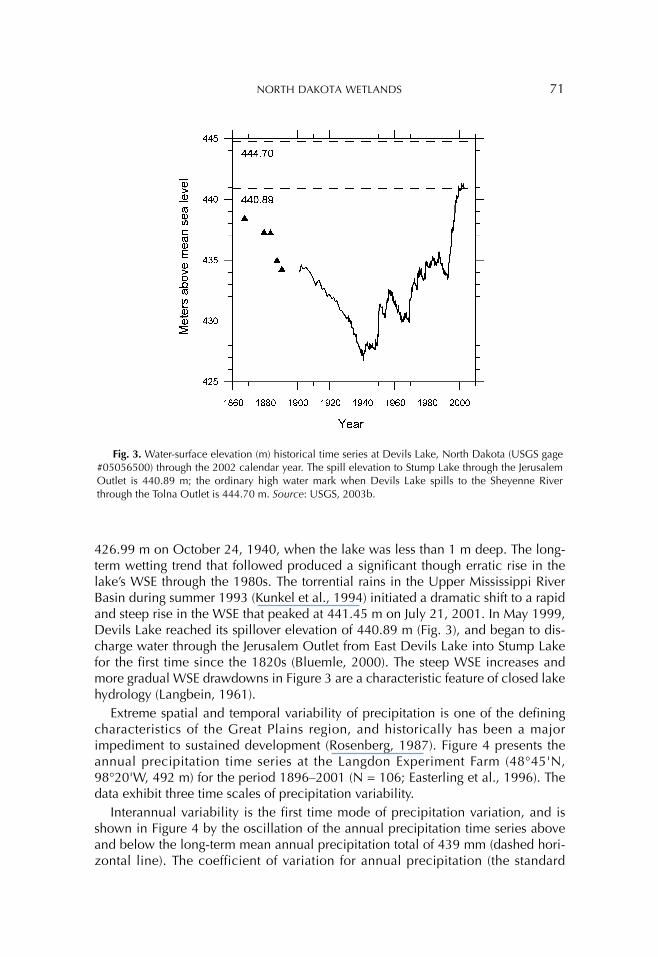
The WSE time series for Devils Lake is given in Figure 3. Lake levels at Devils Lake dropped steadily following European settlement, reaching a minimum of
Fig. 2. Nelson County, North Dakota, showing open water areas in gray.
NORTH DAKOTA WETLANDS 71
426.99 m on October 24, 1940, when the lake was less than 1 m deep. The long-term wetting trend that followed produced a significant though erratic rise in the lake’s WSE through the 1980s. The torrential rains in the Upper Mississippi River Basin during summer 1993 (Kunkel et al., 1994) initiated a dramatic shift to a rapid and steep rise in the WSE that peaked at 441.45 m on July 21, 2001. In May 1999, Devils Lake reached its spillover elevation of 440.89 m (Fig. 3), and began to dis-charge water through the Jerusalem Outlet from East Devils Lake into Stump Lake for the first time since the 1820s (Bluemle, 2000). The steep WSE increases and more gradual WSE drawdowns in Figure 3 are a characteristic feature of closed lake hydrology (Langbein, 1961).
Extreme spatial and temporal variability of precipitation is one of the defining characteristics of the Great Plains region, and historically has been a major impediment to sustained development (Rosenberg, 1987). Figure 4 presents the annual precipitation time series at the Langdon Experiment Farm (48°45'N, 98°20'W, 492 m) for the period 1896–2001 (N = 106; Easterling et al., 1996). The data exhibit three time scales of precipitation variability.
Interannual variability is the first time mode of precipitation variation, and is shown in Figure 4 by the oscillation of the annual precipitation time series above and below the long-term mean annual precipitation total of 439 mm (dashed hori-zontal line). The coefficient of variation for annual precipitation (the standard
Fig. 3. Water-surface elevation (m) historical time series at Devils Lake, North Dakota (USGS gage #05056500) through the 2002 calendar year. The spill elevation to Stump Lake through the Jerusalem Outlet is 440.89 m; the ordinary high water mark when Devils Lake spills to the Sheyenne River through the Tolna Outlet is 444.70 m. Source: USGS, 2003b.

72 TODHUNTER AND RUNDQUIST
deviation of the time series divided by the mean of the time series, expressed as a percentage) is 20.3%, indicating high interannual variability. Hydrologic persis-tence, or the tendency for successive values of a time series to be dependent upon one another, is commonly measured using by the lag-1 autocorrelation (r1). For the time series in Figure 4, r1 = 0.14, which is representative of a geophysical time series with little year-to-year persistence. The Hurst coefficient for the station data is 0.57, which is also indicative of a time series with weak persistence effects (Outcalt et al., 1997). Farmers have adapted to this interannual precipitation variability by developing farm management practices, such as irrigation, crop selection, dry farm-ing, and conservation tillage, which are adaptations to the unreliable precipitation regime (Rosenberg, 1986). Waterfowl have also evolved successful reproduction strategies to this variability (Todhunter, 1995).
The second time mode of precipitation variability, decadal scale variability, occurs when a series of two or more dry or wet years occur in succession of one another, spaced perhaps a decade or two apart. The normal method for identifying this time mode of variability is to filter the geophysical time series (Howarth and Rogers, 1992). A nine-term binomial filter has been applied to the Langdon Exper-iment Farm annual precipitation time series (Fig. 4, heavy curve). A series of dry spells are identified, centered during the 1910s, 1930s, late 1940s, late 1960s, and the late 1980s. These recurrent droughts have been the most important climatic hazard affecting agriculture on the Great Plains and have been the topic of
Fig. 4. Time series of calendar year annual precipitation for Langdon Experiment Farm, North Dakota, 1896–2001. The nine-term binomial filter of the annual time series (dark curve), and the long-term mean annual precipitation (439 mm, dashed line) is shown.

NORTH DAKOTA WETLANDS 73
extensive study (Riebsame, 1986). The series of wet spells have been less well appreciated. Rosenberg’s (1987) brief summary of climatic hazards in the Great Plains failed to even mention wet spells as a significant hazard agent. Minor wet spells are centered on the 1900s, 1920s, 1950s, and early 1980s, while a major wet spell began in the 1990s and is ongoing. The wet spells appear to have been smaller in magnitude and shorter in duration than the dry spells and, since they have nor-mally followed dry spells, they have generally been viewed as desirable events marking the end of a drought episode. The current wet spell appears to be of com-parable magnitude and opposite sign as the worst drought period the Dust Bowl Era of the 1930s, a climatic episode that resulted in considerable environmental and socioeconomic impact to the region (Riebsame, 1986). To appreciate fully the mag-nitude of the current wet spell, a third mode of precipitation variability in the time series needs to be examined.
Outcalt et al. (1997) presented a method of time-series transformation called Hurst rescaling that screens a geophysical time series for regime transitions. Although the annual precipitation time series lacks long-term temporal autocorre-lation, the period-of-record time series often is composed of time series segments that contain statistical properties that are different from the long-term time-series. The method of Hurst rescaling is simple, robust, and possesses several features that make it superior to traditional visual decomposition of a time series (Outcalt et al., 1997).
The transformed time series is constructed by first creating a new time series of the annual deviations of the original time series from the period-of-record mean. This time series of individual deviations is then cumulatively summed to create a rescaled time series. The new rescaled time series is shown in Figure 5. Inflections in the trace of the transformed time series mark the boundary, in time, of these time-series segments. Horizontal traces, such as occurred up to 1927 and from 1940 through 1990, mark time segments whose statistical properties differ little from the longer time series. A descending trace, such as found from 1927 through 1940, marks a time segment with a significantly lower mean than the original time series, while an ascending trace identifies a time segment with larger values than the period-of-record time series. Presumably these inflection points identify changes in the atmospheric circulation mechanisms that control the delivery of moisture to a region (Hirschboeck, 1988), although we did not directly investigate this climato-logical relationship.
The rescaled annual precipitation time series (Fig. 5) shows that the wet spell in the eastern half of North Dakota since 1993 is unprecedented in the historical record. It is comparable in magnitude, intensity, and duration, but opposite in sign to the drought of the 1930s Dust Bowl Era. The review of direct and proxy records for the region by Winter and Rosenberry (1998) suggested that current conditions in eastern North Dakota are the wettest that they have been in the last 130 yrs., and perhaps the last 500 yrs. The Palmer Drought Severity Index (PDSI) for northeast North Dakota in July 1990 was 3.85, and is indicative of extreme drought. In July 2001 the PDSI was 5.26, which is indicative of extremely wet regional conditions (National Climatic Data Center, 2004). The period from 1990 to 2001, therefore, encompasses the extreme range of decadal scale precipitation variability (Winter

74 TODHUNTER AND RUNDQUIST
and Rosenberry, 1998). The current conditions are representative of the extreme moist end of the regional moisture continuum, although moisture levels for meteo-rological, soil, ground water, river, lake, and closed-lake systems are often not in phase with one another (Wilhite and Glantz, 1985).
Some local environmental advocacy groups have claimed that human-induced agricultural land conversion, agricultural drainage, and wetland drainage have been the proximate cause of the lake-level rise. Certainly such land-use changes and hydrologic modifications are extensive throughout eastern North Dakota and were begun as early as the beginning of the 20th century. Brookfield (1999) argued, how-ever, for a more prominent role of natural causes in the explanation of natural disas-ters, and cautions against the erroneous attribution of human causation to modern day natural disasters. If human landscape modification is an important causative fac-tor in the lake level rise we would expect to see a nonlinear relationship between precipitation input and runoff response over the latter half of the 20th century.
Double mass-curve analysis between precipitation input and runoff volume pro-vides a simple but robust technique for examining the consistency of the rainfall-runoff relationships over time (Linsley et al., 1975). No suitable gaging stations of sufficient duration were available within the Devils Lake Basin itself. Instead, cumu-lative mean annual discharge data for the Sheyenne River near Cooperstown, immediately to the south of Devils Lake Basin, was compared to cumulative annual precipitation at Langdon Experiment Farm, just to the northeast of the basin. The results of the analysis for water years 1946–2001 are shown in Figure 6, and show a linear relationship between precipitation input and runoff volume through 1993,
Fig. 5. Rescaled annual precipitation for Langdon Experiment Farm, North Dakota, 1896–2001. The period-of-record (QP) mean annual precipitation is 439 mm. The mean annual precipitation for the four climate phases (Qi, i = 1,4) are also shown.

NORTH DAKOTA WETLANDS 75
followed by an increased runoff response after that date. Because no significant land hydrology changes were initiated in 1993, but that year coincides with the onset of the unprecedented wet spell (Fig. 5), the change in slope in Figure 5 follow-ing 1993 is most likely linked to climate change effects rather than human effects. Regional soil-moisture storage has reached such a high level that the soil’s capacity to serve as a buffer against precipitation input has been reduced, resulting in an increased runoff response as the wet spell has progressed. Water-surface elevation fluctuations at Devils Lake during the past century have been entirely within the range of natural lake-level variability (Bluemle et al., 1999), and are not unprece-dented with respect to the lake water-level history during the past 12,000 yrs. prior to European settlement and subsequent land-cover disturbance. This lends support to the conclusion that the current flooding crisis is more likely due to the underlying natural variability and inherent dynamic instability of the closed basin.
CLOSED-LAKE FLOODING
The post-1990s wet spell has produced two environmental impacts in Nelson County. First, the growth of Stump Lake has resulted in a closed-basin flood hazard. Devils Lake and Stump Lake are part of a series of elongated hill-depressions formed as a result of ice-thrusting 12,000 yrs. ago by the Late Wisconsinan conti-nental ice sheet (Bluemle and Clayton, 1984; Bluemle, 2000).
Fig. 6. Double mass curve analysis of cumulative annual precipitation at Langdon Experiment Farm and cumulative mean annual discharge at the Sheyenne River near Cooperstown (USGS 05057000). Both variables are for the water years 1946–2001.

76 TODHUNTER AND RUNDQUIST
The details of the region’s hydrology for the 2001 calendar year are shown in Fig-ure 7. Devils Lake began to rise from a pre-snowmelt WSE of 440.80 m (Fig. 7C), and reached a peak WSE of 441.45 m on July 22, 2001. At this time the lake area was 46,125 ha, and the lake volume was 296,069 hectare-meters (ha-m). Devils Lake then began a slow decline until freeze-up in late fall. Local snowmelt runoff around Stump Lake initiated a sharp rise at a somewhat earlier date than for Devils Lake due to the shorter surface runoff distances (Fig. 7B). The initial rapid rise in the Stump Lake WSE was followed by a more gradual but steady rise in WSE until it reached a peak WSE of 430.45 m on August 9, 2001. This was a 0.55 m rise for the year, and a 1.35 m increase since spillover from East Devils Lake began in May 1999. The approximate lake area at this time was 2878 ha, with a lake volume of
Fig. 7. Outflow (cms) from Devils Lake to Stump Lake for calendar year 2001 (A); Water surface elevation at Eastern Stump Lake for calendar year 2001 (B); Water surface elevation for Devils Lake for calendar year 2001 (C). Source: USGS, 2003b.

NORTH DAKOTA WETLANDS 77
15,297 ha-m. The continuous rise in the Stump Lake WSE during the fall is the result of surface outflow from Devils Lake via the Jerusalem Outlet into the west end of Stump Lake (Fig. 7A). The rate of outflow into Stump Lake from Devils Lake varied with the hydraulic head, and reached a peak of 1.42 cms on July 30, 2001. Because Stump Lake hydrology is controlled by two sources of surface inflow—local snow-melt runoff from the 1269 km2 Stump Lake Basin and outflow from the 8599 km2
Devils Lake Basin—it does not show a fall decline in WSE, and therefore could rise even more rapidly in the future than has Devils Lake. The continued growth of Stump Lake will be determined by the magnitude of three hydrologic inputs: the direct precipitation onto the lake surface, the surface runoff from the surrounding Stump Lake subbasin, and the spillover of surface runoff from Devils Lake. These three hydrologic inputs exhibit primary temporal variations ranging from the dec-adal to century or even millennial scale, respectively.
When water first began to discharge into Stump Lake during May 1999 the lake level was 429.10 m. The change in the hydrologic and water quality conditions for Stump Lake in mid-summer during the subsequent period is given in Table 1. Over the 3-yr. period the lake has risen 1.74 m, lake area has increased by 8%, lake vol-ume has increased by 44%, and the water has freshened somewhat, although it is still quite saline (Table 1). At the equilibrium elevation with Devils Lake of 440.89 m, Stump Lake would be 5959 ha in area and have a volume of 60,225 ha-m (USGS, 2003a). Stump Lake, therefore, offers 43,264 ha-m of buffer storage to Devils Lake before the merged single lake system would rise in tandem. Since the lake shoreline surrounding Devils Lake is heavily developed, while that around Stump Lake is only sparsely settled, the use of Stump Lake as a buffer to mitigate future flood damage around Devils Lake has been proposed. Because the average lake volume increase for Devils Lake over the period 1993–2001 was 29,885 ha-m, and the single largest increase was 68,750 ha-m in 1997, Stump Lake could miti-gate against one to two years of continued future lake-level rise for Devils Lake. Local parties have proposed stabilizing the Devils Lake level through an engineered emergency outlet, but this suggestion faces stiff regional and international opposi-tion due to environmental and water quality concerns (Leistritz et al., 2002).
Table 1. Hydrologic and Water Quality Data for Eastern Stump Lake near Lakota (USGS #05056665), North Dakota
DateWSE(m)
Lake area(ha)
Lake volume(ha-m)
Totaldissolved solids
(mg 1-1)
Chloride,dissolved(mg l-1)
July 30, 2002 430.84 3,230 16,961 8,850 810
July 17, 2001 430.31 3,157 15,306 9,420 900
August 2, 2000 429.64 3,057 13,222 9,430 920
July 20, 1999 429.17 2,980 11,749 10,800 1,000

78 TODHUNTER AND RUNDQUIST
RURAL WETLAND FLOODING
Nelson County is located within the Drift Prairie physiographic region, and is dotted with innumerable shallow depressions that formed during alternating conti-nental ice sheet advances and retreats during the last Pleistocene glacial stage (Murphy et al., 1997). Glacial till 75 m thick overlies shale bedrock throughout most of the county. The upland areas are dominated by well-drained prairie grass-land, while meadows and marshes are found in the more poorly drained lowlands. Meadows are found in the smaller depressions (<2 ha) and along marsh margins, and are characterized by poor drainage and saturated soils during the spring. Marshes occur in larger depressions (>2 ha) and normally have standing water throughout the summer (Dix and Smeins, 1967). The boundary between upland and lowland environments is difficult to differentiate, as each environment expands and contracts during alternating wet and dry spells. Wetland ponds and wetland vegetation also expand and contract with the wet and dry spells.
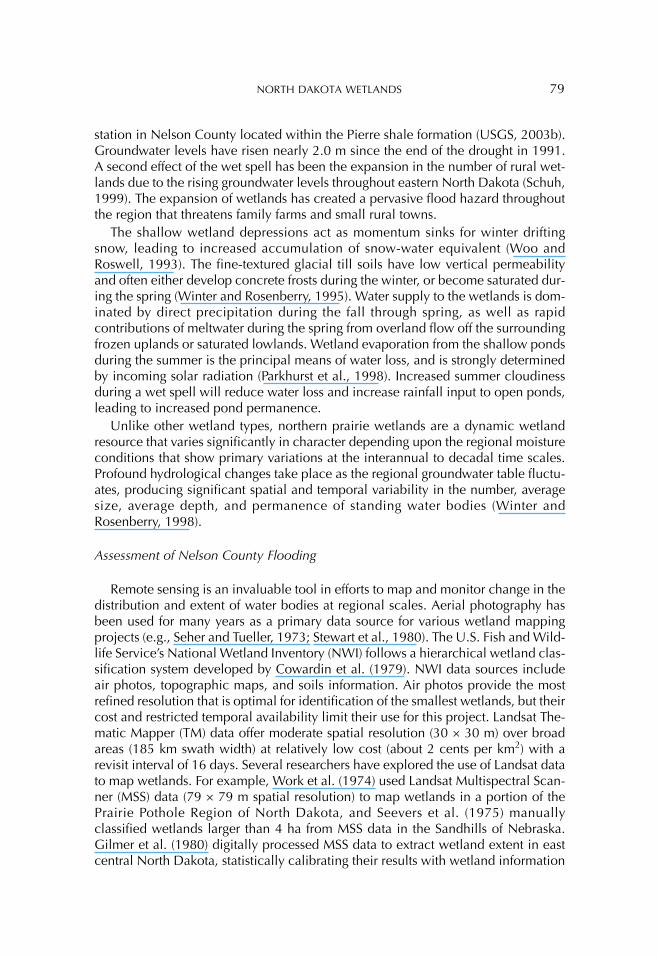
The water-table elevation is an expression of the regional ground-water storage content. In the subdued prairie landscape, decadal-scale positive imbalances in the regional water balance can lead to significant rises in water-table elevation because the fine soils in the region exhibit a larger rise per unit of recharge depth than do coarser soils. Schuh (1999) stated that a 1.0–1.5 m rise in the water table could be expected for each 10 cm of net groundwater recharge. Figure 8 shows the ground-water level time series (in meters below the surface) for a ground-water monitoring
Fig. 8. The ground-water level (meters below the surface) time series for the Nelson County Pierre shale ground-water monitoring station.
NORTH DAKOTA WETLANDS 79
station in Nelson County located within the Pierre shale formation (USGS, 2003b). Groundwater levels have risen nearly 2.0 m since the end of the drought in 1991. A second effect of the wet spell has been the expansion in the number of rural wet-lands due to the rising groundwater levels throughout eastern North Dakota (Schuh, 1999). The expansion of wetlands has created a pervasive flood hazard throughout the region that threatens family farms and small rural towns.
The shallow wetland depressions act as momentum sinks for winter drifting snow, leading to increased accumulation of snow-water equivalent (Woo and Roswell, 1993). The fine-textured glacial till soils have low vertical permeability and often either develop concrete frosts during the winter, or become saturated dur-ing the spring (Winter and Rosenberry, 1995). Water supply to the wetlands is dom-inated by direct precipitation during the fall through spring, as well as rapid contributions of meltwater during the spring from overland flow off the surrounding frozen uplands or saturated lowlands. Wetland evaporation from the shallow ponds during the summer is the principal means of water loss, and is strongly determined by incoming solar radiation (Parkhurst et al., 1998). Increased summer cloudiness during a wet spell will reduce water loss and increase rainfall input to open ponds, leading to increased pond permanence.
Unlike other wetland types, northern prairie wetlands are a dynamic wetland resource that varies significantly in character depending upon the regional moisture conditions that show primary variations at the interannual to decadal time scales. Profound hydrological changes take place as the regional groundwater table fluctu-ates, producing significant spatial and temporal variability in the number, average size, average depth, and permanence of standing water bodies (Winter and Rosenberry, 1998).
Assessment of Nelson County Flooding
Remote sensing is an invaluable tool in efforts to map and monitor change in the distribution and extent of water bodies at regional scales. Aerial photography has been used for many years as a primary data source for various wetland mapping projects (e.g., Seher and Tueller, 1973; Stewart et al., 1980). The U.S. Fish and Wild-life Service’s National Wetland Inventory (NWI) follows a hierarchical wetland clas-sification system developed by Cowardin et al. (1979). NWI data sources include air photos, topographic maps, and soils information. Air photos provide the most refined resolution that is optimal for identification of the smallest wetlands, but their cost and restricted temporal availability limit their use for this project. Landsat The-matic Mapper (TM) data offer moderate spatial resolution (30 × 30 m) over broad areas (185 km swath width) at relatively low cost (about 2 cents per km2) with a revisit interval of 16 days. Several researchers have explored the use of Landsat data to map wetlands. For example, Work et al. (1974) used Landsat Multispectral Scan-ner (MSS) data (79 × 79 m spatial resolution) to map wetlands in a portion of the Prairie Pothole Region of North Dakota, and Seevers et al. (1975) manually classified wetlands larger than 4 ha from MSS data in the Sandhills of Nebraska. Gilmer et al. (1980) digitally processed MSS data to extract wetland extent in east central North Dakota, statistically calibrating their results with wetland information

80 TODHUNTER AND RUNDQUIST
derived from air photos corresponding to randomly sampled subsets of their study area. Turner and Rundquist (1980) used MSS to map wetlands in parts of nine states in the north-central U.S. for the United States Army Corps of Engineers. More recently, Frazier and Page (2000) found that either statistical classification or simple thresholding of TM Band 5 (middle infrared) yielded results comparable to manual digitization of water bodies from aerial photography. A thorough review of wetland-related remote sensing studies is provided by Rundquist et al. (2001).
The baseline land-cover information for this study was the 1992 National Land Cover Characterization data set produced and distributed electronically by USGS (2003c). This data set is derived from image classification of Landsat TM data, and thus provides general land-cover information (up to 21 separate categories). The accuracy of the data set has not yet been assessed by USGS. We acquired the data set for all of North Dakota, and then extracted the area of Nelson County. Water pixels were isolated from the data set.
Using a Landsat TM scene acquired July 9, 2001, pixels representing open water were extracted by performing a density slice on the middle infrared data set (TM Band 5). Density slicing requires the user to both interpret the Band 5 histogram and to examine known water pixels to determine an upper threshold brightness value for water. All pixels with brightness values equal to or less than the selected thresh-old value are classed as water, and all others as non-water, resulting in a binary data set (Work et al., 1974; Work and Gilmer, 1976; Gilmer et al., 1980; Best and Moore, 1981; Lunetta and Barlogh, 1999; Frazier and Page, 2000). A limitation of the density slice approach is that it fails to detect water bodies smaller than the spa-tial resolution of the satellite sensor (30 × 30 m, or 0.09 ha, in the case of TM). In fact, Lunetta and Barlogh (1999) noted problems detecting water bodies as large as 0.81 ha (9 TM pixels). Johnson and Higgins (1997) found that the median wetland area in the eastern Prairie Pothole Region of South Dakota was 0.16 ha, with 83.4% of all wetlands at 0.8 ha or less. These findings suggest that our study underesti-mates open water in Nelson County. The spatial extent of open-water surfaces for 1992 and 2001 is shown in Figure 9.
The 1992 USGS land-cover classification data set was developed at the end of a major regional drought period (Winter and Rosenberry, 1998), while the Landsat TM scene was obtained on July 9, 2001, 13 days before the calendar year peak WSE was reached at Stump Lake. In 1992, Stump Lake comprised 40% of the open water area for the County (1986 ha, Table 2). By July 9, 2001, the lake surface area had increased by 53% (1047 ha). The closed lake flooding associated with Stump Lake
Table 2. Total Open Water Area (ha), 1992 vs. 2001, Nelson County
CategoryUSGS land cover,
1992Landsat TM,July 9, 2001
Change,1992–2001
Change,1992–2001 (%)
Stump Lake 1,986 3,033 1,047 53
Wetland ponds 2,934 15,424 12,490 426
Total open water 4,920 18,457 13,537 275

NORTH DAKOTA WETLANDS 81
accounts for only 8% of the total open water expansion over the period 1992–2001. Currently, Stump Lake accounts for about 16% of the total open water area in Nelson County.
Open water associated with wetlands accounted for 60% of open water in 1992. By July 9, 2001, open water associated with wetlands covered approximately 15,424 ha, for a 426% increase (12,490 ha) over 1992. On July 9, 2001, prairie pot-hole wetlands comprised 84% of the total open water area in Nelson County, and were responsible for 92% of the total open water expansion over the study period.
Total open water in Nelson County has increased from 4920 ha in 1992 to 18,457 ha on July 9, 2001 (Table 2; Fig. 9). This 13,537 ha increase represents nearly a three-fold increase in the total open water area since 1992 (Table 2). The open-water profile in Nelson County changed from one marked by comparable coverage of lake and wetland ponds in 1992 to one in which wetland open water accounted for the vast majority of total open water in 2001.
CONCLUSIONS
Since 1993 Nelson County has experienced two separate chronic flood hazards, which we have reviewed in detail. The hydrological processes that control the Stump Lake terminal lake flood hazard—long-term precipitation trends and inflow from the Devils Lake Basin—operate at a century to millennial time scale. Terminal lake-flooding features a slow rate of onset but, once this flood-event type becomes established, it persists over time. The areal extent of terminal-lake flooding varies directly with flood magnitude (as measured by lake water surface elevation),
Fig. 9. Open water area for 1992 (left) and 2001 (right) for Nelson County, North Dakota.
82 TODHUNTER AND RUNDQUIST
although the flood threat is spatially confined to the immediate lakeshore environ-ment. Although the lake area has increased by 53% over the study period, the cur-rent lake area is only about half of what it would be at the ordinary high water mark. Most likely, a much longer wet spell would be needed to realize the full range of hydrological conditions for this type of hydrological system.
The processes controlling wetland flooding in Nelson County operate at interan-nual to decadal time scales. The rural wetland flood hazard is much more dynamic than the terminal lake flood hazard, and is marked by a faster rate of onset and a shorter duration once established. Rural wetland flooding is spatially more perva-sive and diffuse in extent than terminal lake flooding. Our study period appears to capture nearly the entire range of drought to deluge wetland conditions for the region (Winter and Rosenberry, 1998). Although terminal lake flooding is a better-known hazard, wetland expansion in the Prairie Pothole Region appears to encom-pass a comparable or greater area. The economic impacts of rural wetland flooding are also spatially pervasive and strike at the core of the region’s agricultural eco-nomic base. These conclusions may also be valid for the more publicized flood disaster taking place in the Devils Lake Basin of North Dakota.
Acknowledgments: This research was funded by a Quick Response Research grant from the Natural Hazards Research and Applications Information Center, University of Colorado, Boulder, Colorado.
REFERENCES
Best, R. and Moore, D. (1981) Landsat interpretation of prairie lakes and wetlands of eastern South Dakota. In M. Deutsch, D. Wiesnet, and A. Rango, eds., Satellite Hydrology. Minneapolis, MN: American Water Resources Association, 499–506.
Bluemle, J. P. (2000) The Origin and Behavior of Devils Lake. Available from the North Dakota Geological Survey Web site http:www.state.nd.us/Devils_Lake/Origin_Devils_Lake.htm
Bluemle, J. P. and Clayton, L. (1984) Large-scale glacial thrusting and related pro-cesses in North Dakota. Boreas, Vol. 13, 279–299.
Bluemle, J. P., Sabel, J. M., and Karlén, W. (1999) Rate and magnitude of past global climate changes. Environmental Geosciences, Vol. 6, 63–75.
Brookfield, H. (1999) Environmental damage: Distinguishing human from geophys-ical causes. Environmental Hazards, Vol. 1, 3–11.
Cowardin, L., Carter, V., Golet, F., and LaRoe, E. (1979) Classification of Wetlands and Deepwater Habitats of the United States. Washington, DC: U.S. Department of the Interior, Fish and Wildlife Service.
de Martonne, E. (1927) Regions of interior-basin drainage. Geographical Review, Vol. 17, 397–414.
Dix, R. L. and Smeins, F. E. (1967) The prairie, meadow, and marsh vegetation of Nelson County, North Dakota. Canadian Journal of Botany, Vol. 45, 21–58.
Easterling, D. R., Karl, T. R., Mason, E. H., Hughes, P. Y., and Bowman, D. P. (1996) National Climatic Data Center: 1995, United States Historical Climatology Net-work Monthly Temperature and Precipitation Data, ORNL/CDIAC-87,

NORTH DAKOTA WETLANDS 83
NDP-019/R3, Carbon Dioxide Information Analysis Center, Oak Ridge National Laboratory, Oak Ridge, Tennessee. Available from the Climatic Data Center Web site http://cdiac.esd.ornl.gov/epubs/ndp019/ndp019.html
Frazier, P. and Page, J. (2000) Water body detection and delineation with Landsat TM data. Photogrammetric Engineering and Remote Sensing, Vol. 66, 1461–1468.
Gilmer, D., Work, E., Colwell, J., and Rebel, D. (1980) Enumeration of prairie wet-lands with Landsat and aircraft data. Photogrammetric Engineering and Remote Sensing, Vol. 47, 631–634.
Haskell, B. J., Engstrom, D. R., and Fritz, S. C. (1996) Late Quaternary paleohydrol-ogy in the North American Great Plains inferred from the geochemistry of endogenic carbonate and fossil ostracodes from Devils Lake, North Dakota, USA. Palaeogeography, Palaeoclimatology, Palaeoecology, Vol. 124, 179–193.
Hirschboeck, K. K. (1988) Flood hydroclimatology. In V. R. Baker, R. C. Kochel, and P. C. Patton, eds., Flood Geomorphology. New York, NY: John Wiley & Sons, 27–49.
Howarth, D. A. and Rogers, J. C. (1992) Problems associated with smoothing and filtering of geophysical time-series data. Physical Geography, Vol. 13, 81–99.
Johnson, R. and Higgins, K. (1997) Wetland Resources of Eastern South Dakota. Brookings, SD: South Dakota State University.
Kunkel, K. E., Changnon, S. A., and Angel, J. R. (1994) Climatic aspects of the 1993 Upper Mississippi River Basin flood. Bulletin of the American Meteorological Society, Vol. 75, 811–822.
Langbein, W. B. (1961) Salinity and Hydrology of Closed Lakes. Reston, VA: United States Geological Survey, Professional Paper 412.
Leistritz, F. L., Leitch, J. A., and Bangsund, D. A. (2002) Regional economic impacts of water management alternatives: The case of Devils Lake, North Dakota, USA. Journal of Environmental Management, Vol. 66, 465–473.
Linsley, Jr., R. K., Kohler, M. A., and Paulhus, J. L. P. (1975) Hydrology for Engineers. New York, NY: McGraw-Hill.
Lunetta, R. and Balogh, M. (1999) Application of multi-temporal Landsat 5 TM imagery for wetland identification. Photogrammetric Engineering and Remote Sensing, Vol. 65, 1303–1310.
Murphy, E. C., Fritz, A. M. K., and Fleming, R. F. (1997) The Jerusalem and Tolna Outlets in the Devils Lake Basin, North Dakota. Bismarck, ND: North Dakota Geological Survey, Report of Investigation No. 100.
National Climatic Data Center. (2004) Climvis Home Page. Available from the National Climactic Data Center Web site http://www.ncdc.noaa.gov/oa/climate/onlineprod/drought/xmgr.html
Outcalt, S. I., Hinkel, K. M., Meyer, E., and Brazel, A. J. (1997) Application of Hurst rescaling to geophysical serial data. Geographical Analysis, Vol. 29, 72–87.
Parkhurst, R. S., Winter, T. C., Rosenberry, D. O., and Sturrock, A. M. (1998) Evap-oration from a small, prairie wetland in the Cottonwood Lake Area, North Dakota An energy-budget study. Wetlands, Vol. 18, 272–287.
Riebsame, W. E. (1986) The Dust Bowl: Historical image, psychological anchor, and ecological taboo. Great Plains Quarterly, Vol. 6, 127–136.

84 TODHUNTER AND RUNDQUIST
Rosenberg, N. J. (1986) Adaptations to adversity: Agriculture, climate and the Great Plains of North America. Great Plains Quarterly, Vol. 6, 202–217.
Rosenberg, N. J. (1987) Climate of the Great Plains region of the United States. Great Plains Quarterly, Vol. 7, 22–32.
Rundquist, D., Narumalani, S., and Narayanan, R. (2001) A review of wetlands remote sensing and defining new considerations. Remote Sensing Reviews, Vol. 20, 207–226.
Schuh, W. M. (1999) Climatic effects on groundwater in eastern North Dakota. Pro-ceedings, North Dakota Academy of Science, Vol. 53, 53–57.
Seevers, P., Peterson, R., Mahoney, R., Maroney, D., and Rundquist, D. (1975) An inventory of Nebraska wetlands with the use of imagery from the Earth Resources Technology Satellite. Proceedings, Fourth Annual Remote Sensing of Earth Resources Conference, Vol. 4, 281–292.
Seher, J. and Tueller, P. (1973) Color aerial photos for marshland. Photogrammetric Engineering, Vol. 39, 489–499.
Stewart, W., Carter, V., and Brooks, P. (1980) Inland (non-tidal) wetland mapping. Photogrammetric Engineering and Remote Sensing, Vol. 46, 617–628.
Thornthwaite, C. W. (1948) An approach toward the rational classification of cli-mate. Geographical Review, Vol. 38, 55–94.
Todhunter, P. (1995) Hydroclimatic perspectives on waterfowl production in the North Dakota prairie pothole region. Great Plains Research, Vol. 5, 137–162.
Todhunter, P. and Rundquist, B. C. (2003) Flood Damage Assessment and Survey of Mitigation efforts at Stump Lake, North Dakota: A Study of a Closed-Basin Lake Flood. Quick Response Research Report #164. Boulder, CO: Natural Hazards Research and Applications Information Center, University of Colorado. Available from the University of Colorado at Boulder, Natural Hazards Center Web site http://www.colorado.edu/hazards/qr/qr164/qr164.html
Turner, J. K. and Rundquist, D. C. (1980) Wetlands inventory of the Omaha District. Omaha, NE: United States Army Corps of Engineers, Omaha District.
USGS (United States Geological Survey). (2003a) Devils Lake Elevation, Area, and Capacity Table. Available from the USGS Water Resources of North Dakota Web site http://nd.water.usgs.gov/devilslake/capacity.dat
USGS (United States Geological Survey). (2003b) NWISWeb Data for the Nation. Available from the USGS Water Data Web site http://waterdata.usgs.gov/nwis/
USGS (United States Geological Survey). (2003c) National Land-Cover Character-ization. Available from the USGS Web site http://landcover.usgs.gov/natllandcover.asp
Wilhite, D. A. and Glantz, M. H. (1985) Understanding the drought phenomenon: The role of definitions. Water International, Vol. 10, 111–120.
Williams, W. D. (1996) What future for saline lakes? Environment, Vol. 38, 13–20, 38–39.
Winter, T. C. and Rosenberry, D. O. (1995) The interaction of ground water with prairie pothole wetlands in the Cottonwood Lake area, east-central North Dakota, 1979–1990. Wetlands, Vol. 15, 193–211.
Winter, T. C. and Rosenberry, D. O. (1998) Hydrology of prairie pothole wetlands during drought and deluge: A 17-year study of the Cottonwood Lake wetland

NORTH DAKOTA WETLANDS 85
complex in North Dakota in the perspective of longer term measured and proxy hydrological records. Climatic Change, Vol. 40, 189–209.
Woo, M.-K. and Roswell, R. D. (1993) Hydrology of a prairie slough. Journal of Hydrology, Vol. 146, 175–207.
Work, E., Gilmer, D., and Klett, A. (1974) Utility of ERTS for monitoring the breed-ing habitat of migratory waterfowl. Proceedings, Third Earth Resources Technol-ogy Satellite-1 Symposium, Vol. 1, 10–14.
Work, E. and Gilmer, D. (1976) Utilization of satellite data for inventorying prairie ponds and lakes. Photogrammetric Engineering and Remote Sensing, Vol. 42, 685–694.