Effect of Integrated Nitrogen Management on Soil ... - Thesis
122
Effect of Integrated Nitrogen Management on Soil Properties and Performance of Fenugreek under Typic Ustipsamment Thesis Submitted to the Swami Keshwanand Rajasthan Agricultural University, Bikaner in partial fulfillment of the requirements for the degree of Master of Science In the Faculty of Agriculture (Soil Science and Agricultural Chemistry) by LIKHAMA RAM DHAYAL 2010 Swami Keshwanand Rajasthan Agricultural University, Bikaner S.K.N. College of Agriculture, Jobner
-
Upload
khangminh22 -
Category
Documents
-
view
0 -
download
0
Transcript of Effect of Integrated Nitrogen Management on Soil ... - Thesis
Effect of Integrated Nitrogen Management on Soil Properties and Performance of Fenugreek
under Typic Ustipsamment
Thesis
Submitted to the
Swami Keshwanand Rajasthan Agricultural
University, Bikaner
in partial fulfillment of the requirements for
the degree of
Master of Science
In the
Faculty of Agriculture
(Soil Science and Agricultural Chemistry)
by
LIKHAMA RAM DHAYAL
2010
Swami Keshwanand Rajasthan Agricultural University, Bikaner
S.K.N. College of Agriculture, Jobner
CERTIFICATE - I
Date : ____2010
This is to certify that Mr. Likhama Ram Dhayal has successfully
completed the comprehensive examination held on 15th March 2010 as
required under the regulation for Master’s degree.
(S.P. MAJUMDAR) Prof. & Head
Department of Soil Science and Agricultural Chemistry
S.K.N College of Agriculture,
Jobner
Swami Keshwanand Rajasthan Agricultural University, Bikaner
S.K.N. College of Agriculture, Jobner
CERTIFICATE - II
Date : ____2010
This is to certify that this thesis entitled “Effect of Integrated
Nitrogen Management on Soil Properties and Performance of
Fenugreek under Typic Ustipsamment” submitted for the degree of
Master of Science in the subject of Soil Science and Agricultural
Chemistry embodies bonafide research work carried out by Mr. Likhama
Ram Dhayal under my guidance and supervision and that no part of this
thesis has been submitted for any other degree. The assistance and help
received during the course of investigation have been fully acknowledged.
The draft of the thesis was also approved by the advisory committee on
_______
(S.P. MAJUMDAR) (S.R. SHRAMA) Professor & Head Major Advisor Department of Soil Science and Agricultural Chemistry
(G.L. KESHWA) Dean
S.K.N. College of Agriculture, Jobner
Swami Keshwanand Rajasthan Agricultural University, Bikaner S.K.N. College of Agriculture, Jobner
CERTIFICATE - III
Date : ____2010
This is to certify that this thesis entitled “Effect of Integrated
Nitrogen Management on Soil Properties and Performance of
Fenugreek under Typic Ustipsamment”, submitted by Mr. Likhama
Ram Dhayal to the Swami Keshwanand Rajasthan Agricultural University,
Bikaner in partial fulfillment of the requirements for the degree of Master of
Science in the subject of Soil Science and Agricultural Chemistry, after
recommendation by the external examiner was defended by the candidate
before the following members of the examination committee. The
performance of the candidate in the oral examination on his thesis has
been found satisfactory. We therefore, recommend that the thesis be
approved.
(S.R. SHRAMA) (K.K. SHARMA) Major Advisor Advisor
(N.L. JAT) (S.C. JAIN) Advisor Dean, PGS, Nominee
(S.P. MAJUMDAR) (G.L. KESHWA) Professor & Head Dean Department of Soil Science S.K.N. College of Agriculture, and Agricultural Chemistry Jobner Approved
Dean, Post Graduate Studies Swami Keshwanand Rajasthan Agricultural University, Bikaner
Swami Keshwanand Rajasthan Agricultural University, Bikaner
S.K.N. College of Agriculture, Jobner
CERTIFICATE - IV
Date : ____2010
This is to certify that Mr. Likhama Ram Dhayal of the Department of
Soil Science and Agricultural Chemistry, S.K.N. College of Agriculture,
Jobner has made all corrections /modifications in the thesis entitled “Effect
of Integrated Nitrogen Management on Soil Properties and
Performance of Fenugreek under Typic Ustipsamment” which were
suggested by the external examiner and the advisory committee in the oral
examination held on ________2010. The final copies of the thesis duly
bound and corrected were submitted on ________2010, are enclosed
herewith for approval.
(S.R. SHRAMA) Major Advisor
(S.P. MAJUMDAR) Professor & Head
Department of Soil Science and Agricultural Chemistry
(G.L. KESHWA) DEAN
S.K.N. College of Agriculture, Jobner
Approved
DEAN, Post Graduate Studies Swami Keshwanand Rajasthan Agricultural University, Bikaner

CONTENTS
CHAPTER NO. PARTICULARS PAGE NO
1. INTRODUCTION .........
2. REVIEW OF LITERATURE .........
3. MATERIALS AND METHODS .........
4. EXPERIMENTAL RESULTS
.........
5. DISCUSSION .........
6. SUMMARY AND CONCLUSION .........
BIBLIOGRAPHY .........
ABSTRACT IN ENGLISH .........
ABSTRACT IN HINDI
.........
APPENDICES
.........
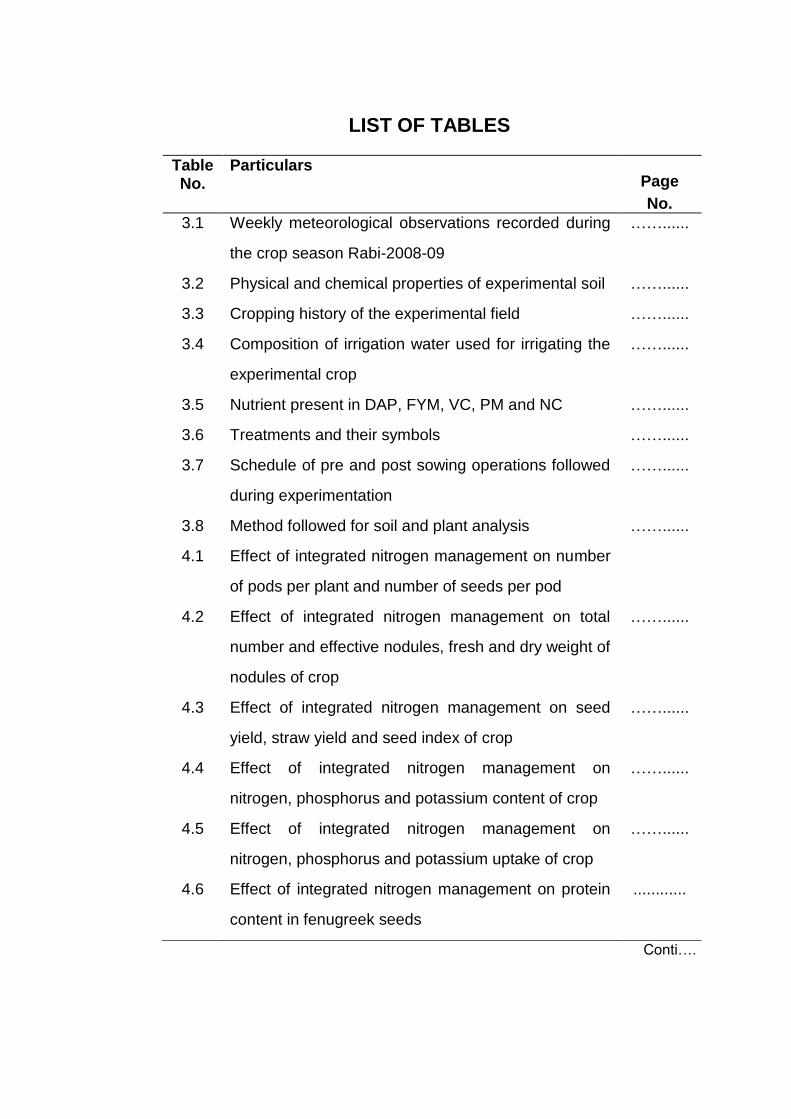
LIST OF TABLES
Table No.
Particulars Page
No.
3.1 Weekly meteorological observations recorded during
the crop season Rabi-2008-09
……......
3.2 Physical and chemical properties of experimental soil ……......
3.3 Cropping history of the experimental field ……......
3.4 Composition of irrigation water used for irrigating the
experimental crop
……......
3.5 Nutrient present in DAP, FYM, VC, PM and NC ……......
3.6 Treatments and their symbols ……......
3.7 Schedule of pre and post sowing operations followed
during experimentation
……......
3.8 Method followed for soil and plant analysis ……......
4.1 Effect of integrated nitrogen management on number
of pods per plant and number of seeds per pod
4.2 Effect of integrated nitrogen management on total
number and effective nodules, fresh and dry weight of
nodules of crop
……......
4.3 Effect of integrated nitrogen management on seed
yield, straw yield and seed index of crop
……......
4.4 Effect of integrated nitrogen management on
nitrogen, phosphorus and potassium content of crop
……......
4.5 Effect of integrated nitrogen management on
nitrogen, phosphorus and potassium uptake of crop
……......
4.6 Effect of integrated nitrogen management on protein
content in fenugreek seeds
............
Conti….
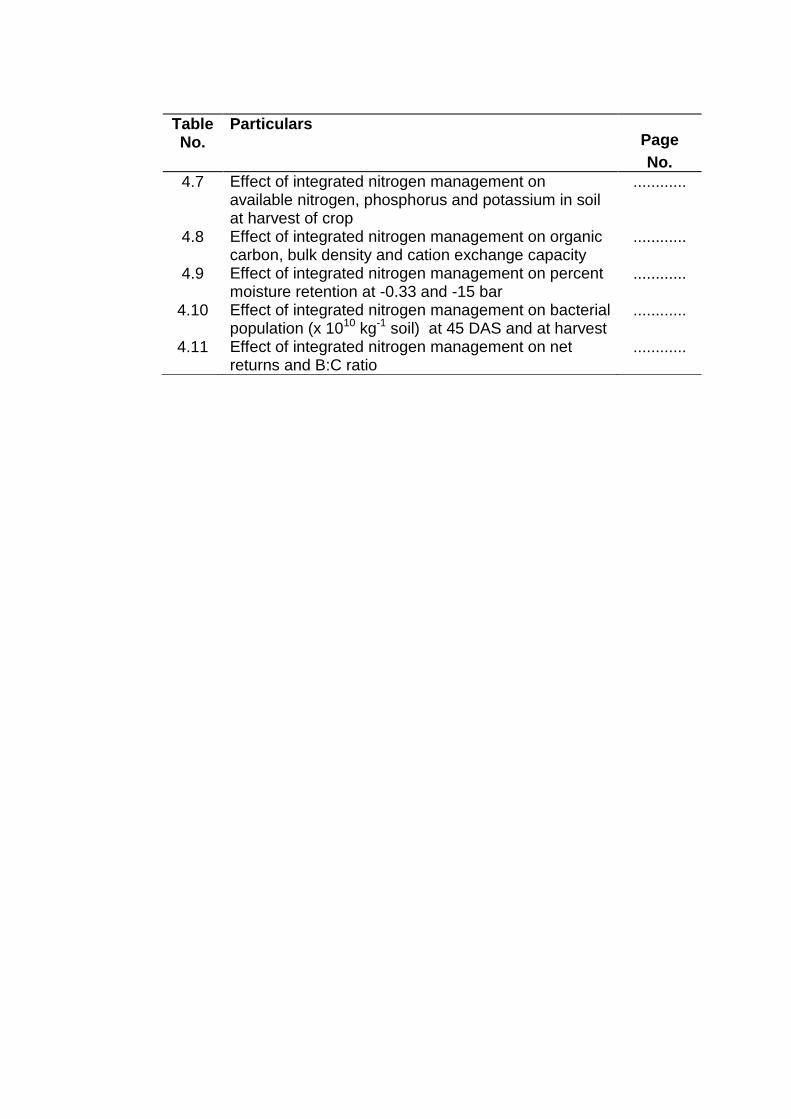
Table No.
Particulars Page
No.
4.7 Effect of integrated nitrogen management on available nitrogen, phosphorus and potassium in soil at harvest of crop
............
4.8 Effect of integrated nitrogen management on organic carbon, bulk density and cation exchange capacity
............
4.9 Effect of integrated nitrogen management on percent moisture retention at -0.33 and -15 bar
............
4.10 Effect of integrated nitrogen management on bacterial population (x 1010 kg-1 soil) at 45 DAS and at harvest
............
4.11 Effect of integrated nitrogen management on net returns and B:C ratio
............
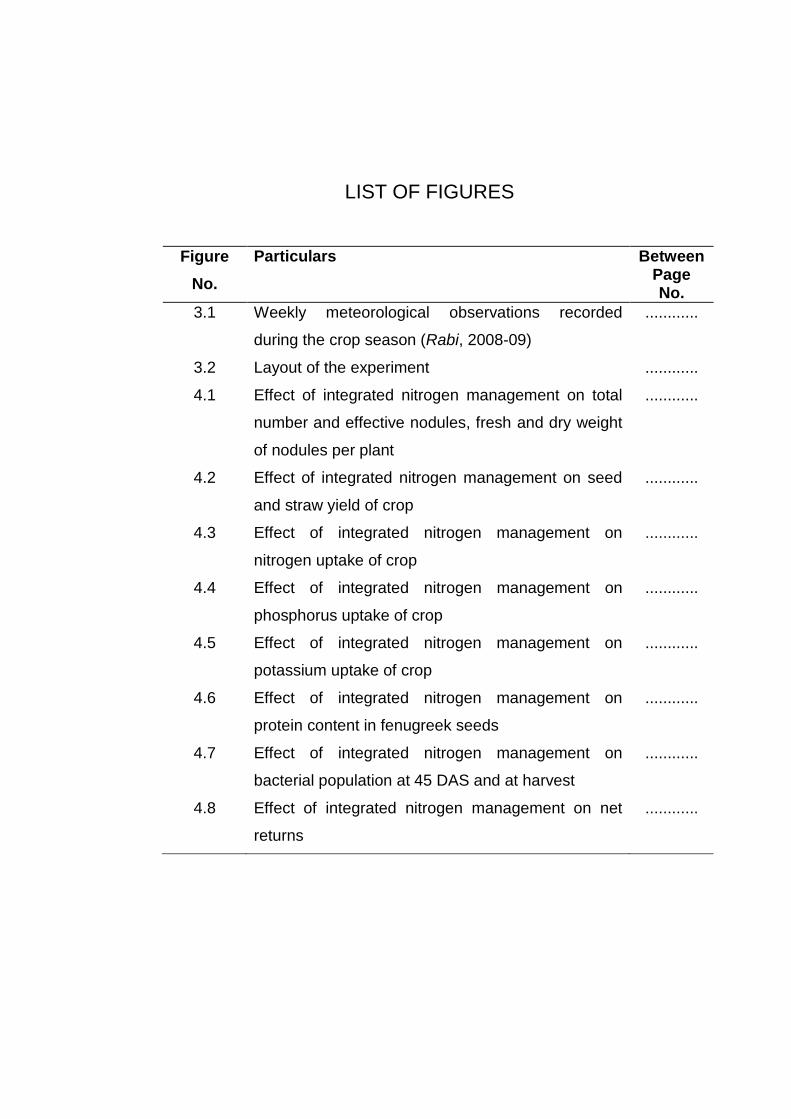
LIST OF FIGURES
Figure
No.
Particulars Between Page No.
3.1 Weekly meteorological observations recorded
during the crop season (Rabi, 2008-09)
............
3.2 Layout of the experiment ............
4.1 Effect of integrated nitrogen management on total
number and effective nodules, fresh and dry weight
of nodules per plant
............
4.2 Effect of integrated nitrogen management on seed
and straw yield of crop
............
4.3 Effect of integrated nitrogen management on
nitrogen uptake of crop
............
4.4 Effect of integrated nitrogen management on
phosphorus uptake of crop
............
4.5 Effect of integrated nitrogen management on
potassium uptake of crop
............
4.6 Effect of integrated nitrogen management on
protein content in fenugreek seeds
............
4.7 Effect of integrated nitrogen management on
bacterial population at 45 DAS and at harvest
............
4.8 Effect of integrated nitrogen management on net
returns
............
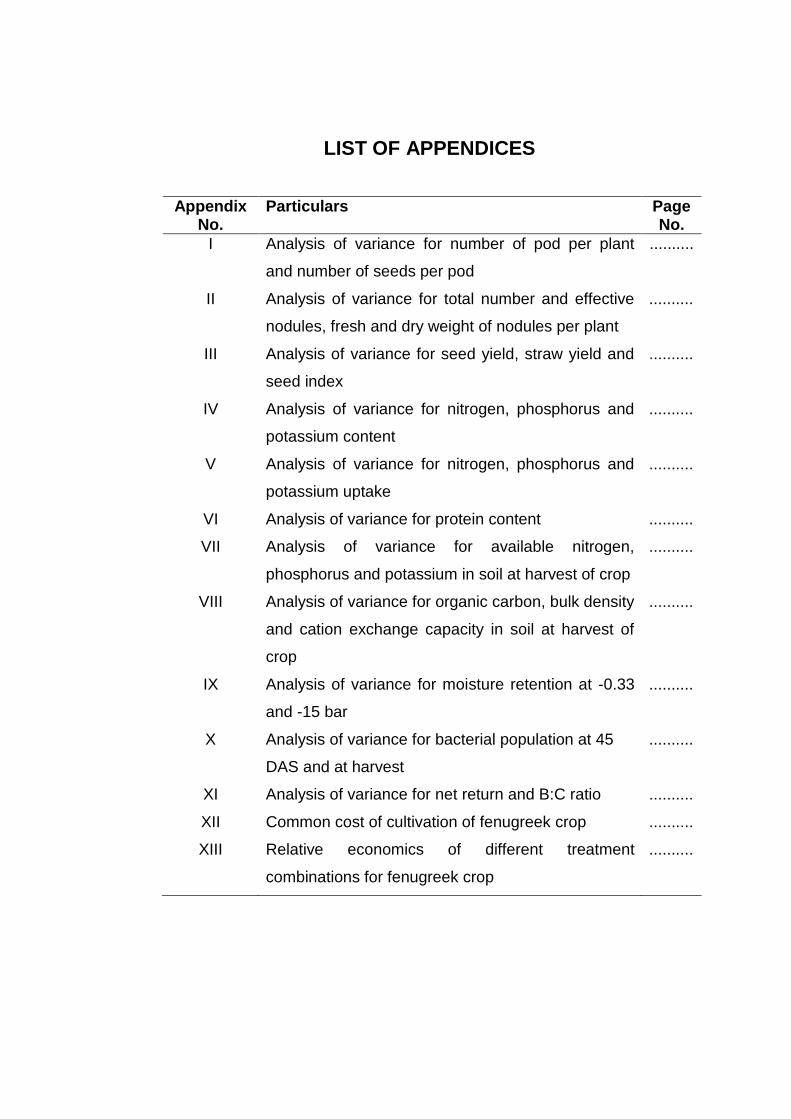
LIST OF APPENDICES
Appendix No.
Particulars Page No.
I Analysis of variance for number of pod per plant
and number of seeds per pod
..........
II Analysis of variance for total number and effective
nodules, fresh and dry weight of nodules per plant
..........
III Analysis of variance for seed yield, straw yield and
seed index
..........
IV Analysis of variance for nitrogen, phosphorus and
potassium content
..........
V Analysis of variance for nitrogen, phosphorus and
potassium uptake
..........
VI Analysis of variance for protein content ..........
VII Analysis of variance for available nitrogen,
phosphorus and potassium in soil at harvest of crop
..........
VIII Analysis of variance for organic carbon, bulk density
and cation exchange capacity in soil at harvest of
crop
..........
IX Analysis of variance for moisture retention at -0.33
and -15 bar
..........
X Analysis of variance for bacterial population at 45
DAS and at harvest
..........
XI Analysis of variance for net return and B:C ratio ..........
XII Common cost of cultivation of fenugreek crop ..........
XIII Relative economics of different treatment
combinations for fenugreek crop
..........
Effect of Integrated Nitrogen Management on Soil Properties and Performance of Fenugreek under Typic Ustipsamment
Likhama Ram Dhayal* Dr. S.R. Sharma** (Scholar) (Major Advisor) Abstract
A field experiment to study the “Effect of integrated nitrogen
management on soil properties and performance of fenugreek under Typic
Ustipsamment” was conducted at Agronomy farm S.K.N. College of
Agriculture, Jobner (Jaipur) during rabi 2008-09. The treatments were
consisting 14 combinations of Farm yard manure, Poultry manure,
Vermicompost, Neem cake and DAP were applied as soil application to
fenugreek (var. RMt-351) crop and replicated three times in randomized
block design.
Results showed that application of 100% RD of N through FYM
significantly decreased the bulk density and increased the organic carbon
content of soil, cation exchange capacity and bacterial population over
control, whereas, a significant increase in the yield attributes, effective and
total number of nodules per plant, dry and fresh weight of root nodules per
plant, seed yield, straw yield, content and uptake of nitrogen, phosphorus
and potassium in seed and straw, protein content in seed and NPK status
of soil at harvest were recorded with the application of 75% RD of N
through vermicompost + 25% N through DAP over control. The highest net
return and B:C ratio were also recorded under the application of 75% RD of
N through vermicompost + 25% N through DAP.
* A Post Graduate Student, Department of Soil Science and
Agricultural Chemistry, S.K.N. College of Agriculture, Jobner.
** M.Sc. (Ag.) thesis submitted to Swami Keshwanand Rajasthan Agricultural University,
Bikaner, for partial fulfillment of the requirement of degree under the supervision of
Dr. S.R. Sharma, Assistant Professor, Department of Soil Science and Agricultural
Chemistry, S.K.N. College of Agriculture, Jobner.
Acknowledgement
It is a great pleasure for me to express sincere and deepest sense of gratitude and indebtedness to my esteem major advisor Dr. S.R. Sharma, Assistant Professor, Department of Soil Science and Agricultural Chemistry, S.K.N. College of Agriculture, Jobner (Rajasthan) for suggesting and planning the present investigation, valuable guidance, carrying attitude and constant encouragement, moral support keen interest throughout the course of investigation and preparation of this manuscript.
A kaleidoscopic bouquet of hearty thanks to members of my advisory committee Dr. K.K. Sharma, Assistant Professor, Department of Soil Science and Agricultural Chemistry, Dr. N.L. Jat, Associate Professor & Head, Department of Agronomy, Dr. S.C. Jain, Assistant Professor (Dean, PGS nominee), Department of Plant Pathology for rendering help as and when needed.
I am highly grateful to Dr. S.P. Majumdar, Professor and Head, Department of Soil Science and Agricultural Chemistry, for providing necessary facilities and valuable suggestion during the course of investigation.
I express my sincere thanks to Dr. G.L. Keshwa, Dean, S.K.N. College of Agriculture, Jobner for providing necessary facilities in this venture.
Words can hardly acknowledge the help rendered by Dr. B.L. Yadav (Assoc. Professor), Dr. B.L. Kumawat (Assoc. Professor), Dr. R.S. Manohar (Assoc. Professor), Sh. K.S. Manohar (Asstt. Professor) and T.R. Boori (AAO) for providing necessary encouragement and help during my study and period of investigation. Thank of are also due to other non-teaching members of Department of Soil Science and Agricultural Chemistry.
I am also thankful to my colleagues, Gajanand Jat, J.K. Bana, Arvind, Mukesh, Dhansi, Sewa Ram, Bhoop Singh and Pradeep for their regular support, motivation and inspiration.
I take privilege to express my deep honour to my father Late Sh. Hanuman Ram Dhayal and mother Smt. Ratani Devi whose inspiration and blessings makes me more energetic at every step of my life for success.
My vocabulary falls short to express heartiest regards to uncle Sh. Sharwan Lal, Aunty Smt. Manni Devi, Sh. Gopal, Dhanna, Radhyshyam, Jagnath, Ranjeet and Mangal, elder brother Sh. Babu Lal and Bhabhiji Smt. Sajana Devi, younger brother Late Jagdish, Sunil, Sushil, Anil, Rajendra, Vishal, Vikas, Abhishek, nephew Gopal, Vijay, Mahendra, Mamaji Goma Ram Ji and Masaji Dayal Ji and all my family members whose consistent encouragement and blessing are beyond my expression
that brought me here up to dream without which it could not have been sketched.
I have no word to express my deep sense of love to my spouse Mrs. Bimla for her devoted cooperation and sacrifice various movements of troubles as well as enjoyment in my life.
I am grateful to Mr. R.K. Bana (Shivam Computer‟s & Training Centre) for the speedy and sincere devotion in typing this manuscript on computer.
Last but not least I appreciate with thanks to help rendered to me during the period to my study by all those whose name could not be mentioned here.
Place : Jobner Date : _____2010
(Likhama Ram Dhayal)
1 Introduction
Fenugreek (Trigonella foenum-graecum L.) commonly known as
“methi” and is belongs to family leguminoaceae, which is an important seed
spices crop used for leafy vegetables, condiment, medicinal purposes and
for fodder also. India and Morocco are the major reporter with the most
important market being the middle east. The major importers of India
fenugreek are Saudi Arabia, Japan, Malaysia, USA, UK, Singapore and Sri
Lanka.
Fenugreek is an annual herb, native of south eastern Europe and
west Asia, crop grown in northern India during winter (rabi) season. The
seed contain protein (27.7-38.6 per cent) and vitamins. The seeds also
contain alkaloids “trigonellina” (0.12-0.38 pr cent) choline “essential oil
(< 0.02 per cent), fatty oil (6.8 per cent) with foetid odour and bitter taste. It
contains 3-hydroxy 4-5 dimethyl 2 (SH)-furnon which gives a characteristic
aroma to the fenugreek seeds.
India is a dominant producer and exporter of fenugreek seeds,
accounting more than 60 per cent of the world trade. Its high market price
and fair salinity tolerance attracts the farmers to include this crop in their
cropping strategy, particularly in areas having salinity problems.
The major districts growing fenugreek in Rajasthan are Sikar,
Chittorgarh, Jaipur, Pali, Nagaur, Jhalawar and Alwar. In Rajasthan the
area under fenugreek is 49,797 ha with production of 48,914 tonnes and
the productivity is 882 kg ha-1 (Anonymous, 2007-08).
As a medicinal plant, it is traditionally been considered to be a
carminative, demuleent, expectorant, laxative and stomachic. It has also
been employed against brounchitis, fevers, sore throats, wounds, diabetes,
ulcers and in the treatment of cancer. It is used to the achieved through its
galactogogic action (increasing the flow of milk). It have also been utilized
as an aphrodisiac (Alaoui, 2000). It has immense medicinal value as
prevention of constipation, removal of indigestion, stimulation of spleen and
it act as a divretics and appetizing agent. The fenugreek seeds
substantially contain the steroidal substances (diosgenin) which helps in
the synthesis of hormone.
The main active substance of the seeds is dysgenic, a steroid
saprogenic, which is the starting compound for over 60% of the total steroid
production of the pharmaceutical industries. Other sapogenins are also
found in fenugreek seed which includes Jam-ogenin, gitogenin, tigogenin
and heotigogens. The sapogenin content is as diosgenin and in seed. It
varies from 0.8-2.2%, (expressed on moisture free basis). Other
constituents of fenugreek include mucilage matter and essential oil, the
amount of which is very less then 0.02% (Alaoui, 2000). The maple aroma
and flavour of fenugreek has led to its use of many baked goods, chutneys,
confections and imitation maple syrup. It is an important constituent of curry
powder. Young seedlings and other parts of the fresh plant material are
eaten as a vegetable. It is also used cosmetically in skin-nourishing face-
masks. Fenugreek is also used as livestock feed.
The increasing use of NPK fertilizers generally devoid of micro
nutrients, had no doubt remarkably increased the food production but it
brought with it a host of problems related to micro nutrient deficiencies by
depleting their resources in soil. In recent years continuous and imbalanced
use of chemical fertilizers with little or no incorporation of organic manure
and simultaneously. Loss of organic matter whether by erosion or high
temperature in the rain fed agro-ecosystem, adds to impoverishment of soil
resources of several elements, essential for plant growth. A decline in
organic matter multiples nutrient deficiencies, its fall by the two-third
symbolizes a serious suppression in nutrient availability (Stangel, 1991).
A proper and economically justified recycling of crop residues in the
form of FYM, compost, green manure etc (Tandon, 1992) and the use of
biofertilizers may provide a substantial supply of nutrients to the system
(Dixit and Gupta, 2000). India is endowed with the enormous potential for
plant nutrients locked up in biological wastes with an estimated amount of
875 mt which is equivalent to 18.45 mt nutrients annually. Recycling of
these would not only supply macro nutrients but also take care of micro-
nutrients which are otherwise limiting the growth and yields in many
intensively cultivated areas (Singh, 1999; Masood Ali and Mishra, 2000).
Incorporation of organic residues directly or indirectly also improves the
physical properties of soil and as such helps in sustaining the crop
production (Swarup and Wanjari, 2000). Generally, light texture soils are
low in organic carbon and prone to be deficient in nitrogen. Hence, a proper
amount of available N level is required to be maintained. Therefore, present
study entitled “Effect of integrated nitrogen management on soil properties
and performance of fenugreek under Typic Ustipsamment” has been under
taken with following objectives.
i. To evaluate the effect of integrated nitrogen management on the
yield, nodulation, nutrient content and uptake of crop.
ii. To find out the effect of integrated nitrogen management on soil
physico-chemical properties and soil fertility.
iii. To find out the economic viability of different treatment
combinations under investigation.
2 Review of literature
The literature on work done pertaining to the „Effect of integrated
nitrogen management on soil properties and performance of fenugreek
under Typic Ustipsamment‟ and related crops has been reviewed in this
chapter.
2.1 Effect of nitrogen fertilizer (DAP), FYM, VC, PM, NC on
yield attributes and yield
Bhutia and Singh (1990) noted that the application of nitrogen @ 50
kg N ha-1 as 50 per cent as urea + 50 per cent as FYM to wheat increased
plant height, number of tillers and leaf area over the sole application of
nitrogen through FYM.
Meena (1995) reported that application of 60 kg N + 5 t FYM ha-1
significantly increased the grain and straw yield and yield attributes of
barley over 30 kg N + 10 t FYM and lower levels of nitrogen.
Talashikar and Chavan (1996) observed that application of N and P
through DAP in combination with FYM significantly increased the pod yield
of groundnut by 17 per cent over control.
Zarate et al. (1997) observed that application of poultry manure @
14 tonnes ha-1 significantly increased the lettuce cv. Grand yield (20 t ha-1)
over control.
Vadiraj et al. (1998) reported that the herbage yield of coriander was
maximum (6075.5 kg ha-1) at 60th day after sowing in plots treated with 15 t
ha-1 vermicompost. The study also indicated that application of
vermicompost @ 15-20 t ha-1 not only increased herbage and seed yield
but also test weight of seed. Cisse (1998) reported an increase in
groundnut dry matter production by 60% with the application of @10 t
manure ha-1 over control. A significantly increase in yield of soybean with
application of FYM on sandy loam soil of IARI, New Delhi was also
reported by Vimje and Seth (1988).
Khiriya et al. (2001) recorded significantly higher plant height, dry
matter accumulation and seed yield of fenugreek with the application of
FYM up to 15 t ha-1.
Yadav (2001) noted that application of nitrogen (25 per cent N
through urea + 75 per cent N through FYM) significantly increased all the
growth parameters, yield and yield attributed of isabgol compared with 50
per cent N through urea + 50 per cent N through FYM, 75 per cent N
through urea + 25 per cent through FYM.
Rajkhowa et al. (2002) reported that vermicompost alone or in
combination with different levels of fertilizer have significantly influenced
the yield and yield components of green gram. The number of pods plant-1,
seeds pod-1, 100 seed weight were also higher under the treatment
receiving vermicompost @ 2.5 t ha-1 along with recommended dose of
fertilizer.
Singh and Verma (2002) recorded significantly higher plant height,
braches plant-1, pods plant-1and 100 seed weight along with grain yield of
french bean (Phaseolus vulgaris) with the application of FYM @ 10 t ha-1
and cane compost in combination with inorganic 75% RDF compared to
their individual effects and over control. Combined application of FYM @
20 t ha-1 + 100% recommended dose of fertilizer + Azotobacter spp. +
Pseudomonas striata registered significantly higher yields of pod and
haulm of groundnut (Kachot et al., 2001).
Netwal (2003) reported during pot experiment that an application of
FYM (0, 5 and 10 t ha-1) and vermicompost (0, 2.5 and 5 t ha-1) significantly
increased the grain yield of cowpea to the extent of 13.54, 27.97 and 32.28
per cent, over control respectively.
Mathur et al. (2003) observed significantly higher number of pods
per plant, grain, stover and biological yield of green gram over control.
Rajkhowa et al. (2003) observed that application of vermicompost @
2.5 t ha-1 being at par with 2.5 t FYM ha-1 significantly increased the
number of pods per plant, seeds per pod and 1000 grain weight of green
gram over control.
Yadav et al. (2003) opined that integration of compost or FYM @ 10
tonnes ha-1 with 90 kg N ha-1 results maximum grain and straw yields of
wheat.
Khoja (2004) found that application of nitrogen in integrated manner
(FYM (N30) + urea (N30) + Azotobacter) produced the highest number of
umbels plant-1, umbellets umbel-1 and seeds umbellet-1and seed (15.32 q
ha-1) and straw yields (29.94 q ha-1) of coriander.
Patil et al. (2004) found that application of recommended dose of
nitrogen through FYM with chemical fertilizers in the ratio of 1:1 gave
significant improvement in the yield attributes (umbels plant-1, umbellets
plant-1, seeds umbellet-1) as well as in seed yield (769 kg ha-1) of cumin
over individual application of inorganic nitrogen fertilizer (746 kg ha-1) and
FYM (670 kg ha-1).
Singh and Meena (2004) observed significant increase in siliquae
plant-1, seed siliquae-1, seed and stover yield of mustard with increasing
levels of N up to 80 kg /ha over control.
Kumar and Gautam (2004) noticed that the application of FYM +
fertilizer N and FYM + BF + fertilizers N brought out a significant variation in
all growth components and yield of pearl millet. The combined application
of FYM, biofertilizer and chemical fertilizers was found significantly superior
over other treatments.
Kumar et al. (2005) reported that the total grain production (110.5 q
ha-1) was higher when both the crops maize and gobhi sarson in system
were fertilized with 150% of recommended dose of NPK. The production of
the both crops were 28 and 26% higher over recommended dose of
fertilizer application, respectively. Application of 10 tonnes FYM along with
100% NPK either to one crop or both crops increased the systems
productivity by 7.7% over 100% NPK application alone.
Roul and Sarawgi (2005) conducted a field experiment on sandy
loam soil to study the effect of different integrated nitrogen nutrition
techniques on yield, N content, N uptake and N use efficiency of rice and
found that the grain yield, straw yield, N content and uptake were
significantly higher under 100% RDN + 5 tonnes FYM over other
treatments.
Jat et al. (2006) reported that highest seed and straw yield of
fenugreek with the application of 100% inorganic N + Rhizobium @ 1.5
kg/ha + 5 tonnes FYM /ha.
Jat (2006) found that the increasing levels of FYM significantly
increased the number of siliquae plant-1, number of seeds siliquae-1, test
weight, seed and stover yield of the mustard crop over lower levels.
Laxminarayana and Patiram (2006) reported that combined use of
organics (green manure/FYM/ poultry manure/pig manure) along with
inorganic fertilizers produced highest and sustainable rice yield and
enhanced use efficiency of added fertilizers as well as fertility of soil.
Ramesh et al., (2006) reported that among different sources, of
nutrient application chemical fertilizers registered higher number of pods
plant-1 in pigeonpea which were at par with cattle dung application.
significant of vermicompost, phospho-compost and poultry manure showed
superiority over control but remain at par with each other.
Gowda et al. (2008) conducted an field experiment on wheat and
reported that application of vermicompost @ 3.8 t ha-1 + poultry manure @
2.45 t ha-1 gave significantly higher plant height, number of leaves, number
of tillers, test weight, straw and seed yield as well as protein content in
seed as compared to control.
2.2 Effect of nitrogen fertilizer (DAP), FYM, VC, PM, NC on
content and uptake of NPK
Saran and Sharma (1994) postulated that conjunctive use of 6 t ha-1
FYM and fertilizer N and P (N20P13) was most effective in increasing uptake
of N, P, K and S by soybean crop.
Dosani et al. (1999) recorded highest uptake of NPK 170.83 kg ha-1,
17.38 kg ha-1 and 67.87 kg ha-1, respectively in groundnut with the
application of poultry manure @3+ ha-1
Kachot et al. (2001) reported that N, P and K content and uptake
were significantly influenced in groundnut crop with the combined
application of FYM @ 20 t ha-1 + 100% recommended dose of fertilizer +
Azotobacter spp +Pseudomonas striata.
Subramanian and Kumar (2001) recorded highest concentration of N
(1.22%), P (0.11%) and K (1.46%) in the plant tissue of coriander with the
application of 100% N (20 kg ha-1) with Azospirillum seed inoculation.
Jain and Tiwari (2001) observed that application of 6 t FYM ha-1 + 60
kg P2O5 ha-1, significantly increased the N, P and K content of soybean
over control.
Rubapathi et al. (2002) observed that application of nitrogen
through combined sources (875 kg FYM with 40 kg N + biofertilizer) gave
higher nitrogen, phosphorus and potassium uptake over the sole
application of organic or inorganic source of nutrients in sorghum + red
gram + coriander cropping system.
Khiriya et al. (2003) observed significantly enhanced NPK content
and uptake in seed and straw of fenugreek with the application of FYM up
to 15 t ha-1.
Rajkhowa et al. (2003) reported significantly increase in uptake of N
and P in green gram with the application of vermicompost @ 2.5 t ha-1
alongwith 100 to 75% fertilizer over control.
Vasanthi and Subramanian (2004) reported highest N, P and K
concentration and uptake in black gram under the treatment that received
vermicompost @ 2 t ha-1 along with 100 % recommended dose of N, P
and K.
Singh and Rai (2004) reported higher uptake P and K in soybean
crop with the application of NPK fertilizer, FYM and bio-fertilizers.
Chaturvedi and Chandel (2005) reported highest total uptake of N,
P, and K under the treatments receiving recommended NPK + FYM @ 10
tonnes/ ha in soybean crop.
Singh et al. (2005) reported that highest N, P and K uptake in rice
was recorded with the application of 60 kg N ha-1 plus Azolla treatment.
Jat et al. (2006) reported highest nitrogen and phosphorus uptake in
fenugreek with the application of 100% inorganic N and Rhizobium @ 1.5
kg/ha + 5 tonnes/ha.
Choudhary (2007) conducted an field experiment on greengram and
found that N, P and K uptake in seed and straw and organic carbon content
in soil at harvest increased significantly with an increasing levels of
vermicompost.
The response of organic manure and fertilizers on yield and nutrient
uptake of ginger was studied by Dharade et al. (2009) and reported that the
use of 50 per cent N through RD + 25 t FYM t ha-1 fertilization of the crop
was beneficial in terms of net returns. The highest uptake of N was
recorded remain to application of RDF + 50 per cent N through poultry
manure whereas the uptake of P and K were highest under the treatment
having RDF + 25 t FYM ha-1 followed by the application of 50 per cent N
through RDF + 50 per cent N through either poultry manure or
vermicompost.
2.3 Effect of nitrogen fertilizer (DAP), FYM, VC, PM, NC on soil
properties
Singh et al. (1997) reported that incorporation of poultry manure @
10 t ha-1 significantly increased the organic carbon and available N at
harvest of sesamum crop. Significant improvement in soil pH, organic
carbon and available N, P and K in soil at harvest of the crop have also
been noticed with the incorporation of FYM (30 Mg ha-1) over control by
Ismail et al. (1998).
Bellaki et al. (1998) observed a significant lower bulk density with
the application of various organic materials to meet out 50 per cent nitrogen
along with 50 per cent NPK whereas application of vermicompost to soil
resulted in increased N, P, K, Fe, Mn, Cu, Zn, organic carbon content and
CEC values and decreased bulk density of soil.
Nethra et al. (1999) reported an improvement in soil pH towards
neutrality with vermicompost application. The maximum available nitrogen
content (493.31 kg ha-1) was observed in the plot receiving the application
of vermicompost @ 5 t ha-1 and 10 % N, P and K by China aster.
Bellakki and Badanur (2000) showed that the use of chemical
fertilizer alone gave comparatively higher bulk density than that of stubbles
with nitrogen application. Babulkar et al. (2000) reported that the bulk
density of soil decreased significantly with the application of FYM @ 75 Mg
FYM ha-1 along with 50% dose of N and P.
Sharma et al. (2000) observed a significant reduction in bulk density
with significant improvement in WHC, CEC, available N, P and S status of
soil with addition of crop residue and FYM.
Nehra and Grewal (2001) reported that the application of
vermicompost @ 15 t ha-1 increased organic carbon content, available N, P
and K in soil significantly.
Prakash et al. (2002) concluded from two years study that FYM is
superior than vermicompost, processed city waste and oil cake pellets in
terms of improvement in soil chemical properties (available N, P, K, organic
carbon, CEC and dehydrogenase activity) at latenritic sandy loam soil.
Netwal (2003) conducted a pot experiment on cowpea and observed
that the increasing levels of organic manures (FYM and vermicompost) was
increased the available NPK and organic carbon content of soil and
decreased the ECe, pH and ESP of the experimental soil.
Bhattacharya et al. (2004) conducted a long term fertility experiment
to study the effect of fertilizer and manuring on soil properties under
soybean-wheat cropping sequence and reported that the application of
NPK + FYM increased soil organic carbon, water retention and decreased
the bulk density of soil.
Selvi et al. (2005) observed that continuous application of balanced
fertilizers along with organic significantly reduced the bulk density of soil
over the unfertilized plots. Although bulk density of experimental soil was
also decreased significantly under NPK and FYM treatments but it did not
varied significantly among the treatment of NPK levels. Increasing levels of
fertilizers significantly increased the hydraulic conductivity. Combined
application of FYM and NPK also resulted in significantly higher hydraulic
conductivity than NPK application alone. The total porosity of soil ranged
from 50.2 to 58.9% and it was significantly higher in the plots fertilized with
NPK in combination of FYM over unmanured control.
Varalakshmi et al. (2005) observed that application of 100%
recommended dose of fertilizer NPK + 7.5 t FYM ha-1 significantly
improved the organic carbon, available N, P and K content of soil.
Bajpai et al. (2006) reported that the organic carbon content of the
surface soil increased significantly with the incorporation of organic
materials with chemical fertilizers as well as with 100% NPK fertilizers
treatment over control. The highest (7.03g kg-1) organic carbon content was
observed in 50% N through GM + 50% through chemical fertilizers. A
significant reduction in bulk density (1.43 Mg m-3) was also recorded under
the treatment having 50% N through green manure + 50% N through
fertilizer as compare to other treatments. The organic matter like FYM and
GM with inorganic fertilizers was also laid beneficial effect on increasing the
nitrogen and phosphorus availability of the soil.
Tripathi and Tiwari (2006) showed that the continuous application of
organics alone or with inorganic fertilizers decreased bulk density; the
lowest being recorded in treatment receiving 33% N (40 kg ha-1) from each
organics. Soil organic carbon of the plot receiving 100% N as urea with 2 t
ha-1 pressmud differed significantly from rest of the treatments, except 25%
N as urea with 25% from each organics.
Singh and Yadav (2007) concluded from a field experiment that
incorporation of organic materials decrease the pH and ESP of soil and
increase the ECe, organic carbon status and exchangeable cations of soil
2.4 Effect of nitrogen fertilizer (DAP), FYM, VC, PM, NC on
nodulation
Lopes et al. (1996) reported that an increase in level of
vermicompost upto 10 t ha-1 significantly increased nodulation and dry
matter yield of cowpea over rest of the treatments.
Mathur (2000) observed that the application of 70 kg N ha-1 through
vermicompost significantly increased growth of summer green gram in the
form of plant height, dry matter, LAI, number and dry weight of nodules per
plant over rest of the treatments.
Das et al. (2002) reported that the application of 100 per cent
recommended dose of NPK through vermicompost to greengram
significantly produced taller plants, higher nodules number and more dry
matter as compared to control.
Rajakhowa et al. (2003) reported that the application of
vermicompost 2.5 t ha-1 + 75% of recommended dose of fertilizers
significantly increased the number of nodules per plant of greengram over
control.
Shikha et al. (2004) studied the effect of 50, 75, 100 or 125 % of the
recommended dose of inorganic fertilizers and RRF 20 and 100 kg K2O in
conjunction with FYM 10 t ha-1, poultry manure 2.5 t ha-1 or biofertilizers on
the performance of soybean under soybean-wheat cropping system. All
treatments significantly enhanced the number of root nodules per plant,
plant height and yields of the crops and the highest number of root nodules
at 50 DAS was obtained under 125% RRF with FYM, poultry manure or
biofertilizers over control.
Choudhary (2007) conducted a field experiment and found that
application of vermicompost @ 2 t/ha significantly increased fresh and dry
weight of root nodules per plant, leaf area index, leghemoglobin content in
root nodules at pre-flowering stage, number of branches per plant, plant
height, number of pods per plant, number of seeds per pod, test weight,
seed and straw yield of greengram.
2.5 Effect of nitrogen fertilizer (DAP), FYM, VC, PM, NC on
protein content
Field experiment conducted on red sandy loam soil at Bangalore
revealed that seed yield, oil yield, protein content and uptake of N, P and K
of soybean showed increasing trend with increase level of organic matter
from 0 to 10 t ha-1 (Rammamurthy and Shivashankar, 1995).
Mathur (2000) observed significantly higher N, P and K uptake and
protein content was observed in green gram with the application of 20 kg N
ha-1 through vermicompost over rest of the treatments.
Kachot et al. (2001) observed that application of FYM @ 20 t ha-1 +
100% RDF + biofertilizers gave significantly higher protein content and oil
yield of groundnut crop over control.
Rao and Shaktawat (2001) conducted a field experiment on
groundnut and found that application of FYM @ 10 t ha-1 and poultry
manure @ 5 t ha-1 significantly increased oil and protein content of
groundnut over control.
A significant increase in protein content was also observed in
fenugreek with the application of FYM upto 15 t ha-1 by Khiriya et al., 2003.
Singh and Rai (2004) reported that the protein content and oil
contents in soybean seed was strongly influenced with the application of
NPK + FYM + Biofertilizers.
Vasanthi and Subramanian (2004) conducted a field experiment on
black gram and found highest crude protein, N, P and K concentration and
uptake of crop plant under the treatments those received vermicompost @
2 t ha-1 along with 100% recommended level of NPK over 100% NPK
through different combinations of chemical fertilizers.
Ramesh et al. (2006) conducted a field experiment at Bhopal
applying different organic manures (cattle dung 4 t /ha, vermicompost 3 t
/ha and poultry manure 2 t /ha) to pigeonpea and reported highest protein
content in seed with the application of cattle dung (21.25%) followed by
vermicompost (20.90%) and poultry manure (20.87%).
Gowda et al. (2008) conducted an field experiment on wheat and
found that application of vermicompost @ 3.8 t ha-1 + poultry manure @
2.45 t /ha gave significantly higher protein content in seed as compared to
control.
2.6 Effect of nitrogen fertilizer (DAP), FYM, VC, PM, NC on soil
moisture
Bellakki and Badanur (1997) reported that application of FYM or
sunhemp alone or in combination with fertilizers significantly increased the
soil aggregates, porosity, field capacity and maximum WHC under dryland
condition of soil. Continuous application of organics increased the CEC and
organic carbon content of surface and sub-surface soils.
Sharma et al. (2000) observed a significant reduction in bulk density
with significant improvement in WHC, CEC, available N, P and S status of
soil with addition of crop residue and FYM.
Ghuman and Sur (2006) found that application of FYM and green
manure decreased the pH of the surface layer, whereas, infiltration rate
increased by 25-69% and soil moisture storage by 21-65 per 1.8 m depth,
respectively over control.
Bajpai et al. (2006) provoked that the incorporation of organic
sources considerably improve the soil properties as decrease in bulk
density and increase in infiltration rate and available NPK status of the soil.
Laxminarayana and Patiram (2006) observed that the water holding
capacity of the soil was progressively improved with the application of
organic manure as compared to inorganic fertilizers. The moisture retention
at field capacity (33 kPa) was recorded as highest with the addition of FYM,
followed by poultry manure and pig manure, whereas, the moisture content
(at 1.5 Mpa) was found to be highest under organics and it was relatively
low with inorganic sources more over. Application of 100% NPK + FYM @
15 t ha-1 was registered highest organic carbon (8.2 g kg-1) over the rest of
treatments.
2.7 Effect of nitrogen fertilizer (DAP), FYM, VC, PM, NC on soil
bacterial population of rhizosphere
Sharma et al (1983) studied the effect of continuous application of
fertilizers, FYM and lime on microbial population of an acidic red loam soil
and observed that the bacteria, actinomycetes, azotobacter, cellulose
decomposers and phosphate solubilizers increased under the treatments of
FYM, FYM+lime+PK and lime + NPK, fungi and beijerinckia proliferated
under N, NP and NPK treatments. Microbial population in the wheat
rhizosphere was invariably higher then that in the non-rhizosphere but FYM
application alone or in combination with the inorganics and lime supported
greater population of bacteria and actinomycetes.
Patil and Varade (1998) reported that population of fungi, bacteria
and actinomycetes was affected significantly with different rates of fertilizer
treatments at all the crop growth stages. Fungi, bacteria and actinomycetes
proliferated under NPK and FYM. Increasing trend of microbial population
was noticed after 30 days of sowing and it declined at harvesting stage.
Selvi et al (2004) reported that population of bacteria, fungi and
actinomycetes was affected significantly with different treatments consisting
in all the three crops (finger millet, maize, cowpea fodder ) of the cropping
system. Bacteria, fungi and actinomycetes proliferated well under
continuous applications of NPK and FYM treatments. The application of
100% N alone fertilizer and control recorded lower value of microbial
population. Higher microbial population were recorded by the application of
10 t FYM/ha along with 100% NPK.
2.8 Effect of nitrogen fertilizer (DAP), FYM, VC, PM, NC on
organic carbon
Sharma (1992) observed significant improvement in organic carbon
content and available NPK status of soil with the application of FYM.
Reddy et al (1995) studied the effect of vermicompost on soil
properties and green gram nutrition and concluded that vermicompost
application significantly increased the organic carbon content of soil,
availability and uptake of different nutrients compared to FYM.
Saxena and Chandel (1997) recorded significant increase in N2-
fixation and organic carbon balance with application of FYM @10 t/ha over
other treatments.
Sinha et al. (1997) showed the possibility of increasing organic
carbon and cation exchange capacity of soils by incorporation of organic
manure.
Vasanthi and Kumarswamy (1999) reported that the organic carbon
content of the soil was increased significantly with the application of
vermicompost over control.
Srikanth et al. (2000) reported that incorporation of various
composts resulted in a significant increase in organic carbon content of soil
over control. Reduction in soil pH at the harvest of the crop was also
recorded under the soils amended with compost and inorganic fertilizers
treatment.
Nehra and Grewal (2001) reported that the application of
vermicompost @ 15 t ha-1 was increased significantly the organic carbon,
available N, P and K content of soil over control.
Akbari et al. (2002) reported that application of FYM @ 10 t ha-1
significantly improved the organic carbon content and available P2O5 of soil
over control.
Bajpai et al. (2006) reported that the organic carbon content of the
surface soil increased significantly with the incorporation of organic
materials with chemical fertilizers as well as with 100% NPK fertilizers
treatment over control. The highest (7.03g kg-1) organic carbon content was
observed under the treatment having 50% N through GM + 50% through
chemical fertilizers. Significant reduction in bulk density (1.43 Mg m-3) was
also recorded under the treatment having 50% N through green manure +
50% N through fertilizer as compared to other treatments. The organic
matter like FYM and GM with inorganic fertilizers was also laid beneficial
effect on increasing the nitrogen and phosphorus availability.
3 Materials and Methods
The investigation entitled “Effect of integrated nitrogen management on soil properties and
performance of fenugreek under Typic Ustipsamment ” was carried out at the Agronomy farm, S.K.N. College of
Agriculture, Jobner (Raj.) during rabi season of 2008-09. The details of materials used and experimental
techniques followed during the course of investigation are described in this chapter.
3.1 Location of experimental site
The Agronomy farm is situated at 750 28‟ East longitude and 260 08‟
North latitude and 427 m above mean sea level.
3.2 Climate and weather conditions
The climate of the area is typically semi-arid characterized by the
aridity of the atmosphere, scarcity of water with extremity of temperatures
both during summer and winter. Maximum temperature in summer ranges
between 300 to 46 0C, whereas, in winter temperature falls down to as low
as –3 0C. The average rainfall varies between 400 to 500 mm and most of
which is received in rainy season from July to September. Wells are the
only source of irrigation and water table is quite deep (about 25-30 m).
3.3 Meteorological observations
The mean weekly weather parameters of the crop season recorded
at the college meteorological observatory have been presented in Table 3.1
and diagrammatically represented in Fig 3.1.
3.4 Soil of the experimental field
In order to ascertain the physico-chemical characteristics of the soil,
soil samples were collected from different spots of the experimental field
randomly from 0-15 cm soil depths and representative composite sample
were subjected to physical and chemical analysis separately. The physico-
chemical characteristics of the soil of experimental field along with the
methods followed for analysis are given in Table 3.2 and 3.8 respectively
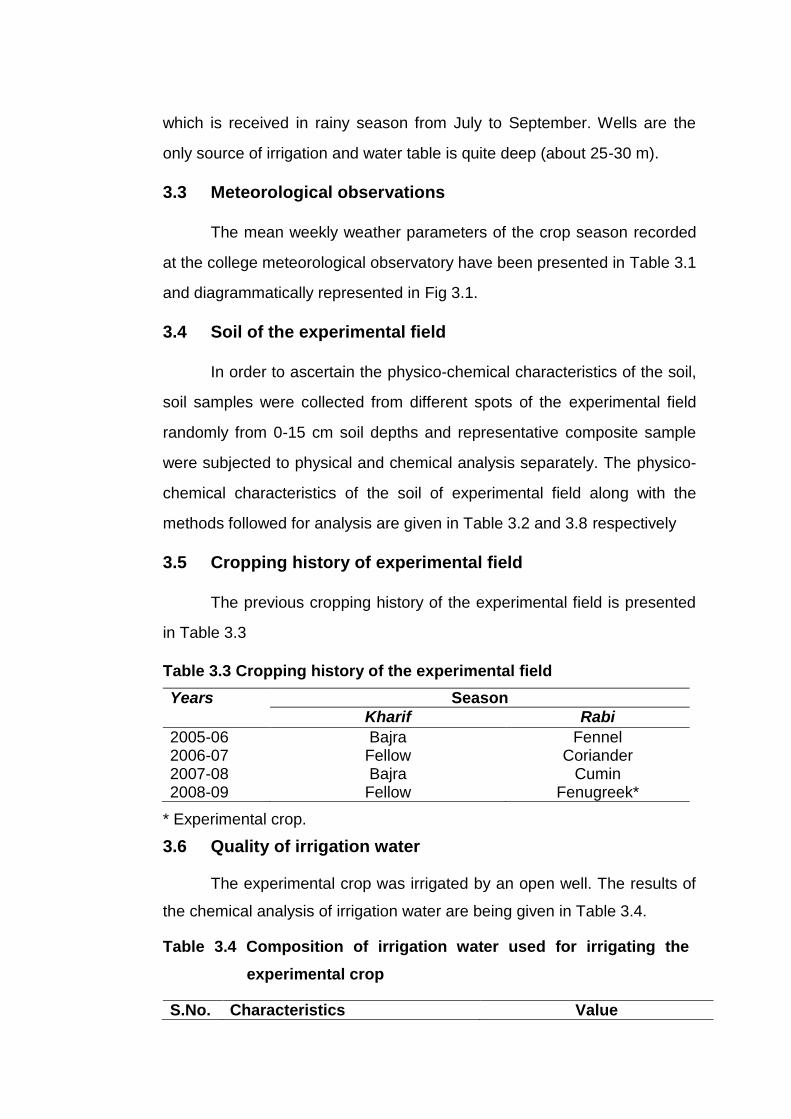
3.5 Cropping history of experimental field
The previous cropping history of the experimental field is presented
in Table 3.3
Table 3.3 Cropping history of the experimental field
Years Season
Kharif Rabi
2005-06 Bajra Fennel 2006-07 Fellow Coriander 2007-08 Bajra Cumin 2008-09 Fellow Fenugreek*
* Experimental crop.
3.6 Quality of irrigation water
The experimental crop was irrigated by an open well. The results of
the chemical analysis of irrigation water are being given in Table 3.4.
Table 3.4 Composition of irrigation water used for irrigating the
experimental crop
S.No. Characteristics Value
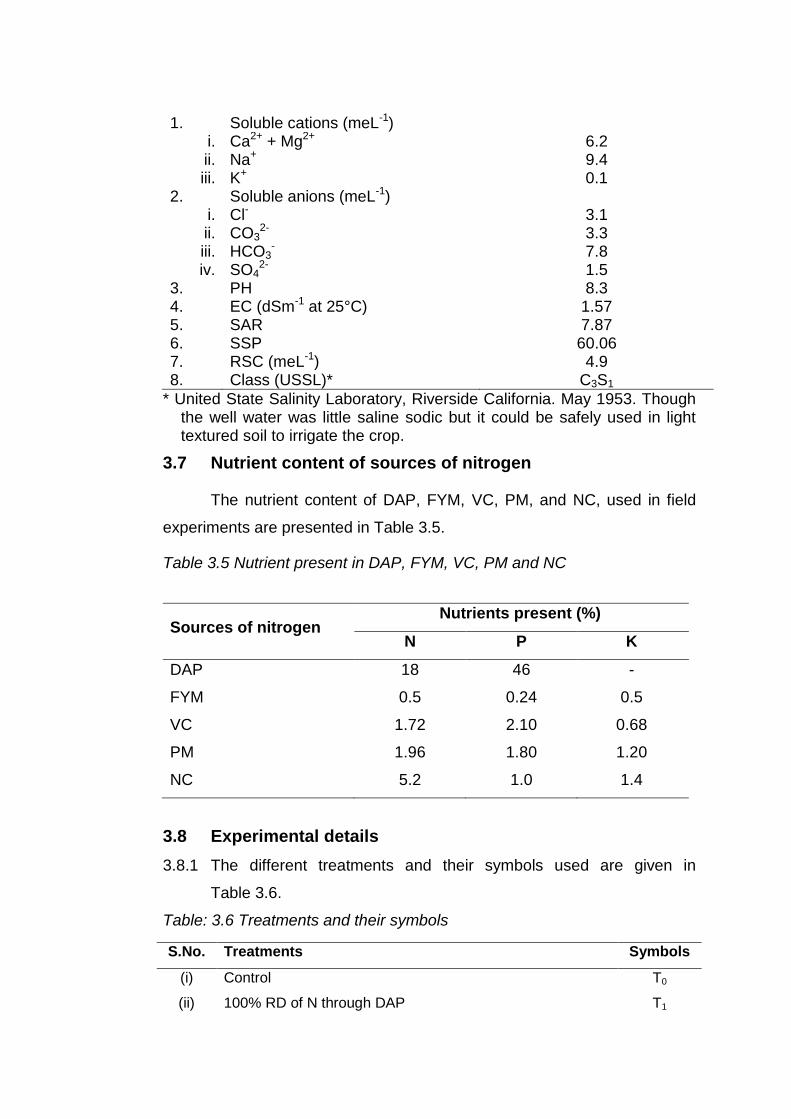
1. Soluble cations (meL-1) i. Ca2+ + Mg2+ 6.2 ii. Na+ 9.4 iii. K+ 0.1
2. Soluble anions (meL-1) i. Cl- 3.1 ii. CO3
2- 3.3 iii. HCO3
- 7.8 iv. SO4
2- 1.5 3. PH 8.3 4. EC (dSm-1 at 25°C) 1.57 5. SAR 7.87 6. SSP 60.06 7. RSC (meL-1) 4.9 8. Class (USSL)* C3S1
* United State Salinity Laboratory, Riverside California. May 1953. Though the well water was little saline sodic but it could be safely used in light textured soil to irrigate the crop.
3.7 Nutrient content of sources of nitrogen
The nutrient content of DAP, FYM, VC, PM, and NC, used in field
experiments are presented in Table 3.5.
Table 3.5 Nutrient present in DAP, FYM, VC, PM and NC
Sources of nitrogen Nutrients present (%)
N P K
DAP 18 46 -
FYM 0.5 0.24 0.5
VC 1.72 2.10 0.68
PM 1.96 1.80 1.20
NC 5.2 1.0 1.4
3.8 Experimental details
3.8.1 The different treatments and their symbols used are given in
Table 3.6.
Table: 3.6 Treatments and their symbols
S.No. Treatments Symbols
(i) Control T0
(ii) 100% RD of N through DAP T1
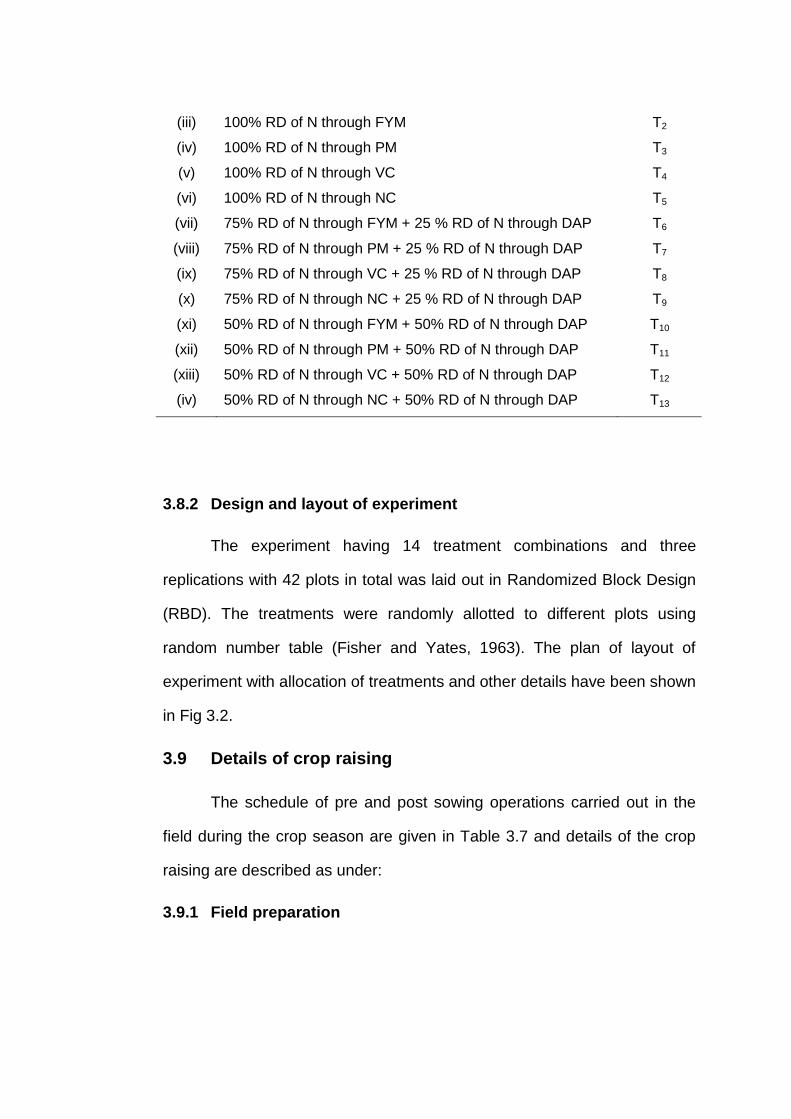
(iii) 100% RD of N through FYM T2
(iv) 100% RD of N through PM T3
(v) 100% RD of N through VC T4
(vi) 100% RD of N through NC T5
(vii) 75% RD of N through FYM + 25 % RD of N through DAP T6
(viii) 75% RD of N through PM + 25 % RD of N through DAP T7
(ix) 75% RD of N through VC + 25 % RD of N through DAP T8
(x) 75% RD of N through NC + 25 % RD of N through DAP T9
(xi) 50% RD of N through FYM + 50% RD of N through DAP T10
(xii) 50% RD of N through PM + 50% RD of N through DAP T11
(xiii) 50% RD of N through VC + 50% RD of N through DAP T12
(iv) 50% RD of N through NC + 50% RD of N through DAP T13
3.8.2 Design and layout of experiment
The experiment having 14 treatment combinations and three
replications with 42 plots in total was laid out in Randomized Block Design
(RBD). The treatments were randomly allotted to different plots using
random number table (Fisher and Yates, 1963). The plan of layout of
experiment with allocation of treatments and other details have been shown
in Fig 3.2.
3.9 Details of crop raising
The schedule of pre and post sowing operations carried out in the
field during the crop season are given in Table 3.7 and details of the crop
raising are described as under:
3.9.1 Field preparation
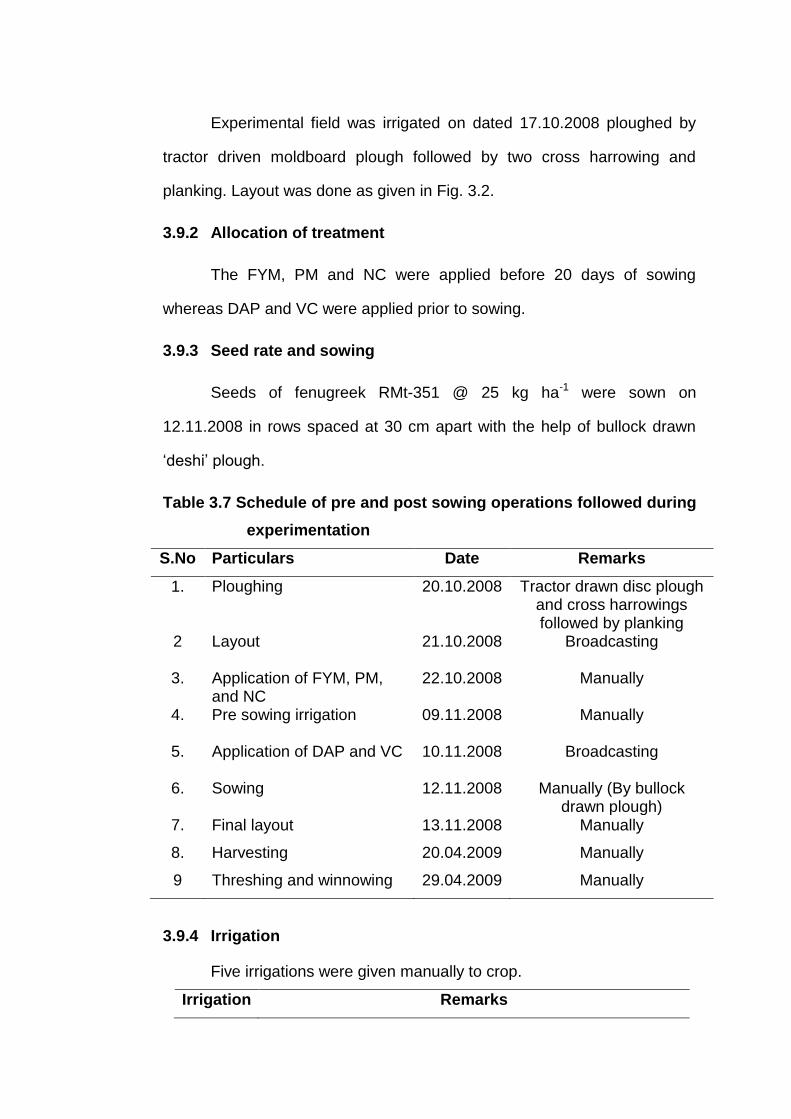
Experimental field was irrigated on dated 17.10.2008 ploughed by
tractor driven moldboard plough followed by two cross harrowing and
planking. Layout was done as given in Fig. 3.2.
3.9.2 Allocation of treatment
The FYM, PM and NC were applied before 20 days of sowing
whereas DAP and VC were applied prior to sowing.
3.9.3 Seed rate and sowing
Seeds of fenugreek RMt-351 @ 25 kg ha-1 were sown on
12.11.2008 in rows spaced at 30 cm apart with the help of bullock drawn
„deshi‟ plough.
Table 3.7 Schedule of pre and post sowing operations followed during
experimentation
S.No Particulars Date Remarks
1. Ploughing 20.10.2008 Tractor drawn disc plough and cross harrowings followed by planking
2 Layout 21.10.2008 Broadcasting
3. Application of FYM, PM, and NC
22.10.2008 Manually
4. Pre sowing irrigation 09.11.2008 Manually
5. Application of DAP and VC 10.11.2008 Broadcasting
6. Sowing 12.11.2008 Manually (By bullock drawn plough)
7. Final layout 13.11.2008 Manually
8. Harvesting 20.04.2009 Manually
9 Threshing and winnowing 29.04.2009 Manually
3.9.4 Irrigation
Five irrigations were given manually to crop.
Irrigation Remarks
Palewa 17.10.2008 Manually
09.11.2008 Manually
I 27.11.2008 Manually
II 18.12.2008 Manually
III 26.01.2009 Manually
IV 24.02.2009 Manually
V 18.03.2009 Manually
3.9.5 Harvesting, threshing and winnowing
The crop was harvested on 20-04-2009 from a net plot size of 03 x
1.8 = 5.4 m2 separately, tied in bundles, tagged and sun dried. Thereafter,
threshing was done by beating the plants with plants. The pods and stover
were separated by manual winnowing and their yield was recorded.
3.10 Treatment evaluation
3.10.1 Nodule study
3.10.1.1 Number of nodules and weight of nodules at flowering
Five plant randomly selected from each plot, uprooted carefully, the
soil mass embodying the roots of the plants was washed off with water and
total nodules and effective nodules, dry and fresh weight (g) of nodules
were counted separately and the mean value was recorded as number of
total nodules and effective nodules, dry weight and fresh weight of nodules
per plant.
3.10.2 Yield attributing characters
3.10.2.1 Number of pods per plant
The pods of 5 plants of each plots were counted at harvest and the
mean was recorded as number of pods per plant.
3.10.2.2 Number of seeds per pod
The seeds of five randomly selected pods from each plot were
counted and the mean was recorded as number of seeds per pod.
3.10.2.3 Yield
The harvested material from net area of each plot was thoroughly
sun dried and weighed with the help of spring balance.The weight was
recorded as biological yield (kg) per plot.
3.10.2.4 Seed yield
After threshing and winnowing, the clean seeds obtained from each
plot were weighed and the weight recorded as seed yield kg per plot and
than computed as quintal per hectare.
3.10.2.5 Straw yield
The straw yield kg per plot was obtained by subtracting the seed
yield from biological yield per plot which was recorded earlier.
3.10.2.6 Test weight (g)
The 1000 seeds from the seed plots were collected and weighed on
an electronic balance. The weight was recorded as test weight (g).
3.10.3 Plant Analysis
3.10.3.1 Collection of plant samples
Plant samples of grain and straw were taken from each plot of
experimental field at the time of threshing.
3.10.3.2 Protein content in seed
The crude protein content in seed was calculated by multiplying
percent nitrogen content of seed with a factor 6.25 as suggested by Gupta
et al. (1972).
3.10.3.3 Nutrient content
The plant samples at harvest from each plot were collected separately and dried in oven at constant
temperature of 70 0C, until they obtained constant weight. The dried samples were powdered in a grinder having
stainless steel blades to avoid contamination of micronutrients and these samples were used for analysed of
estimation of nitrogen, phosphorus, and potassium content. The results were expressed as per cent content of
nitrogen, phosphorus and potassium using standard method as per Table 3.8.
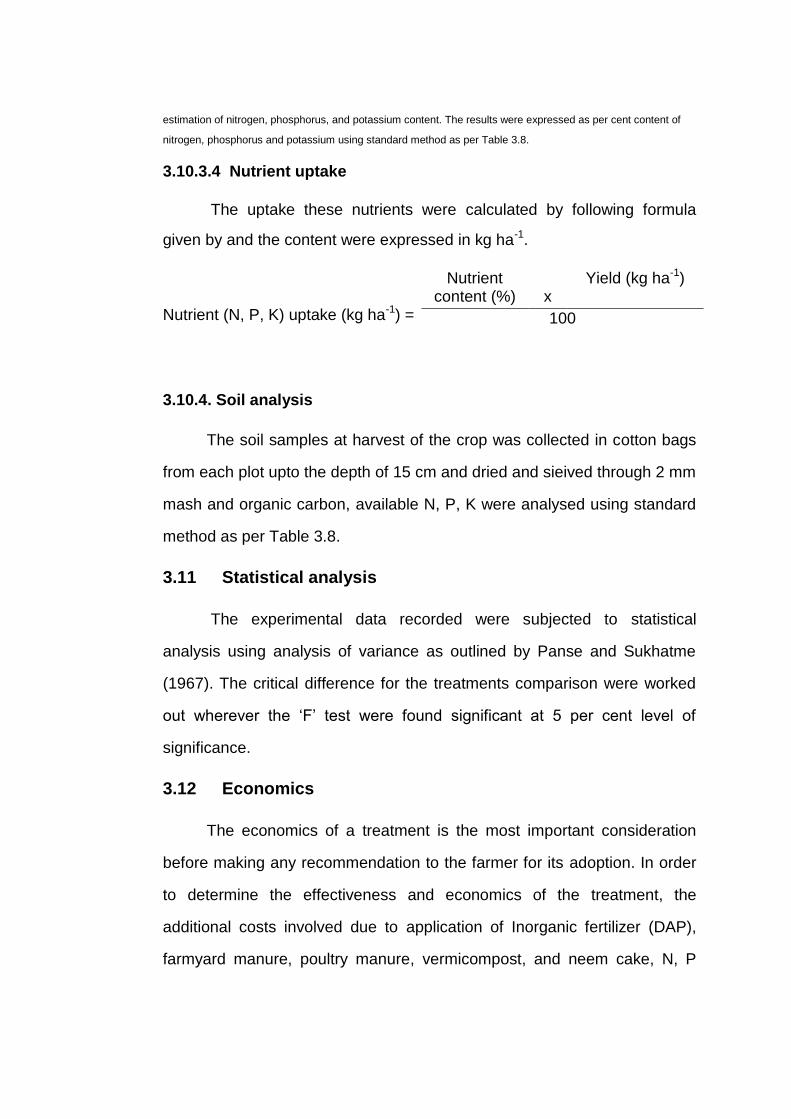
3.10.3.4 Nutrient uptake
The uptake these nutrients were calculated by following formula
given by and the content were expressed in kg ha-1.
Nutrient (N, P, K) uptake (kg ha-1) =
Nutrient content (%)
x
Yield (kg ha-1)
100
3.10.4. Soil analysis
The soil samples at harvest of the crop was collected in cotton bags
from each plot upto the depth of 15 cm and dried and sieived through 2 mm
mash and organic carbon, available N, P, K were analysed using standard
method as per Table 3.8.
3.11 Statistical analysis
The experimental data recorded were subjected to statistical
analysis using analysis of variance as outlined by Panse and Sukhatme
(1967). The critical difference for the treatments comparison were worked
out wherever the „F‟ test were found significant at 5 per cent level of
significance.
3.12 Economics
The economics of a treatment is the most important consideration
before making any recommendation to the farmer for its adoption. In order
to determine the effectiveness and economics of the treatment, the
additional costs involved due to application of Inorganic fertilizer (DAP),
farmyard manure, poultry manure, vermicompost, and neem cake, N, P

and K were taken into account. The net returns from each treatment were
calculated so as to decide the most effective and remunerative treatment.
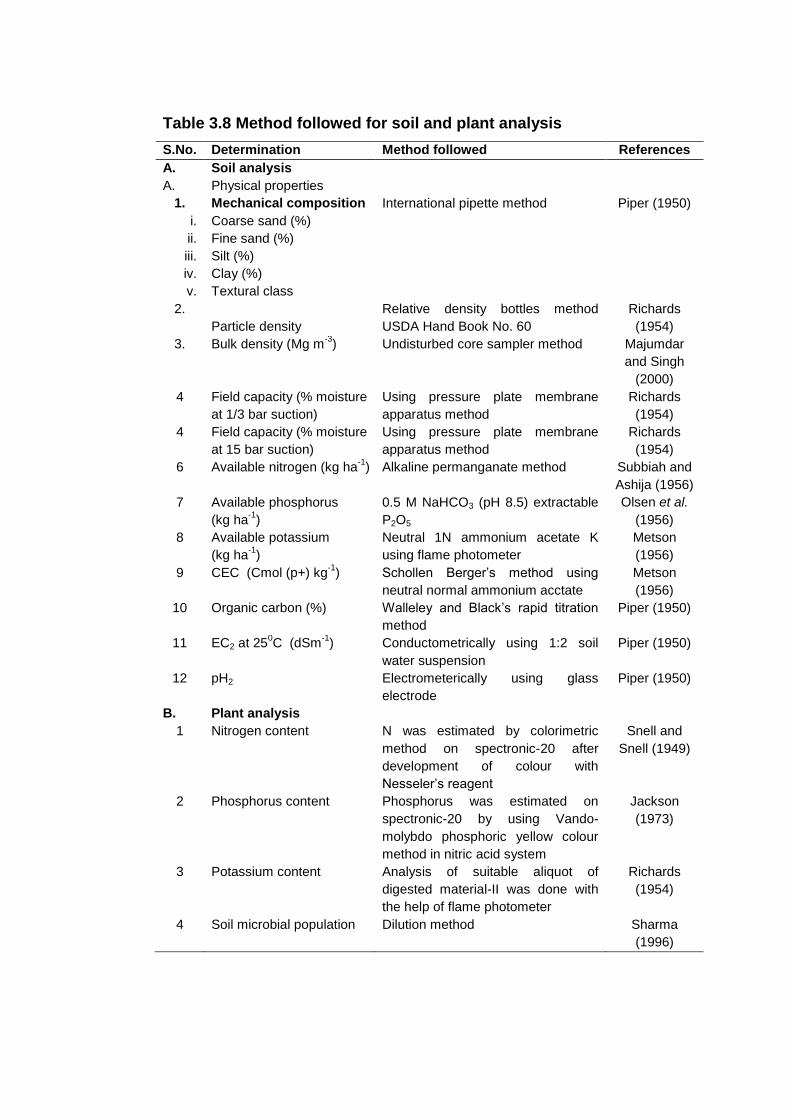
Table 3.8 Method followed for soil and plant analysis
S.No. Determination Method followed References
A. Soil analysis
A. Physical properties
1. Mechanical composition International pipette method Piper (1950)
i. Coarse sand (%)
ii. Fine sand (%)
iii. Silt (%)
iv. Clay (%)
v. Textural class
2.
Particle density
Relative density bottles method
USDA Hand Book No. 60
Richards
(1954)
3. Bulk density (Mg m-3
) Undisturbed core sampler method Majumdar
and Singh
(2000)
4 Field capacity (% moisture
at 1/3 bar suction)
Using pressure plate membrane
apparatus method
Richards
(1954)
4 Field capacity (% moisture
at 15 bar suction)
Using pressure plate membrane
apparatus method
Richards
(1954)
6 Available nitrogen (kg ha-1
) Alkaline permanganate method Subbiah and
Ashija (1956)
7 Available phosphorus
(kg ha-1
)
0.5 M NaHCO3 (pH 8.5) extractable
P2O5
Olsen et al.
(1956)
8 Available potassium
(kg ha-1
)
Neutral 1N ammonium acetate K
using flame photometer
Metson
(1956)
9 CEC (Cmol (p+) kg-1
) Schollen Berger‟s method using
neutral normal ammonium acctate
Metson
(1956)
10 Organic carbon (%) Walleley and Black‟s rapid titration
method
Piper (1950)
11 EC2 at 250C (dSm
-1) Conductometrically using 1:2 soil
water suspension
Piper (1950)
12 pH2 Electrometerically using glass
electrode
Piper (1950)
B. Plant analysis
1 Nitrogen content N was estimated by colorimetric
method on spectronic-20 after
development of colour with
Nesseler‟s reagent
Snell and
Snell (1949)
2 Phosphorus content Phosphorus was estimated on
spectronic-20 by using Vando-
molybdo phosphoric yellow colour
method in nitric acid system
Jackson
(1973)
3 Potassium content Analysis of suitable aliquot of
digested material-II was done with
the help of flame photometer
Richards
(1954)
4 Soil microbial population Dilution method Sharma
(1996)
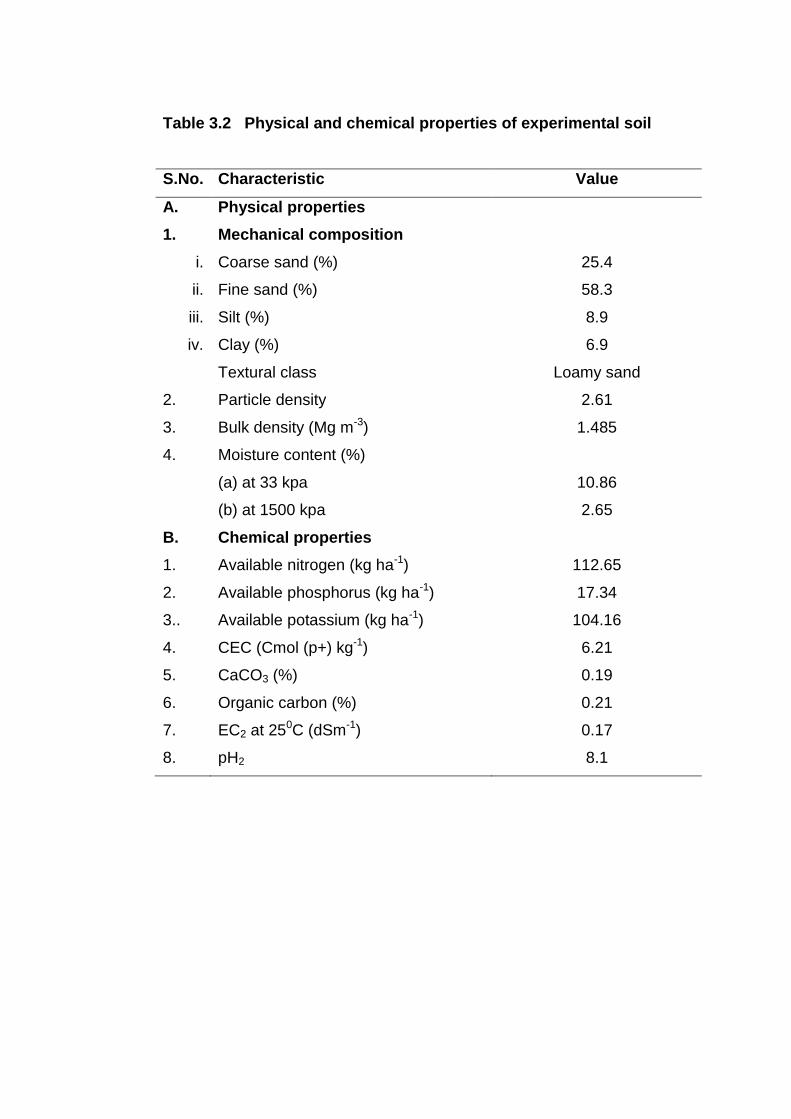
Table 3.2 Physical and chemical properties of experimental soil
S.No. Characteristic Value
A. Physical properties
1. Mechanical composition
i. Coarse sand (%) 25.4
ii. Fine sand (%) 58.3
iii. Silt (%) 8.9
iv. Clay (%) 6.9
Textural class Loamy sand
2. Particle density 2.61
3. Bulk density (Mg m-3) 1.485
4. Moisture content (%)
(a) at 33 kpa 10.86
(b) at 1500 kpa 2.65
B. Chemical properties
1. Available nitrogen (kg ha-1) 112.65
2. Available phosphorus (kg ha-1) 17.34
3.. Available potassium (kg ha-1) 104.16
4. CEC (Cmol (p+) kg-1) 6.21
5. CaCO3 (%) 0.19
6. Organic carbon (%) 0.21
7. EC2 at 250C (dSm-1) 0.17
8. pH2 8.1
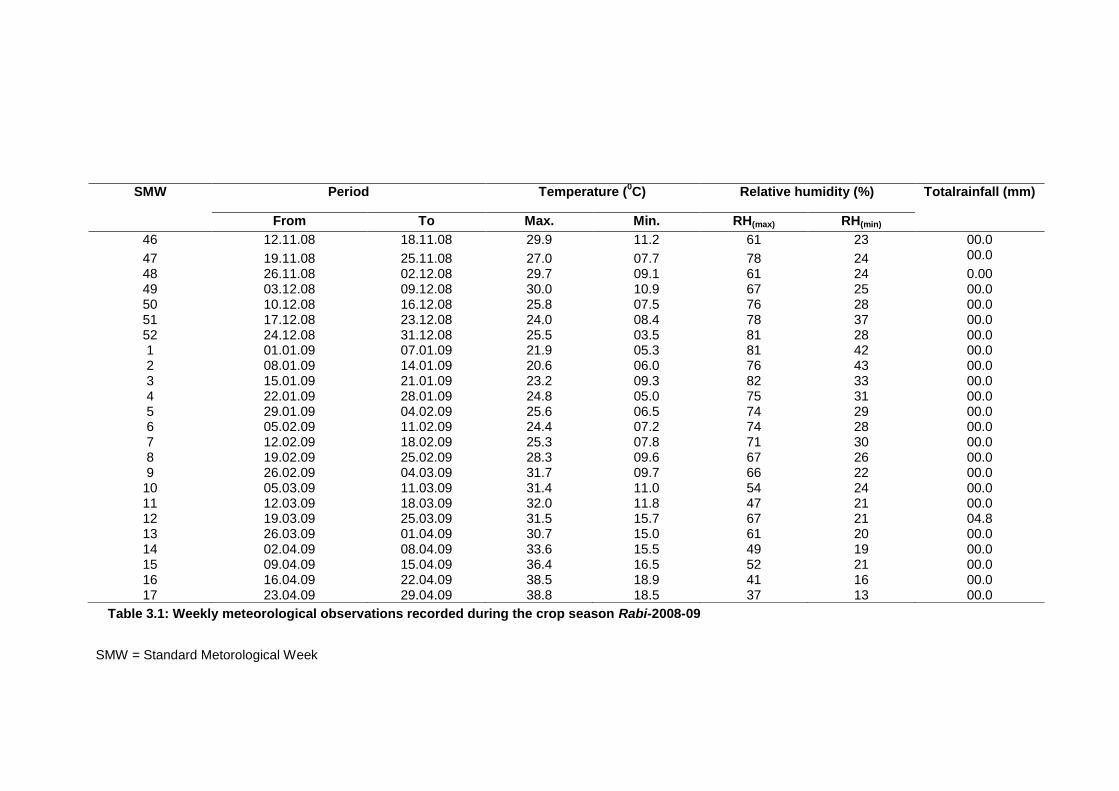
Table 3.1: Weekly meteorological observations recorded during the crop season Rabi-2008-09
SMW = Standard Metorological Week
SMW Period Temperature (0C) Relative humidity (%) Totalrainfall (mm)
From To Max. Min. RH(max) RH(min)
46 12.11.08 18.11.08 29.9 11.2 61 23 00.0
47 19.11.08 25.11.08 27.0 07.7 78 24 00.0
48 26.11.08 02.12.08 29.7 09.1 61 24 0.00 49 03.12.08 09.12.08 30.0 10.9 67 25 00.0 50 10.12.08 16.12.08 25.8 07.5 76 28 00.0 51 17.12.08 23.12.08 24.0 08.4 78 37 00.0 52 24.12.08 31.12.08 25.5 03.5 81 28 00.0 1 01.01.09 07.01.09 21.9 05.3 81 42 00.0 2 08.01.09 14.01.09 20.6 06.0 76 43 00.0 3 15.01.09 21.01.09 23.2 09.3 82 33 00.0 4 22.01.09 28.01.09 24.8 05.0 75 31 00.0 5 29.01.09 04.02.09 25.6 06.5 74 29 00.0 6 05.02.09 11.02.09 24.4 07.2 74 28 00.0 7 12.02.09 18.02.09 25.3 07.8 71 30 00.0 8 19.02.09 25.02.09 28.3 09.6 67 26 00.0 9 26.02.09 04.03.09 31.7 09.7 66 22 00.0
10 05.03.09 11.03.09 31.4 11.0 54 24 00.0 11 12.03.09 18.03.09 32.0 11.8 47 21 00.0 12 19.03.09 25.03.09 31.5 15.7 67 21 04.8 13 26.03.09 01.04.09 30.7 15.0 61 20 00.0 14 02.04.09 08.04.09 33.6 15.5 49 19 00.0 15 09.04.09 15.04.09 36.4 16.5 52 21 00.0 16 16.04.09 22.04.09 38.5 18.9 41 16 00.0 17 23.04.09 29.04.09 38.8 18.5 37 13 00.0
4 EXPERIMENTAL rESULTS
Results of field experiment entitled “Effect of integrated nitrogen management on soil properties and performance of
fenugreek under Typic Ustipsamment” conducted at Agronomy farm, S.K.N College of Agriculture, Jobner (Rajasthan), during rabi
season of 2008-09 are presented in the chapter. The data relating to various criteria used for treatment evaluation were analyzed
statistically using standard statistical methods to test their significance. The analysis of variance for data have been presented in
the appendices at the end. The data recorded for important characters have also been presented graphically for elucidation of the
important trends wherever, necessary.
The experimental findings are presented in under the following appropriate sub headings.
4.1 Yield attributes and yield
4.2 Nutrient content, uptake and quality
4.3 Soil fertility
4.4 Economics
4.1 Yield attributes and yield
4.1.1 Number of pod per plant
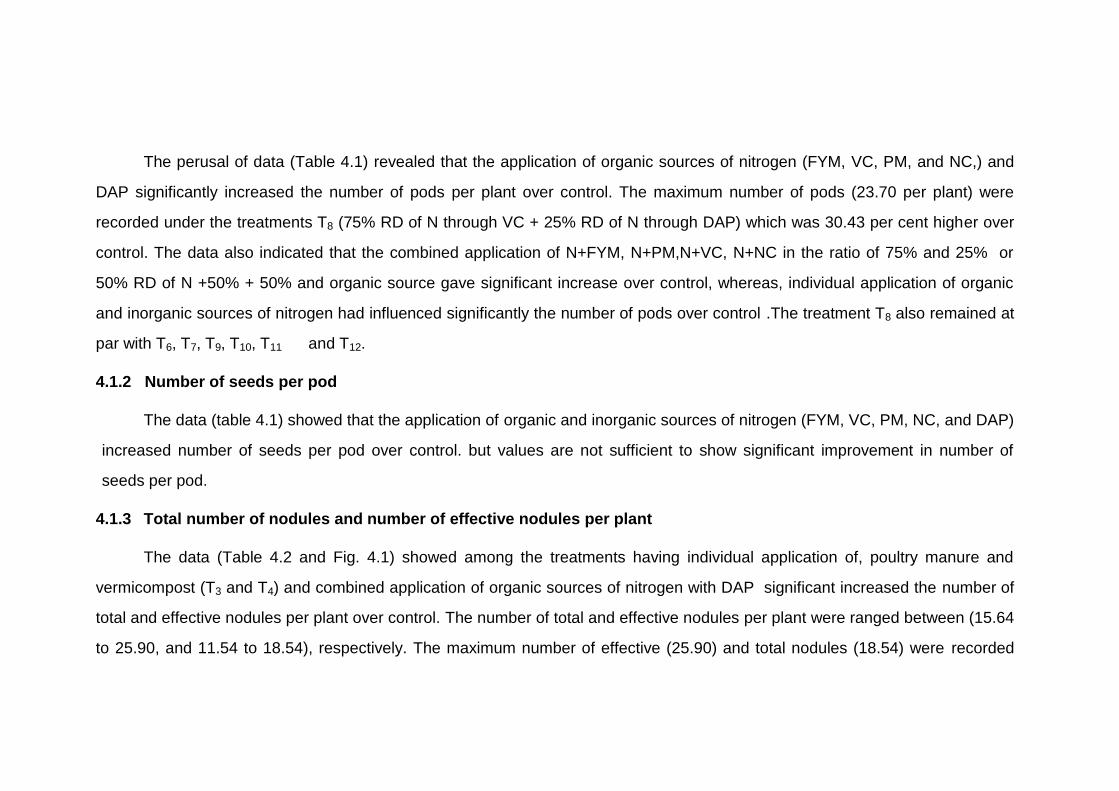
The perusal of data (Table 4.1) revealed that the application of organic sources of nitrogen (FYM, VC, PM, and NC,) and
DAP significantly increased the number of pods per plant over control. The maximum number of pods (23.70 per plant) were
recorded under the treatments T8 (75% RD of N through VC + 25% RD of N through DAP) which was 30.43 per cent higher over
control. The data also indicated that the combined application of N+FYM, N+PM,N+VC, N+NC in the ratio of 75% and 25% or
50% RD of N +50% + 50% and organic source gave significant increase over control, whereas, individual application of organic
and inorganic sources of nitrogen had influenced significantly the number of pods over control .The treatment T8 also remained at
par with T6, T7, T9, T10, T11 and T12.
4.1.2 Number of seeds per pod
The data (table 4.1) showed that the application of organic and inorganic sources of nitrogen (FYM, VC, PM, NC, and DAP)
increased number of seeds per pod over control. but values are not sufficient to show significant improvement in number of
seeds per pod.
4.1.3 Total number of nodules and number of effective nodules per plant
The data (Table 4.2 and Fig. 4.1) showed among the treatments having individual application of, poultry manure and
vermicompost (T3 and T4) and combined application of organic sources of nitrogen with DAP significant increased the number of
total and effective nodules per plant over control. The number of total and effective nodules per plant were ranged between (15.64
to 25.90, and 11.54 to 18.54), respectively. The maximum number of effective (25.90) and total nodules (18.54) were recorded
under the treatment T8 (75% RD of N through VC + 25% RD of N through DAP) which was 65.60 and 60.65 per cent higher over
control, respectively. Whereas it (T8) remain at par with the treatment T6, T7 T9 and T12.
4.1.4 Weight of fresh and dry nodules.
The data pertaining to the fresh and dry weight of nodules (Table 4.2 and Fig. 4.1) indicated that the application of FYM,
VC, PM, NC, and DAP significantly increased the fresh and dry weight of nodules of fenugreek crop over control. Except dry
weight of nodules under 100% RD of NPK (T1). The maximum fresh and dry weight of nodules (5.16 and 2.31 g plant-1)
respectively were observed under treatment T8 (75% RD of N through VC + 25% RD of N through DAP) while the minimum
weights (2.20 and 0.84 g plant-1) were recorded under control T0. The treatment T8 registered significant superiority over rest of
the treatment in increasing fresh and dry weight of nodules but remain at par with T6 T7 and T9 in increasing fresh weight of
nodules and T6 and T7 increasing dry weight of nodules.
4.1.5 Seed yield
The data given in table 4.3 and fig. 4.2 indicated that the individual and combined application of FYM, VC, PM, NC, and
DAP. significantly influenced the seed yield of the crop over control. The treatment T8 registered significant superiority over rest of
the treatment by producing highest seed yield 18.65 q ha-1. Which was 53.87 per cent higher over control, but remain at par with
the treatments with T6, T7, T9, T11 and T12
4.1.6 Straw yield
The data related to straw yield presented in table 4.3 and fig. 4.2 showed that the use of FYM or VC or PM, and combined
application of FYM or PM or VC or NC with DAP significantly increased the straw yield of the crop over control. The highest
straw yield 32.14 q ha-1 was recorded under treatment T8 (75% RD of N through VC + 25% RD of N through DAP) which was
20.50 per cent higher over control and the minimum straw yield 26.67 q ha-1 was recorded under control T0. The treatment T8 was
also recorded at par with T6, T7, T9, T10, T11, T12 and T13.
4.1.7 Seed index
An examination of data in Table 4.3 revealed that the application of nitrogen through FYM, VC, PM, NC and DAP individual
in conjoint application of organic and inorganic sources of nitrogen increased seed index over control. But values were not
sufficient to show significant improvement in seed index of seed.
4.2 Nutrient content, uptake and quality
4.2.1 Nutrient content of seed and straw
4.2.1.1 Nitrogen
The experimental data (Table 4.4) indicated that the nitrogen content of seed and straw was significantly increased with the
combined application of organic and inorganic sources of nitrogen (FYM, VC, PM, and DAP). The highest values of nitrogen
content (3.83 and 1.16 per cent) in seed and straw were respectively recorded under T8 (75% RD of N through VC + 25% RD of N
through DAP), whereas lowest value of nitrogen (2.97 and 0.83 per cent) in seed and straw, respectively was noticed under the T0
(control). Which were 28.95 and 39.75 per cent higher over control respectively. The treatment T8 also remain at par with T7,T9,
,T11, and T12 in increasing nitrogen content in seed and T6,T7,T9T10,T11,T12, and T13 in increasing nitrogen content in straw.
4.2.1.2 Phosphorus
The data in Table 4.4 showed that the combined application of organic and inorganic sources of nitrogen used to
supplement 75% or 50% RD through organic sources only with 25% or 50% RD through DAP Significantly increased the
phosphorus content of seed and straw over control. The phosphorus content of seed and straw ranged between 0.368 to 0.482
per cent and 0.136 to 0.188 per cent respectively. Which were 30.97 and 38.23 per cent higher over control . The treatment T8
also remain at par with T6,T7, T9, T10, T11, T12, T13 and T6, T7, T9, T10, T11, T12 in increasing phosphorus content in seed and straw
both, respectively.
4.2.1.3 Potassium
The data related to potassium content of seed and straw (Table 4.4) revealed that the influence of individual and combined
application of organic and inorganic source of nitrogen (FYM, VC, PM, NC, and DAP) were found to be non-significant in
increasing potassium content of both seed and straw of the crop. Although application of FYM, VC, PM, NC, and DAP show
increasing trend of potassium content in both seed and straw but the values were not sufficient to reach up to the level of
significant in both seed and straw. The potassium content in seed and straw were ranged between 1.37 to 1.47 per cent and 1.88
to 2.15 per cent, respectively.
4.2.2 Nutrient uptake
4.2.2.1 Nitrogen
Nitrogen uptake by fenugreek seed was significantly influenced with the application of FYM, PM, VC, NC, and (Table 4.5
and Fig. 4.3) combined application of organic sources with DAP applied in all ratios. Sole application of VC, and NC and
combined application of organic and inorganic sources used to supply recommended dose N in the organic and inorganic sources
respectively in the ratio of 75% : 25% or 50% :50% significant increased N uptake of straw. The increase in values of N uptake of
seed and straw were recorded 100.30 and 66.15 per cent higher over control under T8 (75% RD of N through VC + 25% RD of N
through DAP) treatment. The values of N uptake of seed and straw were ranged between 35.92 to 71.95 kg ha-1 and 22.34 to
37.12 kg ha-1, respectively . The highest N uptake in both seed and straw were recorded under treatment T8. The treatment T8 also
remain at par with T7T9, and T5, T6, T7, T9, T12 in increasing nitrogen uptake in seed and straw both.
4.2.2.2 Phosphorus
The data in Table 4.5 and Fig. 4.4 showed that the application of 100% RD of N through either FYM, PM, VC, NC or
combined application of FYM, PM, VC, NC with DAP significantly increased phosphorus uptake of seed whereas only 100% RD of
N through PM (T3) and VC (T4) or combined application of any organic sources with DAP significantly increased phosphorus
uptake of straw. The maximum P uptake 8.95 and 6.03 kg ha-1, in seed and straw respectively were recorded under the treatment
T8 (75% RD of N through VC + 25% RD of N through DAP) while minimum P uptake in seed and straw 4.45 and 3.62 kg ha-1
respectively were noticed under T0 (control). The increase in P uptake by seed and straw were 101.12 and 65.57 per cent higher
over control. The treatment T8 also remain at par with T6,T7,T9,T10, T11,T12 for seed and T6,T7,T9,T10, T11 for straw.
4.2.2.3 Potassium
Data (Table 4.5 and Fig. 4.5) indicated that all treatment application of organic or inorganic source of nitrogen FYM, VC,
PM, NC, and DAP individual and in combination significantly increased K uptake of seed and straw of fenugreek over control.
except K uptake straw under T1,T2, and T3 (100% RD of N through DAP or FYM or PM) The highest values of K uptake by seed
and straw were observed 27.39 and 69.10 kg ha-1 under the treatment T8 (75% RD of N through VC + 25% Rd of N through DAP)
which were 65.30 and 37.77 per cent higher over control. The treatment T8 also remain at par with T6,T7,T9,T11, and T12 in
increasing potassium uptake in seed and T6,T7,T9,T10,T11,T12, and T13 in increasing potassium uptake in straw.
4.2.3 Protein content
Experimental data (Table 4.6 and Fig. 4.6) revealed that application 75% RD of N through organic sources (PM, VC and
NC) + 25% of inorganic fertilizer (DAP) or 50% RD of N through any organic sources + 50% N through DAP have significantly
increased the protein content of seed of fenugreek over control. The highest values of protein content 23.94 per cent was
recorded under T8 (75% RD of N through VC + 25% RD of N through DAP) whereas as lowest value of protein 18.56 per cent of
seed respectively was noticed under the to control. The per cent increase in protein content of seed was 28.98 higher over
control. Further more only combined application of organic sources of nitrogen with DAP showed significant effect in increasing
protein content of seed. The treatment T8 was also remain at par with T7,T9,T11, and T12.
4.3 Soil fertility
4.3.1 Available nitrogen
Available nitrogen content of the soil at harvest of the crop was increased significantly with the application of vermicompost
and combined application of organic sources of nitrogen with DAP supplemented dose of nitrogen the fenugreek crop over
control. (Table 4.7) The maximum available nitrogen 142.33 kg ha-1 at harvest of the crop was observed under treatment T8 (75%
RD of N through VC + 25% RD of N through DAP) whereas the minimum available nitrogen 112.65 kg ha-1 was found under T0
(control). The treatment T8 over rest of the treatments and the per cent increase in available N content was 26.34 per cent higher
over control at harvest of the crop. The treatment T8 also remain at par with T6,T7.T9,T10,T11,T12 and T13 in increasing available
nitrogen of soil at harvest of crop.
4.3.2 Available phosphorus
Data (Table 4.7) indicated that the treatment having FYM, VC, PM, NC, and DAP significantly increased the available
phosphorus content of the soil at harvest of the crop over control except T1 (100% RD of N through DAP) The maximum available
phosphorus (26.58 kg ha-1) was observed under T8 (75% RD of N through VC + 25% RD of N through DAP) and the per cent
increase in P content of soil at harvest of the crop was recorded as 53.28 per cent higher over control, whereas minimum
available phosphorus 17.34 kg ha-1 was registered under control. The treatment T8 was also recorded at par with T6 T7 T9T10 and
T11 .
4.3.3 Available potassium
Available potassium content of the soil at harvest of the crop was increased significantly with the application 100% RD of N
through vermicompost (T4) and 75% RD of N through organic sources + 25% of N through DAP and 50% RD of N through organic
sources + 50% of N through DAP (Table4.7).over control. The highest available potassium content in soil at harvest of crop was
133.37 kg ha-1 recorded under treatment (75% RD of N through VC + 25% RD of n through DAP) T8 and lowest values of
available potassium content 104.16 kg ha-1 was recorded under T0 (control) which was 28.04 per cent higher over control. The
treatment T8 also observed at per with T3,T4,T6,T7,T9,T10, T11, and T12 in increasing available potassium of soil at harvest of crop.
4.3.4 Organic carbon
The data presented in Table 4.8 revealed that the highest organic carbon content of the soil 2.88 g kg-1 was recorded under
treatment T2 (100% RD of N through FYM) at harvest of the crop whereas it was lowest organic carbon 1.90 g kg-1 was recorded
under T0 (control). The per cent increase in organic carbon content of soil at harvest of the crop was recorded as 51.57 per cent
higher over control. The treatment T2 also remain at per with T4, T6, and T10, in increasing organic carbon of soil at harvest of crop.
4.3.5 Bulk density
A critical examination of data (Table 4.8) revealed that the individual and combined application of any organic sources
(FYM, PM, VC, NC ) with DAP significantly decreased the bulk density of soil at harvest of fenugreek. The bulk density of soil
varied between 1.538 to 1.453 Mg m-3 respectively. Highest significant decrease in bulk density (5.53%) over control was
recorded with the application of FYM used to supplement 100% RD of (T2) to the crop. The treatments T2 also remained at par
with T3,T4, T5,T6,T7,T8 and T10.
4.3.6 CEC
CEC of the of soil at harvest of the crop increased significantly with the individual and combined application of organic and
inorganic sources of nitrogen supplemented to provide recommended dose of nitrogen in the fenugreek crop over control except
100% RD of nitrogen through DAP (T1) and 50% of RD of N through NC + 50% of RD of N through DAP (T13) (Table 4.8). The
maximum CEC 11.76 cmol (p+) kg-1 was observed under treatment T2 (100% RD of N through FYM) whereas the minimum CEC
6.21 cmol (p+) kg-1 was found under T0 (control). The treatment T2, T3 and T4 also recorded at par.
4.3.7 Available moisture (0.33 bar and –15 bar)
The data indicated that the available moisture of soil at harvest of the crop (Table 4.9) were increased with the application
of FYM, VC, PM, NC, and DAP but the values of available moisture at harvest of the fenugreek crop were not sufficient to record
significant differences over control.
4.3.8 Bacterial population at 45 DAS and at harvest
Counts of the bacterial population are presented in Table 4.10 and Fig. 4.7. The application of nitrogen through organic
sources of nitrogen individually or with DAP significantly increased the bacterial population of the soil at 45 DAS and at harvest of
the crop. The maximum value of bacterial population 22.40 x 10¹⁰ kg-1 soil at 45 DAS and 20.30 x 10¹⁰ kg-1 soil at harvest
recorded under treatment T2 (100% RD N through FYM) whereas minimum values of bacterial population 7.40 x 10¹⁰ and 6.0 x
1010 kg-1 soil were recorded under the treatment T1 (10% RD of N through dap ) at 45 DAS and at harvest of the crop respectively.
4.4 Economics
The Table 4.11 and Fig. 4.8 clearly indicated that the application of nitrogen individually and in combination of organic
sources with the DAP significant effect on net returns of fenugreek. Highest net return and B:C of Rs. 41983 were and 2084 were
recorded under the treatment T8 (75% RD of N through VC+ 25% RD of N through DAP) respectively and followed by T7 (75% RD
of N through VC + 25% RD of N through DAP) by obtaining the net return values and B:C ratio Rs. 38405 and respectively.
5 DISCUSSION
During the course of presenting the results of the experiment entitled “Effect of integrated nitrogen management on soil
properties and performance of fenugreek under Typic ustipsamment ” in the preceding chapter, significant variations in the criteria
used for treatment evaluation have observed and are being discussed in this chapter.
5.1 Effect of FYM, VC, PM, NC, and DAP on nodules
Number of total nodules and effective nodules weight of fresh and dry nodules (Table 4.2 and Appendix-II) were
significantly influenced with application of poultry manure (T3), vermicompost (T4) and combined application of organic sources of
nitrogen with DAP. Significantly highest number of total and effective nodules, weight of fresh and dry nodules, were observed
under the treatment T8 (75% RD of N through vermicompost +25% RD of N through DAP .
Legumes are known to have symbiotic association with heterotrophic soil bacteria and contribute towards the nitrogen
nutrition of legumes host plant especially at later stage of crop growth after the nodules have developed and are functional. The
infection of bacteria and subsequent development of effective nodules as the results of several consecutive physiological and
metabolic interactions. One of the foremost important requirement to have successful infection is the presence of sufficient number
of viable infective cells of rhizobia for infection to root hairs, which depends on the physical and chemical properties of soil,
presence of cells in the soil, their viability and multiplication in the Rhizophere after the germination of seed and are governed by
physical, chemical and biological properties of the soil. The level of success of infection also depends on the competitive ability of
inoculated strain and the health of host.
The application of vermicompost or FYM might have enhanced the population of desired microbes in the root zone during
early stage of infection. Higher population of the desired organisms will always have greater possibilities of infection.
Infection, release of bacterial cells in the cortex, induction of nodule development, synthesis of leghaemoglobin etc. are at
different stages and depend on the genetic and physiological stages of crop plants. Presence of any limiting factor will have
bearing on the nodule mass (Lakshminarayan and Sharma, 1994). Similar findings have also been reported by Negi et al (2007),
and Kausale et al (2009), These results are in agreement with findings of Sharma et al. (2000), and Singh et al (2010) also
reported increased nodulation with improved fertility.
5.2 Yield attributes and yield
The nitrogen supplementation through organic sources and DAP individually and in combinations were significantly
increased number of pods per plant and seed yield whereas straw yield significantly influenced with conjoint application of FYM or
VC or PM or NC and DAP. The application of nitrogen @ 75% RD of N through vermicompost+25% RD of N through DAP gave
maximum yield attributes and seed and straw yield of the crop and proved superior to rest of the treatments.
Beneficial effect of organic manures on yield might be due to balanced supply of macro and micro nutrient through out of
the growth period improvement in physical and biological properties of soil (Datt et al 2003).
Such increase in the yield attributes and yield have also reported to be associated with release of macro and
micronutrients during the course of microbial decomposition (Singh and Ram, 1992) Negi et al (2007), and Kausale et al (2009).
Organic matter also source of energy for soil microflora which bring about the transformation of inorganic nutrients present in soil
or applied fertilizers in the readily utilizable form by growing plants (Sharma, 2001). The beneficial response of FYM/
vermicompost on yield attributes and yield might also be attributed to the availability of sufficient amounts of plant nutrients
throughout the growth period and especially at critical growth periods of crops resulting in better uptake, plant vigour and superior
yield attributes (Brar and Pasricha, 1998; Surender Rao and Sitaramaya, 2000 ). These findings corroborate with the results of
Sharma (2001), Singh et al (2005). Subash Chand and D.Ram (2007), Availability of several macro and micro nutrients along
with better physical environment for root growth from these organic sources have also been reported by Satyajeet and
Nanwal,R.K. (2007), Bhat et al, (2007), Sharma et al (2009), and Singh et al. ( 2010 ).
5.3 Nutrient content and uptake of NPK
The experimental data (Table 4.4 & 4.5, Appendix - IV & V) indicated that the nitrogen and phosphorus content and
uptake of seed and straw were significantly increased with the combined application of organic and inorganic sources of nitrogen
(FYM, VC, PM, NC and DAP). Both nutrient concentration and their uptake are important parameters for judging the capacity of
soil to supply available nutrients. However, uptake is more precise parameter as it takes into account the dry matter yield and is
also an indicator of nutrient requirement of the crop and the level of depletion that is being caused (Sharma, 2001).
Increase in N, P and K uptake in seed and straw with combined application of organic and inorganic sources of nitrogen
might be due to enhanced supply of plant nutrients by direct addition and through atmospheric nitrogen fixation (Kaminvar and
Rajagopal, 1993) and solublization of native phosphorus and potassium content of soil (Das et al., 1992) and also by increasing
nutrient use efficiency and better absorption and utilization of nutrient (Lakpale et al., 1999).
The uptake of N and P may also be due to increase in biological yield with the use of vermicompost, poultry manure
and increased microbial population under favorable condition of soil for multiplication.
It is well known fact that the influence of application of one nutrient on the availability of applied nutrients will shift in
equilibrium towards the greater availability in soil solution while the availability of other nutrients depends on factors like
interactions between nutrients, synergistic or antagonistic, changes in rhizosphere conditions and its impact on the nutrient
transformations (More and Ghonsikar, 1988 and Dhillon and Dhillon, 1991).
Increased N and P content might be due to the solubilization effect of organic manures on native nutrients. Solubilization
and releasing of nutrients for longer duration might be reasons for greater availability. Apart from supply of nutrients organic
manures might have increased the availability of these nutrients to the plant as well as improved the soil environment which
encouraged well developed root system resulting in better absorption of water and nutrients and thus resulted into higher yields.
Higher N and P content and their uptake with the use of various organic manures have also been reported by Satyajeet and
Nanwal (2007). Similar findings have also been reported by Kachot et al. (2001), Mesish et al. (2001), Rao et al. (2002), Basu et
al. (2006) Kumar et al (2007), Bhat et al, (2007), and Kumar et al, (2008)
5.4 Protein content
Data presented in Table 4.6 and Appendix-VI shows that protein content of the fenugreek was increased significantly with
the combined application of organic sources of nitrogen (FYM, PM, VC, NC) with DAP. The increase in protein content might be
due to better availability of desired and required quantity of nitrogen in root zone of the crop resulting from its solubilization caused
by the organic acids produced from the decaying of organic matter since protein content is a function of N content in seeds. The
increased uptake of nutrient by fenugreek roots may also be due to mycorrhizal infection, or increased number of effective
nodules which causing increase in the ascribing absorbing area of roots, increased availability of nitrogen resulted from the
integration of inorganic source of nitrogen with organic sources (Ranjit Singh and Ravi, 2004), and enhanced synthesis of protein
facilitated by the supply of growth principles like enzymes and growth regulators received from the manure (Vasanthi and
Subramanian, 2004). The beneficial effect of organic material on protein content was also reported due to increased nitrogen
content in seed by Khiriya et al. (2003) Bhat et al. (2007) Kumar et al, (2007) and Singh et al. (2010). The similar results were also
observed by Chawala et al. (1995) and Negi et al (2009).
5.5 Soil fertility
5.5.1 Available nitrogen
The data presented in Table 4.7 and Appendix-VII show that the available nitrogen content of soil was significantly
influenced with the application of organic source of nitrogen and DAP. Application of 75% RD of N through vermicompost + 25%
RD of N through DAP gave highest significant increase in the available nitrogen content of soil. This might be ascribed due to the
fact that the addition of mineral nitrogen along with organic sources narrowed the C:N ratio of organic manures which enhanced
the role of mineralization and resulted in rapid release of nutrients from the organic carbon (Sheeba and Chellamuthu, 1999),
Kumar et al (2008) and Singh et al (2010).
The results have also indicated that the fenugreek crop might have helped in the increase of available nitrogen content in
the soil at harvest of the crop by atmospheric nitrogen fixation and addition of organic matter on decay of nodules, which degrades
after flowering of the crop. Similar results were also reported by Badanur et al. (1990), Sharma. (2001) and Rao. (2003). Increase
in available nitrogen with the application of vermicompost or farm yard manure might be attributed due to direct addition of
nitrogen to the available pool of the soil nitrogen reported by Sharma et al.(2009)
5.5.2 Available phosphorus
The available phosphorus content in soil influenced significantly (Table 4.7 and Appendix-VII) with the application all
sources of nitrogen and combined application of organic and inorganic sources of nitrogen where as highest significant increase in
available phosphorus content of soil was noticed under the treatment of 75% RD of N through vermicompost + 25% RD of N
through DAP. This was might be attributed due to the enhanced mobility of phosphorus (Varalakshmi et al., 2005). The addition
of phosphorus through vermicompost might have reduced the fixation of phosphorus through the chelation of Ca+2 (Gupta et al.,
1988) and mineralization of organic phosphorus contributing towards its accumulation in the soil and also due to its possible effect
on solublization of organic phosphorus (Yaduvanshi, 1988). The increase in available P content of soil due to the incorporation of
organic manures may be attributed to the direct addition of P as well as solubilization of native P through release of various
organic acids (Sharma et al. 2009) and due to reduced capacity of soil minerals to fix P and increased availability through release
of organic acids (Singh et al 2010) Similar improvement in available P status due to integrated use of manures and fertilizers had
also been noted by (Sharma et al 2005), Similar results have also been reported by Varalakshmi et a, (2005), Kumar et al, (2008),
Singh et al (2008), and Singh et al, (2010) .
5.5.4 Available potassium
Data presented in Table 4.7 and Appendix-VII show that the individual application of VC, and NC and combined application
of organic sources of nitrogen with DAP had significant effect on increasing the available K content of the soil. This is well known
fact that application of organic manures with inorganic fertilizers give better results in improving availability of nutrients. The
application of vermicompost may be ascribed to the reduction of K fixation and release of K due to the interaction of organic
matter with clay besides the direct addition of potassium to available pool of the soil (Tandon, 1987). The beneficial effect of
vermicmpost and farm yard manure on available K status may be ascribed due to direct addition of potassium in the potassium
pool of the soil (Sharma et al., 2009) Similar findings were also reported by Balaguravaiah et al. (2005) Kumar et al. (2008), Singh
et al. (2008) and Singh et al. (2010).
5.5.4 Organic carbon
The organic carbon content of soil (Table 4.8 and Appendix-VIII) increased significantly with the application of FYM, PM,
VC, NC, and DAP. The treatment T2 (100% RD of N through FYM) gave highest significant build up of organic carbon .The
significant increase under organic carbon content in the manurial treatment could be attributed due to the direct addition of the
organic matter in the soil (Swarup, 1991). which might have stimulated the growth and activity of micro-organisms (Babulkar et al.,
2000) and better root growth (Varalakshmi et al., 2005). These results are in line with the findings of Subramanian and Suresh
(2000), Sharma (2001), Yaduvanshi (2001), Sharma et al, (2007), and Sharma et al. (2009) who advocated that application of
FYM is highly essential to apply FYM to maintain higher levels of organic carbon and to reduce apparent density of soil.
5.5.5 Bulk density
The application of nitrogen through organic sources (FYM, PM, VC, NC) and individually in combination of DAP
significantly decreased the bulk density of surface soil at harvest of fenugreek. The application of 100% N through FYM recorded
maximum decrease in the soil bulk density (Table 4.8 and Appendix-VIII). The decrease in the bulk density with the application of
FYM in light textured soils could be due to the fixing of the low density material with dense mineral fraction of the soil (Srikanth et
al., 2000) and also might be due to structural changes and improved pore size (Larson and Clapp, 1984) and good soil
aggregation (Selvi et al., 2005). Decrease in bulk density, increase in porosity and better water conductivity properties of the soil
may also be mainly due to action of gum compounds, polysaccharides and fulvic acid compounds of organic matter on the soil
structure (Manickam, 1993). The findings corroborates with the results of Maheswarappa et al. (1999) and Shrikanth et al. (2000).
5.5.6 Cation exchange capacity
The application of nitrogen through organic sources of (FYM, PM, VC) and conjoint application of organic sources and
DAP used for nitrogen supplementation Table 4.8 and Appendix-VIII were laid significant effect on increasing the CEC of soil. The
significant increase in CEC of the soil might be due to the increase in water holding capacity of a soil which might have provided
higher availability of water to plants and solubility of the nutrients. The increase in solubility of nutrients might have resulted in to
increased CEC of soil (Epstein, 1997). Similarly, Prakash et al. (2002), Sharma (2007) also reported that the organic manured plot
had a relatively higher cation exchange capacity as compared to inorganic fertilized plot.
5.6 Effect of organic and inorganic sources of nitrogen on bacterial population
Data presented in Table 4.10 and Appendix-X shows that bacterial population of the soil at harvest of the fenugreek were
increased significantly with the application of organic and inorganic sources of nitrogen (FYM, PM, VC, NC, and DAP).This
increase in bacterial population of the soil at harvest of the experimental crop might be due to favorable condition of soil
generated with application of organic sources of nitrogen and DAP (Kamlesh et al., 1991, Patil and Varade 1998).
The addition of organics coupled with nitrogen fertilizer might have also exerted a stimulating influence on the
preponderance of bacteria in soil. The importance of easily degradable carbonaceous compounds for the proliferation of
bacteria population in soil were also reported by Mukherjee et al (1990). Similar findings were also reported by Selvi et al
(2004)
5.7 Economics
Application of nitrogen through farm yard manure, vermicompost, poultry manure, neem cake and DAP significantly
increased the net return of fenugreek (Table 4.11 and Appendix-XI). Application of 75% RD of N through vermicompost + 25% RD
of N through DAP (T8) to fenugreek crop gave highest net return. The increase in net return of the crop with the conjoint
application of FYM/ PM/ VC/ NC and DAP might be due to better root proliferation under favourable soil environment, which in
turned into higher uptake and efficient utilization of added nutrients. Balanced and continuous supply of nutrients through out the
crop growth period, might have also resulted into higher production of the fenugreek crop. Besides this, the incorporation of
vermicompost in addition to DAP in nutritional schedule could have been reduced the cost of input. The similar results have also
be reported by Dikshit and Khatik (2002), Kumpawat (2004) and Jat et al. (2006).
6 Summary and conclusion
Results of the field experiment entitled “Effect of integrated nitrogen management on soil properties and performance
of fenugreek under Typic Ustipsamment” presented and discussed in preceding chapter are being summarized and concluded in this
chapter.
6.1 Yield attributes and yield
6.1.1 The application of FYM, PM, VC, NC and DAP gave significant increase in the yield attributes, but the application of T8
(75% RD of N through vermicompost + 25% RD of N through DAP) were found significantly superior in increasing the
number of pods per plant. The treatment T8 remained at par with T6, T7, T9, T10, T11 and T13,
6.1.2 The application of treatment of 75% RD of N through vermicompost + 25% RD of N through DAP was found significantly
superior in increasing the total number and number of effective nodules, fresh and dry weight of nodules of the crop over
rest of treatments.
6.1.3 The treatment application of T8 (75% RD of N through vermicompost + 25% RD of N through DAP) gave significant
increase in seed and straw yield of the crop over rest of the treatment, but also remained at par with treatment T6, T7, T9,
T11, T12 and T6, T7, T9, T10, T11, T12, T13 both seed and straw.
6.2 Nutrient content, uptake and protein content
6.2.1 The individual and combined application of organic and inorganic sources of nitrogen gave significantly higher nitrogen
content and uptake in seed and straw over rest of the treatment.
6.2.2 The highest content and uptake of phosphorus in seed and straw were recorded with the application of treatment T8 (75%
RD of N through vermicompost + 25% RD of N through DAP) over rest of the treatment.
6.2.3 The highest uptake of potassium in seed and straw were recorded under the treatment T8 (75% RD of N through
vermicompost + 25% RD of N through DAP) over rest of the treatment.
6.2.4 The application of 75% RD of N through vermicompost + 25% RD of N through DAP (T8) was gave significantly higher
protein content in seed of the fenugreek crop over the treatment but remained at par with T7, T9, T11 and T12,
6.3 Soil fertility
6.3.1 Significantly higher available nitrogen content of the soil was recorded under the treatment T8 (75% RD of N through
vermicompost + 25% RD of N through DAP) at harvest of crop at par with T6, T7, T9, T10, T11 T12 and T13.
6.3.2 Application of treatment T8 (75% RD of N through vermicompost + 25% RD of N through DAP) was significantly increased
was available phosphorus content of the soil at harvest of crop and followed by T6, T7, T9, T10 and T11.
6.3.3 The highest potassium content of soil was recorded under the treatment T8 (75% RD of N through vermicompost + 25% RD
of N through DAP) over rest of the treatment but it was remained at par with treatment T3, T4, T6, T7, T9, T10, T11 and T13.
6.3.4 The highest organic carbon build up of soil was recorded under the treatment T2 (100% RD of N through FYM) over rest of
the treatment but it was remained at par with treatment T4, T6 and T10.
6.3.5 The treatment application of T2 was decreased significantly the bulk density of soil and remained at par with T3, T4, T5, T6,
T7, T8 and T10.
6.3.6 The significantly higher CEC of soil at harvest of the crop were recorded with application of 100% RD of N through FYM
(T2) but remained at par with treatment T3 and T4.
6.3.7 Application of T2 (100% RD of N through FYM) was significantly increased the counts of the bacterial population of
rhizosphere at 45 DAS and at harvest of crop.
6.4 Net return
6.4.1 The highest net return was recorded under the treatment T8 (75% RD of N through vermicompost + 25% RD of N through
DAP) with B:C ratio of 2.84.
Conclusion
Based on the results summarized above, it is concluded that fenugreek crop needs combined application of organic
sources of nitrogen with DAP. The application of 75% RD of N through vermicompost coupled with 25% RD of N through
DAP has substantial improvement in yield and net return of the crop.
Bibliography
Akbari, K.N., Sutaria, G.S., Hirapara, D.S., Kunjadia, B.A. and Patel, V.N. 2002. Effect of phosphorus fertilization with and without
FYM on groundnut yield and soil fertility under rainfed condition. Legume Research, 25 : 117-120.
Alaoui, S.B. 2000. Trigonella foenum-graecum L. Contributed by FAO. Institut Agronomique et veterinaire Hassan II Morocco.
Anonymous, 2007-08. Vital Agriculture Statistics Directorate of Agriculture, Pant Krishi Bhawan, Jaipur (Rajasthan),
Spices pp. 60.
Babulkar, P.S., Wandile, R.M., Badole, W.P. and Balpande, S.S. 2000. Residual effect of long-term application of FYM and
fertilization on soil properties (Vertisols) and yield of soybean. Journal of the Indian Society of Soil Science, 48 : 89-92.
Badanur, V.P., Poleshi, C.M. and Naik, B.K. 1990. Effect of organic matter on crop yield and physical and chemical properties of
vertisol. Journal of the Indian Society of Soil Science, 38 : 426-429.
Bajpai, R.K., Chitale, S., Upadhyay, S.K. and Urkurkar, J.S. 2006. Long-term studies on soil physico-chemical properties and
productivity of rice-wheat system as influenced by integrated nutrient management in Inceptisol of Chhattisgarh. Journal of
the Indian Society of Soil Science, 54 : 24-29.
Balaguravaiah, D., Adinarayana, G., Pratap, S. and Reddy, T. Yellamandia 2005. Influence of long term use of inorganic and
organic manures on soil fertility and sustainable productivity of rainfed groundnut in Alfisols. Journal of the Indian Society of
Soil Science 53 : 608-611.
Basu, Manisha, Mondhal, Pinaki, Basak, R.K., Basu, T.K. and Mahapatra, S.C. 2006. Effect of cobalt, rhizobium and
phosphobacterium inoculations on yield and nutrient uptake in summer groundnut (Archis hypogaea L.) on Alluvial soils.
Journal of the Indian Society of Soil Science, 54 : 60-64.
Bellakki, M.A. and Badanur, V.P. 1997. Long-term effect of integrated nutrient management on properties of Vertisol
under dryland agriculture. Journal of the Indian Society of Soil Science, 45 : 438-442.
Bellakki, M.A. and Badanur, V.P. 2000. Residual effect of crop residues in conjunction with organics, inorganics and celluloytic
organisms on chickpea grown on vertisol. Journal of the Indian Society of Soil Science, 48 : 393-395.
Bellakki, M.A., Badanur, V.P. and Selty, R.A. 1998. Effect of long term integrated nutrient management on source and
important properties of Vertisol. Journal of the Indian Society of Soil Science, 46 : 176-180.
Bhalla, R.S. and Devi Prasad, K.V. 2008. Neem cke-urea mixed applications increase growth in paddy. Current Science,
94 (8) : 1066.
Bhat Auyoub Mohd, Singh, R. and Kohil, A. 2007. Effect of integrated use of farmyard manure and fertilizer nitrogen with and
without sulphur on yield and quality of Indian mustard. Journal of the Indian Society of Soil Science, 55 (2) : 224-226.
Bhattacharya, R., Prakash, V., Kundu, S., Srivasta, A.K. and Gupta, H.S. 2004. Effect of long-term manuring on soil
organic carbon, bulk density and water retention characteristics under soybean-wheat cropping sequence in
North-Western Himalayas. Journal of the Indian Society of Soil Science 52 : 238-242.
Bhutia, N.K. and Singh, G.D. 1990. Study in yield and water use efficiency of barley in response to moisture regime and source of
nitrogen. Haryana Journal of Agronomy 6, 76.
Brar, and Pasricha, M.S. 1998. Longterm studies on internated use of organic and inorganic fertilizer in maize-wheat-cowpea
cropping system on alluvial soil of Punjab. In : Long term soil fertility management through integrated plant nutrient supply
system, 154-168 pp. Indian Institute of Soil Science, Bhopal.
Chaturvedi, S. and Chandel, A.S. 2005. Influence of organic and inorganic fertilization on soil fertility and productivity of soybean.
Indian Journal of Agronomy 50, 311-313.
Chawala, U.U., Bharad, G.M., Kohle, S.K. and Nagdeve, M.B. 1995. Effect of N and FYM on yield, quality and nitrogen uptake of
summer groundnut under micro sprinkler irrigation. Res. J. Punjabrao Krishi Vidyapeeth 19 : 171-172.
Choudhary, A. 2007. Effect of vermicompost and molybdenum on growth, yield and quality of green ram [Vigna radiata (L.)
Wilczek] growth under loamy sandy soil. M.Sc. (Ag.), Thesis, S.K.R.A.U., Bikaner.
Cisse, L. 1988. Effect of organic matter application on millet and groundnuts on a degraded soil in North Senegal. II.Plant
development and nutrient uptake. Agronomie 5, 411- 417.
Das, M., Singh, B.R., Ram, H. and Prasad, R.N. 1992. Influence of organic manures on native plant nutrient availability
in an acid alfisol. Journal of the Indian Society of Soil Science, 39 : 286.
Das, P.K., Sarangi, D., Jena, M.K. and Mohanty, S. 2002. Response of greengram (Vigna radiata L.) to integrated application of
vermicompost and chemical fertilizers in acid lateritic soil. Indian Agriculture, 46 : 79-87.
Datt, N., Sharma, R.P. and Sharma, G.D. 2003. Effect of supplementary use of farm yard manure along with chemical fertilizer on
productivity and nutrient uptake by vegetable pea (Pisumn sativum var. arvense) and build up of soil fertility in Lahaul
Valley of Himachal Pradesh. Indian Journal of Agricultural Sciences, 73 : 266-268.
Dharade, K.K., Shalkh, A.A., Desal, M.M. and Kamble, R.S. 2009. Effect of organic manures and fertilizers on yield and nutrient
uptake of ginger. Bioinflet, 6 (2) : 173-174.
Dhillon, K.S. and Dhillon, S.K. 1991. Effect of crop resides and phosphorus levels on yield of groundnut and wheat grown in a
rotation. Journal of Indian Society Soil Science, 39 : 104-108.
Dikshit, P.R. and Khatik, S.K. 2002. Influence of organic manures in combination with chemical fertilizers on production, quality
and economic feasibility of soybean in Typic Haplustert of Jabalpur. Legume Research 25, 53-56.
Dixit, K.G. and Gupta, B.R. 2000. Effect of farmyard manure, chemical and biofertilizers on yield and quality of rice (Oryza sativa
L.) and soil properties. J. Indian Soc. Soil Sci., 48 : 773-780.
Dosani, A.A.K., Talashilkar, S.C. and Mehta, V.B. 1999. Effect of poultry manure applied in combination with fertilizer on the yield,
quality and nutrient uptake of groundnut. Journal of the Indian Society of Soil Science, 47 : 166-169.
Epstein, E. 1997. The Science of Composting. Technomic Publishing Co. In., Pennsylvania.
Fisher, R. A. and Yates, F. 1963. Statistical tables, Oliver and Boyd., Edinburgh Tweeddale Court, London.
Gained, S. and Gaur, A.C. 1991. Thermotolerant phosphate solibilzing micro-organism and their interaction with mungbean. Plant
and Soil. 133 : 141-149.
Ghuman, B.S. and Sur, H.S. (2006). Effect of manuring on soil properties and yield of rainfed wheat. Journal of the Indian Society
of Soil Science 54 : 6-11.
Gowda, C., Patil, B.N., Awaknaver, J.S., Ninganur, B.T. and Ravi., H. 2008. Effect of organic manures on growth, seed yield,
quality of wheat. Karnataka Journal of Agricultural Sciences, 21 (3) : 366-368.
Gupta, A.P., Antil, R.S. and Narual, R.P. 1988. Effect of farm yard manure on organic carbon, available N and P content of soil
during different periods of wheat growth. J. Indian Soc. Soil Sci. 36 : 269-273.
Gupta, B.R., Pathak, R.K., Bhan, S. and Singh, A. 1972. Effect of N,P and K on yield, nutrient uptake and quality of Toria Indian J.
Agron. 17 : 88-91.
Ismail, S.; Malewar, G.U.; Rege, V.S. and Yelvikar, N.V. 1998. Influence of FYM and gypsum on soil properties and yield of
groundnut grown in vertisols. Agropedology, 8 : 73-75.
Jackson, M.L. 1973. Soil Chemical Analysis. Prentice Hall of India Pvt. Ltd., New Delhi.
Jain, R.C. and Tiwari, R.V. 2001. Response of soybean to biogas slurry, farm yard manure and nitrogen with
phosphorus. Annals of Plant and Soil Research 3, 41-44.
Jat, G. 2006. Effect of FYM and mineral nutrients on yield of mustard [Brassica juncea (L.) Czern and Coss] and properties of
loamy sand soil. M.Sc. (Ag.) Thesis, S.K.R.A.U., Bikaner.
Jat, N.L., Jain, N.K. and Choudhary, G.R. 2006. Integrated nutrient management in fenugreek (Trigonella foenum-
graecum). Indian Journal of Agronomy, 51 (4) : 331-33.
Joy, P.P., Thomas, J., Mathew, Samud and Skaria, Baby, P. 2002. Effect of spacing and manuring growth, yild and nutrient
content of Alpinia golanga (L.) willd. J. Spics and Aromatic crops, 11 : 22-25.
Kachot, N.A., Malavia, D.D., Solanki, R.M. and Sagaraka, B.K. 2001. Integrated nutrient management in rainy season groundnut
(Archis hypogaea). Indian Journal of Agronomy, 46 : 516-522.
Kaminwar, S.P. and Rajagopal, V. 1993. Fertilizer response and nutrient requirement of rainfed chilles in Andra Pradesh. Fertilizer
News 38, 21-26.
Kamlesh, K., Mishra, M.M., Dhankar, S.S., Kapoor, JK.K. and Gupta, A.P. 1991. Effect of long-term manurical application on
microbial biomass. Journal of the Indian Society of Soil Science, 39: 685-688.
Kausale, S.P., Shinde, S.B., Patel, L.K. and Borse, N.S. 2009. Effect of integrated nutrient management on nodulation, dry matter
accumulation and yield of summer groundnut at south Gujarat conditions. Legume Research, 32 (3) : 227-229.
Khiriya, K.D., Sheoran, R.S. and Singh, B.P. 2000. Growth analysis of fenugreek (Kignella foenum graecum L.) under various
levels of farm yard manure and phosphorus. Journal of Spices and Aromatic Crops. 10 : 105-110.
Khiriya, K.D., Singh, B.P. and Taneja, K.D. 2003. Effect of farmyard manure and phosphorus levels on yield, quality and nutrient
uptake by fenugreek. (Trigonella foenum, graecum L.). Forage Research, 28 : 210-214.
Khoja, J.R. 2004. Effect of sowing time and sources of nitrogen on growth, yield and quality of coriander [Coriandrum sativum
(L.)]. Ph.D. Thesis Rajasthan Agricultural University, Campus-Jobner.
Kumar, A., Thakur, K.S. and Sharma, S. (2005) Integrated nutrient management in maize (Zea mays) - gobhi sarson (Brassica
napus spp. oleifera var. annua) cropping system under rainfed condition. Indian Journal of Agronomy 50, 274-277.
Kumar, B., Gupta, R.K. and Bhandri, A.L. 2008. Soil fertility changes after long-term application of organic manures and crop
residues under rice-wheat system. Journal of the Indian Society of Soil Science, 56 (1) : 80-85.
Kumar, N. and Gautam, R.C. 2004. Effect of moisture conservation and nutrient management practices on growth and yield of
pearlmillet (Pennisetum glaucum) under rainfed conditions. Indian Journal of Agronomy 49 :182-185.
Kumar, N., Singh, R., Mishra, B.N. and Chandra, K.K. 2007. Influence of organic manure, biofertilizer, and nitrogen levels on
nutrients uptake, soil properties and yield of rice. Indian Journal of Fertilizer, 3 (7) : 45-60.
Kumpawat, B.S. 2004. Integrated nutrient management for maize (Zea mays) - Indian mustard (Brassica juncea) cropping system.
Indian Journal of Agronomy 49, 18-21.
Lakpale, R., Pandy, N and Tripathi, R.S. 1999 Effect of levels of nitrogen and preconditioned urea on yield and N status in plant
and soil in rainfed rice. Indian Journal of Agronomy 44, 89-93.
Lakshminarayan, K. and Sharma, P.K. 1994. Molecular biology of nodulation in legume-Rhizobium. In : Nitrogen fixing organisms. EJs. A.B.
Prasad and Vaishamayan, 155-172 pp. Scientific Pubsliher, Jodhpur.
Larson, W.E. and Clapp, C.E. 1984. Organic matter and Rice. IRRI, Los Banos, Laguna, Phillippines. pp 363.
Laxminarayana, K. and Patiram. 2006. Effect of integrated use of inorganic, biological and organic manures on rice productivity
and soil fertility in Ultisols of Mizoram. Journal of the Indian Society of Soil Science 54, 213-220.
Lopes, A.J., Stamford, N.P., Figueredo, M.V.N., Burity, H.A. and Ferraz, E.B. 1996. Effect of application of vermicompost, mineral
nitrogen and mineralizing agents on N2 fixation and yield of cowpea. Reuistva Brasilerade Ciercia- do- Solo. 20: 55-62.
Maheswarappa, H.P., Nanjappa, H.V. and Hegde, M.R. 1999. Influence of organic manures on yield of arrowroot, soil physico-
chemical and biological properties when grown as intercrop in coconut garden. Annals of Agricultural Research 20 : 318-
323.
Majumdar, S.P. and Singh, R.A. 2000. Analysis of soil physical properties. Published by Agrobios (India), Jodhpur.
Manickam, T.S. 1993. Organics in soil health and crop production (ed. P.K. Tharapan) Peekay Tree Crops Devlopment
Foundation Cochin. pp. 87-104.
Masih, M.R., Chandradeo and Pareek, D.K. 2001. Studies on utilization of composted HGRP in groundnut crop growth on loamy
sand soils. PROM review 2001. Organized by Phosphate Research and Development Centre, Rajasthan State Mines and
Mineral Ltd., Udaipur, pp. 65-68.
Masood Ali and Mishra, J.P. 2000. Nutrient management in pulses and pulse based cropping systems. Fertilizer News, 45 : 59-69.
Mathur, K. 2000. Effect of Rhizobium inoculation and various sources of nitrogen on growth and yield of summer green gram
(Vigna radiata L.) M.Sc. Thesis, CCS HAU, Hisar.
Mathur, K., Singh, V.P. and Singh, B.P. 2003. Effect of source of starter nitrogen and rhizobium inoculation of grain yield and
economics of summer moongban cultivation. Crop Research, 4 : 180-189.
Meena, R.P. 1995. Response of barley (Hordium vulgare L.) to level of nitrogen and FYM with and without growth regulator. M.Sc.
(Ag.) Thesis, Rajasthan Agricultural University, Campus-Jobner.
Metson, A.J. 1956. Methods of chemical analysis for soil survey samples. Bull. No. 2 Deptt. Sci., Md. Res. Soil Bur. 12.
More, S.D. and Gnosikar, C.P. 1988. Effect of some organic manures oin the availability of phosphorus to wheat. Journal of the
Indian Society of Soil Science,36 : 373-374.
Mukherjee, D., Ghosh, S.K. and Das, A.C. 1990. A study on the chemical and microbiological changes during the decomposition
of straw in soil. Indian Agriculture, 34 : 1-10.
Negi, S., Dwivedi, G.K. and Singh, R.V. 2007. Integrated nutrient management through biofertilziers, fertilizers organic manure
and lime for vegetable pea in an acid inceptisol of cool temperate region of Uttraanchal. Legume Research, 30 (1) : 37-40.
Nehra, A.S. and Grewal, K.S. 2001. Influence of integrated use of organic manures and inorganic fertilizer on soil properties and
yield of wheat. International Conference on Natural Farming and Ecological Balance, CCS HAU, Hisar, India March 7-10,
pp. 155.
Nethra, N.N., Jayaprasad, K.V. and Rodha, D. Kale 1999. China aster [Callistephus chinensis (L.) Ness] cultivation using
vermicompost as organic amendment. Crop Research 17 : 209-215.
Netwal, L.C. 2003. Effect of FYM and vermicompost on nutrient uptake and quality of cowpea [Vigna unguiculata (L.) Walp.]
grown under saline conditions. M.Sc. (Ag.) Thesis, RAU, Bikaner.
Olsen, S.R., Cole, C.V., `Watanbe, P.S. and Dean, I.A. 1956. Estimation of available phosphorus in soils by extraction
with sodium carbonate, USDA Circ., 939.
Panse, V.G. and Sukhatme, P.V. 1967. Statistical Methods for Agricultural Workers. ICAR, New Delhi.
Patil, A.B. and Varade, P.A. 1998. Microbial population in Rhizospere as influenced by high inputs rates of fertilizer application to
sorghum on a vcertical. Journal of the Indian Society of Soil Science, 46 (2) : 223-227.
Patil, B.S., Amin, A.U. and Patel, K.P. 2004. Response of cumin (Cuminum cyminum) to integrated nutrient management. Indian
Journal of Agronomy 49 : 205-206.
Piper, C.S. (1950) Soil and Plant Analysis. Inter Science Publishers, New York.
Prakash, Y.S., Bhadoria, P.B.S. and Rakhit A. 2002. Comparative efficacy of organic manures on the changes in soil properties
and nutrient availability in an Alfisoil. Journal of the Indian Society of Soil Science 50 : 219-221.
Rajkhowa, D.J., Saikia, M. and Rajkhowa, K.M. 2002. Effect of vermicompost with and without fertilizer on green gram. Legume
Research, 25 : 295-296.
Rajkhowa, D.J., Saikia, M. and Rajkhowa, K.M. 2003. Effect of vermicompost and levels of fertilizer on greengram. Legume
Research, 26 : 63-65.
Ramamurthy, V. and Shivashankar, K. 1995. Effect of organic matter and phosphorus on quality and nutrient uptake by soybean.
Journal of Oilseed Research,12, 87-90.
Ramesh, P., Singh, Mohan, Panwar, N.R., Singh, A.B. and Ramana, S. 2006. Response of pigonpea verities to organic manures
and their influence on fertility and enzyme activity of soil. Journal of the Indian Society of Soil Science, 76 : 252-254.
Ranjit Singh and Ravi, K.K. 2004. Yield attributes, yield and quality of soybean (Glycine max) as influenced by integrated nutrient
management. Indian Journal of Agronomy, 49 : 271-274.
Rao, S.S. 2003. Nutrient balance and economics of integrated nutrient management in groundnut (Arachis hypogaea L.) -mustard
(Brassica juncea L.). Madras Agricultural Journal, 90 : 465-471.
Rao, S.S. and Shaktawat, M.S. 2001. Effect of organic manure, phosphorus and gypsum on growth, yield and quality of groundnut
(Archis hypogaea L.). Indian Journal Plant Physiology, 6 : 306-311.
Rao, S.S. and Shaktawat, M.S. 2002. Effect of organic manure, phosphorus and gypsum on groundnut (Arachis hypogaea)
production under rainfed condition. Indian Journal of Agronomy, 47: 234-241.
Reddy, K., Sriniwas Mahesh, and Uma, P. 1995. Effect of vermicompost on soil properties and greengram nutrition 60th. Annual
Convention, ISSS, pp. 157.
Richard, L.A. (Ed.) 1954. Diagnosis and improvement of saline and alkali soils. USDA Hand book No. 60, Washington, DC, USA.
Richard, L.A. 1947. Pressure membrane apparatus, Construction and use. Agriculture Engineer 28, 451-455.
Roul, P.K. and Sarawgi, S.K. 2005. Effect of integrated nitrogen nutrition techniques on yield, N content, uptake and use efficiency
of rice (Oryza sativa). Indian Journal of Agronomy 52 : 129-131.
Rubapathi, K., Rangasamy, A. and Chinnusamy, C. 2002. Effect of integrated nutrient management in sorghum based
intercropping system. Journal of Ecobiology,14, 195-199.
Saran, R.N. ad Sharma, R.A. 1994. Influence of conjunctive use of organic and fertilizer nutrients on nutrient uptake and productivity of
soybean. National Seminar on development in Soil Science, IARI, New Delhi, Nov. 28-Dec. 1, pp 324-325.
Satyajeet and Nanwal, R.K. 2007. Integrated nutrient management in pearl millet-mustard cropping system. Indian Journal of
Fertilizers, 3 (4) : 59-62.
Saxena, S.C. and Chandel, A.S. 1997. Effect of micronutrients on yields, nitrogen fixation by soybean (Glycine max) and organic carbon
balance in soil. Indian Journal of Agronomy, 42 : 329-332.
Selvi, D., Santhy, P. and Dhakshinamoorthy 2005. Effect of inorganic alone and in combination with farm yard manure on physical
properties and productivity of Vertic Haplustepts under long term fertilization. Journal of the Indian Society of Soil Science,
53 : 302-307.
Selvi, S., Santhy, P., Dhakshinamoorty, M. and Maheswari, R. 2004. Microbial population and biomass in Rhizospheric as
influenced by continuous intensive cultivation fertilization in an inceptisol. Journal of the Indian Society of Soil Science, 52
(3) : 254-257.
Sharma, M.P., Bali, S.V. and Gupta, D.K. 2000. Crop yield and properties of Inceptisol as influenced by residue
management under rice-wheat cropping sequence. Journal of the Indian Society of Soil Science, 8, 506 - 509.
Sharma, N., Srivastava, L.L. and Mishra, B. 1983. Studies on microbial changes in soil as a results of continuous application of
fertilizers, farm yard manure and lime. Journal of the Indian Society of Soil Science, 31 : 202-206.
Sharma, P.D. 1996. Methods of control of plant diseases. Microbiology and Plant Pathology, Rastogi Publication, Meerut
(UP).
Sharma, P.K., Mishra, B., Singh, Y.H. and Chaudhary, D.C. 2000. Impact of different methods of crop residue management on
soil fertility and productivity of rice-wheat system. In : Proc. Intern. Conf. On Managing Natural Resources for Sustainable
agricultural Production in the 21st Century, New Delhi, 3 : 894-895.
Sharma, R.A. 1992. Influence of integrated fertility management on productivity and water use efficiency of rainfed soybean. Crop
Research, 5 : 52-58.
Sharma, R.P., Datt, N. and Chander, G. 2009. Effect of vermicompost, farm yard manure and chemical fertilizers on yield, nutrient
uptake and soil fertility on okra (Abelmoschus esculentus), onion (Allium cepa), sequence in wet temperate zone of
Himachal Pradesh. Journal of the Indian Society of Soil Science, 57 (3) : 357-361.
Sharma, R.P., Datt, N. and Sharma, P.K. 2003. Combined application of nitrogen, phosphorus, potassium and farmyard manure
in onion (Allium cepa) under high hills, dry temperate conditions of north-western Himalayas. Indian Journal of Agriculture
Sciences, 73 : 225-227.
Sharma, R.P., Sharma, A. and Sharma, J.K. 2005. Productivity nutrient uptake soil fertility and economics as affected by chemical
fertilizers and farm yard manure in broccoli (Brassica oleracea var. italica) in an entisol. Indian Journal of Agriculture
Sciences, 75 : 576-579.
Sharma, S.R. 2001. Effect of organic manure and mineral nutrients on symbiotic efficiency, growth and yield of cowpea, in
cowpea-wheat sequence, Ph.D. Thesis, Rajasthan Agricultural University, Bikaner.
Sheeba, S. and Chellamuthu 1999. Long term influence of organic and inorganic fertilization on the macro-nutrient status of
inceptisols. Journal of the Indian Society of Soil Science, 47 : 803-804.
Shikha, J., Khaddar, V.K., Choudhary, S.K., Phadnis, S. and Rachna, N. 2004. Effect of organic and chemical fertilizers on the
growth, yield attributes and yield of soybean-wheat cropping sequence. Research and Crops, 5 : 22-30.
Singh, Amar and Meena, N.L. 2004. Effect of nitrogen and sulphur on growth, yield attributes and seed yield of mustard (Brassica
juncea) in eastern plains of Rajasthan. Indian Journal of Agronomy 49, 186-188.
Singh, F., Kumar, R. and Pal, S. 2008. Integrated nutrient management in rice-wheat cropping system for sustainable productivity.
Journal of Indian Society of Soil Science, 56 (2) : 205-208.
Singh, G.R., Parihar, S.S., Chaure, N.K., Choudhary, K.K. and Sharma, R.B. 1997. Integrated nutrient management in summer
sesame (Sesamum indicum). Indian Journal of Agronomy, 42 : 699-701.
Singh, H., Singh, O.P., Singh, S. and Prasad, K. 2010. Effect of INM on yield and economics of lentil and its residual effect on rice
in rainfed conditions. Indian Journal of Fertilizers, 6 (3) : 45-48.
Singh, M. and Yadav, B.L. 2007. Effect of organic materials and zinc on yield of wheat and soil properties under high RSC water.
Annals of Plant Soil and Research, 9 : 47-49.
Singh, M.V. 1999. Current status of micro and secondary nutrients deficiencies and crop response in different agro-ecological
regions. Experiments of AICRP on micro and secondary nutrients and pollutant elements in soil and plants. Fertilizer News,
GCl : 63-82.
Singh, N.B. and Verma, K.K. 2002. Response of frenchbean (Phascolus vulgaris) to application of organics and in organics in
eastern Uttar Pradesh. Indian Journal of Agronomy, 47 : 81-85.
Singh, P.N. and Ram, H. 1992. Effect of phosphorus and sulphur on concentration and uptake of micronutrients in chickpea.
Journal of the Indian Society of Soil Science, 40 : 307-312.
Singh, R. and Rai, S.K. 2004. Yield attributes, yield and quality soybean (Glycine max) as influenced by integrated nutrient
management. Indian Journal of Agronomy, 49 : 271-274.
Singh, R.K., Kumarjit, A., Singh, H., Changte, Z. and Singh, N. G. 2005. Integrated management of Azolla, vermicompost and
urea on yield of and nutrient uptake by rice and soil fertility. Journal of the Indian Society of Soil Science, 53 : 107-110.
Singh, S., Mehta, A.K. and Thakral, S. 2005. Yield attributes and yield of wheat as affected by vermicompost and inorganic
fertilizers. Harayana Journal of Agronomy, 21 (1) : 88.
Singh, S., Singh, R.N., Sarkar, A.K. and Prasad, S. 2010. INM for higher productivity of rice-pea cropping system. Indian Journal
of Fertilizers, 6 (2) : 43-46.
Sinha, S.K., Singh, V.N. and Singh, K.P. 1997. Effect of continuous use of fertilizers on physical and physico-chemical properties
of an alluvial soil. Journal of Research Birsa Agricultural University, 9 : 31-34.
Snell, F.D. and Snell, C.T. 1949. Colorimetric Methods of Analysis. 3rd Ed. Vol. ll, Van Nostrand Inc., New york.
Srikanth, K., Srinivasamurthy, C.A., Siddaramappa, R. and Ramakrishna, P.V.R. (2000) Direct and residual effect of
enriched composts, FYM, vermicompost and fertilizers on properties of an Alfisol. Journal of the Indian Society of
Soil Science 48, 496 - 499.
Stangel, P.J. 1991. Presentation in the International Workshop on Evaluation for Sustainable Land Management in the Developing
World, Chiongrai, Thailand.
Subbiah, B.V. and Asija, G.L. 1956. A rapid procedure for the estimation of available nitrogen in soils. Current Science,
25 : 259-60.
Subhash Chand and Ram, D. 2007. Effect of integrated nutrient management on yield and nutrient use efficiency in mustard.
Indian Journal of Fertilizers, 3 (5) : 51-54.
Subramanian, S. and Kumar, V.M. 2001. Effect of various levels of nitrogen and Azospirillum on growth and yield of coriander
(Coriandrum sativum L.). South Indian Horticulture, 49 : 191-194.
Subramanian, S. and Suresh, S. 2000. Long-term effect of fertilizer and manure application on soil fertility and yield of cotton-
sorghum rotation in a Typic Chromustert under dry farming. In : Proc. Intern. Conf. Managing Natural Resources for
Sustainable Agricultural Production in the 21st Century, New Delhi, 3 : 1408-1469.
Surender Rao, S. and Sitaramaya, M. 2000. Performance of alternate organic nitrogen sources in an Inceptisol under rice. In:
Proceedings of International Conference Managing Natural Resources for Sustainable Agricultural Production in the 21st
Century, New Delhi 3, 1464-1465.
Swarup, A. 1991. Long-term effect of green manuring (sesbania aculeate) on soil properties and sustainability of rice and wheat
yield on a sodic soil. Journal of the Indian Society of Soil Science, 39 : 777-780.
Swarup, A. and Wanjari, R.H. 2000. Three decades of All India Co-ordinated Research Project on long term fertilizer experiment
to study, changes in soil quality crop productivity and sustainability. Indian Institute of Soil Science, Bhopal, India, 59 p.
Talashikar, S.C. and Chavan, A.S. 1996. Response of groundnut to calcium, sulphur and boron with and without FYM on
inceptisol. Journal of the Indian Society of Soil Science, 44 : 343-344.
Tandon, H.L.S. 1987. Phosphorus research and agricultural production in India, FDCO, New Delhi.
Tandon, H.L.S. 1992. Fertilizers and their integration with organic and biofertilizers. In : fertilizers organic manure, recyclable
wastes and biofertilizers. Ed. H.L.S. Tandon, 12-36 pp. Fertilizer development and consultation organization, 204-204A,
Bhanot Corner, New Delhi.
Tripathi, Sanjeev and Tiwari, R.C. 2006. Response of Rice and wheat to addition of woolen carpet wastes, sulphinated pressmud
and urban digested sludge. Journal of the Indian Society of Soil Science 54, 96-100.
Vadiraj, B.A., Siddagen Gaiah and Potty, S. Narayana 1998. Response of coriander (Corinandrum sativum L.) cultivars to graded
levels of vermicompost. Journal of Spices and Aromatic Crops, 7 : 141-143.
Varalakshmi, L.R., Srinivasamurthy, C.A. and Bhaskar, S. 2005. Effect of integrated use of organic manures and inorganic
fertilizers on organic carbon, available N, P and K in sustaining productivity of groundnut-fingermillet cropping system.
Journal of the Indian Society of Soil Science, 53 : 315-318.
Vasanthi, D. and Kumarasamy, 1999. Efficacy of vermicompost to improve soil fertility and rice yield. Journal of the Indian Society
of Soil Science, 47 : 268-272.
Vasanthi, D. and Subramanian, S. 2004. Effect of vermicompost on nutrient uptake and protein content in black gram (Cicer
arietinum). Legume Research, 27 : 293-295.
Vimje, P.A. and Seth, J. 1988. Effect of phosphorus and FYM on nutrient uptake by soybean. Indian Journal of Agronomy, 33 :
139-142.
Yadav, R.D. 2001. Response of isabgol (Plantogo ovata Forsk) to nitrogen and sulphur management. M.Sc. (Ag.) Thesis,
Rajasthan Agricultural University, Bikaner, Campus-Jobner.
Yadav, R.S., Yadav, P.C. and Dhama, A.K. 2003. Integrated nutrient management in wheat (Triticum aestivum)-mungbean
(Phaseolus radiatus) cropping sequence in arid region. Indian Journal of Agronomy, 48 : 23-26.
Yaduvanshi, N.P.S. 2001. Effect of five years of rice wheat cropping and NPK fertilizer use with and without organic and green
manures on soil properties and cop yields in a reclaimed sodic soil. Journal of Indian Society of Soil Science, 49 : 714-719.
Zarate, N.A.H., Vieira, M. Doc. and Cahecas, J.O. 1997. Lettuce yield as affected by rates and method of application of semi-
decomposed poultry manure. Horticulture Btassilarians, 15 : 65-67.
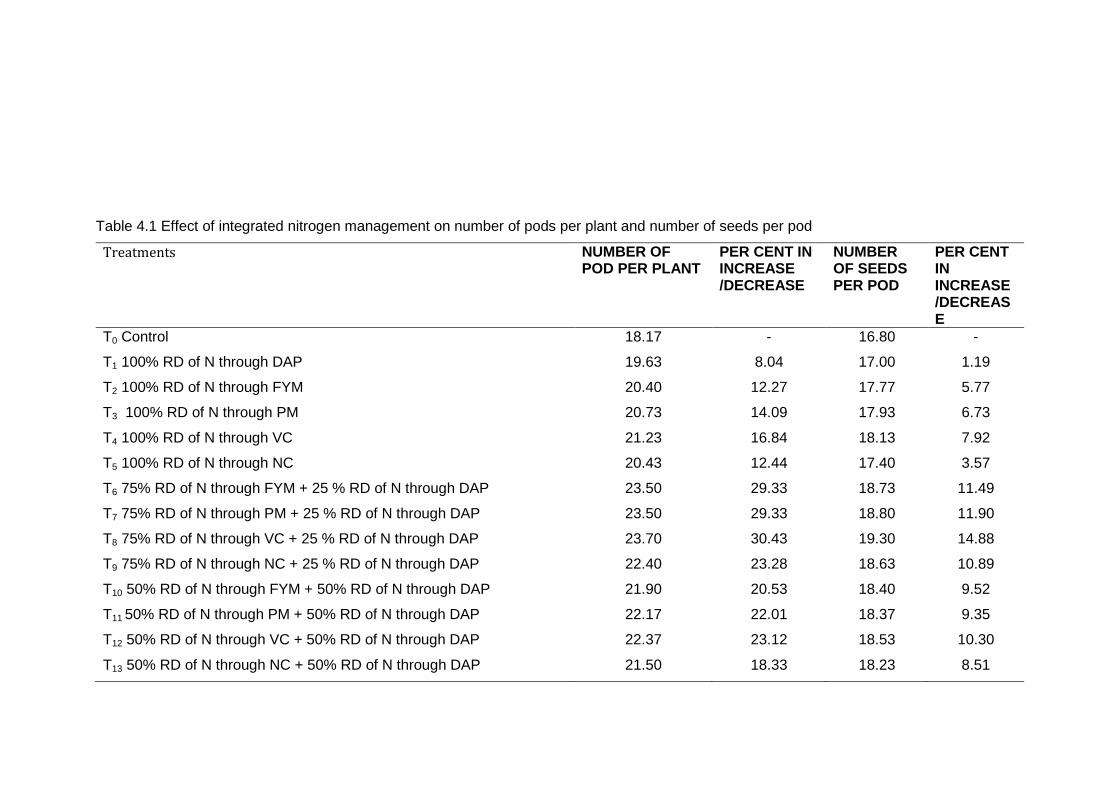
Table 4.1 Effect of integrated nitrogen management on number of pods per plant and number of seeds per pod
Treatments NUMBER OF POD PER PLANT
PER CENT IN INCREASE /DECREASE
NUMBER OF SEEDS PER POD
PER CENT IN INCREASE /DECREASE
T0 Control 18.17 - 16.80 -
T1 100% RD of N through DAP 19.63 8.04 17.00 1.19
T2 100% RD of N through FYM 20.40 12.27 17.77 5.77
T3 100% RD of N through PM 20.73 14.09 17.93 6.73
T4 100% RD of N through VC 21.23 16.84 18.13 7.92
T5 100% RD of N through NC 20.43 12.44 17.40 3.57
T6 75% RD of N through FYM + 25 % RD of N through DAP 23.50 29.33 18.73 11.49
T7 75% RD of N through PM + 25 % RD of N through DAP 23.50 29.33 18.80 11.90
T8 75% RD of N through VC + 25 % RD of N through DAP 23.70 30.43 19.30 14.88
T9 75% RD of N through NC + 25 % RD of N through DAP 22.40 23.28 18.63 10.89
T10 50% RD of N through FYM + 50% RD of N through DAP 21.90 20.53 18.40 9.52
T11 50% RD of N through PM + 50% RD of N through DAP 22.17 22.01 18.37 9.35
T12 50% RD of N through VC + 50% RD of N through DAP 22.37 23.12 18.53 10.30
T13 50% RD of N through NC + 50% RD of N through DAP 21.50 18.33 18.23 8.51
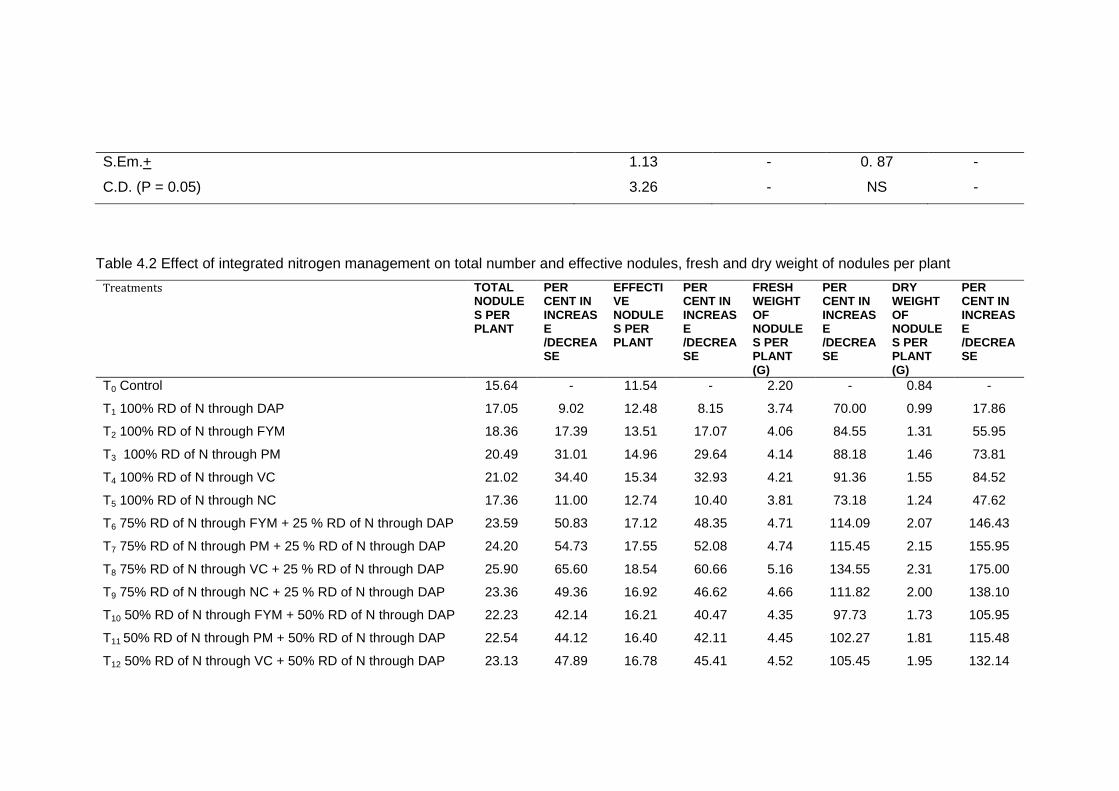
S.Em.+ 1.13 - 0. 87 -
C.D. (P = 0.05) 3.26 - NS -
Table 4.2 Effect of integrated nitrogen management on total number and effective nodules, fresh and dry weight of nodules per plant
Treatments TOTAL NODULES PER PLANT
PER CENT IN INCREASE /DECREASE
EFFECTIVE NODULES PER PLANT
PER CENT IN INCREASE /DECREASE
FRESH WEIGHT OF NODULES PER PLANT (G)
PER CENT IN INCREASE /DECREASE
DRY WEIGHT OF NODULES PER PLANT (G)
PER CENT IN INCREASE /DECREASE
T0 Control 15.64 - 11.54 - 2.20 - 0.84 -
T1 100% RD of N through DAP 17.05 9.02 12.48 8.15 3.74 70.00 0.99 17.86
T2 100% RD of N through FYM 18.36 17.39 13.51 17.07 4.06 84.55 1.31 55.95
T3 100% RD of N through PM 20.49 31.01 14.96 29.64 4.14 88.18 1.46 73.81
T4 100% RD of N through VC 21.02 34.40 15.34 32.93 4.21 91.36 1.55 84.52
T5 100% RD of N through NC 17.36 11.00 12.74 10.40 3.81 73.18 1.24 47.62
T6 75% RD of N through FYM + 25 % RD of N through DAP 23.59 50.83 17.12 48.35 4.71 114.09 2.07 146.43
T7 75% RD of N through PM + 25 % RD of N through DAP 24.20 54.73 17.55 52.08 4.74 115.45 2.15 155.95
T8 75% RD of N through VC + 25 % RD of N through DAP 25.90 65.60 18.54 60.66 5.16 134.55 2.31 175.00
T9 75% RD of N through NC + 25 % RD of N through DAP 23.36 49.36 16.92 46.62 4.66 111.82 2.00 138.10
T10 50% RD of N through FYM + 50% RD of N through DAP 22.23 42.14 16.21 40.47 4.35 97.73 1.73 105.95
T11 50% RD of N through PM + 50% RD of N through DAP 22.54 44.12 16.40 42.11 4.45 102.27 1.81 115.48
T12 50% RD of N through VC + 50% RD of N through DAP 23.13 47.89 16.78 45.41 4.52 105.45 1.95 132.14
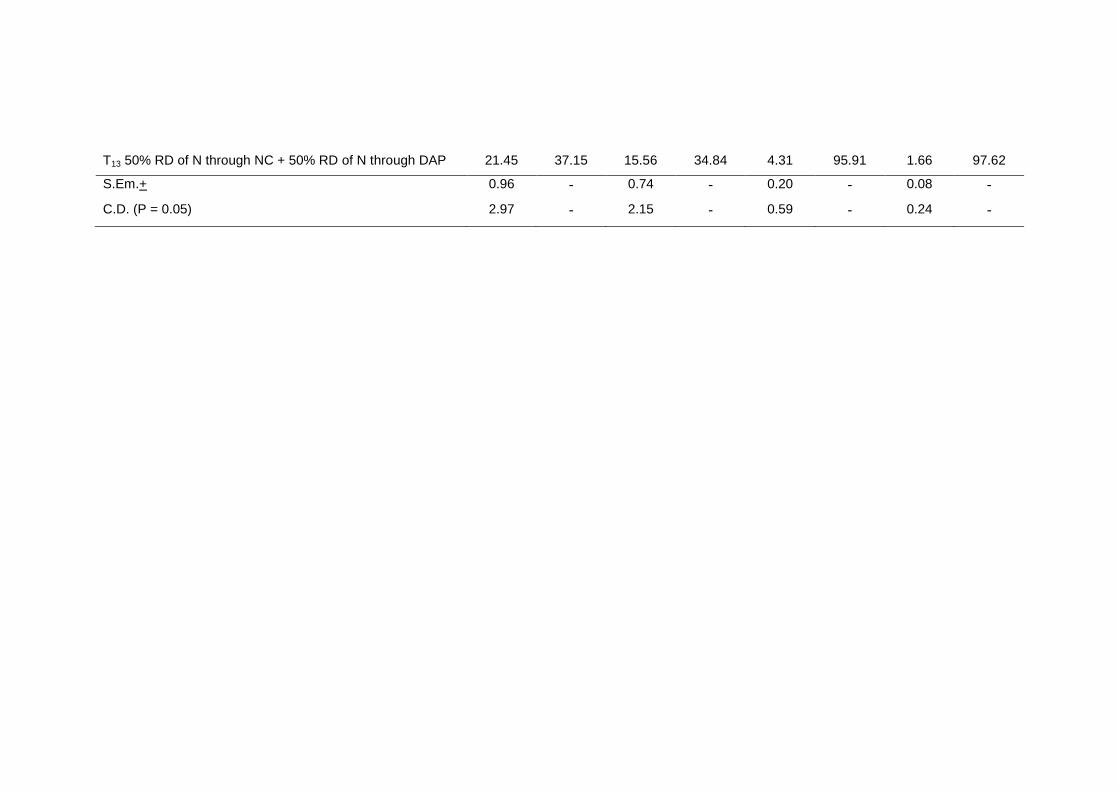
T13 50% RD of N through NC + 50% RD of N through DAP 21.45 37.15 15.56 34.84 4.31 95.91 1.66 97.62
S.Em.+ 0.96 - 0.74 - 0.20 - 0.08 -
C.D. (P = 0.05) 2.97 - 2.15 - 0.59 - 0.24 -
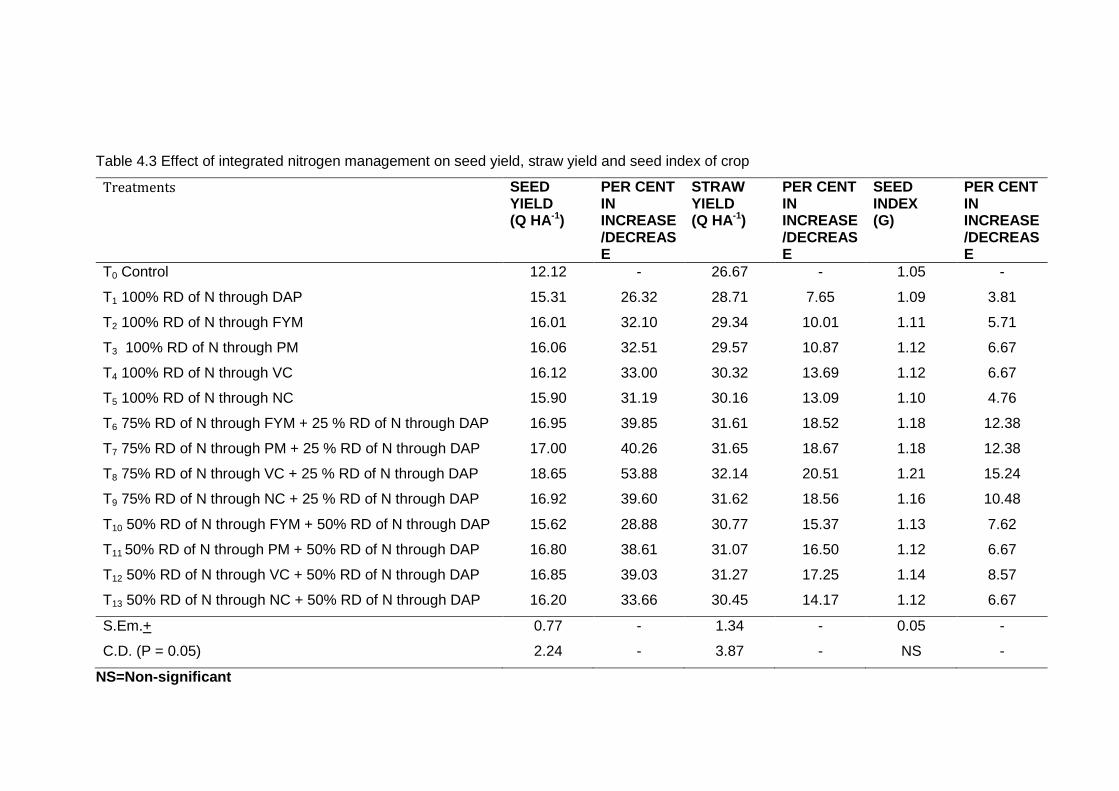
Table 4.3 Effect of integrated nitrogen management on seed yield, straw yield and seed index of crop
Treatments SEED YIELD (Q HA-1)
PER CENT IN INCREASE /DECREASE
STRAW YIELD (Q HA-1)
PER CENT IN INCREASE /DECREASE
SEED INDEX (G)
PER CENT IN INCREASE /DECREASE
T0 Control 12.12 - 26.67 - 1.05 -
T1 100% RD of N through DAP 15.31 26.32 28.71 7.65 1.09 3.81
T2 100% RD of N through FYM 16.01 32.10 29.34 10.01 1.11 5.71
T3 100% RD of N through PM 16.06 32.51 29.57 10.87 1.12 6.67
T4 100% RD of N through VC 16.12 33.00 30.32 13.69 1.12 6.67
T5 100% RD of N through NC 15.90 31.19 30.16 13.09 1.10 4.76
T6 75% RD of N through FYM + 25 % RD of N through DAP 16.95 39.85 31.61 18.52 1.18 12.38
T7 75% RD of N through PM + 25 % RD of N through DAP 17.00 40.26 31.65 18.67 1.18 12.38
T8 75% RD of N through VC + 25 % RD of N through DAP 18.65 53.88 32.14 20.51 1.21 15.24
T9 75% RD of N through NC + 25 % RD of N through DAP 16.92 39.60 31.62 18.56 1.16 10.48
T10 50% RD of N through FYM + 50% RD of N through DAP 15.62 28.88 30.77 15.37 1.13 7.62
T11 50% RD of N through PM + 50% RD of N through DAP 16.80 38.61 31.07 16.50 1.12 6.67
T12 50% RD of N through VC + 50% RD of N through DAP 16.85 39.03 31.27 17.25 1.14 8.57
T13 50% RD of N through NC + 50% RD of N through DAP 16.20 33.66 30.45 14.17 1.12 6.67
S.Em.+ 0.77 - 1.34 - 0.05 -
C.D. (P = 0.05) 2.24 - 3.87 - NS -
NS=Non-significant
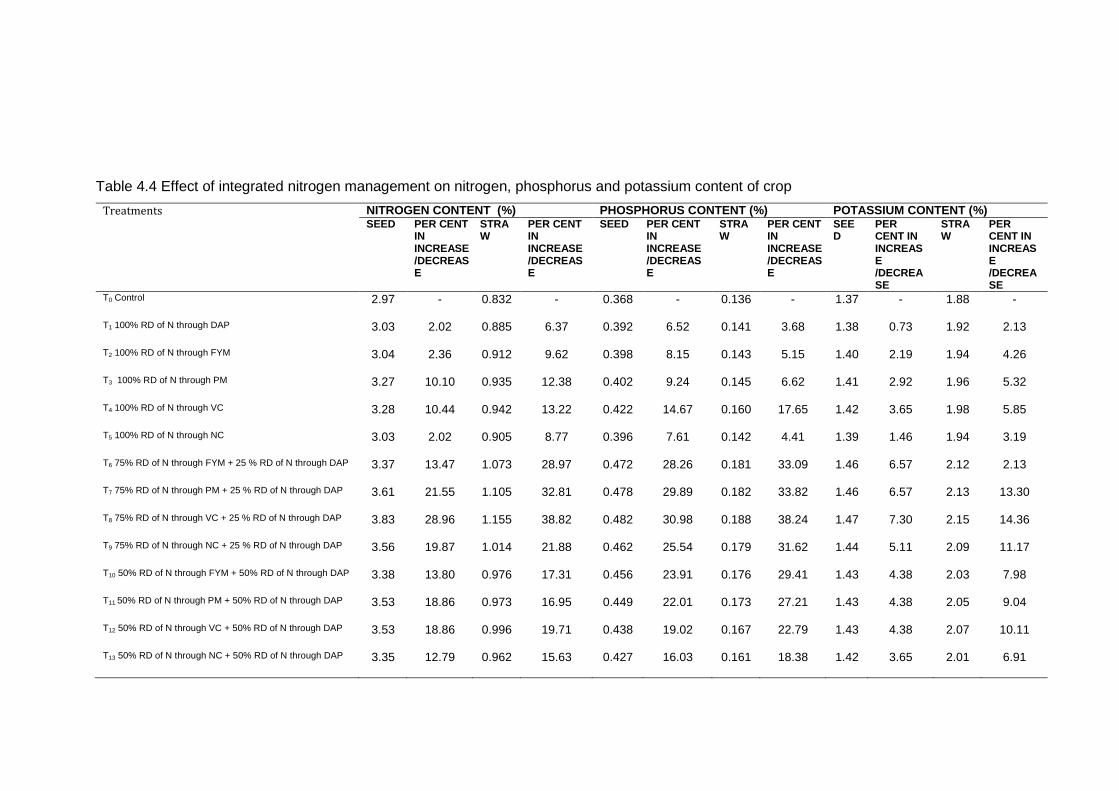
Table 4.4 Effect of integrated nitrogen management on nitrogen, phosphorus and potassium content of crop
Treatments NITROGEN CONTENT (%) PHOSPHORUS CONTENT (%) POTASSIUM CONTENT (%) SEED PER CENT
IN INCREASE /DECREASE
STRAW
PER CENT IN INCREASE /DECREASE
SEED PER CENT IN INCREASE /DECREASE
STRAW
PER CENT IN INCREASE /DECREASE
SEED
PER CENT IN INCREASE /DECREASE
STRAW
PER CENT IN INCREASE /DECREASE
T0 Control 2.97 - 0.832 - 0.368 - 0.136 - 1.37 - 1.88 -
T1 100% RD of N through DAP 3.03 2.02 0.885 6.37 0.392 6.52 0.141 3.68 1.38 0.73 1.92 2.13
T2 100% RD of N through FYM 3.04 2.36 0.912 9.62 0.398 8.15 0.143 5.15 1.40 2.19 1.94 4.26
T3 100% RD of N through PM 3.27 10.10 0.935 12.38 0.402 9.24 0.145 6.62 1.41 2.92 1.96 5.32
T4 100% RD of N through VC 3.28 10.44 0.942 13.22 0.422 14.67 0.160 17.65 1.42 3.65 1.98 5.85
T5 100% RD of N through NC 3.03 2.02 0.905 8.77 0.396 7.61 0.142 4.41 1.39 1.46 1.94 3.19
T6 75% RD of N through FYM + 25 % RD of N through DAP 3.37 13.47 1.073 28.97 0.472 28.26 0.181 33.09 1.46 6.57 2.12 2.13
T7 75% RD of N through PM + 25 % RD of N through DAP 3.61 21.55 1.105 32.81 0.478 29.89 0.182 33.82 1.46 6.57 2.13 13.30
T8 75% RD of N through VC + 25 % RD of N through DAP 3.83 28.96 1.155 38.82 0.482 30.98 0.188 38.24 1.47 7.30 2.15 14.36
T9 75% RD of N through NC + 25 % RD of N through DAP 3.56 19.87 1.014 21.88 0.462 25.54 0.179 31.62 1.44 5.11 2.09 11.17
T10 50% RD of N through FYM + 50% RD of N through DAP 3.38 13.80 0.976 17.31 0.456 23.91 0.176 29.41 1.43 4.38 2.03 7.98
T11 50% RD of N through PM + 50% RD of N through DAP 3.53 18.86 0.973 16.95 0.449 22.01 0.173 27.21 1.43 4.38 2.05 9.04
T12 50% RD of N through VC + 50% RD of N through DAP 3.53 18.86 0.996 19.71 0.438 19.02 0.167 22.79 1.43 4.38 2.07 10.11
T13 50% RD of N through NC + 50% RD of N through DAP 3.35 12.79 0.962 15.63 0.427 16.03 0.161 18.38 1.42 3.65 2.01 6.91
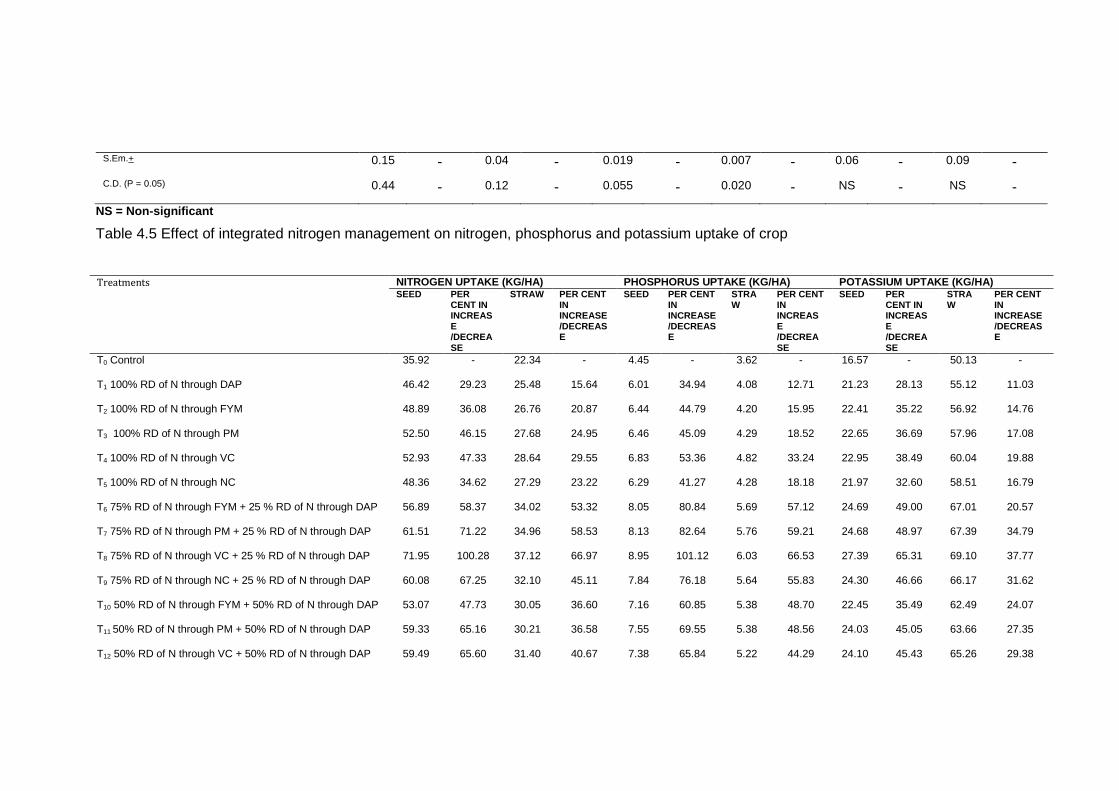
S.Em.+ 0.15 - 0.04 - 0.019 - 0.007 - 0.06 - 0.09 -
C.D. (P = 0.05) 0.44 - 0.12 - 0.055 - 0.020 - NS - NS -
NS = Non-significant
Table 4.5 Effect of integrated nitrogen management on nitrogen, phosphorus and potassium uptake of crop
Treatments NITROGEN UPTAKE (KG/HA) PHOSPHORUS UPTAKE (KG/HA) POTASSIUM UPTAKE (KG/HA) SEED PER
CENT IN INCREASE /DECREASE
STRAW PER CENT IN INCREASE /DECREASE
SEED PER CENT IN INCREASE /DECREASE
STRAW
PER CENT IN INCREASE /DECREASE
SEED PER CENT IN INCREASE /DECREASE
STRAW
PER CENT IN INCREASE /DECREASE
T0 Control 35.92 - 22.34 - 4.45 - 3.62 - 16.57 - 50.13 -
T1 100% RD of N through DAP 46.42 29.23 25.48 15.64 6.01 34.94 4.08 12.71 21.23 28.13 55.12 11.03
T2 100% RD of N through FYM 48.89 36.08 26.76 20.87 6.44 44.79 4.20 15.95 22.41 35.22 56.92 14.76
T3 100% RD of N through PM 52.50 46.15 27.68 24.95 6.46 45.09 4.29 18.52 22.65 36.69 57.96 17.08
T4 100% RD of N through VC 52.93 47.33 28.64 29.55 6.83 53.36 4.82 33.24 22.95 38.49 60.04 19.88
T5 100% RD of N through NC 48.36 34.62 27.29 23.22 6.29 41.27 4.28 18.18 21.97 32.60 58.51 16.79
T6 75% RD of N through FYM + 25 % RD of N through DAP 56.89 58.37 34.02 53.32 8.05 80.84 5.69 57.12 24.69 49.00 67.01 20.57
T7 75% RD of N through PM + 25 % RD of N through DAP 61.51 71.22 34.96 58.53 8.13 82.64 5.76 59.21 24.68 48.97 67.39 34.79
T8 75% RD of N through VC + 25 % RD of N through DAP 71.95 100.28 37.12 66.97 8.95 101.12 6.03 66.53 27.39 65.31 69.10 37.77
T9 75% RD of N through NC + 25 % RD of N through DAP 60.08 67.25 32.10 45.11 7.84 76.18 5.64 55.83 24.30 46.66 66.17 31.62
T10 50% RD of N through FYM + 50% RD of N through DAP 53.07 47.73 30.05 36.60 7.16 60.85 5.38 48.70 22.45 35.49 62.49 24.07
T11 50% RD of N through PM + 50% RD of N through DAP 59.33 65.16 30.21 36.58 7.55 69.55 5.38 48.56 24.03 45.05 63.66 27.35
T12 50% RD of N through VC + 50% RD of N through DAP 59.49 65.60 31.40 40.67 7.38 65.84 5.22 44.29 24.10 45.43 65.26 29.38
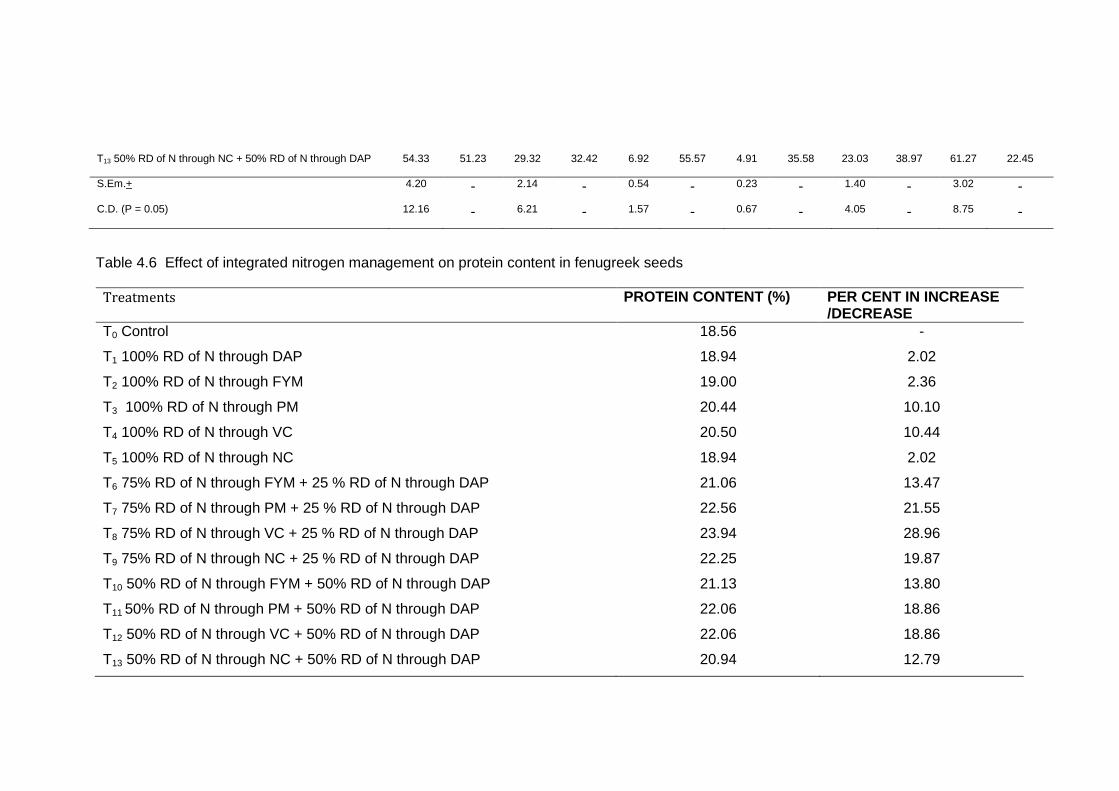
T13 50% RD of N through NC + 50% RD of N through DAP 54.33 51.23 29.32 32.42 6.92 55.57 4.91 35.58 23.03 38.97 61.27 22.45
S.Em.+ 4.20 - 2.14 - 0.54 - 0.23 - 1.40 - 3.02 -
C.D. (P = 0.05) 12.16 - 6.21 - 1.57 - 0.67 - 4.05 - 8.75 -
Table 4.6 Effect of integrated nitrogen management on protein content in fenugreek seeds
Treatments PROTEIN CONTENT (%) PER CENT IN INCREASE /DECREASE
T0 Control 18.56 -
T1 100% RD of N through DAP 18.94 2.02
T2 100% RD of N through FYM 19.00 2.36
T3 100% RD of N through PM 20.44 10.10
T4 100% RD of N through VC 20.50 10.44
T5 100% RD of N through NC 18.94 2.02
T6 75% RD of N through FYM + 25 % RD of N through DAP 21.06 13.47
T7 75% RD of N through PM + 25 % RD of N through DAP 22.56 21.55
T8 75% RD of N through VC + 25 % RD of N through DAP 23.94 28.96
T9 75% RD of N through NC + 25 % RD of N through DAP 22.25 19.87
T10 50% RD of N through FYM + 50% RD of N through DAP 21.13 13.80
T11 50% RD of N through PM + 50% RD of N through DAP 22.06 18.86
T12 50% RD of N through VC + 50% RD of N through DAP 22.06 18.86
T13 50% RD of N through NC + 50% RD of N through DAP 20.94 12.79
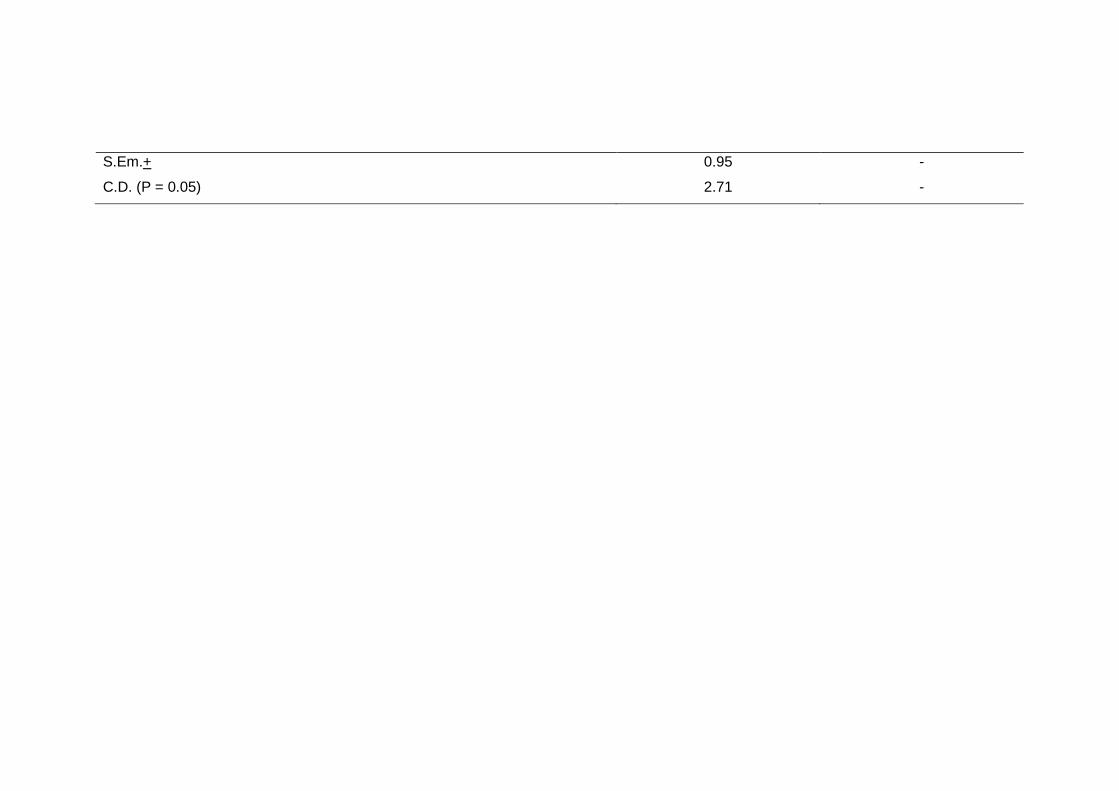
S.Em.+ 0.95 -
C.D. (P = 0.05) 2.71 -
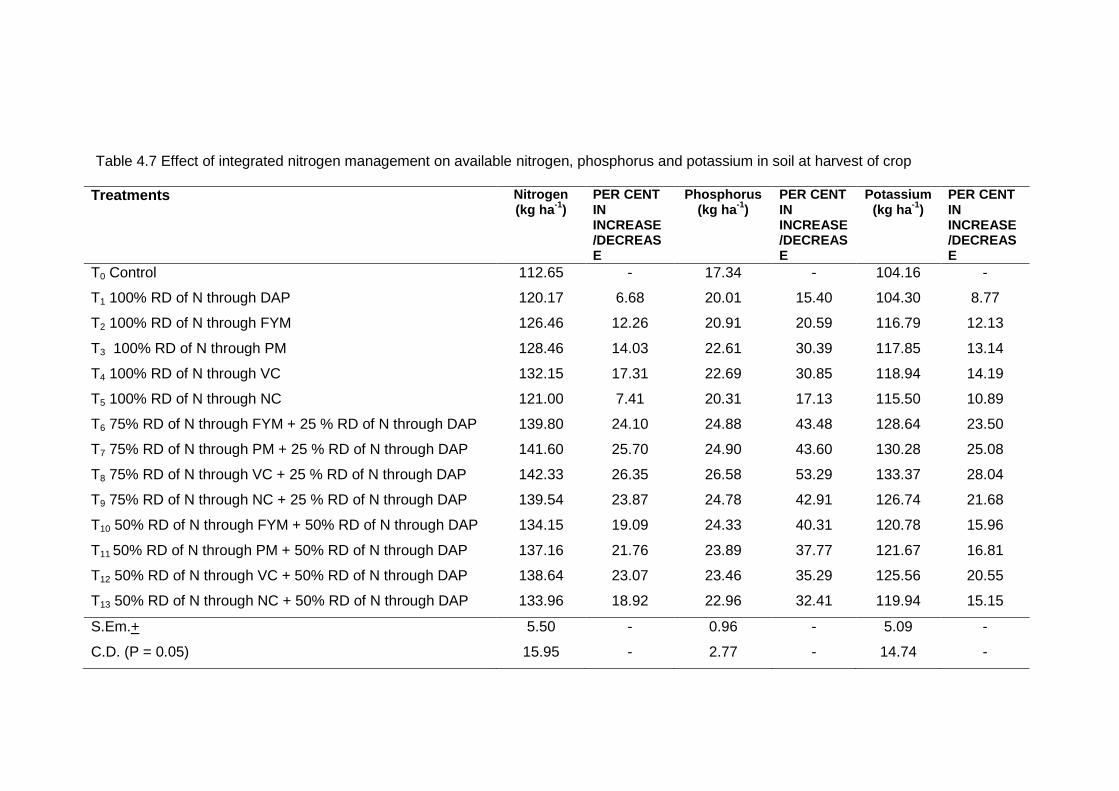
Table 4.7 Effect of integrated nitrogen management on available nitrogen, phosphorus and potassium in soil at harvest of crop
Treatments Nitrogen (kg ha
-1)
PER CENT IN INCREASE /DECREASE
Phosphorus (kg ha
-1)
PER CENT IN INCREASE /DECREASE
Potassium (kg ha
-1)
PER CENT IN INCREASE /DECREASE
T0 Control 112.65 - 17.34 - 104.16 -
T1 100% RD of N through DAP 120.17 6.68 20.01 15.40 104.30 8.77
T2 100% RD of N through FYM 126.46 12.26 20.91 20.59 116.79 12.13
T3 100% RD of N through PM 128.46 14.03 22.61 30.39 117.85 13.14
T4 100% RD of N through VC 132.15 17.31 22.69 30.85 118.94 14.19
T5 100% RD of N through NC 121.00 7.41 20.31 17.13 115.50 10.89
T6 75% RD of N through FYM + 25 % RD of N through DAP 139.80 24.10 24.88 43.48 128.64 23.50
T7 75% RD of N through PM + 25 % RD of N through DAP 141.60 25.70 24.90 43.60 130.28 25.08
T8 75% RD of N through VC + 25 % RD of N through DAP 142.33 26.35 26.58 53.29 133.37 28.04
T9 75% RD of N through NC + 25 % RD of N through DAP 139.54 23.87 24.78 42.91 126.74 21.68
T10 50% RD of N through FYM + 50% RD of N through DAP 134.15 19.09 24.33 40.31 120.78 15.96
T11 50% RD of N through PM + 50% RD of N through DAP 137.16 21.76 23.89 37.77 121.67 16.81
T12 50% RD of N through VC + 50% RD of N through DAP 138.64 23.07 23.46 35.29 125.56 20.55
T13 50% RD of N through NC + 50% RD of N through DAP 133.96 18.92 22.96 32.41 119.94 15.15
S.Em.+ 5.50 - 0.96 - 5.09 -
C.D. (P = 0.05) 15.95 - 2.77 - 14.74 -

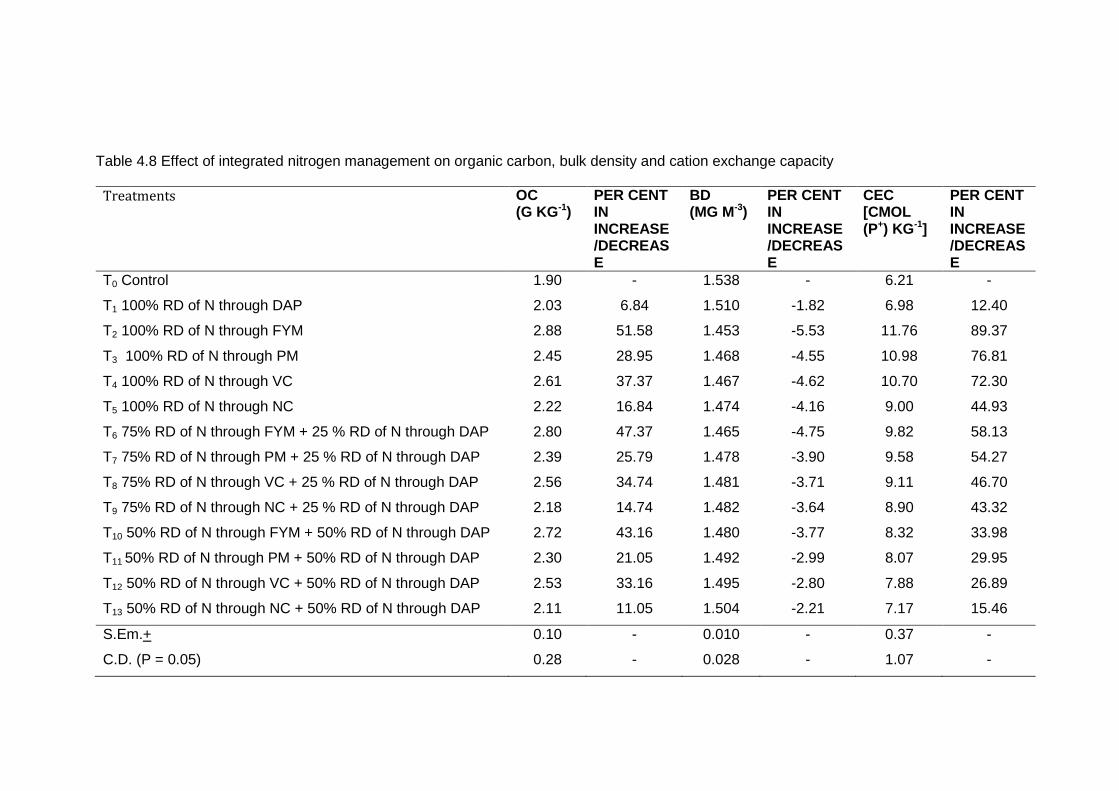
Table 4.8 Effect of integrated nitrogen management on organic carbon, bulk density and cation exchange capacity
Treatments OC (G KG-1)
PER CENT IN INCREASE /DECREASE
BD (MG M-3)
PER CENT IN INCREASE /DECREASE
CEC [CMOL (P+) KG-1]
PER CENT IN INCREASE /DECREASE
T0 Control 1.90 - 1.538 - 6.21 -
T1 100% RD of N through DAP 2.03 6.84 1.510 -1.82 6.98 12.40
T2 100% RD of N through FYM 2.88 51.58 1.453 -5.53 11.76 89.37
T3 100% RD of N through PM 2.45 28.95 1.468 -4.55 10.98 76.81
T4 100% RD of N through VC 2.61 37.37 1.467 -4.62 10.70 72.30
T5 100% RD of N through NC 2.22 16.84 1.474 -4.16 9.00 44.93
T6 75% RD of N through FYM + 25 % RD of N through DAP 2.80 47.37 1.465 -4.75 9.82 58.13
T7 75% RD of N through PM + 25 % RD of N through DAP 2.39 25.79 1.478 -3.90 9.58 54.27
T8 75% RD of N through VC + 25 % RD of N through DAP 2.56 34.74 1.481 -3.71 9.11 46.70
T9 75% RD of N through NC + 25 % RD of N through DAP 2.18 14.74 1.482 -3.64 8.90 43.32
T10 50% RD of N through FYM + 50% RD of N through DAP 2.72 43.16 1.480 -3.77 8.32 33.98
T11 50% RD of N through PM + 50% RD of N through DAP 2.30 21.05 1.492 -2.99 8.07 29.95
T12 50% RD of N through VC + 50% RD of N through DAP 2.53 33.16 1.495 -2.80 7.88 26.89
T13 50% RD of N through NC + 50% RD of N through DAP 2.11 11.05 1.504 -2.21 7.17 15.46
S.Em.+ 0.10 - 0.010 - 0.37 -
C.D. (P = 0.05) 0.28 - 0.028 - 1.07 -

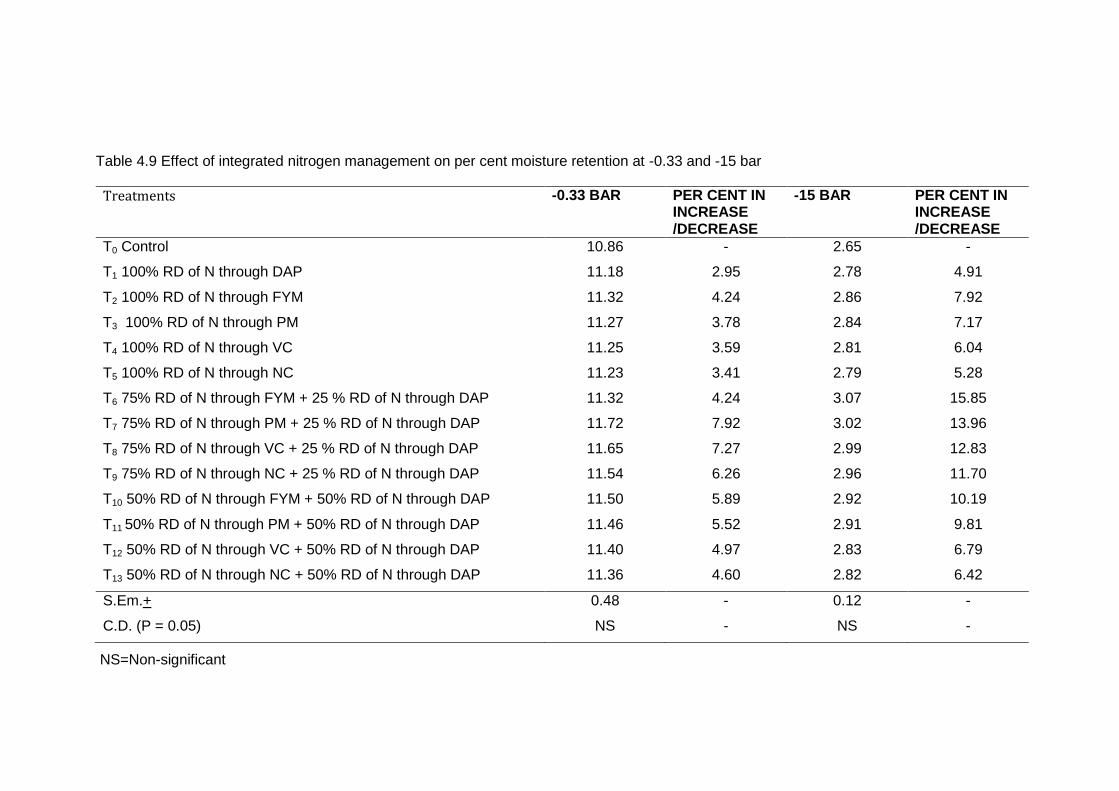
Table 4.9 Effect of integrated nitrogen management on per cent moisture retention at -0.33 and -15 bar
Treatments -0.33 BAR PER CENT IN INCREASE /DECREASE
-15 BAR PER CENT IN INCREASE /DECREASE
T0 Control 10.86 - 2.65 -
T1 100% RD of N through DAP 11.18 2.95 2.78 4.91
T2 100% RD of N through FYM 11.32 4.24 2.86 7.92
T3 100% RD of N through PM 11.27 3.78 2.84 7.17
T4 100% RD of N through VC 11.25 3.59 2.81 6.04
T5 100% RD of N through NC 11.23 3.41 2.79 5.28
T6 75% RD of N through FYM + 25 % RD of N through DAP 11.32 4.24 3.07 15.85
T7 75% RD of N through PM + 25 % RD of N through DAP 11.72 7.92 3.02 13.96
T8 75% RD of N through VC + 25 % RD of N through DAP 11.65 7.27 2.99 12.83
T9 75% RD of N through NC + 25 % RD of N through DAP 11.54 6.26 2.96 11.70
T10 50% RD of N through FYM + 50% RD of N through DAP 11.50 5.89 2.92 10.19
T11 50% RD of N through PM + 50% RD of N through DAP 11.46 5.52 2.91 9.81
T12 50% RD of N through VC + 50% RD of N through DAP 11.40 4.97 2.83 6.79
T13 50% RD of N through NC + 50% RD of N through DAP 11.36 4.60 2.82 6.42
S.Em.+ 0.48 - 0.12 -
C.D. (P = 0.05) NS - NS -
NS=Non-significant
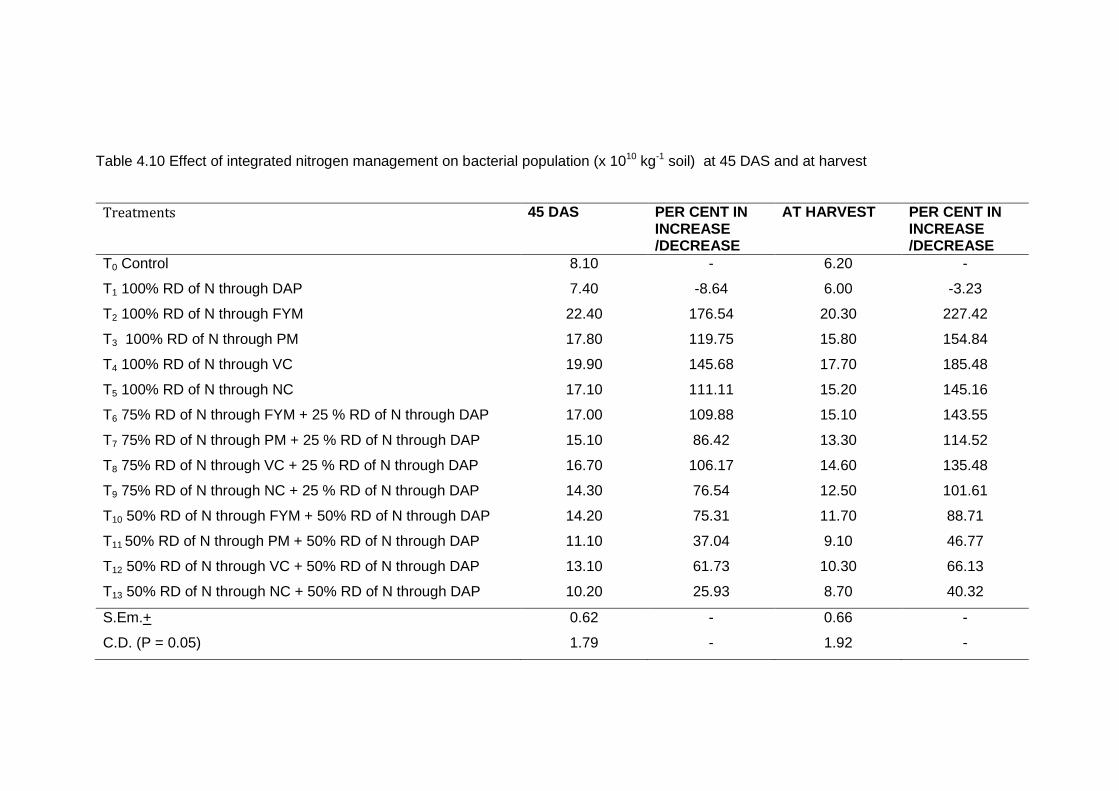
Table 4.10 Effect of integrated nitrogen management on bacterial population (x 1010 kg-1 soil) at 45 DAS and at harvest
Treatments 45 DAS PER CENT IN INCREASE /DECREASE
AT HARVEST PER CENT IN INCREASE /DECREASE
T0 Control 8.10 - 6.20 -
T1 100% RD of N through DAP 7.40 -8.64 6.00 -3.23
T2 100% RD of N through FYM 22.40 176.54 20.30 227.42
T3 100% RD of N through PM 17.80 119.75 15.80 154.84
T4 100% RD of N through VC 19.90 145.68 17.70 185.48
T5 100% RD of N through NC 17.10 111.11 15.20 145.16
T6 75% RD of N through FYM + 25 % RD of N through DAP 17.00 109.88 15.10 143.55
T7 75% RD of N through PM + 25 % RD of N through DAP 15.10 86.42 13.30 114.52
T8 75% RD of N through VC + 25 % RD of N through DAP 16.70 106.17 14.60 135.48
T9 75% RD of N through NC + 25 % RD of N through DAP 14.30 76.54 12.50 101.61
T10 50% RD of N through FYM + 50% RD of N through DAP 14.20 75.31 11.70 88.71
T11 50% RD of N through PM + 50% RD of N through DAP 11.10 37.04 9.10 46.77
T12 50% RD of N through VC + 50% RD of N through DAP 13.10 61.73 10.30 66.13
T13 50% RD of N through NC + 50% RD of N through DAP 10.20 25.93 8.70 40.32
S.Em.+ 0.62 - 0.66 -
C.D. (P = 0.05) 1.79 - 1.92 -
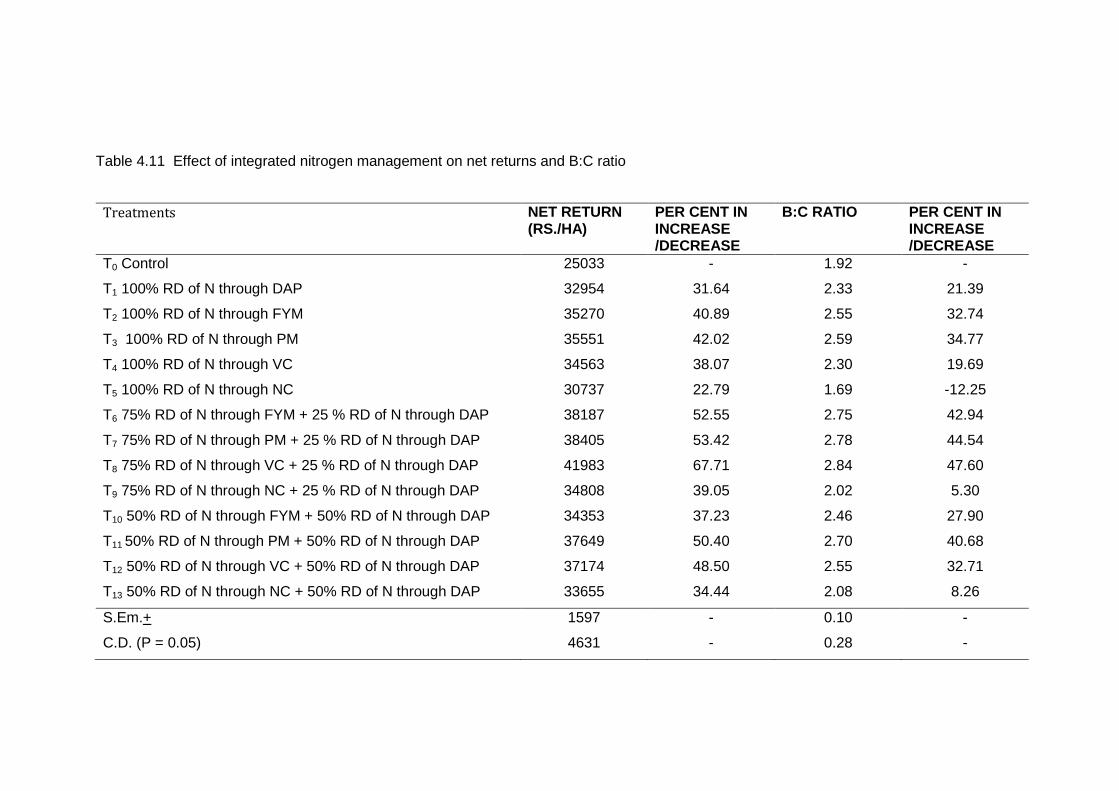
Table 4.11 Effect of integrated nitrogen management on net returns and B:C ratio
Treatments NET RETURN (RS./HA)
PER CENT IN INCREASE /DECREASE
B:C RATIO PER CENT IN INCREASE /DECREASE
T0 Control 25033 - 1.92 -
T1 100% RD of N through DAP 32954 31.64 2.33 21.39
T2 100% RD of N through FYM 35270 40.89 2.55 32.74
T3 100% RD of N through PM 35551 42.02 2.59 34.77
T4 100% RD of N through VC 34563 38.07 2.30 19.69
T5 100% RD of N through NC 30737 22.79 1.69 -12.25
T6 75% RD of N through FYM + 25 % RD of N through DAP 38187 52.55 2.75 42.94
T7 75% RD of N through PM + 25 % RD of N through DAP 38405 53.42 2.78 44.54
T8 75% RD of N through VC + 25 % RD of N through DAP 41983 67.71 2.84 47.60
T9 75% RD of N through NC + 25 % RD of N through DAP 34808 39.05 2.02 5.30
T10 50% RD of N through FYM + 50% RD of N through DAP 34353 37.23 2.46 27.90
T11 50% RD of N through PM + 50% RD of N through DAP 37649 50.40 2.70 40.68
T12 50% RD of N through VC + 50% RD of N through DAP 37174 48.50 2.55 32.71
T13 50% RD of N through NC + 50% RD of N through DAP 33655 34.44 2.08 8.26
S.Em.+ 1597 - 0.10 -
C.D. (P = 0.05) 4631 - 0.28 -
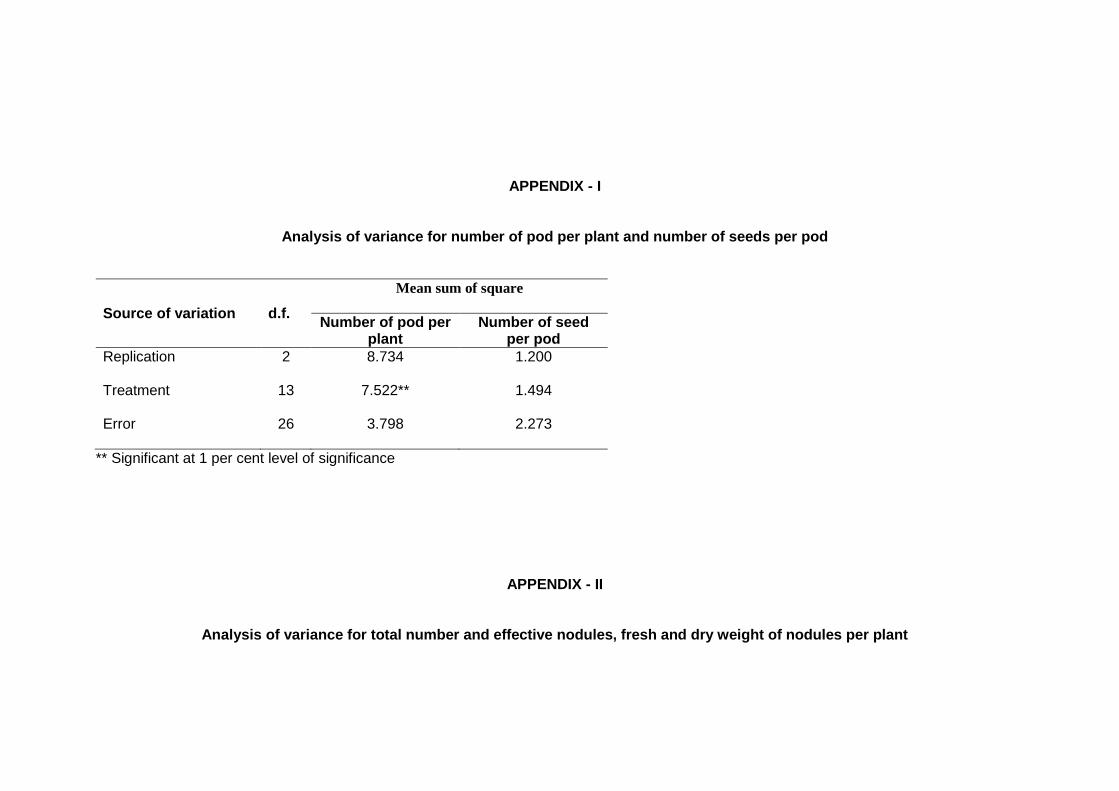
APPENDIX - I
Analysis of variance for number of pod per plant and number of seeds per pod
Source of variation d.f.
Mean sum of square
Number of pod per plant
Number of seed per pod
Replication 2 8.734 1.200
Treatment 13 7.522** 1.494
Error 26 3.798 2.273
** Significant at 1 per cent level of significance
APPENDIX - II
Analysis of variance for total number and effective nodules, fresh and dry weight of nodules per plant
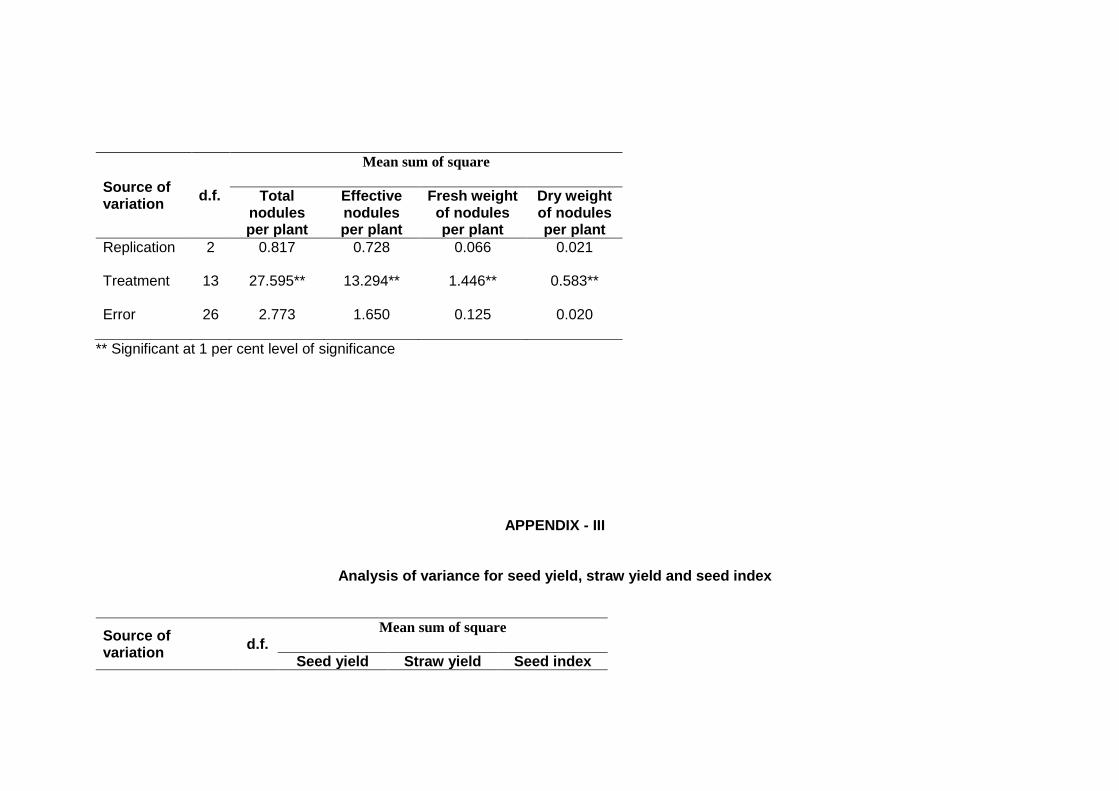
Source of variation
d.f.
Mean sum of square
Total nodules per plant
Effective nodules per plant
Fresh weight of nodules per plant
Dry weight of nodules per plant
Replication 2 0.817 0.728 0.066 0.021
Treatment 13 27.595** 13.294** 1.446** 0.583**
Error 26 2.773 1.650 0.125 0.020
** Significant at 1 per cent level of significance
APPENDIX - III
Analysis of variance for seed yield, straw yield and seed index
Source of variation
d.f. Mean sum of square
Seed yield Straw yield Seed index
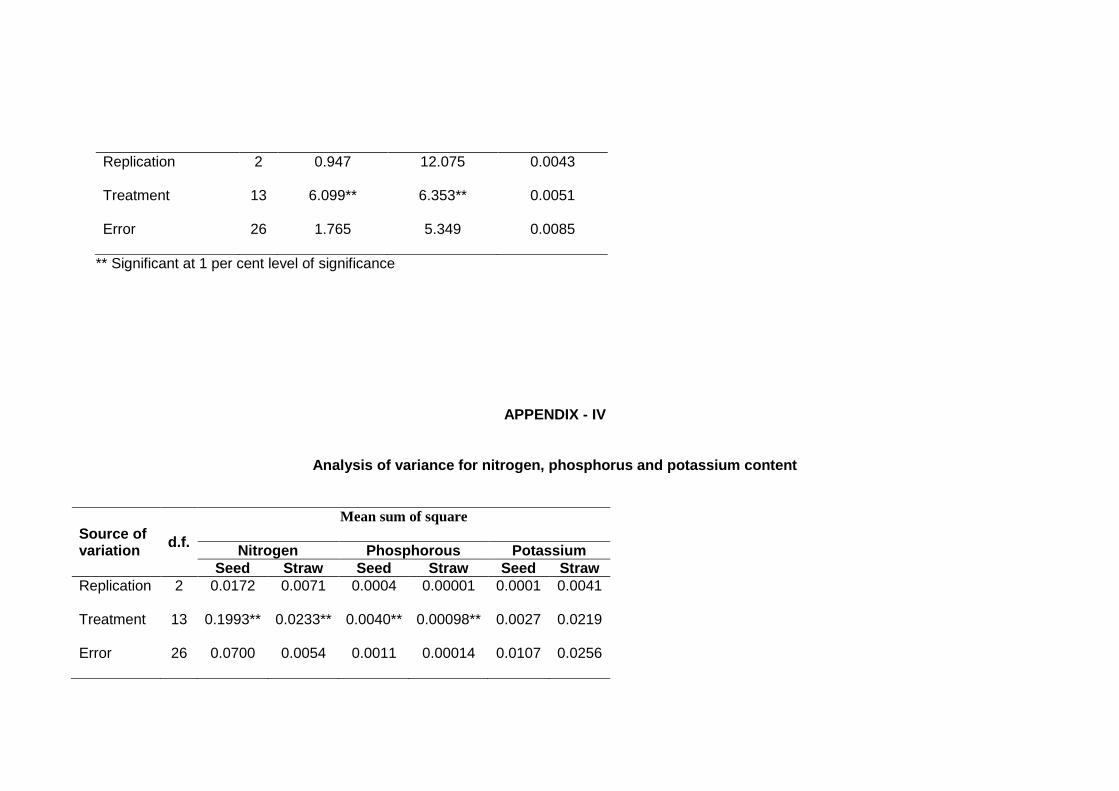
Replication 2 0.947 12.075 0.0043
Treatment 13 6.099** 6.353** 0.0051
Error 26 1.765 5.349 0.0085
** Significant at 1 per cent level of significance
APPENDIX - IV
Analysis of variance for nitrogen, phosphorus and potassium content
Source of variation
d.f.
Mean sum of square
Nitrogen Phosphorous Potassium
Seed Straw Seed Straw Seed Straw
Replication 2 0.0172 0.0071 0.0004 0.00001 0.0001 0.0041
Treatment 13 0.1993** 0.0233** 0.0040** 0.00098** 0.0027 0.0219
Error 26 0.0700 0.0054 0.0011 0.00014 0.0107 0.0256

** Significant at 1 per cent level of significance
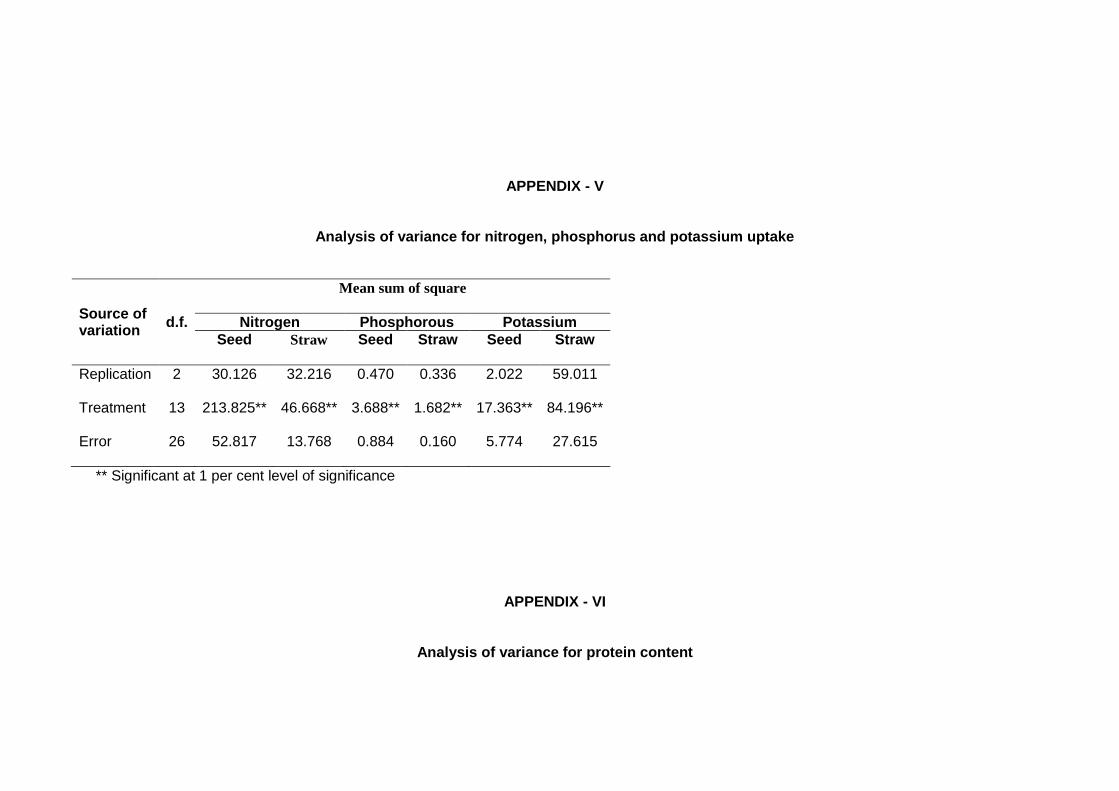
APPENDIX - V
Analysis of variance for nitrogen, phosphorus and potassium uptake
Source of variation
d.f.
Mean sum of square
Nitrogen Phosphorous Potassium
Seed Straw Seed Straw Seed Straw
Replication 2 30.126 32.216 0.470 0.336 2.022 59.011
Treatment 13 213.825** 46.668** 3.688** 1.682** 17.363** 84.196**
Error 26 52.817 13.768 0.884 0.160 5.774 27.615
** Significant at 1 per cent level of significance
APPENDIX - VI
Analysis of variance for protein content
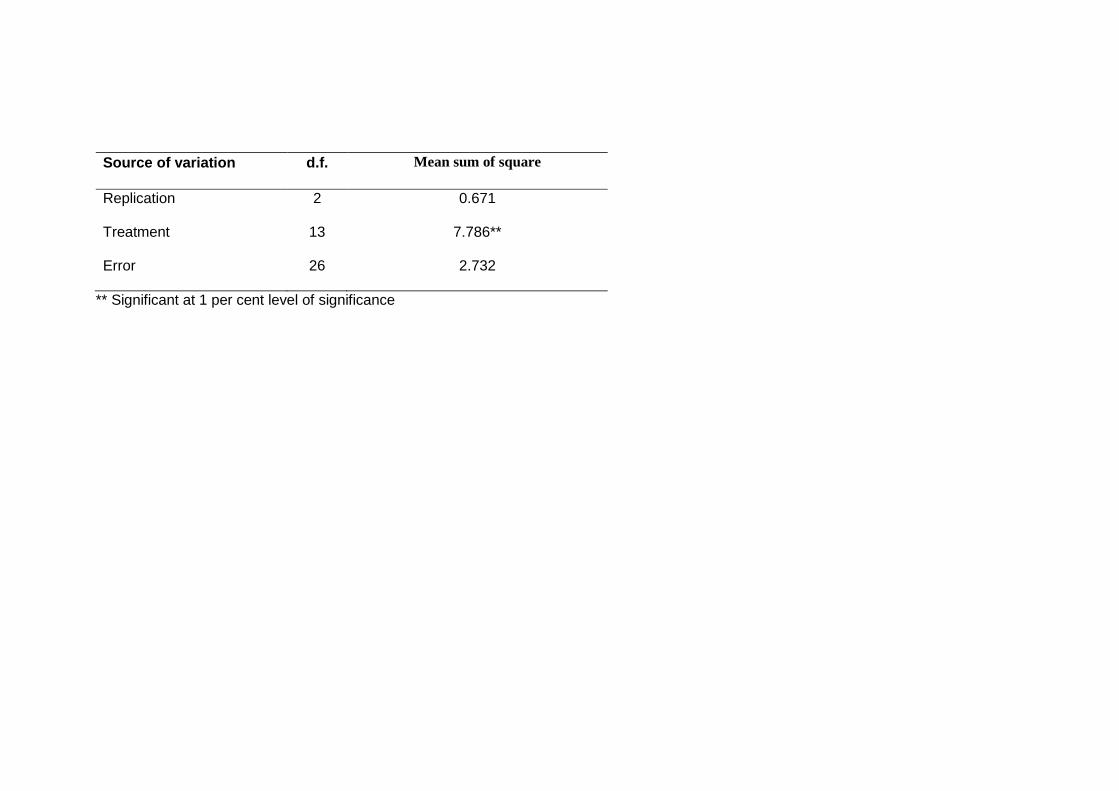
Source of variation d.f. Mean sum of square
Replication 2 0.671
Treatment 13 7.786**
Error 26 2.732
** Significant at 1 per cent level of significance
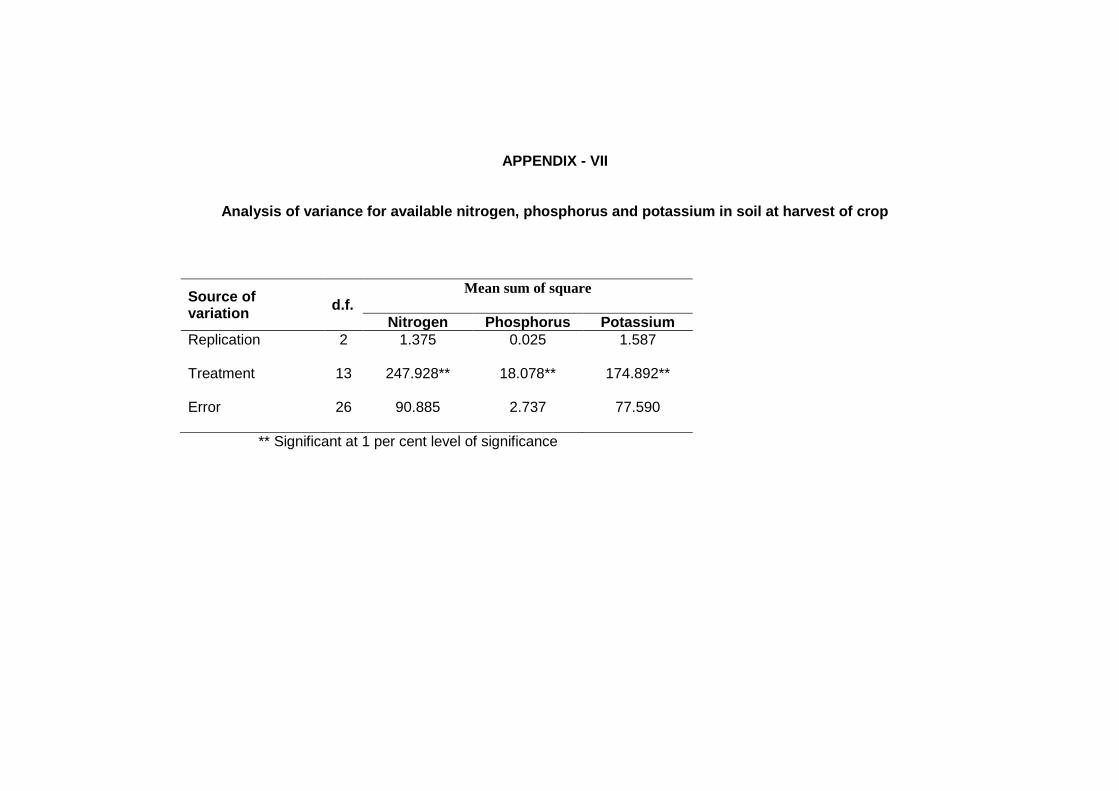
APPENDIX - VII
Analysis of variance for available nitrogen, phosphorus and potassium in soil at harvest of crop
Source of variation
d.f. Mean sum of square
Nitrogen Phosphorus Potassium
Replication 2 1.375 0.025 1.587
Treatment 13 247.928** 18.078** 174.892**
Error 26 90.885 2.737 77.590
** Significant at 1 per cent level of significance
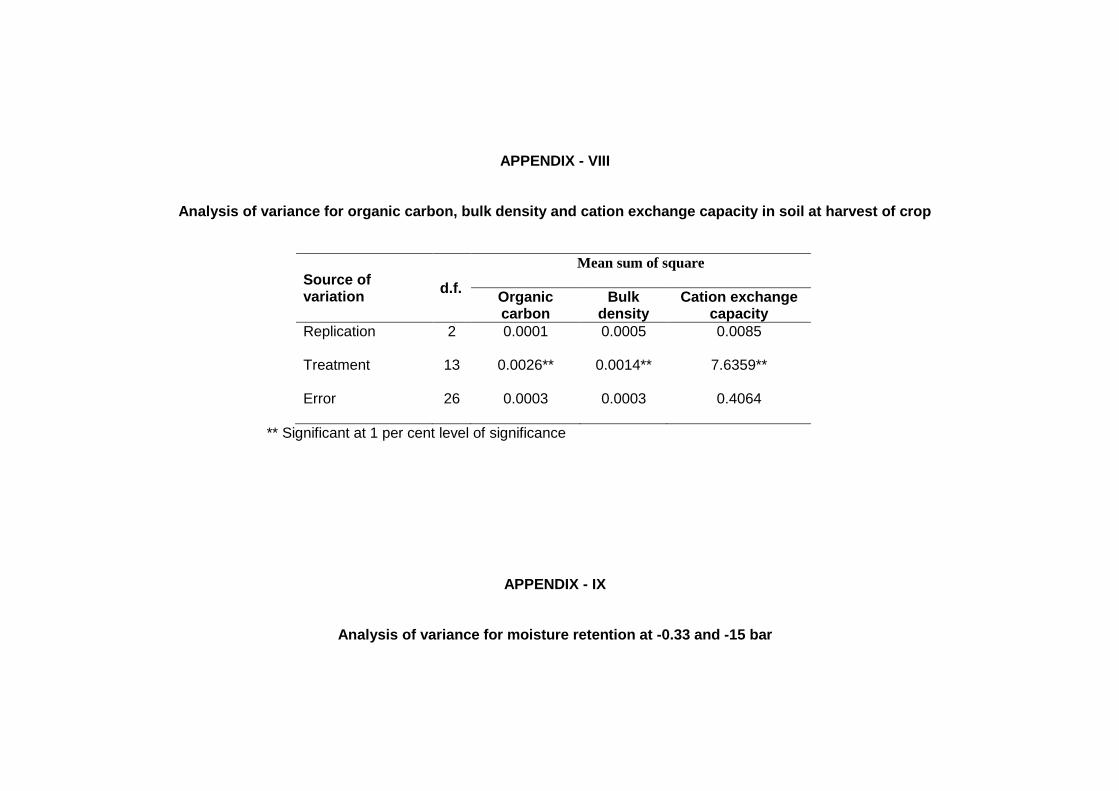
APPENDIX - VIII
Analysis of variance for organic carbon, bulk density and cation exchange capacity in soil at harvest of crop
Source of variation
d.f.
Mean sum of square
Organic carbon
Bulk density
Cation exchange capacity
Replication 2 0.0001 0.0005 0.0085
Treatment 13 0.0026** 0.0014** 7.6359**
Error 26 0.0003 0.0003 0.4064
** Significant at 1 per cent level of significance
APPENDIX - IX
Analysis of variance for moisture retention at -0.33 and -15 bar
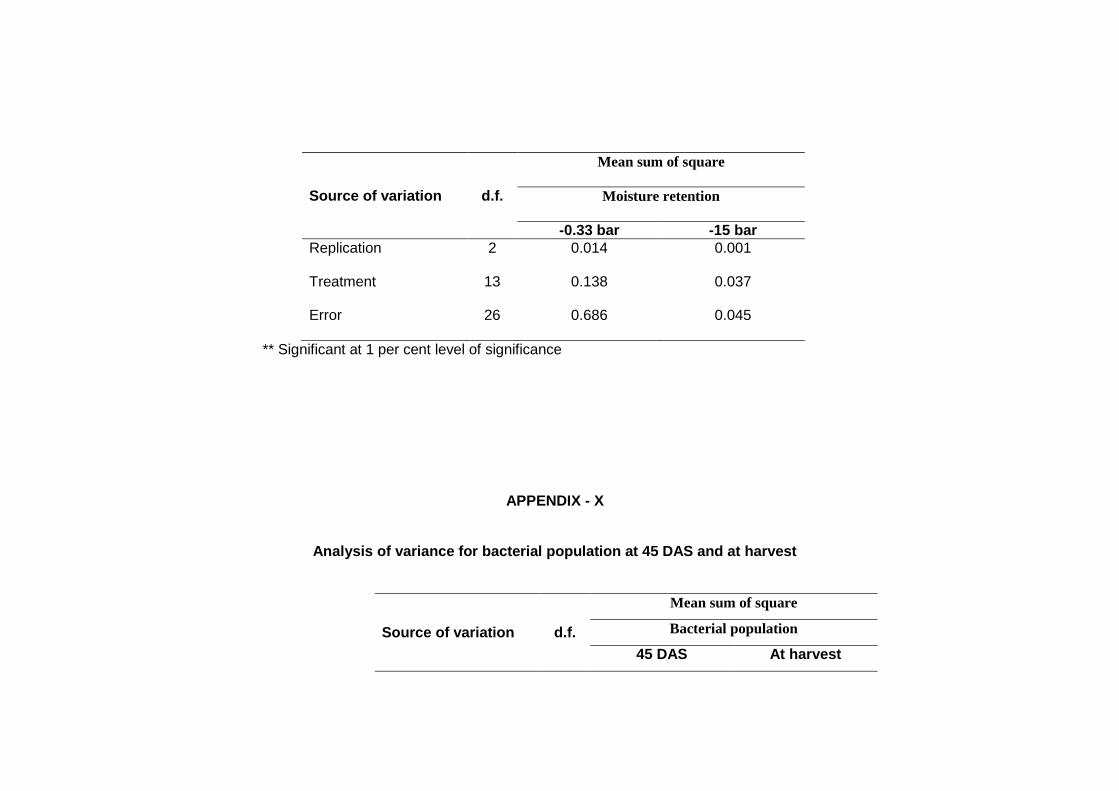
Source of variation d.f.
Mean sum of square
Moisture retention
-0.33 bar -15 bar
Replication 2 0.014 0.001
Treatment 13 0.138 0.037
Error 26 0.686 0.045
** Significant at 1 per cent level of significance
APPENDIX - X
Analysis of variance for bacterial population at 45 DAS and at harvest
Source of variation d.f.
Mean sum of square
Bacterial population
45 DAS At harvest
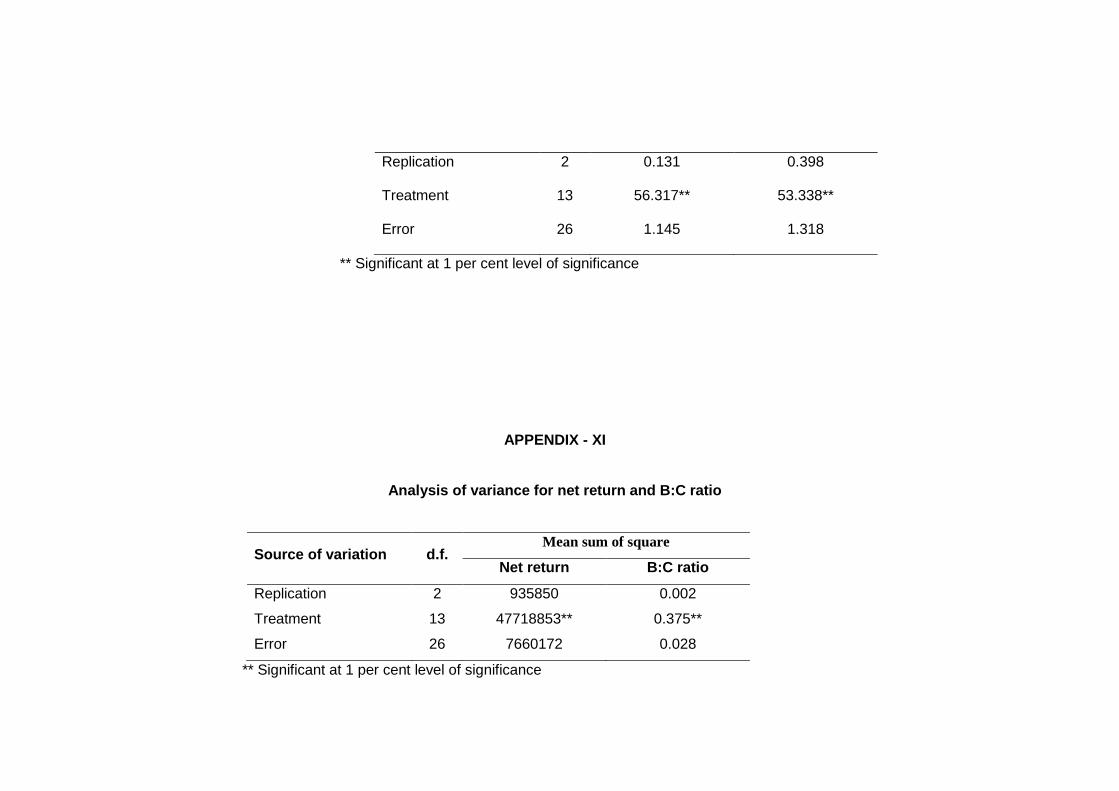
Replication 2 0.131 0.398
Treatment 13 56.317** 53.338**
Error 26 1.145 1.318
** Significant at 1 per cent level of significance
APPENDIX - XI
Analysis of variance for net return and B:C ratio
Source of variation d.f. Mean sum of square
Net return B:C ratio
Replication 2 935850 0.002
Treatment 13 47718853** 0.375**
Error 26 7660172 0.028
** Significant at 1 per cent level of significance
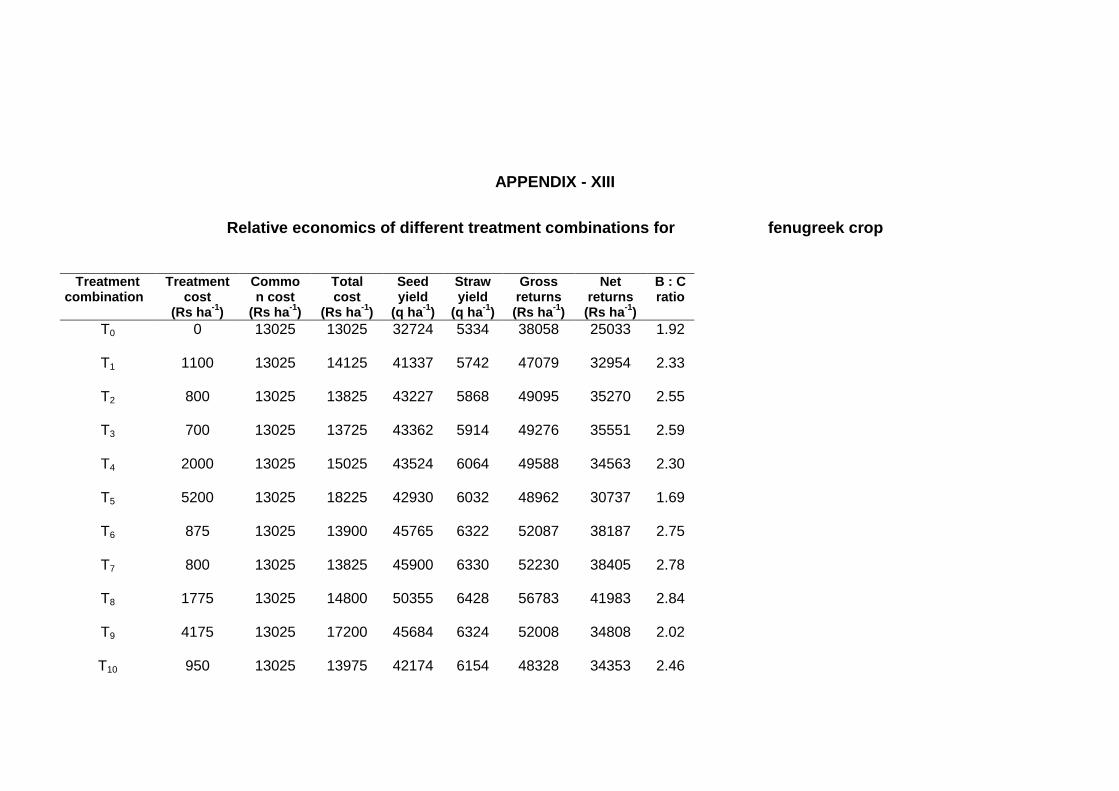
APPENDIX - XIII
Relative economics of different treatment combinations for fenugreek crop
Treatment combination
Treatment cost
(Rs ha-1
)
Common cost
(Rs ha-1
)
Total cost
(Rs ha-1
)
Seed yield
(q ha-1
)
Straw yield
(q ha-1
)
Gross returns (Rs ha
-1)
Net returns (Rs ha
-1)
B : C ratio
T0 0 13025 13025 32724 5334 38058 25033 1.92
T1 1100 13025 14125 41337 5742 47079 32954 2.33
T2 800 13025 13825 43227 5868 49095 35270 2.55
T3 700 13025 13725 43362 5914 49276 35551 2.59
T4 2000 13025 15025 43524 6064 49588 34563 2.30
T5 5200 13025 18225 42930 6032 48962 30737 1.69
T6 875 13025 13900 45765 6322 52087 38187 2.75
T7 800 13025 13825 45900 6330 52230 38405 2.78
T8 1775 13025 14800 50355 6428 56783 41983 2.84
T9 4175 13025 17200 45684 6324 52008 34808 2.02
T10 950 13025 13975 42174 6154 48328 34353 2.46
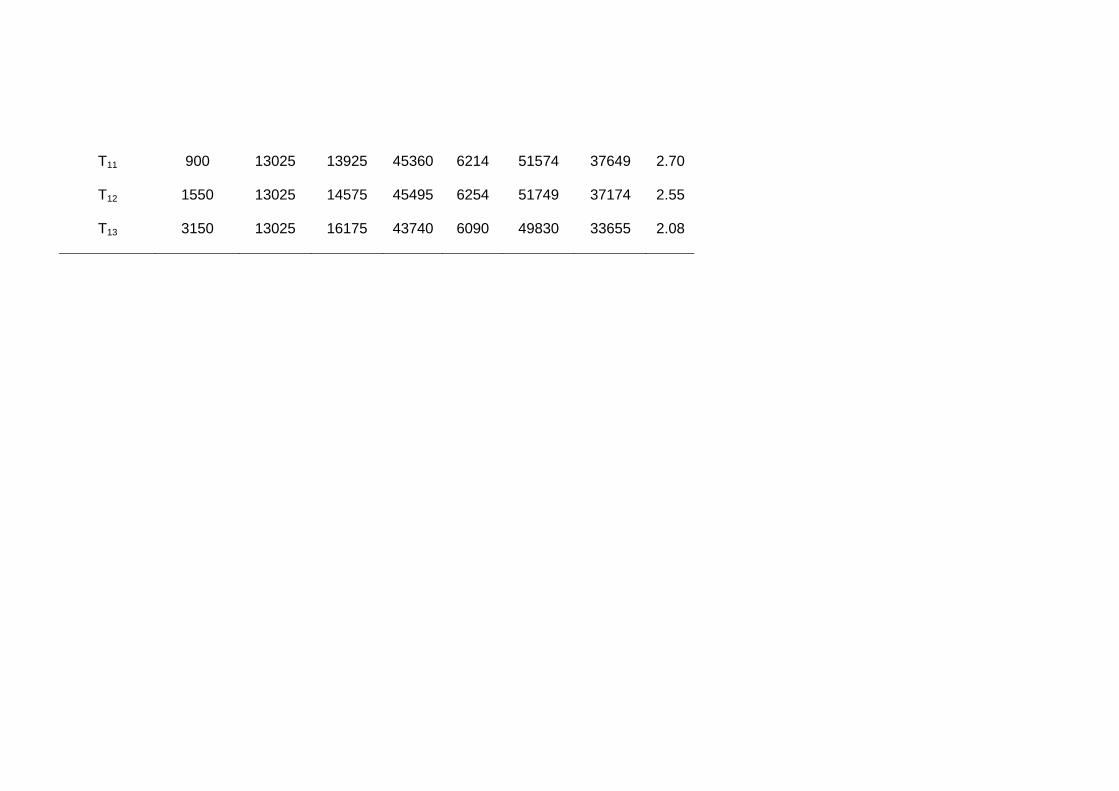
T11 900 13025 13925 45360 6214 51574 37649 2.70
T12 1550 13025 14575 45495 6254 51749 37174 2.55
T13 3150 13025 16175 43740 6090 49830 33655 2.08
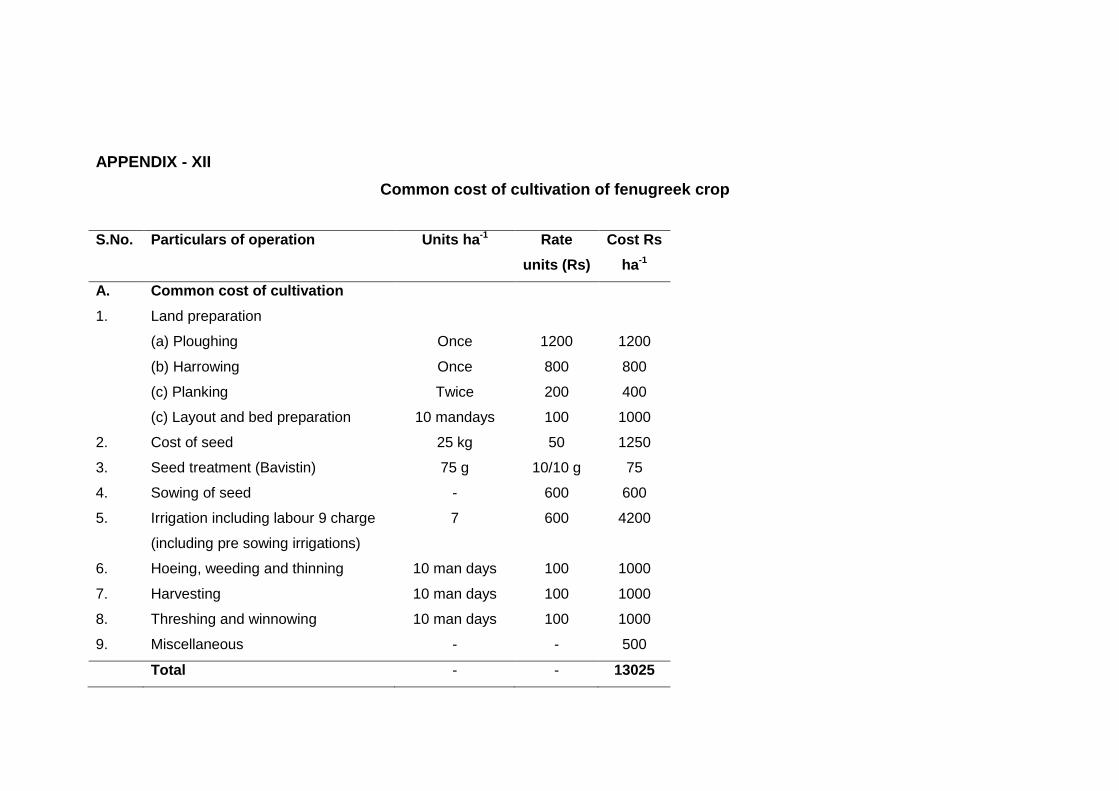
APPENDIX - XII
Common cost of cultivation of fenugreek crop
S.No. Particulars of operation Units ha-1 Rate
units (Rs)
Cost Rs
ha-1
A. Common cost of cultivation
1. Land preparation
(a) Ploughing Once 1200 1200
(b) Harrowing Once 800 800
(c) Planking Twice 200 400
(c) Layout and bed preparation 10 mandays 100 1000
2. Cost of seed 25 kg 50 1250
3. Seed treatment (Bavistin) 75 g 10/10 g 75
4. Sowing of seed - 600 600
5. Irrigation including labour 9 charge
(including pre sowing irrigations)
7 600 4200
6. Hoeing, weeding and thinning 10 man days 100 1000
7. Harvesting 10 man days 100 1000
8. Threshing and winnowing 10 man days 100 1000
9. Miscellaneous - - 500
Total - - 13025
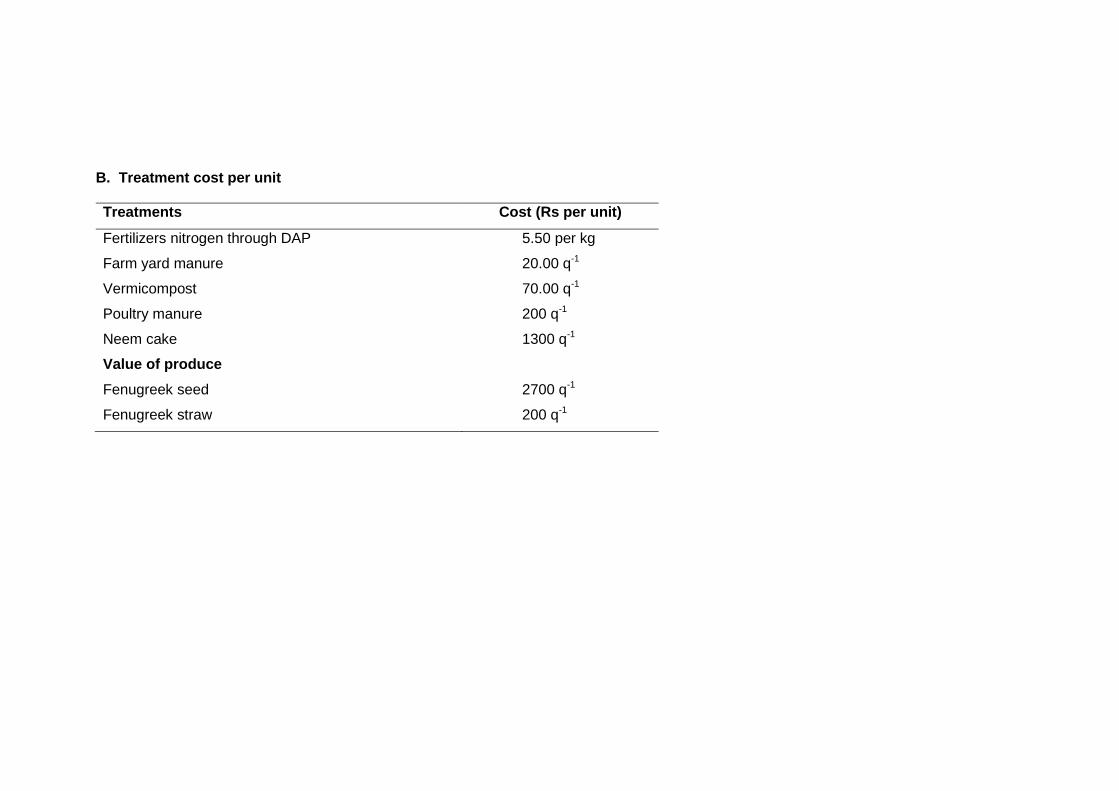
B. Treatment cost per unit
Treatments Cost (Rs per unit)
Fertilizers nitrogen through DAP 5.50 per kg
Farm yard manure 20.00 q-1
Vermicompost 70.00 q-1
Poultry manure 200 q-1
Neem cake 1300 q-1
Value of produce
Fenugreek seed 2700 q-1
Fenugreek straw 200 q-1
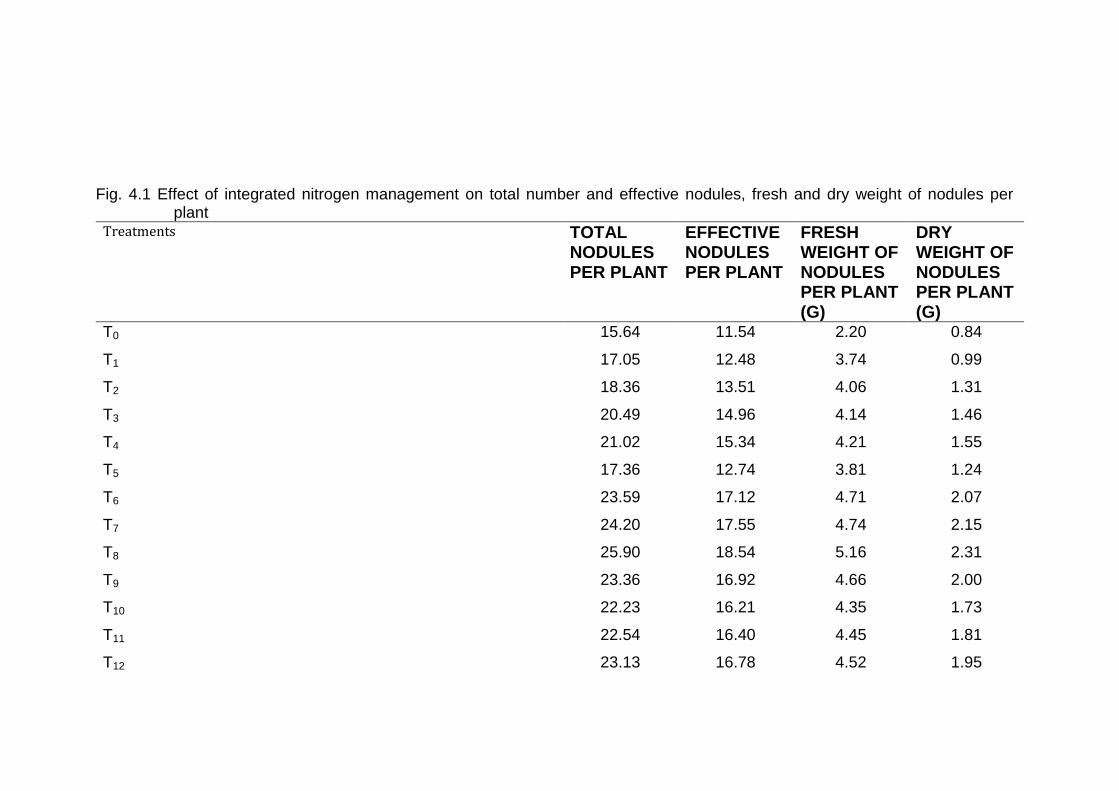
Fig. 4.1 Effect of integrated nitrogen management on total number and effective nodules, fresh and dry weight of nodules per plant
Treatments TOTAL NODULES PER PLANT
EFFECTIVE NODULES PER PLANT
FRESH WEIGHT OF NODULES PER PLANT (G)
DRY WEIGHT OF NODULES PER PLANT (G)
T0 15.64 11.54 2.20 0.84
T1 17.05 12.48 3.74 0.99
T2 18.36 13.51 4.06 1.31
T3 20.49 14.96 4.14 1.46
T4 21.02 15.34 4.21 1.55
T5 17.36 12.74 3.81 1.24
T6 23.59 17.12 4.71 2.07
T7 24.20 17.55 4.74 2.15
T8 25.90 18.54 5.16 2.31
T9 23.36 16.92 4.66 2.00
T10 22.23 16.21 4.35 1.73
T11 22.54 16.40 4.45 1.81
T12 23.13 16.78 4.52 1.95
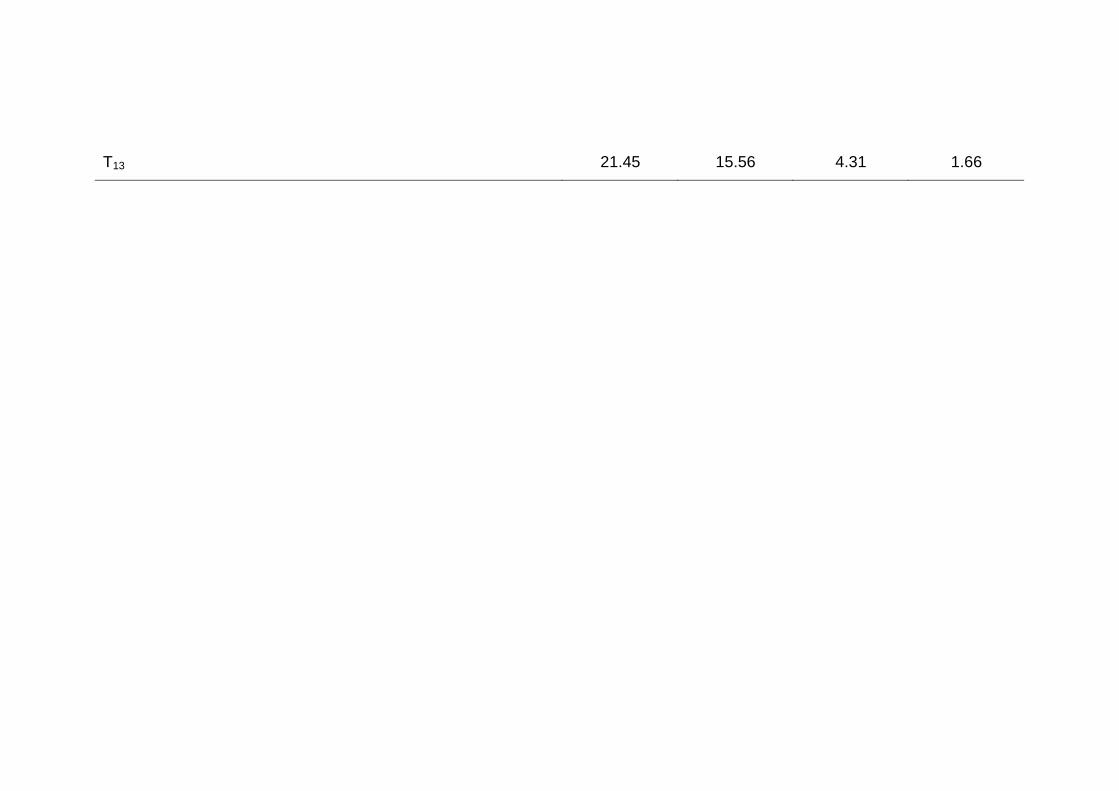
T13 21.45 15.56 4.31 1.66
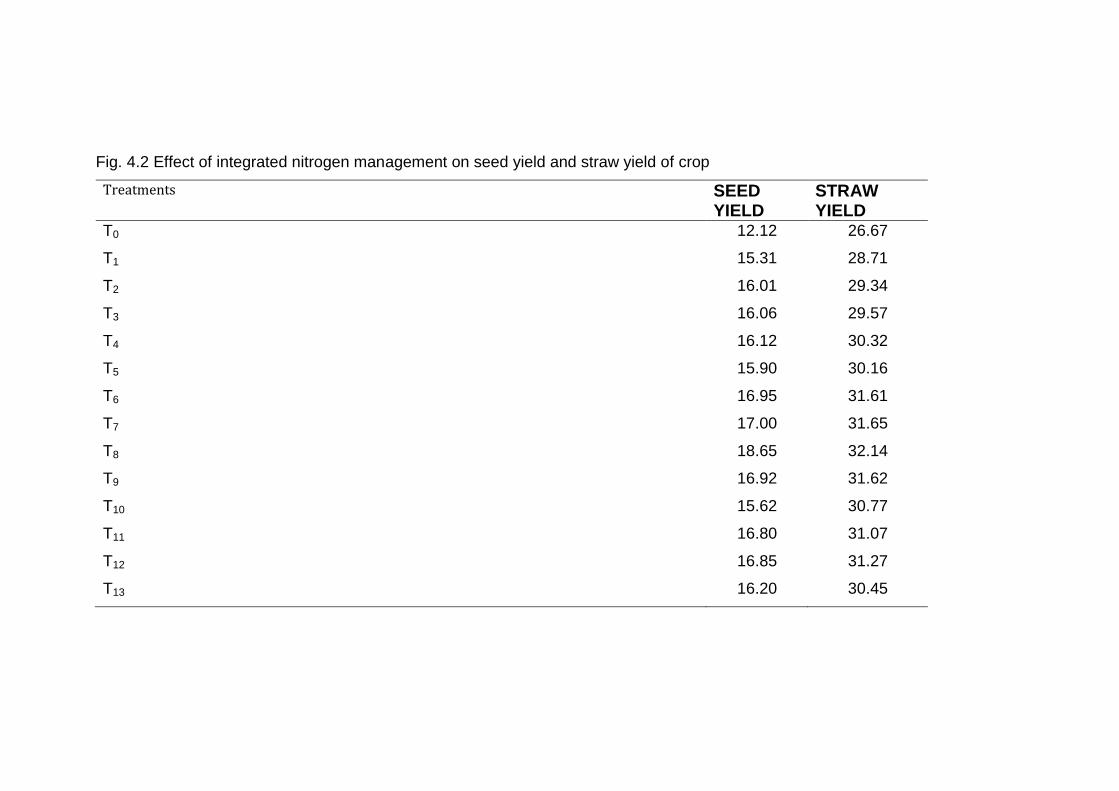
Fig. 4.2 Effect of integrated nitrogen management on seed yield and straw yield of crop
Treatments SEED YIELD
STRAW YIELD
T0 12.12 26.67
T1 15.31 28.71
T2 16.01 29.34
T3 16.06 29.57
T4 16.12 30.32
T5 15.90 30.16
T6 16.95 31.61
T7 17.00 31.65
T8 18.65 32.14
T9 16.92 31.62
T10 15.62 30.77
T11 16.80 31.07
T12 16.85 31.27
T13 16.20 30.45
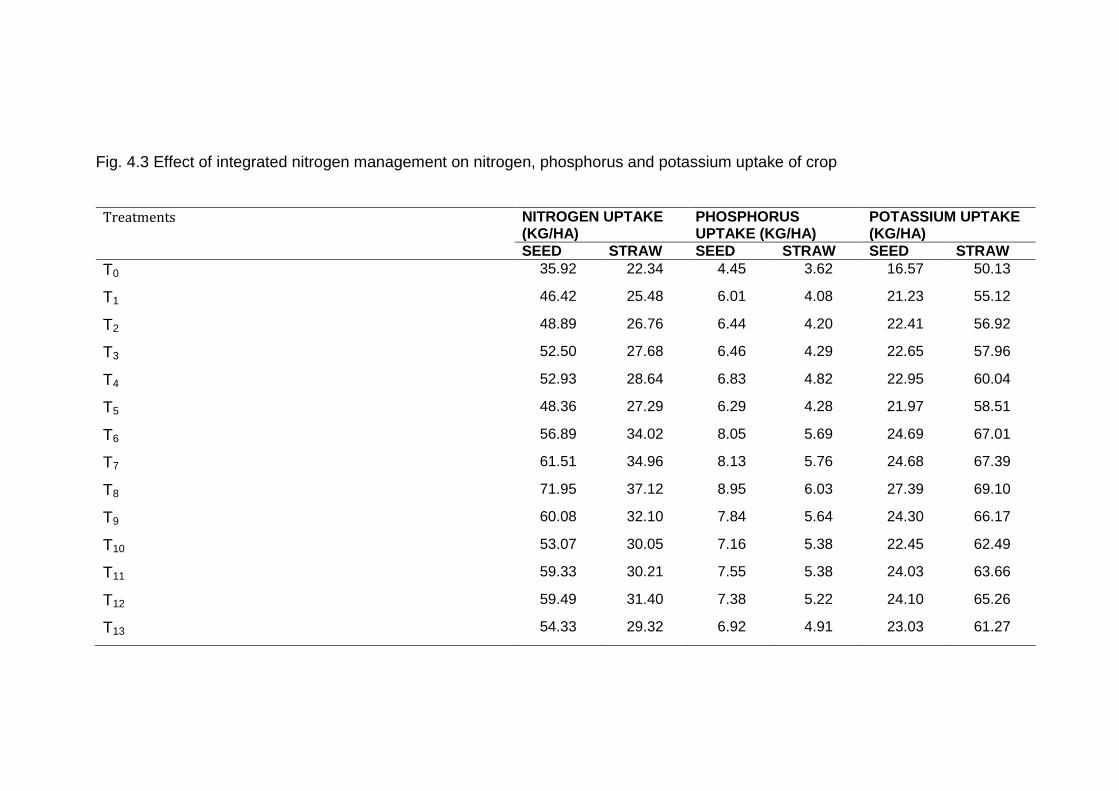
Fig. 4.3 Effect of integrated nitrogen management on nitrogen, phosphorus and potassium uptake of crop
Treatments NITROGEN UPTAKE (KG/HA)
PHOSPHORUS UPTAKE (KG/HA)
POTASSIUM UPTAKE (KG/HA)
SEED STRAW SEED STRAW SEED STRAW
T0 35.92 22.34 4.45 3.62 16.57 50.13
T1 46.42 25.48 6.01 4.08 21.23 55.12
T2 48.89 26.76 6.44 4.20 22.41 56.92
T3 52.50 27.68 6.46 4.29 22.65 57.96
T4 52.93 28.64 6.83 4.82 22.95 60.04
T5 48.36 27.29 6.29 4.28 21.97 58.51
T6 56.89 34.02 8.05 5.69 24.69 67.01
T7 61.51 34.96 8.13 5.76 24.68 67.39
T8 71.95 37.12 8.95 6.03 27.39 69.10
T9 60.08 32.10 7.84 5.64 24.30 66.17
T10 53.07 30.05 7.16 5.38 22.45 62.49
T11 59.33 30.21 7.55 5.38 24.03 63.66
T12 59.49 31.40 7.38 5.22 24.10 65.26
T13 54.33 29.32 6.92 4.91 23.03 61.27
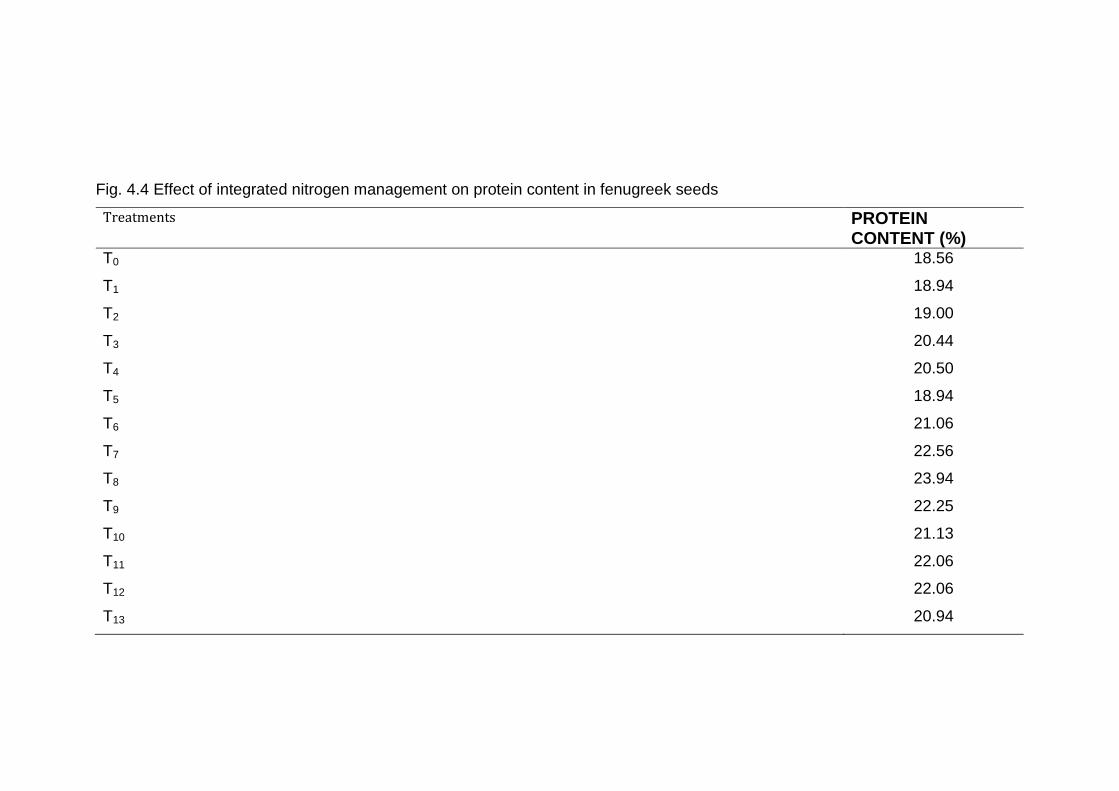
Fig. 4.4 Effect of integrated nitrogen management on protein content in fenugreek seeds
Treatments PROTEIN CONTENT (%)
T0 18.56
T1 18.94
T2 19.00
T3 20.44
T4 20.50
T5 18.94
T6 21.06
T7 22.56
T8 23.94
T9 22.25
T10 21.13
T11 22.06
T12 22.06
T13 20.94
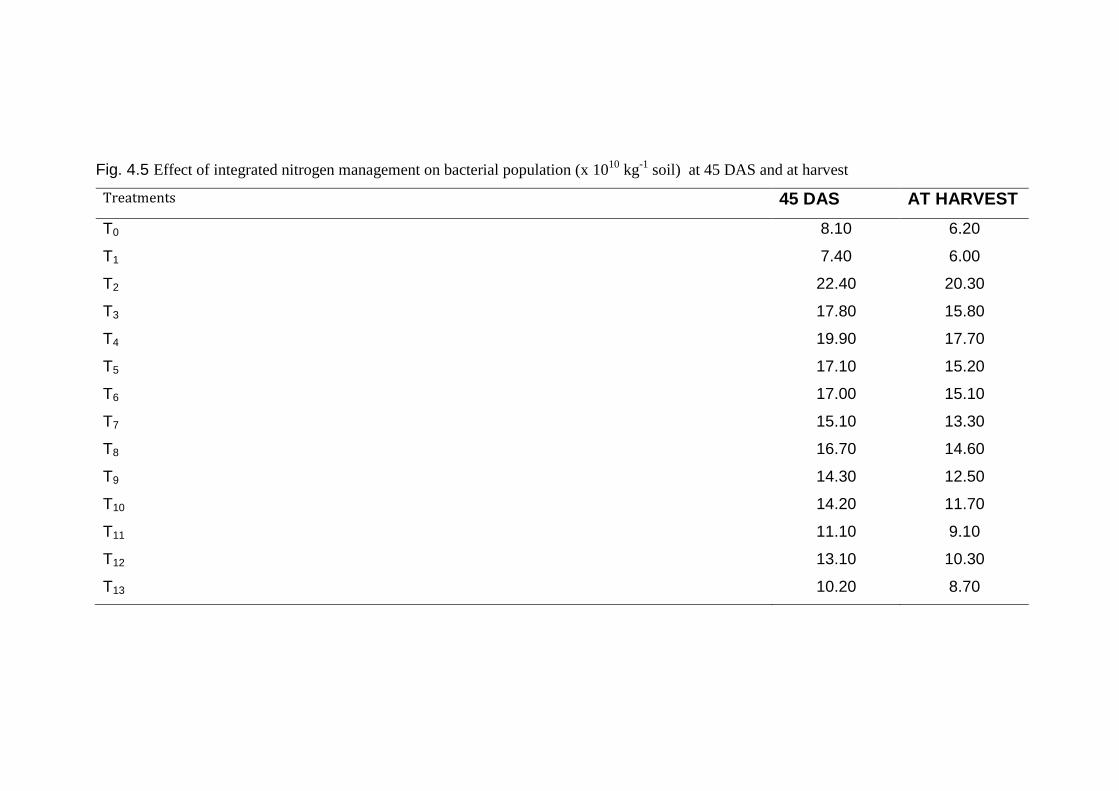
Fig. 4.5 Effect of integrated nitrogen management on bacterial population (x 1010
kg-1
soil) at 45 DAS and at harvest
Treatments 45 DAS AT HARVEST
T0 8.10 6.20
T1 7.40 6.00
T2 22.40 20.30
T3 17.80 15.80
T4 19.90 17.70
T5 17.10 15.20
T6 17.00 15.10
T7 15.10 13.30
T8 16.70 14.60
T9 14.30 12.50
T10 14.20 11.70
T11 11.10 9.10
T12 13.10 10.30
T13 10.20 8.70
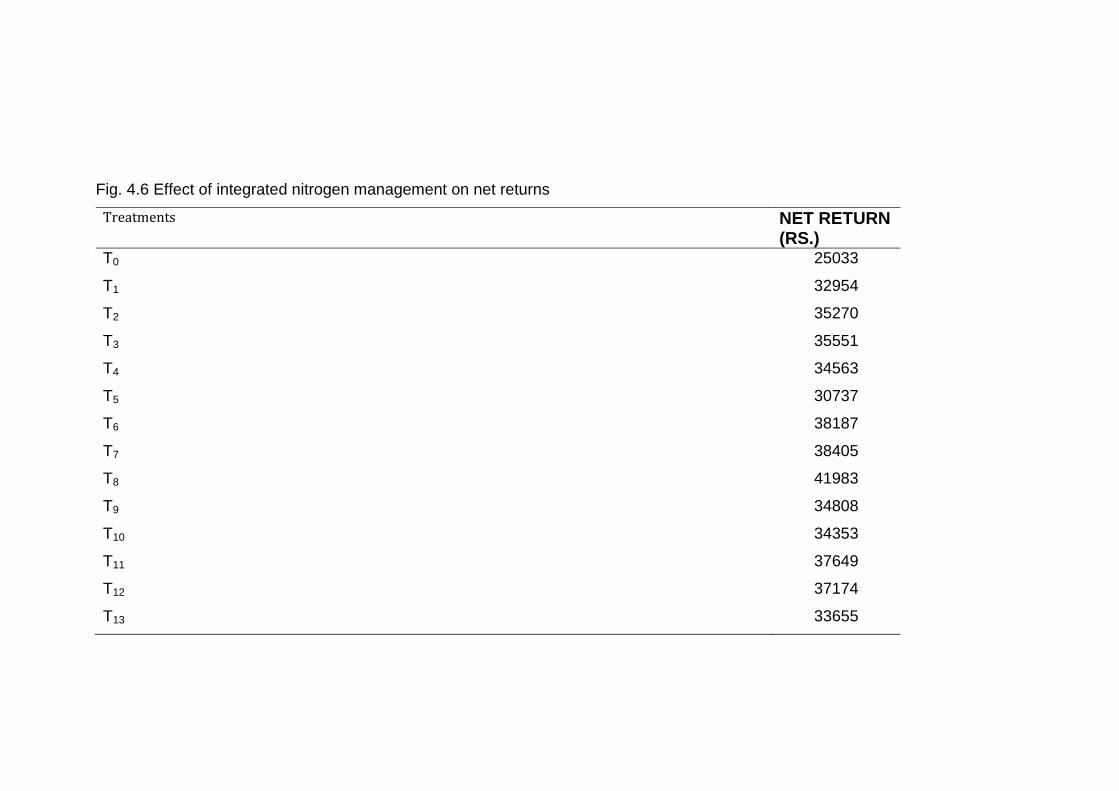
Fig. 4.6 Effect of integrated nitrogen management on net returns
Treatments NET RETURN (RS.)
T0 25033
T1 32954
T2 35270
T3 35551
T4 34563
T5 30737
T6 38187
T7 38405
T8 41983
T9 34808
T10 34353
T11 37649
T12 37174
T13 33655
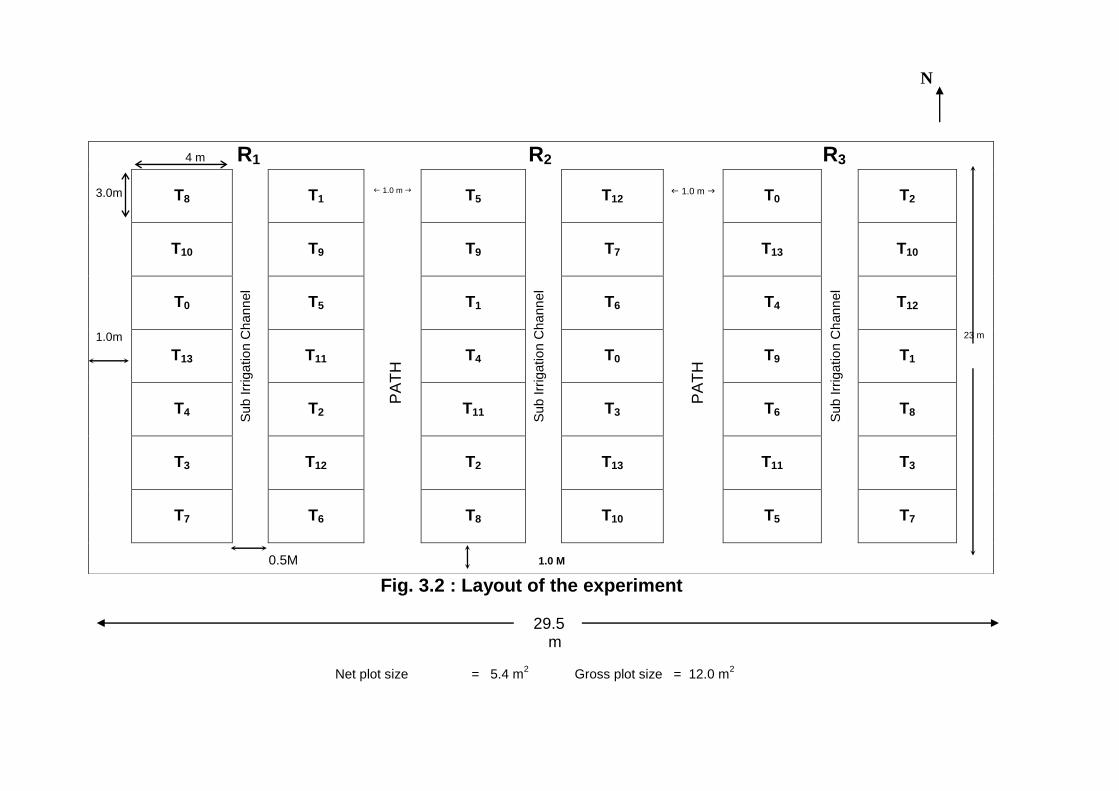
Fig. 3.2 : Layout of the experiment
29.5 m
Net plot size = 5.4 m
2 Gross plot size = 12.0 m
2
4 m R1 R2 R3
3.0m T8
Sub I
rrig
atio
n C
hann
el
T1 1.0 m T5
Sub I
rrig
atio
n C
hann
el
T12 1.0 m T0
Sub I
rrig
atio
n C
hann
el
T2
T10 T9
PA
TH
T9 T7
PA
TH
T13 T10
T0 T5 T1 T6 T4 T12
1.0m T13 T11 T4 T0 T9 T1
23 m
T4 T2 T11 T3 T6 T8
T3 T12 T2 T13 T11 T3
T7 T6 T8 T10 T5 T7
0.5M 1.0 M
N
Treatment combination = 14 Replication = 3 Total plot = 42