
Nanoconfined, dynamic electrolyte gating and memory effects ...

INTERNATIONAL JOURNAL OF ENERGY RESEARCHInt. J. Energy Res. 2007; 31:390–411Published online 18 October 2006 in Wiley InterScience(www.interscience.wiley.com) DOI: 10.1002/er.1257
Effect of flow field design on the performance ofelevated-temperature polymer electrolyte fuel cells
Puneet K. Sinha1,2, Chao-Yang Wang1,2,*,y and Uwe Beuscher3
1Electrochemical Engine Center (ECEC), The Pennsylvania State University, University Park, PA 16802, U.S.A.2Department of Mechanical and Nuclear Engineering, The Pennsylvania State University, University Park,
PA 16802, U.S.A.3Gore Fuel Cell Technologies, W.L. Gore & Associates, Inc., 201 Airport Road, Elkton, MD 21921, U.S.A.
SUMMARY
In our previous work, operation of polymer electrolyte fuel cell (PEFC) at 95oC was investigated in detailand it was found that dry operation of PEFC at elevated temperatures makes the parallel flow field design aviable design option for high temperature applications such as for automobiles. In this work, a three-dimensional, non-isothermal PEFC model is used to compare the performance of a 25 cm2 fuel cell withserpentine and parallel flow field design operated at 95oC under various inlet humidity conditions.Numerical results show that the parallel flow field provides better and more uniformly distributedperformance over the whole active area which makes the parallel flow field a better design compared to theserpentine flow field for PEFCs operated at elevated temperature and low inlet relative humidity.Copyright # 2006 John Wiley & Sons, Ltd.
KEY WORDS: 958C operation; polymer electrolyte fuel cell; non-isothermal model; parallel and serpentineflow field design
1. INTRODUCTION
Polymer electrolyte fuel cells (PEFC) are considered the most promising alternative power plantfor transportation because of their high efficiency, low emissions, low operating temperature,and low noise. Much efforts has been expended in last decade upon development of numericalmodels with more physical complexities to address electrochemical and transport phenomenainvolved in a fuel cell and occurring at disparate length and time scales. In the last 5 years,computational fluid dynamics (CFD)-based model were developed with the coupling of
*Correspondence to: Chao-Yang Wang, Department of Mechanical and Nuclear Engineering, The Pennsylvania StateUniversity, University Park, PA 16802, U.S.A.yE-mail: [email protected]
Contract/grant sponsor: W.L. Gore & Associates Inc.
Received 29 May 2006Revised 17 July 2006
Accepted 24 July 2006Copyright # 2006 John Wiley & Sons, Ltd.
multi-dimensional transport phenomena with electrochemical kinetics and charge transport toprovide a comprehensive understanding of fuel cell dynamics. For CFD modelling of PEFC,one can refer to Wang (2004) and references therein.
PEFC performance is largely influenced by the flow field design. Over the years, several flowfield designs were proposed and the effect of the flow field design on PEFC performance wasinvestigated in detail (Mench et al., 2001; Pasaogullari and Wang, 2002; Glandt et al., 2002;Wang and Wang, 2006). Two flow field designs are commonly used in practice: the serpentineflow field and the parallel flow field. The parallel flow field incurs less pressure drop betweeninlet and outlet of the gas channels in comparison to the serpentine flow field. The parallel flowfield also provides a more uniform distribution of reactant over the whole active area. A maindisadvantage of the parallel flow field design, however, is clogging of the gas channel by liquidwater. Once a channel becomes clogged, the active area under it becomes inactive for rest of theoperation, whereas the serpentine flow field can flush out liquid water more easily via high gasflow rate and gas bypassing through gas diffusion layer (GDL) is possible as well. Typically, thisdrawback of parallel flow field design restricts their use in PEFC.
Sinha et al. (2006) investigated species, heat and charge transport in a PEFC operated at95oC. They identified better oxygen reduction reaction (ORR) kinetics, low membranehydration and dominant oxygen depletion as main characteristics of cell operation at thiselevated temperature. They also showed that dry operation of cell results in a relative humidity(RH) less than unity in both anode and cathode gas channels. This eliminates the possibility ofchannel clogging and makes the parallel flow field an attractive design option for high-temperature applications such as for automobiles. The comparison of elevated-temperaturePEFC performance with parallel flow field design and serpentine flow field design can provide abetter assessment of the feasibility of the parallel flow field as a design option for high-temperature applications.
The main objective of this paper is to provide a detailed comparison of the PEFCperformance operated at 95oC with parallel and serpentine flow field designs using the three-dimensional electrochemical reaction-transport-thermal coupled PEFC model presented bySinha et al. (2006). We aim to compare not only the cell performance in terms of cell voltage, butalso the current density distribution and other key parameters over the whole active area for thetwo flow field designs under various operating conditions.
2. NUMERICAL MODEL
The present three-dimensional, non-isothermal, electrochemical and transport fully coupledPEFC model is developed based on the previous work of Um et al. (2000), Meng and Wang(2004a) and Ju et al. (2005a) and has been described in detail by Sinha et al. (2006). Thus, only abrief summary of the model assumptions is repeated here:
1. Ideal gas mixtures;2. Isotropic and homogenous electrode, catalyst layers and membrane;3. Incompressible and laminar flow due to small pressure gradient and flow velocities; and4. Single-phase assumption for water transport.
Assumption 4 is valid under the condition that the liquid saturation within the GDL is low orliquid droplets are small and dispersed in gas to form a mist flow. The PEFC model is
PERFORMANCE OF ELEVATED-TEMPERATURE PEFC 391
Copyright # 2006 John Wiley & Sons, Ltd. Int. J. Energy Res. 2007; 31:390–411
DOI: 10.1002/er
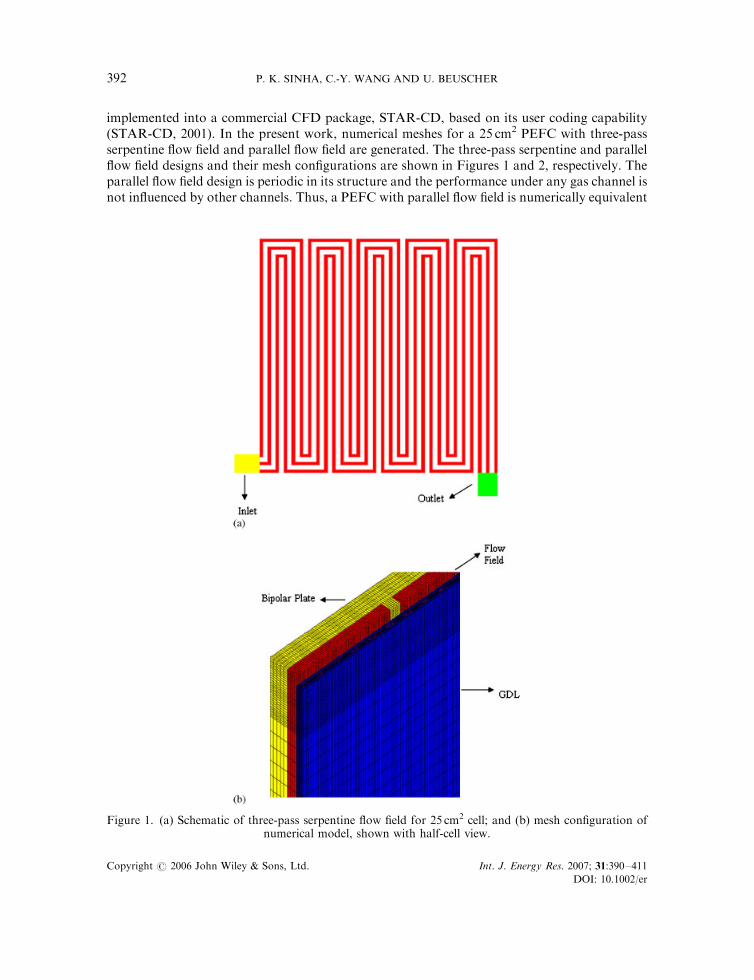
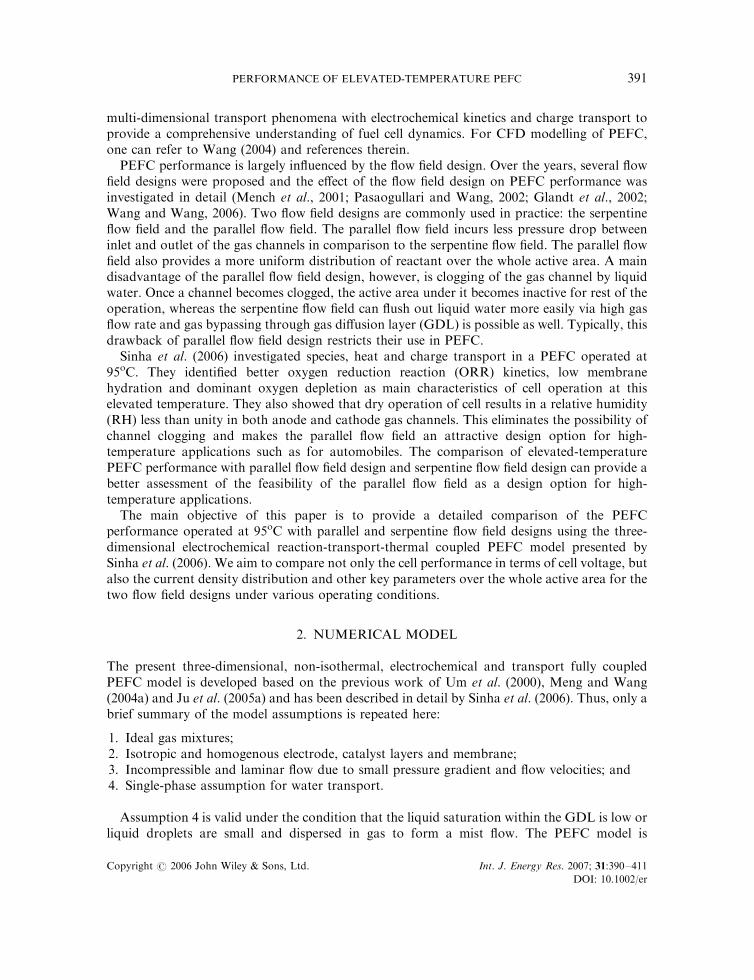
implemented into a commercial CFD package, STAR-CD, based on its user coding capability(STAR-CD, 2001). In the present work, numerical meshes for a 25 cm2 PEFC with three-passserpentine flow field and parallel flow field are generated. The three-pass serpentine and parallelflow field designs and their mesh configurations are shown in Figures 1 and 2, respectively. Theparallel flow field design is periodic in its structure and the performance under any gas channel isnot influenced by other channels. Thus, a PEFC with parallel flow field is numerically equivalent
Figure 1. (a) Schematic of three-pass serpentine flow field for 25 cm2 cell; and (b) mesh configuration ofnumerical model, shown with half-cell view.
P. K. SINHA, C.-Y. WANG AND U. BEUSCHER392
Copyright # 2006 John Wiley & Sons, Ltd. Int. J. Energy Res. 2007; 31:390–411
DOI: 10.1002/er
to a single-channel unit cell, cut out from the 25 cm2 cell with parallel flow field as shownin Figure 2(b), having the same dimensions in the through plane and along the flow directionwith a periodic extension in the in-plane direction. The single-channel unit cell is shown inFigure 2(c).
Based on the grid independence study of Meng and Wang (2004b), roughly 2.0 millioncomputational cells are applied to the three-pass serpentine flow field geometry androughly 94 000 computational cells to the single-channel geometry. This model requiresabout 270 s per iteration on a 8 PC cluster (1.4GHz) for the three-pass serpentinegeometry and about 15 s per iteration on a single PC (2GHz) for the single-channelgeometry.
Figure 2. (a) Schematic of parallel flow field for 25 cm2 cell; (b) cutting plane for a single-channel unit cell;and (c) schematic of unit cell cut out of cell with parallel flow field.
PERFORMANCE OF ELEVATED-TEMPERATURE PEFC 393
Copyright # 2006 John Wiley & Sons, Ltd. Int. J. Energy Res. 2007; 31:390–411
DOI: 10.1002/er
3. RESULTS AND DISCUSSION
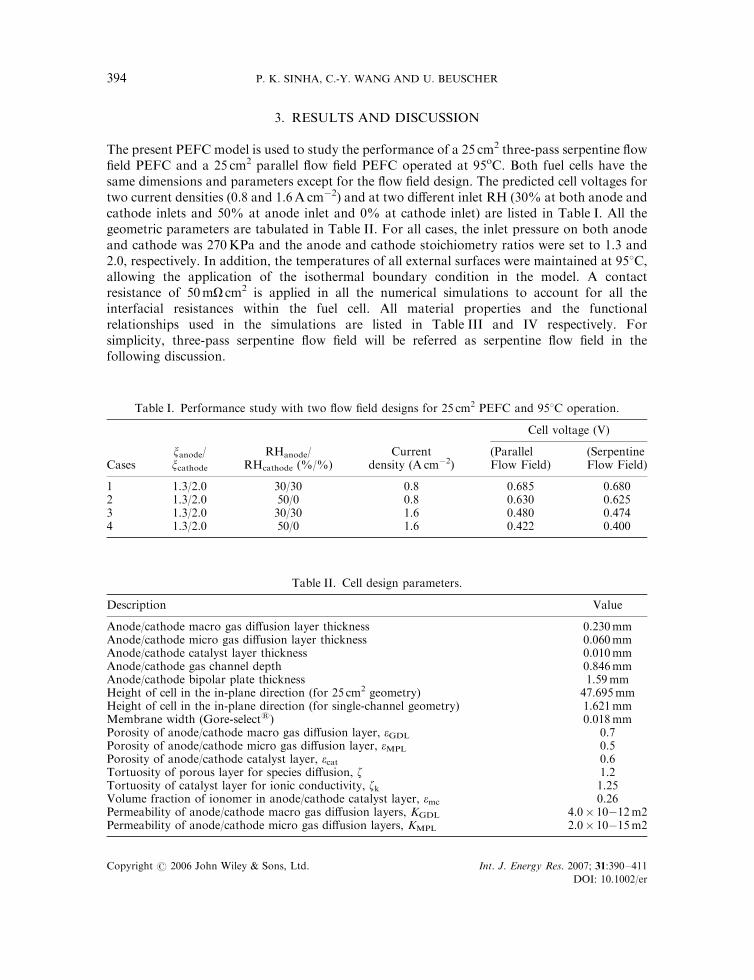
The present PEFC model is used to study the performance of a 25 cm2 three-pass serpentine flowfield PEFC and a 25 cm2 parallel flow field PEFC operated at 95oC. Both fuel cells have thesame dimensions and parameters except for the flow field design. The predicted cell voltages fortwo current densities (0.8 and 1.6A cm�2) and at two different inlet RH (30% at both anode andcathode inlets and 50% at anode inlet and 0% at cathode inlet) are listed in Table I. All thegeometric parameters are tabulated in Table II. For all cases, the inlet pressure on both anodeand cathode was 270KPa and the anode and cathode stoichiometry ratios were set to 1.3 and2.0, respectively. In addition, the temperatures of all external surfaces were maintained at 958C,allowing the application of the isothermal boundary condition in the model. A contactresistance of 50mO cm2 is applied in all the numerical simulations to account for all theinterfacial resistances within the fuel cell. All material properties and the functionalrelationships used in the simulations are listed in Table III and IV respectively. Forsimplicity, three-pass serpentine flow field will be referred as serpentine flow field in thefollowing discussion.
Table I. Performance study with two flow field designs for 25 cm2 PEFC and 958C operation.
Cell voltage (V)
Casesxanode/xcathode
RHanode/RHcathode (%/%)
Currentdensity (A cm�2)
(ParallelFlow Field)
(SerpentineFlow Field)
1 1.3/2.0 30/30 0.8 0.685 0.6802 1.3/2.0 50/0 0.8 0.630 0.6253 1.3/2.0 30/30 1.6 0.480 0.4744 1.3/2.0 50/0 1.6 0.422 0.400
Table II. Cell design parameters.
Description Value
Anode/cathode macro gas diffusion layer thickness 0.230mmAnode/cathode micro gas diffusion layer thickness 0.060mmAnode/cathode catalyst layer thickness 0.010mmAnode/cathode gas channel depth 0.846mmAnode/cathode bipolar plate thickness 1.59mmHeight of cell in the in-plane direction (for 25 cm2 geometry) 47.695mmHeight of cell in the in-plane direction (for single-channel geometry) 1.621mmMembrane width (Gore-select1) 0.018mmPorosity of anode/cathode macro gas diffusion layer, eGDL 0.7Porosity of anode/cathode micro gas diffusion layer, eMPL 0.5Porosity of anode/cathode catalyst layer, ecat 0.6Tortuosity of porous layer for species diffusion, z 1.2Tortuosity of catalyst layer for ionic conductivity, zk 1.25Volume fraction of ionomer in anode/cathode catalyst layer, emc 0.26Permeability of anode/cathode macro gas diffusion layers, KGDL 4.0� 10�12m2Permeability of anode/cathode micro gas diffusion layers, KMPL 2.0� 10�15m2
P. K. SINHA, C.-Y. WANG AND U. BEUSCHER394
Copyright # 2006 John Wiley & Sons, Ltd. Int. J. Energy Res. 2007; 31:390–411
DOI: 10.1002/er
As shown in Table I, the parallel flow field design provides higher cell voltage in comparisonto the serpentine flow field design. Although the difference in cell voltage is small (within 5mV)for 0.8A cm�2, it is large for 1.6A cm�2 average current density. In addition to comparing thenet performance for these two designs it is also necessary to investigate the uniformity of thedistribution of performance over the whole active area. A more uniform distribution indicates abetter utilization of the whole active area and is preferred. For the present study thedistributions of water activity, ionic conductivity and current density over the whole active areaare chosen representative for the cell performance.
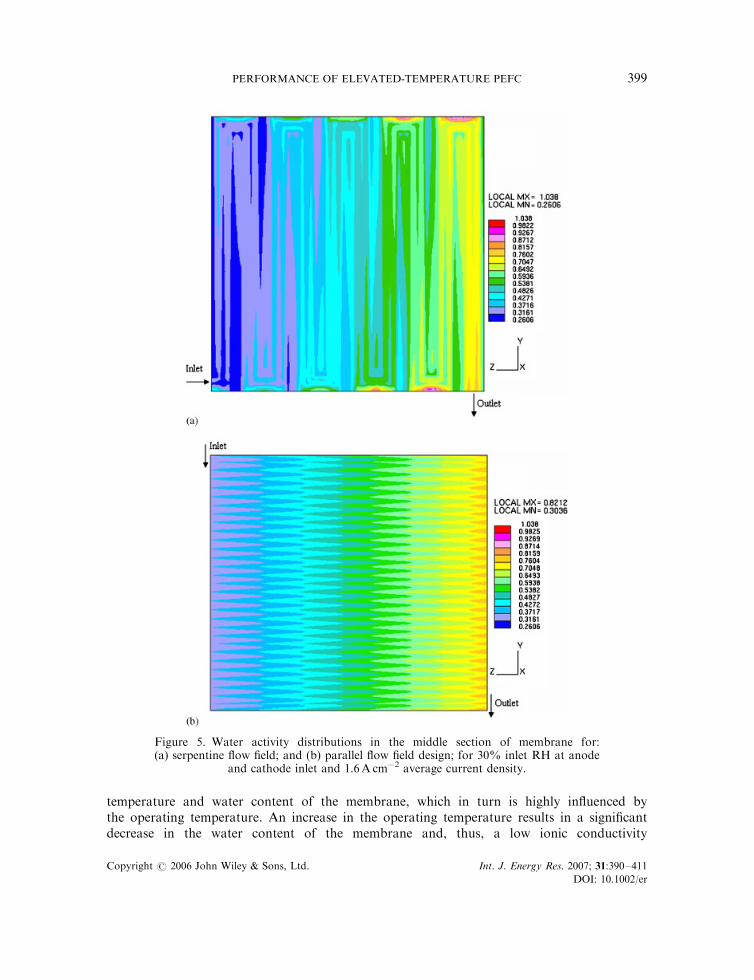
Figures 3 and 4 show the distributions of water activity in the middle section of the membranefor serpentine and parallel flow field designs at 0.8A cm�2 average current density. Wateractivity in the membrane increases along the flow direction due to water production in thecathode catalyst layer. As seen from the Figures 3 and 4, the tortuous serpentine flow fieldprovides better water retention at the U-turns and, hence, results in higher water activity at theselocations. Whereas, due to the independent functionality of each channel in the parallel flowfield, the variation of water activity is equal under each channel and results in a periodicdistribution of water activity over the whole active area. Membranes are better hydrated for1.6A cm�2 average current density, as shown in Figures 5 and 6. As shown in Figures 5 and 6,
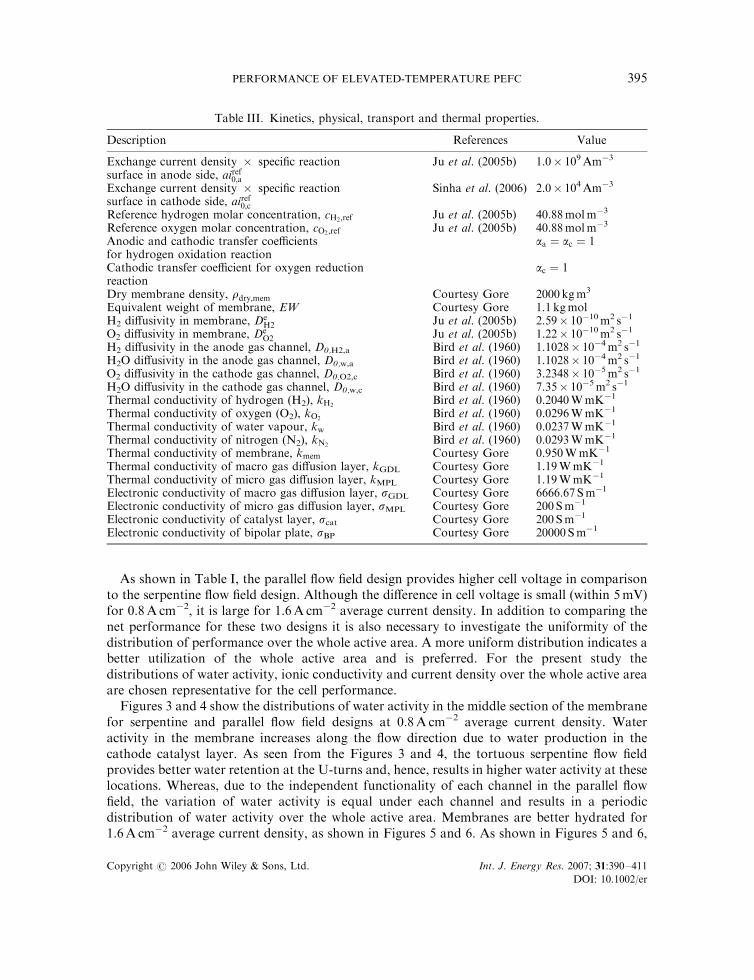
Table III. Kinetics, physical, transport and thermal properties.
Description References Value
Exchange current density � specific reactionsurface in anode side, airef0;a
Ju et al. (2005b) 1.0� 109Am�3
Exchange current density � specific reactionsurface in cathode side, airef0;c
Sinha et al. (2006) 2.0� 104Am�3
Reference hydrogen molar concentration, cH2 ;ref Ju et al. (2005b) 40.88molm�3
Reference oxygen molar concentration, cO2 ;ref Ju et al. (2005b) 40.88molm�3
Anodic and cathodic transfer coefficientsfor hydrogen oxidation reaction
aa ¼ ac ¼ 1
Cathodic transfer coefficient for oxygen reductionreaction
ac ¼ 1
Dry membrane density, rdry;mem Courtesy Gore 2000 kgm3
Equivalent weight of membrane, EW Courtesy Gore 1.1 kgmolH2 diffusivity in membrane, De
H2 Ju et al. (2005b) 2.59� 10�10m2 s�1
O2 diffusivity in membrane, DeO2 Ju et al. (2005b) 1.22� 10�10m2 s�1
H2 diffusivity in the anode gas channel, D0,H2,a Bird et al. (1960) 1.1028� 10�4m2 s�1
H2O diffusivity in the anode gas channel, D0,w,a Bird et al. (1960) 1.1028� 10�4m2 s�1
O2 diffusivity in the cathode gas channel, D0,O2,c Bird et al. (1960) 3.2348� 10�5m2 s�1
H2O diffusivity in the cathode gas channel, D0,w,c Bird et al. (1960) 7.35� 10�5m2 s�1
Thermal conductivity of hydrogen (H2), kH2Bird et al. (1960) 0.2040WmK�1
Thermal conductivity of oxygen (O2), kO2Bird et al. (1960) 0.0296WmK�1
Thermal conductivity of water vapour, kw Bird et al. (1960) 0.0237WmK�1
Thermal conductivity of nitrogen (N2), kN2Bird et al. (1960) 0.0293WmK�1
Thermal conductivity of membrane, kmem Courtesy Gore 0.950WmK�1
Thermal conductivity of macro gas diffusion layer, kGDL Courtesy Gore 1.19WmK�1
Thermal conductivity of micro gas diffusion layer, kMPL Courtesy Gore 1.19WmK�1
Electronic conductivity of macro gas diffusion layer, sGDL Courtesy Gore 6666.67 Sm�1
Electronic conductivity of micro gas diffusion layer, sMPL Courtesy Gore 200 Sm�1
Electronic conductivity of catalyst layer, scat Courtesy Gore 200 Sm�1
Electronic conductivity of bipolar plate, sBP Courtesy Gore 20000 Sm�1
PERFORMANCE OF ELEVATED-TEMPERATURE PEFC 395
Copyright # 2006 John Wiley & Sons, Ltd. Int. J. Energy Res. 2007; 31:390–411
DOI: 10.1002/er
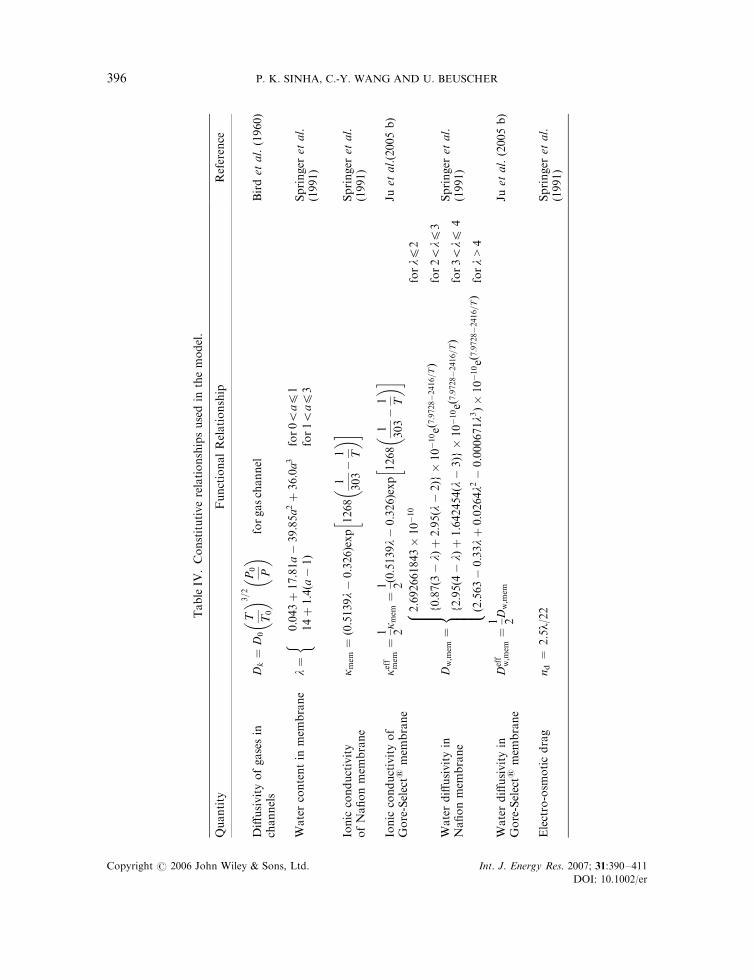
TableIV
.Constitutiverelationshipsusedin
themodel.
Quantity
FunctionalRelationship
Reference
Diffusivityofgasesin
channels
Dk¼
D0
T T0
�� 3=
2P0 P��
forgaschannel
Birdet
al.(1960)
Watercontentin
mem
brane
l¼
0:043þ
17:81a�
39:85a2þ
36:0a3
for05a41
14þ1:4ða�
1Þ
for15a43
�Springer
etal.
(1991)
Ionic
conductivity
ofNafionmem
brane
k mem¼ð0:5139l�0:326Þexp
1268
1
303�
1 T
��
��
Springer
etal.
(1991)
Ionic
conductivityof
Gore-Select1
mem
brane
keff mem¼
1 2k m
em¼
1 2ð0:5139l�
0:326Þexp
1268
1
303�
1 T
��
��
Juet
al.(2005b)
Waterdiffusivityin
Nafionmem
brane
Dw;m
em¼
2:692661843�10�10
forl4
2
0:87ð3�lÞþ
2:95ðl�2Þ
fg�
10�10e
7:9728�2416=T
ðÞ
for25l4
3
2:95ð4�lÞþ
1:642454ðl�3Þ
fg�
10�10e
7:9728�2416=T
ðÞ
for35l4
4
ð2:563�
0:33lþ
0:0264l2�
0:000671l3Þ�
10�10e
7:9728�2416=T
ðÞ
forl>4
8 > > > > > < > > > > > :Springer
etal.
(1991)
Waterdiffusivityin
Gore-Select1
mem
brane
Deff
w;m
em¼
1 2D
w;m
emJu
etal.(2005b)
Electro-osm
oticdrag
nd=
2.5l/22
Springer
etal.
(1991)
P. K. SINHA, C.-Y. WANG AND U. BEUSCHER396
Copyright # 2006 John Wiley & Sons, Ltd. Int. J. Energy Res. 2007; 31:390–411
DOI: 10.1002/er
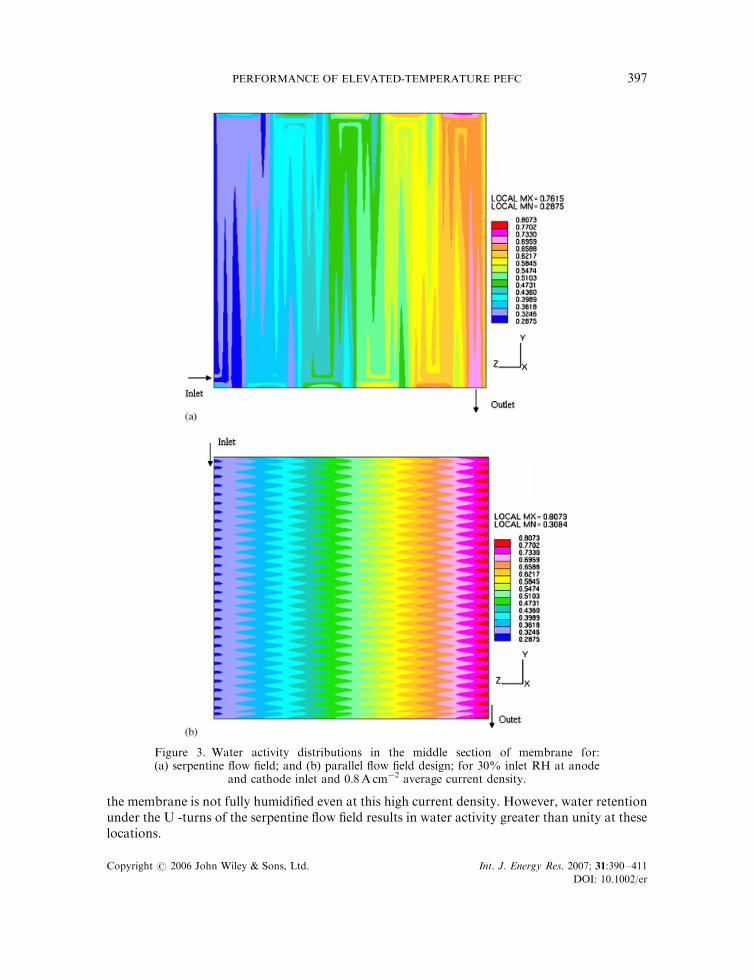
the membrane is not fully humidified even at this high current density. However, water retentionunder the U -turns of the serpentine flow field results in water activity greater than unity at theselocations.
Figure 3. Water activity distributions in the middle section of membrane for:(a) serpentine flow field; and (b) parallel flow field design; for 30% inlet RH at anode
and cathode inlet and 0.8A cm�2 average current density.
PERFORMANCE OF ELEVATED-TEMPERATURE PEFC 397
Copyright # 2006 John Wiley & Sons, Ltd. Int. J. Energy Res. 2007; 31:390–411
DOI: 10.1002/er
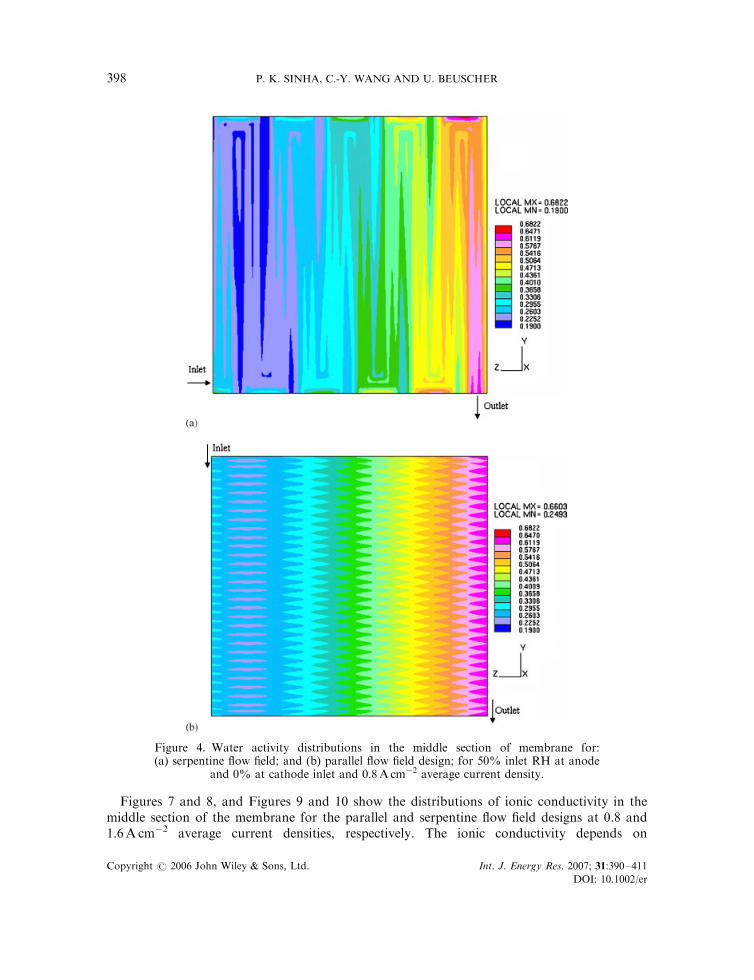
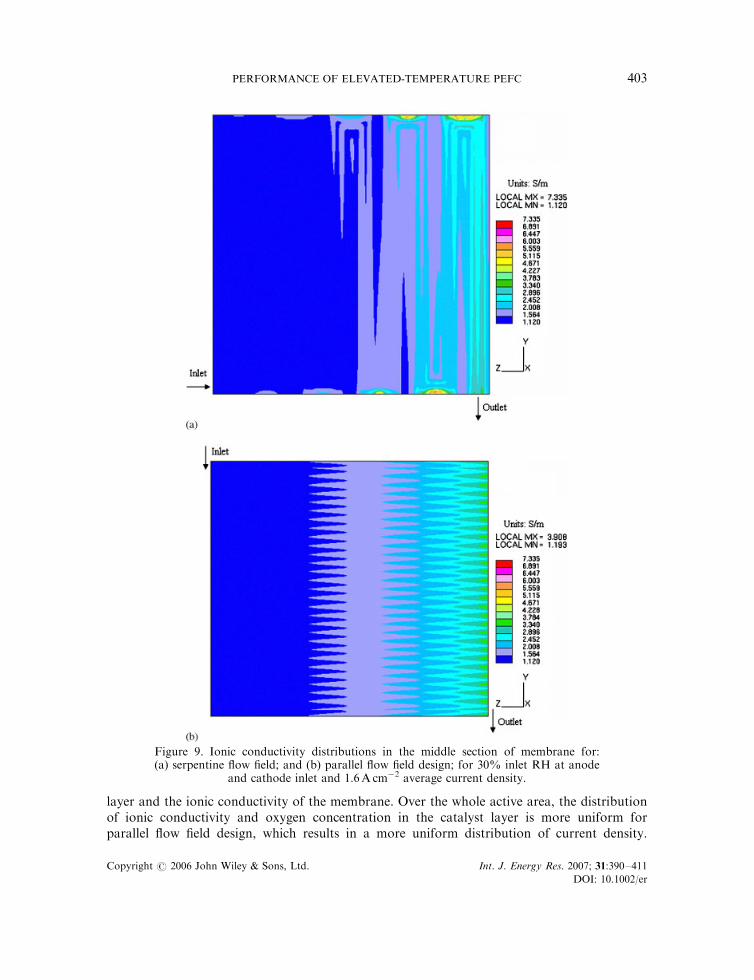
Figures 7 and 8, and Figures 9 and 10 show the distributions of ionic conductivity in themiddle section of the membrane for the parallel and serpentine flow field designs at 0.8 and1.6A cm�2 average current densities, respectively. The ionic conductivity depends on
Figure 4. Water activity distributions in the middle section of membrane for:(a) serpentine flow field; and (b) parallel flow field design; for 50% inlet RH at anode
and 0% at cathode inlet and 0.8A cm�2 average current density.
P. K. SINHA, C.-Y. WANG AND U. BEUSCHER398
Copyright # 2006 John Wiley & Sons, Ltd. Int. J. Energy Res. 2007; 31:390–411
DOI: 10.1002/er
temperature and water content of the membrane, which in turn is highly influenced bythe operating temperature. An increase in the operating temperature results in a significantdecrease in the water content of the membrane and, thus, a low ionic conductivity
Figure 5. Water activity distributions in the middle section of membrane for:(a) serpentine flow field; and (b) parallel flow field design; for 30% inlet RH at anode
and cathode inlet and 1.6A cm�2 average current density.
PERFORMANCE OF ELEVATED-TEMPERATURE PEFC 399
Copyright # 2006 John Wiley & Sons, Ltd. Int. J. Energy Res. 2007; 31:390–411
DOI: 10.1002/er
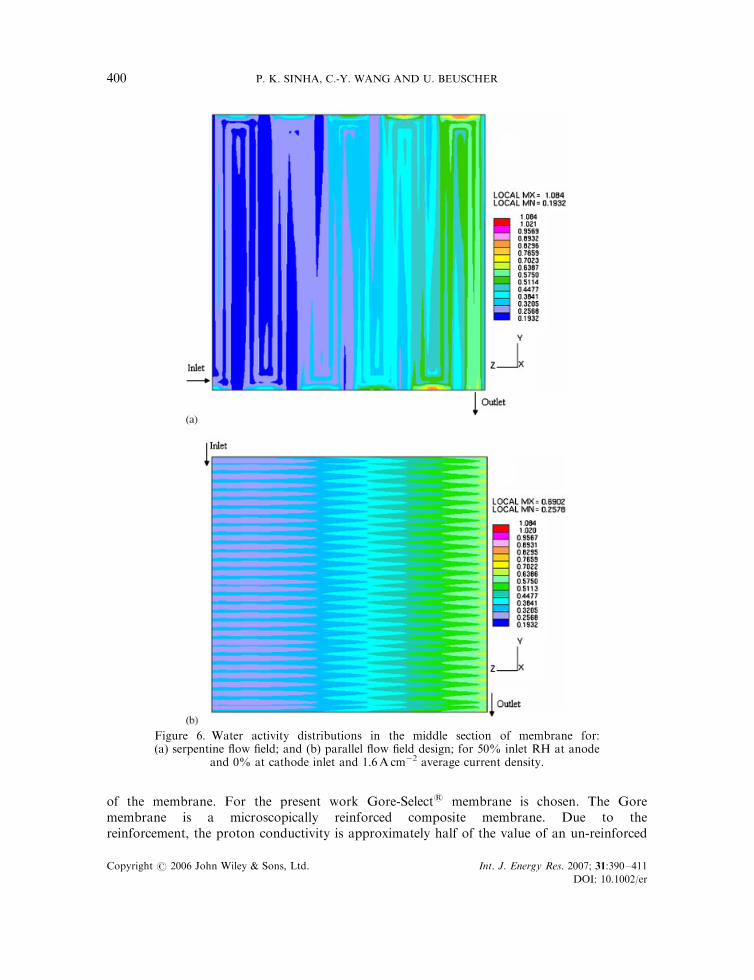
of the membrane. For the present work Gore-Select1 membrane is chosen. The Goremembrane is a microscopically reinforced composite membrane. Due to thereinforcement, the proton conductivity is approximately half of the value of an un-reinforced
Figure 6. Water activity distributions in the middle section of membrane for:(a) serpentine flow field; and (b) parallel flow field design; for 50% inlet RH at anode
and 0% at cathode inlet and 1.6A cm�2 average current density.
P. K. SINHA, C.-Y. WANG AND U. BEUSCHER400
Copyright # 2006 John Wiley & Sons, Ltd. Int. J. Energy Res. 2007; 31:390–411
DOI: 10.1002/er
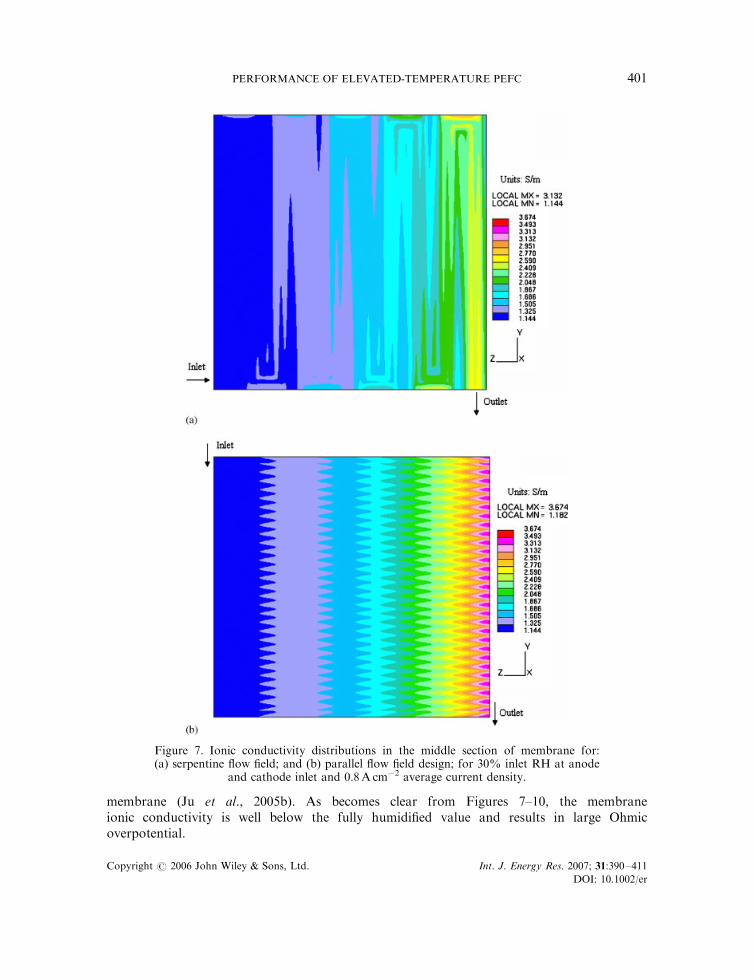
membrane (Ju et al., 2005b). As becomes clear from Figures 7–10, the membraneionic conductivity is well below the fully humidified value and results in large Ohmicoverpotential.
Figure 7. Ionic conductivity distributions in the middle section of membrane for:(a) serpentine flow field; and (b) parallel flow field design; for 30% inlet RH at anode
and cathode inlet and 0.8A cm�2 average current density.
PERFORMANCE OF ELEVATED-TEMPERATURE PEFC 401
Copyright # 2006 John Wiley & Sons, Ltd. Int. J. Energy Res. 2007; 31:390–411
DOI: 10.1002/er
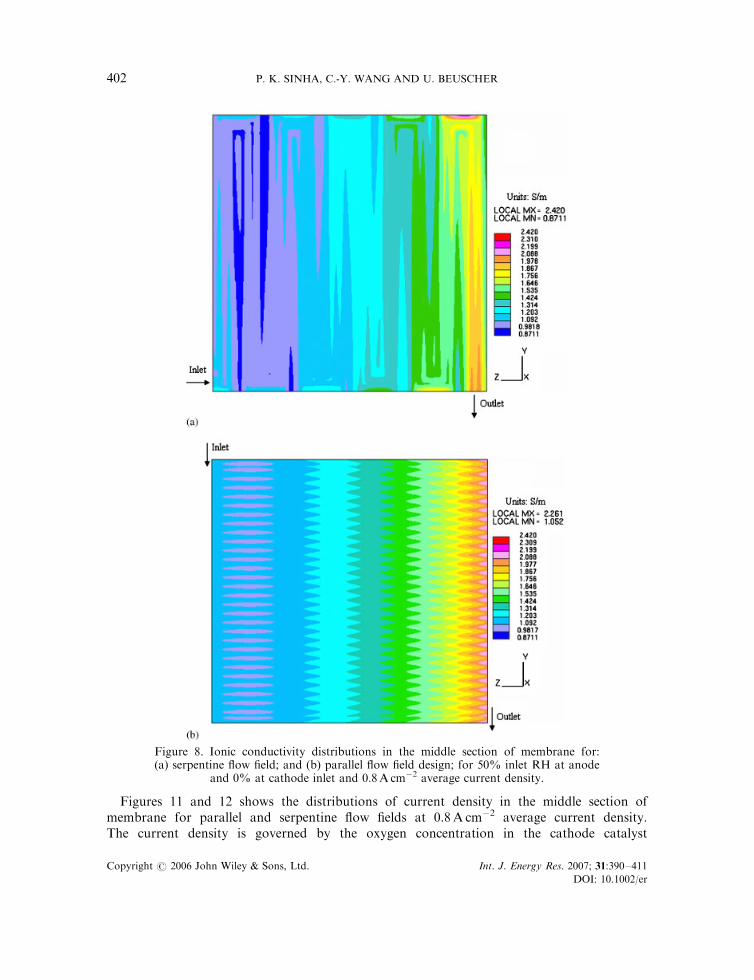
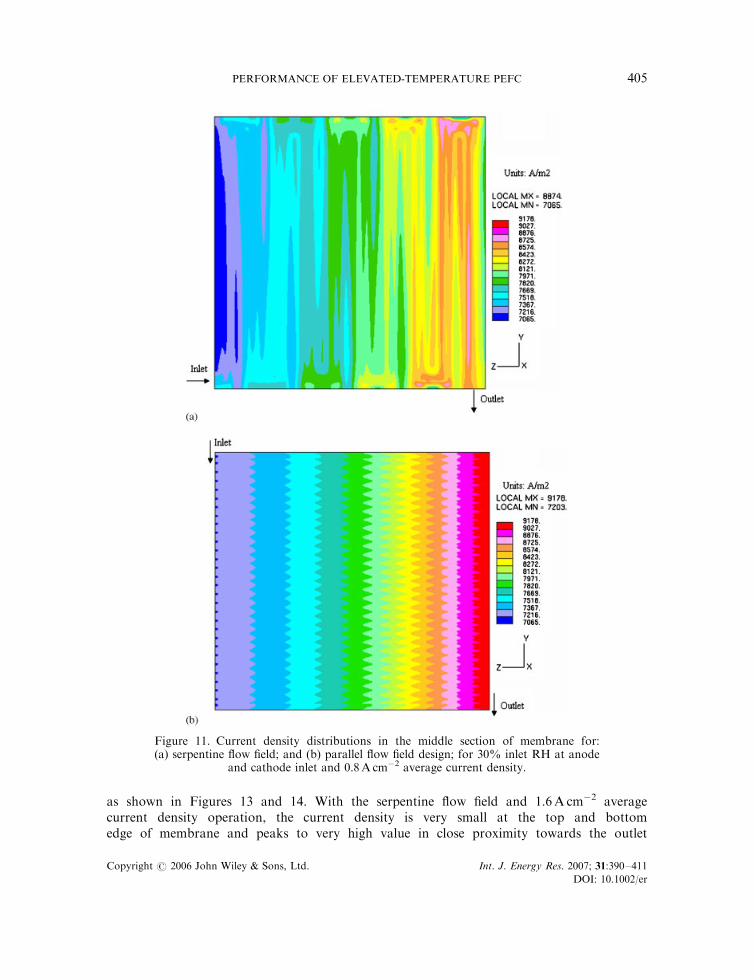
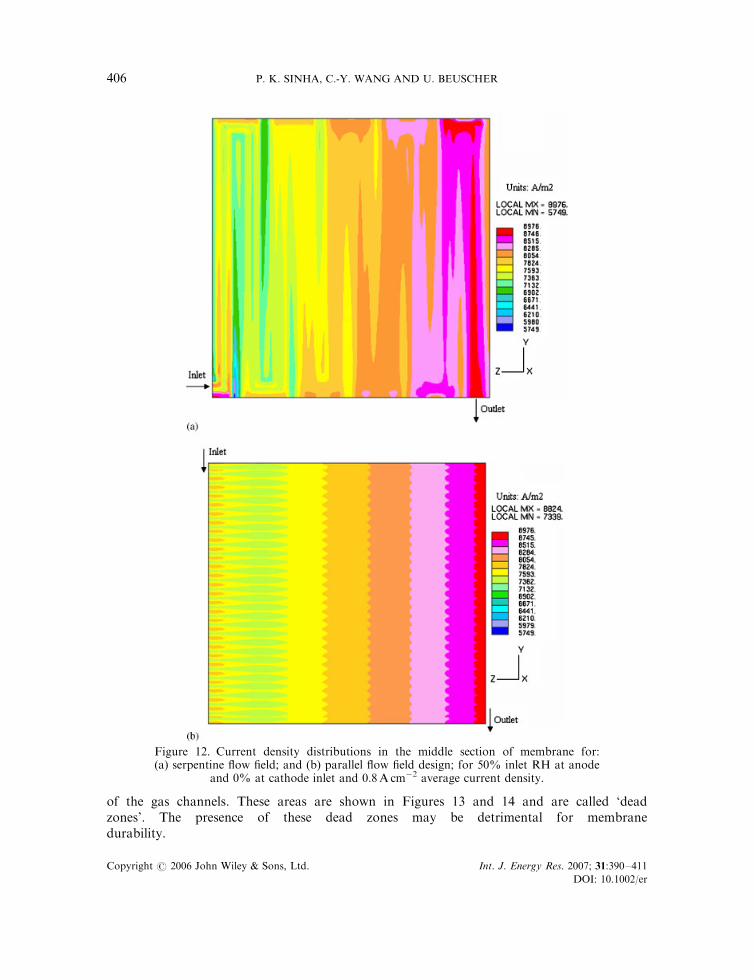
Figures 11 and 12 shows the distributions of current density in the middle section ofmembrane for parallel and serpentine flow fields at 0.8A cm�2 average current density.The current density is governed by the oxygen concentration in the cathode catalyst
Figure 8. Ionic conductivity distributions in the middle section of membrane for:(a) serpentine flow field; and (b) parallel flow field design; for 50% inlet RH at anode
and 0% at cathode inlet and 0.8A cm�2 average current density.
P. K. SINHA, C.-Y. WANG AND U. BEUSCHER402
Copyright # 2006 John Wiley & Sons, Ltd. Int. J. Energy Res. 2007; 31:390–411
DOI: 10.1002/er
layer and the ionic conductivity of the membrane. Over the whole active area, the distributionof ionic conductivity and oxygen concentration in the catalyst layer is more uniform forparallel flow field design, which results in a more uniform distribution of current density.
Figure 9. Ionic conductivity distributions in the middle section of membrane for:(a) serpentine flow field; and (b) parallel flow field design; for 30% inlet RH at anode
and cathode inlet and 1.6A cm�2 average current density.
PERFORMANCE OF ELEVATED-TEMPERATURE PEFC 403
Copyright # 2006 John Wiley & Sons, Ltd. Int. J. Energy Res. 2007; 31:390–411
DOI: 10.1002/er
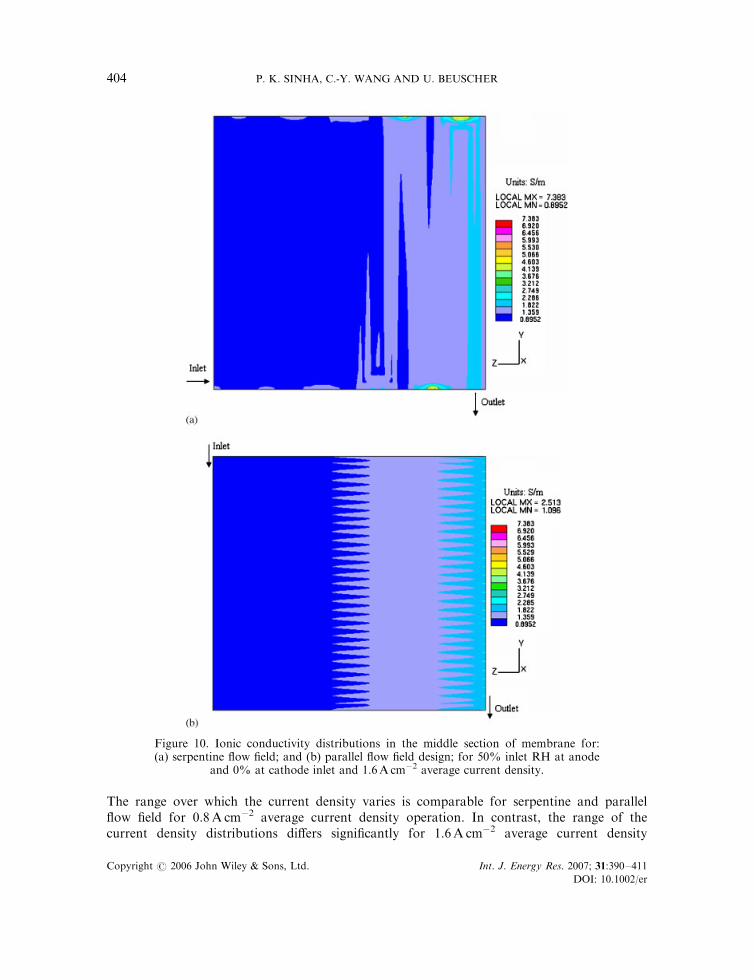
The range over which the current density varies is comparable for serpentine and parallelflow field for 0.8A cm�2 average current density operation. In contrast, the range of thecurrent density distributions differs significantly for 1.6A cm�2 average current density
Figure 10. Ionic conductivity distributions in the middle section of membrane for:(a) serpentine flow field; and (b) parallel flow field design; for 50% inlet RH at anode
and 0% at cathode inlet and 1.6A cm�2 average current density.
P. K. SINHA, C.-Y. WANG AND U. BEUSCHER404
Copyright # 2006 John Wiley & Sons, Ltd. Int. J. Energy Res. 2007; 31:390–411
DOI: 10.1002/er
as shown in Figures 13 and 14. With the serpentine flow field and 1.6A cm�2 averagecurrent density operation, the current density is very small at the top and bottomedge of membrane and peaks to very high value in close proximity towards the outlet
Figure 11. Current density distributions in the middle section of membrane for:(a) serpentine flow field; and (b) parallel flow field design; for 30% inlet RH at anode
and cathode inlet and 0.8A cm�2 average current density.
PERFORMANCE OF ELEVATED-TEMPERATURE PEFC 405
Copyright # 2006 John Wiley & Sons, Ltd. Int. J. Energy Res. 2007; 31:390–411
DOI: 10.1002/er
of the gas channels. These areas are shown in Figures 13 and 14 and are called ‘deadzones’. The presence of these dead zones may be detrimental for membranedurability.
Figure 12. Current density distributions in the middle section of membrane for:(a) serpentine flow field; and (b) parallel flow field design; for 50% inlet RH at anode
and 0% at cathode inlet and 0.8A cm�2 average current density.
P. K. SINHA, C.-Y. WANG AND U. BEUSCHER406
Copyright # 2006 John Wiley & Sons, Ltd. Int. J. Energy Res. 2007; 31:390–411
DOI: 10.1002/er
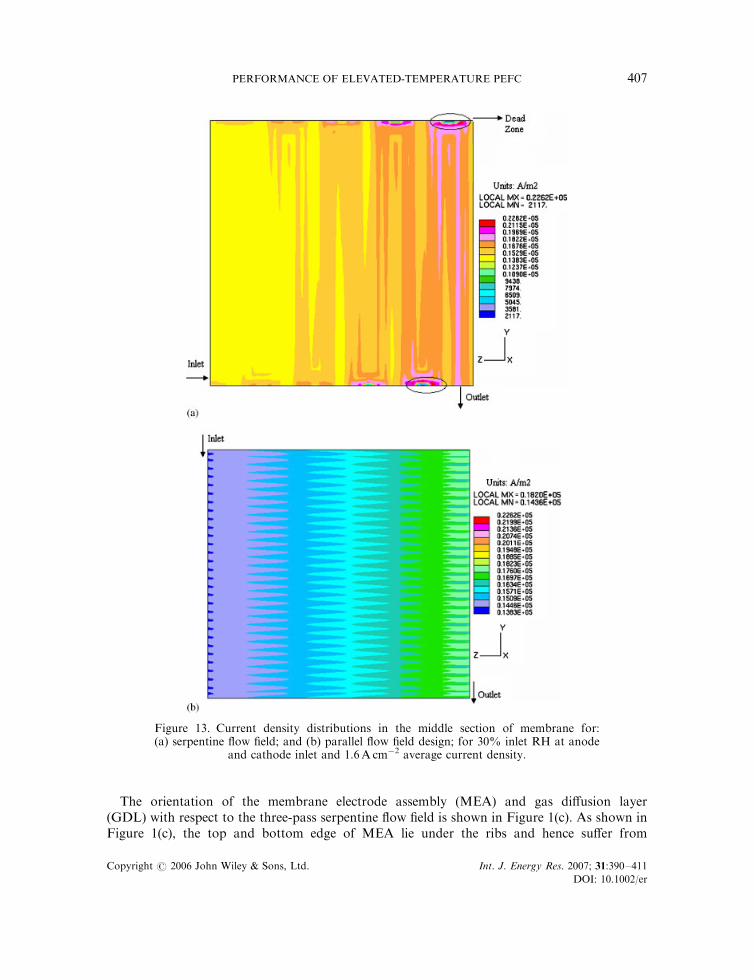
The orientation of the membrane electrode assembly (MEA) and gas diffusion layer(GDL) with respect to the three-pass serpentine flow field is shown in Figure 1(c). As shown inFigure 1(c), the top and bottom edge of MEA lie under the ribs and hence suffer from
Figure 13. Current density distributions in the middle section of membrane for:(a) serpentine flow field; and (b) parallel flow field design; for 30% inlet RH at anode
and cathode inlet and 1.6A cm�2 average current density.
PERFORMANCE OF ELEVATED-TEMPERATURE PEFC 407
Copyright # 2006 John Wiley & Sons, Ltd. Int. J. Energy Res. 2007; 31:390–411
DOI: 10.1002/er
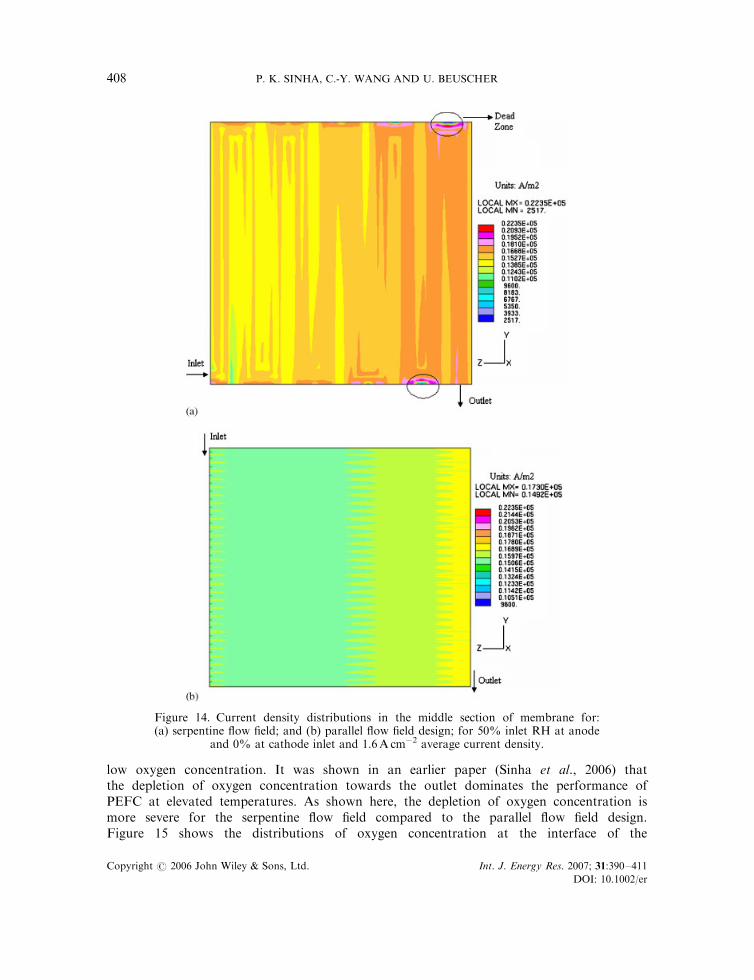
low oxygen concentration. It was shown in an earlier paper (Sinha et al., 2006) thatthe depletion of oxygen concentration towards the outlet dominates the performance ofPEFC at elevated temperatures. As shown here, the depletion of oxygen concentration ismore severe for the serpentine flow field compared to the parallel flow field design.Figure 15 shows the distributions of oxygen concentration at the interface of the
Figure 14. Current density distributions in the middle section of membrane for:(a) serpentine flow field; and (b) parallel flow field design; for 50% inlet RH at anode
and 0% at cathode inlet and 1.6A cm�2 average current density.
P. K. SINHA, C.-Y. WANG AND U. BEUSCHER408
Copyright # 2006 John Wiley & Sons, Ltd. Int. J. Energy Res. 2007; 31:390–411
DOI: 10.1002/er
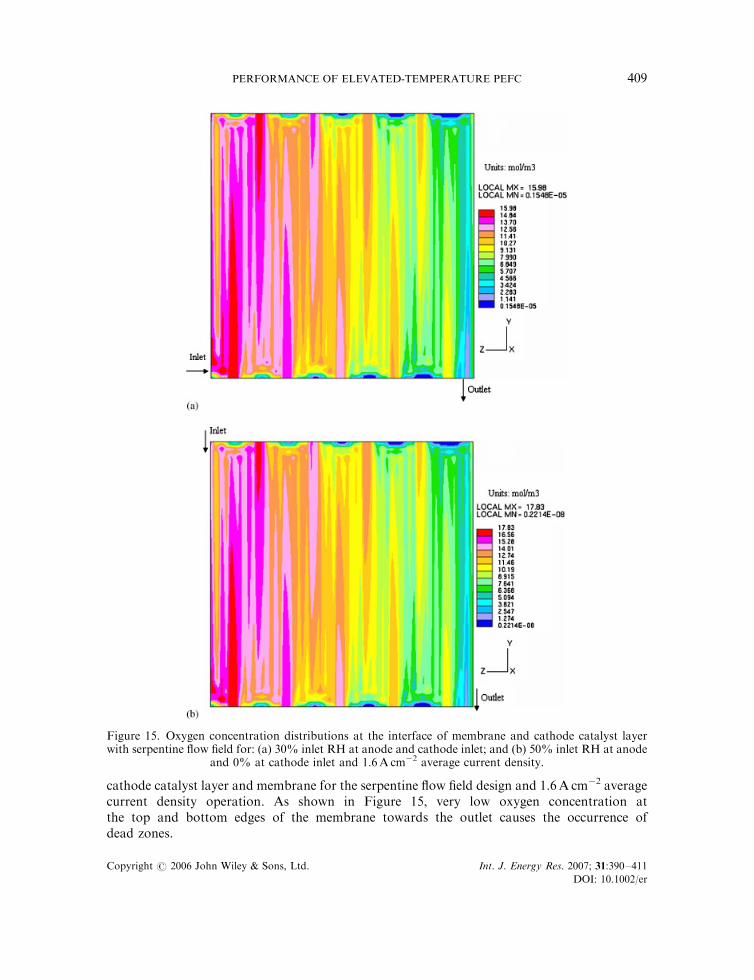
cathode catalyst layer and membrane for the serpentine flow field design and 1.6A cm�2 averagecurrent density operation. As shown in Figure 15, very low oxygen concentration atthe top and bottom edges of the membrane towards the outlet causes the occurrence ofdead zones.
Figure 15. Oxygen concentration distributions at the interface of membrane and cathode catalyst layerwith serpentine flow field for: (a) 30% inlet RH at anode and cathode inlet; and (b) 50% inlet RH at anode
and 0% at cathode inlet and 1.6A cm�2 average current density.
PERFORMANCE OF ELEVATED-TEMPERATURE PEFC 409
Copyright # 2006 John Wiley & Sons, Ltd. Int. J. Energy Res. 2007; 31:390–411
DOI: 10.1002/er
4. CONCLUSIONS
A three-dimensional single-phase non-isothermal PEFC model was applied to 25 cm2 PEFCwith two different flow field designs operated with under-humidified feed gas. The mainobjective of this study was to compare the performance of 25 cm2 PEFC operated at 958C forthree-pass serpentine and parallel flow field designs. It was found that the parallel flow fielddesign provides better performance and more uniform distribution of water activity, ionicconductivity, and current density over the active area, which makes it a more favourable designfor high-temperature fuel cell applications such as for automobiles. Dead zones were found nearthe top and bottom edges of the membrane towards the exit of the fuel cell with the serpentineflow field at high current density, which may be detrimental for membrane durability.
NOMENCLATURE
D =mass diffusivity of species (m2 s�1)EW =equivalent molecular weight of electrolyte in membrane (kgmol�1)F =Faraday constant, 96 487Cmol�1
k =thermal conductivity (WmK�1)K =hydraulic permeability (m2)p =pressure (Pa)R =the universal gas constant, 8.314 JmolK�1
RH =relative humidityT =temperature (K)
Greek letters
e =volume fraction of gaseous phase in porous regionemc =volume fraction of ionomer phase in catalyst layerz =tortuosity of porous regionx =stoichiometry flow ratios =electronic conductivity (Sm�1)
Subscripts
a =anodec =cathodecat =catalystGDL =gas diffusion layerH2 =hydrogenMem =membraneO2 =oxygenRef =reference valuew =water0 =standard condition, 298.15K and 101.3 kPa (1 atm)
P. K. SINHA, C.-Y. WANG AND U. BEUSCHER410
Copyright # 2006 John Wiley & Sons, Ltd. Int. J. Energy Res. 2007; 31:390–411
DOI: 10.1002/er
Superscripts
e =electrolyteeff =effective value in porous regionmem =membraneref =reference value
ACKNOWLEDGEMENTS
Funding for this work from W.L. Gore & Associates, Inc. is gratefully acknowledged.
REFERENCES
Bird RB, Stewart WE, Lightfoot EN. 1960. Transport Phenomena, Wiley, New York.Glandt J, Shimpalee S, Lee W-k, Vanzee JW. 2002. Modeling the effect of flow field design on PEM fuel cell
performance. A.I.Ch.E. Spring National Meeting, 10–14 March, New Orleans, LA.Ju H, Meng H, Wang CY. 2005a. A single-phase non-isothermal model for PEM fuel cells. International Journal of Heat
and Mass Transfer 48:1303–1315.Ju H, Wang CY, Cleghorn S, Beuscher U. 2005b. Non-isothermal modeling of polymer electrolyte fuel cells. Part I:
experimental validation. Journal of Electrochemical Society 152:A1645–A1653.Mench MM, Wang CY, Thynell S. 2001. An introduction to fuel cells and related transport phenomena. International
Journal of Transport Phenomena 3:151–176.Meng H, Wang CY. 2004a. Electron transport in PEFCs. Journal of Electrochemical Society 151:A358–A367.Meng H, Wang CY. 2004b. Large-scale simulation of polymer electrolyte fuel cells by parallel computing. Chemical
Engineering Science 59:A3331–A3343.Pasaogullari U, Wang CY. 2002. Computational fluid dynamics modeling of proton exchange membrane fuel cells. 2002
Fluent Users Groups Meeting, Manchester, NH.Sinha PK, Wang CY, Beuscher U. 2006. Transport phenomena in elevated temperature PEM fuel cells. Journal of
Electrochemical Society, under review.STAR-CD. 2001. STAR-CD version 3.15 Methodology. CD-Adapco Group.Springer TE, Zawodizinski TA, Gottesfeld S. 1991. Polymer electrolyte fuel cell model. Journal of Electrochemical
Society 138:2334–2342.Um S, Wang CY, Chen KS. 2000. Computational fluid dynamics modeling of proton exchange membrane fuel cells.
Journal of Electrochemical Society 147:4485–4493.Wang CY. 2004. Fundamental models for fuel cell engineering. Chemical Reviews 104:4727–4766.Wang Y, Wang CY. 2006. Ultra large-scale simulation of polymer electrolyte fuel cells. Journal of Power Sources
153:130–135.
PERFORMANCE OF ELEVATED-TEMPERATURE PEFC 411
Copyright # 2006 John Wiley & Sons, Ltd. Int. J. Energy Res. 2007; 31:390–411
DOI: 10.1002/er
Copyright © 2022 FDOKUMEN