
A Lithium Oxythioborosilicate Solid Electrolyte Glass with ...
Journal of Power Sources 156 (2006) 375–387
Capillary pressure and hydrophilic porosity in gas diffusionlayers for polymer electrolyte fuel cells
Jeffrey T. Gostick a, Michael W. Fowler a,∗, Marios A. Ioannidis a,Mark D. Pritzker a, Y.M. Volfkovich b, A. Sakars b
a Department of Chemical Engineering, University of Waterloo, Waterloo, Ont., Canada N2L 3G1b Porotech Ltd., Vaughan, Ont., Canada L4L 5Y9
Received 27 April 2005; received in revised form 20 May 2005; accepted 23 May 2005Available online 15 July 2005
Abstract
Capillary pressure versus saturation curves for drainage of a wetting phase were measured for several gas diffusion layers that are commonlyused in polymer electrolyte membrane fuel cells. The technique employed can measure capillary pressure curves for both the total pore networkatsmod©
K
1
truTtcpiwtswe
0d
nd the pore network consisting of only hydrophilic pores. This enables the determination of capillary pressure curves directly relevant tohe study of gas diffusion layer flooding. The overall distributions compared well with mercury intrusion data. It was found that the poreize distribution for the hydrophilic pores were similar in shape to the overall distribution for standard substrate materials. Materials with aicroporous layer did not follow this trend and the microporous layer was found to be completely hydrophobic. Due to their similarity, the
verall and hydrophilic capillary pressure curves for all materials could be correlated using a single Leverett J-function. The results wereescribed by several standard capillary models, the parameters of which can be further used to predict the relative permeability of the phases.
2005 Elsevier B.V. All rights reserved.
eywords: Hydrophilic; Hydrophobic; Porosity; Capillary pressure; Cathode; Water management
. Introduction
Increasing the maximum power density is a key objec-ive of polymer electrolyte membrane fuel cell (PEMFC)esearch. Improvements in catalyst activity, accessibility andtilization have led to a dramatic increase in reaction rates [1].he corresponding increase in water generation, however, has
ended to negate these improvements due to flooding of theathode with liquid water at higher current densities. Theresence of excessive liquid water in the cathode can debil-tate the cell in two ways. On a microscopic scale, liquidater covers catalyst particles, thereby increasing the mass
ransfer resistance and reducing oxygen access to the catalystites. Macroscopically, liquid water may fill the pore networkithin the gas diffusion layer (GDL) support and decrease the
ffective diffusivity of oxygen through the layer. To counter
∗ Corresponding author. Tel.: +1 888 4567x3415; fax: +1 519 746 4979.E-mail address: [email protected] (M.W. Fowler).
the latter effects of liquid water, GDLs are typically coatedwith a non-wetting polymer such as polytetrafluoroethylene(PTFE) to create hydrophobic surfaces and pores throughoutthe GDL that are thought to remain free of water and facilitatetransport of oxygen to the catalyst layer.
Pore scale phenomena associated with the movement ofliquid water and the interplay between the vapor and liquidphases have recently received considerable attention. Numer-ous PEMFC models have been proposed [2–20] and recentreviews are available [21,22]. However, analysis of thesemodels has made evident the scarcity of constitutive rela-tions that describe the distribution and capillary flow of liquidwater in GDL materials. To date, very limited experimentalinformation has been reported on the dependence of capillarypressure (pc) on water saturation (sw) or on the dependenceof water relative permeability (krw) on saturation in differentGDL materials. This hinders progress in model validation.
Several studies focusing on the morphological propertiesof the porous GDLs have reported Hg–Air capillary pres-
378-7753/$ – see front matter © 2005 Elsevier B.V. All rights reserved.oi:10.1016/j.jpowsour.2005.05.086
376 J.T. Gostick et al. / Journal of Power Sources 156 (2006) 375–387
Nomenclature
A area (m2)BC Brooks–Corey model, given by Eq. (10)D diameter of fibers in GDL modelJ Leverett J-function, defined by Eq. (16)k permeability (m2)kr relative permeabilitym VG model fitting parametermd mass of dry sample (kg)ms mass of saturated sample (kg)n VG model fitting parameterpc capillary pressure (N m−2)pcb breakthrough pressure used to fit BC and VG
model (N m−2)RMS root mean squared error:
RMS = 1n
n∑i=1
√(pobserved
c −ppredictedc )
pobservedc
2
s saturation, defined by Eq. (1)S spacing between fibers in GDL modelVB bulk volume (m3)Vp pore volume (m3)VG van Genuchten model, given by Eq. (9)
Greek lettersε porosityθ contact angle (rad)λ BC model fitting parameterρ density (kg m−3)σ surface tension (N m−1)ϕ ratio of substrate pore volume to total
pore volume
SuperscriptsBA SGL10BABB SGL10BBeff effectiveS free substrate of SGL10BB, not intruded
by MPL
SubscriptsB bulkG gasHi hydrophilicnwp non-wetting phaser residualT totalwp wetting phase
sure curves or pore size distributions, but none have beenconcerned with investigating the dependence of capillarypressure on saturation for the water–air system, as requiredfor modeling water transport. Lee et al. [23] and Kong et al.[24] used mercury intrusion porosimetry (MIP) to examinethe consequences of various microporous layer (MPL) man-
ufacturing methods on the morphology of the MPL. Jordanet al. [25] and Passalacqua et al. [26] experimented with dif-ferent types of carbon black in the MPL. Antolini et al. [27]used MIP to study the effect of PTFE addition on the totalpore volume of MPL. Other works have focused specificallyon the GDL properties [28–30], but were aimed at qualita-tively explaining PEMFC performance on the basis of GDLmorphological features. In none of these studies has a sys-tematic investigation of the capillary behavior in GDLs beenconducted. All of the research has been carried out usingmercury intrusion porosimetry (MIP), which cannot distin-guish between the hydrophilic and hydrophobic componentsof GDL porosity.
In the absence of GDL specific pc–sw data, variousassumptions and approximations have been employed. Onecommon, but poorly justified approach [2–8], has been to usea polynomial fit, originally obtained by Udell [31], of capil-lary pressure data measured by Leverett for water imbibitionin water-wet unconsolidated sand packs [32]. Acknowledg-ing the lack of applicable data for GDLs, some researchershave arbitrarily assumed a linear dependence between capil-lary pressure and saturation [10,11,14]. A few attempts havebeen made to model pc–swp relationships specifically forGDLs. Divisek et al. [17] have fitted an empirical relation-ship to data generated from a model developed by Ustohalet al. [33]. Pisani et al. [18] and Natarajan and Nguyen[medcls
tarWhhspiihteihmtG
sag
12,13] adjusted parameters of a capillary pressure model toatch observed polarization behavior. Only Weber et al. [16]
xpressly attempted to empirically fit mercury porosimetryata for use in their models. These various approaches for cal-ulating pc–sw curves have produced a wide range of results,eading to predictions of capillary pressure that range overeveral orders of magnitude.
The heterogeneous nature of GDL materials requireshat attention be given to the coexistence of hydrophilicnd hydrophobic pores spaces within these media. Fewesearchers have addressed this point [10,16,18] and only
eber et al. [16] have attempted to model it. The latter authorsave assumed that hydrophilic and hydrophobic pore spacesave separate size distributions, but that each has the samehape as the overall distribution, while the proportion of eachore type is dictated by the amount of PTFE in the GDL andts expected effect on hydrophobicity. Although this approachs more realistic, the assumption that the hydrophilic andydrophobic pore size distributions have shapes similar tohe overall pore size distribution has not been tested againstxperimental data. Furthermore, to implement this approach,nformation about the relative proportions of hydrophilic andydrophobic porosity is required. In this respect, only slightlyore information is available since few studies have inves-
igated the amount of hydrophilic porosity in PTFE-treatedDLs [28,34,35].The objective of the present work is to determine the pore
ize distribution and void fractions associated with the overallnd hydrophilic porosity of various commercially availableas diffusion layers. Such a breakdown of the overall porosity

J.T. Gostick et al. / Journal of Power Sources 156 (2006) 375–387 377
distribution of a GDL into its hydrophobic and hydrophiliccomponents has not been previously reported. Here, thedependence of capillary pressure on wetting phase satura-tion along a desaturation path (drainage) is directly measuredusing the method of “standard porosimetry” (MSP) [36] withoctane–air and water–air as the working fluid pairs. Measure-ments with octane, which strongly wets both hydrophobic andhydrophilic surfaces, are compared to MIP measurements.Measurements with water enable the determination of thepore size distribution of hydrophilic porosity of interest infuel cell modeling. The effect of temperature is not investi-gated in the present study despite the documented dependenceof capillary pressure curves on temperature [37,38]. Conse-quently, the capillary pressure data obtained are not directlyapplicable to operating fuel cells. Nonetheless, these dataconstitute a first step towards understanding the capillarybehavior of water–air–GDL systems. Fitting of the capillarypressure data using the Brooks–Corey and van Genuchtenmodels is also discussed. Finally, in light of the MSP results,capillary pressure data specific to the hydrophobic MPL areobtained.
2. Materials and methods
2
iapC(SMl
2
mpit
pc,Hg–Air, is gradually increased, providing the capillary pres-sure curve for drainage of a strongly wetting phase [40]. Poresize information in terms of an equivalent cylindrical capil-lary size may be extracted from capillary pressure data usingthe Young–Laplace equation:
r = 2σHg–Air cos θHg–Air
pc,Hg–Air(1)
where r is the pore radius, σHg–Air the surface tension ofthe mercury–air interface and θHg–Air the contact angle ofmercury on the solid surface of the pore wall. In general,inferring the pore size distribution from the results of aMIP experiment is fraught with difficulties stemming frompore accessibility limitations [41]. Larger pores shielded bysmaller ones are only intruded by mercury at the capillarypressure corresponding to entry of mercury in the smallerpores and their volume is incorrectly attributed to smallerpores. In chemically heterogeneous materials such as a GDL,the assumption that mercury exhibits a single, well-definedcontact angle on all solid surfaces is also challenged. Par-tial coverage of the carbon fibers in a GDL by PTFE createsnon-uniformity in θHg–Air, meaning that two pores of similarsize, but with different wettability, are intruded at differentpressures. Uncertainty regarding the value of θHg–Air thuscoai
p
itlc
EGarcr
TP
M 1012)
S ]S 9]TELL
etermin
.1. GDL materials
A representative range of GDL materials was selected fornvestigation in this work, including cloth, felt and paper withnd without a MPL. The materials used were SGL 10BA plainaper and SGL 10BB paper with microporous layer (SGLarbon Group, Short Hills, NJ), Toray TGPH-090 plain paper
Toray Corp., Tokyo, Japan), E-TEK Cloth ‘A’ (E-TEK Inc.,omerset, NJ), as well as Lyflex 484C and 352C felts (Lydall,anchester, CT). The relevant properties of each material are
isted in Table 1.
.2. Mercury intrusion porosimetry
Mercury intrusion porosimetry (MIP) is widely used toeasure the distribution of accessible pore volume by entry
ressure for pores between 1 nm and 1 mm. In an MIP exper-ment, the non-wetting phase (mercury) saturation of an ini-ially evacuated sample is measured as the capillary pressure,
able 1hysical properties of GDL materials testeda
aterial Type ε k (m2 ×GL10BA Paper 0.88 18.0 [29GL10BB Paper w/MPL 0.84 0.33 [2oray 090 Paper 0.78 8.3-Tek Cloth ‘A’ Cloth – 6.3b
yflex 484C Felt 0.83 –yflex 352C Felt 0.74 –a Given by manufacturer except where noted.b Calculated by the method of Happel [39], with fiber diameter of 5 �m d
onfounds the conversion of capillary pressure measured withne fluid (e.g. Hg–Air) to equivalent capillary pressure fornother fluid pair (e.g., water–air), on the basis of the follow-ng equation:
c,2 = σ2−Air cos θ2−Air
σ1−Air cos θ1−Airpc,1 (2)
n which σ1–Air and σ2–Air are the surface tensions of thewo liquids, θ1–Air and θ2–Air the contact of angles of the twoiquids on the material and pc,1 the experimentally measuredapillary pressure.
To obtain an estimate for the contact angles to be used inq. (2), the contact angle of each liquid on the surface of eachDL was measured by image analysis using a video contact
ngle system (AST Products 2500XE, Billerica, MA). Theepeatability of these measurements was ±1◦. The observedontact angles were then corrected for the effects of surfaceoughness and porosity using the Cassie–Baxter equation for
ρB (g mL−1) Thickness (�m) PTFE (wt.%)
0.22 380 50.30 420 5 (in paper)0.44 190 00.33 350 00.30 417 3.10.47 268 6.2
ed by fitting model to Toray 090, and porosity taken as 0.75.

378 J.T. Gostick et al. / Journal of Power Sources 156 (2006) 375–387
Fig. 1. Schematic diagram of fiber structure used to determine f1 and f2 inEqs. (5) and (6).
porous surfaces [42] modified for surface roughness [43]:
cos θObs = bf1 cos θEff − f2 (3)
where θObs is the measured contact angle, b the ratio of actualarea of contact between the drop and the solid portion of thesurface to the projected area (b = π/2 for cylinders) and f1and f2 the fractions of the GDL surface occupied by fiber andvoid, respectively. The value of θEff thus obtained is a roughestimate of the contact angle of the liquid on the chemicallyheterogeneous fibers.
To estimate the values of f1 and f2 for the GDLs, the fibernetwork model of Nam and Kaviany was used [10]. In thismodel the GDL is composed of a stack of interwoven screens(Fig. 1). Spacing between each parallel fiber is equal in bothdirections and this is also the spacing between the layers. Forsimplicity the fibers are allowed to intersect. The unit cellin this model has dimensions of S + D in all three directions,giving a volume of (S + D)3. To calculate porosity, the fibervolume is subtracted from the volume of the unit cell and thefollowing relationship is obtained:
ε = VUnit Cell − 2VFiber + VIntersection
VUnit Cell
= (S + D)3 − 2π4 D2(S + D) + 2
3D3
(S + D)3
Ece
f
Table 2Observed and estimated contact angles of mercury on GDL materials
Material Observed θ [◦] Effective θ [◦]
SGL10BA 148 108SGL10BB/MPLa 148/153 108/119Toray 090 146 112E-Tek Cloth ‘A’ 147 114Lyflex 484C 147 110Lyflex 352C 148 114Graphite 124 [44] –PTFE 150 [43] –
a For a drop deposited on MPL side. A porosity value of 0.72 was used inEq. (3), based on calculations detailed in Section 3.2.6.
f2 = S
S + D=
SD
SD
+ 1(6)
The results of this analysis are given in Table 2, where the esti-mated effective contact angles are also compared to reportedcontact angles of mercury on smooth graphite and PTFE[43,44].
2.3. Method of standard porosimetry
The method of standard porosimetry (MSP) offers twodistinct advantages over MIP [36]. Since mercury is a non-wetting fluid to both carbon and PTFE surfaces, an MIPmeasurement cannot distinguish between hydrophilic andhydrophobic porosity. MSP can be performed with any wet-ting fluid as the working liquid. Using water as the sat-urating fluid permits one to determine the distribution ofhydrophilic pores only. The distribution of the overall poros-ity can be obtained by using a strongly wetting fluid suchas octane, which fully wets both graphite and PTFE sur-faces uniformly. The second advantage of this technique isthat the pc–swp data are obtained directly for the fluid–solidsystem of interest. Therefore, the results are not subjectto the uncertainties in contact angle introduced by the useof Eq. (2). To date, application of the MSP techniqueha[
cpeubsdadppd
=(
SD
)3 + 3(
SD
)2 + 3(
SD
) + 1 − π2
(SD
) − π2 + 2
3(SD
)3 + 3(
SD
)2 + 3(
SD
) + 1(4)
q. (4) may be solved for S/D given ε, thus enabling thealculation of the fractions f1 and f2 from the followingxpressions:
1 = D
S + D= 1
SD
+ 1(5)
as been limited to the characterization of cermet materi-ls in solid oxide fuel cells [45] and Nafion membranes46].
The method of standard porosimetry is based on the prin-iple of capillary equilibrium. When two partially saturatedorous bodies are in contact, the system moves toward anquilibrium state where the capillary pressures of the liq-id in both bodies are equal. MSP exploits this phenomenony placing the unknown sample in capillary contact with atandard sample having a known pc–swp curve. A schematiciagram of the steps required to obtain the pc–swp curve ofn unknown sample is shown in Fig. 2. When the system iseemed to be in capillary equilibrium, the mass of each sam-le is determined. Knowledge of the mass of each sampleermits the determination of its wetting phase saturation swp,efined as the ratio of the volume of liquid in the sample to
J.T. Gostick et al. / Journal of Power Sources 156 (2006) 375–387 379
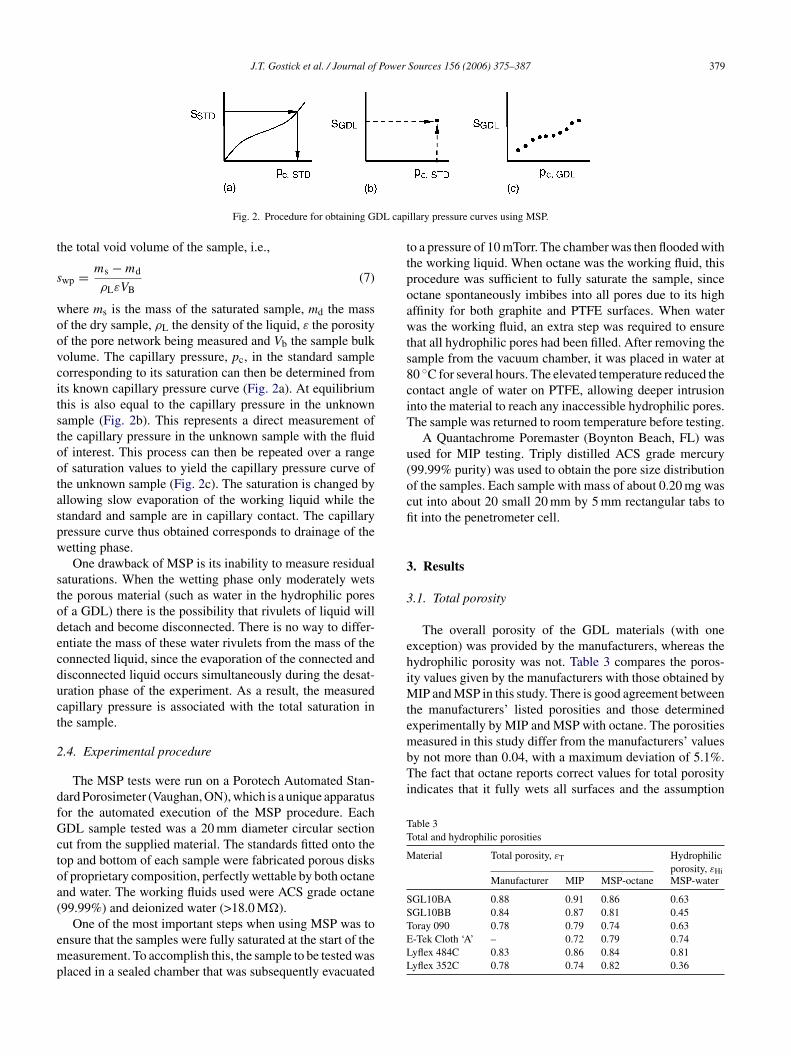
Fig. 2. Procedure for obtaining GDL capillary pressure curves using MSP.
the total void volume of the sample, i.e.,
swp = ms − md
ρLεVB(7)
where ms is the mass of the saturated sample, md the massof the dry sample, ρL the density of the liquid, ε the porosityof the pore network being measured and Vb the sample bulkvolume. The capillary pressure, pc, in the standard samplecorresponding to its saturation can then be determined fromits known capillary pressure curve (Fig. 2a). At equilibriumthis is also equal to the capillary pressure in the unknownsample (Fig. 2b). This represents a direct measurement ofthe capillary pressure in the unknown sample with the fluidof interest. This process can then be repeated over a rangeof saturation values to yield the capillary pressure curve ofthe unknown sample (Fig. 2c). The saturation is changed byallowing slow evaporation of the working liquid while thestandard and sample are in capillary contact. The capillarypressure curve thus obtained corresponds to drainage of thewetting phase.
One drawback of MSP is its inability to measure residualsaturations. When the wetting phase only moderately wetsthe porous material (such as water in the hydrophilic poresof a GDL) there is the possibility that rivulets of liquid willdetach and become disconnected. There is no way to differ-entiate the mass of these water rivulets from the mass of thecduct
2
dfGctoa(
emp
to a pressure of 10 mTorr. The chamber was then flooded withthe working liquid. When octane was the working fluid, thisprocedure was sufficient to fully saturate the sample, sinceoctane spontaneously imbibes into all pores due to its highaffinity for both graphite and PTFE surfaces. When waterwas the working fluid, an extra step was required to ensurethat all hydrophilic pores had been filled. After removing thesample from the vacuum chamber, it was placed in water at80 ◦C for several hours. The elevated temperature reduced thecontact angle of water on PTFE, allowing deeper intrusioninto the material to reach any inaccessible hydrophilic pores.The sample was returned to room temperature before testing.
A Quantachrome Poremaster (Boynton Beach, FL) wasused for MIP testing. Triply distilled ACS grade mercury(99.99% purity) was used to obtain the pore size distributionof the samples. Each sample with mass of about 0.20 mg wascut into about 20 small 20 mm by 5 mm rectangular tabs tofit into the penetrometer cell.
3. Results
3.1. Total porosity
The overall porosity of the GDL materials (with oneexception) was provided by the manufacturers, whereas thehiMtembTi
TT
M
SSTELL
onnected liquid, since the evaporation of the connected andisconnected liquid occurs simultaneously during the desat-ration phase of the experiment. As a result, the measuredapillary pressure is associated with the total saturation inhe sample.
.4. Experimental procedure
The MSP tests were run on a Porotech Automated Stan-ard Porosimeter (Vaughan, ON), which is a unique apparatusor the automated execution of the MSP procedure. EachDL sample tested was a 20 mm diameter circular section
ut from the supplied material. The standards fitted onto theop and bottom of each sample were fabricated porous disksf proprietary composition, perfectly wettable by both octanend water. The working fluids used were ACS grade octane99.99%) and deionized water (>18.0 M�).
One of the most important steps when using MSP was tonsure that the samples were fully saturated at the start of theeasurement. To accomplish this, the sample to be tested was
laced in a sealed chamber that was subsequently evacuated
ydrophilic porosity was not. Table 3 compares the poros-ty values given by the manufacturers with those obtained by
IP and MSP in this study. There is good agreement betweenhe manufacturers’ listed porosities and those determinedxperimentally by MIP and MSP with octane. The porositieseasured in this study differ from the manufacturers’ values
y not more than 0.04, with a maximum deviation of 5.1%.he fact that octane reports correct values for total porosity
ndicates that it fully wets all surfaces and the assumption
able 3otal and hydrophilic porosities
aterial Total porosity, εT Hydrophilicporosity, εHi
Manufacturer MIP MSP-octane MSP-water
GL10BA 0.88 0.91 0.86 0.63GL10BB 0.84 0.87 0.81 0.45oray 090 0.78 0.79 0.74 0.63-Tek Cloth ‘A’ – 0.72 0.79 0.74yflex 484C 0.83 0.86 0.84 0.81yflex 352C 0.78 0.74 0.82 0.36
380 J.T. Gostick et al. / Journal of Power Sources 156 (2006) 375–387
of zero contact angle is valid. Conversely, the fact that thehydrophilic porosity is less than the total porosity in materi-als without PTFE (Toray 090 and ETEK Cloth ‘A’) indicatesthat water does not perfectly wet the virgin carbon fibers.
3.2. Porosity distributions
In this section, the measured capillary pressure data areanalyzed in terms of commonly used pc–swp models. Inthe following, the capillary pressure is defined in terms ofthe difference between the wetting and non-wetting phasepressures as:
pc ≡ pnwp − pwp (8)
3.2.1. Capillary pressure curves: total pore volumeThe pc–swp curves for the overall pore network were
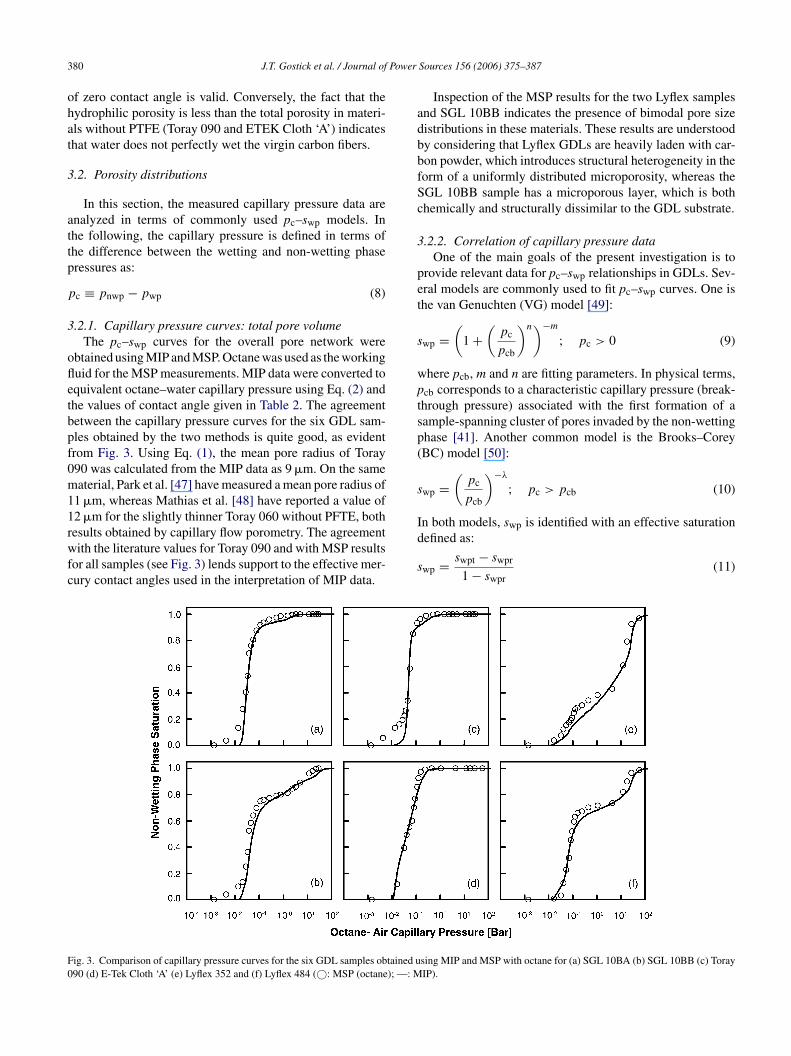
obtained using MIP and MSP. Octane was used as the workingfluid for the MSP measurements. MIP data were converted toequivalent octane–water capillary pressure using Eq. (2) andthe values of contact angle given in Table 2. The agreementbetween the capillary pressure curves for the six GDL sam-ples obtained by the two methods is quite good, as evidentfrom Fig. 3. Using Eq. (1), the mean pore radius of Toray090 was calculated from the MIP data as 9 �m. On the samematerial, Park et al. [47] have measured a mean pore radius of11rwfc
Inspection of the MSP results for the two Lyflex samplesand SGL 10BB indicates the presence of bimodal pore sizedistributions in these materials. These results are understoodby considering that Lyflex GDLs are heavily laden with car-bon powder, which introduces structural heterogeneity in theform of a uniformly distributed microporosity, whereas theSGL 10BB sample has a microporous layer, which is bothchemically and structurally dissimilar to the GDL substrate.
3.2.2. Correlation of capillary pressure dataOne of the main goals of the present investigation is to
provide relevant data for pc–swp relationships in GDLs. Sev-eral models are commonly used to fit pc–swp curves. One isthe van Genuchten (VG) model [49]:
swp =(
1 +(
pc
pcb
)n)−m
; pc > 0 (9)
where pcb, m and n are fitting parameters. In physical terms,pcb corresponds to a characteristic capillary pressure (break-through pressure) associated with the first formation of asample-spanning cluster of pores invaded by the non-wettingphase [41]. Another common model is the Brooks–Corey(BC) model [50]:
swp =(
pc)−λ
; pc > pcb (10)
Id
s
F tained u0 ); —: M
1 �m, whereas Mathias et al. [48] have reported a value of2 �m for the slightly thinner Toray 060 without PFTE, bothesults obtained by capillary flow porometry. The agreementith the literature values for Toray 090 and with MSP results
or all samples (see Fig. 3) lends support to the effective mer-ury contact angles used in the interpretation of MIP data.
ig. 3. Comparison of capillary pressure curves for the six GDL samples ob90 (d) E-Tek Cloth ‘A’ (e) Lyflex 352 and (f) Lyflex 484 (©: MSP (octane
pcb
n both models, swp is identified with an effective saturationefined as:
wp = swpt − swpr
1 − swpr(11)
sing MIP and MSP with octane for (a) SGL 10BA (b) SGL 10BB (c) TorayIP).
J.T. Gostick et al. / Journal of Power Sources 156 (2006) 375–387 381
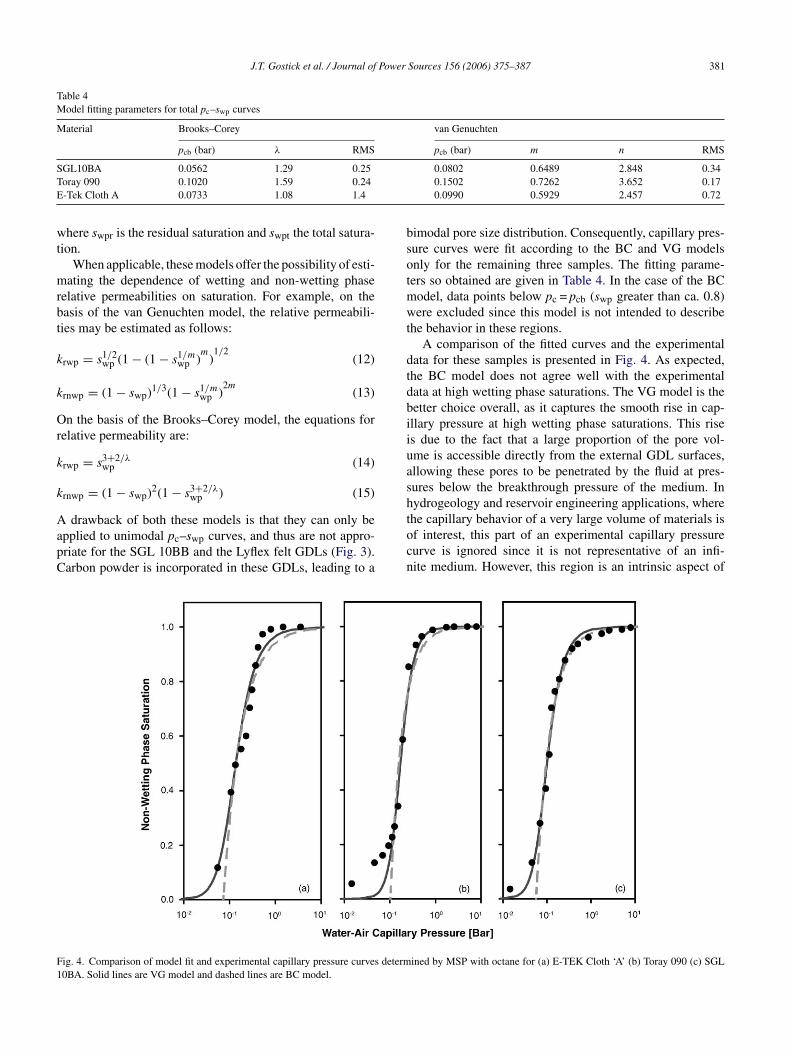
Table 4Model fitting parameters for total pc–swp curves
Material Brooks–Corey van Genuchten
pcb (bar) λ RMS pcb (bar) m n RMS
SGL10BA 0.0562 1.29 0.25 0.0802 0.6489 2.848 0.34Toray 090 0.1020 1.59 0.24 0.1502 0.7262 3.652 0.17E-Tek Cloth A 0.0733 1.08 1.4 0.0990 0.5929 2.457 0.72
where swpr is the residual saturation and swpt the total satura-tion.
When applicable, these models offer the possibility of esti-mating the dependence of wetting and non-wetting phaserelative permeabilities on saturation. For example, on thebasis of the van Genuchten model, the relative permeabili-ties may be estimated as follows:
krwp = s1/2wp (1 − (1 − s1/m
wp )m
)1/2
(12)
krnwp = (1 − swp)1/3(1 − s1/mwp )
2m(13)
On the basis of the Brooks–Corey model, the equations forrelative permeability are:
krwp = s3+2/λwp (14)
krnwp = (1 − swp)2(1 − s3+2/λwp ) (15)
A drawback of both these models is that they can only beapplied to unimodal pc–swp curves, and thus are not appro-priate for the SGL 10BB and the Lyflex felt GDLs (Fig. 3).Carbon powder is incorporated in these GDLs, leading to a
bimodal pore size distribution. Consequently, capillary pres-sure curves were fit according to the BC and VG modelsonly for the remaining three samples. The fitting parame-ters so obtained are given in Table 4. In the case of the BCmodel, data points below pc = pcb (swp greater than ca. 0.8)were excluded since this model is not intended to describethe behavior in these regions.
A comparison of the fitted curves and the experimentaldata for these samples is presented in Fig. 4. As expected,the BC model does not agree well with the experimentaldata at high wetting phase saturations. The VG model is thebetter choice overall, as it captures the smooth rise in cap-illary pressure at high wetting phase saturations. This riseis due to the fact that a large proportion of the pore vol-ume is accessible directly from the external GDL surfaces,allowing these pores to be penetrated by the fluid at pres-sures below the breakthrough pressure of the medium. Inhydrogeology and reservoir engineering applications, wherethe capillary behavior of a very large volume of materials isof interest, this part of an experimental capillary pressurecurve is ignored since it is not representative of an infi-nite medium. However, this region is an intrinsic aspect of
F determ1
ig. 4. Comparison of model fit and experimental capillary pressure curves0BA. Solid lines are VG model and dashed lines are BC model.
ined by MSP with octane for (a) E-TEK Cloth ‘A’ (b) Toray 090 (c) SGL
382 J.T. Gostick et al. / Journal of Power Sources 156 (2006) 375–387
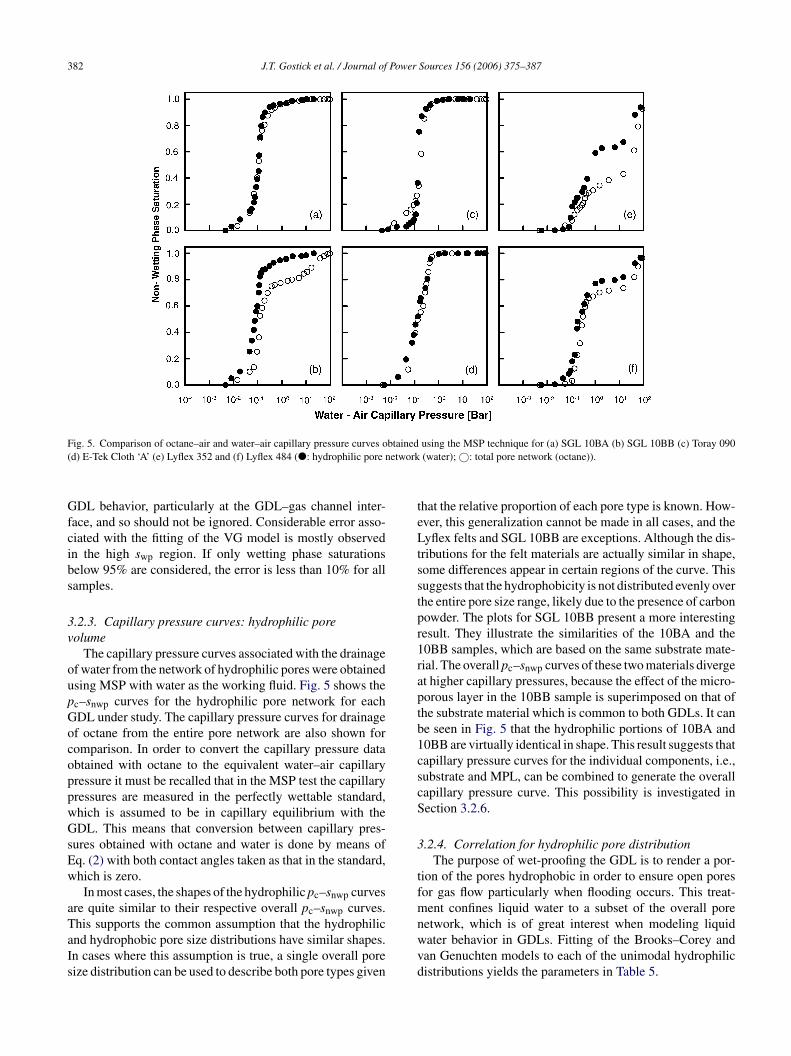
Fig. 5. Comparison of octane–air and water–air capillary pressure curves obtained using the MSP technique for (a) SGL 10BA (b) SGL 10BB (c) Toray 090(d) E-Tek Cloth ‘A’ (e) Lyflex 352 and (f) Lyflex 484 (�: hydrophilic pore network (water); ©: total pore network (octane)).
GDL behavior, particularly at the GDL–gas channel inter-face, and so should not be ignored. Considerable error asso-ciated with the fitting of the VG model is mostly observedin the high swp region. If only wetting phase saturationsbelow 95% are considered, the error is less than 10% for allsamples.
3.2.3. Capillary pressure curves: hydrophilic porevolume
The capillary pressure curves associated with the drainageof water from the network of hydrophilic pores were obtainedusing MSP with water as the working fluid. Fig. 5 shows thepc–snwp curves for the hydrophilic pore network for eachGDL under study. The capillary pressure curves for drainageof octane from the entire pore network are also shown forcomparison. In order to convert the capillary pressure dataobtained with octane to the equivalent water–air capillarypressure it must be recalled that in the MSP test the capillarypressures are measured in the perfectly wettable standard,which is assumed to be in capillary equilibrium with theGDL. This means that conversion between capillary pres-sures obtained with octane and water is done by means ofEq. (2) with both contact angles taken as that in the standard,which is zero.
In most cases, the shapes of the hydrophilic pc–snwp curvesaTaIs
that the relative proportion of each pore type is known. How-ever, this generalization cannot be made in all cases, and theLyflex felts and SGL 10BB are exceptions. Although the dis-tributions for the felt materials are actually similar in shape,some differences appear in certain regions of the curve. Thissuggests that the hydrophobicity is not distributed evenly overthe entire pore size range, likely due to the presence of carbonpowder. The plots for SGL 10BB present a more interestingresult. They illustrate the similarities of the 10BA and the10BB samples, which are based on the same substrate mate-rial. The overall pc–snwp curves of these two materials divergeat higher capillary pressures, because the effect of the micro-porous layer in the 10BB sample is superimposed on that ofthe substrate material which is common to both GDLs. It canbe seen in Fig. 5 that the hydrophilic portions of 10BA and10BB are virtually identical in shape. This result suggests thatcapillary pressure curves for the individual components, i.e.,substrate and MPL, can be combined to generate the overallcapillary pressure curve. This possibility is investigated inSection 3.2.6.
3.2.4. Correlation for hydrophilic pore distributionThe purpose of wet-proofing the GDL is to render a por-
tion of the pores hydrophobic in order to ensure open poresfor gas flow particularly when flooding occurs. This treat-mnwvd
re quite similar to their respective overall pc–snwp curves.his supports the common assumption that the hydrophilicnd hydrophobic pore size distributions have similar shapes.n cases where this assumption is true, a single overall poreize distribution can be used to describe both pore types given
ent confines liquid water to a subset of the overall poreetwork, which is of great interest when modeling liquidater behavior in GDLs. Fitting of the Brooks–Corey andan Genuchten models to each of the unimodal hydrophilicistributions yields the parameters in Table 5.
J.T. Gostick et al. / Journal of Power Sources 156 (2006) 375–387 383
Table 5Model fitting parameters for unimodal hydrophilic pc–swp curves
Material Brooks–Corey van Genuchten
pcb (bar) λ RMS pcb (bar) m n RMS
SGL10BA 0.0636 1.61 0.38 0.0918 0.740 3.843 0.32SGL10BB 0.387 1.17 0.33 0.0580 0.627 2.683 0.33Toray 090 0.120 4.06 1.8 0.1457 0.8667 7.499 0.26E-Tek Cloth A 0.0565 0.950 1.9 0.0781 0.5407 2.177 0.62
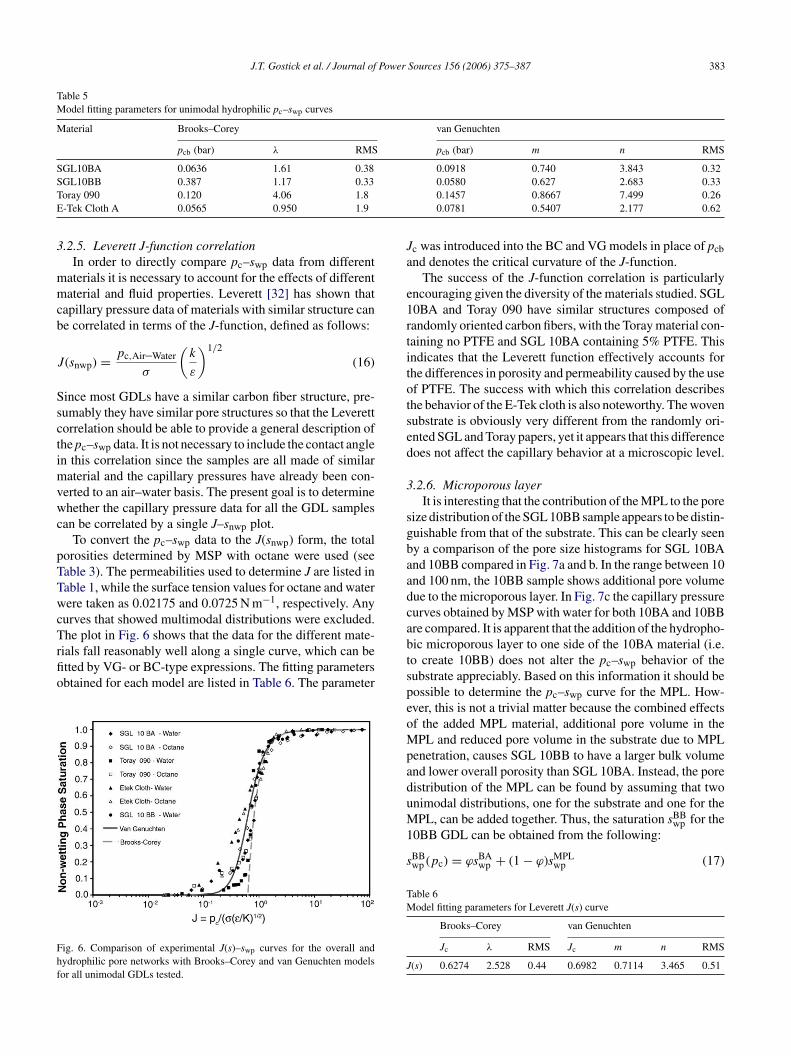
3.2.5. Leverett J-function correlationIn order to directly compare pc–swp data from different
materials it is necessary to account for the effects of differentmaterial and fluid properties. Leverett [32] has shown thatcapillary pressure data of materials with similar structure canbe correlated in terms of the J-function, defined as follows:
J(snwp) = pc,Air–Water
σ
(k
ε
)1/2
(16)
Since most GDLs have a similar carbon fiber structure, pre-sumably they have similar pore structures so that the Leverettcorrelation should be able to provide a general description ofthe pc–swp data. It is not necessary to include the contact anglein this correlation since the samples are all made of similarmaterial and the capillary pressures have already been con-verted to an air–water basis. The present goal is to determinewhether the capillary pressure data for all the GDL samplescan be correlated by a single J–snwp plot.
To convert the pc–swp data to the J(snwp) form, the totalporosities determined by MSP with octane were used (seeTable 3). The permeabilities used to determine J are listed inTable 1, while the surface tension values for octane and waterwere taken as 0.02175 and 0.0725 N m−1, respectively. Anycurves that showed multimodal distributions were excluded.The plot in Fig. 6 shows that the data for the different mate-rfio
Fhf
Jc was introduced into the BC and VG models in place of pcband denotes the critical curvature of the J-function.
The success of the J-function correlation is particularlyencouraging given the diversity of the materials studied. SGL10BA and Toray 090 have similar structures composed ofrandomly oriented carbon fibers, with the Toray material con-taining no PTFE and SGL 10BA containing 5% PTFE. Thisindicates that the Leverett function effectively accounts forthe differences in porosity and permeability caused by the useof PTFE. The success with which this correlation describesthe behavior of the E-Tek cloth is also noteworthy. The wovensubstrate is obviously very different from the randomly ori-ented SGL and Toray papers, yet it appears that this differencedoes not affect the capillary behavior at a microscopic level.
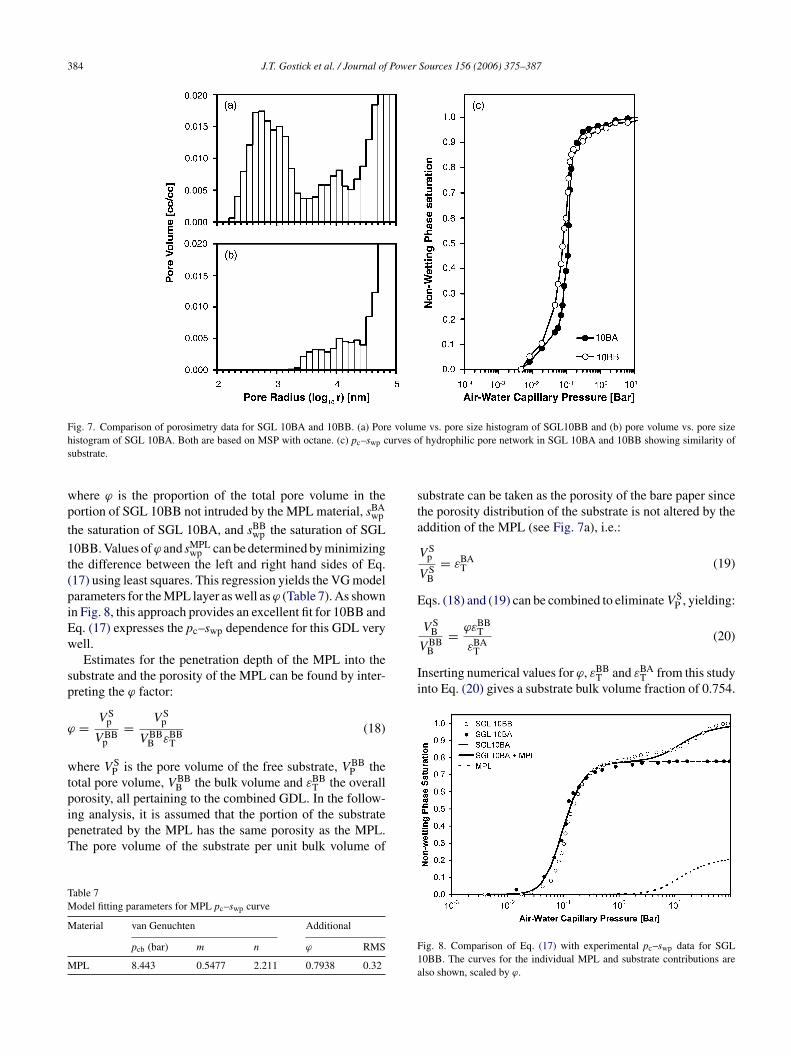
3.2.6. Microporous layerIt is interesting that the contribution of the MPL to the pore
size distribution of the SGL 10BB sample appears to be distin-guishable from that of the substrate. This can be clearly seenby a comparison of the pore size histograms for SGL 10BAand 10BB compared in Fig. 7a and b. In the range between 10and 100 nm, the 10BB sample shows additional pore volumedue to the microporous layer. In Fig. 7c the capillary pressurecurves obtained by MSP with water for both 10BA and 10BBare compared. It is apparent that the addition of the hydropho-bic microporous layer to one side of the 10BA material (i.e.tspeoMpaduM1
s
TM
J
ials fall reasonably well along a single curve, which can betted by VG- or BC-type expressions. The fitting parametersbtained for each model are listed in Table 6. The parameter
ig. 6. Comparison of experimental J(s)–swp curves for the overall andydrophilic pore networks with Brooks–Corey and van Genuchten modelsor all unimodal GDLs tested.
o create 10BB) does not alter the pc–swp behavior of theubstrate appreciably. Based on this information it should beossible to determine the pc–swp curve for the MPL. How-ver, this is not a trivial matter because the combined effectsf the added MPL material, additional pore volume in thePL and reduced pore volume in the substrate due to MPL
enetration, causes SGL 10BB to have a larger bulk volumend lower overall porosity than SGL 10BA. Instead, the poreistribution of the MPL can be found by assuming that twonimodal distributions, one for the substrate and one for thePL, can be added together. Thus, the saturation sBB
wp for the0BB GDL can be obtained from the following:
BBwp (pc) = ϕsBA
wp + (1 − ϕ)sMPLwp (17)
able 6odel fitting parameters for Leverett J(s) curve
Brooks–Corey van Genuchten
Jc λ RMS Jc m n RMS
(s) 0.6274 2.528 0.44 0.6982 0.7114 3.465 0.51
384 J.T. Gostick et al. / Journal of Power Sources 156 (2006) 375–387
Fig. 7. Comparison of porosimetry data for SGL 10BA and 10BB. (a) Pore volume vs. pore size histogram of SGL10BB and (b) pore volume vs. pore sizehistogram of SGL 10BA. Both are based on MSP with octane. (c) pc–swp curves of hydrophilic pore network in SGL 10BA and 10BB showing similarity ofsubstrate.
where ϕ is the proportion of the total pore volume in theportion of SGL 10BB not intruded by the MPL material, sBA
wp
the saturation of SGL 10BA, and sBBwp the saturation of SGL
10BB. Values ofϕ and sMPLwp can be determined by minimizing
the difference between the left and right hand sides of Eq.(17) using least squares. This regression yields the VG modelparameters for the MPL layer as well as ϕ (Table 7). As shownin Fig. 8, this approach provides an excellent fit for 10BB andEq. (17) expresses the pc–swp dependence for this GDL verywell.
Estimates for the penetration depth of the MPL into thesubstrate and the porosity of the MPL can be found by inter-preting the ϕ factor:
ϕ = V Sp
V BBp
= V Sp
V BBB εBB
T(18)
where V SP is the pore volume of the free substrate, V BB
P thetotal pore volume, V BB
B the bulk volume and εBBT the overall
porosity, all pertaining to the combined GDL. In the follow-ing analysis, it is assumed that the portion of the substratepenetrated by the MPL has the same porosity as the MPL.The pore volume of the substrate per unit bulk volume of
Table 7M
M
M
substrate can be taken as the porosity of the bare paper sincethe porosity distribution of the substrate is not altered by theaddition of the MPL (see Fig. 7a), i.e.:
V Sp
V SB
= εBAT (19)
Eqs. (18) and (19) can be combined to eliminate V SP , yielding:
V SB
V BBB
= ϕεBBT
εBAT
(20)
Inserting numerical values for ϕ, εBBT and εBA
T from this studyinto Eq. (20) gives a substrate bulk volume fraction of 0.754.
F1a
odel fitting parameters for MPL pc–swp curve
aterial van Genuchten Additional
pcb (bar) m n ϕ RMS
PL 8.443 0.5477 2.211 0.7938 0.32
ig. 8. Comparison of Eq. (17) with experimental pc–swp data for SGL0BB. The curves for the individual MPL and substrate contributions arelso shown, scaled by ϕ.
J.T. Gostick et al. / Journal of Power Sources 156 (2006) 375–387 385
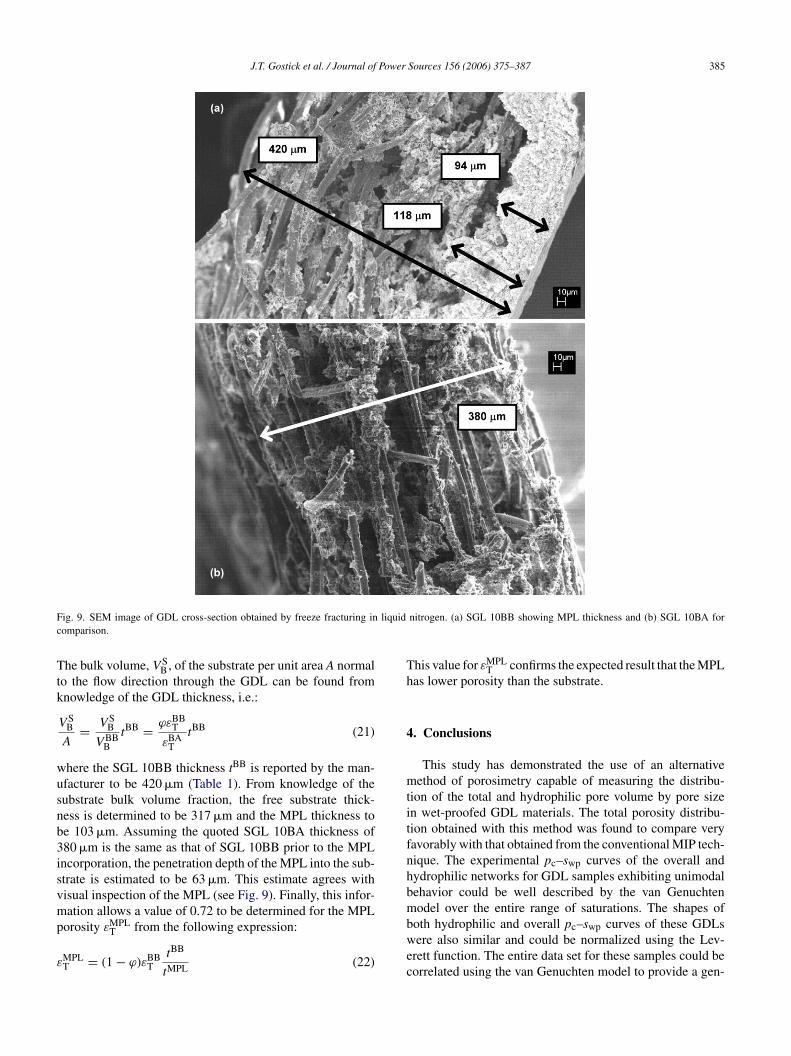
Fig. 9. SEM image of GDL cross-section obtained by freeze fracturing in liquid nitrogen. (a) SGL 10BB showing MPL thickness and (b) SGL 10BA forcomparison.
The bulk volume, V SB, of the substrate per unit area A normal
to the flow direction through the GDL can be found fromknowledge of the GDL thickness, i.e.:
V SB
A= V S
B
V BBB
tBB = ϕεBBT
εBAT
tBB (21)
where the SGL 10BB thickness tBB is reported by the man-ufacturer to be 420 �m (Table 1). From knowledge of thesubstrate bulk volume fraction, the free substrate thick-ness is determined to be 317 �m and the MPL thickness tobe 103 �m. Assuming the quoted SGL 10BA thickness of380 �m is the same as that of SGL 10BB prior to the MPLincorporation, the penetration depth of the MPL into the sub-strate is estimated to be 63 �m. This estimate agrees withvisual inspection of the MPL (see Fig. 9). Finally, this infor-mation allows a value of 0.72 to be determined for the MPLporosity εMPL
T from the following expression:
εMPLT = (1 − ϕ)εBB
TtBB
tMPL (22)
This value for εMPLT confirms the expected result that the MPL
has lower porosity than the substrate.
4. Conclusions
This study has demonstrated the use of an alternativemethod of porosimetry capable of measuring the distribu-tion of the total and hydrophilic pore volume by pore sizein wet-proofed GDL materials. The total porosity distribu-tion obtained with this method was found to compare veryfavorably with that obtained from the conventional MIP tech-nique. The experimental pc–swp curves of the overall andhydrophilic networks for GDL samples exhibiting unimodalbehavior could be well described by the van Genuchtenmodel over the entire range of saturations. The shapes ofboth hydrophilic and overall pc–swp curves of these GDLswere also similar and could be normalized using the Lev-erett function. The entire data set for these samples could becorrelated using the van Genuchten model to provide a gen-
386 J.T. Gostick et al. / Journal of Power Sources 156 (2006) 375–387
eral equation from which the pc–swp curves for other GDLmaterials could be predicted. However, materials with car-bon powder or a highly hydrophobic layer such as an MPL,did not exhibit this behavior. Separate analysis of the microp-orous layer of one GDL sample showed that its behavior couldbe independently described by the van Genuchten model.Then, this could be superimposed with the behavior of thestandard GDL substrate to predict the pc–swp curve of thecombined substrate–MPL GDL. This analysis allowed sev-eral important parameters of the GDL structure such as theMPL porosity and its penetration depth into the substrate tobe estimated. The van Genuchten model that was used todescribe the pc–swp curves also allows the relative perme-abilities to be estimated. This work has proposed alternativerelationships for the modeling of liquid transport in the GDLof PEMFCs. It is anticipated that this relationship will leadto more accurate prediction of behavior in the concentrationoverpotential region.
Acknowledgments
The authors acknowledge the financial support of the Nat-ural Sciences and Engineering Research Council of Canada(NSERC) during the course of this project. They also wishto thank Porotech Inc. (Vaughan, ON) for kindly providingaS
R
[
[11] G. Lin, W. He, T. Van Nguyen, Modeling liquid water effects in thegas diffusion and catalyst layers of the cathode of a PEM fuel cell,J. Electrochem. Soc. 151 (2004) A1999–A2006.
[12] D. Natarajan, T. Van Nguyen, Three-dimensional effects of liquidwater flooding in the cathode of a PEM fuel cell, J. Power Sources115 (2003) 66–80.
[13] D. Natarajan, T. Van Nguyen, A two-dimensional, two-phase, multi-component, transient model for the cathode of a proton exchangemembrane fuel cell using conventional gas distributors, J. Elec-trochem. Soc. 148 (2001) A1324–A1335.
[14] W. He, J.S. Yi, T. Van Nguyen, Two-phase flow model of the cathodeof PEM fuel cells using interdigitated flow fields, AICHE J. 46(2000) 2053–2064.
[15] L. You, H. Liu, A two-phase flow and transport model for the cathodeof PEM fuel cells, Int. J. Heat Mass Transfer 45 (2002) 2277–2287.
[16] A.Z. Weber, R.M. Darling, J. Newman, Modeling two-phasebehaviour in PEFCs, J. Electrochem. Soc. 151 (2004) A1715–A1727.
[17] J. Divisek, J. Fuhrmann, K. Gartner, R. Jung, Performance model-ing of a direct methanol fuel cell, J. Electrochem. Soc. 150 (2003)811–825.
[18] L. Pisani, G. Murgia, M. Valentini, B. D’Aguanno, A working modelof polymer electrolyte fuel cells comparisons between theory andexperiments, J. Electrochem. Soc. 149 (2002) 898–904.
[19] H.K. Hsuen, Performance equations for cathodes in polymer elec-trolyte fuel cells with non-uniform water flooding in gas diffusers,J. Power Sources 137 (2004) 183–195.
[20] M. Grujicic, K.M. Chittajallu, Optimization of the cathode geometryin polymer electrolyte membrane (PEM) fuel cells, Chem. Eng. Sci.59 (2004) 5883–5895.
[
[
[
[
[
[
[
[
[
[
[
[
ccess and support in the operation of their equipment andGL Carbon for donating GDL sample materials.
eferences
[1] S. Gottesfeld, Polymer Electrolyte Fuel Cells, Wiley–VCH, NewYork, 1997, pp. 195–301.
[2] U. Pasaogullari, C.Y. Wang, Liquid water transport in gas diffusionlayer of polymer electrolyte fuel cells, J. Electrochem. Soc. 151(2004) A399–A406.
[3] U. Pasaogullari, C.Y. Wang, Two-phase transport and the role ofmicro-porous layer in polymer electrolyte fuel cells, Electrochim.Acta 49 (2004) 4359–4369.
[4] Z.H. Wang, C.Y. Wang, K.S. Chen, Two-phase flow and transport inthe air cathode of proton exchange membrane fuel cells, J. PowerSources 94 (2001) 40–50.
[5] T. Berning, N. Djilali, A 3D, multiphase multicomponent model ofthe cathode and anode of a PEM fuel cell, J. Electrochem. Soc. 150(2003) A1589–A1598.
[6] M. Noponen, E. Birgersson, J. Ihonen, M. Vynnycky, A. Lundblad,G. Lindbergh, A two-phase non-isothermal PEFC model: theory andvalidation, Fuel Cells 4 (2004) 365–377.
[7] M. Hu, A. Gu, M. Wang, X. Zhu, L. Yu, Three dimensional, twophase flow mathematical model for PEM fuel cell: Part I. Modeldevelopment, Energy Conv. Manage. 45 (2004) 1861–1882.
[8] S. Mazumder, J.V. Cole, Rigorous 3-D mathematical modeling ofPEM fuel cells II. Model predictions with liquid water transport, J.Electrochem. Soc. 150 (2003) 1510–1517.
[9] N.P. Siegel, M.W. Ellis, D.J. Nelson, M.R. Von Spakovsky, A two-dimensional computational model of a PEMFC with liquid watertransport, J. Power Sources 128 (2004) 173–184.
10] J.H. Nam, M. Kaviany, Effective diffusivity and water-saturation dis-tribution in single- and two-layer PEMFC diffusion medium, Int. J.Heat Mass Transfer 46 (2003) 4595–4611.
21] A.Z. Weber, J. Newman, Modeling transport in polymer-electrolytefuel cells, Chem. Rev. 104 (2004) 4679–4726.
22] C.Y. Wang, Fundamental models for fuel cell engineering, Chem.Rev. 104 (2004) 4727–4765.
23] H.K. Lee, J.H. Park, D.Y. Kim, T.H. Lee, A study on the character-istics of the diffusion layer thickness and porosity of the PEMFC,J. Power Sources 131 (2004) 200–206.
24] C.S. Kong, D.-Y. Kim, H.-K. Lee, Y.-G. Shul, T.-H. Lee, Influenceof pore-size distribution of diffusion layer on mass-transport prob-lems of proton exchange membrane fuel cells, J. Power Sources 108(2002) 185–191.
25] L.R. Jordan, A.K. Shukla, T. Behrsing, N.R. Avery, B.C. Muddle, M.Forsyth, Effect of diffusion-layer morphology on the performance ofpolymer electrolyte fuel cells operating at atmospheric pressure, J.Appl. Electrochem. 30 (2000) 641–646.
26] E. Passalacqua, G. Squadrito, F. Lufrano, A. Patti, L. Giorgi, Effectsof the diffusion layer characteristics on the performance of poly-mer electrolyte fuel cell electrodes, J. Appl. Electrochem. 31 (2001)449–454.
27] E. Antolini, A. Pozio, L. Giorgi, E. Passalacqua, Morphologicalcharacteristics of carbon/polytetrafluoroethylene films deposited onporous carbon support, J. Mater. Sci. 33 (1998) 1837–1843.
28] M.V. Williams, E. Begg, L. Bonville, H.R. Kunz, J.M. Fenton, Char-acterization of gas diffusion layers for PEMFC, J. Electrochem. Soc.151 (2004) 1173–1180.
29] J. Ihonen, M. Mikkola, G. Lindbergh, Flooding of gas diffusionbacking in PEFCs: physical and electrochemical characterization, J.Electrochem. Soc. 151 (2004) 1152–1161.
30] M. Prasanna, H.Y. Ha, E.A. Cho, S.A. Hong, I.H. Oh, Influence ofcathode gas diffusion media on the performance of the PEMFCs, J.Power Sources 131 (2004) 147–154.
31] K.S. Udell, Heat transfer in porous media considering phase changeand capillarity - The heat pipe effect, Int. J. Heat Mass Transfer 28(1985) 485–495.
32] M.C. Leverett, Capillary behavior in porous solids, AIME Trans. 142(1941) 152–168.
J.T. Gostick et al. / Journal of Power Sources 156 (2006) 375–387 387
[33] P. Ustohal, F. Stauffer, T. Dracos, Measurement and modeling ofhydraulic characteristics of unsaturated porous media with mixedwettability, J. Contam. Hydrol. 33 (1998) 5–37.
[34] D. Bevers, R. Rogers, M. Von Bradke, Examination of the influ-ence of PTFE coating on the properties of carbon paper inpolymer electrolyte fuel cells, J. Power Sources 63 (1996) 193–201.
[35] H. Dohle, H. Schmitz, T. Bewer, J. Mergel, D. Stolten, Developmentof a compact 500 W class direct methanol fuel cell stack, J. PowerSources 106 (2002) 313–322.
[36] Y.M. Volfkovich, V.S. Bagotzky, V.E. Sosenkin, I.A. Blinov, Thestandard contact porosimetry, Colloids Surf. A 187–188 (2001)349–365.
[37] S.A. Grant, Extension of a temperature effects model for capil-lary pressure saturation relations, Water Resour. Res. 39 (2003) 11–110.
[38] H.Y. She, B.E. Sleep, The effect of temperature on capillary pre-ssure–saturation relationships for air–water and perchloroethylene–water systems, Water Resour. Res. 34 (1998) 2587–2597.
[39] G.W. Jackson, D.F. James, Permeability of fibrous porous media,Can. J. Chem. Eng. 64 (1986) 364–374.
[40] F.A.L. Dullien, Porous Media: Fluid Transport and Pore Structure,Academic Press, New York, 1992.
[41] M.A. Ioannidis, I. Chatzis, Network modelling of pore structure andtransport properties of porous media, Chem. Eng. Sci. 48 (1993)951–972.
[42] A.B.D. Cassie, S. Baxter, Wettability of porous surfaces, FaradaySoc. Trans. 40 (1944) 546–551.
[43] A.W. Adamson, Physical Chemistry of Surfaces, John Wiley andSons, New York, 1982.
[44] T.E. Hutchinson, Direct measurement of microscopic contact angle,Thin Solid Films 8 (1971) R25–R29.
[45] J. Divisek, R. Wilkenhoener, Y. Volfkovich, Structure investigationsof SOFC anode cermets. Part I: porosity investigations, J. Appl.Electrochem. 29 (1999) 153–163.
[46] J. Divisek, M. Eikerling, V. Mazin, H. Schmitz, U. Stimming, Y.M.Volfkovich, Study of capillary porous structure and sorption prop-erties of Nafion proton-exchange membranes swollen in water, J.Electrochem. Soc. 145 (1998) 2677–2683.
[47] G.G. Park, Y.J. Sohn, T.H. Yang, Y.G. Yoon, W.Y. Lee, C.S. Kim,Effect of PTFE contents in the gas diffusion media on the perfor-mance of PEMFC, J. Power Sources 131 (2004) 182–187.
[48] M.F. Mathias, J. Roth, J. Fleming, W. Lehnert, Diffusion mediamaterials and characterization, in: W. Vielstich, H.A. Gasteiger, A.Lamm (Eds.), Handbook of Fuel Cells—Fundamentals, Technologyand Applications, Part 1, vol. 3, John Wiley and Sons, New York,2003, pp. 517–237.
[49] M.T. van Genuchten, Closed-form equation for predicting thehydraulic conductivity of unsaturated soils, Soil Sci. Soc. Am. J.44 (1980) 892–898.
[50] J. Bear, Dynamics of Fluids in Porous Media, Dover Publications,New York, 1972.
Copyright © 2022 FDOKUMEN