Synthesis methods of low-Pt-loading electrocatalysts for proton exchange membrane fuel cell systems
Upload
independentCategory
view
1download
0
Se
Ja
b
a
ARRAA
KWSOIA
1
t[fbfyicteodru[
mert
0d
Electrochimica Acta 54 (2009) 6250–6256
Contents lists available at ScienceDirect
Electrochimica Acta
journa l homepage: www.e lsev ier .com/ locate /e lec tac ta
tudy of IrxRu1−xO2 oxides as anodic electrocatalysts for solid polymerlectrolyte water electrolysis
inbin Cheng a,b, Huamin Zhang a,∗, Guobao Chen a,b, Yining Zhang a,b
Lab of PEMFC Key Materials and Technologies, Dalian Institute of Chemical Physics, Chinese Academy of Science, 457 Zhongshan Road, Dalian, Liaoning 116023, ChinaGraduate School of the Chinese Academy of Sciences, Beijing 100039, China
r t i c l e i n f o
rticle history:eceived 17 March 2009eceived in revised form 26 May 2009ccepted 27 May 2009
a b s t r a c t
Electrocatalysts of the general formula IrxRu1−xO2 were prepared using Adams’ fusion method. The crys-tallite characterization was examined via XRD, and the electrochemical properties were examined viacyclic voltammetry (CV) in, linear sweep voltammetry (LSV) and chronopotentiometry measurements in0.5 M H2SO4. The electrocatalysts were applied to a membrane electrode assembly (MEA) and studied in
vailable online 6 June 2009
eywords:ater electrolysis
olid polymer electrolytexygen evolution reaction
situ in an electrolysis cell through electrochemical impedance spectroscopy (EIS) and stationary currentdensity–potential relations were investigated. The IrxRu1−xO2 (x = 0.2, 0.4, 0.6) compounds were found tobe more active than pure IrO2 and more stable than pure RuO2. The most active electrocatalyst obtainedhad a composition of Ir0.2Ru0.8O2. With an Ir0.2Ru0.8O2 anode, a 28.4% Pt/C cathode and the total noblemetal loading of 1.7 mg cm−2, the potential of water electrolysis was 1.622 V at 1 A cm−2 and 80 ◦C.
rxRu1−xO2 oxidesnodic electrocatalyst
. Introduction
Hydrogen is a recyclable and nonpolluting energy carrier. Withhe rapid development of proton exchange membrane fuel cells1,2], hydrogen will be used more widely in the future. There-ore, preparing hydrogen with high purity in an efficient mannerecomes important. Water electrolysis is an important method
or hydrogen preparation, and traditional alkaline water electrol-sis technology has been widely used in recent decades. However,t has some problems, such as high overpotential and corrosionaused by the alkaline electrolyte. In the 1960s, the General Elec-ric Company first proposed the concept of SPE (solid polymerlectrolyte) technology for space application [3]. The technologyf SPE water electrolysis possesses certain advantages over tra-itional alkaline water electrolysis [4–7], such as greater safety,eliability and energy efficiency. Moreover, the purity of the prod-ct gases from SPE water electrolysis cells is greater than 99.99%8].
In the process of hydrogen production by water electrolysis,
ost of the overpotential that gives rise to losses is related to thelectrochemical processes at the anode, where the O2 evolutioneaction takes place [9]. Much effort has been spent on improvinghese anodic activities. Since Henry B. Beer obtained the patent on
∗ Corresponding author. Tel.: +86 411 8437 9072; fax: +86 411 8466 5057.E-mail address: [email protected] (H. Zhang).
013-4686/$ – see front matter © 2009 Elsevier Ltd. All rights reserved.oi:10.1016/j.electacta.2009.05.090
© 2009 Elsevier Ltd. All rights reserved.
dimensionally stable anodes (DSA) in 1965 [10], RuO2 has been con-sidered the most efficient catalyst for the oxygen evolution reaction(OER) in the alkaline electrolyte [11,12]. However, in acidic media,pure RuO2 undergoes heavy erosion during O2 evolution and losesits activity. According to research by Kötz and Stucki [13], the rea-son for erosion of RuO2 is the production of soluble RuO4 during O2production. To improve the stability of RuO2, inert components likeIrO2, TiO2, Ta2O5, SnO2 or ZrO2 were doped [14]. IrO2 is an excel-lent electrocatalyst for OER [15–19] and is known for being the mostresistant material to O2 evolution in a strong acidic environment.Therefore, a compound of the formula IrxRu1−xO2 would be a moreappropriate electrocatalyst for OER in acidic electrolyte because ofits considerable activity and stability [20].
Kötz and Stucki prepared a RuO2–IrO2 film via reactive sputter-ing and found that even 20 percent IrO2 added to the continuoussolid solution could reduce the erosion rate of the oxide to about4% in the acidic electrolyte [21]. Furthermore, they proposed thatthe electrons available on IrO2 sites could be shared with RuO2sites; thus, the oxidation potentials of Ru were raised. Angelinettaand Trasatti [22] prepared a RuO2–IrO2 oxide electrode via ther-mal decomposition on a Ti support and investigated the surfaceproperties using cyclic voltammetry and ex UHV (AES and XPS)techniques. Wen and Hu [15] fabricated Ru–Ir binary oxides via
thermal decomposition and found that the Ru0.3Ir0.7O2 electrodedemonstrated maximum electrocatalytic activity. Mattos-Costa etal. [23] prepared IrxRu1−xO2 coatings on Ti plates using the sol–gelmethod and observed the “best” performance for the Ru0.7Ir0.3O2coating. The IrxRu1−xO2 catalysts studied above were prepared on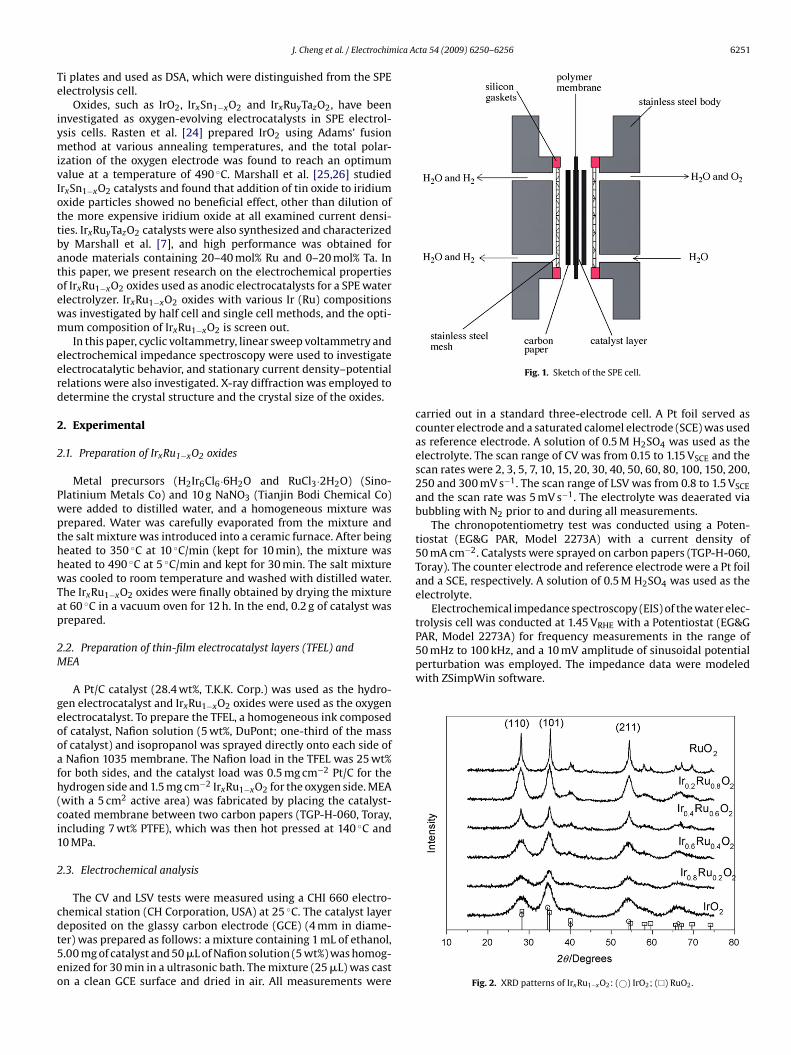
ica Acta 54 (2009) 6250–6256 6251
Te
iymivIottbatoewm
eerd
2
2
PwpthhwTap
2M
geooafh(ci1
2
cdt5eo
50 mHz to 100 kHz, and a 10 mV amplitude of sinusoidal potentialperturbation was employed. The impedance data were modeledwith ZSimpWin software.
J. Cheng et al. / Electrochim
i plates and used as DSA, which were distinguished from the SPElectrolysis cell.
Oxides, such as IrO2, IrxSn1−xO2 and IrxRuyTazO2, have beennvestigated as oxygen-evolving electrocatalysts in SPE electrol-sis cells. Rasten et al. [24] prepared IrO2 using Adams’ fusionethod at various annealing temperatures, and the total polar-
zation of the oxygen electrode was found to reach an optimumalue at a temperature of 490 ◦C. Marshall et al. [25,26] studiedrxSn1−xO2 catalysts and found that addition of tin oxide to iridiumxide particles showed no beneficial effect, other than dilution ofhe more expensive iridium oxide at all examined current densi-ies. IrxRuyTazO2 catalysts were also synthesized and characterizedy Marshall et al. [7], and high performance was obtained fornode materials containing 20–40 mol% Ru and 0–20 mol% Ta. Inhis paper, we present research on the electrochemical propertiesf IrxRu1−xO2 oxides used as anodic electrocatalysts for a SPE waterlectrolyzer. IrxRu1−xO2 oxides with various Ir (Ru) compositionsas investigated by half cell and single cell methods, and the opti-um composition of IrxRu1−xO2 is screen out.
In this paper, cyclic voltammetry, linear sweep voltammetry andlectrochemical impedance spectroscopy were used to investigatelectrocatalytic behavior, and stationary current density–potentialelations were also investigated. X-ray diffraction was employed toetermine the crystal structure and the crystal size of the oxides.
. Experimental
.1. Preparation of IrxRu1−xO2 oxides
Metal precursors (H2Ir6Cl6·6H2O and RuCl3·2H2O) (Sino-latinium Metals Co) and 10 g NaNO3 (Tianjin Bodi Chemical Co)ere added to distilled water, and a homogeneous mixture wasrepared. Water was carefully evaporated from the mixture andhe salt mixture was introduced into a ceramic furnace. After beingeated to 350 ◦C at 10 ◦C/min (kept for 10 min), the mixture waseated to 490 ◦C at 5 ◦C/min and kept for 30 min. The salt mixtureas cooled to room temperature and washed with distilled water.
he IrxRu1−xO2 oxides were finally obtained by drying the mixturet 60 ◦C in a vacuum oven for 12 h. In the end, 0.2 g of catalyst wasrepared.
.2. Preparation of thin-film electrocatalyst layers (TFEL) andEA
A Pt/C catalyst (28.4 wt%, T.K.K. Corp.) was used as the hydro-en electrocatalyst and IrxRu1−xO2 oxides were used as the oxygenlectrocatalyst. To prepare the TFEL, a homogeneous ink composedf catalyst, Nafion solution (5 wt%, DuPont; one-third of the massf catalyst) and isopropanol was sprayed directly onto each side ofNafion 1035 membrane. The Nafion load in the TFEL was 25 wt%
or both sides, and the catalyst load was 0.5 mg cm−2 Pt/C for theydrogen side and 1.5 mg cm−2 IrxRu1−xO2 for the oxygen side. MEAwith a 5 cm2 active area) was fabricated by placing the catalyst-oated membrane between two carbon papers (TGP-H-060, Toray,ncluding 7 wt% PTFE), which was then hot pressed at 140 ◦C and0 MPa.
.3. Electrochemical analysis
The CV and LSV tests were measured using a CHI 660 electro-hemical station (CH Corporation, USA) at 25 ◦C. The catalyst layer
eposited on the glassy carbon electrode (GCE) (4 mm in diame-er) was prepared as follows: a mixture containing 1 mL of ethanol,.00 mg of catalyst and 50 �L of Nafion solution (5 wt%) was homog-nized for 30 min in a ultrasonic bath. The mixture (25 �L) was castn a clean GCE surface and dried in air. All measurements wereFig. 1. Sketch of the SPE cell.
carried out in a standard three-electrode cell. A Pt foil served ascounter electrode and a saturated calomel electrode (SCE) was usedas reference electrode. A solution of 0.5 M H2SO4 was used as theelectrolyte. The scan range of CV was from 0.15 to 1.15 VSCE and thescan rates were 2, 3, 5, 7, 10, 15, 20, 30, 40, 50, 60, 80, 100, 150, 200,250 and 300 mV s−1. The scan range of LSV was from 0.8 to 1.5 VSCEand the scan rate was 5 mV s−1. The electrolyte was deaerated viabubbling with N2 prior to and during all measurements.
The chronopotentiometry test was conducted using a Poten-tiostat (EG&G PAR, Model 2273A) with a current density of50 mA cm−2. Catalysts were sprayed on carbon papers (TGP-H-060,Toray). The counter electrode and reference electrode were a Pt foiland a SCE, respectively. A solution of 0.5 M H2SO4 was used as theelectrolyte.
Electrochemical impedance spectroscopy (EIS) of the water elec-trolysis cell was conducted at 1.45 VRHE with a Potentiostat (EG&GPAR, Model 2273A) for frequency measurements in the range of
Fig. 2. XRD patterns of IrxRu1−xO2: (©) IrO2; (�) RuO2.
6252 J. Cheng et al. / Electrochimica Acta 54 (2009) 6250–6256
H2SO
oaflp
2
m(t
3
3
(qaItss[
cmagc
hfaaItt
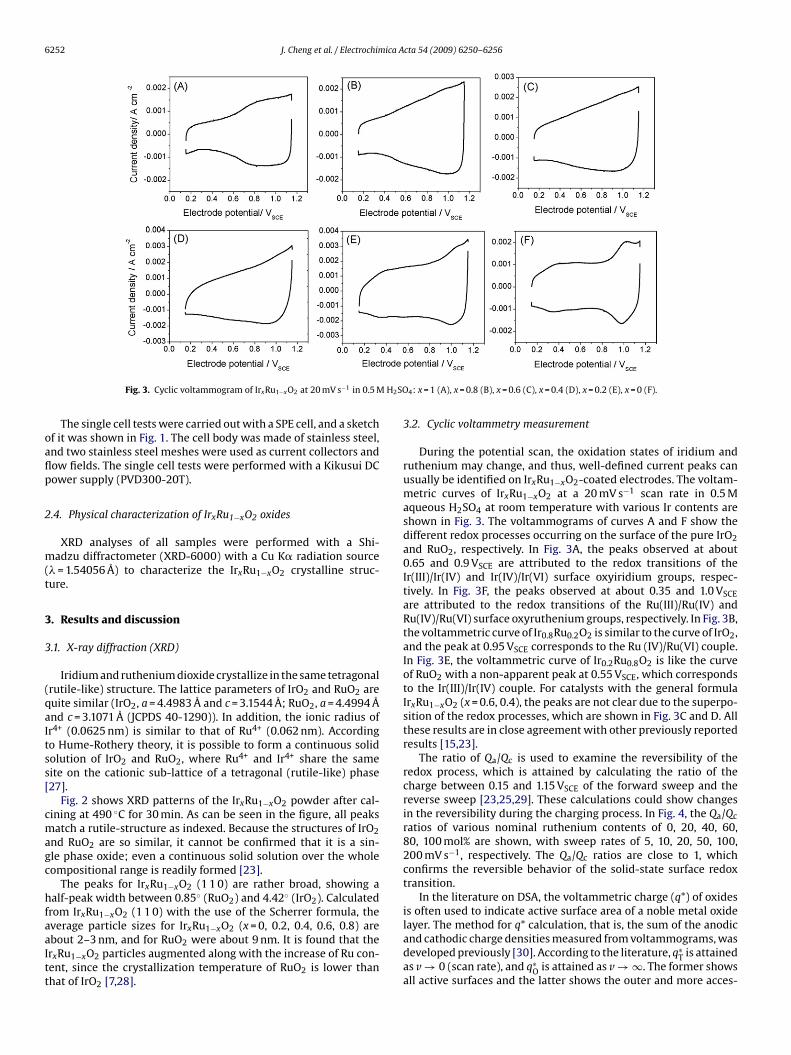
Fig. 3. Cyclic voltammogram of IrxRu1−xO2 at 20 mV s−1 in 0.5 M
The single cell tests were carried out with a SPE cell, and a sketchf it was shown in Fig. 1. The cell body was made of stainless steel,nd two stainless steel meshes were used as current collectors andow fields. The single cell tests were performed with a Kikusui DCower supply (PVD300-20T).
.4. Physical characterization of IrxRu1−xO2 oxides
XRD analyses of all samples were performed with a Shi-adzu diffractometer (XRD-6000) with a Cu K� radiation source
� = 1.54056 Å) to characterize the IrxRu1−xO2 crystalline struc-ure.
. Results and discussion
.1. X-ray diffraction (XRD)
Iridium and ruthenium dioxide crystallize in the same tetragonalrutile-like) structure. The lattice parameters of IrO2 and RuO2 areuite similar (IrO2, a = 4.4983 Å and c = 3.1544 Å; RuO2, a = 4.4994 Ånd c = 3.1071 Å (JCPDS 40-1290)). In addition, the ionic radius ofr4+ (0.0625 nm) is similar to that of Ru4+ (0.062 nm). Accordingo Hume-Rothery theory, it is possible to form a continuous solidolution of IrO2 and RuO2, where Ru4+ and Ir4+ share the sameite on the cationic sub-lattice of a tetragonal (rutile-like) phase27].
Fig. 2 shows XRD patterns of the IrxRu1−xO2 powder after cal-ining at 490 ◦C for 30 min. As can be seen in the figure, all peaksatch a rutile-structure as indexed. Because the structures of IrO2
nd RuO2 are so similar, it cannot be confirmed that it is a sin-le phase oxide; even a continuous solid solution over the wholeompositional range is readily formed [23].
The peaks for IrxRu1−xO2 (1 1 0) are rather broad, showing aalf-peak width between 0.85◦ (RuO2) and 4.42◦ (IrO2). Calculated
rom IrxRu1−xO2 (1 1 0) with the use of the Scherrer formula, theverage particle sizes for IrxRu1−xO2 (x = 0, 0.2, 0.4, 0.6, 0.8) arebout 2–3 nm, and for RuO2 were about 9 nm. It is found that therxRu1−xO2 particles augmented along with the increase of Ru con-ent, since the crystallization temperature of RuO2 is lower thanhat of IrO2 [7,28].
4: x = 1 (A), x = 0.8 (B), x = 0.6 (C), x = 0.4 (D), x = 0.2 (E), x = 0 (F).
3.2. Cyclic voltammetry measurement
During the potential scan, the oxidation states of iridium andruthenium may change, and thus, well-defined current peaks canusually be identified on IrxRu1−xO2-coated electrodes. The voltam-metric curves of IrxRu1−xO2 at a 20 mV s−1 scan rate in 0.5 Maqueous H2SO4 at room temperature with various Ir contents areshown in Fig. 3. The voltammograms of curves A and F show thedifferent redox processes occurring on the surface of the pure IrO2and RuO2, respectively. In Fig. 3A, the peaks observed at about0.65 and 0.9 VSCE are attributed to the redox transitions of theIr(III)/Ir(IV) and Ir(IV)/Ir(VI) surface oxyiridium groups, respec-tively. In Fig. 3F, the peaks observed at about 0.35 and 1.0 VSCEare attributed to the redox transitions of the Ru(III)/Ru(IV) andRu(IV)/Ru(VI) surface oxyruthenium groups, respectively. In Fig. 3B,the voltammetric curve of Ir0.8Ru0.2O2 is similar to the curve of IrO2,and the peak at 0.95 VSCE corresponds to the Ru (IV)/Ru(VI) couple.In Fig. 3E, the voltammetric curve of Ir0.2Ru0.8O2 is like the curveof RuO2 with a non-apparent peak at 0.55 VSCE, which correspondsto the Ir(III)/Ir(IV) couple. For catalysts with the general formulaIrxRu1−xO2 (x = 0.6, 0.4), the peaks are not clear due to the superpo-sition of the redox processes, which are shown in Fig. 3C and D. Allthese results are in close agreement with other previously reportedresults [15,23].
The ratio of Qa/Qc is used to examine the reversibility of theredox process, which is attained by calculating the ratio of thecharge between 0.15 and 1.15 VSCE of the forward sweep and thereverse sweep [23,25,29]. These calculations could show changesin the reversibility during the charging process. In Fig. 4, the Qa/Qc
ratios of various nominal ruthenium contents of 0, 20, 40, 60,80, 100 mol% are shown, with sweep rates of 5, 10, 20, 50, 100,200 mV s−1, respectively. The Qa/Qc ratios are close to 1, whichconfirms the reversible behavior of the solid-state surface redoxtransition.
In the literature on DSA, the voltammetric charge (q*) of oxidesis often used to indicate active surface area of a noble metal oxide
layer. The method for q* calculation, that is, the sum of the anodicand cathodic charge densities measured from voltammograms, wasdeveloped previously [30]. According to the literature, q∗T is attainedas v → 0 (scan rate), and q∗
O is attained as v → ∞. The former showsall active surfaces and the latter shows the outer and more acces-
J. Cheng et al. / Electrochimica Acta 54 (2009) 6250–6256 6253
s[ib
aicfaIv
iotbsittTnp
tion of iridium content, the IrxRu1−xO2 compound shows improved
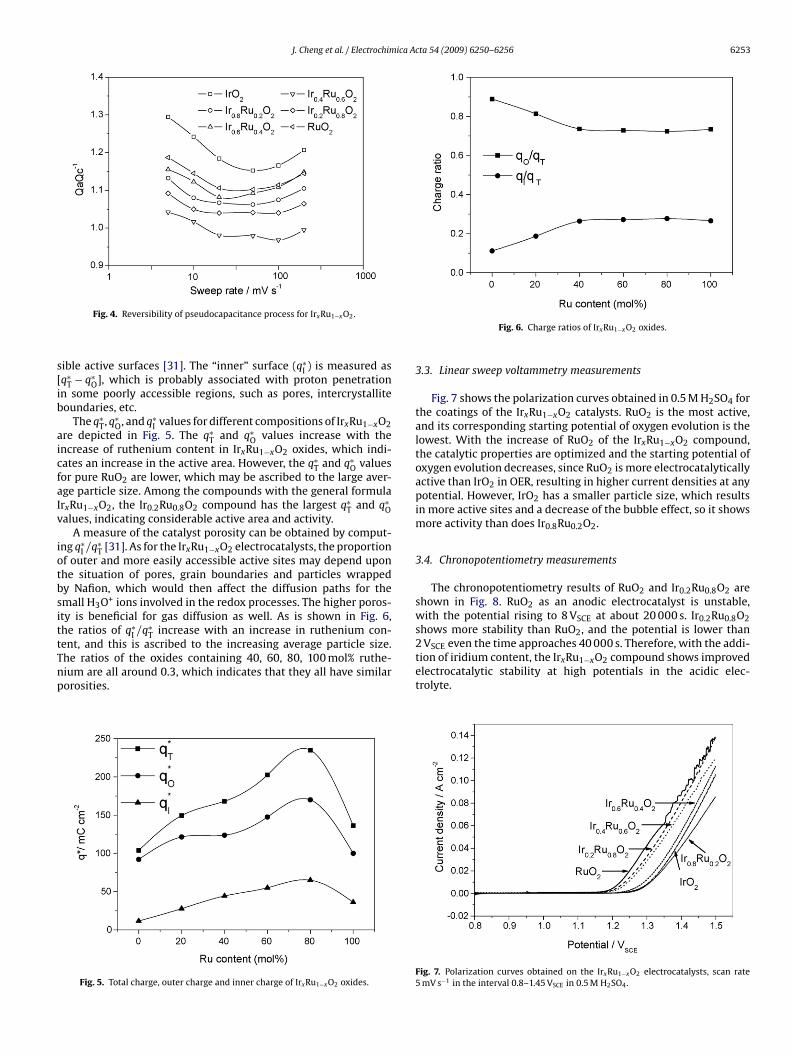
Fig. 4. Reversibility of pseudocapacitance process for IrxRu1−xO2.
ible active surfaces [31]. The “inner” surface (q∗I ) is measured as
q∗T − q∗
O], which is probably associated with proton penetrationn some poorly accessible regions, such as pores, intercrystalliteoundaries, etc.
The q∗T, q∗
O, and q∗I values for different compositions of IrxRu1−xO2
re depicted in Fig. 5. The q∗T and q∗
O values increase with thencrease of ruthenium content in IrxRu1−xO2 oxides, which indi-ates an increase in the active area. However, the q∗
T and q∗O values
or pure RuO2 are lower, which may be ascribed to the large aver-ge particle size. Among the compounds with the general formularxRu1−xO2, the Ir0.2Ru0.8O2 compound has the largest q∗
T and q∗O
alues, indicating considerable active area and activity.A measure of the catalyst porosity can be obtained by comput-
ng q∗I /q∗
T [31]. As for the IrxRu1−xO2 electrocatalysts, the proportionf outer and more easily accessible active sites may depend uponhe situation of pores, grain boundaries and particles wrappedy Nafion, which would then affect the diffusion paths for themall H3O+ ions involved in the redox processes. The higher poros-ty is beneficial for gas diffusion as well. As is shown in Fig. 6,he ratios of q∗
I /q∗T increase with an increase in ruthenium con-
ent, and this is ascribed to the increasing average particle size.he ratios of the oxides containing 40, 60, 80, 100 mol% ruthe-
ium are all around 0.3, which indicates that they all have similarorosities.Fig. 5. Total charge, outer charge and inner charge of IrxRu1−xO2 oxides.
Fig. 6. Charge ratios of IrxRu1−xO2 oxides.
3.3. Linear sweep voltammetry measurements
Fig. 7 shows the polarization curves obtained in 0.5 M H2SO4 forthe coatings of the IrxRu1−xO2 catalysts. RuO2 is the most active,and its corresponding starting potential of oxygen evolution is thelowest. With the increase of RuO2 of the IrxRu1−xO2 compound,the catalytic properties are optimized and the starting potential ofoxygen evolution decreases, since RuO2 is more electrocatalyticallyactive than IrO2 in OER, resulting in higher current densities at anypotential. However, IrO2 has a smaller particle size, which resultsin more active sites and a decrease of the bubble effect, so it showsmore activity than does Ir0.8Ru0.2O2.
3.4. Chronopotentiometry measurements
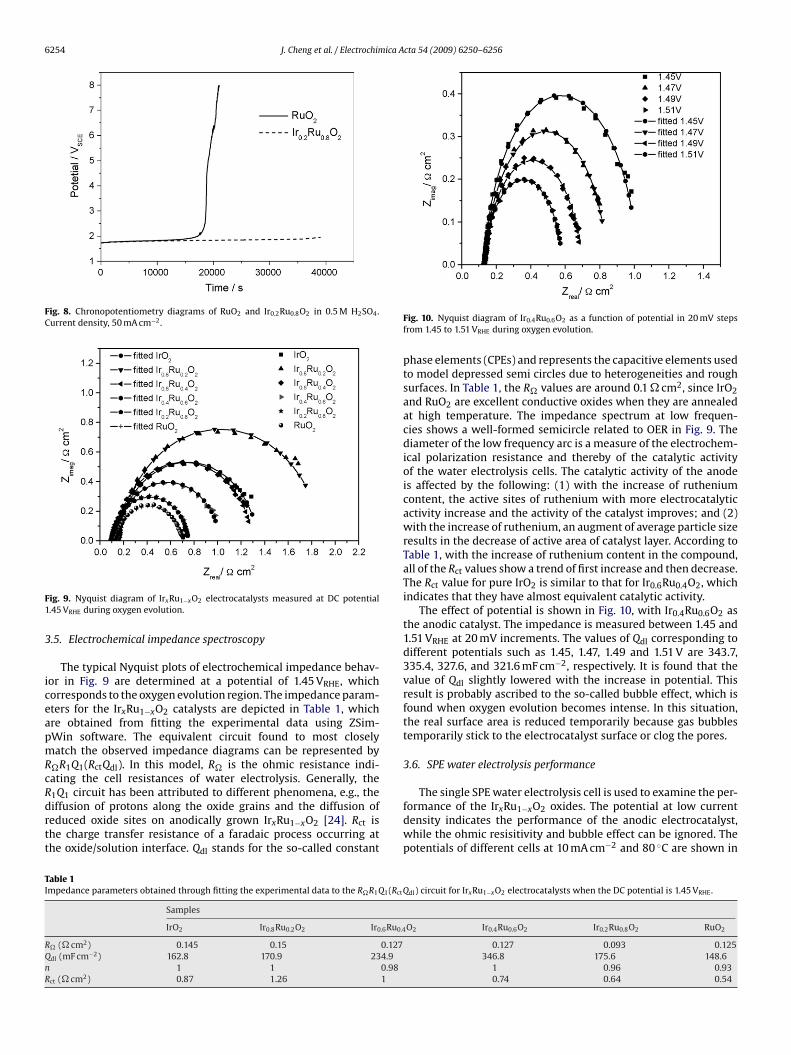
The chronopotentiometry results of RuO2 and Ir0.2Ru0.8O2 areshown in Fig. 8. RuO2 as an anodic electrocatalyst is unstable,with the potential rising to 8 VSCE at about 20 000 s. Ir0.2Ru0.8O2shows more stability than RuO2, and the potential is lower than2 VSCE even the time approaches 40 000 s. Therefore, with the addi-
electrocatalytic stability at high potentials in the acidic elec-trolyte.
Fig. 7. Polarization curves obtained on the IrxRu1−xO2 electrocatalysts, scan rate5 mV s−1 in the interval 0.8–1.45 VSCE in 0.5 M H2SO4.
6254 J. Cheng et al. / Electrochimica Acta 54 (2009) 6250–6256
Fig. 8. Chronopotentiometry diagrams of RuO2 and Ir0.2Ru0.8O2 in 0.5 M H2SO4.Current density, 50 mA cm−2.
F1
3
iceapmRcRdrtt
TI
RQnR
ig. 9. Nyquist diagram of IrxRu1−xO2 electrocatalysts measured at DC potential.45 VRHE during oxygen evolution.
.5. Electrochemical impedance spectroscopy
The typical Nyquist plots of electrochemical impedance behav-or in Fig. 9 are determined at a potential of 1.45 VRHE, whichorresponds to the oxygen evolution region. The impedance param-ters for the IrxRu1−xO2 catalysts are depicted in Table 1, whichre obtained from fitting the experimental data using ZSim-Win software. The equivalent circuit found to most closelyatch the observed impedance diagrams can be represented by
�R1Q1(RctQdl). In this model, R� is the ohmic resistance indi-ating the cell resistances of water electrolysis. Generally, the
1Q1 circuit has been attributed to different phenomena, e.g., theiffusion of protons along the oxide grains and the diffusion ofeduced oxide sites on anodically grown IrxRu1−xO2 [24]. Rct ishe charge transfer resistance of a faradaic process occurring athe oxide/solution interface. Qdl stands for the so-called constantable 1mpedance parameters obtained through fitting the experimental data to the R�R1Q1(RctQ
Samples
IrO2 Ir0.8Ru0.2O2 Ir0.6Ru0.4
� (� cm2) 0.145 0.15 0.127dl (mF cm−2) 162.8 170.9 234.9
1 1 0.98ct (� cm2) 0.87 1.26 1
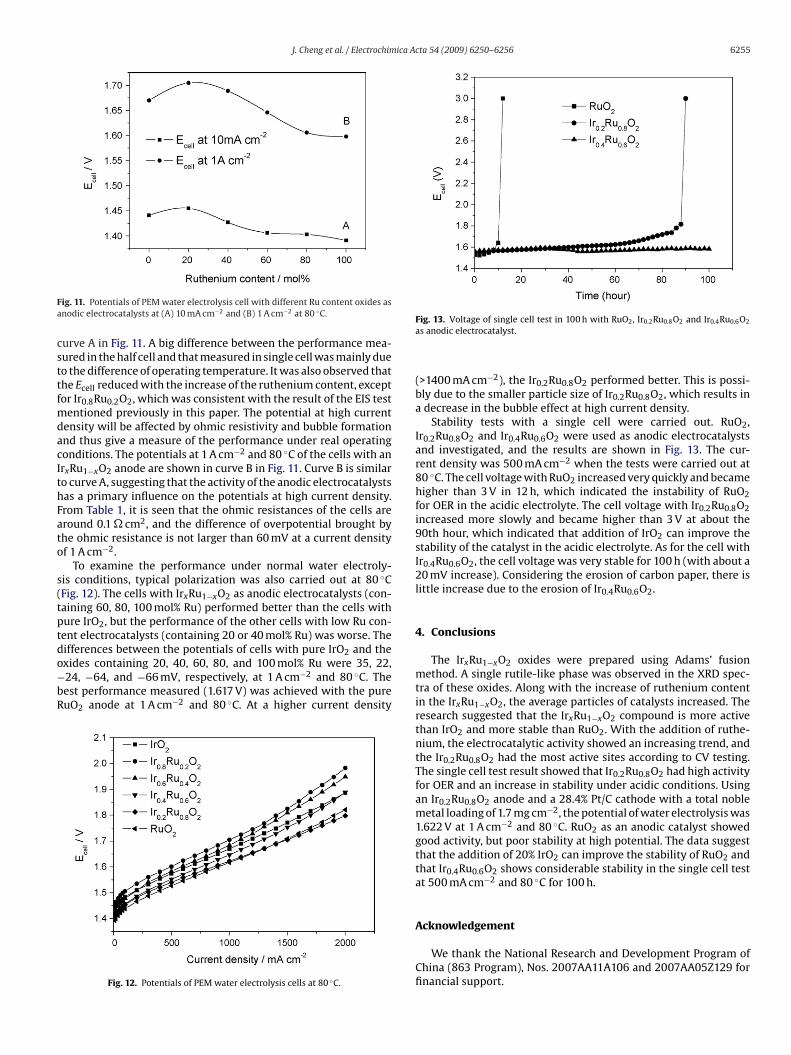
Fig. 10. Nyquist diagram of Ir0.4Ru0.6O2 as a function of potential in 20 mV stepsfrom 1.45 to 1.51 VRHE during oxygen evolution.
phase elements (CPEs) and represents the capacitive elements usedto model depressed semi circles due to heterogeneities and roughsurfaces. In Table 1, the R� values are around 0.1 � cm2, since IrO2and RuO2 are excellent conductive oxides when they are annealedat high temperature. The impedance spectrum at low frequen-cies shows a well-formed semicircle related to OER in Fig. 9. Thediameter of the low frequency arc is a measure of the electrochem-ical polarization resistance and thereby of the catalytic activityof the water electrolysis cells. The catalytic activity of the anodeis affected by the following: (1) with the increase of rutheniumcontent, the active sites of ruthenium with more electrocatalyticactivity increase and the activity of the catalyst improves; and (2)with the increase of ruthenium, an augment of average particle sizeresults in the decrease of active area of catalyst layer. According toTable 1, with the increase of ruthenium content in the compound,all of the Rct values show a trend of first increase and then decrease.The Rct value for pure IrO2 is similar to that for Ir0.6Ru0.4O2, whichindicates that they have almost equivalent catalytic activity.
The effect of potential is shown in Fig. 10, with Ir0.4Ru0.6O2 asthe anodic catalyst. The impedance is measured between 1.45 and1.51 VRHE at 20 mV increments. The values of Qdl corresponding todifferent potentials such as 1.45, 1.47, 1.49 and 1.51 V are 343.7,335.4, 327.6, and 321.6 mF cm−2, respectively. It is found that thevalue of Qdl slightly lowered with the increase in potential. Thisresult is probably ascribed to the so-called bubble effect, which isfound when oxygen evolution becomes intense. In this situation,the real surface area is reduced temporarily because gas bubblestemporarily stick to the electrocatalyst surface or clog the pores.
3.6. SPE water electrolysis performance
The single SPE water electrolysis cell is used to examine the per-formance of the IrxRu1−xO2 oxides. The potential at low currentdensity indicates the performance of the anodic electrocatalyst,while the ohmic resisitivity and bubble effect can be ignored. Thepotentials of different cells at 10 mA cm−2 and 80 ◦C are shown in
dl) circuit for IrxRu1−xO2 electrocatalysts when the DC potential is 1.45 VRHE.
O2 Ir0.4Ru0.6O2 Ir0.2Ru0.8O2 RuO2
0.127 0.093 0.125346.8 175.6 148.6
1 0.96 0.930.74 0.64 0.54
J. Cheng et al. / Electrochimica Acta 54 (2009) 6250–6256 6255
Fa
csttfmdacIthFato
s(tptdo−bR
ig. 11. Potentials of PEM water electrolysis cell with different Ru content oxides asnodic electrocatalysts at (A) 10 mA cm−2 and (B) 1 A cm−2 at 80 ◦C.
urve A in Fig. 11. A big difference between the performance mea-ured in the half cell and that measured in single cell was mainly dueo the difference of operating temperature. It was also observed thathe Ecell reduced with the increase of the ruthenium content, exceptor Ir0.8Ru0.2O2, which was consistent with the result of the EIS test
entioned previously in this paper. The potential at high currentensity will be affected by ohmic resistivity and bubble formationnd thus give a measure of the performance under real operatingonditions. The potentials at 1 A cm−2 and 80 ◦C of the cells with anrxRu1−xO2 anode are shown in curve B in Fig. 11. Curve B is similaro curve A, suggesting that the activity of the anodic electrocatalystsas a primary influence on the potentials at high current density.rom Table 1, it is seen that the ohmic resistances of the cells areround 0.1 � cm2, and the difference of overpotential brought byhe ohmic resistance is not larger than 60 mV at a current densityf 1 A cm−2.
To examine the performance under normal water electroly-is conditions, typical polarization was also carried out at 80 ◦CFig. 12). The cells with IrxRu1−xO2 as anodic electrocatalysts (con-aining 60, 80, 100 mol% Ru) performed better than the cells withure IrO2, but the performance of the other cells with low Ru con-ent electrocatalysts (containing 20 or 40 mol% Ru) was worse. The
ifferences between the potentials of cells with pure IrO2 and thexides containing 20, 40, 60, 80, and 100 mol% Ru were 35, 22,24, −64, and −66 mV, respectively, at 1 A cm−2 and 80 ◦C. Theest performance measured (1.617 V) was achieved with the pureuO2 anode at 1 A cm−2 and 80 ◦C. At a higher current densityFig. 12. Potentials of PEM water electrolysis cells at 80 ◦C.
Fig. 13. Voltage of single cell test in 100 h with RuO2, Ir0.2Ru0.8O2 and Ir0.4Ru0.6O2
as anodic electrocatalyst.
(>1400 mA cm−2), the Ir0.2Ru0.8O2 performed better. This is possi-bly due to the smaller particle size of Ir0.2Ru0.8O2, which results ina decrease in the bubble effect at high current density.
Stability tests with a single cell were carried out. RuO2,Ir0.2Ru0.8O2 and Ir0.4Ru0.6O2 were used as anodic electrocatalystsand investigated, and the results are shown in Fig. 13. The cur-rent density was 500 mA cm−2 when the tests were carried out at80 ◦C. The cell voltage with RuO2 increased very quickly and becamehigher than 3 V in 12 h, which indicated the instability of RuO2for OER in the acidic electrolyte. The cell voltage with Ir0.2Ru0.8O2increased more slowly and became higher than 3 V at about the90th hour, which indicated that addition of IrO2 can improve thestability of the catalyst in the acidic electrolyte. As for the cell withIr0.4Ru0.6O2, the cell voltage was very stable for 100 h (with about a20 mV increase). Considering the erosion of carbon paper, there islittle increase due to the erosion of Ir0.4Ru0.6O2.
4. Conclusions
The IrxRu1−xO2 oxides were prepared using Adams’ fusionmethod. A single rutile-like phase was observed in the XRD spec-tra of these oxides. Along with the increase of ruthenium contentin the IrxRu1−xO2, the average particles of catalysts increased. Theresearch suggested that the IrxRu1−xO2 compound is more activethan IrO2 and more stable than RuO2. With the addition of ruthe-nium, the electrocatalytic activity showed an increasing trend, andthe Ir0.2Ru0.8O2 had the most active sites according to CV testing.The single cell test result showed that Ir0.2Ru0.8O2 had high activityfor OER and an increase in stability under acidic conditions. Usingan Ir0.2Ru0.8O2 anode and a 28.4% Pt/C cathode with a total noblemetal loading of 1.7 mg cm−2, the potential of water electrolysis was1.622 V at 1 A cm−2 and 80 ◦C. RuO2 as an anodic catalyst showedgood activity, but poor stability at high potential. The data suggestthat the addition of 20% IrO2 can improve the stability of RuO2 andthat Ir0.4Ru0.6O2 shows considerable stability in the single cell testat 500 mA cm−2 and 80 ◦C for 100 h.
Acknowledgement
We thank the National Research and Development Program ofChina (863 Program), Nos. 2007AA11A106 and 2007AA05Z129 forfinancial support.

6 ica A
R
[[[[[[[
[
[
[[
[[[
[[
[
256 J. Cheng et al. / Electrochim
eferences
[1] K.B. Prater, J. Power Sources 61 (1996) 105.[2] D. Chu, R. Jiang, K. Gardner, R. Jacobs, J. Schimidt, T. Quakenbush, J. Stephens, J.
Power Sources 96 (2001) 168.[3] P.W. Lu, S. Srinivasan, J. Appl. Electrochem. 9 (1979) 269.[4] P. Millet, F. Andolfatto, R. Durand, Int. J. Hydrogen Energy 21 (1996)
87.[5] P. Millet, M. Pineri, J. Appl. Electrochem. 19 (1989) 162.[6] M. Tsypkin, E. Lyutikova, V. Fateev, V. Rusanov, Russ. J. Electrochem. 36 (2000)
545.[7] A.T. Marshall, S. Sunde, M. Tsypkin, R. Tunold, Int. J. Hydrogen Energy 32 (2007)
2320.[8] J.F. McElroy, J. Power Sources 47 (1994) 369.[9] J.O’M. Bockis, Int. J. Hydrogen Energy 24 (1999) 15.10] H.B. Beer, British Patent 1,147,442 (1969).
11] S. Trasatti, Electrochim. Acta 29 (1984) 1503.12] S. Trasatti, Electrochim. Acta 36 (1991) 225.13] R. Kötz, S. Stucki, J. Electroanal. Chem. 172 (1984) 211.14] O. De Nora, G. Bianchi, A. Nidola, G. Trisoglio, US Patent 3,926,751 (1975).15] T.-C. Wen, C.-C. Hu, J. Electrochem. Soc. 139 (1992) 2158.16] J.F.C. Boodts, S. Trasatti, J. Appl. Electrochem. 19 (1989) 255.[[
[[[
cta 54 (2009) 6250–6256
17] S. Trasatti, in: A. Wieckowski (Ed.), Interfacial Electrochemistry: Theory, Prac-tice, Applications, Marcel Dekker, New York, 1999, p. 69.
18] E. Slavcheva, I. Radev, S. Bliznakov, G. Topalov, P. Andreev, E. Budevski, Elec-trochim. Acta 52 (2007) 3889.
19] M.H.P. Santana, L.A. De Faria, Electrochim. Acta 51 (2006) 3578.20] J.B. Goodenough, R. Manoharan, M. Paranthaman, J. Am. Chem. Soc. 112 (1990)
2076.21] R. Kötz, S. Stucki, Electrochim. Acta 31 (1986) 1311.22] C. Angelinetta, S. Trasatti, J. Electroanal. Chem. 214 (1986) 535.23] F.I. Mattos-Costa, P. de Lima-Neto, S.A.S. Machado, L.A. Avaca, Electrochim. Acta
44 (1998) 1515.24] E. Rasten, G. Hagen, R. Tunold, Electrochim. Acta 48 (2003) 3945.25] A. Marshall, B. Børresen, G. Hagen, M. Tsypkin, R. Tunold, Electrochim. Acta 51
(2006) 3161.26] A. Marshall, B. Børresen, G. Hagen, M. Tsypkin, R. Tunold, Mater. Chem. Phys. 94
(2005) 226.
27] E. Balko, C. Davidson, J. Inorg. Nucl. Chem. 42 (1980) 1778.28] A. DeBattisti, G. Lodi, L. Nanni, G. Battaglin, A. Benedetti, Can. J. Chem. 75 (1997)1759.29] C. De Pauli, S. Trasatti, J. Electroanal. Chem. 396 (1995) 161.30] S. Ardizzone, G. Fregonara, S. Trasatti, Electrochim. Acta 35 (1990) 263.31] J. Gaudet, A.C. Tavares, S. Trasatti, D. Guay, Chem. Mater. 17 (2005) 1570.
Copyright © 2022 FDOKUMEN