Effect of Diffusion Limitations of the Response of Biosensors Utilizing Parallerl Substrates...
10
European Congress on Computational Methods in Applied Sciences and Engineering (ECCOMAS 2012) J. Eberhardsteiner et.al. (eds.) Vienna, Austria, September 10-14, 2012 EFFECTS OF DIFFUSION LIMITATIONS ON THE RESPONSE OF BIOSENSORS UTILIZING PARALLEL SUBSTRATES CONVERSION Vytautas Ašeris 1 , Romas Baronas 1 and Juozas Kulys 2 1 Department of Software Engineering, Vilnius University Naugarduko 24, LT-03225 Vilnius, Lithuania [email protected], [email protected] 2 Institute of Biochemistry, Vilnius University Sauletekio al. 11, LT-10223 Vilnius, Lithuania [email protected] Keywords: computational modelling, simulation, reaction-diffusion, biosensor Abstract. Biosensors are analytical devices used for the recognition of chemical substances in a solution to be analysed. The mathematical and computational modelling is widely used to improve the biosensors design and to optimize their configuration. The purpose of this work was to investigate the peculiarities of the catalytic biosensors utiliz- ing parallel substrates conversion by using digital simulation. Mathematical and correspond- ing computational models of the analysed biosensor were developed. The mathematical model involves three regions in a one-dimensional space: the enzymatic and diffusion layers and a convective region. Biosensors operation is described by the equations of the reaction- diffusion type. The digital simulation was carried out using the finite difference technique by applying Crank–Nicolson finite difference method. The dependency of the biosensors response and sensitivity on the model parameters was in- vestigated. It was discovered that the diffusion layer thickness of the analysed biosensor has considerable influence on the biosensors response, sensitivity and half maximal effective con- centration. Investigation showed that the largest values of the Biot number represent the lowest values of the normalized steady-state current. The sensitivity and the half maximal effective concentra- tion of the biosensor can be increased by increasing the Biot number.
Transcript of Effect of Diffusion Limitations of the Response of Biosensors Utilizing Parallerl Substrates...
European Congress on Computational Methods in Applied Sciences and Engineering (ECCOMAS 2012)
J. Eberhardsteiner et.al. (eds.) Vienna, Austria, September 10-14, 2012
EFFECTS OF DIFFUSION LIMITATIONS ON THE RESPONSE OF
BIOSENSORS UTILIZING PARALLEL SUBSTRATES CONVERSION
Vytautas Ašeris1, Romas Baronas
1 and Juozas Kulys
2
1 Department of Software Engineering, Vilnius University Naugarduko 24, LT-03225 Vilnius, Lithuania
[email protected], [email protected]
2 Institute of Biochemistry, Vilnius University Sauletekio al. 11, LT-10223 Vilnius, Lithuania
Keywords: computational modelling, simulation, reaction-diffusion, biosensor
Abstract. Biosensors are analytical devices used for the recognition of chemical substances
in a solution to be analysed. The mathematical and computational modelling is widely used to
improve the biosensors design and to optimize their configuration.
The purpose of this work was to investigate the peculiarities of the catalytic biosensors utiliz-
ing parallel substrates conversion by using digital simulation. Mathematical and correspond-
ing computational models of the analysed biosensor were developed. The mathematical model
involves three regions in a one-dimensional space: the enzymatic and diffusion layers and a
convective region. Biosensors operation is described by the equations of the reaction-
diffusion type. The digital simulation was carried out using the finite difference technique by
applying Crank–Nicolson finite difference method.
The dependency of the biosensors response and sensitivity on the model parameters was in-
vestigated. It was discovered that the diffusion layer thickness of the analysed biosensor has
considerable influence on the biosensors response, sensitivity and half maximal effective con-
centration.
Investigation showed that the largest values of the Biot number represent the lowest values of
the normalized steady-state current. The sensitivity and the half maximal effective concentra-
tion of the biosensor can be increased by increasing the Biot number.
V. Ašeris, R. Baronas and J. Kulys
2
1 INTRODUCTION
Biosensors are analytical devices used mainly for the recognition of chemical substances in a solution to be analysed [1]. In this work, catalytic biosensors are analysed. The device speci-ficity for a particular substance is achieved by applying a specific enzyme. An amperometric biosensor assesses the concentration of the analyte through the measurement of the faradaic current on a working electrode. These biosensors are most abundant and they found the larg-est application in medicine, ecology and environmental monitoring [2].
The understanding of the kinetic peculiarities of the biosensors behaviour is of crucial im-portance for their design. The mathematical and computational modelling is widely used to improve the biosensors design and to optimize their configuration [3].
The purpose of this work was to develop a computational model for an efficient simulation of an amperometric biosensor utilizing parallel substrates conversion as well as to investigate the influence of the physical and kinetic parameters on the biosensor response [4].
We consider the following kinetic scheme for two substrates (S1 and S2), two enzymes (E1 and E2) and two reaction products (P1 and P2):
,PS 1E
11→ (1)
2E
21 PSS 2→+ . (2)
The use of catalase and peroxidase enzymes is possible in the parallel substrates conver-sion scheme. The catalase (E1) catalyzes hydrogen peroxide splitting with oxygen (O2, denot-ed as P1) production. Peroxidase (E2) catalyzes the oxidation of a broad number of substrates (S2) including some drugs. The produced molecular oxygen can be selectively determined by a sensitive to oxygen electrode, e.g. Clark type electrode [6]. Such biosensors are applicable for metabolites determination in complex biological liquids [7].
The biosensor action consists of two main phases, the first phase when only hydrogen per-oxide (S1) is present in the solution and the second phase when the second substrate (S2) is poured into the solution. The change between the steady-state responses in the both phases is measured as the relative response of the biosensor, indicating the concentration of the second substrate.
The mathematical model of the biosensor utilizing parallel substrates conversion comprises of two compartments, a layer of the enzymes co-immobilized on the electrode surface and an outer diffusion layer. In this paper the effect of the diffusion limitation on the biosensors re-sponse, the sensitivity and the half maximal effective concentration is analysed at the transient and the steady-state conditions. The computational modelling was carried out by using finite difference technique [8]. Calculations showed a complex nonlinear behaviour of the biosensor sensitivity at high concentrations of the catalase as well as low concentrations of the peroxi-dase.
2 MATHEMATICAL MODEL
The mathematical and corresponding computational models of the biosensor utilizing par-allel substrates conversion were developed. The mathematical model involves three regions in a one-dimensional space: the enzymatic and diffusion layers and a convective region.
2.1 Governing equations
The following equations of the reaction-diffusion type describe the biosensor operation in the enzyme layer (0 < x < d, t > 0),
V. Ašeris, R. Baronas and J. Kulys
3
,,222,121
,2,122221,1112
,12
,1
,1
ee
ee
e
e
s
e
sksk
ssekksek
x
sD
t
se +
−−∂
∂=
∂
∂ (3)
,,222121
,2,122221
2
,22
,2
,2
e
eee
s
e
sksk
ssekk
x
sD
t
se +
−∂
∂=
∂
∂ (4)
,,1112
,12
,1
,1 e
e
p
esek
x
pD
t
pe
+∂
∂=
∂
∂ (5)
where x and t stand for space and time, respectively, s1,e(x, t), s2(x, t) and p1(x, t) are the molar concentrations of the substrates S1, S2 and the product P1 in the enzyme layer of the thickness d, respectively, and
esD,1
, esD
,2,
epD,1
are the constant diffusion coefficients. The second
product does not have any influence on the analysed parameters, therefore it is not present in the governing equations.
Outside the enzyme layer (t > 0, d < x < d +δ) only the mass transport by diffusion of the substrates and the product takes place:
,,,, 1212
2
psscx
cD
t
c dC
d
d=
∂∂
=∂∂
(6)
where cd(x, t) stand for the molar concentrations of the substrates and the product in the diffu-sion layer of the thickness δ, and
dcD are the diffusion coefficient for different materials.
A Nernst approach was used on the diffusion layer: the thickness δ remains unchanged with time [10]. According to Nernst approach the solution is uniform in concentration away from the diffusion layer because of the stirring.
2.2 Initial conditions
At the start (t = 0) of the biosensor operation some of the first substrate appears in the bulk,
,,,,,,,0,0)0,( ,1,2,1,1,2,1 dddeee psspsscdxxc =+<<= δ (7)
,)0,( 10,1 sds d =+ δ (8)
,0)0,(,2 =+ δds d (9)
where s10 and s20 are the concentrations of the first and second substrates in the bulk solution, respectively.
2.3 Boundary conditions
The following boundaries are defined: between the electrode and the enzymatic layer (x = 0), between the layers of enzyme and diffusion (x = d) and between the diffusion layer and bulk solution (x = d +δ).
The fluxes of the analysed materials entering the surface of the enzyme membrane are con-sidered equal to the corresponding fluxes exiting through the stagnant external layer. This is defined by the following matching conditions (t > 0):
,,,, 1212
2
2
2
psscx
cD
x
cD
dx
dC
dx
eC de
=∂∂
=∂∂
==
(10)
V. Ašeris, R. Baronas and J. Kulys
4
,,,),,(),( 121 pssctdctdc de == (11)
The substrates are considered electro-inactive substances, while the concentration p1 of the first product at the electrode surface is being permanently reduced to zero due to the polariza-tion of the electrode (t > 0),
,,,0 21
0
2
2
sscx
cD
x
eCe
==∂∂
=
(12)
.0),0(1 =tpe
(13)
According to Nernst approach the concentrations of the substrates and the product in the bulk solution remain constant during the biosensor operation,
,)( 10,1 sds d =+δ (14)
,if,
if,0),(
20,2
≥
<=+
Tts
Tttds d δ (15)
,0),(1 =+ tdpe
δ (16)
where T stands for time moment when the second substrate appears in the solution.
3 CHARACTERISTICS OF THE BIOSENSOR
The peculiarities of the biosensor operation are described by a number of various parame-ters [3]. In this paper we analyse the impact of the Biot number on the biosensor response, the sensitivity and the half maximal effective concentration of the biosensor.
The anodic or cathodic current is assumed as the response of the amperometric biosensor. The density i(t) of the measured current is directly proportional to the flux of the first reaction product at the electrode surface. According to Faraday’s and Fick’s laws the current density is obtained as follows [1]:
,)(0
,1
,1
=∂
∂=
x
e
pex
pFDnti
e (17)
where F is the Faraday constant (F = 96,486×106 CM-1m-3), and ne is a number of electrons involved in the electrochemical reaction.
The system (3)-(17) describing the behaviour of the biosensor approaches the steady-state as t → ∞,
),(lim)( titit
s ∞→= (18)
where is is the density of the steady-state biosensor current. The thickness δ of the diffusion layer is inversely proportional to the intensity of the stir-
ring of the buffer solution. The more intense stirring corresponds to the thinner diffusion layer and the larger Biot number:
δ
d
e
S
S
D
D
dBi ,2
,2
×= , (19)
V. Ašeris, R. Baronas and J. Kulys
5
where Bi is the Biot number expressing the ratio of the internal mass transfer resistance to the external one. The influence of the Biot number on the response is investigated for various bio-sensors [11-13]. The diffusion layer, which is treated as the Nernst layer, practically does not depend upon the enzyme membrane thickness d. The Nernst layer may be practically mini-mized up to δ = 2µm, but no zero thickness can be achieved [5].
The influence of diffusion module or the Damköhler number [14],
esDdek
,1
211
2 =σ , (20)
was also investigated. The diffusion modulus essentially compares the rate of the enzyme re-action k1e1 with the diffusion rate 2
,1dD
es .
At the start of the biosensor operation there is no second substrate in the solution, and the steady-state current density is assumed to be equal to is1. The second substrate appears in the bulk after the time T. Assuming is as the final density of the steady-state current at presence of both substrates in the bulk, the difference between the two steady-state currents (is1 and is) is used to evaluate the concentration of the second substrate,
sss iii −= 12 . (21)
The difference (21) between the currents was normalised and used to investigate the influ-ence of S2 on the response:
1
1
1
2
s
ss
s
sr
i
ii
i
iI
−== , (22)
The sensitivity is another very important characteristic of the biosensor,
,),(
),()(
20
20
20
20
sBiI
s
s
sBiIBiBS ×
∂∂
= (23)
where BS is the dimensionless biosensor sensitivity, I(Bi, s20) is the steady-state current calcu-lated at the Biot number Bi and the concentration s20 of S2 in the bulk.
The half maximal effective concentration C50 [9] was defined as the concentration of S2 at which the response of the biosensor reaches half of the maximal steady-state response keeping the concentration of S1 constant,
{ } { },)(lim5.0)(:)(lim5.0)(: 200
*20
*20202
0
*202
*2050
2020
sIsIssisisC rs
rss
s →→==== (24)
where Ir(s20) the relative current (22) at the steady-state achieved at the concentration s20 of the second substrate. A greater value of C50 corresponds to a longer linear part of the calibra-tion curve [9].
4 DIGITAL SIMULATION
The digital simulation was carried out using the finite difference technique by applying Crank–Nicolson finite difference method [3]. The software was implemented by using C++ programming language [15].
In the numerical simulation the steady-state biosensor response was assumed when the de-cay rate of the biosensor current becomes less than the given dimensionless decay rate ε,
V. Ašeris, R. Baronas and J. Kulys
6
,)(,)(
)(:min
0)(sR
tiR iti
dt
tdi
ti
ttt ≈
<=>
ε (25)
where tR is assumed as the response time. The assumed response time is very sensitive to de-cay rate ε, when ε → 0, tR → ∞. In calculations we used ε = 10-3.
The dependencies of the biosensors response, the sensitivity and the half maximal effective concentration on the Biot number were investigated. The set of parameters listed in Table 1 remained constant for all the calculations.
Parameter Notation Value Dimension
Diffusion coefficient in enzyme layer esD
,1,
esD,2
, epD
,1 3×10⁻¹⁰ m2s-1
Diffusion coefficient in diffusion layer dsD
,1,
dsD,2
, dpD
,1 6×10⁻¹⁰ m2s-1
Number of electrons involved in the elec-trochemical reaction
ne 2 -
Reaction rate constant k1 107 M-1s-1 - k21 7.1×10⁶ M-1s-1 - k22 7.1×10⁶ M-1s-1
First substrate concentration s1 5.0×10⁻³ M Second enzyme concentration e2 1.0×10⁻⁸ M
Enzyme layer thickness d 1.0×10⁻⁵ m
Table 1: Constant values of the biosensor parameters.
The adequacy of the developed computational model was validated by using know analyti-cal solutions for the specific set of parameters [16]. The relative difference between analytical and computational current densities at the steady-state was less than 1%.
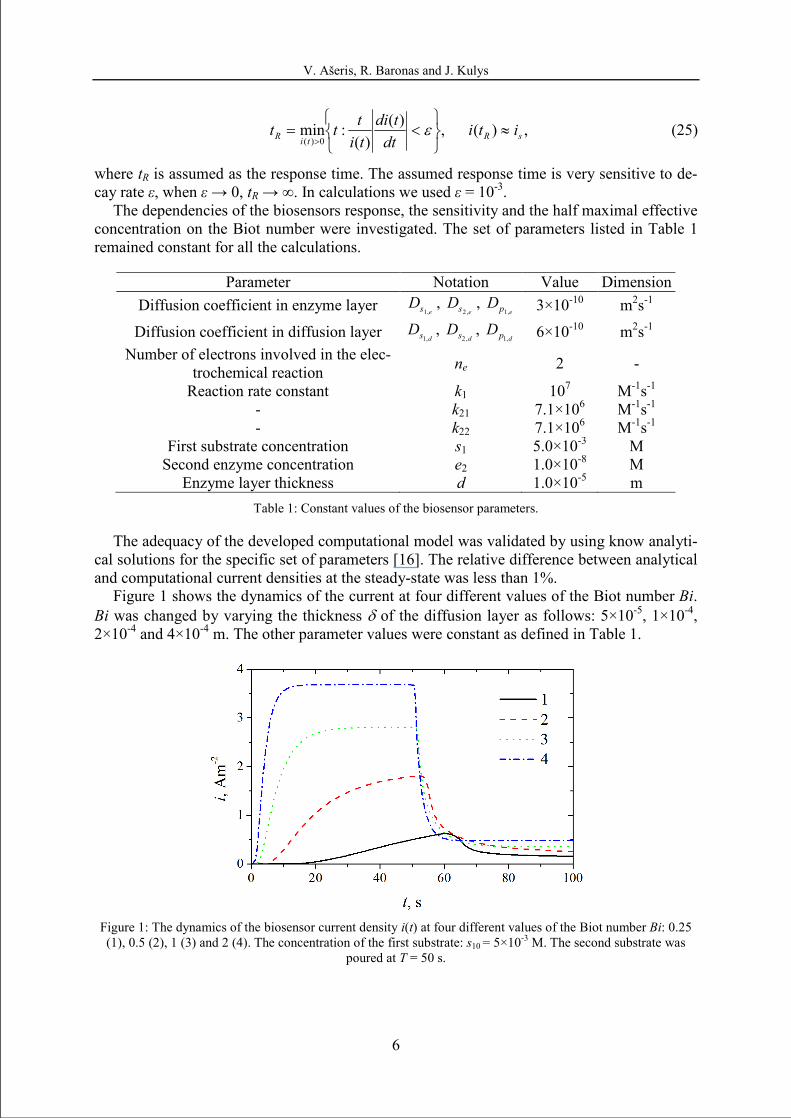
Figure 1 shows the dynamics of the current at four different values of the Biot number Bi. Bi was changed by varying the thickness δ of the diffusion layer as follows: 5×10⁻⁵, 1×10⁻⁴, 2×10⁻⁴ and 4×10⁻⁴ m. The other parameter values were constant as defined in Table 1.
Figure 1: The dynamics of the biosensor current density i(t) at four different values of the Biot number Bi: 0.25 (1), 0.5 (2), 1 (3) and 2 (4). The concentration of the first substrate: s10 = 5×10⁻³ M. The second substrate was
poured at T = 50 s.
V. Ašeris, R. Baronas and J. Kulys
7
As one can see from Figure 1, the larger Biot number corresponds to the higher biosensor response, especially noticeable in the first operational phase. For the larger Biot numbers (Bi = 3, 4) the time needed to reach steady-state is significantly lesser that for the smaller Biot numbers (curves 1 and 2, Bi = 0.25, 0.5). A smaller Biot number represents a thicker diffusion layer as well as less intensive stirring in the solution. A decrease in the stirring process leads to the delayed change in biosensors response in the beginning of the second operational stage (curve 1, Bi = 0.25).
5 MODELLING RESULTS
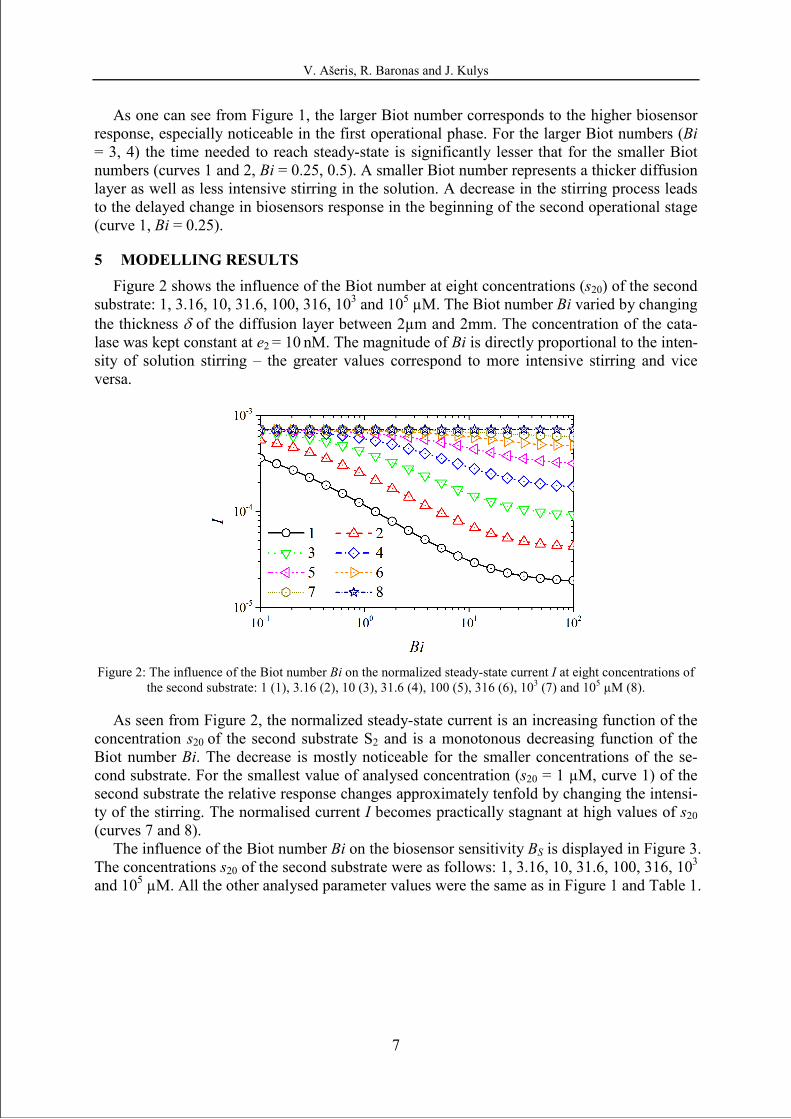
Figure 2 shows the influence of the Biot number at eight concentrations (s20) of the second substrate: 1, 3.16, 10, 31.6, 100, 316, 103 and 105 µM. The Biot number Bi varied by changing the thickness δ of the diffusion layer between 2µm and 2mm. The concentration of the cata-lase was kept constant at e2 = 10 nM. The magnitude of Bi is directly proportional to the inten-sity of solution stirring – the greater values correspond to more intensive stirring and vice versa.
Figure 2: The influence of the Biot number Bi on the normalized steady-state current I at eight concentrations of
the second substrate: 1 (1), 3.16 (2), 10 (3), 31.6 (4), 100 (5), 316 (6), 103 (7) and 105 µM (8).
As seen from Figure 2, the normalized steady-state current is an increasing function of the concentration s20 of the second substrate S2 and is a monotonous decreasing function of the Biot number Bi. The decrease is mostly noticeable for the smaller concentrations of the se-cond substrate. For the smallest value of analysed concentration (s20 = 1 µM, curve 1) of the second substrate the relative response changes approximately tenfold by changing the intensi-ty of the stirring. The normalised current I becomes practically stagnant at high values of s20 (curves 7 and 8).
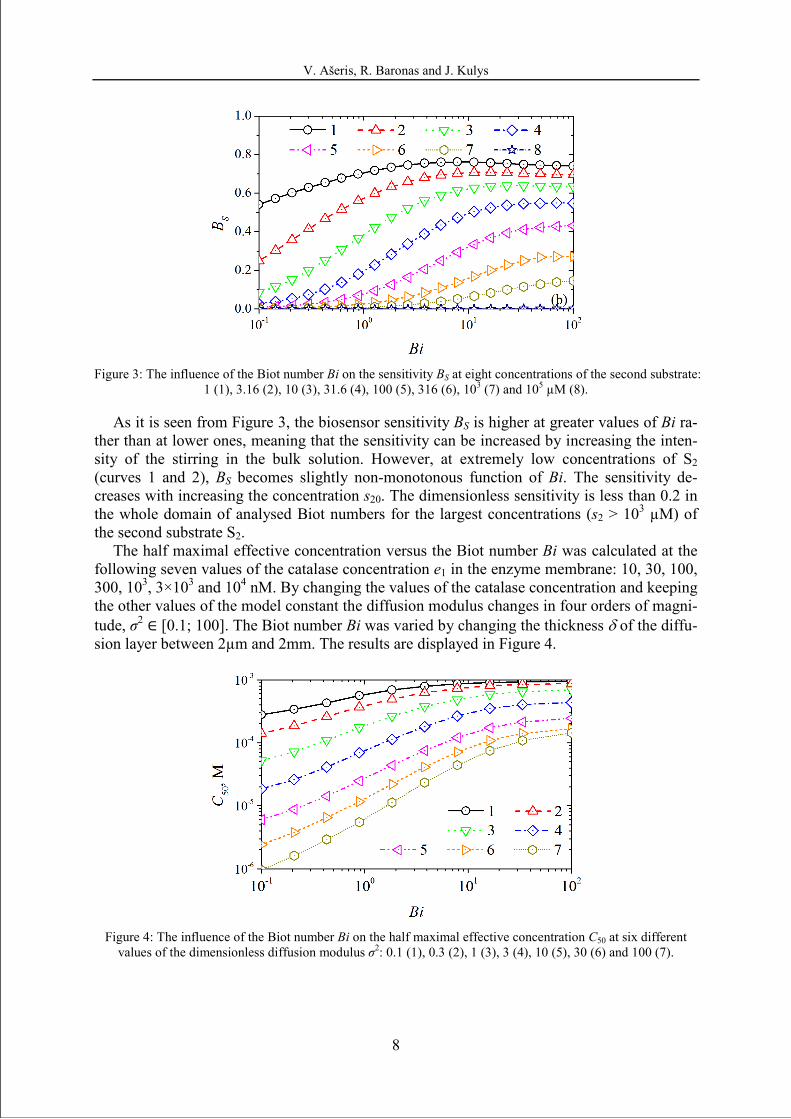
The influence of the Biot number Bi on the biosensor sensitivity BS is displayed in Figure 3. The concentrations s20 of the second substrate were as follows: 1, 3.16, 10, 31.6, 100, 316, 103 and 105 µM. All the other analysed parameter values were the same as in Figure 1 and Table 1.
V. Ašeris, R. Baronas and J. Kulys
8
Figure 3: The influence of the Biot number Bi on the sensitivity BS at eight concentrations of the second substrate:
1 (1), 3.16 (2), 10 (3), 31.6 (4), 100 (5), 316 (6), 103 (7) and 105 µM (8).
As it is seen from Figure 3, the biosensor sensitivity BS is higher at greater values of Bi ra-ther than at lower ones, meaning that the sensitivity can be increased by increasing the inten-sity of the stirring in the bulk solution. However, at extremely low concentrations of S2 (curves 1 and 2), BS becomes slightly non-monotonous function of Bi. The sensitivity de-creases with increasing the concentration s20. The dimensionless sensitivity is less than 0.2 in the whole domain of analysed Biot numbers for the largest concentrations (s2 > 103 µM) of the second substrate S2.
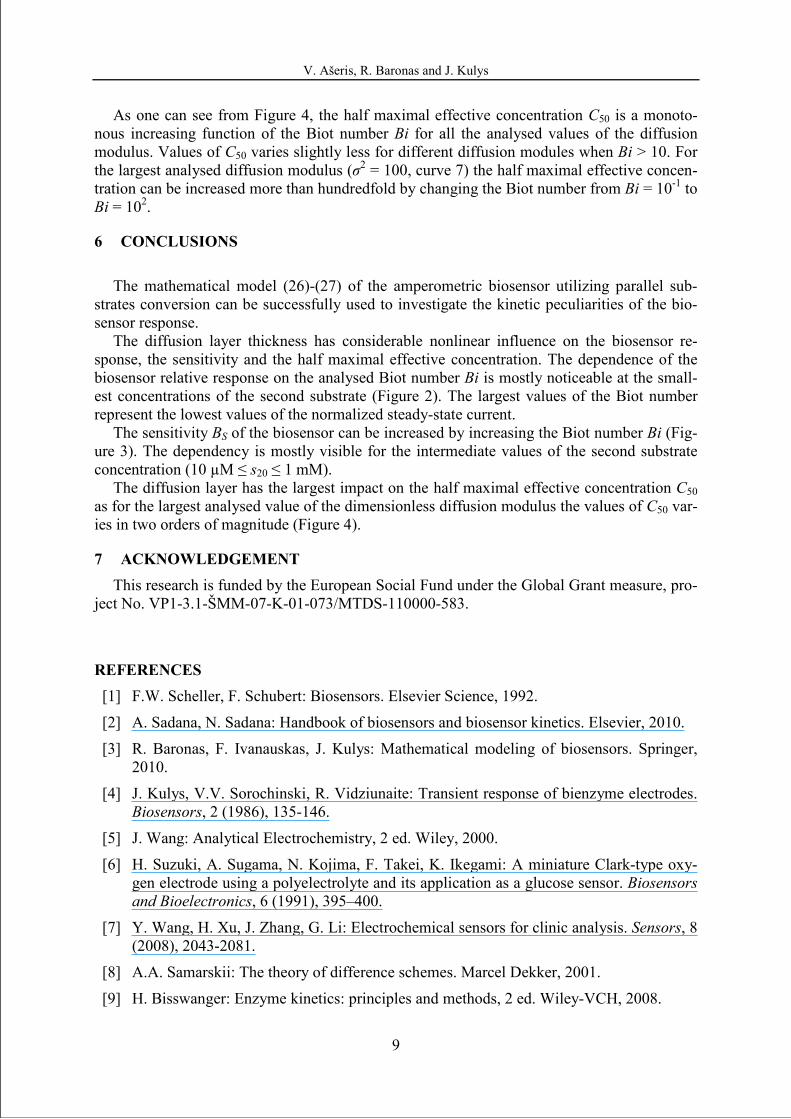
The half maximal effective concentration versus the Biot number Bi was calculated at the following seven values of the catalase concentration e1 in the enzyme membrane: 10, 30, 100, 300, 103, 3×10³ and 104 nM. By changing the values of the catalase concentration and keeping the other values of the model constant the diffusion modulus changes in four orders of magni-tude, σ2 ∈ [0.1; 100]. The Biot number Bi was varied by changing the thickness δ of the diffu-sion layer between 2µm and 2mm. The results are displayed in Figure 4.
Figure 4: The influence of the Biot number Bi on the half maximal effective concentration C50 at six different
values of the dimensionless diffusion modulus σ2: 0.1 (1), 0.3 (2), 1 (3), 3 (4), 10 (5), 30 (6) and 100 (7).
V. Ašeris, R. Baronas and J. Kulys
9
As one can see from Figure 4, the half maximal effective concentration C50 is a monoto-nous increasing function of the Biot number Bi for all the analysed values of the diffusion modulus. Values of C50 varies slightly less for different diffusion modules when Bi > 10. For the largest analysed diffusion modulus (σ2 = 100, curve 7) the half maximal effective concen-tration can be increased more than hundredfold by changing the Biot number from Bi = 10-1 to Bi = 102.
6 CONCLUSIONS
The mathematical model (26)-(27) of the amperometric biosensor utilizing parallel sub-
strates conversion can be successfully used to investigate the kinetic peculiarities of the bio-sensor response.
The diffusion layer thickness has considerable nonlinear influence on the biosensor re-sponse, the sensitivity and the half maximal effective concentration. The dependence of the biosensor relative response on the analysed Biot number Bi is mostly noticeable at the small-est concentrations of the second substrate (Figure 2). The largest values of the Biot number represent the lowest values of the normalized steady-state current.
The sensitivity BS of the biosensor can be increased by increasing the Biot number Bi (Fig-ure 3). The dependency is mostly visible for the intermediate values of the second substrate concentration (10 µM ≤ s20 ≤ 1 mM).
The diffusion layer has the largest impact on the half maximal effective concentration C50 as for the largest analysed value of the dimensionless diffusion modulus the values of C50 var-ies in two orders of magnitude (Figure 4).
7 ACKNOWLEDGEMENT
This research is funded by the European Social Fund under the Global Grant measure, pro-ject No. VP1-3.1-ŠMM-07-K-01-073/MTDS-110000-583.
REFERENCES
[1] F.W. Scheller, F. Schubert: Biosensors. Elsevier Science, 1992.
[2] A. Sadana, N. Sadana: Handbook of biosensors and biosensor kinetics. Elsevier, 2010.
[3] R. Baronas, F. Ivanauskas, J. Kulys: Mathematical modeling of biosensors. Springer, 2010.
[4] J. Kulys, V.V. Sorochinski, R. Vidziunaite: Transient response of bienzyme electrodes. Biosensors, 2 (1986), 135-146.
[5] J. Wang: Analytical Electrochemistry, 2 ed. Wiley, 2000.
[6] H. Suzuki, A. Sugama, N. Kojima, F. Takei, K. Ikegami: A miniature Clark-type oxy-gen electrode using a polyelectrolyte and its application as a glucose sensor. Biosensors
and Bioelectronics, 6 (1991), 395–400.
[7] Y. Wang, H. Xu, J. Zhang, G. Li: Electrochemical sensors for clinic analysis. Sensors, 8 (2008), 2043-2081.
[8] A.A. Samarskii: The theory of difference schemes. Marcel Dekker, 2001.
[9] H. Bisswanger: Enzyme kinetics: principles and methods, 2 ed. Wiley-VCH, 2008.
V. Ašeris, R. Baronas and J. Kulys
10
[10] D. Britz: Digital simulation in electrochemistry, 3 ed. Springer, 2005.
[11] V. Aseris, R. Baronas: Using grid computing to model biosensors acting in stirred and non-stirred solutions. Proceedings of the V European Conference on Computational
Fluid Dynamics ECCOMAS CFD 2010. Lisbon, Portugal, 2009.
[12] R. Baronas, F. Ivanauskas, J. Kulys: Computer simulation of the response of am-perometric biosensors in stirred and non stirred solution. Nonlinear Analysis: Modelling
and Control, 8, (2003), 3-18.
[13] R. Baronas, E. Gaidamauskaite, J. Kulys: Modelling a peroxidase-based optical biosen-sor. Sensors, 7, (2007), 2723-2740.
[14] R. Aris: The mathematical theory of diffusion and reaction in permeable catalysts. The theory of the steady state. Clarendon Press, 1975.
[15] W.H. Press, S.A. Teukolsky, W.T. Vetterling, B.P. Flannery: Numerical recipes: the Art of scientific computing, 3 ed. Cambridge University Press, 2007.
[16] T. Schulmeister: Mathematical modelling of the dynamic behaviour of amperometric enzyme electrodes. Selective Electrode Reviews, 12 (1990), 203–260.