Ecosystem regime change inferred from the distribution of trace metals in Lake Erie sediments
7
Ecosystem regime change inferred from the distribution of trace metals in Lake Erie sediments Fasong Yuan 1 , Richard Depew 2 & Cheryl Soltis-Muth 2 1 Department of Biological, Geological, and Environmental Sciences, Cleveland State University, 2121 Euclid Avenue, Cleveland, OH 44115, USA, 2 Northeast Ohio Regional Sewer District, 3900 Euclid Avenue, Cleveland, OH 44115, USA. Many freshwater and coastal marine ecosystems across the world may have undergone an ecosystem regime change due to a combination of rising anthropogenic disturbances and regional climate change. Such a change in aquatic ecosystems is commonly seen as shifts in algal species. But considerably less detail is known about the eutrophication history in terms of changes in algal productivity, particularly for a large lake with a great deal of spatial variability. Here we present an analysis of trace metals (Cu, Ni, Cd, and Pb) on a sediment core recovered from Lake Erie, off the Vermilion coast of northern Ohio, USA, to reconstruct the eutrophication history of the lake over the past 210 years. Following a slow eutrophication during European settlement, Lake Erie experienced a period of accelerated eutrophication, leading to an ecosystem regime transition into a eutrophic lake state in 1950. Our results suggested that the lake’s biological productivity has ever since maintained fairly high even though a significant input reduction was realized from rigorous nutrient abatements that began as early as in 1969. This work underscored the role of in-lake biogeochemical cycling in nutrient dynamics of this already eutrophic lake. S ince European settlement in the early 1800s, Lake Erie has suffered from a range of natural and anthro- pogenic perturbations such as overfishing, toxic metal pollution, synthetic organic contamination, nutrient enrichment, exotic species invasions, and regional climate change 1–4 . Eutrophication of the lake is among the most serious problems 5,6 , posing an imminent threat to safe drinking water supply and ecosystem sustain- ability. Over the last several decades, much of the research has been directed to improve our understanding of the major mechanisms that led to the trophic changes in the lake. Although progress has been made in identifying the physical, chemical, and biological linkages, there is much uncertainty about the nature and causes of recent ‘‘re- eutrophication’’ in Lake Erie 6–8 . The relative importance of the in-lake biogeochemical cycling (as altered by exotic species invasions and climate change) is not firmly established 8–10 . There is a lack of observational data that can track multiple variables simultaneously to more accurately delineate the ecosystem changes 5 that have occurred over the past two centuries. Existing phytoplankton biomass records from direct measurements of lake waters are rather sporadic (only available for limited project years at several sparsely-distributed locations) and fairly inconsistent 10–12 . As an alternative to these costly conventional monitoring programs, analysis of sediment cores can provide a convenient multiproxy archive for evaluating long-term ecosystem changes that have occurred in a watershed 13 . Past work on Lake Erie has showed that deposits from certain locations have been well preserved and suited to recording ancient climatic and environmental conditions 14–16 . A unimodal pattern of rise and fall in sediment Pb concentrations has been documented to reflect the historical introduction and phase-out of leaded gasoline 16–20 . Attempts to reconstruct the eutrophication history of Lake Erie have also been made through analysis of carbon isotopic ratio (d 13 C) of bulk organic and inorganic carbon in sediments 15,21 . These efforts revealed some important aspects on changes in metal pollution and lacustrine productivity in the lake. However, little is known about the nature and magnitude of the ecosystem changes in the lake. Here we report an analysis of trace metals (Cu, Ni, Cd, and Pb) in sediments from Lake Erie to document a detailed history of the ecosystem changes over the past two centuries. We hypothesized that changes in the trophic lake state can affect biological productivity and subsequently alter the distribution and bioavailability of trace metals. These individual trace elements may behave differently in response to changes in the lake’s trophic state and biological productivity. Thus, the distribution of trace metals in sediments can be used to reveal the trophic changes in a lake. Although the use of trace metals as paleoproductivity proxies has been well established for OPEN SUBJECT AREAS: GEOCHEMISTRY BIOGEOCHEMISTRY Received 8 September 2014 Accepted 11 November 2014 Published 1 December 2014 Correspondence and requests for materials should be addressed to F.Y. (f.yuan06@ csuohio.edu) SCIENTIFIC REPORTS | 4 : 7265 | DOI: 10.1038/srep07265 1
Transcript of Ecosystem regime change inferred from the distribution of trace metals in Lake Erie sediments
Ecosystem regime change inferred fromthe distribution of trace metals in Lake EriesedimentsFasong Yuan1, Richard Depew2 & Cheryl Soltis-Muth2
1Department of Biological, Geological, and Environmental Sciences, Cleveland State University, 2121 Euclid Avenue, Cleveland,OH 44115, USA, 2Northeast Ohio Regional Sewer District, 3900 Euclid Avenue, Cleveland, OH 44115, USA.
Many freshwater and coastal marine ecosystems across the world may have undergone an ecosystem regimechange due to a combination of rising anthropogenic disturbances and regional climate change. Such achange in aquatic ecosystems is commonly seen as shifts in algal species. But considerably less detail isknown about the eutrophication history in terms of changes in algal productivity, particularly for a large lakewith a great deal of spatial variability. Here we present an analysis of trace metals (Cu, Ni, Cd, and Pb) on asediment core recovered from Lake Erie, off the Vermilion coast of northern Ohio, USA, to reconstruct theeutrophication history of the lake over the past 210 years. Following a slow eutrophication during Europeansettlement, Lake Erie experienced a period of accelerated eutrophication, leading to an ecosystem regimetransition into a eutrophic lake state in 1950. Our results suggested that the lake’s biological productivity hasever since maintained fairly high even though a significant input reduction was realized from rigorousnutrient abatements that began as early as in 1969. This work underscored the role of in-lake biogeochemicalcycling in nutrient dynamics of this already eutrophic lake.
Since European settlement in the early 1800s, Lake Erie has suffered from a range of natural and anthro-pogenic perturbations such as overfishing, toxic metal pollution, synthetic organic contamination, nutrientenrichment, exotic species invasions, and regional climate change1–4. Eutrophication of the lake is among
the most serious problems5,6, posing an imminent threat to safe drinking water supply and ecosystem sustain-ability. Over the last several decades, much of the research has been directed to improve our understanding of themajor mechanisms that led to the trophic changes in the lake. Although progress has been made in identifying thephysical, chemical, and biological linkages, there is much uncertainty about the nature and causes of recent ‘‘re-eutrophication’’ in Lake Erie6–8. The relative importance of the in-lake biogeochemical cycling (as altered by exoticspecies invasions and climate change) is not firmly established8–10. There is a lack of observational data that cantrack multiple variables simultaneously to more accurately delineate the ecosystem changes5 that have occurredover the past two centuries. Existing phytoplankton biomass records from direct measurements of lake waters arerather sporadic (only available for limited project years at several sparsely-distributed locations) and fairlyinconsistent10–12.
As an alternative to these costly conventional monitoring programs, analysis of sediment cores can provide aconvenient multiproxy archive for evaluating long-term ecosystem changes that have occurred in a watershed13.Past work on Lake Erie has showed that deposits from certain locations have been well preserved and suited torecording ancient climatic and environmental conditions14–16. A unimodal pattern of rise and fall in sediment Pbconcentrations has been documented to reflect the historical introduction and phase-out of leaded gasoline16–20.Attempts to reconstruct the eutrophication history of Lake Erie have also been made through analysis of carbonisotopic ratio (d13C) of bulk organic and inorganic carbon in sediments15,21. These efforts revealed some importantaspects on changes in metal pollution and lacustrine productivity in the lake. However, little is known about thenature and magnitude of the ecosystem changes in the lake.
Here we report an analysis of trace metals (Cu, Ni, Cd, and Pb) in sediments from Lake Erie to document adetailed history of the ecosystem changes over the past two centuries. We hypothesized that changes in the trophiclake state can affect biological productivity and subsequently alter the distribution and bioavailability of tracemetals. These individual trace elements may behave differently in response to changes in the lake’s trophic stateand biological productivity. Thus, the distribution of trace metals in sediments can be used to reveal the trophicchanges in a lake. Although the use of trace metals as paleoproductivity proxies has been well established for
OPEN
SUBJECT AREAS:GEOCHEMISTRY
BIOGEOCHEMISTRY
Received8 September 2014
Accepted11 November 2014
Published1 December 2014
Correspondence andrequests for materials
should be addressed toF.Y. (f.yuan06@
csuohio.edu)
SCIENTIFIC REPORTS | 4 : 7265 | DOI: 10.1038/srep07265 1
marine ecosystems22,23, their applicability and usefulness for recon-structing lacustrine paleoproductivity has not been explored suffi-ciently24. This is particularly the case for Lake Erie though multipleefforts were made to investigate the evolving history of anthro-pogenic metal inputs16,17,19,20.
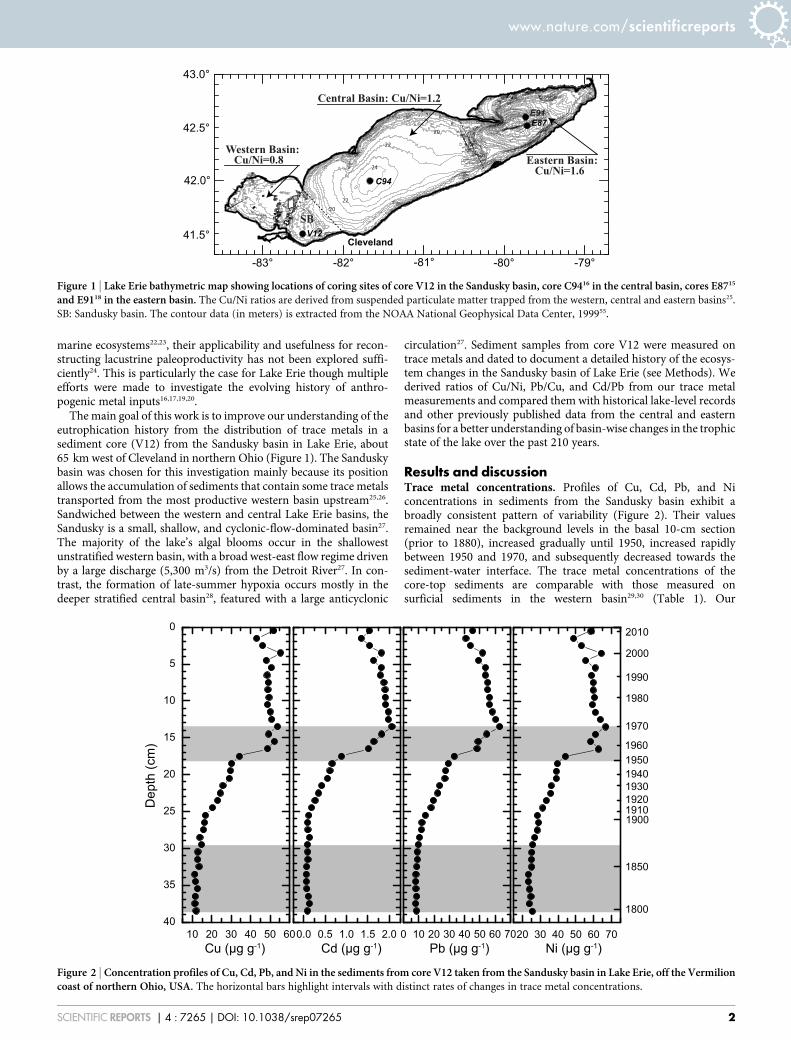
The main goal of this work is to improve our understanding of theeutrophication history from the distribution of trace metals in asediment core (V12) from the Sandusky basin in Lake Erie, about65 km west of Cleveland in northern Ohio (Figure 1). The Sanduskybasin was chosen for this investigation mainly because its positionallows the accumulation of sediments that contain some trace metalstransported from the most productive western basin upstream25,26.Sandwiched between the western and central Lake Erie basins, theSandusky is a small, shallow, and cyclonic-flow-dominated basin27.The majority of the lake’s algal blooms occur in the shallowestunstratified western basin, with a broad west-east flow regime drivenby a large discharge (5,300 m3/s) from the Detroit River27. In con-trast, the formation of late-summer hypoxia occurs mostly in thedeeper stratified central basin28, featured with a large anticyclonic
circulation27. Sediment samples from core V12 were measured ontrace metals and dated to document a detailed history of the ecosys-tem changes in the Sandusky basin of Lake Erie (see Methods). Wederived ratios of Cu/Ni, Pb/Cu, and Cd/Pb from our trace metalmeasurements and compared them with historical lake-level recordsand other previously published data from the central and easternbasins for a better understanding of basin-wise changes in the trophicstate of the lake over the past 210 years.
Results and discussionTrace metal concentrations. Profiles of Cu, Cd, Pb, and Niconcentrations in sediments from the Sandusky basin exhibit abroadly consistent pattern of variability (Figure 2). Their valuesremained near the background levels in the basal 10-cm section(prior to 1880), increased gradually until 1950, increased rapidlybetween 1950 and 1970, and subsequently decreased towards thesediment-water interface. The trace metal concentrations of thecore-top sediments are comparable with those measured onsurficial sediments in the western basin29,30 (Table 1). Our
42.0°
43.0°
42.5°
41.5°Cleveland
-83° -82° -81° -80° -79°
C94
Western Basin: Cu/Ni=0.8
Central Basin: Cu/Ni=1.2
Eastern Basin: Cu/Ni=1.6
SB
E91E87
V12
24
22
20
2022
Figure 1 | Lake Erie bathymetric map showing locations of coring sites of core V12 in the Sandusky basin, core C9416 in the central basin, cores E8715
and E9118 in the eastern basin. The Cu/Ni ratios are derived from suspended particulate matter trapped from the western, central and eastern basins25.
SB: Sandusky basin. The contour data (in meters) is extracted from the NOAA National Geophysical Data Center, 199955.
40
35
30
25
20
15
10
5
0
10 20 30 40 50 600.0 0.5 1.0 1.5 2.0 0 10 20 30 40 50 60 70
Dep
th (c
m)
20 30 40 50 60 70Pb (μg g-1) Ni (μg g-1)Cd (μg g-1)Cu (μg g-1)
2000
2010
1990
1980
1970
1960195019401930192019101900
1800
1850
Figure 2 | Concentration profiles of Cu, Cd, Pb, and Ni in the sediments from core V12 taken from the Sandusky basin in Lake Erie, off the Vermilioncoast of northern Ohio, USA. The horizontal bars highlight intervals with distinct rates of changes in trace metal concentrations.
www.nature.com/scientificreports
SCIENTIFIC REPORTS | 4 : 7265 | DOI: 10.1038/srep07265 2
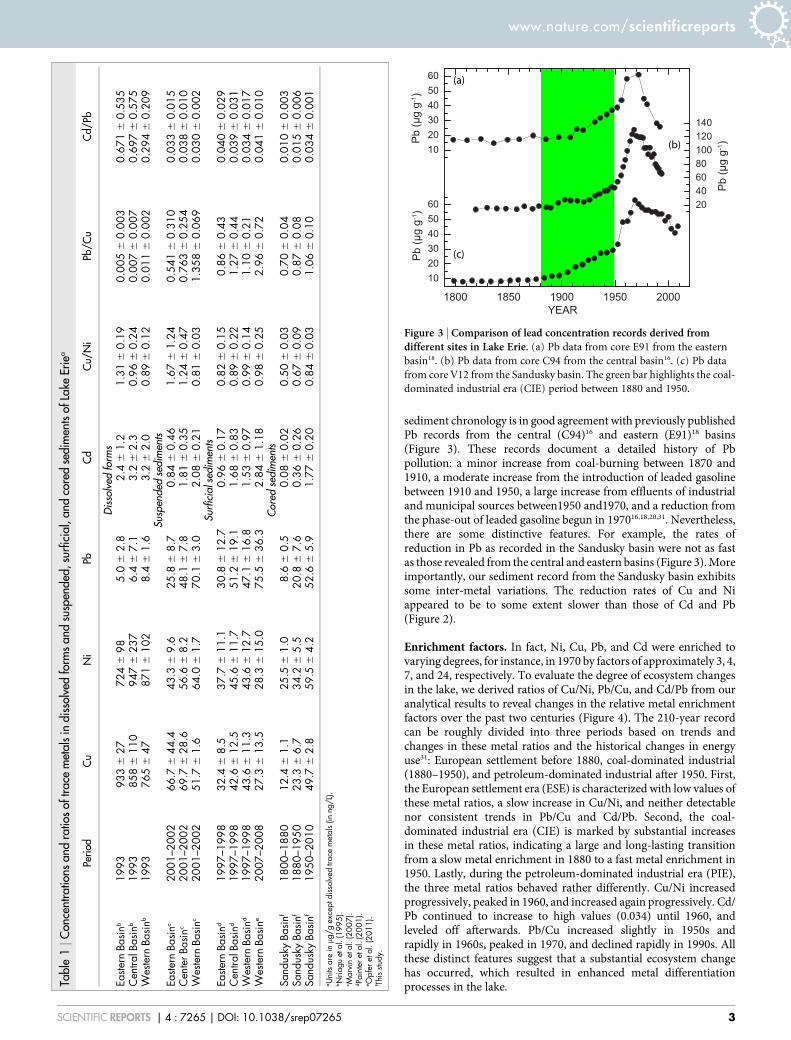
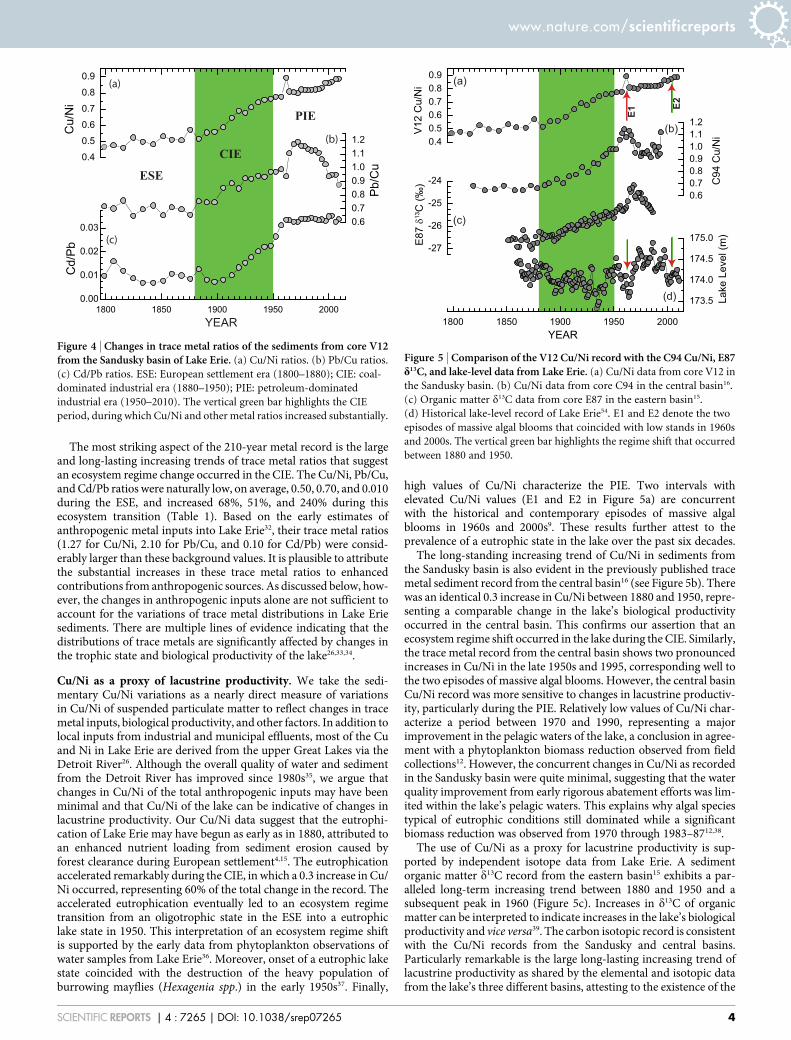
sediment chronology is in good agreement with previously publishedPb records from the central (C94)16 and eastern (E91)18 basins(Figure 3). These records document a detailed history of Pbpollution: a minor increase from coal-burning between 1870 and1910, a moderate increase from the introduction of leaded gasolinebetween 1910 and 1950, a large increase from effluents of industrialand municipal sources between1950 and1970, and a reduction fromthe phase-out of leaded gasoline begun in 197016,18,20,31. Nevertheless,there are some distinctive features. For example, the rates ofreduction in Pb as recorded in the Sandusky basin were not as fastas those revealed from the central and eastern basins (Figure 3). Moreimportantly, our sediment record from the Sandusky basin exhibitssome inter-metal variations. The reduction rates of Cu and Niappeared to be to some extent slower than those of Cd and Pb(Figure 2).
Enrichment factors. In fact, Ni, Cu, Pb, and Cd were enriched tovarying degrees, for instance, in 1970 by factors of approximately 3, 4,7, and 24, respectively. To evaluate the degree of ecosystem changesin the lake, we derived ratios of Cu/Ni, Pb/Cu, and Cd/Pb from ouranalytical results to reveal changes in the relative metal enrichmentfactors over the past two centuries (Figure 4). The 210-year recordcan be roughly divided into three periods based on trends andchanges in these metal ratios and the historical changes in energyuse31: European settlement before 1880, coal-dominated industrial(1880–1950), and petroleum-dominated industrial after 1950. First,the European settlement era (ESE) is characterized with low values ofthese metal ratios, a slow increase in Cu/Ni, and neither detectablenor consistent trends in Pb/Cu and Cd/Pb. Second, the coal-dominated industrial era (CIE) is marked by substantial increasesin these metal ratios, indicating a large and long-lasting transitionfrom a slow metal enrichment in 1880 to a fast metal enrichment in1950. Lastly, during the petroleum-dominated industrial era (PIE),the three metal ratios behaved rather differently. Cu/Ni increasedprogressively, peaked in 1960, and increased again progressively. Cd/Pb continued to increase to high values (0.034) until 1960, andleveled off afterwards. Pb/Cu increased slightly in 1950s andrapidly in 1960s, peaked in 1970, and declined rapidly in 1990s. Allthese distinct features suggest that a substantial ecosystem changehas occurred, which resulted in enhanced metal differentiationprocesses in the lake.Ta
ble
1|C
once
ntra
tions
and
ratio
sof
trac
em
etal
sin
diss
olve
dfo
rms
and
susp
ende
d,su
rfic
ial,
and
core
dse
dim
ents
ofLa
keEr
iea
Peri
odC
uN
iPb
Cd
Cu/
Ni
Pb/C
uC
d/Pb
Dis
solv
edfo
rms
Easte
rnBa
sinb
1993
933
627
724
698
5.0
62.
82.
46
1.2
1.31
60.
190.
005
60.
003
0.67
16
0.53
5C
entra
lBas
inb
1993
858
611
094
76
237
6.4
67.
13.
26
2.3
0.96
60.
240.
007
60.
007
0.69
76
0.57
5W
este
rnBa
sinb
1993
765
647
871
610
28.
46
1.6
3.2
62.
00.
896
0.12
0.01
16
0.00
20.
294
60.
209
Susp
ende
dse
dim
ents
Easte
rnBa
sinc
2001
–200
266
.76
44.4
43.3
69.
625
.86
8.7
0.84
60.
461.
676
1.24
0.54
16
0.31
00.
033
60.
015
Cen
terB
asin
c20
01–2
002
69.7
628
.656
.66
8.2
48.1
67.
81.
816
0.35
1.24
60.
470.
763
60.
254
0.03
86
0.01
0W
este
rnBa
sinc
2001
–200
251
.76
1.6
64.0
61.
770
.16
3.0
2.08
60.
210.
816
0.03
1.35
86
0.06
90.
030
60.
002
Surf
icia
lsed
imen
tsEa
stern
Basi
nd19
97–1
998
32.4
68.
537
.76
11.1
30.8
612
.70.
966
0.17
0.82
60.
150.
866
0.43
0.04
06
0.02
9C
entra
lBas
ind
1997
–199
842
.66
12.5
45.6
611
.751
.26
19.1
1.68
60.
830.
896
0.22
1.27
60.
440.
039
60.
031
Wes
tern
Basi
nd19
97–1
998
43.6
611
.343
.66
12.7
47.1
616
.81.
536
0.97
0.99
60.
141.
106
0.21
0.03
46
0.01
7W
este
rnBa
sine
2007
–200
827
.36
13.5
28.3
615
.075
.56
36.3
2.84
61.
180.
986
0.25
2.96
60.
720.
041
60.
010
Cor
edse
dim
ents
Sand
usky
Basi
nf18
00–1
880
12.4
61.
125
.56
1.0
8.6
60.
50.
086
0.02
0.50
60.
030.
706
0.04
0.01
06
0.00
3Sa
ndus
kyBa
sinf
1880
–195
023
.36
6.7
34.2
65.
520
.86
7.6
0.36
60.
260.
676
0.09
0.87
60.
080.
015
60.
006
Sand
usky
Basi
nf19
50–2
010
49.7
62.
859
.56
4.2
52.6
65.
91.
776
0.20
0.84
60.
031.
066
0.10
0.03
46
0.00
1a U
nits
are
inmg/
gex
cept
diss
olve
dtra
cem
etal
s(in
ng/L
).b N
riagu
etal
.(19
95).
c Mar
vin
etal
.(20
07).
d Pai
nter
etal
.(20
01).
e Opf
eret
al.(
2011
).f Th
isstu
dy.
102030405060
20406080100120140
1800 1850 1900 1950 2000
102030405060
YEAR
Pb
(μg
g-1)
Pb
(μg
g-1)
Pb
(μg
g-1)
(a)
(b)
(c)
Figure 3 | Comparison of lead concentration records derived fromdifferent sites in Lake Erie. (a) Pb data from core E91 from the eastern
basin18. (b) Pb data from core C94 from the central basin16. (c) Pb data
from core V12 from the Sandusky basin. The green bar highlights the coal-
dominated industrial era (CIE) period between 1880 and 1950.
www.nature.com/scientificreports
SCIENTIFIC REPORTS | 4 : 7265 | DOI: 10.1038/srep07265 3
The most striking aspect of the 210-year metal record is the largeand long-lasting increasing trends of trace metal ratios that suggestan ecosystem regime change occurred in the CIE. The Cu/Ni, Pb/Cu,and Cd/Pb ratios were naturally low, on average, 0.50, 0.70, and 0.010during the ESE, and increased 68%, 51%, and 240% during thisecosystem transition (Table 1). Based on the early estimates ofanthropogenic metal inputs into Lake Erie32, their trace metal ratios(1.27 for Cu/Ni, 2.10 for Pb/Cu, and 0.10 for Cd/Pb) were consid-erably larger than these background values. It is plausible to attributethe substantial increases in these trace metal ratios to enhancedcontributions from anthropogenic sources. As discussed below, how-ever, the changes in anthropogenic inputs alone are not sufficient toaccount for the variations of trace metal distributions in Lake Eriesediments. There are multiple lines of evidence indicating that thedistributions of trace metals are significantly affected by changes inthe trophic state and biological productivity of the lake26,33,34.
Cu/Ni as a proxy of lacustrine productivity. We take the sedi-mentary Cu/Ni variations as a nearly direct measure of variationsin Cu/Ni of suspended particulate matter to reflect changes in tracemetal inputs, biological productivity, and other factors. In addition tolocal inputs from industrial and municipal effluents, most of the Cuand Ni in Lake Erie are derived from the upper Great Lakes via theDetroit River26. Although the overall quality of water and sedimentfrom the Detroit River has improved since 1980s35, we argue thatchanges in Cu/Ni of the total anthropogenic inputs may have beenminimal and that Cu/Ni of the lake can be indicative of changes inlacustrine productivity. Our Cu/Ni data suggest that the eutrophi-cation of Lake Erie may have begun as early as in 1880, attributed toan enhanced nutrient loading from sediment erosion caused byforest clearance during European settlement4,15. The eutrophicationaccelerated remarkably during the CIE, in which a 0.3 increase in Cu/Ni occurred, representing 60% of the total change in the record. Theaccelerated eutrophication eventually led to an ecosystem regimetransition from an oligotrophic state in the ESE into a eutrophiclake state in 1950. This interpretation of an ecosystem regime shiftis supported by the early data from phytoplankton observations ofwater samples from Lake Erie36. Moreover, onset of a eutrophic lakestate coincided with the destruction of the heavy population ofburrowing mayflies (Hexagenia spp.) in the early 1950s37. Finally,
high values of Cu/Ni characterize the PIE. Two intervals withelevated Cu/Ni values (E1 and E2 in Figure 5a) are concurrentwith the historical and contemporary episodes of massive algalblooms in 1960s and 2000s9. These results further attest to theprevalence of a eutrophic state in the lake over the past six decades.
The long-standing increasing trend of Cu/Ni in sediments fromthe Sandusky basin is also evident in the previously published tracemetal sediment record from the central basin16 (see Figure 5b). Therewas an identical 0.3 increase in Cu/Ni between 1880 and 1950, repre-senting a comparable change in the lake’s biological productivityoccurred in the central basin. This confirms our assertion that anecosystem regime shift occurred in the lake during the CIE. Similarly,the trace metal record from the central basin shows two pronouncedincreases in Cu/Ni in the late 1950s and 1995, corresponding well tothe two episodes of massive algal blooms. However, the central basinCu/Ni record was more sensitive to changes in lacustrine productiv-ity, particularly during the PIE. Relatively low values of Cu/Ni char-acterize a period between 1970 and 1990, representing a majorimprovement in the pelagic waters of the lake, a conclusion in agree-ment with a phytoplankton biomass reduction observed from fieldcollections12. However, the concurrent changes in Cu/Ni as recordedin the Sandusky basin were quite minimal, suggesting that the waterquality improvement from early rigorous abatement efforts was lim-ited within the lake’s pelagic waters. This explains why algal speciestypical of eutrophic conditions still dominated while a significantbiomass reduction was observed from 1970 through 1983–8712,38.
The use of Cu/Ni as a proxy for lacustrine productivity is sup-ported by independent isotope data from Lake Erie. A sedimentorganic matter d13C record from the eastern basin15 exhibits a par-alleled long-term increasing trend between 1880 and 1950 and asubsequent peak in 1960 (Figure 5c). Increases in d13C of organicmatter can be interpreted to indicate increases in the lake’s biologicalproductivity and vice versa39. The carbon isotopic record is consistentwith the Cu/Ni records from the Sandusky and central basins.Particularly remarkable is the large long-lasting increasing trend oflacustrine productivity as shared by the elemental and isotopic datafrom the lake’s three different basins, attesting to the existence of the
0.60.70.80.91.01.11.2
0.4
0.5
0.6
0.7
0.8
0.9C
u/N
i
Pb/
Cu
1800 1850 1900 1950 20000.00
0.01
0.02
0.03
Cd/
Pb
YEAR
(a)
(b)
(c)
PIE
CIE
ESE
Figure 4 | Changes in trace metal ratios of the sediments from core V12from the Sandusky basin of Lake Erie. (a) Cu/Ni ratios. (b) Pb/Cu ratios.
(c) Cd/Pb ratios. ESE: European settlement era (1800–1880); CIE: coal-
dominated industrial era (1880–1950); PIE: petroleum-dominated
industrial era (1950–2010). The vertical green bar highlights the CIE
period, during which Cu/Ni and other metal ratios increased substantially.
-27
-26
-25
-24
0.40.50.60.70.80.9
V12
Cu/
Ni
E87
δ13
C (‰
)
1.2
0.60.70.80.91.01.1
C94
Cu/
Ni
175.0
1800 1850 1900 1950 2000
173.5
174.0
174.5
YEAR
Lake
Lev
el (m
)
(a)
(b)
(c)
(d)
E1
E2
Figure 5 | Comparison of the V12 Cu/Ni record with the C94 Cu/Ni, E87d13C, and lake-level data from Lake Erie. (a) Cu/Ni data from core V12 in
the Sandusky basin. (b) Cu/Ni data from core C94 in the central basin16.
(c) Organic matter d13C data from core E87 in the eastern basin15.
(d) Historical lake-level record of Lake Erie54. E1 and E2 denote the two
episodes of massive algal blooms that coincided with low stands in 1960s
and 2000s. The vertical green bar highlights the regime shift that occurred
between 1880 and 1950.
www.nature.com/scientificreports
SCIENTIFIC REPORTS | 4 : 7265 | DOI: 10.1038/srep07265 4
ecosystem regime shift caused plausibly by enhanced nutrient load-ing into Lake Erie15. Within the age uncertainty, the subsequent peakin d13C essentially coincided with the historical episode of massivealgal blooms in 1960s.
Lake-level fluctuations and biogeochemical cycling. Comparisonof these proxy data with the lake’s instrumental lake-level recordback to 1860 allows us to reveal some important aspects ofcorresponding changes in the lake’s biological productivity andhydrological conditions (Figure 5d). For instance, the large long-standing increasing trend of lacustrine productivity was virtuallymirrored by a concurrent long-term lake-level lowering trendduring the CIE. The two episodes of massive algal blooms (E1 andE2), as highlighted in Figure 5d, coincided with low stands in 1960sand 2000s. These correspondences underscore the influence ofclimatic and hydrological changes on the nutrient dynamics,biological productivity, and distributions of trace metals in thelake. Low stands may facilitate sediment mobilization andresuspension in the shallow western basin, increase the internalbiogeochemical cycling, and sustain an enhanced loading ofphosphorus and other trace elements in Lake Erie. On the otherhand, high stands may subdue lake sediment resuspension andreduce nutrient enrichment by dilution.
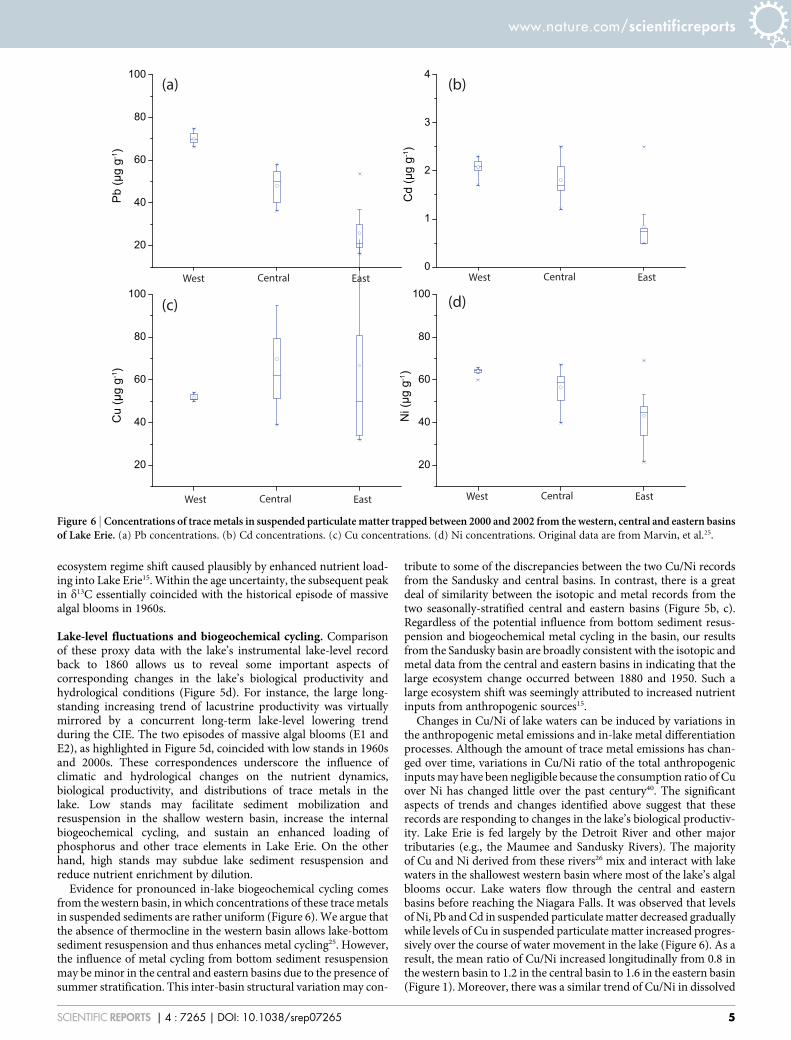
Evidence for pronounced in-lake biogeochemical cycling comesfrom the western basin, in which concentrations of these trace metalsin suspended sediments are rather uniform (Figure 6). We argue thatthe absence of thermocline in the western basin allows lake-bottomsediment resuspension and thus enhances metal cycling25. However,the influence of metal cycling from bottom sediment resuspensionmay be minor in the central and eastern basins due to the presence ofsummer stratification. This inter-basin structural variation may con-
tribute to some of the discrepancies between the two Cu/Ni recordsfrom the Sandusky and central basins. In contrast, there is a greatdeal of similarity between the isotopic and metal records from thetwo seasonally-stratified central and eastern basins (Figure 5b, c).Regardless of the potential influence from bottom sediment resus-pension and biogeochemical metal cycling in the basin, our resultsfrom the Sandusky basin are broadly consistent with the isotopic andmetal data from the central and eastern basins in indicating that thelarge ecosystem change occurred between 1880 and 1950. Such alarge ecosystem shift was seemingly attributed to increased nutrientinputs from anthropogenic sources15.
Changes in Cu/Ni of lake waters can be induced by variations inthe anthropogenic metal emissions and in-lake metal differentiationprocesses. Although the amount of trace metal emissions has chan-ged over time, variations in Cu/Ni ratio of the total anthropogenicinputs may have been negligible because the consumption ratio of Cuover Ni has changed little over the past century40. The significantaspects of trends and changes identified above suggest that theserecords are responding to changes in the lake’s biological productiv-ity. Lake Erie is fed largely by the Detroit River and other majortributaries (e.g., the Maumee and Sandusky Rivers). The majorityof Cu and Ni derived from these rivers26 mix and interact with lakewaters in the shallowest western basin where most of the lake’s algalblooms occur. Lake waters flow through the central and easternbasins before reaching the Niagara Falls. It was observed that levelsof Ni, Pb and Cd in suspended particulate matter decreased graduallywhile levels of Cu in suspended particulate matter increased progres-sively over the course of water movement in the lake (Figure 6). As aresult, the mean ratio of Cu/Ni increased longitudinally from 0.8 inthe western basin to 1.2 in the central basin to 1.6 in the eastern basin(Figure 1). Moreover, there was a similar trend of Cu/Ni in dissolved
20
40
60
80
100
0
1
2
3
4
20
40
60
80
100
20
40
60
80
100
Cd
(μg
g-1)
West Central East West Central East
West Central East West Central East
Pb
(μg
g-1)
Cu
(μg
g-1)
Ni (
μg g
-1)
(a) (b)
(c) (d)
Figure 6 | Concentrations of trace metals in suspended particulate matter trapped between 2000 and 2002 from the western, central and eastern basinsof Lake Erie. (a) Pb concentrations. (b) Cd concentrations. (c) Cu concentrations. (d) Ni concentrations. Original data are from Marvin, et al.25.
www.nature.com/scientificreports
SCIENTIFIC REPORTS | 4 : 7265 | DOI: 10.1038/srep07265 5
forms (Table 1), as observed in 1993 by Nriagu, et al.26. We attributethis longitudinal change in Cu/Ni to in-lake metal differentiationcaused by a cumulative effect of the preferential phytoplanktonuptake of Ni versa Cu. The two trace metals are to varying degreesorganically complexed41. Changes in Cu/Ni in Lake Erie are mostprobably attributed to a stronger organic complexation of Cu which,in turn, limits its bioavailability and uptake by phytoplankton42,43.
Pb/Cu and Cd/Pb. The Pb/Cu record appears to track well thechanges in anthropogenic inputs, in particular, the Pb reductioninduced by restricted use of leaded gasoline since its peak usage in197244. In fact, the rates of reduction in Pb/Cu in the lake weresomewhat exaggerated due to their differentiation mechanisms.Most of the Cd and Pb are delivered via the atmosphere fromvarious anthropogenic sources such as fossil fuel burning and non-ferrous metal extractions26,45. In contrast, most of the Cu and Ni aredelivered via the Detroit River and other major rivers from municipaland industrial effluents26. Because of a strong complexation withorganic ligands, there are relatively high levels of dissolved Cu andNi in Lake Erie (Table 1). The calculated residence times for Cu andNi are about 15 years, much longer than those for Cd (0.23 years) andPb (0.02 years)26. This accounts for the slower reduction of Cu and Niin the Sandusky basin.
The most intriguing feature in our sediment record is that values ofCd/Pb have remained nearly constant (0.034) since 1960 (Figure 4c),close to those of Cd/Pb in suspended and surficial sediments acrossthe three basins (Table 1). More importantly, the Cd/Pb transitionfrom a rising mode to a constant mode was fairly unusual as itcoincided with the first episode (E1) of massive algal blooms in thelake. This strongly suggests that a large shift in the lake’s trophic stateand biological productivity has triggered a significant change in thedistribution of these trace metals. We argue that certain biologically-produced organic ligands from this eutrophic lake46 may have facili-tated the binding of dissolved Cd and thus reduce the activity of freeCd21. Most of the Cd in natural waters is in complex forms47. It hasbeen showed that the ratio of free Cd21 over the total dissolved Cdtypically ranged from 1–3% in eutrophic lakes to 5–9% in rivers45,47,48.Additionally, observational data from Lake Erie show that the ratio ofdissolved Cd/Pb was at least one order greater than that of suspendedand surficial sediments (Table 1). These results further support ourassertion that a large change in the trophic state and biological pro-
ductivity has significantly enhanced the biogeochemical differenti-ation processes in the lake over the last half century.
Our results provided some novel perspectives on the ecosystemchanges in terms of the lake’s biological productivity over the pasttwo centuries. We found multiple lines of evidence that Lake Erieexperienced a marked long-term ecosystem transition between 1880and 1950, due largely to an increased nutrient loading from anthro-pogenic sources. Lake Erie transitioned from an oligotrophic stateprior to 1880 to a eutrophic lake state after 1950. The lake’s biologicalproductivity has ever since remained fairly high, despite the fact thatrigorous nutrient abatement programs began as early as in 1969 andthat a target reduction of tributary loading was reached in 198349–51.Our results also showed that the anthropogenically-induced eutro-phication history of Lake Erie was compounded by regional climatechange. Additionally, this work underscored the role of in-lake bio-geochemical cycling in sustaining the loadings of dissolved traceelements in the lake. Further efforts to quantify the contributionsto the trace metal and other nutrient loadings by the in-lake biogeo-chemical cycling are essential for better management practices in thisalready eutrophic lake.
MethodsSediment coring and subsampling. Core V12 (41.500uN, 82.467uW; in 13 m waterdepth) was recovered from the Sandusky basin with an HTH sediment gravity corer,transported onshore immediately, extruded vertically, and subsampled at every 1 cminterval. A total of 39 sediment samples were oven dried at 60uC and homogenizedwith a mortar and pestle.
Sample digestion. A microwave-assisted acid digestion procedure adapted from theUS EPA method 3015A was used for sample preparation. Approximately 0.1 g ofdried sediments was loaded into Teflon vessels with 8 ml 16 M HNO3 and 2 ml 12 MHCl. The vessels were capped and placed into a microwave that was programed toheat samples to temperatures of 160uC 6 4uC in 15 minutes and maintain thetemperatures between 165–170uC for another 10 minutes. The digested samples wereair cooled back to room temperature, transferred to polypropylene sample tubes,diluted to 50 ml with reagent water, and then gravity filtered.
Elemental analysis. The filtered solutions were analyzed with a Thermo ScientificiCAP 6000 Series ICP optical emission spectrometer equipped with a CETAC ASX-520 autosampler. A total of 22 elements were measured simultaneously but only theresults of the four trace metals were studied and presented in this report. Spike-and-recovery experiments were conducted on selected samples, with the average recoveryrates ranging from 84 to 90%. The relative standard deviations of eight continuingcalibration verification (CCV) standards were 0.8% for Ni, 0.9% for Cd, 1.7% for Pb,and 4.0% for Cu.
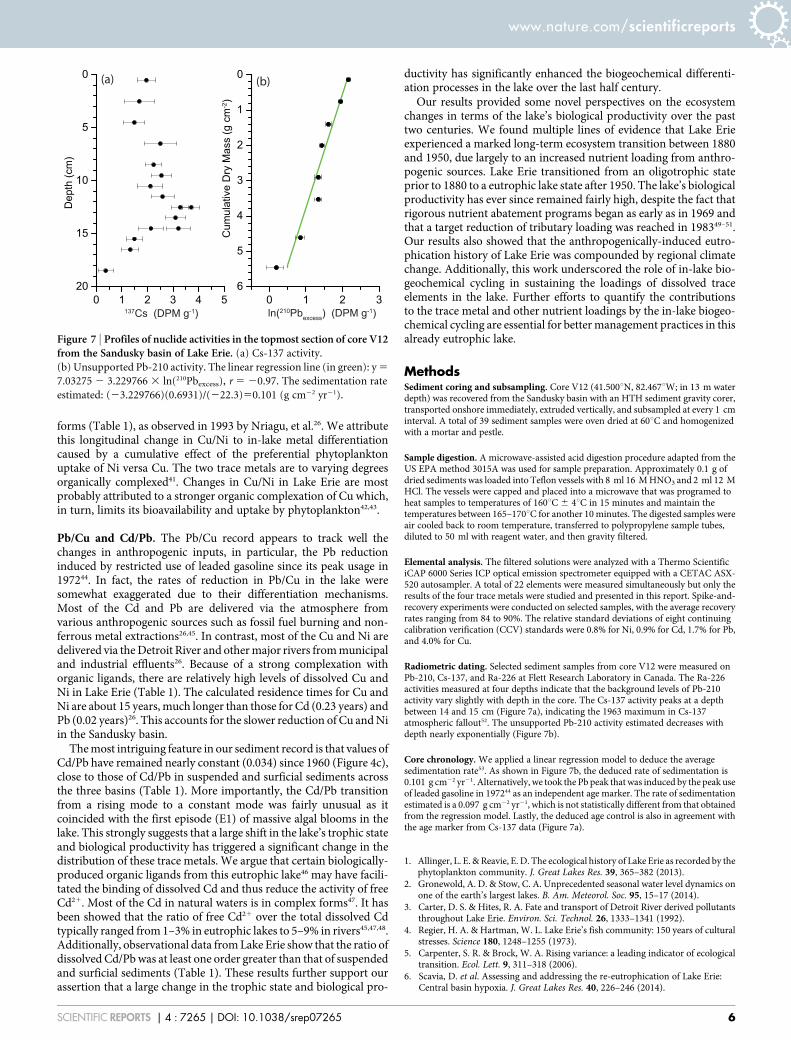
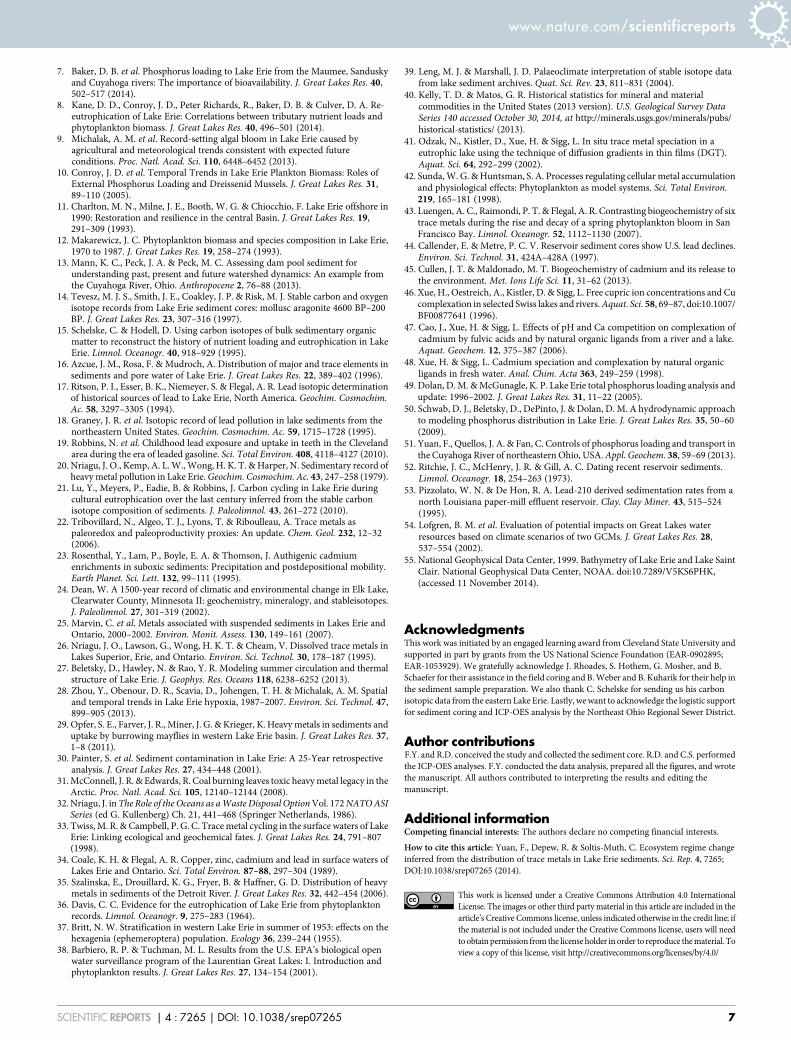
Radiometric dating. Selected sediment samples from core V12 were measured onPb-210, Cs-137, and Ra-226 at Flett Research Laboratory in Canada. The Ra-226activities measured at four depths indicate that the background levels of Pb-210activity vary slightly with depth in the core. The Cs-137 activity peaks at a depthbetween 14 and 15 cm (Figure 7a), indicating the 1963 maximum in Cs-137atmospheric fallout52. The unsupported Pb-210 activity estimated decreases withdepth nearly exponentially (Figure 7b).
Core chronology. We applied a linear regression model to deduce the averagesedimentation rate53. As shown in Figure 7b, the deduced rate of sedimentation is0.101 g cm22 yr21. Alternatively, we took the Pb peak that was induced by the peak useof leaded gasoline in 197244 as an independent age marker. The rate of sedimentationestimated is a 0.097 g cm22 yr21, which is not statistically different from that obtainedfrom the regression model. Lastly, the deduced age control is also in agreement withthe age marker from Cs-137 data (Figure 7a).
1. Allinger, L. E. & Reavie, E. D. The ecological history of Lake Erie as recorded by thephytoplankton community. J. Great Lakes Res. 39, 365–382 (2013).
2. Gronewold, A. D. & Stow, C. A. Unprecedented seasonal water level dynamics onone of the earth’s largest lakes. B. Am. Meteorol. Soc. 95, 15–17 (2014).
3. Carter, D. S. & Hites, R. A. Fate and transport of Detroit River derived pollutantsthroughout Lake Erie. Environ. Sci. Technol. 26, 1333–1341 (1992).
4. Regier, H. A. & Hartman, W. L. Lake Erie’s fish community: 150 years of culturalstresses. Science 180, 1248–1255 (1973).
5. Carpenter, S. R. & Brock, W. A. Rising variance: a leading indicator of ecologicaltransition. Ecol. Lett. 9, 311–318 (2006).
6. Scavia, D. et al. Assessing and addressing the re-eutrophication of Lake Erie:Central basin hypoxia. J. Great Lakes Res. 40, 226–246 (2014).
20
15
10
5
0
0 1 2 3 4 56
5
4
3
2
1
0
0 1 2 3
Dep
th (c
m)
Cum
ulat
ive
Dry
Mas
s (g
cm
-2)
137Cs (DPM g-1) ln(210Pbexcess) (DPM g-1)
(a) (b)
Figure 7 | Profiles of nuclide activities in the topmost section of core V12from the Sandusky basin of Lake Erie. (a) Cs-137 activity.
(b) Unsupported Pb-210 activity. The linear regression line (in green): y 5
7.03275 2 3.229766 3 ln(210Pbexcess), r 5 20.97. The sedimentation rate
estimated: (23.229766)(0.6931)/(222.3)50.101 (g cm22 yr21).
www.nature.com/scientificreports
SCIENTIFIC REPORTS | 4 : 7265 | DOI: 10.1038/srep07265 6
7. Baker, D. B. et al. Phosphorus loading to Lake Erie from the Maumee, Sanduskyand Cuyahoga rivers: The importance of bioavailability. J. Great Lakes Res. 40,502–517 (2014).
8. Kane, D. D., Conroy, J. D., Peter Richards, R., Baker, D. B. & Culver, D. A. Re-eutrophication of Lake Erie: Correlations between tributary nutrient loads andphytoplankton biomass. J. Great Lakes Res. 40, 496–501 (2014).
9. Michalak, A. M. et al. Record-setting algal bloom in Lake Erie caused byagricultural and meteorological trends consistent with expected futureconditions. Proc. Natl. Acad. Sci. 110, 6448–6452 (2013).
10. Conroy, J. D. et al. Temporal Trends in Lake Erie Plankton Biomass: Roles ofExternal Phosphorus Loading and Dreissenid Mussels. J. Great Lakes Res. 31,89–110 (2005).
11. Charlton, M. N., Milne, J. E., Booth, W. G. & Chiocchio, F. Lake Erie offshore in1990: Restoration and resilience in the central Basin. J. Great Lakes Res. 19,291–309 (1993).
12. Makarewicz, J. C. Phytoplankton biomass and species composition in Lake Erie,1970 to 1987. J. Great Lakes Res. 19, 258–274 (1993).
13. Mann, K. C., Peck, J. A. & Peck, M. C. Assessing dam pool sediment forunderstanding past, present and future watershed dynamics: An example fromthe Cuyahoga River, Ohio. Anthropocene 2, 76–88 (2013).
14. Tevesz, M. J. S., Smith, J. E., Coakley, J. P. & Risk, M. J. Stable carbon and oxygenisotope records from Lake Erie sediment cores: mollusc aragonite 4600 BP–200BP. J. Great Lakes Res. 23, 307–316 (1997).
15. Schelske, C. & Hodell, D. Using carbon isotopes of bulk sedimentary organicmatter to reconstruct the history of nutrient loading and eutrophication in LakeErie. Limnol. Oceanogr. 40, 918–929 (1995).
16. Azcue, J. M., Rosa, F. & Mudroch, A. Distribution of major and trace elements insediments and pore water of Lake Erie. J. Great Lakes Res. 22, 389–402 (1996).
17. Ritson, P. I., Esser, B. K., Niemeyer, S. & Flegal, A. R. Lead isotopic determinationof historical sources of lead to Lake Erie, North America. Geochim. Cosmochim.Ac. 58, 3297–3305 (1994).
18. Graney, J. R. et al. Isotopic record of lead pollution in lake sediments from thenortheastern United States. Geochim. Cosmochim. Ac. 59, 1715–1728 (1995).
19. Robbins, N. et al. Childhood lead exposure and uptake in teeth in the Clevelandarea during the era of leaded gasoline. Sci. Total Environ. 408, 4118–4127 (2010).
20. Nriagu, J. O., Kemp, A. L. W., Wong, H. K. T. & Harper, N. Sedimentary record ofheavy metal pollution in Lake Erie. Geochim. Cosmochim. Ac. 43, 247–258 (1979).
21. Lu, Y., Meyers, P., Eadie, B. & Robbins, J. Carbon cycling in Lake Erie duringcultural eutrophication over the last century inferred from the stable carbonisotope composition of sediments. J. Paleolimnol. 43, 261–272 (2010).
22. Tribovillard, N., Algeo, T. J., Lyons, T. & Riboulleau, A. Trace metals aspaleoredox and paleoproductivity proxies: An update. Chem. Geol. 232, 12–32(2006).
23. Rosenthal, Y., Lam, P., Boyle, E. A. & Thomson, J. Authigenic cadmiumenrichments in suboxic sediments: Precipitation and postdepositional mobility.Earth Planet. Sci. Lett. 132, 99–111 (1995).
24. Dean, W. A 1500-year record of climatic and environmental change in Elk Lake,Clearwater County, Minnesota II: geochemistry, mineralogy, and stableisotopes.J. Paleolimnol. 27, 301–319 (2002).
25. Marvin, C. et al. Metals associated with suspended sediments in Lakes Erie andOntario, 2000–2002. Environ. Monit. Assess. 130, 149–161 (2007).
26. Nriagu, J. O., Lawson, G., Wong, H. K. T. & Cheam, V. Dissolved trace metals inLakes Superior, Erie, and Ontario. Environ. Sci. Technol. 30, 178–187 (1995).
27. Beletsky, D., Hawley, N. & Rao, Y. R. Modeling summer circulation and thermalstructure of Lake Erie. J. Geophys. Res. Oceans 118, 6238–6252 (2013).
28. Zhou, Y., Obenour, D. R., Scavia, D., Johengen, T. H. & Michalak, A. M. Spatialand temporal trends in Lake Erie hypoxia, 1987–2007. Environ. Sci. Technol. 47,899–905 (2013).
29. Opfer, S. E., Farver, J. R., Miner, J. G. & Krieger, K. Heavy metals in sediments anduptake by burrowing mayflies in western Lake Erie basin. J. Great Lakes Res. 37,1–8 (2011).
30. Painter, S. et al. Sediment contamination in Lake Erie: A 25-Year retrospectiveanalysis. J. Great Lakes Res. 27, 434–448 (2001).
31. McConnell, J. R. & Edwards, R. Coal burning leaves toxic heavy metal legacy in theArctic. Proc. Natl. Acad. Sci. 105, 12140–12144 (2008).
32. Nriagu, J. in The Role of the Oceans as a Waste Disposal Option Vol. 172 NATO ASISeries (ed G. Kullenberg) Ch. 21, 441–468 (Springer Netherlands, 1986).
33. Twiss, M. R. & Campbell, P. G. C. Trace metal cycling in the surface waters of LakeErie: Linking ecological and geochemical fates. J. Great Lakes Res. 24, 791–807(1998).
34. Coale, K. H. & Flegal, A. R. Copper, zinc, cadmium and lead in surface waters ofLakes Erie and Ontario. Sci. Total Environ. 87–88, 297–304 (1989).
35. Szalinska, E., Drouillard, K. G., Fryer, B. & Haffner, G. D. Distribution of heavymetals in sediments of the Detroit River. J. Great Lakes Res. 32, 442–454 (2006).
36. Davis, C. C. Evidence for the eutrophication of Lake Erie from phytoplanktonrecords. Limnol. Oceanogr. 9, 275–283 (1964).
37. Britt, N. W. Stratification in western Lake Erie in summer of 1953: effects on thehexagenia (ephemeroptera) population. Ecology 36, 239–244 (1955).
38. Barbiero, R. P. & Tuchman, M. L. Results from the U.S. EPA’s biological openwater surveillance program of the Laurentian Great Lakes: I. Introduction andphytoplankton results. J. Great Lakes Res. 27, 134–154 (2001).
39. Leng, M. J. & Marshall, J. D. Palaeoclimate interpretation of stable isotope datafrom lake sediment archives. Quat. Sci. Rev. 23, 811–831 (2004).
40. Kelly, T. D. & Matos, G. R. Historical statistics for mineral and materialcommodities in the United States (2013 version). U.S. Geological Survey DataSeries 140 accessed October 30, 2014, at http://minerals.usgs.gov/minerals/pubs/historical-statistics/ (2013).
41. Odzak, N., Kistler, D., Xue, H. & Sigg, L. In situ trace metal speciation in aeutrophic lake using the technique of diffusion gradients in thin films (DGT).Aquat. Sci. 64, 292–299 (2002).
42. Sunda, W. G. & Huntsman, S. A. Processes regulating cellular metal accumulationand physiological effects: Phytoplankton as model systems. Sci. Total Environ.219, 165–181 (1998).
43. Luengen, A. C., Raimondi, P. T. & Flegal, A. R. Contrasting biogeochemistry of sixtrace metals during the rise and decay of a spring phytoplankton bloom in SanFrancisco Bay. Limnol. Oceanogr. 52, 1112–1130 (2007).
44. Callender, E. & Metre, P. C. V. Reservoir sediment cores show U.S. lead declines.Environ. Sci. Technol. 31, 424A–428A (1997).
45. Cullen, J. T. & Maldonado, M. T. Biogeochemistry of cadmium and its release tothe environment. Met. Ions Life Sci. 11, 31–62 (2013).
46. Xue, H., Oestreich, A., Kistler, D. & Sigg, L. Free cupric ion concentrations and Cucomplexation in selected Swiss lakes and rivers. Aquat. Sci. 58, 69–87, doi:10.1007/BF00877641 (1996).
47. Cao, J., Xue, H. & Sigg, L. Effects of pH and Ca competition on complexation ofcadmium by fulvic acids and by natural organic ligands from a river and a lake.Aquat. Geochem. 12, 375–387 (2006).
48. Xue, H. & Sigg, L. Cadmium speciation and complexation by natural organicligands in fresh water. Anal. Chim. Acta 363, 249–259 (1998).
49. Dolan, D. M. & McGunagle, K. P. Lake Erie total phosphorus loading analysis andupdate: 1996–2002. J. Great Lakes Res. 31, 11–22 (2005).
50. Schwab, D. J., Beletsky, D., DePinto, J. & Dolan, D. M. A hydrodynamic approachto modeling phosphorus distribution in Lake Erie. J. Great Lakes Res. 35, 50–60(2009).
51. Yuan, F., Quellos, J. A. & Fan, C. Controls of phosphorus loading and transport inthe Cuyahoga River of northeastern Ohio, USA. Appl. Geochem. 38, 59–69 (2013).
52. Ritchie, J. C., McHenry, J. R. & Gill, A. C. Dating recent reservoir sediments.Limnol. Oceanogr. 18, 254–263 (1973).
53. Pizzolato, W. N. & De Hon, R. A. Lead-210 derived sedimentation rates from anorth Louisiana paper-mill effluent reservoir. Clay. Clay Miner. 43, 515–524(1995).
54. Lofgren, B. M. et al. Evaluation of potential impacts on Great Lakes waterresources based on climate scenarios of two GCMs. J. Great Lakes Res. 28,537–554 (2002).
55. National Geophysical Data Center, 1999. Bathymetry of Lake Erie and Lake SaintClair. National Geophysical Data Center, NOAA. doi:10.7289/V5KS6PHK,(accessed 11 November 2014).
AcknowledgmentsThis work was initiated by an engaged learning award from Cleveland State University andsupported in part by grants from the US National Science Foundation (EAR-0902895;EAR-1053929). We gratefully acknowledge J. Rhoades, S. Hothem, G. Mosher, and B.Schaefer for their assistance in the field coring and B. Weber and B. Kuharik for their help inthe sediment sample preparation. We also thank C. Schelske for sending us his carbonisotopic data from the eastern Lake Erie. Lastly, we want to acknowledge the logistic supportfor sediment coring and ICP-OES analysis by the Northeast Ohio Regional Sewer District.
Author contributionsF.Y. and R.D. conceived the study and collected the sediment core. R.D. and C.S. performedthe ICP-OES analyses. F.Y. conducted the data analysis, prepared all the figures, and wrotethe manuscript. All authors contributed to interpreting the results and editing themanuscript.
Additional informationCompeting financial interests: The authors declare no competing financial interests.
How to cite this article: Yuan, F., Depew, R. & Soltis-Muth, C. Ecosystem regime changeinferred from the distribution of trace metals in Lake Erie sediments. Sci. Rep. 4, 7265;DOI:10.1038/srep07265 (2014).
This work is licensed under a Creative Commons Attribution 4.0 InternationalLicense. The images or other third party material in this article are included in thearticle’s Creative Commons license, unless indicated otherwise in the credit line; ifthe material is not included under the Creative Commons license, users will needto obtain permission from the license holder in order to reproduce the material. Toview a copy of this license, visit http://creativecommons.org/licenses/by/4.0/
www.nature.com/scientificreports
SCIENTIFIC REPORTS | 4 : 7265 | DOI: 10.1038/srep07265 7