Prediction of Lake Levels on Lakes Michigan-Huron and Erie
36
Prediction of Lake Levels on Lakes Michigan-Huron and Erie Baird Report III March 10, 2020 | 12676.101.R1.RevC
-
Upload
khangminh22 -
Category
Documents
-
view
0 -
download
0
Transcript of Prediction of Lake Levels on Lakes Michigan-Huron and Erie
Prediction of Lake Levels on Lakes Michigan-Huron and Erie
Baird Report III
March 10, 2020 | 12676.101.R1.RevC
Prediction of Lake Levels on Lakes Michigan-Huron and Erie
Baird Report III
© 2020 W.F. Baird & Associates Coastal Engineers Ltd. (Baird) All Rights Reserved. Copyright in the whole and every part of this
document, including any data sets or outputs that accompany this report, belongs to Baird and may not be used, sold, transferred, copied or
reproduced in whole or in part in any manner or form or in or on any media to any person without the prior written consent of Baird.
This document was prepared by W.F. Baird & Associates Coastal Engineers Ltd. for Company Name. The outputs from this document are
designated only for application to the intended purpose, as specified in the document, and should not be used for any other site or project.
The material in it reflects the judgment of Baird in light of the information available to them at the time of preparation. Any use that a Third
Party makes of this document, or any reliance on decisions to be made based on it, are the responsibility of such Third Parties. Baird
accepts no responsibility for damages, if any, suffered by any Third Party as a result of decisions made or actions based on this document.
12676.101.R1.RevC Page i
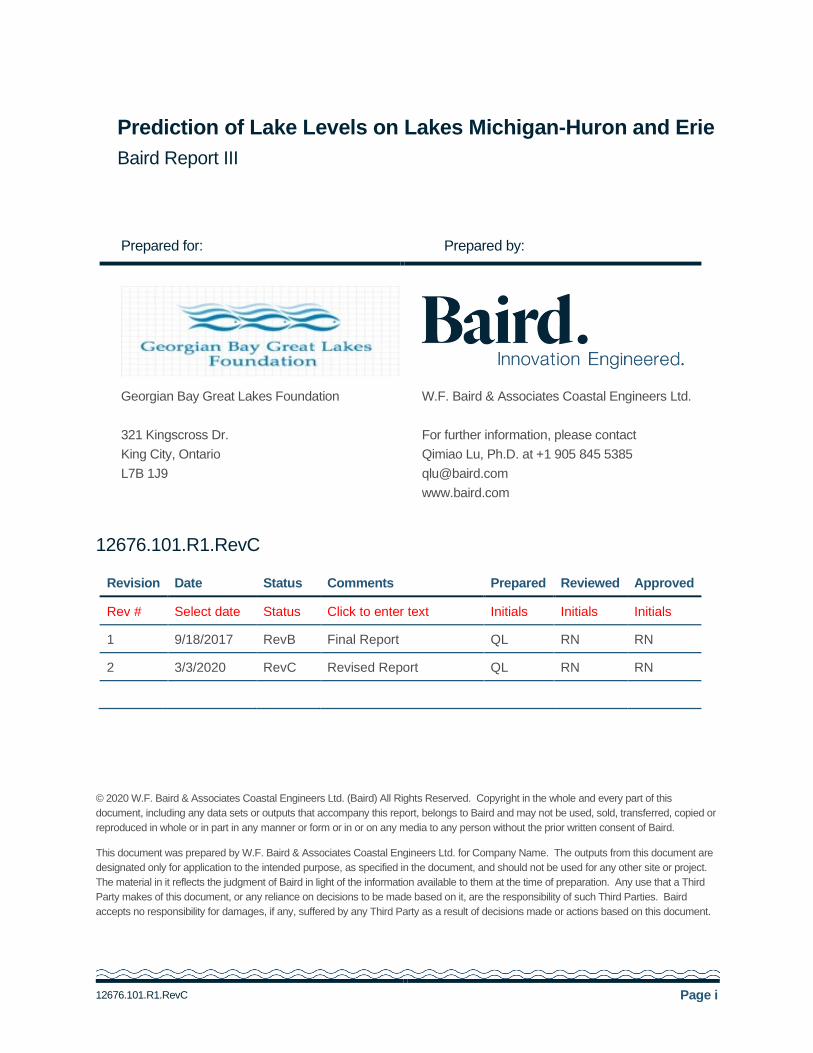
Prepared for: Prepared by:
Georgian Bay Great Lakes Foundation
321 Kingscross Dr.
King City, Ontario
L7B 1J9
W.F. Baird & Associates Coastal Engineers Ltd.
For further information, please contact
Qimiao Lu, Ph.D. at +1 905 845 5385
www.baird.com
12676.101.R1.RevC
Revision Date Status Comments Prepared Reviewed Approved
Rev # Select date Status Click to enter text Initials Initials Initials
1 9/18/2017 RevB Final Report QL RN RN
2 3/3/2020 RevC Revised Report QL RN RN
Prediction of Lake Levels on Lakes Michigan-Huron and Erie
Baird Report III
12676.101.R1.RevC Page ii
Abstract
An analysis of the historic water level fluctuations between 1850 and 2016 was completed for Lake Erie and
Lake Michigan-Huron, based on historical records, to determine the major harmonic constituents with periods
less than about 60 years. These data were supplemented with paleo lake levels derived from beach ridge
records and reconstructed lake levels from tree-ring chronologies. Harmonic analysis of these data reveals four
major quasi-periodic cycles, including 160-year and 11-year quasi-periodic cycles driven by sunspots, the 30-
year quasi-periodic precipitation cycles, and the 4-year quasi-periodic cycles linked to North Atlantic Oscillation
(NAO) and El Niño Southern Oscillation (ENSO), and an annual cycle. Major drivers of these cycles appear to
be sunspot activity and the NAO. We used the four major quasi-periodic cycles to develop a predictive model
for Lake Erie and Lake Michigan-Huron that was calibrated with the measured lake levels between 1850 and
2016. The prediction errors were also evaluated with forecasting time and indicate that the model has
capability to predict lake levels in decadal time frames. The findings have important implications to activities
influenced by lake level, including consumptive use of water, recreational use, navigation, hydro-power
generation, and environmental restoration. The findings also have wider application to sectors associated with
the climate of the Great Lakes basin including agriculture and flood risk management. Finally, the technique
presented may provide a method of monitoring and differentiating human-induced climate change.
Index Words. Great Lakes; Lake Level; Quasi-Periodic Cycle; Prediction; Sunspot Number; NAO
Prediction of Lake Levels on Lakes Michigan-Huron and Erie
Baird Report III
12676.101.R1.RevC Page iii
Table of Contents
1. Introduction ............................................................................................................................. 1
2. Methods ................................................................................................................................... 6
2.1 Data 6
2.2 Finding Cycles 6
2.3 Determination of Amplitudes and Phases of the Identified Cycles 10
3. Results .................................................................................................................................. 12
4. Discussion ............................................................................................................................ 20
5. References ............................................................................................................................ 27
Methods to Filter the Slope
Tables
Table 3.1: Major Cycles Found in the Water Level Data for Lake Erie and Lake Michigan and Huron ....... 12
Figures
Figure 1.1: Lake levels in Lake Michigan-Huron for four data sources, including measured monthly-averaged
lake levels (1865-2016), intermittent period of measurement back to 1819, reconstructed lake level from tree-
ring chronologies (1600-1961), and the paleo lake level data derived from beach ridges and shoreline positions
(2700 BC – 1700). ................................................................................................................................................. 3
Figure 1.2: Correlation between annual sunspot number and lake level in Lake Erie. .................................... 4
Figure 1.3: Comparison of measured lake levels with the water levels predicted in 2005 by the authors using
an earlier version of their method. ........................................................................................................................ 5
Figure 2.1: Comparison of lake levels in Lake Michigan-Huron from the different data sources. ................... 8
Figure 2.2: The variation of standard deviation (SD) and amplitude with period change using the data
generated by the three known cycles (30 years, 40 years, and 50 years) for testing purposes. .................... 9
Prediction of Lake Levels on Lakes Michigan-Huron and Erie
Baird Report III
12676.101.R1.RevC Page iv
Figure 2.3: Adjustment of lake level data in Lake Michigan-Huron by removing the permanent lake level drops
caused by human activities. ............................................................................................................................... 11
Figure 3.1: Comparison of predicted and measured monthly-averaged lake levels in Lake Erie for the
calibration period (1850-2016). .......................................................................................................................... 14
Figure 3.2: Comparison of predicted and measured monthly-averaged lake levels in Lake Michigan-Huron for
the calibration period (1850-2016). .................................................................................................................... 15
Figure 3.3: Correlation of measured and predicted monthly mean lake levels in Lake Erie. ........................ 16
Figure 3.4: Correlation of measured and predicted monthly mean lake levels in Lake Michigan-Huron. .... 17
Figure 3.5: Predicted monthly mean lake levels in Lake Erie (1950-2050). ................................................... 18
Figure 3.6: Predicted monthly mean lake levels in Lake Michigan-Huron (1950-2050). ............................... 19
Figure 4.1: Comparison of measured annually-averaged lake level in Lake Michigan-Huron with lake levels
predicted by using the 160-year quasi-periodic cycles. .................................................................................... 21
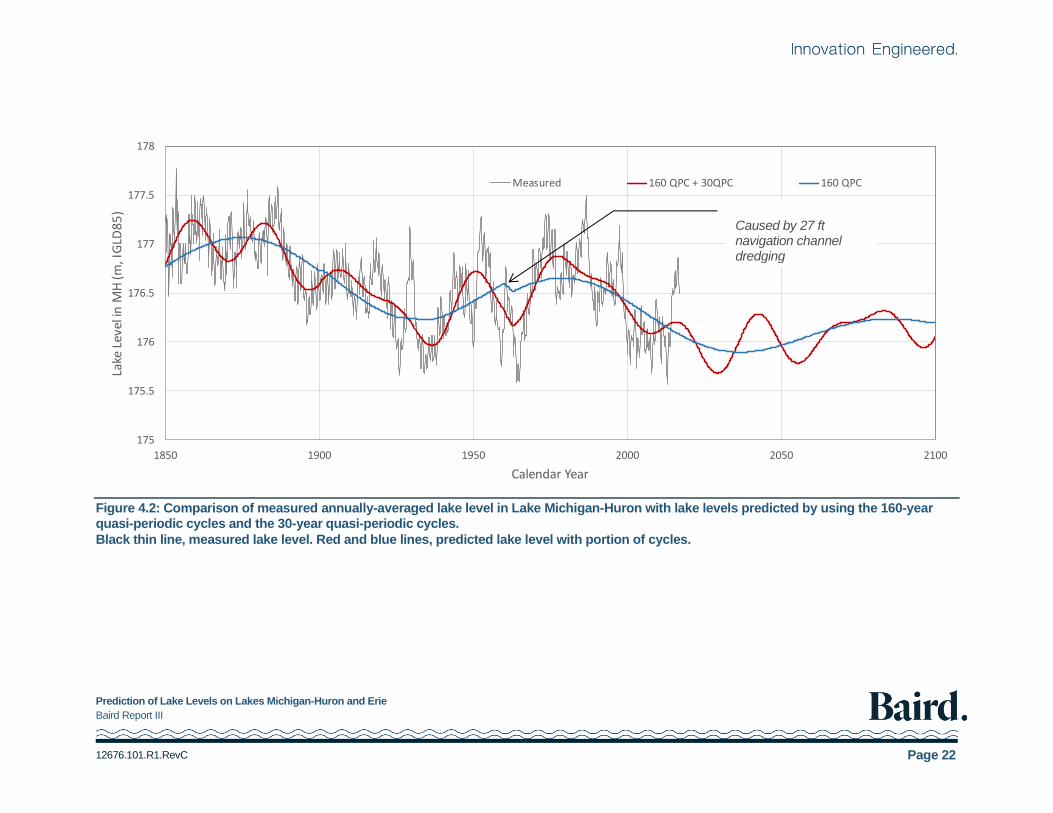
Figure 4.2: Comparison of measured annually-averaged lake level in Lake Michigan-Huron with lake levels
predicted by using the 160-year quasi-periodic cycles and the 30-year quasi-periodic cycles. .................... 22
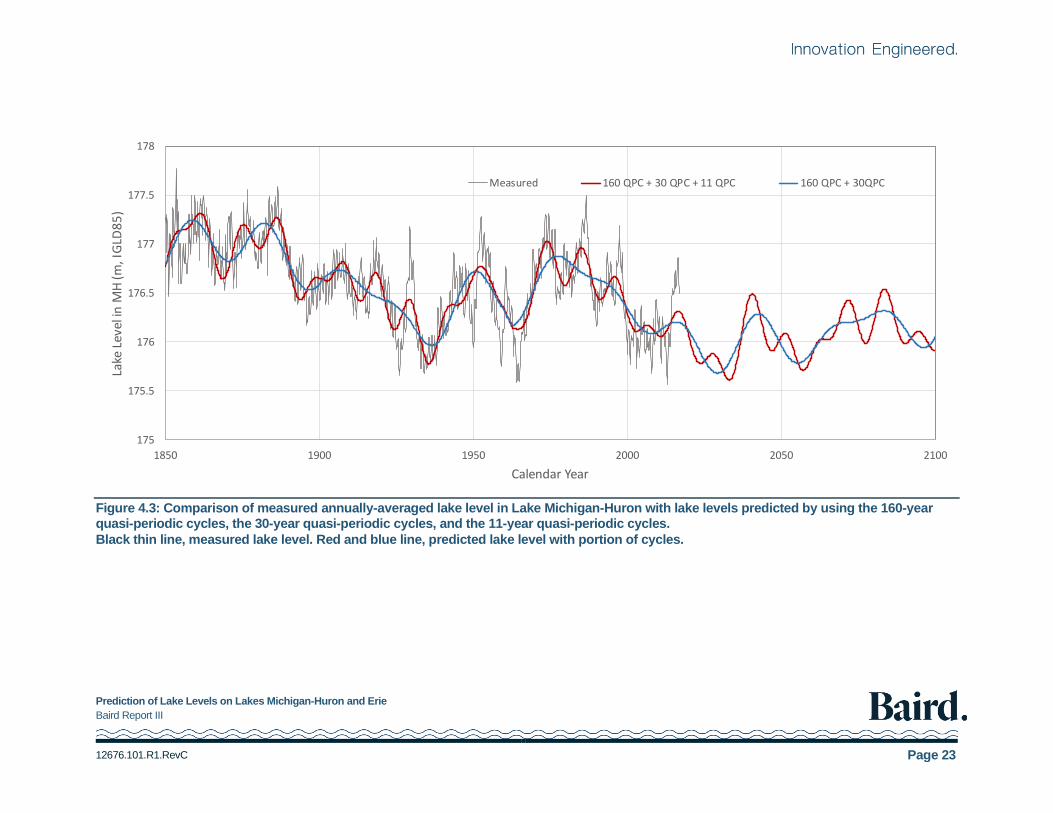
Figure 4.3: Comparison of measured annually-averaged lake level in Lake Michigan-Huron with lake levels
predicted by using the 160-year quasi-periodic cycles, the 30-year quasi-periodic cycles, and the 11-year
quasi-periodic cycles. .......................................................................................................................................... 23
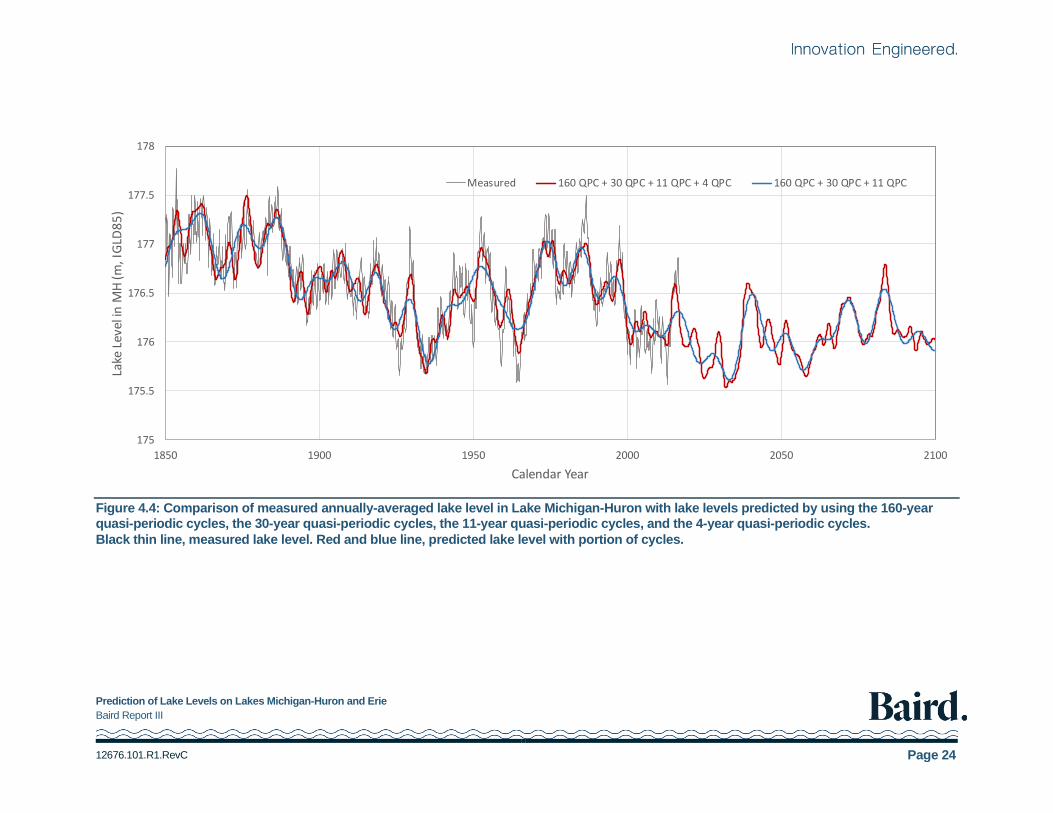
Figure 4.4: Comparison of measured annually-averaged lake level in Lake Michigan-Huron with lake levels
predicted by using the 160-year quasi-periodic cycles, the 30-year quasi-periodic cycles, the 11-year quasi-
periodic cycles, and the 4-year quasi-periodic cycles. ..................................................................................... 24
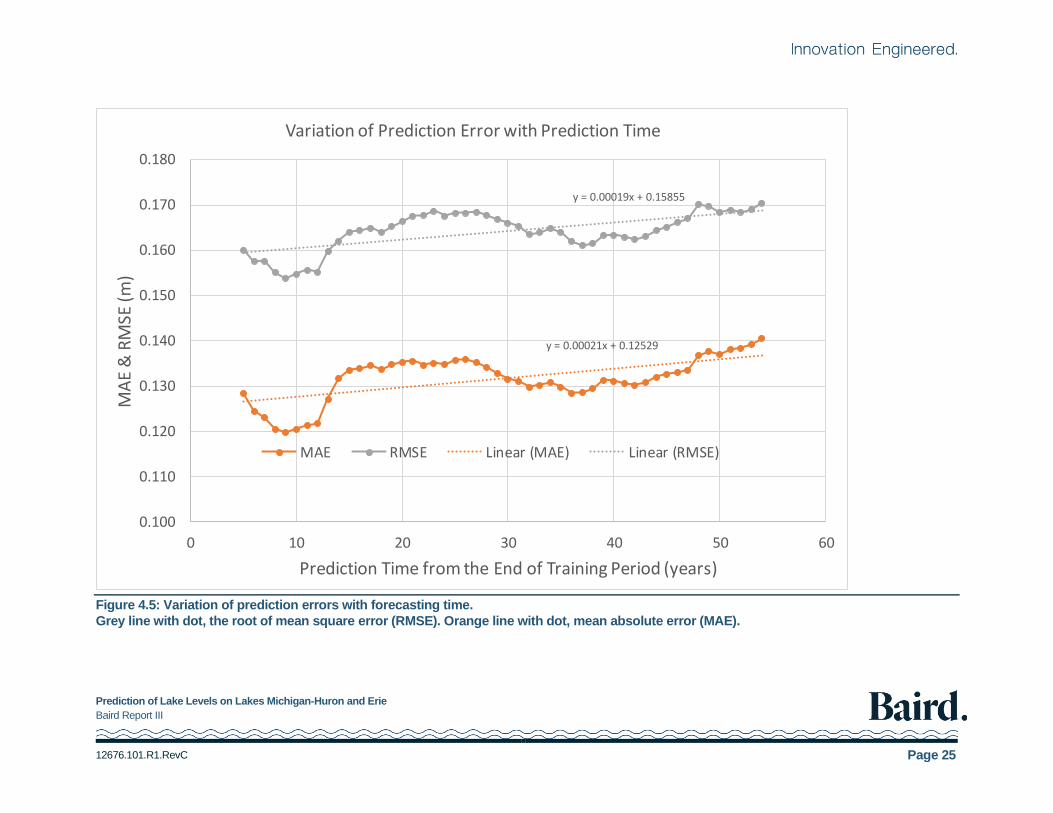
Figure 4.5: Variation of prediction errors with forecasting time. ....................................................................... 25
Figure 4.6: Comparison of lake level fluctuation patterns in Lake Erie and Lake Michigan-Huron. .............. 26
Prediction of Lake Levels on Lakes Michigan-Huron and Erie
Baird Report III
12676.101.R1.RevC Page 1
1. Introduction
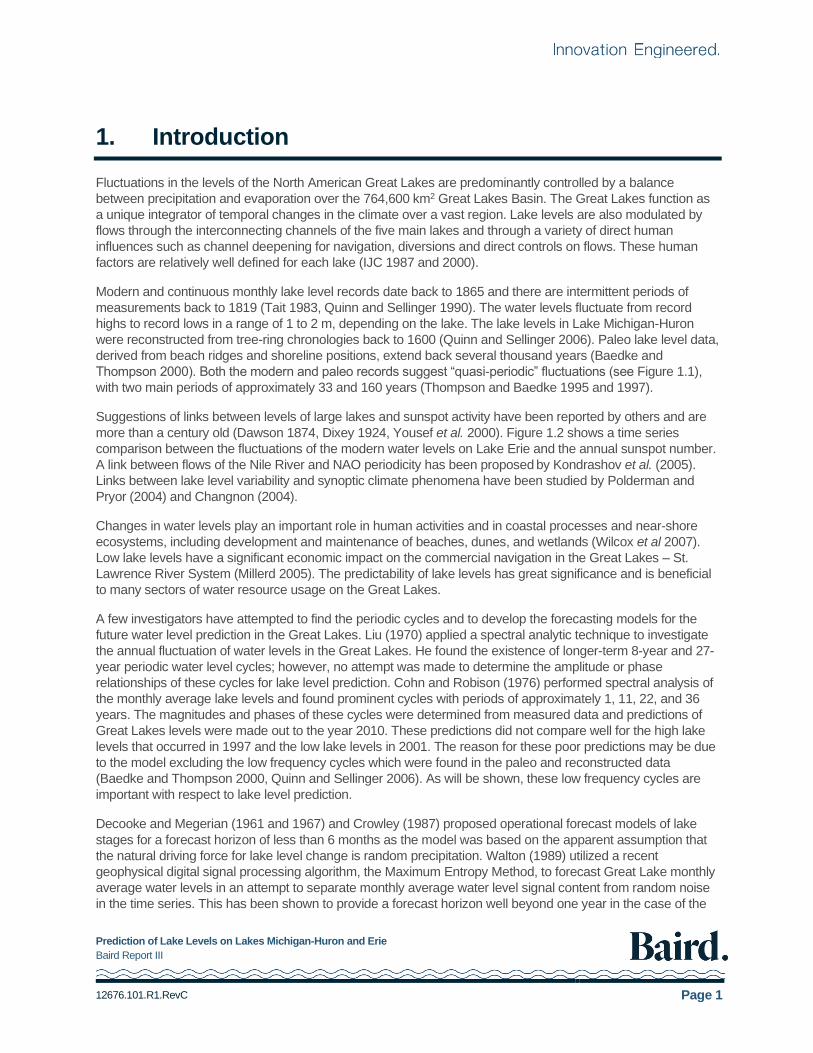
Fluctuations in the levels of the North American Great Lakes are predominantly controlled by a balance
between precipitation and evaporation over the 764,600 km2 Great Lakes Basin. The Great Lakes function as
a unique integrator of temporal changes in the climate over a vast region. Lake levels are also modulated by
flows through the interconnecting channels of the five main lakes and through a variety of direct human
influences such as channel deepening for navigation, diversions and direct controls on flows. These human
factors are relatively well defined for each lake (IJC 1987 and 2000).
Modern and continuous monthly lake level records date back to 1865 and there are intermittent periods of
measurements back to 1819 (Tait 1983, Quinn and Sellinger 1990). The water levels fluctuate from record
highs to record lows in a range of 1 to 2 m, depending on the lake. The lake levels in Lake Michigan-Huron
were reconstructed from tree-ring chronologies back to 1600 (Quinn and Sellinger 2006). Paleo lake level data,
derived from beach ridges and shoreline positions, extend back several thousand years (Baedke and
Thompson 2000). Both the modern and paleo records suggest “quasi-periodic” fluctuations (see Figure 1.1),
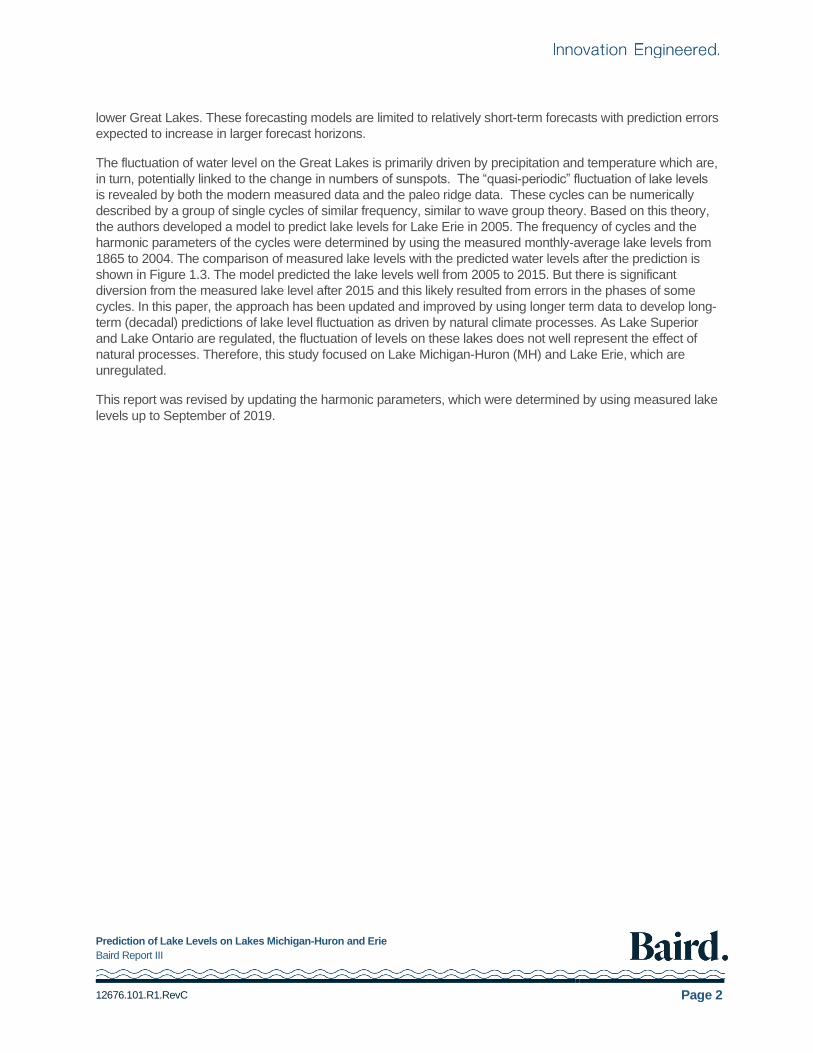
with two main periods of approximately 33 and 160 years (Thompson and Baedke 1995 and 1997).
Suggestions of links between levels of large lakes and sunspot activity have been reported by others and are
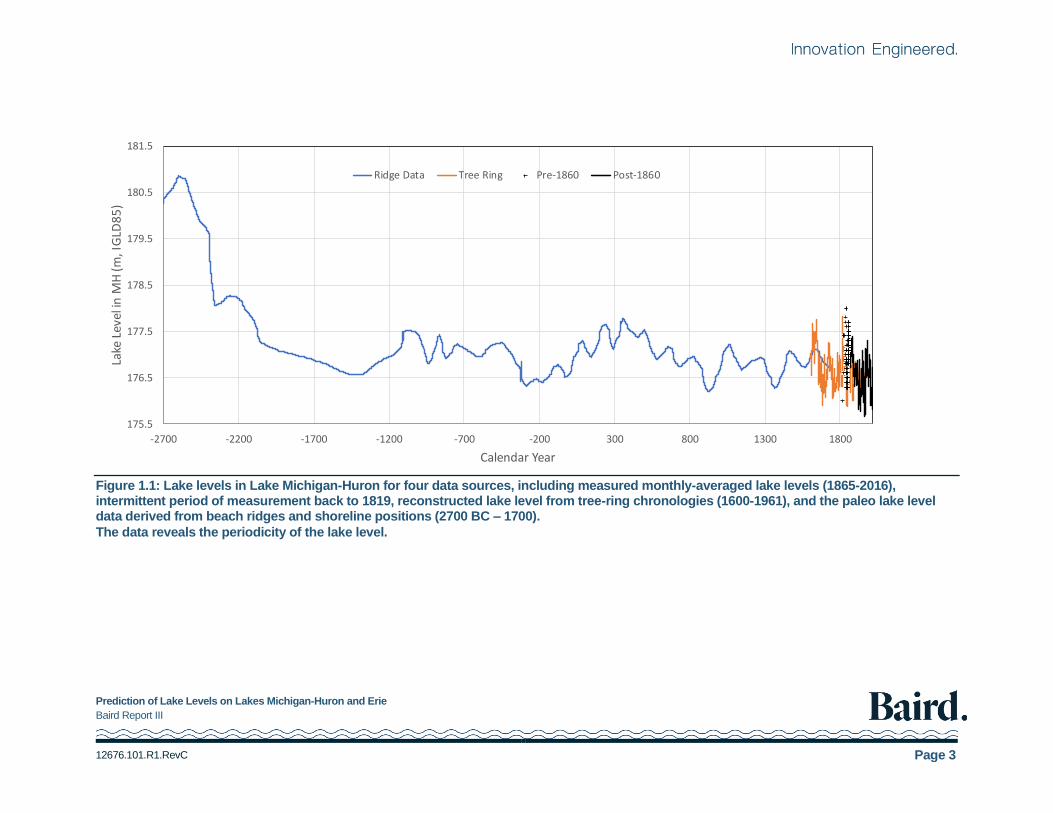
more than a century old (Dawson 1874, Dixey 1924, Yousef et al. 2000). Figure 1.2 shows a time series
comparison between the fluctuations of the modern water levels on Lake Erie and the annual sunspot number.
A link between flows of the Nile River and NAO periodicity has been proposed by Kondrashov et al. (2005).
Links between lake level variability and synoptic climate phenomena have been studied by Polderman and
Pryor (2004) and Changnon (2004).
Changes in water levels play an important role in human activities and in coastal processes and near-shore
ecosystems, including development and maintenance of beaches, dunes, and wetlands (Wilcox et al 2007).
Low lake levels have a significant economic impact on the commercial navigation in the Great Lakes – St.
Lawrence River System (Millerd 2005). The predictability of lake levels has great significance and is beneficial
to many sectors of water resource usage on the Great Lakes.
A few investigators have attempted to find the periodic cycles and to develop the forecasting models for the
future water level prediction in the Great Lakes. Liu (1970) applied a spectral analytic technique to investigate
the annual fluctuation of water levels in the Great Lakes. He found the existence of longer-term 8-year and 27-
year periodic water level cycles; however, no attempt was made to determine the amplitude or phase
relationships of these cycles for lake level prediction. Cohn and Robison (1976) performed spectral analysis of
the monthly average lake levels and found prominent cycles with periods of approximately 1, 11, 22, and 36
years. The magnitudes and phases of these cycles were determined from measured data and predictions of
Great Lakes levels were made out to the year 2010. These predictions did not compare well for the high lake
levels that occurred in 1997 and the low lake levels in 2001. The reason for these poor predictions may be due
to the model excluding the low frequency cycles which were found in the paleo and reconstructed data
(Baedke and Thompson 2000, Quinn and Sellinger 2006). As will be shown, these low frequency cycles are
important with respect to lake level prediction.
Decooke and Megerian (1961 and 1967) and Crowley (1987) proposed operational forecast models of lake
stages for a forecast horizon of less than 6 months as the model was based on the apparent assumption that
the natural driving force for lake level change is random precipitation. Walton (1989) utilized a recent
geophysical digital signal processing algorithm, the Maximum Entropy Method, to forecast Great Lake monthly
average water levels in an attempt to separate monthly average water level signal content from random noise
in the time series. This has been shown to provide a forecast horizon well beyond one year in the case of the
Prediction of Lake Levels on Lakes Michigan-Huron and Erie
Baird Report III
12676.101.R1.RevC Page 2
lower Great Lakes. These forecasting models are limited to relatively short-term forecasts with prediction errors
expected to increase in larger forecast horizons.
The fluctuation of water level on the Great Lakes is primarily driven by precipitation and temperature which are,
in turn, potentially linked to the change in numbers of sunspots. The “quasi-periodic” fluctuation of lake levels
is revealed by both the modern measured data and the paleo ridge data. These cycles can be numerically
described by a group of single cycles of similar frequency, similar to wave group theory. Based on this theory,
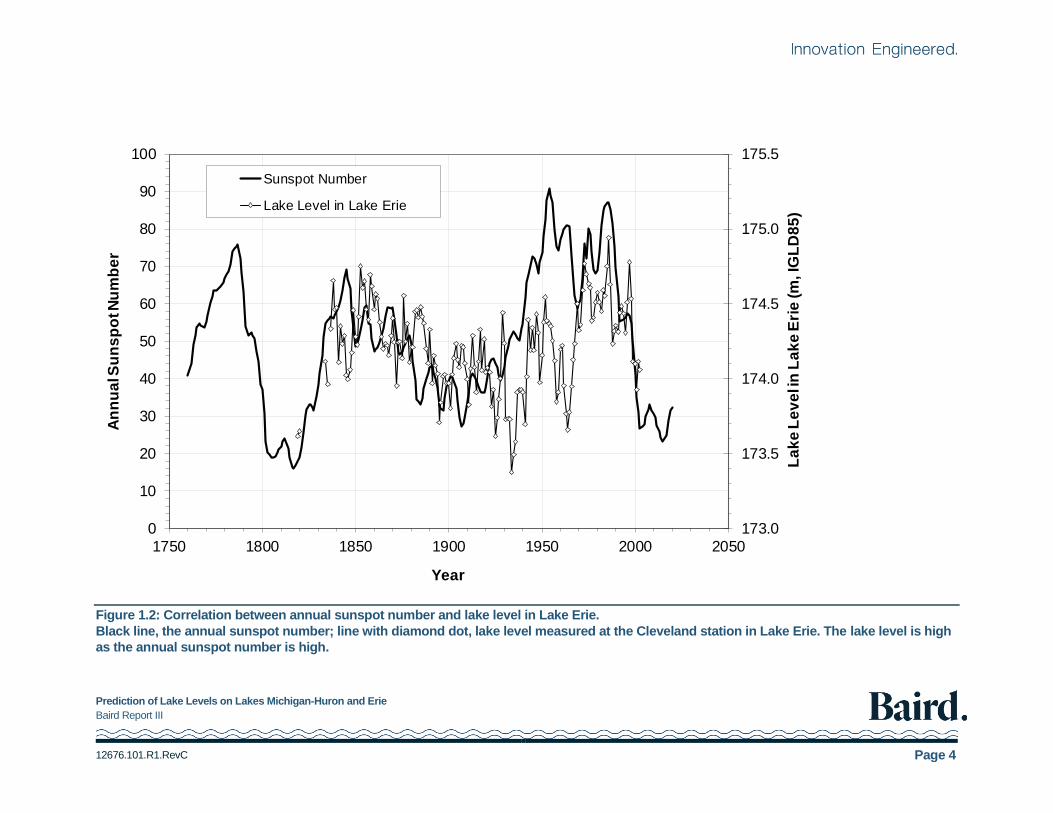
the authors developed a model to predict lake levels for Lake Erie in 2005. The frequency of cycles and the
harmonic parameters of the cycles were determined by using the measured monthly-average lake levels from
1865 to 2004. The comparison of measured lake levels with the predicted water levels after the prediction is
shown in Figure 1.3. The model predicted the lake levels well from 2005 to 2015. But there is significant
diversion from the measured lake level after 2015 and this likely resulted from errors in the phases of some
cycles. In this paper, the approach has been updated and improved by using longer term data to develop long-
term (decadal) predictions of lake level fluctuation as driven by natural climate processes. As Lake Superior
and Lake Ontario are regulated, the fluctuation of levels on these lakes does not well represent the effect of
natural processes. Therefore, this study focused on Lake Michigan-Huron (MH) and Lake Erie, which are
unregulated.
This report was revised by updating the harmonic parameters, which were determined by using measured lake
levels up to September of 2019.
Prediction of Lake Levels on Lakes Michigan-Huron and Erie
Baird Report III
12676.101.R1.RevC Page 3
Figure 1.1: Lake levels in Lake Michigan-Huron for four data sources, including measured monthly-averaged lake levels (1865-2016), intermittent period of measurement back to 1819, reconstructed lake level from tree-ring chronologies (1600-1961), and the paleo lake level data derived from beach ridges and shoreline positions (2700 BC – 1700).
The data reveals the periodicity of the lake level.
175.5
176.5
177.5
178.5
179.5
180.5
181.5
-2700 -2200 -1700 -1200 -700 -200 300 800 1300 1800
Lake
Lev
el in
MH
(m, I
GLD
85
)
Calendar Year
Ridge Data Tree Ring Pre-1860 Post-1860
Prediction of Lake Levels on Lakes Michigan-Huron and Erie
Baird Report III
12676.101.R1.RevC Page 4
Figure 1.2: Correlation between annual sunspot number and lake level in Lake Erie.
Black line, the annual sunspot number; line with diamond dot, lake level measured at the Cleveland station in Lake Erie. The lake level is high
as the annual sunspot number is high.
173.0
173.5
174.0
174.5
175.0
175.5
0
10
20
30
40
50
60
70
80
90
100
1750 1800 1850 1900 1950 2000 2050
La
ke
Le
ve
l in
La
ke
Eri
e (m
, IG
LD
85
)
An
nu
al S
un
sp
ot N
um
be
r
Year
Sunspot Number
Lake Level in Lake Erie
Prediction of Lake Levels on Lakes Michigan-Huron and Erie
Baird Report III
12676.101.R1.RevC Page 5
Figure 1.3: Comparison of measured lake levels with the water levels predicted in 2005 by the authors using an earlier version of their method.
The model was developed in 2005 and was used to predict the lake levels after 2005. The results show that the model predicted the lake levels
in Lake Erie relatively well from 2005 to 2015, but there is significant diversion after 2016.
173.0
173.5
174.0
174.5
175.0
175.5
1990 1995 2000 2005 2010 2015 2020
La
ke
Le
ve
ls in
La
ke
Eri
e (m
, IG
LD
85
)
Year
Predicted water level in 2005
Measured water levels before prediction
Measured water levels after prediction
Prediction of Lake Levels on Lakes Michigan-Huron and Erie
Baird Report III
12676.101.R1.RevC Page 6
2. Methods
2.1 Data
Modern and continuous monthly lake level records dating back to 1860 (see Figure 1.1) were obtained from
the National Oceanic and Atmospheric Administration’s (NOAA) National Ocean Services database (NOAA
tide and current data base, 2017). The monthly lake levels were downloaded for the gage at Harbor Beach in
Lake Huron and for the gage at Cleveland in Lake Erie. These two stations are the most representative of
average lake levels since they are located mid-lake and are less influenced by seasonal winds from a
dominant direction. The downloaded water level data were verified by NOAA (NOAA tide and current data
base, 2017). All modern water levels are referred to International Great Lakes Datum 1985 (IGLD85).
There are intermittent periods of measurements back to 1815 at the other available gages on both Lake
Michigan-Huron and Lake Erie. Quinn and Sellinger (1990) published the intermittent lake levels in Lake
Michigan-Huron from 1815 to 1859, which were converted from the measured lake level at Milwaukee,
Wisconsin and adjusted due to differential isostatic rebound. Tait (1983) listed the lake levels measured at
three gages (Buffalo, Cleveland, and Pt. Colborne) in Lake Erie, which were converted to International Great
Lake Datum 1955 (IGLD55). All of these lake levels were converted to IGLD85 for this study.
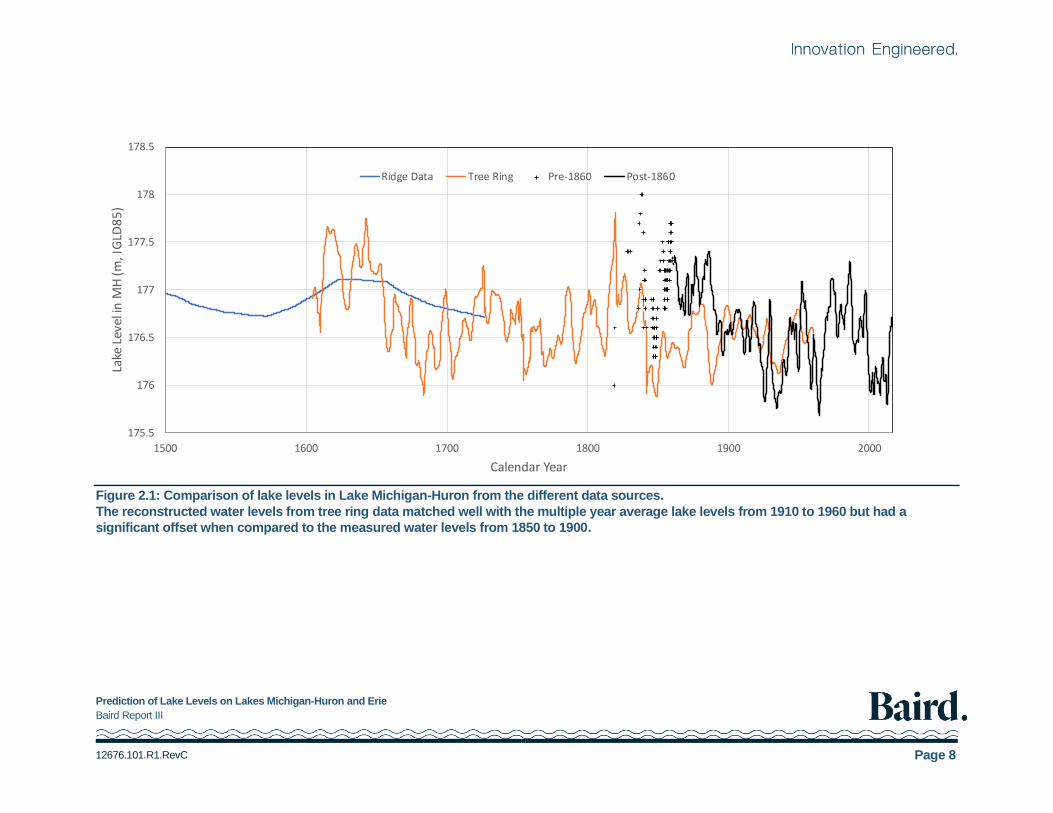
Quinn and Sellinger (2006) used a dendrochronolgy of annual precipitation and air temperature from tree-ring
chronologies at six Great Lakes locations to reconstruct lake levels in Lake Michigan for the period 1600-1961.
The reconstructed water levels matched well with the multiple year average lake levels from 1910 to 1960 but
had a significant offset when compared to the measured water levels from 1850 to 1900 (see Figure 2.1).
These data suggested a return interval of 150 – 190 years for extreme lake levels in Lake Michigan-Huron.
Paleo lake level data, derived from beach ridges and shoreline positions, extend back several thousand years
(Baedke and Thompson 2000). Both the modern and paleo records suggest “quasi-periodic” fluctuations, with
two main periods of approximately 33 years (32 +/- 6.6 years) and 160 years (120 – 200 years), as shown in
Figure 1.1.
2.2 Finding Cycles
The measured lake level data depict so-called “quasi-periodic” cycles, as suggested by others (Thompson and
Baedke 1995 and 1997, Baedke and Thompson 2000, Polderman and Pryor 2004). “Quasi-periodic” cycles
can be described by the superposition of different periodic cycles with periods that are very close. Therefore,
“quasi-periodic” fluctuations of lake levels on the Great Lakes can be described by a number of cosine
functions once any non-periodic trend is filtered out.
A harmonic analysis of the historic fluctuations on available lake level data was completed to find the major
cycles which are important to the lake level fluctuations and to determine the characteristic parameters of
major harmonic constituents; that is, frequency, magnitude, and phase. The mathematical equation used to
find these characteristic parameters is:
(1)
where z is the lake level (in meters), t is time (in calendar years), z0 is the mean lake level (in metres) which is
determined from monthly lake level records (see appendix). The variables of the last two terms of Equation (1)
are described below.
( )=
++−+=N
k
kkk tattzz1
00 cos)(
Prediction of Lake Levels on Lakes Michigan-Huron and Erie
Baird Report III
12676.101.R1.RevC Page 7
The second term of Equation (1) describes the linear trend of the lake levels over the period of record. The
trend term was introduced to account for the non-periodic change of lake levels caused by historical human
activities or by the influence of glacial isostatic adjustment on lake levels. For example, the outlet of Lake Erie
is rising at 6 to 9 cm/century (The Coordinating Committee on Great Lakes Basic Hydraulic and Hydrologic
Data 2001) and this results in an equivalent rise in the mean level of this lake. The trend term also accounts for
periodic changes of the lake levels linked to the climate change cycles with very long periods (over 500 years)
that cannot be determined as the existing lake level record is too short. Cycles with a very long period which
cannot be determined with the available data can be approximately represented as a linear trend in the short
term. The slope coefficient () and initial time (t0) were determined by using regression analysis of the lake
level record (see appendix).
The third term in Equation (1) represents the periodic cycles expressed by a series of cosine functions. Each
cosine function represents a harmonic in lake level cycles. The subscript k represents the k-th cycle and N is
the total number of cycles. Each cycle contains three unknown constants that must be determined from the
lake level records: amplitude (a), frequency ( =2/T, where T is the period), and the initial phase ().
Harmonic analysis is based on three assumptions that must apply over the full length of the lake level record
(Katznelson, 2004): 1) the average value of all sample data must be zero; 2) the average value of any product
)cos()cos( tt ji • , )sin()cos( tt ji • , )cos()sin( tt ji • , and )sin()sin( tt ji • where ji
must be zero; and 3) the average of )(cos2 ti or )(sin 2 ti is equal to ½ (see more detailed explanation in
appendix). Therefore, the amplitude and initial phase for a cycle are determined by the following expressions:
(2)
where
=
=M
i
ikik tzM
A1
)cos(1
, =
=M
i
ikik tzM
B1
)sin(1
, and )( 00 ttzzz −−−= (3)
Using Equations (2) and (3), the amplitude (ak) and the initial phase (k) can be calculated if the frequency (k)
is known.
To complete the harmonic analysis, the frequency of each harmonic constituent or cycle must be first
determined. The harmonic analysis technique was initially applied to search for possible cycles by scanning
periods from 0.5 year to 500 years with an interval of 0.01 year. In each trial, only one harmonic (i.e. N=1 in
Equation (1)) with the given period or frequency was tested by using Equation (1). The amplitude and phase
for each trial cycle was determined by using Equations (2) and (3). The predicted lake level was then
calculated by using Equation (1) and the standard deviation of the prediction error, which is the difference
between the predicted and measured lake levels, was also calculated. The cycles were determined or defined
by examining the response of amplitudes and standard deviations as the frequency changed. The amplitude of
the found cycles should be a maximum and the standard deviation should be a minimum if the cycle with the
given period has a significant role in lake level fluctuations.
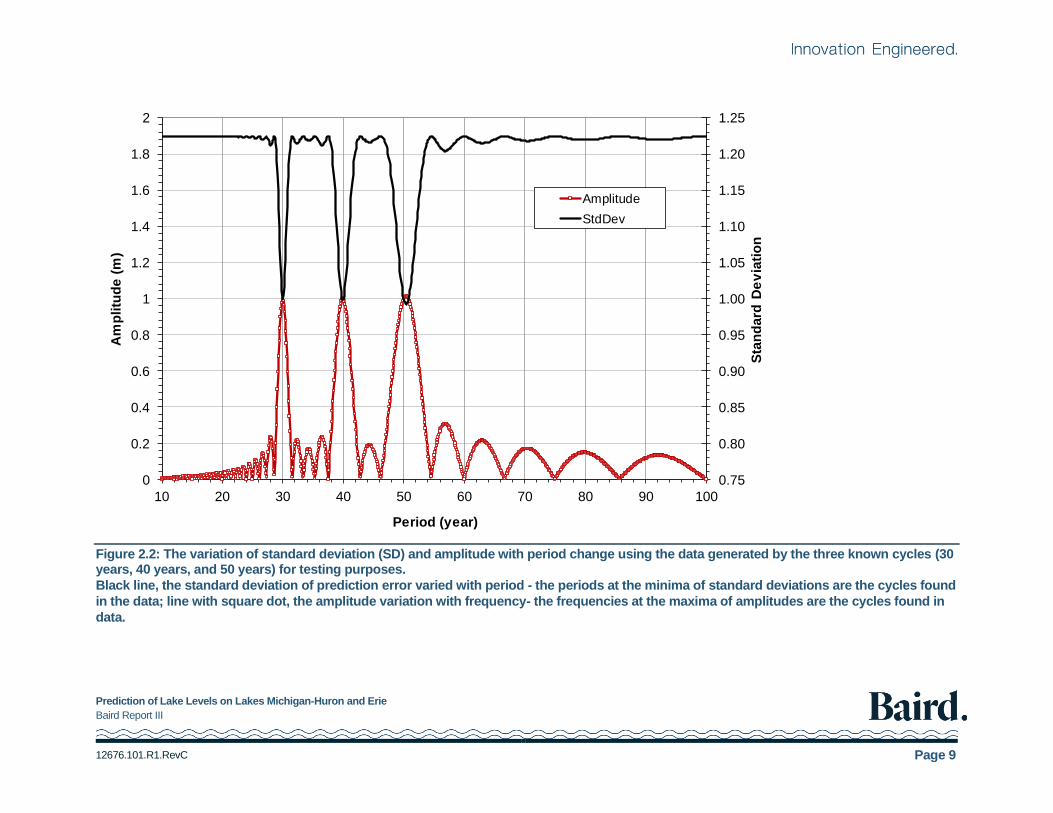
To verify the approach for finding cycles, the artificial data that were generated by using the three known cycles
with periods of 30, 40 and 50 years and unit amplitudes were tested. The amplitude and standard deviation
changes with period are shown in Figure 2.2. The largest amplitudes and smallest standard deviations were
located exactly at the three known periods and therefore the three cycles were identified. In this way lake level
cycles were identified.
)/arctan(
2 22
kkk
k
AB
BAa kk
−=
+=
Prediction of Lake Levels on Lakes Michigan-Huron and Erie
Baird Report III
12676.101.R1.RevC Page 8
Figure 2.1: Comparison of lake levels in Lake Michigan-Huron from the different data sources.
The reconstructed water levels from tree ring data matched well with the multiple year average lake levels from 1910 to 1960 but had a
significant offset when compared to the measured water levels from 1850 to 1900.
175.5
176
176.5
177
177.5
178
178.5
1500 1600 1700 1800 1900 2000
Lake
Lev
el in
MH
(m, I
GLD
85
)
Calendar Year
Ridge Data Tree Ring Pre-1860 Post-1860
Prediction of Lake Levels on Lakes Michigan-Huron and Erie
Baird Report III
12676.101.R1.RevC Page 9
Figure 2.2: The variation of standard deviation (SD) and amplitude with period change using the data generated by the three known cycles (30 years, 40 years, and 50 years) for testing purposes.
Black line, the standard deviation of prediction error varied with period - the periods at the minima of standard deviations are the cycles found
in the data; line with square dot, the amplitude variation with frequency- the frequencies at the maxima of amplitudes are the cycles found in
data.
0.75
0.80
0.85
0.90
0.95
1.00
1.05
1.10
1.15
1.20
1.25
0
0.2
0.4
0.6
0.8
1
1.2
1.4
1.6
1.8
2
10 20 30 40 50 60 70 80 90 100
Sta
nd
ard
De
via
tio
n
Am
pli
tud
e (
m)
Period (year)
Amplitude
StdDev
Prediction of Lake Levels on Lakes Michigan-Huron and Erie
Baird Report III
12676.101.R1.RevC Page 10
Using continuous monthly lake level data measured at the Cleveland gage on Lake Erie dating back to 1850,
the analysis was completed to determine the major harmonic constituents with periods less than approximately
60 years. The recorded lake levels in Lake Erie are recognized to be the most representative of lake level
fluctuation driven by the natural climates since the lake is not regulated and differential isostatic rebound at the
outlet is small. This analysis was also completed for the paleo lake level records derived from Indiana Dunes
beach ridges (Thompson and Baedke 1995 and 1997) and the reconstructed lake level data from tree-ring
chronologies (Quinn and Sellinger 2006) to search for very low frequency cycles with periods from 60 to 500
years. Harmonic analyses of the NAO records (Hurrell and Van Loon 1997, Burns 2002, Ostermeier and
Wallace 2003) from 1658 to 2001 and sunspot number data records (Gleissberg 1971, Siscoe 1978) from 1760
to 2005 were also examined to identify possible climate drivers for the cycles identified in the lake level data.
2.3 Determination of Amplitudes and Phases of the Identified Cycles
Using the major harmonic constituents found in the above analysis, the amplitudes and phases of these cycles
(see Table 3.1) were then recalculated using Equation (1) for Lake Erie and Lake Michigan-Huron separately.
Due to the geographical location of the two lake systems and regional variation of climate, the amplitude and
phases of these identified cycles are expected to be different.
Without any data processing, the recorded lake level in Lake Erie was used to determine the magnitudes and
phases of the identified cycles directly. The differential isostatic rebound in Lake Erie is 6-9 cm/century at the
outlet (IJC 2000), which is small. The outlet at the Niagara River is recognized to be stable and no significant
erosion of the river bed has been identified. The impact of human activities (such as water diversion) on Lake
Erie is minimal. Therefore, the fluctuation of recorded lake levels in Lake Erie is directly representative of the
natural variation of climate in the lower Great Lakes.
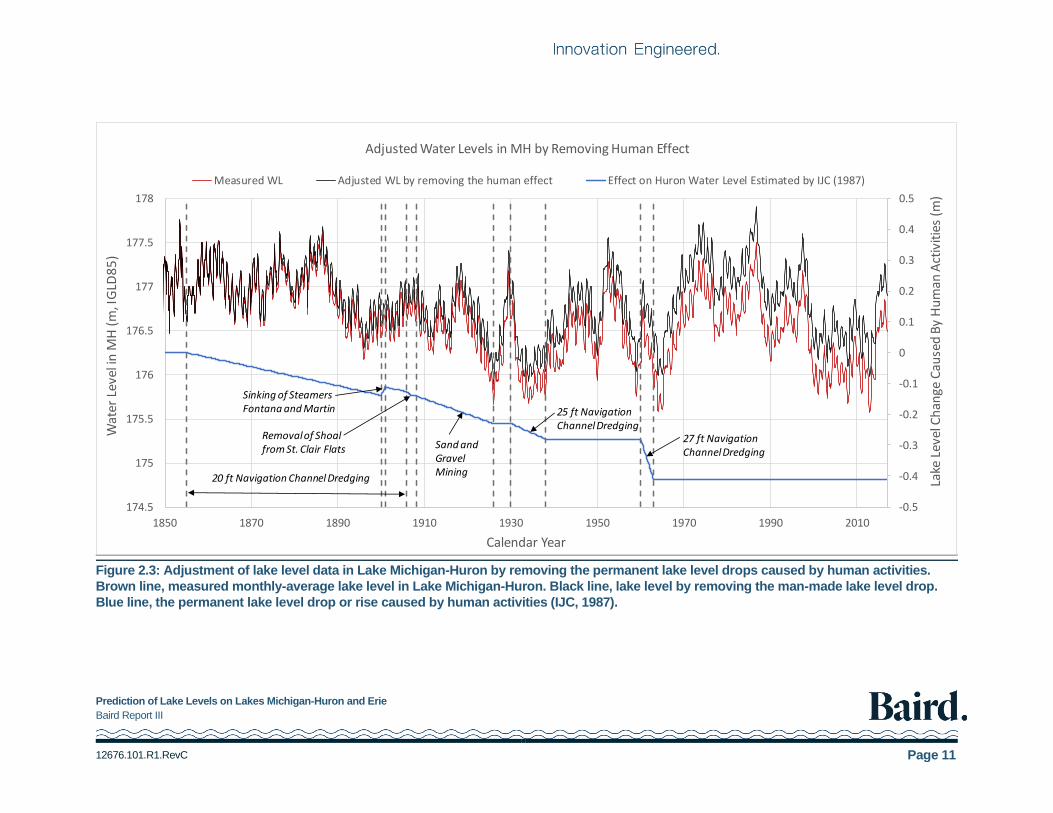
The recorded lake levels in Lake Michigan-Huron depict a decline since 1900, when compared to the trend of
lake levels in Lake Erie. IJC (1987) identifies a permanent drop of lake level of about 41 cm (36 cm ~ 46 cm)
caused by human activities, such as the Chicago diversion and the various Detroit/St. Clair River channel
modifications through dredging. Recently, the erosion of the St. Clair River has been identified and this has
contributed to an unrecoverable decline of lake level in Lake Michigan-Huron (Baird, 2005). These
anthropogenic influences on lake level must be removed from the record of measured lake levels in order for
the lake level fluctuation to represent natural climate variations. Therefore, the estimated permanent water
level reductions caused by the human activities were added to the recorded lake levels as shown in Figure 2.3.
The adjusted water levels were then used to determine the amplitudes and phases of the identified cycles by
applying Equation (1). Note that the slope filter described by the second term in Equation (1) was also applied
to account for the constant decline caused by the erosion in the St. Clair River bed.
Prediction of Lake Levels on Lakes Michigan-Huron and Erie
Baird Report III
12676.101.R1.RevC Page 11
Figure 2.3: Adjustment of lake level data in Lake Michigan-Huron by removing the permanent lake level drops caused by human activities.
Brown line, measured monthly-average lake level in Lake Michigan-Huron. Black line, lake level by removing the man-made lake level drop.
Blue line, the permanent lake level drop or rise caused by human activities (IJC, 1987).
-0.5
-0.4
-0.3
-0.2
-0.1
0
0.1
0.2
0.3
0.4
0.5
174.5
175
175.5
176
176.5
177
177.5
178
1850 1870 1890 1910 1930 1950 1970 1990 2010
Lake
Lev
el C
han
ge C
ause
d B
y H
um
an A
ctiv
itie
s (m
)
Wat
er L
evel
in M
H (
m, I
GLD
85
)
Calendar Year
Adjusted Water Levels in MH by Removing Human Effect
Measured WL Adjusted WL by removing the human effect Effect on Huron Water Level Estimated by IJC (1987)
Sinking of Steamers Fontana and Martin 25 ft Navigation
ChannelDredging27 ft Navigation ChannelDredging
Sand andGravel Mining
Removal of Shoal from St. Clair Flats
20 ft Navigation Channel Dredging
Prediction of Lake Levels on Lakes Michigan-Huron and Erie
Baird Report III
12676.101.R1.RevC Page 12
3. Results
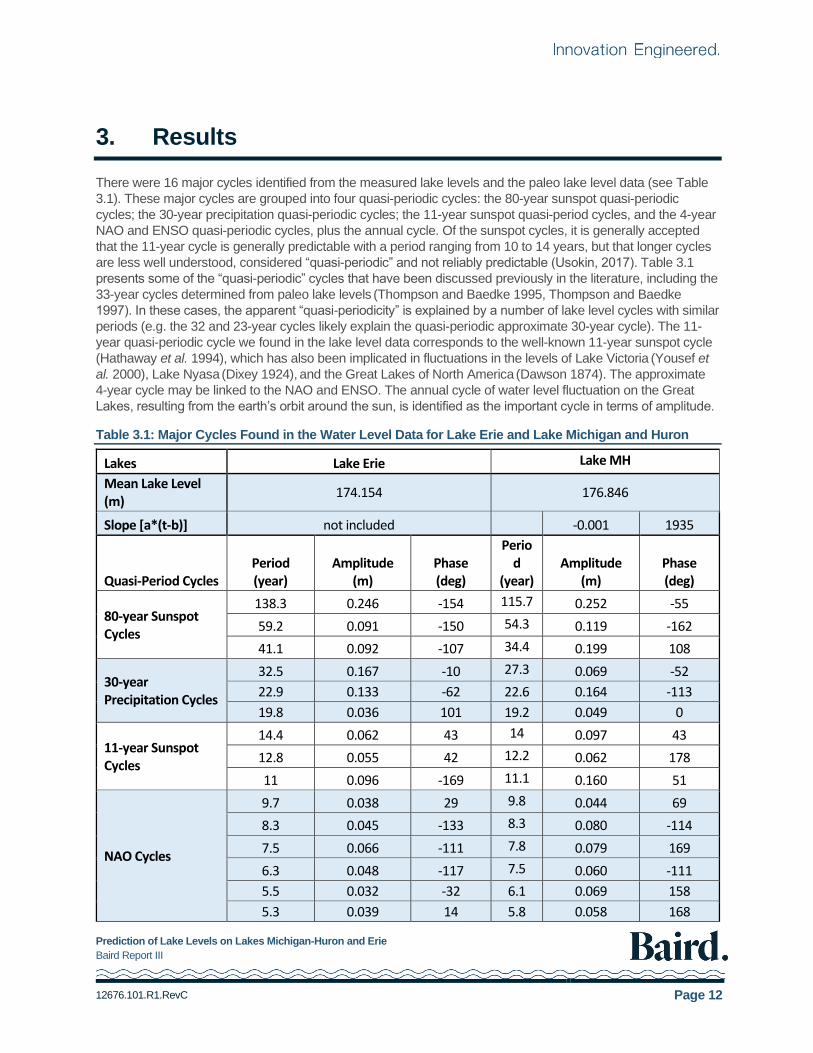
There were 16 major cycles identified from the measured lake levels and the paleo lake level data (see Table
3.1). These major cycles are grouped into four quasi-periodic cycles: the 80-year sunspot quasi-periodic
cycles; the 30-year precipitation quasi-periodic cycles; the 11-year sunspot quasi-period cycles, and the 4-year
NAO and ENSO quasi-periodic cycles, plus the annual cycle. Of the sunspot cycles, it is generally accepted
that the 11-year cycle is generally predictable with a period ranging from 10 to 14 years, but that longer cycles
are less well understood, considered “quasi-periodic” and not reliably predictable (Usokin, 2017). Table 3.1
presents some of the “quasi-periodic” cycles that have been discussed previously in the literature, including the
33-year cycles determined from paleo lake levels (Thompson and Baedke 1995, Thompson and Baedke
1997). In these cases, the apparent “quasi-periodicity” is explained by a number of lake level cycles with similar
periods (e.g. the 32 and 23-year cycles likely explain the quasi-periodic approximate 30-year cycle). The 11-
year quasi-periodic cycle we found in the lake level data corresponds to the well-known 11-year sunspot cycle
(Hathaway et al. 1994), which has also been implicated in fluctuations in the levels of Lake Victoria (Yousef et
al. 2000), Lake Nyasa (Dixey 1924), and the Great Lakes of North America (Dawson 1874). The approximate
4-year cycle may be linked to the NAO and ENSO. The annual cycle of water level fluctuation on the Great
Lakes, resulting from the earth’s orbit around the sun, is identified as the important cycle in terms of amplitude.
Table 3.1: Major Cycles Found in the Water Level Data for Lake Erie and Lake Michigan and Huron
Lakes Lake Erie Lake MH
Mean Lake Level (m)
174.154 176.846
Slope [a*(t-b)] not included -0.001 1935
Quasi-Period Cycles Period (year)
Amplitude (m)
Phase (deg)
Period
(year) Amplitude
(m) Phase (deg)
80-year Sunspot Cycles
138.3 0.246 -154 115.7 0.252 -55
59.2 0.091 -150 54.3 0.119 -162
41.1 0.092 -107 34.4 0.199 108
30-year Precipitation Cycles
32.5 0.167 -10 27.3 0.069 -52
22.9 0.133 -62 22.6 0.164 -113
19.8 0.036 101 19.2 0.049 0
11-year Sunspot Cycles
14.4 0.062 43 14 0.097 43
12.8 0.055 42 12.2 0.062 178
11 0.096 -169 11.1 0.160 51
NAO Cycles
9.7 0.038 29 9.8 0.044 69
8.3 0.045 -133 8.3 0.080 -114
7.5 0.066 -111 7.8 0.079 169
6.3 0.048 -117 7.5 0.060 -111
5.5 0.032 -32 6.1 0.069 158
5.3 0.039 14 5.8 0.058 168
Prediction of Lake Levels on Lakes Michigan-Huron and Erie
Baird Report III
12676.101.R1.RevC Page 13
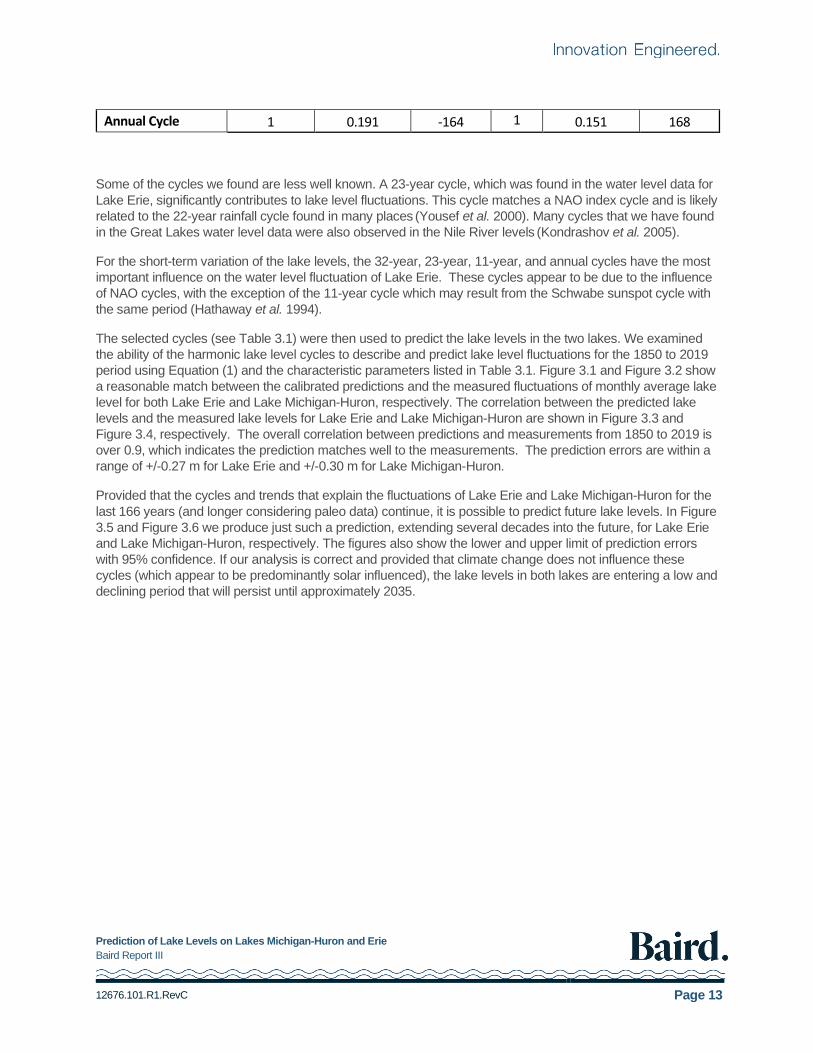
Annual Cycle 1 0.191 -164 1 0.151 168
Some of the cycles we found are less well known. A 23-year cycle, which was found in the water level data for
Lake Erie, significantly contributes to lake level fluctuations. This cycle matches a NAO index cycle and is likely
related to the 22-year rainfall cycle found in many places (Yousef et al. 2000). Many cycles that we have found
in the Great Lakes water level data were also observed in the Nile River levels (Kondrashov et al. 2005).
For the short-term variation of the lake levels, the 32-year, 23-year, 11-year, and annual cycles have the most
important influence on the water level fluctuation of Lake Erie. These cycles appear to be due to the influence
of NAO cycles, with the exception of the 11-year cycle which may result from the Schwabe sunspot cycle with
the same period (Hathaway et al. 1994).
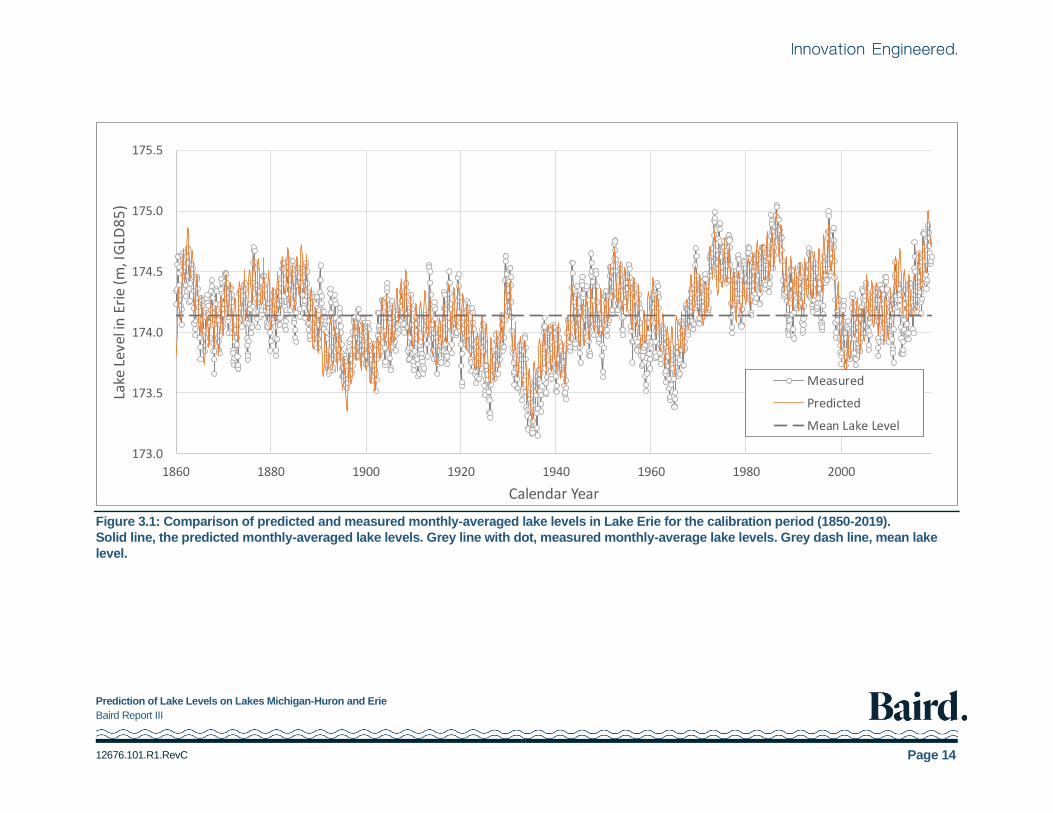
The selected cycles (see Table 3.1) were then used to predict the lake levels in the two lakes. We examined
the ability of the harmonic lake level cycles to describe and predict lake level fluctuations for the 1850 to 2019
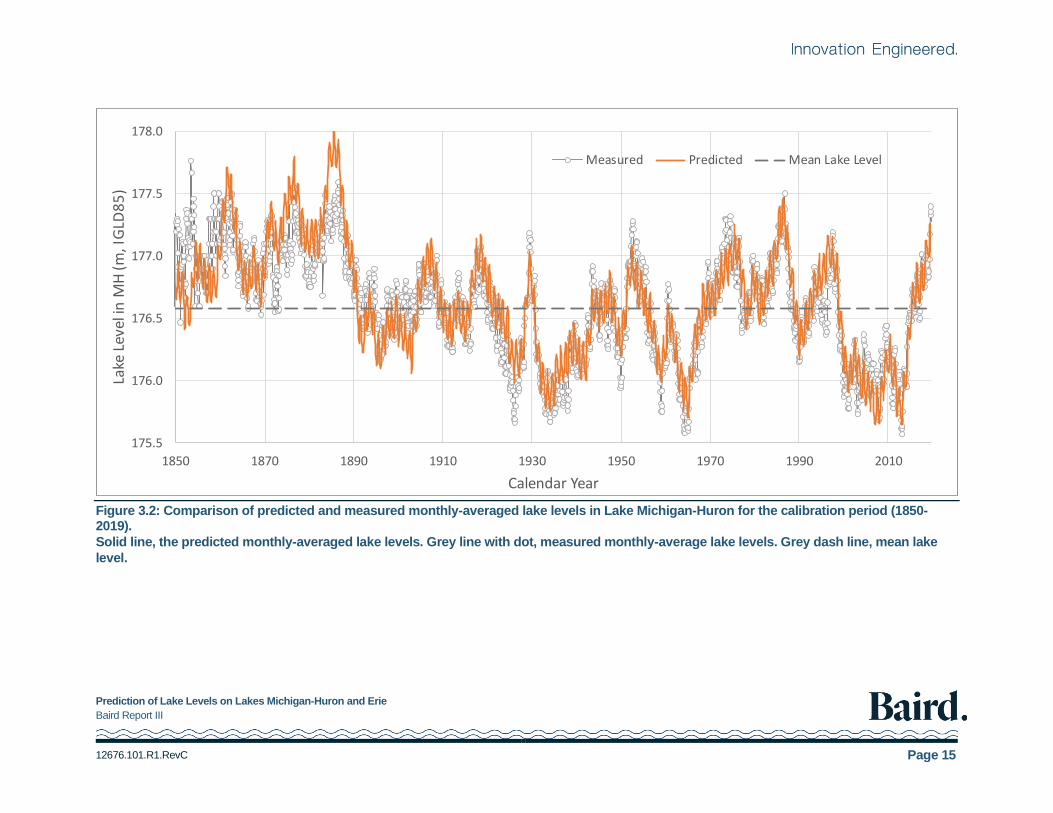
period using Equation (1) and the characteristic parameters listed in Table 3.1. Figure 3.1 and Figure 3.2 show
a reasonable match between the calibrated predictions and the measured fluctuations of monthly average lake
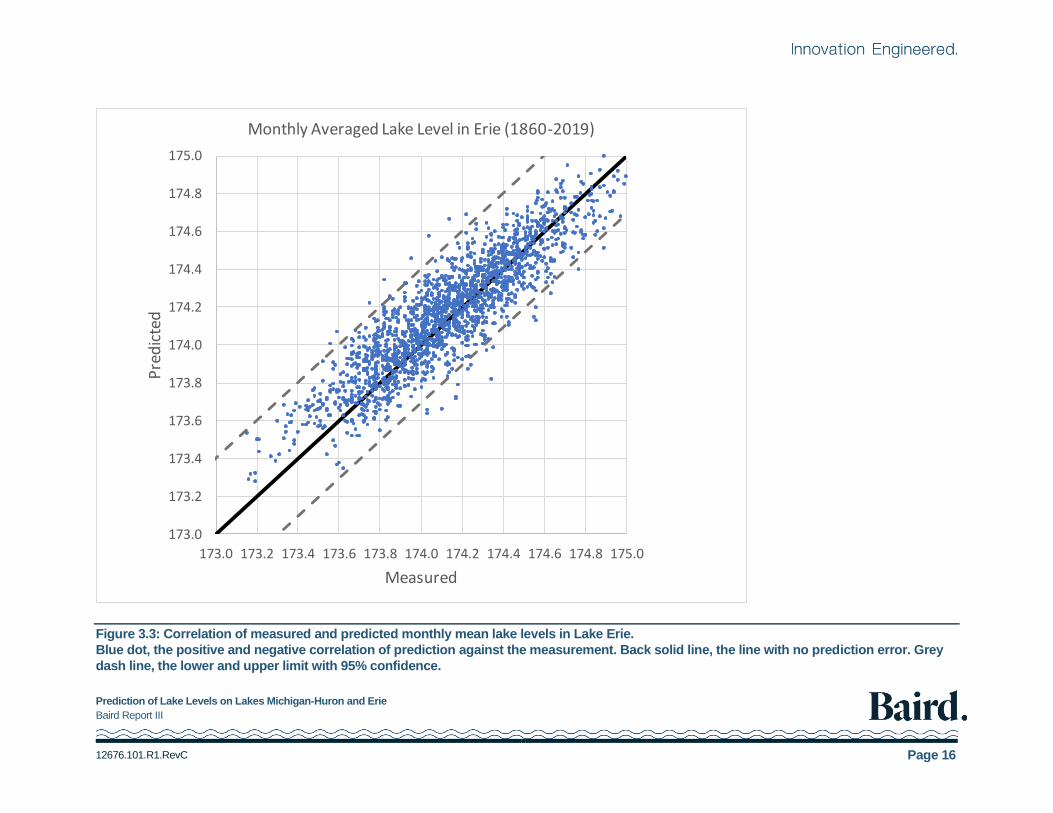
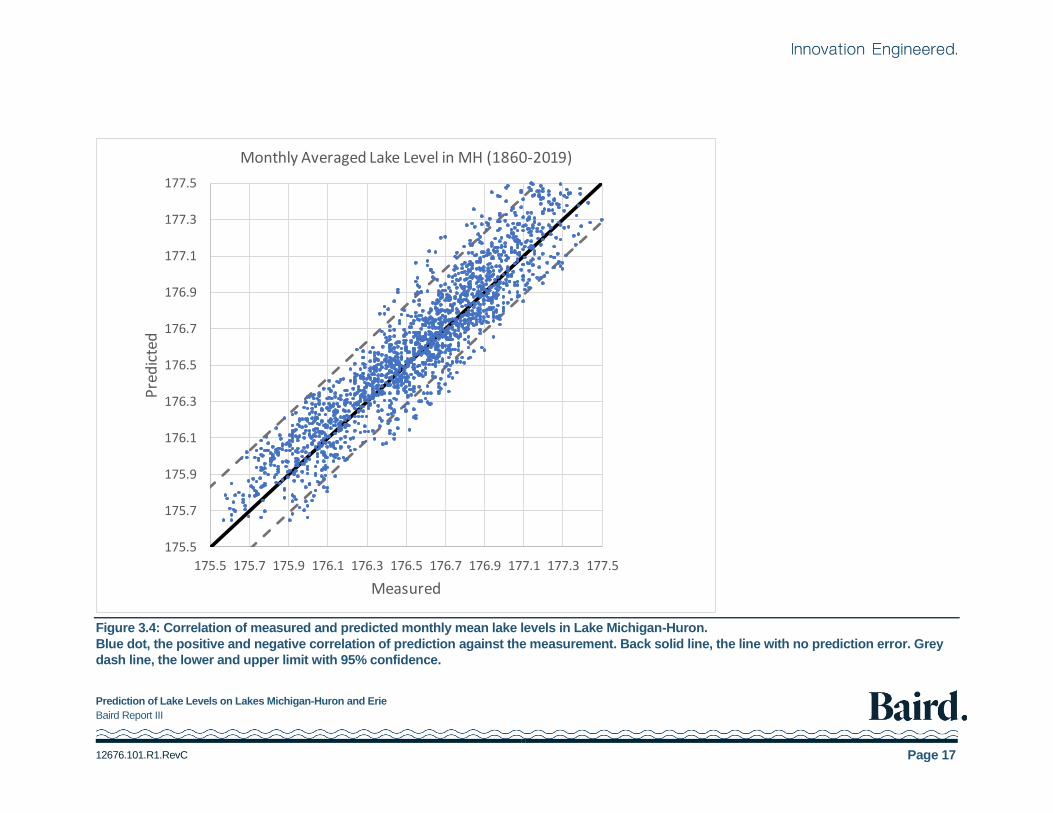
level for both Lake Erie and Lake Michigan-Huron, respectively. The correlation between the predicted lake
levels and the measured lake levels for Lake Erie and Lake Michigan-Huron are shown in Figure 3.3 and
Figure 3.4, respectively. The overall correlation between predictions and measurements from 1850 to 2019 is
over 0.9, which indicates the prediction matches well to the measurements. The prediction errors are within a
range of +/-0.27 m for Lake Erie and +/-0.30 m for Lake Michigan-Huron.
Provided that the cycles and trends that explain the fluctuations of Lake Erie and Lake Michigan-Huron for the
last 166 years (and longer considering paleo data) continue, it is possible to predict future lake levels. In Figure
3.5 and Figure 3.6 we produce just such a prediction, extending several decades into the future, for Lake Erie
and Lake Michigan-Huron, respectively. The figures also show the lower and upper limit of prediction errors
with 95% confidence. If our analysis is correct and provided that climate change does not influence these
cycles (which appear to be predominantly solar influenced), the lake levels in both lakes are entering a low and
declining period that will persist until approximately 2035.
Prediction of Lake Levels on Lakes Michigan-Huron and Erie
Baird Report III
12676.101.R1.RevC Page 14
Figure 3.1: Comparison of predicted and measured monthly-averaged lake levels in Lake Erie for the calibration period (1850-2019).
Solid line, the predicted monthly-averaged lake levels. Grey line with dot, measured monthly-average lake levels. Grey dash line, mean lake
level.
173.0
173.5
174.0
174.5
175.0
175.5
1860 1880 1900 1920 1940 1960 1980 2000
Lake
Lev
el in
Eri
e (m
, IG
LD8
5)
Calendar Year
Measured
Predicted
Mean Lake Level
Prediction of Lake Levels on Lakes Michigan-Huron and Erie
Baird Report III
12676.101.R1.RevC Page 15
Figure 3.2: Comparison of predicted and measured monthly-averaged lake levels in Lake Michigan-Huron for the calibration period (1850-2019).
Solid line, the predicted monthly-averaged lake levels. Grey line with dot, measured monthly-average lake levels. Grey dash line, mean lake
level.
175.5
176.0
176.5
177.0
177.5
178.0
1850 1870 1890 1910 1930 1950 1970 1990 2010
Lake
Lev
el in
MH
(m, I
GLD
85
)
Calendar Year
Measured Predicted Mean Lake Level
Prediction of Lake Levels on Lakes Michigan-Huron and Erie
Baird Report III
12676.101.R1.RevC Page 16
Figure 3.3: Correlation of measured and predicted monthly mean lake levels in Lake Erie.
Blue dot, the positive and negative correlation of prediction against the measurement. Back solid line, the line with no prediction error. Grey
dash line, the lower and upper limit with 95% confidence.
173.0
173.2
173.4
173.6
173.8
174.0
174.2
174.4
174.6
174.8
175.0
173.0 173.2 173.4 173.6 173.8 174.0 174.2 174.4 174.6 174.8 175.0
Pre
dic
ted
Measured
Monthly Averaged Lake Level in Erie (1860-2019)
Prediction of Lake Levels on Lakes Michigan-Huron and Erie
Baird Report III
12676.101.R1.RevC Page 17
Figure 3.4: Correlation of measured and predicted monthly mean lake levels in Lake Michigan-Huron.
Blue dot, the positive and negative correlation of prediction against the measurement. Back solid line, the line with no prediction error. Grey
dash line, the lower and upper limit with 95% confidence.
175.5
175.7
175.9
176.1
176.3
176.5
176.7
176.9
177.1
177.3
177.5
175.5 175.7 175.9 176.1 176.3 176.5 176.7 176.9 177.1 177.3 177.5
Pre
dic
ted
Measured
Monthly Averaged Lake Level in MH (1860-2019)
Prediction of Lake Levels on Lakes Michigan-Huron and Erie
Baird Report III
12676.101.R1.RevC Page 18
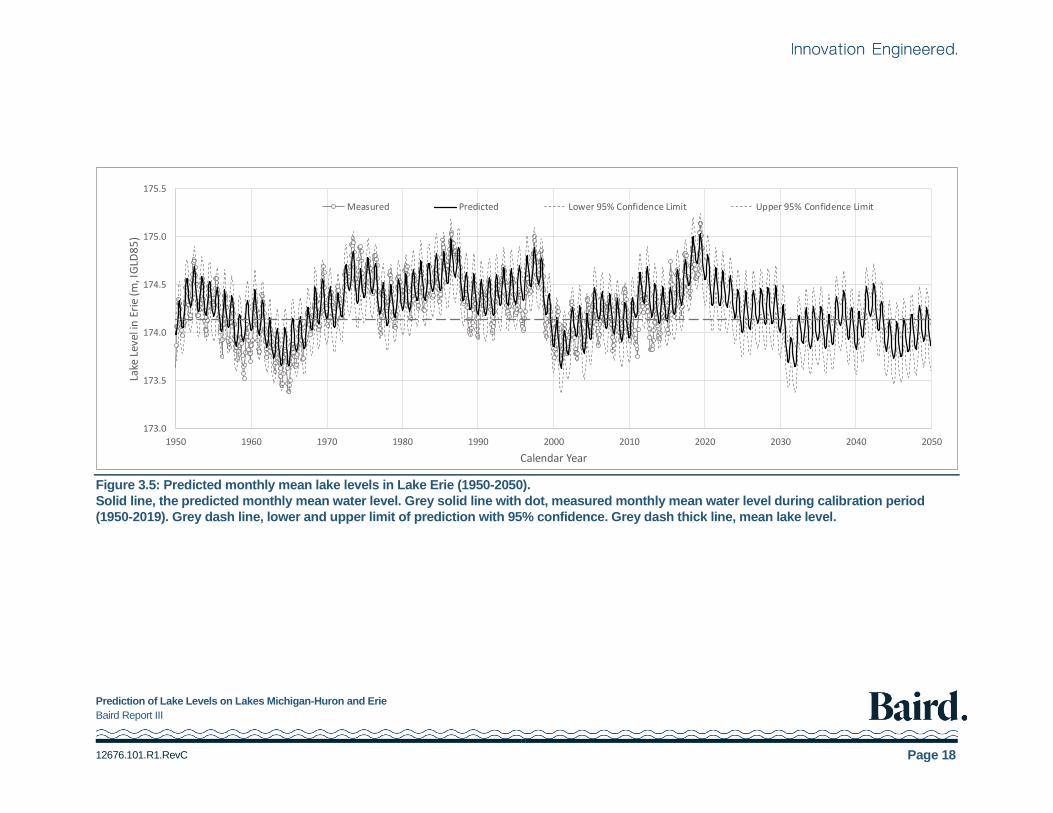
Figure 3.5: Predicted monthly mean lake levels in Lake Erie (1950-2050).
Solid line, the predicted monthly mean water level. Grey solid line with dot, measured monthly mean water level during calibration period
(1950-2019). Grey dash line, lower and upper limit of prediction with 95% confidence. Grey dash thick line, mean lake level.
173.0
173.5
174.0
174.5
175.0
175.5
1950 1960 1970 1980 1990 2000 2010 2020 2030 2040 2050
Lake
Lev
el in
Eri
e (m
, IG
LD8
5)
Calendar Year
Measured Predicted Lower 95% Confidence Limit Upper 95% Confidence Limit
Prediction of Lake Levels on Lakes Michigan-Huron and Erie
Baird Report III
12676.101.R1.RevC Page 19
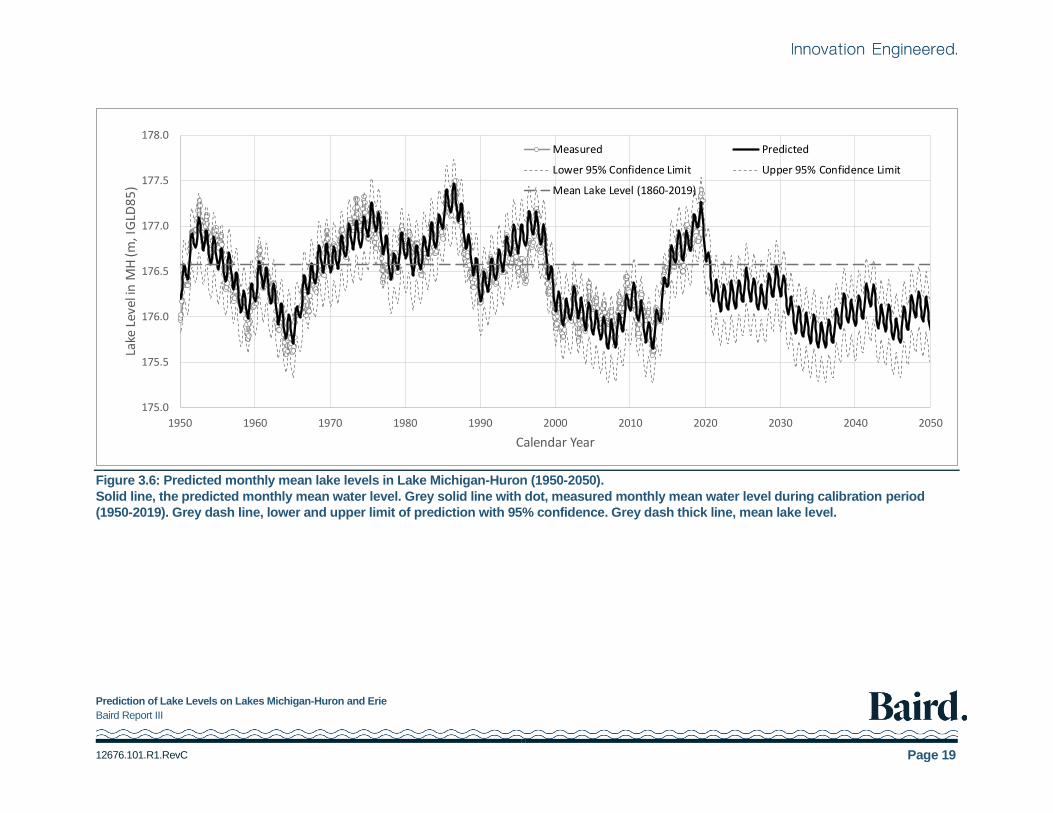
Figure 3.6: Predicted monthly mean lake levels in Lake Michigan-Huron (1950-2050).
Solid line, the predicted monthly mean water level. Grey solid line with dot, measured monthly mean water level during calibration period
(1950-2019). Grey dash line, lower and upper limit of prediction with 95% confidence. Grey dash thick line, mean lake level.
175.0
175.5
176.0
176.5
177.0
177.5
178.0
1950 1960 1970 1980 1990 2000 2010 2020 2030 2040 2050
Lake
Lev
el in
MH
(m, I
GLD
85
)
Calendar Year
Measured Predicted
Lower 95% Confidence Limit Upper 95% Confidence Limit
Mean Lake Level (1860-2019)
Prediction of Lake Levels on Lakes Michigan-Huron and Erie
Baird Report III
12676.101.R1.RevC Page 20
4. Discussion
The ability to predict the fluctuation of the Great Lakes will greatly improve management and planning for
navigation and dredging, commercial shipping and recreational boating, erosion and flooding, power
generation and ecological restoration. The apparent link to climate drivers such as sunspot number and NAO
index cycles suggests that climate trends, at least in terms of integrated influences on evaporation and
precipitation, are predictable, and this has much wider implications to planning and management of many
sectors unrelated to the lakes including the agriculture and insurance sectors.
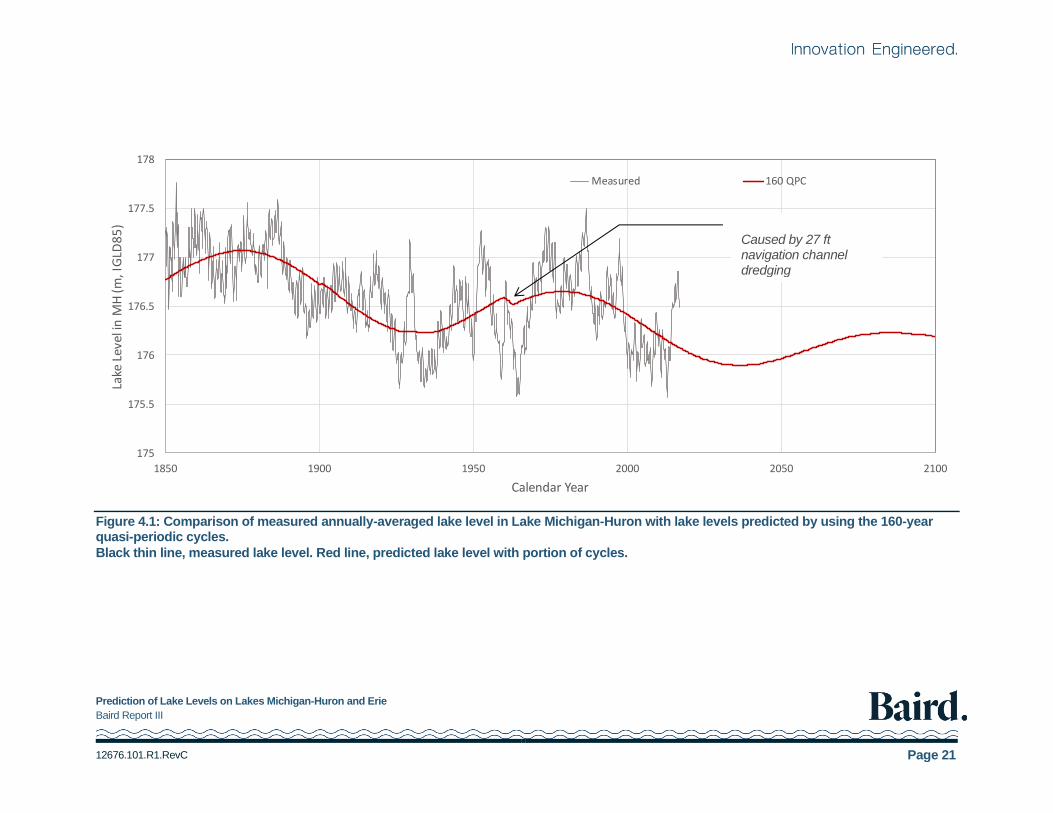
To better understand how these climate drivers influence lake level fluctuation, Figure 4.1 to Figure 4.4 show
the predicted water levels in Lake Michigan-Huron considering selected individual cycles. From these figures,
the low lake level event that occurred in 1935 resulted from a combination of minima associated with the 160-
year, 30-year, 11-year, and 4-year quasi-periodic cycles. The high lake level events that occurred in 1975 and
in 1986 resulted from a combination of the 160-year quasi-periodic cycle peak with the peaks of other quasi-
periodic cycles. Currently, the Great Lakes levels are entering a declining period of the 160-year quasi-periodic
cycles, and are predicted to reach a minimum in approximately 2035. The recent high lake level appears to
result from a combination of the peaks of 30-year precipitation cycles, the 11-year sunspot cycles, and the 4-
year NAO and ENSO cycles. The lake level is expected to be low in the next decade.
It is important to understand the change in prediction errors with forecast horizon. Using the recorded lake
levels from 1850 to 2016, the developed forecast model was run by changing the model training duration, in
which the measured lake levels were used to determine the amplitudes and phases of the cycles, and the
prediction horizon, in which the measured lake levels were used to evaluate the prediction errors. For example,
with the forecast period of 10 years, the model was trained by using the measured lake levels from 1850 to
2006. The model was then used to predict the water level from 2007 to 2016 and the prediction error was
calculated as the mean absolute error (MAE) and the root of mean square error (RMSE). The result is shown
in Figure 4.5. Unlike an operational weather forecast model, the prediction error of this harmonic analysis
approach does not increase significantly with forecast horizon.
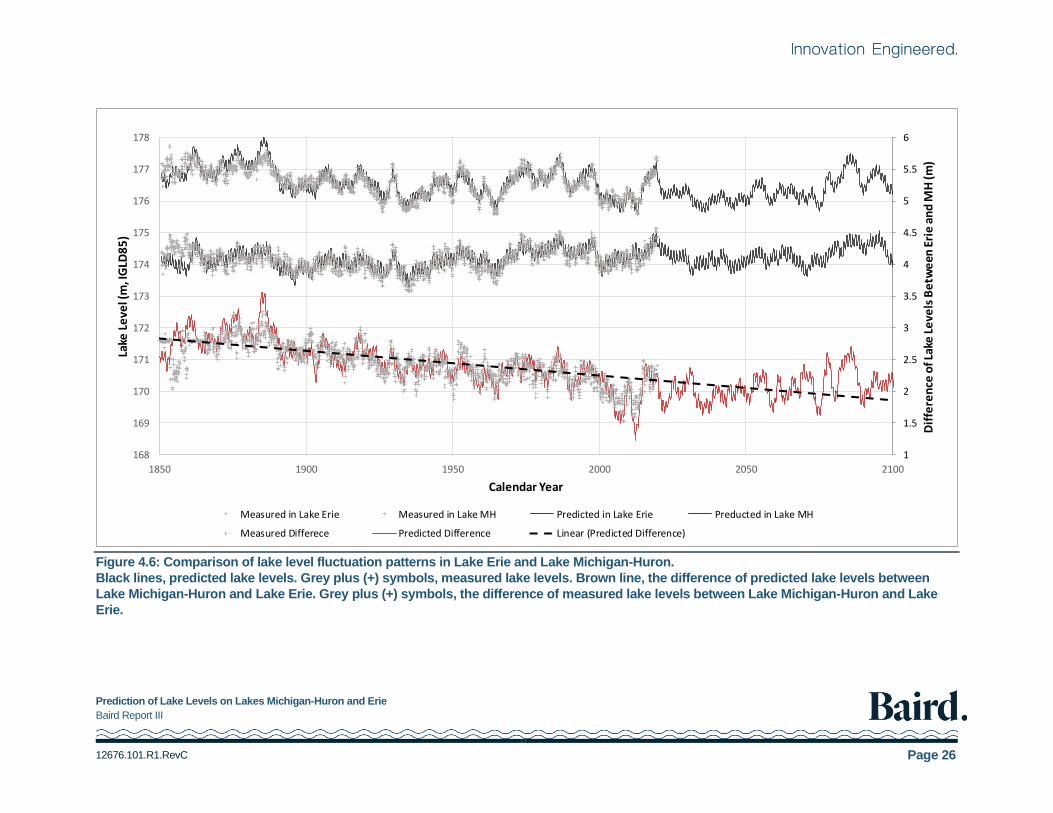
The prediction was further checked to examine the patterns of lake level fluctuation in Lake Erie and Lake
Michigan-Huron. Based on the recorded lake levels in both lakes from 1850 to 2016, the fluctuation of lake
levels in Lake Michigan-Huron features the same patterns as the fluctuations in Lake Erie but the magnitude of
the lake level variation in Lake Michigan-Huron is larger than in Lake Erie. This implies that the water levels in
both lakes were driven by similar climates. Figure 4.6 shows similar patterns of forecast lake level fluctuation
from 2019 to 2050 for the two lake systems.
With harmonic analysis, the maximum period of a cycle that can be detected depends on the length of
recorded lake levels employed in the analysis. The lowest frequency for which amplitude and phase can be
reliably determined from the available time series data for Michigan-Huron and Erie is about 160 years. Lower
frequency or longer period cycles have been derived indirectly from approximate paleo cycle data. The
magnitude and phase for cycles with frequencies larger than 160 years are less reliable. Therefore, this may
result in some inaccuracy in terms of the timing of predicted lake level trends, and caution should be exercised
when using the prediction results.
Prediction of Lake Levels on Lakes Michigan-Huron and Erie
Baird Report III
12676.101.R1.RevC Page 21
Figure 4.1: Comparison of measured annually-averaged lake level in Lake Michigan-Huron with lake levels predicted by using the 160-year quasi-periodic cycles.
Black thin line, measured lake level. Red line, predicted lake level with portion of cycles.
175
175.5
176
176.5
177
177.5
178
1850 1900 1950 2000 2050 2100
Lake
Lev
el in
MH
(m, I
GLD
85
)
Calendar Year
Measured 160 QPC
Caused by 27 ft navigation channel dredging
Prediction of Lake Levels on Lakes Michigan-Huron and Erie
Baird Report III
12676.101.R1.RevC Page 22
Figure 4.2: Comparison of measured annually-averaged lake level in Lake Michigan-Huron with lake levels predicted by using the 160-year quasi-periodic cycles and the 30-year quasi-periodic cycles.
Black thin line, measured lake level. Red and blue lines, predicted lake level with portion of cycles.
175
175.5
176
176.5
177
177.5
178
1850 1900 1950 2000 2050 2100
Lake
Lev
el in
MH
(m, I
GLD
85
)
Calendar Year
Measured 160 QPC + 30QPC 160 QPC
Caused by 27 ft navigation channel dredging
Prediction of Lake Levels on Lakes Michigan-Huron and Erie
Baird Report III
12676.101.R1.RevC Page 23
Figure 4.3: Comparison of measured annually-averaged lake level in Lake Michigan-Huron with lake levels predicted by using the 160-year quasi-periodic cycles, the 30-year quasi-periodic cycles, and the 11-year quasi-periodic cycles.
Black thin line, measured lake level. Red and blue line, predicted lake level with portion of cycles.
175
175.5
176
176.5
177
177.5
178
1850 1900 1950 2000 2050 2100
Lake
Lev
el in
MH
(m, I
GLD
85
)
Calendar Year
Measured 160 QPC + 30 QPC + 11 QPC 160 QPC + 30QPC
Prediction of Lake Levels on Lakes Michigan-Huron and Erie
Baird Report III
12676.101.R1.RevC Page 24
Figure 4.4: Comparison of measured annually-averaged lake level in Lake Michigan-Huron with lake levels predicted by using the 160-year quasi-periodic cycles, the 30-year quasi-periodic cycles, the 11-year quasi-periodic cycles, and the 4-year quasi-periodic cycles.
Black thin line, measured lake level. Red and blue line, predicted lake level with portion of cycles.
175
175.5
176
176.5
177
177.5
178
1850 1900 1950 2000 2050 2100
Lake
Lev
el in
MH
(m, I
GLD
85
)
Calendar Year
Measured 160 QPC + 30 QPC + 11 QPC + 4 QPC 160 QPC + 30 QPC + 11 QPC
Prediction of Lake Levels on Lakes Michigan-Huron and Erie
Baird Report III
12676.101.R1.RevC Page 25
Figure 4.5: Variation of prediction errors with forecasting time.
Grey line with dot, the root of mean square error (RMSE). Orange line with dot, mean absolute error (MAE).
y = 0.00021x + 0.12529
y = 0.00019x + 0.15855
0.100
0.110
0.120
0.130
0.140
0.150
0.160
0.170
0.180
0 10 20 30 40 50 60
MA
E &
RM
SE (
m)
Prediction Time from the End of Training Period (years)
Variation of Prediction Error with Prediction Time
MAE RMSE Linear (MAE) Linear (RMSE)
Prediction of Lake Levels on Lakes Michigan-Huron and Erie
Baird Report III
12676.101.R1.RevC Page 26
Figure 4.6: Comparison of lake level fluctuation patterns in Lake Erie and Lake Michigan-Huron.
Black lines, predicted lake levels. Grey plus (+) symbols, measured lake levels. Brown line, the difference of predicted lake levels between
Lake Michigan-Huron and Lake Erie. Grey plus (+) symbols, the difference of measured lake levels between Lake Michigan-Huron and Lake
Erie.
1
1.5
2
2.5
3
3.5
4
4.5
5
5.5
6
168
169
170
171
172
173
174
175
176
177
178
1850 1900 1950 2000 2050 2100
Dif
fere
nce
of L
ake
Le
vels
Be
twe
en E
rie
an
d M
H (m
)
Lake
Le
vel (
m, I
GLD
85
)
Calendar Year
Measured in Lake Erie Measured in Lake MH Predicted in Lake Erie Preducted in Lake MH
Measured Differece Predicted Difference Linear (Predicted Difference)
Prediction of Lake Levels on Lakes Michigan-Huron and Erie
Baird Report III
12676.101.R1.RevC Page 27
5. References
Baedke, S.J., and Thompson, T.A. 2000. A 4,700-year record of lake level and isostasy for Lake Michigan. J.
Great Lakes Res. 26(4): 416-426.
Baird. 2005. Regime change (man-made intervention) and ongoing erosion in the St. Clair River and impacts
on Lake Michigan-Huron lake levels. Technical Report.
(https://www.watershedcouncil.org/uploads/7/2/5/1/7251350/document_1_-_baird_report.pdf)
Burns, R.E. 2002. In the Atlantic, decadal climate variability, predictability. Sea Technology, May 2002 29-39.
Changnon, S.A. 2004. Temporal Behavior of Levels of the Great Lakes and Climate Variability. J. Great Lakes
Res. 30(1): 184-200.
Cohn, B.P. and Robinson, J.E. 1976. A forecast model for Great Lakes water levels. J. Geology. 84: 455-465
Croley, T.E. 1987. Near real-time forecasting of large lake supplies. J. Water Resources Planning and
Management, American Society of Civil Engineers. 113(6): 810-823.
Damon, P.E., and Sonnett, C.P. 1991, Solar and terrestrial components of the atmospheric 14C variation
spectrum, in Sonnett, C.P., Giampapa, M.S., and Matthews, M.S., eds., The sun in time: Tucson, Ariz., The
University of Arizona Press, p. 360–388.Dawson, G.M. 1874. The fluctuation of the American lakes and the
development of sunspots. Nature, 9:504-506.
Decooke, B.G. 1961. Forecasting Great Lakes levels. J. Great Lake Research. 7:79-84.
Decooke, B.G. and Megeruan E. 1967. Forecasting the levels of the Great Lakes. J. Water Resources
Research. 3(2): 397-403.
Dixey, F. 1924. Lake level in relation to rainfall and sunspots. Nature 114(2,870): 659-660.
Gleissberg, W. 1971. The probable behavior of sunspot cycle 21, Solar Physics 21(1): 240-245.
Hathaway, D.H., Wilson, R.M., and Reichmann, E.J. 1994. The shape of the sunspot cycle. Solar Physics
151(1): 177-190.
Hurrell, J.W., and Van Loon, H. 1997. Decadal variations in climate associated with the North Atlantic
oscillation. Climatic Change 36: 301-326.
International Joint Commission (IJC). 1987. Report on potential measures to alleviate problems created by
current high lake levels, Task 5, St. Clair/Detroit Rivers
International Joint Commission (IJC). 2000. Protection of the waters of the Great Lakes – Final report to the
governments of Canada and the United States, Ottawa, Ontario
Katznelson, Yitzhak, 2004. An introduction to harmonic analysis, Third edition. Cambridge University Press,
ISBN 0-521-83829-0
Kondrashov, D., Feliks, Y., and Ghil, M. 2005. Oscillatory modes of extended Nile River records (A.D. 622–
1922), Geophys. Res. Lett. 32, L10702, doi:10.1029/2004GL022156.
Prediction of Lake Levels on Lakes Michigan-Huron and Erie
Baird Report III
12676.101.R1.RevC Page 28
Liu, P.C. 1970. Statistics of Great Lake Levels, Preceding of the 13th Conference on Great Lakes Research.
360-368
Millerd, F. 2005. The economic impact of the climate change on Canadian commercial navigation on the Great
Lakes, J. Canadian Water Resources. 30(4) : 269-280
NOAA Tides and Currents Data Base. 2017. National Oceanic and Atmosphere Administration, National
Ocean Service: https://tidesandcurrents.noaa.gov/
Ostermeier, G.M., and Wallace, J.M. 2003. Trends in the North Atlantic oscillation-Northern hemisphere
annular model during the twentieth century. J. of Climate 16: 336-341.
Polderman, N.J., and Pryor, S.C. 2004. Linking Synoptic-scale Phenomena to Lake Level Variability in the
Lake Michigan-Huron Basin, J. Great Lakes Res. 30(3): 419-434.
Quinn, F.H., and Sellinger, C.E. 1990. Lake Michigan record levels of 1838, a present perspective, J. Great
Lakes Res. 16(1): 133-138.
Quinn, F.H., and Sellinger, C.E. 2006. A reconstruction of Lake Michigan-Huron water levels derived from tree-
ring chronologies from the period 1600-1961. J. Great Lakes Res. 32:29-39.
Sellinger, C.E., Stow G.A., Lamon E.C., and Qian S.S. 2008. Recent Water Level Declines in the Lake
Michigan-Huron System, J. Environ. Sci. Technol. 42: 367-373
Siscoe, G.L. 1978. Solar-terrestrial influences on weather and climate, Nature, November 1978 276: 348-352.
Tait, B.J. 1983. Conversion of historical Lake Erie water level elevation to the International Great Lakes Datum.
Canadian Hydrographic Service.
The Coordinating Committee on Great Lakes Basic Hydraulic and Hydrologic Data 2001, Apparent Vertical
Movement Over the Great Lakes – Revisited, The Geodetic Survey Division of Natural Resources Canada.
Thompson, T.A., and Baedke, S.J. 1995. Beach-ridge development in Lake Michigan: Shoreline behaviour in
response to quasi-periodic lake-level events. Marine Geology 129: 163-174.
Thompson, T.A., and Baedke, S.J. 1997. Strand-plain evidence for late Holocene lake-level variations in Lake
Michigan. Geological Society of America Bulletin 129: 666-682.
Usokin, I.G. 2017. A history of solar activity over millennia. Living Rev. Sol. Phys. (2017) 14:3.
Walton Jr., T.L. 1989. Simulating Great Lakes water levels for erosion prediction. J. Coastal Research. 5(3):
377-389.
Wilcox, D.A., Thompson, T.A., Booth, R.K., and Nicholas, J.R. 2007. Lake-level variability and water availability
in the Great Lakes. U.S. Geological Survey Circular. 1311: 25p
Yousef, S.M., Amer, M., and Aty, N.A. 2000. The sharp rise of Lake Victoria: A positive indicator to solar Wolf-
Gleissberg cycles turning points. ICEHM-2000, Cairo, Egypt, Sept 2000, 222-234.

Prediction of Lake Levels on Lakes Michigan-Huron and Erie
Baird Report III
12676.101.R1.RevC Page 29
Acknowledgements. The authors wish to acknowledge the fund provided by Georgian Bay Great Lakes
Foundation and the review provided by Dr. Doug Scott.
Author Contributions. Dr. Lu was responsible for the harmonic analysis. Dr. Nairn and Dr. Lu pursued and
developed the concept that harmonic constituents can describe and be used to predict lake level fluctuations,
and that these may be linked to sunspot number and NAO cycles.
Author Information. Correspondence and requests for materials should be addressed to Qimiao Lu
([email protected]) or Robert Nairn ([email protected]).
Prediction of Lake Levels on Lakes Michigan-Huron and Erie
Baird Report III
12676.101.R1.RevC Appendix A
Methods to Filter the Slope
Prediction of Lake Levels on Lakes Michigan-Huron and Erie
Baird Report III
12676.101.R1.RevC Appendix A
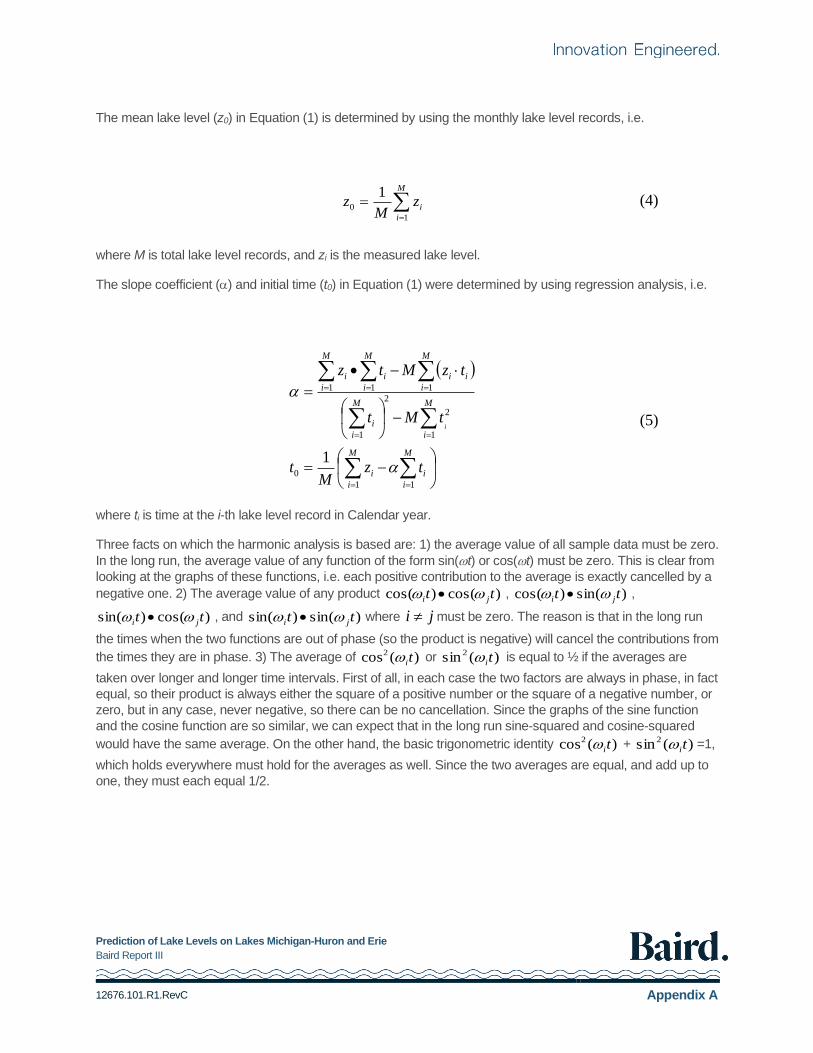
The mean lake level (z0) in Equation (1) is determined by using the monthly lake level records, i.e.
=
=M
i
izM
z1
0
1 (4)
where M is total lake level records, and zi is the measured lake level.
The slope coefficient () and initial time (t0) in Equation (1) were determined by using regression analysis, i.e.
( )
−=
−
−•
=
==
==
===
M
i
i
M
i
i
M
i
M
i
i
M
i
ii
M
i
i
M
i
i
tzM
t
tMt
tzMtz
i
11
0
1
2
2
1
111
1
(5)
where ti is time at the i-th lake level record in Calendar year.
Three facts on which the harmonic analysis is based are: 1) the average value of all sample data must be zero.
In the long run, the average value of any function of the form sin(t) or cos(t) must be zero. This is clear from
looking at the graphs of these functions, i.e. each positive contribution to the average is exactly cancelled by a
negative one. 2) The average value of any product )cos()cos( tt ji • , )sin()cos( tt ji • ,
)cos()sin( tt ji • , and )sin()sin( tt ji • where ji must be zero. The reason is that in the long run
the times when the two functions are out of phase (so the product is negative) will cancel the contributions from
the times they are in phase. 3) The average of )(cos2 ti or )(sin 2 ti is equal to ½ if the averages are
taken over longer and longer time intervals. First of all, in each case the two factors are always in phase, in fact
equal, so their product is always either the square of a positive number or the square of a negative number, or
zero, but in any case, never negative, so there can be no cancellation. Since the graphs of the sine function
and the cosine function are so similar, we can expect that in the long run sine-squared and cosine-squared
would have the same average. On the other hand, the basic trigonometric identity )(cos2 ti + )(sin 2 ti =1,
which holds everywhere must hold for the averages as well. Since the two averages are equal, and add up to
one, they must each equal 1/2.