Report of the Lake Erie Forage Task Group
70
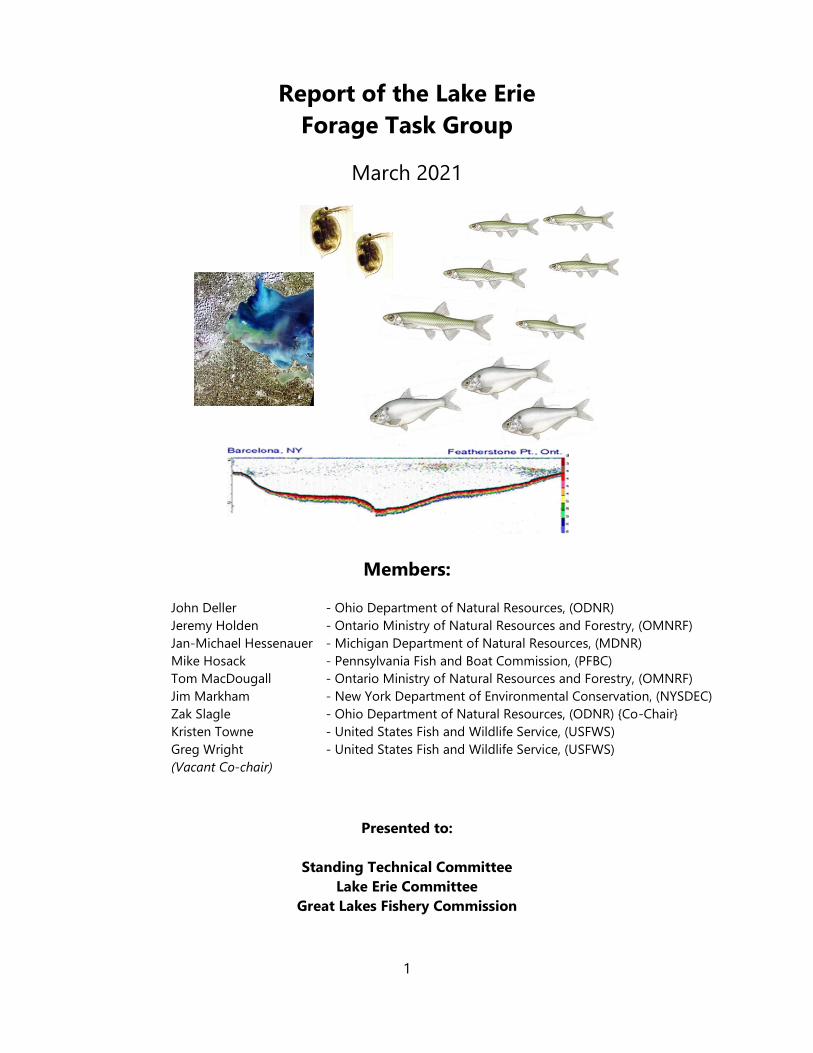
1 Report of the Lake Erie Forage Task Group March 2021 Members: John Deller - Ohio Department of Natural Resources, (ODNR) Jeremy Holden - Ontario Ministry of Natural Resources and Forestry, (OMNRF) Jan-Michael Hessenauer - Michigan Department of Natural Resources, (MDNR) Mike Hosack - Pennsylvania Fish and Boat Commission, (PFBC) Tom MacDougall - Ontario Ministry of Natural Resources and Forestry, (OMNRF) Jim Markham - New York Department of Environmental Conservation, (NYSDEC) Zak Slagle - Ohio Department of Natural Resources, (ODNR) {Co-Chair} Kristen Towne - United States Fish and Wildlife Service, (USFWS) Greg Wright - United States Fish and Wildlife Service, (USFWS) (Vacant Co-chair) Presented to: Standing Technical Committee Lake Erie Committee Great Lakes Fishery Commission
-
Upload
khangminh22 -
Category
Documents
-
view
3 -
download
0
Transcript of Report of the Lake Erie Forage Task Group
1
Report of the Lake Erie
Forage Task Group
March 2021
Members:
John Deller - Ohio Department of Natural Resources, (ODNR)
Jeremy Holden - Ontario Ministry of Natural Resources and Forestry, (OMNRF)
Jan-Michael Hessenauer - Michigan Department of Natural Resources, (MDNR)
Mike Hosack - Pennsylvania Fish and Boat Commission, (PFBC)
Tom MacDougall - Ontario Ministry of Natural Resources and Forestry, (OMNRF)
Jim Markham - New York Department of Environmental Conservation, (NYSDEC)
Zak Slagle - Ohio Department of Natural Resources, (ODNR) {Co-Chair}
Kristen Towne - United States Fish and Wildlife Service, (USFWS)
Greg Wright - United States Fish and Wildlife Service, (USFWS)
(Vacant Co-chair)
Presented to:
Standing Technical Committee
Lake Erie Committee
Great Lakes Fishery Commission
2
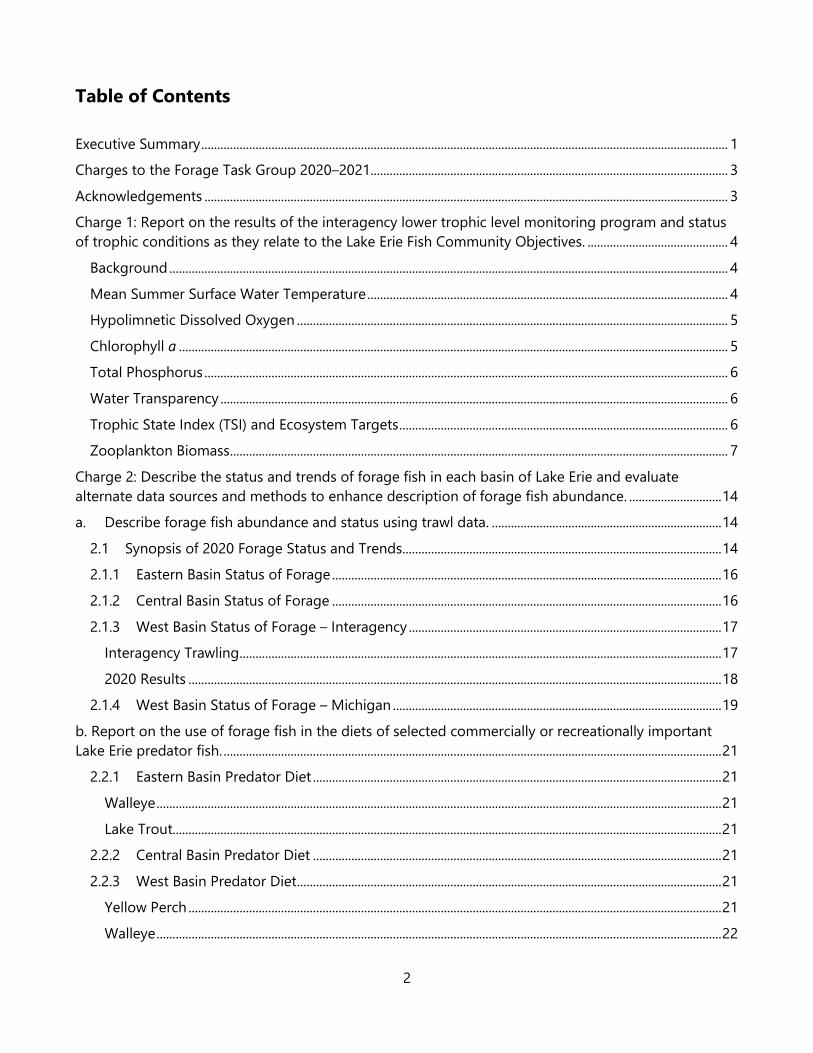
Table of Contents
Executive Summary ..................................................................................................................................................................... 1
Charges to the Forage Task Group 2020–2021................................................................................................................ 3
Acknowledgements .................................................................................................................................................................... 3
Charge 1: Report on the results of the interagency lower trophic level monitoring program and status
of trophic conditions as they relate to the Lake Erie Fish Community Objectives. ............................................ 4
Background ............................................................................................................................................................................... 4
Mean Summer Surface Water Temperature ................................................................................................................. 4
Hypolimnetic Dissolved Oxygen ....................................................................................................................................... 5
Chlorophyll a ............................................................................................................................................................................ 5
Total Phosphorus .................................................................................................................................................................... 6
Water Transparency ............................................................................................................................................................... 6
Trophic State Index (TSI) and Ecosystem Targets ....................................................................................................... 6
Zooplankton Biomass ............................................................................................................................................................ 7
Charge 2: Describe the status and trends of forage fish in each basin of Lake Erie and evaluate
alternate data sources and methods to enhance description of forage fish abundance. ............................. 14
a. Describe forage fish abundance and status using trawl data. ........................................................................ 14
2.1 Synopsis of 2020 Forage Status and Trends .................................................................................................... 14
2.1.1 Eastern Basin Status of Forage .......................................................................................................................... 16
2.1.2 Central Basin Status of Forage .......................................................................................................................... 16
2.1.3 West Basin Status of Forage – Interagency .................................................................................................. 17
Interagency Trawling ....................................................................................................................................................... 17
2020 Results ....................................................................................................................................................................... 18
2.1.4 West Basin Status of Forage – Michigan ....................................................................................................... 19
b. Report on the use of forage fish in the diets of selected commercially or recreationally important
Lake Erie predator fish. ............................................................................................................................................................ 21
2.2.1 Eastern Basin Predator Diet ................................................................................................................................ 21
Walleye ................................................................................................................................................................................. 21
Lake Trout............................................................................................................................................................................ 21
2.2.2 Central Basin Predator Diet ................................................................................................................................ 21
2.2.3 West Basin Predator Diet ..................................................................................................................................... 21
Yellow Perch ....................................................................................................................................................................... 21
Walleye ................................................................................................................................................................................. 22
3
c. Describe growth and condition of selected commercially or recreationally important Lake Erie
predator fish ................................................................................................................................................................................ 23
2.3.1 Eastern Basin Predator Growth ............................................................................................................................. 23
2.3.2 Central Basin Predator Growth .............................................................................................................................. 23
2.3.3 West Basin Predator Growth .................................................................................................................................. 23
Charge 3: Continue hydroacoustic assessment of the pelagic forage fish community in Lake Erie,
incorporating new methods in survey design and analysis, while following the Great Lake Fishery
Commission’s Great Lakes Hydroacoustic Standard Operating Procedures where possible/feasible. ..... 44
3.0 Hydroacoustics Surveys in 2020 ............................................................................................................................... 44
3.1 East Basin Hydroacoustic Survey ............................................................................................................................. 44
Methods ............................................................................................................................................................................... 44
Results .................................................................................................................................................................................. 45
3.2 Central Basin Hydroacoustic Survey ................................................................................................................... 45
Methods ............................................................................................................................................................................... 45
Results .................................................................................................................................................................................. 45
3.3 West Basin Hydroacoustic Survey ....................................................................................................................... 46
Methods ............................................................................................................................................................................... 46
Results .................................................................................................................................................................................. 46
Charge 4: Act as a point of contact for any new/novel invasive aquatic species. ............................................. 51
Protocol for Use of Forage Task Group Data and Reports ........................................................................................ 52
Literature Cited ........................................................................................................................................................................... 53
Appendix 1: List of Species Common and Scientific Names ..................................................................................... 55
Appendix 2. Lake Erie Hydroacoustic Survey Redesign Evaluation ........................................................................ 56
1
Executive Summary
Introduction
The Lake Erie Committee Forage Task Group (FTG) report addresses progress made on four charges:
1. Report on the results of the interagency lower trophic level monitoring program and status of trophic conditions as they
relate to the Lake Erie Fish Community Objectives.
2. Describe the status and trends of forage fish in each basin of Lake Erie and evaluate alternate data sources and methods
to enhance description of forage fish abundance.
a. Describe forage fish abundance and status using trawl data.
b. Report on the use of forage fish in the diets of selected commercially or recreationally important Lake Erie
predator fish.
c. Describe growth and condition of selected commercially or recreationally important Lake Erie predator fish
3. Continue hydro acoustic assessment of the pelagic forage fish community in Lake Erie, incorporating new methods in
survey design and analysis while following the GLFC’s Great Lakes Hydro Acoustic Standard Operating Procedures where
possible/feasible. Support STC review of Hydroacoustics.
4. Act as a point of contact for any new/novel invasive aquatic species.
The complete report is available from the Great Lakes Fishery Commission’s Lake Erie Committee Forage Task Group website
(http://www.glfc.org/lake-erie-committee.php) or upon request from a Lake Erie Committee, STC, or FTG representative.
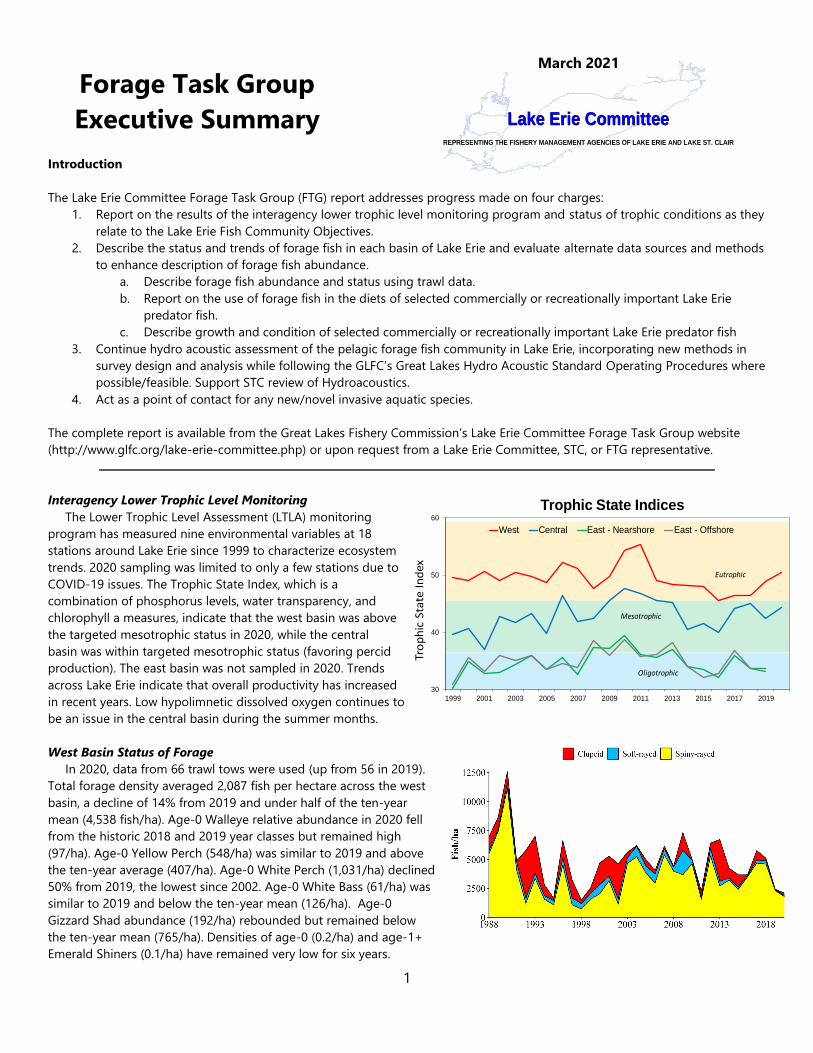
Interagency Lower Trophic Level Monitoring
The Lower Trophic Level Assessment (LTLA) monitoring
program has measured nine environmental variables at 18
stations around Lake Erie since 1999 to characterize ecosystem
trends. 2020 sampling was limited to only a few stations due to
COVID-19 issues. The Trophic State Index, which is a
combination of phosphorus levels, water transparency, and
chlorophyll a measures, indicate that the west basin was above
the targeted mesotrophic status in 2020, while the central
basin was within targeted mesotrophic status (favoring percid
production). The east basin was not sampled in 2020. Trends
across Lake Erie indicate that overall productivity has increased
in recent years. Low hypolimnetic dissolved oxygen continues to
be an issue in the central basin during the summer months.
West Basin Status of Forage
In 2020, data from 66 trawl tows were used (up from 56 in 2019).
Total forage density averaged 2,087 fish per hectare across the west
basin, a decline of 14% from 2019 and under half of the ten-year
mean (4,538 fish/ha). Age-0 Walleye relative abundance in 2020 fell
from the historic 2018 and 2019 year classes but remained high
(97/ha). Age-0 Yellow Perch (548/ha) was similar to 2019 and above
the ten-year average (407/ha). Age-0 White Perch (1,031/ha) declined
50% from 2019, the lowest since 2002. Age-0 White Bass (61/ha) was
similar to 2019 and below the ten-year mean (126/ha). Age-0
Gizzard Shad abundance (192/ha) rebounded but remained below
the ten-year mean (765/ha). Densities of age-0 (0.2/ha) and age-1+
Emerald Shiners (0.1/ha) have remained very low for six years.
Forage Task Group
Executive Summary
2020 Report REPRESENTING THE FISHERY MANAGEMENT AGENCIES OF LAKE ERIE AND LAKE ST. CLAIR
Lake Erie CommitteeLake Erie Committee
March 2021
Trophic State Indices
Tro
ph
ic S
tate
In
dex
30
40
50
60
1999 2001 2003 2005 2007 2009 2011 2013 2015 2017 2019
West Central East - Nearshore East - Offshore
Eutrophic
Mesotrophic
Oligotrophic
2
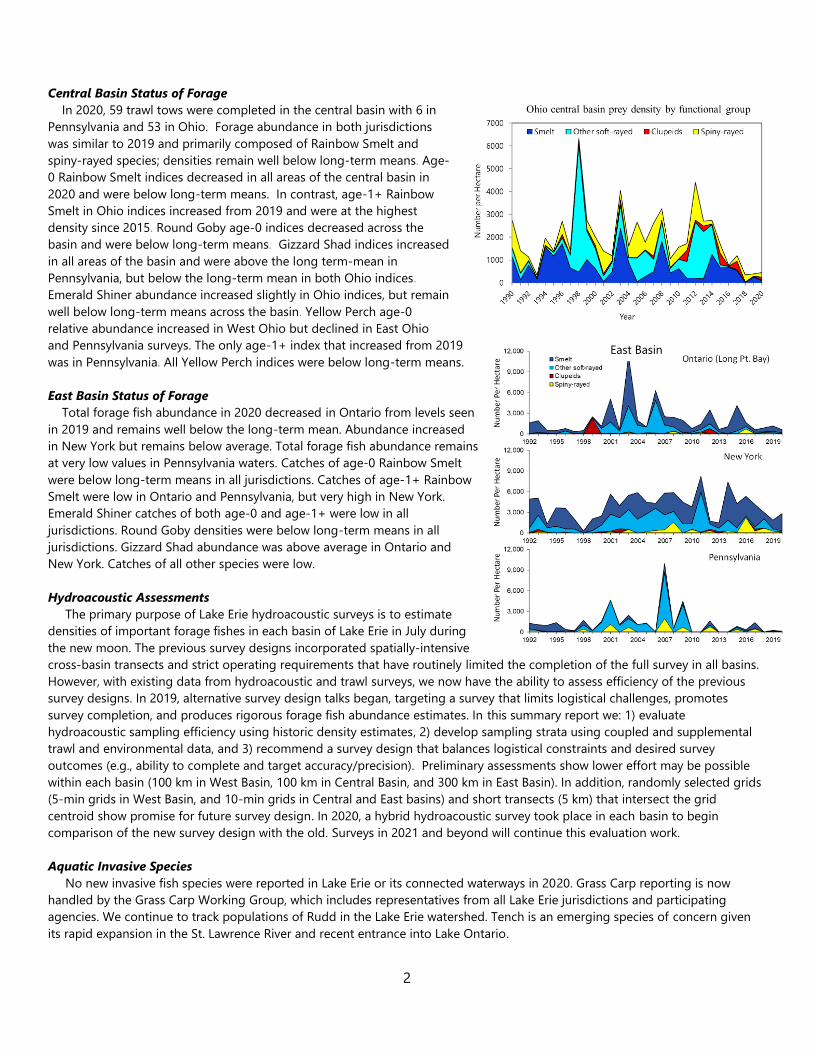
Central Basin Status of Forage
In 2020, 59 trawl tows were completed in the central basin with 6 in
Pennsylvania and 53 in Ohio. Forage abundance in both jurisdictions
was similar to 2019 and primarily composed of Rainbow Smelt and
spiny-rayed species; densities remain well below long-term means. Age-
0 Rainbow Smelt indices decreased in all areas of the central basin in
2020 and were below long-term means. In contrast, age-1+ Rainbow
Smelt in Ohio indices increased from 2019 and were at the highest
density since 2015. Round Goby age-0 indices decreased across the
basin and were below long-term means. Gizzard Shad indices increased
in all areas of the basin and were above the long term-mean in
Pennsylvania, but below the long-term mean in both Ohio indices.
Emerald Shiner abundance increased slightly in Ohio indices, but remain
well below long-term means across the basin. Yellow Perch age-0
relative abundance increased in West Ohio but declined in East Ohio
and Pennsylvania surveys. The only age-1+ index that increased from 2019
was in Pennsylvania. All Yellow Perch indices were below long-term means.
East Basin Status of Forage
Total forage fish abundance in 2020 decreased in Ontario from levels seen
in 2019 and remains well below the long-term mean. Abundance increased
in New York but remains below average. Total forage fish abundance remains
at very low values in Pennsylvania waters. Catches of age-0 Rainbow Smelt
were below long-term means in all jurisdictions. Catches of age-1+ Rainbow
Smelt were low in Ontario and Pennsylvania, but very high in New York.
Emerald Shiner catches of both age-0 and age-1+ were low in all
jurisdictions. Round Goby densities were below long-term means in all
jurisdictions. Gizzard Shad abundance was above average in Ontario and
New York. Catches of all other species were low.
Hydroacoustic Assessments
The primary purpose of Lake Erie hydroacoustic surveys is to estimate
densities of important forage fishes in each basin of Lake Erie in July during
the new moon. The previous survey designs incorporated spatially-intensive
cross-basin transects and strict operating requirements that have routinely limited the completion of the full survey in all basins.
However, with existing data from hydroacoustic and trawl surveys, we now have the ability to assess efficiency of the previous
survey designs. In 2019, alternative survey design talks began, targeting a survey that limits logistical challenges, promotes
survey completion, and produces rigorous forage fish abundance estimates. In this summary report we: 1) evaluate
hydroacoustic sampling efficiency using historic density estimates, 2) develop sampling strata using coupled and supplemental
trawl and environmental data, and 3) recommend a survey design that balances logistical constraints and desired survey
outcomes (e.g., ability to complete and target accuracy/precision). Preliminary assessments show lower effort may be possible
within each basin (100 km in West Basin, 100 km in Central Basin, and 300 km in East Basin). In addition, randomly selected grids
(5-min grids in West Basin, and 10-min grids in Central and East basins) and short transects (5 km) that intersect the grid
centroid show promise for future survey design. In 2020, a hybrid hydroacoustic survey took place in each basin to begin
comparison of the new survey design with the old. Surveys in 2021 and beyond will continue this evaluation work.
Aquatic Invasive Species
No new invasive fish species were reported in Lake Erie or its connected waterways in 2020. Grass Carp reporting is now
handled by the Grass Carp Working Group, which includes representatives from all Lake Erie jurisdictions and participating
agencies. We continue to track populations of Rudd in the Lake Erie watershed. Tench is an emerging species of concern given
its rapid expansion in the St. Lawrence River and recent entrance into Lake Ontario.
East Basin
3
Charges to the Forage Task Group 2020–2021
1. Report on the results of the interagency lower trophic level monitoring program and
status of trophic conditions as they relate to the Lake Erie Fish Community Objectives.
2. Describe the status and trends of forage fish in each basin of Lake Erie and evaluate
alternate data sources and methods to enhance description of forage fish abundance.
a. Describe forage fish abundance and status using trawl data.
b. Report on the use of forage fish in the diets of selected commercially or
recreationally important Lake Erie predator fish.
c. Describe growth and condition of selected commercially or recreationally
important Lake Erie predator fish
3. Continue hydro acoustic assessment of the pelagic forage fish community in Lake Erie,
incorporating new methods in survey design and analysis while following the GLFC’s
Great Lakes Hydro Acoustic Standard Operating Procedures where possible/feasible.
Support STC review of Hydroacoustics.
4. Act as a point of contact for any new/novel invasive aquatic species.
Acknowledgements
The Forage Task Group would like to thank Mark DuFour (ODNR), Matthew Heerschap (OMNRF),
Richard Oldham (USGS-LEBS), Kevin Keretz (USGS-LEBS), and P. Kočovský (USGS-LEBS) for
contributions to multiple sections of this report.
4
Charge 1: Report on the results of the interagency lower trophic level monitoring program
and status of trophic conditions as they relate to the Lake Erie Fish Community Objectives.
(J. Markham)
Background
In 1999, the Forage Task Group (FTG) initiated a Lower Trophic Level Assessment program
(LTLA) within Lake Erie and Lake St. Clair; in recent years, sampling stations have been restricted
to Lake Erie (Figure 1.1). Nine key variables, as identified by a panel of lower trophic level
experts, were chosen to characterize ecosystem change. These variables included profiles of
temperature, dissolved oxygen, light (PAR), water transparency (Secchi disc depth), nutrients
(total phosphorus), chlorophyll a, phytoplankton, zooplankton, and benthos. The protocol calls
for each station to be visited every two weeks from May through September, totaling 12
sampling periods, with benthos collected on two dates, once in the spring and once in the fall.
For this report, we will summarize the last 22 years of data for summer surface temperature,
summer bottom dissolved oxygen, chlorophyll a concentrations, water transparency, total
phosphorus, and zooplankton. Data from all stations were included in the analysis unless noted.
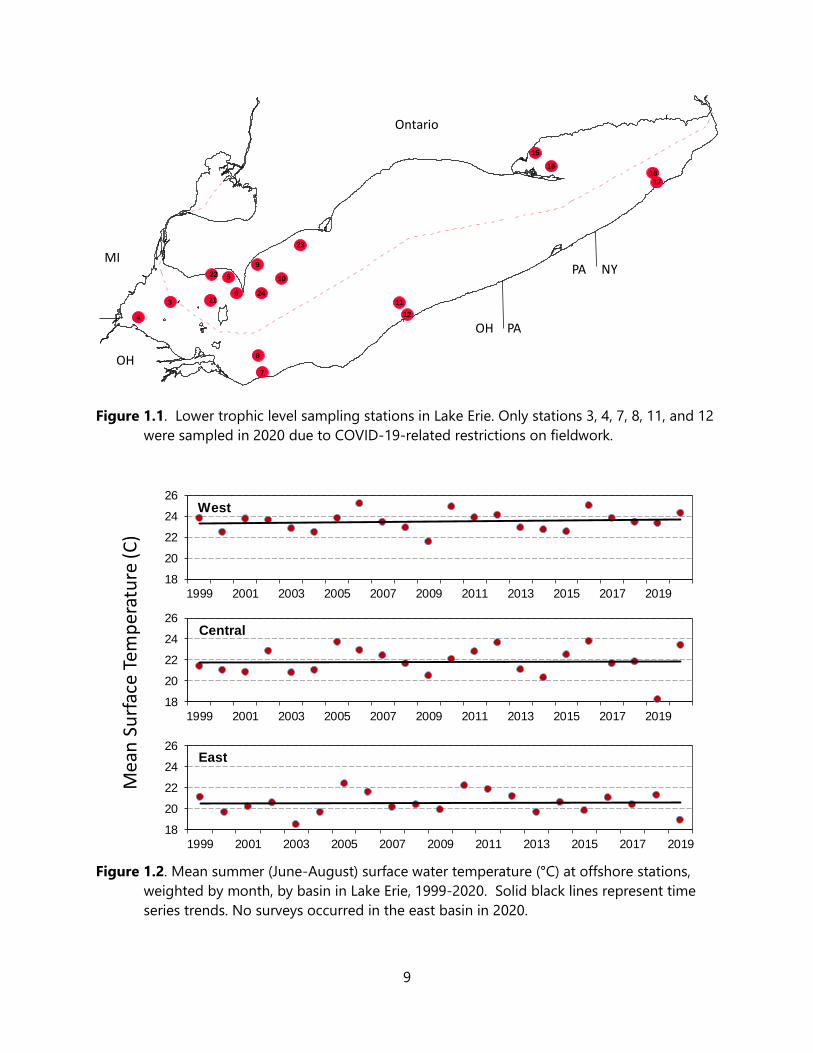
In 2020, only stations 3 and 4 in the west basin, and 7, 8, 11, and 12 in the central basin were
sampled due to COVID-19 associated restrictions to fieldwork (Figure 1.1).
The fish community objectives (FCO) for trophic state in Lake Erie are to maintain
mesotrophic conditions that favor percids in the west, central and nearshore waters of the east
basin, and oligotrophic conditions that favor salmonids in the offshore waters of the east basin
(Ryan et al. 2003). These trophic states are described by ranges of values for total phosphorus,
water transparency, and chlorophyll a (Table 1.1). Mesotrophy is defined by a total phosphorus
range of 9-18 μg/L, a summer (June-August) water transparency (Secchi depth) range of 3-6
meters, and chlorophyll a concentrations between 2.5-5.0 μg/L (Leach et al. 1977). For the
offshore waters of the east basin, the Oligotrophic target is defined as total phosphorus < 9
μg/L; summer water transparency > 6 m, and chlorophyll a concentrations < 2.5 μg/L.
A trophic state index (TSI; Carlson 1977) was used in order to incorporate three independent
variables into a single broader characterization of trophic condition. This index uses algal biomass
as the basis for trophic state classification, which is independently estimated using measures of
chlorophyll a, water transparency, and total phosphorus. Each independent measure is combined
and the average of the three indices reflects a trophic state value for a single sampling event. The
median value of the combined daily indices is used to determine an annual index for each basin.
Because the number generated is only a relative measure of the trophic conditions and does not
define trophic status, this index was calibrated to accepted Lake Erie ranges for values of total
phosphorus, chlorophyll a, and transparency (from Leach et al. 1977) that have long been used to
assess trophic conditions. In this way, oligotrophy was defined as having a TSI < 36.5; mesotrophy
a TSI between 36.5 and 45.5; eutrophy a TSI between 45.5 and 59.2; and hyper-eutrophy a TSI
>59.2.
Mean Summer Surface Water Temperature
Summer surface water temperature is represented by the temperature of the water at 0-1
meters depth during June – August for offshore stations only. This index should provide a good
5
measure of relative system production and growth rate potential for fishes, assuming prey
resources are not limiting. Mean summer surface temperatures across all years are warmest in
the west basin (mean = 23.5 °C), becoming progressively cooler in the central (mean = 21.8 °C)
and east basins (mean = 20.5 °C; Figure 1.2). In 2020, the mean summer surface water
temperature was the same (24.3 °C) in both the west and central basins, and was above average.
No samples were taken at east basin sites in 2020. A slightly increasing trend in summer surface
water temperature is evident in the west basin but no trend is evident in both the central and
east basins for this time series.
Hypolimnetic Dissolved Oxygen
Dissolved oxygen (DO) levels less than 2.0 mg/L are deemed stressful to fish and other
aquatic biota (Craig 2012; Eby and Crowder 2002). Low bottom DO can occur when the water
column becomes stratified, which can begin in early June and continue through September in
the central and east basins. In the west basin, shallow depths allow wind mixing to penetrate to
the bottom, generally preventing thermal stratification. Consequently, there are only a few
summer observations that detect low bottom DO concentrations in the west basin time series
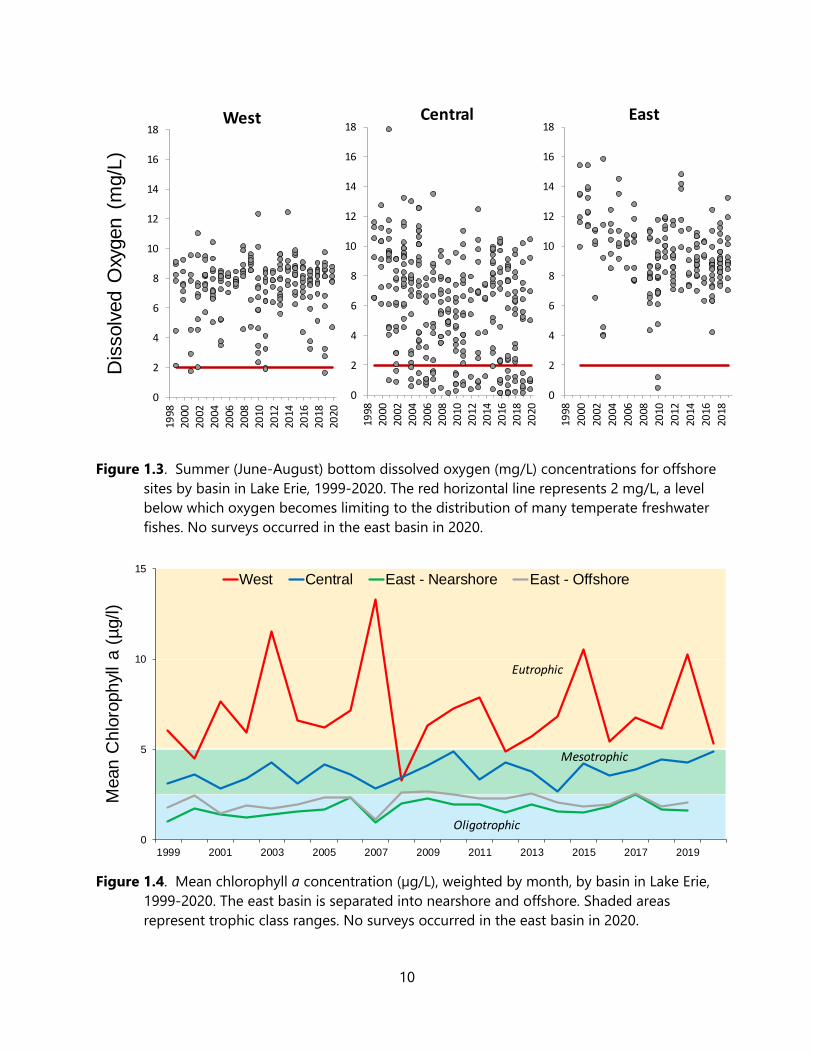
(Figure 1.3). In 2020, there was no observed measurements from the west basin stations of DO
below the 2.0 mg/L threshold.
Low DO is regularly observed in the central basin, where it occurs almost annually at the
offshore stations (8, 10, 11 and 13) and occasionally at inshore stations. Dissolved oxygen of less
than 2.0 mg/L has been observed as early as mid-June and can persist until late September
when fall turnover remixes the water column. In 2020, bottom DO was below the 2.0 mg/L
threshold in the central basin on four occasions (Station 11: 8/12/20 – 0.9 mg/L; Station 8:
7/30/20 – 0.9 mg/L; 8/12/20 – 0.3 mg/L; 8/26/20 – 1.0 mg/L)) (Figure 1.3).
DO is rarely limiting in the east basin offshore due to greater water depths, lower nutrients, a
large hypolimnion and cooler water temperatures. The only observations of DO below the 2.0
mg/L threshold was on 14 July and 13 August, 2010 (Figure 1.3). No measurements were taken
in 2020 in the east basin.
Chlorophyll a
Chlorophyll a concentrations reflects the biomass of the phytoplankton resource, ultimately
representing production at the lowest trophic level. In the west basin, mean chlorophyll a
concentrations have indicated eutrophic conditions for most of the 22 year time series rather
than desired mesotrophic state (Figure 1.4). Annual variability is also highest in the west basin.
In 2020, the mean chlorophyll a concentration was 5.5 µg/L in the west basin, which was slightly
above the targeted mesotrophic range. In the central basin, chlorophyll a concentrations tend to
be less variable annually and fall within the targeted mesotrophic range for the entire time
series; that trend continued in 2020 (4.9 µg/L; Figure 1.4). An increasing trend in annual mean
chlorophyll a is evident in the central basin over the past seven years. In the east basin,
chlorophyll a concentrations in the nearshore waters have been below the targeted mesotrophic
level for the entire time series (Figure 1.4). This may be due to high levels of grazing by
dreissenids (Nicholls and Hopkins 1993) in the nearshore east basin waters where biomass of
quagga mussels (Dreissena bugensis) remains high (Patterson et al. 2005). Recently, low levels at
north shore eastern basin stations could also be linked to low total phosphorus in these waters
6
possibly related to nutrients being converted to attached filamentous algae (Cladophora sp.)
rather than planktonic algae. Conversely, chlorophyll a levels in the offshore waters of the east
basin remain in, or slightly above, the targeted oligotrophic range. No chlorophyll a
measurements were made in the east basin in 2020. However, chlorophyll a concentrations
remain the most stable in the east basin.
Total Phosphorus
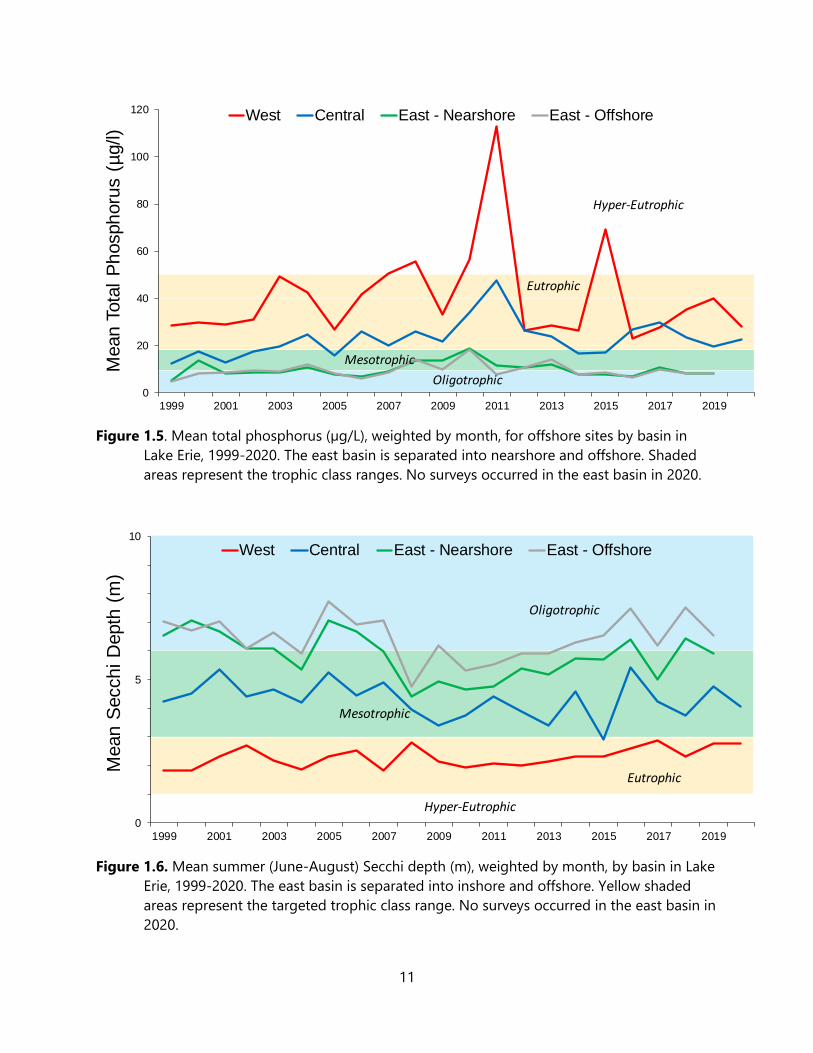
Total phosphorus levels in the west basin have exceeded FCO targets since the beginning of
the LTLA monitoring program and in some years have been in the hyper-eutrophic range (Figure
1.5). In 2020, total phosphorus concentrations in the west basin decreased to 27.8 µg/L but
remain well above targets. In the central basin, total phosphorus levels had exceeded FCO
targets from 2006 through 2013, were borderline mesotrophic/eutrophic in 2014 and 2015, and
then began to increase again in 2016 (Figure 1.5). Total phosphorus measures in the central
basin in 2020 slightly increased to 22.5 µg/L, and now have been above the targeted
mesotrophic target for five consecutive years. In the nearshore waters of the east basin, total
phosphorus levels have remained stable and within or near the targeted mesotrophic range for
the entire time series (Figure 1.5). A gradual increasing trend was evident from 2006 through
2010, but a declining trend has been evident since 2010. Much of this declining trend is driven
by low concentrations along the north shore of the basin. Total phosphorus levels in the
offshore waters of the east basin show a similar trend to nearshore waters, and had risen above
the targeted oligotrophic range from 2008 through 2013 but have declined in more recent
years. No phosphorus measurements were taken in the east basin in 2020.
Water Transparency
Similar to other fish community ecosystem targets (i.e. chlorophyll a, total phosphorus),
water transparency in the west basin has been in the eutrophic range, which is below the FCO
target, for the entire time series (Figure 1.6). Mean summer transparency in the west basin was
2.8 m in 2020, which was similar to 2019 measures and still within the eutrophic range. In
contrast, water transparency in the central basin has remained within the targeted mesotrophic
range for the entire series with the exception of 2015 (2.9 m), which was slightly below the
mesotrophic target range (Figure 1.6). In 2020, water transparency decreased to 4.1 m,
remaining well within the targeted mesotrophic range. In the nearshore water of the east basin,
water transparency was in the oligotrophic range, which is above the FCO targets, from 1999
through 2006, sharply declined, and then steadily increased and generally remaining within the
FCO targets for the next ten years (Figure 1.6). Water transparency has generally hovered
around the cusp of the mesotrophic/oligotrophic range since 2016. In the offshore waters of the
east basin, water transparency was within the oligotrophic target from 1999 through 2007,
decreased into the mesotrophic range in five of the next six years, then increased thereafter. No
measurements of water transparency were taken in the east basin in 2020.
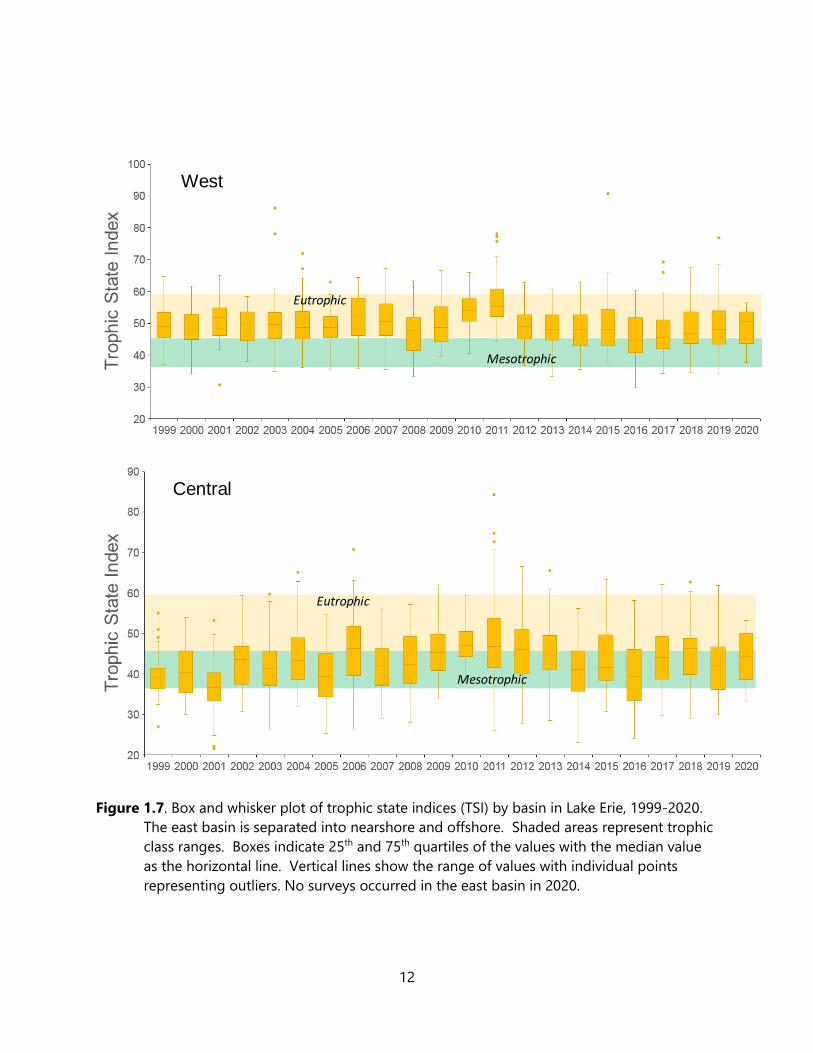
Trophic State Index (TSI) and Ecosystem Targets
A box and whisker plot was used to describe the trophic state index (TSI) for each of the
basins in Lake Erie (Figure 1.7). Median TSI values indicate that the west basin remained in a
eutrophic status from the beginning of the entire time series until 2015, which is more favorable
for a centrarchid (bass, sunfish) fish community. In recent years, overall measures of productivity
7
have declined and are near or within the targeted mesotrophic status, which is more favorable
for percid (Walleye (Sander vitreus) and Yellow Perch (Perca flavescens)) production. In the
central basin, median TSI values have generally remained within the targeted mesotrophic range
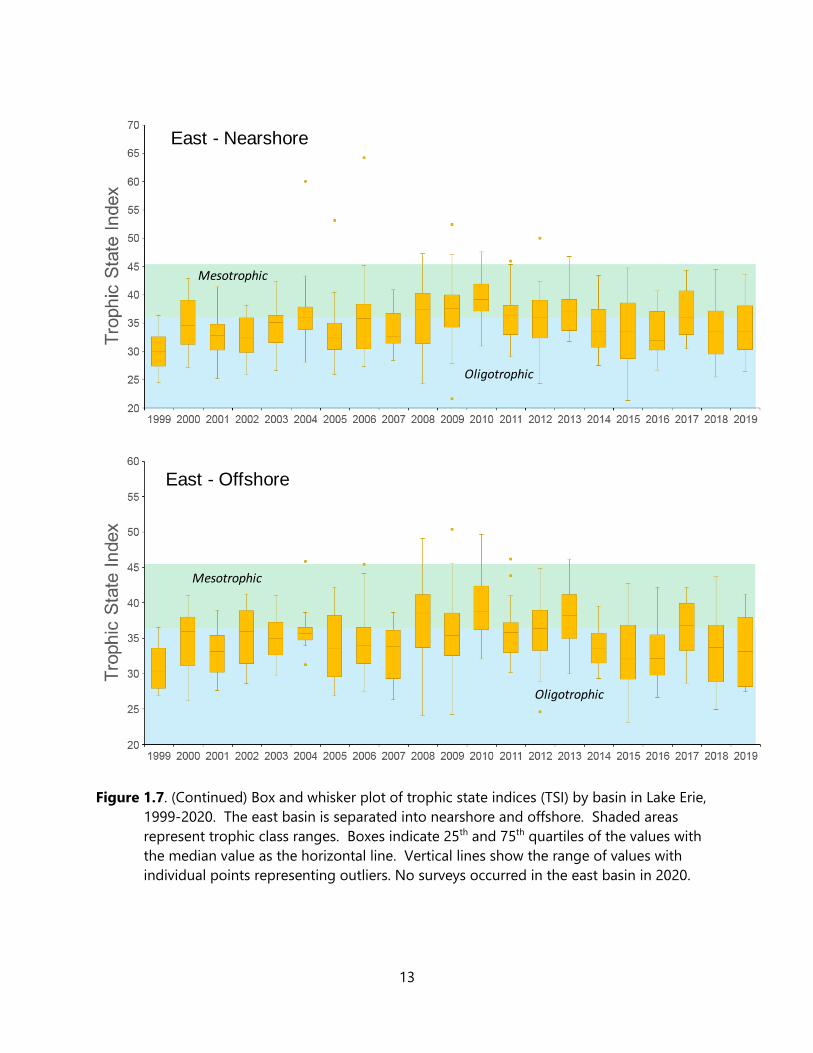
for the entire time series. Trends in the nearshore waters of the east basin indicate median TSI
values and ranges mostly below the targeted mesotrophic range in the early years of the time
series, increasing into the targeted mesotrophic zone in the late-2000s, then decreasing back
into oligotrophic status since 2014. Similar trends are apparent in the offshore waters of the
east basin. The TSI values for 2020 indicate eutrophic status in the west basin (50.5) and
mesotrophic status in the central basin (44.4) (Table 1.2). Trends in trophic status measures
indicate that Lake Erie has decreased in productivity over the past decade but generally remains
in a favorable condition for percid production.
Zooplankton Biomass
Zooplankton samples were only taken at stations 3 and 4 in the west basin and 11 and 12 in
the central basin in 2020. Analysis of this data is not complete and therefore updated
zooplankton biomass is not presented in this report.
8
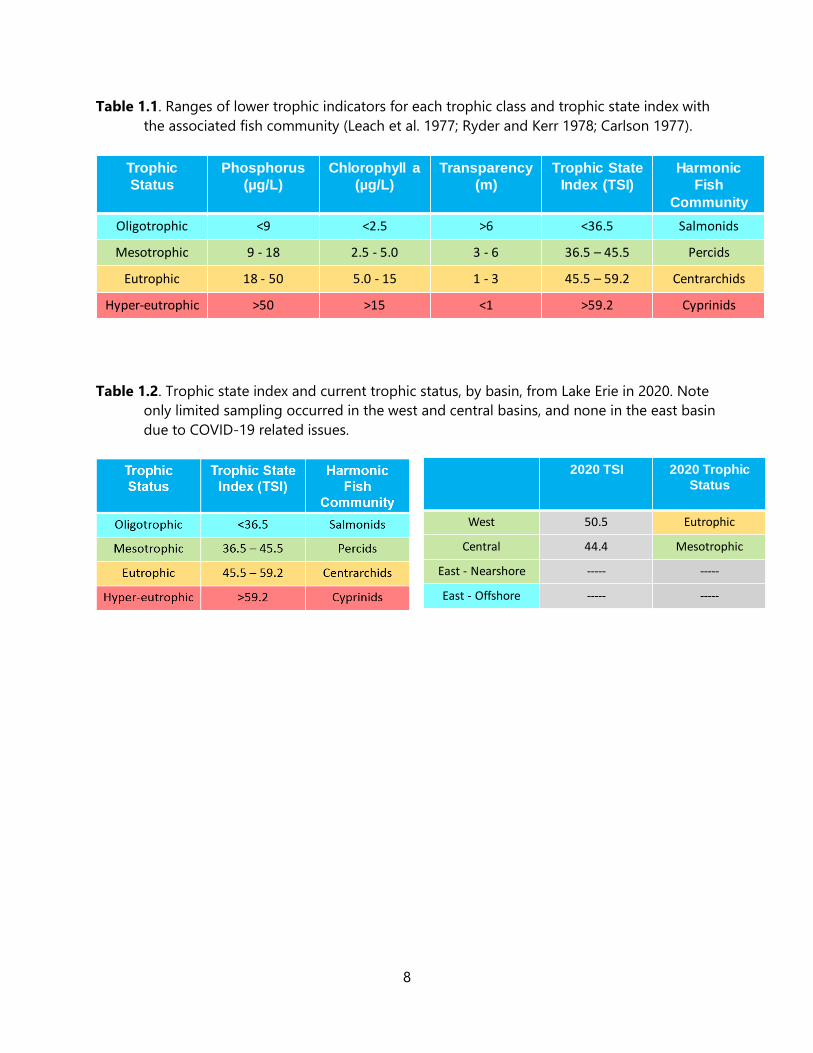
Table 1.1. Ranges of lower trophic indicators for each trophic class and trophic state index with
the associated fish community (Leach et al. 1977; Ryder and Kerr 1978; Carlson 1977).
Table 1.2. Trophic state index and current trophic status, by basin, from Lake Erie in 2020. Note
only limited sampling occurred in the west and central basins, and none in the east basin
due to COVID-19 related issues.
Trophic
Status
Phosphorus
(µg/L)
Chlorophyll a
(µg/L)
Transparency
(m)
Trophic State
Index (TSI)
Harmonic
Fish
Community
Oligotrophic <9 <2.5 >6 <36.5 Salmonids
Mesotrophic 9 - 18 2.5 - 5.0 3 - 6 36.5 – 45.5 Percids
Eutrophic 18 - 50 5.0 - 15 1 - 3 45.5 – 59.2 Centrarchids
Hyper-eutrophic >50 >15 <1 >59.2 Cyprinids
2020 TSI 2020 Trophic
Status
West 50.5 Eutrophic
Central 44.4 Mesotrophic
East - Nearshore ----- -----
East - Offshore ----- -----
9
Figure 1.1. Lower trophic level sampling stations in Lake Erie. Only stations 3, 4, 7, 8, 11, and 12
were sampled in 2020 due to COVID-19-related restrictions on fieldwork.
Figure 1.2. Mean summer (June-August) surface water temperature (°C) at offshore stations,
weighted by month, by basin in Lake Erie, 1999-2020. Solid black lines represent time
series trends. No surveys occurred in the east basin in 2020.
PAOH
PA NYMI
5
6
3
4
9
11
10
8
7
12
15
16
17
18
Ontario
OH
21
22
23
24
18
20
22
24
26
1999 2001 2003 2005 2007 2009 2011 2013 2015 2017 2019
West
Mea
n S
urf
ace
Tem
per
atu
re (
C)
18
20
22
24
26
1999 2001 2003 2005 2007 2009 2011 2013 2015 2017 2019
Central
18
20
22
24
26
1999 2001 2003 2005 2007 2009 2011 2013 2015 2017 2019
East
10
Figure 1.3. Summer (June-August) bottom dissolved oxygen (mg/L) concentrations for offshore
sites by basin in Lake Erie, 1999-2020. The red horizontal line represents 2 mg/L, a level
below which oxygen becomes limiting to the distribution of many temperate freshwater
fishes. No surveys occurred in the east basin in 2020.
Figure 1.4. Mean chlorophyll a concentration (µg/L), weighted by month, by basin in Lake Erie,
1999-2020. The east basin is separated into nearshore and offshore. Shaded areas
represent trophic class ranges. No surveys occurred in the east basin in 2020.
Dis
solv
ed O
xygen
(m
g/L
)
0
2
4
6
8
10
12
14
16
18
1998
2000
2002
2004
2006
2008
2010
2012
2014
2016
2018
2020
West
0
2
4
6
8
10
12
14
16
18
1998
2000
2002
2004
2006
2008
2010
2012
2014
2016
2018
2020
Central
0
2
4
6
8
10
12
14
16
18
1998
2000
2002
2004
2006
2008
2010
2012
2014
2016
2018
EastM
ean
Ch
loro
ph
yll
a (
µg/l)
0
5
10
15
1999 2001 2003 2005 2007 2009 2011 2013 2015 2017 2019
West Central East - Nearshore East - Offshore
Eutrophic
Mesotrophic
Oligotrophic
11
Figure 1.5. Mean total phosphorus (µg/L), weighted by month, for offshore sites by basin in
Lake Erie, 1999-2020. The east basin is separated into nearshore and offshore. Shaded
areas represent the trophic class ranges. No surveys occurred in the east basin in 2020.
Figure 1.6. Mean summer (June-August) Secchi depth (m), weighted by month, by basin in Lake
Erie, 1999-2020. The east basin is separated into inshore and offshore. Yellow shaded
areas represent the targeted trophic class range. No surveys occurred in the east basin in
2020.
Mean
Tota
l P
hosph
oru
s (
µg/l)
Eutrophic
0
20
40
60
80
100
120
1999 2001 2003 2005 2007 2009 2011 2013 2015 2017 2019
West Central East - Nearshore East - Offshore
Mesotrophic
Oligotrophic
Hyper-Eutrophic
Mean
Secch
iD
epth
(m
)
0
5
10
1999 2001 2003 2005 2007 2009 2011 2013 2015 2017 2019
West Central East - Nearshore East - Offshore
Eutrophic
Mesotrophic
Oligotrophic
Hyper-Eutrophic
12
Figure 1.7. Box and whisker plot of trophic state indices (TSI) by basin in Lake Erie, 1999-2020.
The east basin is separated into nearshore and offshore. Shaded areas represent trophic
class ranges. Boxes indicate 25th and 75th quartiles of the values with the median value
as the horizontal line. Vertical lines show the range of values with individual points
representing outliers. No surveys occurred in the east basin in 2020.
West
Eutrophic
Mesotrophic
Central
Eutrophic
Mesotrophic
13
Figure 1.7. (Continued) Box and whisker plot of trophic state indices (TSI) by basin in Lake Erie,
1999-2020. The east basin is separated into nearshore and offshore. Shaded areas
represent trophic class ranges. Boxes indicate 25th and 75th quartiles of the values with
the median value as the horizontal line. Vertical lines show the range of values with
individual points representing outliers. No surveys occurred in the east basin in 2020.
East - Nearshore
Mesotrophic
Oligotrophic
East - Offshore
Mesotrophic
Oligotrophic
14
Charge 2: Describe the status and trends of forage fish in each basin of Lake Erie and
evaluate alternate data sources and methods to enhance description of forage fish
abundance.
a. Describe forage fish abundance and status using trawl data.
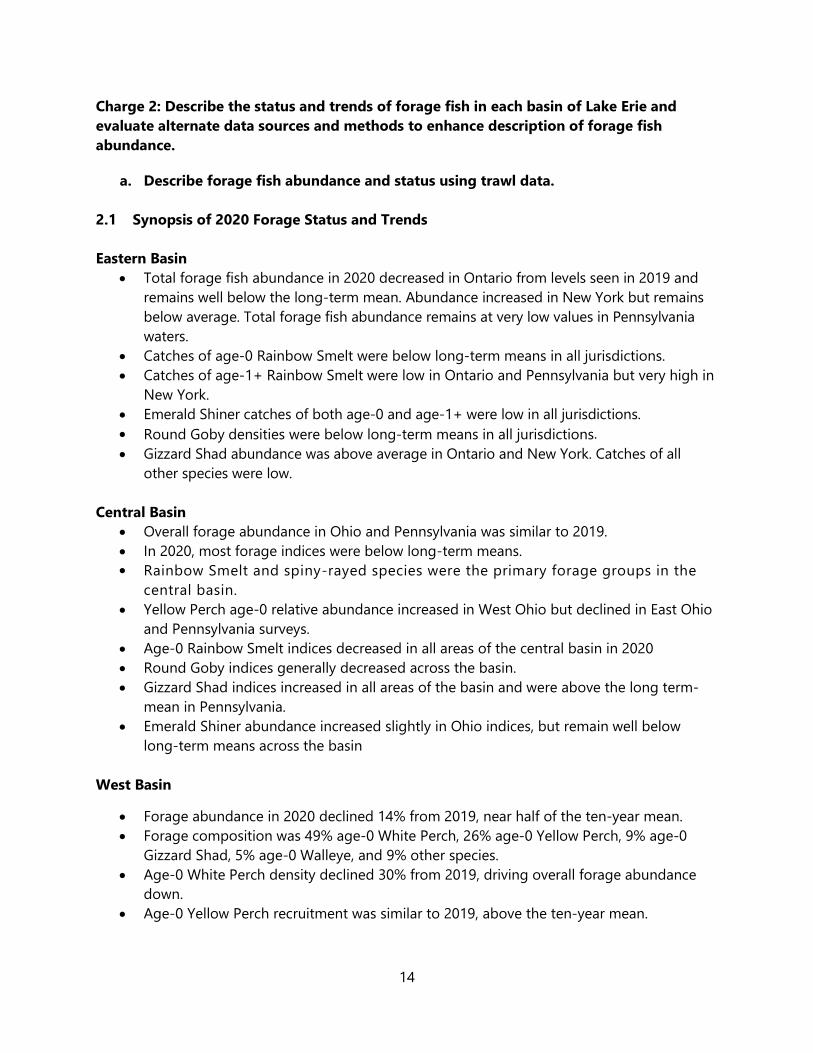
2.1 Synopsis of 2020 Forage Status and Trends
Eastern Basin
• Total forage fish abundance in 2020 decreased in Ontario from levels seen in 2019 and
remains well below the long-term mean. Abundance increased in New York but remains
below average. Total forage fish abundance remains at very low values in Pennsylvania
waters.
• Catches of age-0 Rainbow Smelt were below long-term means in all jurisdictions.
• Catches of age-1+ Rainbow Smelt were low in Ontario and Pennsylvania but very high in
New York.
• Emerald Shiner catches of both age-0 and age-1+ were low in all jurisdictions.
• Round Goby densities were below long-term means in all jurisdictions.
• Gizzard Shad abundance was above average in Ontario and New York. Catches of all
other species were low.
Central Basin
• Overall forage abundance in Ohio and Pennsylvania was similar to 2019.
• In 2020, most forage indices were below long-term means.
• Rainbow Smelt and spiny-rayed species were the primary forage groups in the
central basin.
• Yellow Perch age-0 relative abundance increased in West Ohio but declined in East Ohio
and Pennsylvania surveys.
• Age-0 Rainbow Smelt indices decreased in all areas of the central basin in 2020
• Round Goby indices generally decreased across the basin.
• Gizzard Shad indices increased in all areas of the basin and were above the long term-
mean in Pennsylvania.
• Emerald Shiner abundance increased slightly in Ohio indices, but remain well below
long-term means across the basin
West Basin
• Forage abundance in 2020 declined 14% from 2019, near half of the ten-year mean.
• Forage composition was 49% age-0 White Perch, 26% age-0 Yellow Perch, 9% age-0
Gizzard Shad, 5% age-0 Walleye, and 9% other species.
• Age-0 White Perch density declined 30% from 2019, driving overall forage abundance
down.
• Age-0 Yellow Perch recruitment was similar to 2019, above the ten-year mean.
15
• Age-0 Walleye recruitment declined compared to the historic year classes of 2018-2019
but remained well above average
• White Bass recruitment was below average in 2020.
• Age-0 Gizzard Shad abundance slightly increased from very low levels in 2019.
• Age-0 and age-1+ Emerald Shiner indices continued to be very low in 2020.
• Round Goby abundance was similar to 2019 but remained below average.
• Age-0 Silver Chub abundance was the largest since 1999.
16
2.1.1 Eastern Basin Status of Forage (J. Markham, M. Heerschap [OMNRF], and M. Hosack)
Forage fish abundance and distribution is determined primarily from long-term
bottom trawl assessments conducted by the basin agencies (also see East Basin
Hydroacoustic Survey, Section 3.1). In 2020, a total of 34 trawl tows were sampled across
New York waters, 110 trawl tows in nearshore and offshore Long Point Bay of Ontario, and
2 tows in the east basin waters of Pennsylvania (Figure 2.1.1.1). Gear issues limited
sampling in Pennsylvania in 2020.
In 2020, overall forage fish densities increased in New York waters but remained
low and well below the time series averages in both Ontario and Pennsylvania (Figure
2.1.1.2). Rainbow Smelt is typically the most abundant forage species in most years and
jurisdictions. In 2020, Rainbow Smelt catches were primarily composed of age-0 individuals
in Ontario and Pennsylvania waters; low densities of age-1+ Rainbow Smelt were caught in
these jurisdictions (Table 2.1.1). However, very high densities of age-1+ Rainbow Smelt
were caught in New York waters with below average abundance of age-0 individuals.
Emerald Shiner catches were again low in 2020 in all surveys (Table 2.1.1). Round Goby, an
important species in the east basin forage fish community since it appeared in the late
1990s, peaked in the mid-2000s and have since generally remained at a lower but stable
abundance in all jurisdictions (Table 2.1.1). Round Goby abundance was below average in
all east basin jurisdictions in 2020. Gizzard Shad abundance was above average in both
Ontario and New York, but below average in Pennsylvania waters. Catches of all other
species were low in 2020 (Table 2.1.1).
2.1.2 Central Basin Status of Forage (J. Deller and M. Hosack)
Routine bottom trawl surveys to assess age-0 percid and forage fish abundance and
distributions within the central basin began in Pennsylvania in 1982 and in Ohio in 1990. Trawl
locations in Pennsylvania range from 13 to 24 m in depth and Ohio trawl locations range from 5
to >20 m in depth (Figure 2.1.2.1). Ohio West covers the area from Lorain to Fairport Harbor.
Ohio East covers the area from Fairport Harbor to the Pennsylvania state line. The Pennsylvania
survey covers the area from the Pennsylvania state line to Erie. In 2020, 59 trawl tows were
completed in the central basin with 6 in Pennsylvania and 53 in Ohio. Currently, there are no
annual trawl surveys in Ontario. To address this gap, OMNRF and USGS are collaborating to
develop a new survey. Preliminary trawls were conducted in 2018. Future results from the
OMNRF survey will be included in the Forage Task Group Report.
Forage abundance in Pennsylvania and Ohio was similar to 2019 and was primarily
composed of Rainbow Smelt and spiny-rayed species (Figure 2.1.2.2). The composition of forage
densities in Ohio switched from primarily Rainbow Smelt in 2019 to spiny-rayed species in 2020.
Rainbow Smelt continue to be the primary forage species in Pennsylvania. Forage densities
remain well below long-term means in both Pennsylvania and Ohio.
Relative abundance of Rainbow Smelt, Round Goby, Gizzard Shad and Emerald Shiner,
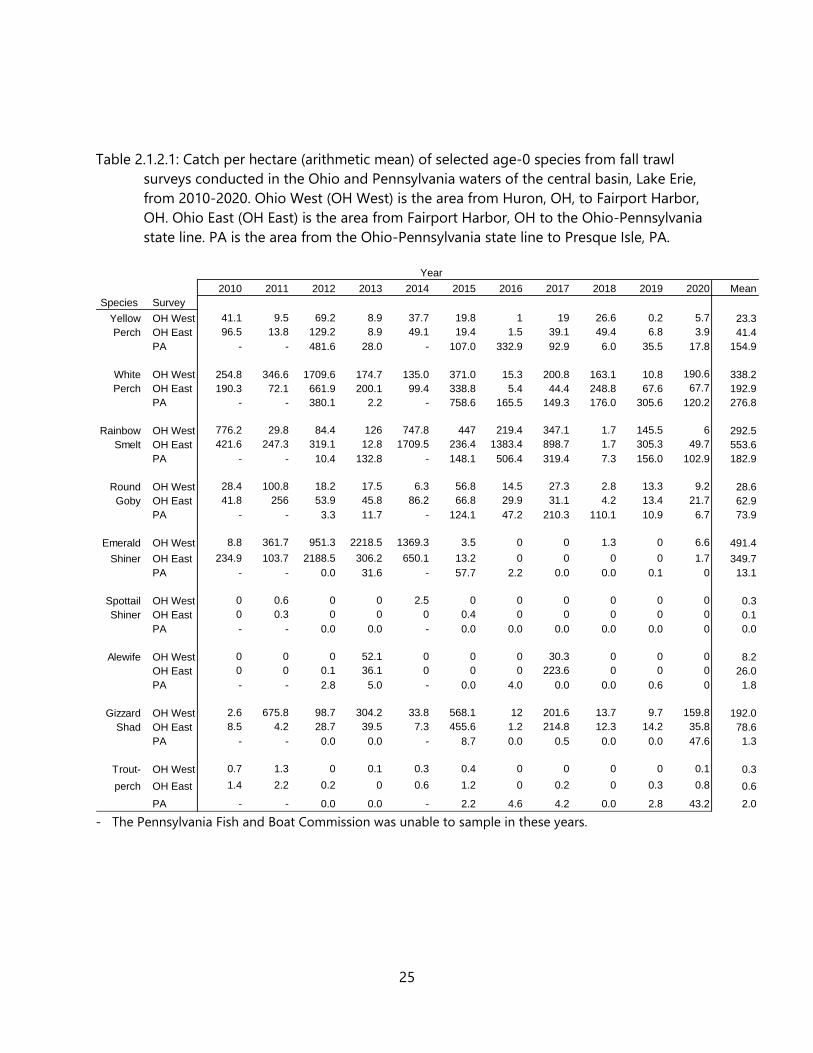
which are the primary forage species, showed mixed results in 2020 (Tables 2.1.2.1 and 2.1.2.2).
Age-0 Rainbow Smelt indices decreased in all areas of the central basin in 2020 and were below
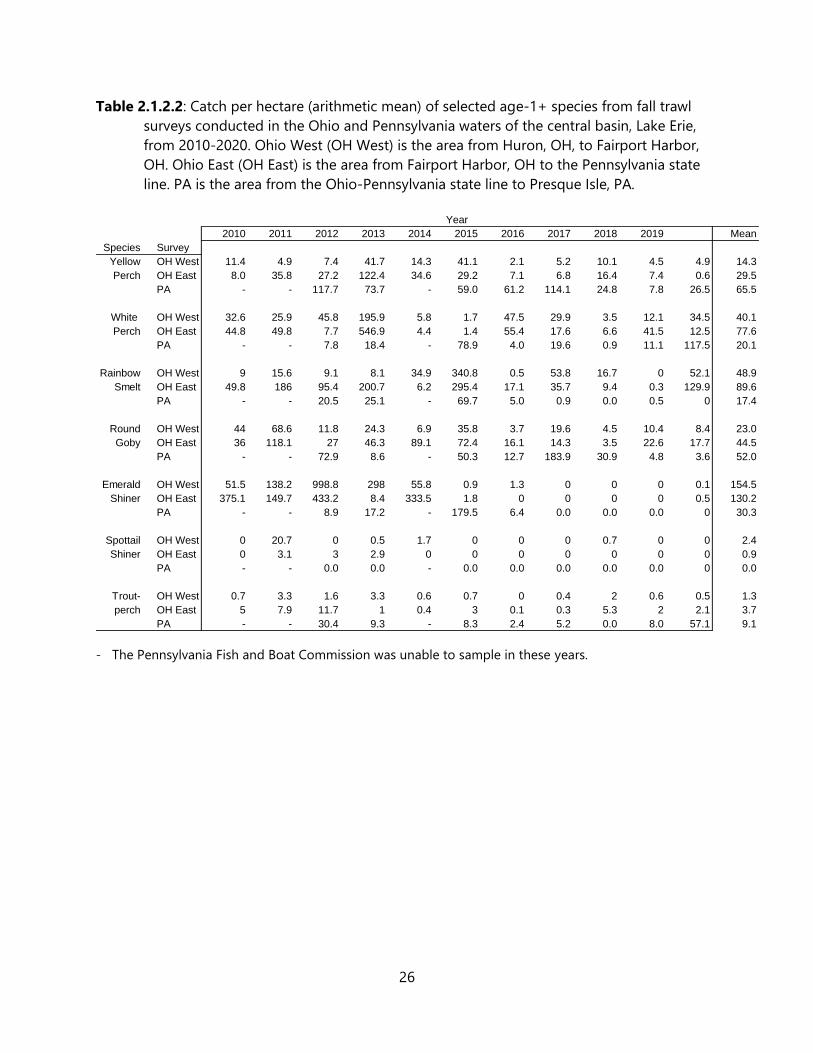
long-term means. Age-1+ Rainbow Smelt indices in Pennsylvania also decreased from 2019 and
17
were below long-term means. In contrast, age-1+ Rainbow Smelt in Ohio indices increased from
2019 and were at the highest density since 2015. Round Goby age-0 indices decreased across
the basin and were below long-term means. Similar trends occurred with age-1+ indices, with
the exception of Ohio East, where abundance increased from 2019. All Round Goby indices
were below long-term means. Age-0 Gizzard Shad indices increased in all areas of the basin and
were above the long term-mean in Pennsylvania, but below the long-term mean in both Ohio
indices. Emerald Shiner indices have been very low across the basin since 2014. In 2020,
Emerald Shiner abundance increased slightly in Ohio indices, but remain well below long-term
means across the basin.
Since 2005, Yellow Perch cohorts in the central basin have tended to be strongest in the
east relative to the west. In 2020, this was not the case as Yellow Perch age-0 relative abundance
increased in West Ohio but declined in East Ohio and Pennsylvania surveys. The only age-1+
index that increased from 2019 was in Pennsylvania; Ohio indices were similar to 2019 or
decreased. All Yellow Perch indices were below long-term means (Tables 2.1.2.1-2).
Trends in White Perch age-0 indices across the central basin were also mixed. Age-0
indices in Ohio West increased from 2019 while Ohio East was similar to 2019 and Pennsylvania
decreased (Table 2.1.2.1). White Perch age-1+ relative abundance was also mixed across the
basin with increases in Ohio West and Pennsylvania indices, while Ohio East decreased from
2019 (Table 2.1.2.2). Pennsylvania age-1+ was the only index that was above long-term means in
2020.
2.1.3 West Basin Status of Forage – Interagency (Z. Slagle and E. Weimer [ODNR])
Interagency Trawling
Interagency trawling has been conducted in Ontario and Ohio waters of the west basin
of Lake Erie in August of each year since 1987, though missing effort data from 1987 has
resulted in the use of data since 1988. The interagency trawling program was developed to
measure basin-wide recruitment of percids but has been expanded to provide basin-wide
community abundance indices. In 1992, the Interagency Index Trawl Group (ITG) recommended
that the Forage Task Group review its interagency trawling program and develop standardized
methods for measuring and reporting basin-wide community indices. Historically, indices from
bottom trawls had been reported as relative abundances, precluding the pooling of data among
agencies. In 1992, in response to the ITG recommendation, the FTG began the standardization
and calibration of trawling procedures among agencies so that the indices could be combined
and quantitatively analyzed across jurisdictional boundaries. SCANMAR was employed by most
Lake Erie agencies in 1992, by OMNRF and ODNR in 1995, and by ODNR alone in 1997 to
calculate actual fishing dimensions of the bottom trawls. In the west basin, net dimensions from
the 1995 SCANMAR exercise are used for the OMNRF vessel, while the 1997 results are applied
to the ODNR vessel. In 2002, ODNR began interagency trawling with the vessel R/V Explorer II
and SCANMAR was again employed to estimate the net dimensions in 2003. In 2003, a trawl
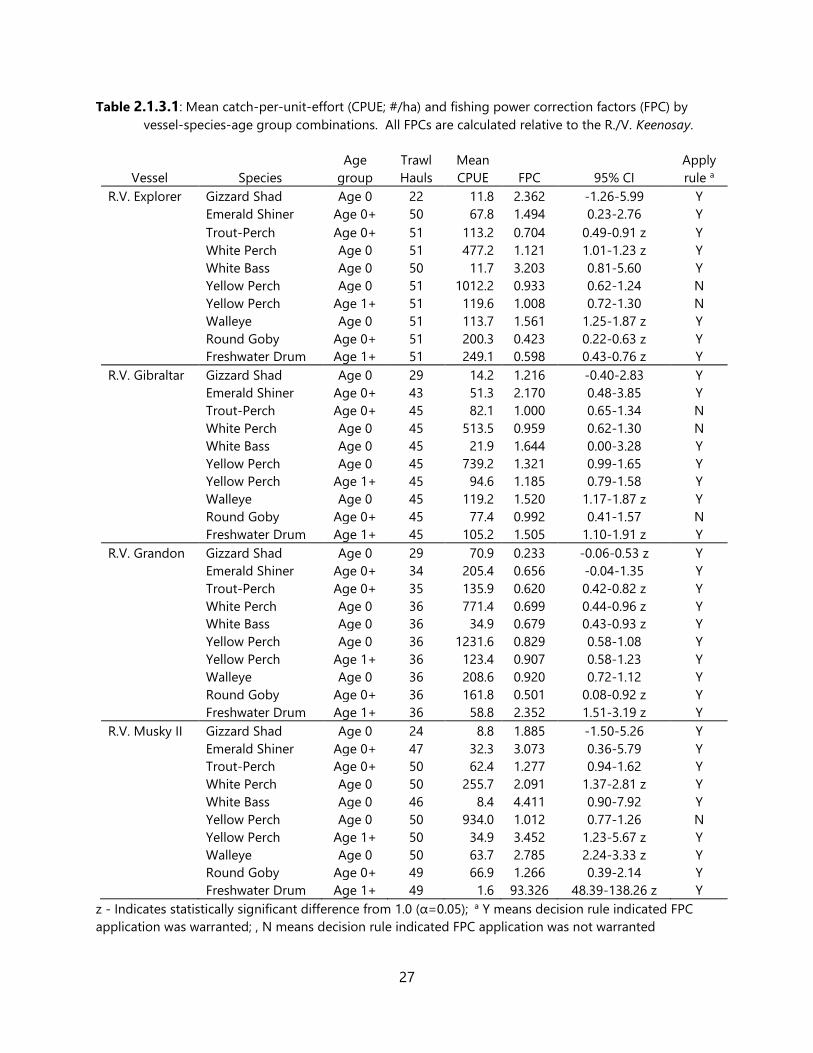
comparison exercise among all west basin research vessels was conducted, and fishing power
correction factors (Table 2.4.1) have been applied to data from the vessels administering the
west basin Interagency Trawling Program ever since (Tyson et al. 2006). Presently, the FTG
18
estimates basin-wide abundance of forage fish in the west basin using information from
SCANMAR trials, trawling effort distance, and catches from the August interagency trawling
program. Species-specific abundance estimates (number per hectare) are combined with length-
weight data to generate a species-specific biomass estimate for each tow. Arithmetic mean
volumetric estimates of abundance and biomass are extrapolated by depth strata (0-6m, >6m)
to the entire west basin to obtain a fishing-power-correction-adjusted absolute estimate of
forage fish abundance and biomass for each species. For reporting purposes, species have been
pooled into three functional groups: clupeids (age-0 Gizzard Shad and Alewife), soft-rayed fish
(Rainbow Smelt, Emerald Shiner, Spottail Shiner, other cyprinids, Silver Chub, Trout-Perch, and
Round Goby), and spiny-rayed fish (age-0 White Perch, White Bass, Yellow Perch, Walleye and
Freshwater Drum).
Hypoxic conditions have been observed during previous years of interagency bottom
trawl assessment in the west basin. Due to concerns about the potential effects of hypoxia on
the distribution of juvenile percids and other species, representatives from task groups, the
Standing Technical Committee, researchers from the Quantitative Fisheries Center at Michigan
State University and Ohio State University (OSU) developed an interim policy for the assignment
of bottom trawl status. Informed by literature (Eby and Crowder 2002; Craig and Crowder 2005)
and field study (ODNR/OSU/USGS) concerning fish avoidance of hypoxic waters, an interim
policy was agreed upon whereby bottom trawls that occurred in waters with dissolved oxygen
less than or equal to 2 mg per liter would be excluded from analyses. The policy has been
applied retroactively from 2009. Currently, there is no consensus among task groups on the best
way to handle this sort of variability in the estimation of year-class strength in Lake Erie. In part,
this situation is hampered by a lack of understanding of how fish distribution changes in
response to low dissolved oxygen. This interim policy will be revisited in the future following an
improved understanding of the relationship between dissolved oxygen and the distribution of
fish species and life stages in Lake Erie (Kraus et al. 2015).
2020 Results
In 2020, hypolimnetic dissolved oxygen levels were below the 2 mg/L threshold (i.e.,
hypoxic) at five sites during the August trawling survey; all hypoxic sites were located either west
of Point Pelee or on the eastern edge of the west basin bordering the central basin. In total, data
from 66 sites were used in 2020, up from 56 in 2019 (Figure 2.1.3.1).
Total forage abundance in 2020 declined 14% from last year and was near half of the
ten-year mean – the lowest forage abundance in the west basin since 1998 (Figure 2.1.3.2; Table
2.4.2). This low abundance is primarily driven by declines in spiny-rayed forage, particularly
White Perch. Spiny-rayed abundance declined 22% from 2019 and was the lowest spiny-rayed
abundance in 10 years. Soft-rayed species increased 15% from a time-series minimum in 2019.
Clupeid abundance also increased from the minimum in the time series, rebounding 403% from
last year. Total forage density averaged 2,087 fish/ha across the west basin, under half of the
ten-year mean (4,791 fish/ha). Clupeid density was 193 fish/ha (ten-year mean 835 fish/ha), soft-
rayed fish density was 101 fish/ha (mean 442 fish/ha), and spiny-rayed fish density was 1,792
fish/ha (mean 3,514 fish/ha). Relative abundance of the dominant species includes: age-0 White
19
Perch (49%), age-0 Yellow Perch (26%), age-0 Gizzard Shad (9%), age-0 Walleye (5%), followed
by age-0 White Bass (3%), age-0 Freshwater Drum (3%) and other fishes (5%).
Recruitment of individual species remains highly variable in the west basin (Table 2.1.3.3).
Age-0 Walleye relative abundance in 2020 was the fourth greatest in the time series (97/ha) but
down from two consecutive record years in 2018 and 2019 (Figure 2.1.3.3). Age-0 Yellow Perch
(548/ha; Figure 2.1.3.4) was similar to 2019 (482/ha) and remained above the ten-year mean
(407/ha) for the third consecutive year. Age-0 White Perch (1,031/ha) declined 30% from 2019
and was the lowest abundance for the species since 2002 (Figure 2.1.3.4). Age-0 White Bass
(61/ha) was below the ten-year mean (126/ha). Densities of all ages of Rainbow Smelt continue
to be minimal in the west basin. Age-0 Gizzard Shad abundance (192/ha) rebounded from a
time-series low in 2019 (38/ha) and continued a trend of high annual variation (Figure 2.1.3.4).
Densities of age-0 (0.2/ha) and age-1+ Emerald Shiners (0.1/ha) were again the lowest in the
time series and have reached minimal abundance for five straight years (Figure 2.1.3.5). Age-1+
Silver Chub relative abundance (9/ha) remained high, well above the ten-year mean (1.9/ha);
age-0 Silver Chub attained their greatest abundance since 1999. Age-0 Sand Shiner abundance
was unusually high at 4/ha (ten-year mean = 1.6/ha).
2.1.4 West Basin Status of Forage – Michigan (J. Hessenauer)
Michigan initiated a trawling program to assess the forage and age-0 sportfish
community in Michigan waters of Lake Erie in August of 2014. This assessment samples eight
two-minute index grids for one five- or ten-minute tow with an otter trawl, typically sampling an
area of approximately 0.2-0.4 ha depending on tow time. The otter trawl has a 10-meter head
rope and 9.5-mm terminal mesh and is deployed with a single warp and 45.7-meter bridle.
Captured fish are passed through a 3.18-cm screen to grade out forage and age-0 sportfish. In
2020 all eight sites (Table 2.1.4.1; Figure 2.1.4.1) were sampled on August 3rd and August 4th,
2020.
The 2020 trawl survey captured 2,273.8 foraged sized individuals/ha trawled, a 14%
increase in total catch compared year over year from 2019. While down 31% from the 2014-
2019 average of 3,328/ha, the 2020 catch represented the third highest catch of our time series
(the mean is still heavily influenced by the massive forage catch of 2018 (>10,000/ha trawled).
As is typical, age-0 White Perch (1194/ha) and age-0 Yellow Perch (675/ha trawled) were the
most abundant species in the catch (Table 2.1.4.1). White Perch were up substantially (207%
compared to 2019, but down 41.9% compared to the 2014-2019 average (2055/ha). Conversely,
Yellow Perch were down 48% compared to 2018, but within one percent of their 2014-2019
mean (671/ha). Signals among shiner species were mixed. No Emerald Shiners were caught in
2020 and Mimic Shiners (2020: 53/ha) were down 63% compared to 2019 and 71% from the
2014-2019 mean. However, Spottail Shiner abundance (2020: 24/ha) was up 128% from last
year and 22% above the 2014-2019 mean. Other notable findings included a large increase in
the catch of Round Goby (126/ha) which is up 409% compared to last year and 133% over the
2014-2019 mean. Additionally, while not typically found in our catch (2014-2019 mean of
1.8/ha), a relatively large catch of age-0 Smallmouth Bass (60/ha) occurred in 2020. Finally, in
2020 we had the highest catch of Silver Chub (22/ha) and captured Channel Darter and Lake

20
Sturgeon for the first time, with the Lake Sturgeon likely the result of recent stocking efforts in
the Lake Erie basin.
The development of this dataset will allow for the evaluation of trends in forage
abundance and the recruitment of sportfishes in Michigan’s Lake Erie waters in future years,
while contributing to a greater understanding of forage dynamics in Lake Erie’s West Basin.
21
b. Report on the use of forage fish in the diets of selected commercially or recreationally
important Lake Erie predator fish.
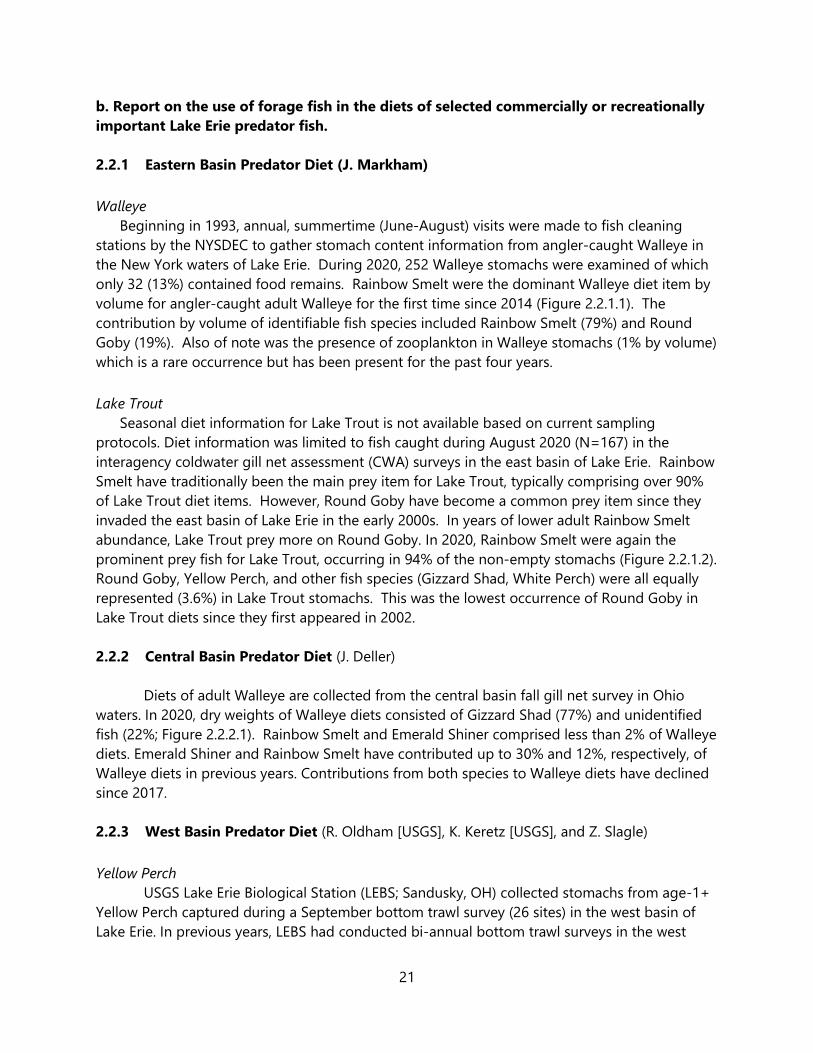
2.2.1 Eastern Basin Predator Diet (J. Markham)
Walleye
Beginning in 1993, annual, summertime (June-August) visits were made to fish cleaning
stations by the NYSDEC to gather stomach content information from angler-caught Walleye in
the New York waters of Lake Erie. During 2020, 252 Walleye stomachs were examined of which
only 32 (13%) contained food remains. Rainbow Smelt were the dominant Walleye diet item by
volume for angler-caught adult Walleye for the first time since 2014 (Figure 2.2.1.1). The
contribution by volume of identifiable fish species included Rainbow Smelt (79%) and Round
Goby (19%). Also of note was the presence of zooplankton in Walleye stomachs (1% by volume)
which is a rare occurrence but has been present for the past four years.
Lake Trout
Seasonal diet information for Lake Trout is not available based on current sampling
protocols. Diet information was limited to fish caught during August 2020 (N=167) in the
interagency coldwater gill net assessment (CWA) surveys in the east basin of Lake Erie. Rainbow
Smelt have traditionally been the main prey item for Lake Trout, typically comprising over 90%
of Lake Trout diet items. However, Round Goby have become a common prey item since they
invaded the east basin of Lake Erie in the early 2000s. In years of lower adult Rainbow Smelt
abundance, Lake Trout prey more on Round Goby. In 2020, Rainbow Smelt were again the
prominent prey fish for Lake Trout, occurring in 94% of the non-empty stomachs (Figure 2.2.1.2).
Round Goby, Yellow Perch, and other fish species (Gizzard Shad, White Perch) were all equally
represented (3.6%) in Lake Trout stomachs. This was the lowest occurrence of Round Goby in
Lake Trout diets since they first appeared in 2002.
2.2.2 Central Basin Predator Diet (J. Deller)
Diets of adult Walleye are collected from the central basin fall gill net survey in Ohio
waters. In 2020, dry weights of Walleye diets consisted of Gizzard Shad (77%) and unidentified
fish (22%; Figure 2.2.2.1). Rainbow Smelt and Emerald Shiner comprised less than 2% of Walleye
diets. Emerald Shiner and Rainbow Smelt have contributed up to 30% and 12%, respectively, of
Walleye diets in previous years. Contributions from both species to Walleye diets have declined
since 2017.
2.2.3 West Basin Predator Diet (R. Oldham [USGS], K. Keretz [USGS], and Z. Slagle)
Yellow Perch
USGS Lake Erie Biological Station (LEBS; Sandusky, OH) collected stomachs from age-1+
Yellow Perch captured during a September bottom trawl survey (26 sites) in the west basin of
Lake Erie. In previous years, LEBS had conducted bi-annual bottom trawl surveys in the west
22
basin (June & September; 41 sites per survey); however, the 2020 pandemic limited sampling to
the fall and to U.S. waters. Captured fishes were dissected in the field immediately after capture.
Stomach contents were placed in Whirl-Pak bags and frozen at -80° C, then transferred to -20° C
after flash freezing. Contents were processed in the lab at LEBS. Prey items were identified to the
lowest taxonomic level by coarse visual inspection (i.e., no effort was made to use taxonomic
keys to identify species of Hexagenia or Chironomidae), dried in a Thermo Scientific Heratherm
drying oven at 60° C until a constant mass was achieved, then weighed to the nearest 0.0001 g.
Thirty-nine Yellow Perch stomachs were collected in September 2020, five of which were empty.
Summaries below are based on stomachs containing food items.
Zooplankton was the most common food item, found in 76% of the Yellow Perch
stomachs, followed by benthic macroinvertebrates (41%), and fish prey (9%; Figure 2.2.3.1).
Zooplankton occurred more frequently in 2020 than in previous years. The most common
zooplankton consumed was Bythotrephes spp., found in 76% of Yellow Perch stomachs, followed
by Daphnia spp. (24%) and Leptodoridae spp. (21%; Figure 2.2.3.2). The most common benthic
macroinvertebrates found in Yellow Perch stomachs were Hexagenia spp. (21%). Both
Gastropoda spp. and Chironomid spp. were the second most common food item found in
stomachs (12% each), followed by Amphipoda and Dreissenidae spp. (9% each). Fish prey were
found in 9% of Yellow Perch stomachs and were too decomposed for taxonomic identification.
Based on percentage of stomach contents by dry weight, zooplankton (43%) and benthic
macroinvertebrates (33%) contributed the most to Yellow Perch diets (Figure 2.2.3.3).
Zooplankton made up a greater proportion of stomach content dry weight than any previous
year. Bythotrephes spp. had the highest percentage of dry weight in Yellow Perch diets (39%),
followed by fish prey (24%), then Gastropoda (18%). The remaining 20% of dry weights were
made up by Hexagenia spp. (7%), Daphnia spp. and Dreissenidae spp. (4% each), Amphipoda
(3%), Chironomid spp. pupae (2%), and Leptodoridae (1%). Lastly, Chironomid spp. larvae made
up less than 1% of the dry weight for Yellow Perch diets. (Figure 2.2.3.4).
Walleye
Diets of adult Walleye are sampled as part of the Michigan trawl and gill net surveys. Due
to a combination of COVID-19 restrictions and poor weather we were unable to complete our
annual gill net survey; therefore, diet summaries here represent a subsample of the typical diet
samples. Fifty-four adult Walleye diets were sampled from August trawls in 2020.
Of 54 sampled diets, only 43% were not empty (Table 2.2.3). Of these gut contents, the
majority (79%) was fish that were unable to be identified. Fish identified in gut contents included
Gizzard Shad (8%) and White Perch (4%).
23
c. Describe growth and condition of selected commercially or recreationally important
Lake Erie predator fish
2.3.1 Eastern Basin Predator Growth (J. Markham)
Walleye length at age-1 and age-2 from netting surveys targeting juveniles in New York had
remained relatively stable for the past decade but has declined for the past four years. In 2020,
age-1 and age-2 Walleye were 1.6 and 1.2 inches below the long-term average length,
respectively; both metrics ranked at or near the lowest observed lengths in the 39-year time
series (Wilkins 2021). In general, age-0 and age-1 Yellow Perch have exhibited stable growth
rates over the past ten years. In 2020, age-0 and age-1 Yellow Perch were both above their time
series averages (0.2 and 0.6 inches, respectively; Markham and Wilkins 2021).
Adult Walleye condition in the New York waters of Lake Erie has generally been trending
down over the past decade. In 2020 the estimated weight of a 20-, 24- and 28-inch harvested
Walleye was 2.6, 4.5 and 7.3 lbs., respectively, compared to long-term averages of 2.7, 4.7 and
7.6 lbs. (Figure 2.3.1.1). Decreasing weight at length may indicate a lack of suitable forage in
recent years, especially Rainbow Smelt, and increasing predator demand.
Adult Lake Trout condition in the New York waters of Lake Erie has generally remained
stable over the past 10 years (Figure 2.3.1.2). A decline in both length and weight at age-5 was
evident in 2019 and consistent with changes in the forage community. However, both metrics
increased in 2020 to values more typically observed in recent years.
2.3.2 Central Basin Predator Growth (J. Deller)
Growth rates of age-0 Walleye declined from 2019 and were below the long-term mean.
Age-0 Walleye growth rates have been below long-term means since 2015. Mean length of age-
0 Walleye was the lowest in the time series, most likely due to density dependent effects: cohort
indices have been above the long-term mean since 2017 in the central basin. Growth rates of
most age-0 forage species in 2020 were at or above long-term means.
2.3.3 West Basin Predator Growth (Z. Slagle)
Overall, mean length of age-0 sport fish in 2020 was similar to 2019 (Figure 2.3.3.1).
Lengths of select age-0 species in 2020 include Walleye (101 mm), Yellow Perch (66 mm), White
Bass (68 mm), and White Perch (64 mm). Walleye average length remained at minimal levels.
White Bass returned to near-average after two years of well above average growth.
24
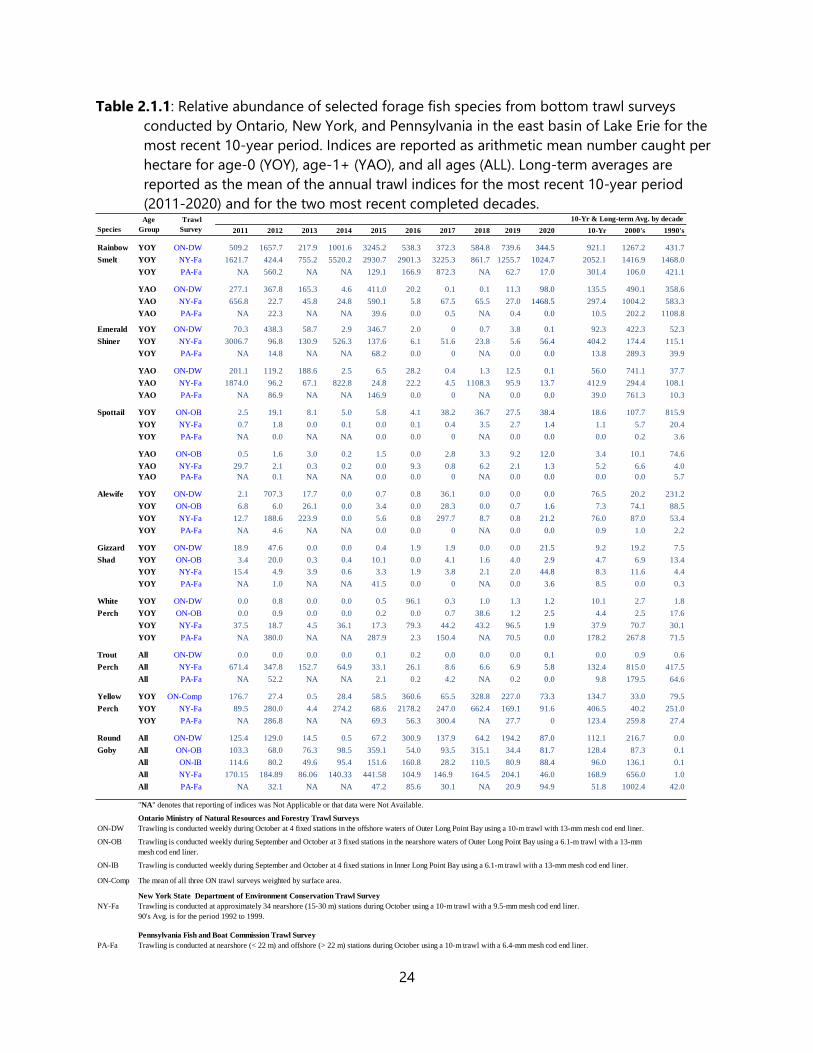
Table 2.1.1: Relative abundance of selected forage fish species from bottom trawl surveys
conducted by Ontario, New York, and Pennsylvania in the east basin of Lake Erie for the
most recent 10-year period. Indices are reported as arithmetic mean number caught per
hectare for age-0 (YOY), age-1+ (YAO), and all ages (ALL). Long-term averages are
reported as the mean of the annual trawl indices for the most recent 10-year period
(2011-2020) and for the two most recent completed decades.
Table 2.2.1 Relative abundance of selected forage fish species in Eastern Lake Erie from bottom trawl surveys conducted by Ontario, New York, and
Pennsylvania for the most recent 10-year period. Indicies are reported as arithmetic mean number caught per hectare for young-of-the-
year (YOY), yearling-and-older (YAO), and all ages (ALL). Long-term averages are reported as the mean of the annual trawl indices for
the most recent 10-year period (2011-2020) and for the two most recent completed decades. Agency trawl surveys are described below.
Age Trawl 10-Yr & Long-term Avg. by decade
Species Group Survey 2011 2012 2013 2014 2015 2016 2017 2018 2019 2020 10-Yr 2000's 1990's
Rainbow YOY ON-DW 509.2 1657.7 217.9 1001.6 3245.2 538.3 372.3 584.8 739.6 344.5 921.1 1267.2 431.7
Smelt YOY NY-Fa 1621.7 424.4 755.2 5520.2 2930.7 2901.3 3225.3 861.7 1255.7 1024.7 2052.1 1416.9 1468.0
YOY PA-Fa NA 560.2 NA NA 129.1 166.9 872.3 NA 62.7 17.0 301.4 106.0 421.1
YAO ON-DW 277.1 367.8 165.3 4.6 411.0 20.2 0.1 0.1 11.3 98.0 135.5 490.1 358.6
YAO NY-Fa 656.8 22.7 45.8 24.8 590.1 5.8 67.5 65.5 27.0 1468.5 297.4 1004.2 583.3
YAO PA-Fa NA 22.3 NA NA 39.6 0.0 0.5 NA 0.4 0.0 10.5 202.2 1108.8
Emerald YOY ON-DW 70.3 438.3 58.7 2.9 346.7 2.0 0 0.7 3.8 0.1 92.3 422.3 52.3
Shiner YOY NY-Fa 3006.7 96.8 130.9 526.3 137.6 6.1 51.6 23.8 5.6 56.4 404.2 174.4 115.1
YOY PA-Fa NA 14.8 NA NA 68.2 0.0 0 NA 0.0 0.0 13.8 289.3 39.9
YAO ON-DW 201.1 119.2 188.6 2.5 6.5 28.2 0.4 1.3 12.5 0.1 56.0 741.1 37.7
YAO NY-Fa 1874.0 96.2 67.1 822.8 24.8 22.2 4.5 1108.3 95.9 13.7 412.9 294.4 108.1
YAO PA-Fa NA 86.9 NA NA 146.9 0.0 0 NA 0.0 0.0 39.0 761.3 10.3
Spottail YOY ON-OB 2.5 19.1 8.1 5.0 5.8 4.1 38.2 36.7 27.5 38.4 18.6 107.7 815.9
YOY NY-Fa 0.7 1.8 0.0 0.1 0.0 0.1 0.4 3.5 2.7 1.4 1.1 5.7 20.4
YOY PA-Fa NA 0.0 NA NA 0.0 0.0 0 NA 0.0 0.0 0.0 0.2 3.6
YAO ON-OB 0.5 1.6 3.0 0.2 1.5 0.0 2.8 3.3 9.2 12.0 3.4 10.1 74.6
YAO NY-Fa 29.7 2.1 0.3 0.2 0.0 9.3 0.8 6.2 2.1 1.3 5.2 6.6 4.0
YAO PA-Fa NA 0.1 NA NA 0.0 0.0 0 NA 0.0 0.0 0.0 0.0 5.7
Alewife YOY ON-DW 2.1 707.3 17.7 0.0 0.7 0.8 36.1 0.0 0.0 0.0 76.5 20.2 231.2
YOY ON-OB 6.8 6.0 26.1 0.0 3.4 0.0 28.3 0.0 0.7 1.6 7.3 74.1 88.5
YOY NY-Fa 12.7 188.6 223.9 0.0 5.6 0.8 297.7 8.7 0.8 21.2 76.0 87.0 53.4
YOY PA-Fa NA 4.6 NA NA 0.0 0.0 0 NA 0.0 0.0 0.9 1.0 2.2
Gizzard YOY ON-DW 18.9 47.6 0.0 0.0 0.4 1.9 1.9 0.0 0.0 21.5 9.2 19.2 7.5
Shad YOY ON-OB 3.4 20.0 0.3 0.4 10.1 0.0 4.1 1.6 4.0 2.9 4.7 6.9 13.4
YOY NY-Fa 15.4 4.9 3.9 0.6 3.3 1.9 3.8 2.1 2.0 44.8 8.3 11.6 4.4
YOY PA-Fa NA 1.0 NA NA 41.5 0.0 0 NA 0.0 3.6 8.5 0.0 0.3
White YOY ON-DW 0.0 0.8 0.0 0.0 0.5 96.1 0.3 1.0 1.3 1.2 10.1 2.7 1.8
Perch YOY ON-OB 0.0 0.9 0.0 0.0 0.2 0.0 0.7 38.6 1.2 2.5 4.4 2.5 17.6
YOY NY-Fa 37.5 18.7 4.5 36.1 17.3 79.3 44.2 43.2 96.5 1.9 37.9 70.7 30.1
YOY PA-Fa NA 380.0 NA NA 287.9 2.3 150.4 NA 70.5 0.0 178.2 267.8 71.5
Trout All ON-DW 0.0 0.0 0.0 0.0 0.1 0.2 0.0 0.0 0.0 0.1 0.0 0.9 0.6
Perch All NY-Fa 671.4 347.8 152.7 64.9 33.1 26.1 8.6 6.6 6.9 5.8 132.4 815.0 417.5
All PA-Fa NA 52.2 NA NA 2.1 0.2 4.2 NA 0.2 0.0 9.8 179.5 64.6
Yellow YOY ON-Comp 176.7 27.4 0.5 28.4 58.5 360.6 65.5 328.8 227.0 73.3 134.7 33.0 79.5
Perch YOY NY-Fa 89.5 280.0 4.4 274.2 68.6 2178.2 247.0 662.4 169.1 91.6 406.5 40.2 251.0
YOY PA-Fa NA 286.8 NA NA 69.3 56.3 300.4 NA 27.7 0 123.4 259.8 27.4
Round All ON-DW 125.4 129.0 14.5 0.5 67.2 300.9 137.9 64.2 194.2 87.0 112.1 216.7 0.0
Goby All ON-OB 103.3 68.0 76.3 98.5 359.1 54.0 93.5 315.1 34.4 81.7 128.4 87.3 0.1
All ON-IB 114.6 80.2 49.6 95.4 151.6 160.8 28.2 110.5 80.9 88.4 96.0 136.1 0.1
All NY-Fa 170.15 184.89 86.06 140.33 441.58 104.9 146.9 164.5 204.1 46.0 168.9 656.0 1.0
All PA-Fa NA 32.1 NA NA 47.2 85.6 30.1 NA 20.9 94.9 51.8 1002.4 42.0
"NA" denotes that reporting of indices was Not Applicable or that data were Not Available.
Ontario Ministry of Natural Resources and Forestry Trawl Surveys
ON-DW Trawling is conducted weekly during October at 4 fixed stations in the offshore waters of Outer Long Point Bay using a 10-m trawl with 13-mm mesh cod end liner.
ON-OB Trawling is conducted weekly during September and October at 3 fixed stations in the nearshore waters of Outer Long Point Bay using a 6.1-m trawl with a 13-mm
mesh cod end liner.
ON-IB Trawling is conducted weekly during September and October at 4 fixed stations in Inner Long Point Bay using a 6.1-m trawl with a 13-mm mesh cod end liner.
ON-Comp The mean of all three ON trawl surveys weighted by surface area.
New York State Department of Environment Conservation Trawl Survey
NY-Fa Trawling is conducted at approximately 34 nearshore (15-30 m) stations during October using a 10-m trawl with a 9.5-mm mesh cod end liner.
90's Avg. is for the period 1992 to 1999.
Pennsylvania Fish and Boat Commission Trawl Survey
PA-Fa Trawling is conducted at nearshore (< 22 m) and offshore (> 22 m) stations during October using a 10-m trawl with a 6.4-mm mesh cod end liner.
25
Table 2.1.2.1: Catch per hectare (arithmetic mean) of selected age-0 species from fall trawl
surveys conducted in the Ohio and Pennsylvania waters of the central basin, Lake Erie,
from 2010-2020. Ohio West (OH West) is the area from Huron, OH, to Fairport Harbor,
OH. Ohio East (OH East) is the area from Fairport Harbor, OH to the Ohio-Pennsylvania
state line. PA is the area from the Ohio-Pennsylvania state line to Presque Isle, PA.
- The Pennsylvania Fish and Boat Commission was unable to sample in these years.
2010 2011 2012 2013 2014 2015 2016 2017 2018 2019 2020 Mean
Species Survey
Yellow OH West 41.1 9.5 69.2 8.9 37.7 19.8 1 19 26.6 0.2 5.7 23.3
Perch OH East 96.5 13.8 129.2 8.9 49.1 19.4 1.5 39.1 49.4 6.8 3.9 41.4
PA - - 481.6 28.0 - 107.0 332.9 92.9 6.0 35.5 17.8 154.9
White OH West 254.8 346.6 1709.6 174.7 135.0 371.0 15.3 200.8 163.1 10.8 190.6 338.2
Perch OH East 190.3 72.1 661.9 200.1 99.4 338.8 5.4 44.4 248.8 67.6 67.7 192.9
PA - - 380.1 2.2 - 758.6 165.5 149.3 176.0 305.6 120.2 276.8
Rainbow OH West 776.2 29.8 84.4 126 747.8 447 219.4 347.1 1.7 145.5 6 292.5
Smelt OH East 421.6 247.3 319.1 12.8 1709.5 236.4 1383.4 898.7 1.7 305.3 49.7 553.6
PA - - 10.4 132.8 - 148.1 506.4 319.4 7.3 156.0 102.9 182.9
Round OH West 28.4 100.8 18.2 17.5 6.3 56.8 14.5 27.3 2.8 13.3 9.2 28.6
Goby OH East 41.8 256 53.9 45.8 86.2 66.8 29.9 31.1 4.2 13.4 21.7 62.9
PA - - 3.3 11.7 - 124.1 47.2 210.3 110.1 10.9 6.7 73.9
Emerald OH West 8.8 361.7 951.3 2218.5 1369.3 3.5 0 0 1.3 0 6.6 491.4
Shiner OH East 234.9 103.7 2188.5 306.2 650.1 13.2 0 0 0 0 1.7 349.7
PA - - 0.0 31.6 - 57.7 2.2 0.0 0.0 0.1 0 13.1
Spottail OH West 0 0.6 0 0 2.5 0 0 0 0 0 0 0.3
Shiner OH East 0 0.3 0 0 0 0.4 0 0 0 0 0 0.1
PA - - 0.0 0.0 - 0.0 0.0 0.0 0.0 0.0 0 0.0
Alewife OH West 0 0 0 52.1 0 0 0 30.3 0 0 0 8.2
OH East 0 0 0.1 36.1 0 0 0 223.6 0 0 0 26.0
PA - - 2.8 5.0 - 0.0 4.0 0.0 0.0 0.6 0 1.8
Gizzard OH West 2.6 675.8 98.7 304.2 33.8 568.1 12 201.6 13.7 9.7 159.8 192.0
Shad OH East 8.5 4.2 28.7 39.5 7.3 455.6 1.2 214.8 12.3 14.2 35.8 78.6
PA - - 0.0 0.0 - 8.7 0.0 0.5 0.0 0.0 47.6 1.3
Trout- OH West 0.7 1.3 0 0.1 0.3 0.4 0 0 0 0 0.1 0.3
perch OH East 1.4 2.2 0.2 0 0.6 1.2 0 0.2 0 0.3 0.8 0.6
PA - - 0.0 0.0 - 2.2 4.6 4.2 0.0 2.8 43.2 2.0
Year
26
Table 2.1.2.2: Catch per hectare (arithmetic mean) of selected age-1+ species from fall trawl
surveys conducted in the Ohio and Pennsylvania waters of the central basin, Lake Erie,
from 2010-2020. Ohio West (OH West) is the area from Huron, OH, to Fairport Harbor,
OH. Ohio East (OH East) is the area from Fairport Harbor, OH to the Pennsylvania state
line. PA is the area from the Ohio-Pennsylvania state line to Presque Isle, PA.
- The Pennsylvania Fish and Boat Commission was unable to sample in these years.
2010 2011 2012 2013 2014 2015 2016 2017 2018 2019 Mean
Species Survey
Yellow OH West 11.4 4.9 7.4 41.7 14.3 41.1 2.1 5.2 10.1 4.5 4.9 14.3
Perch OH East 8.0 35.8 27.2 122.4 34.6 29.2 7.1 6.8 16.4 7.4 0.6 29.5
PA - - 117.7 73.7 - 59.0 61.2 114.1 24.8 7.8 26.5 65.5
White OH West 32.6 25.9 45.8 195.9 5.8 1.7 47.5 29.9 3.5 12.1 34.5 40.1
Perch OH East 44.8 49.8 7.7 546.9 4.4 1.4 55.4 17.6 6.6 41.5 12.5 77.6
PA - - 7.8 18.4 - 78.9 4.0 19.6 0.9 11.1 117.5 20.1
Rainbow OH West 9 15.6 9.1 8.1 34.9 340.8 0.5 53.8 16.7 0 52.1 48.9
Smelt OH East 49.8 186 95.4 200.7 6.2 295.4 17.1 35.7 9.4 0.3 129.9 89.6
PA - - 20.5 25.1 - 69.7 5.0 0.9 0.0 0.5 0 17.4
Round OH West 44 68.6 11.8 24.3 6.9 35.8 3.7 19.6 4.5 10.4 8.4 23.0
Goby OH East 36 118.1 27 46.3 89.1 72.4 16.1 14.3 3.5 22.6 17.7 44.5
PA - - 72.9 8.6 - 50.3 12.7 183.9 30.9 4.8 3.6 52.0
Emerald OH West 51.5 138.2 998.8 298 55.8 0.9 1.3 0 0 0 0.1 154.5
Shiner OH East 375.1 149.7 433.2 8.4 333.5 1.8 0 0 0 0 0.5 130.2
PA - - 8.9 17.2 - 179.5 6.4 0.0 0.0 0.0 0 30.3
Spottail OH West 0 20.7 0 0.5 1.7 0 0 0 0.7 0 0 2.4
Shiner OH East 0 3.1 3 2.9 0 0 0 0 0 0 0 0.9
PA - - 0.0 0.0 - 0.0 0.0 0.0 0.0 0.0 0 0.0
Trout- OH West 0.7 3.3 1.6 3.3 0.6 0.7 0 0.4 2 0.6 0.5 1.3
perch OH East 5 7.9 11.7 1 0.4 3 0.1 0.3 5.3 2 2.1 3.7
PA - - 30.4 9.3 - 8.3 2.4 5.2 0.0 8.0 57.1 9.1
Year
27
Table 2.1.3.1: Mean catch-per-unit-effort (CPUE; #/ha) and fishing power correction factors (FPC) by
vessel-species-age group combinations. All FPCs are calculated relative to the R./V. Keenosay.
Vessel Species
Age
group
Trawl
Hauls
Mean
CPUE FPC 95% CI
Apply
rule a
R.V. Explorer Gizzard Shad Age 0 22 11.8 2.362 -1.26-5.99 Y
Emerald Shiner Age 0+ 50 67.8 1.494 0.23-2.76 Y
Trout-Perch Age 0+ 51 113.2 0.704 0.49-0.91 z Y
White Perch Age 0 51 477.2 1.121 1.01-1.23 z Y
White Bass Age 0 50 11.7 3.203 0.81-5.60 Y
Yellow Perch Age 0 51 1012.2 0.933 0.62-1.24 N
Yellow Perch Age 1+ 51 119.6 1.008 0.72-1.30 N
Walleye Age 0 51 113.7 1.561 1.25-1.87 z Y
Round Goby Age 0+ 51 200.3 0.423 0.22-0.63 z Y
Freshwater Drum Age 1+ 51 249.1 0.598 0.43-0.76 z Y
R.V. Gibraltar Gizzard Shad Age 0 29 14.2 1.216 -0.40-2.83 Y
Emerald Shiner Age 0+ 43 51.3 2.170 0.48-3.85 Y
Trout-Perch Age 0+ 45 82.1 1.000 0.65-1.34 N
White Perch Age 0 45 513.5 0.959 0.62-1.30 N
White Bass Age 0 45 21.9 1.644 0.00-3.28 Y
Yellow Perch Age 0 45 739.2 1.321 0.99-1.65 Y
Yellow Perch Age 1+ 45 94.6 1.185 0.79-1.58 Y
Walleye Age 0 45 119.2 1.520 1.17-1.87 z Y
Round Goby Age 0+ 45 77.4 0.992 0.41-1.57 N
Freshwater Drum Age 1+ 45 105.2 1.505 1.10-1.91 z Y
R.V. Grandon Gizzard Shad Age 0 29 70.9 0.233 -0.06-0.53 z Y
Emerald Shiner Age 0+ 34 205.4 0.656 -0.04-1.35 Y
Trout-Perch Age 0+ 35 135.9 0.620 0.42-0.82 z Y
White Perch Age 0 36 771.4 0.699 0.44-0.96 z Y
White Bass Age 0 36 34.9 0.679 0.43-0.93 z Y
Yellow Perch Age 0 36 1231.6 0.829 0.58-1.08 Y
Yellow Perch Age 1+ 36 123.4 0.907 0.58-1.23 Y
Walleye Age 0 36 208.6 0.920 0.72-1.12 Y
Round Goby Age 0+ 36 161.8 0.501 0.08-0.92 z Y
Freshwater Drum Age 1+ 36 58.8 2.352 1.51-3.19 z Y
R.V. Musky II Gizzard Shad Age 0 24 8.8 1.885 -1.50-5.26 Y
Emerald Shiner Age 0+ 47 32.3 3.073 0.36-5.79 Y
Trout-Perch Age 0+ 50 62.4 1.277 0.94-1.62 Y
White Perch Age 0 50 255.7 2.091 1.37-2.81 z Y
White Bass Age 0 46 8.4 4.411 0.90-7.92 Y
Yellow Perch Age 0 50 934.0 1.012 0.77-1.26 N
Yellow Perch Age 1+ 50 34.9 3.452 1.23-5.67 z Y
Walleye Age 0 50 63.7 2.785 2.24-3.33 z Y
Round Goby Age 0+ 49 66.9 1.266 0.39-2.14 Y
Freshwater Drum Age 1+ 49 1.6 93.326 48.39-138.26 z Y
z - Indicates statistically significant difference from 1.0 (α=0.05); a Y means decision rule indicated FPC
application was warranted; , N means decision rule indicated FPC application was not warranted

28
Table 2.1.3.2: Ten-year mean relative abundance (arithmetic mean number per hectare), 2020
relative abundance, and the percent difference between 2020 and the ten-year average
for forage fish functional groups from fall trawl surveys in the west basin Lake Erie. Data
are collected by OMNRF and ODNR and combined using FPC factors.
Functional Group Mean: 2009-2019 2020 +/-
All forage species 4791.1 2086.5 -56%
Clupeid 834.8 193.3 -77%
Soft-rayed 442.3 101.3 -77%
Spiny-rayed 3514.0 1792.0 -49%
Table 2.1.3.3: Ten-year mean relative abundance (arithmetic mean number per hectare), 2020
relative abundance, and the percent difference between 2020 and the ten-year average
for selected forage species from fall trawl surveys in the west basin Lake Erie. Data are
collected by OMNRF and ODNR and combined using FPC factors.
Species Age class Mean: 2009-2019 2020 +/-
Emerald Shiner Age-0 51.3 0.2 -100%
Emerald Shiner Age-1+ 56.3 0.1 -100%
Freshwater Drum Age-0 95.7 54.5 -43%
Gizzard Shad Age-0 834.4 192.2 -77%
Rainbow Smelt Age-0 165.8 0.3 -100%
Rainbow Smelt Age-1+ 7.9 0.0 -100%
Round Goby All ages 29.4 15.9 -46%
Walleye Age-0 60.6 97.1 60%
White Bass Age-0 125.9 61.4 -51%
White Perch Age-0 2824.4 1030.7 -64%
Yellow Perch Age-0 407.5 548.3 35%
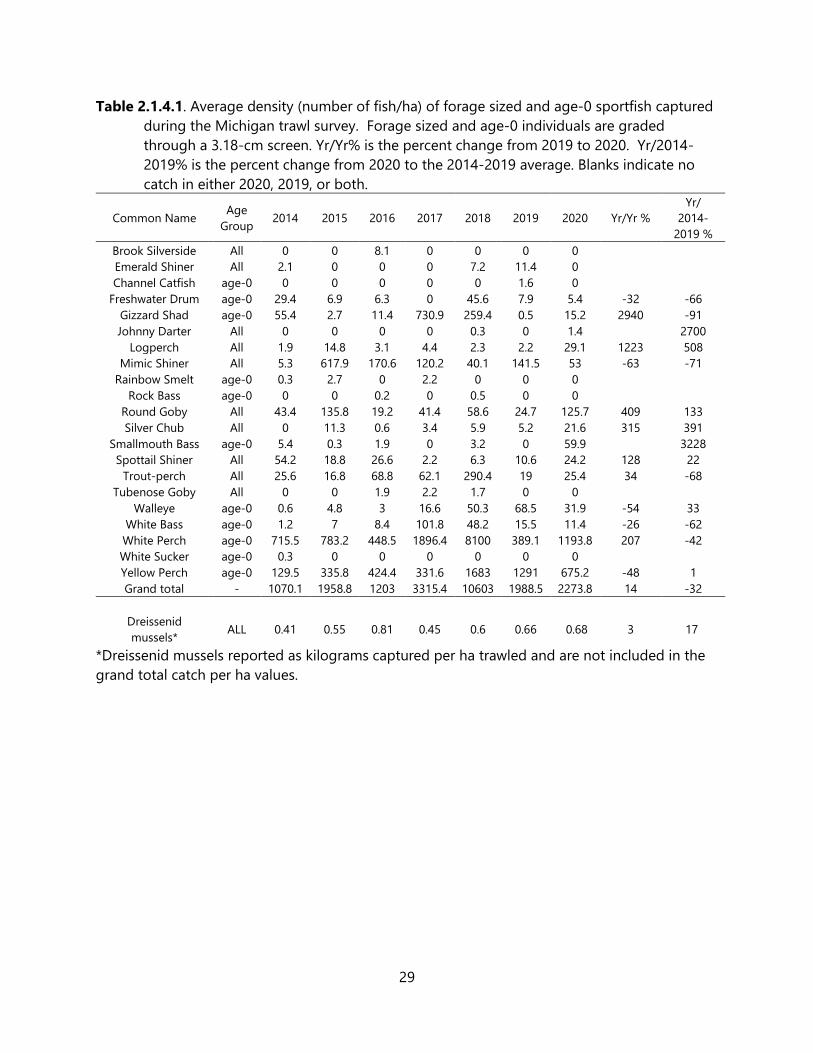
29
Table 2.1.4.1. Average density (number of fish/ha) of forage sized and age-0 sportfish captured
during the Michigan trawl survey. Forage sized and age-0 individuals are graded
through a 3.18-cm screen. Yr/Yr% is the percent change from 2019 to 2020. Yr/2014-
2019% is the percent change from 2020 to the 2014-2019 average. Blanks indicate no
catch in either 2020, 2019, or both.
Common Name Age
Group 2014 2015 2016 2017 2018 2019 2020 Yr/Yr %
Yr/
2014-
2019 %
Brook Silverside All 0 0 8.1 0 0 0 0
Emerald Shiner All 2.1 0 0 0 7.2 11.4 0
Channel Catfish age-0 0 0 0 0 0 1.6 0
Freshwater Drum age-0 29.4 6.9 6.3 0 45.6 7.9 5.4 -32 -66
Gizzard Shad age-0 55.4 2.7 11.4 730.9 259.4 0.5 15.2 2940 -91
Johnny Darter All 0 0 0 0 0.3 0 1.4 2700
Logperch All 1.9 14.8 3.1 4.4 2.3 2.2 29.1 1223 508
Mimic Shiner All 5.3 617.9 170.6 120.2 40.1 141.5 53 -63 -71
Rainbow Smelt age-0 0.3 2.7 0 2.2 0 0 0
Rock Bass age-0 0 0 0.2 0 0.5 0 0
Round Goby All 43.4 135.8 19.2 41.4 58.6 24.7 125.7 409 133
Silver Chub All 0 11.3 0.6 3.4 5.9 5.2 21.6 315 391
Smallmouth Bass age-0 5.4 0.3 1.9 0 3.2 0 59.9 3228
Spottail Shiner All 54.2 18.8 26.6 2.2 6.3 10.6 24.2 128 22
Trout-perch All 25.6 16.8 68.8 62.1 290.4 19 25.4 34 -68
Tubenose Goby All 0 0 1.9 2.2 1.7 0 0
Walleye age-0 0.6 4.8 3 16.6 50.3 68.5 31.9 -54 33
White Bass age-0 1.2 7 8.4 101.8 48.2 15.5 11.4 -26 -62
White Perch age-0 715.5 783.2 448.5 1896.4 8100 389.1 1193.8 207 -42
White Sucker age-0 0.3 0 0 0 0 0 0
Yellow Perch age-0 129.5 335.8 424.4 331.6 1683 1291 675.2 -48 1
Grand total - 1070.1 1958.8 1203 3315.4 10603 1988.5 2273.8 14 -32
Dreissenid
mussels* ALL 0.41 0.55 0.81 0.45 0.6 0.66 0.68 3 17
*Dreissenid mussels reported as kilograms captured per ha trawled and are not included in the
grand total catch per ha values.
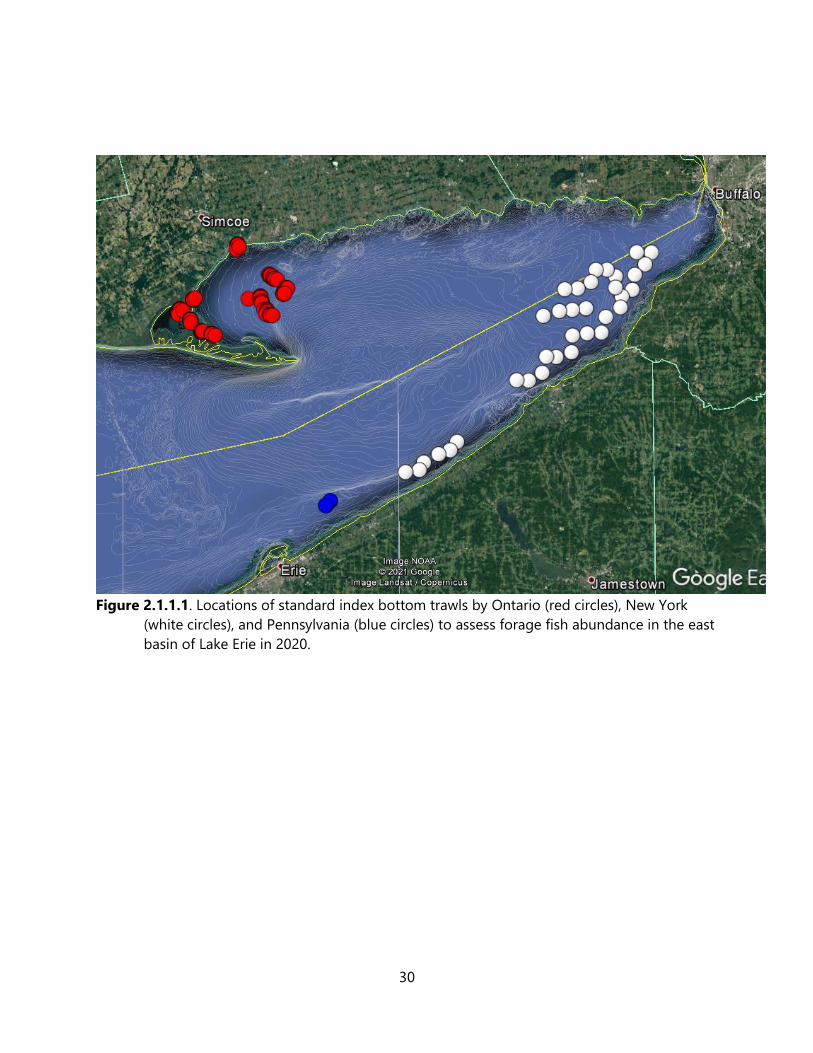
30
Figure 2.1.1.1. Locations of standard index bottom trawls by Ontario (red circles), New York
(white circles), and Pennsylvania (blue circles) to assess forage fish abundance in the east
basin of Lake Erie in 2020.
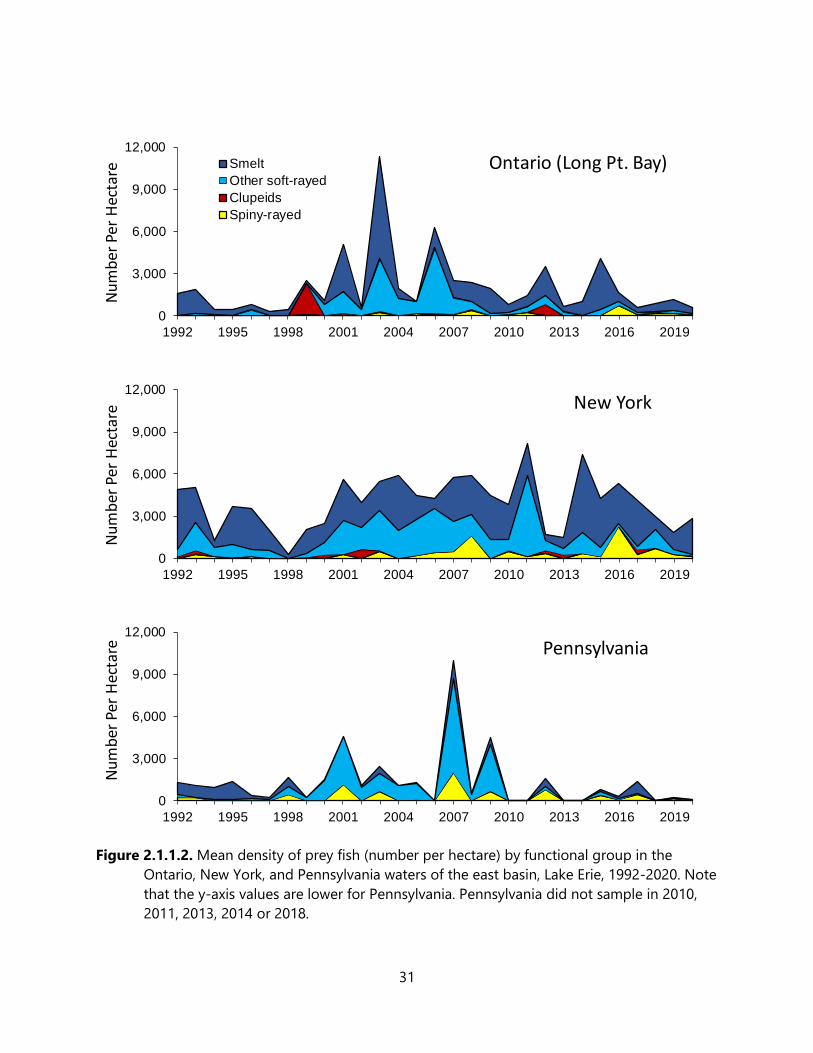
31
Figure 2.1.1.2. Mean density of prey fish (number per hectare) by functional group in the
Ontario, New York, and Pennsylvania waters of the east basin, Lake Erie, 1992-2020. Note
that the y-axis values are lower for Pennsylvania. Pennsylvania did not sample in 2010,
2011, 2013, 2014 or 2018.
0
3,000
6,000
9,000
12,000
1992 1995 1998 2001 2004 2007 2010 2013 2016 2019
Nu
mb
erPe
r H
ecta
re
New York
0
3,000
6,000
9,000
12,000
1992 1995 1998 2001 2004 2007 2010 2013 2016 2019
Nu
mb
erPe
r H
ecta
re Pennsylvania
0
3,000
6,000
9,000
12,000
1992 1995 1998 2001 2004 2007 2010 2013 2016 2019
Smelt
Other soft-rayed
Clupeids
Spiny-rayed
Nu
mb
erPe
r H
ecta
re Ontario (Long Pt. Bay)
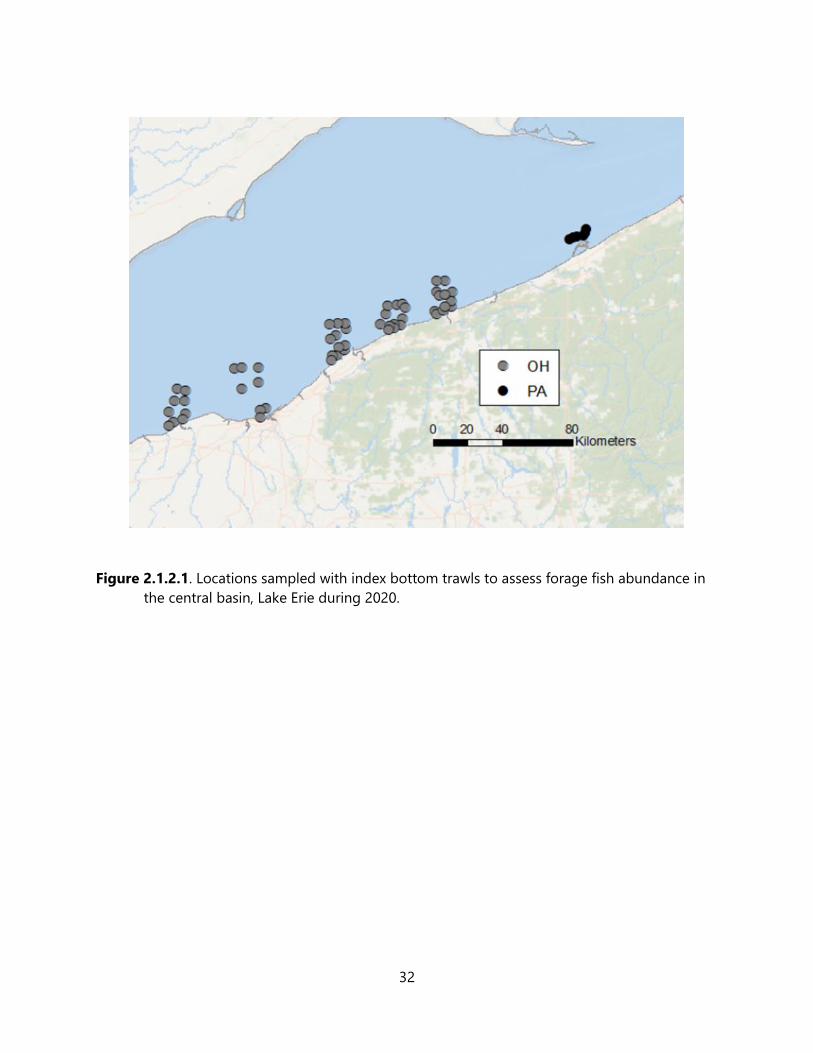
32
Figure 2.1.2.1. Locations sampled with index bottom trawls to assess forage fish abundance in
the central basin, Lake Erie during 2020.

33
Figure 2.1.2.2: Mean density of prey fish (number per hectare) by functional group in
Pennsylvania and Ohio waters of the central basin, Lake Erie, 1990-2020.
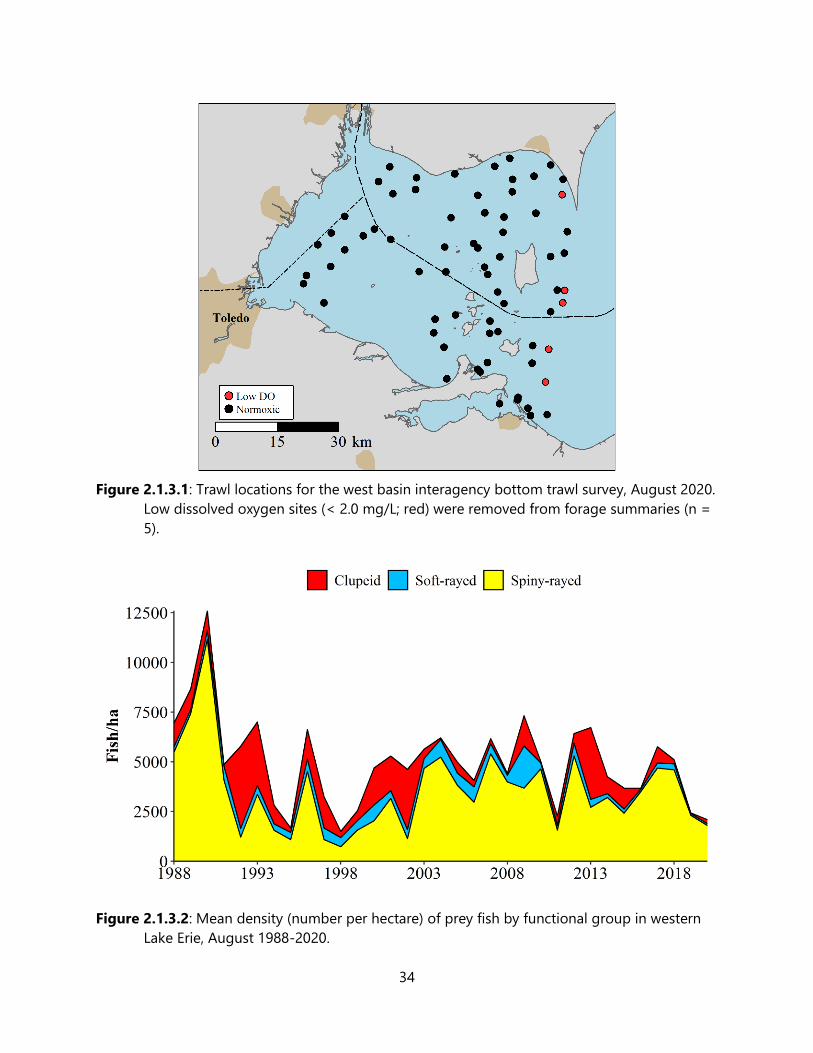
34
Figure 2.1.3.1: Trawl locations for the west basin interagency bottom trawl survey, August 2020.
Low dissolved oxygen sites (< 2.0 mg/L; red) were removed from forage summaries (n =
5).
Figure 2.1.3.2: Mean density (number per hectare) of prey fish by functional group in western
Lake Erie, August 1988-2020.
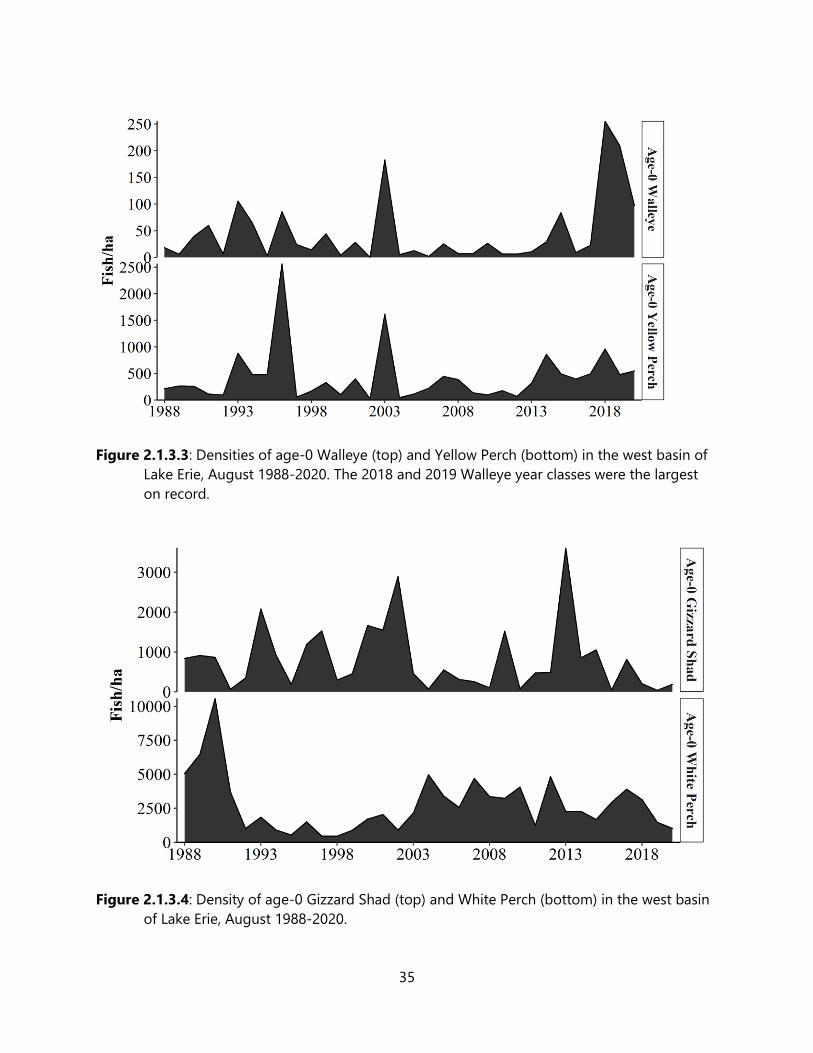
35
Figure 2.1.3.3: Densities of age-0 Walleye (top) and Yellow Perch (bottom) in the west basin of
Lake Erie, August 1988-2020. The 2018 and 2019 Walleye year classes were the largest
on record.
Figure 2.1.3.4: Density of age-0 Gizzard Shad (top) and White Perch (bottom) in the west basin
of Lake Erie, August 1988-2020.
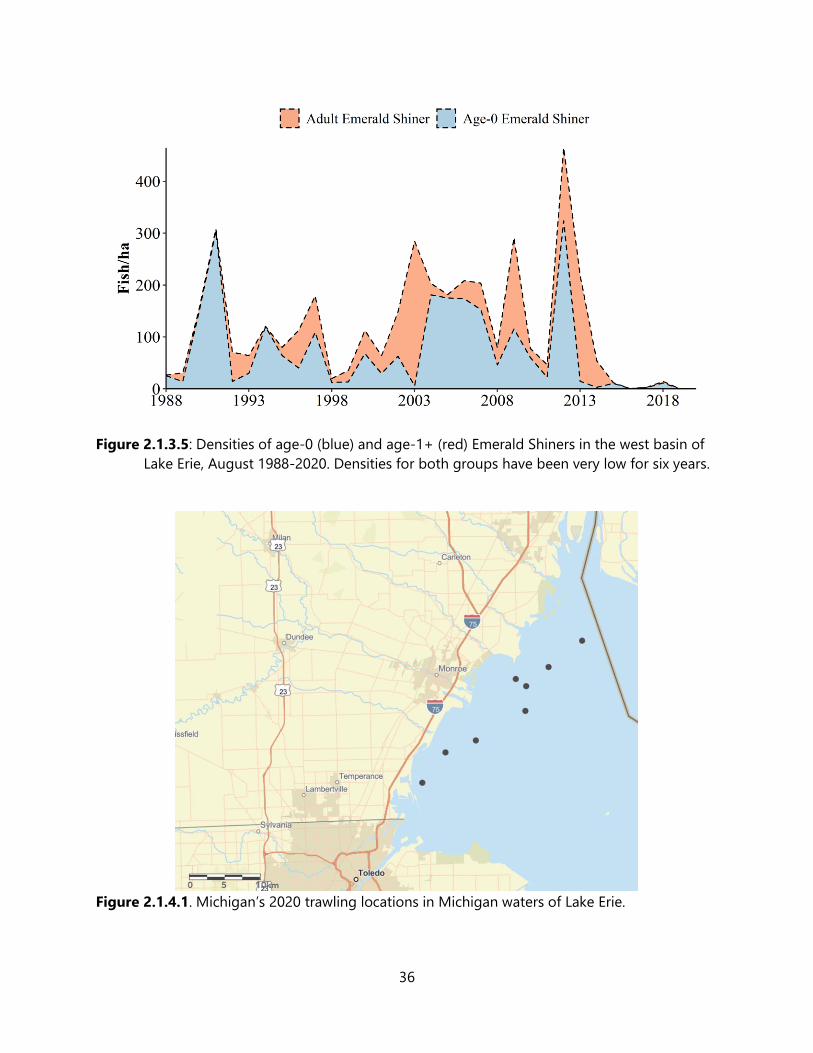
36
Figure 2.1.3.5: Densities of age-0 (blue) and age-1+ (red) Emerald Shiners in the west basin of
Lake Erie, August 1988-2020. Densities for both groups have been very low for six years.
Figure 2.1.4.1. Michigan’s 2020 trawling locations in Michigan waters of Lake Erie.
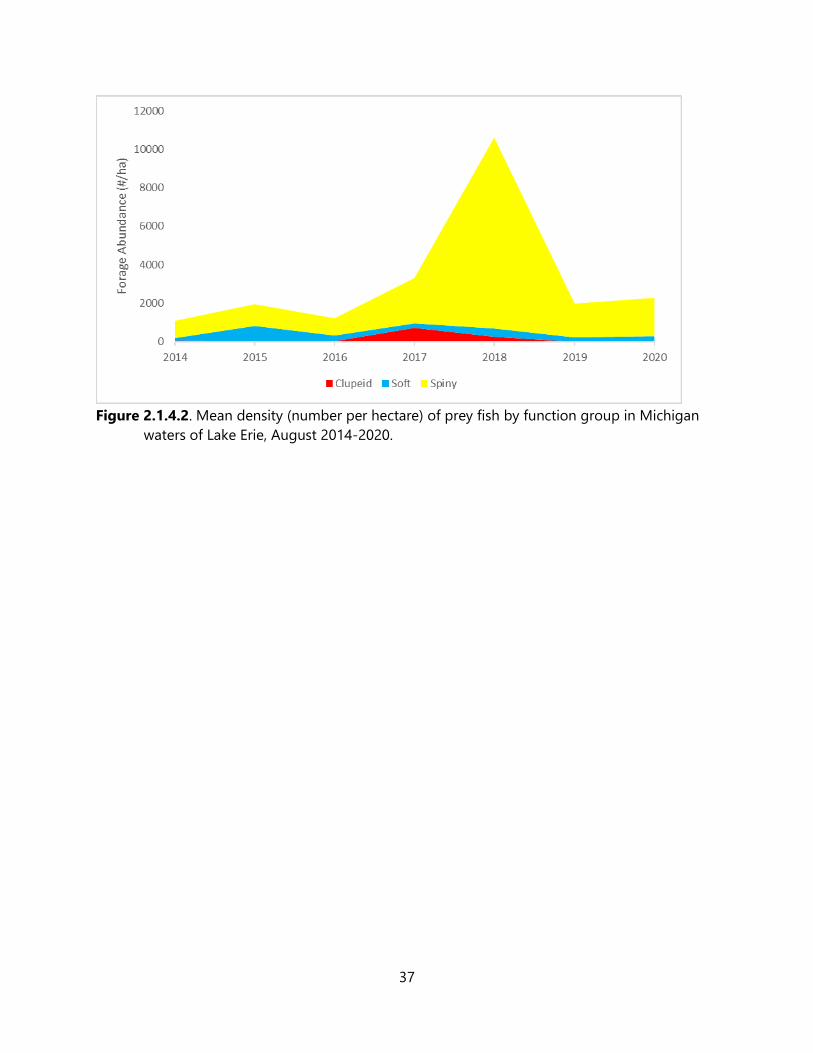
37
Figure 2.1.4.2. Mean density (number per hectare) of prey fish by function group in Michigan
waters of Lake Erie, August 2014-2020.
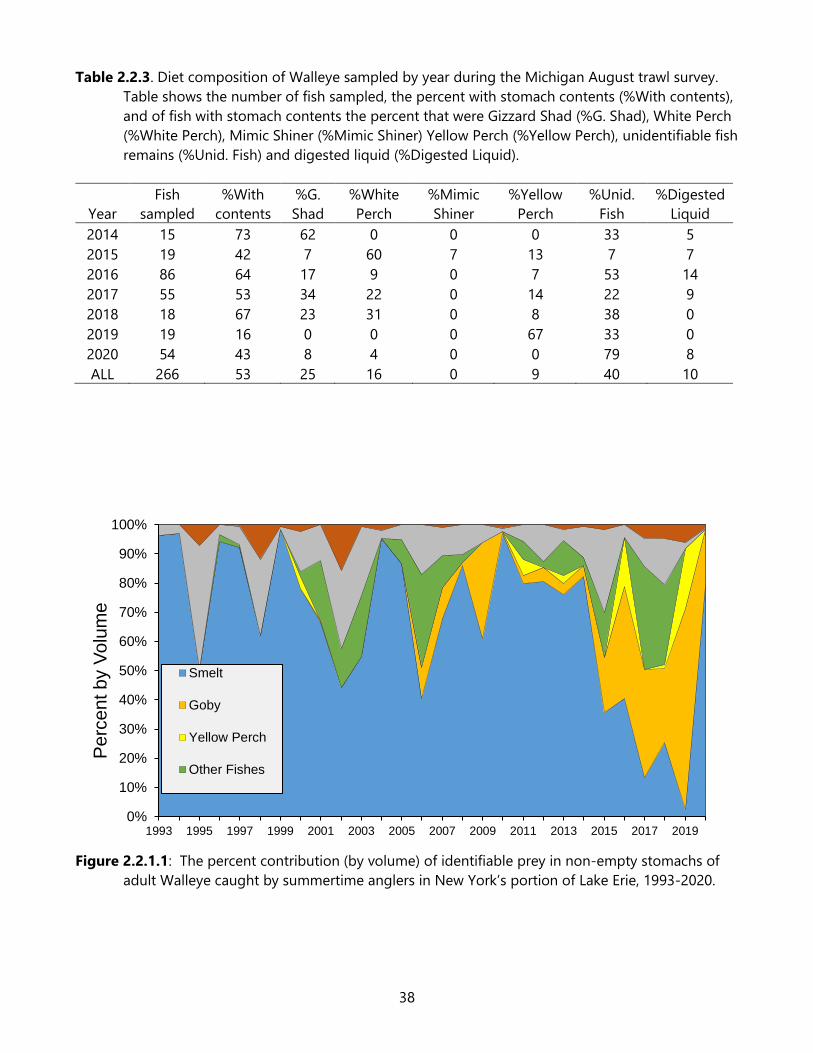
38
Table 2.2.3. Diet composition of Walleye sampled by year during the Michigan August trawl survey.
Table shows the number of fish sampled, the percent with stomach contents (%With contents),
and of fish with stomach contents the percent that were Gizzard Shad (%G. Shad), White Perch
(%White Perch), Mimic Shiner (%Mimic Shiner) Yellow Perch (%Yellow Perch), unidentifiable fish
remains (%Unid. Fish) and digested liquid (%Digested Liquid).
Year
Fish
sampled
%With
contents
%G.
Shad
%White
Perch
%Mimic
Shiner
%Yellow
Perch
%Unid.
Fish
%Digested
Liquid
2014 15 73 62 0 0 0 33 5
2015 19 42 7 60 7 13 7 7
2016 86 64 17 9 0 7 53 14
2017 55 53 34 22 0 14 22 9
2018 18 67 23 31 0 8 38 0
2019 19 16 0 0 0 67 33 0
2020 54 43 8 4 0 0 79 8
ALL 266 53 25 16 0 9 40 10
Figure 2.2.1.1: The percent contribution (by volume) of identifiable prey in non-empty stomachs of
adult Walleye caught by summertime anglers in New York’s portion of Lake Erie, 1993-2020.
0%
10%
20%
30%
40%
50%
60%
70%
80%
90%
100%
1993 1995 1997 1999 2001 2003 2005 2007 2009 2011 2013 2015 2017 2019
Pe
rce
nt b
y V
olu
me
NY Angler Caught Walleye Diets
Smelt
Goby
Yellow Perch
Other Fishes
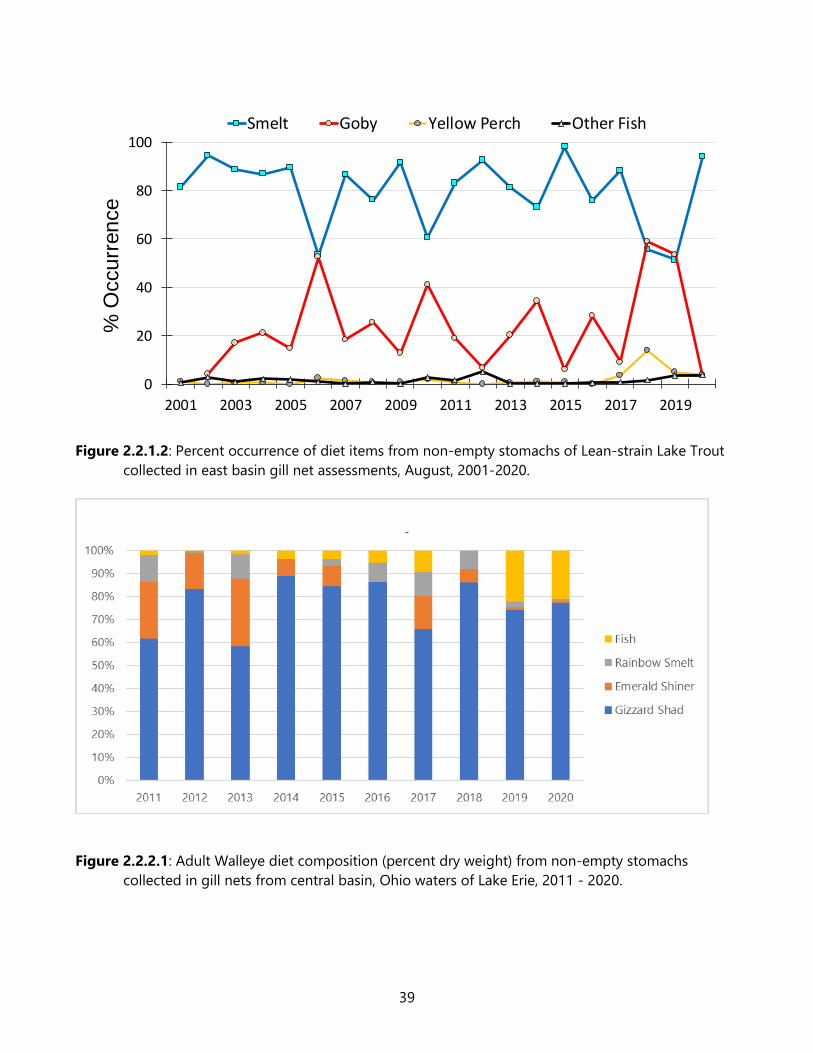
39
Figure 2.2.1.2: Percent occurrence of diet items from non-empty stomachs of Lean-strain Lake Trout
collected in east basin gill net assessments, August, 2001-2020.
Figure 2.2.2.1: Adult Walleye diet composition (percent dry weight) from non-empty stomachs
collected in gill nets from central basin, Ohio waters of Lake Erie, 2011 - 2020.
Lake Trout
0
20
40
60
80
100
2001 2003 2005 2007 2009 2011 2013 2015 2017 2019
Smelt Goby Yellow Perch Other Fish%
Occu
rren
ce
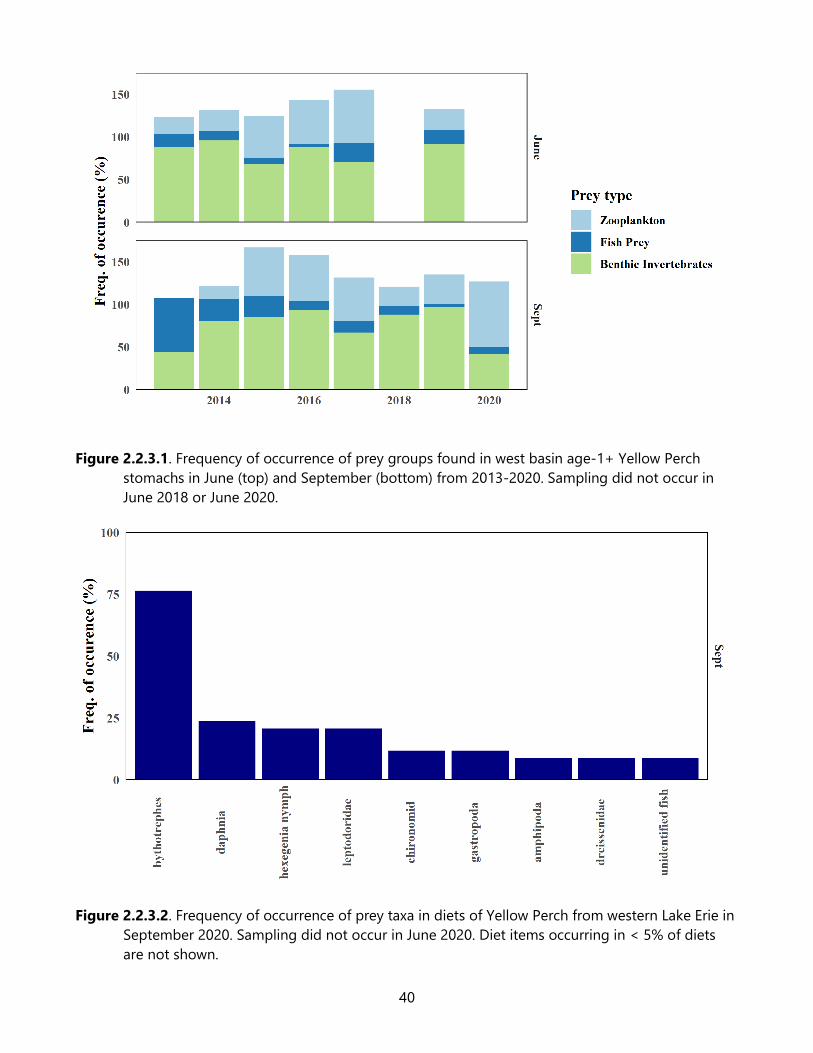
40
Figure 2.2.3.1. Frequency of occurrence of prey groups found in west basin age-1+ Yellow Perch
stomachs in June (top) and September (bottom) from 2013-2020. Sampling did not occur in
June 2018 or June 2020.
Figure 2.2.3.2. Frequency of occurrence of prey taxa in diets of Yellow Perch from western Lake Erie in
September 2020. Sampling did not occur in June 2020. Diet items occurring in < 5% of diets
are not shown.
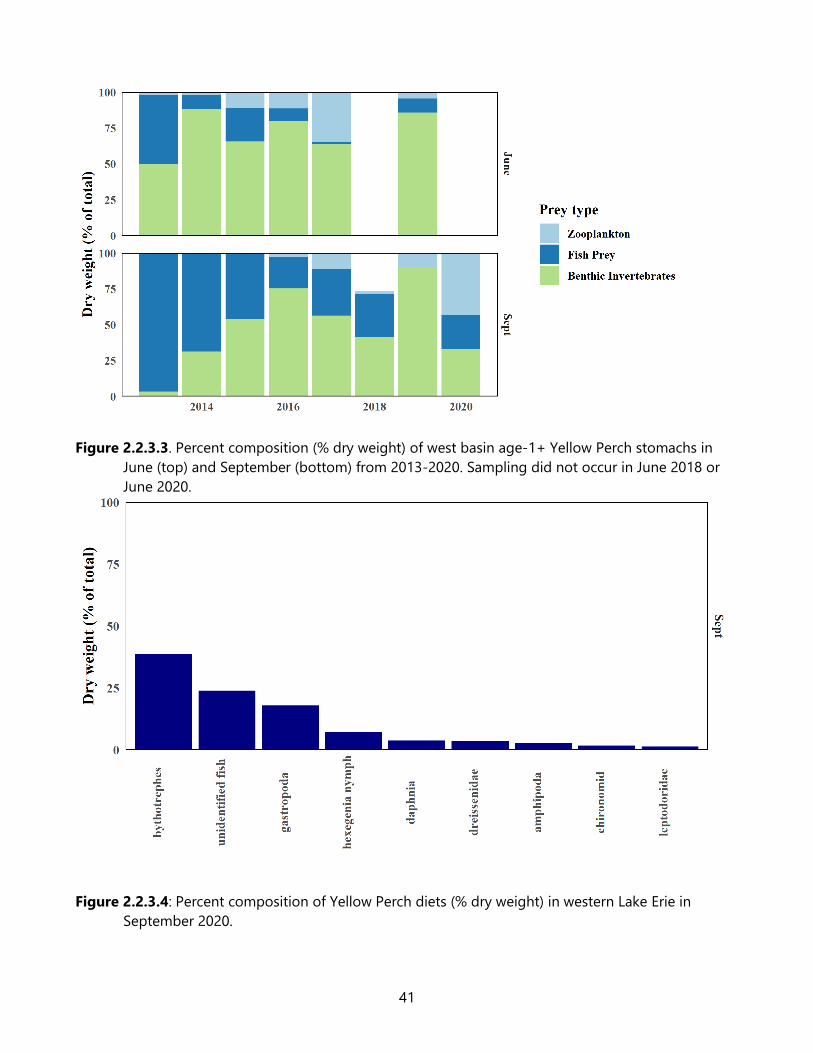
41
Figure 2.2.3.3. Percent composition (% dry weight) of west basin age-1+ Yellow Perch stomachs in
June (top) and September (bottom) from 2013-2020. Sampling did not occur in June 2018 or
June 2020.
Figure 2.2.3.4: Percent composition of Yellow Perch diets (% dry weight) in western Lake Erie in
September 2020.
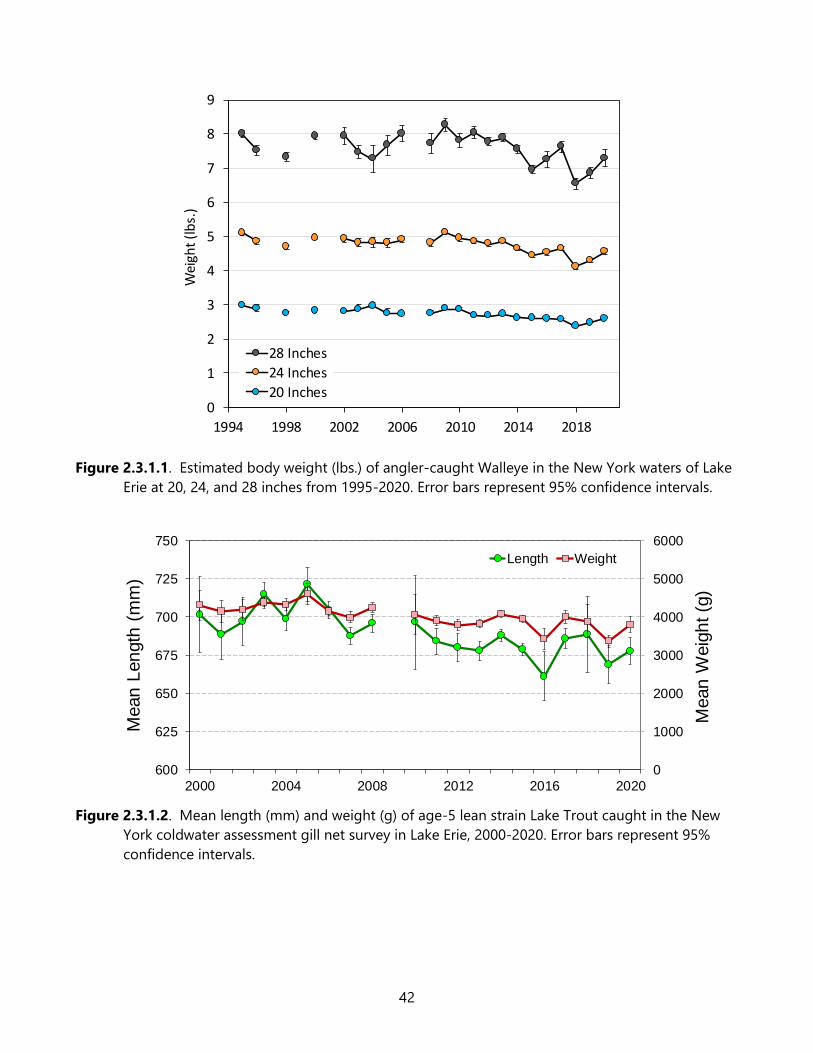
42
Figure 2.3.1.1. Estimated body weight (lbs.) of angler-caught Walleye in the New York waters of Lake
Erie at 20, 24, and 28 inches from 1995-2020. Error bars represent 95% confidence intervals.
Figure 2.3.1.2. Mean length (mm) and weight (g) of age-5 lean strain Lake Trout caught in the New
York coldwater assessment gill net survey in Lake Erie, 2000-2020. Error bars represent 95%
confidence intervals.
0
1
2
3
4
5
6
7
8
9
1994 1998 2002 2006 2010 2014 2018
Wei
ght
(lb
s.)
Estimated walleye weight at length
28 Inches
24 Inches
20 Inches
0
1000
2000
3000
4000
5000
6000
600
625
650
675
700
725
750
2000 2004 2008 2012 2016 2020
Mean
Weig
ht
(g)
Length Weight
Mean
Len
gth
(m
m)
Age-5 Lake Trout
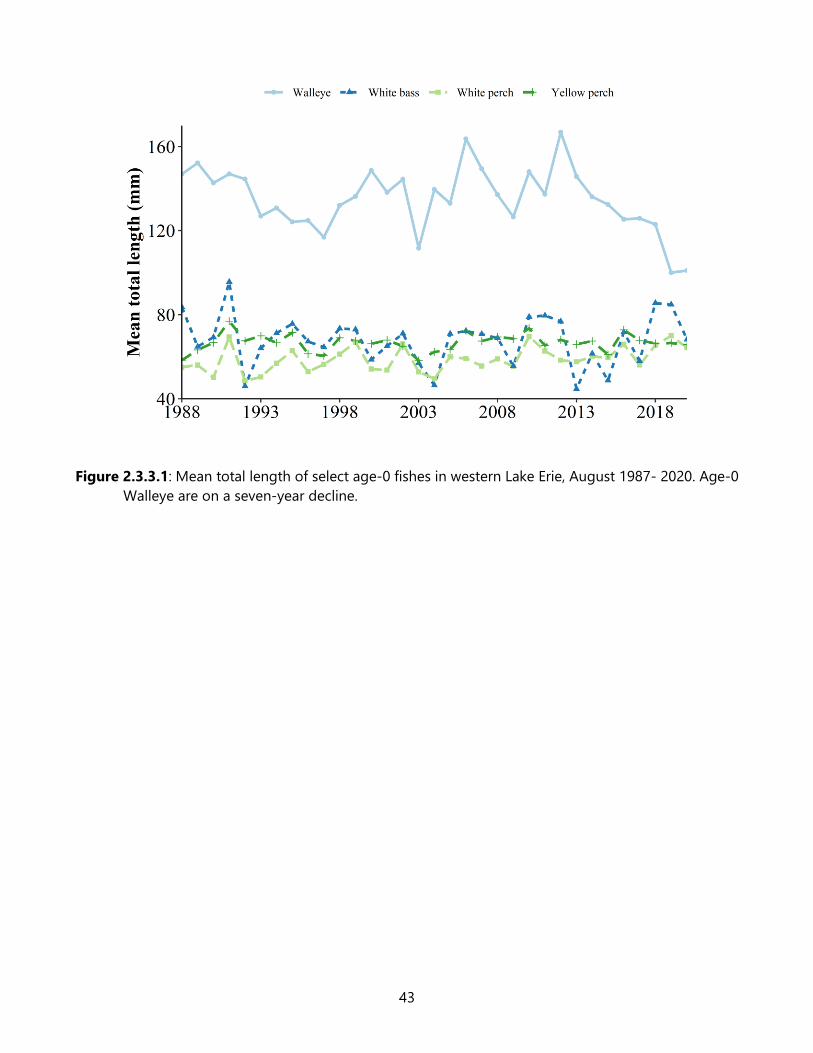
43
Figure 2.3.3.1: Mean total length of select age-0 fishes in western Lake Erie, August 1987- 2020. Age-0
Walleye are on a seven-year decline.
44
Charge 3: Continue hydroacoustic assessment of the pelagic forage fish community in Lake Erie,
incorporating new methods in survey design and analysis, while following the Great Lake
Fishery Commission’s Great Lakes Hydroacoustic Standard Operating Procedures where
possible/feasible.
3.0 Hydroacoustics Surveys in 2020 (Z. Slagle)
In 2020, two major changes to all Lake Erie hydroacoustics surveys occurred. First, the COVID-
19 Pandemic closed the international border for the entire survey period. This prevented typical
sampling efforts, effectively limiting each hydroacoustic survey to half of the typical sampling area.
Second, a redesign of each of the three basin surveys was well underway (Appendix 2; FTG 2020).
Biologists utilized the already limited 2020 sampling year to initiate survey redesign methods,
including partial implementation of random-grid (instead of cross-basin or cross-strata) transects.
Therefore, prey density summaries from 2020 are not directly comparable to previous years, especially
in the West and Central Basins where accomplished transects differ significantly from previous surveys.
3.1 East Basin Hydroacoustic Survey (J. Holden)
Methods
A fisheries hydroacoustic survey has been conducted in the East Basin since 1993 to provide
estimates of the distribution and abundance of age-1+ Rainbow Smelt. The original design was
based off a fixed transect design that provided spatial coverage throughout the basin. In 1998, the
survey was redesigned to include a random transect approach within defined strata. The strata are
defined by 150 Loran-C lines providing equal distribution of transects across the basin. Two of the
central strata were combined and divided north/south to allow separation of the 25-40m depth zone
that previous surveys have shown are typically higher in age-1+ Rainbow Smelt Abundance (Figure
3.1.1.). From 1993 to 1996 a 70kHz single beam Simrad EY-M system was used. Since 1997, the
hydroacoustic data acquisition system consists of a Simrad EY60 surface unit with a 120 kHz 7-
degree split-beam general purpose transducer mounted on a fixed pole in a down facing orientation
approximately 1 m below the water surface on the OMNRF research vessel, R/V Erie Explorer. Early
surveys were conducted multiple times throughout the year (2 seasons from 1993-1997, 3 seasons
1998-1999, July only since 2000). The July survey window maximizes the separation between young-
of-year and age-1+ Rainbow Smelt in the water column. The 2014 edition of this report details the
history, design and analytical methods of the hydroacoustic survey (Forage Task Group 2014). Up to
2007, companion midwater trawls were completed by NYSDEC and found that age-1+ Rainbow
Smelt made up greater than 95% of catches of fish of their acoustic target strength in meta-
hypolimnion trawls. In the absence of companion trawls post 2007 the acoustic data were analyzed
with the assumption that all meta-hypolimnion targets above the minimum target strength threshold
were age-1+ Rainbow Smelt. In 2019, OMNRF extended the survey window to incorporate mid-water
trawling (N = 24) to test the assumption that the meta-hypolimnion targets were still likely to be
age-1+ Rainbow Smelt. A midwater trawl 13.6 m long with a 7.1 m headline, spread with 0.5 m2
aluminum doors was fished throughout the water column in areas where high densities of acoustic
targets were identified. Midwater trawl catches confirmed the assumption that the majority of targets
meeting the minimum target strength threshold in the hypo-metalimnion layer are age-1+ Rainbow
Smelt.
45
Results
A reduced survey was implemented in 2020. Transects were limited to only the Ontario waters of
the Eastern Basin and the eastern most stratum (Stratum 4) was not sampled (Figure 3.1.2). Additional
random-grid segments were conducted in Strata 2.2. and 2.3 to support the evaluation of the acoustic
program (Appendix 2). Only data from the cross-stratum transects were used to generate the annual
index of abundance. Transects are segmented in to 800 m sampling units for analytical purposes.
Strata density are the mean density of all the 800 m segments within the strata (two transects
combined). The basin estimate is a mean of the combined strata. Hydroacoustic analyses in 2020
indicated that age-1+ Rainbow Smelt densities (1,854 fish/ha) increased from low densities observed
in 2019 (180 fish/ha; Figure 3.1.3). The highest density was observed within Stratum 2.3 where several
800 m segments exceeded 10,000 age-1+/ha on one transect (Figure 3.1.3). Density exceeded 5000
age-1+ /ha in Stratum 3 and a small portion of Stratum 2 but was generally low throughout much of
the strata.
3.2 Central Basin Hydroacoustic Survey (P. Kočovský [USGS], J. Deller)
The Ontario Ministry of Natural Resources and Forestry (OMNRF), Ohio Department of Natural
Resources (ODNR), and the U.S. Geological Survey (USGS) have collaborated to conduct joint
hydroacoustic and midwater trawl surveys in the central basin of Lake Erie since 2004. Beginning in
2008, all hydroacoustic data were collected and analyzed following recommendations in the Standard
Operating Procedures for Fisheries Acoustics Surveys in the Great Lakes (GLSOP; Parker-Stetter et al.
2009). The primary purpose of the central basin hydroacoustic survey is to estimate densities of
Rainbow Smelt and Emerald Shiner, which are the primary pelagic forage species in the central basin.
Methods
Hydroacoustic data were collected from the USGS R/V Muskie and the ODNR-DOW R/V North
River. Acoustic transects corresponding to Loran-C TD lines were sampled from one half hour after
sunset (approximately 2130) to no later than one half hour before sunrise (approximately 0530),
depending on the length of the transect and vessel speed. The prescribed starting and ending points
for the survey are the 10 m depth contour lines. Hydroacoustic data, from both vessels, were collected
with BioSonics DTX® echosounders and BioSonics Visual Acquisition (release 6.0) software. Data from
the R/V Muskie were collected using a 120 kHz, 7.4-degree, split-beam transducer mounted inside a
through-hull transducer tube at a depth of 1.5 m below the water surface. Data from the R/V North
River were collected with a 122 kHz, 7.6-degree, split-beam transducer mounted to the port hull on a
movable bracket, roughly equidistant between the bow and stern, with the transducer 1.3 meters
below the surface. A description of central basin survey protocols and analysis can be found in the
2017 Forage Task Group Report (FTG 2017).
Results
Three cross-basin transects were sampled between 17 July and 25 July 2020 with
hydroacoustics, each only traversing half the basin due to pandemic restrictions. Twelve 5 km random-
46
grid transects were also sampled. One partial cross-basin and one random-grid transect were not
completed due to severe weather. No midwater trawls were accomplished in 2020.
Forage fish densities were greatest across the West-Central Offshore cross-basin transect, while
densities across the two East-Central cross-basin transects were substantially lower (Figure 3.2.1). Due
to survey changes, 2020 forage fish densities were not directly comparable to previous years’ surveys;
thus, no density over time graphs were generated in 2020. Analysis of the additional random-grid
segments is available in Appendix 2.
3.3 West Basin Hydroacoustic Survey (M. DuFour [ODNR])
Since 2005, the Ohio Department of Natural Resources Division of Wildlife has conducted a
hydroacoustic forage fish survey in the west basin of Lake Erie. This survey consists of three, cross-
basin transects surveyed between one-half hour after sunset and one-half hour before sunrise. No
trawling has ever been conducted in conjunction with acoustic data collection.
Methods
All transects were surveyed using a single, downward-facing, 6.3-degree, 201-kHz split-beam
transducer, a Garmin global positioning system, and a Panasonic CF-30 laptop computer. The acoustic
system was calibrated prior to the survey with a tungsten carbide reference sphere of known acoustic
size. The mobile survey, conducted aboard the ODNR’s RV Almar, was initiated approximately 0.5 h
after sunset and completed by 0.5 h prior to sunrise. Transects were navigated with waypoints
programmed in a Lowrance GPS, and speed was maintained at 8-9 km/h. The transducer was mounted
to a BioSonics Towfish at 1 m below the surface starboard side of the boat. Data were collected using
BioSonics Visual Acquisition 6 software. Collection settings during the survey were 10 pings/second, a
pulse length of 0.2 msec, and a minimum collection threshold of -70 dB. The sampling environment
(water temperature) was set at the temperature 2 m deep on the evening of sampling. Data were
written to file and named by the date and time the file was collected. Files were automatically collected
every 30 minutes. Latitude and longitude coordinates were written to the file as the data were
collected to identify sample location.
Data were analyzed using the Myriax software Echoview 10.0 using a modified process
developed by the Ohio Division of Wildlife Inland Fisheries Research Unit. Total length (mm) range
was estimated using Love’s dorsal aspect equation (Love 1971):
TL = 10 ([TS + 26.1]/19.1) * 1000
Biomass (kg) estimates were based on average target length as determined by the above equation and
an established length (TL)-weight (Wt) relationship.
Wt = (0.0000263*TL2.7875)/1000
Results
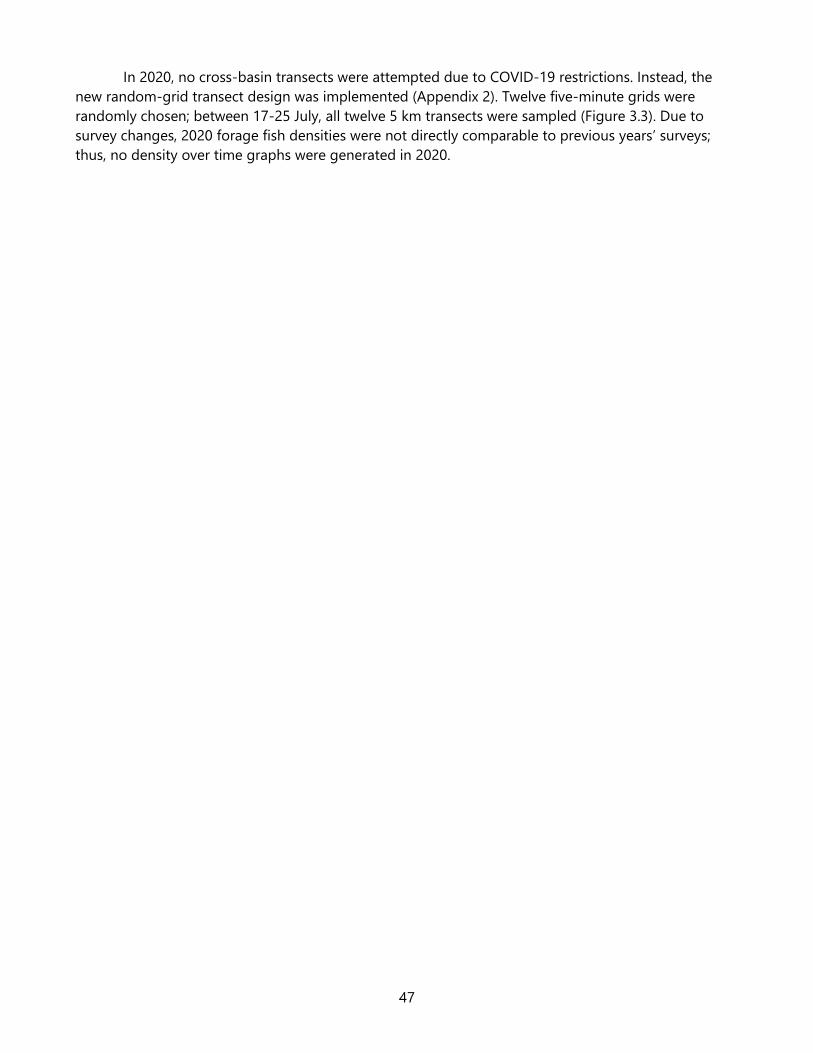
47
In 2020, no cross-basin transects were attempted due to COVID-19 restrictions. Instead, the
new random-grid transect design was implemented (Appendix 2). Twelve five-minute grids were
randomly chosen; between 17-25 July, all twelve 5 km transects were sampled (Figure 3.3). Due to
survey changes, 2020 forage fish densities were not directly comparable to previous years’ surveys;
thus, no density over time graphs were generated in 2020.
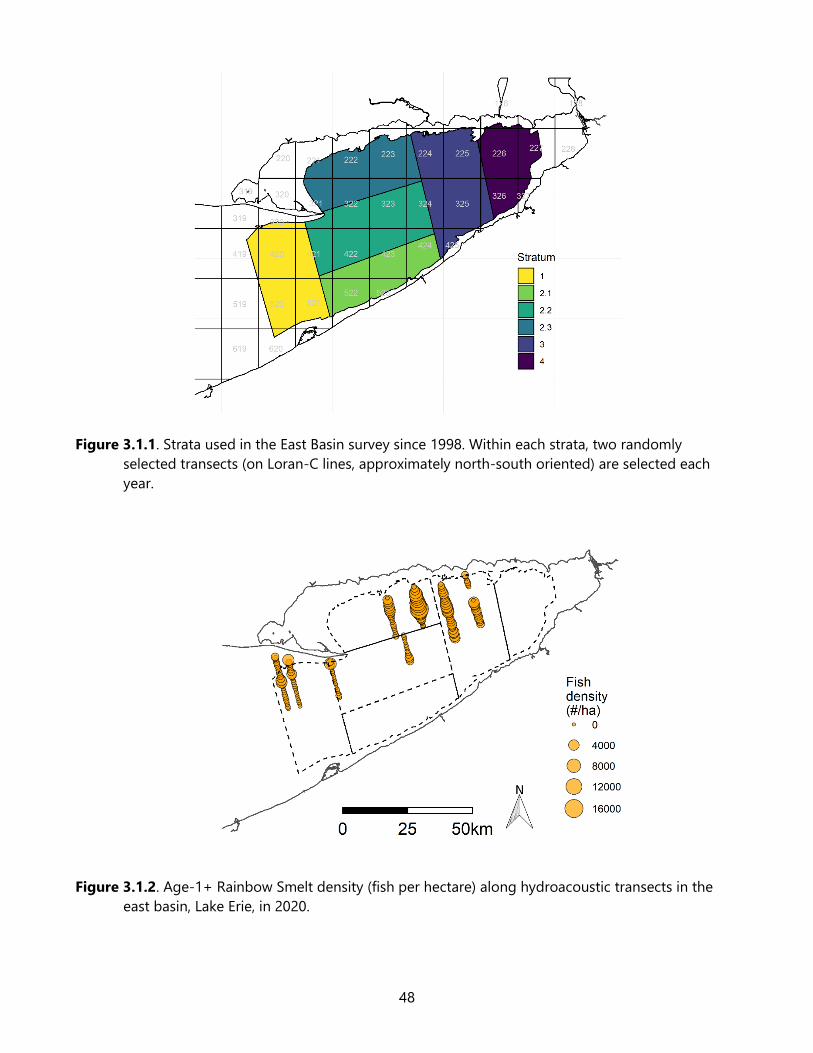
48
Figure 3.1.1. Strata used in the East Basin survey since 1998. Within each strata, two randomly
selected transects (on Loran-C lines, approximately north-south oriented) are selected each
year.
Figure 3.1.2. Age-1+ Rainbow Smelt density (fish per hectare) along hydroacoustic transects in the
east basin, Lake Erie, in 2020.
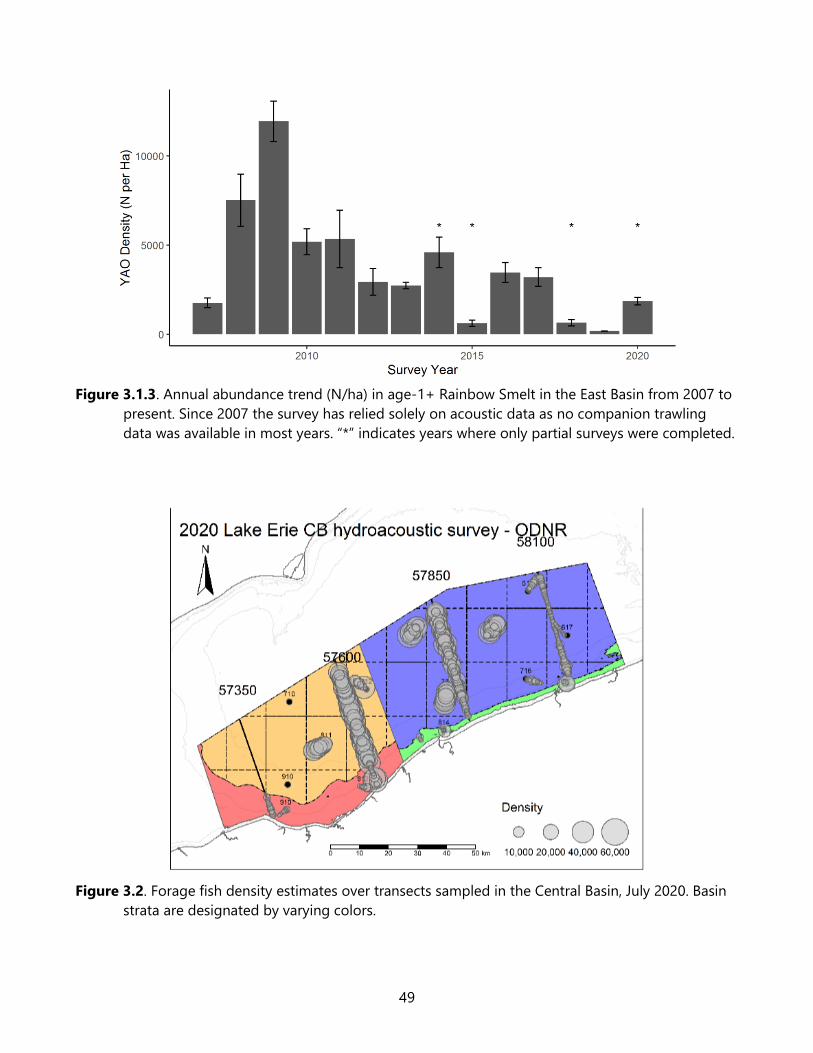
49
Figure 3.1.3. Annual abundance trend (N/ha) in age-1+ Rainbow Smelt in the East Basin from 2007 to
present. Since 2007 the survey has relied solely on acoustic data as no companion trawling
data was available in most years. “*” indicates years where only partial surveys were completed.
Figure 3.2. Forage fish density estimates over transects sampled in the Central Basin, July 2020. Basin
strata are designated by varying colors.
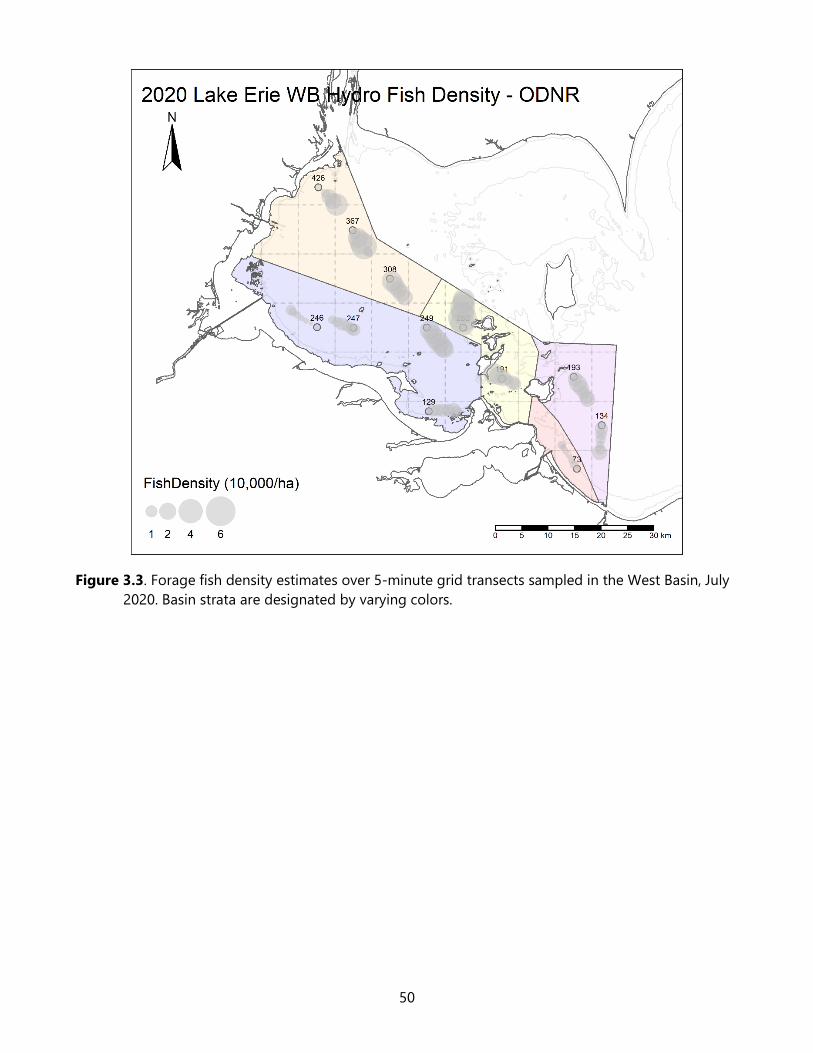
50
Figure 3.3. Forage fish density estimates over 5-minute grid transects sampled in the West Basin, July
2020. Basin strata are designated by varying colors.
51
Charge 4: Act as a point of contact for any new/novel invasive aquatic species.
(K. Towne and G. Wright)
Since 2016, the Forage Task Group (FTG) has maintained a database to track Aquatic Invasive
Species (AIS) in Lake Erie. The FTG adopted the US Fish and Wildlife Service (USFWS) list of injurious
wildlife (https://www.fws.gov/injuriouswildlife/list-of-injurious-wildlife.html) as the primary species to
track. Black, Silver, and Bighead carps are present in the Mississippi Basin, but have not yet established
in the Great Lakes Basin. Prussian Carp are abundant and spreading in rivers in southern Alberta but
also have not yet established in the Great Lakes Basin (Elgin et al. 2014, Docherty 2016). Although there
were no new invasive species captured in Lake Erie or its connected waterways in 2020, sampling effort
and scope were greatly reduced due to the COVID-19 pandemic.
Species not on the injurious wildlife list but of interest to Lake Erie agencies include Grass Carp,
Rudd, and Tench. Grass Carp is present and reproducing in at least two tributaries (Embke et al. 2016).
Grass Carp management is conducted through a multi-agency working group and a joint multi-
jurisdictional database is managed and distributed as part of that process. Grass Carp is not a new
species and the status of the Grass Carp population is reported elsewhere; therefore, we no longer
report on Grass Carp captures in this report.
Rudd have reproducing populations in Ontario and New York waters connected to Lake Erie;
there have been reported captures in the West Basin and Huron-Erie Corridor as recently as 2014
(USFWS 2016). However, there is no evidence of established populations west of the East Basin.
Tench, another non-native fish species absent from the USFWS list of injurious species, is also
of potential concern in the Great Lakes. As of 2016, Tench range extended from Quebec City to Lake
Saint Francis (~320 river km) along the St. Lawrence River and to the southern end of Lake Champlain
(~235 river km; see figures in Avlijas et al. 2018). Numbers of Tench captured by commercial fishermen
in Lake Saint Pierre has increase rapidly since 2008 (Avlijas et al. 2018). In 2018, a commercial
fisherman captured a mature female Tench in Lake Ontario in the Bay of Quinte near Belleville, ON (S.
Avlijas, McGill University, personal communication), approximately 90 km from the outlet of Lake
Ontario to the St. Lawrence River. The rapid expansion suggests there is an elevated risk of Tench
entering Lake Erie should their expansion into Lake Ontario continue. Tench sampling efforts were
limited in 2020 due to the COVID-19 pandemic. No Tench were captured in Lake Erie waters in 2020.
52
Protocol for Use of Forage Task Group Data and Reports
• The Forage Task Group has standardized methods, equipment, and protocols as much as possible;
however, data are not identical across agencies, management units, or basins. The data are based
on surveys that have limitations due to gear, depth, time and weather constraints that vary from
year to year. Any results, conclusions, or abundance information must be treated with respect to
these limitations. Caution should be exercised by outside researchers not familiar with each
agency’s collection and analysis methods to avoid misinterpretation.
• The FTG strongly encourages outside researchers to contact and involve the FTG in the use of any
specific data contained in this report. Coordination with the FTG can only enhance the final output
or publication and benefit all parties involved.
• Any data intended for publication should be reviewed by the FTG and written permission obtained
from the agency responsible for the data collection.
Citation:
Forage Task Group. 2021. Report of the Lake Erie Forage Task Group, March 2021. Presented to the
Standing Technical Committee, Lake Erie Committee of the Great Lakes Fishery Commission, Ann
Arbor, Michigan, USA.
53
Literature Cited
Avlijas, S., A. Ricciardi, and N. E. Mandrak. 2018. Eurasian tench (Tinca tinca): the next Great Lakes
invader. Canadian Journal of Fisheries and Aquatic Sciences 75:169-179.
Carlson, R. E. 1977. A trophic state index for lakes. Limnology and Oceanography 22(2):361-369.
Craig, J. K. 2012. Aggregation on the edge: effects of hypoxia avoidance on the spatial distribution of
brown shrimp and demersal fishes in the Northern Gulf of Mexico. Marine Ecology Progress
Series 445: 75-95.
Craig, J. K., and L.B. Crowder. 2005. Hypoxia-induced habitat shifts and energetic consequences in
Atlantic croaker and brown shrimp on the Gulf of Mexico shelf. Marine Ecology Progress Series
Vol. 294: 79-94.
Docherty, C. H. 2016. Establishment, spread and impact of Prussian Carp (Carassius gibelio), a new
invasive species in Western North America. Master’s Thesis, University of Alberta, 69 pp.
Eby, L. A., and L.B. Crowder. 2002. Hypoxia-based habitat compression in the Neuse River Estuary:
context-dependent shifts in behavioral avoidance thresholds. Canadian Journal of Fisheries
and Aquatic Sciences 59:952-965.
Elgin, E. L., H. R. Tunna, and L. J. Jackson. 2014. First confirmed records of Prussian carp, Carassius
gibelio (Bloch, 1782) in open waters of North America. BioInvasions Records 3:275-282.
Embke, H. S., P. M Kočovský, C. A. Richter, J. J. Pritt, C. M. Mayer, and S. S. Qian. 2016. First direct
confirmation of Grass Carp spawning in a Great Lakes tributary. Journal of Great Lakes Research
42: 899-903.
Forage Task Group. 2014. Report of the Lake Erie Forage Task Group, March 2014. Presented to the
Standing Technical Committee, Lake Erie Committee of the Great Lakes Fishery Commission,
Ann Arbor, Michigan, USA.
Forage Task Group. 2017. Report of the Lake Erie Forage Task Group, March 2017. Presented to the
Standing Technical Committee, Lake Erie Committee of the Great Lakes Fishery Commission,
Ann Arbor, Michigan, USA.
Kraus, R. T., Knight, C.T., Farmer, T.M., Gorman, A.M., Collingsworth, P.D., Warren, G.J., Kocovsky, P.M.,
and J.D. Conroy. 2015. Dynamic hypoxic zones in Lake Erie compress fish habitat, altering
vulnerability to fishing gears. Canadian Journal of Fisheries and Aquatic Sciences 72 (6): 797-
806.
Leach, J. H., M.G. Johnson, J.R.M. Kelso, J. Hartman, W. Numan, and B. Ents. 1977. Responses of percid
fishes and their habitats to eutrophication. Journal of the Fisheries Research Board of Canada
34:1964-1971.
Love, R. H. 1971. Dorsal aspect target strength of an individual fish. Journal of the Acoustical Society
of America 49: 816-823.
Markham, J. L. and P. D Wilkins. 2021. Forage and juvenile yellow perch survey. Section C in NYSDEC
2021, Lake Erie 2020 Annual Report. New York State Department of Environmental
Conservation, Albany, USA.
Nicholls, K. H. and G. J. Hopkins. 1993. Recent changes in Lake Erie (north shore) phytoplankton:
cumulative impacts of phosphorus loading reductions and the zebra mussel introduction.
Journal of Great Lakes Research 19: 637-647.
Parker-Stetter, S. L., L. G. Rudstam, P. J. Sullivan and D. M. Warner. 2009. Standard operating
procedures for fisheries acoustic surveys in the Great Lakes. Great Lakes Fishery Commission
Special Publication 09-01.
54
Patterson, M. W. R., J.J.H. Ciborowski, and D. R. Barton. 2005. The distribution and abundance of
Dreissena species (Dreissenidae) in Lake Erie, 2002. Journal of Great Lakes Research 31(Suppl.
2): 223-237.
Ryan, P. A., R. Knight, R. MacGregor, G. Towns, R. Hoopes, and W. Culligan. 2003. Fish-community
goals and objectives for Lake Erie. Great Lakes Fisheries Commission Special Publication 03-02.
56 p.
Ryder, R. A., and S. R. Kerr. 1978. Adult Walleye in the percid community - a niche definition based on
feeding behavior and food specificity. American Fisheries Society Special Publication 11.
Tyson, J. T., T. B. Johnson, C. T. Knight, M. T. Bur. 2006. Intercalibration of Research Survey Vessels on
Lake Erie. North American Journal of Fisheries Management 26:559-570.
US Fish and Wildlife Service (USFWS). 2016. Early detection and monitoring of non-native fishes in
Lake Erie, 2013-2015. U.S. Fish and Wildlife Service, Lower Great Lakes Fish and Wildlife
Conservation Office, Basom, NY and U.S. Fish and Wildlife Service, Alpena Fish and Wildlife
Conservation Office, Alpena, MI. 59 pp.
Wilkins, P. D. 2021. Warmwater gill net assessment. Section D in NYSDEC 2021, Lake Erie 2020
Annual Report. New York State Department of Environmental Conservation, Albany, USA.
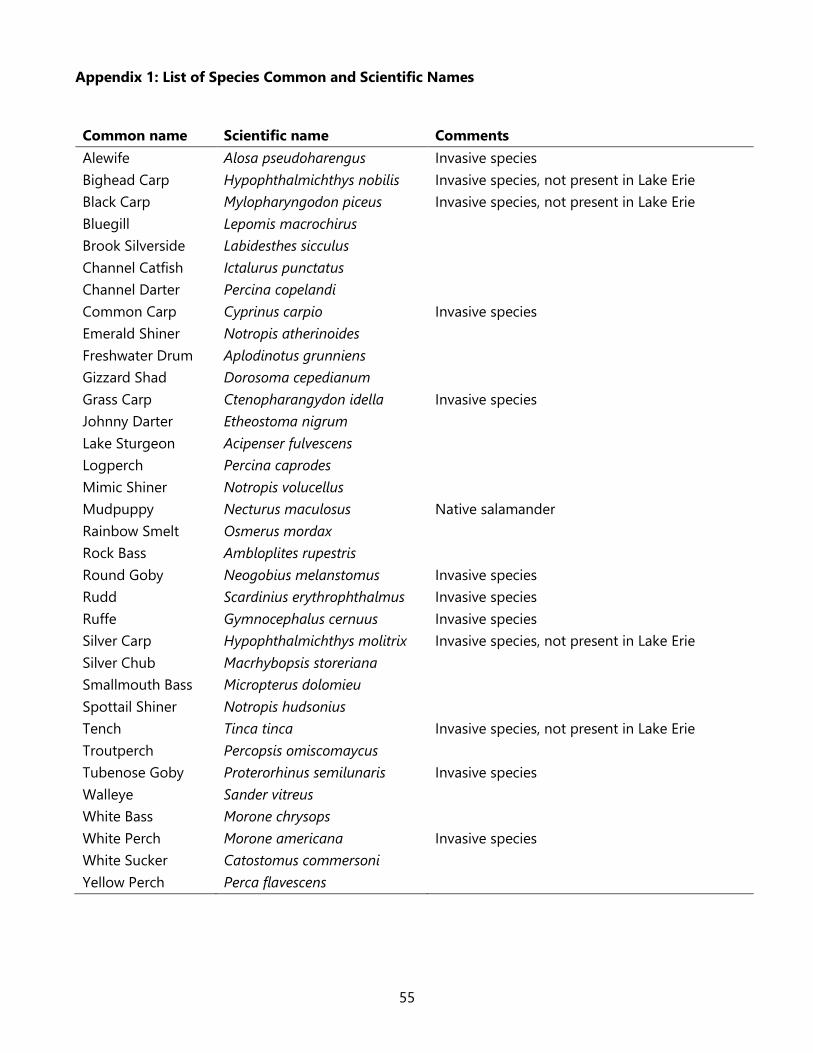
55
Appendix 1: List of Species Common and Scientific Names
Common name Scientific name Comments
Alewife Alosa pseudoharengus Invasive species
Bighead Carp Hypophthalmichthys nobilis Invasive species, not present in Lake Erie
Black Carp Mylopharyngodon piceus Invasive species, not present in Lake Erie
Bluegill Lepomis macrochirus
Brook Silverside Labidesthes sicculus
Channel Catfish Ictalurus punctatus
Channel Darter Percina copelandi
Common Carp Cyprinus carpio Invasive species
Emerald Shiner Notropis atherinoides
Freshwater Drum Aplodinotus grunniens
Gizzard Shad Dorosoma cepedianum
Grass Carp Ctenopharangydon idella Invasive species
Johnny Darter Etheostoma nigrum
Lake Sturgeon Acipenser fulvescens
Logperch Percina caprodes
Mimic Shiner Notropis volucellus
Mudpuppy Necturus maculosus Native salamander
Rainbow Smelt Osmerus mordax
Rock Bass Ambloplites rupestris
Round Goby Neogobius melanstomus Invasive species
Rudd Scardinius erythrophthalmus Invasive species
Ruffe Gymnocephalus cernuus Invasive species
Silver Carp Hypophthalmichthys molitrix Invasive species, not present in Lake Erie
Silver Chub Macrhybopsis storeriana
Smallmouth Bass Micropterus dolomieu
Spottail Shiner Notropis hudsonius
Tench Tinca tinca Invasive species, not present in Lake Erie
Troutperch Percopsis omiscomaycus
Tubenose Goby Proterorhinus semilunaris Invasive species
Walleye Sander vitreus
White Bass Morone chrysops
White Perch Morone americana Invasive species
White Sucker Catostomus commersoni
Yellow Perch Perca flavescens
56
Appendix 2. Lake Erie Hydroacoustic Survey Redesign Evaluation
Andy Cook, Ontario Ministry of Natural Resources and Forestry
John Deller, Ohio Division of Wildlife
Rebecca Dillon, U.S. Geological Survey
Mark DuFour, Ohio Division of Wildlife
Jeremy Holden, Ontario Ministry of Natural Resources and Forestry
Patrick Kočovský, U.S. Geological Survey
James Roberts, U.S. Geological Survey
Joseph Schmitt, U.S. Geological Survey
Zak Slagle, Ohio Division of Wildlife
Existing Survey Background
The primary purpose of Lake Erie hydroacoustic surveys (Figure 1) is to estimate densities of important
forage fishes including Gizzard Shad and Emerald Shiner in the West Basin, Rainbow Smelt and
Emerald Shiner in the Central Basin, and Rainbow Smelt in the East Basin. As of 2019, all surveys took
place within five days of the new moon in July to synchronize across the lake; however, each survey
routinely experienced challenges that inhibit survey completion. A brief history and description of
surveys in each basin follows:
• Lake Erie hydroacoustic surveys have been conducted annually in the East Basin since 1993.
Effort is divided among six strata with two randomly chosen north-south transects within each
stratum. Companion midwater trawls were initially completed by NYSDEC until 2007. These
trawls determined that >95% of the fish caught in cold-water habitat were age-1+ Rainbow
Smelt which lead to an analytical approach that vertically splits the echogram based on
temperature and target size such that all fish in the age-1+ size range (TS -59dB to -40dB) are
defined as age-1+ Rainbow Smelt. The entire survey is routinely complete; however, only four
of six strata were sampled in 2014, only three of the strata in 2015, and only Ontario waters in
2018 and 2020.
• The Central Basin hydroacoustic survey began in 2000. In cooperation, OMNRF, ODNR, and
USGS implemented surveys with consistent methodology since 2004. The survey design targets
eight cross-basin transects each year, a total of 643 km. Midwater trawl samples are taken
along each transect, usually 6–9 trawls per transect. These trawls allow hydroacoustic targets to
be apportioned by species. Thus, the survey estimates relative density and biomass for each
species. Vessel limitations require four to five nights of good weather (waves < 1.0 m). Given
the survey length and short temporal window, the full eight-transect survey was completed
only once between 2004–2019.
• The West Basin hydroacoustic survey began a year later (2005) and is conducted solely by
ODNR. While midwater trawls were originally planned, none have been accomplished to date;
therefore, the West Basin survey cannot apportion by species and only generates a combined
estimate of relative forage density and biomass. The survey design calls for three cross-basin
transects a year, totaling 143 km. Due to vessel limitations, the full survey requires three nights
of good weather (waves < 0.4 m and wind direction parallel to transect direction). Given these
strict requirements, the full survey was completed in only 8 of 13 years, with no midwater
trawling.
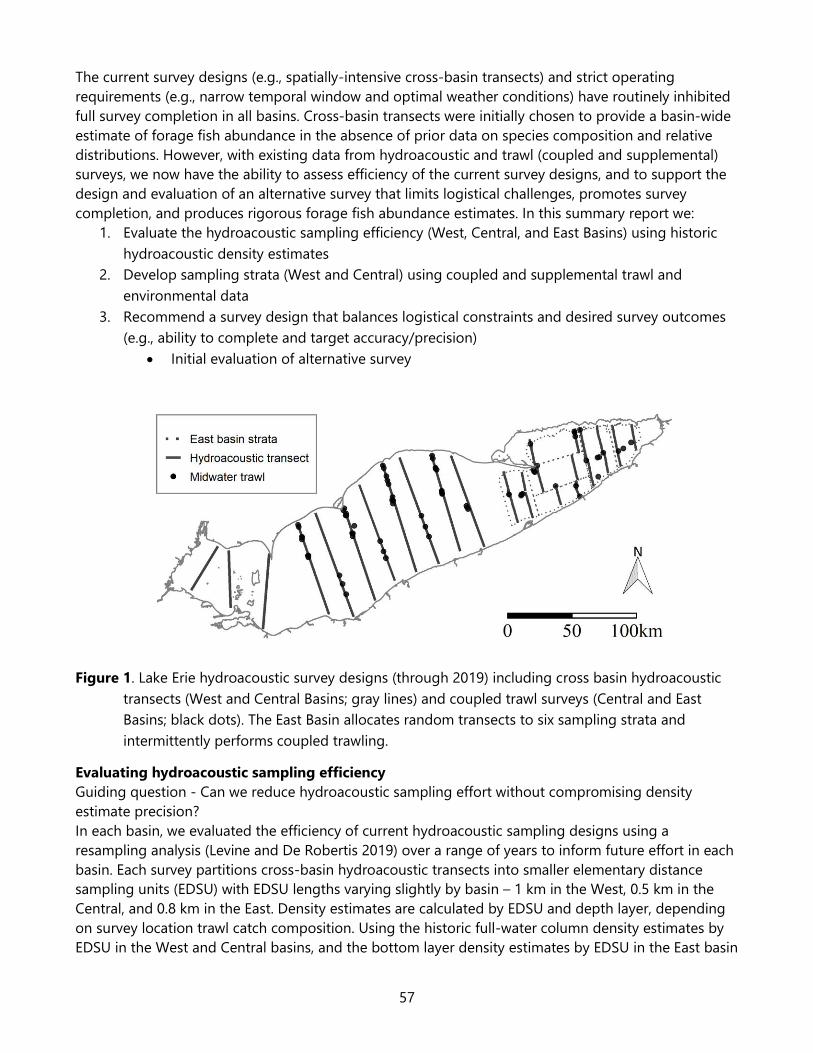
57
The current survey designs (e.g., spatially-intensive cross-basin transects) and strict operating
requirements (e.g., narrow temporal window and optimal weather conditions) have routinely inhibited
full survey completion in all basins. Cross-basin transects were initially chosen to provide a basin-wide
estimate of forage fish abundance in the absence of prior data on species composition and relative
distributions. However, with existing data from hydroacoustic and trawl (coupled and supplemental)
surveys, we now have the ability to assess efficiency of the current survey designs, and to support the
design and evaluation of an alternative survey that limits logistical challenges, promotes survey
completion, and produces rigorous forage fish abundance estimates. In this summary report we:
1. Evaluate the hydroacoustic sampling efficiency (West, Central, and East Basins) using historic
hydroacoustic density estimates
2. Develop sampling strata (West and Central) using coupled and supplemental trawl and
environmental data
3. Recommend a survey design that balances logistical constraints and desired survey outcomes
(e.g., ability to complete and target accuracy/precision)
• Initial evaluation of alternative survey
Figure 1. Lake Erie hydroacoustic survey designs (through 2019) including cross basin hydroacoustic
transects (West and Central Basins; gray lines) and coupled trawl surveys (Central and East
Basins; black dots). The East Basin allocates random transects to six sampling strata and
intermittently performs coupled trawling.
Evaluating hydroacoustic sampling efficiency
Guiding question - Can we reduce hydroacoustic sampling effort without compromising density
estimate precision?
In each basin, we evaluated the efficiency of current hydroacoustic sampling designs using a
resampling analysis (Levine and De Robertis 2019) over a range of years to inform future effort in each
basin. Each survey partitions cross-basin hydroacoustic transects into smaller elementary distance
sampling units (EDSU) with EDSU lengths varying slightly by basin – 1 km in the West, 0.5 km in the
Central, and 0.8 km in the East. Density estimates are calculated by EDSU and depth layer, depending
on survey location trawl catch composition. Using the historic full-water column density estimates by
EDSU in the West and Central basins, and the bottom layer density estimates by EDSU in the East basin
58
we calculated the relative standard error (RSE = 100 x SE/mean) in each year with respect to reduced
survey effort (i.e., fewer sampled EDSU). We established a precision threshold of <= 15% RSE change
for considering reduced sampling effort (Hardin and Conner 1992, Dumont and Schlechte 2004).
West Basin - The current survey prescribes 143 km of cross-basin transects which generates 143 1-km
EDSU if the full survey is completed. Our efficiency analysis suggested that we were over sampling the
West Basin, and that a mild reduction in effort (143 to 100 km) would produce future density estimates
with precision similar (< 15% RSE) to historical estimates (Figure 2).
Central Basin - The current survey prescribes 643 km of cross-basin transects which generates 1286
0.5-km EDSU if the full survey is completed. Our efficiency analysis suggested that we were
substantially oversampling the Central Basin, and that a large reduction in effort (643 to 100 km)
would conservatively produce future density estimates with precision similar (< 15% RSE) to historic
estimates (Figure 2).
East Basin - The current survey prescribes approximately 350 km of cross-basin transects to complete
the entire survey with annual variation due to randomized transects. This generates over 430 0.8-km
EDSU when the full transects can be completed. Our preliminary analysis suggested that a reduction to
300 EDSU would achieve a survey RSE <15% (Figure 2). At this time, the analysis has not considered
how differences across strata may affect future allocation of effort within each stratum.
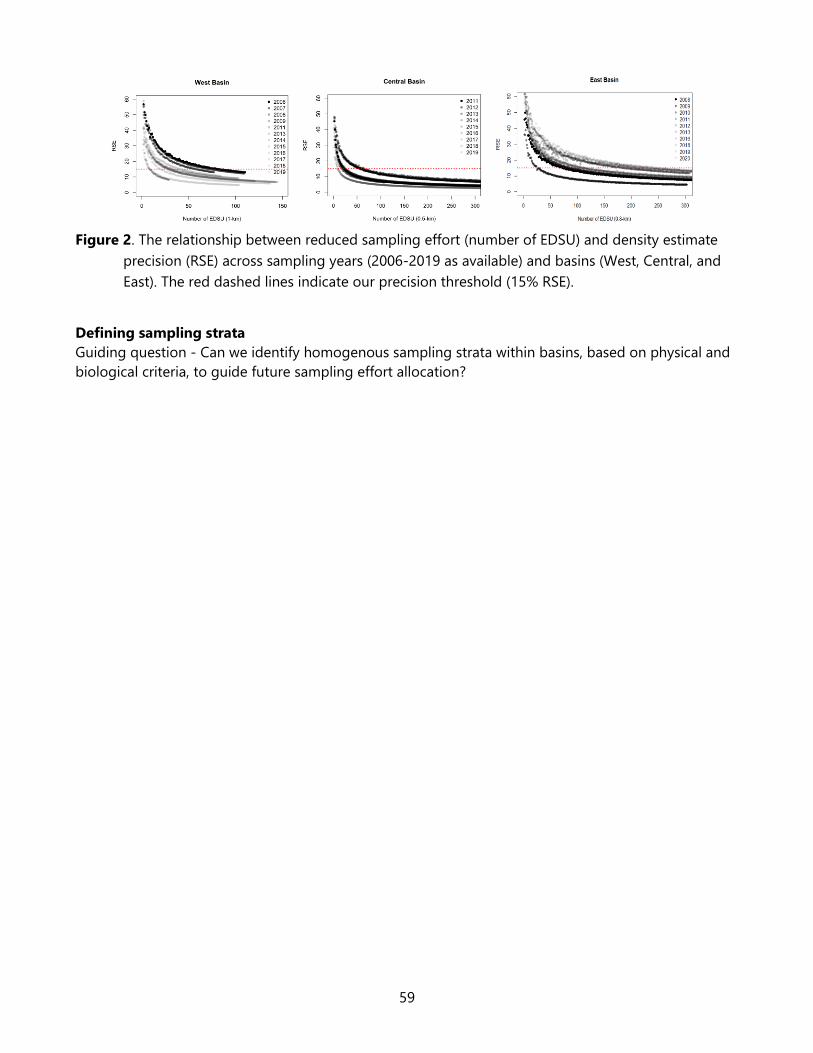
59
Figure 2. The relationship between reduced sampling effort (number of EDSU) and density estimate
precision (RSE) across sampling years (2006-2019 as available) and basins (West, Central, and
East). The red dashed lines indicate our precision threshold (15% RSE).
Defining sampling strata
Guiding question - Can we identify homogenous sampling strata within basins, based on physical and
biological criteria, to guide future sampling effort allocation?
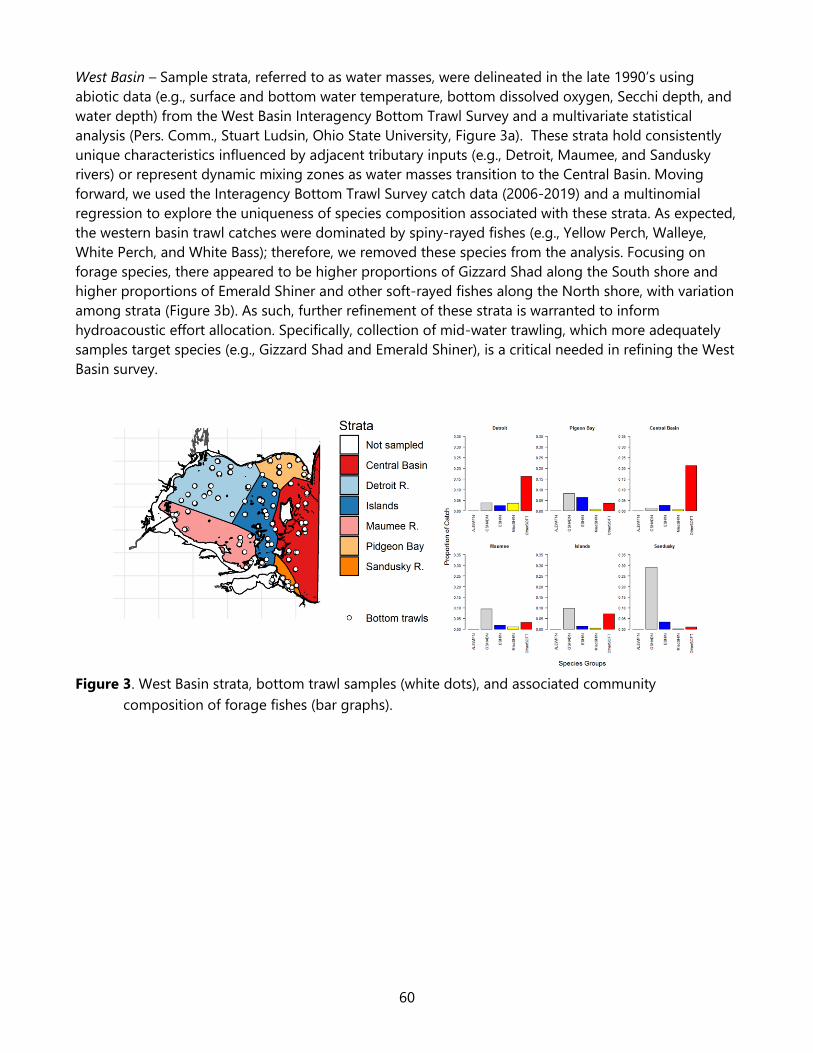
60
West Basin – Sample strata, referred to as water masses, were delineated in the late 1990’s using
abiotic data (e.g., surface and bottom water temperature, bottom dissolved oxygen, Secchi depth, and
water depth) from the West Basin Interagency Bottom Trawl Survey and a multivariate statistical
analysis (Pers. Comm., Stuart Ludsin, Ohio State University, Figure 3a). These strata hold consistently
unique characteristics influenced by adjacent tributary inputs (e.g., Detroit, Maumee, and Sandusky
rivers) or represent dynamic mixing zones as water masses transition to the Central Basin. Moving
forward, we used the Interagency Bottom Trawl Survey catch data (2006-2019) and a multinomial
regression to explore the uniqueness of species composition associated with these strata. As expected,
the western basin trawl catches were dominated by spiny-rayed fishes (e.g., Yellow Perch, Walleye,
White Perch, and White Bass); therefore, we removed these species from the analysis. Focusing on
forage species, there appeared to be higher proportions of Gizzard Shad along the South shore and
higher proportions of Emerald Shiner and other soft-rayed fishes along the North shore, with variation
among strata (Figure 3b). As such, further refinement of these strata is warranted to inform
hydroacoustic effort allocation. Specifically, collection of mid-water trawling, which more adequately
samples target species (e.g., Gizzard Shad and Emerald Shiner), is a critical needed in refining the West
Basin survey.
Figure 3. West Basin strata, bottom trawl samples (white dots), and associated community
composition of forage fishes (bar graphs).
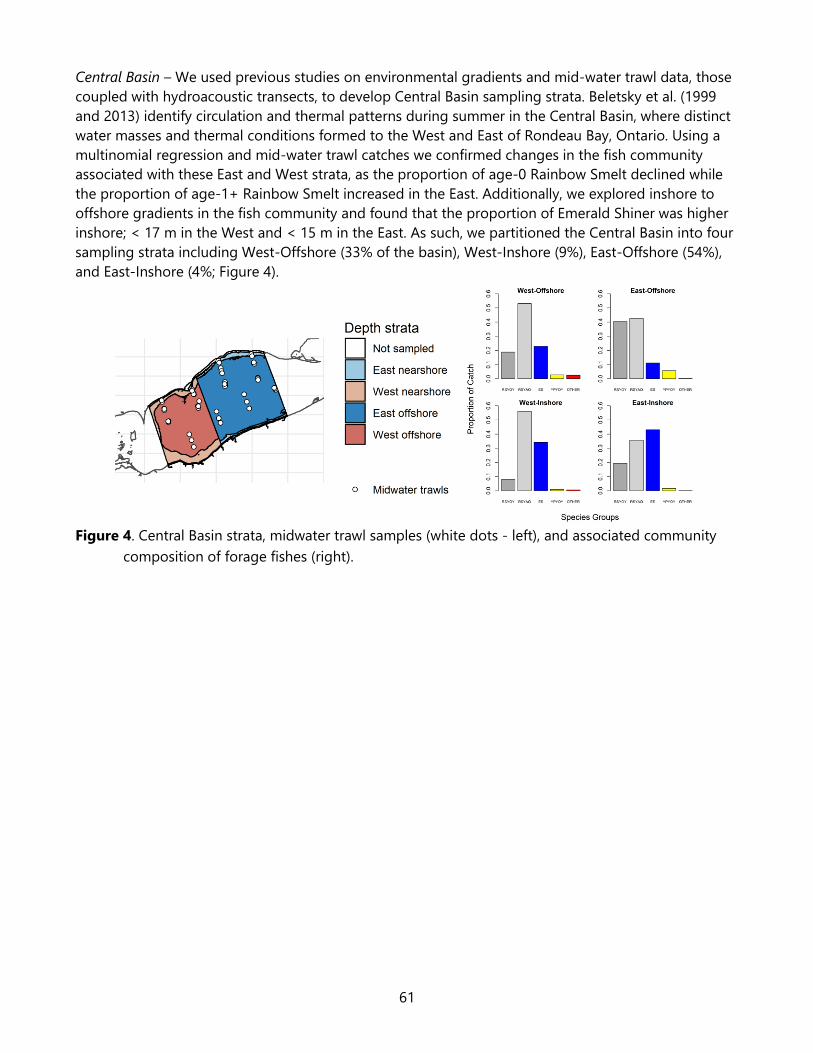
61
Central Basin – We used previous studies on environmental gradients and mid-water trawl data, those
coupled with hydroacoustic transects, to develop Central Basin sampling strata. Beletsky et al. (1999
and 2013) identify circulation and thermal patterns during summer in the Central Basin, where distinct
water masses and thermal conditions formed to the West and East of Rondeau Bay, Ontario. Using a
multinomial regression and mid-water trawl catches we confirmed changes in the fish community
associated with these East and West strata, as the proportion of age-0 Rainbow Smelt declined while
the proportion of age-1+ Rainbow Smelt increased in the East. Additionally, we explored inshore to
offshore gradients in the fish community and found that the proportion of Emerald Shiner was higher
inshore; < 17 m in the West and < 15 m in the East. As such, we partitioned the Central Basin into four
sampling strata including West-Offshore (33% of the basin), West-Inshore (9%), East-Offshore (54%),
and East-Inshore (4%; Figure 4).
Figure 4. Central Basin strata, midwater trawl samples (white dots - left), and associated community
composition of forage fishes (right).
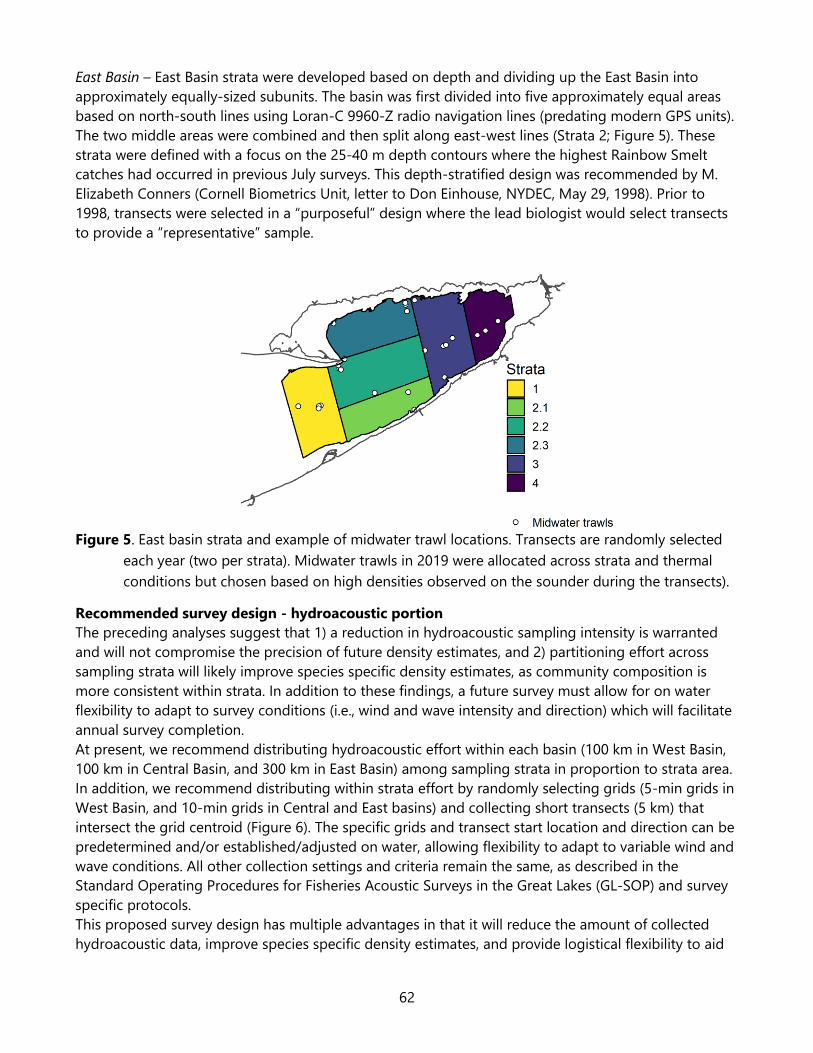
62
East Basin – East Basin strata were developed based on depth and dividing up the East Basin into
approximately equally-sized subunits. The basin was first divided into five approximately equal areas
based on north-south lines using Loran-C 9960-Z radio navigation lines (predating modern GPS units).
The two middle areas were combined and then split along east-west lines (Strata 2; Figure 5). These
strata were defined with a focus on the 25-40 m depth contours where the highest Rainbow Smelt
catches had occurred in previous July surveys. This depth-stratified design was recommended by M.
Elizabeth Conners (Cornell Biometrics Unit, letter to Don Einhouse, NYDEC, May 29, 1998). Prior to
1998, transects were selected in a “purposeful” design where the lead biologist would select transects
to provide a “representative” sample.
Figure 5. East basin strata and example of midwater trawl locations. Transects are randomly selected
each year (two per strata). Midwater trawls in 2019 were allocated across strata and thermal
conditions but chosen based on high densities observed on the sounder during the transects).
Recommended survey design - hydroacoustic portion
The preceding analyses suggest that 1) a reduction in hydroacoustic sampling intensity is warranted
and will not compromise the precision of future density estimates, and 2) partitioning effort across
sampling strata will likely improve species specific density estimates, as community composition is
more consistent within strata. In addition to these findings, a future survey must allow for on water
flexibility to adapt to survey conditions (i.e., wind and wave intensity and direction) which will facilitate
annual survey completion.
At present, we recommend distributing hydroacoustic effort within each basin (100 km in West Basin,
100 km in Central Basin, and 300 km in East Basin) among sampling strata in proportion to strata area.
In addition, we recommend distributing within strata effort by randomly selecting grids (5-min grids in
West Basin, and 10-min grids in Central and East basins) and collecting short transects (5 km) that
intersect the grid centroid (Figure 6). The specific grids and transect start location and direction can be
predetermined and/or established/adjusted on water, allowing flexibility to adapt to variable wind and
wave conditions. All other collection settings and criteria remain the same, as described in the
Standard Operating Procedures for Fisheries Acoustic Surveys in the Great Lakes (GL-SOP) and survey
specific protocols.
This proposed survey design has multiple advantages in that it will reduce the amount of collected
hydroacoustic data, improve species specific density estimates, and provide logistical flexibility to aid
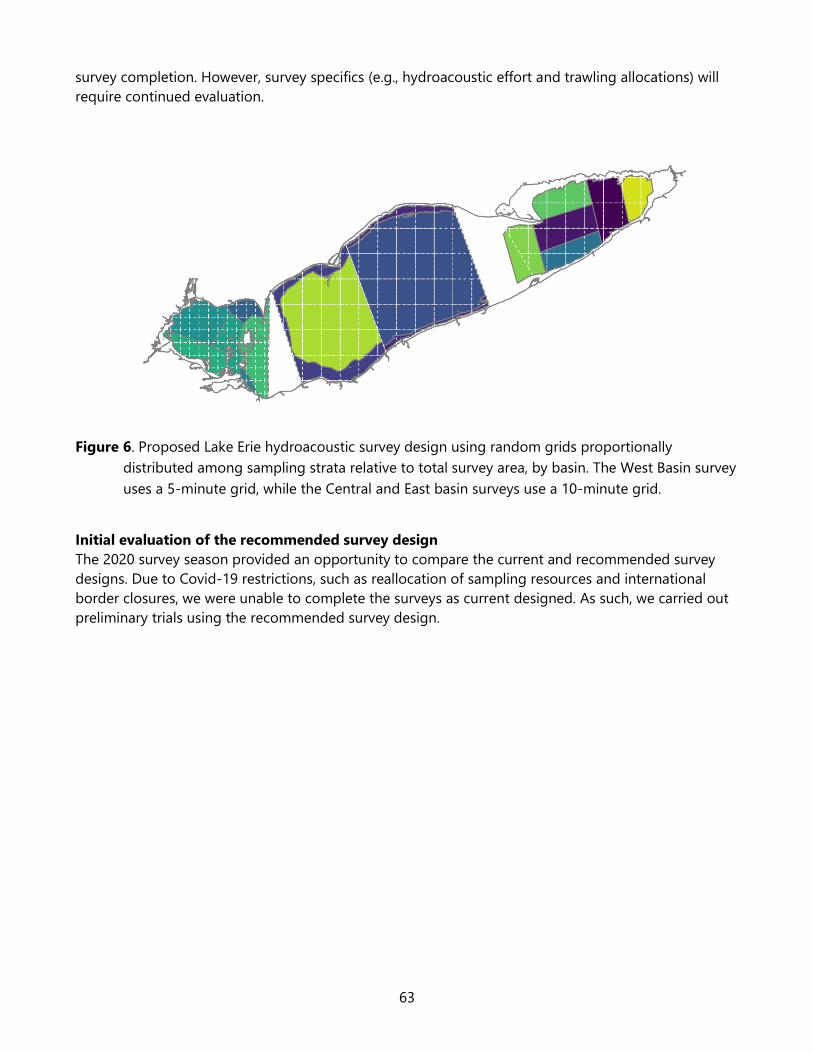
63
survey completion. However, survey specifics (e.g., hydroacoustic effort and trawling allocations) will
require continued evaluation.
Figure 6. Proposed Lake Erie hydroacoustic survey design using random grids proportionally
distributed among sampling strata relative to total survey area, by basin. The West Basin survey
uses a 5-minute grid, while the Central and East basin surveys use a 10-minute grid.
Initial evaluation of the recommended survey design
The 2020 survey season provided an opportunity to compare the current and recommended survey
designs. Due to Covid-19 restrictions, such as reallocation of sampling resources and international
border closures, we were unable to complete the surveys as current designed. As such, we carried out
preliminary trials using the recommended survey design.
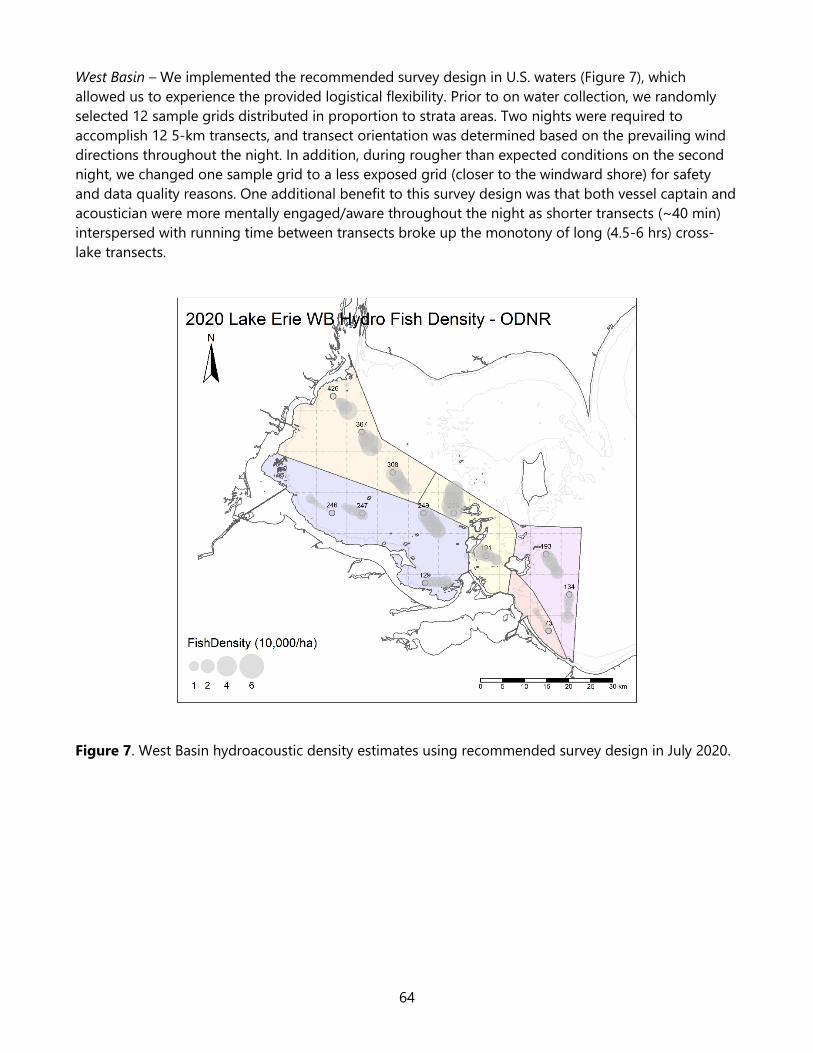
64
West Basin – We implemented the recommended survey design in U.S. waters (Figure 7), which
allowed us to experience the provided logistical flexibility. Prior to on water collection, we randomly
selected 12 sample grids distributed in proportion to strata areas. Two nights were required to
accomplish 12 5-km transects, and transect orientation was determined based on the prevailing wind
directions throughout the night. In addition, during rougher than expected conditions on the second
night, we changed one sample grid to a less exposed grid (closer to the windward shore) for safety
and data quality reasons. One additional benefit to this survey design was that both vessel captain and
acoustician were more mentally engaged/aware throughout the night as shorter transects (~40 min)
interspersed with running time between transects broke up the monotony of long (4.5-6 hrs) cross-
lake transects.
Figure 7. West Basin hydroacoustic density estimates using recommended survey design in July 2020.
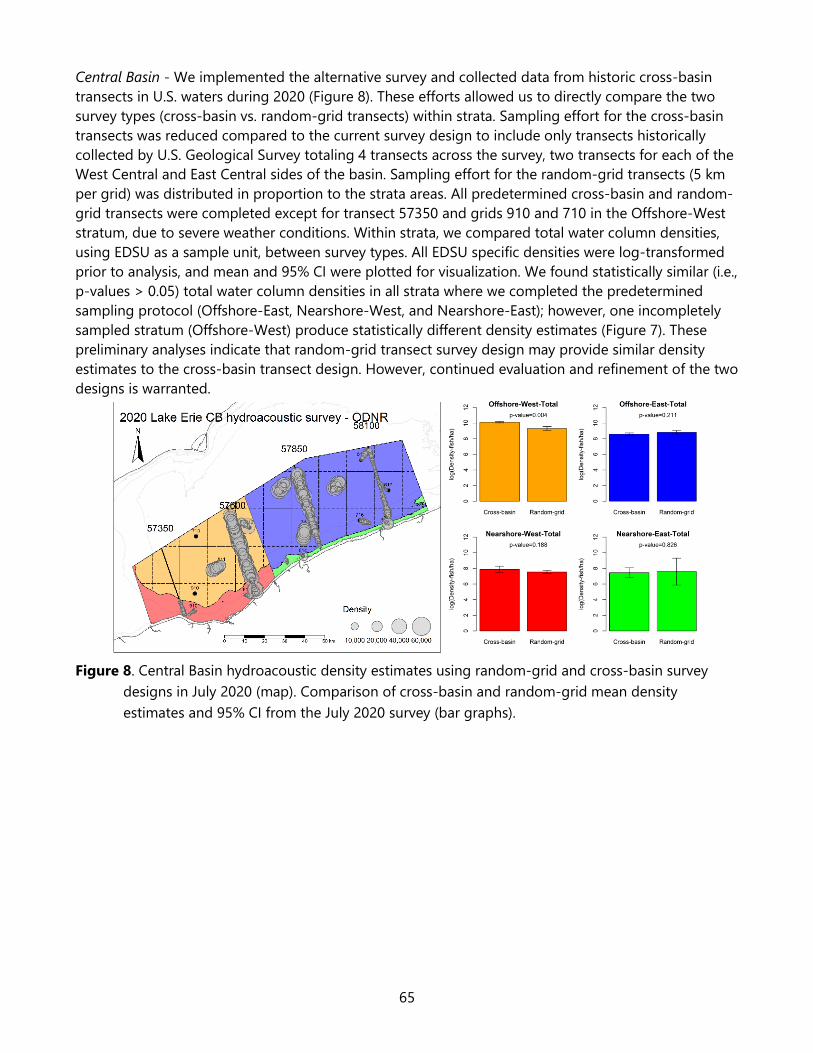
65
Central Basin - We implemented the alternative survey and collected data from historic cross-basin
transects in U.S. waters during 2020 (Figure 8). These efforts allowed us to directly compare the two
survey types (cross-basin vs. random-grid transects) within strata. Sampling effort for the cross-basin
transects was reduced compared to the current survey design to include only transects historically
collected by U.S. Geological Survey totaling 4 transects across the survey, two transects for each of the
West Central and East Central sides of the basin. Sampling effort for the random-grid transects (5 km
per grid) was distributed in proportion to the strata areas. All predetermined cross-basin and random-
grid transects were completed except for transect 57350 and grids 910 and 710 in the Offshore-West
stratum, due to severe weather conditions. Within strata, we compared total water column densities,
using EDSU as a sample unit, between survey types. All EDSU specific densities were log-transformed
prior to analysis, and mean and 95% CI were plotted for visualization. We found statistically similar (i.e.,
p-values > 0.05) total water column densities in all strata where we completed the predetermined
sampling protocol (Offshore-East, Nearshore-West, and Nearshore-East); however, one incompletely
sampled stratum (Offshore-West) produce statistically different density estimates (Figure 7). These
preliminary analyses indicate that random-grid transect survey design may provide similar density
estimates to the cross-basin transect design. However, continued evaluation and refinement of the two
designs is warranted.
Figure 8. Central Basin hydroacoustic density estimates using random-grid and cross-basin survey
designs in July 2020 (map). Comparison of cross-basin and random-grid mean density
estimates and 95% CI from the July 2020 survey (bar graphs).
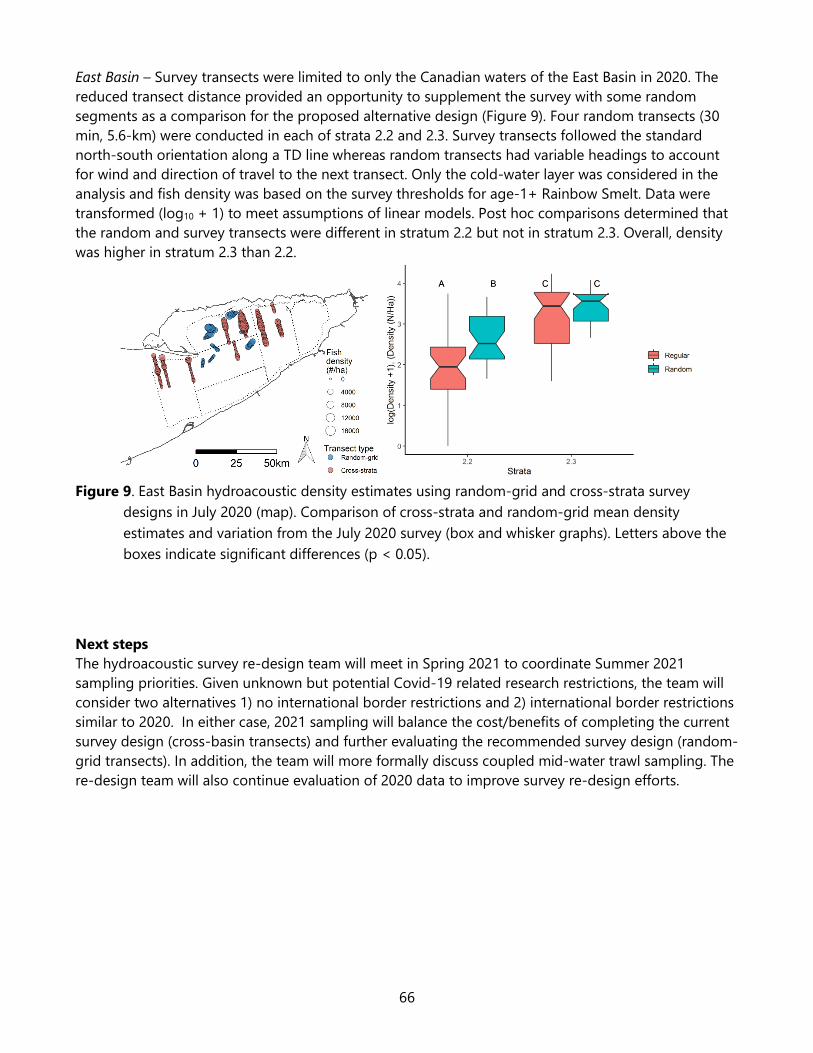
66
East Basin – Survey transects were limited to only the Canadian waters of the East Basin in 2020. The
reduced transect distance provided an opportunity to supplement the survey with some random
segments as a comparison for the proposed alternative design (Figure 9). Four random transects (30
min, 5.6-km) were conducted in each of strata 2.2 and 2.3. Survey transects followed the standard
north-south orientation along a TD line whereas random transects had variable headings to account
for wind and direction of travel to the next transect. Only the cold-water layer was considered in the
analysis and fish density was based on the survey thresholds for age-1+ Rainbow Smelt. Data were
transformed (log10 + 1) to meet assumptions of linear models. Post hoc comparisons determined that
the random and survey transects were different in stratum 2.2 but not in stratum 2.3. Overall, density
was higher in stratum 2.3 than 2.2.
Figure 9. East Basin hydroacoustic density estimates using random-grid and cross-strata survey
designs in July 2020 (map). Comparison of cross-strata and random-grid mean density
estimates and variation from the July 2020 survey (box and whisker graphs). Letters above the
boxes indicate significant differences (p < 0.05).
Next steps
The hydroacoustic survey re-design team will meet in Spring 2021 to coordinate Summer 2021
sampling priorities. Given unknown but potential Covid-19 related research restrictions, the team will
consider two alternatives 1) no international border restrictions and 2) international border restrictions
similar to 2020. In either case, 2021 sampling will balance the cost/benefits of completing the current
survey design (cross-basin transects) and further evaluating the recommended survey design (random-
grid transects). In addition, the team will more formally discuss coupled mid-water trawl sampling. The
re-design team will also continue evaluation of 2020 data to improve survey re-design efforts.
67
References
Beletsky, D., Saylor, J.H., and Schwab, D.J. 1999. Mean circulation in the Great Lakes. Journal of Great
Lakes Research, 25(1): 78 – 93.
Beletsky, D., Hawley, N., and Rao, Y.R. 2013. Modeling summer circulation and thermal structure of
Lake Erie. Journal of Geophysical Research: Oceans, 118: 6238 – 6252.
Dumont, S.C., and Schlechte, W. 2004. Use of resampling to evaluate a simple random sampling design
for general monitoring of fishes in Texas reservoirs. North American Journal of Fisheries
Management, 24(2): 408 – 416.
Hardin, S., and Connor, L.L. 1992. Variability of electrofishing crew efficiency, and sampling
requirements for estimating reliable catch rates. North American Journal of Fisheries
Management, 12: 612 – 617.
Levine, M., and De Robertis, A. 2019. Don’t work too hard: Subsampling leads to efficient analysis of
large acoustic datasets. Fisheries Research, 219: 105323.