Tectonics at the intersection of the East Pacific Rise with Tamayo Transform fault
Upload
independentCategory
view
2download
0
JOURNAL OF GEOPHYSICAL RESEARCH, VOL. 92, NO. B10, PAGES 10,485-10,510, SEPTEMBER 10, 1987
Earthquake Source Mechanisms and Transform Fault Tectonics in the Gulf of California
JOHN A. GOFF, ERIC A. BERGMAN, AND SEAN C. SOLOMON
Department of Earth, Atmospheric, and Planetary Sciences, Massachusetts Institute of Technolo•ly, Cambrid•le
We have determined the source parameters of 19 earthquakes in the Gulf of California from an inversion of long-period P and SH waveforms. Fifteen of the earthquakes, on transforms between the Cerro Prieto fault and the Tamayo Fracture Zone, are characterized by right-lateral strike-slip faulting, and all but one of these likely reflect the relative motion between the North American and Pacific plates. Slip vectors from these events constitute an improved data set for determination of North American- Pacific motion. Most centroid depths are poorly resolved because of trade-offs between depth and source time function. Both the ranges in acceptable centroid depths and the average fault width estimated from cumulative moment release during this century are compatible with the hypothesis that seismic slip does not extend below about 10-km depth, or the approximate depth of the nominal 800øC isotherm, along the principal oceanic transforms of the gulf. Two normal-faulting earthquakes during a swarm in the northern gulf have centroid depths of 6 + 3 and 3 + 2 km, consistent with earthquake centroid depths in other settings (Arctic, northern Red Sea) where plate separation has carried continental rifting nearly to completion. A thrust-faulting earthquake near the Tres Marias escarpment has a centroid depth of 11 + 2 km and probably reflects relative motion between the Rivera and North American plates. The transition from oceanic transform faulting to continental transform faulting in the northern gulf is marked by a broadening of the zone of deformation and a 10 ø change in the strike of the principal fault accommodating plate motion. Fault kinematics in the transition zone may be understood in terms of an unstable FFF triple junction, with the Agua Blanca and San Miguel faults acting to transfer a portion of the plate motion to faults west of the San Andreas system and with the Delfin and Wagner basins forming as a direct result of slip on the three fault systems meeting in the junction region.
INTRODUCTION
The source characteristics of large earthquakes in the Gulf of California are of interest for several reasons. The azimuths
of slip vectors of earthquakes along the predominantly trans- form plate boundary in the gulf provide key constraints on the relative motion between the North American and Pacific
plates [Minster et al., 1974; Chase, 1978' Minster and Jordan, 1978]. The Gulf of California is also the focus of ongoing geodetic programs to determine the distribution of defor- mation across the plate boundary [Kasser et al., 1987' Tralli et al., 1987], and the history of seismic slip on faults in the gulf will provide an important context within which the geodetic results can be interpreted. Finally, the region offers an op- portunity to test generalizations about the depth extent of seismic slip on transform faults in young oceanic lithosphere [Burr and Solomon, 1978' En•leln et al., 1986' Berylman et al., 1986] and along a transition between oceanic and continental transform faulting [Phillips, 1964]. In this paper we determine the source mechanisms and centroid depths of 19 earthquakes in the Gulf of California from an inversion of long-period P and $H waveforms [Nabelek, 1984].
Several studies of the focal mechanisms of major earth- quakes in the Gulf of California have been published [Sykes, 1970' Thatcher and Brune, 1971' Molnar, 1973; Tatham and Savino, 1974' Reichle et al., 1976; Sharman et al., 1976' Mun•luia et al., 1977]. Most of these studies relied primarily on P wave first motions. The azimuths of the slip vectors indicated by these fault plane solutions have a typical uncer- tainty of _+ 10 ø [Sykes, 1970' Molnar, 1973]. A forward mod- eling investigation of the E1 Golfo earthquake of August 7,
Copyright 1987 by the American Geophysical Union.
Paper number 7B6016. 0148-0227/87/007 B-6016505.00
1966, by Ebel et al. [1978] represents the only previous use of long-period P and SH waveform data in a source study of an earthquake in the gulf region. A number of investigations of earthquake aftershocks and swarms in the Gulf of California have also been conducted with drifting sonobuoys [Reid et al., 1973; Reichle et al., 1976; Reichle and Reid, 1977; Mun•luia et al., 1977].
After a brief introduction to the tectonics of the Gulf of
California region in the next section, we summarize the wave- form inversion procedure and the estimated precision of derived source parameters. Particular attention is devoted to source complexity, resolution of slip vector azimuth, and reso- lution of centroid depth. After a discussion of these earth- quake source characteristics, we speculate on their impli- cations for the tectonic evolution of the gulf.
TECTONIC SETTING
The dominant mode of faulting in the Gulf of California (Figure 1) is right-lateral strike-slip motion on transform faults connecting short spreading centers [Rusnak et al., 1964]. The spreading centers are well-developed ridge segments only in the southernmost gulf; the rest are small pull-apart basins filled to varying degrees by terrigenous and pelagic sediments [Moore, 1973; Lonsdale, 1985]. Seismic refraction and gravity data indicate that the crustal structure beneath the portions of the gulf deeper than about 2 km closely resembles that of typical oceanic crust [Phillips, 1964; Harrison and Mathur, 1964], although the crustal structure is likely to differ from that of normal oceanic crust in detail because of the high sedimentation rate and its potentially strong effect on the pro- cesses of shallow igneous intrusion and volcanism [Moore, 1973; Nicolas, 1985]. Measurements of heat flow [Lawyer and Williams, 1979; Williams et al., 1979-1, geomagnetic variation [White, 1973a, b], and water column temperature [Lonsdale and Becker, 1985] in the gulf confirm that the basins are sites
10,485

10,486 GOFF ET AL.' EARTHQUAKE SOURCE MECHANISMS
122 •
UNITED STATES
32o4
MEXICO
26 120 ø
PACIFIC ocEAN %o
18 ø
116 ø
Fig. 1. Principal active faults in the Gulf of California region, simplified from North American Geologic Map Com- mittee [1965]. Spreading centers are denoted by double lines (dashed where inferred), strike-slip faults by single lines, and thrust faults by barbed lines (dashed where inferred).
of active volcanic intrusion and hydrothermal venting. Mantle P wave velocities to a depth of 350 km beneath the Gulf of California are slow relative to continental and island arc re-
gions [Walck, 1984]. Well-documented magnetic anomalies occur only along the
Mazatlan Ridge (Figure 2), the spreading center segment to the immediate north of the Tamayo Fracture Zone, and along the East Pacific Rise to the south [Larson et al., 1968; Larson, 1972]. A full spreading rate of 58 mm/yr across the Mazatlan Ridge was obtained from two profiles [Larson et al., 1968; Atwater, 1970]; a recent reinterpretation of these profiles [DeMets et al., 1986] suggests a somewhat lower rate of 50 mm/yr. The lack of identified magnetic anomalies along other spreading center segments in the gulf has been attributed by Larson et al. [1972] to an inhibition of extrusive volcanism by the high sediment influx and a consequent reduction of the thermal remanent magnetization of the upper crust.
According to the recent synthesis of the tectonic evolution of the Gulf of California region by Moore and Curray [1982-1, lithospheric extension in the gulf began 5.5 m.y. ago, when transform motion between the Pacific and North American
plates jumped inland from its earlier position along the Tosco- Abreojos fault zone offshore of what is now the Baja Califor-
nia peninsula [Spencer and Normark, 1979] and movement was initiated on the San Andreas fault. For the next 2 m.y., extension across the gulf was accomplished primarily by thin- ning of continental crust through block faulting and listric normal faulting. At about 3.5 m.y. ago, oceanic crust with clear magnetic anomalies began to form along the Mazatlan Ridge in the southern gulf [Larson et al., 1968; Larson, 1972]. A paleogeographic reconstruction derived by restoring 300 km of offset of Baja California [Gastil and Krummenacher, 1977] along the direction N124øE closes the gulf with no remaining oceanic crust and little overlap of continental crustal material [Moore and Curray, 1982]. The northern gulf is completely closed by this reconstruction, whereas the southern gulf is closed to about the 1-km isobath; the difference may be the result of the large influx of Colorado River sediment in the northern gulf [Moore and Curray, 1982].
EARTHQUAKE DATA SET
To select those earthquakes suitable for body waveform in- version, we searched the catalog of the International Seismo- logical Centre (ISC), Edinburgh, Scotland, for earthquakes in the Gulf of California with body wave magnitude rn b larger

GOFF ET AL.' EARTHQUAKE SOURCE MECHANISMS 10,487
CERRO PRIETO
FAULT
MAR 20, 1969
MAR 21,1969
WAGNER BASIN
7, 1966
18,1963,
JUL 8,1975
DELFIN BASIN
FEB I0, 1984
MAY
SAN MARTIR
y BASIN
FEB 27, 1965
SEP 30, 1971
GUAYMA. < BASIN
5,1964 27 •,
BASIN
25,19
JUL 6,1964 BASIN
• SEP 24,1975 25'
AUG •7,
MAZATLAN APR 4, RIDGE • TAMAYO FRACTURE
'Y'•• ZONE FEB 9,1976
---- NOV I, 1969 i.•/• CIFIc
• TRES MARlAS I ESCARPMENT N I
Fig. 2. Epicenters and source mechanisms obtained by body waveform inversion for large earthquakes in the Gulf of California. Epicentral positions include an approximate correction to account for the systematic northeastward misloca- tion by ISC for earthquakes in this region (see text). Events modeled with more than one point source are indicated by overlapping mechanisms, reading left to right in order of occurrence; the relative location of subevent epicenters is shown. Fault plane solutions are equal area projections of the lower focal hemisphere; compressional quadrants are shaded. Important bathymetric features, including ridges (hatched), basins (interior ticks), and transforms (dashed), are simplified from Bischojf and Niemitz [1980] and Niemitz and Bischojf[1981].
than 5.3 during the period 1964 to 1984. We then examined long-period seismograms from stations of the World Wide Standard Seismograph Network (WWSSN) for all such events, as well as several large earthquakes in 1963. Some events were omitted from the data set because of poor signal-to-noise ratio
or inadequate station coverage. The 19 earthquakes selected for study occurred between 1963 and 1984 and are listed in Table 1. This time period includes an 8-year interval (1976- 1984) during which no large (mb > 5.3) earthquakes occurred in the gulf region.

10,488 GOFF ET AL.' EARTHQUAKE SOURCE MECHANISMS
TABLE 1. Epicentral Data and Source Parameters for Earthquakes in the Gulf of California
Origin Lati- Longi- Date Time, UT tude, øN tude, øW m b M s Mo a Mechanism b
Range in
Possible
Centroid
Depth, c km
Nov. 18, 1963 a 1438'26.2 29.68 113.74 5.7 6.6 e 4.6 131/111/167 7 _+ 2 July 5, 1964 1908' 00.1 26.34 110.21 5.7 6.3 e 4.0 f 128/58/175 f 0-19 July 6, 1964 0214' 36.7 26.32 110.28 5.6 6.6 e 7.8 129/76/175 0-13 Feb. 27, 1965 0746'28.6 28.38 112.27 5.4 6.0 e 1.1 133/48/190 0-18 Aug. 7, 1966 g 1736'28.5 31.74 114.31 5.7 6.3 •' 2.5 140/51/193 12 __. 3
1.4 141/57/179 3-20 March 20, 1969 0817'45.1 31.32 114.18 5.3 5.7 0.48 23/43/273 6 ___ 3 March 21, 1969 0634' 26 31.25 114.31 5.6 5.4 0.33 35/43/274 3 + 2 April 4, 1969 1616' 19.6 24.44 109.80 5.5 0.79 f 153/51/264 f 2-12 Aug. 17, 1969 2013'09.3 25.25 109.24 5.6 6.5 129/76/175 0-17 Aug. 17, 1969 2015'00.8 25.12 109.55 5.8 6.6 12. 126/92/186 0-16 Nov. 1, 1969 • 1108'24.3 23.19 107.99 5.5 6.6 11. 122/77/175 0-13 Jan. 19, 1971 0316'54.2 23.80 108.73 5.5 5.9 1.2 f 127/84/176 f 0-10 Sept. 30, 1971 0817' 59.8 26.88 110.80 5.7 6.6 6.7 128/85/179 0-11 March 25, 1973 2242'01 25.84 109.93 5.4 5.5 0.46 153/94/190 0-13 May 31, 1974 1405'01.9 27.36 111.13 5.4 6.3 3.8 123/65/169 0-10 July 8, 1975 g 0937'28.9 29.49 113.40 5.6 6.5 5.9 132/93/170 1-7
4.2 130/92/175 10 _+ 2 Sept. 24, 1975 1719' 37.8 25.20 109.26 5.5 5.7 1.6 129/72/173 0-14 Feb. 9, 1976 2129'57.0 21.63 106.59 5.6 5.4 0.71 92/52/086 11 ___ 2 Feb. 10, 1984 1651'21 28.29 112.14 5.5 6.2 1.2 127/96/182 0-12
Epicentral and magnitude data are taken from the ISC, except where noted. aSeismic moments in units of 1025 dyn cm (10x8 N m). OFocal mechanism (strike/dip/slip, all in degrees) specified with convention of Aki and Richards [1980]. C Relative to the seafloor.
aEpicenter from Sykes [1970]. eMagnitude M from Roth• [1969]. SSource parameters are for the shallower of two possible solutions (see text). gThis event modeled with more than one point source. •'From Ebel et al. [1978]. iThis event modeled as a point source propagating to the northwest at 3.2 km/s.
Because the Gulf of California is marked by variable bathy- metry and crustal structure, accurate epicentral location is important to the conduct and interpretation of body wave- form inversion studies. Epicenters determined by the ISC for events in the Gulf of California tend to be biased toward the
north and east because of the concentration of seismic stations
in North America. This effect is most clearly seen for those earthquakes for which detailed aftershock studies have been conducted with sonobuoys, including three of the events listed in Table 1: March 25, 1973; May 31, 1974; and July 8, 1975 {-Reichle et al., 1976; Mun•tuia et al., 1977]. For each of these three earthquakes, the centroid of the aftershock zone is about 40 km to the southwest of the ISC epicenter for the main shock. Water column reverberations (compressional waves multiply reflected within the water layer) in the P waveforms may also provide a clue to event mislocation for earthquakes having a significant component of dip-slip faulting. For exam- ple, the P waveforms from the August 17, 1969 (2013 UT), earthquake exhibit prominent water column reverberations at a predominant period inconsistent with the water depth at the
source region of each earthquake for waveform modeling, we projected the epicenters back to the plate boundary (as de- fined by bathymetry and mapped fault trends) along the azi- muth N150øW, the average azimuth of the epicenter correc- tion vector indicated by the aftershock zones of the three earthquakes noted above. Corrected in this manner, the epi- centers of the 19 events of Table 1 are depicted in Figure 2.
WAVEFORM INVERSION
For each of the events listed in Table 1, we deiermined the parameters of the best fitting double-couple point source, using a formal inversion of long-period teleseismic P and $H waveforms {-Nabelek, 1984]. In each inversion, we solve for the best fitting point source parameters, including focal mecha- nism, centroid depth, seismic moment, and source time func- tion. The source time function is parameterized as a series of overlapping triangular elements of assigned number and dura- tion. The relative amplitudes of the elements are determined by the inversion procedure, and the number of elements is chosen so that the end of the source time function approaches
ISC location. A good fit can be obtained, however, if the zero smoothly. The convention for describing a double-couple epicenter is relocated to the southwest in the deeper water of source mechanism is that of Aki and Richards [1980]. We the Pescadero basin complex. specify the strike and dip of one nodal plane and the slip
We have assumed that ISC epicenters for large earthquakes angle, which defines the motion of the hanging wall relative to in the Gulf of California are mislocated to the northeast by the footwall measured counterclockwise from the strike direc- several tens of kilometers. To estimate the water depth in the tion on the footwall; the three angles are given in the order

GOFF ET AL.' EARTHQUAKE SOURCE MECHANISMS 10,489
TABLE 2. Seismic Velocity Models Assumed for the Source Regions of Specified Earthquakes
Thickness. V.. V s. p. Layer km km/s km/s g/cm 3
Thinned Continental Crust (Au•tust 7, 1966, and March 20-21, 1969) 1 1.2 1.8 0.5 1.0
2 2.3 4.0 2.4 1.8
3 4.3 5.4 3.2 2.4
4 16.2 6.7 3.9 3.0
5 half-space 7.8 4.6 3.4
Transitional Crust (November 18, 1963, and July 8, 1975) 1 1.1 1.5 0 1.0
2 0.9 2.0 0.6 1.1
3 10.0 5.5 3.2 2.4
4 half-space 7.6 4.5 3.3
Normal Oceanic Crust (all other events) 1 variable 1.5 0 1.0
2 6.0 6.4 3.7 2.6
3 half-space 8.1 4.6 3.4
strike/dip/slip. Centroid depths are relative to the seafloor. For some events a single point source proved inadequate to
match the observed waveforms, and two point sources sepa- rated in space and time were assumed. In such cases, the timing and location of the second subevent relative to the first, as well as the source parameters of each subevent, were in- cluded as parameters in the inversion. For all such complex events, we employed a statistical test to establish the signifi- cance of the improvement in fit that resulted from using two point sources, given the increase in the number of free parame- ters. This test is described in Appendix A.
Seismic velocity structures assumed for the source regions are given in Table 2. For most of the events, the source model was a simple approximation to normal oceanic crustal struc- ture, with a water layer of appropriate thickness and a single- layer crust over a mantle half-space. This same velocity struc- ture has been used in our studies of mid-ocean ridge and oceanic int•aplate earthquakes [Ber•tman et al., 1984; Beretman and Solomon, 1984, 1985; Huan•t et al., 1986; Jemsek et al., 1986; Huan•t and Solomon, 1987]. Seismic reflection profiles reported by Moore [1973] and by Niemitz and Bischoff[1981] indicate that the thickness of sediment in the central part of the gulf varies considerably but rarely exceeds 1 km. Because of our ignorance of the thickness of the sediment layer at any given epicenter, we included no sediment layer for inversions using the normal oceanic crustal structure. The most signifi- cant uncertainty introduced by this omission is in the determi- nation of centroid depth. If the sediments are unconsolidated, so that the sediment-basement interface is a major reflector, then centroid depths will be underestimated by the depth of the sediment thickness. If, in contrast, the seafloor remains the major reflector, then depths will be overestimat,ed by an amount somewhat less than the sediment thickness. As will be
discussed below, the uncertainty in centroid depth for most events is considerably greater than the contribution from un- modeled sediment layers.
For the five northernmost earthquakes in the gulf region (Figure 2), source models more appropriate to the local crustal structure were adopted. For the August 7, 1966, E1 Golfo earthquake and the March 20-21, 1969, swarm earthquakes, we adopted the structure assumed by Ebel et al. [1978] in
their study of the E1 Golfo event. This crustal model (Table 2) is in agreement with travel times from the most northerly of the seismic refraction lines of Phillips [1964]. For the earth- quakes of November 18, 1963, and July 8, 1975, we used the structure obtained by Phillips [1964] from a reversed refrac- tion line in the Canal de Ballenas' shear wave velocity and
density were estimated from V•, in a manner consistent with the model of Ebel et al. [1978].
The double-couple orientations, centroid depths, and seis- mic moments of the 19 Gulf of California earthquakes studied are given in Table 1. The focal mechanisms are also displayed in map view in Figure 2. A detailed discussion of the wave- form data and inversion results for each earthquake is given in Appendix B. For some events, noted in Appendix B, we have also estimated the length of the rupture zone from the point source solution under the assumption that the source time function may be approximated by the convolution of two boxcar functions, one representing rise time and a longer one representing rupture duration. Except where noted, a rupture velocity of 3.2 km/s has been assumed in order to convert rupture duration to fault length.
It is important to consider the uncertainties in the derived source parameters. For the double-couple components, the formal error (2o') is typically ___ 1 ø in fault strike and ___ 2 ø in the dip and slip angles. The formal error in seismic moment is typically ___20%, and that in centroid depth is generally +0.4 km. The true uncertainties in these parameters, however, exceed these formal errors. Numerical simulations of wave-
form inversions by Nabelek [1984] have shown that while 2o' is a good estimate of the uncertainty in the seismic moment, the true uncertainties in double-couple orientation angles and in centroid depth are generally in the range 5-10 a. These rules of thumb yield uncertainties of _ 3ø-5 ø for fault strike, _+ 5ø-10 ø for fault dip and slip, _+ 2 km for centroid depth, and _+20% for seismic moment. For earthquakes which can be modeled adequately only with multiple sources, the uncer- tainties in all parameters are larger by amounts that depend on the particular case. U•icertainties in relative timing and location of multiple subevents and tradeoffs in mechanism parameters that are not reflected in the typical uncertainties are discussed in Appendix B for specific events. For several of the strike-slip earthquakes with little station coverage to the west, there is a tendency for the northwest striking nodal plane to dip to the southwest at an apparently significantly nonvertical angle (see Appendix B). This solution results from fitting both the clear P wave polarity change at stations to the northeast and the relatively large P wave amplitudes at Cen- tral and South American stations to the southeast. While these
nonvertical dip angles may thus be real, the P waves at sta- tions to the southeast may be anomalously large because of downward focusing by a narrow zone of low seismic velocities within the mantle beneath the axis of the gulf [Walck, 1984].
Since one of the goals of this study is to obtain an improved set of slip vector azimuths to constrain plate motion models, and since the uncertainty in the slip vector azimuth for strike- slip earthquakes is dominated by the uncertainty in fault strike, we conducted additional tests of the resolution of fault strike. For each event, we fixed the strike at a succession of values distributed about the best fitting value and inverted for the remaining parameters. We then followed the method of Huan•t et al. [1986] to estimate the range of acceptable values for fault strike at a given confidence level. For large earth-

10,490 GOFF ET AL.' EARTHQUAKE SOURCE MECHANISMS
0.25
MAY 31, 1974
i i i i i i [ [ [ i
b.] I
•: 0.20 • • o I I
DEPTH, km
Fig. 3. Residual variance versus ccntroid depth for the earth- quake of May 31, 1974. Individual points on this curve were obtained by fixing the centroid depth and inverting for the combination of the remaining parameters (mechanism, moment, source time function) that best fit the body waveforms. The residual variance equals the mean squared misfit of synthetic to observed waveforms normalized by the mean squared observed waveforms. Arrows delimit the 90% confidence limits on centroid depth according to the paired t test of Huan•t et al. [1986].
quakes with good station coverage (or for the larger of the two subevents), the fault strike is resolved to within _+3 ø at 90% confidence. The smallest strike-slip earthquake (January 19, 1971) with good station coverage and seismic moment in excess of 1025 dyn cm has an uncertainty in strike of +_4 ø at that confidence. Uncertainties in dip and slip angles also con- tribute to the uncertainty in the slip vector, though they are much less important than the uncertainty in strike. Taking into consideration the conservatism of the significance test [Huang et al., 1986], a reasonable estimate for the full uncer- tainty in slip vector azimuth for a Gulf of California strike-slip earthquake with M 0 > 1025 dyn cm is +_ 5 ø.
We also examined in detail the resolution of centroid depth. Following Huang et al. [1986], we fixed the depth at a suc- cession of values distributed about the best fitting value and inverted for the remaining parameters. An example of the re- sulting curve for residual variance versus centroid depth is shown in Figure 3 for the earthquake of May 31, 1974. The relatively flat character of the residual variance curve between
0-km depth and about 10-km depth indicates that centroid depths in this range cannot be distinguished. Small variations in the residual variance within this depth range are not signifi- cant, as they can be quite sensitive to changes in the assumed source parameterization (e.g., length of individual source time function elements) or source velocity structure. This type of residual variance curve is typical of the shallow strike-slip earthquakes of this study, even for events with good signal-to- noise ratio and station coverage.
The relatively flat portion of the residual variance curve in Figure 3 arises because of a nearly complete trade-off between centroid depth and the duration and shape of the source time function. The source time function has a longer duration at the shallowest depths and a shorter duration at greater depths. The trade-off is strong for a vertical strike-slip event, because the two major phases contributing to the P waveform, P and sP, are of like polarity. At the shallowest depths, P and sP add constructively, and the shape of the P waveforms determines the shape of the source time function. At greater depth, the separation between P and sP permits a shorter time function. This trade-off is illustrated in Figure 4 by a comparison of observed and synthetic waveforms for several centroid depths for the earthquake of May 31, 1974. The source time functions for the best-fitting solution at each depth are also shown. At assumed centroid depths of 1, 5, and 9 km, the duration of the source time function is 13, 12, and 10 s, respectively. The misfit of synthetic and observed waveforms is nearly indistinguish- able for these three solutions. Synthetic seismograms for a solution at an assumed centroid depth of 16 km, in contrast, provide a poorer fit to the observed waveforms, particularly at KBS.
At very shallow depths, within 2 km of the seafloor, other parameters in the source mechanism also contribute to the trade-off with centroid depth. In particular, the dip angles of the nodal planes depart significantly from the vertical and the seismic moment is nearly doubled (Figure 4). The n0nvertical dip angle changes the radiation pattern so that only the downgoing or upgoing phases contribute to the waveform of a given station, allowing the source time function to control
DEPTH, km MECHANISM Mo, I025 dyn cm S.T.F., s KBS KIP SJG
I 124/27/174 7.4
5 123/65/169 3.8 illlimit,
9 124/61/168 4.0
16 127/57/173 3.8 0 5 I0 15
Fig. 4. Observed P waveforms (solid lines) at selected stations for the earthquake of May 31, 1974, together with synthetic waveforms (dashed lines) for the best-fitting point source solution at each of several fixed centroid depths. The mechanism, moment, and source time function (STF) indicated by the inversion of the full set of P and SH waveforms at each fixed centroid depth are also shown.

GOFF ET AL.' EARTHQUAKE SOURCE MECHANISMS 10,491
completely the shape of the waveform. This behavior occurs for the other strike-slip events of this study as well. From the standpoint of residuals alone, these extremely shallow solu- tions cannot be rejected. Some of these solutions may be dis- counted, however, on the basis of implausible fault geometry or, for the largest events, on the basis of anomalously large implied values of fault slip or fault length.
Resolution of centroid depth for shallow dip-slip events is generally better than for strike-slip events, because P and pP (the most important surface-reflected phase) are typically of opposite polarity. An example of residual variance versus cen- troid depth for an earthquake with a dip-slip mechanism (Feb- ruary 9, 1976) is shown in Figure 5. A well-defined minimum is apparent at 11 km. A second solution has a centroid at 6-km depth and possesses a longer source time function. The large discontinuous jump in the residual variance at the base of the crust is an artifiact of the simplified source velocity structure assumed; the solution at 6-km depth is degraded when a more gradual crust-mantle transition is assumed.
For all events we use the paired t test as described by Huang et al. [1986] to estimate confidence limits on centroid depth. Except where noted, these limits are at the 90% confi- dence level, rounded to the nearest integral depth (in kilome- ters) outside the formal limits. In cases where there are two or more solutions at different centroid depths or where there is a range of centroid depths over which the residual variance is indistinguishable, the t test is applied only in the vicinity of the deepest and shallowest solutions to estimate the extremes of the confidence interval. Ranges in possible centroid depths are given for each event in Table 1 and are discussed more fully in Appendix B.
EARTHQUAKE COMPLEXITY
For seven of the events of this study, the waveforms con- tained signals which could not be well matched with a single point source in a horizontally layered structure, even with an extended or multipeaked source time function. In each of these cases, a significant improvement to the waveforms could be obtained when we modeled these sources as two distinct sub-
events. Bathymetric variations in the epicentral region may also have contributed to waveform complexity [Wiens, 1986]. For three other events, complexity was indicated but the im- provement in fit assuming two distinct subevents was not sig- nificant at high confidence (see Appendix A). These 10 earth- quakes with some signature of complexity include all but two of the events of this study with seismic moment in excess of
FEBRUARY 9, 1976
i i i i i i i i i i i i i i
0.40
z
.j I
,• 0.35 ii - C:) _ _
n,' _ -
_ -
_ _
i i I I I I I I I I i
0.30• 5 I0 15 DEPTH, km
Fig. 5. Residual variance versus centroid depth for the earthquake of February 9, 1976. See Figure 3 for explanation.
114 ø
JULY 8, 19 CENTROID
EPTH, km 0 I0
A
113 ø • 300
VERT EXAG X2
20 30 40
km •
ISC EPICENTER
29 ø
Fig. 6. Mainshock and aftershock locations for the earthquake of July 8, 1975, from Munguia et al. [1977]. Also shown are the ISC epicenter and the source mechanisms of the two subevents as ob- tained from waveform inversion. The second subevent occurred 8 s
later than and 23 km northwest of the first. Bathymetric contours, in meters, are from Bischoffand Niemetz [1980].
2 x 1025 dyn cm. For 8 of these 10 events, however, the pa- rameters of the second smaller subevent in the assumed two-
source model were not well resolved.
The earthquake of July 8, 1975, is a good example of an event requiring a multiple-source solution. This earthquake was well recorded, and its epicentral location in the Canal de Ballenas (Figure 6) is accurately known from the aftershock study of Munguia et al. [1977]. The Canal de Ballenas is a region of rugged bathymetry [Bischoff and Niemitz, 1980]' considering the large rate of sedimentation in the area, the bathymetric relief suggests a high level of current tectonic ac- tivity. From P wave first motions, Munguia et al. [1977] ob- tained a fault plane solution indicating right-lateral strike-slip motion on a vertical fault striking at N130ø-135øE, and from the surface wave record at one station they estimated a seismic moment of 2 x 1025 dyn cm.
A comparison of the fit of the synthetic waveforms to select- ed P waves is shown for several source models in Figure 7. For the best fitting point source where the source time func- tion was constrained to be a single pulse, the synthetic wave- forms match the early part of the P waves but do not match the significant arrival of energy about 15 s after initial motion' the variance reduction for the full data set is 58%. If we allow
for an extended source time function of arbitrary shape, this misfit is reduced (72% variance reduction), and the source time function displays 2-3 distinct pulses. We next considered a model featuring a point source propagating horizontally at a uniform rupture velocity of 3 km/s. In this model, the source time function at each station has the same shape but is com- pressed or expanded in time according to a simple function of the rupture velocity, the ray parameter, and the relative azi- muth of the rupture direction and the ray path [Ben- Menahem, 1962' Nabelek, 1985]. Some further improvement over the best point source is obtained for a source propagat- ing to the northwest (76% variance reduction), e.g., in the amplitude and phase of the second cycle of motion at BHP. The duration of the source time function for this model corre-

10,492 GOFF ET AL..' EARTHQUAKE SOURCE MECHANISMS
S.T.F., s COL GDH WES BHP
Fig. 7. Comparison of observed (solid lines) and synthetic (dashed lines) P waves at selected stations for the earth- quake of July 8, 1975. Synthetic waveforms for four different source models are shown: (1) the best fitting point source with a source time function (STF) constrained to a single pulse, (2) the best fitting point source with a source time function unconstrained except for total duration, (3) a propagating point source (southeast to northwest) with a source time function unconstrained except for total duration, and (4) the best fitting model with two distinct point sources; the source time function for the second subevent is indicated by the dashed line.
sponds to a fault about 35 km long, a value somewhat less than the 50-km length of the aftershock zone [Munguia et al., 1977]. In the final model the source consists of two subevents separated in time and space.
The waveforms are best modeled (81% variance reduction) with the two source model (Figures 7 and 8). According to the
inversion, the second subevent occurred 8 s later than the first and was located 23 km to the northwest along the strike of the presumed fault plane. The two subevents have nearly identical focal mechanisms (132/93/170 and 130/92/!75, respectively) and comparable moments (5.9 and 4.2 x 1025 dyn cm, respec- tively). These mechanisms are similar to that of Munguia et al.
July 8, 1975
Fig. 8. Comparson of observed P and SH waves (solid lines) from the July 8, 1975, earthquake with synthetic waveforms (dashed lines) generated using a model consisting of two point sources, the parameters of which were found from body-waveform inversion. Full names and locations of all stations are given by Poppe et al. [1978]. P and SH radiation patterns are shown on the lower focal hemisphere (equal area projection). The source time functions of the two subevents obtained from the inversion are also shown. The dashed lines in the source time function and focal mechanism represent the second subevent. The delay between the centroid times of the subevents is shown; the apparent delay at any station depends on the angle between the line joining the subevents and the ray path to the station. All amplitudes are normalized to a WWSSN instrument magnification of 3000 and an epicentral distance of 40ø; the amplitude scales correspond to the waveforms that would be observed on an original seismogram from such an instrument. The two vertical lines delimit the portion of each time series used in the inversion. Symbols for both types of waves are as follows: open circles, dilatation; solid circles, compression; cross, emergent arrival. For SH waves, compression corresponds to positive motion as defined by Aki and Richards [1980].

GOFF ET AL.' EARTHQUAKE SOURCE MECHANISMS 10,493
JULY 8, 1975
_
z 0.25 • _
• -
<I: -
t'• -
w 0.20
_
I [ I I I I I I I I I I I I
0 5 I0 •5 DEPTH, km
Fig. 9. Residual variance versus centroid depth for the best two- source solution to the inversion of P and SH waveforms for the Gulf
of California earthquake of July 8, 1975. In these inversions, the centroid depth is held fixed for either the first (squares) or second (circles) subevent at the indicated value. The arrows denote the 90% confidence intervals for the centroid depths of the two subevents.
[1977], but the total moment exceeds their estimate by a factor of 5. The improvement in the fit of the P and SH waveforms with two point sources is significant at the 99% confidence level over the best fitting point source and at 95% confidence over the propagating point source.
The preferred two-source solution is shown in map view and in cross section in Figure 6. The absolute locations of the subevent centroids are somewhat uncertain .and are taken so
as to -give the closest agreement with the most prominent clust.ers of aftershocks; the epicenter of the first subevent is near that obtained by Munguia et al. [1977] from arrival times at stations around the Gulf of California and in southern
California. The fault strikes and relative positions of the two subevents shown in Figure 6 are those derived from the inver- sion and agree well with the trend of the aftershocks.
The cross-sectional view along the strike of the solution indicates the most significant difference in the source parame- ters of the two subevents: the centroid depth of the second subevent is at 10 km, 5 km deeper than that of the first sub-
event. At 90% confidence the centroid depth of the first sub- event lies in the range 1-7 km, and that of the second subevent lies in the range 9-12 km (Figure 9). The somewhat poorer resolution for the first subevent is the result of a trade-off
between the duration of the source time function and centroid
depth. A secondary minimum in the curve for residual versus depth for the second subevent also occurs at 2 km, but this solution can be rejected at 90% confidence. The compara- tively good resolution of centroid depths for this event is due to good station coverage and signal-to-noise ratio and to the short duration (about 4 s) of the principal components of the source time function for each subevent.
SLIP VECTORS AND PL^TE MOTIONS
The azimuths of the slip vectors of the strike-slip earth- quakes of this study constitute an improved data set for con- straining the relative motion between the Pacific and North American plates. Slip vector azimuths for the earthquakes most likely to represent relative plate motion are listed in order of decreasing latitude in Table 3. The slip vector azi- muths agree with the local azimuths of the major bathymetric trends of the transform faults [Bischoff and Henyey, 1974; Bischoff and Niemitz, 1980; Niemitz and Bischoff, 1981; Kastens, 1981] to within an rms misfit of only 2 ø. This is in contrast to the slip vectors reported by Sykes [1970] and Molnar [1973], which are oriented 5 ø to 10 ø more southerly than the azimuths of local bathymetric features.
Also shown in Table 3 are the azimuths of Pacific-North
American plate motion predicted at the various epicenters by plate kinematic model RM2 [Minster and Jordan, 1978]. While the fit of pre•dicted and observed azimuths is quite good, the RM2 azimuths on average exceed the slip vector azimuths by several degrees. J. B. Minster and T. H. Jordan (personal communication, 1986) have recalculated the RM2 angular velocity vectors after correcting and augmenting the data set for azimuths in the Gulf of California with the infor-
mation in Table 3 and with updated fault trends [Bischoff and Niemitz, 1980; Niemitz and Bischoff, 1981]. In the resulting solution, denoted by RM2', the pole for North American-
TABLE 3. Comparison of Earthquake Slip Vectors With Bathymetric Trends and Plate Motion Models
Azimuth Predictions of Plate Motion Models, deg of
Azimuth Bathy- RM2 RM2' of Slip metric Vector, Trend, a
Earthquake deg deg Azimuth b Residual Azimuth c Residual
Nov. 18, 1963 125 "' 136 11 133 8 July 8, 1975 a 132 .-. 136 4 133 1 Feb. 10, 1984 127 125 134 7 131 4 May 31, 1974 128 127 133 5 130 2 Sept. 30, 1971 128 127 133 5 130 2 July 5, 1964 131 128 132 1 129 -2 July 6, 1964 130 128 132 2 129 - 1 Aug. 17, 1969 (2013UT) 131 130 130 -- 1 127 --4 Sept. 24, 1975 132 130 130 --2 127 -5 Aug. 17, 1969 (2015UT) 126 130 130 4 127 1 Jan. 19, 1971 127 127 129 2 126 -- 1 Nov. 1, 1969 123 119 128 5 125 2
aFrom Bischoff and Henyey [1974], Bischoff and Niemitz [1980], Niemitz and Bischoff [1981], and Kastens [1981].
bFrom Pacific-North American plate motion pole, model RM2 [Minster and Jordan, 1978]. CFrom Pacific-North American plate motion pole, model RM2' (J. B. Minster and T. H. Jordan,
personal communication, 1986). dSlip vector is for first subevent.

10,494 GOFF ET AL.' EARTHQUAKE SOURCE MECHANISMS
Pacific motion is at 50.25øN, 76.03øW, and the angular veloci- ty is 0.837 deg/m.y. These quantities lie within the 95% confi- dence limits of the RM2 pole coordinates (48.77øN, 73.91øW) and rate (0.852 deg/m.y.) [Minster and Jordan, 1978]. The RM2' angular velocity vector reduces the mean squared misfit with the slip vector azimuth data in Table 3 by 50% from that of RM2. Slight but important differences in the azimuth of North American-Pacific plate motion are also predicted else- where along the plate boundary. In particular, for RM2', unlike RM2, the orientation of the creeping portion of the San Andreas fault in central California is not statistically different from the predicted relative plate motion vector [Minster and Jordan, 1985]. It should be noted here that RM2' is not a global revision of RM2, but only an updated solution with an improved angular velocity vector for Pacific-North American plate motion (J. B. Minster and T. H. Jordan, personal com- munication, 1986).
As was noted above, the nonvertical dip angle of the indi- cated fault plane for several earthquakes may be an artifact of incomplete focal sphere coverage or of focusing effects beneath the axis of the gulf, and a possible bias in the slip vector azimuth may be introduced for these events. Inversion solu- tions for 6 of the 12 earthquakes listed in Table 3 have fault planes dipping to the southwest at angles departing by more than 10 ø from the vertical and striking more westerly than the indicated slip vector azimuth. For the three events having solutions with the shallowest dip angles, we conducted ad- ditional waveform inversions during which the fault planes were constrained to be vertical (Appendix B). Slip vector azi- muths were reduced by 2ø-3 ø compared with the un- constrained inversions, resulting in an improved fit to plate motion model RM2' for two events and a somewhat worsened
fit for one event. We conclude that the potential bias in slip vector azimuth due to dip angle error is small, probably 1 ø or less for most of the events in Table 3, and that the RM2' pole for Pacific-North American plate motion is robust with re- spect to this level of possible bias.
CENTROID DEPTHS AND FAULT WIDTHS
The centroid depths obtained in this study provide points of comparison with centroid depths determined with similar techniques for events on other oceanic transforms and conti- nental strike-slip fault zones. Engeln et al. [1986] applied body waveform modeling techniques to estimate the centroid depths of 29 earthquakes on transform faults in the north and central Atlantic. They found no depths greater than 7 km beneath the seafloor, and they concluded that centroid depths of oceanic transform events are generally limited to depths above the nominal 400øC isotherm, in contrast to the situation in young oceanic lithosphere where centroid depths extend about to the depth of the nominal 800øC isotherm [Wiens and Stein, 1983, 1984; Bergman and Solomon, 1984]. They further inferred that transform zones must be either anomalously weak or hotter than simple averages of the temperature structure in the litho- sphere on either side [Forsyth and Wilson, 1984; Phipps Morgan and Forsyth, 1987]. More recent body waveform in- version studies of Atlantic transform earthquakes, however, have called these conclusions into question [Bergman et al., 1986].
The centroid depths of several large earthquakes along major strike-slip fault zones in California [Ebel and Helmber- ger, 1982] and China [Cipar, 1979; Chung and Cipar, 1983;
Zhou et al., 1983' Nabelek et al., 1987] have been estimated using body waveform modeling techniques broadly similar to those employed in this paper. Centroid depths range from 6 to 18 km for these events. In general, seismic behavior extends to greater depth along continental strike-slip fault zones than in young oceanic lithosphere [Chen and Molnar, 1983].
The large ranges in possible centroid depths for most of the oceanic transform events in the Gulf of California preclude a definitive test of whether the centroids are anomalously shal- low relative to intraplate events in young oceanic lithosphere. The principal transforms between the San Pedro Martir Basin and the East Pacific Rise have offsets between 50 and 120 km
(Figure 2). Adopting a simple cooling half-space model [Tur- cotte and Schubert, 1982] for the thermal structure in young oceanic lithosphere and assuming that the temperature distri- bution along the transform may be approximated by the arith- metic mean of the expected temperature distribution in the adjacent lithosphere on either side, the nominal 800øC iso- therm for an average full spreading rate of 56 mm/yr [Minster and Jordan, 1978] is reached at depths between 6 and 10 km along these transforms. Thus the 90% confidence limits on centroid depth for the 11 earthquakes along these transforms in all cases extend deeper than the nominal 800øC isotherm.
The one transform event of this study clearly occurring in continental lithosphere is the August 7, 1966, E1 Golfo earth- quake. The centroid depths of the two subevents are 12 and 15 km, but their uncertainties overlap those of oceanic transform events in the Gulf of California and in the north Atlantic
[Bergman et al., 1986]. The quite different centroid depths of the two subevents of the July 8, 1975, Canal de Ballenas earth- quake (Figure 9), located near the northernmost limit of oceanic crust [Phillips, 1964-1, lead us to speculate that the first and more southerly subevent (5-km centroid depth) may have ruptured oceanic lithosphere but that the second and more northerly subevent at 10-km centroid depth (Figure 6) may have occurred in still-preserved but extended continental lithosphere.
The centroid depths of 6 + 3 and 3 _ 2 km obtained for the two normal faulting events in the Wagner basin swarm of March-April 1969 are within the range of centroid depths found in tectonically similar settings. In a study of earth- quakes along the Arctic spreading center, Jemsek et al. [1986] reported centroid depths of 5-20 km for the portion of the plate boundary crossing the continental margin of northeast- ern Asia. Huang and Solomon [1987] also obtained centroid depths of 6 km for two normal-faulting earthquakes in the extending continental lithosphere of the northernmost Red Sea near the mouth of the Gulf of Suez.
An independent estimate of the depth extent of seismic faulting along transform faults in the Gulf of California is provided by the cumulative release of seismic moment [Brune, 1968]. Reichle et al. [1976] estimated a moment release in the southern two thirds of the Gulf of California of 3 x 10²? dyn cm for the period 1918-1975. Their estimate was derived from standard seismicity catalogs, a relation between m b and surface wave magnitude Ms, the Mo-M s relation of Brune [1968], and the assumption that all slip at shallow depths occurred during earthquakes. We have repeated their calculation for the region of the gulf south of the Delfin basin for the 80-year period 1904-1984, an interval that includes an M -- 7.5 earthquake in 1907 [Gutenberg and Richter, 1954] as well as the events of this study. We compiled a list of all events with M s (or M) greater than or equal to 5.7' sources included Gutenberg and

GOFF ET AL.: EARTHQUAKE SOURCE MECHANISMS 10,495
Richter [1954] for the period 1904-1952, Rothg [1969] for the period 1953-1963, and Table 1 for more recent events. The frequency of events with M• < 5.7 was inferred from the recur- rence relation of Reichle et al. [1976]. For events prior to 1963, we estimated moments from the relation
log•o M o = 1.16 M• + 18.4
obtained by least squares fit to the published moments and magnitudes for about 200 oceanic transform earthquakes in the period 1963-1985 (S.C. Solomon and D. W. Forsyth, manuscript in preparation, 1987); this relation may yield an underestimate of the moment for the very largest (M• > 7) events [Kanamori and Anderson, 1975]. The contribution to the cumulative moment from events with M• < 5.7 was deter- mined using the method of Molnar [1979]. From this pro- cedure we obtained a cumulative moment •M o of 7 x 1027 dyn cm.
The average fault width w along Gulf of California trans- forms may be estimated from the relation w- •Mo/(l•Lvt ), where /• is the rigidity, L is the total fault length, v is the average slip rate, and t is the time interval [Brune, 1968]. Adopting/• - 3.3 x 10 TM dyn/cm 2, L = 880 km I-Reichle et al., 1976], v = 56 mm/yr, and t = 80 yr gives w = 5 km. (For v = 50 mm/yr, w = 6 km.)
It is worth noting that the historical record of large earth- quakes, the rate of seismic moment release, and the implied depth extent of seismic faulting differ between transforms in the central and southern gulf regions. The transforms between the Delfin and Carmen basins (Figure 2) have been the site of 60% of the plate boundary earthquakes with M• > 6 and all three of the earthquakes with M• > 7, despite having a total fault length (470 km) only slightly greater than that of the transforms to the south between the Carmen basin and the
East Pacific Rise (410 km). The total seismic moment released during the period 1904-1984, estimated following the pro- cedure used above, was 5 x 10²? and 2 x 10²? dyn cm for the central and southern gulf transforms, respectively. The implied average fault widths are 7 and 3 km for v = 56 mm/yr (8 and 4 km for v - 50 mm/yr), respectively. A distinction between the central and southern gulf has also been drawn by Rusnak et al. [1964] on the basis of differences in seafloor morphology and accumulated fault displacements. These differences in maxi- mum earthquake size and average fault width may be related to the likelihood that transform faults in the central gulf abut scattered blocks of continental to transitional crust and litho-
sphere [Phillips, 1964; Kastens, 1981], whereas only young oceanic lithosphere formed at the adjacent spreading centers borders the more evolved transforms of the southern gulfi
These estimates of the depth extent of seismic faulting along transforms in the gulf are uncertain by as much as a factor of 2. They are likely, however, to be less than the maximum depth of slip during large earthquakes because of contri- butions from aseismic slip and underestimates of the largest moments. Values of 3-8 km for the average seismic fault width support centroid depths in the upper half of the ranges cited in Table 1 and are broadly consistent with a maximum depth of seismic slip no greater than the depth of the nominal 800øC isotherm.
FAULT GEOMETRY IN THE NORTHERN GULF REGION
The transition from oceanic to continental transform do-
mains in the northern Gulf of California is marked by several important changes in the nature of faulting. To the south of
the Canal de Ballenas, the plate boundary may be traced along a series of well-defined en echelon transform fault zones, each trending approximately along the mean direction of plate motion. To the north, in contrast, plate motion appears to be taken up over a wide zone of deformation that includes faults in northern Baja California as well as the northernmost gulf (Figure 10). Both the Agua Blanca and San Miguel faults are currently active, on the basis of recent seismicity [Lomnitz et al., 1970; Reyes et al., 1975; Rebollar et al., 1982], large his- toric earthquakes [Richter, 1958; Shor and Roberts, 1958; Allen et al., 1965], and Quaternary stream offsets [Allen et al., 1960]. Further, seismic reflection profiles in the northern gulf [Henyey and Bischoff, 1973] suggest a diffuse zone of exten- sional faulting rather than a traditional ridge-transform geom- etry. Earthquake swarms are common in the region [Thatcher and Brune, 1971; Tatham and Savino, 1974]. During the 22- year period of this study, the only large earthquakes in the gulf to the north of the Delfin basin have been those in the normal faulting swarm of March-April 1969.
It is also noteworthy that there is a change of approxi- mately 10 ø in strike between the dominantly oceanic trans- form in the Canal de Ballenas and the principal continental transform, the Cerro Prieto fault (Figure 10). In terms of rigid block tectonics, such a change in strike requires that the tran- sition zone act at least instantaneously as a triple junction. We suggest that an FFF triple junction is appropriate (Figure 11). In such a kinematic model, there is compensating motion along a right-lateral, strike-slip fault trending more westerly than the Cerro Prieto fault. Probably, the Agua Blanca and San Miguel faults together accommodate this motion, which may be transferred from the gulf via the San Pedro Martir normal fault (Figure 10). The effect of these faults is to transfer a portion of the Pacific-North American plate motion to faults west of the southern San Andreas system [Allen et al., 1960], possibly including offshore faults of the southern Cali- fornia borderland. The partitioning of slip rate between the Cerro Prieto and Baja California faults can be estimated from the fault geometry if the slip rate along the Canal de Ballenas transform is known. For instance, for a slip rate across the Canal de Ballenas of 50 mm/yr [DeMets et al., 1986], the Cerro Prieto fault should accommodate 37 mm/yr of slip, while 15 mm/yr of right lateral slip should be transferred along faults parallel to the Agua Blanca fault. The former value is similar to the rate of slip observed along the San Andreas fault in central California [Thatcher, 1979]. The latter value is consistent with the occurrence of M• = 6-7 earthquakes on the Agua Blanca and San Miguel faults [Rich- ter, 1958; Shot and Roberts, 1958; Allen et al., 1965].
An FFF triple junction is unstable with respect to finite motion [McKenzie and Morgan, 1969]. A further consequence of such a fault geometry would be the development of an approximately triangular pull-apart basin (Figure 11). The Delfin and Wagner basins, outlined by diffuse zones of exten- sional faulting [Henyey and Bischoff, 1973], may correspond to this basin predicted from simple kinematics. Neither the dimensions of these basins nor the amount of right-lateral slip documented between Isla Angel de la Guarda and the Baja California peninsula [Gastil et al., 1975] support the presence of an FFF junction of the sort depicted in Figure 11 for the entire history of gulf opening. We speculate that similar junc- tions may have been episodically present at more southerly locations earlier in the evolution of the gulf.

10,496 GOFF ET AL.' EARTHQUAKE SOURCE MECHANISMS
Fig. 10. Major faults and bathymetry in the northern Gulf of California region, from Rusnak et al. [1964]. Bathymetric contours are in fathoms.
CONCLUSIONS
We have investigated the recent tectonic history of the Gulf of California by means of detailed source studies of 19 large earthquakes that have occurred since 1963, using an inversion of teleseismic long-period P and SH body waveforms. The well constrained focal mechanisms of 12 events judged to rep- resent Pacific-North AmericaD relative plate motion provide an improved set of slip vector data for global plate motion inversions. An update of plate motion model RM2 incorpor- ating these new data results in a slight revision to the Pacific- North American rotation pole.
Centroid depths for most of the strike-slip earthquakes are poorly resolved because of trade-offs in the inversion between
depth and source time function. For most of these earth- quakes the centroid depth can lie anywhere from immediately beneath the seafloor to 10 km or more. The cumulative seis-
mic moment for earthquakes in the gulf between 1904 and 1984 indicates a value of 5-6 km for the average seismogenic fault width, though this figure is likely to be less than the maximum depth of slip during large earthquakes. We suggest that most of the larger earthquakes probably have centroid depths of about 5 km. The maximum depth of rupture would then be consistent with the depth to the nominal 800øC iso- therm, which appears to limit the depth of rupture for earth- quakes in young oceanic lithosphere and on large-offset trans- forms in the north Atlantic.

GOFF ET AL.' EARTHQUAKE SOURCE MECHANISMS 10,497
N b
• CERRO '"•, PRIETO
AGUA •'""",,.,,•..• BLANCA •
Fig. 11. Kinematic model of the effect of a difference in strike (a) between the transforms in adjacent oceanic and continental lithosphere in the northern gulfi The model predicts (b) motion on a compensating right-lateral transform fault, creating an FFF triple junction, and the formation of a triangular basin (hatched region). The three faults of the model may be schematically associated with the Canal de Ballenas transform fault and the Cerro Prieto and Agua Bianca-San Miguel faults; one possible configuration of slip rate vectors is shown in the inset.
Two normal faulting earthquakes in the March-April 1969 swarm in the Wagner basin have centroid depths of 6 _+ 3 and 3 _+ 2 km, within the range of earthquake centroid depths observed in other settings (Arctic, northern Red Sea) where plate separation has carried continental rifting nearly to com- pletion. A thrust-faulting earthquake near the Tres Marias escarpment has a centroid depth of 11 _ 2 km and probably reflects relative motion between the Rivera and North Ameri-
can plates. The transition from oceanic transform faulting to conti-
nental transform faulting in the northern gulf is marked by a broadening of the zone of deformation and about a 10 ø change in the strike of the principal fault accommodating plate motion. Fault kinematics in the transition zone may be approximated by that of an unstable FFF triple junction, with the Agua Blanca and San Miguel faults acting to transfer a portion of the plate motion to faults west of the southern San Andreas system, possibly including offshore faults in the Cali- fornia borderland. By this simple kinematic model, the Delfin and Wagner basins formed as a direct result of slip on the three fault systems meeting in the junction region.
APPENDIX A' TEST OF SIGNIFICANCE OF IMPROVED FIT FOR
MULTIPLE-SOURCE MODELS
The fit between synthetic and observed waveforms may always be improved by adding parameters to the source model, including the decomposition of the source into several subevents. We wish to test the significance of the improvement in fit given an increase in the number of free parameters. To do this, we conduct a test of significance for the differences in station residuals between the best fitting point source model and the best fitting multiple-source model. By using the re- siduals at individual stations instead of the residuals at each
discrete time sample, we are assured of independent data. This approach leads to a severe underestimate of the number of degrees of freedom, however, and will yield a very conserva- tive result [Huanq et al., 1986].
We define the mean square residual for station j as
rj 2 = • (sij - ou) 2 j = 1, 2, ---, N Mj •
where s u and o u are the amplitudes of the synthetic and ob- served seismograms at time sample i and station j, M j is the number of samples in the time window used in the inversion, and N is the number of stations. We denote the mean square
residuals for the best fitting point source by rjs 2 and those for the best fitting multiple source by rjm 2. The set of differences is then defined by
2
dj = rjs 2 -- rdm j = 1, 2,..., N
We denote the mean and standard deviation of the set dj by/•d and ad, respectively. The set of dj may be regarded as a sample of a normally distributed population of station residual differ- ences with mean/•D and standard deviation aD [Huanq et al., 1986].
We wish to test the null hypothesis that /•- 0, but we must take into account the increase in the number of free
parameters used in the determination of the multiple-source model. We regard the quantity/• as a function of the differ- ence k in the number of parameters used to specify the single- source and multiple-source models. The number of degrees of freedom of the set dj is then N- k- 1, and the standard deviation ad that provides an unbiased estimate of aa is given by
1 N
O'd 2 = •(dj- •/./d) 2 N-k--li:
We test the null hypothesis by forming the statistic
aa/N ø.5
which follows the t distribution with N- k- 1 degrees of freedom. Since we are testing the hypothesis that the solution using two point sources is better than the solution using one point source, we use the one-tailed (or one-sided) test.
APPENDIX B' SOURCE MECHANISMS FROM LONG-PERIOD BODY WAVEFORM INVERSION
We present here the details of the source mechanisms de- termined from the inversion of long-period teleseismic P and SH waveforms for each event.

10,498 GOFF ET AL.' EARTHQUAKE SOURCE MECHANISMS
November 18, 1965
P WAVES
CMC KON GEO• C
A,?T LPB ½• V
o
$ec
Source Time Function (sec)
SH WAVES
CMC
IP
ANT •
i i i 161o
Fig. B1. Comparison of observed P and SH waves from the earthquake of November 18, 1963, with synthetic waveforms for the best fitting point source. See Figure 8 for further explanation.
November 18, 1963 July 5, 1964
This earthquake occurred to the immediate south of the This event was part of a sequence of at least 13 earthquakes Delfin Basin along the northern Canal de Ballenas (Figure 2). that occurred just south of the Carmen basin (Figure 2) be- Sykes [1970] obtained a strike slip mechanism (135/109/180) tween June 29 and July 6, 1964 [Thatcher and Brune, 1971]. A from P wave first motions and S wave polarizations. The best strike-slip mechanism (131/90/180) was determined by Sykes fitting point source (Figure B1) has a predominantly strike slip [-1970] from P wave first motions and S wave polarizations. mechanism on a fault plane that dips to the northeast Long-period P and SH waveforms for this earthquake are (131/111/167). The nonvertical dip angle is most evident in the shown in Figure B2. Waveform inversions conducted over a P waveforms at the South American stations, where the P and range of centroid depths indicate that there are two point- sP arrivals are of opposite polarity. Beca.use of this polarity source solutions, differing principally in the centroid depth, difference, the centroid depth is well resolved at 7 _ 2 km at with essentially indistinguishable residuals. The shallower 90% confidence. The seismic moment is 4.6 x 1025 dyn cm. solution (5 km) has a strike-slip mechanism (128/58/175) and a
July 5, 1964
P WAVES • SH WAVES ,.• ..• / .......... •
__1 1/'•1 • /V'• •^ •ource Time Function (sec)
• - - TRN
• I /• KIP• k •f% •BEC ,•11
• 5 NT E I I I I 1610 o • • • •6•0
sec •] ' sec
Fig. B2. Comparison of observed P and SH waves from the earthquake of July 5, 1964, with synthetic waveforms for the best fitting point source. See Figure 8 for further explanation.

GOFF ET AL.' EARTHQUAKE SOURCE MECHANISMS 10,499
Fig. B3.
July 6, 1964
P WAVES ,, ,•"• 46 SH WAVES Source Time Fun•on (sec) ,f .-._,
t• CMC ß -- NOR x \ / KON
r ' / • BHP •f•l) I _ 1 LPA NNA'• ••
sec sec
Comparison of observed P and SH waves from the earthquake of July 6, 1964, with synthetic waveforms for the best fitting point source. See Figure 8 for further explanation.
seismic moment of 4.0 x 10²• dyn cm. The impulsive phase arriving approximately 15 s after the beginning of the first P motion at a number of stations (Figure B2) may indicate a second subevent. While the incorporation of a second sub- event results in an improved fit to the waveforms compared with the single point-source model, the mechanism of the second subevent is not well constrained. The deeper solution (13 km) has a nearly identical fault geometry (128/62/171) and moment (4.1 x 10 25 dyn cm).
The southwestward dip of the fault plane appears to depart significantly from vertical, a result controlled by the wave- forms at stations BHP and ARE. To test whether the slip vector azimuth (131 ø) for the mechanism in Figure B2 is biased by an incorrect dip angle, we conducted a waveform inversion in which the fault plane was constrained to be verti- cal. The mechanism (128/90/175) and slip vector azimuth (128 ø) are very close to those obtained in the unconstrained inversion.
Overall, the resolution of centroid depth for this event is poor. For centroid depths between 0 and 19 km, the length of the source time function trades off with depth so that the fit of synthetic and observed waveforms is not significantly worse at the 85% confidence level than for the two best fitting depths. Solutions at centroid depths of less than 3 km, however, dis- play an unlikely mechanism (strike-slip motion on a nearly horizontal fault plane, or dip-slip motion on a nearly vertical plane) and can probably be rejected.
duly 6, 1964
This earthquake was the largest event in the sequence of June-July 1964. A strike-slip fault plane solution (135/90/175) was obtained by Molnar [1973]. The resolution of the source parameters of this event is degraded somewhat by noise at several stations from earlier events (Figure B3), but in general the waveforms are quite similar to those for the earthquake of July 5. The best fitting point source has a strike-slip mecha-
nism (129/76/175), a moment of 7.8 x 1025 dyn cm, and a centroid depth of 3 km. The statistical test of goodness of fit, however, limits centroid depth only to the range 0-13 km. The focal mechanism solution is similar to that of Molnar [1973], but the probable fault plane appears to dip significantly to the southwest.
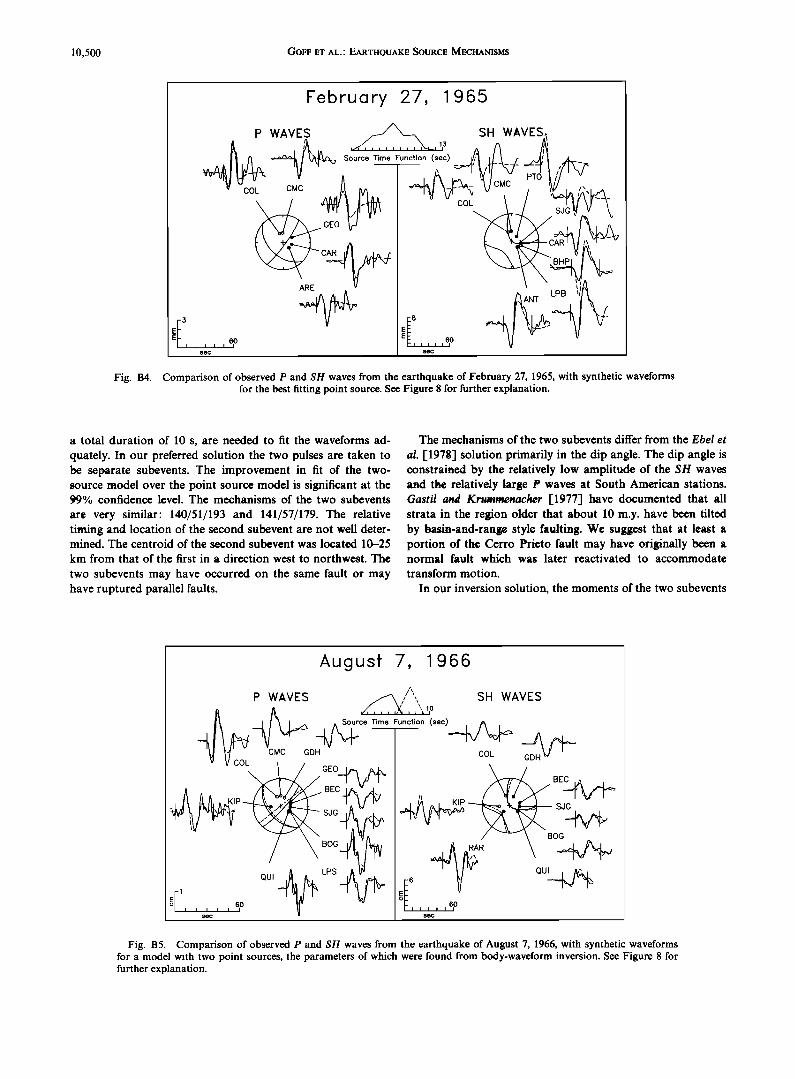
February 27, 1965
This earthquake occurred on the plate boundary between the San Pedro Martir and Guaymas basins (Figure 2). Molnar [1973] determined a strike-slip mechanism (132/80/180) from P wave first motions and S wave polarizations. Station cover- age is incomplete (Figure B4) because of the comparatively small moment (M o = 1.1 x 1025 dyn cm). For this reason, the strike-slip mechanism (133/48/190), at 5-km centroid depth, is not particularly robust for this event. The uncertainty in fault strike is +_ 5 ø at 70% confidence. The apparently large depar- ture of the dip angle from vertical is suspect because of the lack of station coverage to the west. Because of these uncer- tainties, we have excluded this event from slip vector analysis. Because of the trade off with source time function duration, the centroid depth is constrained only to be less than 18 km beneath the seafloor.
August 7, 1966
The August 7, 1966, E1 Golfo earthquake ruptured a por- tion of the Cerro Prieto fault at the northern tip of the Gulf of California (Figure 2). Sykes [1970] determined a focal mecha- nism of 129/70/200 from P wave first motions. Ebe! et al. [1978] conducted forward modeling of both body waves and surface waves. They obtained a strike-slip mechanism (140/85/183), a centroid depth of 10 km, a body wave moment of 5 x 10 25 dyn cm, and a source duration of 4 s.
Our solution (Figure BS) differs from that of Ebe! et al. [1978] in several important ways. If a single point source is assumed, two distinct pulses in the source time function, with
10,500 GOFF ET AL.: EARTHQUAKE SOURCE MECHANISMS
February 27, 1965
Fig. B4. Comparison of observed P and SH waves from the earthquake of February 27, 1965, with synthetic waveforms for the best fitting point source. See Figure 8 for further explanation.
a total duration of 10 s, are needed to fit the waveforms ad-
quately. In our preferred solution the two pulses are taken to be separate subevents. The improvement in fit of the two- source ,model over the point source model is significant at the •99% confidence level. The mechanisms of the two subevents
are very similar: 140/51/193 and 141/57/179. The relative timing and location of the second subevent are not well deter- mined. The centroid of the second subevent was located 10-25
km from that of the first in a direction west to northwest. The
two subevents may have occurred on the same fault or may have ruptured parallel faults.
The mechanisms of the two subevents differ from the Ebel et
al. r1978] solution primarily in the dip angle. The dip angle is constrained by the relatively low amplitude of the SH waves and the relatively large P waves at South American stations. Gastil and Krummenacher [1977] have documented that all strata in the region older that about 10 m.y. have been tilted by basin-and-range style faulting. We suggest that at least a portion of the Cerro Prieto fault may have originally been a normal fault which was later reactivated to accommodate
transform motion.
In our inversion solution, the moments of the two subevents
Augusf 7, 1966
P WAVES .......--'•,,'"",, SH WAVES /!, /, .... X, ,',,,,0
I - I - I COL G•H COL
•Ul • a x
60 • o •ac 60 ......
Fig. B5. Comparison of observed P and SH waves from the earthquake of August 7, 1966, with synthetic waveforms for a model with two point sources, the parameters of which were found from body-waveform inversion. See Figure 8 for further explanation.

GOFF ET AL.: EARTHQUAKE SOURCE MECHANISMS 10,501
March 20, 1969
P WAVES ,,,• SH WAVES 1•0
,, ,, , \
ß
O• OAR • BHP,• • NNA •
50 • 60 I I I I I I
I Ise • I sec
Fig. B6. Comparison of observed P and SH waves from the earthquake of March 20, 1969, with synthetic waveforms for the best fitting point source. See Figure 8 for further explanation.
are 2.5 and 1.4 x 1025 dyn cm, respectively. The total moment of 3.9 x 1025 dyn cm is thus only slightly less than that re- ported by Ebel et al. [1978]. The centroid depth of the first subevent is 12 km; 90% confidence limits are 9-14 km. This depth is well constrained because of the short duration of the source time function and the clear expression of depth phases on most of the P waveforms. The best fitting centroid depth for the second subevent is 15 km, but a solution as shallow as 3 km or as deep as 20 km cannot be ruled out.
March 20, 1969
This event was the largest of a swarm of more than 200 earthquakes that occurred between March 20 and April 3,
1969, in the Wagner basin (Figure 2); 14 of the events were of mb> 5 [Thatcher and Brune, 1971]. Thatcher and Brune [1971] used P wave first motions and S wave polarizations to infer a fault plane solution displaying a combination of strike- slip and normal faulting (50/60/225) and nonorthogonal nodal planes. From the surface wave trace at one station, Thatcher [1972] estimated the seismic moment to be 1.3 x 1025 dyn cm. From Pg- Pn times, Thatcher and Brune [1971] determined the best average focal depth for the swarm events to be 7 km.
The P wave signal-to-noise ratio and station coverage (Figure B6) are good for a gulf earthquake of this size. The waveforms are best matched by a nearly pure normal faulting mechanism (23/43/273). The orientation of the nodal planes is
March 21, 1969
, P WAVES
-•-••-7 •-•••.•/•-/• Source Time Function (sec) SH WAVES
uI
Fig. B7. Comparison of observed P and SH waves from the earthquake of March 21, 1969, with synthetic waveforms for the best fitting point source. See Figure 8 for further explanation.

10,502 GOFF ET AL.' EARTHQUAKE SOURCE MECHANISMS
April 4, 1969
WAVES •
•2• , z ..... • ,,• _••• Source Time Func•-•on (sec)
SH WAVES
Fig. B8. Comparison of observed P and SH waves from the earthquake of April 4, 1969, with synthetic waveforms for the best fitting point source. See Figure 8 for further explanation.
well constrained by changes in SH wave polarity between COL and WES and between SJG and NNA, but the SH waveforms are of poor quality. The seismic moment is 4.8 x 1024 dyn cm, less than half the value estimated by Thatcher
[1972]. The centroid depth is 6 _+ 3 km, consistent with the average focal depth for swarm events inferred by Thatcher and Brune [1971].
March 21, 1969
This earthquake was one of the larger events in the Wagner basin swarm. Surface wave arrivals from earlier events se-
verely limited the number of usable SH waveforms (Figure B7) to three stations located at nearly the same azimuth. Station
azimuthal coverage, and the waveforms are severely contami- nated by long-period noise. The waveform data are well matched with a nearly pure normal-faulting mechanism (35/43/274). Despite the poor station coverage, the fault strike, approximately parallel to the trend of spreading center seg- ments in the gulf, is constrained by the change in $H first motion between CAR and ARE. The centroid depth is 3 _+ 2 km at 95% confidence, and the seismic moment is 3.3 x 1024 dyn cm.
April 4, 1969
Ths earthquake probably occurred beneath the continental shelf of Baja California (Figure 2). From P wave first motions,
coverage for P waves is also poor, with only about 120 ø of Molnar [1973] determined a normal faulting mechanism
I August 17, 1969 (201 3) P WAVES • SH WAVES
A• •i•A •A ^__ Source Time Function ( L"•/ ........ •s•'lc) IA r•
,•,t K••K•O •• VA%,••/F •. •L•L NOR
E/ I I I I I I I f E• I I I I I I 1 Fig. B9. Comparison of observed P and SH waves from the earthquake of August 17, 1969 (2013 UT), with synthetic
waveforms for the best fitting point source. See Figure 8 for further explanation.
GOFF ET AL.' EARTHQUAKE SOURCE MECHANISMS 10,503
Fig. B10.
Augusf 17, 1969 (201 5)
P WAVES •,• .... SH WAVES '{• • . Source Time Function (se'c)
- • • • / ,•V,,•- •••[•'
"•1 • BH. ,• A _ ANT, li ',•, A
..... sec
Comparison of observed P and SH waves from the earthquake of August 17, 1969 (2015 UT), with synthetic waveforms for the best fitting point source. See Figure 8 for further explanation.
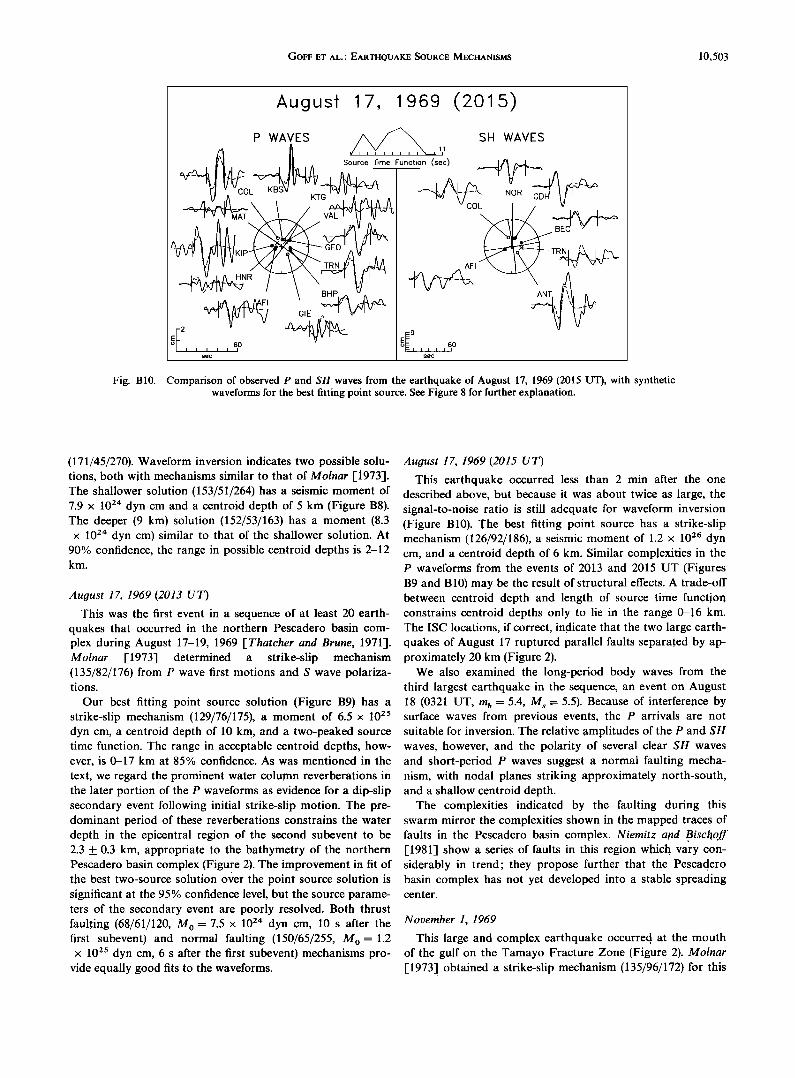
(171/45/270). Waveform inversion indicates two possible solu- tions, both with mechanisms similar to that of Molnar [i973]. The shallower solution (153/51/264) has a seismic moment of 7.9 x 1024 dyn cm and a centroid depth of 5 km (Figure B8). The deeper (9 km) solution (152/53/163) has a moment (8.3 x l02'r dyn cm) similar to that of the shallower solution. At
90% confidence, the range in possible centroid depths is 2-12 km.
August 17, 1969 (2013 UT)
This was the first event in a sequence of at least 20 earth- quakes that occurred in the northern Pescadero basin com- plex during August 17-19, 1969 [Thatcher and Brune, 1971]. Molnar 1-1973] determined a strike-slip mechanism (135/82/176) from P wave first motions and S wave polariza- tions.
Our best fitting point source solution (Figure B9) has a strike-slip mechanism (129/76/175), a moment of 6.5 x 1025 dyn cm, a centroid depth of 10 km, and a two-peaked source time function. The range in acceptable centroid depths, how- ever, is 0-17 km at 85% confidence. As was mentioned in the
text, we regard the prominent water column reverberations in the later portion of the P waveforms as evidence for a dip-slip secondary event following initial strike-slip motion. The pre- dominant period of these reverberations constrains the water depth in the epicentral region of the second subevent to be 2.3 ___ 0.3 km, appropriate to the bathymetry of the northern Pescadero basin complex (Figure 2). The improvement in fit of the best two-source solution over the point source solution is significant at the 95% confidence level, but the source parame- ters of the secondary event are poorly resolved. Both thrust faulting (68/61/120, M 0 = 7.5 x l02'• dyn cm, 10 s after the first subevent) and normal faulting (150/65/255, M 0 -1.2 x 1025 dyn cm, 6 s after the first subevent) mechanisms pro-
vide equally good fits to the waveforms.
August 17, 1969 (2015 UT)
This earthquake occurred less than 2 min after the one described above, but because it was about twice as large, the signal-to-noise ratio is still adequate for waveform inversion (Figure B10). The best fitting point source has a strike-slip mechanism (126/92/186), a seismic moment of 1.2 x 1026 dyn cm, and a centroid depth of 6 km. Similar complexities in the P waveforms from the events of 2013 and 2015 UT (Figures B9 and B10) may be the result of structural effects. A trade-off between centroid depth and length of source time functiorl constrains centroid depths only to lie in the range 0-16 km. The ISC locations, if correct, indicate that the two large earth- quakes of August 17 ruptured parallel faults separated by ap- proximately 20 km (Figure 2).
We also examined the long-period body waves from the third largest earthquake in the sequence, an event on August 18 (0321 UT, m b = 5.4, M s •= 5.5). Because of interference by surface waves from previous events, the P arrivals are not suitable for inversion. The relative amplitudes of the P and SH waves, however, and the polarity of several clear SH waves and short-period P waves suggest a normal faulting mecha- nism, with nodal planes striking approximately north-south, and a shallow centroid depth.
The complexities indicated by the faulting during this swarm mirror the complexities shown in the mapped traces of faults in the Pescadero basin complex. Niemitz and Bischoff [1981] show a series of faults in this region whic h vary con- siderably in trend; they propose further that the Pescadero basin complex has not yet developed into a stable spreading center.
Not;ember 1, 1969
This large and complex earthquake occurred, at the mouth of the gulf on the Tamayo Fracture Zone (Figure 2). Molnar [1973] obtained a strike-slip mechanism (135/96/172) for this

10,504 GOFF ET AL..' EARTHQUAKE SOURCE MECHANISMS
November 1, 1969
WAVES • SH WAVES •bS_ , •/•/•_ Source Time ......... 'Function •'•-'m/ •'•le':) I • •1
SJG
Fig. B11. Comparison of observed P and SH waves from the earthquake of November 1, 1969, with synthetic waveforms for the best fitting point source. See Figure 8 for further explanation.
event from P wave first motions. Sharman et al. [1976] reeval- uated the first motion data and obtained a slightly different mechanism (127/90/180).
We model this earthquake as a horizontally propagating point source, which is an improvement over a'fixed point source at the 90% level of significance. Because of the ex- tremely emergent character of the P waves (Figure Bll), evi- dent on both long- and short-period records, it is quite diffi- cult to establish the correct alignment between synthetic and observed waveforms. Energetic arrivals approximately 25 s into the P waveforms are notable at most stations. We were
unable to model these arrivals, however, even with a multiple-
source model. The best fitting propagating point source has a strike-slip mechanism (122/77/175) and a moment of 1.1 x 1026 dyn cm. Rupture occurred in a northwesterly direc-
tion; at an assumed rupture velocity of 3.2 km/s, the fault length is about 20 km. The best fitting centroid depth is 6 km, but no depth shallower than 13 km can be excluded at 90% confidence.
January 19, 1971
This earthquake occurred on the transform portion of the plate boundary between the Pescadero basin complex and the Mazatlan Ridge (Figure 2). The main features of the long-
Jdnuary 19, 1971
i i i i I
sec
P WAVES , ,• SH WAVES
•L • Source Time Function (sec) .• _• KEV
• / so•, • •-
CAR x•
Fig. B12. Comparison of observed P and SH waves from the earthquake of January 19, 1971, with synthetic waveforms for the best fitting point source. See Figure 8 for further explanation.

GOFF ET AL.: EARTHQUAKE SOURCE ?•ECHANISMS 10,505
Fig. B13.
Sepfember 30, 1971
P WAVES ,•-'• SH WAVES Function (sec) .• /•-•.•.•_
'v '-" COL 'l/'
7 610 I I I I I
Comparison of observed P and SH waves from the earthquake of September 30, 1971, with synthetic wave- forms for the best fitting point source. See Figure 8 for further explanation.
period waveforms for this event (Figure B12) are well matched by a strike-slip mechanism (127/84/176), a moment of 1.2 x 1025 dyn cm, and a centroid depth of 4 km. A simple
trapezoidal source time function suggests a fault length of about 15 km. A second, nearly indistinguishable, minimum in the residual-versus-depth curve occurs at 7 km; the mecha- nism (127/83/177) and moment (1.3 x 1025 dyn cm) are nearly identical to those of the shallower solution. The full range in possible centroid depths at 90% confidence is 0-10 km. The fit between synthetic and observed SH waveforms for the solu- tion in Figure B12 is good. Additional energy arriving ap- proximately 10 s after the onset of the P waves is suggestive of a complex source. Inversions with two point sources indicate that the second subevent may be characterized by high-angle normal faulting, but the improvement in fit is not significant at greater than 70% confidence because of the low signal-to- noise ratio of the P waveforms. We have not included a
second subevent in our source model of this earthquake be- cause of the uncertainty in its source parameters.
September 30, 1971
This earthquake occurred between the Guaymas and Carmen basins (Figure 2). Station coverage for P and SH waveforms is excellent, and the signal-to-noise ratio is very good at most stations. This event displays complex P wave- forms and probably involved multiple subevents. We are unable to resolve the mechanisms of any but the primary subevent, however. The best fitting point source (Figure B13) has a strike-slip mechanism (128/85/179), a seismic moment of 6.7 x 1025 dyn cm, and a centroid depth of 7 km. At 90% confidence the centroid depth lies in the range 0-11 km.
March 25, 1973
This earthquake occurred between the Carmen and Faral- lon basins (Figure 2). Reichle et al. [1976] employed P wave
first motions and surface wave radiation patterns to obtain a strike-slip mechanism (147/90/180). They estimated a moment of 4.6 x 10²'• dyn cm and a centroid depth of 1-3 km from surface wave amplitude spectra. They also noted the anoma- lous strike of the probable fault plane for this earthquake, which deviates by aproximately 20 ø from the trend of the main bathymetric escarpments in the gulf. Reichle et al. [1976] also reported aftershock locations obtained from a small network of drifting sonobuoys. On the basis of these locations they inferred that this event occurred along a 10- to 15-km length of fault near, but distinct from, the principal transform, and they argued that the anomalous trend represents a recent de- velopment in the pattern of local faulting, subsidiary to the main trend of transform faulting in the gulfi Waveform inver- sion (Figure B14) yields a source mechanism (153/94/190) and moment (4.6 x 1024 dyn cm) similar to those obtained by Reichle et al. [1976] and a centroid depth of 9 km. The range in possible centroid depths at 90% confidence is 0-13 km. The short duration and simple trapezoidal shape of the source time function (Figure B14) are consistent with the fault length of 10-15 km inferred from aftershock locations [Reichle et al., 1976].
May 31, 1974
This earthquake occurred on the transform fault just south of the Guaymas basin (Figure 2). Reichle et al. [1976] de- ployed sonobuoys in the epicentral area within 36 hours of the main shock; they inferred a 20- to 30-km length for the after- shock zone and suggested that aftershock focal depths were approximately 3-5 km. The station coverage and signal-to- noise ratio of the P and SH waveform data for this earthquake are excellent. The best fitting point source solution (Figure B15) has a predominantly strike-slip mechanism (123/65/169) and a moment of 3.8 x 1025 dyn cm. The slip vector azimuth (128 ø ) is reduced by 2 ø in an inversion solution obtained with

10,506 GOFF ET AL.' EARTHQUAKE SOURCE MECHANISMS
Mdrch 25, 1973
5O i i i
IsecI
P WAVES ,• SH WAVES Source Time Function (sec)
E I •
$ec
Fig. B14. Comparison of observed P and SH waves from the earthquake of March 25, 1973, with synthetic waveforms generated for the best fitting point source. See Figure 8 for further explanation.
the fault plane constrained to be vertical. The centroid depth for the solution in Figure B15 is 5 km, but the centroid depth trades off with the duration of the source time function, and
any value in the range 0-10 km is permitted by the waveform data. The source time function is consistent with a fault length of about 25 km, a value comparable to the length of the aftershock zone.
July 8, 1975
This event is described fully in the text.
September 24, 1975
This earthquake occurred at the northern end of the Pesca- dero basin complex (Figure 2). The best fitting point source (Figure B16) has a strike-slip mechanism (129/72/173), a seis- mic moment of 1.6 x 1025 dyn cm, and a centroid depth of 9 km. The residuals are not significantly worse, however, for any centroid depth in the range 0-14 km. An inversion conducted with the fault plane constrained to be vertical yielded a mech- anism with a slip vector azimuth 2 ø less than that for the solution in Figure B16. A two-source model improves the fit
31, 1974
P WAVES ..... SH WAVES 17
oroe,meno,oneo -- [\ ., ^ KBS GDH COL
E sec 60 •v •' • ' • sec 60 Fig. B15. Comparison of observed P and SH waves from the earthquake of May 31, 1974, with synthetic waveforms
generated for the best fitting point source. See Figure 8 for further explanation.

GOFF ET AL.' EARTHQUAKE SOURCE MECHANISMS 10,507
Sepfember 24, 1975
•sec • • 5•0
P WAVES ,• ,•
Source Time Function (sec)• - -J t • - GDH•
SH WAVES
COL
r•AFI
øE 11 60 i i i i i i
Fig. B16. Comparison of observed P and SH waves from the earthquake of September 24, 1975, with synthetic wave- forms for the best fitting point source. See Figure 8 for further explanation.
to the waveforms- while the mechanism of the secondary sub- event appears to involve dip-slip motion, it is poorly resolved.
February 9, 1976
This event occurred near the Tres Marias escarpment (Figure 2) and probably represents motion between the North American and Rivera plates. On the basis of P wave first motions, Eissler and McNally [1984] inferred a strike-slip fault plane solution, a mechanism which supports the predic- tion of Minster and Jordan [1979] for the direction of North
American-Rivera relative motion in that region. Such a mech- anism is not compatible with the body waveform data, how- ever (Figure 1317). A thrust-faulting mechanism (92/52/86), a moment of 7.1 x 1024 dyn cm, and a centroid depth of 11 _ 2 km provide a good fit to the observed data. A second mini- mum in the residual-versus-depth curve is present at the base of the crust (6 km), but this solution is not robust with respect to changes in the source velocity model (see text). H. K. Eissler (personal communication, 1985) acknowledged that for P waves near nodal directions some of the first motions reported
February 9, 1976
WAVES • SH WAVES ,,s
• K•BS "1 Source Time Function (s•c) I,• GECO ,t • -• GDH
QUI
I I I I I I I I ,6,o sec sec
Fig. B17. Comparison of observed P and SH waves from the earthquake of February 9, 1976, with synthetic waveforms for the best fitting point source. See Figure 8 for further explanation.

10,508 GOFF ET AL.: EARTHQUAKE SOURCE MECHANISMS
February 10, 1984
P WAVES
,,•.• Ax.,•. i • ' ,Source Time
COL BEC •
ARE BO• •
, ,•W/• SH WAVES ?
Func_t[on (sec) -• z•-'•,-
-I FI COL I /
BEC
.... Fig. B18. Comparison of observed P and SH waves from the earthquake of February 10, 1984, with synthetic waveforms
for the best fitting point source. See Figure 8 for further explanation.
by Eissler and McNally [1984] may be in error as a result of reading pP rather than P as the dominant phase.
February 10, 1984
This earthquake occurred on the transform just north of the Guaymas basin (Figure 2). Using a semiautomated centroid moment tensor inversion scheme, Dziewonski et al. [1984] ob- tained a strike-slip mechanism (121/101/190) and a seismic moment of 1.3 x 1025 dyn cm. Body waveform inversion yields a best fitting point source (Figure B18) with similar mechanism (127/96/182) and moment (1.2 x 1025 dyn cm). The best fitting centroid depth is 6 km, but at 90% confidence the centroid depth is constrained only to lie in the range 0-12 km. The two distinct peaks in the source time function (Figure B18) are not well constrained; such a source time function is consistent with the P waveforms at most South American sta-
tions, but at the three stations at the most northerly azimuths the initial P motion appears to be opposite in polarity to that in the synthetic waveforms.
Acknowledgments. We appreciate constructive discussions with Charles DeMets, Holly Eissler, Paul Huang, Tom Jordan, Kim Kastens, Bernard Minster, Jeanne Sauber, and Joann Stock, and we thank John Nabelek and Jason Phipps Morgan for copies of papers in advance of publication. Bernard Minster and Tom Jordan kindly calculated the RM2' angular velocity vector for Pacific-North Ameri- can motion using the new slip vector azimuths obtained in this study. We also thank Mark Carlson and Laura Doughty for their assistance with manuscript preparation and Joe Engeln and a second reviewer for helpful comments on an earlier draft. This research was supported by the National Science Foundation under grants EAR-8416192 and EAR-8617967 and by the National Aeronautics and Space Adminis- tration under contract NAS 5-27339 and grant NAG 5-814.
REFERENCES
Aki, K., and P. G. Richards, Quantitative Seismolo#y: Theory and Methods, vol. 1, 557 pp., W. H. Freeman, San Francisco, Calif., 1980.
Allen, C. R., L. T. Silver, and F. G. Stehli, Agua Blanca Fault--A major transverse structure of northern Baja California, Mexico, Geol. Soc. Am. Bull., 71, 457-482, 1960.
Allen, C. R., P. St. Amand, C. F. Richter, and J. M. Nordquist, Re- lationship between seismicity and geologic structure in the southern California region, Bull. Seismol. Soc. Am., 55, 753-797, 1965.
Atwater, T., Implications of plate tectonics for the Cenozoic tectonic evolution of western North America, Geol. Soc. Am. Bull., 81, 3513- 3536, 1970.
Ben-Menahem, A., Radiation of seismic body waves from a finite moving source in the Earth, d. Geophys. Res., 67, 345-350, 1962.
Bergman, E. A., and S.C. Solomon, Source mechanisms of earth- quakes near mid-ocean ridges from body waveform inversion: Im- plications for the early evolution of oceanic lithosphere, d. Geophys. Res., 89, 11,415-11,441, 1984.
Bergman, E. A., and S.C. Solomon, Earthquake source mechanisms from body-waveform inversion and intraplate tectonics in the northern Indian Ocean, Phys. Earth Planet. Inter., 40, 1-23, 1985.
Bergman, E. A., J. L. Nabelek, and S. C. Solomon, An extensive region of off-ridge normal faulting earthquakes in the southern Indian Ocean, d. Geophys. Res., 89, 2425-2443, 1984.
Bergman, E. A., S.C. Solomon, and J. A. Goff, Source processes of large earthquakes on north Atlantic transform faults (abstract), Eos Trans. AGU, 67, 1230, 1986.
Bischoff, J. L., and T. L. Henyey, Tectonic elements of the central part of the Gulf of California, Geol. Soc. Am. Bull., 85, 1893-1904, 1974.
Bischoff, J. L., and J. W. Niemitz, Bathymetric maps of the Gulf of California, Map 1-1244, U.S. Geol. Surv., Reston, Va., 1980.
Brune, J. N., Seismic moment, seismicity, and rate of slip along major fault zones, d. Geophys. Res., 73, 777-784, 1968.
Burr, N. C., and S.C. Solomon, The relationship of source parame- ters of oceanic transform earthquakes to plate velocity and trans- form length, d. Geophys. Res., 83, 1193-1205, 1978.
Chase, C. G., Plate kinematics: The Americas, east Africa, and the rest of the world, Earth Planet. Sci. Lett., 37, 355-368, 1978.
Chen, W.-P., and P. Molnar, Focal depths of intracontinental and intraplate earthquakes and their implications for the thermal and mechanical properties of the lithosphere, d. Geophys. Res., 88, 4183- 4214, 1983.
Chung, W.-Y., and J. J. Cipar, Source modeling of the Hsingtai, China, earthquakes of March 1966, Phys. Earth Planet. Inter., 33, 111-125, 1983.
Cipar, J., Source processes of the Haicheng, China, earthquake from observations of P and S waves, Bull. Seismol. Soc. Am., 69, 1903- 1916, 1979.
DeMets, C., R. G. Gordon, S. Stein, D. Argus, and D. Woods, Pacific-North America spreading rate in the Gulf of California (abstract), Eos Trans. AGU, 67, 905, 1986.
Dziewonski, A.M., J. E. Franzen, and J. H. Woodhouse, Centroid- moment tensor solutions for January-March, 1984, Phys. Earth Planet. Inter., 34, 209-219, 1984.

GOFF ET AL.: EARTHQUAKE SOURCE MECHANISMS 10,509
Ebel, J. E., and D. V. Helmberger, P-wave complexity and fault as- perities: The Borrego Mountain, California, earthquake of 1968, Bull. Seismol. Soc. Am., 72, 413-437, 1982.
Ebel, J. E., L. J. Burdick, and G. S. Stewart, The source mechanism of the August 7, 1966 E1 Golfo earthquake, Bull. Seismol. Soc. Am., 68, 1281-1292, 1978.
Eissler, H. K., and K. C. McNally, Seismicity and tectonics of the Rivera plate and implications for the 1932 Jalisco, Mexico, earth- quake, J. Geophys. Res., 89, 4520-4530, 1984.
Eng½ln, J. F., D. A. Wiens, and S. Stein, Mechanisms and depths of Atlantic transform earthquakes, J. Geophys. Res., 91, 548-577, 1986.
Forsyth, D. W., and B. Wilson, Three-dimensional temperature struc- ture of a ridge-transform-ridge system, Earth Planet. Sci. Lett., 70, 355-362, 1984.
Gastil, R. G., and D. Krummenacher, Reconnaissance geology of coastal Sonora between Puerto Lobos and Bahia Kino, Geol. Soc. Am. Bull., 88, 187-198, 1977.
Gastil, R. G., R. P. Phillips, and E. C. Allison, Reconnaissance Ge- ology of the State of Baja California, Mere. Geol. Soc. Am., 140, 170 pp., Geological Society of America, Boulder, Colo., 1975.
Gutenberg, B., and C. F. Richter, Seismicity of the Earth and Associ- ated Phenomena, 2nd ed., 310 pp., Princeton University Press, Princeton, N.J., 1954.
Harrison, J. C., and S. P. Mathur, Gravity anomalies in Gulf of California, in Marine Geology of the Gulf of California, Mere. Am. Assoc. Pet. Geol., 3, edited by T. van Andel and G. G. Shor, Jr., pp. 76-89, American Association of Petroleum Geologists, Tulsa, Okla., 1964.
Henyey, T. L., and J. L. Bischoff, Tectonic elements of the northern part of the Gulf of California, Geol. Soc. Am. Bull., 84, 315-330, 1973.
Huang, P. Y., and S.C. Solomon, Centroid depths and mechanisms of mid-ocean ridge earthquakes in the Indian Ocean, Gulf of Aden, and Red Sea, J. Geophys. Res., 92, 1361-1382, 1987.
Huang, P. Y., S.C. Solomon, E. A. Bergman, and J. L. Nabelek, Focal depths and mechanisms of Mid-Atlantic Ridge earthquakes from body waveform inversion, J. Geophys. Res., 91, 579-598, 1986.
Jemsek, J.P., E. A. Bergman, J. L. Nabelek, and S.C. Solomon, Focal depths and mechanisms of large earthquakes on the Arctic mid- ocean ridge system, J. Geophys. Res., 91, 13,993-14,005, 1986.
Kanamori, H., and D. L. Anderson, Theoretical basis of some empiri- cal relations in seismology, Bull. Seismol. Soc. Am., 65, 1073-1095, 1975.
Kasser, M., J.-C. Ruegg, P. Lesage, L. Ortlieb, J. Pagarete, N. Duch, J. Guerrero, and J. Roldan, Geodetic measurements of plate motions across the central Gulf of California, 1982-1986, Geophys. Res. Lett., 14, 5-8, 1987.
Kastens, K. A., Deep tow survey of a transform fault between oceanic and continental crust, Guaymas Basin, Gulf of California (abstract), Geol. Soc. Am. Abstr. Programs, 13, 63, 1981.
Larson, P. A., J. D. Mudie, and R. L. Larson, Magnetic anomalies and fracture-zone trends in the Gulf of California, Geol. Soc. Am. Bull., 83, 3361-3368, 1972.
Larson, R. L., Bathymetry, magnetic anomalies, and plate tectonic history of the mouth of the Gulf of California, Geol. Soc. Am. Bull., 83, 3345-3360, 1972.
Larson, R. L., H. W. Menard, and S. M. Smith, Gulf of California: A result of ocean floor spreading and transform faulting, Science, 161, 781-784, 1968.
Lawver, L. A., and D. L. Williams, Heat flow in the central Gulf of California, J. Geophys. Res., 84, 3465-3478, 1979.
Lomnitz, C., F. Mooser, C. R. Allen, J. N. Brune, and W. Thatcher, Seismicity and tectonics of the northern Gulf of California, Mexico. Preliminary results, Geofis. Int., 10, 37-48, 1970.
Lonsdale, P., A transform continental margin rich in hydrocarbons, Gulf of California, Am. Assoc. Pet. Geol. Bull., 69, 1160-1180, 1985.
L0nsdale, P., and K. Becker, Hydrothermal plumes, hot springs, and conductive heat flow in the southern trough of Guaymas Basin, Earth Plan. Sci. Lett., 73, 211-225, 1985.
McKenzie, D. P., and W. J. Morgan, Evolution of triple junctions, Nature, 224, 125-133, 1969.
Minster, J. B., and T. H. Jordan, Present-day plate motions, J. Geo- phys. Res., 83, 5331-5354, 1978.
Minster, J. B., and T. H. Jordan, Rotation vectors for the Philippine and Rivera plates (abstract), Eos Trans. AGU, 60, 958, 1979.
Minster, J. B., and T. H. Jordan, Self-consistent modeling of western U.S. deformation (abstract), Eos Trans. AGU, 66, 849, 1985.
Minster, J. B., T. H. Jordan, P. Molnar, and E. Haines, Numerical
modeling of instantaneous plate tectonics, Geophys. J. R. Astron. Soc., 36, 541-576, 1974.
Molnar, P., Fault plane solutions of earthquakes and direction of motion in the Gulf of California and on the Rivera Fracture Zone, Geol. Soc. Am. Bull., 84, 1651-1658, 1973.
Molnar, P., Earthquake recurrence intervals and plate tectonics, Bull. Seismol. Soc. Am., 69, 115-133, 1979.
Moore, D. G., Plate-edge deformation and crustal growth, Gulf of California structural province, Geol. Soc. Am. Bull., 84, 1883-1905, 1973.
Moore, D. G., and J. R. Curray, Geologic and tectonic history of the Gulf of California, Initial Rep. Deep Sea Drill. Proj., 64, 1279-1294, 1982.
Munguia, L., M. Reichle, A. Reyes, R. Simons, and J. Brune, After- shocks of the 8 July, 1975 Canal de las Ballenas, Gulf of California, earthquake, Geophys. Res. Lett., 4, 507-509, 1977.
Nabelek, J. L., Determination of earthquake source parameters from inversion of body waves, Ph.D. thesis, 346 pp., Mass. Inst. of Tech- nol., Cambridge, 1984.
Nabelek, J., Geometry and mechanism of faulting of the 1980 E1 Asnam, Algeria, earthquake from inversion of teleseismic body waves and comparison with field observations, J. Geophys. Res., 90, 12,713-12,728, 1985.
Nabelek, J. L., W.-P. Chen, and H. Ye, The Tangshan earthquake sequence and its implications for the evolution of the North China basin, J. Geophys. Res., in press, 1987.
Nicolas, A., Novel type of crust produced during continental rifting, Nature, 315, 112-115, 1985.
Niemitz, J. W., and J. L. Bischoff, Tectonic elements of the southern part of the Gulf of California, Geol. Soc. Am. Bull., Part 2, 92, 360-407, 1981.
North American Geologic Map Committee, Geologic map of North America, scale 1:5,000,000, U.S. Geol. Surv., Reston, Va., 1965.
Phillips, R. P., Seismic refraction studies in Gulf of California, in Marine Geology of the Gulf of California, Mem. Am. Assoc. Pet. Geol., 3, edited by T. van Andel and G. G. Shor, Jr., pp. 90-121, American Association of Petroleum Geologists, Tulsa, Okla., 1964.
Phipps Morgan, J., and D. W. Forsyth, Three-dimensional flow and temperature perturbations due to a transform offset: Effects on oceanic crustal and upper mantle structure, J. Geophys. Res., in press, 1987.
Poppe, B. B., D. A. Naab, and J. S. Perry, Seismograph station codes and characteristics, U.S. Geol. $urv. Circ., 791, 171 pp., 1978.
Rebollar, C. J., A. Reyes, and M. Reichle, Estudia del enjambre de San Quintin, Baja California, Mexico, ocurrido durante 1975, Geofis. Int., 21, 331-358, 1982.
Reichle, M. S., and I. Reid, Detailed study of earthquake swarms from the Gulf of California, Bull. $eismol. $oc. Am., 67, 159-171, 1977.
Reichle, M. S., G. F. Sharman, and J. N. Brune, Sonobuoy and tele- seismic study of Gulf of California transform fault earthquake se- quences, Bull. $eismol. $oc. Am., 66, 1623-1641, 1976.
Reid, I., M. Reichle, J. Brune, and H. Bradner, Microearthquake stud- ies using sonobuoys, preliminary results from the Gulf of Califor- nia, Geophys. J. R. Astron. $oc., 34, 365-379, 1973.
Reyes, A., J. Brune, T. Barker, L. Canales, J. Madrid, J. Rebollar, and L. Munguia, A microearthquake survey of the San Miguel fault zone, l•aja California, Mexico, Geophys. Res. Lett., 2, 56-59, 1975.
Richter, C. F., Elementary Seisinology, pp. 531-533, W. H. Freeman, San Francisco, 1958.
Roth6, J.P., The Seismicity of the Earth, 336 pp., UNESCO, Paris, 1969.
Rusnak, G. A., R. L. Fisher, and F. P. Shepard, Bathymetry and faults of Gulf of California, in Marine Geology of the Gulf of California, Mem. Am. Assoc. Petrol. Geol., 3, edited by T. van Andel and G. G. Shor, Jr., pp. 59-75, American Association of Petroleum Geologists, Tulsa, Okla., 1964.
Sharman, G., M. S. Reichle, and J. N. Brune, Detailed study of rela- tive plate motion in the Gulf of California, Geology, 4, 206-210, 1976.
Shor, G. G., Jr., and E. Roberts, San Miguel, Baja California Norte, earthquakes of February, 1956, Bull. $eismol. $oc. Am., 48, 101-116, 1958.
Spencer, J. E., and W. R. Normark, Tosco-Abreojos fault zone: A Neogene transform plate boundary within the Pacific margin of southern Baja California, Mexico, Geology, 7, 554-557, 1979.
Sykes, L. R., Focal mechanism solutions for earthquakes along the world rift system, Bull. $eismol. $oc. Am., 60, 1749-1752, 1970.
Tatham, R. H., and J. M. Savino, Faulting mechanisms for two

10,510 GoFF ET AL.: EARTHQUAKE SOURCE MECHANISMS
oceanic earthquake swarms, J. Geophys. Res., 79, 2643-2652, 1974. Thatcher, W., Regional variations of seismic source parameters in the
northern Baja California area, J. Geophys. Res., 77, 1549-1565, 1972.
Thatcher, W., Systematic inversion of geodetic data in central Califor- nia, J. Geophys. Res., 84, 2283-2295, 1979.
Thatcher, W., and J. Brune, Seismic study of an oceanic ridge earth- quake swarm in the Gulf of California, Geophys. J. R. Astron. Soc., 22, 473-489, 1971.
Tralli, D. M., T. H. Dixon, L. L. Skrumeda, S. A. Stephens, C. Vegos, J. M. Davidson, P. Dauphin, and F. Suarez-Vidal, GPS baselines across the Gulf of California (abstract), Eos Trans. AGU, 68, 283, 1987.
Turcotte, D. L., and G. Schubert, Geodynamics, 450 pp., John Wiley, New York, 1982.
Walck, M. C., The P-wave upper mantle structure beneath an active spreading centre: The Gulf of California, Geophys. J. R. Astron. Soc., 76, 697-723, 1984.
White, A., A geomagnetic variation anomaly across the northern Gulf of California, Geophys. J. R. Astron. Soc., 33, 1-25, 1973a.
White, A., Anomalies in geomagnetic variations across the central Gulf of California, Geophys. J. R. Astron. Soc., 33, 27-46, 1973b.
Wiens, D. A., Effects of bathymetry on teleseismic P waveforms (ab- stract), Eos Trans. AGU, 67, 1105, 1986.
Wiens, D. A., and S. Stein, Age dependence of oceanic intraplate seismicity and implications for lithospheric evolution, J. Geophys. Res., 88, 6455-6468, 1983.
Wiens, D. A., and S. Stein, Intraplate seismicity and stresses in young oceanic lithosphere, J. Geophys. Res., 89, 11,442-11,464, 1984.
Williams, D. L., K. Becker, L. A. Lawver, and R. P. Von Herzen, Heat flow at the spreading centers of the Guaymas basin, Gulf of Califor- nia, J. Geophys. Res., 84, 6757-6769, 1979.
Zhou, H., H.-L. Liu, and H. Kanamori, Source processes of large earthquakes along the Xianshuihe fault in southwestern China, Bull. Seisrnol. Soc. Am., 73, 537-551, 1983.
E. A. Bergman, J. A. Goff, and S. C. Solomon, Department of Earth, Atmospheric, and Planetary Sciences, Building 54-526, Massa- chusetts Institute of Technology, Cambridge, MA 02139.
(Received December 24, 1986; revised May 29, 1987; accepted June 1, 1987.)
Copyright © 2022 FDOKUMEN