Mesozoic extensional tectonics in the southeast Iberian Chain
Upload
independentCategory
view
0download
0
Earth and Planetary Science Letters, 39 (1978) 199-210 199 © Elsevier Scientific Publishing Company, Amsterdam - Printed in The Netherlands
151
PALAEOMAGNETISM AND TECTONICS IN UMBRIA, ITALY
J.E.T. CHANNELL, W. LOWRIE Institut ffir Geophysik, ETH Hi~nggerberg, 8093 Ztirich (Switzerland)
F. MEDIZZA Istituto di Geologia dell'Universith, 35100 Padova (Italy)
and
W. ALVAREZ Department of Geology and Geophysics, University of California, Berkeley, CA 94 720 (U.S.A.)
Received August 12, 1977 Revised version received December 21, 1977
Detailed records of palaeomagnetic directions from two Upper Cretaceous Umbrian sections are compared with the com- posite section compiled by Van den Berg et al. [ 1 ]. In addition to these sections, fifty-one geographically distributed sites have been studied magnetically and palaeontologically. The Late Miocene-Pliocene fold belt of the Umbrian Apennines is arcuate in outcrop, being convex toward the east. The fold axes are generally tangential to the Umbrian arc, which can be divided into a northern northwestern-trending part and a southern northeastern-trending part. Sites from the north have more westerly declinations than those from the south. The differences are significant at the 95% probability level and most probably rellect the bending of originally straight fold axes or the development of fold axes with initial curvature. The pala- eomagnetic directions from Umbria provide important information concerning the Umbrian tectonic deformation, but are not applicable to the Italian autochthon.
I. Introduction
The recent development of highly sensitive rock magnetometers has meant that the weakly magnetised pelagic limestones which characterise the basinal facies throughout the Periadriatic region can now be mea- sured with sufficient precision. Apart from the lblean zone of Sicily (fig. 1) where Cretaceous basalts have been studied palaeomagnetically [ 2 - 4 ] , truly autoch- thonous units in Italy consists almost entirely of these weakly magnetised limestones. The Mesozoic South Tethyan limestones have been studied magnetically in three localities which have been considered autochtho- nous: Umbria, Apulia/Gargano and the Southern Alps (fig. 1). The Northern Apennine Umbrian sequence has recently been a focus of attention for palaeomag-
Institut fiir Geophysik, ETH Ziirich, Contribution Nr. 193.
netic workers in Italy. The sequence contains a pink pelagic limestone - the Scaglia Rossa - which repre- sents almost continuous deposition from the Early
Turonian to the Early Eocene. Several independent palaeomagnetic investigations of these basinal facies have produced mutually compatible data, but con- flicting interpretations have arisen because of differing assumptions concerning the tectonic history of Um- bria.
Lowrie and Alvarez [5,6] studied Scaglia Rossa samples from twenty localities distributed throughout Umbria. They interpreted the northwestward declina- tions as evidence for counterclockwise-rotation of Um- bria and autochthonous peninsular Italy since the time of deposition of the Scaglia Rossa. They also placed sixteen sites at different stratigraphic levels in a com- plete section of the Scaglia Rossa near Gubbio, where the entire thickness of the formation from Turonian

200
1 1 ~ N
I-'~ ~TRIESTE 4 6 0
PERUGIA* ILl \
x:2121'Zo , _ 40 °
~38 o
" ~ . ~ P A C H I NO 1 _ _ t _ /
12 ° 1/. ° 16 ° E
Fig. 1. Approximate location of the main regions which have been thought to be autochthonous and have been sampled for palaeomagnetic studies. 1 = Vicentinian and Venetian (Southern) Alps; 2 = Umbria; 3 = Gargano; 4 = Apulia; 5 = Iblei.
to Eocene is almost continuously exposed. Their data from this section showed a strong variation of declina- tion with stratigraphic position which they interpreted as evidence for approximately 45 ° counterclockwise rotation of peninsular Italy during the Campanian- Maastrichtian followed by a further 25 ° counterclock- wise rotation after the Middle Eocene. Lowrie and Alvarez [61 cautioned that this interpretation required confirmation from a check section.
Channell and Tarling [7] noted that the Late Creta- ceous magnetic directions from Apulia, the Southern Alps and lblei, were similar to those that would be expected if Italy moved as part of Africa since the kate
Cretaceous. Their palaeomagnetic data from the Urn- brian sequence were very similar to those of Lowrie and Alvarez and had declinations that were more westward than those associated with the other three "autochthonous" palaeomagnetic sampling localities. They suggested that the Umbrian sequence directions were the result either of allochthony or of decoupling of tile Northern Apennine "autochthon" from the rest of autochthonous Italy along the Anzio-Ancona line and beneath the Po basin.
Full interpretation of the regional data of both these investigations was impeded by absence of palaeon- tological dates for the sites. This is essential as deposi- tion of the Scaglia Rossa alone spanned an interval of about 50 m.y., from Early Turonian to Middle Eocene.
Van den Berg et al. [ l ] sampled several stratigraphic levels within the Umbrian sequence. They recognised that the shifts of magnetic direction with time were similar to those expected for Africa, but that the whole pattern was rotated by 2 5 - 3 0 ° westwards. Van den Berg and Wonders [8] pointed out that this "African pattern" does not coincide with a similar but unrotated pattern revealed by sampling the same stratigraphic levels in the Vicentinian (Southern) Alps and proposed that the data can be explained if autochthonous Italy, south of the Po basin, moved with Africa until post- Early Eocene time when a 2 5 - 3 0 ° counterclockwise rotation of the Italian peninsula occurred relative to Africa. The Southern Alps were considered to have been detached from autochthonous Italy during the kate Cretaceous and to have undergone a clockwise rotation relative to Africa and a later counterclock- wise rotation of the same magnitude such that there is now consistency between Southern Alpine and Afri- can data. This interpretation assumes that the Umbrian sequence is autochthonous and that the palaeomag- netic data from Umbria are applicable to peninsular Italy. An opposing view advocating allochthony in Umbria was presented by Channell [ 15 ].
The different conclusions result in large part from the differences of geological opinion concerning the autochthony of Umbria. The present investigation was undertaken as a contribution to the resolution of this problem, by (1) bringing together the data from the separate stratigraphic sections under a common inter- pretation, and (2) combining data from all 51 palaeo- magnetic sites geographically distributed throughout Umbria, each of which has now been dated palaeonto- logically.
2. Palaeomagnetic results from stratigraphic sections in Umbria
The Upper Cretaceous section at Gubbio and a check section at Moria (Fig. 2) have been intensively sampled for the purpose of establishing a Late Creta- ceous magnetic stratigraphy. At Gubbio over 600 samples were collected at approximately 0.5-m inter- vals [9,10] and at Moria over 250 samples were col- lected at approximately 1-m intervals throughout the sections. The two sections have produced well-defined
125 ° 13 o
1.3 5 °
/.3 o
~25 o
12 '5e 13o
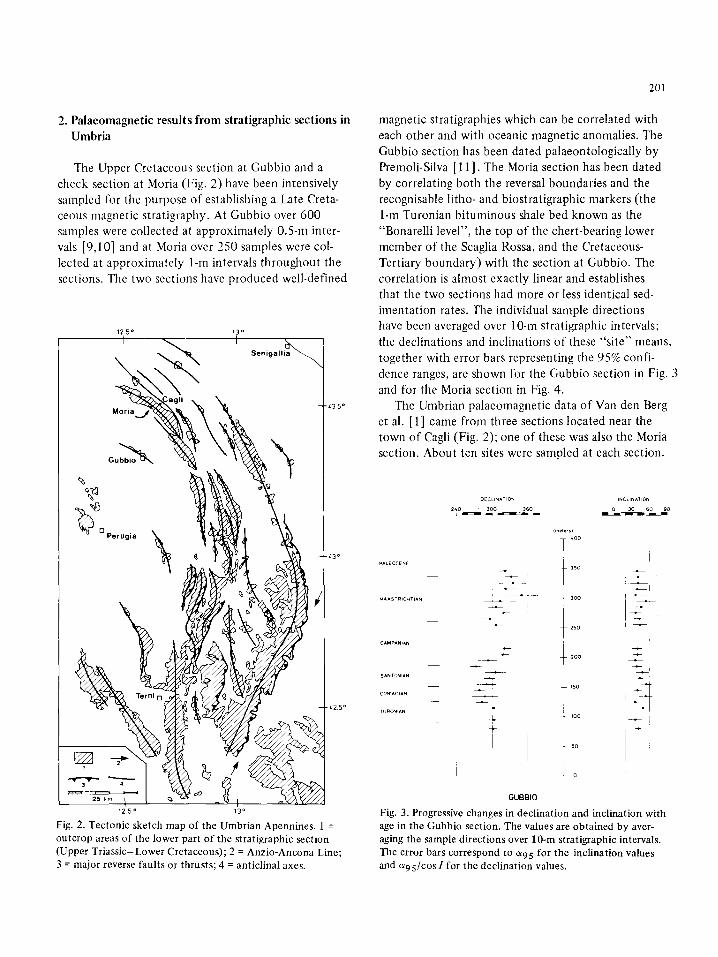
Fig. 2. Tectonic sketch map of the Umbrian Apennines. 1 =
outcrop areas of the lower part of the stratigraphic section (Upper Triassic-Lower Cretaceous); 2 = Anzio-Ancona Line; 3 = major reverse faults or thrusts; 4 = anticlinal axes.
201
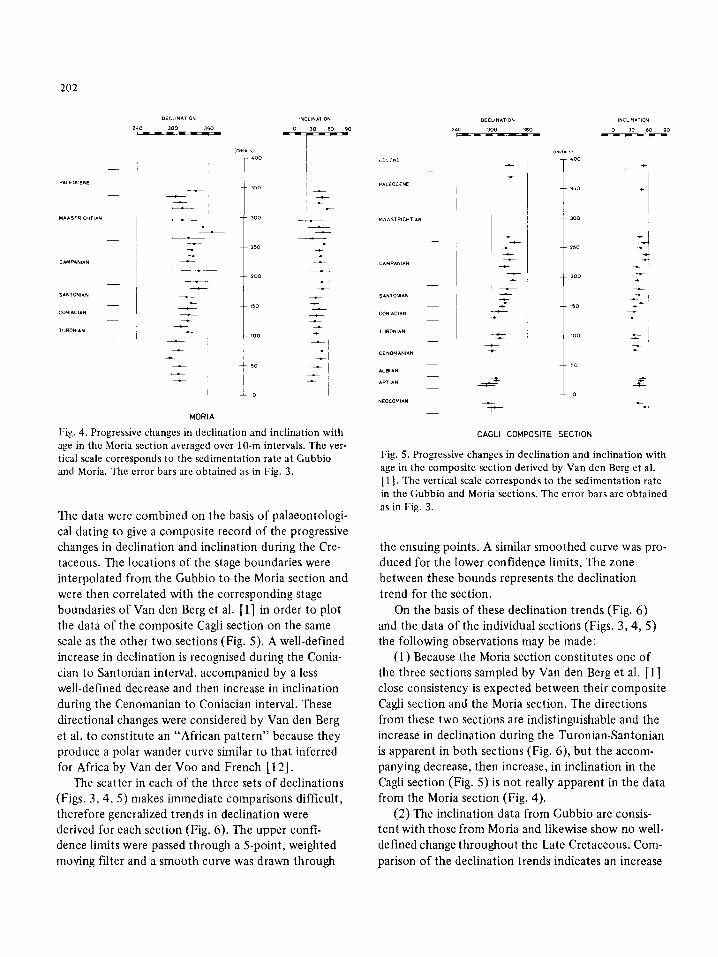
magnetic stratigraphies which can be correlated with each other and with oceanic magnetic anomalies. The Gubbio section has been dated palaeontologically by Premoli-Silva [11]. The Moria section has been dated by correlating both the reversal boundaries and the recognisable litho- and biostratigraphic markers (the l -m Turonian bituminous shale bed known as the "Bonarelli level", the top of the chert-bearing lower member of the Scaglia Rossa, and the Cretaceous- Tertiary boundary) with the section at Gubbio. The correlation is almost exactly linear and establishes that the two sections had more or less identical sed- imentation rates. The individual sample directions have been averaged over 10-m stratigraphic intervals; tile declinations and inclinations of these "site" means, together with error bars representing the 95% confi- dence ranges, are shown for the Gubbio section in Fig. 3 and for the Moria section in Fig. 4.
The Umbrian palaeomagnetic data of Van den Berg et al. [ 1] came from three sections located near the town of Cagli (Fig. 2); one of these was also the Moria section. About ten sites were sampled at each section.
SAN TONIAN
C0NIACIAN
TtJRCW~IAN
OECLINATION
240 3OO 360
L
i ° - -
+ I
(me te r !
400
350
300
250
200
- 150
100
- - 50
0
}NCLINAT~ON
O 30 60 90
I
t •
I
G U B B I O
Fig. 3. Progressive changes in declination and inclination with age in the Gubbio section. The values are obtained by aver- aging the sample directions over 10-m stratigraphic intervals. The error bars correspond to a95 for the inclination values and c~ 9 5/COS/for the declination values.
202
5ANTONIAN
CONIACIAN
TURONIAN
DECLINATION
240 300 360
' ° i
°,
I
_ _ - ° ,
-- 7"-
~00
350
300
250
200
150
100
50
0
INCLINAI ~ON
I
I
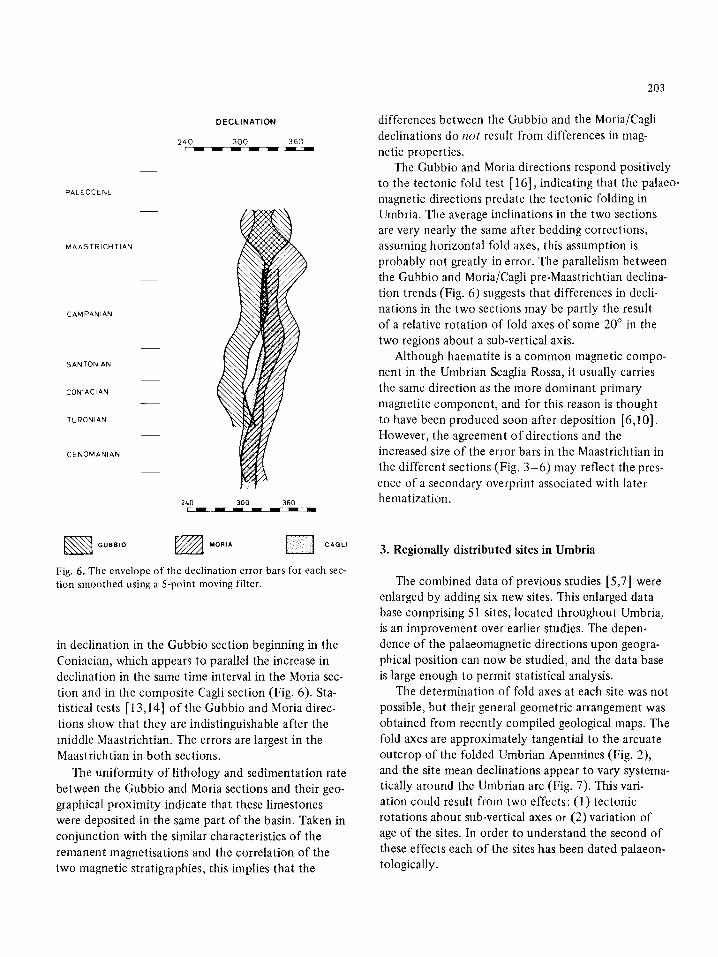
M O R I A
Fig. 4. Progressive changes in declination and inclination with age in the Moria section averaged over 10-m intervals. The ver- tical scale corresponds to the sedimentation rate at Gubbio and Moria. The error bars are obtained as in Fig. 3.
The data were combined on the basis of palaeontologi- cal dating to give a composite record of the progressive changes in declination and inclination during the Cre- taceous. The locations of the stage boundaries were interpolated from the Gubbio to the Moria section and were then correlated with the corresponding stage boundaries of Van den Berg et al. [1] in order to plot the data of the composite Cagli section on the same scale as the other two sections (Fig. 5). A well-defined increase in declination is recognised during the Conia- clan to Santonian interval, accompanied by a less well-defined decrease and then increase in inclination during the Cenomanian to Coniacian interval. These directional changes were considered by Van den Berg et al. to constitute an "African pattern" because they produce a polar wander curve similar to that inferred for Africa by Van der Voo and French [12].
The scatter in each of the three sets of declinations (Figs. 3, 4, 5) makes immediate comparisons difficult, therefore generalized trends in declination were derived for each section (Fig. 6). The upper confi- dence limits were passed through a 5-point, weighted moving filter and a smooth curve was drawn through
DECLINATION
240 3OO 3BO
INCLINATION
0 30 60 90
c.C':~N(:
PALEOCENE
SANTONIAN
CONIAC~AN
TURONIAN
CENOMANIAN
ALBIAN
APTIAN
NEOCOMiAN
r
(me1,~sl
400
350
300
250
200
150
100
50
0
-i
i- +
CAOLI COMPOSITE SECTION
Fig. 5. Progresswe changes in declination and inclination with age in the composite section derived by Van den Berg et al. [ 1 ]. The vertical scale corresponds to the sedimentation rate in the Gubbio and Moria sections. The error bars are obtained as in Fig. 3.
the ensuing points. A similar smoothed curve was pro- duced for the lower confidence limits. The zone between these bounds represents the declination trend for the section.
On the basis of these declination trends (Fig. 6) and the data of the individual sections (Figs. 3, 4, 5) the following observations may be made:
(1) Because the Moria section constitutes one of the three sections sampled by Van den Berg et al. [1] close consistency is expected between their composite Cagli section and the Moria section. The directions from these two sections are indistinguishable and the increase in declination during the Turonian-Santonian is apparent in both sections (Fig. 6), but the accom- panying decrease, then increase, in inclination in the Cagli section (Fig. 5) is not really apparent in the data from the Moria section (Fig. 4).
(2) The inclination data from Gubbio are consis- tent with those from Moria and likewise show no well- defined change throughout the Late Cretaceous. Com- parison of the declination trends indicates an increase
D E C L I N A T I O N
240 3 0 0 360
PALEOCENE
MAASTRICHTIAN
CAMPANIAN
$ANTONIAN
CON]ACIAN
$URONIAN
CENOMANIAN
2&0 300 360
Fig. 6. The envelope of the declination error bars for each sec- tion smoothed using a 5-point moving filter.
in declination in the Gubbio section beginning in the Coniacian, which appears to parallel the increase in declination in the same time interval in the Moria sec- tion and in the composite Cagli section (Fig. 6). Sta- tistical tests [13,14] of the Gubbio and Moria direc- tions show that they are indistinguishable after the middle Maastrichtian. The errors are largest in the Maastrichtian in both sections.
The uniformity of lithology and sedimentation rate between the Gubbio and Moria sections and their geo- graphical proximity indicate that these limestones were deposited in the same part of the basin. Taken in conjunction with the similar characteristics of the remanent magnetisations and the correlation of the two magnetic stratigraphies, this implies that the
203
differences between the Gubbio and the Moria/Cagli declinations do n o t result from differences in mag- netic properties.
The Gubbio and Moria directions respond positively to the tectonic fold test [16], indicating that the palaeo- magnetic directions predate the tectonic folding in Umbria. The average inclinations in the two sections are very nearly the same after bedding corrections, assuming horizontal fold axes, this assumption is probably not greatly in error. The parallelism between the Gubbio and Moria/Cagli pre-Maastrichtian declina- tion trends (Fig. 6) suggests that differences in decli- nations in the two sections may be partly the result of a relative rotation of fold axes of some 20 ° in the two regions about a sub-vertical axis.
Although haematite is a common magnetic compo- nent in the Umbrian Scaglia Rossa, it usually carries the same direction as the more dominant primary magnetite component, and for this reason is thought to have been produced soon after deposition [6,10]. However, the agreement o f directions and the increased size of the error bars in the Maastrichtian in the different sections (Fig. 3 - 6 ) may reflect the pres- ence of a secondary overprint associated with later hematization.
3. Regionally distributed sites in Umbria
The combined data of previous studies [5,7] were enlarged by adding six new sites. This enlarged data base comprising 51 sites, located throughout Umbria, is an improvement over earlier studies. The depen- dence of the palaeomagnetic directions upon geogra- phical position can now be studied, and the data base is large enough to permit statistical analysis.
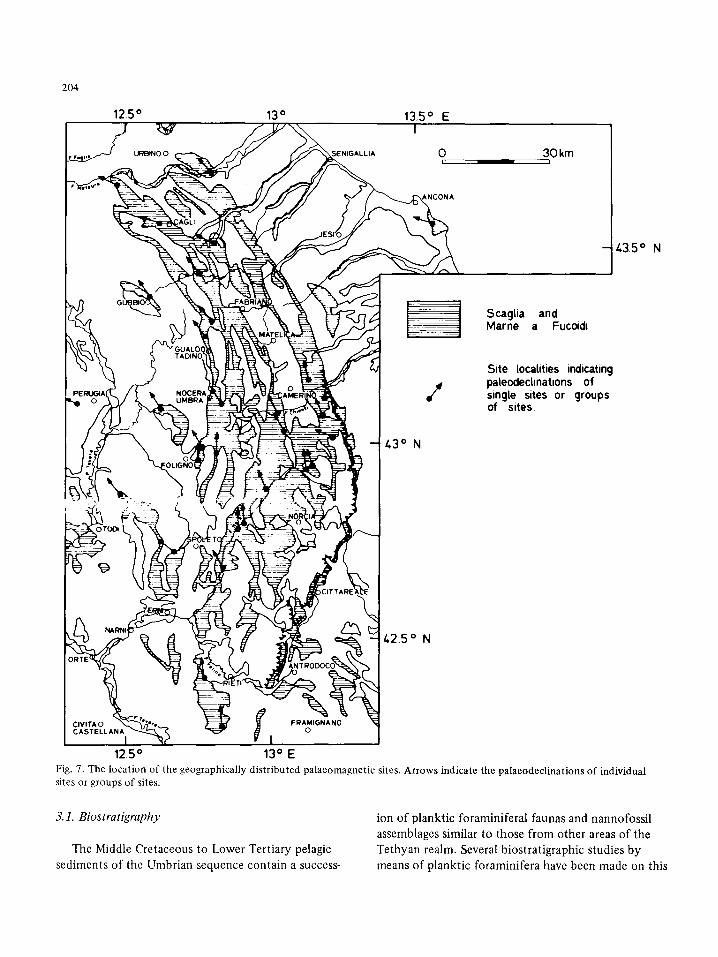
The determination of fold axes at each site was not possible, but their general geometric arrangement was obtained from recently compiled geological maps. The fold axes are approximately tangential to the arcuate outcrop of the folded Umbrian Apennines (Fig. 2), and the site mean declinations appear to vary systema- tically around the Umbrian arc (Fig. 7). This vari- ation could result from two effects: (1) tectonic rotations about sub-vertical axes or (2) variation of age of the sites. In order to understand the second of these effects each of the sites has been dated palaeon- tologically.
204
12.5 °
J URBtNO 0
13 °
!NIGALLIA
13.5 ° I
E
0 i
~NCONA
30 km i
43.5 o
Scaglia and Marne a Fucoldi
/ Site localities indicating paieodeciinations of single sites or groups of sites.
43 ° N
L z , • ,
'4 /.2.5 o N
I CIVITAO e.e ~ I;1 ~, FRAMIGNANOo j'~
12.5 ° 13 ° E Fig. 7. The location of the geographically distributed palaeomagnetic sites. Arrows indicate the palaeodeclinations of individual sites or groups of sites.
3.1. Biostratigraphy
The Middle Cretaceous to Lower Tertiary pelagic sediments of the Umbrian sequence contain a success-
ion of planktic foraminiferal faunas and nannofossil assemblages similar to those from other areas of the Tethyan realm. Several biostratigraphic studies by means of planktic foraminifera have been made on this
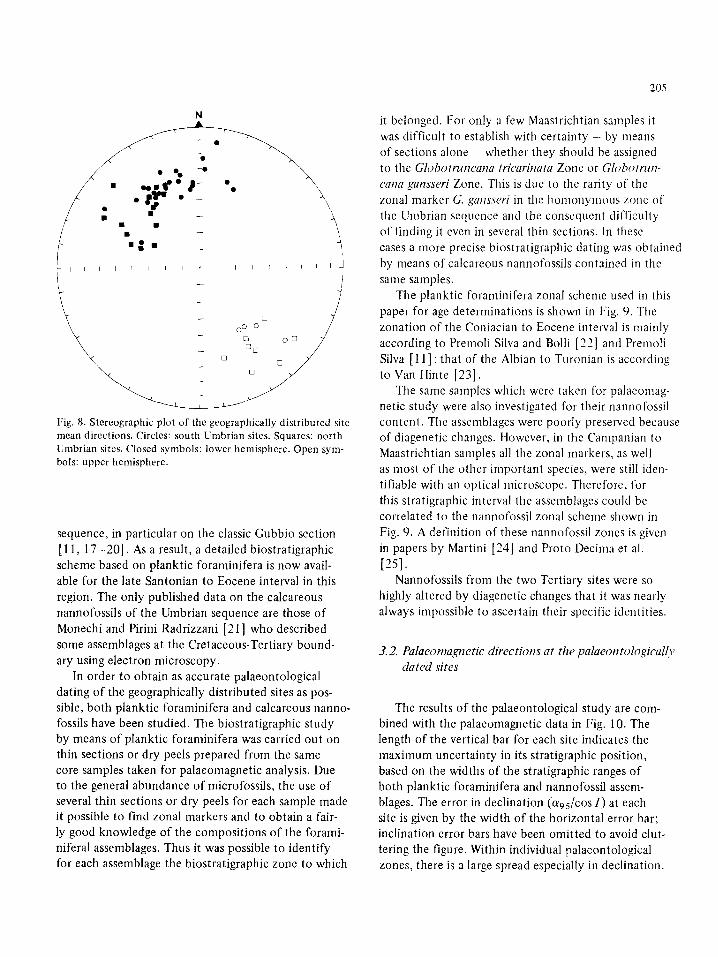
Fig. 8. Stereographic plot of the geographically distributed site mean directions. Circles: south Umbrian sites. Squares: north Umbrian sites. Closed symbols: lower hemisphere. Open sym- bols: upper hemisphere.
sequence, in particular on the classic Gubbio section [11, 17 -20] . As a result, a detailed biostratigraphic scheme based on planktic foraminifera is now avail- able for the late Santonian to Eocene interval in this region. The only published data on the calcareous nannofossils of the Umbrian sequence are those of Monechi and Pirini Radrizzani [21] who described some assemblages at the Cretaceous-Tertiary bound- ary using electron microscopy.
In order to obtain as accurate palaeontological dating of the geographically distributed sites as pos- sible, both planktic foraminifera and calcareous nanno- fossils have been studied. The biostratigraphic study by means of planktic foraminifera was carried out on thin sections or dry peels prepared from the same core samples taken for palaeomagnetic analysis. Due to the general abundance of microfossils, the use of several thin sections or dry peels for each sample made it possible to find zonal markers and to obtain a fair- ly good knowledge of the compositions of the forami- niferal assemblages. Thus it was possible to identify for each assemblage the biostratigraphic zone to which
205
it belonged. For only a few Maastrichtian samples it was difficult to establish with certainty - by nreans of sections alone whether they should be assigned to tile Globotruncana tricarinata Zone or Globolnol- cana gansseri Zone. This is due to the rarity of the zonal marker G. gansseri in the llomonynlous zone of the Umbrian sequence and the consequent difficulty of finding it even in several thin sections. In these cases a more precise biostratigraphic dating was obtained by means of calcareous nannofossils contained in the same samples.
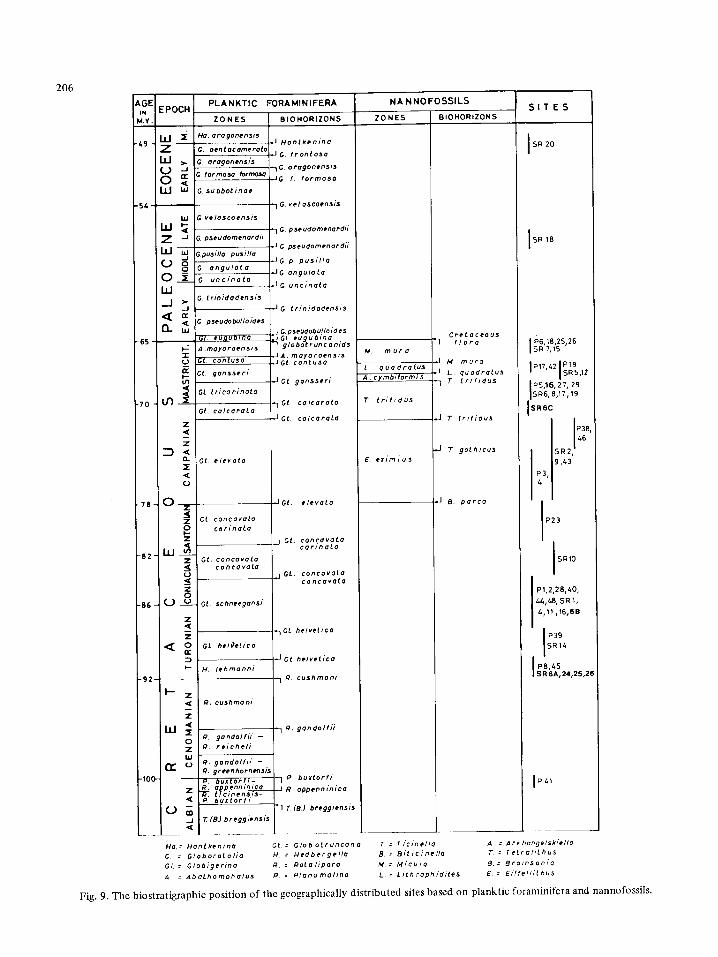
The planktic foraminifera zonal scheme used in this paper for age determinations is shown in Fig. 9. The zonation of the Coniacian to Eocene interval is mainly according to Premoli Silva and Bolli [221 and Premoli Silva [11]; that of the Albian to Turonian is according to Van Hinte [23].
The same samples which were taken for palaeonmg- netic study were also investigated for their nannofossil content. The assemblages were poorly preserved because of diagenetic changes. However, in the Campanian to Maastrichtian samples all the zonal markers, as well as most of the other important species, were still iden- tifiable with an optical microscope. Therefore, for this stratigraphic interval the assemblages could be correlated to the nannofossil zonal scheme shown in Fig. 9. A definition of these nannofossil zones is given in papers by Martini [24] and Proto Decima et al. [25].
Nannofossils from the two Tertiary sites were so highly altered by diagenetic changes that it was nearly always impossible to ascertain their specific identities.
3. 2. Palaeomagnetic directkms at the palaeontologically dated sites
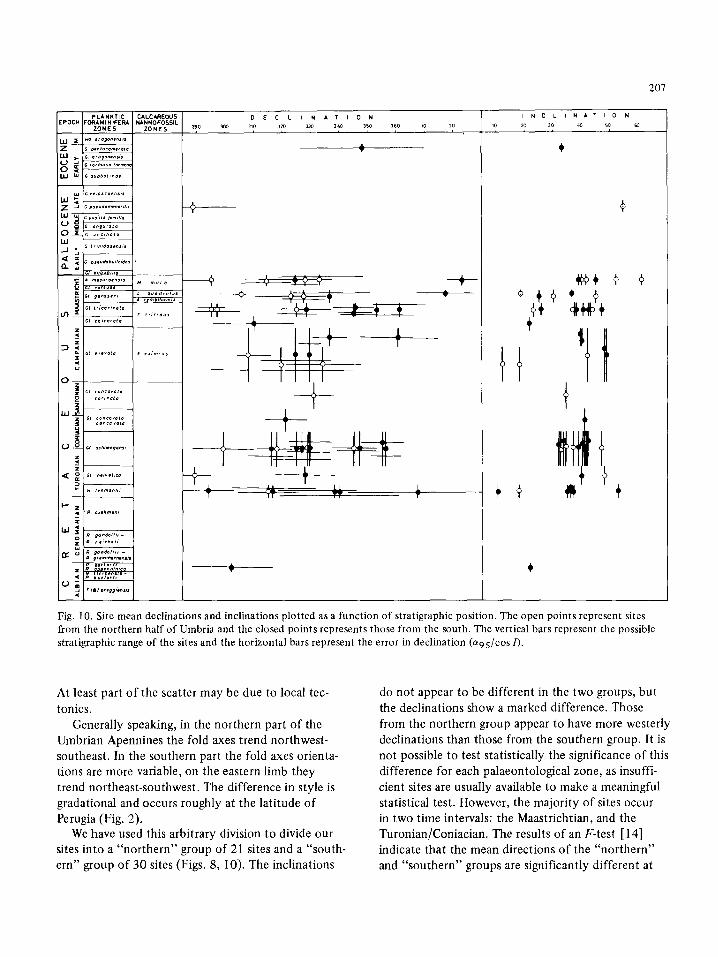
The results of the palaeontological study are com- bined with the palaeomagnetic data in Fig. 10. The length of the vertical bar for each site indicates the maximum uncertainty in its stratigraphic position, based on the widths of the stratigraphic ranges of both planktic foraminifera and nannofossil assem- blages. The error in declination (C%s/COS I ) at each site is given by the width of the horizontal error bar; inclination error bars have been omitted to avoid clut- tering the figure. Within individual palaeontological zones, there is a large spread especially in declination.
206 AGE PLANKTIC FORAMINIFERA
,N EPOCH M.Y. Z 0 N ES BIO HORIZONS
I I I ~ Ha. oregonens is , I H e n t k e n i n a
"&9 Z G. penteeamerata ,I G f r o n t o s a I I I >. G. orogonens/s
,c orog . . . . . . . "J G formoso formoso I G f. f o r m o s e
~ J I I I LIJ G subbot t 'noe
-54 G vel escoensis
W ; . ve lescoens is I I I ~ G pseudomenardi i Z "J G. pseudomenerdh"
• I G pseudomenordi / LLJ LU G pus/lie pus/l ie
~t~ IG p p u s i l l o ( " ) G a n g u l a r ° . i G o n g u l o t ° O ~ c unc ,n . te LLJ .JG u n c / n a t o
G t r i n } d o d e n s l s _J >- J "J G. l r / n i d o d e n s i s
~ . ~ C pseudobu/Io/des IJJ Gpseudobuiloldes
~l. eu f lue lne ~ G l . e u g u b i n o I-: A .moyo roens i s g l o b o t r u n c a n i d s
I A. moyoroens t ' s ~_) G~ con tuse , . IGt Coo tuse
Ct g a n s s e r i I,n i.J Gt 9enssert"
Gt t r i c e r i n o t e U3 • ] Gt ce l ca ro~e
Gt c a / c o r a t e ,J Gt c a l c e r o t ~
Z
Z
a . ]E <[ C)
o Z
o Z
LLJ u~ Z < u <_ Z 0
G~ e l e v a t e
Ct concava to ear l 'noLo
a t . c o n c a v a t a concovaLo
. IGt . e l e v a t e
j GL c o n c e v o L e c a r / n o t e
. j GL. COnCOVOLO c o e c o v e t o
0 U _ ~ Gt schneegansi
Z - - "7 Ct he l ve t i ca Z
<~ o c~ h,l, 'et,ce
• J GL h e l v e t i c a P- H. l e h m a n n i
- - ~I R. cushman/ '
I - - z <[ R. eushmoni
Z
I L l ~E I R. g a n d o l f l i gandol f i t ' R,
7 O. r e i c h e / i IJU
r ~ o R, £ondo l f J [ - R. greenhornet~SlS
- - p b u x t o r f l - "~ p b u x t o r f l R. e~penn in ice i O. appenn /n /ce R. ~ t c i n e n s i s - P b u x t o r f /
"7 [ (B.) beegg/ensts 0 ~D T(B. )b regg/ens ls
NA N N O F O S S I L S
ZO N ES BIOHORtZONS
CPeLeceou5 "I f l o r a
M m u r a ~J M i n u r e
L q u o d r o t u s . j L q u e d r o t u s A cymb l f o rm i s "7 T L r / f i d u s
T t r l ' f / d u s
E. e x / m i u s
~J 77 f r / f i d u s
J T g o t h / c u s
. I B. p e r c a
S I T E S
I SR 20
IS R 18
I I~6,18,2%26 SR 7,15
I P17,42 IP19 ISRS,'Z
I P 5,16, 27, 29 SR6, 8,17119
I SR6C
IP38 I 1 46
S R 2, I 9,43
F3,
P23
I SRIO P1,2,28,40j 44j48j SR I, 4,11 j 16,6B
I P39 SR14
I PB,45 I SR 6As24s25,2E
IP4,
Ho.= H o n t k e n i n e Gt : G l o b o t r u n c e n e T = T l 'C/nel lo A, : A rkhange lsk /e l l e G. : G l o b o r o t o l i o H = H e d b e r g e l l o B. = B / ~ / c i n e l l o 7 - : F e L r o l i t h u s GI. = G l o b J g e r l n e R = R o ~ a l l p o r a M : M / c u l e B.= B r o / n s o n i e A : A b a L h o m p h o l u s P = P l e n o m o / i n o L : L i t h r e p h / d / t e s E.= E / f f e f l i t h u 5
Fig. 9. The biostratigraphic position of the geographically distributed sites based on planktic foraminifera and nannofossils.
PLANKT IC CALCAREOUS FORAMINIFERA NANNOFOSSIL
ZONES ZONES
wo *ro~o~r~s,s
G orago~ns~s I
S pus, l/* Dusm*
G e~guloLo G ~nc,~oto
trmi¢oce~s,s
D E C L I N A T I 0 N ~00 310 320 330 340 350 290
T
+ +
360 1o 20
I N C L I N A T I 0 N
70 30 ,0 50
+ ' +
'tt
207
Fig. 10. Site mean declinations and inclinations plotted as a function of stratigraphic position. The open points represent sites from the northern half of Umbria and the closed points represents those from the south. The vertical bars represent the possible stratigraphic range of the sites and the horizontal bars represent the error in declination (a95/cos/).
At least part of the scatter may be due to local tec-
tonics. Generally speaking, in the northern part of the
Umbrian Apennines the fold axes trend northwest- southeast. In the southern part the fold axes orienta- tions are more variable, on the eastern limb they trend northeast-southwest. The difference in style is gradational and occurs roughly at the latitude of Perugia (Fig. 2).
We have used this arbitrary division to divide our sites into a "northern" group of 21 sites and a "south- ern" group of 30 sites (Figs. 8, 10). The inclinations
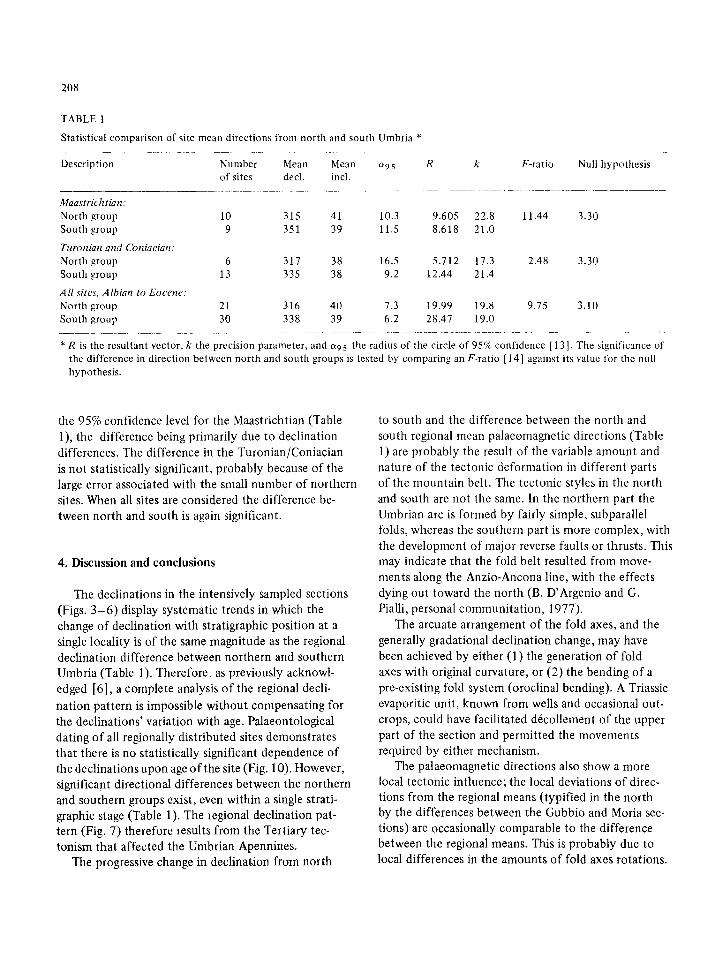
do not appear to be different in the two groups, but the declinations show a marked difference. Those from the northern group appear to have more westerly declinations than those from the southern group. It is not possible to test statistically the significance of this difference for each palaeontological zone, as insuffi- cient sites are usually available to make a meaningful statistical test. However, the majority of sites occur in two time intervals: the Maastrichtian, and the Turonian/Coniacian. The results of an F-test [14] indicate that the mean directions of the "northern" and "southern" groups are significantly different at
208
TABLE 1
Statistical comparison of site mean directions from north and south Umbria *
Description Number of sites
Mean Mean ~9 s R k F-ratio Null hypothesis decl. incl.
Maastrich tian: North group 10 315 41 10.3 9.605 22.8 11.44 3.30 South group 9 351 39 11.5 8.618 21.0
Turonian and Coniacian: North group 6 317 38 16.5 5.712 17.3 2.48 3.30 South group 13 335 38 9.2 12.44 21.4
All sites, Albian to Eocene. North group 21 316 40 7.3 19.99 19.8 9.75 3.10 South group 30 338 39 6.2 28.47 19.0
* R is the resultant vector, k the precision parameter, and c~ 9 s the radius of the circle of 95% confidence [ 13 ]. The significance of the difference in direction between north and south groups is tested by comparing an F-ratio [14] against its value for the null hypothesis.
the 95% confidence level for the Maastrichtian (Table 1), the difference being primarily due to declination differences. The difference in the Turonian/Coniacian is not statistically significant, probably because of the large error associated with the small number of northern sites. When all sites are considered the difference be- tween north and south is again significant.
4. Discussion and conclusions
The declinations in the intensively sampled sections (Figs. 3 - 6 ) display systematic trends in which the change of declination with stratigraphic position at a single locality is of the same magnitude as the regional declination difference between northern and southern Umbria (Table 1). Therefore, as previously acknowl- edged [6], a complete analysis of the regional decli-
nation pattern is impossible without compensating for the declinations' variation with age. Palaeontological dating of all regionally distributed sites demonstrates that there is no statistically significant dependence of the declinations upon age o f the site (Fig. 10). However, significant directional differences between the northern and southern groups exist, even within a single strati- graphic stage (Table 1). The regional declination pat- tern (Fig. 7) therefore results from the Tertiary tec- tonism that affected the Umbrian Apennines.
The progressive change in declination from north
to south and the difference between the north and south regional mean palaeomagnetic directions (Table I) are probably the result of the variable amount and nature of the tectonic deformation in different parts of the mountain belt. The tectonic styles in the north and south are not the same. In the northern part the Umbrian arc is formed by fairly simple, subparallel folds, whereas the southern part is more complex, with the development of major reverse faults or thrusts. This may indicate that the fold belt resulted from move- ments along the Anzio-Ancona line, with the effects dying out toward the north (B. D'Argenio and G. Pialli, personal communitat ion, 1977).
The arcuate arrangement of the fold axes, and the generally gradational declination change, may have been achieved by either (1) the generation of fold axes with original curvature, or (2) the bending of a pre-existing fold system (oroclinal bending). A Triassic evaporitic unit, known from wells and occasional out- crops, could have facilitated d6collement of the upper part of the section and permitted the movements required by either mechanism.
The palaeomagnetic directions also show a more local tectonic influence; the local deviations of direc- tions from the regional means (typified in the north by the differences between the Gubbio and Moria sec- tions) are occasionally comparable to the difference between the regional means. This is probably due to local differences in the amounts of fold axes rotations.
The palaeomagnetic data do not in themselves provide a definitive solution as to the nature of the regional or local tectonic deformation but provide information to supplement field studies which are currently in pro- gress.
The European polar wander path of Van der Voo and French [12] predicts a declination/inclination com- bination for the Late Cretaceous in Umbria of 357°/44 °, while their African polar wander path predicts a direc- tion of 342o/36 ° . The mean direction of our sites in the northern half of Umbria is 316°/40 °, and for the sites in the southern half is 338o/39 ° (Table 1). "European" directions are unlike those in either the northern or southern half of Umbria. The directions from the sites in the southern half of Umbria agree quite closely with "African" directions; however, the mean declination of the northern group has been rotated some 22 ° counterclockwise relative to the southern group and to "African" directions.
Too much significance should not be placed upon these "African" directions from southern Umbria. The tectonic situation in Umbria is as yet incompletely understood;considerable transport of the sedimentary cover may have occurred. Also the Late Cretace- ous palaeomagnetic pole positions for both Europe and Africa are not well defined. Furthermore, although our demarcation between northern and southern groups appears to correspond to a difference in tectonic styles and fold axes trends, the transition is gradational and there is no tectonic feature with which the demarca- tion can be identified. Thus the "African" directions in southern Umbria may well be fortuitous.
Channell and Tarling [7] recognised a westward deviation of Umbrian data relative to Southern Alpine and African data of the same age at sites distributed mainly in the northern part of Umbria. Van den Berg and Wonders [8] interpreted similar differences in palaeomagnetic data from the Southern Alps and Um- bria in terms of relative rotation of two autochthons bounded by a fault in the Po basin. Their Umbrian data came from near Cagli, in the northern part of Umbria. Our investigation of dated sites indicates that the westward deviation of magnetic directions reflects the progressive increase in counterclockwise rotation o f the northern half of Umbria relative both to the southern half of Umbria and to the Southern Alps. This casts doubt on the validity of Van den Berg and Wonders' interpretation. Palaeomagnetic data from
209
Umbria yield information concerning the tectonic deformation of the Umbrian Apennines but are not applicable to the Italian autochthon.
Acknowledgements
We are grateful to our Dutch colleagues, J. Van den Berg, C.T. Klootwijk, and A.A.H. Wonders, who kindly gave us a preprint of their article [ 1 ] and who have allowed us to use these data in our palaeomagnetic analysis of different Umbrian sections in the present paper.
References
9
10
11
12
1 J. Van den Berg, C.T. Klootwijk and A.A.H. Wonders, The Late Mesozoic movements of the Italian peninsula: further paleomagnetic data from the Umbrian sequence, Bull. Geol. Soc. Am. 89(1978) 133 150.
2 A. Schult, Paleomagnetism of Upper Cretaceous volcanic rocks in Sicily, Earth Planet. Sci. Lett. 19 (1973) 97-100.
3 F. Barberi, L. Civetta, P. Gasparini, F. Innocenti, R. Scan- done and k. Villari, Evolution of a section of the Africa- Europe plate boundary: palaeomagnetic and volcanological evidence from Sicily, Earth Planet. Sci. Lett. 22 (1974) 123-132.
4 C.B. Gregor, A.E.M. Nairn and J.F.W. Negendank, Palaeo- magnetic investigations of the Tertiary and Quaternary rocks, IX. The Pliocene of southeast Sicily and some Cre- taceous rocks from Cape Passero, Geol. Rundsch. 64 (1975) 948-958.
5 W. Lowrie and W. Alvarez, Rotation of the Italian penin- sula, Nature 251 (1974) 285-288.
6 W. Lowrie and W. Alvarez, Paleomagnetic evidence for rotation of the Italian Peninsula, J. Geophys. Res. 80 (1975) 1579-1592.
7 J.E.T. Channell and D.H. Tarling, Paleomagnetism and the rotation of Italy, Earth Planet. Sci. Lett. 25 (1975) 177- 188. J. Van den Berg and A.A.H. Wonders, Paleomagnetic evi- dence of large fault displacement around the Po Basin, Tectonophysics 33 (1976) 301 320. W. Lowrie and W. Alvarez, Upper Cretaceous magnetic stratigraphy, Bull. Geol. Soc. Am. 88 (1977) 374-377. W. Lowrie and W. Alvarez, Late Cretaceous geomagnetic polarity sequence: detailed rock and palaeomagnetic stu- dies of the Scaglia Ros~ limestone at Gubbio, Italy, Geo- phys. J. 51 (1977) 561-581. I. Premoli Silva, The Gubbio section: biostratigraphy, Bull. Geol. Soc. Am. 88 (1977) 371-374. R. Van der Voo and R.B. French, Apparent polar wan- dering for the Atlantic-bordering continents: Late Car-
210
boniferous to Eocene, Earth Sci. Rev. 10 (1974) 99-119. 13 R.A. Fisher, Dispersion on a sphere, Proc. R. Soc. Lond.
Ser. A, 217 (1953) 295-305. 14 G.S. Watson, Analysis of dispersion on a sphere, Mon.
Not. R. Astron. Soc. Geophys. Suppl. 7 (1956) 153-159. 15 J.E.T. Channell, Umbrian palaeomagnetism and the con-
cept of the African-Adriatic Promontory, Mem. Soc. Geol. It. 15 (1976) 119-128.
16 J.W. Graham, The stability and significance of magnetism in sedimentary rocks, J. Geophys. Res. 54 (1949) 131-167.
17 O. Renz, Stratigraphische und mikropaleontologische Untersuchung der Scaglia (Obere Kreide-Terti~r) im zen- tralen Apennin, Eclogae Geol. Helv. 29 (1936) 1-149.
18 H.P. Luterbacher and I. Premoli Silva, Note pr~liminaire sur une r~vision du profil de Gubbio, Italia, Riv. ltal. Paleon- tol. 68 (1962) 253-288.
19 H.P. Luterbacher and I. Premoli Silva, Biostratigrafia del limite Cretaceo-Terziario nell Appennino centrale, Riv. Ital. Paleontol., 70 (1964) 67-128.
20 H.P. Luterbacher, Studies on some Globorotalia from the
Paleocene and lower Eocene of the central Apennines, Eclogae Geol. Helv. 57 (1964) 631-730.
21 S. Monechi and C. Pirini Radrizzani, Nannoplankton from Scaglia Umbria Formation (Gubbio) at Cretaceous-Tertiary boundary, Riv. Ital. Paleontol Stratigr. 81 (1975) 45-87.
22 I. Premoli Silva and M.M. Bolli, Late Cretaceous to Eocene planktonic foraminifera and stratigraphy of Leg 15 sites in the Caribbean Sea, in: Initial Reports of the Deep Sea Drilling Project, 15 (U.S. Government Printing Office, Washington, D.C., 1973) 499-547.
23 J.E. Van Hinte, A Cretaceous time scale, Am. Assoc. Pet. Geol. Bull. 60 (1976) 498-516.
24 E. Martini, Cretaceous to Recent calcareous nannoplankton from the Central Pacific Ocean (DSDP Leg 33), in: Initial Reports of the Deep Sea Drilling Project, 33 (U.S. Govern- ment Printing Office, Washington, D.C., 1976) 383-423.
25 F. Proto Decima, F. Medizza and L. Todesco, Southeastern Atlantic Leg 40 calcareous nannofossils, in: Initial Reports of the Deep Sea Drilling Project, (U.S. Government Printing Office, Washington, D.C. 1977) in press.
Copyright © 2022 FDOKUMEN