focus transform deliver - Rolls-Royce
156
FOCUS TRANSFORM DELIVER Rolls-Royce plc Annual Report 2015
-
Upload
khangminh22 -
Category
Documents
-
view
1 -
download
0
Transcript of focus transform deliver - Rolls-Royce

FOCUSTRANSFORMDELIVER
Rolls-Royce plcAnnual Report 2015

ROLLS-ROYCE IS A PRE-EMINENT ENGINEERING COMPANY FOCUSED ON WORLD-CLASS POWER AND PROPULSION SYSTEMS.
2015 Annual Report
FORWARD-LOOKING STATEMENTSThis Annual Report contains forward-looking statements. Any statements that express forecasts, expectations and projections are not guarantees of future performance and guidance may be updated from time to time. This report is intended to provide information to shareholders, and is not designed to be relied upon by any other party or for any other purpose, and the Company and its Directors accept no liability to any other person other than that required under English law. Latest information will be made available on the Group’s website. By their nature, these statements involve risk and uncertainty, and a number of factors could cause material differences to the actual results or developments.
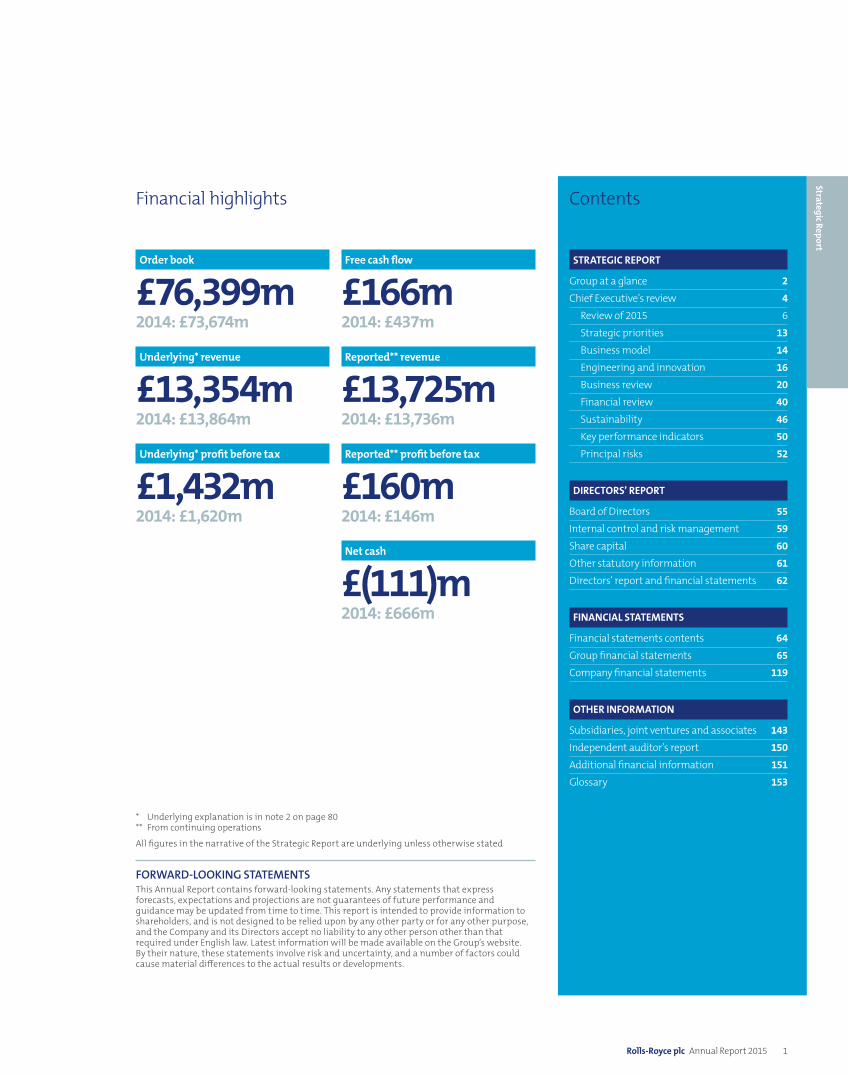
Financial highlights
Order book
£76,399m2014: £73,674m
Underlying* revenue
£13,354m2014: £13,864m
Underlying* profit before tax
£1,432m2014: £1,620m
Free cash flow
£166m2014: £437m
Reported** revenue
£13,725m2014: £13,736m
Reported** profit before tax
£160m2014: £146m
Net cash
£(111)m2014: £666m
STRATEGIC REPORT
Group at a glance 2
Chief Executive’s review 4
Review of 2015 6
Strategic priorities 13
Business model 14
Engineering and innovation 16
Business review 20
Financial review 40
Sustainability 46
Key performance indicators 50
Principal risks 52
DIRECTORS’ REPORT
Board of Directors 55
Internal control and risk management 59
Share capital 60
Other statutory information 61
Directors’ report and financial statements 62
FINANCIAL STATEMENTS
Financial statements contents 64
Group financial statements 65
Company financial statements 119
OTHER INFORMATION
Subsidiaries, joint ventures and associates 143
Independent auditor’s report 150
Additional financial information 151
Glossary 153
Contents
* Underlying explanation is in note 2 on page 80 ** From continuing operations
All figures in the narrative of the Strategic Report are underlying unless otherwise stated
Rolls-Royce plc Annual Report 2015 1
Strategic Report
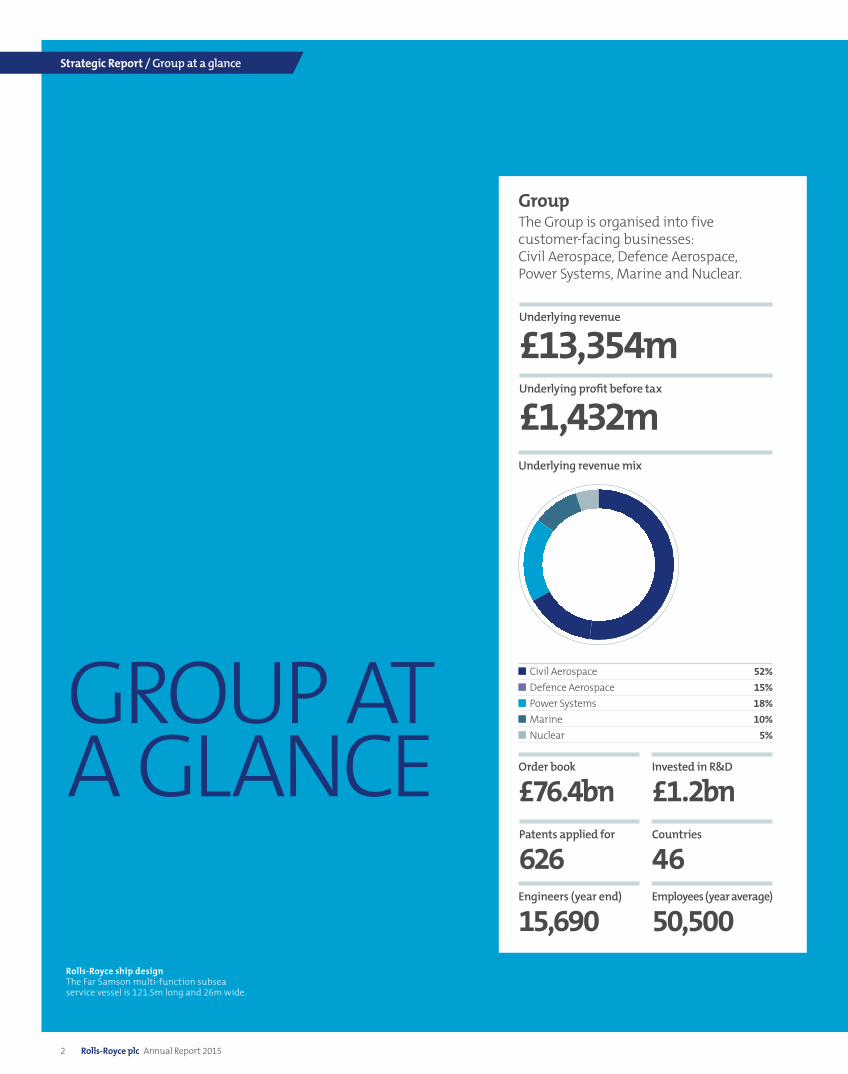
Underlying revenue
£13,354mUnderlying profit before tax
£1,432m
Engineers (year end)
15,690
Invested in R&D
£1.2bnOrder book
£76.4bnPatents applied for
626Employees (year average)
50,500
Countries
46
GroupThe Group is organised into five customer-facing businesses: Civil Aerospace, Defence Aerospace, Power Systems, Marine and Nuclear.
Underlying revenue mix
Civil Aerospace 52% Defence Aerospace 15% Power Systems 18% Marine 10% Nuclear 5%
GROUP AT A GLANCE
Rolls-Royce ship design The Far Samson multi-function subsea service vessel is 121.5m long and 26m wide.
2 Rolls-Royce plc Annual Report 2015
Strategic Report / Group at a glance

Underlying revenue
£2,385m
Underlying revenue
£687m
Underlying revenue
£6,933m
Underlying revenue
£1,324m
Underlying revenue
£2,035m
Underlying profit*
£194m
Underlying profit*
£70m
Underlying profit*
£812m
Underlying profit*
£15m
Underlying profit*
£393m
Underlying revenue mix
Underlying revenue mix
Underlying revenue mix
Underlying revenue mix
Underlying revenue mix
Power Systems
Nuclear
Civil Aerospace
Marine
Defence Aerospace
OE revenue 47% Services revenue 53%
OE revenue 68% Services revenue 32%
OE revenue 37% Services revenue 63%
OE revenue 58% Services revenue 42%
OE revenue 39% Services revenue 61%
Underlying revenue mix
Underlying revenue mix
Underlying revenue mix
Underlying revenue mix
Underlying revenue mix
PAGES 20 TO 25 FOR MORE INFORMATION
PAGES 30 TO 33 FOR MORE INFORMATION
PAGES 38 TO 39 FOR MORE INFORMATION
PAGES 34 TO 37 FOR MORE INFORMATION
PAGES 26 TO 29 FOR MORE INFORMATION
* Underlying profit before financing and taxation
Rolls-Royce plc Annual Report 2015 3
Strategic Report
Group at a glance

TRANSFORM
In the context of challenging trading conditions our overall performance for the year was in line with the expectations we set out in July 2015. It was a year of considerable change for Rolls-Royce: in our management, in some market conditions and in our near-term outlook. At the same time, there were some important constants: the underlying growth of our long-term markets, the quality of our mission-critical technology and services, and strength of customer demand for these, which are reflected in our growing order book. While we have some near-term challenges, these constants provide us with confidence in a strong, profitable, cash-generative future.”Warren EastChief Executive
4 Rolls-Royce plc Annual Report 2015
Strategic Report / Chief Executive’s review

Welcome to my first Chief Executive’s review for Rolls-Royce. My intention is that this report will share with you all, in a clear and open way, how we performed last year, the opportunities ahead of us and the clear goals and priorities we are setting ourselves to maximise value creation.We are now taking great steps to transform the business, adding pace and simplicity to what we do, a process we started in November 2015. This will be covered extensively in next year’s report. In the meantime, we have significantly enhanced the disclosure in this year’s report to present our performance in a more transparent and understandable way. I hope you find it informative.
In this Strategic Report, I will describe the business in depth and we will provide further information on our financial position and business performance.
06
14
20
46
52
13
16
40
50
Review of 2015
Business model
Business review
Sustainability
Principal risks
Strategic priorities
Engineering and innovation
Financial review
Key performance indicators
How the Group performed in a year of significant change
How we deliver value from mission-critical systems and services
Reviewing each of our five customer-facing businesses; with analysis of their markets
Setting out the approach we take and the targets we set for a more sustainable business
Outlining our main risks together with our risk management process
Our clear focus and priorities for developing the business
Creating engineering excellence with world-class knowledge and technology
Explaining our financial performance in 2015 in detail
How financial and non-financial indicators are used to measure the Group
Rolls-Royce plc Annual Report 2015 5
Strategic Report
Chief Executive’s review

REVIEW OF 2015 AND BUSINESS TRANSFORMATION
Performance in 2015Our performance in 2015 was broadly in line with our early expectations, with Marine markets causing most of the weakness. At the same time we have continued to invest in products and services to support our customers and reinforce the long-term strength of our order book, valued at £76.4bn at the year end, up 4% on 2014.
Group revenue was broadly unchanged on a constant currency basis with good growth in Civil Aerospace offsetting weaknesses in Marine. The combination of some difficult market conditions, sustained engineering investment and high fixed costs led to underlying profit before finance charges and tax 11% being lower at £1,492m.
Civil Aerospace delivered an underlying profit before finance charges and tax of £812m (2014: £942m). Defence Aerospace delivered £393m (2014: £366m), Power Systems £194m (2014: £253m) and Marine £15m (2014: £138m). Nuclear delivered £70m (2014: £50m). More detail on each business is included in the Business review.
After underlying financing costs of £60m (2014: £61m), underlying profit before tax was £1,432m (2014: £1,620m). Excluding the benefit of a one-off intellectual property settlement of £58m, triggered by the third-party acquisition of a former business partner, and a favourable £19m R&D credit benefiting our Nuclear business, underlying profit before tax would have been £1,355m, in line with the lower half of the 2015 guidance range set out in July 2015.
After an underlying tax charge of £351m (2014: £388m) and adjusting for non-controlling interests, underlying profit for the year was £1,080m (2014: £1,226m).
Reported profit before tax was £160m (2014: £67m), compared to an underlying profit before tax of £1,432m (2014: £1,620m). A full reconciliation of headline to underlying profit can be found in note 2 to the Consolidated Financial Statements.
Free cash flow of £179m was materially higher than our third quarter expectations, reflecting strong cash collections at the end of the year from a number of key customers, a better than expected overall working capital performance and the non-recurring cash settlement arising from the intellectual property agreement mentioned above. Some of this positive variance is likely to reverse early in 2016.
A more detailed review of financial performance is included in the Financial review.
0 10 20 30 40 50 60 70 80
Order book (£bn)
2014
2015
Underlying revenue (£m)
0 3,000 6,000 9,000 12,000 15,000
2014
2015
Underlying pro�t before tax (£m)
0 500 1,000 1,500 2,000
2014
2015
FINANCIAL REVIEW P40
6 Rolls-Royce plc Annual Report 2015
Strategic Report / Chief Executive’s review Review of 2015

Our strategic priorities in 2015
Performance in 2015
CustomerPlacing the customer at the heart of our organisation is key. We listen to our customers, share ideas, really understand their needs and then relentlessly focus on delivering our promises.
InnovationThis is our lifeblood. We continually innovate to remain competitive. To drive innovation, we create the right environment – curious, challenging, unafraid of failure, disciplined, open-minded and able to change with pace. Most importantly, we ensure our innovation is relevant to our customers’ needs.
Profitable growthBy focusing on our customers and offering them a competitive portfolio of products and services, we create the opportunity to grow our market share. We have to make sure that we are not just growing, but growing profitably. That means ensuring our costs are competitive. We look after our cash and we win right.
Trent XWB completes exemplary first year in service with Qatar Airways.
Gulfstream G650 corporate jet with BR725 engines enters service .
F-35B Lightning II with Rolls-Royce LiftSystem® declared operational by US Marine Corps.
US Air Force, Boeing and Embraer all name Rolls-Royce in their top supplier categories.
Testing of Trent 1000 TEN and Trent XWB-97 development engines is progressing well.
MTU signs agreement with Daimler to jointly develop EU Stage 5, emissions compliant diesel engines for off-highway applications.
We produce the world’s largest 3D component for the aerospace industry.
We are leading an international research programme into remote and autonomous ship control.
Our largest ever order secured: US$9.2bn from Emirates for Trent 900s.
We expand TotalCare® service offering range and our maintenance, repair and overhaul (MRO) network.
€100m order for MTU engines to power rail locomotives for Dalian of China.
US$600m investment announced for re-developing our production facilities in Indianapolis, US.
2014 20150
2,000
4,000
6,000
8,000
2014 20150
2,000
4,000
6,000
8,000
2014 20150
2,000
4,000
6,000
8,000
2014 20150
2,000
4,000
6,000
8,000
2014 20150
2,000
4,000
6,000
8,000
Civil Aerospace Defence Aerospace Power Systems Marine Nuclear
Underlying revenue (£m)
Rolls-Royce plc Annual Report 2015 7
Strategic Report
Chief Executive’s review / Review of 2015

Strong growth expected in installed widebody fleet
2034202920242019201420092004199919941989198419791974
0
2,000
4,000
6,000
8,000
10,000
Num
ber o
f airc
raft
Year
Announced initial findings of a detailed operational reviewOur strategic priorities for 2015 remained largely consistent throughout the year, with a clear focus on the customer, innovation and on driving long-term profitable growth. However, with short-term market conditions around us changing, it has been appropriate to review these priorities as we look to the next three or four years.
Since July 2015, we have been conducting a review of operations and presented the initial conclusions in November 2015. As part of this we shared our views on the strengths and weaknesses of our business portfolio and updated management’s future focus and priorities around delivery and transformation.
Positive market developments continue to drive long-term growthThe long-term positive market trends for our leading power systems remain unchanged despite some near-term uncertainties that are expected to impact small aerospace engine production volumes and service activity on older widebody engines over the next couple of years. The trends driving demand for growth in large passenger aircraft, corporate jets and maritime activity remain strong; in particular a growing aspirational and mobile middle-class, particularly in Asia, and globalisation in business, trade and tourism. In addition, capacity constraints at the airframe manufacturers and a strong underlying demand for newer, more fuel efficient aircraft, should provide resilience to manufacturing schedules over the next few years as the industry transitions to new airframes during a strong replacement cycle.
The most significant short-term challenge that has emerged in 2015 relates to the changing demand for our Trent 700 engine as Airbus transitions production from old to
new airframes. This has had a knock on effect on both demand for and pricing of the remaining engines to be delivered. Once completed, we will benefit from an exclusive position with the new Trent 7000 on the A330neo. In the near-term the profit impact of this transition is negative; the impact of lower pricing and gross margin is exacerbated by the accounting effects of changes within our large engine aerospace product mix as we transition to a portfolio increasingly comprising ‘unlinked’ platform positions. However, the roll-out of new engines will significantly grow our market share and the installed base of new engines will deliver strong aftermarket revenues for decades to come.
We recognise that these changes have been exacerbated by market uncertainty as to the impact of TotalCare accounting on our financial statements. As a result, we are increasing our financial disclosure to present a simpler narrative that will more clearly describe how the key drivers of performance translate into our financial results and aid transparency and understanding. These are included in the Business review.
BUSINESS REVIEW P20
Company estimates
8 Rolls-Royce plc Annual Report 2015
Strategic Report / Chief Executive’s review Review of 2015

Portfolio analysis“We have a strong portfolio of products and services with strong competitive positions and many in sustainably attractive markets. We have the opportunity to strengthen products, routes to market or to reduce their costs so they can be more competitive in the future.”
Warren East24 November 2015
Market attractivenessLow High
High
Com
peti
tive
pos
itio
n
Market attractivenessLow High
High
Com
peti
tive
pos
itio
n
50% ~70%
Group portfolio 2020Group portfolio 2015
Rolls-Royce is in… growing markets. We are strongly positioned and… growing market share.”Warren East24 November 2015
Strategic focus going forwardThe review has led us to recast our priorities for 2016 onwards. As before, the overarching theme continues to be developing our products, services and order book to drive long-term profitable growth. We will do this by focusing on three common themes across all our businesses:
• investing in and developing engineering excellence;
• driving a manufacturing and supply chain transformation which will embed operational excellence in lean, lower-cost facilities and processes; and
• leveraging our installed base, product knowledge and engineering capabilities to provide customers with outstanding service through which we can capture aftermarket value long into the future.
Our ability to deliver these priorities will be enhanced by a major transformation of our organisation; to simplify our processes and management structure, to add pace to our decision making and execution, and to provide space to develop our people and create a stronger, high performance culture.
These themes will become the cornerstones of our operational priorities going forward.
Clear areas for business improvementThe review of operations also highlighted a number of opportunities to drive further performance improvements over and above the extensive restructuring programmes already underway. As we grew as an organisation we embedded costs and complexity in the business which, in periods of significant investment and product transition like now, are impacting our performance. But the higher costs also present a significant opportunity; to simplify what we do and sustainably reduce the cost of management, creating a more streamlined, resilient and sustainable business.
Rolls-Royce plc Annual Report 2015 9
Strategic Report
Chief Executive’s review / Review of 2015

Major new transformation programme creating meaningful cost savingsThe objective of our new transformation programme is to simplify the organisation, streamline senior management, reduce fixed costs and add greater pace and accountability to decision making. Our target is to deliver incremental gross cost savings of between £150m and £200m per annum, with the full benefits accruing from the end of 2017 onwards.
In the last two months, we have already announced a 20% reduction in the top two layers of senior management with further reductions planned for 2016 and onwards. This has included removal of the divisional structure. To date we have already identified around 50%, or £75-100m, of targeted cost savings with a related exceptional restructuring charge of £75-100m. Around £30-50m of the initial savings should be achieved in 2016 with the full run rate benefiting 2017. Further actions are underway to quantify the additional savings needed to reach our goals, together with the related costs which we expect to take in 2017.
To ensure we remain focused, we have set up a transformation team which will drive change to simplify processes and activities across the Group to deliver sustainable performance improvements. The new team will ensure other restructuring programmes maintain progress. They will also help develop the comprehensive range of key performance indicators needed to support the changes we are looking to make inside the business. Several measures around site level productivity and aerospace engine unit costs have already been adopted within the business. These and other measures will be important indicators of the changing culture around productivity, cost reduction, investment efficiency and process waste. Details on new measures will be set out in further announcements.
Restructuring initiatives started prior to November continue to make good progress During 2014 and 2015 restructuring initiatives were started, largely focused on our operational footprint within Aerospace and Marine.
In 2015, we consolidated our Civil Aerospace repair and overhaul activities, enabling the closure of sites in Brazil and the UK, along with further rationalisation of our UK manufacturing footprint. To date, nearly 80% of the targeted 2,600 Civil and Defence Aerospace headcount reductions have been completed, with an 11% reduction in our 2013 operational footprint.
In May 2015, we announced a Marine restructuring programme to make significant reductions in both manufacturing footprint and headcount (by 600) and generate £25m in annual savings from 2016 onwards. This included work to consolidate our footprint and increase lower-cost country sourcing. At the start of October 2015, we announced an additional programme of restructuring, focused largely on back-office administrative functions. This will lead to a further 400 reduction in headcount.
Good progress has been made overall, with related headcount reductions across Aerospace and Marine totalling 2,500 by the end of 2015.
We have significant opportunities to improve our operating performance and our pace, customer delivery, programme delivery, project delivery, lean manufacturing, as well as reducing our footprint.”David Smith Chief Financial Officer24 November 2015
10 Rolls-Royce plc Annual Report 2015
Strategic Report / Chief Executive’s review Review of 2015

RESTRUCTURING PROGRAMMES ANNOUNCED PRIOR TO NOVEMBER 2015
NOVEMBER 2015: NEW TRANSFORMATION PROGRAMME TO CREATE SIGNIFICANT INCREMENTAL SAVINGS
HOW WE ARE TRANSFORMING THE BUSINESS
My review… has highlighted a number of areas where we can simplify the way we work and inject pace into our decision making”Warren East 24 November 2015
£150–200m initial saving targeted with maximum 1-2 year payback
Primarily senior level, corporate and divisional fixed costs
Focus and deploy resources to maximise value to customers and add pace and simplicity to the business
Engineering excellence
Operational excellence
Capturing aftermarket value
Incremental changes (as previously announced)*
Aerospace
Marine
Net improvementHeadcount reduction
Net improvementHeadcount reduction
£0m2,200**
£(10)m600
£80m400
£35m400
£0m–
£40m–
2015
2016
2017
* Overall benefits expected to be broadly in line with previously announced estimates
** Includes 545 who left the business in 2014
AerospaceFootprint
Output – number of widebody engines
1.4 million sqm
~330
1.1 million sqm
~600
2015 2020
20%
80%
Rolls-Royce plc Annual Report 2015 11
Strategic Report
Chief Executive’s review / Review of 2015

Outlook for 2016Our outlook for 2016 is unchanged from that set out in November 2015. On a constant currency basis, Group revenue for 2016 is expected to be marginally lower than that achieved in 2015, partially reflecting the pricing and volume effects in Civil Aerospace and the continued weakness in offshore marine markets. Overall, the net profit trading headwinds discussed in previous announcements are unchanged at around £650m compared to our underlying profit before financing, excluding £58m intellectual property settlement included in ‘Other’ and £19m research and development (R&D) credit which benefited Nuclear.
Individual outlooks are provided for each business in the Business review.
Transforming our US operationsIn October 2015, we confirmed the decision to invest nearly US$600m in modernising our manufacturing base in Indianapolis, US.
This investment is the largest by Rolls-Royce in the US since we purchased the Allison Engine Company in 1995.
The new facility is part of a five-year modernisation plan and the investment is in line with the Group’s ongoing commitment to consolidate operations and significantly reduce operational costs. The new facility will be a state-of-the-art manufacturing centre that combines modern production systems and machinery together with a highly-skilled workforce.
We currently employ around 4,000 people in Indianapolis, where engines are designed, assembled and tested for US defence aircraft, civil helicopters, regional and business jets and power systems for US naval vessels.
Looking further aheadThe successful roll-out of new engines, led in particular by the Trent XWB, Trent 1000 and Trent 7000, together with a growing aftermarket, is expected to drive significant revenue growth over the next ten years as we build toward a 50% plus share of the installed widebody passenger market. While the impact of the transition to the Trent 7000 has reduced Trent 700 deliveries, and will hold back Civil Aerospace profit in the near term, we are confident that the important investments we are making to transition our production will create a strong platform to drive customer service, improved margins and strong cash flows.
Our 2014 and 2015 initiatives to reduce manufacturing and back office costs within Aerospace and Marine are on track to reduce costs by £145m by the end of 2017.
In addition, we have made a good start to the transformation programme that will add pace and simplify our business, and create incremental enduring cost savings of between £150m and £200m per annum from the end of 2017 onwards. These initiatives will make us a more efficient and resilient business. At the same time, we will continue to invest appropriately to strengthen our engineering and operational excellence and aftermarket products and services. We have started the journey that will return the Company to its long-term trend of profitable growth.
BUSINESS REVIEW P20
12 Rolls-Royce plc Annual Report 2015
Strategic Report / Chief Executive’s review Review of 2015

Engineering excellence
Operational excellence
Capturing aftermarket value
1 2 3Investing in and developing the excellence of our engineering to produce high-performance power systems
Transforming our manufacturing and supply chain to embed a lean approach across our facilities and processes
Leveraging our installed base, product knowledge and capabilities to provide outstanding services to customers
VISION – BETTER POWER FOR A CHANGING WORLD
‘…to be the market leader in high-performance power systems where our engineering expertise, global reach and deep industry knowledge deliver outstanding customer relationships and sustainable solutions.’
‘…focus on differentiated, mission-critical power systems which create high barriers to entry in our chosen markets. Leverage world-leading engineering, operational and customer service excellence to drive growing market shares, capture long-term aftermarket value and deliver profitable growth.’
STRATEGIC FOCUS – OUR PRIORITIES FOR DEVELOPING THE BUSINESS
OUR STRATEGIC PRIORITIES GOING FORWARD
Underpinned by a commitment to developing our people and our culture in a safe and ethical environment.
Rolls-Royce plc Annual Report 2015 13
Strategic Report
Chief Executive’s review / Strategic priorities

Our business model is to capture value from markets for high-performance power. We do this by developing advanced, integrated power and propulsion systems and providing long-term aftermarket support and delivery of outstanding customer services.Our long-life products operate in challenging environments where they are expected to deliver sustained levels of differentiated performance. They deliver value to customers through outstanding power or other performance capabilities, together with greater fuel efficiency and mission-critical reliability. This is often combined with a flexible service offering to best suit each customer’s operating needs.
We make significant investments in advanced technology and engineering programmes to deliver market-leading products. We seek to recoup our investment through developing superior products, many of which are selected for use on major multi-year programmes. We benefit from increasingly cost-efficient manufacturing as production levels rise, and by securing strong aftermarket revenues. In certain markets we strengthen our customer relationships typically through long-term service agreements where we commit to deliver exceptional standards of service, including high levels of product operational availability. This provides significant value to customers and in return we achieve long-term predictable revenues.
By growing our installed base of power systems over time and leveraging our aftermarket service activities, we enhance revenue, profit and cash flow. Cash flow is then invested to support future product development and technology programmes to drive growth while providing good shareholder returns.
OUR BUSINESS MODEL
Develop technology that anticipates customer needs
Our deep understanding of customer needs drives the development of new
technologies and products.
Disciplined capital allocationWe allocate our capital to achieve a balance of financial strength and liquidity to deliver commercial advantage and sustainable long-term shareholder returns.
Manufacturing capabilityWe manufacture cost-efficiently through a combination of economies of scale, developing a lean enterprise and integrated management of our supply chain.
Invest in R&D and skilled peopleDeveloping and protecting leading-edge technology and deploying it across our businesses allows us to compete on a global basis and creates high barriers to entry.
Design and make world-class productsWe differentiate on performance. We win and retain customers by developing and delivering products that provide more capability and offer better through-life value than those of our competitors.
Grow market share and installed base
Our substantial order book for both original equipment and services provides good visibility of future revenues
and provides a firm foundation to invest
with confidence.
Secure and maximise service opportunityOur equipment is in service for decades. Our deep design knowledge and in-service experience ensures that we are best placed to optimise product performance and availability.
Investment in future programme developmentWe make significant investment in development programmes which we believe will deliver cost-efficient and competitive next-generation products.
Engineering excellence
Industry-leading R&D
Proven mission-critical reliability
Exceptional long-life products
Differentiated product performance
1Operational excellence
Strong supply chain partnerships
Sustained cost reduction
Transforming to world-class production capability
Cost-focused lean enterprise
High-performance culture
2Capturing aftermarket value
Long-term relationships with civil and defence customers
Decades of in-service experience
Flexible range of service offerings
Growing installed base and global service footprint
3
Rolls-Royce plc Annual Report 2015 1514 Rolls-Royce plc Annual Report 2015
Strategic Report
Strategic Report / Chief Executive’s review Business model Chief Executive’s review / Business model

ENGINEERINGOUR FUTURE
CREATING WORLD-CLASS TECHNOLOGYIn 2015, we invested £1.2bn in gross R&D, which includes funding from governments and other bodies. £831m was from our own funds. As a result, we applied for 626 patents during the year. It is this investment that creates the intellectual property we then develop and embed in our products.
We leverage our own scientific and engineering talent globally to create world-class technology and also partner with leading academic institutions. This ensures we benefit from the knowledge of renowned experts in their fields, and get the best value from our investment.
We seek to attract and retain the best and brightest engineers. We then create a culture of innovation that allows them to develop their skills. We encourage all employees to contribute to our Innovation Portal via the Company intranet. In 2015, this generated well over 1,000 ideas from which we conducted dozens of challenges.
Graduates recruited in 2015
228Apprentices recruited in 2015
277
INVESTING IN PEOPLE AND SKILLS
Our investment in technology and skilled people is vital for a company that has advanced engineering at its core. Ultimately it delivers the differentiated, high-technology products that attract our customers.”Colin SmithGroup PresidentDirector – Engineering & Technology throughout 2015
READ MORE AT ROLLS-ROYCE.COM
16 Rolls-Royce plc Annual Report 2015
Strategic Report / Chief Executive’s review Engineering and innovation

EXPERT KNOWLEDGEWithin our engineering community, we have some of the world’s most knowledgeable people in specialist disciplines. There are over 100 members of the Rolls-Royce Fellowship (fellows and associate fellows) – each recognised as an expert in a particular field of science and technology.
STEM SUPPORTWe are actively engaged in supporting the study and teaching of science, technology, engineering and mathematics (STEM) subjects. The Rolls-Royce Science Prize is a prime example. This is an annual award programme that rewards excellence in science teaching – this year, we received 2,000 entries.
£1.2bnRESEARCH AND TECHNOLOGY CENTRESWe have a network of 31 University Technology Centres (UTCs) dedicated to advancing our understanding in specialist science and technologies that are core to our business. 2015 marked the 25th anniversary of our UTC network.
Gross R&D investment in 2015 University Technology Centres
31
Rolls-Royce plc Annual Report 2015 17
Strategic Report
Chief Executive’s review / Engineering and innovation
OTHER ENGINEERS(SAFETY/TEST/
TRANSFORMATION)
2,108
ELECTRICAL ENGINEERS
1,614
SERVICES ENGINEERS
1,554
DESIGN ENGINEERS
7,210
MANUFACTURING ENGINEERS
3,204
TOTAL ENGINEERS
15,690YEAR-END

ENGINEERING EXCELLENCE
LATEST MARINE THRUSTERS
Permanent magnet tunnel thrusters are now entering service. These improve efficiency and response, while reducing vibration, noise and emissions.
...THROUGH DESIGNStructured developmentOur latest Product Development System, introduced in 2015, provides an even more rigorous and structured method for developing game-changing capabilities and embedding these across the Group. It allows us to substantially improve our performance.
Lean thinkingWe further increased focus on lean thinking and behaviours during 2015, with the aim of transforming our business into a true lean enterprise. By a relentless pursuit of efficiency and continuous improvement we are seeking to empower our people to reduce waste in all its forms and deliver products and services efficiently. 5
Near-term technologies ready to embed into new products
10Leading-edge and
validated technologies
20Emerging and as yet
unproven technologies
VISION
VISION
VISION
Our Vision 20 approach to research and development of technology over a 20-year horizon
18 Rolls-Royce plc Annual Report 2015
Strategic Report / Chief Executive’s review Engineering and innovation

...THROUGH MANUFACTURINGAn important part of the design process is to consider the most effective way of manufacturing the often complex components that go into our products. These considerations are an intrinsic part of design engineering for any Rolls-Royce product. Teams of design and manufacturing engineers work closely on the development of future products.
Advanced Manufacturing Research Centres (AMRCs)Our growing network of seven AMRCs forms a unique resource to bridge the gap between early research and industrial application, delivering step-change improvements in product competitiveness and business performance. The network supports all our key manufacturing process technologies including additive layer manufacturing (3D printing) and advanced composites.
These highly collaborative public/private partnerships are a national asset, supported by long-term government commitment and delivering benefits through the entire supply chain for both original equipment and aftermarket activities.
FUTURE MAKING
READ MORE AT ROLLS-ROYCE.COM
Advanced Manufacturing Research Centres
7
Rolls-Royce plc Annual Report 2015 19
Strategic Report
Chief Executive’s review / Engineering and innovation

20 Rolls-Royce plc Annual Report 2015
Strategic Report / Chief Executive’s review Business review
BUSINESS REVIEW CIVIL AEROSPACE
OPERATIONAL REVIEWOverall, underlying revenue for Civil Aerospace grew 3% on a constant currency basis (up 1% at actual rates) with steady growth in services (up 9% at constant rates, including a £189m one-off benefit discussed below) which more than offset the reduction in original equipment (down 3% at constant rates). Second-half growth was particularly strong as the business improved original equipment delivery performance on a number of programmes, notably in corporate jets.
Original equipment revenues from widebody engines: linked and other reduced 11% reflecting a slow-down in linked Trent 700 deliveries for the Airbus A330 ahead of the introduction of the Trent 7000 for the A330neo, together with reduced sales of linked Trent 900 engines for the Airbus A380, partly offset by increased linked Trent 1000 engine sales for the Boeing 787 Dreamliner. In addition, sales of spare engines to joint ventures generated revenue of £189m (2014: £138m).
Original equipment revenues from unlinked widebody engines increased by 29%, largely a result of an increase in unlinked Trent XWB and other Trent engine deliveries.
The 17% increase in widebody services revenue was mainly driven by increased flying hours from our growing fleet of installed Trent 700, Trent 900 and Trent 1000 engines and a £189m one-off benefit resulting from refining the basis for taking account of risk in our forecasts of future revenue on long-term contracts. This was partially offset by lower utilisation of some of our more mature engine types, notably the Trent 500 and Trent 800.
SummaryThe Civil Aerospace business is a major manufacturer of aero engines for the commercial large aircraft and corporate jet markets. We power 35 types of commercial aircraft and have more than 13,000 engines in service around the world.
Underlying revenue mixUnderlying revenue mix
OE revenue 47% Services revenue 53%
Underlying revenue by sectorUnderlying revenue by sector
Large engines 63% Small & medium 37%
Key highlights Underlying revenue up 3%; solid growth
in aftermarket revenues offset lower new engine sales.
Underlying profit before financing 14% lower than 2014; largely reflecting lower gross margins, due to adverse mix effects and higher R&D charges, partially offset by the impact of life-cycle cost improvements, retrospective long-term contract accounting benefits, a reversal of impairment of contractual aftermarket rights and lower restructuring costs.
£3.8bn order book growth; led by Trent 900 and Trent XWB orders – Trent XWB now nearly 50% of order book.
New Trent engines, 1000 TEN, XWB-97 and 7000, on track for entry into service in 2017 and 2018.
Good progress modernising supply chain to reduce costs and increase capacity for Trent XWB ramp up over next four years.

Rolls-Royce plc Annual Report 2015 21
Strategic Report
Chief Executive’s review / Business review
Within our corporate engine business we had good revenue growth from our BR725 engine which powers the Gulfstream G650 and G650ER. This was offset by lower volumes for our other products due to weaker demand from Chinese, Russian and Brazilian customers. As a result, corporate original equipment revenues declined 1%. Despite a reduction in new corporate engine deliveries, our installed base of corporate jet engines continued to grow, contributing to a 13% increase in services revenues from these products.
Services revenues from our regional jet engines declined 14%, reflecting retirements and reduced utilisation of relevant fleets by North American operators.
On the V2500 programme, original equipment revenues declined 9% due to reduced demand from International Aero Engines (IAE) for V2500 modules to power the Airbus A320ceo, reflecting a mix change in engine types powering the aircraft ahead of the introduction of the A320neo. Despite continued growth in the installed base of engines, services revenues on the V2500 were down 1% overall reflecting a combination of fewer overhauls, lower spare parts sales and reduced engine flying hours.
Overall gross margins for Civil Aerospace were 22.0% (2014: 24.5%). The year-on-year reduction in margin of £139m reflected the lower
proportion of linked Trent 700 engine sales, weaker corporate jet engine volumes and a declining regional aftermarket, partially offset by £16m higher gross margin contribution from sales of spare engines to joint ventures (£67m in 2015 compared to £51m in 2014).
In addition, these factors were partially offset by a number of contract accounting adjustments and reversals of impairments and provisions.
The in-year benefit of retrospective long-term contract accounting adjustments as expected was a net positive of £222m (2014: total benefit of £150m). Of this, £189m was a one-off benefit resulting from refining the basis for taking account of risk in our forecasts of future revenue. In 2012, it was agreed with the Group Audit Committee that a comprehensive review would be completed during 2015. The new enhanced methodology should better reflect risk, current experience and expected long-term performance. Other long-term contract accounting adjustments totalled a net benefit of £33m (2014: total benefit of £150m). This comprised a retrospective charge of £107m (2014: benefit of £90m), reflecting reduced customer fleet utilisation, mainly in respect of the Trent 500 and Trent 800, other commercial changes and technical risks, offset by the benefit of £140m (2014: benefit of £60m) from life-cycle cost improvements.
Full-year performance also benefited from the reversal of previously recognised impairments on contractual aftermarket rights (CARs) and release of a related provision with a profit of £65m being recognised (2014: impairment charge of £19m). This reflected a significantly more positive outlook for future maintenance costs for a Trent 1000 launch customer which enabled the reversal of a previous impairment. This also resulted in the capitalisation of £22m of 2015 CARs that would otherwise have been impaired.
Costs below gross margin were £5m lower than the previous year. Within this, R&D charges were £64m higher, reflecting increased spend on key programmes, particularly in respect of the Trent 1000 TEN, the Trent 7000 and the Trent XWB-97. These engines, now in their final stages of preparation before flight testing, are due to enter service in 2017 and 2018. They represent a significant advance on previous Trent designs, providing substantial fuel burn improvements. The Trent 7000 and Trent XWB-97 programmes have yet to reach a point at which their costs can be capitalised. In addition, following its successful entry into service, continuing investment in the Trent XWB-84 engine can no longer be capitalised. Investment also increased to develop future corporate jet engine technology.
CIVIL AEROSPACE / KEY FINANCIAL DATA
2014Underlying
changeAcquisitions& disposals
Foreignexchange 2015
Order book 63,229 3,800 – – 67,029Engine deliveries 739 (27) – – 712Underlying revenue 6,837 201 – (105) 6,933Change +3% – -2% +1%Underlying OE revenue* 3,463 (117) – (88) 3,258Change -3% – -3% -6%Underlying services revenue* 3,374 318 – (17) 3,675Change +9% – +1% +9%Underlying gross margin 1,675 (139) – (10) 1,526Gross margin % 24.5% -270 bps – – 22.0%Commercial and administrative costs (283) (14) – 1 (296)Restructuring costs (82) 75 – – (7)Research and development costs (461) (65) – 11 (515)Joint ventures and associates 93 8 – 3 104Underlying profit before financing 942 (135) – 5 812Change -14% – – -14%Underlying operating margin 13.8% -230 bps – – 11.7%
* The methodology basis for the allocation of Civil Aerospace revenues on linked TotalCare contracts between original equipment and aftermarket has been reviewed and amendments made to reflect better the commercial substance of the combined contracts. Historically, the allocation has resulted in original equipment revenue and aftermarket revenue reflecting the contractual terms rather than the commercial substance of the contracts. The 2014 figures have been restated on the same basis; the impact was an increase in original equipment revenue of £198m and an equal decrease in aftermarket revenue
22 Rolls-Royce plc Annual Report 2015
Strategic Report / Chief Executive’s review Business review
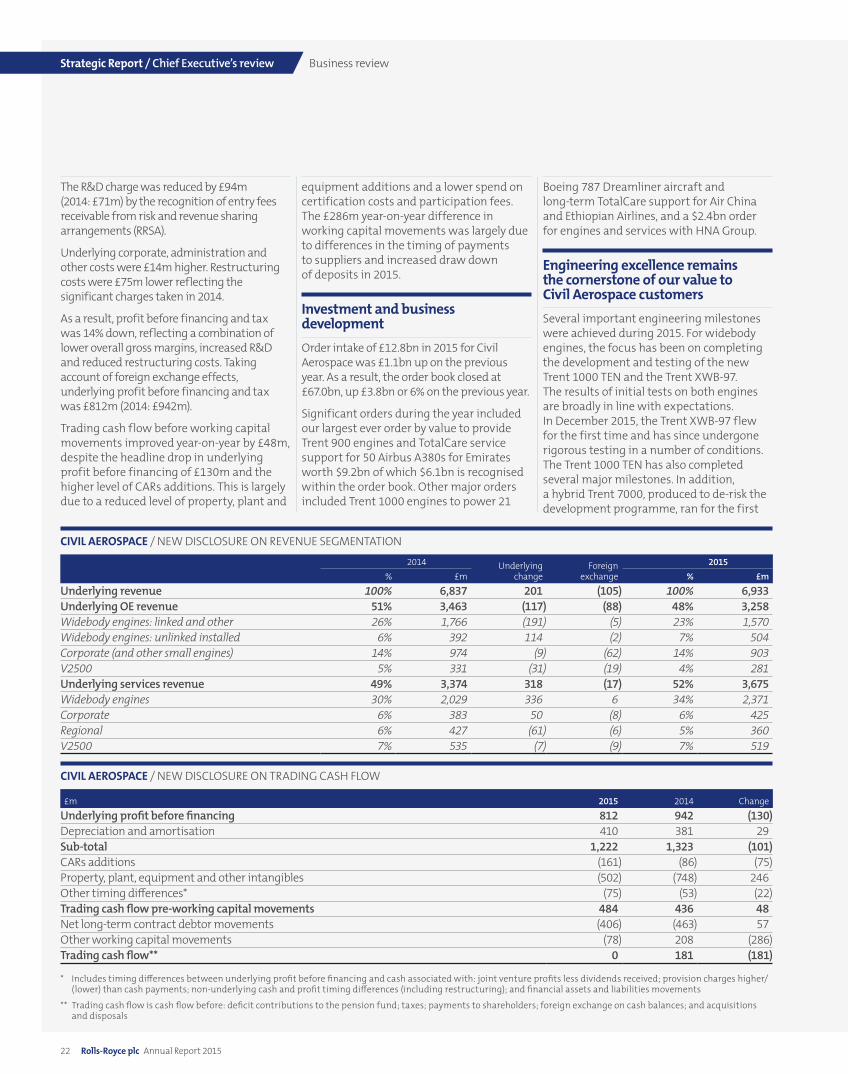
The R&D charge was reduced by £94m (2014: £71m) by the recognition of entry fees receivable from risk and revenue sharing arrangements (RRSA).
Underlying corporate, administration and other costs were £14m higher. Restructuring costs were £75m lower reflecting the significant charges taken in 2014.
As a result, profit before financing and tax was 14% down, reflecting a combination of lower overall gross margins, increased R&D and reduced restructuring costs. Taking account of foreign exchange effects, underlying profit before financing and tax was £812m (2014: £942m).
Trading cash flow before working capital movements improved year-on-year by £48m, despite the headline drop in underlying profit before financing of £130m and the higher level of CARs additions. This is largely due to a reduced level of property, plant and
equipment additions and a lower spend on certification costs and participation fees. The £286m year-on-year difference in working capital movements was largely due to differences in the timing of payments to suppliers and increased draw down of deposits in 2015.
Investment and business development Order intake of £12.8bn in 2015 for Civil Aerospace was £1.1bn up on the previous year. As a result, the order book closed at £67.0bn, up £3.8bn or 6% on the previous year.
Significant orders during the year included our largest ever order by value to provide Trent 900 engines and TotalCare service support for 50 Airbus A380s for Emirates worth $9.2bn of which $6.1bn is recognised within the order book. Other major orders included Trent 1000 engines to power 21
Boeing 787 Dreamliner aircraft and long-term TotalCare support for Air China and Ethiopian Airlines, and a $2.4bn order for engines and services with HNA Group.
Engineering excellence remains the cornerstone of our value to Civil Aerospace customers Several important engineering milestones were achieved during 2015. For widebody engines, the focus has been on completing the development and testing of the new Trent 1000 TEN and the Trent XWB-97. The results of initial tests on both engines are broadly in line with expectations. In December 2015, the Trent XWB-97 flew for the first time and has since undergone rigorous testing in a number of conditions. The Trent 1000 TEN has also completed several major milestones. In addition, a hybrid Trent 7000, produced to de-risk the development programme, ran for the first
CIVIL AEROSPACE / NEW DISCLOSURE ON REVENUE SEGMENTATION
2014 Underlying change
Foreignexchange
2015% £m % £m
Underlying revenue 100% 6,837 201 (105) 100% 6,933Underlying OE revenue 51% 3,463 (117) (88) 48% 3,258Widebody engines: linked and other 26% 1,766 (191) (5) 23% 1,570Widebody engines: unlinked installed 6% 392 114 (2) 7% 504Corporate (and other small engines) 14% 974 (9) (62) 14% 903V2500 5% 331 (31) (19) 4% 281Underlying services revenue 49% 3,374 318 (17) 52% 3,675Widebody engines 30% 2,029 336 6 34% 2,371Corporate 6% 383 50 (8) 6% 425Regional 6% 427 (61) (6) 5% 360V2500 7% 535 (7) (9) 7% 519
CIVIL AEROSPACE / NEW DISCLOSURE ON TRADING CASH FLOW
£m 2015 2014 Change
Underlying profit before financing 812 942 (130)Depreciation and amortisation 410 381 29Sub-total 1,222 1,323 (101)CARs additions (161) (86) (75)Property, plant, equipment and other intangibles (502) (748) 246Other timing differences* (75) (53) (22)Trading cash flow pre-working capital movements 484 436 48Net long-term contract debtor movements (406) (463) 57Other working capital movements (78) 208 (286)Trading cash flow** 0 181 (181)
* Includes timing differences between underlying profit before financing and cash associated with: joint venture profits less dividends received; provision charges higher/(lower) than cash payments; non-underlying cash and profit timing differences (including restructuring); and financial assets and liabilities movements
** Trading cash flow is cash flow before: deficit contributions to the pension fund; taxes; payments to shareholders; foreign exchange on cash balances; and acquisitions and disposals

Rolls-Royce plc Annual Report 2015 23
Strategic Report
Chief Executive’s review / Business review
time and is now being put through its paces with a series of rigorous tests.
For corporate jets, developments in the year were more modest. Strong orders for the BR725 have sustained steady original equipment volumes as the new Gulfstream G650ER entered service, despite a weakening market. Failure in past years to secure new positions on some important new corporate jet platforms contributed to a weak order intake in the year which will impact future volumes and revenues adversely. As part of our technology strategy, investments are being made to secure future opportunities and regain its position as the leading provider to the important market of large-cabin, long-range corporate jets.
Investing in new aerospace supply chain capabilities to help drive operational excellenceAs part of the supply chain transformation underway in the business, several important new facilities were completed during the year. These included the opening of our Advanced Blade Casting Facility in Rotherham, UK, which will halve the time it takes to manufacture turbine blades, and an expansion of our Trent XWB production centre in Derby. We also announced plans to invest in our facility in Inchinnan to create a new Centre of Competence for manufacturing aerofoils and established a joint venture with Liebherr to develop manufacturing capability and capacity for the power gearbox for our UltraFan™ demonstrator programme.
Strengthening our aerospace aftermarket service offeringDuring 2015, we broadened our service offering and strengthened our support network to provide customers with greater choice, flexibility and capability at all stages of the engine lifecycle, supporting a growing installed base.
This included making improvements to our Trent service network which will result in increased competition among our Approved Maintenance Centres (AMCs) and the announcement of our first independent AMC, Delta TechOps. We have also set up a global network of Customer Service Centres,
bringing us closer to our customers, working in their time-zones.
We launched a new service, SelectCare™, which fits between our comprehensive TotalCare and general maintenance, repair and overhaul services, where customers contract for individual shop visit support. At the same time, we announced American Airlines as the launch customer. We also announced our first customers for TotalCare Flex®, a new service targeting owners and operators of more mature engines. Cathay Pacific, AerCap, South African Airways and BMI Regional chose the service for Trent 800, Trent 500 and AE 3007 engines.
Civil Aerospace outlookAs we set out in November 2015, we believe the long-term outlook for Civil Aerospace remains very good, led by a strong widebody order book for fuel efficient engines. Key to the long-term success of the business is converting this exceptional order book into a large installed base of engines that meet customer demands for safe, reliable, efficient operation while driving profitable engine flying hour revenues. The next few years will be very important as we ramp up production of new engines – in new, efficient facilities – and invest in the development of future engine platforms that will benefit the order book from 2020 onwards. As a result, until we gain additional aftermarket scale, or complete our industrial transformation and improve unit costs and cash margins, the business will continue to be a net investor of cash.
Over the next few years the transition from ‘linked’ to ‘unlinked’ contracts creates a headwind to reported profit but no change to cash flows.
In the future, an increasing proportion of our new engines will be sold to the airframer on a sole-source basis, in particular the new Trent XWB and Trent 7000 for use on the Airbus A350 and A330neo respectively. As a result, a significantly larger proportion of our sales in the future will be accounted for on an ‘unlinked’ basis. While this does not change cash flows, it does change the timing of when profit is recognised across the OE and aftermarket contracts. Under ‘unlinked’ accounting, the engine sale and aftermarket contracts are accounted for separately.
This typically results in lower upfront profit recognition on engine delivery, with significantly higher proportion of profit in the aftermarket period. This is in comparison to ‘linked’ accounting, where a blended margin is applied across the engine sale and aftermarket contracts.
Near-term conditions in some segments remain challenging. We continue to expect our Civil Aerospace business to underperform 2015 underlying profit before finance and tax by around £550m. The significant headwinds related to Trent 700 volume reductions and the non-recurrence of a number of one-off benefits seen in 2015 remain broadly unchanged. In addition, we still expect to see weaker demand for new corporate jets and declines in demand within our regional jet aftermarket. The aftermarket benefit of higher levels of engine deliveries and increased installed thrust is expected to be largely offset by the underutilisation of older large engines. However, the business will benefit from reduced costs from the restructuring initiatives started in 2014.
We now expect the TotalCare net asset to grow from £2.2bn and peak at around £2.5bn, allowing for a more positive demand outlook for our ‘linked’ accounted engines and the benefit of further life-cycle cost improvements now being seen in engine performance.
Engines delivered in 2015
>700

24 Rolls-Royce plc Annual Report 2015
Strategic Report / Chief Executive’s review Business review
Market dynamics• Overall there has been a slowdown in all major
geographical markets for new aircraft orders reflecting a period of higher than normal order placement for new airframe products in recent years (principally Airbus A350 and A330neo, and Boeing 787 and 777X).
• Long-term growth in the number of widebody aircraft in the global fleet has historically been strongly correlated to global GDP growth.
• Asia and the Middle East are strong drivers of growth, correlating to their regional GDP growth.
• Historically, growth has recovered quickly following major economic shocks.
• Our current share in the widebody engine market is at 31% of the installed widebody passenger fleet and is expected to reach 50% early in the next decade.
• Older widebody aircraft are experiencing reduced utilisation by certain airlines, in particular Boeing 777s and Airbus A340s.
• The re-engining of the A330, announced in summer 2014, reduced Trent 700 sales ahead of the new Trent 7000 entering service in 2017 as the sole source engine for A330neo.
• Over 90% of Rolls-Royce large engine fleet is covered by our TotalCare service agreements.
• We are the market leader in large business jet aircraft engines, with 55% market share of the large/very large business jet market in 2015.
• Over 65% of Rolls-Royce business jet engines are covered by our CorporateCare® service agreements.
• Demand for large business jets is related to global economic growth and increases in the number of high net-worth individuals; the sector has historically been fairly resilient to financial shocks.
• The current business jet market is slowly recovering in the US (our largest market), but is currently going through a slowdown elsewhere due to political tensions and customer anticipation of new models about to enter into service. Overall, this sector is expected to grow faster than global GDP in the long term.
• In the regional sector, aftermarket demand for engines on 50-70 seat aircraft is reducing as aircraft approach the end of their lives.
Competition• GE is the main competitor supplying engines
in the widebody sector. In 2015, deliveries of engines for widebody passenger aircraft were split Rolls-Royce 38%, GE 54%, Pratt & Whitney 2%, and Engine Alliance 6%.
• Rolls-Royce is well positioned on all Airbus widebody airliner programmes and competes with GE on the Boeing 787 family.
• Rolls-Royce is the sole engine provider on the Airbus A350 XWB family where 775 aircraft have been ordered so far.
• GE is the sole engine provider on the Boeing 777X aircraft, scheduled to enter into service in 2020 where 306 have been ordered so far.
• In large business jets the main competition is GE, Pratt & Whitney and Safran; in 2015 the GE-Honda joint venture entered the market in very low thrust engines.
• Rolls-Royce has 3,100 powered business jets flying, representing 55% market share of the large/very large business jet fleet.
Business risks • If we experience a major product failure in
service, then this could result in loss of life and critical damage to our reputation.
• If an external event or severe economic downturn significantly reduces air travel, then our financial performance may be impacted.
• If our airframer customers significantly delay their production rates, then our financial performance may be impacted.
• If we fail to achieve cost reductions at the necessary pace, then our ability to invest in future programmes and technology may be reduced.
• If we experience significant pricing pressure from increased competitor challenge in our key markets, then our financial performance may be impacted.
• If we suffer a major disruption in our supply chain, then our delivery schedules may be delayed, damaging our financial performance and reputation.
• If there are significant changes to the regulatory environment for the airline industry, then our market position may be impacted.
Potential for OE and services over the next 20 years
Civil Aerospace – all sectors
$1,720bnOriginal equipment
$1,110bnAftermarket
$610bn
MARKET REVIEWRolls-Royce is one of the world’s leading civil aero-engine manufacturers with particular strengths in engines for civil widebody aircraft and large business jets, underpinned by our strength and continued investment in technology.
We are market leaders in the large business jet fleet market powering aircraft from most of the main airframers. We have a strong market position on widebody aircraft produced by the world’s two major airframers: Boeing and Airbus, who are broadly consistent in forecasting traffic growth (Revenue Passenger Kilometres) of approximately 5% CAGR over the next 20 years. In the engine market for narrowbody aircraft, we continue to supply some parts and services for the IAE V2500 engine family.

Rolls-Royce plc Annual Report 2015 25
Strategic Report
Chief Executive’s review / Business review
Key Rolls-Royce differentiators• Barriers to entry are extremely high in the civil
sector. We invest heavily to maintain market leading technologies and system level integration capabilities to deliver the best engine performance for our customers. We offer a wide range of aftermarket services which provide flexible and cost-effective options to our customers and build long-term customer relationships.
Opportunities • Our position and long-term prospects in the
widebody sector are strong across our Trent family.
• The Trent XWB has successfully completed its first year in service and the new Trent XWB-97 engine made its first test flight in November 2015 and is on schedule to enter into service in 2017.
• The new Trent 7000 is scheduled to enter into service in 2017 on the A330neo. We have sole source on this platform which will replace the A330, on which we are one of three engine providers.
• We will be introducing the new Trent 1000 TEN in 2017 for the Boeing 787. On the 787, Rolls-Royce engines have been selected for 42% of the current order book.
• A potential significant new entrant into the civil sector is China’s COMAC which is developing a narrowbody aircraft for entry into service towards the end of the decade. COMAC is also planning a joint programme with Russia’s UAC to develop a widebody aircraft, targeting entry into service around 2025. We remain in close dialogue with COMAC and UAC to understand their plans and whether their widebody programme presents an opportunity for Rolls-Royce.
• Our business jet market share is likely to fall in the medium term with the success of new entrants into the large/very large sector, but the market remains attractive and we will continue to invest to improve our position and retain leadership.
Exemplary year for Trent XWBOn 15 January 2016, the world’s most efficient aero engine completed its first year in service. The Trent XWB on the A350 XWB airliner achieved the milestone in style having delivered outstanding performance over its first 12 months of operation, with launch customer Qatar Airways.
The engine lived up to its credentials in terms of being the most efficient engine ever and the Trent XWB also managed to claim the crown of being the most reliable engine with a dispatch rate of 99.83%.
Designed as the next generation of medium-/long-haul airliners, the A350 is an all-new family of aircraft from Airbus.
The Trent XWB engine represents the largest single element of our £76.4bn order book by some margin. Over 1,500 of the engines have been ordered by more than 40 airlines, from important existing customers and from new Rolls-Royce customers all over the world.
READ MORE AT ROLLS-ROYCE.COM

26 Rolls-Royce plc Annual Report 2015
Strategic Report / Chief Executive’s review Business review
DEFENCE AEROSPACE
OPERATIONAL REVIEWUnderlying revenue at £2,035m was 5% lower on a constant currency basis (down 2% at actual exchange rates). Lower original equipment volumes for helicopters and trainers were partially offset by growth in LiftSystem™ volumes. Aftermarket revenues reflected lower volumes on helicopter spares partially offset by higher revenues related to long-term service agreements for UK combat aircraft.
Despite the reduced revenues, gross margin improved to 28.5%. Lower helicopter volumes and lower margins on some transport contract extensions were offset by higher LiftSystem volumes and increased retrospective margin improvements of £101m (2014: £53m) on existing long-term contracts. These relate to various combat platforms, where overall profitability has been improved by changed flying patterns and lower service costs, including approximately £40m (2014: £nil) due to one-off contract and scope variations.
Overall R&D costs were £20m higher in 2015 reflecting increased investment in new programmes. Restructuring costs were lower due to reduced level of severance costs and lower costs related to changing our operational footprint.
Underlying profit before financing of £393m was 4% up on the prior year on a constant currency basis, reflecting the lower volumes, the one-off margin improvements, increased R&D charges and lower restructuring charges. As a result, operating margin improved by 170 basis points to 19.3%.
SummaryWe are a leading engine maker for the military transport market and the second largest provider of defence aero-engine products and services globally. Defence has 16,000 engines in service with 160 customers in over 100 countries.
Key highlights Underlying revenue 5% lower; revenues
impacted by weaker helicopter and trainer volumes, partially offset by higher combat original equipment sales.
Underlying profit before financing up 4%; steady gross margin and lower restructuring costs offset higher R&D charges.
Strong positions in transport and patrol, and combat underpin outlook for a steady performance in 2016.
Major five-year $600m investment in Indianapolis, US, to improve cost base and benefit long-term growth.
Underlying revenue mix
Underlying revenue mix
OE revenue 39% Services revenue 61%
Underlying revenue by sector
Underlying revenue by sector
Combat 36% Transport and patrol 43% Other 21%

Rolls-Royce plc Annual Report 2015 27
Strategic Report
Chief Executive’s review / Business review
Long term, it remains essential that we have a cost-efficient supply chain to support the profitable growth of our business in a competitive market. To support future business competitiveness we initiated a major $600m investment in the upgrading of our Indianapolis facility, which will bring a combination of cost reductions, operational efficiencies and greater development capabilities for defence technologies. This investment recognises the importance of the US market and our strong position there.
Defence Aerospace outlookThe long-term outlook for Defence Aerospace remains positive with good opportunities to capitalise on its strong positions in transport and patrol and combat. Investment in developing new advanced technologies will be a feature of R&D for the next few years as the business ensures it can compete for new opportunities.
The outlook for revenues in 2016 remains steady. Operating profit will be adversely impacted by the lower level of expected long-term contract benefits in 2016, together with higher R&D and operational restructuring costs.
Free cash flow from Defence Aerospace is expected to remain strong in the longer term, reflecting the high proportion of aftermarket revenues. However, in the coming year free cash flow is expected to be lower reflecting the increased cost of investment and the run out of costs on key UK programmes where deposits have been received in advance of delivery.
Investment in US facilities
$600m
DEFENCE AEROSPACE / KEY FINANCIAL DATA
£m 2014Underlying
changeAcquisitions& disposals
Foreignexchange 2015
Order book 4,564 (248) – – 4,316Engine deliveries 744 (95) – – 649Underlying revenue 2,069 (101) – 67 2,035Change -5% – +3% -2%Underlying OE revenue 816 (45) – 30 801Change -6% – +4% -2%Underlying services revenue 1,253 (56) – 37 1,234Change -5% – +3% -2%Underlying gross margin 567 (9) – 21 579Gross margin % 27.4% +90bps – – 28.5%Commercial and administrative costs (112) (7) – (5) (124)Restructuring costs (55) 48 – (1) (8)Research and development costs (50) (20) – (3) (73)Joint ventures and associates 16 3 – – 19Underlying profit before financing 366 15 – 12 393Change +4% – – +7%Underlying operating margin 17.7% +170bps – – 19.3%
Investments and business developmentOverall, the Defence order book declined 5%, in large part reflecting the 2014 benefit of the significant multi-year order for engines to power C-130J aircraft. With a major focus within defence budgets on cost control, 2015 saw significant interest in availability-based service contracts and also on offering efficiency upgrades. New contracts included an extension of the UK’s Hercules Integrated Operational Support contract and commitment to the UK’s Future Combat Air System (FCAS) programme. After successful first flights on US ‘Hurricane Hunter’ P-3 aircraft in May, we received strong international interest including an initial USAAF order for the T56 3.5 technology insertion kit upgrade delivering both fuel saving and performance benefits for an engine programme which has been in existence for over 50 years.
Outside the UK and US markets, our particular focus has been on positioning ourselves to be competitive for forthcoming combat programmes. We had success in South Korea in conjunction with Airbus, with the contract being awarded to power the A330 tanker fleet with Trent 700 engines, as well as agreeing an order for our largest ever number of engines – a ten-year order with Robinson to supply at least 1,000 RR300 engines.

28 Rolls-Royce plc Annual Report 2015
Strategic Report / Chief Executive’s review Business review
Market dynamics• Defence budgets are expected to show modest
growth, flat in real terms in the US and UK, partially offset by growth in other emerging markets.
• Western customers are seeking to reduce and minimise costs by delaying or deferring purchases, improving asset availability and extending lifecycles of aircraft/engines.
• Increasing levels of economic affluence and political tension in the Asia Pacific and Middle East regions are leading to increases in both original equipment and services spend.
• Revenue has historically been broadly balanced between original equipment sales and aftermarket services, biased towards the latter.
Business risks • If we experience a major product failure
in service, then this could result in loss of life and critical damage to our reputation.
• If global defence spending experiences a further downturn, then our financial performance may be impacted.
• If we do not continue to invest to improve the performance and cost of our products, then we may lose market share.
• If we suffer a major disruption in our supply chain, then our delivery schedules may be delayed, damaging our financial performance and reputation.
• If we do not secure new applications, then our capabilities may be eroded in the long term.
Opportunities • The UK’s FCAS potentially a joint programme
with France, presents a longer-term combat opportunity to Rolls-Royce.
• Our LiftFan™ system for the F-35B is only just entering service and we expect to deliver over 400 systems in the next 20 years.
• Emerging markets, such as India, Turkey and South Korea are inviting bids on new combat aircraft. We estimate a potential of over 300 aircraft for these programmes.
• In transport, we believe the Airbus A400M transport aircraft and V-22 Osprey have overseas sales opportunities.
• We see strong growth potential for increased service provision to the military and we are well positioned with programmes such as MissionCare®.
Key Rolls-Royce differentiators• We are investing heavily in technology,
integration capabilities and facility modernisation to deliver capable, affordable engines for our customers. Additionally, we leverage our large installed base and strong services capabilities to provide superior and affordable service solutions.
MARKET REVIEWRolls-Royce is a market leader in defence aero engines for military transport aircraft and has strong positions in other sectors, including combat, trainer aircraft and helicopters. We are pursuing new opportunities emerging in Asia and the Middle East to mitigate flat defence budgets in the established North American and European markets.
Competition• GE, Pratt & Whitney, Honeywell and Safran
are the main competition in our sectors.
• In Europe, large defence programmes tend to be addressed by consortia of two or more companies due to the political environment. Examples include our collaboration with ITP, MTU and Safran on the TP400 engine for the Airbus A400M and with GE Avio, ITP and MTU on the EJ200 engine for the Eurofighter Typhoon.
• We support/lead sales campaigns globally on behalf of Eurojet for export sales opportunities of Eurofighter Typhoon.
• Barriers to entry are high and we do not envisage the competitive landscape changing significantly in the near future.
Potential for OE and services over the next 20 years
Defence Aerospace – all sectors
$400bnOriginal equipment
$125bnAftermarket
$275bn
Rolls-Royce plc Annual Report 2015 29
Strategic Report
Chief Executive’s review / Business review
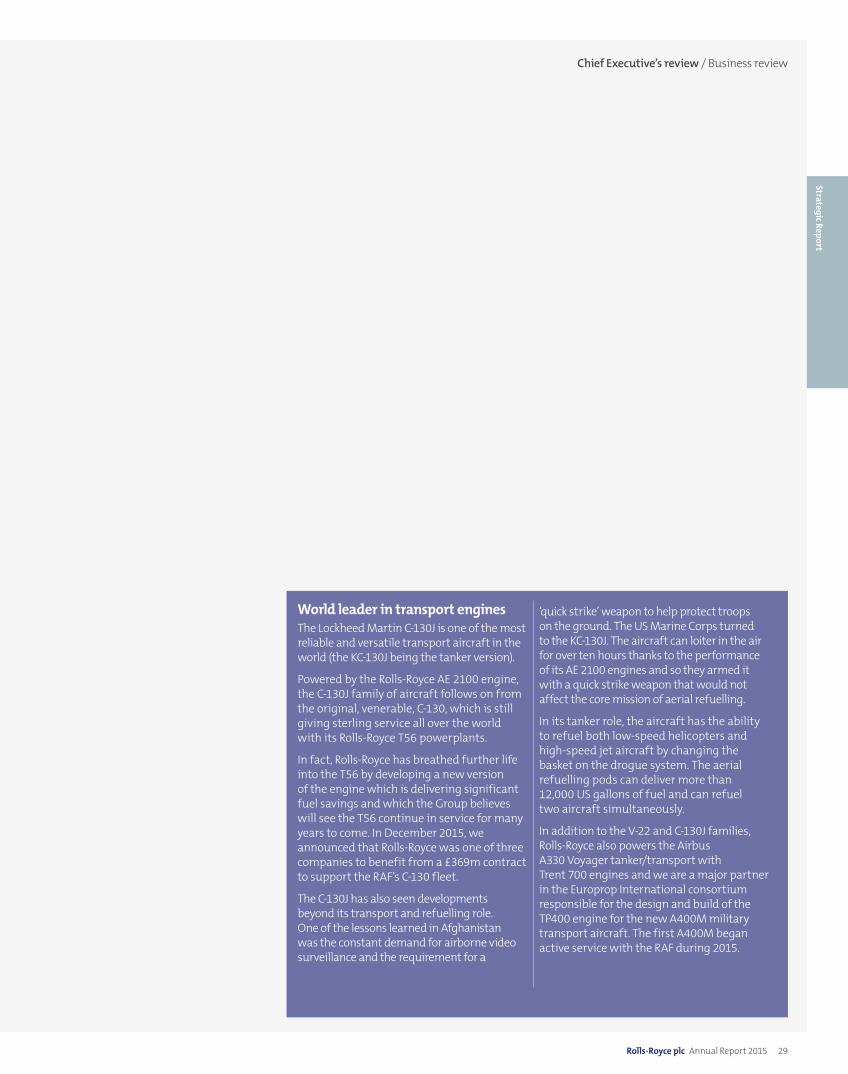
World leader in transport enginesThe Lockheed Martin C-130J is one of the most reliable and versatile transport aircraft in the world (the KC-130J being the tanker version).
Powered by the Rolls-Royce AE 2100 engine, the C-130J family of aircraft follows on from the original, venerable, C-130, which is still giving sterling service all over the world with its Rolls-Royce T56 powerplants.
In fact, Rolls-Royce has breathed further life into the T56 by developing a new version of the engine which is delivering significant fuel savings and which the Group believes will see the T56 continue in service for many years to come. In December 2015, we announced that Rolls-Royce was one of three companies to benefit from a £369m contract to support the RAF’s C-130 fleet.
The C-130J has also seen developments beyond its transport and refuelling role. One of the lessons learned in Afghanistan was the constant demand for airborne video surveillance and the requirement for a
‘quick strike’ weapon to help protect troops on the ground. The US Marine Corps turned to the KC-130J. The aircraft can loiter in the air for over ten hours thanks to the performance of its AE 2100 engines and so they armed it with a quick strike weapon that would not affect the core mission of aerial refuelling.
In its tanker role, the aircraft has the ability to refuel both low-speed helicopters and high-speed jet aircraft by changing the basket on the drogue system. The aerial refuelling pods can deliver more than 12,000 US gallons of fuel and can refuel two aircraft simultaneously.
In addition to the V-22 and C-130J families, Rolls-Royce also powers the Airbus A330 Voyager tanker/transport with Trent 700 engines and we are a major partner in the Europrop International consortium responsible for the design and build of the TP400 engine for the new A400M military transport aircraft. The first A400M began active service with the RAF during 2015.

30 Rolls-Royce plc Annual Report 2015
Strategic Report / Chief Executive’s review Business review
POWER SYSTEMS
OPERATIONAL REVIEWUnderlying revenue of £2,385m was 3% lower on a constant currency basis (12% lower at actual rates). Original equipment revenue was 5% lower, reflecting weaker oil & gas markets and weaker governmental demand which peaked in 2014. This was partially offset by an improved luxury yacht demand and some recovery in our sections of the construction and agriculture market where new emissions regulations increased demand. Underlying service revenues were up 3% despite some weakness in spare parts sales in North America and Europe.
Gross margins were slightly lower at 26.6% (2014: 27.3%) reflecting a change in product mix and lower overall volumes as expected.
Underlying profit declined 15% as a result of the lower gross margins. On a constant currency basis costs below gross margin were unchanged.
SummaryPower Systems is a leading provider of high- and medium-speed reciprocating engines, complete propulsion and drive systems, distributed energy solutions and fuel injection systems. The business serves the marine, naval, land defence, rail, mining, oil & gas, construction & agriculture and power generation markets through its core brands MTU, MTU Onsite Energy, Bergen and L’Orange.
Key highlights Underlying revenue 3% lower; weaker
original equipment partially offset by good growth in services.
Underlying profit before financing 15% lower; led by lower gross margin.
Positive outlook for 2016; healthy closing order book with good positions in key market segments.
Long-term R&D investments to increase cost competitiveness in higher volume engine applications .
OE revenue 68% Services revenue 32%
Underlying revenue mix
Underlying revenue by sector
Marine 37% Industrial 21% Energy 30% Defence and other 12%

Rolls-Royce plc Annual Report 2015 31
Strategic Report
Chief Executive’s review / Business review
The energy segment generated an increased order intake in 2015 reflecting good growth in gas gensets, particularly in Asia. In addition, the easing of the trading embargo with Iran is enabling the business to secure a good foothold in the country. As a result, we enjoy a strong market position within back-up power, particularly for larger mission-critical applications, which is a growing market. Recent notable orders came from Kuwait, Turkey and Bangladesh for the provision of back-up power for hospital modernisations and continuous power for a steel mill.
Power Systems outlookThe outlook for Power Systems remains steady. The business finished the year with a healthy order book for many of its key markets. As a result, while some markets remain difficult, we continue to expect the business to deliver modest growth in revenue and profit in 2016.
Closing order book
£1.9bn
POWER SYSTEMS / KEY FINANCIAL DATA
£m 2014Underlying
changeAcquisitions& disposals
Foreignexchange 2015
Order book 1,971 (43) – – 1,928Underlying revenue 2,720 (72) – (263) 2,385Change -3% – -10% -12%Underlying OE revenue 1,893 (97) – (178) 1,618Change -5% – -9% -15%Underlying services revenue 827 25 – (85) 767Change +3% – -10% -7%Underlying gross margin 742 (37) – (70) 635Gross margin % 27.3% -70bps – – 26.6%Commercial and administrative costs (296) (9) – 30 (275)Restructuring costs (7) 3 – – (4)Research and development costs (183) 3 – 18 (162)Joint ventures and associates (3) 3 – –Underlying profit before financing 253 (37) – (22) 194Change -15% – – -23%Underlying operating margin 9.3% -110bps – – 8.1%
Investment and business developmentOur Power Systems business serves a variety of markets ranging from marine, industrial, construction & agriculture to defence and power generation. This diversity enabled the business to mitigate some of the weak environment, particularly that linked to oil and commodities.
2015 order intake was £2.5bn (2014: £2.6bn) with the closing order book broadly unchanged at £1.9bn. Within this, the defence sector demonstrated greater resilience with a combination of a higher proportion of long-term service contracts together with the winning of the first order worth approximately €80m from the British Army for 589 MTU diesel engines for the new Scout Specialist Vehicle.
Within the broad range of industrial applications, while a number of markets deteriorated through the year, there was positive news. This included contract wins from a Chinese company for 232 MTU Series 4000 engines for freight locomotives bound for South Africa, and further orders for luxury yacht engines. An extension to our longstanding co-operation with Daimler was also agreed for the development of a new range of industrial engines, which comply with new EU off-highway regulations for reduced soot emissions.

32 Rolls-Royce plc Annual Report 2015
Strategic Report / Chief Executive’s review Business review
Market dynamics• Population growth and increasing urbanisation
are driving rising demands for energy, resources and food and continuous infrastructure developments.
• Global GDP development with particular growth in Asia.
• Increasing global and regional trade and transport of goods.
• Geopolitics and an increasing multipolar world are driving modest defence budget growth (1-2%) in NATO countries with more growth in emerging markets.
• Increasing focus on renewable energy sources requires decentralised and clean energy solutions (eg. continuous gas and back-up power generation solutions).
• Increasing environmental legislation and efficiency requirements drive emission and efficiency technologies.
• Current weak environment in certain markets (eg. oil & gas and mining), due to current low oil and commodity price levels.
Business risks • Economic: some markets are currently
affected by low oil and commodity prices (oil & gas, mining) while some regional markets show challenges due to the current economic situation.
• Political: increasing political tensions and sanctions might limit levels of global trade and customer access.
• Competitive: upcoming competitors from Asia and new entrants into our existing markets can potentially put pressure on volumes and margins.
• Technological: complementary technologies might replace existing solutions eg. energy storage for back-up power.
Key Rolls-Royce differentiators• Technology leadership and reputation with
market-leading performance and system approach especially in mission-critical applications; new product innovation (eg. hybrid/e-drive); and high level of customisation.
Opportunities • Regional growth, eg. Asia, through leveraging
partner companies.
• Continuous development into clean propulsion and energy solutions which are compliant with new emissions regulations.
• Development of efficiency solutions, eg. e-drive/hybrid drives and fuel diversification towards gas/dual-fuel.
• Enhancement of system competence and solutions to create customer value through optimised total system functionality and performance.
• Expansion of service portfolio, customised offerings and intelligent applications and services.
Potential for OE and services over the next 20 years
Power Systems – all sectors
£650bn
MARKET REVIEWThe markets served by Power Systems are driven by global megatrends such as increasing population growth, rising energy, resource and food demand, increasing and stricter emissions legislation and government defence budgets. Despite the current market downturn in some of our markets, most noticeably in oil & gas and offshore, we expect long-term recovery in these and continuous growth in all of our markets. We estimate that Power Systems ‘off-highway’ reciprocating engine markets offer an opportunity of £650bn.
Competition• Fragmented competitor landscape in
‘off-highway’ engine markets which varies depending on specific market segments – many players although a few dominate.
• Continuing industry consolidation results in strong, large scale and integrated players.
• Expansion of western competitors in our specific core engine markets.
• Competition from Asia increasingly focusing on higher power ranges where MTU operates.
• While traditional competition has been limited to engine suppliers, solution providers are becoming more relevant.

Rolls-Royce plc Annual Report 2015 33
Strategic Report
Chief Executive’s review / Business review
During 2015, Rolls-Royce completed further trials on its hybrid drive power system, the result of five years of pioneering work.
A conventional MTU railway PowerPack combines all the individual elements needed for power and efficiency into a single functional unit mounted on a supporting frame. MTU has delivered more than 6,000 of these PowerPacks to the rail industry.
The MTU hybrid PowerPack combines the benefits of a conventional diesel system with an electric propulsion module, energy storage and propulsion control system.
The basic idea of hybrid rail technology is that the kinetic energy initially generated by the diesel engine is recovered via an electric motor operating as an electric brake. This energy is stored chemically in a powerful battery for later use.
The recovery of the kinetic energy in braking mode is extremely energy- and cost-efficient, particularly in stop-and-go situations on local public transport lines where there are a large number of stops and on inclined rail sections on hilly terrains.
In 2015, for the first time, MTU performed its own tests on a hybrid train. During the tests, fuel consumption was shown to be reduced by more than 23% compared to straightforward diesel mode. Under optimum conditions, MTU believes fuel savings of 25% or more are possible.
READ MORE AT ROLLS-ROYCE.COM
High-efficiency power for trainsHybrid rail technology is the energy-saving combination of a conventional diesel engine and an electric drive system.

34 Rolls-Royce plc Annual Report 2015
Strategic Report / Chief Executive’s review Business review
MARINE
OPERATIONAL REVIEWUnderlying revenue of £1,324m was 16% lower on a constant currency basis (down 23% at actual rates). Within this, original equipment revenues were 19% down at £773m. Service revenues were more robust, although still declined 10%. This reflected weaknesses in offshore and merchant, as ship owners deferred overhaul and maintenance on the back of reduced utilisation of their vessels.
As a result of the revenue weaknesses, price pressure and cost under-recovery, gross margins declined 500 basis points to 19.6% and overall gross margin was £260m, £139m lower than in 2014. As a result, with only modest reductions to date being achieved in corporate, administration and other costs, underlying profit was £15m, 94% down on a constant currency basis.
Around £15m of restructuring charges were incurred in 2015 and excluding these, underlying profit declined 83%. In the first half we took a non-underlying charge of £69m for the impairment of goodwill on two of our businesses owing to a less favourable business outlook, partly driven by the impact of market deteriorations on our offshore businesses.
SummaryMarine is a leading provider of complex and integrated propulsion and handling systems to the maritime offshore, merchant and naval markets. The product offering ranges from individual items of equipment to integrated systems and flexible mission-critical solutions, including complete vessel designs. The business has more than 4,000 customers. Seventy naval forces and over 30,000 commercial vessels use our equipment.
Key highlights Underlying revenue down 16%; weak
offshore markets impacting both OE and aftermarket revenues.
Underlying profit before financing down 94%; significant reduction in gross margin, led by lower volumes, and higher restructuring costs only partially offset by reduced commercial and administration costs.
Challenging outlook for 2016; led by reduced demand in offshore oil & gas markets.
Launched two restructuring programmes in 2015 focused on manufacturing footprint and back-office functions; expected benefits to start to accrue from 2016 onwards.
Underlying revenue by sector
Merchant 24% Offshore 56% Naval 20%
OE revenue 58% Services revenue 42%
Underlying revenue mix

Rolls-Royce plc Annual Report 2015 35
Strategic Report
Chief Executive’s review / Business review
ship equipment for a dive support vessel. We also saw demand from non-oil related sectors such as wind farm support and fishing trawlers.
Activity within our target merchant sectors was subdued, but we made progress in our strategy of developing markets for offshore derived technologies within specialist areas such as azimuth propulsion systems for double-ended ferries. We also delivered Asia’s first LNG-powered tug and the first of two all-gas powered cargo vessels for a Norwegian transport company.
The naval business was focused on further development work and deliveries against contracts in both the UK and US. These included the first DDG 1000 multi-mission destroyer class for the US Navy and the world’s largest, gas turbine engines, the MT30 for the UK’s two new aircraft carriers. We also signed a contract to supply MT30s for operation on the first three of the Royal Navy’s new Type 26 Global Combat Ship.
Product development work within the business included expanding the range of permanent magnet-based propulsion systems, as well as spearheading research into our pioneering ship intelligence technology focused on data-driven value-added services.
Marine outlookOverall the outlook for Marine remains cautious. We expect that the market will continue to be hit by low oil prices which will impact on demand for our products and services. As a result we will sustain our cost reduction programmes, focusing on manufacturing facilities, supply chain and overhead costs, in order to drive a more competitive business while also adapting to volume risks.
As set out in November 2015, we expect the net impact of weak trading conditions and cost saving initiatives to result in 2016 profits being between £75m and £100m lower than those achieved in 2015. As a result, the business is expected to be significantly loss making in 2016.
Closing order book
26%
MARINE / KEY FINANCIAL DATA
£m 2014Underlying
changeAcquisitions& disposals
Foreignexchange 2015
Order book 1,567 (403) – – 1,164Underlying revenue 1,709 (269) – (116) 1,324Change -16% – -7% -23%Underlying OE revenue 1,070 (204) – (93) 773Change -19% – -9% -28%Underlying services revenue 639 (65) – (23) 551Change -10% – -4% -14%Underlying gross margin 425 (139) – (26) 260Gross margin % 24.9% -500bps – – 19.6%Commercial and administrative costs (254) 27 – 26 (201)Restructuring costs (4) (16) – 4 (16)Research and development costs (29) (2) – 3 (28)Underlying profit before financing 138 (130) – 7 15Change -94% – – -89%Underlying operating margin 8.1% -750bps – – 1.1%
>Investment and business developmentThe focus in 2015 has been on repositioning the Marine business to reflect the very challenging market environment and outlook. During the year, we also announced a number of restructuring programmes that will in total lead to the loss of around 1,000 employees in operations and back-office functions as we shrink our Northern European footprint, reduce indirect headcount, and consolidate manufacturing activity. This will deliver projected cost savings of £65m per annum from 2017 onwards and create a business better able to compete in an increasingly cost-conscious market place which is geographically shifting towards Asia.
Overall, the Marine order book declined 26% during the year, mainly reflecting a very weak offshore market, particularly in Northern Europe. Orders for new vessels, projects and services were all sharply lower than 2014 and as a result order intake was only £997m, 45% down on the previous year.
The offshore market was extremely weak reflecting a low oil price and reduced capital expenditure within the upstream oil exploration and related services sectors. Targeted investment in R&D and improving our Asian position saw progress later in the year with two major orders from China. These comprised an equipment contract for nine tug supply vessels and a package of advanced

36 Rolls-Royce plc Annual Report 2015
Strategic Report / Chief Executive’s review Business review
Market dynamics• Increasing environmental legislation
and system efficiency requirements.
• Population growth is leading to an increasing energy and resources demand for cargo and passenger transportation in the long term.
• Increasing global and regional trade and transport of goods with effects on short-sea shipping.
• Strong shift from traditional markets towards Asia, both in shipbuilding and operation.
• Geopolitics and an increasing multipolar world results in increasing defence expenditures especially in emerging markets which stimulates demand for naval vessels.
• Increased technology requirements for harsher environments, eg. deepwater.
• Currently significant challenges in offshore markets due to low oil prices and weak investment signals.
Business risks • Markets: significant reduction in oil price
creates pressure in the offshore market with all customer groups seeking to reduce costs and capital commitments.
• Order delays and cancellations impact our revenue, cash and profit but also put our supply chain under financial stress.
• Competition: competitors react to a depressed market by cutting costs, pricing aggressively and partnering with other players.
• Business continuity: the main risk is our key suppliers remaining solvent. We monitor and manage this to ensure no supplier has critical mass and maintain business continuity plans for these risks and other operational risks such as IT.
• Technology: failure to invest in the right technologies to meet customer demand in the future.
• Risk of product failure in the field resulting in the need for intervention to rectify the issue with financial consequences.
Opportunities • Capture value on more advanced vessels
in offshore.
• Grow in tugs, ferries and workboats and short-sea shipping in merchant segments.
• Continue to leverage the joint value proposition in naval markets together with MTU.
• Continue to develop clean propulsion solutions which are emission compliant to new regulations, including alternative fuels (eg. gas/dual-fuel).
• Grow in integrated propulsion and electric systems.
• Establish a leading position in ship intelligence.
• Leverage local partnerships to generate regional growth in Asia, especially China.
Potential for OE and services over the next 20 years
Marine – all sectors
£250bn
MARKET REVIEWIn Marine, where we offer integrated ship solutions (including design, propulsion, deck machinery, automation and control, and power electrics), we forecast the market opportunity across the offshore, merchant and naval market segments to be £250bn.
Competition• Major competitors fall into two groups
– focus on strengthening systems capability or focus on product and technology.
• Industry consolidation within recent years has resulted in the establishment of large market players.
• Increasing competition from Asia, especially China.
• Increasing competition from industrial and electric companies driven by more focus on efficiency and electrification.

Rolls-Royce plc Annual Report 2015 37
Strategic Report
Chief Executive’s review / Business review
Key Rolls-Royce differentiators• Unique domain knowledge; unique system
portfolio including vessel design; joint value proposition within naval together with MTU; continuous innovation and technology leadership; and leadership in ship intelligence.
Waterjets for fast catsWatercat M18 multi-purpose vessels use Rolls-Royce Steel Series Kamewa waterjets to propel them at speeds of over 40 knots. These lightweight, agile boats from Marine Alutech of Finland are ideal for fast patrol and troop transportation roles.
READ MORE AT ROLLS-ROYCE.COM

38 Rolls-Royce plc Annual Report 2015
Strategic Report / Chief Executive’s review Business review
NUCLEAR
OPERATIONAL REVIEWUnderlying revenue increased 9% on a constant currency basis, led by growth in both original equipment and services. In particular, growth in submarine activities was strong. Revenue growth for our instrumentation and controls businesses was also good, particularly in Europe.
Despite the growth in revenue, gross margin declined by 240 basis points to 16.2% or £111m. This was largely due to increased costs on a number of projects with lower margin. Gross margin was also impacted by a reclassification of site costs from commercial, administration and other of around £7m. This favourably benefited costs below gross margin which also benefited from lower R&D charges as a result of an R&D credit of £19m which covered the current and the two previous years. Excluding this, underlying profit before tax was £50m, in line with the prior year. After the release, underlying profit of £70m is 40% up on the prior year.
Investment and business developmentsThe order book fell around 13%, reflecting delivery of our long-term contracts across both submarines and civil nuclear businesses. New orders were biased to the second half of the year, benefiting from the expansion of our business reach and capabilities.
Our civil nuclear business focuses on multi-year projects and specialist services for what is a growing global industry. We were selected as preferred bidder by EDF to work on heat exchangers and waste treatment for the Hinkley Point C project in the UK and we were selected by Hitachi to be part of the Wylfa power station delivery team, the second nuclear power station scheduled in the UK’s new-build programme. We also won a contract to supply safety measurement systems for the entire French fleet of 900MW reactors. These mandates help to further consolidate our significant position in the European marketplace and position us well to seek further opportunities for partnerships in growing nuclear markets.
SummaryNuclear is a leader in propulsion system design and development for the Royal Navy’s nuclear submarine fleet and is the sole provider and technical authority, managing all aspects of plant design, safety, manufacture, performance and through-life support.
In civil nuclear we provide nuclear reactor vendors and utility operators with integrated, long-term support services and solutions spanning the whole reactor lifecycle, from concept design through to obsolescence management and plant-life extension. Safety-critical systems have been supplied to around 50% of the global nuclear power plants in service. We have been a key player in the nuclear industry for more than 50 years.
Key highlights Underlying revenue 9% higher; strong
service revenues led by increased submarine work.
Underlying profit before financing unchanged, excluding the benefit from a £19m R&D credit; volume benefit offset by lower margins.
2016 outlook steady; focus on improving delivery performance and developing civil nuclear opportunities.
Investing in the business to extend systems offering and increase service scope.
Underlying revenue by sector
Submarines 80% Civil 20%
OE revenue 37% Services revenue 63%
Underlying revenue mix
Potential for OE and services in civil nuclear over the next 20 years
£360bn

Rolls-Royce plc Annual Report 2015 39
Strategic Report
Chief Executive’s review / Business review
In the US our acquisition of R.O.V. Technologies Inc. in March 2015 expanded our nuclear services portfolio, bringing complementary Boiling Water Reactor expertise and broadening our existing Pressurised Water Reactor remote inspection capability.
Our submarine activities have concentrated on delivering against long-term contracts for the Royal Navy’s nuclear submarine fleet, including delivery of the nuclear propulsion system to power HMS Artful, the third Astute-class submarine, which was launched in August 2015. Our work on the Vanguard class included work on a refuelling programme and also the first successful upgrade to the reactor control and instrumentation update for HMS Vengeance. At the Naval Reactor Test Establishment, HMS Vulcan, the PWR2 test facility reactor was safely shut down having completed its prototyping role. Development work on the new PWR3 power plant for the Successor submarine fleet continues with contract extensions agreed in preparation ahead of the government final investment decision.
Nuclear outlookThe outlook for Nuclear remains steady. Both submarines and civil nuclear enjoy long-term secure aftermarket revenues. While business development opportunities remain modest in the near-term, new power plants for the Successor together with long-term opportunities to develop relevant products for civil nuclear applications should provide incremental growth.
MARKET REVIEWAll respected global energy forecasts predict that nuclear power will continue to play a significant role in providing low-carbon, continuous and secure power. The demand for mission-critical equipment, systems and engineering services and the associated reactor support services for the civil nuclear market is forecast to be £360bn over the next 20 years.
Market dynamics• Population growth and improved living
standards in emerging markets are driving a rise in demand for electricity.
• Within the future energy mix, low-carbon energy is expected to increase, with nuclear energy accounting for a significant share.
• Growth in nuclear power generation is predominantly driven by non-OECD countries; strong growth is expected especially in China.
• Solid growth in mature markets based on current operations and plant life extensions.
Competition• In civil nuclear the competitor landscape is
fragmented and comprises reactor vendors, original equipment manufacturers, multi-skilled companies and nuclear operators in service.
• Plant operators increasingly outsource service activities.
Business risks • Delivery: failure to meet customer expectations
or regulatory requirements.• Markets: if nuclear markets do not grow as
anticipated due to external or other political events then business will be diminished.
• Customer strategy: if programmes are cancelled as a result of strategic decisions, such as abandonment of the UK nuclear deterrent, or vertical integration by reactor vendors, then future revenues will be diminished.
• If we experience a major product failure in service, then this could result in loss of life and critical damage to our reputation.
• If we suffer a major disruption in our supply chain, then our delivery schedules may be delayed, damaging our financial performance and reputation.
Opportunities • Increasing the pace of growth of the civil
nuclear business.• Focusing on growth regions beyond current
core markets.• Strengthening our position with the rapidly
growing importance of China in the civil nuclear market.
• Capturing a higher share of the nuclear service market through extension of our geographic reach.
Key Rolls-Royce differentiators• Unique key technology capability in defence
and civil nuclear with substantial credibility (more than 50 years’ experience); broad mix of offerings over the whole lifecycle; reactor independent portfolio, capable of global reach.
NUCLEAR / KEY FINANCIAL DATA
£m 2014Underlying
changeAcquisitions& disposals
Foreignexchange 2015
Order book 2,499 (331) – 2,168Underlying revenue 638 56 – (7) 687Change +9% – -1% +8%Underlying OE revenue 230 27 – (6) 251Change +12% – -3% +9%Underlying services revenue 408 29 – (1) 436Change +7% – – +7%Underlying gross margin 119 (6) – (2) 111Gross margin % 18.7% -240bps – – 16.2%Commercial and administrative costs (61) 6 – 2 (53)Restructuring costs (1) (1) – – (2)Research and development costs (7) 21 – – 14Underlying profit before financing 50 20 – – 70Change +40% – – +40%Underlying operating margin 7.8% +230bps – – 10.2%

Order book and order intakeDuring the year our order book increased by £2.7bn to £76.4bn. Key orders included our record single order from Emirates for 200 Trent 900 engines which contributed $6.1bn to the order book. Throughout the year new order intake in our Marine business was very weak, driven by significant market deterioration in offshore. Overall, orders were lower in Defence and Nuclear, although we view the prospects for these businesses as unchanged, reflecting long-term orders won in previous years.
Consistent with the plans we laid out in November 2015, we have enhanced the financial disclosures for all our reporting segments to include gross margin, R&D and other costs below gross margin, as well as restructuring charges. In addition, within Civil Aerospace we have provided additional revenue segmentation and a trading cash flow breakdown. These disclosures apply to both 2014 and 2015 and should help further analysis of trading performance.
DELIVER
GROUP TRADING SUMMARY
£m 2014Underlying
changeAcquisitions & disposals
Foreignexchange 2015
Order book 73,674 2,725 – – 76,399Underlying revenue 13,864 (96) – (414) 13,354Change -1% – -3% -4%Underlying OE revenue 7,418 (363) – (331) 6,724Change -5% – -5% -9%Underlying services revenue 6,446 267 – (83) 6,630Change +4% – -1% +3%Underlying gross margin 3,523 (251) – (90) 3,182Gross margin % 25.4% -160bps – – 23.8%Corporate and administrative costs (1,069) 11 – 54 (1,004)Restructuring costs (149) 107 – 3 (39)Research and development costs (730) (64) – 29 (765)Joint ventures and associates 106 10 – 2 118Underlying profit before financing 1,681 (187) – (2) 1,492Change -11% – – -11%Underlying operating margin 12.1% -130bps – – 11.2%
We have significantly enhanced this year’s Annual Report with additional disclosures to increase transparency and understanding.”David SmithChief Financial Officer
Underlying tradingUnderlying Group revenue declined 1% in 2015 compared to 2014 on a constant currency basis. This reflects a 5% decline in revenue from original equipment, partially offset by a 4% increase in services revenue, led by Civil Aerospace. By business on a constant currency basis, Civil Aerospace revenue increased 3%, Defence Aerospace revenue decreased 5%, Power Systems revenue decreased 3%, Marine revenue decreased 16% and Nuclear revenue increased 9%.
Underlying profit before financing of £1,492m (2014: £1,681m) was 11% lower on a constant currency basis, led by a significant reduction in Marine profit, driven by weak offshore markets in particular. Civil Aerospace was down year-on-year, although performance was helped by around £222m of retrospective benefits (2014: £150m) led by refining the basis for taking account of risk in our forecasts of
40 Rolls-Royce plc Annual Report 2015
Strategic Report / Chief Executive’s review Financial review

Underlying revenue
£13,354m Underlying operating margin
11.2% Underlying profit before financing
£1,492m
201520142014201320122011
inc E
nerg
y
exc E
nerg
y
201520142014201320122011
inc E
nerg
y
exc E
nerg
y
201520142014201320122011
inc E
nerg
y
exc E
nerg
y
2014 exc £13,864m2014 inc £14,588m2013 £15,505m2012 £12,209m2011 £11,277m
2014 exc 12.1%2014 inc 11.5%2013 11.8%2012 12.2%2011 10.7%
2014 exc £1,681m2014 inc £1,678m2013 £1,832m2012 £1,490m2011 £1,206m
0
500
1,000
1,500
2,000
202720262025202420232022202120202019201820172016
Debt retirement (£m)
Undrawn Drawn
Net debtThe Group is committed to maintaining a robust balance sheet and a strong, investment-grade credit rating, which it believes are important when selling products which will be in service for decades. Standard & Poor’s updated the rating of Rolls-Royce Holdings plc in January 2016 to A/negative outlook and Moody’s maintained a rating of A3/stable.
At the end of 2015, the Group’s net cash balance reduced from £666m to a net debt position of £111m, reflecting the £166m positive free cash inflow, movements on balances with Rolls-Royce Holdings plc as a result of its share repurchases totalling £414m and shareholder payments of £421m. Other items include residual payments related to the divestment of the Energy business and non-cash foreign exchange movements. During the year we refinanced our revolving credit facility, increasing it to £1.5bn, and issued two new US bonds, totalling US$1.5bn.
into service of the Trent XWB-84 in January 2015 and increased recognition of entry fees.
Underlying financing charges were £60m (2014: £61m). Underlying profit before tax was £1,432m (2014: £1,620m). The underlying tax charge was £351m, with an effective tax rate of 24.5% (2014: 24.0%).
Free cash flowCash capital expenditure in 2015 reduced to £479m (2014: £616m), largely reflecting lower spend on new aerospace facilities. Cash taxes were £160m (2014: £265m excluding Energy). The cash cost of defined benefit pension schemes in excess of the earnings charge was £46m (2014: £154m excluding Energy).
Overall, the free cash inflow for the year was £166m (2014: inflow of £437m, adjusted for Energy). The significant decline from 2014 primarily reflects lower trading margins and adverse working capital movements.The TotalCare net asset movement year-on-year was slightly higher than expectations.
future revenue on long-term contracts, and the reversal of previously recognised impairment on contractual aftermarket rights (CARs) and release of a related provision. Defence Aerospace delivered an improved year-on-year profit which included one-time contract benefits, led by contract extensions and reduced long-term costs. Power Systems was down year-on-year in line with our expectations on a constant currency basis as the business managed well within a number of weaker markets. Marine, as expected, was sharply lower, reflecting the weak oil & gas offshore sector and Nuclear was in line, after excluding the positive R&D credit.
The R&D charge increased 11% over 2014 on a constant currency basis, largely reflecting ongoing investments in Civil Aerospace for the Trent 1000 TEN and Trent XWB-97, together with higher spending on the Trent 7000 and corporate jet programmes. In addition, we increased investment in future technology demonstrator programmes and improved emissions solutions for Power Systems applications. In addition, capitalisation of R&D declined significantly largely due to the entry
Rolls-Royce plc Annual Report 2015 41
Strategic Report
Chief Executive’s review / Financial review

FINANCIAL REVIEW CONTINUEDResults broadly in line with the expectations set out in July 2015
UNDERLYING INCOME STATEMENT£m 2015 2014 Change
Revenue 13,354 13,864 -510Gross profit 3,182 3,523 -341Commercial and administrative costs (1,004) (1,069) +65Restructuring (39) (149) +110Research and development costs (765) (730) -35Share of results of joint ventures and associates 118 106 +12Profit before financing 1,492 1,681 -189Net financing (60) (61) +1Profit before tax 1,432 1,620 -188Tax (351) (388) +37Profit for the year 1,081 1,232 -151Gross R&D investment (1,240) (1,249) +9Net R&D charge (765) (730) -35
SEGMENTAL ANALYSIS
Revenue Gross profit Profit before financing£m 2015 2014 Change 2015 2014 Change 2015 2014 Change
Civil 6,933 6,837 +96 1,526 1,675 -149 812 942 -130Defence 2,035 2,069 -34 579 567 +12 393 366 +27Aerospace Division 8,968 8,906 +62 2,105 2,242 -137 1,205 1,308 -103Power Systems 2,385 2,720 -335 635 742 -107 194 253 -59Marine 1,324 1,709 -385 260 425 -165 15 138 -123Nuclear 687 638 +49 111 119 -8 70 50 +20Other 96 46 +50 64 8 +56 52 (2) +54Intra-segment (106) (155) +49 7 (13) +20 7 (13) +20Land & Sea Division 4,386 4,958 -572 1,077 1,281 -204 338 426 -88Central costs (51) (53) +2Group 13,354 13,864 -510 3,182 3,523 -341 1,492 1,681 -189
Reported revenue
£160m Reported profit before taxation
6.2% Net R&D as a proportion of underlying revenue
£13,725m
2014 £13,736m2013 £15,513m2012 £12,161m2011 £11,124m
2014 £146m2013 £2,019m2012 £2,705m2011 £1,106m
2014 exc 5.9%2014 inc 5.8%2013 4.8%2012 4.7%2011 4.6%
42 Rolls-Royce plc Annual Report 2015
Strategic Report / Chief Executive’s review Financial review
20152014201320122011 20152014201320122011 201520142014201320122011
inc E
nerg
y
exc E
nerg
y

The effects of acquisition accounting in accordance with IFRS 3 are excluded from underlying profit so that all businesses are measured on an equivalent basis. Impairment of goodwill principally relates to the Marine business.
Costs associated with the substantial closure, or exit from, a site, facility or activity are classified as exceptional restructuring and excluded.
Profits and losses arising on acquisitions and disposals during the year are excluded.
Net financing on post-retirement schemes is excluded from underlying profit.
Appropriate tax rates are applied to these adjustments, the net effect of which was an increase of £275m in the reported tax charge (2014: £239m increase, including a £64m reduction in the amount of recoverable advance corporation tax recognised).
The 2014 reported results also included £142m relating to discontinued operations.
Balance sheetIntangible assets (note 8) represent long-term assets of the Group. These assets decreased by £159m in the year, with additions of £408m being more than offset by amortisation of £407m, impairments to goodwill of £75m (including £69m Marine impairment reported in the first half) and exchange losses of £134m (largely relating to euro-denominated intangible assets arising from the acquisition of Rolls-Royce Power Systems AG).
Underlying income statementThe ‘Other’ category in the segmental analysis includes residual retained assets relating to the Energy business which were not included in the sale to Siemens in 2014 and a one-off intellectual property settlement of £58m. The value of these is not material to the Group.
Underlying profit before financing and taxation is discussed in the Business review on pages 20 to 39.
Underlying financing costs were stable versus 2014. An increase in net interest of £13m was offset by changes in other underlying financing costs. An underlying foreign exchange gain of £34m is included, arising from realised gains on foreign exchange contracts settled to translate overseas dividends into sterling.
Underlying taxation was £351m, an underlying tax rate of 24.5% compared with 24.0% in 2014.
Reported resultsConsistent with past practice and IFRS accounting standards, the Group provides both reported and underlying figures. We believe underlying figures are more representative of the trading performance, by excluding the impact of year-end mark-to-market adjustments, principally the GBP:USD hedge book. In addition, financing of post-retirement benefits, effects of acquisition accounting and impairment of goodwill are also excluded. Adjustments between underlying profit and reported profit in the income statement are set out in more detail in note 2 to the Consolidated Financial Statements. This basis of presentation has been applied consistently.
Mark-to-market adjustments are principally driven by movements in the GBP:USD exchange rate which moved from 1.56 to 1.48 during 2015.
Movements in other financial instruments relate entirely to financial risk and revenue sharing arrangements. The put option on the non-controlling interest in Power Systems was exercised in 2014, so this had no impact in 2015.
The CARs balance increased by £156m to £405m. The increase included £50m arising from the reversal of previously recognised impairments. During the year, following analysis of the first major overhauls of Trent 1000 engines, the recoverable amount of certain CARs has been reassessed. This demonstrated that aftermarket cash flows from these engines are better than originally assumed, arising from both operational and contractual performance improvements. Accordingly, cumulative impairments prior to 2015 of £50m have been reversed. This has resulted in the capitalisation of £22m of CARs in 2015 that would otherwise have been impaired, including £16m recognised in the interim results.
PROFIT BEFORE TAXATION£m 2015 2014
Underlying profit before tax 1,432 1,617Mark-to-market of derivatives and related adjustments (1,065) (1,254)Movements on other financial instruments 8 (8)Effects of acquisition accounting (124) (142)Exceptional restructuring (49) (39)Acquisitions and disposals 2 8Impairment of goodwill (75) –Post-retirement scheme financing 32 (29)Other (1) (7)Reported profit before tax from continuing operations 160 146
Rolls-Royce plc Annual Report 2015 43
Strategic Report
Chief Executive’s review / Financial review

SUMMARY BALANCE SHEET£m 2015 2014
Intangible assets 4,645 4,804Property, plant and equipment 3,490 3,446Joint ventures and associates 576 539Net working capital (743) (712)Net funds (111) 666Provisions (640) (807)Net post-retirement scheme (deficits)/surpluses (77) 555Net financial assets and liabilities (1,854) (833)Other net assets and liabilities (483) (827)Net assets 6,289 6,831Other itemsUS$ hedge book (US$bn) 28.8 25.6TotalCare assets 2,994 2,492TotalCare liabilities (783) (687)Net TotalCare assets 2,211 1,805Customer financing contingent commitments: Gross 269 388 Net 54 59
with IAS 19. While the corporate bond yields used to measure the liabilities remained broadly stable, gilt yields which are the principal driver of asset valuations increased, reducing the value of the assets. The schemes adopt a low risk investment strategy that reduces funding volatility (for which both assets and liabilities are measured on a gilt basis); interest rate and inflation risks are largely hedged and the exposure to equities is around 9% of scheme assets.
The increase in overseas schemes arose largely due to higher discount rates in Germany and the US.
Provisions (note 17) largely relate to warranties and guarantees provided to secure the sale of OE and services. The decrease is largely a result of the utilisation of warranty and restructuring provisions.
Net financial assets and liabilities (note 16) include the fair value of derivatives and financial RRSAs. The increase in liabilities primarily reflects the impact on the US$ hedge book of the GBP:USD exchange rate falling to 1.48 from 1.56 at the beginning of the year.
The Group hedges transactional foreign exchange exposures to reduce volatility. The most significant exposure is net US$ income. The US$ hedge book increased by 12.5% to US$28.8bn, which represents around five years of net exposure and has an average book rate of £1 to US$1.59.
Net TotalCare assets relate to long-term service agreement contracts in the Civil Aerospace business, including the flagship services product TotalCare. These assets represent the timing difference between the recognition of income and costs in the income statement and cash receipts and payments.
The net asset increased in 2015 by £406m (2014: £463m), reflecting accounting for new ‘linked’ engines of £521m (2014: £588m) and retrospective TotalCare accounting adjustments of £222m (2014: £150m) taken in the year, offset by cash flows and other items of £337m (2014: £275m).
Customer financing facilitates the sale of OE and services by providing financing support to certain customers. Where such support is provided by the Group, it is almost exclusively to customers of the Civil Aerospace business and takes the form of various types of credit
FINANCIAL REVIEW CONTINUED
Carrying values of intangible assets are assessed for impairment against the present value of forecast cash flows generated by the intangible asset. The principal risks remain: reductions in assumed market share; programme timings; increases in unit cost assumptions; and adverse movements in discount rates. Other than noted above, there have been no significant impairments in 2015.
Property, plant and equipment (note 9) increased by £44m. Capital expenditure of £494m was largely offset by depreciation of £373m, disposals of £34m and foreign exchange movements of £32m.
Investments in joint ventures and associates (note 10) increased modestly, principally as the share of retained profit exceeded dividends received.
Net post-retirement scheme (deficits)/surpluses (note 18) decreased by £632m, comprising a reduction of £692m in the UK and an increase of £60m overseas.
The reduction in UK schemes is principally due to relative movements in assumptions used to value the underlying assets and liabilities in the UK schemes in accordance
44 Rolls-Royce plc Annual Report 2015
Strategic Report / Chief Executive’s review Financial review

Pensions: contributions to defined benefit pension schemes in 2015 reduced by £63m, which included a reduction in the UK deficit funding payments of £36m and the non-recurrence of discretionary increase contributions of £33m. The total operating charge increased by £43m largely due to past service credits of £8m in 2015 compared to £31m in 2014. Funding of defined benefit schemes is expected to be similar in 2016.
Movements on balances with parent company: primarily reflects the parent company’s payments to shareholders and share buyback, funded by Rolls-Royce plc.
Discontinued operations in 2015 reflect a sales price adjustment of £42m paid in 2015 on the 2014 disposal of the Energy business and wind-down costs.
and asset value guarantees. These exposures produce contingent liabilities that are outlined in note 17. Contingent liabilities represent the maximum aggregate discounted gross and net exposure in respect of delivered aircraft, regardless of the point in time at which such exposures may arise. During 2015, the Group’s gross exposure on delivered aircraft reduced by £119m, mainly due to guarantees expiring.
Summary funds flowMovement in working capital includes an increase in the net TotalCare asset of £406m and a reduction in the amount of net customer deposits of £143m. The reduction in customer deposits is largely in the Marine business as a result of lower order intake in the offshore market and lower government spend.
Expenditure on property, plant and equipment and intangible assets: the decrease reflects reductions in additions to property, plant and equipment (£174m), participation fees and certification costs (£86m) and capitalised development costs (£45m), offset by increased expenditure on contractual aftermarket rights (£68m) and foreign exchange movements of £51m.
£166m Free cash flow
201520142014201320122011
inc E
nerg
y
exc E
nerg
y
2014 exc 4372014 inc 2442013 7382012 5502011 543
SUMMARY FUNDS FLOW
£m
2015 2014Previously
reported EnergyExcluding
Energy Change
Opening net funds 666 1,939Closing net funds (111) 1,273Change in net funds (777) (666)
Underlying profit before tax 1,432 1,617 (3) 1,620 -188Depreciation and amortisation 613 600 18 582 +31Movement in net working capital (546) (520) (152) (368) -178Expenditure on property, plant and equipment and intangible assets (887) (1,114) (30) (1,084) +197Other (240) 89 (17) 106 -346Trading cash flow 372 672 (184) 856 -484Contributions to defined benefit post-retirement schemes in excess of PBT charge (46) (152) 2 (154) +108Tax (160) (276) (11) (265) +105Free cash flow 166 244 (193) 437 -271Movement on balances with parent company (822) (465) – (465) -357Shareholder payments – (76) – (76) +76Acquisitions and disposals (3) (965) – (965) +962Net funds acquired – (30) – (30) +30Discontinued operations (121) – 193 (193) +72Foreign exchange 3 19 – 19 -16Change in net funds (777) (1,273) – (1,273)
Rolls-Royce plc Annual Report 2015 45
Strategic Report
Chief Executive’s review / Financial review

46 Rolls-Royce plc Annual Report 2015
Strategic Report / Chief Executive’s review Sustainability
DEVELOPING A SUSTAINABLE BUSINESS
WHAT MATTERS MOSTUnderstanding and prioritising the issues that matter most to the Group and our stakeholders enables us to manage our business effectively for the long term. This informs our strategy, approach and reporting. We have policies, processes, targets and governance in place to manage the most important issues.
READ MORE AT ROLLS-ROYCE.COM
Dow Jones Sustainability IndexWe have been awarded Industry Leader, Industry Mover and Gold Class award for the Aerospace and Defense sector in the Dow Jones Sustainability Index. Achieving an overall score of 77, we have been listed in the DJSI World and DJSI Europe indexes.
CDP Climate Change IndexOur score of 99B in the CDP is our highest to date and has earned us a place in the FTSE 350 Climate Disclosure Leadership Index. This reflects our commitment to continuously improve our environmental performance and disclosure.
As a leading power systems provider we have a fundamental role in meeting the environmental and societal opportunities and challenges that the world faces.
EXTERNAL RECOGNITION
Better power
Better future
Better business
ENERGY CONSUMPTION WASTE AND RECYCLING TAXATION SUPPLIER OPERATIONS
EXTERNAL PARTNERSHIPS COMMUNITY INVESTMENT LOCAL ECONOMIC DEVELOPMENT
STEM EDUCATION OUTREACH
BUSINESS ETHICS ABC AND EXPORT CONTROL
SUPPLIER ETHICS EMPLOYEE SAFETY MATERIAL STEWARDSHIP
TRANSPARENCY AND DISCLOSURE
GHG EMISSIONS FROM OUR OPERATIONS AND FACILITIES
DIVERSITY AND INCLUSION EMPLOYEE WELLBEING HUMAN RIGHTS
INNOVATION EMPLOYEE ENGAGEMENT TALENT MANAGEMENT DATA AND CYBER SECURITY
PRODUCT SAFETY PRODUCT PERFORMANCE
PRODUCT COMPLIANCE
CUSTOMER SATISFACTION
OUR MATERIAL
ISSUES
CR
ITIC
AL HIGH
MODERATE

Rolls-Royce plc Annual Report 2015 47
Strategic Report
Chief Executive’s review / Sustainability
OUR APPROACH
Average number of employees per region* Average number of employees by business unit*
*Headcount data is calculated in terms of average full-time employees for 2015See note 6 Employee information on page 88 for comparative data
UK 23,200 USA 6,400 Canada 1,100
Civil Aerospace 23,200 Defence Aerospace 6,400 Power Systems 10,600
Germany 10,700 Nordic countries 3,800 Rest of world 5,300
Marine 6,000 Nuclear 4,100 Other 200
Helping our customers do more, using less
Our engineering expertise helps us to deliver more efficient products for our customers. Our commitment is to improve continuously the environmental performance of our products and services. Each year we invest over £1.2bn in gross R&D, two thirds of which is aimed at improving environmental performance.
Our environment strategy focuses on three areas: supporting our customers by further reducing the environmental impact of our products and services; developing new technology for future low emissions products; and maintaining our drive to reduce the environmental impact of our business activities.
We work with our customers to ensure optimal performance from our products throughout their operational life. We deliver a broad range of learning solutions, ranging from product operations and maintenance to simulation activities.
We have an extensive range of field service personnel and service operations centres that ensure we have the expertise and equipment available to service our products with minimal disruption.
Our products and services are designed to the highest standards of product safety, and we consistently pursue proactive opportunities for improvement. Product safety and environmental requirements are an integral part of each stage of the product lifecycle.
Better power Better futureCommitted to innovation, powering better, cleaner economic growth
Innovation is embedded in all of our products and services and is a key competitive advantage. The skills, knowledge and passion of our workforce help us to innovate and to deliver on behalf of customers. We are working towards creating an environment where everyone can reach their full potential. We encourage diversity, engagement and development.
We are committed to protecting the human rights of our employees. Our Global Human Rights policy sets out this commitment through employment standards covering: employee involvement; diversity and equality; pay and benefits; working hours; forced labour and child labour. Compliance is assessed on a regular basis.
Employee health and wellbeing are the foundation of high performance. We focus our health improvement programmes on key areas in accordance with our risk profile: health risk management; resilience and wellbeing.
A diverse workforce will help ensure our continued success as a global business and contribute towards a better future.
We use a variety of channels to communicate with employees and encourage participation and engagement. Our community investment and education outreach programmes are a key component of our employee involvement activities.
Better businessInvesting in technology, people and ideas to improve all aspects of performance
We are committed to conducting every aspect of our business to the highest ethical standards and ensuring we are in line with all applicable laws. We have a zero tolerance approach to any form of ethical misconduct, bribery or corruption.
We have a Global Code of Conduct that applies to all employees of Rolls-Royce, our subsidiaries and controlled joint ventures, wherever they are located. We set equivalent standards for our supply chain through our Global Supplier Code of Conduct.
We regard the health and safety of our employees and those working on our premises, or on our behalf, as paramount.
We continue to focus on managing the health and safety risks through risk-based improvement programmes, strengthening leadership and cultural change.
Reducing the environmental impact of our business activities is a key part of our environment strategy. We continue to invest in improving the performance of our operations by reducing energy use, greenhouse gas emissions and waste.
We are committed to optimising material and resource efficiency. We are working to better manage the use of chemicals in our processes and to phase out the use of substances that are considered dangerous to the environment or harmful to health.

48 Rolls-Royce plc Annual Report 2015
Strategic Report / Chief Executive’s review Sustainability
SUSTAINABILITY PERFORMANCE INDICATORSWe launched our dashboard of sustainability performance indicators in 2015, with higher stretching targets base-lined on our 2014 performance.
Better futureDescription Why we measure it How we have performed
STEMReach 6 million people through our STEM education programmes and activities by 2020
We aim to inspire future generations in Science, Technology, Engineering and Mathematics (STEM) through education outreach programmes and activities that demonstrate the life-long opportunities that STEM careers can offer.
Our programmes reached 1.6 million people worldwide in 2015, 70% of whom were actively engaged in one or more STEM activity. Many programmes were aimed at groups currently under-represented in engineering careers, reflecting our commitment to encouraging greater diversity in the workplace.
Employee wellbeingAll sites to achieve our employee health and wellbeing LiveWell accreditation by 2020
Our goal is to enhance the personal health and wellbeing of our people to help them reach their full potential. The Rolls-Royce LiveWell accreditation programme will help to create a culture where healthy choices are encouraged and rewarded, including; smoke-free site policies, healthy food choices and exercise facilities. Sites are also required to establish local employee wellbeing committees with annual objectives.
During 2015, all sites were required to complete an initial LiveWell accreditation gap analysis. One site, Bristol UK, met the criteria for accreditation and was awarded the LiveWell award. The introduction of our Global Smoke Free Campus policy in 2016 will enable more sites to obtain LiveWell accreditation.
Employee engagementEnsure our Sustainable Employee Engagement Index is greater than, or equal to, the Global High Performance Norm1 by 2020
We want all of our employees to be able to perform to their best ability and encourage open collaboration, engagement and involvement.
Our Sustainable Engagement Score declined slightly, from 84 in 2014 to 81 in 2015, as we continue to undergo significant change as a business. As a result, our Executive Leadership Team has committed to and is driving a programme of improvement actions relating to leadership, communication and enablement. These are aimed at improving our work environment and strengthening our climate for success.
Number of people reached (million)
2020target
2015 2016 2017 2018 2019012
6543
LiveWell site accreditation (%)
2020target
2015 2016 2017 2018 2019
100
020406080
Sustainable Employee Engagement Score100
020406080
Score High performance norm
2014baseline
20202015 2016 2017 2018 2019
Better powerDescription Why we measure it How we have performed
Improving efficiency levels of each generation of the Trent engine familyto meet the ACARE Flightpath 2050 goals
The Advisory Council for Aviation Research and Innovation in Europe (ACARE) has set challenging goals for aviation to meet by 2050. These include developing technologies and procedures to:• Reduce aircraft CO2 emissions
by 75% (per passenger kilometre)• Reduce noise by 65%• Reduce oxides of nitrogen (NOx) by 90%.This is all relative to a typical new aircraft produced in 2000.
This chart shows the improved efficiency levels of each generation of Trent engine from the Trent 800 onwards.
Improving emissions levels of each generation of the MTU Series 4000 C&I enginesto meet future emissions regulations
Our MTU Series 4000 C&I engines meet the strictest current regulations for NOx and particulates reduction. This is achieved through field-tested and proven technology such as two-stage turbocharging and exhaust gas recirculation. We continue to invest in product R&D to meet future emissions regulations.
This chart shows the improved emissions levels of each generation of the MTU Series 4000 C&I engine.
% change in particulates (g/kWh)
% change in NOx (g/kWh)
Future trend
Trent family
Technology demonstrator engine targets
Rolls-Royce contribution to ACARE Flightpath 2050 target
1998 2003 2008 2013 2018 2023
0
-20
-40
-60
-80
-100
CO1
CO3
CO4CO5
% ch
ange
in e
mis
sion
(g/k
Wh)
Entry into service
1 Employee Engagement survey, Sustainable Employee Engagement Index and Global High Performance Norm provided independently by Towers Watson
2000 2010 2020 2030 2040 2050
-5
-10
-15
-20
-25
-30
Trent 500Trent 900
Trent 1000Trent XWB
Advance
UltraFan
Entry into service
% C
O2 o
r fue
l bur
n
Trent 800

Rolls-Royce plc Annual Report 2015 49
Strategic Report
Chief Executive’s review / Sustainability
Better businessDescription Why we measure it How we have performed
EthicsAll employees to complete year-on-year Global Code of Conduct certification and mandatory ethics training
Our Global Code of Conduct sets out the ethical principles that underpin our values and the way we do business. It also provides guidance on how to apply these principles in everything we do.
During the year, 100% of our managers have certified that they have access to, understand and will comply with our Global Code of Conduct. Our ethics training continued to require managers to lead ethical discussions around dilemmas with their teams. During 2015, 97% of employees completed dilemma-based training.
Energy Reduce energy use in our operations and facilities by 30%, normalised by revenue, by 2020
(excluding product test and development)
Understanding our energy use helps us to identify inefficiency and opportunities for improvement across our global operations and activities. Upgrading existing facilities and investing in energy efficient technology helps us to reduce energy consumption and cost.
We continue to invest in energy efficient technology to reduce our energy consumption and cost. Our energy use in 2015 was 112 MWh/£m. This represents a decrease of 3% compared to 2014. We have invested in upgrading lighting systems, variable speed drives and voltage optimisation. We have also introduced more efficient cooling systems.
GHG emissions4 Reduce greenhouse gas (GHG) emissions in our operations and facilities by 50%, absolute, by 2025
(excluding product test and development)
Investing in renewable energy sources and other opportunities to reduce our GHG emissions reduces cost and mitigates risk associated with energy price volatility.
Our total GHG emissions for 2015, excluding product test and development, was 455 ktCO2e. This represents an 8% reduction from 2014. We continue to drive energy efficiency and have developed a number of low carbon and renewable energy projects across our global facilities. These include combined heat and power, tri-generation power systems and solar.
WasteReduce total solid and liquid waste in our operations and facilities by 25%, normalised by revenue, by 2020
We recognise that improving the environmental performance of our operations contributes to profitable growth. The four principal waste streams that contribute to our waste production are: recyclable solid wastes; liquid wastes sent for disposal; recyclable metals; and solid wastes sent for landfill.
We have seen a modest reduction in the amount of waste that we dispose of from our sites. Our total solid and liquid waste, normalised by revenue, was 4.31 t/£m in 2015. This represents a 3% reduction compared to 2014. New programmes launched in 2015 and continuing into 2016 are expected to accelerate waste reduction across our global operations.
RecyclingZero waste to landfill in our operations and facilities, by 2020
(excluding hazardous waste)
We are committed to both increasing our recycling rates and achieving zero waste to landfill from our manufacturing and office facilities. We are concentrating on the recycling of metals and packaging. Hazardous waste will continue to be managed in a safe and controlled manner.
The amount of waste sent to landfill has increased from 6,700 tonnes in 2014 to 7,200 tonnes in 2015. This is due in part to an increase in waste from our Power Systems business and improved waste reporting across the Group. Since 2009, we have reduced our waste to landfill by 3,000 tonnes and remain confident that more sites will achieve zero waste to landfill.
Safety Reduce total reportable injury (TRI) rate to 0.3 per 100 employees by 2020, to achieve first quartile performance
We are dedicated to providing a safe and healthy place of work for all our employees, contractors and visitors to our facilities and wherever they may work on our behalf.
Our TRI rate deteriorated in 2015 to 0.82, compared to 0.64 in 2014. This is primarily due to the inclusion of Power Systems data and improved reporting of safety incidents across the Group. We continue to focus our improvement programmes on high consequence activities in accordance with our risk profile, for example electrical safety and process safety management.
SuppliersAll suppliers aligned to our own ambitions: all suppliers agree adherence to the Global Supplier Code of Conduct by 2016
Our Global Supplier Code of Conduct sets out the minimum standards of behaviour and practices we require of our suppliers. We work to align them to our own ambitions in ethics, and support suppliers in managing their energy and waste, and in completing submissions to the CDP.
We released a revision to our Global Supplier Code of Conduct at the start of 2015. Our terms of business now include agreement to the Code, which makes our compliance expectations clear. 75% of our suppliers have now contractually agreed adherence. We plan to launch strategic supplier monitoring programmes in 2016.
Certi�cation Training
Ethics employee certi�cation and training (% of employees)2
2014baseline
20202015 2016 2017 2018 2019
100
0255075
Energy use (MWh/£m)3
2014baseline
2020target
2015 2016 2017 2018 201902040
1201008060
2014baseline
2015 2016 2017 2018 20202019
Absolute GHG emissions (ktCO2e)3
2025target
500
0100200300400
Total solid and liquid waste (t/£m)3
2014baseline
2020target
2015 2016 2017 2018 2019
5
01234
Waste to land�ll (000 tonnes)3
2014baseline
2015 2016 2017 2018 2019 2020target
8
0246
2014baseline
2015 2016 2017 2018 2019
TRI rate (per 100 employees)3
2020target
Rest of GroupPower Systems
00.250.500.751.0
2015
2016target
0 20 40 60 80 100
Suppliers agreed adherence to the Global Supplier Code of Conduct (%)
2 2015 certification by managers only3 2014 data has been restated to reflect the inclusion
of Power Systems4 Regulatory GHG emissions data detailed on page 61
READ MORE AT ROLLS-ROYCE.COM

KEY PERFORMANCE INDICATORS
Description Why we measure it How we have performed
Order book
+4%The order book provides an indicator of future business. We measure it at constant exchange rates and list prices and include both firm and announced orders. In Civil Aerospace, it is common for a customer to take options for future orders in addition to firm orders placed. Such options are excluded from the order book. In Defence Aerospace, long-term programmes are often ordered for only one year at a time. In such circumstances, even though there may be no alternative engine choice available to the customer, only the contracted business is included in the order book. Conservatively, we only include the first seven years’ revenue of long-term aftermarket contracts.
The order book grew by £2.7bn. An increase of £3.8bn in Civil Aerospace was offset by a reduction of £0.4bn in Marine, reflecting the current weak market conditions.
£bn
62.2 60.1
71.6 73.7 76.4
2011 2012 2013 2014 2015
Order intake
-4%Order intake is a measure of new business secured during the year and represents new firm orders, adjusted for the movement in the announced order book between the start and end of the period. Any orders which were recorded in previous periods and which are subsequently cancelled, reducing the order book, are included as a reduction to intake. We measure order intake at constant exchange rates and list prices and, consistent with the order book policy of recording the first seven years’ revenue of long-term aftermarket contracts, include the addition of the following year of revenue on long-term aftermarket contracts.
An increase of £0.9bn in Civil Aerospace order intake was offset by weaker intake in Defence Aerospace and Marine.
£bn
16.3 16.1
26.9
19.4 19.0 18.2
2011 2012 2013 2014 2014 2015
inc E
nerg
y
exc E
nerg
y
Underlying revenue
-4%-1% excluding FX
Monitoring of revenue provides a measure of business growth. Underlying revenue is used as it reflects the impact of our FX hedging policy by valuing foreign currency revenue at the actual exchange rates achieved as a result of settling FX contracts. This provides a clearer measure of the year-on-year trend.
The reduction reflects a 9% reduction in OE revenue, offset by a 3% increase in services revenue. Marine revenue fell by 23%, reflecting the weak market conditions.
£m
11,27712,209
15,50514,588 13,86413,354
2011 2012 2013 2014 2014 2015
inc E
nerg
y
exc E
nerg
y
Net R&D expenditure as a proportion of underlying revenue
6.2%
This measure reflects the need to generate current returns as well as to invest for the future. We measure R&D as the self-funded expenditure before both amounts capitalised in the year and amortisation of previously-capitalised balances. We expect to spend approximately 5% of underlying revenues on R&D although this proportion will fluctuate depending on the stage of development of current programmes. We expect this proportion will reduce modestly over the medium term.
The increase is largely due to changes in net capitalisation, reflecting the phasing of new Civil Aerospace programmes, in particular the Trent XWB-84 and the Trent 1000 TEN.
%
4.6 4.7 4.8
5.8 5.9 6.2
2011 2012 2013 2014 2014 2015
inc E
nerg
y
exc E
nerg
y
Financial performance indicators are shown below. Other non-financial performance indicators are shown in the Sustainability section on pages 48 and 49.
50 Rolls-Royce plc Annual Report 2015
Strategic Report / Chief Executive’s review Key performance indicators

Non-financial KPIsAs we undertake significant restructuring, reorganisation and transformation, it is imperative that we do not lose focus on our customers, and that we ensure our employees are fully engaged in the transformation. So for 2016, we are introducing two non-financial measures to the Annual Performance Related Award, relating to customers and employees. In line with our remuneration policy, financial performance will still be required for any payout, as the non-financial measures will be subject to achieving a profit before taxation threshold.
Description How performance is measured
Customer satisfaction This is measured by the percentage of ‘on-time to purchase order’ and includes measures for new equipment, spare parts, equipment repair and overhaul. This is tracked Group-wide in our scheduling and order fulfilment system.
Employee engagement This is measured through our Employee Opinion Survey which produces a composite engagement score. The targets will be based on absolute scores.
Description Why we measure it How we have performed
Capital expenditure as a proportion of underlying revenue
3.7%
To deliver on its commitments to customers, the Group invests significant amounts in its infrastructure. All proposed investments are subject to rigorous review to ensure that they are consistent with forecast activity and will provide value for money. We measure annual capital expenditure as the cost of property, plant and equipment acquired during the period and, over the medium term, expect a proportion of around 4%.
Expenditure reduced to £494m (2014: £668m) principally reflecting the major investment in Civil Aerospace facilities nearing completion.
%
4.1 4.04.4 4.6 4.7
3.7
2011 2012 2013 2014 2014 2015
inc E
nerg
y
exc E
nerg
y
Underlying profit before financing
-11%We measure underlying profit before financing on a basis that shows the economic substance of the Group’s hedging strategies in respect of the transactional exchange rate and commodity price movements. In particular: (a) revenues and costs denominated in US dollars and euros are presented on the basis of the exchange rates achieved during the year; (b) similar adjustments are made in respect of commodity derivatives; and (c) consequential adjustments are made to reflect the impact of exchange rates on trading assets and liabilities and long-term contracts on a consistent basis.
The reduction reflects the reduction in revenues and the Group’s high level of fixed costs, which the transformation programme is addressing.
£m
2011 2012 2013 2014 2014 2015
1,206
1,490
1,8321,678 1,681
1,492
inc E
nerg
y
exc E
nerg
y
Free cash flow
£166mIn a business requiring significant investment, we monitor cash flow to ensure that profitability is converted into cash generation, both for future investment and as a return to shareholders. We measure free cash flow as the movement in net funds/debt during the year, before movements arising from payments to shareholders, acquisitions and disposals, and FX.
The reduction reflects the lower profits and the utilisation of provisions.
£m
2011 2012 2013 2014 2014 2015
543 550
738
244
437
166
inc E
nerg
y
exc E
nerg
y
Average cash is no longer being monitored as a key performance indicator, as the focus is now on the free cash flow.
Rolls-Royce plc Annual Report 2015 51
Strategic Report
Chief Executive’s review / Key performance indicators

PRINCIPAL RISKSchallenge by the Executive Leadership Team (ELT) and the Board during their risk reviews. This includes monitoring the status of mitigation actions, adequacy of controls and any incidents that have occurred since the last review. Risks are also captured during the strategy and business planning activities to inform the development of the principal risks.
The Board, assisted by the ELT, has carried out a robust assessment of, and reviewed our appetite for, the principal risks facing the Group. These include those that threaten the business model, future performance, solvency and liquidity. These reviews have been complemented by financial scenario modelling of our principal risks.
The Board, or the most appropriate Board committee, undertakes periodic in-depth reviews of our principal risks in which it assesses our material controls and the effectiveness of our risk management and mitigation activities.
Business units and functions are accountable for identifying and managing risk in line with the Group risk management policy. Business continuity plans are in place to mitigate continuity risks.
The Group’s enterprise risk team, led by the Director of Risk, is responsible for disseminating risk policy and processes and co-ordinating the effective operation of the RMS. Progress of actions to mitigate risks and the adequacy of risk controls are also now regularly reviewed by the sector audit committees.
Joint ventures constitute an increasingly large part of the Group’s activities. Responsibility for risk and internal control in joint ventures lies with the managers of those operations. We seek
to exert influence over such joint ventures through board representation. Management and internal audit regularly review the activities of these joint ventures.
The Board is aware that the effectiveness of risk management is highly dependent on behaviours, as a good process does not automatically lead to a good outcome. Our ethics and compliance improvement programme, aimed at securing compliance with our ethical standards, and the Global Code of Conduct are reinforcing the values and behaviours required, which in turn will continue to strengthen our risk management culture.
Principal risksDuring the year, the Board and ELT focused on the principal risks and the actions and controls in place to manage them.
This involved: discussing changes to the risks; reviewing the risk indicators for principal risks; and hearing from management about how risks will be managed.
This ongoing review of risks has resulted in a further principal risk being added this year: talent and capability. This risk has been added to reflect the significant transformation agenda ahead and our future growth requirements and plans.
Management of principal risksOur risk framework ensures that risks are identified, managed and communicated at every level of the Group.
Identify principal risks
(PRs)
Impact of PRs on long-
term viability
Monitor mitigation and control of PRs
Governance of PRs
Set risk appetite for PRs Reporting
Assess effectiveness of risk management system (RMS)
Risk managementRisk management is built into our daily activities and is an integral part of how we work: from our engineering design, through to engine production, servicing and how we run our operations.
The Board is responsible for the Group’s risk management and internal control system and reviewing its effectiveness. The system is designed to identify and manage, rather than eliminate, the risk of failure to achieve business objectives and to provide reasonable but not absolute assurance against material misstatement or loss.
Our risk management system (RMS) helps us make better decisions and to deal with problems if they occur. It is implemented through: a Group-wide framework mandated in the Group risk management policy; a network of trained risk management facilitators; and a software tool.
In 2015, we performed a comprehensive review of our RMS and are implementing a programme of work to enhance our RMS which will continue to be embedded throughout 2016. This activity is sponsored by the General Counsel and Chief Financial Officer and is regularly reviewed by the Audit Committee. The enhancements touch all areas of our RMS including: categorisation, governance, operating model, reporting and infrastructure.
Our RMS is designed so that principal risks can be identified from multiple sources. Key bottom-up risks are identified by businesses and functions and the detail of risks that meet the Group threshold are subject to review and
52 Rolls-Royce plc Annual Report 2015
Strategic Report / Chief Executive’s review Principal risks

Risk or uncertainty and potential impact How we manage itStrategic priorities
Product failureProduct not meeting safety expectations, or causing significant impact to customers or the environment through failure in quality control.
• Embedding and operating a safety-first culture.• Applying our engineering design and validation process from initial design through production
and into service.• The Safety & Ethics Committee reviewing the scope and effectiveness of the Group’s product
safety policies to ensure that they operate to the highest industry standards.• Operating a safety management system (SMS), governed by the product safety review board,
and subject to continual improvement based on experience and industry best practice. Product safety training is an integral part of our SMS.
• Improving our supply chain quality.• Crisis management team jointly chaired by the Group President and the General Counsel.This principal risk is subject to review by the Safety & Ethics Committee.
1
2
3
Business continuityBreakdown of external supply chain or internal facilities that could be caused by destruction of key facilities, natural disaster, regional conflict, insolvency of a critical supplier or scarcity of materials which would reduce the ability to meet customer commitments, win future business or achieve operational results.
• Continued investment in adequate capacity and modern equipment and facilities.• Identifying and assessing points of weakness in our internal and external supply chain,
our IT systems and our people skills.• Selecting and developing stronger suppliers.• Developing dual sources or dual capability.• Developing and testing incident management and business continuity plans.• Crisis management team jointly chaired by the Group President and the General Counsel.• Customer excellence centres providing improved response to supply chain disruption.This principal risk is subject to review by the Audit Committee.
2
3
Competitive positionThe presence of large, financially strong competitors in the majority of our markets means that the Group is susceptible to significant price pressure for original equipment or services, even where our markets are mature, or the competitors are few. Our main competitors have access to significant government funding programmes, as well as the ability to invest heavily in technology and industrial capability.
• Accessing and developing key technologies and service offerings which differentiate us competitively (see Engineering and innovation on page 16).
• Focusing on being responsive to our customers and improving the quality, delivery and reliability of our products and services.
• Partnering with others effectively.• Driving down cost and improving margins (see Chief Executive’s review on page 10).• Protecting credit lines.• Investing in innovation, manufacturing and production, and continuing governance of
technology programmes (see Engineering and innovation on page 16.• Maintaining a strong balance sheet to enable access to cost-effective sources of third-party funding.• Understanding our competitors.This principal risk is subject to review by the Board.
1
2
3
Political riskGeopolitical factors that lead to an unfavourable business climate and significant tensions between major trading parties or blocs which could impact the Group’s operations. For example: explicit trade protectionism, differing tax or regulatory regimes, potential for conflict, or broader political issues.
• Where possible, locating our facilities and supply chain in countries with a low level of political risk and/or ensuring that we maintain dual capability.
• Diversifying global operations to avoid excessive concentration of risks in particular areas.• The international network of Rolls-Royce and its business units proactively monitoring
local situations.• Maintaining a balanced business portfolio with high barriers to entry and a diverse customer
base (see Chief Executive’s review on page 6).• Proactively influencing regulation where it affects us.This principal risk is subject to review by the Board.
2
Major programme deliveryFailure to deliver a major programme on time, within budget, to specification, or technical performance falling significantly short of customer expectations, or not delivering the planned business benefits, would have potentially significant adverse financial and reputational consequences, including the risk of impairment of the carrying value of the Group’s intangible assets and the impact of potential litigation.
• Major programmes are subject to Board approval (see Additional financial information on page 151).• Reviewing major programmes at levels and frequencies appropriate to their criticality
and performance, against key financial and non-financial deliverables and potential risks throughout the programme’s life cycle (see Additional financial information on page 151).
• Conducting technical audits at pre-defined points which are performed by a team that is independent from the programme.
• Requiring programmes to address the actions arising from reviews and audits and monitoring and controlling progress through to closure.
• Applying knowledge management principles to provide benefit to current and future programmes.This principal risk is subject to review by the Board.
1
2
1 Engineering excellence 2 Operational excellence 3 Capturing aftermarket value
References to committees are to committees of Rolls-Royce Holdings plc
Rolls-Royce plc Annual Report 2015 53
Strategic Report
Chief Executive’s review / Principal risks
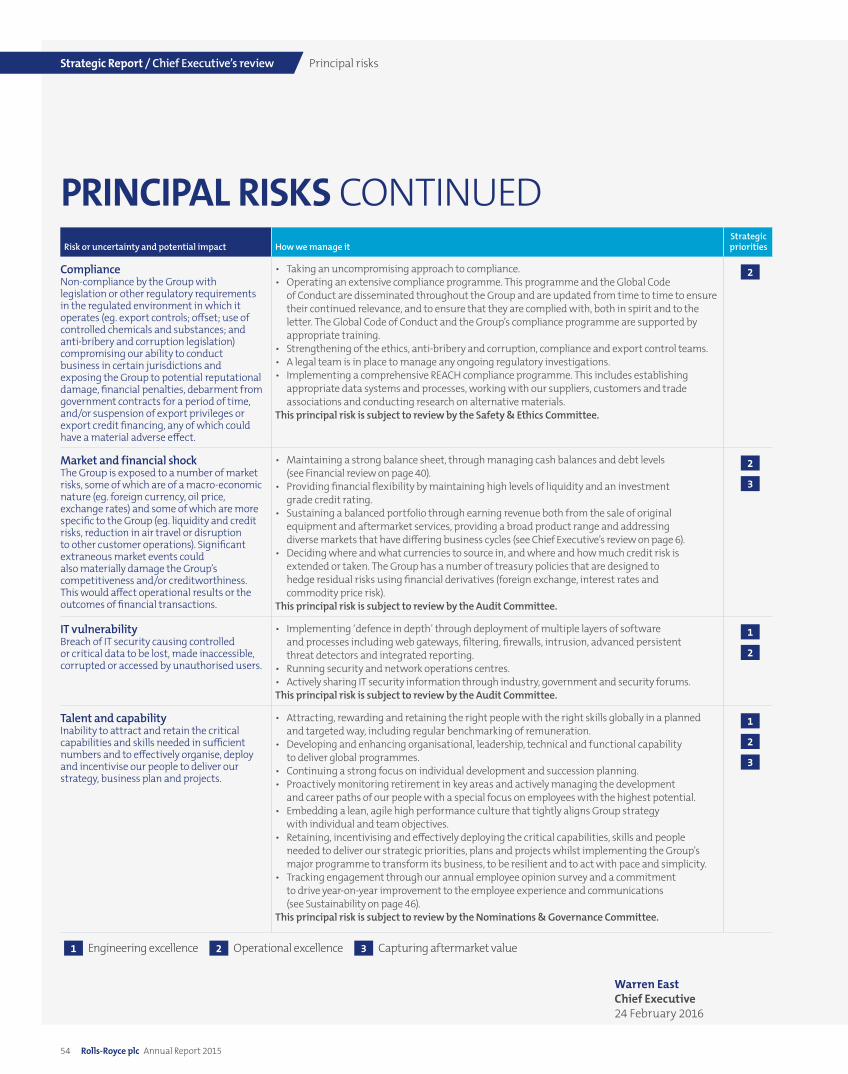
Risk or uncertainty and potential impact How we manage itStrategic priorities
Compliance Non-compliance by the Group with legislation or other regulatory requirements in the regulated environment in which it operates (eg. export controls; offset; use of controlled chemicals and substances; and anti-bribery and corruption legislation) compromising our ability to conduct business in certain jurisdictions and exposing the Group to potential reputational damage, financial penalties, debarment from government contracts for a period of time, and/or suspension of export privileges or export credit financing, any of which could have a material adverse effect.
• Taking an uncompromising approach to compliance.• Operating an extensive compliance programme. This programme and the Global Code
of Conduct are disseminated throughout the Group and are updated from time to time to ensure their continued relevance, and to ensure that they are complied with, both in spirit and to the letter. The Global Code of Conduct and the Group’s compliance programme are supported by appropriate training.
• Strengthening of the ethics, anti-bribery and corruption, compliance and export control teams.• A legal team is in place to manage any ongoing regulatory investigations.• Implementing a comprehensive REACH compliance programme. This includes establishing
appropriate data systems and processes, working with our suppliers, customers and trade associations and conducting research on alternative materials.
This principal risk is subject to review by the Safety & Ethics Committee.
2
Market and financial shockThe Group is exposed to a number of market risks, some of which are of a macro-economic nature (eg. foreign currency, oil price, exchange rates) and some of which are more specific to the Group (eg. liquidity and credit risks, reduction in air travel or disruption to other customer operations). Significant extraneous market events could also materially damage the Group’s competitiveness and/or creditworthiness. This would affect operational results or the outcomes of financial transactions.
• Maintaining a strong balance sheet, through managing cash balances and debt levels (see Financial review on page 40).
• Providing financial flexibility by maintaining high levels of liquidity and an investment grade credit rating.
• Sustaining a balanced portfolio through earning revenue both from the sale of original equipment and aftermarket services, providing a broad product range and addressing diverse markets that have differing business cycles (see Chief Executive’s review on page 6).
• Deciding where and what currencies to source in, and where and how much credit risk is extended or taken. The Group has a number of treasury policies that are designed to hedge residual risks using financial derivatives (foreign exchange, interest rates and commodity price risk).
This principal risk is subject to review by the Audit Committee.
2
3
IT vulnerability Breach of IT security causing controlled or critical data to be lost, made inaccessible, corrupted or accessed by unauthorised users.
• Implementing ‘defence in depth’ through deployment of multiple layers of software and processes including web gateways, filtering, firewalls, intrusion, advanced persistent threat detectors and integrated reporting.
• Running security and network operations centres.• Actively sharing IT security information through industry, government and security forums.This principal risk is subject to review by the Audit Committee.
1
2
Talent and capability Inability to attract and retain the critical capabilities and skills needed in sufficient numbers and to effectively organise, deploy and incentivise our people to deliver our strategy, business plan and projects.
• Attracting, rewarding and retaining the right people with the right skills globally in a planned and targeted way, including regular benchmarking of remuneration.
• Developing and enhancing organisational, leadership, technical and functional capability to deliver global programmes.
• Continuing a strong focus on individual development and succession planning.• Proactively monitoring retirement in key areas and actively managing the development
and career paths of our people with a special focus on employees with the highest potential.• Embedding a lean, agile high performance culture that tightly aligns Group strategy
with individual and team objectives.• Retaining, incentivising and effectively deploying the critical capabilities, skills and people
needed to deliver our strategic priorities, plans and projects whilst implementing the Group’s major programme to transform its business, to be resilient and to act with pace and simplicity.
• Tracking engagement through our annual employee opinion survey and a commitment to drive year-on-year improvement to the employee experience and communications (see Sustainability on page 46).
This principal risk is subject to review by the Nominations & Governance Committee.
1
2
3
1 Engineering excellence 2 Operational excellence 3 Capturing aftermarket value
PRINCIPAL RISKS CONTINUED
Warren EastChief Executive 24 February 2016
54 Rolls-Royce plc Annual Report 2015
Strategic Report / Chief Executive’s review Principal risks
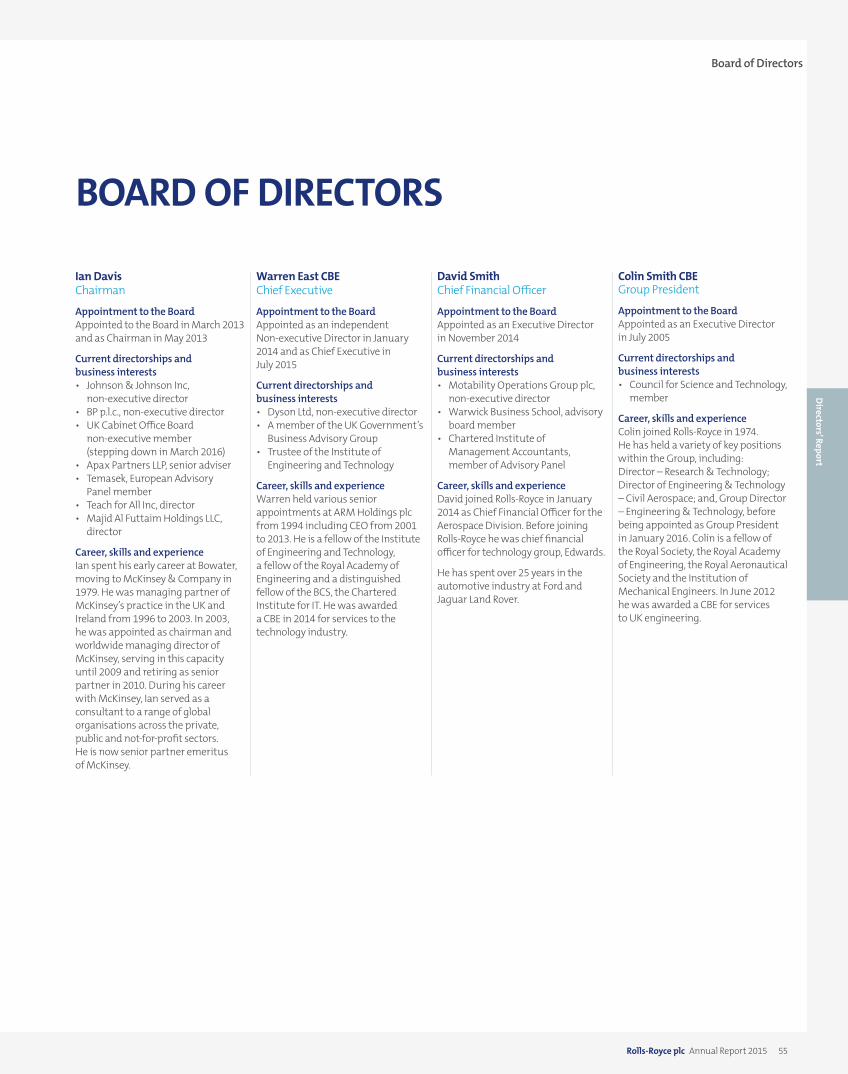
BOARD OF DIRECTORS
Rolls-Royce plc Annual Report 2015 55
Directors’ Report
Board of Directors
Ian DavisChairman
Appointment to the Board Appointed to the Board in March 2013 and as Chairman in May 2013
Current directorships and business interests • Johnson & Johnson Inc,
non-executive director• BP p.l.c., non-executive director• UK Cabinet Office Board
non-executive member (stepping down in March 2016)
• Apax Partners LLP, senior adviser• Temasek, European Advisory
Panel member• Teach for All Inc, director• Majid Al Futtaim Holdings LLC,
director
Career, skills and experience Ian spent his early career at Bowater, moving to McKinsey & Company in 1979. He was managing partner of McKinsey’s practice in the UK and Ireland from 1996 to 2003. In 2003, he was appointed as chairman and worldwide managing director of McKinsey, serving in this capacity until 2009 and retiring as senior partner in 2010. During his career with McKinsey, Ian served as a consultant to a range of global organisations across the private, public and not-for-profit sectors. He is now senior partner emeritus of McKinsey.
Warren East CBEChief Executive
Appointment to the Board Appointed as an independent Non-executive Director in January 2014 and as Chief Executive in July 2015
Current directorships and business interests• Dyson Ltd, non-executive director• A member of the UK Government’s
Business Advisory Group• Trustee of the Institute of
Engineering and Technology
Career, skills and experienceWarren held various senior appointments at ARM Holdings plc from 1994 including CEO from 2001 to 2013. He is a fellow of the Institute of Engineering and Technology, a fellow of the Royal Academy of Engineering and a distinguished fellow of the BCS, the Chartered Institute for IT. He was awarded a CBE in 2014 for services to the technology industry.
David SmithChief Financial Officer
Appointment to the BoardAppointed as an Executive Director in November 2014
Current directorships and business interests• Motability Operations Group plc,
non-executive director• Warwick Business School, advisory
board member• Chartered Institute of
Management Accountants, member of Advisory Panel
Career, skills and experienceDavid joined Rolls-Royce in January 2014 as Chief Financial Officer for the Aerospace Division. Before joining Rolls-Royce he was chief financial officer for technology group, Edwards.
He has spent over 25 years in the automotive industry at Ford and Jaguar Land Rover.
Colin Smith CBEGroup President
Appointment to the Board Appointed as an Executive Director in July 2005
Current directorships and business interests• Council for Science and Technology,
member
Career, skills and experienceColin joined Rolls-Royce in 1974. He has held a variety of key positions within the Group, including: Director – Research & Technology; Director of Engineering & Technology – Civil Aerospace; and, Group Director – Engineering & Technology, before being appointed as Group President in January 2016. Colin is a fellow of the Royal Society, the Royal Academy of Engineering, the Royal Aeronautical Society and the Institution of Mechanical Engineers. In June 2012 he was awarded a CBE for services to UK engineering.

BOARD OF DIRECTORS CONTINUED
56 Rolls-Royce plc Annual Report 2015
Directors’ Report / Board of Directors
Ruth CairnieIndependent Non-executive Director
Appointment to the Board Appointed as an independent Non-executive Director in September 2014
Current directorships and business interests• Associated British Foods plc,
non-executive director• Keller Group plc, non-executive
director • Rotterdam School of Management,
member of the advisory board• Cambridge University, finance
committee member
Career, skills and experience Ruth was executive vice president strategy and planning at Royal Dutch Shell Plc until 2014, before which she held a number of other senior international roles at Shell, including managing its global commercial fuels business from 2005 to 2011.
Ruth served on the boards of Shell Pakistan Ltd and joint venture companies in Germany and Thailand.
She also chairs the POWERful women initiative, supporting the progression of women to senior positions in the energy sector.
Lewis Booth CBESenior Independent Non-executive Director
Appointment to the Board Appointed as an independent Non-executive Director in May 2011
Current directorships and business interests • Mondelez International Inc,
non-executive director• Gentherm Inc., non-executive
director
Career, skills and experience Lewis is the former executive vice president and chief financial officer of Ford Motor Company, a position he held for over three years until his retirement from the company in April 2012. During his 34-year career at Ford he held a series of senior positions in Europe, Asia, Africa and the US. Lewis began his career with British Leyland, before joining Ford in 1978. He was awarded a CBE in June 2012 for services to the UK automotive and manufacturing industries.
Sir Frank ChapmanIndependent Non-executive Director
Appointment to the Board Appointed as an independent Non-executive Director in November 2011
Current directorships and business interests• Myeloma UK, vice chairman
Career, skills and experience Sir Frank has worked in the oil & gas industry for 38 years including appointments within Royal Dutch Shell plc and BP p.l.c. He was chief executive of BG Group plc for 12 years until December 2012 and chairman of Golar LNG Ltd from 2014 to 2015. Sir Frank is a fellow of the Royal Academy of Engineering, the Institution of Mechanical Engineers and the Energy Institute. He was knighted in 2011 for services to the oil & gas industry.
Dame Helen AlexanderIndependent Non-executive Director
Appointment to the Board Appointed as an independent Non-executive Director in September 2007
Current directorships and business interests • UBM plc, chairman • Huawei Technologies (UK) Co.
Limited, non-executive director• Bain Capital, senior adviser • EDF Energy’s Stakeholder Advisory
Panel, member• University of Southampton,
chancellor• She is also involved in not-for-profit
organisations in media and the arts
Career, skills and experience Dame Helen was chief executive of the Economist Group until 2008, having joined the company in 1985, and was managing director of the Economist Intelligence Unit from 1993 to 1997. She was president of the CBI from 2009 to 2011; she has also been chairman of Incisive Media and Port of London Authority, and a non-executive director of Northern Foods plc, BT Group plc and Centrica plc. She was awarded a DBE in 2011 for services to business.

Board members by gender Tenure of Non-executive DirectorsBalance of the Board Nationalities of Directors*
Male 10 Female 4
Executive Directors 3 Non-executive Directors 11
0 - 3 years 6 3 - 6 years 3 6 - 9 years 2
British 11 German 1 Singaporean 1 Australian 1
* According to the Company’s Articles of Association, at least 50% of all Directors must be British citizens
Rolls-Royce plc Annual Report 2015 57
Directors’ Report
Board of Directors
Lee Hsien YangIndependent Non-executive Director
Appointment to the Board Appointed as an independent Non-executive Director in January 2014
Current directorships and business interests• General Atlantic LLC and associated
funds, special adviser• Civil Aviation Authority of
Singapore, chairman• The Islamic Bank of Asia Private
Limited, chairman• The Australian and New Zealand
Banking Group Ltd, director• Lee Kuan Yew School of Public Policy,
member of the Board of governors• INSEAD SE Asia Council, president• Singapore Exchange Ltd, director• Capital International Inc,
consultant to advisory board
Career, skills and experience Hsien Yang was chief executive of Singapore Telecommunications Limited for 12 years until 2007. He served as chairman and non-executive director of Fraser and Neave Limited from 2007 until February 2013.
John McAdam Independent Non-executive Director
Appointment to the Board Appointed as an independent Non-executive Director in February 2008
Current directorships and business interests• J. Sainsbury plc, senior independent
director • Rentokil Initial plc, chairman• United Utilities Group PLC,
chairman
Career, skills and experienceJohn was the chief executive of ICI plc until ICI’s acquisition by Akzo Nobel in 2008. He held a number of positions at Unilever, within its Birds Eye Walls, Quest International and Unichema International businesses and is a former non-executive director of Severn Trent plc and Sara Lee Corporation.
Alan DaviesIndependent Non-executive Director
Appointment to the Board Appointed as an independent Non-executive Director in November 2015
Current directorships and business interests• Rio Tinto Diamonds and Minerals
division, chief executive
Career, skills and experience Alan joined Rio Tinto in 1997 and has held a number of senior positions in Australia, London and the US, predominantly in Rio Tinto’s iron ore product group where he has served as CFO, managing director global development and as president international operations. Alan is a fellow of the Institute of Chartered Accountants in Australia.
Irene DornerIndependent Non-executive Director
Appointment to the Board Appointed as an independent Non-executive Director in July 2015
Current directorships and business interests• OUTleadership Advisory Board,
member• South East Asia Rainforest Research
Partnership, trustee
Career, skills and experience Irene was CEO and president of HSBC, US, until December 2014 where she was responsible for all of HSBC’s operations in the US and played a key role in strengthening the financial institution’s risk processes. During a 29-year career at HSBC, she held a number of international roles including as the first woman to lead HSBC in Malaysia and launching its Islamic banking unit.
Irene was a consultant at PwC until February 2016. She is a fellow of St. Anne’s College, Oxford.

EXECUTIVE LEADERSHIP TEAMThe Executive Leadership Team is the executive forum in which the Group’s senior leaders come together to communicate, review and agree on issues and actions of Group-wide significance, and assist the Chief Executive in the performance of his duties.
Warren East CBEChief Executive
Colin Smith CBEGroup President
David SmithChief Financial Officer
Chris BarkeyGroup Director – Engineering & Technology
Marion BlakeyPresident & CEO Rolls-Royce North America
Chris CholertonPresident – Defence Aerospace
Miles CowdryCorporate Development Director
Dr Ulrich DöhleCEO – Power Systems
Mark GregoryGeneral Counsel
Harry HoltGroup Operations Strategy Director (Transitional support) President – Nuclear
Mary HumistonGroup Human Resources Director
Mikael MakinenPresident – Marine
Eric SchulzPresident – Civil Aerospace
Lawrie HaynesExecutive (Transitional support)
Tony WoodExecutive (Transitional support)
BOARD OF DIRECTORS CONTINUED
58 Rolls-Royce plc Annual Report 2015
Directors’ Report / Board of Directors
Jasmin StaiblinIndependent Non-executive Director
Appointment to the BoardAppointed as an independent Non-executive Director in May 2012
Current directorships and business interests• Alpiq Holding AG, CEO• Georg Fischer AG, non-executive
director• Federal Institute of Technology,
the ETH Domain, board member
Career, skills and experienceJasmin is the CEO of Alpiq Holding AG. She held a number of senior positions at ABB Switzerland Ltd, a subsidiary of the ABB Group, culminating in her serving as CEO of ABB Switzerland Ltd until December 2012. She has lived and worked in Switzerland, Sweden and Australia.
Pamela ColesCompany Secretary
AppointmentAppointed as Company Secretary in October 2014
Career, skills and experiencePamela has been a fellow of the Institute of Chartered Secretaries and Administrators since 1997, and is an expert in governance and company law. She has held a variety of company secretary roles throughout her career. She joined Rolls-Royce from Centrica plc, where she was head of secretariat. Pamela’s previous roles also include group company secretary and a member of the executive committee at The Rank Group plc and company secretary & head of legal at RAC plc.
The names of the directors who held office during the year are set out on pages 55 to 58, with the exception of James Guyette and John Neill who left the Company on 8 May 2015 and John Rishton who left the Company on 2 July 2015.
At 31 December 2015, all the directors were also directors of Rolls-Royce Holdings plc, the ultimate parent company. As directors of the ultimate parent company, there is no requirement to disclose their remuneration or their interests in the shares of Rolls-Royce group companies in this Directors’ Report, as they are included in the Annual Report of Rolls-Royce Holdings plc.
Sir Kevin Smith CBEIndependent Non-executive Director
Appointment to the BoardAppointed as an independent Non-executive Director in November 2015
Current directorships and business interests• Unitas Capital, senior adviser
Career, skills and experienceSir Kevin joined Unitas Capital in 2012 and served as partner and chairman of its operating advisor group until October 2015. He was chief executive officer of GKN plc until 31 December 2011, having led GKN’s Aerospace division from 1999 to 2003. Before joining GKN, he spent nearly 20 years with British Aerospace (BAe plc), becoming group managing director of BAe’s New Business division. Sir Kevin served as a non-executive director of Scottish and Southern Energy plc between June 2004 and July 2008.
He was knighted in 2006 for services to industry and is a fellow of the University of Central Lancashire, The Royal Aeronautical Society and The Chartered Institute of Management.

INTERNAL CONTROL AND RISK MANAGEMENTThe Board’s responsibility for internal control and risk managementThe Board has overall responsibility to the shareholders for the Group’s system of internal control over its business and risk management processes and the risks identified through the risk management process.
In developing our internal governance framework we looked at how the Company’s risk management and internal control systems work together. As noted on page 52, these systems are designed to manage, rather than eliminate, the risk of failure to achieve objectives and so can only provide reasonable and not absolute assurance against material misstatement or loss. The Board has reviewed the effectiveness of the risk management and internal control systems, including controls in relation to the financial reporting process, for the year under review and to the date of this report.
The Group has a long-standing process for identifying risks and planning mitigating actions and for assessing the effectiveness of internal control. During 2015, as an enhanced model for representing the system was approved, comprising:
• entity-level controls covering leadership and direction from the top; and
• specific control activities, covering detailed process controls, and internal and external assurance activities.
The Board will continue routinely to challenge management in order to ensure that the system of internal control is constantly improving and remains fit for purpose. A major review of our risk management framework has been conducted over the past year and implementation is now underway.
This model was then populated and the operation and effectiveness of the controls rated. This commenced in 2015 and prioritised:
• entity-level controls;
• controls over principal risks as described on pages 52 to 54;
• controls over key risks and critical processes for each of the Group’s business; and
• core financial controls.
Work will continue during 2016 to complete the definition and documentation of the controls in the enhanced model.
Judgement is required in evaluating the risks facing the Group in achieving its objectives, in determining the risks that are considered acceptable, in determining the likelihood of those risks materialising, in identifying the Group’s ability to reduce the incidence and impact on the business of risks that do materialise, and in ensuring the costs of operating particular controls are proportionate to the benefit provided.
The Group is also using this standardisation of the internal control framework as an opportunity to improve the consistency of reporting, in particular from the Group’s smaller operations.
Particular attention was paid to internal controls over financial reporting and, mindful of the current business challenges the Group is facing.
Financial reportingThe Group has a comprehensive budgeting system with an annual budget approved by the Board. Revised forecasts for the year are reported at least quarterly. Actual results, at both a business and Group level, are reported monthly against budget and variances are kept under scrutiny. Since his appointment in November 2014, the Chief Financial Officer has undertaken an in-depth review of our management reporting and budgeting processes to ensure that they fully provide what we need, taking into account the size and shape of the Group and the structure of our operations.
Financial managers are required to acknowledge in writing that their routine financial reporting is based on reliable data and that results are properly stated in accordance with Group requirements. In addition, for annual reporting, business presidents and finance directors are required to confirm that their business has complied with the Group’s finance manual.
The Audit CommitteeRolls-Royce Holdings plc has an Audit Committee, whose key objective is assist the Board in ensuring the integrity of its financial statements. In addressing the key objective, the committee reviewed financial statements with both management and the external auditor, concentrating on:
Financial reporting• review financial statements, focusing on: – the appropriateness
of critical accounting policies, judgements and estimates and consistent application of those accounting policies;
• inclusion of appropriate disclosures; and
• compliance with relevant regulations.
Risk and control environment• assess the scope and effectiveness of the systems to identify,
manage and monitor financial and non-financial risks;
• assess the management of principal risks allocated to the committee: business continuity, market and financial shock and IT vulnerability;
• review the procedures for detecting, monitoring and managing the risk of fraud;
Rolls-Royce plc Annual Report 2015 59
Directors’ Report
Director’s Report / Internal control and risk management

• review the system of internal control over the business processes and the risks identified through the risk management process.
Internal audit• review the scope, resources, results and effectiveness of internal
audit.
External auditors• oversee the relationship with the external auditor, reviewing the
effectiveness of the external audit process and making recommendations to the Board for the external auditor’s appointment and fees.
The Rolls-Royce Holdings plc Ethics Committee and the referral the Serious Fraud OfficeRegulatory investigationsWe previously reported that the Serious Fraud Office (SFO) had begun a formal investigation. The Group is continuing to cooperate with the authorities in the UK, US and elsewhere. The Ethics Committee received regular updates on the regulatory investigations. As the investigations are still ongoing we are unable to give any further details or a timescale for when they will conclude.
Throughout 2015, the Company’s authorised share capital was £400 million, comprising 2,000,000,000 ordinary shares of 20p. On 31 December 2015, there were 1,630,996,508 ordinary shares in issue.
Each member has one vote for each ordinary share held. Holders of ordinary shares are entitled to receive the Company’s
Disciplinary proceedings under the Global Code of Conduct (Global Code)If an employee is found to have acted in breach of the Company’s Global Code, the Group takes appropriate action to address that breach. That action may include giving a disciplinary warning, imposing another penalty or, ultimately, terminating employment in the most serious of cases. In 2015, there were 33 employees whose employment ended for reasons relating to breaches of the Global Code.
Ethics and compliance improvement programme and Lord Gold’s reviewLord Gold was engaged in 2013 to provide independent assessment and guidance to assist the Company in improving its ethics and compliance culture. In December 2014, Lord Gold issued a second interim report and recommendations on the results from his detailed review. The Group has been implementing these recommendations in 2015 through its ethics and compliance improvement programme under the committee’s oversight, and has continued to make good progress. Lord Gold attended three meetings of the committee during the year. We discussed the results of his review and his observations, including insights from focus groups held with a mix of employees in different countries.
The size, structure and skills of the risk team were kept under review during the year with regard to required resourcing to deliver and maintain the appropriate level of focus.
Annual Report; attend and speak at general meetings of the Company; to appoint one or more proxies or, if they are corporations, corporate representatives; and to exercise voting rights.
The ordinary shares are not listed.
INTERNAL CONTROL AND RISK MANAGEMENT CONTINUED
SHARE CAPITAL
60 Rolls-Royce plc Annual Report 2015
Directors’ Report / Share capital

Disclosures in the strategic reportThe Board has taken advantage of section 414C(11) of the Companies Act 2006 to include disclosures in the Strategic Report on:
page(s)
• disabled people and employee involvement; 47
• the future development, performance and position of the Group;
1 to 54
• the financial position of the Group; 40 to 45
• R&D activities; and 16
• the principal risks and uncertainties. 52 to 54
Political donationsIn line with its established policy, the Company does not make, and does not intend to make, donations to political parties within the normal meaning of the expression ‘political donations’. However, it is possible that certain activities undertaken by the Group may unintentionally fall within the broad scope of the provisions contained in the Companies Act 2006 (the Act).
During 2015, expenses incurred by Rolls-Royce North America Inc. (RRNA) in providing administrative support for the Rolls-Royce North America Political Action Committee (RRNA PAC) was US$45,021 (2014: US$52,690). PACs are a common feature of the US political system and are governed by the Federal Election Campaign Act.
The RRNA PAC is independent of the Group and independent of any political party. The RRNA PAC funds are contributed voluntarily by employees and the Group cannot affect how they are applied although, under US law, the business expenses are paid by the employer company (RRNA). Such contributions do not require authorisation by shareholders under the Act.
Greenhouse gas emissionsIn 2015, our total greenhouse gas (GHG) emissions from our facilities and processes, including product test and development, was 602 kilotonnes carbon dioxide equivalent (ktCO2e). This represents a decrease of 12% compared with 683 ktCO2e in 2014.
All figures exclude fugitive emissions of hydrofluorocarbons (HFCs) associated with air conditioning equipment. We are putting in place a system to be able to extract this data from records kept under the F-Gas regulations. We do not anticipate a material impact on our reported GHG emissions.
Total GHG emissions (ktCO2e) 2011 2012 2013 2014* 2015
Direct emissions – facilities, processes, product test and development (Scope 1)
218 219 241 231 242
Indirect emissions – facilities, processes, product test and development (Scope 2)
327 313 313 382 360
Total for facilities, processes, product test and development
545 532 554 683 602
Direct emissions – power generation to grid (Scope 1)
153 155 132
Indirect emissions – power generation to grid (Scope 2)
12 14 15
Total for facilities, processes, product test and development, and power generation to grid
719 852 749
Intensity ratio (total emissions normalised by revenue) for facilities, processes, product test and development, and power generation to grid (ktCO2e/£m)
0.048 0.062 0.055
* 2014 data has been restated to reflect the inclusion of greenhouse gas emissions data from Power Systems. Figures for prior years (2011 to 2013) do not include data from Power Systems and therefore are not directly comparable.
With the exceptions noted above, we have reported on all of the emission sources required under the Companies Act 2006 (Strategic Report and Directors Reports) Regulations 2013. These sources fall within our Consolidated Financial Statements. We do not have responsibility for any emission sources that are not included in our Consolidated Financial Statements.
We have used the GHG Protocol Corporate Accounting and Reporting Standard (revised edition) as of 31 December 2014, data gathered to fulfil our requirements under the Carbon Reduction Commitment (CRC) Energy Efficiency scheme and emission factors from the UK Government’s GHG Conversion Factors for Company Reporting 2015.
Further details on our methodology for reporting and the criteria used can be found within our Basis of Reporting, available to download from our website at rolls-royce.com.
OTHER STATUTORY INFORMATION
Rolls-Royce plc Annual Report 2015 61
Directors’ Report
Directors’ report / Other statutory information

BranchesWe are a global company and our activities and interests are operated through subsidiaries, branches of subsidiaries, joint ventures and associates which are subject to the laws and regulations of many different jurisdictions. Our subsidiaries and joint ventures are listed on pages 143 to 149.
Post balance sheet eventsThere have been no events affecting the Group since 31 December 2015 which need to be reflected in the 2015 Financial Statements.
Financial instrumentsDetails of the Group’s financial instruments are set out in note 16 to the Consolidated Financial Statements.
Responsibility statementsStatement of Directors’ responsibilities in respect of the Annual Report and the Financial statementsThe Directors, as listed on pages 55 to 58, are responsible for preparing the Annual Report and the Group and parent company financial statements in accordance with applicable law and regulations.
Company law requires the Directors to prepare Group and parent company financial statements for each financial year. Under that law they are required to prepare the Group financial statements in accordance with IFRS as adopted by the EU and applicable law and have elected to prepare the parent company financial statements in accordance with UK Accounting Standards and applicable law.
Under company law the Directors must not approve the financial statements unless they are satisfied that they give a true and fair view of the state of affairs of the Group and parent company and of their profit or loss for that period.
Related party transactionsRelated party transactions are set out in note 23 to the Consolidated Financial Statements.
Management reportThe Strategic Report and the Directors’ Report together are the management report for the purposes of Rule 4.1.8R of the Financial Conduct Authority’s (FCA’s) Disclosure Rules and Transparency Rules.
In preparing each of the Group and parent company financial statements, the Directors are required to:
• select suitable accounting policies and then apply them consistently;
• make judgements and estimates that are reasonable and prudent;
• for the Group financial statements, state whether they have been prepared in accordance with IFRS as adopted by the EU;
• for the parent company financial statements, state whether applicable UK Accounting Standards have been followed, subject to any material departures disclosed and explained in the parent company financial statements; and
• prepare the financial statements on the going concern basis unless it is inappropriate to presume that the Group and the parent company will continue in business.
OTHER STATUTORY INFORMATION CONTINUED
DIRECTORS’ REPORT AND FINANCIAL STATEMENTS
62 Rolls-Royce plc Annual Report 2015
Directors’ Report / Directors’ Report and Financial Statements

The Directors are responsible for keeping adequate accounting records that are sufficient to show and explain the parent and Group’s transactions and disclose with reasonable accuracy at any time the financial position of the parent company and enable them to ensure that its financial statements comply with the Companies Act 2006. They have general responsibility for taking such steps as are reasonably open to them to safeguard the assets of the Group and to prevent and detect fraud and other irregularities.
The Directors are responsible for the maintenance and integrity of the corporate and financial information included on the Group’s website. Legislation in the UK governing the preparation and dissemination of financial statements may differ from legislation in other jurisdictions.
Responsibility statements under the disclosure and transparency rulesEach of the persons who is a Director at the date of approval of this report confirms that to the best of his or her knowledge:
i) each of the Group and parent company financial statements, prepared in accordance with IFRS and UK Accounting Standards respectively, gives a true and fair view of the assets, liabilities, financial position and profit or loss of the Company and the undertakings included in the consolidation taken as a whole;
ii) the Strategic Report on pages 1 to 54 and Directors’ Report on pages 55 to 63 and pages 151 and 152 include a fair review of the development and performance of the business and the position of the Company and the undertakings included in the consolidation taken as a whole, together with a description of the principal risks and uncertainties that they face; and
iii) the Annual Report, taken as a whole, is fair, balanced and understandable and provides the information necessary for shareholders to assess the Group’s position and performance, business model and strategy.
Going concernThe going concern assessment considers whether it is appropriate to prepare the financial statements on a going concern basis.
As described on page 152, the Group meets its funding requirements through a mixture of shareholders’ funds, bank borrowings, bonds and notes. At 31 December 2015, the Group had borrowing facilities of £5.1 billion and total liquidity of £5.0 billion, including cash and cash equivalents of £3.2 billion and undrawn facilities of £1.8 billion. £419 million of the facilities mature in 2016.
The Group’s forecasts and projections, taking into account reasonably possible changes in trading performance, show that the Group has sufficient financial resources. The Directors have reasonable expectations that the Company and the Group are well placed to manage business risks and to continue in operational existence for the foreseeable future (which accounting standards require to be at least a year from the date of this report) and have not identified any material uncertainties to the Company’s and the Group’s ability to do so.
On the basis described above, the Directors consider it appropriate to adopt the going concern basis in preparing the consolidated financial statements (in accordance with the “Guidance on Risk Management, Internal Control and Related Financial and Business Reporting” published by the Financial Reporting Council in September 2014).
Disclosure of information to auditorsEach of the persons who is a Director at the date of approval of this report confirms that:
i) so far as the Director is aware, there is no relevant audit information of which the Company’s auditor is unaware; and
ii) the Director has taken all steps that he or she ought to have taken as a director in order to make himself or herself aware of any relevant audit information and to establish that the Company’s auditor is aware of that information.
This confirmation is given, and should be interpreted, in accordance with the provisions of Section 418 of the Companies Act 2006.
By order of the Board
Pamela ColesCompany Secretary
24 February 2016
DIRECTORS’ REPORT AND FINANCIAL STATEMENTS CONTINUED
Rolls-Royce plc Annual Report 2015 63
Directors’ Report
Directors’ Report / Directors’ Report and Financial Statements

Financial Statements
64 Rolls-Royce plc Annual Report 2015
FINANCIAL STATEMENTS
CONSOLIDATED FINANCIAL STATEMENTS
Consolidated income statement 65
Consolidated statement of comprehensive income 66
Consolidated balance sheet 67
Consolidated cash flow statement 68
Consolidated statement of changes in equity 70
Notes to the Consolidated Financial Statements 71
1 Accounting policies 71
2 Segmental analysis 80
3 Research and development and other income and expenses 85
4 Net financing 85
5 Taxation 86
6 Employee information 88
7 Auditors’ remuneration 89
8 Intangible assets 89
9 Property, plant and equipment 92
10 Investments 93
11 Inventories 96
12 Trade and other receivables 96
13 Cash and cash equivalents 96
14 Borrowings 97
15 Trade and other payables 97
16 Financial instruments 98
17 Provisions for liabilities and charges 106
18 Post-retirement benefits 108
19 Share capital 113
20 Share-based payments 114
21 Leases 115
22 Contingent liabilities 116
23 Related party transactions 117
24 Acquisitions and disposals 118
COMPANY FINANCIAL STATEMENTS
Company balance sheet 119
Company statement of comprehensive income 120
Company statement of changes in equity 120
Notes to the Company Financial Statements 121
1 Accounting policies 121
2 Emoluments of directors 127
3 Intangible assets 127
4 Property, Plant and equipment 128
5 Investments 128
6 Inventories 129
7 Trade and other receivables 129
8 Cash and cash equivalents 129
9 Other financial assets and liabilities 129
10 Borrowings 131
11 Trade and other payables 131
12 Provisions for liabilities and charges 131
13 Deferred taxation 132
14 Post-retirement benefits 132
15 Share capital 134
16 Operating lease commitments 135
17 Share-based payments 135
18 Transition to FRS 101 Reduced Disclosure Framework 136
19 Contingent liabilities 142
20 Related party transactions 142
21 Ultimate holding company 142

Financial Statements
Rolls-Royce plc Annual Report 2015 65
Financial Statements
CONSOLIDATED INCOME STATEMENTFor the year ended 31 December 2015
Notes2015
£m2014
£m
Continuing operationsRevenue 2 13,725 13,736 Cost of sales (10,459) (10,533)Gross profit 3,266 3,203 Other operating income 10 10 Commercial and administrative costs (1,059) (1,124)Research and development costs 3 (818) (793)Share of results of joint ventures and associates 10 100 94 Operating profit 1,499 1,390 Profit on acquisition/reclassification of joint ventures – 2 Profit on disposal of businesses 2 6 Profit before financing and taxation 2 1,501 1,398
Financing income 4 115 32 Financing costs 4 (1,456) (1,284)Net financing (1,341) (1,252)
Profit before taxation1 160 146 Taxation 5 (76) (151)Profit for the year from continuing operations 84 (5)
Discontinued operationsProfit for the year from ordinary activities 2 – 4 Profit on disposal – 138 Profit for the year from discontinued operations – 142
Profit for the year 84 137
Attributable to:Ordinary shareholders 83 148 Non-controlling interests 1 (11)
Profit for the year 84 137
1 Underlying profit before taxation 2 1,432 1,620

Financial Statements
66 Rolls-Royce plc Annual Report 2015
CONSOLIDATED STATEMENT OF COMPREHENSIVE INCOMEFor the year ended 31 December 2015
Notes2015
£m2014
£m
Profit for the year 84 137
Other comprehensive income (OCI)Movements in post-retirement schemes 18 (722) 1,192 Related tax movements 257 (431)Items that will not be reclassified to profit or loss (465) 761
Foreign exchange translation differences on foreign operations (129) (158)Reclassified to income statement on disposal of businesses 1 (29)Share of OCI of joint ventures and associates 10 (19) (13)Related tax movements 5 (2) (2)Items that may be reclassified to profit or loss (149) (202)
Total comprehensive income for the year (530) 696
Attributable to:Ordinary shareholders (530) 729 Non-controlling interests – (33)
Total comprehensive income for the year (530) 696

Financial Statements
Rolls-Royce plc Annual Report 2015 67
Financial Statements
Notes2015
£m2014
£m
ASSETSIntangible assets 8 4,645 4,804 Property, plant and equipment 9 3,490 3,446 Investments – joint ventures and associates 10 576 539 Investments – other 10 33 31 Other financial assets 16 83 107 Deferred tax assets 5 318 369 Post-retirement scheme surpluses 18 1,063 1,740 Non-current assets 10,208 11,036 Inventories 11 2,637 2,768 Trade and other receivables 12 7,985 6,820 Taxation recoverable 23 19 Other financial assets 16 29 22 Short-term investments 2 7 Cash and cash equivalents 13 3,176 2,862 Assets held for sale 5 1 Current assets 13,857 12,499 TOTAL ASSETS 24,065 23,535
LIABILITIESBorrowings 14 (419) (68)Other financial liabilities 16 (302) (187)Trade and other payables 15 (7,420) (7,680)Current tax liabilities (164) (184)Provisions for liabilities and charges 17 (336) (433)Current liabilities (8,641) (8,552)Borrowings 14 (2,883) (2,193)Other financial liabilities 16 (1,651) (717)Trade and other payables 15 (2,317) (2,445)Non-current tax liabilities (1) (10)Deferred tax liabilities 5 (839) (1,228)Provisions for liabilities and charges 17 (304) (374)Post-retirement scheme deficits 18 (1,140) (1,185)Non-current liabilities (9,135) (8,152)TOTAL LIABILITIES (17,776) (16,704)
NET ASSETS 6,289 6,831
EQUITYCalled-up share capital 19 326 326 Share premium account 631 631 Cash flow hedging reserve (100) (81)Other reserves (54) 75 Retained earnings 5,484 5,875 Equity attributable to ordinary shareholders 6,287 6,826 Non-controlling interests 2 5 TOTAL EQUITY 6,289 6,831
The financial statements on pages 65 to 118 were approved by the Board on 24 February 2016 and signed on its behalf by:
WARREN EAST Chief Executive DAVID SMITH Chief Financial Officer
CONSOLIDATED BALANCE SHEETAt 31 December 2015

Financial Statements
68 Rolls-Royce plc Annual Report 2015
CONSOLIDATED CASH FLOW STATEMENTFor the year ended 31 December 2015
Notes2015
£m2014
£m
Reconciliation of cash flows from operating activitiesOperating profit from continuing operations 1,499 1,390 Operating loss from discontinued operations – (1)Operating profit 1,499 1,389 Loss/(profit) on disposal of property, plant and equipment 8 (3)Share of results of joint ventures and associates 10 (100) (94)Dividends received from joint ventures and associates 10 63 73 Return of capital from joint ventures 10 – 3 Gain on consolidation of previously non-consolidated subsidiary – (3)Amortisation and impairment of intangible assets 8 432 367 Depreciation and impairment of property, plant and equipment 9 378 375 Impairment of investments 10 2 – (Decrease)/increase in provisions (151) 129 Decrease in inventories 63 166 Increase in trade and other receivables (836) (878)Increase in trade and other payables 240 203 Cash flows on other financial assets and liabilities held for operating purposes (305) (30)Net defined benefit post-retirement cost recognised in profit before financing 213 170 Cash funding of defined benefit post-retirement schemes (259) (322)Share-based payments 20 5 21 Net cash inflow from operating activities before taxation 1,252 1,566Taxation paid (160) (276)Net cash inflow from operating activities 1,092 1,290
Cash flows from investing activitiesAdditions of unlisted investments (6) (11)Additions of intangible assets (408) (477)Disposals of intangibles assets 4 –Purchases of property, plant and equipment (487) (648)Government grants received 8 11 Disposals of property, plant and equipment 33 65 Acquisitions of businesses (5) (3)Acquisition of non-controlling interest – (1,937)Disposal of discontinued operations (121) 1,027 Disposals of other businesses 2 24 Investments in joint ventures and associates (15) (17)Net cash outflow from investing activities (995) (1,966)
Cash flows from financing activitiesRepayment of loans (54) (233)Proceeds from increase in loans and finance leases 1,150 49 Capital element of finance lease payments (1) – Net cash flow from increase/(decrease) in borrowings and finance leases 1,095 (184)Interest received 5 18 Interest paid (58) (63)Interest element of finance lease payments (2) –Decrease in short-term investments 5 313 Movement on balances with parent company (822) (465)Dividend paid to non-controlling interest – (76)Net cash inflow/(outflow) from financing activities 223 (457)
Change in cash and cash equivalents 320 (1,133)Cash and cash equivalents at 1 January 2,862 3,987 Exchange (losses)/gains on cash and cash equivalents (6) 8 Cash and cash equivalents at 31 December 3,176 2,862

Financial Statements
Rolls-Royce plc Annual Report 2015 69
Financial Statements
2015£m
2014£m
Reconciliation of movements in cash and cash equivalents to movements in net fundsChange in cash and cash equivalents 320 (1,133)Cash flow from (increase)/decrease in borrowings and finance leases (1,095) 184 Cash flow from decrease in short-term investments (5) (313)Change in net funds resulting from cash flows (780) (1,262)Net funds (excluding cash and cash equivalents) of businesses acquired – (30)Exchange gains on net funds 3 19 Fair value adjustments 45 (59)Movement in net funds (732) (1,332)Net funds at 1 January excluding the fair value of swaps 608 1,940 Net funds at 31 December excluding the fair value of swaps (124) 608 Fair value of swaps hedging fixed rate borrowings 13 58 Net funds at 31 December (111) 666
The movement in net funds (defined by the Group as including the items shown below) is as follows:
At 1 January
2015£m
Fundsflow
£m
Exchange differences
£m
Fair value adjustments
£mReclassifications
£m
At31 December
2015£m
Cash at bank and in hand 739 (69) (8) – – 662Money market funds 692 92 (1) – – 783Short-term deposits 1,431 297 3 – – 1,731Cash and cash equivalents 2,862 320 (6) – – 3,176Short-term investments 7 (5) – – – 2Other current borrowings (67) (64) – 8 (294) (417)Non-current borrowings (2,149) (1,027) 12 37 294 (2,833)Finance leases (45) (4) (3) – – (52)Net funds excluding fair value of swaps 608 (780) 3 45 – (124)Fair value of swaps hedging fixed rate borrowings 58 (45) 13Net funds 666 (780) 3 – – (111)
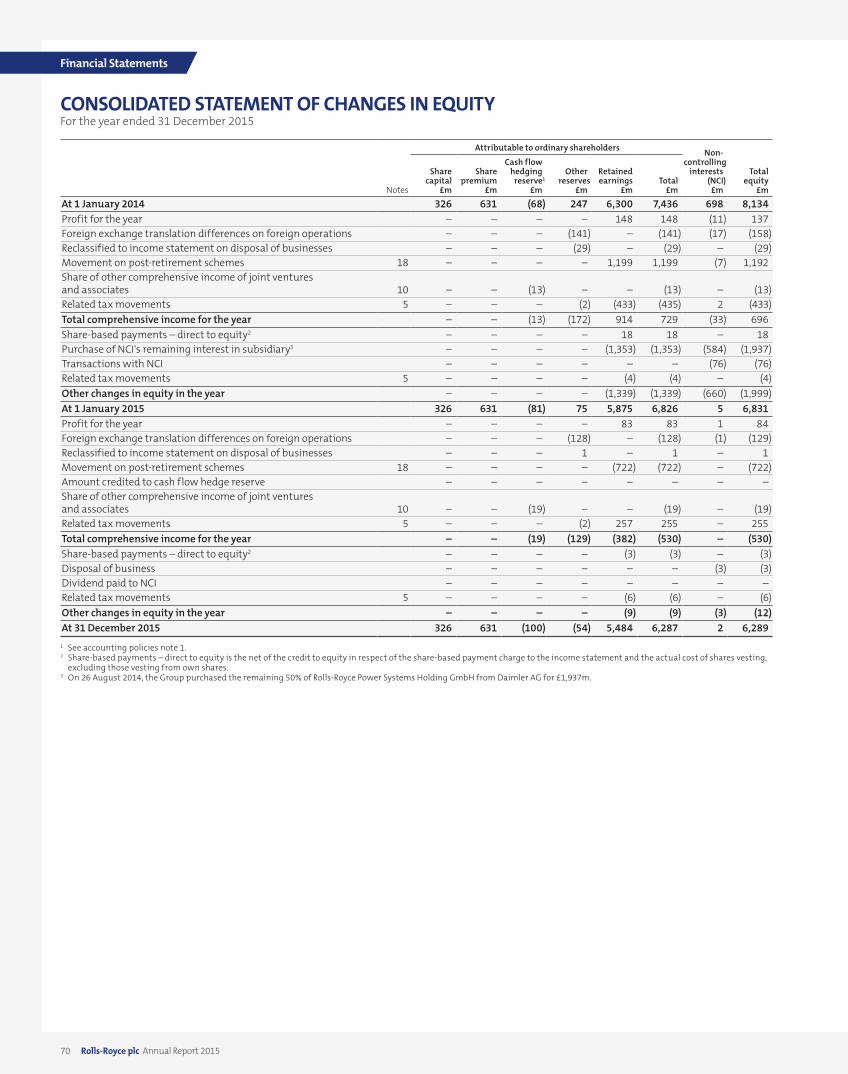
Financial Statements
70 Rolls-Royce plc Annual Report 2015
CONSOLIDATED STATEMENT OF CHANGES IN EQUITYFor the year ended 31 December 2015
Attributable to ordinary shareholders Non-controlling
interests (NCI)£mNotes
Share capital
£m
Share premium
£m
Cash flow hedging
reserve1
£m
Other reserves
£m
Retained earnings
£mTotal
£m
Totalequity
£m
At 1 January 2014 326 631 (68) 247 6,300 7,436 698 8,134 Profit for the year – – – – 148 148 (11) 137 Foreign exchange translation differences on foreign operations – – – (141) – (141) (17) (158)Reclassified to income statement on disposal of businesses – – – (29) – (29) – (29)Movement on post-retirement schemes 18 – – – – 1,199 1,199 (7) 1,192 Share of other comprehensive income of joint ventures and associates 10 – – (13) – – (13) – (13)Related tax movements 5 – – – (2) (433) (435) 2 (433)Total comprehensive income for the year – – (13) (172) 914 729 (33) 696 Share-based payments – direct to equity2 – – – – 18 18 – 18 Purchase of NCI's remaining interest in subsidiary3 – – – – (1,353) (1,353) (584) (1,937)Transactions with NCI – – – – – – (76) (76)Related tax movements 5 – – – – (4) (4) – (4)Other changes in equity in the year – – – – (1,339) (1,339) (660) (1,999)At 1 January 2015 326 631 (81) 75 5,875 6,826 5 6,831 Profit for the year – – – – 83 83 1 84 Foreign exchange translation differences on foreign operations – – – (128) – (128) (1) (129)Reclassified to income statement on disposal of businesses – – – 1 – 1 – 1 Movement on post-retirement schemes 18 – – – – (722) (722) – (722)Amount credited to cash flow hedge reserve – – – – – – – – Share of other comprehensive income of joint ventures and associates 10 – – (19) – – (19) – (19)Related tax movements 5 – – – (2) 257 255 – 255 Total comprehensive income for the year – – (19) (129) (382) (530) – (530)Share-based payments – direct to equity2 – – – – (3) (3) – (3)Disposal of business – – – – – – (3) (3)Dividend paid to NCI – – – – – – – – Related tax movements 5 – – – – (6) (6) – (6)Other changes in equity in the year – – – – (9) (9) (3) (12)At 31 December 2015 326 631 (100) (54) 5,484 6,287 2 6,289
1 See accounting policies note 1.2 Share-based payments – direct to equity is the net of the credit to equity in respect of the share-based payment charge to the income statement and the actual cost of shares vesting,
excluding those vesting from own shares.3 On 26 August 2014, the Group purchased the remaining 50% of Rolls-Royce Power Systems Holding GmbH from Daimler AG for £1,937m.

Financial Statements
NOTES TO THE CONSOLIDATED FINANCIAL STATEMENTS
1 Accounting policiesTHE COMPANYRolls-Royce plc (the ‘Company’) is a company domiciled in the United Kingdom. The consolidated financial statements of the Company for the year ended 31 December 2015 consist of the consolidation of the financial statements of the Company and its subsidiaries (together referred to as the ‘Group’) and include the Group’s interest in jointly controlled and associated entities.
BASIS OF PREPARATION AND STATEMENT OF COMPLIANCEIn accordance with European Union (EU) regulations, these financial statements have been prepared in accordance with International Financial Reporting Standards (IFRS) issued by the International Accounting Standards Board (IASB), as adopted for use in the EU effective at 31 December 2015 (Adopted IFRS).
The Company has elected to prepare its individual company financial statements under FRS 101 Reduced Disclosure Framework. This year is the first year that the financial statements have been prepared under FRS 101. They are set out on pages 119 to 142 and the accounting policies in respect of Company financial statements are set out on page 121.
These consolidated financial statements have been prepared on the historical cost basis except where Adopted IFRS requires the revaluation of financial instruments to fair value and certain other assets and liabilities on an alternative basis – most significantly post-retirement scheme obligations are valued on the basis required by IAS 19 Employee Benefits – and on a going concern basis as described on page 63.
The consolidated financial statements are presented in sterling which is the Company’s functional currency.
The preparation of financial statements in conformity with Adopted IFRS requires management to make judgements and estimates that affect the reported amounts of assets and liabilities at the date of the financial statements and the reported amounts of revenues and expenses during the reporting period. Actual results could differ from those estimates.
KEY AREAS OF JUDGEMENTIntroductionThe Group generates a significant portion of its revenues and profit on aftermarket arrangements arising from the installed original equipment (OE) fleet. As a consequence, the Group will often agree contractual prices for OE deliveries that take into account the anticipated aftermarket arrangements. Accounting policies reflect this aspect of the business model, in particular the policies for the recognition of contractual aftermarket rights and the linkage of OE and aftermarket arrangements.
When a civil large engine is sold, the economic benefits received usually far exceed the cash receivable under the contract, due to the rights to valuable aftermarket spare parts business. However, because the value of this right cannot be estimated with enough precision, accounting standards require that the revenue recognised in the accounts on sale of the engine is restricted to a total amount that results in a break even position. The amount of the revenue recognised in excess of cash receivable is recognised as an intangible asset, which is called a ‘contractual aftermarket right’.
There is only one circumstance where accounting standards require the recognition of more of the value of the aftermarket rights when an engine is sold. This occurs where a long-term aftermarket contract (generally a TotalCare agreement — TCA) and an engine sale contract have been negotiated together. In this circumstance, the part of the aftermarket rights covered by the TCA can be valued much more precisely and is recognised at the time of the engine sale through accounting for the engine sale and TCA as a single contract. Nevertheless, the accounting profit recognised is still less than the economic benefits on the sale as there will be other valuable aftermarket rights (for instance for the period beyond the TCA term or for the sale of parts which are outside the scope of the TCA) which cannot be recognised.
The Group enters into arrangements with long-term suppliers to share the risks and rewards of major programmes – risk and revenue sharing arrangements (RRSAs). The accounting policy for these arrangements has been chosen, consistent with Adopted IFRS, to reflect their commercial effect.
The key judgements in determining these accounting policies are described below.
Contractual aftermarket rights (CARs)On delivery of Civil Aerospace engines, the Group has contractual rights to supply aftermarket parts to the customers and its intellectual rights, warranty arrangements and, where relevant, statutory airworthiness or other regulatory requirements provide reasonable control over this supply. The directors consider that these rights meet the definition of an intangible asset in IAS 38 Intangible Assets. However, the directors do not consider that it is possible to determine a reliable fair value for this intangible asset. Accordingly, an intangible asset (CAR) is only recognised on the occasions where the contractual price of the engine is below the cost of manufacture and then only to the extent of this deficit, as this amount is reliably measureable. An equal amount of revenue is recognised at the same point. Where a long-term aftermarket contract is linked to the OE contract (see below), the contractual price of the engine (including amounts allocated from the aftermarket contract) is above its cost of manufacture; consequently no CAR is recognised.
Financial Statements
Rolls-Royce plc Annual Report 2015 71

NOTES TO THE CONSOLIDATED FINANCIAL STATEMENTS CONTINUED
1 Accounting policies continuedMeasure of performance on long-term aftermarket contractsA large proportion of the Group’s activities relate to long-term aftermarket contracts, in particular TotalCare and similar arrangements in the Aerospace Division. Under these contracts, the Group’s primary obligation is to maintain customers’ equipment in an operational condition and achieves this by undertaking various activities, such as engine monitoring, line maintenance and repair and overhaul, over the period of the contract. In general, the directors consider that the stage of performance of the contract should be by reference to the obligation to maintain an operational fleet and that this is best measured by the operation of the fleet. Accordingly, stage of performance is measured by reference to flying hours of each fleet under contract.
Linkage of original and long-term aftermarket contracts Where the key terms of a long-term aftermarket contract are substantively agreed (eg in a term sheet) at the same time as an OE contract with the operator, the directors consider these to be linked for accounting purposes and they are treated as a single contract, as this best reflects the overall commercial effect. Where the OE contract is not with the operator, eg where it is with an OE manufacturer or a lessor, the contracts are not linked as they were not negotiated on a unified basis.
Risk and revenue sharing arrangements (RRSAs)RRSAs with key suppliers (workshare partners) are a feature of our Civil Aerospace business. Under these contractual arrangements the key commercial objectives are that: (i) during the development phase the workshare partner shares in the risks of developing an engine by performing its own development work, providing development parts and paying a non-refundable cash entry fee; and (ii) during the production phase it supplies components in return for a share of the programme revenues as a ‘life of type’ supplier (ie as long as the engine remains in service). The share of development costs borne by the workshare partner and of the revenues it receives reflect the partner’s proportionate cost of providing its production parts compared to the overall manufacturing cost of the engine. The share is based on a jointly agreed forecast at the commencement of the arrangement.
These arrangements are complex and have features that could be indicative of: a collaboration agreement, including sharing of risk and cost in a development programme; a long-term supply agreement; sharing of intellectual property; or a combination of these. In summary, and as described below, the directors’ view is that the development and production phases of the contract should be considered separately in accounting for the RRSA, which results in the entry fee being matched against the non-recurring costs incurred by the Group.
Having considered the features above, the directors considered that there is no directly applicable IFRS to determine an accounting policy for the recognition of entry fees of this nature in the income statement. Consequently, in developing an accounting treatment for such entry fees that best reflects the commercial objectives of the contractual arrangement, the directors have analysed these features in the context of relevant accounting pronouncements (including those of other standard setters where these do not conflict with IFRS) and have weighed the importance of each feature in faithfully representing the overall commercial effect. The most important considerations that need to be balanced are: the transfer of development risk; the workshare partner receiving little standalone value from the payment of the entry fee; and the overall effect being collaboration between the parties which falls short of being a joint venture as the Group controls the programme. Also important in the analysis is the fact that, whilst the Group and the workshare partner share risks and rewards through the life of the contract, these risks and rewards are very different during the development and production phases.
In this context, the entry fee might be considered to represent: an amount paid as an equalisation of development costs; a payment to secure a long-term supply arrangement; a purchase of intellectual property; or some combination thereof. The accounting under these different scenarios could include: recognition of the entry fee to match the associated costs in the income statement; being spread over the life of the programme as a reduction in the cost of supply during production; or being spread over the time period of the access to the intellectual property by the workshare partner.
The directors consider that the most important features of the arrangement are the risk sharing and that the entry fee represents a contribution to the development costs that the Group incurs in excess of its proportionate programme share. The key judgements taken in reaching this view are: the entry fee is determined by the parties on that basis and the contract specifies that, in the event that a derivative engine is to be developed, additional entry fees will also be calculated on this basis; the workshare partners describe the entry fee in this way; although the workshare partner receives little stand-alone value from paying the entry fee, the entry fee together with its own development activities represent its aggregate investment in the collaboration; the amount of the entry fee does not include any amount in excess of that necessary to equalise forecast development costs; the Group is not ‘on risk’ for the full development costs it incurs but for that amount less the entry fees received; and, as far as can be determined, this appears to be common industry accounting for arrangements of this type, under both Adopted IFRS and US accounting standards (which the directors do not believe conflicts with IFRS in this regard).
The resulting accounting policy (described on page 75) represents the commercial effect of the contractual arrangements in that the Group recognises only those development costs to which it is exposed (and thus reflects the significant transfer of development risk to the workshare partner) and the costs of supply of parts during the production phase is measured at the workshare partner’s share of programme revenues (which we consider to be a commercial fair value). The directors do not consider that accounting which would result in entry fees only being recognised in the production phase would appropriately reflect the sharing of development risk. Accordingly, the directors believe that the policy adopted best reflects the commercial objectives of the arrangements, the nature of the relationship with the workshare partner and is in accordance with Adopted IFRS.
Financial Statements
72 Rolls-Royce plc Annual Report 2015

Financial Statements
1 Accounting policies continuedAs described in the 2013 Annual Report, an alternative view is that the RRSA contract cannot be divided into separate development and production phases, as the fees and development components received by the Group during the development phase are exchanged for the obligation to pay the supplier a predetermined share of any sales receipts during the production phase. On this basis the entry fees received would be deferred in their entirety and recognised over the period of production. The size of the difference between the two approaches is monitored and is not currently expected to become material in the foreseeable future. The impact of the different approaches on profit before tax and net assets, which is not considered to be material, is as follows:
2015 2014
Reported profit before tax
£m
Underlying profit before tax
£mNet assets
£m
Reported profit before tax
£m
Underlying profit before tax
£mNet assets
£m
Adopted policy 160 1,432 6,289 146 1,620 6,831Difference (28)1 (28) (435) (30)1 (30) (402)Alternative policy 132 1,404 5,854 116 1,590 6,429
1 If the alternative policy were adopted, the difference would be included in profit before financing, which would change from £1,501m as reported to £1,473m (2014: £1,398m to £1,368m)
Internally generated development costsIAS 38 requires that internally generated development costs should only be recognised if strict criteria are met, in particular relating to technical feasibility and generation of future economic benefits. The directors consider that, due to the complex nature of new equipment programmes, these criteria are not met until relatively late in the programme – Civil Aerospace programmes represent around half of development costs recognised; for these, the criteria are generally satisfied around the time of the initial engine certification.
Customer financing contingent liabilitiesThe Group has contingent liabilities in respect of financing support provided to customers. In order to assess whether a provision should be recognised, judgement as to the likelihood of these crystallising is required. This judgement is based on an assessment on the knowledge of the customers’ fleet plans, the underlying value of the security provided and, where appropriate, the customers’ creditworthiness.
KEY SOURCES OF ESTIMATION UNCERTAINTYIn applying the accounting policies, estimates are made in many areas; the actual outcome may differ from that calculated. The key sources of estimation uncertainty at the balance sheet date, that have a significant risk of causing material adjustment to the carrying amounts of assets and liabilities within the next financial year are set out below. The estimation of the relevant assets and liabilities involves the combination of a number of assumptions. Sensitivities are disclosed in the relevant notes where this is appropriate and practicable.
Forecasts and discount ratesThe carrying values of a number of items on the balance sheet are dependent on the estimates of future cash flows arising from the Group’s operations, in particular:
• The assessment of whether the goodwill and other intangible assets (carrying value at 31 December 2015 £1,502m, 31 December 2014: £1,659m) arising on the consolidation of RRPS is impaired is dependent of the present value of the future cash flows expected to be generated by the business.
• The assessment as to whether there are any indications of impairment of development, participation, customer relationships, certification and contractual aftermarket rights recognised as intangible assets (carrying values at 31 December 2015 £2,533m, 31 December 2014: £2,533m) is dependent on estimates of cash flows generated by the relevant assets and the discount rate used to calculate a present value. These estimates include the performance of long-term contractual arrangements as described below, as well as estimates for future market share, pricing and unit cost for uncontracted business. The risk of impairment is generally higher for newer programmes and for customer specific intangible assets (CARs) for launch customers and typically reduces as programmes become more established.
Assessment of long-term contractual arrangementsThe Group has long-term contracts that fall into different accounting periods and which can extend over significant periods – the most significant of these are long-term service arrangements in the Civil Aerospace business. The estimated revenues and costs are inherently imprecise and significant estimates are required to assess: engine flying hours, time on wing and other operating parameters; the pattern of future maintenance activity and the costs to be incurred; and life cycle cost improvements over the term of the contracts. The estimates take account of the inherent uncertainties and the risk of non-recovery of any resulting contract balances. During 2015, the methodologies for making these estimates were reviewed and refined.
Post-retirement benefitsThe Group’s defined benefit pension schemes and similar arrangements are assessed annually in accordance with IAS 19. The accounting valuation, which is based on assumptions determined with independent actuarial advice, resulted in a net deficit of £77m before deferred taxation being recognised on the balance sheet at 31 December 2015 (31 December 2014: net surplus £555m). The size of the net surplus/deficit is sensitive to the market value of the assets held by the schemes and to actuarial assumptions, which include price inflation, pension and salary increases, the discount rate used in assessing actuarial liabilities, mortality and other demographic assumptions and the levels of contributions. Further details are included in note 18.
Financial Statements
Rolls-Royce plc Annual Report 2015 73

NOTES TO THE CONSOLIDATED FINANCIAL STATEMENTS CONTINUED
1 Accounting policies continuedProvisionsAs described in the accounting policy on page 78, the Group measures provisions (carrying value at 31 December 2015 £640m, 31 December 2014: £807m) at the directors’ best estimate of the expenditure required to settle the obligation at the balance sheet date. These estimates take account of information available and different possible outcomes.
TaxationThe tax payable on profits is determined based on tax laws and regulations that apply in each of the numerous jurisdictions in which the Group operates. Where the precise impact of these laws and regulations is unclear, or uncertain then reasonable estimates may be used to determine the tax charge included in the financial statements.
The main area of uncertainty is in relation to cross border transactions, entered into in the normal course of business, as the amount of income or profit taxable in each country involved can be subjective and therefore open to interpretation by the relevant tax authorities. This can result in disputes and possibly litigation.
Accruals for tax contingencies require management to make judgements and estimates of exposures in relation to tax audit issues and other areas of uncertainty. Contingent liabilities, including in respect of any tax disputes or litigation, are covered in note 22 (contingent liabilities). All provisions are in current liabilities. Any liability relating to interest or penalties on tax liabilities is included in the tax charge.
Deferred tax assets are recognised to the extent it is probable that future taxable profits will be available against which the deductible temporary difference can be utilised based on management’s assumptions relating to the amounts and timing of future taxable profits.
Further details on the group tax position can be found on page 151.
SIGNIFICANT ACCOUNTING POLICIESThe Group’s significant accounting policies are set out below. These accounting policies have been applied consistently to all periods presented in these consolidated financial statements and by all Group entities.
Basis of consolidationThe Group consolidated financial statements include the financial statements of the Company and its subsidiary undertakings together with the Group’s share of the results of joint arrangements and associates made up to 31 December. In line with common practice in Germany, a small number of immaterial subsidiaries of Rolls-Royce Power Systems are not consolidated and are carried at cost in other investments. If such subsidiaries become material, they are consolidated. The difference between the net assets recognised and the investment cost eliminated is recognised in other operating income.
A subsidiary is an entity controlled by the Company. Control exists when the Company has power over an entity, exposure to variable returns from its involvement with an entity and the ability to use its power over an entity so as to affect the Company’s returns.
A joint arrangement is an entity in which the Group holds a long-term interest and which is jointly controlled by the Group and one or more other venturers under a contractual arrangement. Joint arrangements may be either joint ventures or joint operations. An associate is an entity, being neither a subsidiary nor a joint arrangement, in which the Group holds a long-term interest and where the Group has a significant influence. The results of joint ventures and associates are accounted for using the equity method of accounting. The results of joint operations are proportionately accounted.
Any subsidiary undertakings, joint arrangements or associates sold or acquired during the year are included up to, or from, the dates of change of control. Transactions with non-controlling interests are recorded directly in equity.
Where a put option over shares held by a non-controlling interest has been agreed, the Group recognises a liability for the estimated exercise value of that option. Movements in the estimated liability after initial recognition are recognised in the income statement.
All intra-group transactions, balances, income and expenses are eliminated on consolidation. Adjustments are made to eliminate the profit or loss arising on transactions with joint arrangements and associates to the extent of the Group’s interest in the entity.
Revenue recognitionRevenues comprise sales to outside customers after discounts, excluding value added taxes.
Sales of products (both original equipment and spare parts) are recognised when the significant risks and rewards of ownership of the goods are transferred to the customer, the sales price agreed and the receipt of payment can be assured – this is generally on delivery. On occasion, the Group may participate in the financing of OE, most commonly by the provision of guarantees as described in note 17. In such circumstances, the contingent obligations arising under these arrangements are taken into account in assessing when the significant risks and rewards of ownership have been transferred to the customer. As described on page 71, a sale of OE at a contractual price below its cost of manufacture is considered to give rise to revenue to the extent that an intangible asset, (contractual aftermarket right), is recognised at the same time.
Financial Statements
74 Rolls-Royce plc Annual Report 2015

Financial Statements
1 Accounting policies continuedSales of services are recognised by reference to the stage of completion based on services performed to date. As described on page 72, the assessment of the stage of completion is dependent on the nature of the contract, but will generally be based on: flying hours or equivalent for long-term aftermarket arrangements where the service is provided on a continuous basis; costs incurred to the extent these relate to services performed up to the reporting date; or achievement of contractual milestones where relevant.
As described on page 72, sales of products and services are treated as though they are a single contract where these components have been negotiated as a single commercial package and are so closely interrelated that they do not operate independently of each other and are considered to form a single transaction with an overall profit margin. The total revenue is allocated between the two components such that the total agreed discount to list prices is allocated to revenue for each of the two components pro rata, based on list prices. The revenue is then recognised for each component on this basis as the products are delivered and services provided, as described above. Where the contractual price of the OE component is below the revenue allocated from the combined arrangement, this will give rise to an asset included in ‘amounts recoverable on contracts’. This asset reduces as services are provided, increases as costs are incurred, and reduces to zero by the end of the contract. Where the balance is a liability, it is recognised in ‘accruals and deferred income’.
Provided that the outcome of construction contracts can be assessed with reasonable certainty, the revenues and costs on such contracts are recognised based on stage of completion and the overall contract profitability. Full provision is made for any estimated losses to completion of contracts, having regard to the overall substance of the arrangements.
Progress payments received, when greater than recorded revenue, are deducted from the value of work in progress except to the extent that payments on account exceed the value of work in progress on any contract where the excess is included in accruals and deferred income within trade and other payables. The amount by which recorded revenue of long-term contracts is in excess of payments on account is classified as amounts recoverable on contracts and is separately disclosed within trade and other receivables.
TotalCare arrangementsAs described above, these are accounted for on a stage of completion basis, with the stage of completion based on the proportion of flying hours completed compared to the total estimated under the contract. In making the assessment of future revenues, costs and the level of profit recognised the Group takes account of: (i) the forecast utilisation of the engines by the operator; (ii) the forecast costs to maintain the engines in accordance with the contractual requirements – the principal variables being the time between shop visits and the cost of each shop visit; and (iii) the recoverability of any contract asset arising. The Group benchmarks the forecast costs against previous programmes, recognising that the reliability of the forecasts will improve as operational experience of the engine increases. To the extent that actual costs differ from forecast costs or that forecast costs change, the cumulative impact is recognised in the period. An allowance is made against forecast contract revenues, given the potential for reduced engine flying hours based on historical forecasting accuracy, the risk of aircraft being parked by the customer and the customer’s creditworthiness, (previously assessed against contract assets arising based on both the customer’s creditworthiness and an assessment of the importance of the particular engine fleet to the customer.) Again, changes in this allowance are recognised in the period.
Risk and revenue sharing arrangements (RRSAs)As described on page 72, the Group enters into arrangements with certain workshare partners under which these suppliers: (i) contribute to the forecast costs of developing an engine by performing their own development work, providing development parts and paying a non-refundable cash entry fee; and (ii) supply components for the production phase for which they receive consideration, which is an agreed proportion of the total programme revenues. Both the suppliers’ contributions to the forecast non-recurring development costs and their consideration are determined by reference to their proportionate forecast scopes of supply relative to that of the engine overall. Once the forecast costs and the scopes of supply have been agreed at the inception of the contract, each party is then accountable for its own incurred costs. No accounting entries are recorded when the suppliers undertake development work or when development components are supplied. Cash sums received are recognised in the income statement, as a reduction in research and development costs incurred, to match the expensing of the Group’s related costs – where the cash sums are received in advance of the related costs being expensed or where the related costs are capitalised as intangible assets, the recognition of the cash received is deferred (in accruals and deferred income) to match the recognition of the related expense or the amortisation of the related intangible asset respectively. The payments to suppliers of their shares of the programme revenues for their production components are charged to cost of sales as programme revenues arise.
The Group has arrangements with partners who do not undertake development work or supply parts. Such arrangements are considered to be financial instruments as defined by IAS 32 Financial Instruments: Presentation and are accounted for using the amortised cost method.
Government investmentWhere a government or similar body has previously invested in a development programme, the Group treats payments to that body as royalty payments, which are matched to related sales.
Government grantsGovernment grants are recognised in the income statement so as to match them with the related expenses that they are intended to compensate. Where grants are received in advance of the related expenses, they are included in the balance sheet as deferred income. Non-monetary grants are recognised at fair value.
Financial Statements
Rolls-Royce plc Annual Report 2015 75

NOTES TO THE CONSOLIDATED FINANCIAL STATEMENTS CONTINUED
1 Accounting policies continuedInterestInterest receivable/payable is credited/charged to the income statement using the effective interest method. Where borrowing costs are attributable to the acquisition, construction or production of a qualifying asset, such costs are capitalised as part of the specific asset.
TaxationThe tax charge/credit on the profit or loss for the year comprises current and deferred tax:
• Current tax is the expected tax payable for the year, using tax rates enacted or substantively enacted at the balance sheet date, and any adjustment to tax payable in respect of previous years.
• Deferred tax is provided using the balance sheet liability method, providing for temporary differences between the carrying amounts of the assets and liabilities for financial reporting purposes and the amounts used for tax purposes and is calculated using the enacted or substantively enacted rates that are expected to apply when the asset or liability is settled.
Tax is charged or credited in the income statement or other comprehensive income (OCI) as appropriate, except when it relates to items credited or charged directly to equity in which case the tax is also dealt with in equity.
Deferred tax liabilities are recognised for taxable temporary differences arising on investments in subsidiaries and joint arrangements, except where the Group is able to control the reversal of the temporary difference and it is probable that the temporary difference will not reverse in the foreseeable future. Deferred tax is not recognised on taxable temporary differences arising on the initial recognition of goodwill or for temporary differences arising from the initial recognition of assets and liabilities in a transaction that is not a business combination and that affects neither accounting nor taxable profit.
Deferred tax assets are recognised only to the extent that it is probable that future taxable profits will be available against which the assets can be utilised.
Foreign currency translationTransactions denominated in currencies other than the functional currency of the transacting Group undertaking are translated into the functional currency at the exchange rates ruling on the date of the transaction. Monetary assets and liabilities denominated in foreign currencies are translated into the relevant functional currency at the rate ruling at the year end. Exchange differences arising on foreign exchange transactions and the retranslation of assets and liabilities into functional currencies at the rate ruling at the year end are taken into account in determining profit before taxation.
The trading results of Group undertakings are translated into sterling at the average exchange rates for the year. The assets and liabilities of overseas undertakings, including goodwill and fair value adjustments arising on acquisition, are translated at the exchange rates ruling at the year end. Exchange adjustments arising from the retranslation of the opening net investments, and from the translation of the profits or losses at average rates, are recognised in OCI. The cumulative amount of exchange adjustments was, on transition to IFRS in 2004, deemed to nil.
Financial instrumentsIAS 39 Financial Instruments: Recognition and Measurement requires the classification of financial instruments into separate categories for which the accounting requirement is different. The Group has classified its financial instruments as follows:
• short-term investments are generally classified as available for sale;• short-term deposits (principally comprising funds held with banks and other financial institutions), trade receivables and short-term
investments not designated as available for sale are classified as loans and receivables;• borrowings, trade payables and financial RRSAs are classified as other liabilities; and• derivatives, comprising foreign exchange contracts, interest rate swaps and commodity swaps are classified as fair value through profit
or loss.
Financial instruments are recognised at the contract date and initially measured at fair value. Their subsequent measurement depends on their classification:
• Available for sale assets are held at fair value. Changes in fair value arising from changes in exchange rates are included in the income statement. All other changes in fair value are taken to equity. On disposal, the accumulated changes in value recorded in equity are included in the gain or loss recorded in the income statement.
• Loans and receivables and other liabilities are held at amortised cost and not revalued (except for changes in exchange rates and forecast contractual cash flows, which are included in the income statement) unless they are included in a fair value hedge accounting relationship. Where such a hedging relationship exists, the instruments are revalued in respect of the risk being hedged, with the change in value included in the income statement.
• Fair value through profit or loss items are held at fair value. Changes in fair value are included in the income statement unless the instrument is included in a cash flow hedge. If the instruments are included in an effective cash flow hedging relationship, changes in value are taken to equity. When the hedged forecast transaction occurs, amounts previously recorded in equity are recognised in the income statement.
Financial instruments are derecognised on expiry or when all contractual rights and obligations are transferred.
Financial Statements
76 Rolls-Royce plc Annual Report 2015

Financial Statements
1 Accounting policies continuedHedge accountingThe Group does not generally apply hedge accounting in respect of forward foreign exchange contracts or commodity swaps held to manage the cash flow exposures of forecast transactions denominated in foreign currencies or in commodities respectively.
The Group applies hedge accounting in respect of transactions entered into to manage the fair value and cash flow exposures of its borrowings. Forward foreign exchange contracts are held to manage the fair value exposures of borrowings denominated in foreign currencies and are designated as fair value hedges. Interest rate swaps are held to manage the interest rate exposures and are designated as fair value or cash flow hedges of fixed and floating rate borrowings respectively.
Changes in the fair values of derivatives designated as fair value hedges and changes in fair value of the related hedged item are recognised directly in the income statement.
Changes in the fair values of derivatives that are designated as cash flow hedges and are effective are recognised directly in equity. Any ineffectiveness in the hedging relationships is included in the income statement. The amounts deferred in equity are recognised in the income statement to match the recognition of the hedged item.
Hedge accounting is discontinued when the hedging instrument expires or is sold, terminated, exercised, or no longer qualifies for hedge accounting. At that time, for cash flow hedges and if the forecast transaction remains probable, any cumulative gain or loss on the hedging instrument recognised in equity is retained in equity until the forecast transaction occurs. If a hedged transaction is no longer expected to occur, the net cumulative gain or loss previously recognised in equity is transferred to the income statement.
The portion of a gain or loss on an instrument used to hedge a net investment in a foreign operation that is determined to be an effective hedge is recognised directly in equity. The ineffective portion is recognised immediately in the income statement. Gains and losses accumulated in the translation reserve will be recycled to profit when the foreign operation is sold.
Business combinations and goodwillOn the acquisition of a business, fair values are attributed to the identifiable assets and liabilities and contingent liabilities unless the fair value cannot be measured reliably, in which case the value is subsumed into goodwill. Where fair values of acquired contingent liabilities cannot be measured reliably, the assumed contingent liability is not recognised but is disclosed in the same manner as other contingent liabilities.
Goodwill recognised represents the excess of the fair value of the purchase consideration over the fair value to the Group of the net of the identifiable assets acquired and the liabilities assumed. On transition to IFRS on 1 January 2004, business combinations were not retrospectively adjusted to comply with Adopted IFRS and goodwill was recognised based on the carrying value under the previous accounting policies. Goodwill in respect of the acquisition of a subsidiary is recognised as an intangible asset. Goodwill arising on the acquisition of joint arrangements and associates is included in the carrying value of the investment.
Certification costs and participation feesCosts incurred in respect of meeting regulatory certification requirements for new civil aero-engine/aircraft combinations including payments made to airframe manufacturers for this and participation fees are carried forward in intangible assets to the extent that they can be recovered out of future sales and are charged to the income statement over the programme life, up to a maximum of 15 years from the entry into service of the product.
Research and developmentIn accordance with IAS 38 Intangible Assets, expenditure incurred on research and development is distinguished as relating either to a research phase or to a development phase.
All research phase expenditure is charged to the income statement. Development expenditure is capitalised as an internally generated intangible asset only if it meets strict criteria, relating in particular to technical feasibility and generation of future economic benefits. As described on page 73, the Group considers that it is not possible to distinguish reliably between research and development activities until relatively late in the programme.
Expenditure capitalised is amortised over its useful economic life, up to a maximum of 15 years from the entry into service of the product.
Contractual aftermarket rightsAs described under key judgements on page 71, the Group may sell OE to customers at a price below its cost, on the basis that it also receives valuable aftermarket rights. Such a sale is considered to give rise to an intangible asset which is recognised, in accordance with IAS 38, at the same time as the revenue at an amount equal to the cash deficit and is amortised on a straight-line basis over the period that highly probable aftermarket sales are expected to be earned.
Customer relationshipsThe fair value of customer relationships recognised as a result of a business combination relate to the acquired company’s established relationships with its existing customers that result in repeat purchases and customer loyalty. Amortisation occurs on a straight-line basis over its useful economic life, up to a maximum of 15 years.
Financial Statements
Rolls-Royce plc Annual Report 2015 77

NOTES TO THE CONSOLIDATED FINANCIAL STATEMENTS CONTINUED
1 Accounting policies continuedSoftwareThe cost of acquiring software that is not specific to an item of property, plant and equipment is classified as an intangible asset and amortised over its useful economic life, up to a maximum of five years.
Property, plant and equipmentProperty, plant and equipment assets are stated at cost less accumulated depreciation and any provision for impairment in value.
Depreciation is provided on a straight-line basis to write off the cost, less the estimated residual value, of property, plant and equipment over their estimated useful lives. No depreciation is provided on assets in the course of construction. Estimated useful lives are as follows:
i) land and buildings, as advised by the Group’s professional advisers: a) freehold buildings – five to 45 years (average 25 years); b) leasehold buildings – lower of adviser’s estimates or period of lease; c) no depreciation is provided on freehold land;ii) plant and equipment – five to 25 years (average 13 years);iii) aircraft and engines – five to 20 years (average 13 years).
Operating leasesPayments made and rentals received under operating lease arrangements are charged/credited to the income statement on a straight-line basis.
Impairment of non-current assetsImpairment of non-current assets is considered in accordance with IAS 36 Impairment of Assets. Where the asset does not generate cash flows that are independent of other assets, impairment is considered for the cash-generating unit to which the asset belongs. Goodwill and intangible assets not yet available for use are tested for impairment annually. Other intangible assets, property, plant and equipment and investments are assessed for any indications of impairment annually. If any indication of impairment is identified, an impairment test is performed to estimate the recoverable amount.
If the recoverable amount of an asset (or cash-generating unit) is estimated to be below the carrying value, the carrying value is reduced to the recoverable amount and the impairment loss recognised as an expense. The recoverable amount is the higher of value in use or fair value less costs to sell, if this is readily available. The value in use is the present value of future cash flows using a pre-tax discount rate that reflects the time value of money and the risk specific to the asset.
InventoriesInventories and work in progress are valued at the lower of cost and net realisable value on a first-in, first-out basis. Cost comprises direct materials and, where applicable, direct labour costs and those overheads, including depreciation of property, plant and equipment, that have been incurred in bringing the inventories to their present location and condition. Net realisable value represents the estimated selling prices less all estimated costs of completion and costs to be incurred in marketing, selling and distribution.
Cash and cash equivalentsCash and cash equivalents include cash at bank and in hand, investments in money-market funds and short-term deposits with a maturity of three months or less on inception. The Group considers overdrafts (repayable on demand) to be an integral part of its cash management activities and these are included in cash and cash equivalents for the purposes of the cash flow statement.
ProvisionsProvisions are recognised when the Group has a present obligation as a result of a past event, and it is probable that the Group will be required to settle that obligation. Provisions are measured at the directors’ best estimate of the expenditure required to settle the obligation at the balance sheet date, and are discounted to present value where the effect is material.
Post-retirement benefitsPensions and similar benefits (principally healthcare) are accounted for under IAS 19 Employee Benefits.
For defined benefit plans, obligations are measured at discounted present value, using a discount rate derived from high-quality corporate bonds denominated in the currency of the plan, whilst plan assets are recorded at fair value. Surpluses in schemes are recognised as assets only if they represent economic benefits available to the Group in the future. A liability is recognised to the extent that the minimum funding requirements in respect of past service will give rise to an unrecognisable surplus.
The service and financing costs of such plans are recognised separately in the income statement:
• current service costs are spread systematically over the lives of employees;• past-service costs are recognised immediately; and• financing costs are recognised in the periods in which they arise.
Actuarial gains and losses and movements in unrecognised surpluses and minimum funding liabilities are recognised immediately in OCI.
Payments to defined contribution schemes are charged as an expense as they fall due.
Financial Statements
78 Rolls-Royce plc Annual Report 2015

Financial Statements
1 Accounting policies continuedShare-based paymentsThe Group provides share-based payment arrangements to certain employees. These are principally equity-settled arrangements and are measured at fair value (excluding the effect of non-market based vesting conditions) at the date of grant. The fair value is expensed on a straight-line basis over the vesting period. The amount recognised as an expense is adjusted to reflect the actual number of shares or options that will vest, except where additional shares vest as a result of the total shareholder return (TSR) performance condition in the Performance Share Plan (PSP).
Cash-settled share options (grants in the International ShareSave plan) are measured at fair value at the balance sheet date. The Group recognises a liability at the balance sheet date based on these fair values, taking into account the estimated number of options that will actually vest and the relative completion of the vesting period. Changes in the value of this liability are recognised in the income statement for the year.
Sales financing supportIn connection with the sale of its products, the Group will, on occasion, provide financing support for its customers. These arrangements fall into two categories: credit-based guarantees and asset-value guarantees. In accordance with the requirements of IAS 39 and IFRS 4 Insurance Contracts, credit-based guarantees are treated as insurance contracts. The Group considers asset-value guarantees to be non-financial liabilities and accordingly these are also treated as insurance contracts. As described on page 107, the directors consider the likelihood of crystallisation in assessing whether provision is required for any contingent liabilities.
The Group’s contingent liabilities relating to financing arrangements are spread over many years and relate to a number of customers and a broad product portfolio, and are reported on a discounted basis.
Revisions to Adopted IFRS in 2015There were no changes to accounting standards that had a material impact on the 2015 financial statements.
Revisions to IFRS not applicable in 2015Standards and interpretations issued by the IASB are only applicable if endorsed by the EU.
Once endorsed, IFRS 9 Financial Instruments will simplify the classification of financial assets for measurement purposes, but is not anticipated to have a significant impact on the financial statements.
IFRS 15 Revenue from Contracts with Customers (effective for the year-ending 31 December 2018, not yet endorsed by the EU) provides a single, principles-based five-step model to be applied to all sales contracts, based on the transfer of control of goods and services to customers. It replaces the separate models for goods, services and construction contracts currently included in IAS 11 Construction Contracts and IAS 18 Revenue. Given the nature of the Group’s long-term contracts, it is likely that the adoption of IFRS 15 will require significant judgement.
Based on the provisional assessment, IFRS 15 will have a significant impact on the timing of recognition of revenue on individual long-term contracts, most particularly in the Civil Aerospace business, although this impact is likely to be significantly reduced at a Group level when all long-term contracts (with different start and end dates) are combined. The key areas of judgement are: (i) whether contractual aftermarket rights can continue to be recognised; (ii) whether OE and TotalCare contracts can be linked for accounting purposes; and (iii) how performance should be measured on TotalCare contracts. The Group will continue to assess the impact during 2016 and also consider the interpretations of other aerospace and defence companies .
IFRS 16 Leases (effective for the year-ending 31 December 2019, not yet endorsed by the EU) will require all leases to be recognised on the balance sheet. Currently, IAS 17 Leases only requires leases categorised as finance leases to be recognised on the balance sheet, with leases categorised as operating leases not recognised. In broad terms, the impact will be to recognise a lease liability and corresponding asset for operating lease commitments set out in note 21.
The Group does not consider that any other standards, amendments or interpretations issued by the IASB, but not yet applicable, will have a significant impact on the financial statements.
Financial Statements
Rolls-Royce plc Annual Report 2015 79

NOTES TO THE CONSOLIDATED FINANCIAL STATEMENTS CONTINUED
2 Segmental analysisThe analysis by Division (business segment) is presented in accordance with IFRS 8 Operating segments, on the basis of those segments whose operating results are regularly reviewed by the Board (the Chief Operating Decision Maker as defined by IFRS 8), as follows:
AEROSPACE DIVISION:Civil – development, manufacture, marketing and sales of commercial aero engines and aftermarket services.Defence – development, manufacture, marketing and sales of military aero engines and aftermarket services.
LAND & SEA DIVISION:Power Systems – development, manufacturing, marketing and sales of reciprocating engines and power systems.Marine – development, manufacture, marketing and sales of marine-power propulsion systems and aftermarket services.Nuclear – development, manufacture, marketing and sales of nuclear systems for civil power generation and naval
propulsion systems.
The Energy business was sold on 1 December 2014 and is excluded from the 2014 comparative figures. The residual businesses previously included in the Energy sector and costs associated with the wind-down are shown as ‘Other’.
The operating results reviewed by the Board are prepared on an underlying basis, which the Board considers reflects better the economic substance of the Group’s trading during the year. Additional disclosure of the two segments is also provided. The principles adopted to determine underlying results are:
Underlying revenues – Where revenues are denominated in a currency other than the functional currency of the Group undertaking, these reflect the achieved exchange rates arising on settled derivative contracts.
Underlying profit before financing – Where transactions are denominated in a currency other than the functional currency of the Group undertaking, this reflects the transactions at the achieved exchange rates on settled derivative contracts. In addition, adjustments have been made to exclude one-off past-service credits on post-retirement schemes, exceptional restructuring costs. The effect of acquisition accounting and the impairment of goodwill.
Underlying profit before taxation – In addition to those adjustments in underlying profit before financing:
• includes amounts realised from settled derivative contracts and revaluation of relevant assets and liabilities to exchange rates forecast to be achieved from future settlement of derivative contracts; and
• excludes unrealised amounts arising from revaluations required by IAS 39 Financial Instruments: Recognition and Measurement, changes in value of financial RRSA contracts arising from changes in forecast payments and the net impact of financing costs related to post-retirement scheme benefits.
Taxation – the tax effect of the adjustments above are excluded from the underlying tax charge. In addition changes in the amount of recoverable advance corporation tax recognised and the impact of changes in tax rates are also excluded.
This analysis also includes a reconciliation of the underlying results to those reported in the consolidated income statement.
Financial Statements
80 Rolls-Royce plc Annual Report 2015

Financial Statements
2 Segmental analysis continuedAerospace Land & Sea
Inter-segment
£m
Total reportable segments
£mCivil
£mDefence
£mTotal
£m
Power Systems
£mMarine
£mNuclear
£mOther 1
£m
Intra-segment
£mTotal
£m
Year ended 31 December 2015Underlying revenue from sale of original equipment 3,258 801 4,059 1,618 773 251 76 (53) 2,665 – 6,724 Underlying revenue from aftermarket services2 3,675 1,234 4,909 767 551 436 20 (53) 1,721 – 6,630 Total underlying revenue 6,933 2,035 8,968 2,385 1,324 687 96 (106) 4,386 – 13,354 Gross profit 1,526 579 2,105 635 260 111 64 7 1,077 – 3,182 Commercial and administrative costs (296) (123) (419) (276) (201) (53) (4) – (534) – (953)Restructuring (7) (8) (15) (4) (16) (2) (2) – (24) – (39)Research and development costs (515) (73) (588) (162) (28) 14 (1) – (177) – (765)Share of results of joint ventures and associates 104 19 123 – – – (5) – (5) – 118 Underlying profit before financing and taxation 812 394 1,206 193 15 70 52 7 337 – 1,543
Segment assets 12,291 1,768 14,059 3,411 1,690 404 119 – 5,624 (850) 18,833 Investments in joint ventures and associates 545 12 557 8 7 3 1 – 19 – 576 Segment liabilities (8,995) (1,787) (10,782) (1,026) (839) (352) (120) – (2,337) 850 (12,269)Net assets/(liabilities) 3,841 (7) 3,834 2,393 858 55 – – 3,306 – 7,140 Investment in intangible assets, property, plant and equipment and joint ventures and associates 668 84 752 108 36 18 – – 162 – 914 Depreciation, amortisation and impairment 410 58 468 197 111 23 11 – 342 – 810
Year ended 31 December 2014 Underlying revenue from sale of original equipment 2 3,463 816 4,279 1,893 1,070 230 24 (78) 3,139 – 7,418 Underlying revenue from aftermarket services 2 3,374 1,253 4,627 827 639 408 22 (77) 1,819 – 6,446 Total underlying revenue 6,837 2,069 8,906 2,720 1,709 638 46 (155) 4,958 – 13,864 Gross profit 1,675 567 2,242 742 425 119 8 (13) 1,281 – 3,523 Commercial and administrative costs (283) (112) (395) (296) (254) (61) (10) – (621) – (1,016)Restructuring (82) (55) (137) (7) (4) (1) – – (12) – (149)Research and development costs (461) (50) (511) (183) (29) (7) – – (219) – (730)Share of results of joint ventures and associates 93 16 109 (3) – – – – (3) – 106 Underlying profit before financing and taxation 942 366 1,308 253 138 50 (2) (13) 426 – 1,734
Segment assets 10,976 1,683 12,659 3,607 1,820 333 791 (22) 6,529 (1,269) 17,919 Investments in joint ventures and associates 507 13 520 7 5 3 4 – 19 – 539 Segment liabilities (7,886) (1,890) (9,776) (1,117) (1,196) (442) (552) – (3,307) 1,269 (11,814)Net assets/(liabilities) 3,597 (194) 3,403 2,497 629 (106) 243 (22) 3,241 – 6,644 Investment in intangible assets, property, plant and equipment and joint ventures and associates 836 78 914 144 36 23 8 – 211 – 1,125 Depreciation and amortisation 381 49 430 221 38 22 13 – 294 – 724
1 Energy business retained following 2014 disposal.2 The basis for the allocation of Civil Aerospace revenues on linked TotalCare contracts between OE and aftermarket has been reviewed and amendments made to reflect better the
commercial substance of the combined contracts. Historically, the allocation has resulted in original equipment revenue reflecting the contractual terms rather than the commercial substance of the contracts. The 2014 figures have been restated on the same basis: the impact was an increase in original equipment revenue of £198m and an equal decrease in aftermarket revenue.
Financial Statements
Rolls-Royce plc Annual Report 2015 81

NOTES TO THE CONSOLIDATED FINANCIAL STATEMENTS CONTINUED
2 Segmental analysis continuedRECONCILIATION TO REPORTED RESULTS
Total reportable segments
£m
Underlying central items
£m
Totalunderlying
£m
Underlying adjustments
£m
Discontinued business
£mGroup
£mYear ended 31 December 2015Revenue from sale of original equipment 6,724 – 6,724 215 6,939 Revenue from aftermarket services 6,630 – 6,630 156 6,786Total revenue 13,354 – 13,354 371 13,725 Gross profit 3,182 – 3,182 84 3,266 Other operating income – – – 10 10 Commercial and administrative costs (953) (51)1 (1,004) (55) (1,059)Restructuring (39) – (39) 39 – Research and development costs (765) – (765) (53) (818)Share of results of joint ventures and associates 118 – 118 (18) 100 Profit on disposal of businesses – – – 2 2 Profit before financing and taxation 1,543 (51) 1,492 9 1,501 Net financing (60) (60) (1,281) (1,341)Profit before taxation (111) 1,432 (1,272) 160Taxation (351) (351) 275 (76)Profit for the year from continuing operations 1,081 (997) 84 Profit for the year from discontinued operations – – – Profit for the year 1,081 (997) 84 Attributable to:Ordinary shareholders 1,080 (997) 83 Non-controlling interests 1 – 1
Year ended 31 December 2014Revenue from sale of original equipment 7,418 – 7,418 (1) 7,417 Revenue from aftermarket services 6,446 – 6,446 (127) 6,319 Total revenue 13,864 – 13,864 (128) 13,736 Gross profit 3,523 – 3,523 (320) 3,203 Other operating income – – – 10 10 Commercial and administrative costs (1,016) (53)1 (1,069) (55) (1,124)Restructuring (149) – (149) 149 – Research and development costs (730) – (730) (63) (793)Share of results of joint ventures and associates 106 – 106 (12) 94 Profit on transfer of joint ventures to subsidiaries – – – 2 2 Profit on disposal of businesses – – – 6 6 Profit before financing and taxation 1,734 (53) 1,681 (283) 1,398 Net financing (61) (61) (1,191) (1,252)Profit before taxation (114) 1,620 (1,474) 146 Taxation (388) (388) 237 (151)Profit for the year from continuing operations 1,232 (1,237) (5)Profit for the year from discontinued operations – – 142 142 Profit for the year 1,232 (1,237) 142 137 Attributable to:Ordinary shareholders 1,226 (1,220) 142 148 Non-controlling interests 6 (17) – (11)
1 Central corporate costs.
CASH FLOWS FROM DISCONTINUED OPERATIONS2014
£mRevenue 713Profit before taxation 1Tax on ordinary activities 3Profit for the year from ordinary activities 4Profit on disposal of discontinued operations 136Tax on profit of discontinued operations 2Profit for the year from discontinued operations 142Net cash inflow/(outflow) from operating activities (127)Net cash outflow from investing activities (35)Net change in cash and cash equivalents (162)
Financial Statements
82 Rolls-Royce plc Annual Report 2015
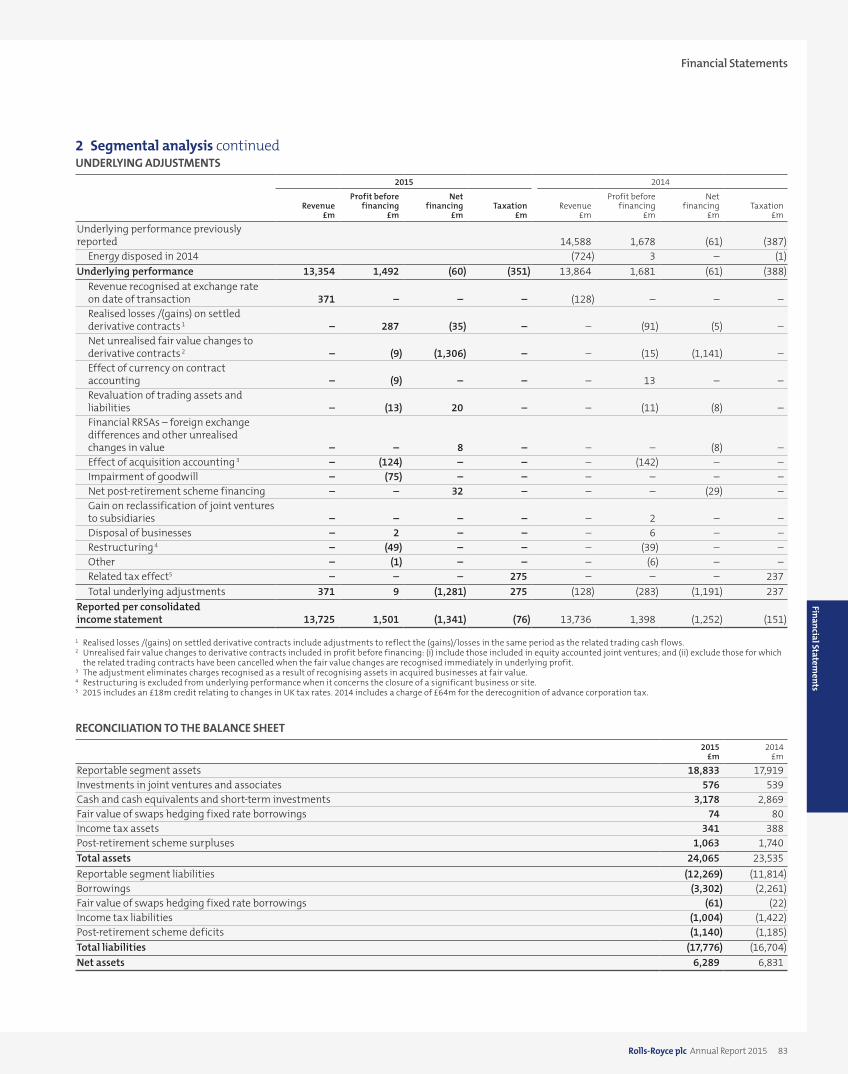
Financial Statements
2 Segmental analysis continuedUNDERLYING ADJUSTMENTS
2015 2014
Revenue£m
Profit beforefinancing
£m
Net financing
£mTaxation
£mRevenue
£m
Profit beforefinancing
£m
Net financing
£mTaxation
£m
Underlying performance previously reported 14,588 1,678 (61) (387)
Energy disposed in 2014 (724) 3 – (1)Underlying performance 13,354 1,492 (60) (351) 13,864 1,681 (61) (388)
Revenue recognised at exchange rate on date of transaction 371 – – – (128) – – – Realised losses /(gains) on settled derivative contracts 1 – 287 (35) – – (91) (5) – Net unrealised fair value changes to derivative contracts 2 – (9) (1,306) – – (15) (1,141) – Effect of currency on contract accounting – (9) – – – 13 – – Revaluation of trading assets and liabilities – (13) 20 – – (11) (8) – Financial RRSAs – foreign exchange differences and other unrealised changes in value – – 8 – – – (8) – Effect of acquisition accounting 3 – (124) – – – (142) – – Impairment of goodwill – (75) – – – – – –Net post-retirement scheme financing – – 32 – – – (29) – Gain on reclassification of joint ventures to subsidiaries – – – – – 2 – – Disposal of businesses – 2 – – – 6 – – Restructuring 4 – (49) – – – (39) – – Other – (1) – – – (6) – – Related tax effect5 – – – 275 – – – 237 Total underlying adjustments 371 9 (1,281) 275 (128) (283) (1,191) 237
Reported per consolidated income statement 13,725 1,501 (1,341) (76) 13,736 1,398 (1,252) (151)
1 Realised losses /(gains) on settled derivative contracts include adjustments to reflect the (gains)/losses in the same period as the related trading cash flows.2 Unrealised fair value changes to derivative contracts included in profit before financing: (i) include those included in equity accounted joint ventures; and (ii) exclude those for which
the related trading contracts have been cancelled when the fair value changes are recognised immediately in underlying profit.3 The adjustment eliminates charges recognised as a result of recognising assets in acquired businesses at fair value.4 Restructuring is excluded from underlying performance when it concerns the closure of a significant business or site.5 2015 includes an £18m credit relating to changes in UK tax rates. 2014 includes a charge of £64m for the derecognition of advance corporation tax.
RECONCILIATION TO THE BALANCE SHEET2015
£m2014
£m
Reportable segment assets 18,833 17,919 Investments in joint ventures and associates 576 539 Cash and cash equivalents and short-term investments 3,178 2,869 Fair value of swaps hedging fixed rate borrowings 74 80 Income tax assets 341 388 Post-retirement scheme surpluses 1,063 1,740 Total assets 24,065 23,535 Reportable segment liabilities (12,269) (11,814)Borrowings (3,302) (2,261)Fair value of swaps hedging fixed rate borrowings (61) (22)Income tax liabilities (1,004) (1,422)Post-retirement scheme deficits (1,140) (1,185)Total liabilities (17,776) (16,704)Net assets 6,289 6,831
Financial Statements
Rolls-Royce plc Annual Report 2015 83

NOTES TO THE CONSOLIDATED FINANCIAL STATEMENTS CONTINUED
2 Segmental analysis continuedGEOGRAPHICAL SEGMENTS The Group’s revenue by destination from continuing operations is as follows:
2015£m
2014£m
United Kingdom 1,780 1,599 Germany 642 734 Switzerland 782 670 Norway 280 322 France 249 292 Italy 222 201 Spain 200 113 Russia 59 86 Rest of Europe 786 575 Europe 5,000 4,592 USA 3,591 3,751 Canada 475 472 North America 4,066 4,223 South America 425 407 Saudi Arabia 365 327 Rest of Middle East 445 418 Middle East 810 745 China 1,236 1,290 South Korea 278 485 Singapore 549 396 Malaysia 78 280 Japan 136 272 India 99 161 Rest of Asia 546 493 Asia 2,922 3,377 Africa 144 115 Australasia 278 207 Other 80 70
13,725 13,736
No single customer represented 10% or more of the Group’s revenue.
The carrying amounts of the Group’s non-current assets, excluding financial instruments, deferred tax assets and post-employment benefit surpluses, by the geographical area in which the assets are located, are as follows:
2015£m
2014£m
United Kingdom 4,072 3,864 United States of America 835 827 Nordic countries 598 724 Germany 2,339 2,493 Other 900 912
8,744 8,820
Financial Statements
84 Rolls-Royce plc Annual Report 2015

Financial Statements
3 Research and development and other income and expensesRESEARCH AND DEVELOPMENT
2015£m
2014£m
Expenditure in the year (831) (818)Capitalised as intangible assets 51 83 Amortisation of capitalised costs (136) (125)Net research and development cost (916) (860)Entry fees received 83 51 Entry fees deferred in respect of charges in future years (28) (38)Recognition of previously deferred entry fees 43 54 Net cost recognised in the income statement (818) (793)Underlying adjustments relating to effects of acquisition accounting and foreign exchange 53 63 Net underlying cost recognised in the income statement (765) (730)Discontinued operations (25)Net underlying cost recognised in the income statement previously reported (755)
4 Net financing
Notes
2015 2014
Per consolidated
income statement
£m
Underlyingfinancing2
£m
Per consolidated
income statement
£m
Underlyingfinancing2
£m
Financing incomeInterest receivable 12 12 17 17 Fair value gains on foreign currency contracts 1 16 – – 2 – Financial RRSAs – foreign exchange differences and other unrealised changes in value 16 21 – – – Finance income on post-retirement scheme surpluses 18 65 – 13 – Net foreign exchange gains 3 17 32 – –
115 44 32 17 Financing costsInterest payable (71) (71) (63) (63)Fair value losses on foreign currency contracts 1 16 (1,217) – (1,127) – Financial RRSAs – financing 16 (8) (8) (5) (5)Financial RRSAs – foreign exchange differences and other unrealised changes in value 16 (13) – (8) – Fair value losses on commodity derivatives1 16 (89) – (15) – Finance cost on post-retirement scheme deficits 18 (33) – (42) – Net foreign exchange losses – – (13) – Other financing charges (25) (25) (11) (10)
(1,456) (104) (1,284) (78)Net financing (1,341) (60) (1,252) (61)
Analysed as:Net interest payable (59) (59) (46) (46)Net post-retirement scheme financing 32 – (29) – Net other financing (1,314) (1) (1,177) (15)Net financing (1,341) (60) (1,252) (61)1 Net (loss) / gain on fair value items through profit or loss (1,306) – (1,140) –
2 See Note 2 3 The underlying financing income of includes £34m from gains on settlement of foreign exchange following the receipt in the UK of dividends from overseas subsidiaries.
Financial Statements
Rolls-Royce plc Annual Report 2015 85

NOTES TO THE CONSOLIDATED FINANCIAL STATEMENTS CONTINUED
5 TaxationUK Overseas Total
2015£m
2014£m
2015£m
2014£m
2015£m
2014£m
Current taxCurrent tax charge for the year 9 8 157 240 166 248 Less double tax relief – – – – – –
9 8 157 240 166 248 Adjustments in respect of prior years 6 1 (23) 12 (17) 13
15 9 134 252 149 261
Deferred taxDeferred tax credit for the year (37) (72) (23) (77) (60) (149)Adjustments in respect of prior years 10 (14) (5) (11) 5 (25)Derecognition of advance corporation tax – 64 – – – 64 Deferred tax credit resulting from reduction in tax rates (18) – – – (18) –
(45) (22) (28) (88) (73) (110)
Recognised in the income statement (30) (13) 106 164 76 151
OTHER TAX (CHARGES)/CREDITSOCI Equity
Items that will not be reclassified
Items that may be reclassified
2015£m
2014£m
2015£m
2014£m
2015£m
2014£m
Current tax:Share-based payments – direct to equity – 3
Deferred tax:Movement in post-retirement schemes 257 (431)Share-based payments – direct to equity (6) (7)Net investment hedge (2) (2)
257 (431) (2) (2) (6) (4)
TAX RECONCILIATION ON CONTINUING OPERATIONS 2015
£m2014
£m
Profit before taxation 160 146Less share of results of joint ventures and associates (note 10) (100) (94)Profit before taxation excluding joint ventures and associates 60 52
Nominal tax charge at UK corporation tax rate 20.25% (2014: 21.5%) 12 11UK R&D credit – (6)Rate differences 1 63 71 Impairment of goodwill 13 – Other permanent differences 5 22 Benefit to deferred tax from previously unrecognised tax losses and temporary differences (7) (3)Tax losses in year not recognised in deferred tax 20 4 Adjustments in respect of prior years (12) (12)Derecognition of advance corporation tax – 64 Reduction in closing deferred taxes resulting from decrease in tax rates (18) –
76 151 Underlying items (note 2) 351 390Non-underlying items (275) (239)
76 151
1 Rate differences mainly relate to tax on profits in countries, such as the US and Germany, which have higher tax rates than the UK.
Financial Statements
86 Rolls-Royce plc Annual Report 2015

Financial Statements
5 Taxation continuedTAX ON DISCONTINUED OPERATIONS
2015£m
2014£m
Tax credit on ordinary activities of the discontinued operation – (3)Tax credit on profit on disposal of discontinued operations – (2)
– (5)
Deferred taxation assets and liabilities 2015
£m2014
£m
At 1 January (859) (566)Amount credited to income statement 73 120 Amount credited/(charged) to other comprehensive income 255 (433)Amount charged to equity (6) (7)Acquisition of businesses – (3)Exchange differences 16 30
At 31 December (521) (859)Deferred tax assets 318 369 Deferred tax liabilities (839) (1,228)
(521) (859)
The analysis of the deferred tax position is as follows:At
1 January 2015
£m
Recognisedin income
statement £m
Recognisedin OCI
£m
Recognisedin equity
£m
Exchange differences
£m
At 31 December
2015£m
Intangible assets (455) 52 – – 11 (392)Property, plant and equipment (195) 7 – – (2) (190)Other temporary differences 97 (69) (2) (7) 2 21 Amounts recoverable on contracts (526) (13) – – – (539)Pensions and other post-retirement scheme benefits (324) (30) 257 – 7 (90)Foreign exchange and commodity financial assets and liabilities 135 171 – – – 306 Losses 393 (49) – 1 (2) 343 R&D expenditure credit 16 4 – – – 20
(859) 73 255 (6) 16 (521)
At 1 January
2014£m
Recognisedin income
statement £m
Recognisedin OCI
£m
Recognisedin equity
£m
Disposal of businesses
£m
Exchange movements
£m
At 31 December
2014£m
Intangible assets (511) 41 – – – 15 (455)Property, plant and equipment (210) 20 – – (6) 1 (195)Other temporary differences 80 23 (2) (10) (1) 7 97 Amounts recoverable on contracts (380) (146) – – – – (526)Pensions and other post-retirement scheme benefits 153 (54) (431) – – 8 (324)Foreign exchange and commodity financial assets and liabilities (92) 226 – – – 1 135 Losses 323 65 – 3 4 (2) 393 R&D expenditure credit 7 9 – – – 16 Advance corporation tax 64 (64) – – – – –
(566) 120 (433) (7) (3) 30 (859)Included in: Taxation 110 Discontinued operations 10
Financial Statements
Rolls-Royce plc Annual Report 2015 87
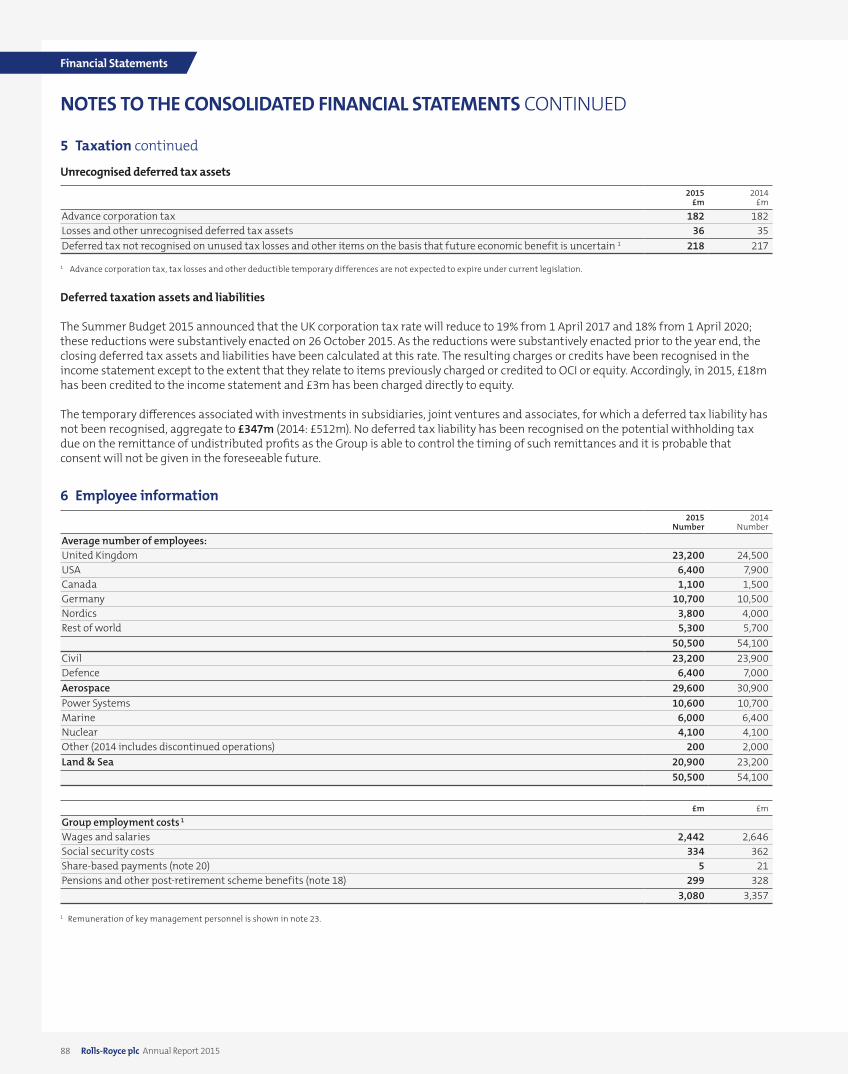
NOTES TO THE CONSOLIDATED FINANCIAL STATEMENTS CONTINUED
5 Taxation continued
Unrecognised deferred tax assets
2015£m
2014£m
Advance corporation tax 182 182 Losses and other unrecognised deferred tax assets 36 35 Deferred tax not recognised on unused tax losses and other items on the basis that future economic benefit is uncertain 1 218 217
1 Advance corporation tax, tax losses and other deductible temporary differences are not expected to expire under current legislation.
Deferred taxation assets and liabilities
The Summer Budget 2015 announced that the UK corporation tax rate will reduce to 19% from 1 April 2017 and 18% from 1 April 2020; these reductions were substantively enacted on 26 October 2015. As the reductions were substantively enacted prior to the year end, the closing deferred tax assets and liabilities have been calculated at this rate. The resulting charges or credits have been recognised in the income statement except to the extent that they relate to items previously charged or credited to OCI or equity. Accordingly, in 2015, £18m has been credited to the income statement and £3m has been charged directly to equity.
The temporary differences associated with investments in subsidiaries, joint ventures and associates, for which a deferred tax liability has not been recognised, aggregate to £347m (2014: £512m). No deferred tax liability has been recognised on the potential withholding tax due on the remittance of undistributed profits as the Group is able to control the timing of such remittances and it is probable that consent will not be given in the foreseeable future.
6 Employee information2015
Number2014
Number
Average number of employees:United Kingdom 23,200 24,500 USA 6,400 7,900 Canada 1,100 1,500 Germany 10,700 10,500 Nordics 3,800 4,000 Rest of world 5,300 5,700
50,500 54,100 Civil 23,200 23,900 Defence 6,400 7,000 Aerospace 29,600 30,900 Power Systems 10,600 10,700 Marine 6,000 6,400 Nuclear 4,100 4,100 Other (2014 includes discontinued operations) 200 2,000Land & Sea 20,900 23,200
50,500 54,100
£m £m
Group employment costs 1
Wages and salaries 2,442 2,646 Social security costs 334 362 Share-based payments (note 20) 5 21 Pensions and other post-retirement scheme benefits (note 18) 299 328
3,080 3,357
1 Remuneration of key management personnel is shown in note 23.
Financial Statements
88 Rolls-Royce plc Annual Report 2015

Financial Statements
7 Auditors’ remunerationFees payable to the Company’s auditors and its associates were as follows:
2015£m
2014£m
Fees payable to the Company's auditors for the audit of the Company's annual financial statements 1 1.9 1.8 Fees payable to the Company's auditors and its associates for the audit of the Company's subsidiaries pursuant to legislation 3.7 3.7Total fees payable for audit services 5.6 5.5 Fees payable to the Company's auditors and its associates for other services:
Audit related assurance services 2 1.0 0.8 Taxation compliance services 0.4 0.7 All other services – 0.4
7.0 7.4Fees payable in respect of the Group's pension schemes:
Audit 0.2 0.2
1 The level of fees payable to the Company’s auditors for the audit of the Company’s annual financial statements reflects the fact that limited incremental work is required in respect of the audit of these financial statements. Rolls-Royce plc, a subsidiary of the Company, is also required to prepare consolidated financial statements and the fees payable to the Company’s auditors for the audit of those financial statements, including the audit of the sub-consolidation, is included in the audit of the Company’s subsidiaries pursuant to legislation.
2 This includes £0.3m (2014 £0.3m) for the review of the half-year report.
8 Intangible assets
Goodwill£m
Certificationcosts and
participation fees£m
Developmentexpenditure
£m
Contractualaftermarket
rights£m
Customer relationships
£mSoftware
£mOther
£mTotal
£m
Cost:At 1 January 2014 1,861 928 1,646 580 475 453 532 6,475
Reclassifications 1 (8) – 4 – 11 19 (28) (2)Exchange differences (112) (8) (43) – (17) (1) (28) (209)Additions – 159 100 93 – 83 42 477 Acquisitions of businesses 1 – – – – – – 1 Disposals of businesses (67) – – (35) – (11) – (113)
At 1 January 2015 1,675 1,079 1,707 638 469 543 518 6,629 Exchange differences (87) (7) (32) – (14) – (16) (156)Additions – 73 55 161 – 79 40 408 Acquisitions of businesses 1 – – – 1 – 1 3 Disposals – – – – – (6) – (6)
At 31 December 2015 1,589 1,145 1,730 799 456 616 543 6,878
Accumulated amortisation:At 1 January 2014 23 265 444 352 69 198 137 1,488
Reclassifications 1 (8) – 4 – (11) 5 6 (4)Exchange differences – – (9) – (4) – (6) (19)Charge for the year 1 – 46 125 37 42 63 53 366 Impairment 1 – – – – – – 1 Disposal of businesses – – – – – (7) – (7)
At 1 January 2015 16 311 564 389 96 259 190 1,825 Exchange differences (5) (1) (10) – (3) – (3) (22)Charge for the year 2 – 63 137 55 46 68 38 407 Impairment 75 – – – – – – 75 Reversal of impairment – – – (50) – – – (50)Disposals – – – – – (2) – (2)
At 31 December 2015 86 373 691 394 139 325 225 2,233
Net book value:At 31 December 2015 1,503 772 1,039 405 317 291 318 4,645 At 31 December 2014 1,659 768 1,143 249 373 284 328 4,804 At 1 January 2014 1,838 663 1,202 228 406 255 395 4,987
1 In 2013, following the acquisition of RRPS, the Group revised the classification of intangible assets. During 2014, a number of minor inconsistencies in these classifications were identified and amended. The net movement of £2m relates to software previously included in property, plant and equipment.
2 Charged to cost of sales except development costs, which are charged to research and development costs.
Financial Statements
Rolls-Royce plc Annual Report 2015 89

Financial Statements
90 Rolls-Royce plc Annual Report 2015
NOTES TO THE CONSOLIDATED FINANCIAL STATEMENTS CONTINUED
8 Intangible assets continuedGOODWILLIn accordance with the requirements of IAS 36 Impairment of Assets, goodwill is allocated to the Group’s cash-generating units, or groups of cash-generating units, that are expected to benefit from the synergies of the business combination that gave rise to the goodwill as follows:
CASH-GENERATING UNIT (CGU) OR GROUP OF CGUsPrimary reporting
segment2015
£m2014
£m
Rolls-Royce Deutschland Ltd & Co KG Civil Aerospace 202 215 Commercial marine – arising from the acquisitions of Vinters plc and Scandinavian Electric Holdings AS Marine 491 552 Commercial marine – arising from the acquisition of ODIM ASA Marine 25 77 Rolls-Royce Power Systems AG Power Systems 739 760 Other Various 46 55
1,503 1,659
Goodwill has been tested for impairment during 2015 on the following basis:
• The carrying value of goodwill has been assessed by reference to value in use. These have been estimated using cash flows from the most recent forecasts prepared by management, which are consistent with past experience and external sources of information on market conditions. Given the long-term and established nature of many of the Group’s products (product lives are often measured in decades), these forecasts generally cover the next ten years. Growth rates for the period not covered by the forecasts are based on a range of growth rates 2.0-2.75 %) that reflect the products, industries and countries in which the relevant CGU or group of CGUs operate.
• The key assumptions for the impairment tests are the discount rate and, in the cash flow projections, the programme assumptions, the growth rates and the impact of foreign exchange rates on the relationship between selling prices and costs. Impairment tests are performed using prevailing exchange rates.
• The pre-tax cash flow projections have been discounted at rates based on the Group’s weighted average cost of capital, adjusted for specific risk where appropriate. The discount rate used, before taking account of specific risks, is 13% (2014: 13%).
As a result of the continuing poor market conditions in the Marine offshore business caused by the low crude oil price and the consequential reduced order intake in the period, the Group has recognised an impairment loss of £69m (included in the total impairment charge of £75m) to the carrying value of goodwill of cash generating units in this market. This is included in cost of sales in the income statement, but excluded from the underlying results. The impairment loss primarily relates to the cash generating units Scandinavian Electric Holdings ASA (acquired in 2008) and ODIM ASA (acquired in 2010), which are both business operations included in Marine. The impairment loss is based on a value in use calculation using cash flows forecast over a ten year period and a pre-tax discount rate of 13% which indicated a recoverable amount of £74m compared with a pre-impairment carrying value of £143m.

Financial Statements
Rolls-Royce plc Annual Report 2015 91
Financial Statements
8 Intangible assets continuedThe principal value in use assumptions for goodwill balances considered to be individually significant are:
• Rolls-Royce Power Systems AG – Volume of equipment deliveries, pricing achieved and cost escalation. These are based on current and known future programmes, estimates of capture of market share and long-term economic forecasts. The principal foreign exchange exposures are on translating income in a variety of non-functional currencies into euros. For the purposes of the impairment only, cash flows from recent management forecasts for a five-year period have been included. Cash flows beyond five years are assumed to grow at 2% (2014: 2%). Reasonably possible change in the key assumptions would cause the value in use of the goodwill to fall below its carrying value, which include a reduction in the level of cash generation of 9%, or an increase in the assumed discount rate of 2%.
• Rolls-Royce Deutschland Ltd & Co KG – Volume of engine deliveries, flying hours of installed fleet and cost escalation. These are based on current and known future programmes, estimates of customers’ fleet requirements and long-term economic forecasts. The principal foreign exchange exposure is on translating US dollar income into euros. For the purposes of the impairment test only, cash flows beyond the ten-year forecasts are assumed to grow at 2.5% (2014: 2.5%). The directors do not consider that any reasonably possible change in the key assumptions would cause the value in use of the goodwill to fall below its carrying value. The overall level of business would need to reduce by more than 69% to cause an impairment of this balance.
• Vinters Limited – Volume of equipment deliveries, capture of aftermarket and cost escalation. These are based on current and known future programmes, estimates of customers’ fleet requirements and long-term economic forecasts. The principal foreign exchange exposures are on translating income in a variety of non-functional currencies into Norwegian kroner. For the purposes of the impairment test only, cash flows beyond the ten-year forecasts are assumed to grow at 2.5% (2014: 2.5%). The directors do not consider that any reasonably possible change in the key assumptions would cause the value in use of the goodwill to fall below its carrying value. The overall level of business would need to reduce by more than 54% to cause an impairment of this balance.
OTHER INTANGIBLE ASSETSCertification costs and participation fees, development costs and recoverable engine costs have been reviewed for impairment in accordance with the requirements of IAS 36 Impairment of Assets. Where an impairment test was considered necessary, it has been performed on the following basis:
• The carrying values have been assessed by reference to value in use. These have been estimated using cash flows from the most recent forecasts prepared by management, which are consistent with past experience and external sources of information on market conditions over the lives of the respective programmes.
• The key assumptions underlying cash flow projections are assumed market share, programme timings, unit cost assumptions, discount rates, and foreign exchange rates.
• The pre-tax cash flow projections have been discounted at 11% (2014: 11%), based on the Group’s weighted average cost of capital, reduced where relevant to take account of the lower risk associated with contracted aftermarket flows.
• No impairment is required on this basis. However, a combination of changes in assumptions and adverse movements in variables that are outside the Group’s control (discount rate, exchange rate and airframe delays), could result in impairment in future years.
During the year, following analysis of the first major overhauls of the Trent 1000 engines, the recoverable amount of certain contractual aftermarket rights have been reassessed. This analysis demonstrated that the aftermarket cash flows from the engines were better than originally assumed, arising from both operational and contractual performance improvements. As a result of this analysis, the value in use (based on a pre-tax discount rate of 9%) has increased to around £140m, exceeding the unimpaired carrying value of £72m. Accordingly, cumulative impairments prior to 2015 of £50m have been reversed. This reversal is included in the Civil Aerospace business cost of sales.

Financial Statements
92 Rolls-Royce plc Annual Report 2015
NOTES TO THE CONSOLIDATED FINANCIAL STATEMENTS CONTINUED
9 Property, plant and equipmentLand and buildings
£m
Plant and equipment
£m
Aircraft and engines
£m
In course of construction
£mTotal
£m
Cost:At 1 January 2014 1,297 3,490 324 700 5,811
Exchange differences (23) (42) (1) 2 (64)Additions 24 160 57 427 668 Acquisitions of businesses – – 38 – 38 Disposals of businesses (88) (94) (77) (28) (287)Reclassifications 134 137 32 (305) (2)Disposals/write-offs (10) (51) (52) (1) (114)
At 1 January 2015 1,334 3,600 321 795 6,050 Exchange differences (20) (39) (2) (3) (64)Additions 18 117 19 340 494 Acquisitions of businesses – 1 – – 1 Disposals of businesses – (1) – – (1)Reclassifications 81 335 7 (423) – Transferred to assets held for sale (8) (23) (2) – (33)Disposals/write-offs (30) (96) (4) (1) (131)
At 31 December 2015 1,375 3,894 339 708 6,316
Accumulated depreciation:At 1 January 2014 386 1,949 84 – 2,419
Exchange differences (8) (26) – – (34)Charge for the year 1 49 294 31 – 374 Impairment – – – 1 1 Reclassifications (29) (62) (9) – (100)Disposals/write-offs (7) (46) (3) – (56)
At 1 January 2015 391 2,109 103 1 2,604 Exchange differences (7) (24) (1) – (32)Charge for the year 1 48 299 26 – 373 Impairment 3 2 – – 5 Disposals of businesses – (1) – – (1)Transferred to assets held for sale (5) (20) (1) – (26)Disposals/write-offs (14) (81) (2) – (97)
At 31 December 2015 416 2,284 125 1 2,826
Net book value:At 31 December 2015 959 1,610 214 707 3,490 At 31 December 2014 943 1,491 218 794 3,446 At 1 January 2014 911 1,541 240 700 3,392
1 Depreciation charged during the year is presented in the income statement or included in the cost of inventory as appropriate.

Financial Statements
Rolls-Royce plc Annual Report 2015 93
Financial Statements
9 Property, plant and equipment continuedProperty, plant and equipment include:
2015£m
2014£m
Net book value of finance leased assets:Land and buildings 5 6 Plant and equipment 7 9 Aircraft and engines 40 43
Assets held for use in operating leases:Cost 321 267 Depreciation (87) (64)Net book value 234 203
Capital expenditure commitments 167 194 Cost of fully depreciated assets 853 792
The Group’s share of equity accounted entities’ capital commitments is £75m (2014 £82m).
10 InvestmentsCOMPOSITION OF THE GROUPThe entities contributing to the Group’s financial results are listed on pages 143 to 149.
NON-CONTROLLING INTERESTSIn 2015 the Group did not have any material non-wholly owned subsidiaries. On 7 March 2014, Daimler AG announced its intention to exercise its put option on its 50% of Rolls-Royce Power Systems Holding GmbH (RRPSH). Formal notice of this intention was served on 24 March 2014. From this date, the Group had an effective economic interest in RRPSH of 100% and NCI of £584m was transferred to retained earnings. The Group acquired the shares on 26 August 2014, giving it a 100% interest in RRPSH.
Summarised financial information for RRPSH is as follows:At
24 March 20141
£m
Current assets 1,529 Non-current assets 2,511 Current liabilities (974)Non-current liabilities (1,118)Equity attributable to Rolls-Royce shareholders 1,364 Non-controlling interests 584
1 Immediately prior to the exercise of the put option
Period to 24 March
2014 £m
Revenue 551 Loss for the period (25)
Attributable to ordinary shareholders (12)Non-controlling interests (12)
Total comprehensive income for the period (69)Attributable to ordinary shareholders (35)Non-controlling interests (35)
Dividends paid to non-controlling interests (76)Cash flow from operating activities 33 Cash flow from investing activities (17)Cash flow from financing activities (158)Net cash outflow (142)

Financial Statements
94 Rolls-Royce plc Annual Report 2015
NOTES TO THE CONSOLIDATED FINANCIAL STATEMENTS CONTINUED
10 Investments continuedEQUITY ACCOUNTED AND OTHER INVESTMENTS
Equity accounted Other
Joint ventures£m
Associates£m
Total£m
Unlisted£m
At 1 January 2014 599 2 601 27 Reclassification 1 (25) – (25) – Exchange differences 7 – 7 (2)Additions 15 2 17 11 Taxation paid by the Group 3 – 3 – Transfer to subsidiary (1) – (1) – Share of retained profit 23 – 23 – Disposals (70) – (70) – Return of capital (3) – (3) – Consolidation of previously non-consolidated subsidiary – – – (5)Share of OCI – may be reclassified to profit or loss (13) – (13) –
At 1 January 2015 535 4 539 31 Exchange differences 7 – 7 (2)Additions 12 3 15 6 Taxation paid by the Group (3) – (3) – Share of retained profit 42 (5) 37 – Impairment – – – (2)Share of OCI – may be reclassified to profit or loss (19) – (19) –
At 31 December 2015 574 2 576 33
1 The reclassification relates to an adjustment in the 2013 relating to transactions between the Group and a joint venture which was included in creditors. It was transferred to investments in joint ventures in 2014.
RECONCILIATION TO THE INCOME STATEMENT AND CASH FLOW STATEMENTContinuing operations Discontinued operations Total
2015£m
2014£m
2015£m
2014£m
2015£m
2014£m
Share of profit after tax 100 94 – 2 100 96 Share of dividends paid (63) (71) – (2) (63) (73)Share of retained profit 37 23 – – 37 23
The following joint ventures are considered to be individually material to the Group:Principal location Activity Ownership interest
Alpha Partners Limited (APL) UK Aero engine leasing 50.0%Hong Kong Aero Engine Services Limited (HAESL) Hong Kong Aero engine repair and overhaul 45.0%Singapore Aero Engine Services Pte Limited (SAESL) Singapore Aero engine repair and overhaul 39.0%Industria de Turbo Propulsores SA (ITP) Spain Aero engine component manufacture and maintenance 46.9%

Financial Statements
Rolls-Royce plc Annual Report 2015 95
Financial Statements
10 Investments continuedSummarised financial information of the Group’s individually material joint ventures is as follows:
APL HAESL SAESL ITP
2015 £m
2014 £m
2015 £m
2014 £m
2015£m
2014 £m
2015 £m
2014 £m
Revenue 130 105 652 652 626 815 520 529 Profit from continuing operations 65 39 27 34 46 60 40 24 Post-tax profit from discontinued operations – – – – – – – – Profit for the year 65 39 27 34 46 60 40 24 Other comprehensive operations – – – – – – – – Total comprehensive income for the year 65 39 27 34 46 60 40 24 Dividends received during the year (29) (13) (23) (30) (35) (56) (19) (19)Profit for the year included the following:
Depreciation and amortisation (59) (47) (8) (8) (5) (5) (37) (37)Interest income – – – – – – 10 19 Interest expense (17) (15) (1) (1) – (1) (16) (12)Income tax expense (7) (11) (5) (7) – – 7 4
Current assets 129 72 223 159 218 207 576 603 Non-current assets 1,349 1,171 85 86 125 102 554 525 Current liabilities (70) (62) (116) (61) (75) (88) (416) (415)Non-current liabilities (1,123) (959) (38) (37) (136) (106) (431) (418)Net assets 285 222 154 147 132 115 283 295 Included in the above:
Cash and cash equivalents 20 11 4 8 10 11 225 256Current financial liabilities 1 (19) (13) – – – – (25) (10)Non-current financial liabilities 1 (969) (815) (30) (29) (136) (106) (273) (282)
1 Excluding trade and other payables.
Reconciliation to the carrying amount recognised in the consolidated financial statementsOwnership interest 50.0% 50.0% 45.0% 45.0% 39.0% 39.0% 46.9% 46.9%Group share of net assets above 143 111 69 66 51 45 133 138
The summarised aggregated results of the Group’s share of all equity accounted investments is as follows:Joint ventures Associates Total
2015£m
2014£m
2015£m
2014£m
2015£m
2014£m
Assets:Non-current assets 1,998 1,911 – 2 1,998 1,913 Current assets 843 715 2 4 845 719
Liabilities: 2
Current liabilities (541) (519) – (1) (541) (520)Non-current liabilities (1,726) (1,572) – (1) (1,726) (1,573)
574 535 2 4 576 539 2 Liabilities include borrowings of: (1,473) (1,376) – – (1,473) (1,376)
Post-tax profit from continuing operations 105 94 (5) – 100 94 Post-tax profit from discontinued operations – 2 – – – 2 Profit for the year 105 96 (5) – 100 96 Other comprehensive income (19) (13) – – – (13)Total comprehensive income for the year 86 83 (5) – 100 83

Financial Statements
96 Rolls-Royce plc Annual Report 2015
NOTES TO THE CONSOLIDATED FINANCIAL STATEMENTS CONTINUED
11 Inventories2015
£m2014
£m
Raw materials 509 553 Work in progress 882 984 Long-term contracts work in progress 23 22 Finished goods 1,173 1,149 Payments on account 50 60
2,637 2,768
Inventories stated at net realisable value 221 265 Amount of inventory write-down 64 62 Reversal of inventory write-down 14 1
12 Trade and other receivables2015
£m2014
£m
Trade receivables 1,612 1,531 Amounts recoverable on contracts 1 3,179 2,684 Amounts owed by parent undertaking 1,741 1,311 Amounts owed by joint ventures and associates 252 309 Other receivables 1,006 785 Prepayments and accrued income 195 200
7,985 6,820
Analysed as:Financial instruments (note 16):
Trade receivables and similar items 2,061 1,981 Other non-derivative financial assets 843 671
Non-financial instruments 5,081 4,168 7,985 6,820
Trade and other receivables expected to be recovered in more than one year:Trade receivables 57 40 Amounts recoverable on contracts 2,768 2,444 Amounts owed by joint ventures and associates 1 – Other receivables 131 61 Prepayments and accrued income 68 55
3,025 2,600
1 Amounts recoverable on contracts include £2,994m (2014 £2,492m) of TotalCare assets.
13 Cash and cash equivalents2015
£m2014
£m
Cash at bank and in hand 662 739 Money-market funds 783 692 Short-term deposits 1,731 1,431
3,176 2,862
Overdrafts (note 14) – – Cash and cash equivalents per cash flow statement (page 68) 3,176 2,862
Cash held as collateral against third party obligations (note 17) 35 42
Cash and cash equivalents at 31 December 2015 include £21m (2014: £30m) that is not available for general use by the Group. This balance relates to cash held in non-wholly owned subsidiaries and the Group’s captive insurance company.

Financial Statements
Rolls-Royce plc Annual Report 2015 97
Financial Statements
14 BorrowingsCurrent Non-current Total
2015£m
2014£m
2015£m
2014£m
2015£m
2014£m
UnsecuredOverdrafts – – – – – – Bank loans 217 12 330 392 547 404 7 3⁄8% Notes 2016 £200m 200 – – 200 200 200 6.55% Notes 2015 US$83m 1 – 55 – – – 55 6.75% Notes 2019 £500m 2 – – 536 547 536 547 2.375% Notes 2020 US$500m 1 – – 333 – 333 – 2.125% Notes 2021 €750m 1 – – 576 615 576 615 3.625% Notes 2025 US$1,000m1 – – 668 – 668 – 3.375% Notes 2026 £375m 2 – – 390 395 390 395
SecuredObligations under finance leases: 3 2 1 50 44 52 45
419 68 2,883 2,193 3,302 2,261
1 These notes are the subject of interest rate swap agreements under which the Group has undertaken to pay floating rates of interest, and currency swaps which form a fair value hedge. 2 These notes are the subject of interest rate swap agreements under which the Group has undertaken to pay floating rates of interest which form a fair value hedge. 3 Obligations under finance leases are secured by related leased assets.
15 Trade and other payablesCurrent Non-current Total
2015£m
2014£m
2015£m
2014£m
2015£m
2014£m
Payments received on account 1 1,491 1,291 516 860 2,007 2,151 Trade payables 1,397 1,348 23 13 1,420 1,361 Amounts owed to parent undertaking 497 889 – – 497 889 Amounts owed to joint ventures and associates 197 235 2 4 199 239 Other taxation and social security 90 109 1 1 91 110 Other payables 1,784 1,756 361 320 2,145 2,076 Accruals and deferred income 1,964 2,052 1,414 1,247 3,378 3,299
7,420 7,680 2,317 2,445 9,737 10,125 1 Includes payments received on account from joint ventures
and associates 161 158 35 99 196 257
Included within trade and other payables are government grants of £64m (2014: £80m). During the year, £21m (2014: £24m) of government grants were released to the income statement.
Included in accruals and deferred income are deferred receipts from RRSA workshare partners of £228m, (2014: £244m) and £718m (2014: £687m) of TotalCare liabilities.
Trade and other payables are analysed as follows:2015
£m2014
£m
Financial instruments (note 16):Trade payables and similar items 3,101 3,049 Other non-derivative financial liabilities 817 831
Non-financial instruments 5,819 6,245 9,737 10,125

Financial Statements
98 Rolls-Royce plc Annual Report 2015
NOTES TO THE CONSOLIDATED FINANCIAL STATEMENTS CONTINUED
16 Financial instrumentsCARRYING VALUES AND FAIR VALUES OF FINANCIAL INSTRUMENTS
Notes
Basis for determining
fair value
Assets Liabilities Total
Fair value through
profit or loss£m
Loans and receivables
£m
Available for sale
£mCash
£m
Fair value through
profit or loss£m
Other£m £m
2015Unlisted non-current asset investments 10 A – 33 – – – – 33 Trade receivables and similar items 12 B – 2,061 – – – – 2,061 Other non-derivative financial assets 12 B – 843 – – – – 843 Derivative financial assets 1 C 112 – – – – – 112 Short-term investments B – 2 – – – – 2 Cash and cash equivalents 13 B – 1,731 783 662 – – 3,176 Borrowings 14 D – – – – – (3,302) (3,302)Derivative financial liabilities 1 C – – – – (1,843) – (1,843)Financial RRSAs E – – – – – (110) (110)Trade payables and similar items 15 B – – – – – (3,101) (3,101)Other non-derivative financial liabilities 15 B – – – – – (817) (817)
112 4,670 783 662 (1,843) (7,330) (2,946)
2014Unlisted non-current asset investments 10 A – 31 – – – – 31 Trade receivables and similar items 12 B – 1,981 – – – – 1,981 Other non-derivative financial assets 12 B – 671 – – – – 671 Derivative financial assets1 C 129 – – – – – 129 Short-term investments B – 7 – – – – 7 Cash and cash equivalents 13 B – 1,431 692 739 – – 2,862 Borrowings 14 D – – – – – (2,261) (2,261)Derivative financial liabilities1 C – – – – (759) – (759)Financial RRSAs E – – – – – (145) (145)Trade payables and similar items 15 B – – – – – (3,049) (3,049)Other non-derivative financial liabilities 15 B – – – – – (831) (831)
129 4,121 692 739 (759) (6,286) (1,364)
1 In the event of counterparty default relating to derivative financial assets and liabilities, off-setting would apply and financial assets and liabilities held with the same counterparty would net off. If this occurred with every counterparty, total financial assets would be nil and liabilities £1,731m.
Fair values equate to book values for both 2015 and 2014, with the following exceptions: 2015 2014
Book value£m
Fair value£m
Book value£m
Fair value£m
Borrowings (3,302) (3,312) (2,261) (2,362)Financial RRSAs (110) (110) (145) (152)
The fair value of a financial instrument is the price at which an asset could be exchanged, or a liability settled, between knowledgeable, willing parties in an arms-length transaction. Fair values have been determined with reference to available market information at the balance sheet date, using the methodologies described below.A These primarily comprise unconsolidated companies where fair value approximates to the book value.B Fair values are assumed to approximate to cost either due to the short-term maturity of the instruments or because the interest rate of the investments is reset after periods not
exceeding six months.C Fair values of derivative financial assets and liabilities are estimated by discounting expected future contractual cash flows using prevailing interest rate curves. Amounts
denominated in foreign currencies are valued at the exchange rate prevailing at the balance sheet date. These financial instruments are included on the balance sheet at fair value, derived from observable market prices (Level 2 as defined by IFRS 13 Fair Value Measurement).
D Borrowings are carried at amortised cost. Amounts denominated in foreign currencies are valued at the exchange rate prevailing at the balance sheet date.E The fair value of RRSAs is estimated by discounting expected future cash flows. The contractual cash flows are based on future trading activity, which is estimated based on latest
forecasts (Level 3 as defined by IFRS 13).
IFRS 13 Fair Value Measurement defines a three level valuation hierarchy:Level 1 – quoted prices for similar instrumentsLevel 2 – directly observable market inputs other than Level 1 inputsLevel 3 – inputs not based on observable market data

Financial Statements
Rolls-Royce plc Annual Report 2015 99
Financial Statements
16 Financial instruments continuedCARRYING VALUES OF OTHER FINANCIAL ASSETS AND LIABILITIES
Foreign exchange contracts
£m
Commodity contracts
£m
Interest rate contracts
£m
Total derivatives
£m
Financial RRSAs
£mTotal
£m
2015Non-current assets 3 – 80 83 – 83 Current assets 29 – – 29 – 29 Assets 32 – 80 112 – 112 Current liabilities (244) (39) – (283) (19) (302)Non-current liabilities (1,428) (65) (67) (1,560) (91) (1,651)Liabilities (1,672) (104) (67) (1,843) (110) (1,953)
(1,640) (104) 13 (1,731) (110) (1,841)2014Non-current assets 28 – 79 107 – 107 Current assets 22 – – 22 – 22 Assets 50 – 79 129 – 129 Current liabilities (144) (21) – (165) (22) (187)Non-current liabilities (545) (22) (27) (594) (123) (717)Liabilities (689) (43) (27) (759) (145) (904)
(639) (43) 52 (630) (145) (775)
DERIVATIVE FINANCIAL INSTRUMENTSThe Group uses various financial instruments to manage its exposure to movements in foreign exchange rates. Where the effectiveness of a hedging relationship in a cash flow hedge is demonstrated, changes in the fair value that are deemed effective are included in the cash flow hedge reserve and released to match actual payments on the hedged item. The Group uses commodity swaps to manage its exposure to movements in the price of commodities (jet fuel and base metals). To hedge the currency risk associated with a borrowing denominated in US dollars, the Group has currency derivatives designated as part of fair value hedges. The Group uses interest rate swaps and forward rate agreements to manage its exposure to movements in interest rates.
Movements in the fair values of derivative financial assets and liabilities were as follows:Foreign exchange instruments Commodity instruments Interest rate instruments Total
2015£m
2014£m
2015£m
2014£m
2015£m
2014£m
2015£m
2014£m
At 1 January (639) 498 (43) (39) 52 (6) (630) 453 Currency options at inception 1 (20) – – – – – (20) – Movements in fair value hedges 2 1 3 – – (36) 58 (35) 61 Movements in other derivative contracts 3 (1,217) (1,125) (89) (15) – – (1,306) (1,140)Contracts settled 4 235 (15) 28 11 (3) – 260 (4)
At 31 December (1,640) (639) (104) (43) 13 52 (1,731) (630)
1 The Group has written currency options to sell USD and buy GBP as part of a commercial agreement. The fair value of this option on inception is treated as a discount to the customer. 2 Gain on related hedged items £35m (2014: £61m loss).3 Included in financing. 4 Includes £8m contracts settled in fair value hedges (2014: nil).
FINANCIAL RISK AND REVENUE SHARING ARRANGEMENTS (RRSAS)
The Group’s holding company had agreed a put option with Daimler AG, such that Daimler could sell its interest in Rolls-Royce Power Systems Holding GmbH to the Group. Daimler AG exercised this option on 24 March 2014 and the Group acquired Daimler’s 50% share of RRPSH on 26 August 2014. Prior to this, the fair value of the exercise value this option was included as a financial liability.

Financial Statements
100 Rolls-Royce plc Annual Report 2015
NOTES TO THE CONSOLIDATED FINANCIAL STATEMENTS CONTINUED
16 Financial instruments continued Movements in the carrying values were as follows:
Financial RRSAs
2015£m
2014£m
At 1 January (145) (167)Exchange adjustments included in OCI – 3 Financing charge 1 (8) (5)Excluded from underlying profit:
Exchange adjustments 1 8 (8)Cash paid to partners 35 32
At 31 December (110) (145)
1 Included in financing.
RISK MANAGEMENT POLICIES AND HEDGING ACTIVITIES The principal financial risks to which the Group is exposed are: foreign currency exchange rate risk, liquidity risk, credit risk, interest rate risk and commodity price risk. The Board has approved policies for the management of these risks.
Foreign currency exchange rate risk – The Group has significant cash flows (most significantly US dollars, followed by the euro) denominated in currencies other than the functional currency of the relevant trading entity. To manage its exposures to changes in values of future foreign currency cash flows, so as to maintain relatively stable long-term foreign exchange rates on settled transactions, the Group enters into derivative forward foreign currency transactions. For accounting purposes, these derivative contracts are not designated as hedging instruments.
The Group also has exposures to the fair values of non-derivative financial instruments denominated in foreign currencies. To manage the risk of changes in these fair values, the Group enters into derivative forward foreign exchange contracts, which are designated as fair value hedges for accounting purposes.
The Group regards its interests in overseas subsidiary companies as long-term investments. The Group aims to match its translational exposures by matching the currencies of assets and liabilities. Where appropriate, foreign currency financial liabilities may be designated as hedges of the net investment.
Liquidity risk – The Group’s policy is to hold financial investments and maintain undrawn committed facilities at a level sufficient to ensure that the Group has available funds to meet its medium-term capital and funding obligations and to meet any unforeseen obligations and opportunities. The Group holds cash and short-term investments, which together with the undrawn committed facilities, enable the Group to manage its liquidity risk.
Credit risk – The Group is exposed to credit risk to the extent of non-payment by either its customers or the counterparties of its financial instruments. The effective monitoring and controlling of credit risk is a key component of the Group’s risk management activities. The Group has credit policies covering both trading and financial exposures. Credit risks arising from treasury activities are managed by a central treasury function in accordance with the Group credit policy. The objective of the policy is to diversify and minimise the Group’s exposure to credit risk from its treasury activities by ensuring the Group transacts strictly with ‘BBB+’ or higher rated financial institutions based on pre-established limits per financial institution. At the balance sheet date, there were no significant concentrations of credit risk to individual customers or counterparties. The maximum exposure to credit risk at the balance sheet date is represented by the carrying value of each financial asset, including derivative financial instruments.
Interest rate risk – The Group’s interest rate risk is primarily in relation to its fixed rate borrowings (fair value risk), floating rate borrowings and cash and cash equivalents (cash flow risk). Interest rate derivatives are used to manage the overall interest rate profile within the Group policy, which is to maintain a higher proportion of net debt at floating rates of interest as a natural hedge to the net cash position. These are designated as either fair value or cash flow hedges as appropriate.
Commodity risk – The Group has exposures to the price of jet fuel and base metals arising from business operations. To minimise its cash flow exposures to changes in commodity prices, the Group enters into derivative commodity transactions. For accounting purposes, these derivative contracts are not designated as hedging instruments.
Other price risk – The Group’s cash equivalent balances represent investments in money market instruments, with a term of up to three months. The Group does not consider that these are subject to significant price risk.

Financial Statements
Rolls-Royce plc Annual Report 2015 101
Financial Statements
16 Financial instruments continuedDERIVATIVE FINANCIAL INSTRUMENTSThe nominal amounts, analysed by year of expected maturity, and fair values of derivative financial instruments are as follows:
Expected maturity Fair value
Nominalamount
£m
Withinone year
£m
Between one and
two years£m
Betweentwo and
five years£m
Afterfive years
£mAssets
£mLiabilities
£m
At 31 December 2015Foreign exchange contracts:
Fair value hedges – – – – – – – Non-hedge accounted 22,418 5,736 4,266 11,637 779 32 (1,672)
Interest rate contracts:Fair value hedges 2,437 – – 500 1,937 74 (61)Non-hedge accounted – – – – – 6 (6)
Commodity contracts:Non-hedge accounted 268 90 72 83 23 – (104)
25,123 5,826 4,338 12,220 2,739 112 (1,843)At 31 December 2014Foreign exchange contracts:
Fair value hedges 46 46 – – – 6 – Non-hedge accounted 20,889 5,431 4,793 10,665 – 44 (689)
Interest rate contracts:Fair value hedges 1,512 53 – 500 959 74 (22)Non-hedge accounted 2 2 – – – 5 (5)
Commodity contracts:Non-hedge accounted 240 79 62 71 28 – (43)
22,689 5,611 4,855 11,236 987 129 (759)
As described above, all derivative financial instruments are entered into for risk management purposes, although these may not be designated into hedging relationships for accounting purposes.
CURRENCY ANALYSISDerivative financial instruments related to foreign exchange risks are denominated in the following currencies:
Currencies purchased forward
Sterling£m
US dollar£m
Euro£m
Other£m
Total£m
At 31 December 2015Currencies sold forward:
Sterling – 383 – 221 604 US dollar 18,869 – 1,552 902 21,323 Euro 2 76 – 125 203 Other 131 12 143 2 288
At 31 December 2014Currencies sold forward:
Sterling – 429 – 199 628 US dollar 16,659 – 2,014 938 19,611 Euro 150 61 – 185 396 Other 167 9 114 10 300
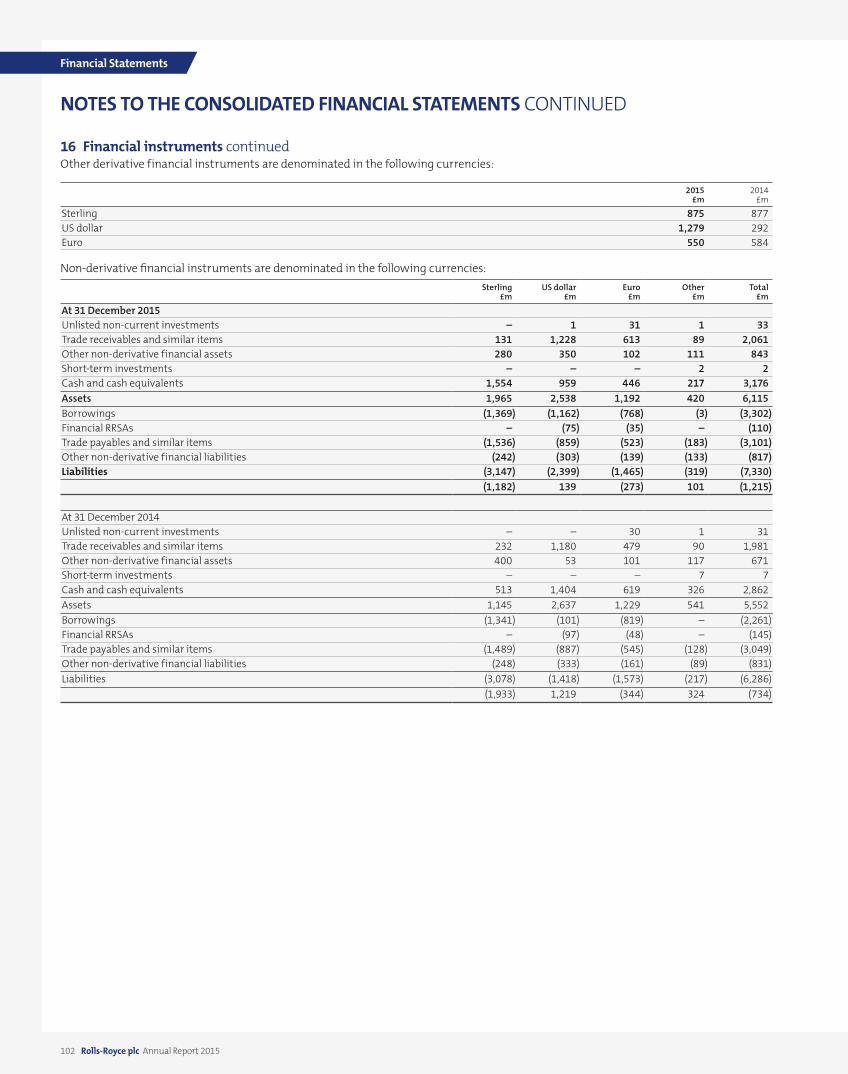
Financial Statements
102 Rolls-Royce plc Annual Report 2015
NOTES TO THE CONSOLIDATED FINANCIAL STATEMENTS CONTINUED
16 Financial instruments continuedOther derivative financial instruments are denominated in the following currencies:
2015£m
2014£m
Sterling 875 877 US dollar 1,279 292 Euro 550 584
Non-derivative financial instruments are denominated in the following currencies:Sterling
£mUS dollar
£mEuro
£mOther
£mTotal
£m
At 31 December 2015Unlisted non-current investments – 1 31 1 33 Trade receivables and similar items 131 1,228 613 89 2,061 Other non-derivative financial assets 280 350 102 111 843 Short-term investments – – – 2 2 Cash and cash equivalents 1,554 959 446 217 3,176 Assets 1,965 2,538 1,192 420 6,115 Borrowings (1,369) (1,162) (768) (3) (3,302)Financial RRSAs – (75) (35) – (110)Trade payables and similar items (1,536) (859) (523) (183) (3,101)Other non-derivative financial liabilities (242) (303) (139) (133) (817)Liabilities (3,147) (2,399) (1,465) (319) (7,330)
(1,182) 139 (273) 101 (1,215)
At 31 December 2014Unlisted non-current investments – – 30 1 31 Trade receivables and similar items 232 1,180 479 90 1,981 Other non-derivative financial assets 400 53 101 117 671 Short-term investments – – – 7 7 Cash and cash equivalents 513 1,404 619 326 2,862 Assets 1,145 2,637 1,229 541 5,552 Borrowings (1,341) (101) (819) – (2,261)Financial RRSAs – (97) (48) – (145)Trade payables and similar items (1,489) (887) (545) (128) (3,049)Other non-derivative financial liabilities (248) (333) (161) (89) (831)Liabilities (3,078) (1,418) (1,573) (217) (6,286)
(1,933) 1,219 (344) 324 (734)
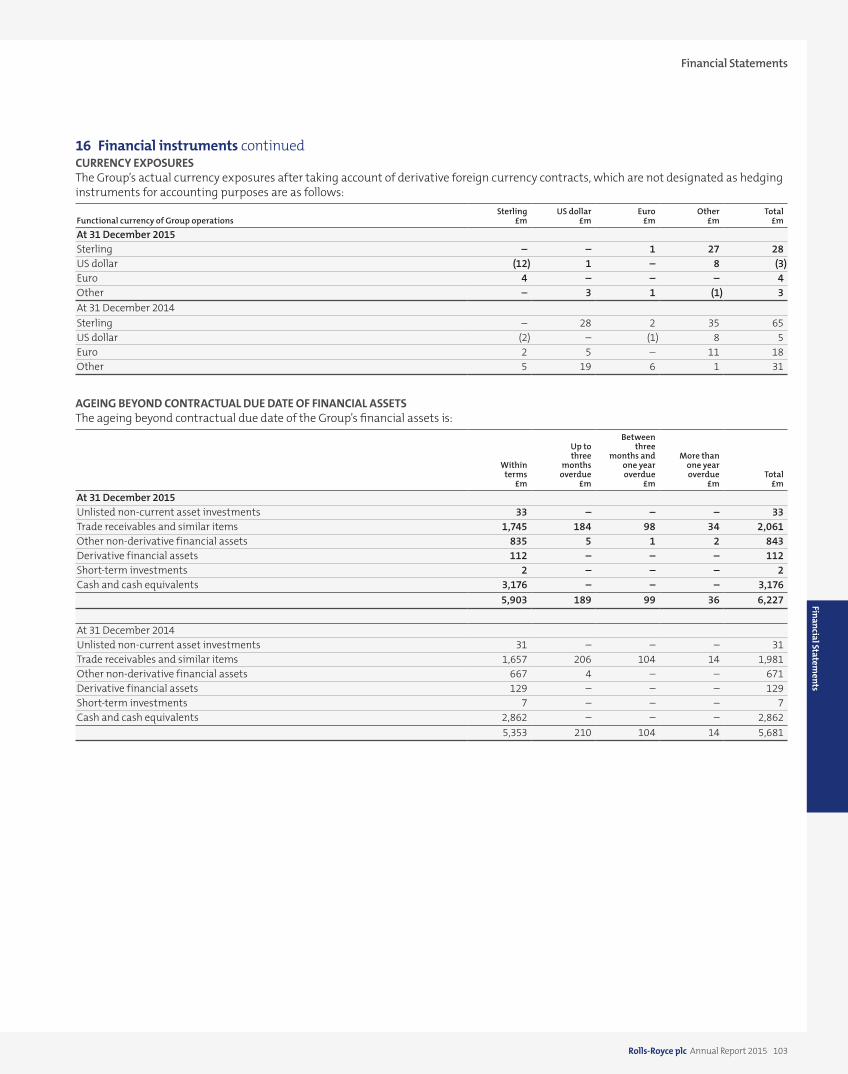
Financial Statements
Rolls-Royce plc Annual Report 2015 103
Financial Statements
16 Financial instruments continuedCURRENCY EXPOSURESThe Group’s actual currency exposures after taking account of derivative foreign currency contracts, which are not designated as hedging instruments for accounting purposes are as follows:
Functional currency of Group operationsSterling
£mUS dollar
£mEuro
£mOther
£mTotal
£m
At 31 December 2015Sterling – – 1 27 28 US dollar (12) 1 – 8 (3)Euro 4 – – – 4 Other – 3 1 (1) 3 At 31 December 2014Sterling – 28 2 35 65 US dollar (2) – (1) 8 5 Euro 2 5 – 11 18 Other 5 19 6 1 31
AGEING BEYOND CONTRACTUAL DUE DATE OF FINANCIAL ASSETSThe ageing beyond contractual due date of the Group’s financial assets is:
Withinterms
£m
Up tothree
monthsoverdue
£m
Betweenthree
months andone yearoverdue
£m
More thanone yearoverdue
£mTotal
£m
At 31 December 2015Unlisted non-current asset investments 33 – – – 33 Trade receivables and similar items 1,745 184 98 34 2,061 Other non-derivative financial assets 835 5 1 2 843 Derivative financial assets 112 – – – 112 Short-term investments 2 – – – 2 Cash and cash equivalents 3,176 – – – 3,176
5,903 189 99 36 6,227
At 31 December 2014Unlisted non-current asset investments 31 – – – 31 Trade receivables and similar items 1,657 206 104 14 1,981 Other non-derivative financial assets 667 4 – – 671 Derivative financial assets 129 – – – 129 Short-term investments 7 – – – 7 Cash and cash equivalents 2,862 – – – 2,862
5,353 210 104 14 5,681

Financial Statements
104 Rolls-Royce plc Annual Report 2015
NOTES TO THE CONSOLIDATED FINANCIAL STATEMENTS CONTINUED
16 Financial instruments continuedCONTRACTUAL MATURITY ANALYSIS OF FINANCIAL LIABILITIES
Gross values
Withinone year
£m
Betweenone and
two years£m
Betweentwo and
five years£m
Afterfive years
£mDiscounting
£m
Carryingvalue
£m
At 31 December 2015Borrowings (530) (161) (1,317) (1,897) 603 (3,302)Derivative financial liabilities (286) (329) (1,026) (314) 112 (1,843)Financial RRSAs (16) (20) (76) (10) 12 (110)Trade payables and similar items (3,059) (38) (4) – – (3,101)Other non-derivative financial liabilities (640) (43) (74) (60) – (817)
(4,531) (591) (2,497) (2,281) 727 (9,173)
At 31 December 2014Borrowings (148) (385) (214) (1,880) 366 (2,261)Derivative financial liabilities (174) (115) (324) (181) 35 (759)Financial RRSAs (17) (19) (72) (52) 15 (145)Trade payables and similar items (3,012) (32) (2) (3) – (3,049)Other non-derivative financial liabilities (650) (95) (20) (66) – (831)
(4,001) (646) (632) (2,182) 416 (7,045)
INTEREST RATE RISKIn respect of income earning financial assets and interest bearing financial liabilities, the following table indicates their effective interest rates and the periods in which they reprice. The value shown is the carrying amount.
At 31 December 2015
Period in which interest rate reprices
Effective interest rate
%Total
£m
6 monthsor less
£m6-12 months
£m
Short-term investments 1 2 2 – Cash and cash equivalents 2 3,176 3,176 – Unsecured bank loans
Other borrowings (129) (1) – £200m floating rate loan GBP LIBOR + 1.26 (200) (200) – £43m floating rate loan GBP LIBOR + 0.402 (43) (43) – €125m fixed rate loan 2.6000% (92) – – €75m fixed rate loan 2.0600% (55) – – €50m fixed rate loan 2.3500% (28) – –
Unsecured bond issues7 3⁄8% Notes 2016 £200m 7.3750% (200) – – 6.75% Notes 2019 £500m 6.7500% (536) – – Effect of interest rate swaps GBP LIBOR + 2.9824 – (536) – 2.375% Notes 2020 $500m 2.3750% (333) – – Effect of interest rate swaps GBP LIBOR + 0.8410 – (333) – 2.125% Notes 2021 €750m 2.1250% (576) – – Effect of interest rate swaps GBP LIBOR + 0.7005 – (576) – 3.625% Notes 2025 $1,000m 3.6250% (668) – – Effect of interest rate swaps GBP LIBOR + 1.4658 – (668) – 3.375% Notes 2026 £375m 3.3750% (390) – – Effect of interest rate swaps GBP LIBOR + 0.8930 – (390) –
Other securedObligations under finance leases 4.1089% (52)
(124)
1 Interest on the short-term investments are at fixed rates.2 Cash and cash equivalents comprises bank balances and demand deposits and earns interest at rates based on daily deposit rates.

Financial Statements
Rolls-Royce plc Annual Report 2015 105
Financial Statements
16 Financial instruments continued
At 31 December 2014
Period in which interest rate reprices
Effective interest rate
%Total
£m
6 monthsor less
£m6-12 months
£m
Short-term investments 1 7 5 2 Cash and cash equivalents 2 2,862 2,862 – Unsecured bank loans
Other borrowings (12) (1) – Interest rate swaps 5.8156% – 2 (2)£200m floating rate loan GBP LIBOR + 1.26 (200) (200) – €125m fixed rate loan 2.6000% (97) – – €75m fixed rate loan 2.0600% (59) – – €50m fixed rate loan 2.3500% (36) – –
Unsecured bond issues7 3⁄8% Notes 2016 £200m 7.3750% (200) – – 6.55% Notes 2015 US$83m 6.5500% (55) – (55) Effect of interest rate swaps USD LIBOR + 1.24 – (55) 55 6.75% Notes 2019 £500m 6.7500% (547) – – Effect of interest rate swaps GBP LIBOR + 2.9824% – (547) – 2.125% Notes 2021 €750m 2.1250% (615) – – Effect of interest rate swaps GBP LIBOR + 0.7005 – (615) – 3.375% Notes 2026 £375m 3.3750% (395) – – Effect of interest rate swaps GBP LIBOR + 0.8930 – (395) –
Other securedObligations under finance leases 4.1089% (45) (1) (1)
608
1 Interest on the short-term investments are at fixed rates.2 Cash and cash equivalents comprises bank balances and demand deposits and earns interest at rates based on daily deposit rates.
Some of the Group’s borrowings are subject to the Group meeting certain obligations, including customary financial covenants. If the Group fails to meet its obligations these arrangements give rights to the lenders, upon agreement, to accelerate repayment of the facilities. There are no rating triggers contained in any of the Group’s facilities that could require the Group to accelerate or repay any facility for a given movement in the Group’s credit rating.
In addition, the Group has £1,780m (2014: £1,277m) of undrawn committed borrowing facilities available for at least the next two years.
SENSITIVITY ANALYSIS
Sensitivities at 31 December (all other variables held constant) – impact on profit after tax and equity2015
£m2014
£m
Sterling 10% weaker against the US dollar (1,574) (1,336)Sterling 10% stronger against the US dollar 1,288 1,093 Euro 10% weaker against the US dollar (130) (147)Euro 10% stronger against the US dollar 111 123 Sterling 10% weaker against the Euro 18 15 Sterling 10% stronger against the Euro (15) (12)Commodity prices 10% lower (13) (15)Commodity prices 10% higher 13 15
At 31 December 2015 the Group had no material sensitivity to changes in interest rates on that date. The main interest rate sensitivity for the Group arises as a result of the gross up of net cash and this is mitigated as described under the interest rate risk management policies on page 100.
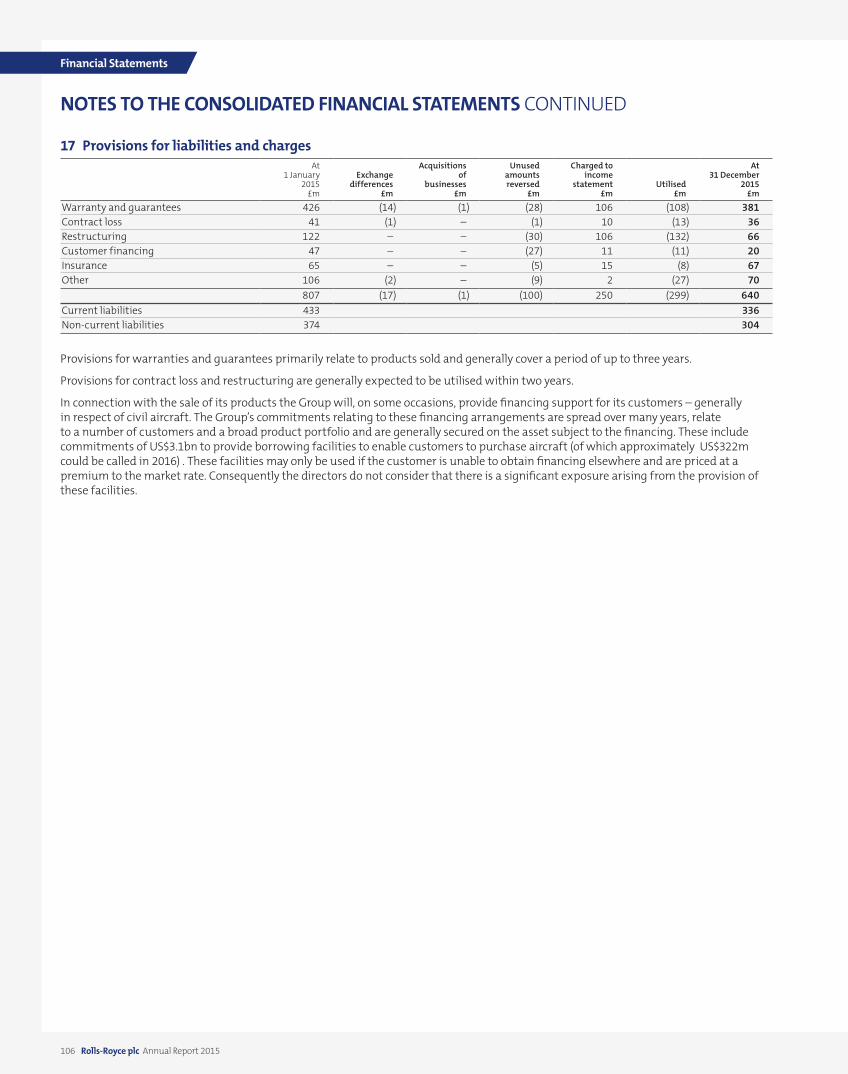
Financial Statements
106 Rolls-Royce plc Annual Report 2015
NOTES TO THE CONSOLIDATED FINANCIAL STATEMENTS CONTINUED
17 Provisions for liabilities and chargesAt
1 January2015
£m
Exchangedifferences
£m
Acquisitions of
businesses£m
Unused amountsreversed
£m
Charged toincome
statement£m
Utilised£m
At31 December
2015£m
Warranty and guarantees 426 (14) (1) (28) 106 (108) 381 Contract loss 41 (1) – (1) 10 (13) 36 Restructuring 122 – – (30) 106 (132) 66 Customer financing 47 – – (27) 11 (11) 20 Insurance 65 – – (5) 15 (8) 67 Other 106 (2) – (9) 2 (27) 70
807 (17) (1) (100) 250 (299) 640 Current liabilities 433 336 Non-current liabilities 374 304
Provisions for warranties and guarantees primarily relate to products sold and generally cover a period of up to three years.
Provisions for contract loss and restructuring are generally expected to be utilised within two years.
In connection with the sale of its products the Group will, on some occasions, provide financing support for its customers – generally in respect of civil aircraft. The Group’s commitments relating to these financing arrangements are spread over many years, relate to a number of customers and a broad product portfolio and are generally secured on the asset subject to the financing. These include commitments of US$3.1bn to provide borrowing facilities to enable customers to purchase aircraft (of which approximately US$322m could be called in 2016) . These facilities may only be used if the customer is unable to obtain financing elsewhere and are priced at a premium to the market rate. Consequently the directors do not consider that there is a significant exposure arising from the provision of these facilities.

Financial Statements
Rolls-Royce plc Annual Report 2015 107
Financial Statements
17 Provisions for liabilities and charges continuedCustomer financing provisions cover guarantees provided for asset value and/or financing. These guarantees, the risks arising and the process used to assess the extent of the risk are described under the heading ‘Customer financing’ in the Finance Review on page 44. It is estimated that the provision will be utilised as follows:
2015£m
2014£m
Potential claims with specific claim dates:In one year or less 3 32 In more than one year but less than five years 12 11 In more than five years 5 4
20 47
Commitments on delivered aircraft in excess of the amounts provided are shown in the table below. These are reported on a discounted basis at the Group’s borrowing rate to reflect better the time span over which these exposures could arise. These amounts do not represent values that are expected to crystallise. The commitments are denominated in US dollars. As the Group does not generally adopt cash flow hedge accounting for future foreign exchange transactions, this amount is reported, together with the sterling equivalent at the reporting date spot rate. The values of aircraft providing security are based on advice from a specialist aircraft appraiser.
2015 2014
£m $m £m $m
Gross commitments 269 399 388 605 Value of security 1 (136) (201) (245) (382)Indemnities (79) (118) (84) (132)Net commitments 54 80 59 91 Net commitments with security reduced by 20% 2 78 115 90 140 1 Security includes unrestricted cash collateral of: 35 52 42 66
2 Although sensitivity calculations are complex, the reduction of relevant security by 20% illustrates the sensitivity to changes in this assumption.
The Group’s captive insurance company retains a portion of the exposures it insures on behalf of the remainder of the Group. Significant delays occur in the notification and settlement of claims and judgement is involved in assessing outstanding liabilities, the ultimate cost and timing of which cannot be known with certainty at the balance sheet date. The insurance provisions are based on information currently available, however it is inherent in the nature of the business that ultimate liabilities may vary. Provisions for outstanding claims are established to cover the outstanding expected liability as well as claims incurred but not yet reported.
Other provisions comprise a number of liabilities with varying expected utilisation rates.

Financial Statements
108 Rolls-Royce plc Annual Report 2015
NOTES TO THE CONSOLIDATED FINANCIAL STATEMENTS CONTINUED
18 Post-retirement benefitsThe Group operates a number of defined benefit and defined contribution schemes:
• UK defined benefit schemes are funded, with the assets are held in separate trustee administered funds. Employees are entitled to retirement benefits based on either their final or career average salaries and length of service; and
• Overseas defined benefit schemes are a mixture of funded and unfunded plans and provide benefits in line with local practice. Additionally in the US, and to a lesser extent in some other countries, the Group’s employment practices include the provision of healthcare and life insurance benefits for retired employees. These schemes are unfunded.
The valuations of the defined benefit schemes are based on the most recent funding valuations, where relevant, updated by the scheme actuaries to 31 December 2015.
The defined benefit schemes expose the Group to actuarial risks such as longevity, interest rate, inflation and investment risks. In the UK, and in the principal North American pension schemes, the Group has adopted investment policies to mitigate some of these risks. This involves investing a significant proportion of the schemes’ assets in Liability Driven Investment (LDI) portfolios, which hold investments designed to offset interest rate and inflation rate risks. In addition, in the UK, the Rolls-Royce Pension Fund has invested in a longevity swap, which is designed to offset longevity risks in respect of existing pensioners.
In the UK, surpluses are recognised on schemes where, on ultimate wind-up when there are no remaining members, any surplus will be returned to the Group.
AMOUNTS RECOGNISED IN THE INCOME STATEMENT2015 2014
UKschemes
£m
Overseasschemes
£mTotal
£m
UKschemes
£m
Overseasschemes
£mTotal
£m
Defined benefit schemes:Current service cost and administrative expenses 169 52 221 156 45 201 Past-service and curtailment (credit)/cost (16) 8 (8) (18) (13) (31)
153 60 213 138 32 170 Defined contribution schemes 33 85 118 32 97 129 Operating cost 186 145 331 170 129 299 Net financing in respect of defined benefit schemes (65) 33 (32) (11) 40 29 Total income statement charge 121 178 299 159 169 328
The operating cost is charged as follows:Defined benefit Defined contribution Total
2015£m
2014£m
2015£m
2014£m
2015£m
2014£m
Cost of sales 147 117 80 84 227 201 Commercial and administrative costs 32 21 21 23 53 44 Research and development 34 27 17 17 51 44 Operating cost – continuing operations 213 165 118 124 331 289 Discontinued operations – 5 – 5 – 10 Total operating cost 213 170 118 129 331 299

Financial Statements
Rolls-Royce plc Annual Report 2015 109
Financial Statements
18 Post-retirement benefits continuedThe Group operates a PaySave scheme in the UK. This is a salary sacrifice scheme under which employees elect to stop making employee contributions and the Group makes additional contributions in return for a reduction in gross contractual pay. As a result, there is a decrease in wages and salaries and a corresponding increase in pension costs of £32m (2014: £35m) in the year.
Net financing comprises:2015 2014
UKschemes
£m
Overseasschemes
£mTotal
£m
UKschemes
£m
Overseasschemes
£mTotal
£m
Financing on scheme obligations 375 57 432 390 64 454 Financing on scheme assets (440) (24) (464) (427) (24) (451)Financing on unrecognised surpluses and minimum funding liability – – – 26 – 26 Net financing (income)/charge in respect of defined benefit schemes (65) 33 (32) (11) 40 29
Financing income on scheme surpluses (65) – (65) (13) – (13)Financing cost on scheme deficits – 33 33 2 40 42
AMOUNTS RECOGNISED IN OCI IN RESPECT OF DEFINED BENEFIT SCHEMES2015 2014
UKschemes
£m
Overseasschemes
£mTotal
£m
UKschemes
£m
Overseasschemes
£mTotal
£m
Actuarial gains and losses arising from demographic assumptions (185) 8 (177) 23 (17) 6 Actuarial gains and losses arising from financial assumptions (70) 70 – (1,099) (228) (1,327)Actuarial gains and losses arising from experience adjustments 56 8 64 (343) (17) (360)Return on scheme assets excluding financing income (593) (16) (609) 2,258 55 2,313 Movement in unrecognised surplus and related finance cost – – – 513 – 513 Movement in minimum funding liability and related finance cost – – – 47 – 47 Included in other comprehensive income (792) 70 (722) 1,399 (207) 1,192
AMOUNTS RECOGNISED IN THE BALANCE SHEET IN RESPECT OF DEFINED BENEFIT SCHEMES2015 2014
UKschemes
£m
Overseasschemes
£mTotal
£m
UKschemes
£m
Overseasschemes
£mTotal
£m
Present value of funded obligations (10,914) (650) (11,564) (10,606) (664) (11,270)Fair value of scheme assets 11,957 597 12,554 12,341 593 12,934 Net asset/(liability) on funded schemes 1,043 (53) 990 1,735 (71) 1,664 Present value of unfunded obligations – (1,067) (1,067) – (1,109) (1,109)Net asset/(liability) recognised in the balance sheet 1,043 (1,120) (77) 1,735 (1,180) 555
Post-retirement scheme surpluses 1,059 4 1,063 1,735 5 1,740 Post-retirement scheme deficits (16) (1,124) (1,140) – (1,185) (1,185)
Overseas schemes are located in the following countries:2015 2014
Assets£m
Obligations£m
Net£m
Assets£m
Obligations£m
Net£m
Canada 152 (188) (36) 160 (208) (48)Germany – (553) (553) – (592) (592)US pension schemes 429 (513) (84) 414 (508) (94)US healthcare schemes – (426) (426) – (423) (423)Other 16 (37) (21) 19 (42) (23)Net asset/(liability) recognised in the balance sheet 597 (1,717) (1,120) 593 (1,773) (1,180)

Financial Statements
110 Rolls-Royce plc Annual Report 2015
NOTES TO THE CONSOLIDATED FINANCIAL STATEMENTS CONTINUED
18 Post-retirement benefits continuedDEFINED BENEFIT SCHEMESAssumptionsSignificant actuarial assumptions for UK schemes (weighted average, weighted by the size of the obligation) used at the balance sheet date were as follows:
2015 2014
Discount rate 3.6% 3.6%Inflation assumption(RPI) 1 3.2% 3.2%Rate of increase in salaries 4.0% 4.2%Male life expectancy from age 65: current pensioner 22.8 years 22.5 years future pensioner currently aged 45 24.8 years 24.1 years
1 This is the assumption for the Retail Price Index. The Consumer Price Index is assumed to be 1.1% lower.
Discount rates are determined by reference to the market yields on AA rated corporate bonds. The rate is determined by using the profile of forecast benefit payments to derive a weighted average discount rate from the yield curve.
The inflation assumption is determined by the market implied assumption based on the yields on long-term indexed linked government securities and increases in salaries are based on actual experience, allowing for promotion, of the real increase above inflation.
The mortality assumptions adopted for the UK pension schemes are derived from the SAP actuarial tables, with future improvements in line with the CMI 2015 core projections and long-term improvements of 1.5%. Where appropriate, these are adjusted to take account of the relevant scheme’s actual experience.
Other assumptions have been set on advice from the relevant actuary, having regard to the latest trends in scheme experience and the assumptions used in the most recent funding valuation. The rate of increase of pensions in payment is based on the rules of the relevant scheme, combined with the inflation assumption where the increase is capped.
Assumptions for overseas schemes are less significant and are based on advice from local actuaries. The principal assumptions are:2015 2014
Discount rate 3.6% 3.3%Inflation assumption 2.2% 2.2%Long-term healthcare cost trend rate 5.0% 5.0%Male life expectancy from age 65: current pensioner 21.1 years 21.1 years future pensioner currently aged 45 23.3 years 23.3 years
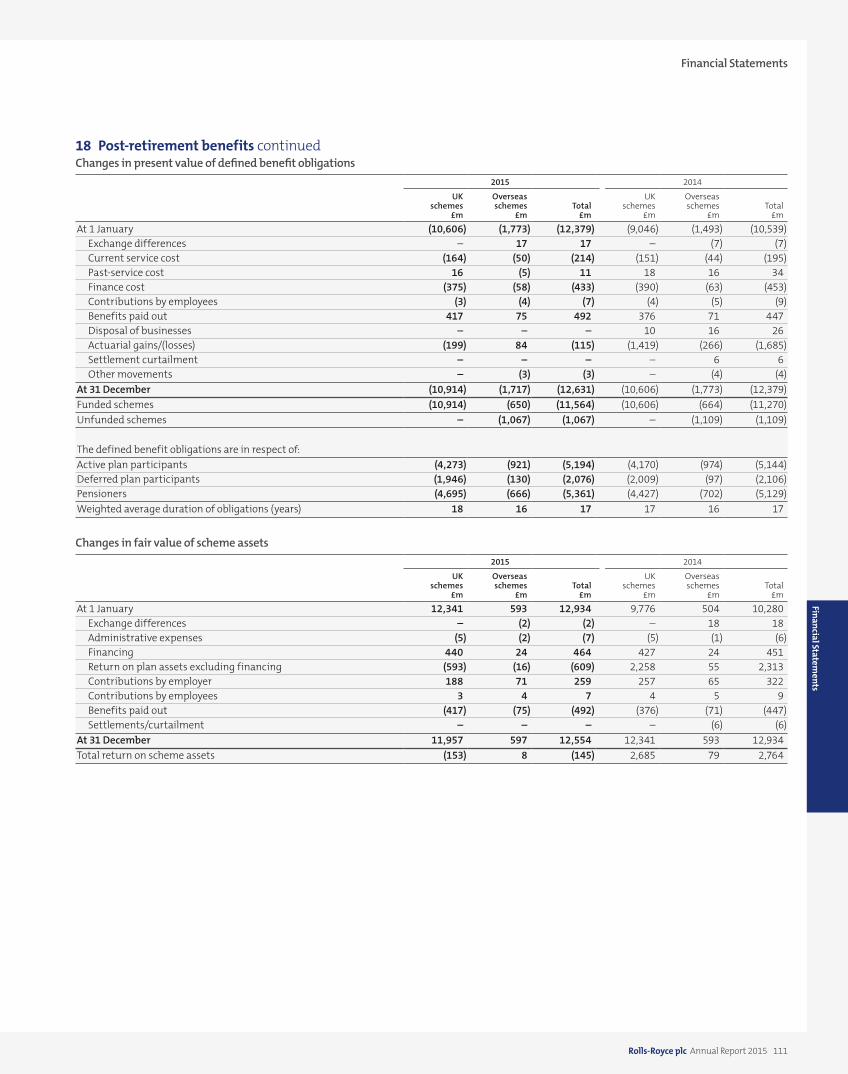
Financial Statements
Rolls-Royce plc Annual Report 2015 111
Financial Statements
18 Post-retirement benefits continuedChanges in present value of defined benefit obligations
2015 2014
UKschemes
£m
Overseasschemes
£mTotal
£m
UKschemes
£m
Overseasschemes
£mTotal
£m
At 1 January (10,606) (1,773) (12,379) (9,046) (1,493) (10,539)Exchange differences – 17 17 – (7) (7)Current service cost (164) (50) (214) (151) (44) (195)Past-service cost 16 (5) 11 18 16 34 Finance cost (375) (58) (433) (390) (63) (453)Contributions by employees (3) (4) (7) (4) (5) (9)Benefits paid out 417 75 492 376 71 447 Disposal of businesses – – – 10 16 26 Actuarial gains/(losses) (199) 84 (115) (1,419) (266) (1,685)Settlement curtailment – – – – 6 6 Other movements – (3) (3) – (4) (4)
At 31 December (10,914) (1,717) (12,631) (10,606) (1,773) (12,379)Funded schemes (10,914) (650) (11,564) (10,606) (664) (11,270)Unfunded schemes – (1,067) (1,067) – (1,109) (1,109)
The defined benefit obligations are in respect of:Active plan participants (4,273) (921) (5,194) (4,170) (974) (5,144)Deferred plan participants (1,946) (130) (2,076) (2,009) (97) (2,106)Pensioners (4,695) (666) (5,361) (4,427) (702) (5,129)Weighted average duration of obligations (years) 18 16 17 17 16 17
Changes in fair value of scheme assets2015 2014
UKschemes
£m
Overseasschemes
£mTotal
£m
UKschemes
£m
Overseasschemes
£mTotal
£m
At 1 January 12,341 593 12,934 9,776 504 10,280 Exchange differences – (2) (2) – 18 18 Administrative expenses (5) (2) (7) (5) (1) (6)Financing 440 24 464 427 24 451 Return on plan assets excluding financing (593) (16) (609) 2,258 55 2,313 Contributions by employer 188 71 259 257 65 322 Contributions by employees 3 4 7 4 5 9 Benefits paid out (417) (75) (492) (376) (71) (447)Settlements/curtailment – – – – (6) (6)
At 31 December 11,957 597 12,554 12,341 593 12,934 Total return on scheme assets (153) 8 (145) 2,685 79 2,764

Financial Statements
112 Rolls-Royce plc Annual Report 2015
NOTES TO THE CONSOLIDATED FINANCIAL STATEMENTS CONTINUED
18 Post-retirement benefits continuedFair value of scheme assets at 31 December
2015 2014
UKschemes
£m
Overseasschemes
£mTotal
£m
UKschemes
£m
Overseasschemes
£mTotal
£m
Sovereign debt 7,283 297 7,580 7,282 167 7,449 Derivatives on sovereign debt (5) (1) (6) (2,622) 2 (2,620)Corporate debt instruments 1,977 239 2,216 2,053 237 2,290 Interest rate swaps 1,868 – 1,868 4,218 – 4,218 Inflation swaps (477) – (477) (360) – (360)Cash and similar instruments 118 21 139 193 127 320 Liability driven investment (LDI) portfolios 1 10,764 556 11,320 10,764 533 11,297 Longevity swap 2 (142) – (142) 10 – 10 Listed equities 810 1 811 787 3 790 Unlisted equities 232 – 232 216 – 216 Sovereign debt 110 3 113 105 4 109 Corporate debt instruments 24 – 24 15 – 15 Cash 68 21 89 166 32 198 Other 91 16 107 278 21 299 Fair value of scheme assets 11,957 597 12,554 12,341 593 12,934
1 A portfolio of gilt and swap contracts, backed by LIBOR generating assets, that is designed to hedge the majority of the interest rate and inflation risks associated with the schemes’ obligations.
2 Under the longevity swap, the Rolls-Royce Pension Fund has agreed an average life expectancy of pensioners with a counterparty. If pensioners live longer than expected the counterparty will make payments to the Fund to offset the additional cost of paying pensioners. If the reverse applies the cost of paying pensioners will be reduced but the scheme will be required to make payments to the counterparty. The longevity swap is valued at fair value in accordance with IFRS 13 (Level 3).
The scheme assets do not include any of the Group’s own financial instruments, nor any property occupied by, or other assets used by, the Group. The longevity swap is valued by the scheme actuaries based on the difference between the agreed longevity assumptions at inception and actual longevity experience. All other fair values are provided by the fund managers. Where available, the fair values are quoted prices (eg listed equity, sovereign debt and corporate bonds). Unlisted investments (private equity) are included at values provided by the fund manager in accordance with relevant guidance. Other significant assets are valued based on observable inputs such as yield curves.
Movements in unrecognised surplus and minimum funding liability2015 2014
UKschemes
£m
Overseasschemes
£mTotal
£m
UKschemes
£m
Overseasschemes
£mTotal
£m
At 1 January – – – (534) – (534)Movements in unrecognised surplus through OCI 1 – – – 513 – 513 Movements in minimum funding liability through OCI 2 – – – 47 – 47 Related finance costs – – – (26) – (26)
At 31 December – – – – – –
1 Where a surplus has arisen on a scheme, in accordance with IAS 19 and IFRIC 14, the surplus is recognised as an asset only if it represents an unconditional economic benefit available to the Group in the future. Any surplus in excess of this benefit is not recognised in the balance sheet. During 2014, the rules of one scheme were amended, which removed the restriction on recognising the surplus.
2 A minimum funding liability arises where the statutory funding requirements require future contributions in respect of past service that will result in a future unrecognisable surplus.
FUTURE CONTRIBUTIONSThe Group expects to contribute approximately £260m to its defined benefit schemes in 2016.
In the UK, the funding is set on the basis of a triennial funding valuation by the actuaries for which the assumptions may differ from those above. In particular, the discount rate used to value the obligations takes account of the investment strategy, rather than being based on market yields of AA corporate bonds. As a result of these valuations, the Group and the scheme trustees agree a Schedule of Contributions (SoC), which sets out the required contributions from the employer and employees for current service. Where the scheme is in deficit, the SoC also includes required contributions from the employer to eliminate the deficit. The most recent agreed triennial valuations for the principal schemes are:
Obligations at 31 December 2015
£m Valuation date
Rolls-Royce Pension Fund (7,871) 31 March 2015Rolls-Royce Group Pension Scheme (1,913) 5 April 2013Vickers Group Pension Scheme (702) 31 March 2013

Financial Statements
Rolls-Royce plc Annual Report 2015 113
Financial Statements
18 Post-retirement benefits continuedSensitivitiesThe calculations of the defined benefit obligations are sensitive to the assumptions set out above. The following table summarises how the estimated impact of a change in a significant assumption would affect the UK defined benefit obligation at 31 December 2015, while holding all other assumptions constant. This sensitivity analysis may not be representative of the actual change in the defined benefit obligation as it is unlikely that the change in assumptions would occur in isolation of one another as some of the assumptions may be correlated.
For the most significant funded schemes, the investment strategies are designed to hedge the risks from interest rates, inflation on an economic basis and in the Rolls-Royce Pension Fund in the UK, the longevity of pensioners. Where appropriate, the table also includes the corresponding movement in the value of the plan assets.
£m
Reduction in the discount rate of 0.25% 1 Obligation (524)Plan assets (LDI portfolio) 569
Increase in inflation of 0.25% 1 Obligation (249)Plan assets (LDI portfolio) 231
Real increase in salaries of 0.25% Obligations (86)One year increase in life expectancy Obligations (308)
1 The difference between the sensitivities on obligations and plan assets arises largely due to differences in the methods used to value the obligations for accounting and economic purposes. On an economic basis the correlation is approximately 97% for discount rates and 89% for inflation.
19 Share capitalEquity
Ordinary shares
of 20p eachMillions
Nominalvalue
£m
Issued and fully paidAt 1 January 2014 and 31 December 2015 1,631 326
The rights attaching to each class of share are set out on page 60.

Financial Statements
114 Rolls-Royce plc Annual Report 2015
NOTES TO THE CONSOLIDATED FINANCIAL STATEMENTS CONTINUED
20 Share-based paymentsEFFECT OF SHARE-BASED PAYMENT TRANSACTIONS ON THE GROUP’S RESULTS AND FINANCIAL POSITION
2015£m
2014£m
Total expense recognised for equity-settled share-based payments transactions 6 26 Total credit recognised for cash-settled share-based payments transactions (1) (5)Share-based payments recognised in the consolidated income statement 5 21 Liability for cash-settled share-based payment transactions – 13
MOVEMENTS IN THE GROUP’S SHARE-BASED PAYMENT PLANS DURING THE YEARShareSave PSP APRA
NumberMillions
Weighted average
exercise pricePence
NumberMillions
NumberMillions
Outstanding at 1 January 2014 26.0 660 12.0 3.1 Granted – – 2.9 1.1 Additional entitlements arising from TSR performance – – 0.5 – Additional shares accrued from reinvestment of C Shares – – – 0.1 Forfeited (1.0) 775 (1.2) (0.2)Exercised (0.5) 487 (4.4) (1.7)
Outstanding at 1 January 2015 24.5 660 9.8 2.4 Granted 13.0 617 3.0 – Additional entitlements arising from TSR performance – – 0.5 – Forfeited (4.6) 908 (2.9) (0.1)Exercised (9.7) 445 (1.7) (1.4)
Outstanding at 31 December 2015 23.2 677 8.7 0.9 Exercisable at 31 December 2015 – – – – Exercisable at 31 December 2014 – – – –
As share options are exercised throughout the year, the weighted average share price during the year of 820p (2014: 1013p) is representative of the weighted average share price at the date of exercise. The closing price at 31 December 2015 was 575p (2014: 870p).
FAIR VALUES OF SHARE-BASED PAYMENT PLANS
The weighted average fair value per share of equity-settled share-based payment plans granted during the year, estimated at the date of grant, are as follows:
2015 2014
PSP – 25% TSR uplift 1,015p 1,105p PSP – 50% TSR uplift 1,036p 1,227p ShareSave – 3 year grant 192p n/a ShareSave – 5 year grant 219p n/a APRA n/a 984p
PSPThe fair value of shares awarded under the PSP is calculated using a pricing model that takes account of the non-entitlement to dividends (or equivalent) during the vesting period and the market-based performance condition based on expectations about volatility and the correlation of share price returns in the group of FTSE 100 companies and which incorporates into the valuation the interdependency between share price performance and TSR vesting. This adjustment increases the fair value of the award relative to the share price at the date of grant.
ShareSaveThe fair value of the options granted under the ShareSave plan is calculated using a binomial pricing model that assumes that participants will exercise their options at the beginning of the six-month window if the share price is greater than the exercise price. Otherwise it assumes that options are held until the expiration of their contractual term. This results in an expected life that falls somewhere between the start and end of the exercise window.
APRAThe fair value of shares awarded under APRA is calculated as the share price on the date of the award, excluding expected dividends (or equivalent).

Financial Statements
Rolls-Royce plc Annual Report 2015 115
Financial Statements
21 LeasesOPERATING LEASESLeases as lessee
2015£m
2014£m
Rentals paid – hire of plant and machinery 122 123 – hire of other assets 124 75 Non-cancellable operating lease rentals are payable as follows:
Within one year 190 182 Between one and five years 488 542 After five years 496 438
1,174 1,162
Leases as lessor2015
£m 2014
£m
Rentals received – credited within revenue from aftermarket services 3 15 Non-cancellable operating lease rentals are receivable as follows:
Within one year 12 16 Between one and five years 12 30 After five years 8 13
32 59
The Group acts as lessee and lessor for both land and buildings and gas turbine engines, and acts as lessee for some plant and equipment.
• Sublease payments of £1m (2014: £1m) and sublease receipts of £3m (2014: £12m) were recognised in the income statement in the year.• Purchase options exist on aero engines, land and buildings and plant and equipment with the period to the purchase option date
varying between one to eight years.• Renewal options exist on aero engines, land and buildings and plant and equipment with the period to the renewal option varying
between one to 52 years at terms to be negotiated upon renewal.• Escalation clauses exist on some leases and are linked to LIBOR.• The total future minimum sublease payments expected to be made is £3m (2014: £6m) and sublease receipts expected
to be received are £24m (2014: £31m).
FINANCE LEASESFinance lease liabilities are payable as follows:
2015 2014
Payments£m
Interest£m
Principal£m
Payments£m
Interest£m
Principal£m
Within one year 5 2 3 3 2 1Between one and five years 18 8 10 13 7 6After five years 46 7 39 47 9 38
69 17 52 63 18 45

Financial Statements
116 Rolls-Royce plc Annual Report 2015
NOTES TO THE CONSOLIDATED FINANCIAL STATEMENTS CONTINUED
22 Contingent liabilitiesContingent liabilities in respect of customer financing commitments are described in note 17.
On 6 December 2012, the Company announced that it had passed information to the Serious Fraud Office (SFO), following a request from the SFO for information about allegations of malpractice in overseas markets. On 23 December 2013, the Company announced that it had been informed by the SFO that it had commenced a formal investigation. Since the initial announcement, the Company has continued its investigations and is engaging with the SFO and other authorities in the UK, the USA and elsewhere in relation to the matters of concern.
The consequence of these disclosures will be decided by the regulatory authorities. It is too early to predict the outcomes, but these could include the prosecution of individuals and of the Group. Accordingly, the potential for fines, penalties or other consequences cannot currently be assessed. As the investigation is ongoing, it is not yet possible to identify the timescale in which these issues might be resolved.
Contingent liabilities exist in respect of guarantees provided by the Group in the ordinary course of business for product delivery, performance and reliability. The Group has, in the normal course of business, entered into arrangements in respect of export finance, performance bonds, countertrade obligations and minor miscellaneous items. Various Group undertakings are parties to legal actions and claims which arise in the ordinary course of business, some of which are for substantial amounts. As a consequence of the insolvency of an insurer as previously reported, the Group is no longer fully insured against known and potential claims from employees who worked for certain of the Group’s UK based businesses for a period prior to the acquisition of those businesses by the Group. While the outcome of some of these matters cannot precisely be foreseen, the directors do not expect any of these arrangements, legal actions or claims, after allowing for provisions already made, to result in significant loss to the Group.
The Group’s share of equity accounted entities’ contingent liabilities is £11m (2014: £11m).

Financial Statements
Rolls-Royce plc Annual Report 2015 117
Financial Statements
23 Related party transactions2015
£m 2014
£m
Sales of goods and services to joint ventures and associates 1,896 2,138 Purchases of goods and services from joint ventures and associates (2,266) (2,544)Operating lease payments to joint ventures and associates (88) (81)Guarantees of joint ventures' and associates' borrowings 9 9 Dividends received from joint ventures and associates 63 73 RRSA receipts from joint ventures and associates 16 2 Other income received from joint ventures and associates 2 2
The aggregated balances with joint ventures are shown in notes 12 and 15. Transactions with Group pension schemes are shown in note 18.
Included in sales of goods and services to joint ventures and associates are sales of spare engines amounting to £189m (2014: £138m). Profit recognised in the year on such sales amounted to £71m (2014: £54m), including profit on current year sales and recognition of profit deferred on sales in previous years.
In the course of normal operations, related party transactions entered into by the Group have been contracted on an arms-length basis.
Key management personnel are deemed to be the directors and the members of the ELT as set out as set out in the Annual Report of Rolls-Royce Holdings plc. Remuneration for key management personnel is shown below:
2015£m
2014£m
Salaries and short-term benefits 8 9Post-retirement schemes – 1 Share-based payments – 4
8 14
The charge for share-based payments above is based on when the award is charged to the income statement in accordance with IFRS 2 Share-Based Payments.

Financial Statements
118 Rolls-Royce plc Annual Report 2015
NOTES TO THE CONSOLIDATED FINANCIAL STATEMENTS CONTINUED
24 Acquisitions and disposalsACQUISITIONSOn 27 March 2015, the Group acquired 100% of ROV Technologies Inc. for $8m. The acquisition gave rise to goodwill of £1m and other intangible assets of £2m.
DISPOSALSOn 27 November 2015, the Group completed the sale of its Michell Bearings business (comprising a business based in the UK, and a 51% shareholding in Michell Bearings (India) Pvt Ltd, a subsidiary company based in Bangalore) for net consideration of £2m.

Financial Statements
Rolls-Royce plc Annual Report 2015 119
COMPANY BALANCE SHEETAt 31 December 2015
Notes2015
£m2014
£m
AssetsNon-current assetsIntangible assets 3 2,869 2,622 Property, plant and equipment 4 1,389 1,348 Investments – subsidiary undertakings 5 1,430 1,724 – joint ventures 5 78 72 – other 5 1 – Other financial assets 9 123 137 Post-retirement schemes – surpluses 14 1,052 1,727
6,942 7,630 Current assets Inventories 6 1,218 1,237 Trade and other receivables 7 6,821 6,308 Taxation recoverable 9 – Other financial assets 9 137 103 Cash and cash equivalents 8 2,422 1,941
10,607 9,589 Total assets 17,549 17,219
LiabilitiesCurrent liabilitiesBorrowings 10 (314) (1,100)Other financial liabilities 9 (322) (218)Trade and other payables 11 (7,936) (7,565)Provisions for liabilities and charges 12 (57) (96)
(8,629) (8,979)
Non-current liabilitiesBorrowings 10 (2,746) (1,957)Other financial liabilities 9 (1,679) (753)Trade and other payables 11 (1,211) (1,497)Deferred tax liabilities 13 (121) (479)Provisions for liabilities and charges 12 (32) (78)Post-retirement scheme deficits 14 (15) –
(5,804) (4,764)
Total liabilities (14,433) (13,743)
Net assets 3,116 3,476
EquityCalled-up share capital 15 326 326 Share premium account 631 631 Revaluation reserve 11 21 Other reserves 167 167 Retained earnings 1,981 2,331 Total equity 3,116 3,476
The financial statements on pages 119 to 142 were approved by the Board on 24 February 2016 and signed on its behalf by:
WARREN EAST Chief Executive DAVID SMITH Chief Financial Officer
Company’s registered number 1003142
Financial Statements

120 Rolls-Royce plc Annual Report 2015
STATEMENT OF COMPREHENSIVE INCOME For the year ended 31 December 2015
2015£m
2014£m
Profit attributable to the shareholders of Rolls-Royce plc 161 (203)Other comprehensive income (OCI) Items that will not be reclassified to profit and loss – –
Net movement on post-retirement schemes (789) 1,393 Related tax movements 273 (488)
Total comprehensive income for the year (355) 702
STATEMENT OF CHANGES IN EQUITYFor the year ended 31 December 2015
Non-distributable reserves
Share capital
£m
Share premium
£m
Revaluation reserve
£m
Other reserves
£m
Retained earnings
£mTotal equity
£m
At 1 January 2015 326 631 21 167 2,331 3,476 Total comprehensive income in the year – – – – (355) (355)Dividend paid – – – – – –Transfers between reserves – – (10) – 10 –Share-based payments – direct to equity – – – – – –Related tax movements – – – – (5) (5)At 31 December 2015 326 631 11 167 1,981 3,116
Financial Statements

Financial Statements
Rolls-Royce plc Annual Report 2015 121
1 Accounting policiesBASIS OF ACCOUNTINGThese financial statements have been prepared in accordance with Financial Reporting Standard 101 Reduced Disclosure Framework (‘FRS 101’).
These are the Company’s first financial statements prepared in accordance with FRS 101.
In preparing these financial statements, the Company applies the recognition, measurement and disclosure requirements of International Financial Reporting Standards as adopted by the EU (‘Adopted IFRSs’), but makes amendments where necessary in order to comply with Companies Act 2006.
In the transition to FRS 101, the Company has applied IFRS 1, whilst ensuring that its assets and liabilities are measured in compliance with FRS 101. An explanation of how the transition to FRS 101 has affected the reported financial position and financial performance of the Company is provided in note 18.
In these financial statements the Company has applied the exemptions available under FRS 101 in respect of the following disclosures:
• a cash flow statement and related notes;• IFRS 2 Share Based Payments in respect of group settled share based payments;• comparative period reconciliations for share capital, tangible fixed assets and intangible assets; and • disclosures in respect of the compensation of key management personnel.
The accounting policies set out below have, unless otherwise stated, been applied consistently to all periods presented in these financial statements and in preparing an opening FRS 101 balance sheet at 1 January 2014 for the purposes of the transition to FRS 101.
As permitted by Section 408 of the Companies Act 2006, a separate income statement for the Company has not been included in these financial statements. As permitted by the audit fee disclosure regulations, disclosure of non-audit fees information is not included in respect of the Company.
MEASUREMENT CONVENTIONThese financial statements have been prepared on the historical cost basis except where Adopted IFRS requires the revaluation of financial instruments to fair value and certain other assets and liabilities on an alternative basis – most significantly post-retirement scheme obligations are valued on the basis required by IAS 19 Employee Benefits – and on a going concern basis as described on page 63.
KEY AREA OF JUDGEMENTIntroductionThe Company generates a significant portion of its revenues and profit on spare parts revenues arising from the installed original equipment (OE) fleet. As a consequence, the Company will often agree contractual prices for OE deliveries that take into account the anticipated aftermarket arrangements. Accounting policies reflect this aspect of the business model, in particular the policies for the recognition of contractual aftermarket rights and the linkage of OE and aftermarket arrangements.
When a civil large engine is sold, the economic benefits received usually far exceed the cash receivable under the contract, due to the rights to valuable aftermarket spare parts business. However, because the value of this right cannot be estimated with enough precision, accounting standards require that the revenue recognised in the accounts on sale of the engine is restricted to a total amount that results in a break even position. The amount of the revenue recognised in excess of cash receivable is recognised as an intangible asset, which is called a ‘contractual aftermarket right’.
The Company enters into arrangements with long-term suppliers to share the risks and rewards of major programmes – risk and revenue sharing arrangements (RRSAs). The accounting policy for these arrangements has been chosen, consistent with Adopted IFRS, to reflect their commercial effect.
The key judgements in determining these accounting policies are described below.
Contractual aftermarket rights (CARs)On delivery of Civil Aerospace engines, the Company has contractual rights to supply aftermarket parts to the customers and its intellectual rights, warranty arrangements and, where relevant, statutory airworthiness or other regulatory requirements provide reasonable control over this supply. The Directors consider that these rights meet the definition of an intangible asset in IAS 38 Intangible Assets. However, the Directors do not consider that it is possible to determine a reliable fair value for this intangible asset. Accordingly, an intangible asset (CAR) is only recognised on the occasions where the contractual price of the engine is below the cost of manufacture and then only to the extent of this deficit, as this amount is reliably measurable. An equal amount of revenue is recognised at the same point. Where a long-term aftermarket contract is linked to the OE contract (see below), the contractual price of the engine (including amounts allocated from the aftermarket contract) is above its cost of manufacture; consequently no CAR is recognised.
NOTES TO THE COMPANY FINANCIAL STATEMENTS
Financial Statements

122 Rolls-Royce plc Annual Report 2015
Risk and revenue sharing arrangementsRRSAs with key suppliers (workshare partners) are a feature of our Civil Aerospace business. Under these contractual arrangements the key commercial objectives are that: (i) during the development phase the workshare partner shares in the risks of developing an engine by performing its own development work, providing development parts and paying a non-refundable cash entry fee; and (ii) during the
production phase it supplies components in return for a share of the programme revenues as a ‘life of type’ supplier (ie. as long as the engine remains in service). The share of development costs borne by the workshare partner and of the revenues it receives reflect the partner’s proportionate cost of providing its production parts compared to the overall manufacturing cost of the engine. The share is based on a jointly agreed forecast at the commencement of the arrangement.
These arrangements are complex and have features that could be indicative of: a collaboration agreement, including sharing of risk and cost in a development programme; a long-term supply agreement; sharing of intellectual property; or a combination of these. In summary, and as described below, the Directors’ view is that the development and production phases of the contract should be considered separately in accounting for the RRSA, which results in the entry fee being matched against the non-recurring costs incurred by the Company.
Having considered the features above, the Directors considered that there is no directly applicable IFRS to determine an accounting policy for the recognition of entry fees of this nature in the income statement. Consequently, in developing an accounting treatment for such entry fees that best reflects the commercial objectives of the contractual arrangement, the Directors have analysed these features in the context of relevant accounting pronouncements (including those of other standard setters where these do not conflict with IFRS) and have weighed the importance of each feature in faithfully representing the overall commercial effect. The most important considerations that need to be balanced are: the transfer of development risk; the workshare partner receiving little standalone value from the payment of the entry fee; and the overall effect being collaboration between the parties which falls short of being a joint venture as the Company controls the programme. Also important in the analysis is the fact that, whilst the Company and the workshare partner share risks and rewards through the life of the contract, these risks and rewards are very different during the development and production phases.
In this context, the entry fee might be considered to represent: an amount paid as an equalisation of development costs; a payment to secure a long-term supply arrangement; a purchase of intellectual property; or some combination thereof. The accounting under these different scenarios could include: recognition of the entry fee to match the associated costs in the income statement; being spread over the life of the programme as a reduction in the cost of supply during production; or being spread over the time period of the access to the intellectual property by the workshare partner.
The Directors consider that the most important features of the arrangement are the risk sharing and that the entry fee represents a contribution to the development costs that the Company incurs in excess of its proportionate programme share. The key judgements taken in reaching this view are: the entry fee is determined by the parties on that basis and the contract specifies that, in the event that a derivative engine is to be developed, additional entry fees will also be calculated on this basis; the workshare partners describe the entry fee in this way; although the workshare partner receives little stand-alone value from paying the entry fee, the entry fee together with its own development activities represent its aggregate investment in the collaboration; the amount of the entry fee does not include any amount in excess of that necessary to equalise forecast development costs; the Company is not ‘on risk’ for the full development costs it incurs but for that amount less the entry fees received; and, as far as can be determined, this appears to be common industry accounting for arrangements of this type, under both Adopted IFRS and US accounting standards (which the Directors do not believe conflicts with IFRS in this regard).
The resulting accounting policy (described on page 124) represents the commercial effect of the contractual arrangements in that the Company recognises only those development costs to which it is exposed (and thus reflects the significant transfer of development risk to the workshare partner) and the costs of supply of parts during the production phase is measured at the workshare partner’s share of programme revenues (which we consider to be a commercial fair value). The Directors do not consider that accounting which would result in entry fees only being recognised in the production phase would appropriately reflect the sharing of development risk. Accordingly, the Directors believe that the policy adopted best reflects the commercial objectives of the arrangements, the nature of the relationship with the workshare partner and is in accordance with Adopted IFRS.
Internally generated development costsIAS 38 requires that internally generated development costs should only be recognised if strict criteria are met, in particular relating to technical feasibility and generation of future economic benefits. The Directors consider that, due to the complex nature of new equipment programmes, these criteria are not met until relatively late in the programme – Civil Aerospace programmes represent around half of development costs recognised; for these, the criteria are generally satisfied around the time of the initial engine certification.
Customer financing contingent liabilitiesThe Company has contingent liabilities in respect of financing support provided to customers. In order to assess whether a provision should be recognised, judgement as to the likelihood of these crystallising is required. This judgement is based on an assessment on the knowledge of the customers’ fleet plans, the underlying value of the security provided and, where appropriate, the customers’ creditworthiness.
KEY SOURCES OF ESTIMATION UNCERTAINTYIn applying the accounting policies, estimates are made in many areas; the actual outcome may differ from that calculated. The key sources of estimation uncertainty at the balance sheet date, that have a significant risk of causing material adjustment to the carrying amounts of assets and liabilities within the next financial year are set out below. The estimation of the relevant assets and liabilities involves the combination of a number of assumptions. Sensitivities are disclosed in the relevant notes where this is appropriate and practicable.
NOTES TO THE COMPANY FINANCIAL STATEMENTS CONTINUED
Financial Statements

Financial Statements
Rolls-Royce plc Annual Report 2015 123
Forecasts and discount ratesThe carrying values of a number of items on the balance sheet are dependent on the estimates of future cash flows arising from the Company’s operations, in particular: the assessment as to whether there are any indications of impairment of development, participation, certification, and contractual aftermarket rights recognised as intangible assets (carrying values at 31 December 2015: £2,494m, 31 December 2014: £2,267m) is dependent on estimates of cash flows generated by the relevant assets and the discount rate used to calculate a present value. These estimates include the performance of long-term contractual arrangements as described below, as well as estimates for future market share, pricing and unit cost for uncontracted business. The risk of impairment is generally higher for newer programmes and for customer specific intangible assets (CARs) for launch customers and typically reduces as programmes become more established.
Post-retirement benefitsThe Company’s defined benefit pension schemes and similar arrangements are assessed annually in accordance with IAS 19. The accounting valuation, which is based on assumptions determined with independent actuarial advice, resulted in a net surplus of £1,036m before deferred taxation being recognised on the balance sheet at 31 December 2015 (31 December 2014: net surplus £1,727m). The size of the net surplus/deficit is sensitive to the market value of the assets held by the schemes and to actuarial assumptions, which include price inflation, pension and salary increases, the discount rate used in assessing actuarial liabilities, mortality and other demographic assumptions and the levels of contributions. Further details are included in note 14.
ProvisionsAs described in the accounting policy on page 126, the Company measures provisions (carrying value at 31 December 2015: £89m, 31 December 2014: £174m) at the Directors’ best estimate of the expenditure required to settle the obligation at the balance sheet date. These estimates take account of information available and different possible outcomes.
TaxationThe tax payable on profits is determined based on tax laws and regulations that apply in each of the numerous jurisdictions in which the Company trades. Where the precise impact of these laws and regulations is unclear, or uncertain, then reasonable estimates may be used to determine the tax charge included in the financial statements.
The main area of uncertainty is in relation to cross border transactions, entered into in the normal course of business, as the amount of profit taxable can be subjective and therefore open to interpretation by the tax authorities. This can result in disputes and possibly litigation.
Accruals for tax contingencies require management to make judgements and estimates of exposures in relation to areas of uncertainty. Contingent liabilities, including in respect of any tax disputes or litigation, are covered in note 19 (contingent liabilities). All provisions are in current liabilities. Any liability relating to interest or penalties on tax liabilities is included in the tax charge.
Deferred tax assets are recognised to the extent it is probable that future taxable profits will be available, against which the asset can be utilised, based on management’s assumptions relating to the amounts and timing of future taxable profits.
SIGNIFICANT ACCOUNTING POLICIESThe Group’s significant accounting policies are set out below. These accounting policies have been applied consistently to all periods presented in these consolidated financial statements and by all Group entities.
Revenue recognitionRevenue comprises sales to external customers after discounts, and excluding value added tax.
Sales of products (both original equipment and spare parts) are recognised when the significant risks and rewards of ownership of the goods are transferred to the customer, the sales price agreed and the receipt of payment can be assured – this is generally on delivery. On occasion, the Group may participate in the financing of OE, most commonly by the provision of guarantees as described in note 18. In such circumstances, the contingent obligations arising under these arrangements are taken into account in assessing when the significant risks and rewards of ownership have been transferred to the customer. As described on page 121, a sale of OE at a contractual price below its cost of manufacture is considered to give rise to revenue to the extent that an intangible asset (contractual aftermarket right) is recognised at the same time.
Sales of services and long-term contracts are recognised when the outcome of the transaction can be reliably estimated. Revenue is recognised by reference to the stage of completion based on services performed to date as a percentage of the total contractual obligation.The assessment of the stage of completion is dependent on the nature of the contract, but will generally be based on: costs incurred to the extent these relate to services performed up to the reporting date; achievement of contractual milestones where appropriate; or flying hours or equivalent for long-term aftermarket arrangements.
Provided that the outcome of construction contracts can be assessed with reasonable certainty, the revenues and costs on such contracts are recognised based on stage of completion and the overall contract profitability. Full provision is made for any estimated losses to completion of contracts, having regard to the overall substance of the arrangements.
Progress payments received, when greater than recorded revenue, are deducted from the value of work in progress except to the extent that payments on account exceed the value of work in progress on any contract where the excess is included in accruals and deferred income within trade and other payables. The amount by which recorded revenue of long-term contracts is in excess of payments on account is classified as amounts recoverable on contracts and is separately disclosed within trade and other receivables.
Financial Statements

124 Rolls-Royce plc Annual Report 2015
Risk and revenue sharing arrangements (RRSAs)As described on page 122, the Company enters into arrangements with certain workshare partners under which these suppliers: (i) contribute to the forecast costs of developing an engine by performing their own development work, providing development parts and paying a non-refundable cash entry fee; and (ii) supply components for the production phase for which they receive consideration, which is an agreed proportion of the total programme revenues. Both the suppliers’ contributions to the forecast non-recurring development costs and their consideration are determined by reference to their proportionate forecast scopes of supply relative to that of the engine overall. Once the forecast costs and the scopes of supply have been agreed at the inception of the contract, each party is then accountable for its own incurred costs. No accounting entries are recorded when the suppliers undertake development work or when development components are supplied. Cash sums received are recognised in the income statement, as a reduction in research and development costs incurred, to match the expensing of the Company’s related costs – where the cash sums are received in advance of the related costs being expensed or where the related costs are capitalised as intangible assets, the recognition of the cash received is deferred (in accruals and deferred income) to match the recognition of the related expense or the amortisation of the related intangible asset respectively. The payments to suppliers of their shares of the programme revenues for their production components are charged to cost of sales as programme revenues arise.
The Company has arrangements with partners who do not undertake development work or supply parts. Such arrangements are considered to be financial instruments as defined by IAS 32 Financial Instruments: Presentation and are accounted for using the amortised cost method.
Government investmentWhere a government or similar body has previously invested in a development programme, the Company treats payments to that body as royalty payments, which are matched to related sales.
Research and developmentIn accordance with IAS 38 Intangible Assets, expenditure incurred on research and development is distinguished as relating either to a research phase or to a development phase.
All research phase expenditure is charged to the income statement. Development expenditure is capitalised as an internally generated intangible asset only if it meets strict criteria, relating in particular to technical feasibility and generation of future economic benefits.
The Company considers that it is not possible to distinguish reliably between research and development activities until relatively late in the programme.
Expenditure capitalised is amortised over its useful economic life, up to a maximum of 15 years from the entry into service of the product.
InterestInterest receivable/payable is credited/charged to the income statement using the effective interest method. Where borrowing costs are attributable to the acquisition, construction or production of a qualifying asset, such costs are capitalised as part of the specific asset.
TaxationThe tax charge/credit on the profit or loss for the year comprises current and deferred tax:
• Current tax is the expected tax payable for the year, using tax rates enacted or substantively enacted at the balance sheet date, and any adjustment to tax payable in respect of previous years.
• Deferred tax is provided using the balance sheet liability method, providing for temporary differences between the carrying amounts of the assets and liabilities for financial reporting purposes and the amounts used for tax purposes and is calculated using the enacted or substantively enacted rates that are expected to apply when the asset or liability is settled.
Tax is charged or credited in the income statement or other comprehensive income (OCI) as appropriate, except when it relates to items credited or charged directly to equity in which case the tax is also dealt with in equity.
Deferred tax liabilities are recognised for taxable temporary differences arising on investments in subsidiaries and joint arrangements, except where the Company is able to control the reversal of the temporary difference and it is probable that the temporary difference will not reverse in the foreseeable future.
Deferred tax assets are recognised only to the extent that it is probable that future taxable profits will be available against which the assets can be utilised.
Foreign currency translationTransactions in overseas currencies are translated into local currency at the exchange rate ruling on the date of the transaction. Monetary assets and liabilities denominated in foreign currencies are translated into sterling at the rate ruling at the year-end. Exchange differences arising on foreign exchange transactions and the retranslation of assets and liabilities into sterling at the rate ruling at the year-end are taken into account in determining profit on ordinary activities before taxation.
NOTES TO THE COMPANY FINANCIAL STATEMENTS CONTINUED
Financial Statements

Financial Statements
Rolls-Royce plc Annual Report 2015 125
Financial instruments IAS 39 Financial instruments: Recognition and Measurement requires the classification of financial instruments into separate categories for which the accounting requirement is different. Rolls-Royce has classified its financial instruments as follows:
• Short-term investments are generally classified as available for sale.• Short-term deposits (principally comprising funds held with banks and other financial institutions), trade receivables and short-term
investments not designated as available for sale are classified as loans and receivables.• Borrowings, trade creditors and financial RRSAs are classified as other liabilities.• Derivatives, comprising foreign exchange contracts, interest rate swaps and commodity swaps are classified as fair value through profit
or loss.
Financial instruments are recognised at the contract date and initially measured at fair value. Their subsequent measurement depends on their classification:
• Available for sale assets are held at fair value. Changes in fair value arising from changes in exchange rates are included in the income statement. All other changes in fair value are taken to reserves. On disposal, the accumulated changes in value recorded in reserves are included in the gain or loss recorded in the profit and loss account.
• Loans and receivables and other liabilities are held at amortised cost and not revalued (except for changes in exchange rates, which are included in the income statement) unless they are included in a fair value hedge accounting relationship. Where such a relationship exists, the instruments are revalued in respect of the risk being hedged. If instruments held at amortised cost are hedged, generally by interest rate swaps, and the hedges are effective, the carrying values are adjusted for changes in fair value, which are included in the income statement.
• Fair value through profit or loss are held at fair value. Changes in fair value are included in the income statement unless the instrument is included in a cash flow hedge. If the instruments are included in an effective cash flow hedging relationship, changes in value are taken to equity. When the hedged forecast transaction occurs, amounts previously recorded in equity are recognised in the income statement.
Financial instruments are derecognised on expiry or when all contractual rights and obligations are transferred.
Hedge accounting
The Company does not apply hedge accounting in respect of forward foreign exchange contracts held to manage the cash flow exposures of forecast future transactions denominated in foreign currencies.
The Company does not apply hedge accounting in respect of commodity swaps held to manage the cash flow exposures of forecast future transactions in those commodities.
The Company applies hedge accounting in respect of transactions entered into to manage the fair value and cash flow exposures of its borrowings. Forward foreign exchange contracts are held to manage the fair value exposures of borrowings denominated in foreign currencies and are designated as fair value hedges. Interest rate swaps are held to manage the interest rate exposures and are designated as fair value or cash flow hedges of fixed and floating rate borrowings respectively.
Changes in the fair values of derivatives designated as fair value hedges and changes in fair value of the related hedged item are recognised directly in the income statement.
Changes in the fair values of derivatives that are designated as cash flow hedges and are effective are recognised directly in reserves. Any ineffectiveness in the hedging relationships is included in the income statement. The amounts deferred in reserves are recognised in the income statement to match the recognition of the hedged item.
Hedge accounting is discontinued when the hedging instrument expires or is sold, terminated, or exercised, or no longer qualifies for hedge accounting. At that time, for cash flow hedges and if the forecast transaction remains probable, any cumulative gain or loss on the hedging instrument recognised in reserves, is retained in reserves until the forecast transaction occurs. If a hedged transaction is no longer expected to occur, the net cumulative gain or loss previously recognised in reserves is transferred to the income statement.
The portion of a gain or loss on an instrument used to hedge a net investment in a foreign operation that is determined to be an effective hedge is recognised directly in reserves. The ineffective portion is recognised immediately in the income statement.
Certification costs and participation feesCosts incurred in respect of meeting regulatory certification requirements for new civil engine/aircraft combinations and payments made to airframe manufacturers for this, and participation fees, are carried forward in intangible assets to the extent that they can be recovered out of future sales and are charged to the profit and loss account over the programme life, up to a maximum of 15 years from the entry into-service of the product.
Contractual Aftermarket Rights (CARs)As described under key judgements on page 121, the Company may sell OE to customers at a price below its cost, on the basis that it also receives valuable aftermarket rights. Such a sale is considered to give rise to an intangible asset which is recognised, in accordance with IAS 38, at the same time as the revenue at an amount equal to the cash deficit and is amortised on a straight-line basis over the period that highly probable aftermarket sales are expected to be earned.
Financial Statements

126 Rolls-Royce plc Annual Report 2015
SoftwareThe cost of acquiring software that is not specific to an item of tangible fixed assets is classified as an intangible asset and amortised over its useful economic life, up to a maximum of five years.
Tangible fixed assets and depreciationTangible fixed assets are stated at cost or valuation less accumulated depreciation and any provision for impairments in value.
Depreciation is provided on a straight-line basis to write-off the cost or valuation, less the estimated residual value, over the estimated useful life. Estimated useful lives are as follows:
i) Land and buildings, as advised by the Company’s professional valuers: a) Freehold buildings – five to 45 years (average 26 years). b) Leasehold land and buildings – lower of valuers’ estimates or period of lease. c) No depreciation is provided in respect of freehold land.ii) Plant and equipment – five to 25 years (average 14 years).iii) Aircraft and engines – five to 20 years (average 9 years).iv) No depreciation is provided on assets in the course of construction.
Impairment of non-current assetsImpairment of non-current assets is considered in accordance with IAS 36 Impairment of Assets. Where the asset does not generate cash flows that are independent of other assets, impairment is considered for the cash-generating unit to which the asset belongs. Intangible assets not yet available for use are tested for impairment annually. Other intangible assets, property, plant and equipment and investments are assessed for any indications of impairment annually. If any indication of impairment is identified, an impairment test is performed to estimate the recoverable amount.
If the recoverable amount of an asset (or cash-generating unit) is estimated to be below the carrying value, the carrying value is reduced to the recoverable amount and the impairment loss recognised as an expense. The recoverable amount is the higher of value in use or fair value less costs to sell, if this is readily available. The value in use is the present value of future cash flows using a pre-tax discount rate that reflects the time value of money and the risk specific to the asset.
Operating leasesPayments made and rentals received under operating lease arrangements are charged/credited to the income statement on a straight-line basis.
InventoriesInventories and work in progress are valued at the lower of cost and net realisable value on a first-in, first-out basis. Cost comprises direct materials and, where applicable, direct labour costs and those overheads, including depreciation of property, plant and equipment, that have been incurred in bringing the inventories to their present location and condition. Net realisable value represents the estimated selling prices less all estimated costs of completion and costs to be incurred in marketing, selling and distribution.
ProvisionsProvisions are recognised when the Company has a present obligation as a result of a past event, and it is probable that the Company will be required to settle that obligation. Provisions are measured at the directors’ best estimate of the expenditure required to settle the obligation at the balance sheet date, and are discounted to present value where the effect is material.
Post-retirement benefitsPensions and similar benefits (principally healthcare) are accounted for under IAS19 Employee Benefits. For defined benefit plans, obligations are measured at discounted present value whilst plan assets are recorded at fair value. Surpluses in schemes are recognised as assets only if they represent economic benefits available to the Company in the future. A liability is recognised to the extent that the minimum funding requirements in respect of past service will give rise to an unrecognisable surplus.
The service and financing costs of such plans are recognised separately in the income statement; service costs are spread systematically over the lives of employees and financing costs are recognised in the periods in which they arise.
Actuarial gains and losses and movements in unrecognised surpluses and minimum funding liabilities are recognised immediately in OCI.
Payments to defined contribution schemes are charged as an expense as they fall due.
Share-based payments The Company participates in Rolls-Royce Holdings plc employee share-based payment arrangements. These are equity-settled arrangements and are measured at fair value (excluding the effect of non-market based vesting conditions) at the date of grant. The fair value is expensed on a straight-line basis over the vesting period, based on the Company’s estimate of shares or options that will eventually vest. The costs of these share-based payments are treated as a capital contribution from the parent company. Any payments made by the Company to its parent company, in respect of these arrangements, are treated as a return of this capital contribution.
Financial Statements

Financial Statements
Rolls-Royce plc Annual Report 2015 127
The fair values of the share-based payment arrangements are measured as follows:
i) ShareSave – using the binomial pricing method;
ii) Performance Share Plan – using a pricing model adjusted to reflect non-entitlement to dividends (or equivalent) and the Total Shareholder Return market based condition;
iii) Annual performance Related Award plan and free shares under the Share Incentive Plan – share price on the date of the award.
See note 17 for further description of the share-based payment plans.
2 Emoluments of directors 2015 2014
Highest paid director
£000
Otherdirectors
£000
Highest paid director
£000
Otherdirectors
£000
Aggregate emoluments excluding deferred share plans 826 4,374 1,379 3,844 Aggregate amounts relating to deferred share plans 395 1,621 2,512 2,714 Aggregate value of Company contributions to Company defined contribution pensions schemes – 203 42 3913
Accrued pension of highest paid director – – – – Gains realised on exercise of share options1 – – – –
2015Number
2014Number
Number of directors with accruing retirement benefits: Defined contribution schemes 2 2Defined benefit schemes2 1 1 Number of directors exercising share options – – Number of directors receiving shares as part of long-term incentives schemes 3 4
1 Includes gains under the ShareSave plan. 2 One director was a contributing member of both defined contribution and defined benefit schemes (2014 one director).3 There has been an adjustment to the defined pension contributions over 2014 to allow for the 2014 Employer True Up Match contribution paid in March 2015 of £42,000.
3 Intangible assets
Development costs
£m
Contractual aftermarket rights (CARs)
£m
Certification costs and
participation fees£m
Software and other
£mTotal
£m
Cost:At 1 January 2015 9591 1,820 946 6351 4,360 Additions 36 340 46 89 511 Disposals – – – (4) (4)At 31 December 2015 995 2,160 992 720 4,867
Accumulated amortisation:At 1 January 2015 365 796 297 280 1,738 Charge for the year 55 134 56 66 311 Reversal of impairment – (50) – – (50)Disposals – – – (1) (1)At 31 December 2015 420 880 353 345 1,998
Net book value:At 31 December 2015 575 1,280 639 375 2,869 At 1 January 2015 594 1,024 649 355 2,622
1 Development costs include £9m which had previously been presented as ‘other intangible assets’ and were reclassified on transition to FRS 101.
During the year, following analysis of the first major overhauls of the Trent 1000 engines, the recoverable amount of certain contractual aftermarket rights have been reassessed. This analysis demonstrated that the aftermarket cash flows from the engines were better than originally assumed, arising from both operational and contractual performance improvements. As a result of this analysis, the value in use (based on a pre-tax discount rate of 9%) has increased to around £140 million, exceeding the unimpaired carrying value of £72 million. Accordingly, cumulative impairments prior to 2015 of £50 million have been reversed. This reversal is included in cost of sales.
Financial Statements

128 Rolls-Royce plc Annual Report 2015
NOTES TO THE COMPANY FINANCIAL STATEMENTS CONTINUED
4 Property, plant and equipmentLand and buildings
£m
Plant and equipment
£m
Aircraft and engines
£m
In course of construction
£mTotal
£m
Cost or valuation:At 1 January 2015 559 1,753 70 337 2,719 Additions 32 56 11 133 232 Reclassifications 30 144 4 (178) – Transferred from ‘Assets held for resale’ – – (4) – (4)Disposals (16) (56) – – (72)At 31 December 2015 605 1,897 81 292 2,875
Accumulated depreciation:At 1 January 2015 193 1,145 33 – 1,371Charge for the year 20 140 10 – 170 Reclassifications – – 4 – 4 Transferred from ‘Assets held for resale’ – – (3) – (3)Disposals (6) (50) – – (56)At 31 December 2015 207 1,235 44 – 1,486
Net book value:At 31 December 2015 398 662 37 292 1,389 At 1 January 2015 366 608 37 337 1,348
Tangible fixed assets include:2015
£m2014
£m
Net book value of finance leased assets 8 9 Non-depreciable land 74 68 Land and buildings at cost or valuation comprise:
Cost 454 397 Valuation at 31 December 1996 151 162
605 559 On an historical cost basis the net book value of land and buildings would have been as follows:Cost 580 533 Depreciation (194) (189)
386 344
Capital expenditure commitments 72 71
5 InvestmentsSubsidiary
undertakings1 Joint ventures and associatesOther
investments
Sharesat cost2
£m
Sharesat cost
£mLoans
£mTotal
£m
At 1 January 2015 1,724 36 36 72 –Additions 26 – 6 6 3Disposal (12) – – – –Impairment3 (308) – – – (2)At 31 December 2015 1,4302 36 42 78 1
1 The subsidiary and joint venture undertakings are listed on pages 143 to 149. 2 The Company has guaranteed the uncalled share capital of Nightingale Insurance Limited, one of its subsidiaries. At 31 December 2015, this guarantee was £25 million (2014 £25 million).3 The impairment in the year relates to subsidiary undertakings where the carrying value was found to be less than the recoverable amount of the investment.
Financial Statements
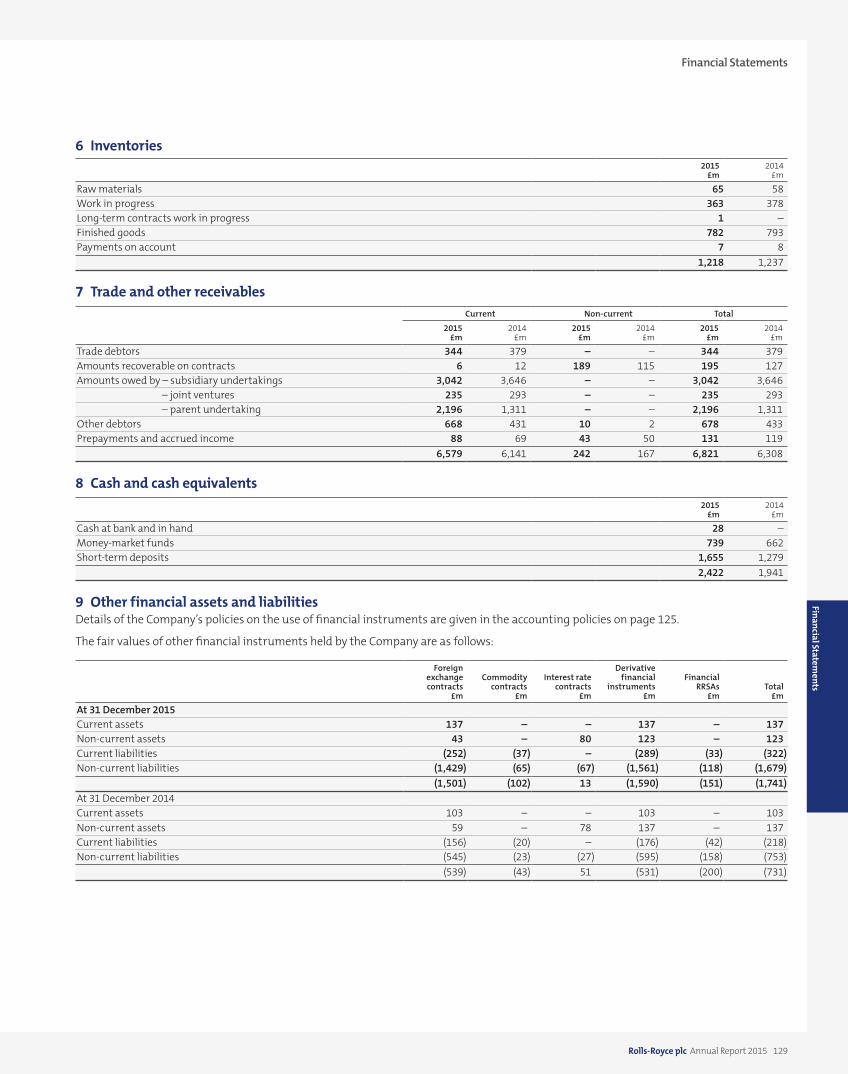
Financial Statements
Rolls-Royce plc Annual Report 2015 129
6 Inventories2015
£m2014
£m
Raw materials 65 58 Work in progress 363 378 Long-term contracts work in progress 1 – Finished goods 782 793 Payments on account 7 8
1,218 1,237
7 Trade and other receivables Current Non-current Total
2015 £m
2014 £m
2015 £m
2014 £m
2015 £m
2014 £m
Trade debtors 344 379 – – 344 379Amounts recoverable on contracts 6 12 189 115 195 127Amounts owed by – subsidiary undertakings 3,042 3,646 – – 3,042 3,646 – joint ventures 235 293 – – 235 293 – parent undertaking 2,196 1,311 – – 2,196 1,311 Other debtors 668 431 10 2 678 433Prepayments and accrued income 88 69 43 50 131 119
6,579 6,141 242 167 6,821 6,308
8 Cash and cash equivalents2015
£m2014
£m
Cash at bank and in hand 28 – Money-market funds 739 662 Short-term deposits 1,655 1,279
2,422 1,941
9 Other financial assets and liabilities Details of the Company’s policies on the use of financial instruments are given in the accounting policies on page 125.
The fair values of other financial instruments held by the Company are as follows:
Foreign exchange contracts
£m
Commodity contracts
£m
Interest ratecontracts
£m
Derivative financial
instruments £m
FinancialRRSAs
£mTotal
£m
At 31 December 2015Current assets 137 – – 137 – 137 Non-current assets 43 – 80 123 – 123 Current liabilities (252) (37) – (289) (33) (322)Non-current liabilities (1,429) (65) (67) (1,561) (118) (1,679)
(1,501) (102) 13 (1,590) (151) (1,741)At 31 December 2014Current assets 103 – – 103 – 103 Non-current assets 59 – 78 137 – 137 Current liabilities (156) (20) – (176) (42) (218)Non-current liabilities (545) (23) (27) (595) (158) (753)
(539) (43) 51 (531) (200) (731)
Financial Statements

130 Rolls-Royce plc Annual Report 2015
NOTES TO THE COMPANY FINANCIAL STATEMENTS CONTINUED
9 Other financial assets and liabilities continuedDERIVATIVE FINANCIAL INSTRUMENTSThe Company uses various financial instruments to manage its exposure to movements in foreign exchange rates. The Company uses commodity swaps to manage its exposure to movements in the price of commodities (jet fuel and base metals). To hedge the currency risk associated with a borrowing denominated in US dollars, the Company has currency derivatives designated as part of a fair value hedge. The Company uses interest rate swaps, forward rate agreements and interest rate caps to manage its exposure to movements in interest rates. Where the effectiveness of the hedge relationship in a cash flow hedge is demonstrated, changes in the fair value that are deemed effective are included in the hedging reserve and released to match actual payments on the hedged item.
Movements in the fair values of derivative financial instruments were as follows:
Foreign exchange
instrumentsCommodity
instrumentsInterest rate instruments Total
£m £m £m £m
At 1 January 2014 497 (39) (6) 452 Movements in fair value hedges1 3 – 57 60 Movements in other derivative contracts (888) (15) – (903)Contracts settled (151) 11 – (140)At 1 January 2015 (539) (43) 51 (531)Currency options at inception (20) – – (20)Movements in fair value hedges1 1 – (36) (35)Movements in other derivative contracts (1,016) (88) – (1,104)Contracts settled 73 29 (2) 100 At 31 December 2015 (1,501) (102) 13 (1,590)
1 Gain on related hedged items £35m (2014 £60m loss).
Where applicable, market values have been used to determine fair values. Where market values are not available, fair values have been calculated by discounting expected future cash flows at prevailing interest rates and translating at prevailing exchange rates.
FINANCIAL RISK AND REVENUE SHARING ARRANGEMENTS (RRSAS)The Company has financial liabilities arising from financial RRSAs. These financial liabilities are valued at each reporting date using the amortised cost method. This involves calculating the present value of the forecast cash flows of the arrangements using the internal rate of return at the inception of the arrangements as the discount rate.
The amortised cost values of financial RRSAs were as follows:
2015£m
2014£m
At 1 January (200) (227)Cash paid to partners 42 41Financing charge (11) (12)Exchange adjustments (3) (8)Changes in forecast payments 21 6At 31 December (151) (200)
Financial Statements

Financial Statements
Rolls-Royce plc Annual Report 2015 131
10 Borrowings Current Non-current
2015 £m
2014 £m
2015 £m
2014 £m
UnsecuredOverdrafts – 1,045 – –Bank loans 114 – 243 200 7.375% Notes 2016 £200m 200 – – 200 6.55% Notes 2015 US$83m1 – 55 – –6.75% Notes 2019 £500m2 – – 536 547 2.375% Notes 2020 US$500m1 – – 333 –2.125% Notes 2021 €750m1 – – 576 615 3.625% Notes 2025 US$1,000m1 – – 668 –3.375% Notes 2026 £375m2 – – 390 395
314 1,100 2,746 1,957 Repayable – otherwise than by instalmentsBetween one and two years – 200 Between two and five years 1,069 747 After five years 1,677 1,010
2,746 1,957
1 These notes are the subject of interest rate swap agreements under which the Company has undertaken to pay floating rates of interest, and currency swaps which form a fair value hedge. 2 These notes are the subject of interest rate swap agreements under which the Company has undertaken to pay floating rates of interest which form a fair value hedge.
11 Trade and other payables Current Non-current
2015 £m
2014 £m
2015 £m
2014 £m
Payments received on account1 746 386 462 778 Trade creditors 697 622 – –Amounts owed to – subsidiary undertakings 3,910 4,053 – – – joint ventures 193 230 2 4 – parent undertaking 28 – – –Corporate taxation 95 82 – –Other taxation and social security 30 35 – –Other creditors 1,193 1,128 227 305 Accruals and deferred income 1,044 1,029 520 410
7,936 7,565 1,211 1,497 1 Includes payments received from joint ventures 79 73 35 99
12 Provisions for liabilities and charges At
31 December 2014
£mTransfers in £m
Unusedamountsreversed
£m
Chargedto profit andloss account
£mUtilised
£m
At31 December
2015£m
Warranties and guarantees 28 – (8) 8 (5) 23 Contract loss 11 – – (2) – 9 Customer financing 45 – (27) 11 (10) 19 Restructuring 66 – (12) 11 (36) 29 Other 24 3 – (11) (7) 9
174 3 (47) 17 (58) 89 Current liabilities 96 57 Non-current liabilities 78 32
Provisions for warranties and guarantees primarily relate to products sold and generally cover a period of up to three years.
Provisions for contract loss and restructuring are generally expected to be utilised within two years.
Customer financing provisions cover guarantees provided for asset values and/or financing as described in note 19. Timing of utilisation is uncertain.
Financial Statements

132 Rolls-Royce plc Annual Report 2015
NOTES TO THE COMPANY FINANCIAL STATEMENTS CONTINUED
13 Deferred taxation£m
At 1 January 2015 (479)Amount credited to income statement 90 Amount credited to statement of comprehensive income 273 Amount charged to equity (5)At 31 December 2015 (121)
The analysis of the deferred tax position is as follows:
2015 £m
2014 £m
Fixed asset timing differences (67) (76)Other temporary differences (330) (321)Pensions and other post-retirement scheme benefits (365) (604)Foreign exchange and commodity financial assets and liabilities 306 135 Losses 320 373 Advance corporation tax – –Research and development expenditure credit withholding tax 15 14
(121) (479)
There are other deferred tax assets totalling £162m (2014 £162m) that have not been recognised on the basis that their future economic benefit is uncertain.
The Summer budget 2015 announced that the UK corporation tax rate will reduce to 19% from 1 April 2017 and will reduce further to 18% from 1 April 2020. These reductions were substantively enacted on 26 October 2015. As the reduction to 18% was substantively enacted prior to the year end, the closing deferred tax liability has been calculated at this rate. In 2015, £23m has been charged to the income statement and £3m has been charged directly to equity.
The temporary differences associated with investments in subsidiaries, joint ventures and associates, for which a deferred tax liability has not been recognised, aggregate to £347m (2014 £512m). No deferred tax liability has been recognised on the potential withholding tax due to the remittance of undistributed profits as the Company is able to control the timing of such remittances and it is probable that consent will not be given in the foreseeable future.
14 Post-retirement benefits The defined benefit schemes’ assets are held in separate trustee administered funds and employees are entitled to retirement benefits based on either their final or career average salaries and length of service.
The valuations of the defined benefit schemes are based on the most recent funding valuations, updated by the scheme actuaries to 31 December 2015. The most recent funding valuations of the main schemes were:
Scheme Valuation date
Rolls-Royce Pension Fund 31 March 2015Rolls-Royce Group Pension Scheme 5 April 2013Vickers Group Pension Scheme 31 March 2013
The principal actuarial assumptions used at the balance sheet date were as follows:
2015 £m
2014 £m
Discount rate 3.6% 3.6%RPI inflation assumption 3.2% 3.2%Rate of increase in salaries 4.0% 4.2%Male life expectancy from age 65 – current pensioner 22.8 years 22.5 years – future pensioner currently aged 45 24.8 years 24.2 years
1 The Consumer Price Index is assumed to be 1.1% lower.
Financial Statements

Financial Statements
Rolls-Royce plc Annual Report 2015 133
14 Post-retirement benefits continuedThe discount rates are determined by reference to the market yields on AA rated corporate bonds. The rate is determined by using the profile of forecast benefit payments to derive a weighted average discount rate from the yield curve. The discount rate above is the weighted average of the rate for each scheme, based on the value of their respective liabilities.
The mortality assumptions adopted for the UK pension schemes are derived from the SAP actuarial tables, with future improvements in line with the CMI 2015 core projections and long-term improvements of 1.5%. Where appropriate, these are adjusted to take account of the relevant scheme’s actual experience. The resulting range of life expectancies in the principal schemes are shown in the table above.
Other demographic assumptions have been set on advice from the relevant actuary, having regard to the latest trends in scheme experience and other relevant data. The assumptions are reviewed and updated as necessary as part of the periodic actuarial valuation of the schemes.
Amounts recognised in the balance sheet2015
£m2014
£m
Present value of funded obligations (10,802) (10,505)Fair value of scheme assets 11,839 12,232 Net asset recognised in the balance sheet 1,037 1,727
Analysed as: Post-retirement scheme surpluses 1,052 1,727 Post-retirement scheme deficits (15) –
1,037 1,727
1 Where a surplus has arisen on a scheme, in accordance with IAS 19 Employee benefits, the surplus is recognised as an asset only if it represents an unconditional economic benefit available to the Company in the future. Any surplus in excess of this benefit is not recognised in the balance sheet.
Changes in present value of defined benefit obligations2015
£m 2014
£m
At 1 January (10,505) (8,970)Current service cost (154) (141)Past-service cost 16 18 Finance cost (371) (388)Contributions by employees (3) (3)Benefits paid out 415 375 Actuarial losses (200) (1,406)Disposal of business – 10 At 31 December (10,802) (10,505)Active participants (4,182) (4,073)Deferred plan participants (1,940) (2,007)Pensioners (4,681) (4,424)Weighted average duration of obligations (years) 17 17
Changes in fair value of scheme assets 2015
£m 2014
£m
At 1 January 12,232 9,698 Administrative expenses (5) (5)Financing 436 423 Return on plan assets excluding financing (589) 2,241 Contributions by employer 177 247 Contributions by employees 3 3 Benefits paid out (415) (375)At 31 December 11,839 12,232
Actual return on plan assets (153) 2,664
Financial Statements

134 Rolls-Royce plc Annual Report 2015
14 Post-retirement benefits continuedThe fair value of the scheme assets and the expected rates of return at 31 December were as follows:
2015 £m
2014 £m
Sovereign debt 7,283 7,282 Derivatives on sovereign debt (5) (2,622)Corporate debt instruments 1,977 2,053 Interest rate swaps 1,868 4,218 Inflation swaps (477) (360)Cash and similar instruments 117 193 LDI portfolio1 10,763 10,764 Longevity swap2 (142) 10 Listed equities 788 767 Equities 232 216 Sovereign debt 42 41 Cash 67 160Other 89 274
11,839 12,232
1 A portfolio of gilt and swap contracts, backed by LIBOR generating assets, that is designed to hedge the majority of the interest rate and inflation risks associated with the schemes’ obligations.
2 Under the longevity swap the scheme has agreed an average life expectancy with a counterparty. If pensioners live longer than expected the counterparty will make payments to the scheme to offset the additional cost of paying pensions. If the reverse applies the cost of paying pensions will be reduced but the scheme will be required to make payments to the counterparty.
The scheme assets do not include any financial instruments of the Rolls-Royce Holdings plc group, nor any property occupied by, or other assets used by, the group.
Future contributionsThe Company expects to contribute approximately £170m to its defined benefit schemes in 2016.
SensitivitiesThe investment strategies are designed to hedge the risks from interest rates and inflation on an economic basis. The impacts of the principal sensitivities are:
2015 £m
2014 £m
Defined benefit obligations – 0.25% reduction in discount rate1 (517) (466)Defined benefit assets – 0.25% reduction in interest rates1 561 586 Defined benefit obligations – 0.25% increase in inflation (245) (234)Defined benefit assets – 0.25% increase in inflation 225 204 Defined benefit obligations – 0.25% increase in rate of increase in salaries (87) (86)Defined benefit obligations – longevity increases by one year (305) (247)
1 The difference between the sensitivities on obligations and plan assets arises largely due to differences in the methods used to value the obligations for accounting and economic purposes. On an economic basis the correlation is approximately 97% for discount rates and 89% for inflation.
DEFINED CONTRIBUTION SCHEMESThe Company operates a number of defined contribution schemes. The total expense recognised in the income statement was £26m (2014 £25m).
15 Share capital Equity
ordinary sharesof 20p each
Millions
Nominal value
£m
Authorised At 1 January and 31 December 2015 2,000 400 Issued and fully paid At 1 January and 31 December 2015 1,631 326
NOTES TO THE COMPANY FINANCIAL STATEMENTS CONTINUED
Financial Statements
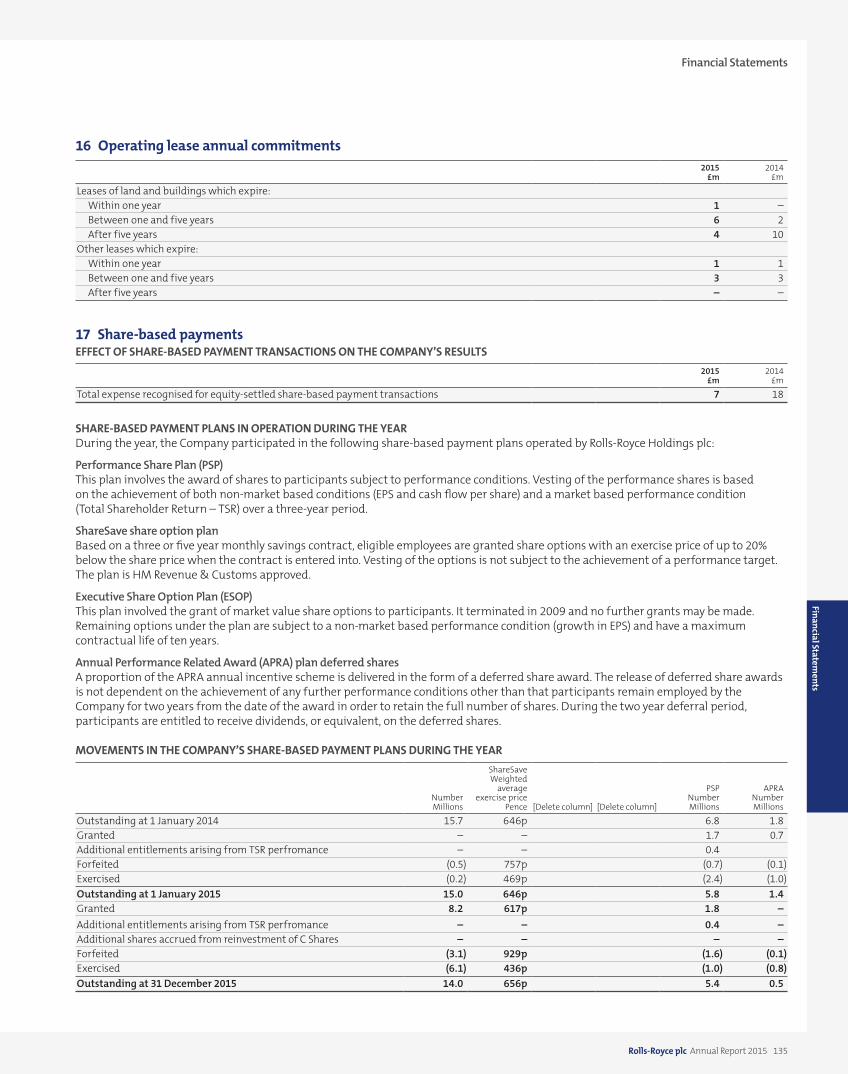
Financial Statements
Rolls-Royce plc Annual Report 2015 135
16 Operating lease annual commitments 2015
£m2014
£m
Leases of land and buildings which expire:Within one year 1 –Between one and five years 6 2 After five years 4 10
Other leases which expire:Within one year 1 1 Between one and five years 3 3 After five years – –
17 Share-based paymentsEFFECT OF SHARE-BASED PAYMENT TRANSACTIONS ON THE COMPANY’S RESULTS
2015£m
2014£m
Total expense recognised for equity-settled share-based payment transactions 7 18
SHARE-BASED PAYMENT PLANS IN OPERATION DURING THE YEARDuring the year, the Company participated in the following share-based payment plans operated by Rolls-Royce Holdings plc:
Performance Share Plan (PSP)This plan involves the award of shares to participants subject to performance conditions. Vesting of the performance shares is based on the achievement of both non-market based conditions (EPS and cash flow per share) and a market based performance condition (Total Shareholder Return – TSR) over a three-year period.
ShareSave share option planBased on a three or five year monthly savings contract, eligible employees are granted share options with an exercise price of up to 20% below the share price when the contract is entered into. Vesting of the options is not subject to the achievement of a performance target. The plan is HM Revenue & Customs approved.
Executive Share Option Plan (ESOP)This plan involved the grant of market value share options to participants. It terminated in 2009 and no further grants may be made. Remaining options under the plan are subject to a non-market based performance condition (growth in EPS) and have a maximum contractual life of ten years.
Annual Performance Related Award (APRA) plan deferred sharesA proportion of the APRA annual incentive scheme is delivered in the form of a deferred share award. The release of deferred share awards is not dependent on the achievement of any further performance conditions other than that participants remain employed by the Company for two years from the date of the award in order to retain the full number of shares. During the two year deferral period, participants are entitled to receive dividends, or equivalent, on the deferred shares.
MOVEMENTS IN THE COMPANY’S SHARE-BASED PAYMENT PLANS DURING THE YEAR
NumberMillions
ShareSave Weighted
average exercise price
Pence [Delete column] [Delete column]
PSPNumberMillions
APRA NumberMillions
Outstanding at 1 January 2014 15.7 646p 6.8 1.8 Granted – – 1.7 0.7 Additional entitlements arising from TSR perfromance – – 0.4 Forfeited (0.5) 757p (0.7) (0.1)Exercised (0.2) 469p (2.4) (1.0)Outstanding at 1 January 2015 15.0 646p 5.8 1.4 Granted 8.2 617p 1.8 –Additional entitlements arising from TSR perfromance – – 0.4 –Additional shares accrued from reinvestment of C Shares – – – –Forfeited (3.1) 929p (1.6) (0.1)Exercised (6.1) 436p (1.0) (0.8)Outstanding at 31 December 2015 14.0 656p 5.4 0.5
Financial Statements

136 Rolls-Royce plc Annual Report 2015
17 Share-based payments continuedAs share options are exercised throughout the year, the weighted average share price during the year of 820p (2014 1013p) is representative of the weighted average share price at the date of exercise. The closing price at 31 December 2015 was 575p, (2014 870p).
There were no exercisable options as at 31 December 2015.
FAIR VALUES OF SHARE-BASED PAYMENT PLANSThe weighted average fair values per share of equity-settled share-based payment plans granted during the year, estimated at the date of grant are as follows:
2015 £m
2014 £m
PSP – 25% TSR uplift 1,015p 1105pPSP – 50% TSR uplift 1,036p 1227pShareSave – 3 year grant 192p n/aShareSave – 5 year grant 219p n/aAPRA n/a 984p
Expected volatility is based on the historical volatility of Rolls-Royce Holdings plc’s share price over the seven years prior to the grant or award date. Expected dividends are based on Rolls-Royce Holdings plc’s payments to shareholders in respect of the previous year.
PSP The fair value of shares awarded under the PSP is calculated using a pricing model that takes account of the non-entitlement to dividends (or equivalent) during the vesting period and the market-based performance condition based on expectations about volatility and the correlation of share price returns in the group of FTSE 100 companies and which incorporates into the valuation the interdependency between share price performance and TSR vesting. This adjustment increases the fair value of the award relative to the share price at the date of grant.
ShareSaveThe fair value of the options granted under the ShareSave plan is calculated using a binomial pricing model that assumes that participants will exercise their options at the beginning of the six month window if the share price is greater than the exercise price. Otherwise it assumes that options are held until the expiration of their contractual term. This results in an expected life that falls somewhere between the start and end of the exercise window.
APRAThe fair value of shares awarded under APRA is calculated as the share price on the date of the award, excluding expected dividends (or equivalent).
18 Transition to FRS 101 Reduced Disclosure Framework As stated in note 1, the Company adopted FRS 101 Reduced Disclosure Framework from 1 January 2015, and restated its financial statements for the year ending 31 December 2014, which were previously reported under the prevailing relevant UK GAAP.
The main changes arising as a result of adopting FRS 101 are:
• recognition of intangible assets, whereby certain qualifying costs, in particular related to research and development and contractual aftermarket rights, which were written off under UK GAAP, are required to be recognised and amortised on a systematic basis;
• due to the recognition of development costs as an intangible asset, cash received from risk and revenue sharing agreements has been carried forward to match the amortisation of the intangible asset; and
• the longevity swap is valued at fair value rather than an actuarial basis and the basis for recognition of a surplus in a pension scheme differs in IAS 19, compared with the previous basis.
Details of the adjustments made in adopting FRS 101 are provided below. Reconciliations for the 2014 restated opening and closing balance sheets are provided on pages 140 and 141.
NOTES TO THE COMPANY FINANCIAL STATEMENTS CONTINUED
Financial Statements

Financial Statements
Rolls-Royce plc Annual Report 2015 137
18 Transition to FRS 101 Reduced Disclosure Framework continuedRESEARCH AND DEVELOPMENTIAS 38 Intangible Assets requires that all development costs meeting specified criteria be capitalised as intangible assets.
Under previous UK GAAP internally generated development costs were expensed as incurred. As part of the transition to FRS 101, costs relating to development projects which meet strict capitalisation criteria, relating in particular to technical feasibility and generation of future economic benefits, have been recognised.
The Company considers that it is not possible to distinguish reliably between research and development activities until relatively late in the programme.
Development costs capitalised are amortised on a straight-line basis over a period not exceeding 15 years. The impact arising from this change is summarised as:
At 1 January
2014£m
Year ended 31 December
2014 £m
Income statementCapitalisation of internal expenditure 67 Amortisation of intangible asset (42)Adjustment to loss before taxation 25
Net assetsIntangible asset – cost 883 959 Intangible asset – accumulated amortisation (323) (365)
560 594Related taxation effect (112) (117)Adjustment to net assets 448 477
OTHER INTANGIBLE ASSETSThe testing process of a fleet leader engine requires that the engine is stripped and rebuilt many times. The testing process provides data on the performance and reliability of the engine. Costs relating to the strip and rebuild process have historically been expensed, but as part of the transition to FRS 101, costs which meet strict capitalisation criteria, relating in particular to technical feasibility and generation of future economic benefits, have been recognised.
Development costs capitalised are amortised on a straight-line basis over a period not exceeding 15 years. The impact arising from this change is summarised as:
At 1 January
2014£m
Year ended 31 December
2014 £m
Income statementCapitalisation of internal expenditure 30 Amortisation of intangible asset (5)Adjustment to loss before taxation 25
Net assetsIntangible asset – cost 57 87 Intangible asset – accumulated amortisation (20) (25)
37 62 Related taxation effect (7) (12)Adjustment to net assets 30 50
Financial Statements

138 Rolls-Royce plc Annual Report 2015
18 Transition to FRS 101 Reduced Disclosure Framework continuedCONTRACTUAL AFTERMARKET RIGHTS (CARS)The Company may sell original equipment to customers at a price below its cost, on the basis that this deficit will be recovered from future aftermarket sales to the original customer or to other group companies. Where the Company has a contractual right to supply aftermarket parts to the customer and its intellectual rights, warranty arrangements and statutory airworthiness requirements provide reasonable control over this supply, these arrangements are considered to meet the definition of an intangible asset under IAS 38 Intangible Assets. Under UK GAAP, the associated revenue and costs of sale were recognised in the income statement as they arose. Under IAS 38 an intangible asset is recognised at the same time as the sale is made, with an amount equal to the cash deficit capitalised in the Company and amortised on a straight-line basis over the period that highly probable aftermarket sales to other group companies are expected to be earned.
Under UK GAAP an adjustment was made for a contract to a joint venture customer, where the OE was sold to the customer at a deficit but the aftermarket sales were on a time and materials basis. As it was deemed that there was sufficient control over the supply of the engines to the customer, the amount by which recorded turnover of long-term contracts was in excess of payments on account was classified as ‘amounts recoverable on contracts’ and was separately disclosed within debtors. On transition to FRS 101, the adjustment has been reversed and the deficit recognised as a CAR, with the appropriate amortisation applied.
The impact arising from this change is summarised as follows:
At 1 January
2014£m
Year ended 31 December
2014 £m
Income statementCapitalisation of internal expenditure 264 Amortisation of intangible asset (109)Elimination of related debtor balance previously recognised under UK GAAP 7 Adjustment to loss before taxation 162
Net assetsIntangible asset – cost 1,556 1,820 Intangible asset – accumulated amortisation (687) (796)
869 1,024 Elimination of related ‘amounts recoverable on contracts’ balance previously recognised under UK GAAP (75) (68)
794 956 Related taxation effect (159) (191)Adjustment to net assets 635 765
RISK AND REVENUE SHARING ARRANGEMENTS (RRSAS)The Company enters into arrangements with certain workshare partners under which these suppliers: (i) contribute to the forecast costs of developing an engine; and (ii) supply components for the production phase for which they receive consideration, which is an agreed proportion of the total programme revenues. Cash sums received are recognised in the income statement to match the expensing of the Company’s related costs – where the cash sums are received in advance of the related costs being expensed or where the related costs are capitalised as intangible assets, the recognition of the cash received is deferred to match the recognition of the related expense or the amortisation of the related intangible asset respectively. The payments to suppliers of their shares of the programme revenues for their production components are charged to the income statement as programme revenues arise.
Under FRS 101, certain development costs previously written off to the income statement now meet the criteria for capitalisation as an intangible asset. Where cash sums have been received in relation to such costs an adjustment has been made to defer the costs and match them to the amortisation of the intangible asset.
NOTES TO THE COMPANY FINANCIAL STATEMENTS CONTINUED
Financial Statements

Financial Statements
Rolls-Royce plc Annual Report 2015 139
18 Transition to FRS 101 Reduced Disclosure Framework continuedThe impact arising from this change is summarised as follows:
At 1 January
2014£m
Year ended 31 December
2014 £m
Income statementAdjustments to research and development costs (13)Adjustment to loss before taxation (13)
Net assetsOther creditors falling due within one year 15 5 Other creditors falling due after one year (95) (98)
(80) (93)Related taxation effect 16 19 Adjustment to net assets (64) (74)
POST-RETIREMENT BENEFITSOn transition to FRS 101, the longevity swap held in the Rolls-Royce Pension Fund is treated as a stand-alone financial instrument and in accordance with IAS 19 is valued at fair value. An adjustment has been made to restate the previous valuation under UK GAAP to fair value. The bases of recognising surpluses on pension funds differs between UK GAAP and IAS 19. Accordingly, an adjustment has been made to reflect the surplus in line with the requirements of IAS 19.
The impact arising from this change is summarised as follows:
At 1 January
2014£m
Year ended 31 December
2014 £m
Income statementAdjustments to operating loss (5)Adjustments to financing costs 19 Adjustment to loss before taxation 14
Net assetsPost retirement scheme – surpluses (221) 428
(221) 428 Related taxation effect 7 (344)Adjustment to net assets (214) 84
INCOME TAXESThe net deferred tax impact of the changes above is shown as part of the relevant adjustment.
In addition, under IAS 12 Income Taxes certain temporary differences, for example in respect of fixed assets, which previously were not recognised under UK GAAP, will be recognised.
The impact arising from this change is summarised as follows:
At 1 January
2014£m
Year ended 31 December
2014 £m
Net assetsChanges to deferred tax charge resulting from differences in the basis of calculation 1 (15)Adjustment to net assets 1 (15)
Financial Statements

140 Rolls-Royce plc Annual Report 2015
18 Transition to FRS 101 Reduced Disclosure Framework continuedRestatement of net assets and equity at 1 January 2014
UK GAAP as previously
reported£m
Development costs
£m
Other intangible
assets£m
Contractual Aftermarket
Rights£m
Risk and Revenue Sharing
Agreements£m
Post-retirement
benefits£m
Tax£m
Restated in accordance
with FRS 101£m
Fixed assets Intangible assets 872 560 37 869 – – – 2,338 Tangible assets 1,270 – – – – – – 1,270 Investments – subsidiary undertakings 1,749 – – – – – – 1,749 – joint ventures 70 – – – – – – 70 – other – – Post retirement schemes – surpluses 415 – – – – (221) – 194
4,376 560 37 869 – (221) – 5,621 Current assets Stocks 1,237 – – – – – – 1,237 Debtors– amounts falling due within one year 3,447 – – – – – – 3,447 – amounts falling due after one year 392 (112) (7) (234) 16 7 122 184 Other financial assets– amounts falling due within one year 83 – – – – – – 83 – amounts falling due after one year 687 – – – – – – 687 Short-term deposits 1,973 – – – – – – 1,973 Cash at bank and in hand 1,237 – – – – – – 1,237 Assets held for resale 2 – – – – – – 2
9,058 (112) (7) (234) 16 7 122 8,850 Creditors – amounts falling due within one year Borrowings (805) – – – – – – (805)Other financial liabilities (142) – – – – – – (142)Other creditors (6,940) – – – 15 – – (6,925)
(7,887) – – – 15 – – (7,872)
Net current assets 1,254 (112) (7) (234) 31 (76) 122 978
Total assets less current liabilities 5,547 448 30 635 31 (214) 122 6,599
Creditors – amounts falling due after one year Borrowings (1,951) – – – – – – (1,951)Other financial liabilities (403) – – – – – – (403)Other creditors (1,130) – – – (95) – (121) (1,346)
(3,484) – – – (95) – (121) (3,700)
Provisions for liabilities and charges (140) – – – – – – (140)Net assets 1,923 448 30 635 (64) (214) 1 2,759
Capital and reserves Called-up share capital 326 – – – – – – 326 Share premium account 631 – – – – – – 631 Revaluation reserve 26 – – – – – – 26 Other reserves 167 – – – – – – 167 Profit and loss account 773 448 30 635 (64) (214) 1 1,609 Total shareholders’ funds 1,923 448 30 635 (64) (214) 1 2,759
NOTES TO THE COMPANY FINANCIAL STATEMENTS CONTINUED
Financial Statements

Financial Statements
Rolls-Royce plc Annual Report 2015 141
18 Transition to FRS 101 Reduced Disclosure Framework continuedRestatement of net assets and equity at 31 December 2014
UK GAAP as previously
reported£m
Development costs
£m
Other intangible
assets£m
Contractual Aftermarket
Rights£m
Risk and Revenue Sharing
Agreements£m
Post-retirement
benefits£m
Tax£m
Restated in accordance
with FRS 101£m
Fixed assets Intangible assets 951 585 62 1,024 – – – 2,622 Tangible assets 1,348 – – – – – – 1,348 Investments – subsidiary undertakings 1,724 – – – – – – 1,724 – joint ventures 72 – – – – – – 72 – other – – Post retirement schemes – surpluses 1,299 – – – – 428 – 1,727
5,394 585 62 1,024 – 428 – 7,493 Current assets Stocks 1,237 – – – – – – 1,237 Debtors– amounts falling due within one year 6,141 – – – – – – 6,141 – amounts falling due after one year 416 (117) (12) (259) 19 (344) 464 167 Other financial assets– amounts falling due within one year 103 – – – – – – 103 – amounts falling due after one year 137 – – – – – – 137 Short-term deposits 1,279 – – – – – – 1,279 Cash at bank and in hand 662 – – – – – – 662 Assets held for resale – – – – – – – –
9975 (117) (12) (259) 19 (344) 464 9,726 Creditors – amounts falling due within one year Borrowings (1,100) – – – – – – (1,100)Other financial liabilities (218) – – – – – – (218)Other creditors (7,570) – – – 5 – – (7,565)
(8,888) – – – 5 – – (8,883)
Net current assets 1,347 (117) (12) (259) 24 (604) 464 843
Total assets less current liabilities 6,481 468 50 765 24 84 464 8,336
Creditors – amounts falling due after one year Borrowings (1,957) – – – – – – (1,957)Other financial liabilities (753) – – – – – – (753)Other creditors (1,399) – – – (98) – (479) (1,976)
(4,109) – – – (98) – (479) (4,686)
Provisions for liabilities and charges (174) – – – – – – (174)Net assets 2,198 468 50 765 (74) 84 (15) 3,476
Capital and reserves Called-up share capital 326 – – – – – – 326 Share premium account 631 – – – – – – 631 Revaluation reserve 21 – – – – – – 21 Other reserves 167 – – – – – – 167 Profit and loss account 1,053 468 50 765 (74) 84 (15) 2,331 Total shareholders’ funds 2,198 468 50 765 (74) 84 (15) 3,476
Financial Statements

142 Rolls-Royce plc Annual Report 2015
19 Contingent liabilitiesIn connection with the sale of its products the Company will, on some occasions, provide financing support for its customers. The Company’s contingent liabilities relating to financing arrangements are spread over many years and relate to a number of customers and a broad product portfolio.
Contingent liabilities are disclosed on a discounted basis. As the directors consider the likelihood of these contingent liabilities crystallising to be remote, this amount does not represent a value that is expected to crystallise. However, the amounts are discounted at the Company’s borrowing rate to reflect better the time span over which these exposures could arise. The contingent liabilities are denominated in US dollars. As the Company does not adopt cash flow hedge accounting for forecast foreign exchange transactions, this amount is reported together with the sterling equivalent at the reporting date spot rate.
The discounted value of the total gross contingent liabilities relating to financing arrangements on all delivered aircraft less insurance arrangements and relevant provisions were:
2015 2014
£m $m £m $m
Gross contingent liabilities 269 399 388 605 Value of security1 (136) (201) (245) (382)Indemnities (79) (118) (84) (132)Net commitments 54 80 59 91 Net commitments with security reduced by 20%2 78 115 90 140 1 Security includes cash collateral of: 35 52 42 66
2 Although sensitivity calculations are complex, the reduction of the relevant security by 20% illustrates the sensitivity of the contingent liability to this assumption.
In connection with the sale of its products the Company will, on some occasions, provide financing support for its customers – generally in respect of civil aircraft. The Company’s commitments relating to these financing arrangements are spread over many years, relate to a number of customers and a broad product portfolio and are generally secured on the asset subject to the financing. These include commitments of US$3.1bn to provide borrowing facilities to enable customers to purchase aircraft (of which approximately US$322m could be called in 2016) . These facilities may only be used if the customer is unable to obtain financing elsewhere and are priced at a premium to the market rate. Consequently the directors do not consider that there is a significant exposure arising from the provision of these facilities.
Contingent liabilities exist in respect of guarantees provided by the Company in the ordinary course of business for product delivery, performance and reliability. The Company has, in the normal course of business, entered into arrangements in respect of export finance, performance bonds, countertrade obligations and minor miscellaneous items. The Company is party to legal actions and claims which arise in the ordinary course of business, some of which are for substantial amounts. As a consequence of the insolvency of an insurer as previously reported, the Company is no longer fully insured against known and potential claims from employees who worked for certain of the Company’s UK based businesses for a period prior to the acquisition of those businesses by the Company. While the outcome of some of these matters cannot precisely be foreseen, the directors do not expect any of these arrangements, legal actions or claims, after allowing for provisions already made, to result in significant loss to the Company.
Where the Company enters into financial guarantee contracts to guarantee the indebtedness of other companies within its group, the Company considers these to be insurance arrangements, and accounts for them as such. In this respect, the Company treats the guarantee contract as a contingent liability until such time as it becomes probable that the Company will be required to make a payment under the guarantee. At 31 December 2015, these guarantees amounted to £178m.
At 31 December 2015, there were Company guarantees in respect of joint ventures amounting to £9m (2014 £9m).
The Company participates in a Cash Pooling Arrangement. Under the Pooling Arrangement the Company benefits from more favourable interest rates than would be available outside of the Pooling Arrangement as well as more streamlined treasury functions. As part of the Pooling Arrangement, the Company cross-guarantees the borrowings of other pooling participants. At 31 December 2015 these guarantees amounted to £11m (2014 £8m).
20 Related party transactions The Company is a wholly owned subsidiary of Rolls-Royce Group plc and therefore has taken advantage of the exemption in FRS 101 not to disclose related party transactions with its parent company and other wholly owned group companies.
Included in sales of goods and services to joint ventures and associates are sales of spare engines amounting to £189m (2014 £138m). The aggregated balances with joint ventures are shown in notes 7 and 11.
21 Ultimate holding company The ultimate holding company is Rolls-Royce Holdings plc, incorporated in Great Britain. The financial statements for Rolls-Royce Holdings plc may be obtained from the Company Secretary, Rolls-Royce Holdings plc, 62 Buckingham Gate, London SW1E 6AT.
NOTES TO THE COMPANY FINANCIAL STATEMENTS CONTINUED
Financial Statements

SUBSIDIARIES
Company name % held AddressA.F.C Wultex Limited * 90 Derby 1
A.P.E. – Allen Gears Limited * 100 Derby 1
Allen Power Engineering Limited * 100 Derby 1
Amalgamated Power Engineering Limited * 100 Derby 1
Bergen Engines AS 100 125 Hordvikneset, 5108 Hordvik, Bergen, 1201, NorwayBergen Engines Bangladesh Private Limited 100 Plot n.58E, Kemal Ataturk Avenue, Dhaka, 1213, BangladeshBergen Engines BV 100 Werfdijk 2, 3195HV Pernis, Rotterdam, NetherlandsBergen Engines Denmark A/S 100 23 Varftsvej, 9000 Aalborg, DenmarkBergen Engines India Private Limited 100 52-b Okhla Industrial Estate, Phase 3, New Delhi 110-020, IndiaBergen Engines Limited 100 Derby 1
Bergen Engines Property Co AS 100 125 Hordvikneset, 5108 Hordvik, Bergen, 1201, NorwayBergen Engines S.L. 100 Calle Dinamarca, 43120 Constanti, Tarragona, SpainBergen Engines S.r.l 100 13 Via Castel Morrone, 16161, Genoa, ItalyBristol Energy Limited * 100 Derby 1
Bristol Siddeley Engines Limited * 100 Derby 1
Brooks Inspection Solutions Limited 100 Derby 1
Brown Brothers & Company Limited * 100 Taxiway, Hillend Industrial Estate, Dalgety Bay, Dunfermline, Scotland, KY11 9JTC.A. Parsons & Company Limited * 100 Derby 1
Composite Technology and Applications Limited 100 Derby 1
Crossley-Premier Engines (Sales) Limited * 100 Derby 1
Croydon Energy Limited * 100 Derby 1
Data Systems & Solutions, LLC 100 5959 Shallowford Road, Chattanooga, TN 37421, USADeeside Titanium Limited * 82.5 Derby 1
Derby Cogeneration Limited * 100 Derby 1
Derby Specialist Fabrications Limited * 100 Derby 1
Europea Microfusioni Aerospaziali S.p.A. 100 Zona Industriale AS1, 83040 Morra De Sanctis, Avellino, ItalyExeter Power Limited * 100 Derby 1
Fluid Mechanics LLC 100 39525 MacKenzie Drive, Novi, Michigan 48377, USAGate Leasing Limited 100 London 2
Hartshill Ventures Limited 100 Derby 1
Heartlands Power Limited * 100 Derby 1
Heaton Power Limited * 100 Derby 1
John Hastie of Greenock (Holdings) Limited * 100 Derby 1
John Thompson Cochran Limited * 100 Taxiway, Hillend Industrial Estate, Dalgety Bay, Dunfermline, Scotland KY11 9JTJohn Thompson Limited * 100 Derby 1
Kalvet Engineering (Proprietary) Limited * 100 Corner Marcony Rd and 3rd St, Western Cape, 7441, South AfricaKamewa AB * 100 Box 1010, S-68129, Kristinehamn, SwedenKamewa Do Brazil Equipmentos Maritimos Limitada * 100 401 Rua Visconde de Piraja 433, Rio de Janeiro, BrazilKamewa Holding AB * 100 Box 1010, S-68129, Kristinehamn, SwedenKamewa UK Limited * 100 Derby 1
Karl Maybach-Hilfe GmbH 100 1 Maybachplatz, 88045 Friedrichshafen, GermanyL’Orange Unterstutzungkasse GmbH 100 Harteckweg 9, 72293 Glatten, GermanyL’Orange Fuel Injection (Ningbo) Co, Ltd 100 #3 South Qihang Rd 55, Yinzhou Economic Development Zone Ningbo City, 315145, ChinaL’Orange Fuel Injection Trading (Suzhou) Co, Ltd 100 #399 Suhong Middle Rd, Suzhou Industrial Park, Suzhou 215000, ChinaL’Orange GmbH 100 30 Porschestrabe, 70435 Stuttgart, GermanyM.L. Limited 100 Derby 1
MTU America Inc 100 39625 McKenzie Drive, Novi, MI 48377, USAMTU Anlagenvermietung GmbH 100 1 Maybachplatz, 88045 Friedrichshafen, GermanyMTU Asia PTE. Limited 100 #05-01, Robinson Rd 112, 068902, SingaporeMTU Benelux B.V. 100 Merwedestraat 86, 3313 CS, Dordrecht, NetherlandsMTU China Company Limited 100 1801–1803, 18/F Ascendas Plaza, No.333 Tian Yao Qiao Road Xuhai District, Shanghai,
200030, ChinaMTU Do Brazil Limitada 100 Via Anhanguera, KM 29203, 05276-000 Sao Paulo SP Brazil
* Dormant Entity1 Moor Lane, Derby, Derbyshire, England, DE24 8BJ2 62 Buckingham Gate, London, England SW1E 6AT
Other information
Rolls-Royce plc Annual Report 2015 143
Other inform
ation

Company name % held Address
MTU Engineering (Suzhou) Company Limited 100 9 Long Yun Rd, Suzhou Industrial Park, Suzhou 215024 Jiang Su, ChinaMTU France SAS 100 281 Chaussée Jules César, 95250 Beauchamp, FranceMTU Friedrichshafen GmbH 100 1 Maybachplatz, 88045 Friedrichshafen, GermanyMTU Hong Kong Limited 100 1-3 Wing Yip St, Kwai Chung, New Territories, Hong KongMTU Iberica Propulsion Y Energia S.L. 100 26-28 Calle Copernico, 28823 Coslada, Madrid, SpainMTU India Private Limited 100 159/1 Tathawade, Pune Mumbai Highway, Pune 411033, IndiaMTU Israel Limited 100 4 Ha"Alon Str, Kfar Neter, 4059300, IsraelMTU Italia S.r.l 100 Via Aurelia Nord, 328, 19021 Arcola (SP), ItalyMTU Japan Co Limited 100 2-15-19 Takanawa-Meiko, Minato-ku, Tokyo, 108-0074, JapanMTU Korea Limited 100 20F Kores First Bank Building, 100 Gongpyung-dong, Jongno-gu Seoul, 100-702,
Republic of KoreaMTU Middle East FZE 100 Showroom No. S3B5SR06 , Jebel Ali Free Zone, P.O. Box 61141 Dubai, United Arab EmiratesMTU Motor Turbin Sanayi Ve Ticaret. A.S 100 113. Ada 3.Parsel No.11, Çorlu, Tekirdag, 34555,TurkeyMTU Onsite Energy Corporation 100 100 Power Drive, Mankato, MIN 56001, USAMTU Onsite Energy GmbH 100 8 Rotthofer Straße, 94099 Ruhstorf a.d. Rott, GermanyMTU Onsite Energy Systems GmbH 100 8 Rotthofer Straße, 94099 Ruhstorf a.d. Rott, GermanyMTU Polska SP. ZOO 100 Ul. Slaska, Nr 9. Raum, Stargard Szczecinski, 73-110, Potsdam Stargard Szczecinski, PolandMTU Reman Technologies GmbH 100 8 Friedrich-List-Strabe, 39122 Magdeburg, GermanyMTU RUS LLC 100 Shabolovka Street 2, 119049, Moscow, Russian FederationMTU South Africa (Pty) Limited 100 Corner Marcony Rd and 3rd St, Western Cape, 7441 South AfricaMTU UK Limited 100 Unit 29 The Birches Industrial Estate, East Grinstead, England RH19 1XZNavis Consult d.o.o 75 Ul. Bartola Kasica 5/4, HR-51000, Rijeka, CroatiaNEI Allen Limited * 100 Derby 1
NEI Combustion Engineering Limited * 100 Derby 1
NEI International Combustion Limited * 100 Derby 1
NEI Limited * 100 Derby 1
NEI Mining Equipment Limited * 100 Derby 1
NEI Nuclear Systems Limited * 100 Derby 1
NEI Overseas Holdings Limited 100 Derby 1
NEI Parsons Limited * 100 Derby 1
NEI Peebles Limited * 100 Derby 1
NEI Power Projects Limited * 100 Derby 1
NEI Services Limited * 100 Derby 1
Nightingale Insurance Limited 100 Maison Trinity, Trinity Square, St. Peter Port, GY1 4AT, GuernseyOptimized Systems and Solutions (US) LLC 100 Suite 500, 54 Monument Circle, Indianapolis, IN 46204, USAOptimized Systems and Solutions Limited * 100 Derby 1
Oxygenaire Limited * 100 Derby 1
PKMJ Technical Services, Inc. 100 465 Malcolm Dr., Moon Township, PA 15108, USAPowerfield Limited * 100 Derby 1
Powerfield Specialist Engines Limited * 100 Derby 1
Prokura Diesel Services (pty) Limited 100 Corner Marcony Rd and 3rd St, Western Cape, 7441 South AfricaPT Rolls-Royce 100 Mid Plaza 2, Lantai 16 Jl. Jenderal Sudirman 10-11, JakartaPusat, 10220, IndonesiaPT MTU Indonesia 100 Secure Building Blok B, Jl. Raya Protokol Halim, Perdanakusuma Jakarta, 13610, IndonesiaQuay Leasing Limited 100 London 2
R. Brooks Associates, Inc. 100 6546 Pound Road, Williamson, NY14589, USARallyswift Limited * 100 Derby 1
Reyrolle Belmos Limited * 100 Taxiway, Hillend Industrial Estate, Dalgety Bay, Dunfermline, Scotland KY11 9JTRolls E.L Turbofans Limited * 100 Derby 1
Rolls-Royce (Ireland)* 100 1st Floor, IFSC House, International Financial Services Centre, Customs House Quay, Dublin, Irish Republic
Rolls-Royce (Thailand) Limited 100 900, 11th Fl, Tonson Tower, Ploenchit Rd, Bangkok, ThailandRolls-Royce (Xi’an) Mechanical Manufacturing Co. Limited 100 E-1, No. 5 Lan Tian Road, Xian Yanliang National Aviation Hi-Tech Industrial Base,
ChinaRolls-Royce AB 100 Box 1010, S-68129, Kristinehamn, Sweden
* Dormant Entity1 Moor Lane, Derby, Derbyshire, England, DE24 8BJ2 62 Buckingham Gate, London, England SW1E 6AT
SUBSIDIARIES CONTINUED
Other information
144 Rolls-Royce plc Annual Report 2015

Company name % held Address
Rolls-Royce Aero Engine Services Limited * 100 Derby 1
Rolls-Royce Aircraft Management Limited 100 London 2
Rolls-Royce Australia Limited 100 Suite 102, 2-4 Lyonpark Rd, Macquarie Park, NSW- 2113, AustraliaRolls-Royce Australia Services PTY Limited 100 Suite 102, 2-4 Lyonpark Rd, Macquarie Park, NSW- 2113, AustraliaRolls-Royce Brazil Limitada 100 Rua Dr Cincinato Braga 47, Planalto, Sao Bernando do Campo/SP 09890-900, BrazilRolls-Royce Canada Limited 100 9500 Cote De Liesse Rd, Lachine QC H8T 1A2, CanadaRolls-Royce Capital Limited 100 Derby 1
Rolls-Royce Civil Nuclear Canada Limited 100 597 The Queensway, Peterborough ON K9J7J6, CanadaRolls-Royce Civil Nuclear SAS 100 23 Chemin du Vieux Chene, 38240, Meylan, FranceRolls-Royce Commercial (Beijing) Co., Limited 100 2109 China Life Building, 16 Chao Yang Men Wai Street, Beijing 100020, ChinaRolls-Royce Commercial Aero Engines Limited * 100 Derby 1
Rolls-Royce Control Systems Holdings Co 100 Suite 200, 1875 Explorer Street, Reston, VA 20190, USARolls-Royce Controls and Data Services (NZ) Limited 100 L7 Bayleys Building, 36 Brandon St, Wellington, 6011 New ZealandRolls-Royce Controls and Data Services (UK) Limited 100 Derby 1
Rolls-Royce Controls and Data Services Inc. 100 Suite 200, 1875 Explorer Street, Reston, VA 20190, USARolls-Royce Controls and Data Services Limited 100 Derby 1
Rolls-Royce Corporation 100 2001 S Tibbs Avenue, Indianapolis, IN 46206, USARolls-Royce Côte d’Ivoire Sarl 100 7 Boulevard Latrille, 25 BP 945, Abidjan, Côte d'IvoireRolls-Royce Credit Corporation 100 Suite 200, 1875 Explorer Street, Reston, VA 20190, USARolls-Royce Crosspointe LLC 100 Suite A, 3811 Corporate Rd. Petersburg, VA 23805-0848, USARolls-Royce de Venezuela SA 100 Avenida 3E, entre Calles 78 y 79, Torre Empresarial Claret Piso 10, Oficina 10-3, Sector
Valle Frio, Maracaibo, VenezuelaRolls-Royce Defense Holdings Inc. 100 2001 S Tibbs Avenue, Indianapolis, IN 46206, USARolls-Royce Defense Products and Solutions Inc. 100 2001 S Tibbs Avenue, Indianapolis, IN 46206, USARolls-Royce Defense Services Inc. 100 2001 S Tibbs Avenue, Indianapolis, IN 46206, USARolls-Royce Deutschland Ltd & Co KG 100 11 Eschenweg, 15827 Blankenfelde-Mahlow, GermanyRolls-Royce Directorate Limited * 100 Derby 1
Rolls-Royce Energy Angola Limitada 100 Rua Rei Katyavala, Entrada B, Piso 8, Luanda, AngolaRolls-Royce Energy Systems Inc. 100 Suite 200, 1875 Explorer Street, Reston, VA 20190, USARolls-Royce Engine Control Systems Pension Trustees Ltd 100 Derby 1
Rolls-Royce Engine Controls Holdings Limited 100 Derby 1
Rolls-Royce Engine Services – Oakland Inc. 100 7200 Earhart Road, Oakland, CA 64621-4504, USARolls-Royce Engine Services Holdings Co 100 Suite 200, 1875 Explorer Street, Reston, VA 20190, USARolls-Royce Engine Services Limitada Inc. * 100 Bldg 06 Berthaphil Compound, Jose Abad Santos Avenue, Clark Special Eco Zone,
Pampanga, PhilippinesRolls-Royce Erste Beteiligungs GmbH 100 11 Eschenweg, 15827 Blankenfelde-Mahlow, GermanyRolls-Royce Finance Company Limited * 100 Derby 1
Rolls-Royce Finance Holdings Co 100 Suite 200, 1875 Explorer Street, Reston, VA 20190, USARolls-Royce Fuel Cell Systems Limited 100 Derby 1
Rolls-Royce General Partner Limited 100 Derby 1
Rolls-Royce High Temperature Composites Inc. 100 18411 Gothard Street #8, Huntington Beach, CA 92648, USARolls-Royce Holdings Canada Inc. 100 9500 Cote De Liesse Rd, Lachine QC H8T 1A2, CanadaRolls-Royce India Limited 100 Derby 1
Rolls-Royce India Private Limited 100 Birla Tower West 25, Barakhamba Rd, New Delhi, 110001, IndiaRolls-Royce Industrial & Marine Gas Turbines * 100 Derby 1
Rolls-Royce Industrial & Marine Power Limited * 100 Derby 1
Rolls-Royce Industrial Power (India) Limited 100 Derby 1
Rolls-Royce Industrial Power (Overseas Projects) Limited 100 Derby 1
Rolls-Royce Industrial Power Engineering (Overseas Projects) Limited
100 Derby 1
Rolls-Royce Industrial Power Investments Limited * 100 Derby 1
Rolls-Royce Industrial Power Systems Limited * 100 Derby 1
Rolls-Royce Industries Limited * 100 Derby 1
Rolls-Royce International Limited 100 Derby 1
* Dormant Entity1 Moor Lane, Derby, Derbyshire, England, DE24 8BJ2 62 Buckingham Gate, London, England SW1E 6AT
Other information
Rolls-Royce plc Annual Report 2015 145
Other inform
ation

Company name % held Address
Rolls-Royce International LLC 100 10 B. Sadovaya St, 123001, Moscow, RussiaRolls-Royce International S.R.O. 100 Pobřežní 620/3, 186 00, Karlin - Prague 8, Czech RepublicRolls-Royce Investment Co 100 Suite 200, 1875 Explorer Street, Reston, VA20190, USARolls-Royce Italia SRL 100 Via Castel Morrone 13,16161, Genova, ItalyRolls-Royce Japan Co. Limited 100 31 Fl, Kasumigaseki bldg, 3-2-5 Kasumigaseki, Chiyoda-Ku, Tokyo 100-6031, JapanRolls-Royce JSF Holdings Inc. 100 2001 S Tibbs Avenue, Indianapolis, IN46206, USARolls-Royce Leasing Limited 100 Derby 1
Rolls-Royce Malaysia SDN BHD 100 Suite 13.03, 13th Fl, Menara Tan & Tan, 207 Jalan Tun Razak 50400 Kuala Lumpur, Malaysia
Rolls-Royce Marine A/S 100 Vaerftsvej 23 , 2300, Aalborg, DenmarkRolls-Royce Marine AS 100 Sjogata 80, 6065 Ulsteinvik, NorwayRolls-Royce Marine Asia Limited 100 1-3 Wing Yip St, Kwai Chung, New Territories, Hong KongRolls-Royce Marine Australia Pty Limited 100 Unit 2/8 Wallace Way, Fremantle WA 6160, AustraliaRolls-Royce Marine Benelux BV 100 Werfdijk 2, 3195HV Pernis, Rotterdam, NetherlandsRolls-Royce Marine Chile SA 100 Alcantara 200, Office 1303, Las Condes, Santiago, ChileRolls-Royce Marine Deutschland GmbH 100 Fahrstieg 9, 21107, Hamburg, GermanyRolls-Royce Marine Electrical Systems Limited 100 Derby 1
Rolls-Royce Marine Espana S.A. 100 Poligono Industrial de Constanti, 43120 Constanti, Tarragona, SpainRolls-Royce Marine France Sarl 100 4 Place Des Etats Unis, Imm Monaco Silic 261, Rungis, FranceRolls-Royce Marine Hellas S.A. 100 25 Atki Poseidonos & Makrigianni corner, Athens 18344, GreeceRolls-Royce Marine Hong Kong Limited 100 1-3 Wing Yip St, Kwai Chung, New Territories, Hong KongRolls-Royce Marine India Private Limited 100 PLOT D-505, TTC Industrial Area, MIDC, Sharaya Hyundai Lane Turbhe, Navi Mumbai,
Maharashtra, 400710, IndiaRolls-Royce Marine Korea Limited 100 197 Noksansaneopbung-ro , Gangseogu, Busan, Republic of KoreaRolls-Royce Marine Manufacturing (Shanghai) 100 1 Xuanzhong Rd, Xuanqiao Town, Pudong New Area, Shanghai 201399, ChinaRolls-Royce Marine North America Inc. 100 Suite 200, 1875 Explorer Street, Reston, VA20190, USARolls-Royce Marine Power Operations Limited 100 Derby 1
Rolls-Royce Mechanical Test Operations Centre GmbH 100 Kiefernstrasse 1,15827 Blankenfelde-Mahlow, Dahlewitz, GermanyRolls-Royce Mexico Administration S de RL de CV, Rolls-Royce Mexico S de RL de CV
100 Adolfo Ruiz Cortinez 3642-403, Costa de Oro, Veracruz 94299 6, Mexico
Rolls-Royce Military Aero Engines Limited * 100 Derby 1
Rolls-Royce Namibia (Proprietary) Limited 100 Ausspann Plaza, Dr Agostinho Neto Rd, Private Bag 12012, Asspannplatz, Windhoek, Namibia
Rolls-Royce New Zealand Limited 100 L7 Bayleys Building, 36 Brandon St, Wellington, 6011, New ZealandRolls-Royce Nigeria Limited 100 22A Gerrard Street, Ikoyi, Lagos, NigeriaRolls-Royce North America (USA) Holdings Co. 100 Suite 200, 1875 Explorer Street, Reston, VA 20190, USARolls-Royce North America Holdings Inc. 100 Suite 200, 1875 Explorer Street, Reston, VA 20190, USARolls-Royce North America Inc. 100 Suite 200, 1875 Explorer Street, Reston, VA 20190, USARolls-Royce North America Ventures Inc. 100 Suite 200, 1875 Explorer Street, Reston, VA 20190, USARolls-Royce North American Technologies Inc. 100 2059 S Tibbs Avenue, Indianapolis, IN 46241, USARolls-Royce Nuclear Field Services France SAS 100 ZA Notre-Dame, 84430, Mondragon, FranceRolls-Royce Oman LLC 100 PO Box 686, Ruwi, 112, OmanRolls-Royce Operations (India) Private Limited 100 Whitefield Rd, EPIP Zone, Mahadevapura Bangalore 560066, IndiaRolls-Royce Overseas Holdings Limited 100 Derby 1
Rolls-Royce Overseas Investments Limited 100 Derby 1
Rolls-Royce Overseas Projects Limited 100 Derby 1
Rolls-Royce Oy Ab 100 PO Box 220, Suojantie 5, 26101, Rauma, FinlandRolls-Royce Placements Limited 100 Derby 1
Rolls-Royce Poland Sp z.o.o 99.5 GNIEW 83-140, ul. Kopernika 1, PolandRolls-Royce Power Development Limited 100 Derby 1
Rolls-Royce Power Engineering plc 100 Derby 1
Rolls-Royce Power Systems AG 100 1 Maybachplatz, 88045, Friedrichshafen, GermanyRolls-Royce Saudi Arabia Limited 100 PO Box 88545, Riyadh, 11672, Saudi Arabia
* Dormant Entity1 Moor Lane, Derby, Derbyshire, England, DE24 8BJ2 62 Buckingham Gate, London, England SW1E 6AT
SUBSIDIARIES CONTINUED
Other information
146 Rolls-Royce plc Annual Report 2015

Company name % held Address
Rolls-Royce Secretariat Ltd * 100 Derby 1
Rolls-Royce Singapore Pte. Ltd 100 1 Seletar Aerospace Crescent, 797565 SingaporeRolls-Royce Technical Support Sarl 100 Centreda 1, av Didier Daurat, 31700 Blagnac, Toulouse, FranceRolls-Royce Total Care Services Limited 100 Derby 1
Rolls-Royce Transmission and Distribution Limited * 100 Derby 1
Rolls-Royce Turkey Power Solutions Industry and Trade Limited 100 Ekemen Han No:1 Kat:6 Kabataş Beyoğlu , Istanbul, TurkeyRolls-Royce Vietnam Limited 100 Dong Xuyen Industrial Zone, Rach Dua Ward, Vung Tau City Ba Ria – Vung Tau
Province, VietnamRolls-Royce Zweite Beteiligungs GmbH 100 11 Eschenweg, 15827 Blankenfelde-Mahlow, GermanyRoss Ceramics Limited 100 Derby 1
R.O.V Technologies, Inc. 100 49 Bennett Drive, Guilford, Vermont, USAR-R Industrial Controls Limited * 100 Derby 1
Scandinavian Electric Gdansk Sp. z.o.o. 67 M. Reja 3, Gdansk, 80-404, PolandScandinavian Electric Systems do Brazil Limitada 66 Rua Sao Jose 90, salas 1406-07, Rio de Janeiro, RJ, BrazilSpare IPG (AGL) Limited, Spare IPG (CEL) Limited, Spare IPG 3 Limited, Spare IPG 4 Limited, Spare IPG 11 Limited, Spare IPG 15 Limited, Spare IPG 20 Limited, Spare IPG 22 Limited, Spare IPG 24 Limited, Spare IPG 27 Limited, Spare IPG 28 Limited, Spare IPG 30 Limited, Spare IPG 32 Limited *
100 Derby 1
Spare IPG 18 Ltd * 90 Derby 1
Stone Vickers Limited * 100 Derby 1
Superstructure Capital Limited 100 Derby 1
The Bushing Company Limited * 100 Derby 1
Timec 1487 Limited * 100 Derby 1
Trigno Energy S.r.l. 100 Zona Industrial, San Salvo, 66050, ItalyUlstein Holding AS 100 Sjøgata 80, 6065 Ulsteinvik, NorwayUlstein Maritime Limited 100 96 North Bend St, Coquitlam, BC V3K 6H1, CanadaUlstein Trading Ltd AS * 100 Sjøgata 80, 6065, Ulsteinvik, NorwayVessel Lifts Inc * 100 Suite 102, 9130 S Dadeland Blvd, Miami, FL 33156, USAVickers Pension Trustees Limited * 100 Derby 1
Vickers Pressings Limited * 100 Derby 1
Viking Power Limited * 100 Derby 1
Vinters Defence Systems Limited * 100 Derby 1
Vinters Engineering Limited 100 Derby 1
Vinters International Limited 100 Derby 1
Vinters Limited 100 Derby 1
Vinters-Armstrongs (Engineers) Limited * 100 Derby 1
Vinters-Armstrongs Limited * 100 Derby 1
Wultex Machine Company Limited * 100 Derby 1
Wultex Machine Company Limited* 100 Derby1
* Dormant Entity1 Moor Lane, Derby, Derbyshire, England, DE24 8BJ2 62 Buckingham Gate, London, England SW1E 6AT
Other information
Rolls-Royce plc Annual Report 2015 147
Other inform
ation

Company name AddressClass of shares
% of class held
Group interest held %
Aero Gearbox International SAS 18 Boulevard Louis Seguin, 92700 Colombes, France Ordinary 50 50Aerospace Transmission Technologies GmbH Adelheidstrasse 40, D-88046, Friedrichshafen,
GermanyOrdinary 50 50
Airtanker 1 Limited * One London Wall, London, England EC2Y 5EB Ordinary 20 20Airtanker Finance Limited One London Wall, London, England EC2Y 5EB Ordinary 20 20Airtanker Holdings Limited One London Wall, London, England EC2Y 5EB Ordinary 20 20Airtanker Limited One London Wall, London, England EC2Y 5EB Ordinary 20 20Airtanker Services Limited Airtanker Hub, RAF Brize Norton,
Carterton,Oxfordshire, England OX18 3LX Ordinary 22 22
Alpha Leasing Limited, Alpha Leasing (No.4) Limited, Alpha Leasing (No.9) Limited, Alpha Leasing (No.10) Limited, Alpha Leasing (No.11) Limited, Rolls-Royce & Partners Finance Limited
London 2 Ordinary 100 50
Alpha Leasing (US) LLC, Alpha Leasing (US) (No 2) LLC, Alpha Leasing (US) (No 4) LLC, Alpha Leasing (US) (No 5) LLC, Alpha Leasing (US) (No.6) LLC, Alpha Leasing (US) (No.7) LLC, Alpha Leasing (US) (No.8) LLC, Rolls-Royce & Partners Finance (US) LLC, Rolls-Royce & Partners Finance (US) (NO.2) LLC
Suite 200, 1875 Explorer Street, Reston, VA 20190, USA
Partnerships (no equity held)
– 50
Alpha Partners Leasing Limited London 2 A Ordinary 100 50Anecom Aerotest GmbH 124/126 Freiheitsstrasse, Wildau, D-15745, Germany Ordinary 24.9 24.9Clarke Chapman Portia Port Services Limited Maritime centre, Port of Liverpool, Liverpool
L21 1LAA Ordinary 100 50
Egypt Aero Management Services EgyptAir Engine Workshop, Cairo International Airport, Cairo, Egypt
Ordinary 50 50
EPI Europrop International GmbH Dachauer Strasse 655, 80995 Munich, Germany Ordinary 28 Effective 35.5EPI Europrop International Madrid S.L. Edificio Berlin – First Floor, Parque Empresarial San
Fernando, Avenida Castilla 2, 28830 San Fernando De Henares, Madrid, Spain
Ordinary 28 Effective 35.5
Eurojet Turbo GmbH Lilienthalstrasse 2b, 85399 Hallbergmoos, Germany Ordinary 33 Effective 39GE Rolls-Royce Fighter Engine Team LLC 2001 S Tibbs Avenue, Indianapolis, IN 46206, USA
Partnership(no equity held) – 40
Genistics Holdings Limited Derby 1 Ordinary A 100 50Genistics Limited Derby 1 Ordinary 100 50Glacier LP Suite 300, Bank Tower, 66 Wellington Street West,
Toronto, ON M5K 1E6, Canada Ordinary 50 50
Global Aerospace Centre for Icing and Environmental Research Inc.
1000 Marie-Victorin Boulevard, Montreal, QC J4G 1A1, Canada
Ordinary 50 50
Hong Kong Aero Engine Services Limited 33/F, 2 Pacific Place, 88 Queensway, Hong Kong Ordinary 45 45Hovden Klubbhaus AS Stalhaugen 5, Ulsteinvik, 6065 Norway Ordinary 69 69Industria De Turbo Propulsores SA Suite 300, Parque Technologico, 48170 Zamudio,
Vizcaya, SpainOrdinary 46.9 46.9
International Aerospace Manufacturing Private Ltd 3 Kempapure Village, Bangalore, 560037, India Ordinary 50 50International Engine Component Overhaul Pte Ltd No.3 Loyang Way 2, 507102, Singapore Ordinary 50 50LG Fuel Cell Systems Inc. 6065 Strip Ave, Canton, OH 44720-9207, USA Common Stock 32 32Light Helicopter Turbine Engine Company (unincorporated partnership)
Suite 119, 9238 Madison Boulevard, Madison, AL 35758, USA
Partnership (no equity held)
– 50
Metlase Limited Unipart House, Garsington Road, Cowley, Oxford, England OX4 2PG
Ordinary B 100 20
MTU Turbomeca Rolls-Royce GmbH Am Soldnermoos 17, 85399 Hallbergmoos, Germany Ordinary 33.3 33.3MTU Turbomeca Rolls-Royce ITP GmbH Am Soldnermoos 17, 85399 Hallbergmoos, Germany Ordinary 25 Effective 26N3 Engine Overhaul Services GmbH & Co KG 1 Gerhard-Höltje-Str, D-99310, Arnstadt, Germany Ordinary 50 50N3 Engine Overhaul Services Verwaltungsgesellschaft Mbh 1 Gerhard-Höltje-Str, D-99310, Arnstadt, Germany Ordinary 50 50Northern Engineering Industries Africa Limited (in liquidation) * 2nd floor, Ristone Office Park, 15 Sherborne Rd,
Parktown 2193, South Africa Ordinary 24.4 24.4
Offshore Simulator Centre AS 4 Larsgardsvegen, 6009, Alesund, Norway Ordinary 25 25
* Dormant Entity1 Moor Lane, Derby, Derbyshire, England, DE24 8BJ2 62 Buckingham Gate, London, England SW1E 6AT
JOINT VENTURES AND ASSOCIATES
Other information
148 Rolls-Royce plc Annual Report 2015
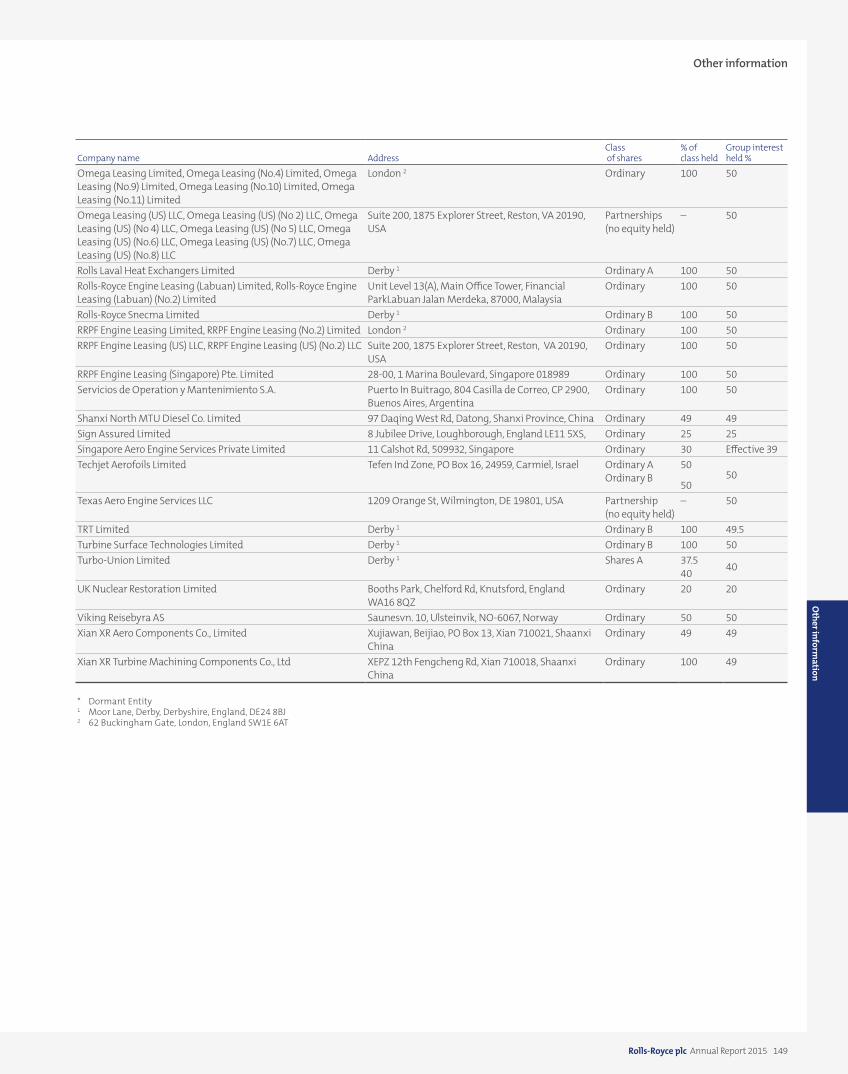
Company name AddressClass of shares
% of class held
Group interest held %
Omega Leasing Limited, Omega Leasing (No.4) Limited, Omega Leasing (No.9) Limited, Omega Leasing (No.10) Limited, Omega Leasing (No.11) Limited
London 2 Ordinary 100 50
Omega Leasing (US) LLC, Omega Leasing (US) (No 2) LLC, Omega Leasing (US) (No 4) LLC, Omega Leasing (US) (No 5) LLC, Omega Leasing (US) (No.6) LLC, Omega Leasing (US) (No.7) LLC, Omega Leasing (US) (No.8) LLC
Suite 200, 1875 Explorer Street, Reston, VA 20190, USA
Partnerships (no equity held)
– 50
Rolls Laval Heat Exchangers Limited Derby 1 Ordinary A 100 50Rolls-Royce Engine Leasing (Labuan) Limited, Rolls-Royce Engine Leasing (Labuan) (No.2) Limited
Unit Level 13(A), Main Office Tower, Financial ParkLabuan Jalan Merdeka, 87000, Malaysia
Ordinary 100 50
Rolls-Royce Snecma Limited Derby 1 Ordinary B 100 50RRPF Engine Leasing Limited, RRPF Engine Leasing (No.2) Limited London 2 Ordinary 100 50RRPF Engine Leasing (US) LLC, RRPF Engine Leasing (US) (No.2) LLC Suite 200, 1875 Explorer Street, Reston, VA 20190,
USAOrdinary 100 50
RRPF Engine Leasing (Singapore) Pte. Limited 28-00, 1 Marina Boulevard, Singapore 018989 Ordinary 100 50Servicios de Operation y Mantenimiento S.A. Puerto In Buitrago, 804 Casilla de Correo, CP 2900,
Buenos Aires, ArgentinaOrdinary 100 50
Shanxi North MTU Diesel Co. Limited 97 Daqing West Rd, Datong, Shanxi Province, China Ordinary 49 49Sign Assured Limited 8 Jubilee Drive, Loughborough, England LE11 5XS, Ordinary 25 25Singapore Aero Engine Services Private Limited 11 Calshot Rd, 509932, Singapore Ordinary 30 Effective 39Techjet Aerofoils Limited Tefen Ind Zone, PO Box 16, 24959, Carmiel, Israel Ordinary A
Ordinary B50
5050
Texas Aero Engine Services LLC 1209 Orange St, Wilmington, DE 19801, USA Partnership (no equity held)
– 50
TRT Limited Derby 1 Ordinary B 100 49.5Turbine Surface Technologies Limited Derby 1 Ordinary B 100 50Turbo-Union Limited Derby 1 Shares A 37.5
40 40
UK Nuclear Restoration Limited Booths Park, Chelford Rd, Knutsford, England WA16 8QZ
Ordinary 20 20
Viking Reisebyra AS Saunesvn. 10, Ulsteinvik, NO-6067, Norway Ordinary 50 50Xian XR Aero Components Co., Limited Xujiawan, Beijiao, PO Box 13, Xian 710021, Shaanxi
China Ordinary 49 49
Xian XR Turbine Machining Components Co., Ltd XEPZ 12th Fengcheng Rd, Xian 710018, Shaanxi China
Ordinary 100 49
* Dormant Entity1 Moor Lane, Derby, Derbyshire, England, DE24 8BJ2 62 Buckingham Gate, London, England SW1E 6AT
Other information
Rolls-Royce plc Annual Report 2015 149
Other inform
ation

150 Rolls-Royce plc Annual Report 2015
Other information
We have audited the financial statements of Rolls-Royce plc for the year ended 31 December 2015 set out on pages 65 to 149. The financial reporting framework that has been applied in the preparation of the group financial statements is applicable law and International Financial Reporting Standards (IFRSs) as adopted by the EU. The financial reporting framework that has been applied in the preparation of the parent company financial statements is applicable law and UK Accounting Standards (UK Generally Accepted Accounting Practice).
This report is made solely to the company’s members, as a body, in accordance with Chapter 3 of Part 16 of the Companies Act 2006. Our audit work has been undertaken so that we might state to the company’s members those matters we are required to state to them in an auditor’s report and for no other purpose. To the fullest extent permitted by law, we do not accept or assume responsibility to anyone other than the company and the company’s members, as a body, for our audit work, for this report, or for the opinions we have formed.
Respective responsibilities of directors and auditorAs explained more fully in the Directors’ Responsibilities Statement set out on pages 62 and 63, the directors are responsible for the preparation of the financial statements and for being satisfied that they give a true and fair view. Our responsibility is to audit, and express an opinion on, the financial statements in accordance with applicable law and International Standards on Auditing (UK and Ireland). Those standards require us to comply with the Auditing Practices Board’s Ethical Standards for Auditors.
Scope of the audit of the financial statements A description of the scope of an audit of financial statements is provided on the Financial Reporting Council’s website at www.frc.org.uk/auditscopeukprivate.
Opinion on financial statementsIn our opinion:
• the financial statements give a true and fair view of the state of the group’s and of the parent company’s affairs as at 31 December and of the group’s profit for the year then ended;
• the group financial statements have been properly prepared in accordance with IFRSs as adopted by the EU;
• the parent company financial statements have been properly prepared in accordance with UK Generally Accepted Accounting Practice;
• the financial statements have been prepared in accordance with the requirements of the Companies Act 2006.
Opinion on other matter prescribed by the Companies Act 2006In our opinion the information given in the Strategic Report and the Directors’ Report for the financial year for which the financial statements are prepared is consistent with the financial statements.
Based solely on the work required to be undertaken in the course of the audit of the financial statements and from reading the Strategic report and the Directors’ report:
• we have not identified material misstatements in those reports; and.
• in our opinion, those reports have been prepared in accordance with the Companies Act 2006.
Matters on which we are required to report by exceptionWe have nothing to report in respect of the following matters where the Companies Act 2006 requires us to report to you if, in our opinion:
• adequate accounting records have not been kept by the parent company, or returns adequate for our audit have not been received from branches not visited by us; or
• the parent company financial statements are not in agreement with the accounting records and returns; or
• certain disclosures of directors’ remuneration specified by law are not made; or
• we have not received all the information and explanations we require for our audit.
RICHARD ACKLAND (SENIOR STATUTORY AUDITOR)for and on behalf of KPMG LLP, Statutory Auditor
Chartered Accountants 15 Canada Square London E14 5GL 24 February 2016
INDEPENDENT AUDITOR’S REPORTto the members of Rolls-Royce plc only

Other information
Rolls-Royce plc Annual Report 2015 151
ADDITIONAL FINANCIAL INFORMATION
Foreign exchangeForeign exchange rate movements influence the reported income statement, the cash flow and closing net cash balance. The average and spot rates for the principal trading currencies of the Group are shown in the table below:
2015 2014 Change
USD per GBPYear end spot rate 1.48 1.56 -5%Average spot rate 1.53 1.65 -7%
EUR per GBP Year end spot rate 1.36 1.28 +6%Average spot rate 1.38 1.24 +11%
The Group’s approach to managing its tax affairs The Board is involved in setting the Group’s tax policies which govern the way its tax affairs are managed. In summary, this means:
(i) the Group manages its tax costs through maximising the tax efficiency of business transactions. This includes taking advantage of available tax incentives and exemptions;
(ii) this must be done in a way which is aligned with the Group’s commercial objectives and meets its legal obligations and ethical standards;
(iii) the Group also has regard for the intention of the legislation concerned rather than just the wording itself;
(iv) the Group is committed to building constructive working relationships with tax authorities based on a policy of full disclosure in order to remove uncertainty in its business transactions and to allow the authorities to review possible risks;
(v) where appropriate and possible, the Group enters into consultation with tax authorities to help shape proposed legislation and future tax policy; and
(vi) the Group seeks to price transactions between Rolls-Royce group companies as if they were between unrelated parties, in compliance with the OECD Transfer Pricing Guidelines and the laws of the relevant jurisdictions.
The Group’s global corporate income tax contributionAround 95% of the Group’s underlying profit before tax (excluding joint ventures and associates) is generated in the UK, the US, Germany, Norway, Finland and Singapore. The remaining profits are generated across more than 40 other countries. This reflects the fact that the majority of the Group’s business is undertaken, and employees are based, in the above countries.
In common with most multinational groups the total of all profits in respect of which corporate income tax is paid is not the same as the consolidated profit before tax reported on page 65. The main reasons for this are:
(i) the consolidated income statement is prepared under IFRS whereas tax is paid on the profits of each Group company, which are determined by local accounting rules;
(ii) accounting rules require certain income and costs relating to our commercial activities to be eliminated from, or added to, the aggregate of all the profits of the Group companies when preparing the consolidated income statement (‘consolidation adjustments’); and
(iii) specific tax rules including exemptions or incentives as determined by the tax laws in each country.
The Group’s total corporation tax payments in 2015 were £160m. The level of tax paid in each country is impacted by the above. In most cases, (i) and (ii) are only a matter of timing and therefore tax will be paid in an earlier or later year. As a result they only have a negligible impact on the Group’s underlying tax rate, which excluding joint ventures and associates would be 26.6% (the underlying tax rate including joint ventures and associates can be found on page 43). This is due to deferred tax accounting, details of which can be found in note 5 to the consolidated financial statements. The impact of (iii) will often be permanent depending on the relevant tax law.
Further information on the tax position of the Group can be found as follows:
• Note 1 to the consolidated financial statements (page 74) – Details of key areas of uncertainty and accounting policies for tax;
• Note 5 to the consolidated financial statements (page 86) – Details of the tax balances in the consolidated financial statements together with a tax reconciliation on continuing operations. This explains the main drivers of the tax rate.
At this stage we expect these items to continue to influence the underlying tax rate. The reported tax rate is more difficult to forecast due to the volatility of significant items in reported profits, in particular the net unrealised fair value changes to derivative contracts.
Investments and capital expenditureThe Group subjects all major investments and capital expenditure to a rigorous examination of risks and future cash flows to ensure that they create shareholder value. All major investments, including the launch of major programmes, require Board approval.
The Group has a portfolio of projects at different stages of their life cycles. Discounted cash flow analysis of the remaining life of projects is performed on a regular basis.
Sales of engines in production are assessed against criteria in the original development programme to ensure that overall value is enhanced. O
ther information

152 Rolls-Royce plc Annual Report 2015
Other information
ADDITIONAL FINANCIAL INFORMATION CONTINUED
Financial risk managementThe Board has established a structured approach to financial risk management. The Financial risk committee (Frc) is accountable for managing, reporting and mitigating the Group’s financial risks and exposures. These risks include the Group’s principal counterparty, currency, interest rate, commodity price, liquidity and credit rating risks outlined in more depth in note 16. The Frc is chaired by the Chief Financial Officer. The Group has a comprehensive financial risk policy that advocates the use of financial instruments to manage and hedge business operations risks that arise from movements in financial, commodities, credit or money markets. The Group’s policy is not to engage in speculative financial transactions. The Frc sits quarterly to review and assess the key risks and agree any mitigating actions required.
Capital structure
£ million 2015 2014
Total equity 6,289 6,831Cash flow hedges 100 81Group capital 6,389 6,462Net funds (111) 666
Operations are funded through various shareholders’ funds, bank borrowings, bonds and notes. The capital structure of the Group reflects the judgement of the Board as to the appropriate balance of funding required.
Funding is secured by the Group’s continued access to the global debt markets. Borrowings are funded in various currencies using derivatives where appropriate to achieve a required currency and interest rate profile. The Board’s objective is to retain sufficient financial investments and undrawn facilities to ensure that the Group can both meet its medium-term operational commitments and cope with unforeseen obligations and opportunities.
The Group holds cash and short-term investments which, together with the undrawn committed facilities, enable it to manage its liquidity risk.
On 6 October the Group issued US$500m 2.375% Notes due 2020 and US$1,000m 3.625% Notes due 2025.
During the year the Group renegotiated the £1,000m committed bank borrowing facility, increasing the amount to £1,500m and extending the maturity to 2020. This facility was undrawn at the period end. A €300m committed borrowing facility was cancelled during the period.
At year end, the Group retained aggregate liquidity of £5.0 billion, including: cash and cash equivalents of £3.2 billion and undrawn borrowing facilities of £1.8bn. In 2016, £419m of the facilities mature.
The maturity profile of the borrowing facilities is regularly reviewed to ensure that refinancing levels are manageable in the context of the business and market conditions. There are no rating triggers in any borrowing facility that would require the facility to be accelerated or repaid due to an adverse movement in the Group’s credit rating.
The Group conducts some of its business through a number of joint ventures. A major proportion of the debt of these joint ventures is secured on the assets of the respective companies and is non-recourse to the Group. This debt is further outlined in note 10.
Credit rating
Rating Outlook Grade
Moody’s Investors Service A3 Stable InvestmentStandard & Poor’s A Negative Investment
The Group’s holding company, Rolls-Royce Holdings plc, subscribes to both Moody’s Investors Service and Standard & Poor’s for independent long-term credit ratings. At the date of this report, it maintained investment grade ratings from both agencies.
As a capital-intensive business making long-term commitments to our customers, the Group attaches significant importance to maintaining or improving the current investment grade credit ratings.
AccountingThe consolidated Financial Statements have been prepared in accordance with International Financial Reporting Standards (IFRS), as adopted by the EU.
No new accountings standards had a material impact in 2015. The impact changes to IFRS which have not been adopted in 2015 is included within the accounting policies in note 1.

Other information
Rolls-Royce plc Annual Report 2015 153
Other inform
ation
Other information
GLOSSARY
ABC anti-bribery and corruptionADR American Depositary ReceiptsAGM Annual General MeetingAMC Approved Maintenance CentreAPRA Annual Performance Related Award planArticles Articles of Association of Rolls-Royce Holdings plcC Shares non-cumulative redeemable preference sharesC&A commercial and administrativeCAGR Compound Annual Growth RateCARs contractual aftermarket rightsCEO chief executive officerCFO chief financial officerCGU cash-generating unitCO2 carbon dioxideCompany Rolls-Royce plcCPS cash flow per shareCRIP C Share Reinvestment PlanELT Executive Leadership TeamEPS earnings per shareEU European UnionEUR euroFCA Financial Conduct AuthorityFCAS Future Combat Air SystemFRC Financial Reporting CouncilFX foreign exchangeGBP Great British pound or pound sterlingGHG greenhouse gasGlobal Code Global Code of ConductGroup Rolls-Royce plc and its subsidiariesHMRC HM Revenue & CustomsHS&E health, safety and environmentI&C instrumentation and controlIAB International Advisory BoardIAS International Accounting Standards
IASB International Accounting Standards BoardIFRIC International Financial Reporting Interpretations CommitteeIFRS International Financial Reporting StandardsKPIs key performance indicatorsktCO2e kilotonnes carbon dioxide equivalentLIBOR London Inter-Bank Offered RateLTSA long-term service agreementLNG liquefied natural gasMRO Maintenance, repair and overhaulNCI non-controlling interestNOx nitrogen oxidesOCI other comprehensive incomeOE original equipmentOECD Organisation for Economic Cooperation and DevelopmentPBT profit before taxPSP Performance Share PlanR&D research and developmentR&T research and technologyREACH Registration, Evaluation Authorisation and restriction
of CHemicalsRegistrar Computershare Investor Services PLCRRPS Rolls-Royce Power Systems AG RRSAs risk and revenue sharing arrangements SFO Serious Fraud OfficeSIP Share Incentive PlanSOx sulphur oxidesSTEM science, technology, engineering and mathematicsTCA TotalCare agreementthe Code UK Corporate Governance CodeTRI total reportable injuriesTSR total shareholder returnUSD/US$ United States dollarUTCs University Technology Centres

Designed by

© Rolls-Royce plc 2016
Rolls-Royce plc Registered office: 62 Buckingham Gate London SW1E 6AT
T +44 (0)20 7222 9020 www.rolls-royce.com
Company number 1003142