E4182 v4 - World Bank Documents
237
Project Draft EMF Report Submitted to Chief Engineer (Urban)-Cum-Member Secretary, Executive Committee, Bihar State Water and Sanitation Mission (BSWSM) (Public Health Engineering Department, Govt. of Bihar) Vishveshwariya Bhawan, Bailey Road, Patna-800001 Environmental Assessment and Environmental Management Framework for the state of Bihar Draft Final Report (version 2) Public Disclosure Authorized Public Disclosure Authorized Public Disclosure Authorized Public Disclosure Authorized Public Disclosure Authorized Public Disclosure Authorized Public Disclosure Authorized Public Disclosure Authorized Public Disclosure Authorized Public Disclosure Authorized Public Disclosure Authorized Public Disclosure Authorized Public Disclosure Authorized Public Disclosure Authorized Public Disclosure Authorized Public Disclosure Authorized Public Disclosure Authorized Public Disclosure Authorized Public Disclosure Authorized Public Disclosure Authorized
-
Upload
khangminh22 -
Category
Documents
-
view
0 -
download
0
Transcript of E4182 v4 - World Bank Documents

Project Draft EMF Report
Submitted to
Chief Engineer (Urban)-Cum-Member Secretary,
Executive Committee, Bihar State Water and Sanitation
Mission (BSWSM)
(Public Health Engineering Department, Govt. of Bihar)
Vishveshwariya Bhawan,
Bailey Road, Patna-800001
Environmental Assessment and
Environmental Management
Framework for the state of Bihar
Draft Final Report (version 2)
Pub
lic D
iscl
osur
e A
utho
rized
Pub
lic D
iscl
osur
e A
utho
rized
Pub
lic D
iscl
osur
e A
utho
rized
Pub
lic D
iscl
osur
e A
utho
rized
Pub
lic D
iscl
osur
e A
utho
rized
Pub
lic D
iscl
osur
e A
utho
rized
Pub
lic D
iscl
osur
e A
utho
rized
Pub
lic D
iscl
osur
e A
utho
rized
Pub
lic D
iscl
osur
e A
utho
rized
Pub
lic D
iscl
osur
e A
utho
rized
Pub
lic D
iscl
osur
e A
utho
rized
Pub
lic D
iscl
osur
e A
utho
rized
Pub
lic D
iscl
osur
e A
utho
rized
Pub
lic D
iscl
osur
e A
utho
rized
Pub
lic D
iscl
osur
e A
utho
rized
Pub
lic D
iscl
osur
e A
utho
rized
Pub
lic D
iscl
osur
e A
utho
rized
Pub
lic D
iscl
osur
e A
utho
rized
Pub
lic D
iscl
osur
e A
utho
rized
Pub
lic D
iscl
osur
e A
utho
rized
wb350881
Typewritten Text
E4182 v4

Environmental Assessment and Environmental Management Framework for the state of Bihar
ii
© The Energy and Resources Institute 2013
Suggested format for citation
T E R I. 2013
Inception Report for study on ‚Environmental Assessment and
Environmental Management Framework for the state of Bihar‛
New Delhi: The Energy and Resources Institute.
Contact Details
Anshuman
Associate Director (Water Resources)
T E R I Tel. 2468 2100 or 2468 2111
Darbari Seth Block E-mail [email protected]
IHC Complex, Lodhi Road Fax 2468 2144 or 2468 2145
New Delhi – 110 003 Web www.teriin.org
India +91 • Delhi (0)11

Environmental Assessment and Environmental Management Framework for the state of Bihar
iii
TTaabbllee ooff CCoonntteennttss
AA bb bb rr ee vv ii aa tt ii oo nn ss .................................................................................................................... 1
EE xx ee cc uu tt ii vv ee SS uu mm mm aa rr yy ......................................................................................................... 3
11 .. II nn tt rr oo dd uu cc tt ii oo nn ............................................................................................................... 15
1.1 Background ..................................................................................................................... 15
1.2 World Bank Assisted Rural Water Supply and Sanitation Project ......................... 15
1.2.1 Institutional.................................................................................................................. 16
1.2.2 Sanitation and Hygiene Promotion .......................................................................... 16
1.2.3 Financing ...................................................................................................................... 16
1.2.4 Water Source Protection, Development and Management .................................. 16
1.2.5 Proposed Development Objective(s)........................................................................ 19
1.3 Scope of the Project ........................................................................................................ 19
1.4 Need for Environmental Assessment ......................................................................... 23
1.5 Objectives of Environmental Assessment .................................................................. 23
1.6 Approach and Methodology ........................................................................................ 24
1.6.1 Approach ..................................................................................................................... 24
1.6.2 Methodology ............................................................................................................... 24
1.7 Site selection.................................................................................................................... 28
1.7.1 Criteria for selecting villages for field study .......................................................... 28
1.7.2 Details of Selected villages ........................................................................................ 29
1.8 Organization of the Report ........................................................................................... 33
22 .. RR WW SS SS –– PP oo ll ii cc yy ,, RR ee gg uu ll aa tt oo rr yy FF rr aa mm ee ww oo rr kk ,, MM ii ss ss ii oo nn ss aa nn dd PP rr oo gg rr aa mm mm ee ss ................................................................................................................ 35
2.1 State RWSS Vision .......................................................................................................... 35
2.1.1 RWSS at National Context ......................................................................................... 36
2.1.2 Sector Reforms Project ............................................................................................... 37
2.1.3 Swajaladhara ............................................................................................................... 38
2.1.4 Sub – Mission Project (SMP) ..................................................................................... 39
2.1.5 Other Related Programmes ....................................................................................... 39
2.1.6 Total sanitation Campaign (TSC) ............................................................................. 41
2.1.7 Nirmal Bharat Abhiyan (NBA) ................................................................................. 42
2.2 RWSS Coverage in Bihar ............................................................................................... 44
2.2.1 Drinking Water ........................................................................................................... 44
2.2.2 Sanitation ..................................................................................................................... 46
2.3 Regulatory and Policy Framework .............................................................................. 47

Environmental Assessment and Environmental Management Framework for the state of Bihar
iv
2.3.1 National Policies and Regulation ............................................................................. 47
2.3.2 National Policy Framework ...................................................................................... 49
2.3.3 Recent changes in the policy framework ................................................................. 50
2.3.4 Applicable Legal and Regulatory system................................................................ 50
2.3.5 The World Bank's environmental and social safeguard policies ......................... 54
2.4 State Sector institutions ................................................................................................. 56
2.4.1 Resolution ..................................................................................................................... 59
2.4.2 Power / Functions of the Mission ............................................................................. 59
2.4.3 The Proposed Policy .................................................................................................... 60
2.5 Converging departments .............................................................................................. 62
2.5.1 Central Ground Water Board .................................................................................... 62
2.5.2 Bihar State Pollution Control Board ......................................................................... 63
2.6 Proposed World Bank Assisted Project ...................................................................... 64
33 .. BB aa ss ee ll ii nn ee EE nn vv ii rr oo nn mm ee nn tt aa ll SS tt aa tt uu ss ........................................................................ 65
3.1 Introduction .................................................................................................................... 65
3.2 Brief profile of State ....................................................................................................... 65
3.3 Geographic and Physiographic Profile ....................................................................... 66
3.3.1 Location ........................................................................................................................ 66
3.3.2 Physiography .............................................................................................................. 67
3.3.3 Geomorphology ........................................................................................................... 67
3.4 Important Population Characteristics of Bihar State ................................................ 68
3.4.1 Demographic Status ................................................................................................... 68
3.4.2 Number of Households in the State .......................................................................... 69
3.4.3 Population by Religion .............................................................................................. 70
3.4.4 Selected Health Indicators for Bihar and India ....................................................... 70
3.4.5 SC/ST Population in Bihar State ................................................................................ 71
3.5 Literacy Trend in Bihar State ........................................................................................ 74
3.6 Number of workers........................................................................................................ 74
3.6.1 Workers in Agricultural.............................................................................................. 75
3.7 Economy of Bihar State ................................................................................................. 75
3.8 Environmental Baseline of Bihar ................................................................................. 76
3.8.1 Climate ......................................................................................................................... 76
3.8.2 Rainfall .......................................................................................................................... 76
3.8.3 Agro-climatic conditions ............................................................................................ 79
3.8.4 Soils ................................................................................................................................ 81
3.8.5 Land use ........................................................................................................................ 82

Environmental Assessment and Environmental Management Framework for the state of Bihar
v
3.8.7 Forest ............................................................................................................................ 89
3.8.8 Industry ......................................................................................................................... 91
3.8.9 Biodiversity .................................................................................................................. 92
3.8.10 Water Resources ........................................................................................................ 97
3.9 Important Observations from Analysis of Secondary Data Sources .................... 111
44 .. EE nn vv ii rr oo nn mm ee nn tt aa ll MM aa nn aa gg ee mm ee nn tt FF rr aa mm ee ww oo rr kk .................................................. 114
4.1 Environmental Analysis .............................................................................................. 114
4.2 Environmental issues identified during Focus group discussions and household surveys ....................................................................................................... 114
4.2.1. Environmental issues identified during Focus group discussions (FGDs) ...... 114
4.2.2 Environmental issues identified from household surveys .................................. 115
4.3 Key Environmental Issues .......................................................................................... 116
4.3.1 Water Availability..................................................................................................... 116
4.3.2 Water Quality ............................................................................................................. 118
4.3.3 Environmental Sanitation ........................................................................................ 119
4.3.4 Liquid waste disposal .............................................................................................. 119
4.3.5 Solid waste disposal ................................................................................................. 120
4.3.6 Construction Stage Environmental Impacts ......................................................... 121
4.3.7 Operation Stage- Environmental Impacts ............................................................. 122
4.4 Objectives of EMF ........................................................................................................ 123
4.5 Components of the EMF ............................................................................................. 123
4.5.1 Main Elements of the EMF ...................................................................................... 123
4.5.2 Application of EMF to Project ................................................................................. 125
4.5.4 Environmental Management Plan .......................................................................... 127
4.5.5 Arrangements for Supervision, Monitoring and Environmental Audit of the
Schemes ...................................................................................................................... 128
4.5.6 Overall coordination ................................................................................................. 128
4.6 Institutional Arrangement .......................................................................................... 130
4.6.1. Village level Institutions .......................................................................................... 130
4.7 Training and Capacity Building................................................................................. 134
4.7.1 Objectives ................................................................................................................... 134
4.7.2 Training Needs Assessment (TNA) ....................................................................... 134
4.7.3 Training Approach ................................................................................................... 136
4.7.4 Institutions for Training ........................................................................................... 136
4.7.5 Details of Training Programmes ............................................................................. 136
4.7.6 Budget for training on environmental management ............................................ 138
4.8 Budget for external audit of the category II schemes ............................................. 139

Environmental Assessment and Environmental Management Framework for the state of Bihar
vi
4.9 Environmental Codes of Practice ............................................................................... 140
4.9.1 Guidelines/Environmental Code of Practices ....................................................... 140
AA nn nn ee xx uu rr ee 11 EE nn vv ii rr oo nn mm ee nn tt aa ll AA ss ss ee ss ss mm ee nn tt QQ uu ee ss tt ii oo nn nn aa ii rr ee ss ........................ 141
AA nn nn ee xx uu rr ee 22 HH oo uu ss ee hh oo ll dd ss uu rr vv ee yy aa nn aa ll yy ss ii ss ........................................................... 152
AA nn nn ee xx uu rr ee 33 SS cc rr ee ee nn ii nn gg cc hh ee cc kk -- ll ii ss tt ff oo rr ss cc hh ee mm ee ss .............................................. 160
AA nn nn ee xx uu rr ee 44 EE nn vv ii rr oo nn mm ee nn tt aa ll mm aa nn aa gg ee mm ee nn tt pp ll aa nn ff oo rr ss tt aa gg ee ss oo ff pp rr oo jj ee cc tt ii mm pp ll ee mm ee nn tt aa tt ii oo nn (( dd ee ss ii gg nn aa nn dd dd ee vv ee ll oo pp mm ee nn tt ,, ii mm pp ll ee mm ee nn tt aa tt ii oo nn ,, aa nn dd OO && MM ss tt aa gg ee )) ............................................................................................................... 162
AA nn nn ee xx uu rr ee 55 GG uu ii dd ee ll ii nn ee ss ff oo rr tt hh ee II dd ee nn tt ii ff ii cc aa tt ii oo nn aa nn dd SS ee ll ee cc tt ii oo nn oo ff WW aa tt ee rr SS uu pp pp ll yy SS oo uu rr cc ee ss ......................................................................................... 166
AA nn nn ee xx uu rr ee 66 SS aa nn ii tt aa rr yy PP rr oo tt ee cc tt ii oo nn oo ff WW aa tt ee rr SS uu pp pp ll yy SS oo uu rr cc ee ss ..................... 168
AA nn nn ee xx uu rr ee 77 GG uu ii dd ee ll ii nn ee ss ff oo rr SS uu ss tt aa ii nn aa bb ii ll ii tt yy oo ff GG rr oo uu nn dd ww aa tt ee rr SS oo uu rr cc ee ss 169
AA nn nn ee xx uu rr ee 88 WW aa tt ee rr QQ uu aa ll ii tt yy MM oo nn ii tt oo rr ii nn gg aa nn dd SS uu rr vv ee ii ll ll aa nn cc ee ....................... 174
AA nn nn ee xx uu rr ee 99 SS ee ll ee cc tt ii oo nn oo ff SS aa ff ee SS aa nn ii tt aa tt ii oo nn TT ee cc hh nn oo ll oo gg ii ee ss aa nn dd EE nn vv ii rr oo nn mm ee nn tt aa ll cc oo nn ss ii dd ee rr aa tt ii oo nn ss ii nn ll oo cc aa tt ii oo nn oo ff tt oo ii ll ee tt ss .......................... 176
AA nn nn ee xx uu rr ee 11 00 RR ee cc oo mm mm ee nn dd ee dd CC oo nn ss tt rr uu cc tt ii oo nn PP rr aa cc tt ii cc ee aa nn dd PP oo ll ll uu tt ii oo nn SS aa ff ee gg uu aa rr dd ss ff oo rr TT ww ii nn PP ii tt PP oo uu rr FF ll uu ss hh LL aa tt rr ii nn ee ss ......................................... 179
AA nn nn ee xx uu rr ee 11 11 GG uu ii dd ee ll ii nn ee ss ff oo rr SS aa ff ee SS uu ll ll aa gg ee DD ii ss pp oo ss aa ll aa tt HH oo uu ss ee hh oo ll dd aa nn dd cc oo mm mm uu nn ii tt yy LL ee vv ee ll ss ........................................................................................ 182
AA nn nn ee xx uu rr ee 11 22 GG uu ii dd ee ll ii nn ee ss oo nn ss aa ff ee ss uu ll ll aa gg ee dd ii ss pp oo ss aa ll aa nn dd OO rr gg aa nn ii cc ww aa ss tt ee mm aa nn aa gg ee mm ee nn tt ................................................................................................ 186
AA nn nn ee xx uu rr ee 11 33 GG uu ii dd ee ll ii nn ee ss ff oo rr ww oo rr kk ii nn gg ii nn FF oo rr ee ss tt AA rr ee aa ss ............................. 193
AA nn nn ee xx uu rr ee 11 44 GG uu ii dd ee ll ii nn ee ss :: NN aa tt uu rr aa ll HH aa bb ii tt aa tt ...................................................... 194
AA nn nn ee xx uu rr ee 11 55 GG uu ii dd ee ll ii nn ee ss ff oo rr pp rr oo tt ee cc tt ii nn gg ss uu rr ff aa cc ee ww aa tt ee rr ss uu pp pp ll yy ss oo uu rr cc ee aa nn dd ee nn ss uu rr ii nn gg ss uu ss tt aa ii nn aa bb ii ll ii tt yy ............................................................. 197
AA nn nn ee xx uu rr ee 11 66 GG uu ii dd ee ll ii nn ee ss ff oo rr PP uu bb ll ii cc aa nn dd ww oo rr kk ee rr ’’ ss hh ee aa ll tt hh aa nn dd ss aa ff ee tt yy 199
AA nn nn ee xx uu rr ee 11 77 TT ee rr mm ss oo ff RR ee ff ee rr ee nn cc ee ff oo rr tt hh ee EE nn vv ii rr oo nn mm ee nn tt aa ll SS pp ee cc ii aa ll ii ss tt ,, SS PP MM UU ........................................................................................................................... 201
AA nn nn ee xx uu rr ee 11 88 FF oo rr mm aa tt ss ff oo rr EE nn vv ii rr oo nn mm ee nn tt aa ll DD aa tt aa SS hh ee ee tt ss (( EE DD SS )) ................ 203
AA nn nn ee xx uu rr ee 11 99 II nn tt ee rr nn aa ll SS uu pp ee rr vv ii ss ii oo nn oo ff tt hh ee CC oo mm pp ll ee tt ee dd SS cc hh ee mm ee ss ........... 210
AA nn nn ee xx uu rr ee 22 00 EE xx tt ee rr nn aa ll AA uu dd ii tt oo ff tt hh ee CC oo mm pp ll ee tt ee dd SS cc hh ee mm ee ss ........................ 212
AA nn nn ee xx uu rr ee 22 11 CC hh ee cc kk ll ii ss tt ff oo rr EE nn vv ii rr oo nn mm ee nn tt aa ll SS uu pp ee rr vv ii ss ii oo nn // AA uu dd ii tt .......... 215
AA nn nn ee xx uu rr ee 22 22 SS aa mm pp ll ee FF ii ee ll dd VV ii ss ii tt RR ee pp oo rr tt ss ff oo rr II nn tt ee rr nn aa ll SS uu pp ee rr vv ii ss ii oo nn // EE xx tt ee rr nn aa ll AA uu dd ii tt ....................................................................................................... 219
AA nn nn ee xx uu rr ee 22 33 EE nn vv ii rr oo nn mm ee nn tt aa ll PP ee rr ff oo rr mm aa nn cc ee II nn dd ii cc aa tt oo rr ss ............................... 220
AA nn nn ee xx uu rr ee 22 44 GG rr oo uu nn dd ww aa tt ee rr qq uu aa ll ii tt yy ss cc ee nn aa rr ii oo ff rr oo mm tt hh ee ss uu rr vv ee yy ee dd dd ii ss tt rr ii cc tt ss ....................................................................................................................... 221
AA nn nn ee xx uu rr ee 22 55 SS cc ee nn ee ss ff rr oo mm tt hh ee ss uu rr vv ee yy ee dd vv ii ll ll aa gg ee ss (( BB ii hh aa rr )) ........................ 225

1
AAbbbbrreevviiaattiioonnss
ARWSP Accelerated Rural Water Supply Programme
AE Assistant Engineer
AEE Assistant Executive Engineer
BCM Billion Cubic Meter
BSWSM Bihar State Water and Sanitation Mission
CCDU Community and Capacity Development Unit
CGWB Central Ground Water Board
CPCB Central Pollution Control Board
DES District Environmental Specialist
DPMC District Programme Management Cell
DPMU District Project Management Unit
DWSM District Water and Sanitation Mission
DPR Detailed Project Report
DSU District Support Unit
DWSM District Water and Sanitation Mission
DWSC District Water and Sanitation Committee
EDS Environmental Data Sheet
ECOPs Environmental Codes of Practices
EA Environmental Assessment
EE Executive Engineer
ES Environmental Specialist
EMF Environmental Management Framework
GoI Government of India
GP Gram Panchayat
GPSWC Gram Panchayat Water Supply and Sanitation Committee
HH Household
ISL Individual Sanitary Latrines
IHHL Individual Household Latrines
JE Junior Engineer
MCM Million Cubic Meter
MoEF Ministry of Environment & Forests
M&E Monitoring and Evaluation
MVS Multi Village Scheme
NGO Non-Governmental Organization
NPMU National Project Monitoring Unit
NSS Not Safe Sources
O&M Operation and Maintenance
PC Partially Covered
PHED Public Health Engineering Department
PRI Panchayati Raj Institution
PSU Project Support Unit
RWSS Rural Water Supply and Sanitation
RWSM Rural Water and Sanitation Mission
SA Support Agency
SE Superintending Engineer
SGS Single Gram Panchayat Schemes
SHS Single Habitation Scheme
SLC Scheme Level Committee

Environmental Assessment and Environmental Management Framework for the state of Bihar
2
SPCB State Pollution Control Board
SWSM State Water Supply and Sanitation Mission
SO Support Organizations
SPMU State Project Monitoring Unit
SVS Single Village Scheme
TSC Total Sanitation Campaign
TPPF Twin Pit Pour Flush
VWSC Village Water Supply and Sanitation Committee
WB World Bank
UNDP United Nations Development Programme

Environmental Assessment and Environmental Management Framework for the state of Bihar
3
EExxeeccuuttiivvee SSuummmmaarryy
1. INTRODUCTION
The Government of India has introduced the National Rural Drinking Water Supply
Program in order to address water supply and sanitation problems in rural areas.
The present project will use this NRDWSP to address the water and sanitation needs
of the 4 Low Income States; Assam, Bihar, Jharkhand & Uttar Pradesh. The Bihar
component of this project will be implemented in 10 selected districts of the state.
This task is to be carried out through the State Drinking Water and Sanitation
Mission under the Department of Drinking Water and Sanitation. This RWSS Project
for Low Income States will promote decentralized service delivery arrangements
with increased Panchayati Raj Institution (PRI) and community participation,
improved financial sustainability and enhanced accountability at all levels.
2. EA-EMF STUDY
This proposed project falls under environmental category 'B' as per the World Bank’s
OP 4.01. At this stage, the exact size and scope of various sub-projets to be taken up
under the Project is not decided. Hence an Environmental Assessment is conducted
and an Environment Management Framework is prepared. This EA-EMF study,
comprised i). Baseline Environment Assessment, ii). Policy and Legal Environment
Analysis, iii). Institutional Assessment, iv). Environmental Issues and Impacts
Identification, v). Proposing Mitigation Measures vi) Environmental Management
Framework and vii). Institutional and Monitoring Arrangement and viii). Capacity
Building. The Baseline Environment Assessment assesses the current status of rural
water supply, availability of both groundwater and surface water sources and their
quality and environmental sanitation status in the state along with status of other
monitorable environmental parameters in the project area. The Policy and Legal
Analysis identifies various policies and legal procedures to be followed by the
proposed Project. The Institutional Assessment lists the various institutions involved
in provision of rural water and sanitation services, their functions and lists their
strengths, weaknesses, opportunities and threats. Environmental Issues and Impacts
Identification lists all the issues related to environment identified through analysis of
primary and secondary information, field visits and consultations and the possible
environmental impacts due to the proposed Project. Proposed Mitigation Measures
recommend some generic environmental impact mitigation measures to manage the
negative impacts and advocates some enhancement measures. Environmental
Management Framework sets the procedures for sub-project impact assessment,
screening, categorization, management and monitoring. Institutional and
Monitoring Arrangements details the human resource requirements, functions and
responsibilities for implementation along with identifying a set of monitorable

Environmental Assessment and Environmental Management Framework for the state of Bihar
4
indicators and their monitoring protocol. Capacity Building lists the actions required
to build institutional capacity and training requirements of the involved personnel.
This study was conducted using both participatory and consultative approaches.
The methodology basically comprised collection and collation of secondary data and
primary data. A review and analysis of this information led to the delineation of the
baseline status of relevant environmental components pertaining to the State and
provided the basis for assessment of the potential environmental impacts due to the
proposed project and preparation of Environmental Management Framework (EMF)
for mitigating negative impacts and enhancing positive impacts.
3. POLICY AND LEGAL FRAMEWORK
This project is guided by policies and regulations enunciated by the Government of
India and Government of Bihar. These include:
73rd Constitutional Amendment
The National Water Policy of 2012
National Water Mission
National Rural Sanitation & Hygiene strategy 2012-2022.
Guidelines for ground water use.
The Environment (Protection) Act, No.29 of 1986
Water (Prevention and Control of Pollution) Act, 1974 (Central Act 6 of 1974) as
amended in1988
Water (Prevention and Control of Pollution) Cess Act No 36 of 1977
The Air (Prevention and Control of pollution) Act 1981
The Wetlands Conservation and Management rules 2010
EIA Mechanism and Wildlife Clearances
Wildlife protection Act, 1972
Indian Forest Act 1927
The Biological Biodiversity Act 2002
Forest (Conservation) Act No. 69 of 1980 as amended in l988
The Wildlife (Protection) Act 1972 as Amended in 1991
EIA Notification of 2006

Environmental Assessment and Environmental Management Framework for the state of Bihar
5
In addition to the above, the following World Bank Safeguards policies are
applicable.
Policy Applicability to the project
OP/BP 4.01 Environmental
Assessment
Applicable to this project.
The EMF includes a detailed description of assessment procedures for
each of the activities proposed under the project.
OP/BP 4.04 Natural Habitats Not applicable,
The project would avoid converting and avoiding natural habitats.
Appendix 14 provide guidelines for working in natural habitats.
OP/BP 4.36 Forestry Applicable to the project.
Some of the schemes taken up under the Project, if located in forest
areas. Assessment procedures and mitigation measures have been put
in place through the EMP in accordance with the approval of the
Forest Department and guidelines for compensatory afforestation.
OP 4.09 Pest Management Not Applicable.
Vector control measures, if undertaken in the project will be in
accordance with the OP 4.09 avoiding use of insecticides in classes 1a,
1b and 2.
OP/BP 4.12 Involuntary
Resettlement
Not Applicable
The project will ensure that people are not displaced.
OP/BP 4.20 Indigenous Peoples Applicable to the project.
To be decided based on the Social Assessment Study.
OP/BP 4.11 Physical Cultural
Resources
Not Applicable to the project.
No existing cultural property will be damaged.
OP/BP 4.37 Safety of Dams Not applicable
Since the project does not involve construction of dams.
OP/BP 7.50 Projects on
International Waterways
Applicable to the project.
In accordance with OP 7.50 (International Waterways) this is seen that
the proposed project falls within the exceptions to the notification
requirement under para 7(a) of the Policy. OP 7.50 is applicable for the
proposed project since the Ganga and its tributaries from where water
resource would be used for the project is infinitesimally small fraction
of overall volume of flow in these rivers and investment components
involve piped water supply schemes which will ultimately improve
the efficiency of water supply system, delivery of resource, decrease in
wastage of resource and thus improved efficiency of WSS system and
service delivery. It is envisaged that there will not be any adverse
impacts on water quality and quantity due to this project and there
Environmental Assessment and Environmental Management Framework for the state of Bihar
6
will not be adverse effect on water use of the other riparian countries.
The project is expected to have a net positive effect on the
environment.
OP/BP 7.60 Projects in Disputed
Areas
Not applicable
As no project components will be proposed in disputed areas.
4. BASELINE DATA ANALYSIS
Bihar is richly endowed with water resources, both the ground water resource and
the surface water resources. Not only by rainfall but it has considerable water supply
from the rivers which flow within the territory of the State. Besides lakes, ponds and
other water bodies also supply water to some population. Following sections shows
detail information on these different sections. Ganga is the major river basin of the
state. It has the maximum catchment area and length of flow in the state. River
Ganga is a snow fed and has its source at Gaumakh in the southern Himalayan
Glaciers on the Indian side of the Tibetan border. In Bihar, it is joined by three great
effluents - the Ghaghra, the Gandak, and the Son and their tributaries. Further
Punpun joins it at Fatuha in Patna district; Koshi joins it at Khagaria district while
the Harohar and the Kiul join it near Surajgarha, Distrct - Lakhisarai.
In Bihar, annual replenishable groundwater resource is 29.19 BCM while Net Annual
Ground Water Availability is 10.77 BCM. The stage of ground water development is
only 39%, which when compared to the CGWB categorization of assessment units
i.e. (<=70% is ‘safe’) is below the threshold of concern (over exploited, critical and
semi-critical). Out of 533 assessment units (blocks), 529 have been categorized as safe
and 4 blocks have been categorized as semi-critical. Though the ground water
development is comparatively low in major part of the State, the higher
development areas are mostly located in isolated patches.
The total requirement of water for the proposed schemes is approximately 29 MCM
per annum which is less than 1% of annual replenish able groundwater and
available surface water resources available in Bihar.
Fluoride, Iron, and Arsenic are the major contaminants in the groundwater in Bihar.
Arsenic is a serious quality concern for many districts in Bihar like Begusarai,
Bhagalpur, Bhojpur, Buxar, Darbhanga, Katihar, Khagaria, Kishanganj, Lakhiserai,
Munger, Patna, Purnea, Samastipur, Saran, Vaishali. All of these districts have been
reported by Central Ground Water Board to be affected by arsenic with a
concentration of more than 50 ppm.
Aurangabad, Begusarai, Bhojpur, Buxar, Bhabua(Kaimur), East Champaran,
Gopalganj, Katihar, Khagaria, Kishanganj, Lakhiserai, Madhepura, Muzafferpur,
Nawada, Rohtas, Saharsa, Samastipur, Siwan, Supaul, West Champaran districts of

Environmental Assessment and Environmental Management Framework for the state of Bihar
7
the state have been identified by CGWB to be affected by iron contamination of more
than 1mg/L in groundwater.
Southern belt of the state is affected by fluoride, with districts like Aurangabad,
Banka, Buxar, Bhabua(Kaimur), Jamui, Munger, Nawada, Rohtas, Supaul having
concentration more than the standard limit of 1.5mg/L
Limit for faecal coliform in the water sample exceeds the tolerance limit as specified
in Class A and Class B of designated best use of water by Central Pollution Control
Board (Govt. of India). For class A which is classified on the basis of its use for
drinking water without conventional treatment tolerance limit is total coliform
organism shall be 50 or less and for class B which is classified on the basis of its use
for bathing, tolerance limit is total coliform organism shall be 500 or less.
5. KEY ENVIRONMENTAL ISSUES
An analysis of the baseline environmental situation, observations during site visits,
Focused Group Discussions, Household surveys, as well as discussions with State,
District and GP level functionaries have identified the following key environmental
issues in the rural areas.
a. Inadequate or disrupted water supply
b. Bacteriological contamination of surface and ground water quality.
c. Presence of Arsenic, Iron and Fluoride concentrations exceeding the permissible
levels in drinking water.
d. Lack of adequate sanitation facilities.
e. Lack of adequate waste (solid and liquid) disposal systems
5.1 Environmental issues identified during Focus group discussions (FGDs)
Fifteen FGDs were conducted in the four districts selected for field survey. The FGDs
comprised of village heads, Panchayat members, teachers, lawyers, farmers, women
etc. Some of the major inferences drawn from the FGDs are:
There is no awareness about the water conservation and efficient water use
practices which leads to wastage of precious water resources.
Piped water supply is inadequate in the villages
Water source is insufficient during winter
Water distribution lines for the piped water schemes are inadequate with
frequent bursting of pipes, lack of O&M, and wastage of water
There is inadequate water supply due to frequent power cuts
Water quality is poor in the villages
People remove the treatment attachment units from the Govt. sponsored hand
pumps to get more water from the hand pumps with less effort.

Environmental Assessment and Environmental Management Framework for the state of Bihar
8
Disposal of backwash water (with high concentration of chemicals) from
water treatment systems into the field was observed by the field survey team.
This backwash water infiltrates into groundwater.
Open defecation is rampant in all the study sites
There are inadequate number of latrines in all villages
There is no solid and liquid disposal system in place in the villages
Many of the toilets constructed in the village under the government scheme
are of shallow depth, which lead to the filling up of the pits in a short
duration, causing the villagers to go for open defecation.
It was observed in some of the villages that the wastewater is discharged into
ponds inside the village leading to seepage of wastewater into the soil and
causing further contamination of surface and groundwater.
At one survey site (Bachwara block, Begusarai District) where a MVS is being
proposed with River Ganga as water source, it was observed that river had
changed course in the past and this may occur in the future, thus impacting
sustainability of the water source for the scheme.
Use of pesticides in agricultural field was also reported in all surveyed village
which may contaminate water sources.
5.2 Environmental issues identified from household surveys
Household surveys were carried out in three villages in each of the selected four
districts to understand the environmental issues in those villages. Below are the
major observations at the household level.
Based on the perception of 82% households in the villages surveyed, the
groundwater level has gone down during the last 10 years. 81% of the
respondents said that during summer season water level goes down and most
of the hand pumps run dry to shallow depth of the hand pumps.
23% households expressed that the amount of water is not sufficient for daily
needs.
55 % households expressed that potable water as an issue in the village and
almost 78% households expressed the need for a better water supply system
because of water availability issues.
Water quality of shallow hand pumps was perceived to be bad and poor in
almost all surveyed villages in terms of colour (42% of the respondent
households), odour (24% of the respondent households) and taste (19% of the
respondent households).
50% respondents have the perception that during summer, water quality
problem is ‚somewhat serious‛ and 25% respondents said that water quality
problem is ‚somewhat serious‛ during winters.
100% respondents drink water without any treatment at household level.

Environmental Assessment and Environmental Management Framework for the state of Bihar
9
Water logging in shallow open pits in front of hand pumps & stand posts was
also observed by the field survey team. This may contaminate the ground
water quality. These waterlogged areas are breeding place for mosquitoes.
Malaria and water borne diseases are rampant in the villages surveyed. Some
of the diseases faces by the households are: Diarrhoea (13%), Malaria (37%),
Typhoid (8%) and Skin diseases (18%).
78% respondents do not have a drainage facility for disposal of wastewater
that leads to logging of wastewater near households and hand-pumps.
Solid waste generated from the households is disposed of in the open space
(92% of the households) that leads to vector breeding, and this gets
aggravated during the rainy season where rainwater mixes with the solid
waste to further cause contamination and pollution.
78% respondents practice waste water disposal to the earthen drainage along
the streets.
92% of the respondents dispose solid waste by throwing in open places.
Most of the surveyed households use cattle dung as fuel and in agricultural
fields as fertilizer.
Sanitation standards and practices in the villages are still poor. Many of them
still go for open defecation (74% of the households) due to non-availability
and bad maintenance (filling up of pits) of the toilets.
74% respondents go for open defecation in all the surveyed villages and 88%
respondents expressed the need for household toilets.
5.3 Environmental Issues
The environmental issues in the villages have been discussed in detail below. ECOPS
have been included in the report for avoiding, mitigating and safeguarding
environmental issues. The EMF includes environmental monitoring and management
plans for the proposed schemes in Bihar. Institutional arrangement and capacity
building for environmental safeguard have also been provided in this report.
5.3.1 Water Availability
Inadequate and disrupted water supply affects human health and environmental
sanitation. Tapping of semi-critical aquifers may cause quality deterioration with
increased concentration of harmful substances like fluoride, Arsenic and Iron.
5.3.2 Water Quality
Non point sources of pollution in the catchment areas resulting from widely
prevalent practice of open defecation, and agricultural run-off containing fertilizers
and pesticides, washing, bathing and other human activities contaminate the
rivers/irrigation canals. In addition to this, sewerage from cities/towns and industrial
effluents discharging into the surface water bodies form a major source of
contamination.

Environmental Assessment and Environmental Management Framework for the state of Bihar
10
The shallow groundwater quality in many parts of Bihar is poor owing to natural
presence of contaminants like Iron, Fluoride, Arsenic, Chloride, Nitrate etc. at
concentrations exceeding the permissible levels for drinking water use. In addition,
the quality of groundwater may also be affected by bacteriological contamination
due to disposal of sullage into kaccha (earthen) drains and pits, deep toilet pits,
effluent from septic tanks, water logging near hand pumps, and open defecation.
5.3.3 Sanitation and Environmental Health
Large percentage of the population still resort to open defecation due to inadequate
latrines, low usage of latrines and low levels of awareness, which lead to
bacteriological contamination of soil and groundwater. Presence of deep leach pit
latrine (>6 ft.) can lead to bacteriological contamination of groundwater. Open field
defecation leads to health problems among the community through vectors.
5.3.4 Waste Disposal
5.3.4.1 Liquid waste disposal: Liquid waste is generated from households, containing
wastes such as detergents, soap, kitchen wastes. In addition to that, overflow of
water from hand pumps and public stand posts also contributes to waste water
generation. Liquid waste generated by the households, including liquid-waste from
cattle-sheds, flows into open surface drains leading to stagnation of water near
houses and road side. The presence of stagnant water in the villages combined with
poor personal hygiene leads to the incidence of malaria and other vector borne
diseases, like diarrhoea, etc.
5.3.4.2 Solid waste disposal: Different types of solid wastes like cattle dung, kitchen
waste, agriculture waste, plastic and paper are generated in the villages. These are
usually dumped in open spaces close to the households. Solid wastes of
biodegradable and non-biodegradable nature are directly disposed by dumping
along roads and open places leading to vector breeding, odour generation, and this
gets aggravated during rainy season leading to health problems and contamination
of soil and groundwater through leaching.
5.4 ENVIRONMENT MANAGEMENT FRAMEWORK
In order to ensure that the environmental issues are systematically identified and
addressed in the various stages of the implementation of the schemes, an
Environment Management Framework (EMF) has been developed for the proposed
schemes. The specific objectives of the EMF are:
To design a set of procedures, designate the roles and responsibilities of
various Stakeholders, and develop institutional structure in the
implementation of sub-projects along with the capacity building and staffing

Environmental Assessment and Environmental Management Framework for the state of Bihar
11
requirements for mainstreaming environmental management in project
planning, implementation and O&M processes.
To identify appropriate mitigation measures for addressing the identified
environmental impacts at various stages of the projects.
In order to facilitate the effective implementation of the EMF, the Schemes will be
classified either as Class I (limited environmental impact) or Class II (significant
environmental impact) scheme. A screening tool for the categorization of schemes
will be used to decide whether a scheme is a category I or category II scheme. The
environmental classification of schemes by using the screening tool will be
undertaken by the EE of PHED. The classification of the schemes is an essential
component of the EMF and it requires the data on source of water supply, water
quality, proposed water treatment, sanitation facilities, sullage disposal, solid and
liquid waste disposal etc. For recording all these details, Environmental Data Sheets
(EDS) for schemes on water supply, sanitation, solid and liquid waste management
etc., have been formulated. The EDS will be filled at the field data collection stage of
the proposed Water Supply and Sanitation Schemes. The AEE/EE of PHED will
ensure the compilation of the information in the EDS with assistance from VWSC,
GPWSC and with the facilitation support of the NGO/SO. The available
environmental information recorded in the EDS will be evaluated and examined.
Based on the level of expected environmental and public health impacts for the
schemes, the proposed scheme(s) would be classified as category I or category II
scheme.
5.5 MAIN ELEMENTS OF THE EMF
5.5.1 Environmental Appraisal and Approval
For the category I schemes, there will be no separate environment appraisal other
than the EDS. For category II schemes, detailed environmental appraisals of the
proposed schemes will be required. This will be done by the district level
environmental specialist attached to DPSU. In extreme cases, where the district level
resources are not enough for conducting the environmental appraisal and
formulating the appropriate mitigation measures, support from the Environmental
specialists at the state level will be sought. The environmental appraisal for category
II schemes should be done within a month.
The Detailed Project Report (DPR) for category I schemes should be accompanied by
the Environmental Data Sheet (EDS). This is the responsibility of the EE of PHED.
The Detailed Project Report (DPR) for category II schemes should be accompanied
by the Environmental Data Sheet (EDS) as well as the environmental appraisal. The
EE of PHED will confirm that these are taken care of.
As part of the generic Environment Management Plan, this EMF has provided
several Environmental Codes of Practice (ECOP) with technical specification

Environmental Assessment and Environmental Management Framework for the state of Bihar
12
required for effective implementation. These ECOPs respond to the environmental
priorities analyzed as part of the EA.
Guidelines for the Identification and Selection of Water Supply Sources
Sanitary Protection of Water Supply Sources
Guidelines for Sustainability of Groundwater Sources
Water Quality Monitoring and Surveillance
Selection of Safe Sanitation Technologies and Environmental considerations in
location
of toilets
Recommended Construction Practice and Pollution Safeguards for Twin Pit Pour
Flush
Latrines
Guidelines for Safe Sullage Disposal at Household and community Levels
Guidelines for Community Solid Waste Management
Guidelines for working in Forest Areas.
ECoPs on Safe Sullage Disposal and Organic Waste Management
ECOPs on Safe Solid Waste Management at Individual Household and
Community Level
5.5.2 Environmental Compliance Monitoring during Implementation and O&M
phases
The EMF will ensure that the prescribed environmental mitigation measures as
identified through the environmental appraisal process are to be adequately
implemented. Regular supervision and monitoring including an independent
external audit is to be conducted, as a part of the overall project monitoring
program. Also, capacity building and IEC activities are to be conducted to make sure
that the EMF including evaluation, supervision, and monitoring have been
implemented.
5.5.3 Supervision, Monitoring and Environmental Audit of the Schemes
Environmental supervision: A sample of 30% of the completed schemes will be visited
at six monthly intervals by a team from the DWSC to check if all safeguard
requirements are met and to identify any issues that need to be addressed. The
selected sample will have representation of both Category I and Category II schemes
in water supply, sanitation and waste management.
Monitoring of relevant external environmental parameters: Once every year, the state
Project Monitoring Unit (SPMU) will prepare a report of the environmental situation
in the state including data and analysis of relevant parameters such as rainfall, depth
to water levels, status of groundwater basins, incidence of water borne diseases, etc.,
as well as a listing of relevant new legislation and regulations that have a bearing on

Environmental Assessment and Environmental Management Framework for the state of Bihar
13
the environmental performance of the project. The EMF will be suitably revised
annually on the basis of this document by the SPMU.
Environmental audit: Once every year, the SPMU will appoint an external agency to
undertake an independent audit of the environmental performance of the project.
15% of the completed schemes will be covered in the audit having representation of
both Category I and Category II schemes in water supply, sanitation and waste
management.
5.6 Institutional arrangements for environmental management
The personnel and agencies with the responsibility for environmental management
will be located as follows in the project institutional structure: The Director, SPMU
will hold co-charge for environment aspects and will be assisted by the
Environmental specialists at the state level (SPMU). Jointly they will be overall
responsible for implementation of the EMF. In particular their responsibilities will
include but not be limited to (a) the monitoring, supervision and audits linked to
EMF compliance, (b) the selection of experts for undertaking the EIAs of high impact
schemes and (c) the provision of overall guidance and technical support to the
DPMU engineers.
Each of the DPMUs will be staffed with district level environmental specialist who
will be overall responsible for EMF implementation at the district level. The district
level environmental specialist will conduct technical reviews and approvals of
scheme-specific environmental appraisal reports as well as the monitoring and
supervision linked to EMF implementation at the district level.
The engineers appointed to each block will be responsible at the GP Level. They will
assist the support organizations (SO) and beneficiary communities to prepare the
environmental appraisal documentation as part of the engineering designs; and a
panel of technical experts at the state and district level will be constituted to provide
technical support to the SPMU and the DPMUs.
5.7 Training and capacity building
The objective of training and capacity building initiatives is to build and strengthen
the capability of rural water and sanitation service delivery institutions
(Communication and Capacity Development Unit-CCDU and PRANJAL) and other
partners (NGOs, Contractors, Engineers, Consultants in the Water and Sanitation
sector and other field level stake holders) to ensure tangible skill enhancement of the
stakeholders and to integrate sound environmental management into water and
sanitation service delivery. Systematic capacity building initiatives will be
introduced after the completion of training needs assessment for the government
officials and other stakeholders. The training will be in a cascade mode. All the
trained staff will in turn conduct further trainings at State, District, Block, Gram
Panchayat and village levels for improved service delivery.

Environmental Assessment and Environmental Management Framework for the state of Bihar
14
In Bihar, it is required to empower Village Water and Sanitation Committee (VWSC)
and to measure the impact of training and progress of sanitation in the state.
Workshops need to be organized periodically for Training Needs Assessment of
various stake holders with the following objectives:
Identifying gaps in the existing set of knowledge, skills and capabilities of the
existing Public Health Engineers, Sanitation Coordinators, different
stakeholders of VWSC etc.
Identifying issues and means to upgrade the existing set of knowledge and
skills in order to upgrade the efficiency of the various stakeholders.
An enabling condition should be created for stake holders to understand and
implement programmes on rural drinking water and sanitation (as per NRDWP
guidelines). Special emphasis needs to be given to participatory techniques,
community facilitation and communication skills and gender based approaches. The
total estimated cost of training on environmental management for members of
GPWSCs, VWSC, NGOs/ SOs, Engineers of RWSSD, and artisans, under the
proposed plan is Rs. 2.91 Crore.

Environmental Assessment and Environmental Management Framework for the state of Bihar
15
11.. IInnttrroodduuccttiioonn
1.1 Background As part of the National Rural Drinking Water Programme (NRDWP), the state departments responsible for drinking water supply and sanitation have prepared long term strategic plans (2011-2022) for ensuring drinking water security to all rural households. This strategy supports the creation of an environment for the Panchayati Raj Institutions and local communities to manage rural drinking water sources and systems highlighting source sustainability measures, water quality safety, monitoring and surveillance, service agreements with operators, synergy among different development programs, and professional capacity building.
Bihar being one of the four lagging states in terms of piped water supply coverage faces constraints in institutional and technical capacity at the state, district, block and GP (Gram Panchayat) levels for implementing sustainable rural water supply projects. This World Bank supported project is expected to bring about positive health and environmental benefits through supply of 'safe' drinking water and creation of sanitary conditions in the villages. The key elements of the RWSS program include the use of community or local government managed models for intra-GP RWSS schemes and State-PRI partnership models for multi-GP schemes, water resources security, recovery of the RWSS sector and establishment of metered household connections with 24/7 water supply where feasible. Other components of the program are the promotion of professionalized service provision management models, and/or back-up support functions for the different market segments. The project would be having components related to improved water quality monitoring, health and hygiene education as well as groundwater recharge for water supply source protection and environmental mitigation measures which includes solid and liquid waste management.
To contribute to the environmental sustainability of the project, an Environmental Assessment (EA) study, as required by the World Bank’s safeguards policies, has been planned. The study has collected and analysed information regarding the environmental issues related to the project from the concerned state in the Phase-I and finally prepared an Environmental Management Framework (EMF).
1.2 World Bank Assisted Rural Water Supply and Sanitation Project
In India, rural water supply and sanitation are the constitutional responsibilities of state governments. However, in the last two decades these services have become a national priority. Currently, annual investment by the Government of India (GoI) in rural drinking water supply exceeds USD one billion. Together, the Government of India and state governments have spent about USD 25 billion in the last 20 years, providing rural drinking water services to 700 million people in 1.5 million villages. This has been channelled through the Accelerated Rural Water Supply Programme (ARWSP) launched in 1972 and renamed the National Rural Drinking Water Programme (NRDWP) in 2009.
Historically, Government of India’s approach to drinking water supply has focused on financing investment for asset creation to enhance access to drinking water services.

Environmental Assessment and Environmental Management Framework for the state of Bihar
16
Although this has led to over 95% access in rural areas, concern has been raised over the sustainability of this approach. As a result, since the 1990s, GoI has been identifying and testing reform options, such as the Sector Reform Project and the Swajaldhara Program, to attempt to ensure 100% access to safe and sustainable drinking water.
Government of India along with seven states, have partnered with the World Bank in implementing rural water supply and sanitation (RWSS) projects. Till now World Bank has assisted 9 projects on RWSS (listed in Table.1). While implementation of these projects, the principles for the World Bank Support to Sector-wide Approaches (SWAps) was as follows:
1.2.1 Institutional
• Decentralized service-delivery approach providing a central institutional role to village-level rural local governments (GPs), in partnership with user groups, in RWSS service provision, including scheme implementation (planning, design, procurement, and construction) and O&M of SVSs. Investment funds are to be provided to and managed by GPs/user groups.
• Transfer of RWSS functions, particularly SVSs, and all sanitation functions, to GPs, with associated support interventions to build capacity of PRIs and user groups.
• Demand-responsive approach adopting self-selection of villages based on demand expressed by GPs/user groups, using transparent eligibility and prioritization criteria, and providing technology choices.
1.2.2 Sanitation and Hygiene Promotion
• Integrated approach to water supply, environmental sanitation works, and changing hygiene behaviour, including common support mechanism. There is an emphasis on sanitation promotion and hygiene education.
1.2.3 Financing
• 100 % recurrent O&M costs of RWSS services (to cover all operating costs, preventive maintenance and minor repairs) to be recovered through user charges (except for multi-village schemes and water quality-affected habitations, where a partial subsidy may be necessary).
• Capital-cost sharing by users, in proportion to service levels demanded. Partial subsidy for basic water supply service (40 lpcd), and 100% user-financing of incremental service levels over basic service level. Provide flexibility in capital-cost sharing to socially disadvantaged populations for providing basic service levels. Declining and targeted subsidies to households for sanitation.
1.2.4 Water Source Protection, Development and Management
• Developing and adopting satisfactory water policies (and associated actions) relevant to the sustainability of water sources used for drinking water schemes.

Environmental Assessment and Environmental Management Framework for the state of Bihar
17
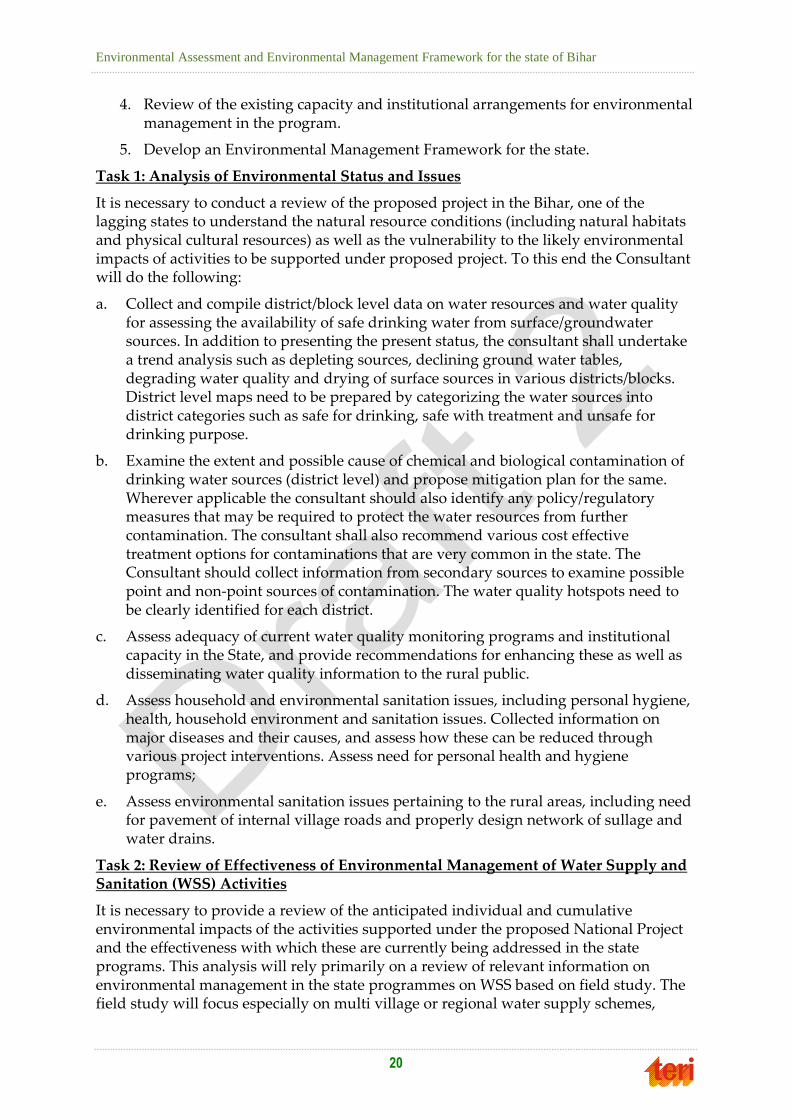
Table 1.1 Summary of Key Features of World Bank-Assisted Rural Water Supply and
Sanitation Projects
Project Objective Technology Output Cost (US$
million)
Maharashtra 1
1991-1998
Raise the
standard of
living via better
health and
productivity
from access to
WS & ES.
Hand pumps: population <1000.
Piped system: population >2000.
VIP latrines
1.7 million
people in
1060 villages
WS:86.0
ES: 9.0
HSP: 5.0
IS: 5.0
Karnataka 1
1993-2000
Raise the
standard of
living via better
health and
productivity
from access to
WS & ES.
Combination of HPs and stand
posts. Provided individual
connections, power line
extensions for electric pumps,
and devices to control power and
voltage changes. VIP latrines and
sullage drains
4.5 million
people
in 1200
villages
WS:$71m
ES: $29m
HSP: $1m
IS: $17m
Uttar Pradesh
1996-2002
Sustainable
health and
hygiene via time
savings and
extra income
from improved
WS & ES.
400 to 2000 people/scheme.
Mix of technologies employing
surface and groundwater, gravity
and pumped schemes.
VIP and pour flush latrines,
sullage drains.
1.2 million
people in
1000 villages
IS: $8m
WS&ES:
$60m
SD: $2.5m
Kerala 1
2000-2008
Improve WS &
ES through cost
recovery and
building the
state's capacity
to scale
up decentralized
service delivery.
Mostly piped systems for
settlements serving about 250
people based on groundwater.
70% household connections.
New and upgraded latrines.
Drainage for rainwater and
sullage.
1.1 million
people in
3,700
villages
100%
household
with water
connections
IS: $11m
WS&ES:$75
m
SD: $4m
Karnataka 2
2002-2013
Increase access
to improved &
sustainable WS
& ES.
Institutionalize
decentralized
WS services.
Springs, HPs and open wells used
for villages with <500 people.
Piped systems based on level of
service affordable to community.
Drainage and lane improvement.
Twin pit, pour-flush latrines.
5 million
people in
2100
villages,
47%
household
with water
connections
WS&ES:$16
6m
IS: $21m
SD: $6m
Environmental Assessment and Environmental Management Framework for the state of Bihar
18
Project Objective Technology Output Cost (US$
million)
Maharashtra 2
2003-2009
Increase access
to
improved/
sustainable WS
institutionalize
decentralized
WS service
delivery in
districts and
communities.
HPs and piped systems with
stand posts and house
connections. Attention to source
sustainability and ground water
recharge. Latrines, solid waste,
and drainage.
6.7 million
people in
2300
villages-
61%
project GPs
(ODF)
-3000 GPs
WS&ES:$18
7m
IS:$55m
SD:$5m
Pilot:$5m
Uttarakhand
2006-2014
.
Improve
effectiveness of
RWSS services
through
decentralization
and
increased role of
PRIs and
involvement of
local
communities
Piped water systems with
spring/stream sources in hilly
areas and surface water sources
in the plain areas, and
distribution with stand posts and
private connections. Household
toilets, solid and liquid waste
management. Integrated
approach for source
sustainability, water supply, and
sanitation.
1.2 million
people
expected
in 3750
villages
WS&ES:$10
3.4m
IS: $11.6m
SD: $5m
Punjab
2007-2013
Increase access
of rural
communities to
improved and
sustainable rural
water supply
and sanitation
services.
New/upgraded piped systems
with tube well and canal sources
providing at least 40 lpcd. Sullage
drains where septic tank
overflows are a problem.
Bank
component
1.5 million
people
expected
in 1,200
villages
IS: $32m
CD: $24m
WS&ES:$20
m
Andhra
Pradesh
2009-2014
Improve rural
water supply
and sanitation
services through
progressive
decentralization,
community
participation
and enhanced
accountability
Piped systems, using mostly
groundwater for SVS and surface
water for MVS with source
protection sustainability
measures. Household toilets,
solid and liquid waste
management.
1.2 million
people
expected
in 1000
villages
SD:$12m
WS&ES:$15
4m
IS:$14m
* WS-Water Supply; ES-Environmental Sanitation; HSP-Household (Health/Hygiene) Sanitation Program; IS-
Implementation Support;
SD-Sector Development; CD- Capacity Development; HP – hand pumps; ODF- Open Defecation Free

Environmental Assessment and Environmental Management Framework for the state of Bihar
19
Thus, its main contributions to the sector during the last two decades cover a wide array of project activities across the following sectoral themes:
• Implementing new institutional models at scale;
• Demonstrating inclusive community-based, participatory, demand-responsive approaches;
• Building the capacity of state RWSS departments, sector institutions, local governments, NGOs and the local private sector, and communities;
• Integrating governance and accountability aspects into project designs;
• Improving sustainability—financial sustainability of programs, water source sustainability, service delivery sustainability—and on-going community satisfaction;
• Designing and implementing consistent sector-wide approaches at the state and district level to scale up reforms; and
Enabling the achievement of ‘open defecation free’ villages through effective sanitation programs, advancing the household sanitation agenda and starting to tackle next generation sanitation challenges of community-centric solid and liquid waste management.
1.2.5 Proposed Development Objective(s)1
The development objective of the Rural Water Supply and Sanitation Project for Low Income States is to increase access to improved piped water and sanitation services for selected rural communities in the target states through decentralized delivery systems.
The key PDO level results indicators for the proposed project are the following:
1. Number of rural households having access to piped water services;
2. Improvements in O&M cost recovery and collection efficiency;
• Number of GPs with drains and lane improvements; and
• Number of rural households adopting improved hygiene and sanitation practices.
1.3 Scope of the Project The specific tasks of the study are:
1. Conduct an analysis of the environmental status and issues in the program area for the state.
2. Identify the potential environmental impacts of the range of activities to be undertaken through the state projects, review the effectiveness of environmental management through the program systems.
3. Assess the country and state policy, legal and regulatory requirements relevant to the WSS program, the performance of the program in this context, and identify provisions to ensure compliance.
1 As per information provided in the World Bank’s, ‘Project Information Document (PID): Concept Stage’, Report No.: PIDC634 (2012)
Environmental Assessment and Environmental Management Framework for the state of Bihar
20
4. Review of the existing capacity and institutional arrangements for environmental management in the program.
5. Develop an Environmental Management Framework for the state.
Task 1: Analysis of Environmental Status and Issues
It is necessary to conduct a review of the proposed project in the Bihar, one of the lagging states to understand the natural resource conditions (including natural habitats and physical cultural resources) as well as the vulnerability to the likely environmental impacts of activities to be supported under proposed project. To this end the Consultant will do the following:
a. Collect and compile district/block level data on water resources and water quality for assessing the availability of safe drinking water from surface/groundwater sources. In addition to presenting the present status, the consultant shall undertake a trend analysis such as depleting sources, declining ground water tables, degrading water quality and drying of surface sources in various districts/blocks. District level maps need to be prepared by categorizing the water sources into district categories such as safe for drinking, safe with treatment and unsafe for drinking purpose.
b. Examine the extent and possible cause of chemical and biological contamination of drinking water sources (district level) and propose mitigation plan for the same. Wherever applicable the consultant should also identify any policy/regulatory measures that may be required to protect the water resources from further contamination. The consultant shall also recommend various cost effective treatment options for contaminations that are very common in the state. The Consultant should collect information from secondary sources to examine possible point and non-point sources of contamination. The water quality hotspots need to be clearly identified for each district.
c. Assess adequacy of current water quality monitoring programs and institutional capacity in the State, and provide recommendations for enhancing these as well as disseminating water quality information to the rural public.
d. Assess household and environmental sanitation issues, including personal hygiene, health, household environment and sanitation issues. Collected information on major diseases and their causes, and assess how these can be reduced through various project interventions. Assess need for personal health and hygiene programs;
e. Assess environmental sanitation issues pertaining to the rural areas, including need for pavement of internal village roads and properly design network of sullage and water drains.
Task 2: Review of Effectiveness of Environmental Management of Water Supply and Sanitation (WSS) Activities
It is necessary to provide a review of the anticipated individual and cumulative environmental impacts of the activities supported under the proposed National Project and the effectiveness with which these are currently being addressed in the state programs. This analysis will rely primarily on a review of relevant information on environmental management in the state programmes on WSS based on field study. The field study will focus especially on multi village or regional water supply schemes,

Environmental Assessment and Environmental Management Framework for the state of Bihar
21
construction/upgrading of RWSS infrastructure in large/peri-urban villages, water treatment plants, sewage treatment plants, interventions increasing energy efficiency, etc.). The sample for the state-specific field study has been representative with respect to water availability and water quality, presence of critical natural habitats, etc. Furthermore, the review will include the extent to which program activities can adversely affect and to what degree do program systems include safeguard measures relevant to the following:
a. Important biodiversity sites
b. Important cultural resource sites
c. Natural and critical natural habitats
d. Physical cultural property
e. Community and worker safety against potential risks during construction and operations of schemes
f. Exposure to toxic chemicals and hazardous waste, including polluted industrial areas
g. Reconstruction or rehabilitation of schemes in natural hazard prone areas
h. Technically sound environmental engineering practices employed for all schemes to ensure sustainability of water quantity and quality.
The output of this component is a profile of the WSS schemes to be taken up with details on the nature and scale of the activities, remarks and field observations on environmental impact, and remarks on the effectiveness with which impacts are currently being addressed through the program systems. Activities that pose a risk of potentially significant and irreversible adverse impacts on the environment (classified Category A schemes under IL) have been identified and criteria for exclusion from the program have been developed.
Task 3: Analysis of Performance of the Legal, Regulatory and Policy Framework
a. A review of the relevant policy, legal and regulatory requirements has been undertaken.
This task will include an examination of the existing policies, laws and regulations of the Government of India and the Bihar State Government relevant to the WSS program. The review will identify the legal, regulatory and policy bases for environmental management in the WSS program; assess the performance of the program systems in this context; and state clearly the provisions that need to be included in the Environmental Management Framework to ensure that the activities supported under the National Project are in compliance with the legal and regulatory requirements of the Government and with the safeguard policy of the World Bank.
b. The output from this component is expected to be a detailed, up-to-date listing of all relevant policies as well as legal and regulatory requirements of the Government of India and the State Government and the relevant safeguard policies of the World Bank specifying the gaps and relevance to the activities undertaken under the proposed National Project for lagging states.
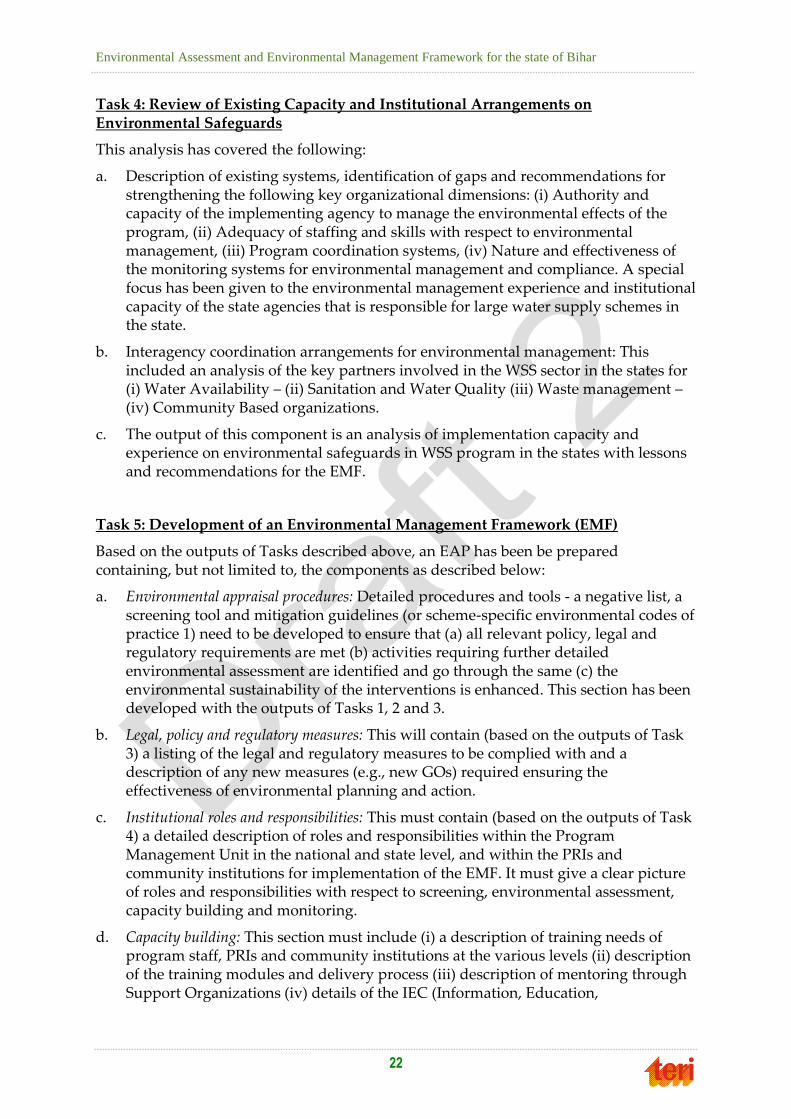
Environmental Assessment and Environmental Management Framework for the state of Bihar
22
Task 4: Review of Existing Capacity and Institutional Arrangements on Environmental Safeguards
This analysis has covered the following:
a. Description of existing systems, identification of gaps and recommendations for strengthening the following key organizational dimensions: (i) Authority and capacity of the implementing agency to manage the environmental effects of the program, (ii) Adequacy of staffing and skills with respect to environmental management, (iii) Program coordination systems, (iv) Nature and effectiveness of the monitoring systems for environmental management and compliance. A special focus has been given to the environmental management experience and institutional capacity of the state agencies that is responsible for large water supply schemes in the state.
b. Interagency coordination arrangements for environmental management: This included an analysis of the key partners involved in the WSS sector in the states for (i) Water Availability – (ii) Sanitation and Water Quality (iii) Waste management – (iv) Community Based organizations.
c. The output of this component is an analysis of implementation capacity and experience on environmental safeguards in WSS program in the states with lessons and recommendations for the EMF.
Task 5: Development of an Environmental Management Framework (EMF)
Based on the outputs of Tasks described above, an EAP has been be prepared containing, but not limited to, the components as described below:
a. Environmental appraisal procedures: Detailed procedures and tools - a negative list, a screening tool and mitigation guidelines (or scheme-specific environmental codes of practice 1) need to be developed to ensure that (a) all relevant policy, legal and regulatory requirements are met (b) activities requiring further detailed environmental assessment are identified and go through the same (c) the environmental sustainability of the interventions is enhanced. This section has been developed with the outputs of Tasks 1, 2 and 3.
b. Legal, policy and regulatory measures: This will contain (based on the outputs of Task 3) a listing of the legal and regulatory measures to be complied with and a description of any new measures (e.g., new GOs) required ensuring the effectiveness of environmental planning and action.
c. Institutional roles and responsibilities: This must contain (based on the outputs of Task 4) a detailed description of roles and responsibilities within the Program Management Unit in the national and state level, and within the PRIs and community institutions for implementation of the EMF. It must give a clear picture of roles and responsibilities with respect to screening, environmental assessment, capacity building and monitoring.
d. Capacity building: This section must include (i) a description of training needs of program staff, PRIs and community institutions at the various levels (ii) description of the training modules and delivery process (iii) description of mentoring through Support Organizations (iv) details of the IEC (Information, Education,

Environmental Assessment and Environmental Management Framework for the state of Bihar
23
Communication) strategy for raising awareness on integrating environmental sustainability in WSS planning.
e. Monitoring: This component needs to have details of (i) the verification requirements for environmental compliance, specifying roles and responsibilities, to ensure that the procedures defined for screening and assessment are effectively applied, (ii) the process of assessing cumulative environmental impacts, (iii) the reporting requirements on the EMF implementation including specification of the performance indicators, and, integration of the performance indicators into the program MIS.
The final output is an Environmental Management Framework providing detailed recommendations and actions.
1.4 Need for Environmental Assessment In order to improve the environmental health and hygiene in rural areas, it is a necessity to provide them with proper water supply and sanitation system. Past studies indicate that the existing water supply conditions in the rural areas of the states are not satisfactory, particularly in terms of quality. The existing sanitation system in rural areas is also very poor.
The proposed water supply and sanitation project is to provide good water quality and better hygienic conditions, in the rural 4 districts of Bihar. The implementation of water supply and sanitation schemes is likely to result into varying level of environmental impacts that would also require supervision and monitoring. The environmental monitoring and supervision have been undertaken based on the key environmental issues associated with such type of work. Assessment of the existing condition of the water supply and sanitation needs to be taken up in the project area to identify:
• Current water supply scenario
• Current disposal systems of the wastewater as well as Solid waste
• Personal health and hygiene.
• Prevailing disease due to lack of good water supply and sanitation facilities.
The consultancy assignment is intended to provide assistance to the implementers in performing their duties for smooth implementation of the project. An EMF will be used by the Engineers as a ready reference to screen the project interventions, impact evaluation, and adopting the mitigation measures in the design stage itself. This will help not only the GP/ implementing authority but also to the engineers who are involved in the preparation of various schemes. This will help to reduce the intensity of impacts at planning stage as well as during implementation and post implementation phase.
1.5 Objectives of Environmental Assessment The key objective of the study is to undertake and prepare a Bihar State-specific Environmental assessment/Environment Management Framework (EA/EMF) Report with a view to identify the critical environmental concerns in the RWSS sector and address them as an integral part of project design.
The specific objective includes:

Environmental Assessment and Environmental Management Framework for the state of Bihar
24
1. To assess the existing status of environment in the Bihar State and to identify threats and issues which have effect on RWSS sector.
2. To identify the environmental issues associated with implementation of RWSS schemes (single village & multi village schemes) and develop environmental codes of practices that need to be followed during various stages such as planning, construction and operation and maintenance.
3. To identify generic environmental issues that are beyond the scope of RWSS schemes, but related to the sector and recommend remedial measures to address them as part of the project.
4. To identify existing good behaviour in recycling of water, use of traditional method of liquid and solid waste management.
5. To identify traditional habitation this results into lower per capita consumption of water.
6. To identify household and environmental sanitation issues as well as to make an assessment of pollution level with regard to water supply and its usages & propose appropriate sanitation technology options.
7. To prepare an Environment Management Framework including well-defined performance indicators for addressing the identified issues, through the various activities/tasks under the proposed project, and strategy for its implementation to achieve sustainable sources for water supply schemes and environmental sanitation benefits.
1.6 Approach and Methodology
1.6.1 Approach
A participatory integrated approach has been adopted for achieving the specified objectives. This approach will include collection and analysis of both primary and secondary data on environmental issues of RWSS sector, relevant policies/laws/regulations of the Government of India and the Government of Bihar, and this shall be supplemented with multi-stakeholder consultation process which will include in-depth discussions with officials in the various water sector institutions. This approach will also involve thorough review and integration of scientific knowledge from various sources. It is also envisaged to include satellite data to map the water resources including water quality for each district. Following diagram describes the approach of the study.
1.6.2 Methodology
A very important component of this study has been based on secondary published data by Government Departments (State and Central) and other sources.
An environmental baseline chapter highlighting the environmental issues of the state in general, and the important aspects of environment issues associated with RWSS sector in particular has been included. The various schemes envisaged under the RWSS were elicited through stakeholder consultations and their environmental implications in the sampled project districts have been assessed on the basis of inherent characteristics of each activity, consultations with stakeholders, field surveys and open interviews.

Environmental Assessment and Environmental Management Framework for the state of Bihar
25
Stakeholder consultations and field surveys are the key activities in this Environmental Assessment study to assess the environmental feasibility of the proposed sub projects and associated impacts. The stakeholders include the government officials, PHED, Rural Development, Watershed Directorate, SWSM/PMU, relevant R&D institutions/ organizations in the State, CGWB, SPCB and local village communities etc. Experts of the World Bank will also be consulted at various crucial study points. The detailed methodology for this study is as given below;
Secondary Data Collection and Literature Review
Both quantitative and qualitative secondary data are to be collected from government departments, World Bank documents, state departments (PHED, Pollution Control Board, Ground Water Board, Department of Agriculture) etc. Literature review to also be carried out to assess the current environmental conditions in the project area, and ascertain the impacts of the schemes with focus on the vulnerability to these impacts on each region. Other successful EMFs, State and National Reports on Drinking Water and Sanitation and the World Bank’s Project Implementation Document (PID), have been referred to in particular to understand the & analyse the design of the EMF, its implementation and to come up with the necessary mitigation measures.
Details of the tasks under this activity include:
- Compilation of district/ block level data on water resources availability and quality
- Collection of water quality data (district and block level)
- Assessment of adequacy of current water quality monitoring setup
- Collection of information on sanitation programs/schemes
- Identification of WSS schemes under the proposed National Project.
- identification of activities that pose a threat to environment
Review of Policy and Regulatory Systems
Following a review of the environmental settings, a comprehensive assessment of the policies, guidelines (of the Government of India and Government of Bihar) and the overall regulatory status of the RWSS sector project has be carried out.
As part of this activity:
Review of secondary information on existing State and National policies and programs as well as safeguard Policies of the World Bank have been conducted and documented in a detailed, up-to-date, tabular form including relevant description.
Assessment of the effectiveness of policies and programs has been undertaken with focus on relevance to WSS and identification of gaps.
Based on the assessment, provisions which should be included in the Environmental Management Framework have been identified.

Environmental Assessment and Environmental Management Framework for the state of Bihar
26
Stakeholder Consultations
All the identified stakeholders have been consulted and the findings of the consultations are to be incorporated into the final EMF report. The stakeholder consultations involved the following:
• Discussions with key informants (Executive Engineer, Assistant Engineer, Junior Engineers, District Coordinators),
• Public consultation meetings involving Village Mukhiya, teachers, lawyers, farmers, and women (includes Environmental Survey)
• Household survey involving 10-15% of beneficiary households in the villages visited.
• Another important criterion under the stakeholder consultation is participation and feedback-integration from workshops led by the National and State Governments. These multi-stakeholder workshops will help to solicit the stakeholder’s recommendations and comments on the draft final report.
• In addition to the above mentioned tools, open informal interviews were conducted with stakeholders during the course of the study.
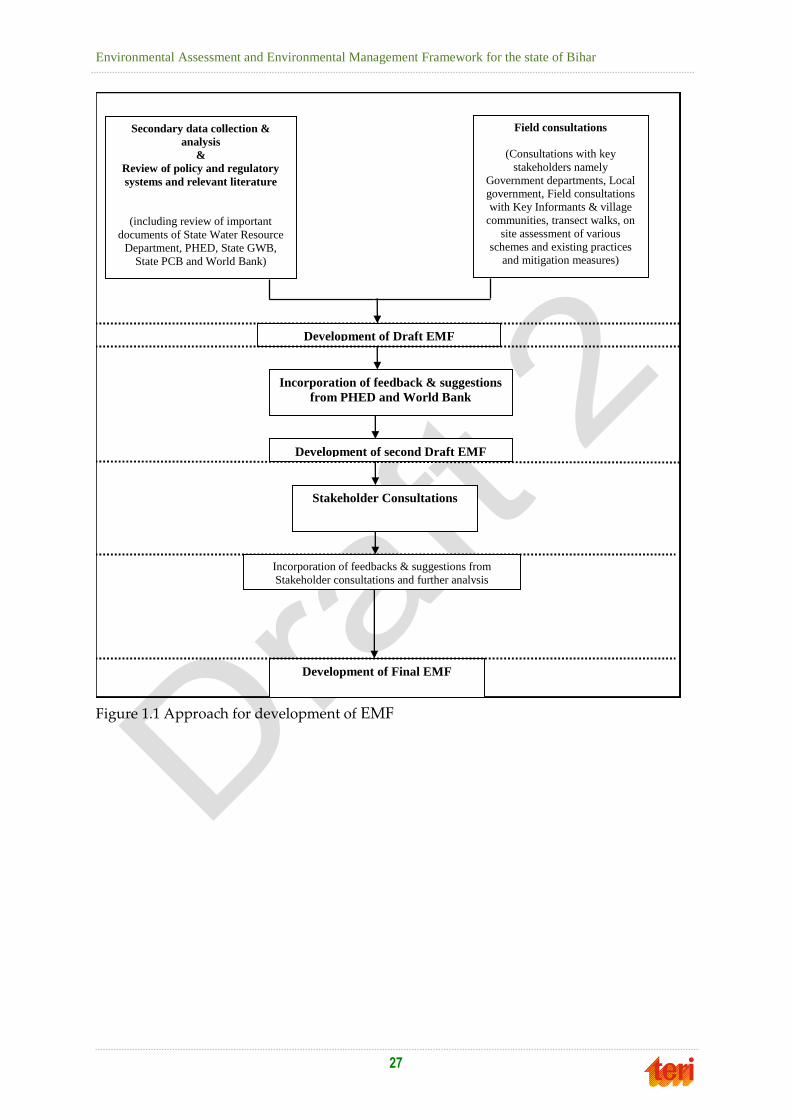
Environmental Assessment and Environmental Management Framework for the state of Bihar
27
Figure 1.1 Approach for development of EMF
Secondary data collection &
analysis
&
Review of policy and regulatory
systems and relevant literature
(including review of important
documents of State Water Resource
Department, PHED, State GWB,
State PCB and World Bank)
Field consultations
(Consultations with key
stakeholders namely
Government departments, Local
government, Field consultations
with Key Informants & village
communities, transect walks, on
site assessment of various
schemes and existing practices
and mitigation measures)
Stakeholder Consultations
Development of Draft EMF
Development of Final EMF
Development of second Draft EMF
Incorporation of feedback & suggestions
from PHED and World Bank
Incorporation of feedbacks & suggestions from
Stakeholder consultations and further analysis

Environmental Assessment and Environmental Management Framework for the state of Bihar
28
Figure 1.2 Breakup of components for EMF
1.7 Site selection
1.7.1 Criteria for selecting villages for field study
The districts in Bihar for this study have been selected based on following criteria
1. Agro-climatic zones,
2. Water quality (Arsenic, Fluoride, Iron)
3. Schemes (Hand Pump, Mini water supply scheme (MWSS), Rural water supply scheme (RWSS), Multi village scheme (MVS), Small multi village scheme (SMVS), Hand pump with attachment unit. Single, multi-village & Hand pump),
4. Source (Ground water & Surface water)
5. Other (Flood & Drought affected area).
The selected villages should cover all the three agro-climatic zones of the state of Bihar, should have water quality issues, and should include aforementioned schemes.
Environmental Assessment and Environmental Management Framework for the state of Bihar
29
The 10 districts selected by PHED, Bihar for this study are:
Patna
Nalanda,
Nawada,
Begusarai,
Mujafferpur,
West Champaran,
Saran,
Munger,
Banka,
Purnea.
Out of the 10 districts, four districts were selected by TERI (in consultation with PHED), as sample sites, based on the above mentioned criteria. These four districts are:
1. West Champaran (Agro-climatic zone 12)
2. Purnea (Agro-climatic zone 2)
3. Begusarai (Agro-climatic zone 2)
4. Nawada (Agro-climatic zone 3)
1.7.2 Details of Selected villages
District: Begusarai
Water quality issue: As (Arsenic), Iron (Fe), Chloride (Cl)
Other issues: Back wash from Iron & Arsenic treatment systems
Name of villages for study:
1. Sushil nagar (Panchyat: Amraur Kirathpur, Block:Begusarai):
Scheme: Hand pump and Mini water supply scheme with Iron treatment attachment unit & solar pump
2. Siuri (Panchyat: Manjhaul-4,Block :Cheria Bariyarpur):
Scheme: Hand pump & Singal village scheme (RWSS), not started yet (Under testing)
3. Kawakol: (Panchyat: Gurgawan,Block: Matihani):
Scheme: Hand pump & Mini water supply scheme with Arsenic treatment attachment unit & Solar pump (under construction)
2 Department of Agriculture, Govt. Of Bihar < http://www.krishi.bih.nic.in/pdf/zones.pdf>

Environmental Assessment and Environmental Management Framework for the state of Bihar
30
4. SinghPur (Panchyat: Balahpur-1,Block: Matehani):
Scheme: Hand pump & Mini water supply with solar pump & Iron treatment attachment unit (14 to 20 taps provided along the boundary wall of the scheme, no pipe lines laid in the village)
Figure 1.3 District map of Begusarai
District: Purnea
Water quality issue: Iron (Fe)
Other issues: Flood affected & backwash from Iron treatment systems
Name of villages for study:
1. Banbagh (Panchyat: Banbagh chunapur,Block: K Nagar,Dist Purnea)
Scheme: Hand pump and Mini water supply scheme with Iron treatment attachment unit & solar pump
2. Dhamdha north (Panchyat dhamdha north,Block: Dhamdha,District Purnea)
Scheme: Hand pump and Singal village scheme (RWSS) with Iron treatment attachment unit.
3. Barbatta (Panchyat: Amour,Block: Baisi,Diistrict:Purnea)
Scheme: Hand pump and Mini water supply scheme with Iron treatment attachment unit & solar pump

Environmental Assessment and Environmental Management Framework for the state of Bihar
31
Figure 1.4 District map of Purnea
District: Nawada
Water quality issue: Fluoride
Other issues: Draught (water scares area) & back wash from Fluoride treatment systems
Name of villages for study:
1. Kachariyadih (Panchyat: Hardia, Block: Rajuli):
Scheme: Mini water supply system with fluoride treatment system & solar pumps
2. Bhola khura: (Panchyat: Sandhmanjgaon,Block: Sirdala)
Scheme: Hand pump & Mini water supply system with fluoride treatment system & solar pumps
3. Khadhar (Panchyat: Kharsari, Block: Kauakol):
Scheme: Hand pump & Mini water supply system with fluoride treatment system & solar pumps
4. Pali (Panchyat:Pali,Block: Kauakol)
Scheme: Hand Pump, Hand pump with fluoride attachment unit & Mini water supply system with fluoride treatment system & solar pumps

Environmental Assessment and Environmental Management Framework for the state of Bihar
32
Figure 1.5 District map of Nawada
District: West Champaran (Bettiah)
Water quality issue: No, as per PHED
Other issues: Tribal & Opportunity for surface water supply system schemes
Name of villages for study:
1. Nautan (Panchyat: Nautan,Block :Nautan)
Scheme: Hand pump & RWSS (Rural water supply scheme)
2. Ghoghaghat (Panchyat: Ghogha, Block: Chanpatia)
Scheme: Existing scheme only hand pumps, Proposed place for multi village scheme & source of water will be Gandak river.
3. Gowardhana (Panchyat: Manchangwa,Block: Ramnagar)
Scheme: Existing scheme only hand pumps.
Questionnaires were developed to collect environment related information through Focused Group Discussions (FGDs) and household surveys (Annexure 1).

Environmental Assessment and Environmental Management Framework for the state of Bihar
33
Figure 1.6 District map of West Champaran
1.8 Organization of the Report The draft EA & EMF report has been outlined as per the following structure.
Chapter 1 – Introduction presents a brief description of the report discussing project background; objective of the project and its major components, scope of the project, need of Environmental Assessment and objectives of it and Methodology.
Chapter 2 – Rural Water supply and Sanitation - Policy, Regulatory Framework, Mission and Programmes discusses State RWSS vision, RWSS coverage in the state, relevant laws/ acts, WB safeguard policies, existing institutional setup.
Chapter 3 – Baseline Environmental Status gives existing set-up, overview of existing environmental condition of the villages of 4 districts of Bihar and their issues, existing water supply status and sanitation amenities etc.
Chapter 4 – Environmental Management Framework includes a benchmark EMF suggesting different environmental enhancement measures for water supply and sanitation schemes keeping in mind key environmental issues identified and assessed, budgetary cost estimates along with its implementation and responsibility of different institutions.
Furthermore, EMF is to be prepared with a special focus on state water supply and sanitation schemes, suggesting environmental data collection sheets (EDS), implementation of EMF in project cycle, Environmental code of Practices (ECOPs), Roles and Responsibility matrix, environmental supervision, monitoring, evaluation plan,

Environmental Assessment and Environmental Management Framework for the state of Bihar
34
options for safe liquid and solid waste disposal, implementation plan including training and capacity building, training needs, budget for training and EMP, has been presented in this section.

35
22.. RRWWSSSS –– PPoolliiccyy,, RReegguullaattoorryy FFrraammeewwoorrkk,,
MMiissssiioonnss aanndd PPrrooggrraammmmeess
2.1 State RWSS Vision For ensuring delivery of drinking water to rural areas, various State/Centrally sponsored programs are being operated in the Bihar state. Some of the schemes under Accelerated Rural Water Supply Programme (ARWSP) are as follows:
Deployment of hand-pumps at partially covered/uncovered tolas (habitats).
Replacement of old/non-functional hand-pumps by new ones of better technology.
Running of water harvesting schemes for better usage of rain water.
Reorganisation of old/new pipe based delivery of drinking water to rural areas.
Installation of new hand-pumps at all the Primary and Middle Schools.
Bihar government ensures availability of at least one source of drinking water for each group of 250 people in rural areas as per the guidelines of Govt. of India. It also follows the norm of 40 liter per day per person water consumption for all schemes. Bihar state drinking water coverage in rural areas has been given as under
By 2001, all rural areas identified through 1993-94 survey were covered completely. However, due to expiry of the life-span of old hand-pumps, some areas have once again become partially covered.
As per 2008-09 survey, the status of rural localities is as follows:
Fully covered localities - 59,602
Partially covered localities - 48,040
By the end of 2009-10, a total of 79,541 localities were brought under coverage.
Following additional State/Centrally sponsored Programmes are being implemented in the state.
National Rural Drinking Water Programme.
Plans for Water Quality affected Areas.
Centrally Sponsored Urban Water Supply Plans.
Drinking Water Sanitation Schemes for Government Buildings.
Total Sanitation Campaign.
Lohiya Swachhata Yojana
Source: http://phed.bih.nic.in/
Future plans (infrastructure & finance) of RWSS schemes has been given in Tables 2.1, and 2.2.

36
Table 2.1 RWSS Infrastructure Component Phasing (Physical)
Project Components 2013/14 2014/15 2015/16 2016/17 2017/18 2018/19 TOTAL
New Schemes
- SHS/ SGS Schemes
7
14
50
50
21
-
142
- Small MVS
1
1
5
5
2
-
14
- Large MVS
-
1
2
2
1
-
6
- SGS Schemes
1
3
10
10
4
-
28
Sanitation
- Hardware
- Software
Will be in all GPs and covered in coordination with NBA and
MNREGA for IHHL, SLWM, IEC, Construction works for
drainage, lane improvement, soak pits, etc.
Details will be worked out during preparation of Batch 1
Table 2.2 Batch wise Implementation of RWSS Schemes
Batch Small Schemes
(SHS/ SGS)
Small
MVS
Large
MVS
Sanitation
Batch 1 (~30%)
(Aug 2013- Aug 2016)
49 4 2 All Batch 1 GPs will be covered
Batch 2 (~35%)
(April 2015-July 2018)
63 5 2 All Batch 2 GPs will be covered
Batch 3 (~35%)
(April 2017-July 2019)
58 5 2 All Batch 3 GPs will be covered
2.1.1 RWSS at National Context
In 1950, the Constitution of India specifies water as a State subject. From 1951-2012, the Government of India (GoI) and the State governments have spent Rs 1,56,580 crores in the domestic water and sanitation sector of the country. Also, about USD 2 billion per annum are spent through various programs for improving access to rural water supply and sanitation (RWSS). But still only 31% of rural households have access to piped water and 31% households have access to sanitation (2011 Census).
In 1972-73, GoI introduces the Accelerated Rural Water Supply Program (ARWSP) by to assist states and union territories to accelerate the pace of coverage of drinking water supply, in 1981 India enters the International Drinking Water Supply and Sanitation. In, 1986 The National Drinking Water Mission (NDWM) was launched to accelerate the process of coverage of the country with drinking water. In, 1987 first national water
37
policy was drafted by Ministry of Water Resources giving first priority to drinking water supply. In 1994 the 73rd Constitution Amendment made provision for assigning the responsibility of providing drinking water to the Panchayati Raj Institutions. In 1999 a separate Department of Drinking Water Supply in the Ministry of Rural Development, Govt. of India was made. In 2002 Swajaldhara programme comes up and also, India commits to the Millennium Development Goals to halve the proportion of people without sustainable access to safe drinking water and basic sanitation by 2015, from 1990 levels. In 2009, National Rural Drinking Water Programme launched from 1/4/2009 by modifying the earlier Accelerated Rural Water Supply Programme and subsuming earlier sub Missions, Miscellaneous Schemes and mainstreaming Swajaldhara principles. In 2010 Department of Drinking Water Supply renamed as Department of Drinking Water and Sanitation. And in 2011 Department of Drinking Water and Sanitation upgraded as separate Ministry of Drinking Water and Sanitation.
In order to improve the water supply and sanitation conditions of the rural sector of India, the Working Group of 12th five year plan (2012-2017) plans to make water accessible to people from at least a radial distance of 50 meters, introduce piped water supply schemes which are designed to carry a minimum of 55 lpcd for stand posts and 70 lpcd for house connection/yard taps, villages affected by quality of water such as fluoride, arsenic, iron and other chemical and natural contaminants would be given priority, incorporation of public participation by the State Departments, Panchayats and other local bodies in all aspects of drinking water supply, right from its planning, formulation of strategies, implementation, monitoring and on operation and maintenance of systems, Village Water and Sanitation Committees (VWSCs) will have more than 50% women members from all communities, in order to ensure water security for drinking purposes no bore well other than for household consumption would be allowed at least in 500 meters radius of the existing drinking water sources, the Water Quality Assessment Authority, which is under the Ministry of Environment and Forests, will be converted into separate Drinking Water Quality Assessment Authority, which should be constituted and brought under the purview of Ministry of Drinking water and Sanitation or Ministry of Health and Family Welfare, conjoint approach to water and sanitation would be implemented, etc.
2.1.2 Sector Reforms Project
Development of policies and the administration of the rural drinking water sector were started by Rajiv Gandhi National Drinking Water Mission (RGNDWM). Accelerated Rural Water Supply Programme (ARWSP) was also started by RGNDWM, and is funded by government of India and state governments. It was first introduced in 1972 and it continues to provide the basis for the union government’s interventions in rural drinking water. During the Ninth plan (1997-2002), guidelines were revised to achieve full coverage of all rural habitations. Project which came up with revised guidelines was known as Swajal project which was implemented on then undivided Uttar Pradesh. By 1999, the union government decided to broaden the Swajal experiment throughout the country which came up as the Sector Reform Project (SRP) which sought to implement in 67 districts. The project had a paradigm shift from the regular supply based approach to the demand based approach and stressed on community involvement by making the community bear 10% of the capital cost either in cash or kind (labour, material or land) and also the entire operation and maintenance (O&M) cost.

38
Immediately after the completion of Swajal Project, SRP was extended to the whole country in the guise of Swajaldhara Guidelines.
2.1.3 Swajaladhara
Swajaldhara Programme, an extension of Sector Reform Programme, was launched on 25th December’02. It emphasized on the need for an increase in people’s participation, treatment of water as a socio-economic good and the use of 20% of available funds for states promoting reforms along these lines. It introduced a paradigm shift towards demand-led schemes from supply-led schemes, centralized to de- centralized implementation and Government’s role from service provider to facilitator.
Principles of “Swajaldhara” programme are:
i. Adoption of a demand-responsive, adaptable approach along with community participation based on empowerment of villagers to ensure their full participation in the project through a decision making role in the choice of the drinking water scheme, planning, design, implementation, control of finances and management arrangements;
ii. Full ownership of drinking water assets with appropriate levels of Panchayats,
iii. Panchayats / communities to have the powers to plan, implement, operate, maintain and manage all Water Supply and Sanitation schemes,
iv. Partial capital cost sharing either in cash or kind including labour or both, 100% responsibility of operation and maintenance (O&M) by the users;
v. An integrated service delivery mechanism;
vi. Taking up of conservation measures through rain water harvesting and ground water recharge systems for sustained drinking water supply; and
vii. Shifting the role of Government from direct service delivery to that of planning, policy formulation, monitoring and evaluation, and partial financial support.
In June 2003 new guidelines were formulated, according to which Swajaldhara was to have two Dharas (streams). First Dhara (Swajaldhara I) is for a Gram Panchayat (GP) or a group of GPs or an intermediate Panchayat (at Block / Tehsil level) and the Second Dhara Swajaldhara II) has a District as the Project area. In the Tenth Plan, it was suggested to discontinue with Swajaldhara Project and reformulate tits guidelines to overcome the difficulties in the collection of community contribution. It was eventually decided to allocate 20% ARWSP funds for Swajaldhara Projects during the Eleventh Plan.
Guidelines for environmental safety as per Swajaldhara Projects
a. States would need to enact and implement law on effective groundwater extraction control, regulation and recharge
b. State Government should integrate water conservation and rainwater harvesting schemes with drinking water supply schemes
c. Rural drinking water, sanitation, health and hygiene programmes need to be integrated at the State, District, Block and GP levels
d. Suitable monitoring mechanism and systems may be put in place in this regard by State Government

39
2.1.4 Sub – Mission Project (SMP)
Sub-Mission projects were taken up to ensure safe and sustainable water supply, through rain water harvesting, artificial recharge, etc. particularly to the rural habitations which are suffering from water quality problems like arsenic, fluorides, iron, etc. The schemes were funded by central and state governments in the ratio of 75:25.
2.1.5 Other Related Programmes
There are various popular schemes being implemented in Bihar state by the state
government. Following list shows these schemes:
Mukhyamantri Balika Poshak Yojana
Mukhyamantri Balika Cycle Yojana
Mukhyamantri Kanya Suraksha Yojana
Mukhyamantri Kanya Vivah Yojna
Mukhyamantri Awas Yojana
Mukhyamantri Zila Vikas Yojana
Mukhyamantri Gram Sadak Yojana
Mukhyamantri Setu Nirman Yojana
Mukhyamantri Tivra Beej Vistar Yojana
Samudai Adharit Samanvit Van Prabandhan Evam Sanrakshan Yojana of
Bihar State
Jawahar Gram Samriddhi Yojna
National Health Insurance Scheme
Mamta Scheme
Aam Aadmi Bima Yojanaa
Vidya Sagar Project
Welfare Schemes
MP Local Area Development Scheme
Community Development
Basic Minimum Services
Minority welfare schemes
Flood protection schemes
Samudai Adharit Samanvit Van Prabandhan Evam Sanrakshan Yojana of Bihar State
A Planning Commission, Government of India sponsored project titled ‚Samudai Adharit Samanvit Van Prabandhan Evam Sanrakshan Yojana of Bihar State‛ (Bihar Project) is being implemented by ICFRE. The 1st phase of the project involves implementation of agroforestry component in Vaishali district, North Bihar and RDF

40
through JFM component in Banka and Jamui Division of South Bihar. The duration of 1st phase of the project is from 2005-06 to 2006-07. The outlay for ICFRE component is Rs. 18.94 crore out of the total outlay of Rs. 51.00 crore for implementation of the 1st phase. ICFRE has taken up project programme related to agrogorestry with help and support of SFD, Bihar and implemented it on farmer’s fields in North Bihar by providing technical knowledge, quality planting stock, training and extension, establishment of hi-tech nursery, kisan nursery and demonstration trials. In JFM linked RDF programme in Banka and Jamui Divisions, ICFRE is helping in establishing hi-tech nursery cum demonstration centre, providing training support and helping in conducting study tours.
Various activities being implemented in this scheme are as follows3
1. Socio-economic Survey
2. Impact Assessment
3. Selection of Suitable Plant Species and their Propagation
4. Raising Quality Planting Stock through Establishment of Model Nurseries and Kisan Nursery
5. Planting Trees an Farmlands
6. Establishment of Field Demonstration
7. Trainings, Extension and NGO Involvement
8. Establishment of Orchards, Hedge Garden
9. Identification of VAM fungi and Inoculation
10. Protection
11. Develop Extension Material/Packages Field Manuals in Vernacular Language
12. Establishment of Center and Appointment of staff
13. Engagement of Consultants for Agroforestry, Joint Forest Management, Planting Stock Improvement, Socio-economic Studies
14. National Seminar/ Workshop and Study Tours
15. Monitoring and Evaluation, Documentation and Data Base
16. Utilization of Agroforestry/Forestry Produce
In addition to schemes mentioned above following are some of the important schemes being implemented by Rural Development, State Government of Bihar:
National Rural Employment Guarantee Scheme - Bihar
Swarna Jayanti Gram Swarojgar Yojana
Indira Aawas Yojana
o Credit-cum-Subsidy Scheme for Rural Housing
Hariyali
3 http://www.biharonline.gov.in/Site/Content/Government/Government.aspx?u=l

41
o Integrated Waste-Land Development Project
o Drought-Prone Area Programme
Integrated Waste-Land Development Project
The Integrated Wastelands Development Project Scheme strives to develop non-forest wasteland on village/micro-watershed basis. The scheme also helps generate employment in rural areas besides, enhancing people's participation in wasteland development leading to equitable sharing of benefits and sustainable development.
Scope
Watershed Development approach has been adopted for all area development programmes. This approach has also been adopted for implementation of this scheme. Integrated Wasteland Development based on village/micro-watershed plans is taken up after taking into consideration the local capabilities, site condition and local needs of the people.
Funding
The Government of India provides 100% grant. Project cost not to exceed Rs. 5 crore per project at a rate of Rs. 4,000/- per hectare for a period of four years.
Strategy
Major activities taken up under this scheme are soil and moisture conservation, afforestation and pasture development, promotion of horticulture/agro-forestry, encouraging natural regeneration, wood substitution and fuel wood conservation measures, and dissemination of technology, as decided by the user group living in or around the project area.
Source: http://rdd.bih.nic.in/schemes.htm
2.1.6 Total sanitation Campaign (TSC)
Water, sanitation and health, all three are inter-related. Consumption of unsafe drinking water, improper disposal of human excreta, improper environmental sanitation, lack of personal and food hygiene, prevailing High Infant Mortality Rate are major causes of many diseases in developing countries like India. In this context and primarily with the objective of improving the quality of life of the rural people and also to provide privacy and dignity to women, Central Rural Sanitation Programme (CRSP) was launched in 1986.
CRSP was a supply driven, highly subsidy and infrastructure oriented. As a result of these deficiencies and low financial allocations, the CRSP had little impact on the gigantic problem. The results of evaluation of CRSP and the experience of community-driven, awareness generating campaign based programmes in some states, led to the formulation of the Total Sanitation Campaign (TSC) approach in 1999.
The main goal of Total Sanitation Campaign is to eradicate the practice of open defecation by 2017. Community-led total sanitation is not focused on building infrastructure, but on preventing open defecation through peer pressure and shame. In Maharashtra where the program started more than 2000 Gram Panchayats have achieved ‘open defecation free’ status. To give boost to the campaign, the GOI has launched a program called Nirmal Gram Puraskar under which individuals and institutions which will significantly contribute in ensuring attainment of full sanitation

42
coverage status of an area will receive monetary rewards and high publicity under the program.
The main objectives of the TSC are as under4
• Bring about an improvement in the general quality of life in the rural areas.
• Accelerate sanitation coverage in rural areas.
• Generate felt demand for sanitation facilities through awareness creation and health education.
• Cover schools/ Anganwadi’s in rural areas with sanitation facilities and promote hygiene education and sanitary habits among students.
• Encourage cost effective and appropriate technologies in sanitation.
• Eliminate open defecation to minimize risk of contamination of drinking water sources and food.
• Convert dry latrines to pour flush latrines, and eliminate manual scavenging practice, wherever in existence in rural areas.
2.1.7 Nirmal Bharat Abhiyan (NBA)
With the objective to accelerate sanitation coverage in the rural areas so as to comprehensively cover the rural community through renewed strategies and saturation approach, TSC has been renamed as ‚Nirmal Bharat Abhiyan‛ (NBA).
NBA envisages covering the entire community for saturated outcomes with a view to create Nirmal Gram Panchayats with following priorities:
• Provision of Individual Household Latrine (IHHL) of both Below Poverty Line (BPL) and identified Above Property Line households within a Gram Panchayat (GP).
• Gram Panchayats where all habitations have access to water to be taken up. Priority may be given to Gram Panchayats having functional piped water supply.
• Provision of sanitation facilities in Government Schools and Anganwadis in Government buildings within these GPs
• Solid and Liquid Waste Management (SLWM) for proposed and existing Nirmal Grams.
• Extensive capacity building of the stake holders like PRIs, VWSCs and field functionaries for sustainable sanitation.
• Appropriate convergence with MGNREGS with unskilled man-days and skilled man-days.
4 http://rural.nic.in/sites/downloads/pura/Total%20Sanitation%20Campaign%20-%20DDWS.pdf

43
The main objectives of NBA are as under:
• Bring about an improvement in the general quality of life in the rural areas.
• Accelerate sanitation coverage in rural areas to achieve the vision of Nirmal Bharat by 2002 with all gram Panchayats in the country attaining Nirmal status.
• Motivate communities and PRIs promoting sustainable sanitation facilities through awareness creation and wealth education.
• To cover the remaining schools not covered under Sarva Shiksha Abhiyan (SSA) and Anganwadi Centres in the rural areas with proper sanitation facilities and undertake proactive promotion of hygiene education and sanitary habits among students.
• Encourage cost effective and appropriate technologies for ecologically safe and sustainable sanitation.
• Develop community managed environmental sanitation systems focusing on solid and liquid waste management for overall cleanliness in the rural areas.
Implementation
Implementation of NBA is proposed with ‘Gram Panchayat’ as the base unit. The project proposal originates from a district and is examined and consolidated by the State Government and send out to the Government of India (Ministry of Drinking Water and Sanitation) as a State Plan. NBA is implemented in phases with start-up activities and funds are to be made available for preliminary IEC work. The physical implementation is oriented towards satisfying the felt-needs, where-in individual households choose from a menu of options to their household latrines. The built-in flexibility in the menu of options gives people the opportunity for subsequent up gradation depending upon their requirements and financial position. In the ‚campaign approach‛, a synergistic interaction between the Government agencies and other stakeholders is a necessity. To bring about the desired behavioural changes for relevant sanitary practices, intensive IEC and advocacy, with participation of NGOs/ PRIs/ resource organizations is envisaged.
Components of NBA5
• Start-Up activities
• IEC Activities
• Capacity Building
• Construction of Individual Household Latrines
• Rural Sanitary Marts and Production Centres
• Provision of Revolving Fund in the District
• Community Sanitary Complex
• Institutional Toilets – School and Anganwadi toilets
• Solid and Liquid Waste Management
• Maintenance of facilities created under NBA
• Administrative charges
5 Ministry of Drinking Water and Sanitation 2012, Nirmal Bharat Abhiyan, Government of India, New Delhi
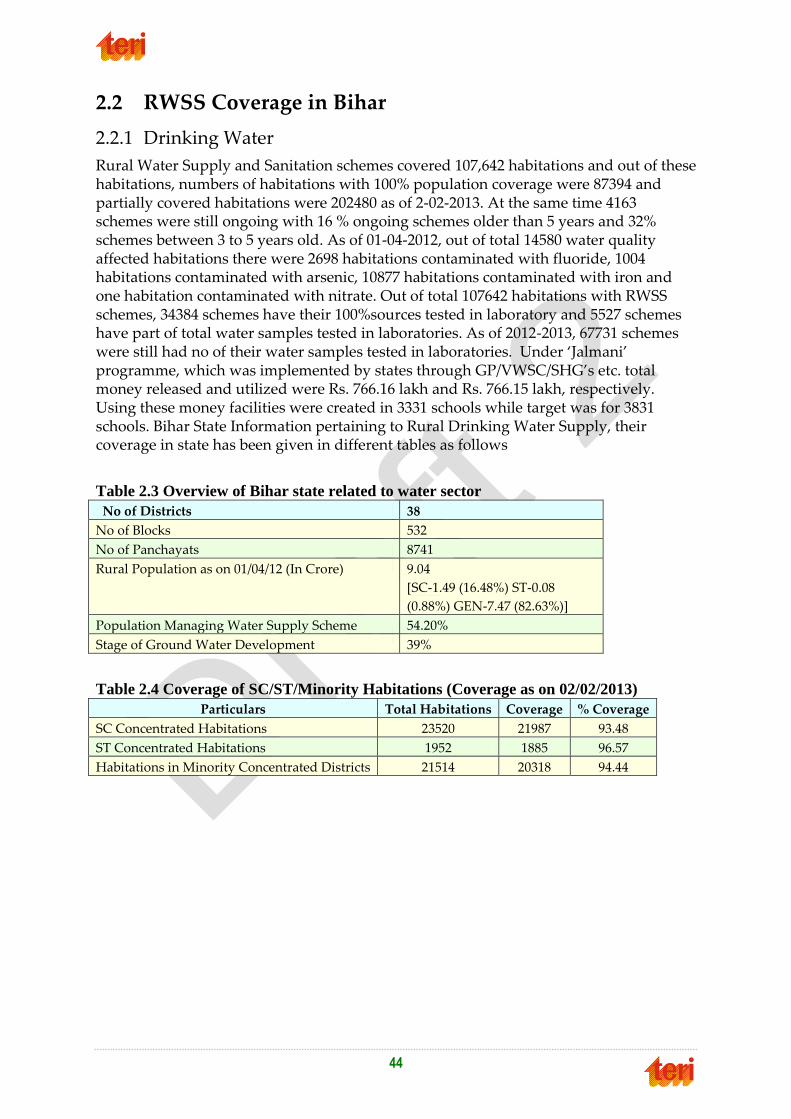
44
2.2 RWSS Coverage in Bihar
2.2.1 Drinking Water
Rural Water Supply and Sanitation schemes covered 107,642 habitations and out of these habitations, numbers of habitations with 100% population coverage were 87394 and partially covered habitations were 202480 as of 2-02-2013. At the same time 4163 schemes were still ongoing with 16 % ongoing schemes older than 5 years and 32% schemes between 3 to 5 years old. As of 01-04-2012, out of total 14580 water quality affected habitations there were 2698 habitations contaminated with fluoride, 1004 habitations contaminated with arsenic, 10877 habitations contaminated with iron and one habitation contaminated with nitrate. Out of total 107642 habitations with RWSS schemes, 34384 schemes have their 100%sources tested in laboratory and 5527 schemes have part of total water samples tested in laboratories. As of 2012-2013, 67731 schemes were still had no of their water samples tested in laboratories. Under ‘Jalmani’ programme, which was implemented by states through GP/VWSC/SHG’s etc. total money released and utilized were Rs. 766.16 lakh and Rs. 766.15 lakh, respectively. Using these money facilities were created in 3331 schools while target was for 3831 schools. Bihar State Information pertaining to Rural Drinking Water Supply, their coverage in state has been given in different tables as follows
Table 2.3 Overview of Bihar state related to water sector
No of Districts 38
No of Blocks 532
No of Panchayats 8741
Rural Population as on 01/04/12 (In Crore) 9.04
[SC-1.49 (16.48%) ST-0.08
(0.88%) GEN-7.47 (82.63%)]
Population Managing Water Supply Scheme 54.20%
Stage of Ground Water Development 39%
Table 2.4 Coverage of SC/ST/Minority Habitations (Coverage as on 02/02/2013)
Particulars Total Habitations Coverage % Coverage
SC Concentrated Habitations 23520 21987 93.48
ST Concentrated Habitations 1952 1885 96.57
Habitations in Minority Concentrated Districts 21514 20318 94.44

45
Table 2.5 Different Scheme Details in Bihar state as on 02/02/2013
S.N. Particulars State
Total
Percentage India
Total
Percentage
1 Habitations covered by PWSS 3643 3.38 497964 29.89
2 Habitations covered by
Handpumps / Bore wells
85819 79.73 742067 44.54
3 Habitations covered by Others 16812 15.62 42878 2.57
4 Habitations where scheme detail
Not entered in information
system
1368 1.27 383166 23.00
5 Total 107642 100.00 1666075 100.00
Table 2.6 Physical Progress during 2012-13 as on 02/02/2013
S.N. Particulars Target Achievement % Achievement
1 Partially Covered 8915 4699 52.71
2 Quality Affected 6100 1428 23.41
3 Minority Districts 2495 731 0.00
4 Minority Blocks 2264 690 0.00
5 SC Dominated 2904 965 0.00
6 ST Dominated 264 111 0.00
Table 2.7 Planned Targets and Achievements (up to 02/02/2013) 2012-2013
S.No. Activity Target Achievement % age
1 No. of Persons to be Trained for water
quality testing using FTKs
42210 0 0.00
2 No. of water quality tests done in labs 114000 56116 49.22
3 No. of water quality tests done using FTKs 50000 270 0.54
4 No. of Sub division Labs set up 76 0 0.00
5 Provision of Water Supply in Schools 3000 1716 57.20
6 No of Sustainability structures constructed 3260 43 1.32
7 No PWSS handed over to panchayats 50 95 190.00
8 No. of VWSC members Trained 6000 0 0.00
Source for all above tables: NRDWM website at http://indiawater.gov.in/IMISReports/Reports/Profile/rpt_StateProfile.aspx?Rep=1

46
2.2.2 Sanitation
Numbers of beneficiary households incentivized for ‘Individual Household Latrines (IHHL)’ under ‘Total Sanitation Scheme’ in Bihar in the years 2009-10, 2010-11 and 2011-12 were 472722, 545770, and 646052, respectively. As on 31.03.2012, State Government of Bihar constructed 3837803 ‘Individual Household Latrines’, 777 ‘Sanitary Complexes’ and 74003 school toilets and 2876 Anganwadi toilets under TSC. In the year 2000-01, 2001-02, 2002-03, 2005-06 and 31.12.2007 total school toilets sanctioned under TSC in Bihar were 4120, 5804, 3000, 2329 and 7492, respectively. For these school toilets central government spent 494.4, 696.48 and 360.0 lakh Rs. in the year 2000-01, 2001-02, and 2002-03, respectively. Additional information pertaining to sanitation sector is presented in following different tables which also includes coverage in state and expenditure.
Table 2.8 Individual Household Latrines (IHHL) Project Objectives and Achievements
under Total Sanitation Campaign (TSC) in Bihar (As on March, 2012)
State Objectives (IHHL Total) Achievement (Up to March, 2012)
Bihar 11171314 3839093
India 125726727 87362100
Table 2.9 Number of toilets Constructed under TSC in Bihar (2008-2009 to 2011-2012-
upto August 2011)
Table 2.10 Physical Progress under TSC in Bihar (2009-2010, Upto December 2009) In
Number
State IHHL
(BPL)
IHHL
(APL)
IHHL
Total
Sanitary
Comp
School
Toilets
Balwadi
Toilets
Bihar 368714 150902 519616 7 3403 161
India 3405425 3808617 7214042 1239 95081 34052
Table 2.11 Financial and Physical Achievements under TSC in Bihar (2007-2008)
State Release
Amount
Expenditure
Amount
IHHL Sanitary
Complex
School
Toilets
Anganwadi
Toilets
Bihar 9554.97 5794.58 513050 66 11836 474
India 90913.37 79070.63 11527890 3006 236289 86493
Year IHHL School
Toilet
Anganwadi
Toilet
Community
Sanitary
Complex
2008-2009 756465 15065 272 52
2009-2010 640359 4010 216 17
2010-2011 717792 8679 309 63
2011-2012
(Up to Aug
11)
203225 2705 87 19

47
Table 2.12 District-wise Physical Progress under TSC in Bihar (As on 5.1.2003)
Districts Sanc-
tion
Month/
Year
Repor-
ted
Month/
Year
Project Objectives
IHHLs Sani-
tary
Com-
plex
School
Toilets
Toilets
for
Bal-
wadis
RSM/
PCs
Total San.
Of Vill-
ages
Vaishali 11/99 9/02 190598 662 1300 0 10 0
East
Champaran
2/01 9/02 180000 625 1090 0 10 0
Patna 2/01 9/02 190000 659 1100 0 10 0
Gaya 2/01 9/02 190000 655 1095 0 10 0
Banka 2/01 9/02 144396 500 835 0 10 0
Muzaffarpur 5/01 9/02 180000 371 995 0 10 0
Chapra
(Saran)
5/01 9/02 170000 590 1030 0 10 0
Madhubani 3/02 9/02 160000 600 1500 0 10 14707
Katihar 3/02 9/02 170000 600 1158 0 10 0
Begusarai 3/02 9/02 170000 600 1121 0 10 0
Bihar 1744994 5862 11224 0 100 14707
Source for all above tables:
http://www.biharstat.com/googlesearch.aspx?q=&cx=012488167769036444254:muc_jmckdka&cof=FO
RID:9
2.3 Regulatory and Policy Framework
2.3.1 National Policies and Regulation
Water sources like river, pond, oasis, open wells etc. were very important to the development of civilizations. They provided water for farming crops and for other uses. With development of society, management started shifting from private to community level to the local governments. Maintaining this basic characteristic of civilization, Government of India’s, provides drinking water supplies through different mechanisms. Following table shows Progress of The Rural Water Supply (RWS) sector driven by Government of India.
Table 2.13 Progress of RWSS Programme, Government of India6
Development Stage Year Major Thrust
The first government-installed
rural water supply schemes
1952 Basic drinking water supply facilities to the rural
population
Government of India’s effective
role
1972-73 Launch of Accelerated Rural Water Supply
Programme (ARWSP).
The First generation 1972-1986 Provision of adequate drinking water supply to the
6 National Rural Drinking Water Programme: Framework for Implementation, Department of Drinking Water Supply, Ministry of Rural Development, Government of India http://rural.nic.in/sites/downloads/pura/National%20Rural%20Drinking%20Water%20Programme.pdf

48
Development Stage Year Major Thrust
programme rural community through the Public Health
Engineering System.
The second generation
programme
1986-87,
1991-92
Technology Mission renamed in 1991-92 as Rajiv
Gandhi National Drinking Water Mission Stress on
water quality, appropriate technology intervention,
human resource development support and other
related activities
The third generation
programme
1999-2000,
2002
Sector Reform Projects evolved to involve
community in planning, implementation and
management of drinking water related schemes,
later scaled up as Swajaldhara in 2002
Fourth phase 2012-13 Ensuring sustainability of water availability in
terms of potability, adequacy, convenience,
affordability and equity while also adopting
decentralized approach involving PRIs and
community organizations. Decentralization &
conjunctive use of water etc.

49
2.3.2 National Policy Framework7
Following figure gives snapshot of framework for National Rural Drinking Water Programme (NRDWP).
Figure 2.1 Overview of National Policy Framework
7 National Rural Drinking Water Programme: Framework for Implementation, Department of Drinking Water Supply, Ministry of Rural Development, Government of India http://rural.nic.in/sites/downloads/pura/National%20Rural%20Drinking%20Water%20Programme.pdf
50
2.3.3 Recent changes in the policy framework
National drinking water mission has progressed through different stage (Table 2.29) to achieve the present stage. Following are the major paradigm shifts in the policy framework to ensure inclusive & sustainable growth.
Providing 40 lpcd for the entire population in a habitation to providing adequate drinking water to people living at the tail end of the schemes or throughout the year
Conventional norms of litres per capita per day (lpcd) to ensure drinking water security for all in the community
To ensure that the basic minimum requirement at the household level for drinking and cooking needs
Maintain quality as per the prescribed as per BIS standards
To prevent contamination of drinking water in the conveyance system
Drinking water quality standards both at the production (water treatment plant) as well as at the consumption points (household level).
Focus on personal hygiene
Bureau of Indian Standard (BIS) IS: 10500 and World Health Organization issued modified Guidelines for Drinking Water Quality (2004) and Guidelines for safe use of wastewater and grey water (2006) adopted for health based target setting approach
Risk assessment and risk management of water supplies commonly known as 'water safety plan'.
Linking water quality problem with a water safety solution
Actual water use rather than the source should determine the quality of the water supplied
Water Quality Monitoring & Surveillance Programme
In addition to above major changes in thoughts, since year 2012-13 Government of India through its notification no. D.O. No. W-11011/07/2012-WQ dated July 17, 2012 has modified NRDWP. According to these modifications utilization of 5% water quality fund under NRDWP for inhabitation’s having chemical contamination of drinking water sources and for Japanese Encephalitis (JE)/ Acute Encephalitis Syndrome (AES) affected priority districts is mandatory. Out of earmarked 5% water quality find, 75% will be allocated to states with habitations with chemical contamination (arsenic, fluoride, nitrate, salinity and iron in that order of priority) and the remaining 25% fund will be allocated to the five states with 60 high priority districts affected with JE/AES viz. Assam, Bihar, Tamil Nadu, Uttar Pradesh and West Bengal. Detailed guidelines to follow these instructions have also been provided.
2.3.4 Applicable Legal and Regulatory system
A) Water
National water policy (NWP) 2002, presents the framework for the policy, including the present scenario, concerns, and basic principles of water resource management. This also mentions the interdependence of all elements of the hydrological cycle, and of the

51
need for equity. In pursuance of the strategies identified in National Water Mission Document as well as deliberations in National Water Board, Ministry of Water Resources had initiated the process of reviewing the NWP 2002. Accordingly, the Drafting Committee on National Water Policy has evolved the draft policy after taking into consideration recommendations of various stake holders. Resultant is called as Draft National Water Policy (NWP, 2012). Even while recognizing that the States have the right to frame suitable policies, laws and regulations on water, the draft NWP, 2012 lays emphasis on the need for a national water framework law, comprehensive legislation for optimum development of inter-State rivers and river valleys, public trust doctrine, amendment of the Indian Easements Act, 1882, etc. Hence all water related issues shall be handled by NWP-2012 at national level and by Bihar State Water Policy -2010 at state level. For water quality following regulations are applicable:
Bureau of Indian Standard (BIS) IS: 10500 and
World Health Organization issued modified Guidelines for Drinking Water Quality (2004) and Guidelines for safe use of wastewater and grey water (2006)
For sustainability of drinking water projects guidelines ‚Mobilising Technology for Sustainability‛ issued by the Department of Drinking Water Supply, Government of India
B) Environment
The following are the laws and regulations that are applicable to the environmental and social aspects of the projects:
Policy and Regulatory Framework of Government of India (GoI)
Environmental Policy and Regulations of the Bihar State Government.
Legislations/norms applicable to construction projects.
Operational Policies of the World Bank
Table 2.14 Applicable National and State Policies and Regulatory Frameworks
S.
N
o
Act / Rules Purpose Applicable
Yes/ No
Reason for
Applicability
Authority
1 Environment
Protection Act-
1986
To protect and
improve overall
environment
Yes As all
environmental
notifications, rules
and schedules are
issued under this
Act.
MoEF, Gol,
DoE, State
Gov. CPCB,
SPCB
2 Environmental
Impact
Assessment
Notification
14th Sep-2006
To provide
environmental
clearance to new
development
activities
following
environmental
impact assessment
No
All projects listed
under Schedule-I of
the
Notification
requires
environmental
clearance from the
MoEF. Water
MoEF, EIAA

52
S.
N
o
Act / Rules Purpose Applicable
Yes/ No
Reason for
Applicability
Authority
supply and
sanitation projects,
however, are not
covered in the
Schedule.
5 The Land
Acquisition Act
1894 (As
amended in
1985)
Set out rule for
acquisition. of
land by
government
Yes This Act will be
applicable as there
will be acquisition
of land for scheme
construction.
Revenue
Department,
State
Government
6 The Forest
(Conservation)
Act. 1980
To check
deforestation by
restricting
conversion of
forested areas into
non- forested
areas
Yes Applicable if there
is diversion of forest
land for non-forest
activities i.e. forest
land if required for
any of the schemes.
Forest
Department,
State
Government
and Ministry
of
Environment
and Forests,
Government
of India
7 Wild Life
Protection Act
1972
To protect listed
species of flora
and fauna and
establishment of a
network of
ecologically-
important
protected areas
Yes This Act is will be
applicable, if there
are any points of
wildlife crossings in
proximity to project
locations.
Chief
Conservator
Wildlife,
Wildlife Wing,
State Forest
Department
and Ministry
of
Environment
and Forests,
Government
of India
8 Air (Prevention
and Control of
Pollution) Act,
1981
To control air
pollution by
controlling
emission of air
pollutants as per
the prescribed
standards.
Yes This Act will be
applicable during
construction.
SPCBs
9 Water
Prevention and
Control of
Pollution)
Act1974
To control water
pollution by
controlling
discharge of
pollutants as per
the prescribed
standards
Yes This Act will be
applicable during
construction.
SPCBs

53
S.
N
o
Act / Rules Purpose Applicable
Yes/ No
Reason for
Applicability
Authority
10 The Noise
Pollution
(Regulation and
Control) Rules,
2000
The standards for
noise for day and
night have been
promulgated by
the MoEF for
various land uses.
Yes This act will be
applicable for all
construction
equipment
deployed at
worksite.
SPCBs
11 Ancient
Monuments and
Archaeological
Sites and
Remains
Act1958
Conservation of
cultural and
historical remains
found in India
Yes This act will be
applicable, only if
any scheme site is in
proximity to any
Ancient Monument,
declared protected
under the act.
Archaeologica
l Department
Gol, Indian
Heritage
Society and
Indian
National Trust
for Art and
Culture
Heritage
(INTACH).
12 Public Liability
and Insurance
Act 1991
Protection form
hazardous
materials8 and
accidents.
Yes Contractor may
need to stock
hazardous material
like diesel, Bitumen,
Emulsions etc.
SPCBs
13 Explosive Act
1984
Safe
transportation,
storage and use of
explosive material
Yes For transporting
and storing diesel,
oil and lubricants
etc.
Chief
Controller of
Explosives
14 Minor Mineral
Concession
Rules
For opening new
quarry.
No Regulate use of
minor minerals like
stone, soil, river
sand etc.
District
Collector
15 Central Motor
Vehicle Act 1988
To check
vehicular air and
noise pollution.
Yes This rule will be
applicable to
vehicles deployed
for construction
activities and
construction
machinery.
Motor Vehicle
Department
16 National Forest
Policy, 1988
To maintain
ecological stability
through
preservation and
restoration of
biological
Yes This policy will be
applicable if any eco
sensitive feature
exists in and around
the scheme sites.
Forest
Department,
State
Government
and Ministry
of
8 “Hazardous substance" means any substance or preparation which is defined as hazardous substance under the Environment (Protection) Act, 1986 (29 of 1986).
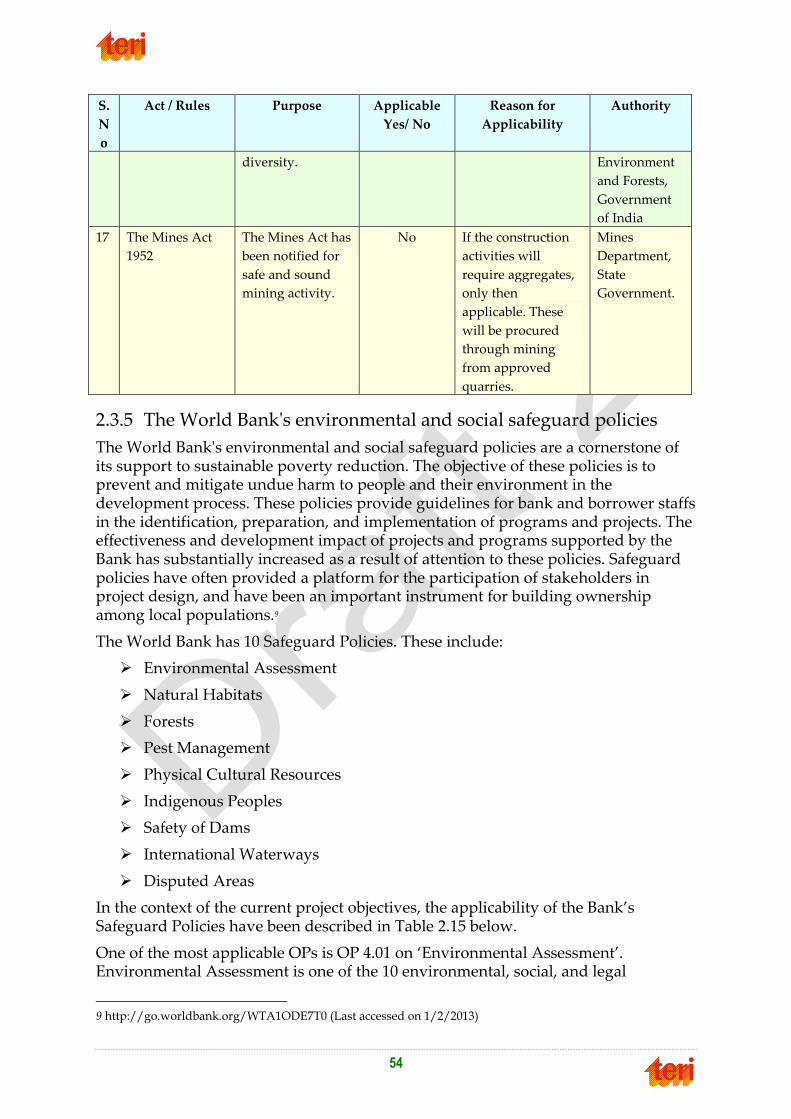
54
S.
N
o
Act / Rules Purpose Applicable
Yes/ No
Reason for
Applicability
Authority
diversity. Environment
and Forests,
Government
of India
17 The Mines Act
1952
The Mines Act has
been notified for
safe and sound
mining activity.
No If the construction
activities will
require aggregates,
only then
applicable. These
will be procured
through mining
from approved
quarries.
Mines
Department,
State
Government.
2.3.5 The World Bank's environmental and social safeguard policies
The World Bank's environmental and social safeguard policies are a cornerstone of its support to sustainable poverty reduction. The objective of these policies is to prevent and mitigate undue harm to people and their environment in the development process. These policies provide guidelines for bank and borrower staffs in the identification, preparation, and implementation of programs and projects. The effectiveness and development impact of projects and programs supported by the Bank has substantially increased as a result of attention to these policies. Safeguard policies have often provided a platform for the participation of stakeholders in project design, and have been an important instrument for building ownership among local populations.9
The World Bank has 10 Safeguard Policies. These include:
Environmental Assessment
Natural Habitats
Forests
Pest Management
Physical Cultural Resources
Indigenous Peoples
Safety of Dams
International Waterways
Disputed Areas
In the context of the current project objectives, the applicability of the Bank’s Safeguard Policies have been described in Table 2.15 below.
One of the most applicable OPs is OP 4.01 on ‘Environmental Assessment’. Environmental Assessment is one of the 10 environmental, social, and legal
9 http://go.worldbank.org/WTA1ODE7T0 (Last accessed on 1/2/2013)
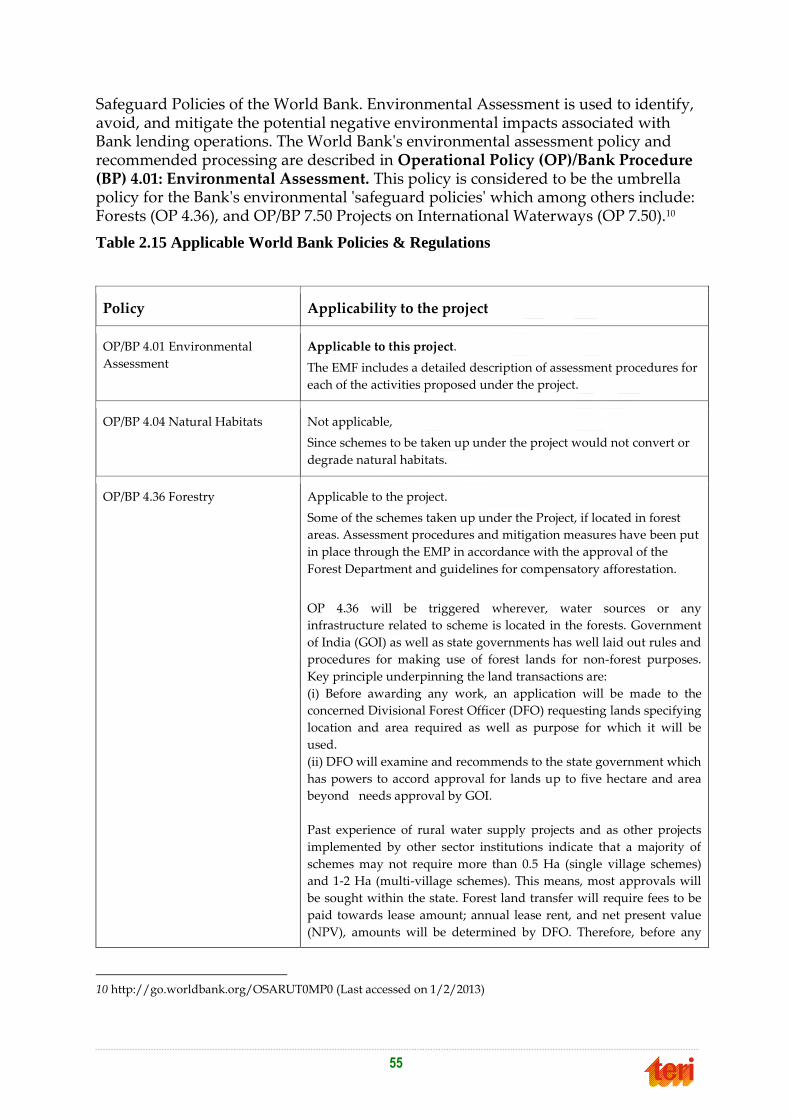
55
Safeguard Policies of the World Bank. Environmental Assessment is used to identify, avoid, and mitigate the potential negative environmental impacts associated with Bank lending operations. The World Bank's environmental assessment policy and recommended processing are described in Operational Policy (OP)/Bank Procedure (BP) 4.01: Environmental Assessment. This policy is considered to be the umbrella policy for the Bank's environmental 'safeguard policies' which among others include: Forests (OP 4.36), and OP/BP 7.50 Projects on International Waterways (OP 7.50).10
Table 2.15 Applicable World Bank Policies & Regulations
Policy Applicability to the project
OP/BP 4.01 Environmental
Assessment
Applicable to this project.
The EMF includes a detailed description of assessment procedures for
each of the activities proposed under the project.
OP/BP 4.04 Natural Habitats Not applicable,
Since schemes to be taken up under the project would not convert or
degrade natural habitats.
OP/BP 4.36 Forestry Applicable to the project.
Some of the schemes taken up under the Project, if located in forest
areas. Assessment procedures and mitigation measures have been put
in place through the EMP in accordance with the approval of the
Forest Department and guidelines for compensatory afforestation.
OP 4.36 will be triggered wherever, water sources or any
infrastructure related to scheme is located in the forests. Government
of India (GOI) as well as state governments has well laid out rules and
procedures for making use of forest lands for non-forest purposes.
Key principle underpinning the land transactions are:
(i) Before awarding any work, an application will be made to the
concerned Divisional Forest Officer (DFO) requesting lands specifying
location and area required as well as purpose for which it will be
used.
(ii) DFO will examine and recommends to the state government which
has powers to accord approval for lands up to five hectare and area
beyond needs approval by GOI.
Past experience of rural water supply projects and as other projects
implemented by other sector institutions indicate that a majority of
schemes may not require more than 0.5 Ha (single village schemes)
and 1-2 Ha (multi-village schemes). This means, most approvals will
be sought within the state. Forest land transfer will require fees to be
paid towards lease amount; annual lease rent, and net present value
(NPV), amounts will be determined by DFO. Therefore, before any
10 http://go.worldbank.org/OSARUT0MP0 (Last accessed on 1/2/2013)

56
project be taken up in the forest areas due procedure to seek forest
clearance be undertaken before work on a water supply scheme be
started.
OP 4.09 Pest Management Not Applicable.
Vector control measures, if undertaken in the project will be in
accordance with the OP 4.09 avoiding use of insecticides in classes 1a,
1b and 2.
OP/BP 4.12 Involuntary
Resettlement
Not Applicable
The project will ensure that people are not displaced.
OP/BP 4.20 Indigenous Peoples Applicable to the project.
To be decided based on the Social Assessment Study.
OP/BP 4.11 Physical Cultural
Resources
Not Applicable to the project.
No existing cultural property will be damaged.
OP/BP 4.37 Safety of Dams Not applicable
Since the project does not involve construction of dams.
OP/BP 7.50 Projects on
International Waterways
Applicable to the project.
In accordance with OP 7.50 (International Waterways) this is seen that
the proposed project falls within the exceptions to the notification
requirement under para 7(a) of the Policy. OP 7.50 is applicable for the
proposed project since the Ganga and its tributaries from where water
resource would be used for the project is infinitesimally small fraction
of overall volume of flow in these rivers and investment components
involve piped water supply schemes which will ultimately improve
the efficiency of water supply system, delivery of resource, decrease in
wastage of resource and thus improved efficiency of WSS system and
service delivery. It is envisaged that there will not be any adverse
impacts on water quality and quantity due to this project and there
will not be adverse effect on water use of the other riparian countries.
The project is expected to have a net positive effect on the
environment.
The project will not adversely impact the quality and quantity of
water, both upstream and downstream, and the proposed project
activities do not conflict with any of the agreements between the
riparian countries.
OP/BP 7.60 Projects in Disputed
Areas
Not applicable
As no project components will be proposed in disputed areas.
2.4 State Sector institutions The Public Health Engineering Department of Bihar is entrusted with the mandate to provide drinking water and sanitation services in the state. The PHED was established

57
in the year 1972 for purposes of planning, implementing, monitoring and supervision of approved schemes. The department has created a State Water and Sanitation Mission (registered as a Society under it) for management of Rural Water supply and sanitation (Fig. 2.2 and 2.3).
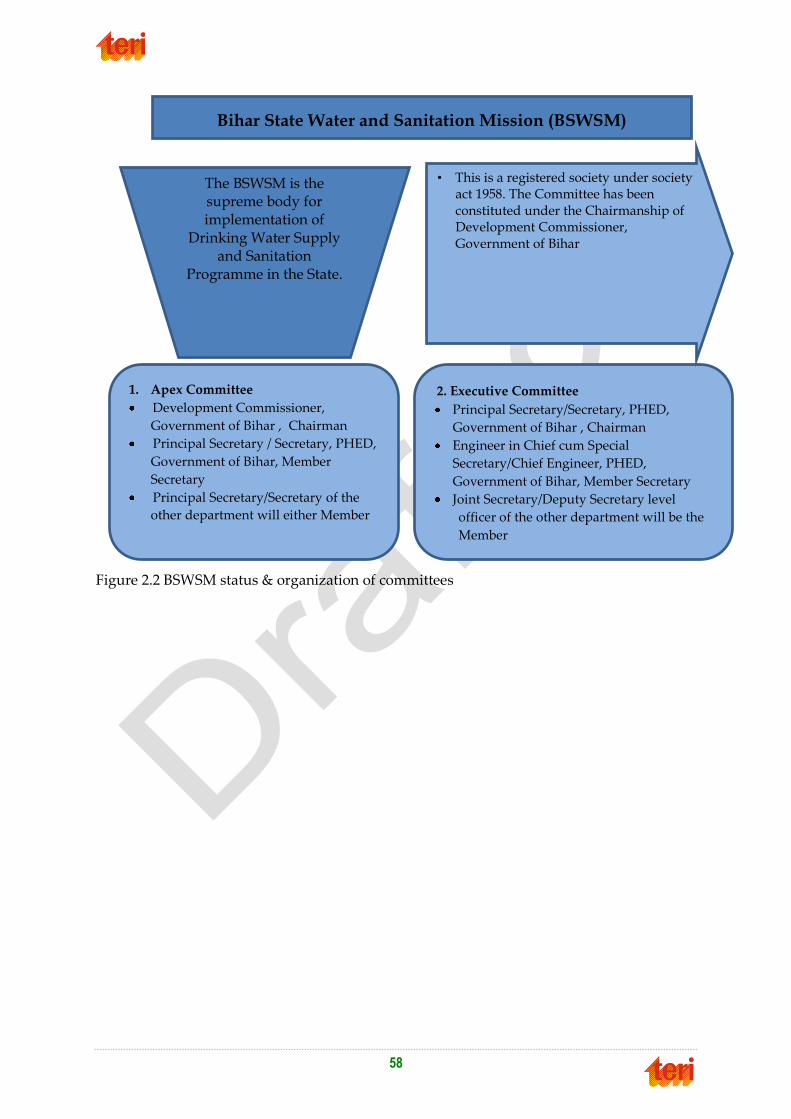
58
Figure 2.2 BSWSM status & organization of committees
1. Apex Committee
Development Commissioner,
Government of Bihar , Chairman
Principal Secretary / Secretary, PHED,
Government of Bihar, Member
Secretary
Principal Secretary/Secretary of the
other department will either Member
2. Executive Committee
Principal Secretary/Secretary, PHED,
Government of Bihar , Chairman
Engineer in Chief cum Special
Secretary/Chief Engineer, PHED,
Government of Bihar, Member Secretary
Joint Secretary/Deputy Secretary level
officer of the other department will be the
Member
The BSWSM is the supreme body for implementation of
Drinking Water Supply and Sanitation
Programme in the State.
• This is a registered society under society act 1958. The Committee has been constituted under the Chairmanship of Development Commissioner, Government of Bihar
Bihar State Water and Sanitation Mission (BSWSM)

59
Figure 2.3 Organizational structure of the BSWSM
2.4.1 Resolution
As per Para 2.2 la of Restructured Central sponsored Rural Sanitation Programme (RCRSP) guidelines and under Rajiv Gandhi National Drinking Water Mission, GOI, New Delhi; Bihar state water & sanitation mission (BSWSM) is constituted as a registered society. For this purpose, approval on constitution of BSWSM and its registration was given by Apex committee of the government body in its meeting on 7th
Oct. 2004 and by executive of the BSWSM in its meeting on 22nd Sept. 2004. It is in this connection a resolution has taken to register BSWSM. The organizational structure of the Bihar State Water & Sanitation Mission (BSWSM) is as shown in Figure 2.3.
2.4.2 Power / Functions of the Mission
A. Governing Body
• Overall policy guidance & Co-ordination of programmes implemented by the District WATSAN missions / Zila Parishads.
• To ensure co-ordination with various departments, agencies and convergence of different activities related to water supply & sanitation in rural areas.
• To approve and sanction the Annual Plan, Budget and Audited Accounts.
• Make, alter and amend the objectives, rules and regulations by laws of the Mission, constitute committees from time to time as and when considered necessary for effective execution of the programmes and schemes.

60
• Delegate powers and function to the employees committees and the consultants of the missions.
B. Executive Body: Subject to the general control and supervision of the Government Body,
• Implement the policies / decision of the Government Body.
• Interact with GOI/RGNDWM and support the implementation of directly implement, various Rural Water Supply and Sanitation schemes and other related activities as well as programmes funded by external donors like DFID, UNICEF, DANIDA etc.
• Liaise & Co-ordinate with various line departments, State Govt. & other sector partners and ensuring participation of the SHGs and the communities in different projects.
• Identify; mobilize NGO’s to undertake work as per schemes notified by the Department of Rural Development. This would include providing technical assistance, guidance and training.
• Ensure establishment and constitution of Missions in the District Level and Panchayat Level.
• Ensure opening of separate Bank account at District Level and Panchayat Level.
• Organize meeting/ Workshop/ Study tours/ Seminars with involvement of all concerned prepare IEC/ Publicity materials for Sanitation and Sector reforms projects and other related activities.
• To promote adoption of demand driven & participatory approach, service delivery maximizing empowerment of villagers in decision making on the choice of service levels.
• Monitor and evaluate the implementation of the schemes by the various agencies including NGO’s.
• Consider and approve the annual accounts ensuring proper auditing of the expenditure by competent authority.
• Undertake any other activities that are consistent with the aims & objectives of the Mission.
2.4.3 The Proposed Policy
Water Allocation Priorities
The order of priorities of water allocation for effective water resource management will be as follows:
Priority rankings: from high to low
• Drinking water for Human beings
• Drinking water for Livestock
• Other domestic, commercial and municipal water uses
• Agriculture

61
• Power generation
• Environmental and ecological Industrial Non-consumptive uses, such as cultural, leisure and tourist uses.
• Others (Lowest priority) any departure from the above priorities will require consideration on a case-by-case basis.
Drinking Water Supply
• The State Government will ensure the provision of adequate potable drinking water to every citizen, shifting from habitation based norms to family level water security. The service level for rural areas will be at least 70 lpcd.
• Formation of special task force with budgetary provisions to manage arsenic, fluoride and excess iron in drinking water.
• As a long term solution, cover all the habitations affected with arsenic, fluoride and iron with piped water supply in next five years
• Promotion of the principles of Reduce, Recycle and Reuse of water
• Sufficient funds and functionaries will be provided to PRI and Local Bodies for regulation and distribution of drinking water in villages, Tolas and towns.
• The capacities of PRIs and Urban bodies will be enhanced in a phased manner so that these institutions can regulate and distribute the drinking water.
• Drinking water needs of humans and livestock will be the first charge on any available water source.
• In multi-purpose Irrigation projects top priority will be given to drinking water.
• Future and existing irrigation and multi-purpose projects will include a drinking water component wherever there is no dependable alternative source of drinking water.
Optimizing Water Availability
• A comprehensive inventory of potential and actual water resources, perennial and ephemeral will be fully identified and quantified. Funds will be provided, on priority basis, to implement programmers of optimum water utilization.
• The watershed approach will be considered in planning of new irrigation projects.
• Basin, sub-basin, aquifer and State-level water resources development and environmental plans will be prepared with stakeholder participation.
Surface water
• Roof top rain water harvesting, storm-water harvesting, recycling and reuse of waste waters will be promoted in water stressed areas
• Efficient crop-water application and utilization practices shall be encouraged by adopting modern water conservation techniques.
• The economic and technical potential for the re-use of treated wastewater will be assessed in all basins.

62
Groundwater
• Exploitation of groundwater for agriculture and purposes other than drinking will be so managed by public participation so as not to exceed the average long-term recharge potential.
• The cost-effectiveness of various technologies, under varying conditions, for brackish groundwater will be explored. Pilot projects will be undertaken to evaluate these technologies under field conditions.
• Aquifer wise planning based on modern technology will be introduced and community organizations would be set up at village and aquifer level to plan and manage ground water resources with focus on drinking water supply
Project Planning and Implementation
• Water resources development projects will be prioritized on the basis of economic, social, environmental and financial criteria.
• Wherever possible, projects will integrate surface and ground water resources.
• Quantitative estimates of future water demands will be estimated by stakeholders with line-departments technical assistance.
• Public Private Partnership in development and management of water systems will be encouraged.
Source: for information regarding BSWSM (http://www.bswsmpatna.org/aboutbswsm.html) and for proposed policy http://www.bswsmpatna.org/Pdf%20file/Updated%20proposed%20draft%20for%20Drinking%20water%20and%20Sanitation.pdf Last accessed on February 13, 2013.
2.5 Converging departments Departments which work together with BSWSM or PHED by joining or side by side in achieving water and sanitation related works are called as converging departments. As water and sanitation are basic requirements for human beings, support in different form and ways can be provided to fulfill the requirements. Hence many water and sanitation related targets will be seen in many departments and programs. Following are some of the important converging departments
2.5.1 Central Ground Water Board
The Central Ground Water Board is responsible for activities as mentioned below:
i. Hydrogeological Surveys: Central Ground Water Board carries out regional hydrogeological studies which provide information on ground water occurrence in different terrains and are essential for future planning of ground water development and management.
ii. Ground water Management Studies (GWMS): They are essential to update the scenario of ground water occurrence, availability and utilization in term of quality and quantity
iii. Ground water exploration aided by drilling: It is one of the major activities of the Board with an objective to discover aquifers in different hydrogeological conditions and determination of hydraulic parameters.

63
iv. Ground Water Monitoring: Ground water levels are being measured four times a year during January, April/ May, August and November by the Central Ground Water Board through observation wells.
v. Ground Water Resources Assessment: Quantification of ground water resources is one of the major inputs in planning ground water development and management. The resource assessment and the categorisation of assessment units forms a basis for implementing various ground water management plans and programmes.
vi. Ground Water Quality Monitoring: Monitoring of ground water quality is an effort to obtain information on chemical quality through representative sampling in different hydrogeological units. The chemical quality is being monitored by Central Ground Water Board once in a year.
2.5.2 Bihar State Pollution Control Board
Bihar State Pollution Control Board was constituted in the year 1974 under the provisions of the Water (prevention and Control of pollution) Act, 1974. Since inception Bihar State Pollution Control Board, like other State Boards has been performing its functions as enumerated under section 17 of the Water (Prevention and Control of Pollution) Act, 1974. Functions, so entrusted to the Board are:
1. Planning programme for prevention and control of pollution in the state;
2. Advising the State Government from time to time in the matters of pollution;
3. Collection and dissemination of information with regard to pollution control;
4. Conduction and participation in Research & Development (R&D) relating to water pollution;
5. Collaboration with Central Board in organizing training and mass awareness programme of grant of consent;
6. Inspection of Treatment plant and their review for the purpose;
7. Laying down standards of sewage and trade effluents;
8. Evolving economical and reliable methods of effluent treatment;
9. Evolving methods of utilisation of sewage and trade effluent for agriculture;
10. Evolving methods of disposal of sewage and trade effluents on land;
11. Laying down standards of treatment of sewage and trade effluent;
12. Making any suitable order concerning prevention and control of discharges of effluent into streams or concerning construction of systems for their disposal;
13. Laying down effluent standards to be observed by any person causing discharge of sewage or sludge;
14. Advising the State Government with respect to the location of any industry;
15. Performing such other functions, as may be prescribed by the Central Board of the State Government; and
16. Establishment or recognition of laboratories for the analysis of discharges of effluent.

64
Besides this there are many converging departments mentioned below
Primary and Secondary Health Centres,
Minor Irrigation Dept.
Water Resources Dept.
Dept. of Agriculture,
Dept. of Rural Development
Panchayati Raj Institutes (Gram Panchayat, Block Development Officie, Zilla
Parishad etc.)
2.6 Proposed World Bank Assisted Project The proposed World Bank assisted RWSS project would aim to scale up demand responsive and decentralized service delivery approach across the state. The project will cover all the 38 districts in Bihar.
A unique feature of the proposed project is its bottom up planning process through decentralization and devolution of powers, where-in the Panchayat Raj institutions and the local communities are actively involved in all stages of development of the project and its implementation including O&M of the facilities created under the project.
The key objectives of the proposed project are:
a) To improve the quality of rural water supply and sanitation services and to achieve Sustainable development, Poverty reduction, Sustainable health and hygiene benefits to the rural population, Empowerment and inclusion of community in general and rural poor and women in particular, and Strengthening the decentralization process.
b) To promote the long term sustainability of the rural water supply and sanitation sector by identifying and implementing an appropriate policy framework and strategic plan.
These objectives will be achieved through:
Adopting a demand responsive approach and use of participatory process for delivery of sustainable service to project communities,
Phased implementation of appropriate policy and institutional reforms for changing role of the government from provider to facilitator,
Community and Village Panchayat capacity building, Women's development initiatives built into the project, Targeted Tribal Development Plan.
Construction and up-gradation of drinking water supply, drainage and sanitation schemes, including water quality monitoring programs, Groundwater recharge and rainwater harvesting will be integral parts of drinking water source development.
This will also involve promoting integrated water resource management, and Establishing financial viability and sustainability of rural water supply and sanitation services.

65
33.. BBaasseelliinnee EEnnvviirroonnmmeennttaall SSttaattuuss
3.1 Introduction This chapter provides a detailed description of the existing environmental conditions and status of different components related to environment in the state of Bihar. Information of four districts that were selected for field surveys viz. Begu Sarai, Nawada, Purnea and West Champaran has also been given at different relevant sections.
3.2 Brief profile of State Bihar, the land locked state, lies in the eastern part of the country. The state shares its international border with Nepal in the North and state borders with Jharkhand in the South, West Bengal in the East and Uttar Pradesh in the West. The River Ganga flows from west to east through the state and divides the plains of Bihar into two unequal halves11. Tables 3.1 and 3.2 show the key statistics and administrative divisions of Bihar, respectively.
The state (old Bihar state) was bifurcated in the year 2000 into the present Bihar and Jharkhand state. The total area of the state is 94,163 sq kms, out of which around 97% is rural and only 3% is urban area. Administratively the state is divided into 9 divisions and 38 districts (Fig. 3.1)
Table 3.1 Key statistics of Bihar12
Population 10,38,04,637
Literacy In Absolute
Numbers
5,43,90,254
Male 3,27,11,975
Female 2,16,78,279
Percentage of Population Total 63.82%
Male 73.39%
Female 53.33%
Decadal Population Growth (2001-
2011)
Absolute 2,08,06,128
As Percentage 25.07%
Highest Decadal Growth at Madhepura District (30.65%)
Lowest Decadal Growth at Gopalganj District (18.83%)
Density of Population 1,102 per sq kms
Highest Density Sheohar, 1882 per sq kms
Lowest Density Kaimur, 488 per sq kms
Most Populous District Patna: 57,72,804
Least Populous District Sheikhpura: 6,34,927
Sex Ratio (Females/Thousand Males) 916
Highest Ratio (Gopalganj) 1,015
Lowest Ratio (Munger and Bhagalpur) 879
Highest Literacy Rate Rohtas, 75.59%
Lowest Literacy Rate Purnea, 52.49%
Average Population of a District 27,31,701
11 http://gov.bih.nic.in/Profile/default.htm 12 ibid
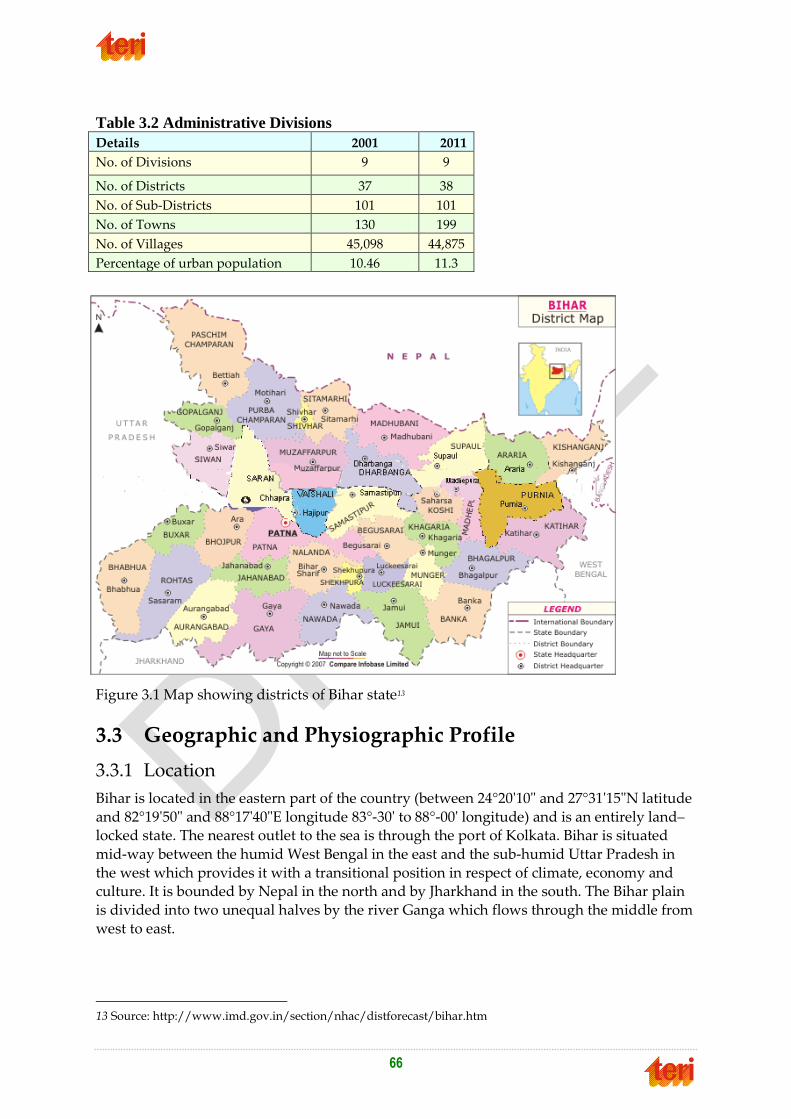
66
Table 3.2 Administrative Divisions
Details 2001 2011
No. of Divisions 9 9
No. of Districts 37 38
No. of Sub-Districts 101 101
No. of Towns 130 199
No. of Villages 45,098 44,875
Percentage of urban population 10.46 11.3
Figure 3.1 Map showing districts of Bihar state13
3.3 Geographic and Physiographic Profile
3.3.1 Location
Bihar is located in the eastern part of the country (between 24°20'10" and 27°31'15"N latitude
and 82°19'50" and 88°17'40"E longitude 83°-30' to 88°-00' longitude) and is an entirely land–locked state. The nearest outlet to the sea is through the port of Kolkata. Bihar is situated
mid-way between the humid West Bengal in the east and the sub-humid Uttar Pradesh in
the west which provides it with a transitional position in respect of climate, economy and culture. It is bounded by Nepal in the north and by Jharkhand in the south. The Bihar plain
is divided into two unequal halves by the river Ganga which flows through the middle from
west to east.
13 Source: http://www.imd.gov.in/section/nhac/distforecast/bihar.htm

67
3.3.2 Physiography
The State of Bihar is divided into three physiographic region: 1) the north Bihar plains, 2) the south Bihar plains, and 3) Chhotanagpur and Santhal Paraganas plateau. They are briefly
described here.
3.3.2.1 North Bihar plains
North Bihar plains consist of fifteen districts and is spread over 5.4 million hectares. The
topography of this area is practically levelled with a slope towards south-east. Several big
rivers such as Ganges, Gandak, Kosi, Kamala balan and Baghmati regularly flood this area. In north Bihar plain all the districts excepts Champaran are devoid of forests. However, the
soil in this area is comparatively a fertile though saline and alkali problems are common.
3.3.2.2 South Bihar plains
Southern plains of Bihar consist of nine districts and covers an area of about 4.0 million
hectares. Its topography slopes towards north and most of the streams flow northward and
join the Ganges as tributaries. The southern plains has many important rivets such as Son, Punpun and Falgu.
3.3.2.3 Chhotanagpur and Santhal Panganas plateau
Chhotanagpur and santhal paraganas plateau, though consists of only seven districts, covers It has the largest geo- graphical area of about 8.0 million hectares. This region consists of
several plateau having altitudes varying from 300 to 1000 metres above mean sea level with
valleys in between them. Several rivers such as Damodar, Suvamarekha, Barakar, Koel etc. flow through this region. The plateau has large proportion of land under forest which is
highest in district of Palamau (48.05%), followed by Hazaribagh (40.17%) and Singhbhum
(29.07%) districts.
Though the population of Chotanagpur and Santhal Paragana consists of a wide variety of
ethnic composition, a large number of scheduled tribes are found there.
3.3.3 Geomorphology
The geomorphology of an area is based on broad parameters such as relief, drainage pattern
and geology. The three geomorphic domains are such as:14
Uplifted block of hilly southern highlands comprising the northern part of the Kodarma- Santhal Pargana planation surface, falling in parts of Bihar, northern fringe
or escarpment of Chota Nagpur plateau and Rohtas plateau
The transition zone between the southern highlands and the Great Ganga Plains, constituting the central Bihar Plains, and
The Ganga foredeep of the North Bihar Plains bounded by the rising Himalaya in the
north and the Ganga R. in the South.
Bihar state is 12th largest in terms of geographical size (94,163 km2) and 3rd largest by
population (10.38 crores as per Census 2011, in the country. It is also known for its abundant
natural resources, perennial rivers, fertile lands and a long glorious history. The state’s divided into two states in the year 2000. After the division the state retained almost 75% of
14 State of the Environment Report, Bihar (2007)

68
the population, while it is left with only 54% of the land, thus inducing a lot of strain on the
available resources. Most of this population (close to 88%) lives in villages.
Bihar lies in the tropical to sub-tropical region. Rainfall here is the most significant factor in
determining the nature of vegetation. Bihar has a monsoon climate with an average annual
rainfall of 1200 mm. The sub Himalayan foothills of Someshwar and Dun ranges in Champaran constitute belt of moist deciduous forests. This region also consists of scrub,
grass and reeds. High rainfall in this region (above 1,600 mm) promotes luxuriant Sal forests
in the favored areas. The hot and dry summer give rise to the deciduous forests. The most important trees of the region are Shorea Robusta (Sal), Shisham, Cedrela Toona, Khair, and
Semal. This type of forests also occurs in Saharasa and Purnea districts
3.4 Important Population Characteristics of Bihar State
3.4.1 Demographic Status
Bihar is the third most populous state in India after Uttar Pradesh and Maharashtra.
According to the provisional population by census 2011, the population of the Bihar is 10.38 crore, out of which around 5.3 crore are males and 4.96 crore are females. A slight decrease
in the percentage decadal growth from 1991-2001 to 2001-2011 was observed i.e. the decadal
population growth was 28.6% and 25.1% in 1991-2001 and 2001-2011 respectively.
The total literate population in the state is 5.4 crore out of 10.38 crore in 2011, out which 3.2
crore men and 2.1 crore females are literate. The literacy rate in the state has shown
improvements over the past decade. In 2001, out of the total population only 47% people were literate which has increased to 63.82% in 2011. The percentage of males and females
literate has also increased over the same period. In 2001, 59.68% males and 33.12% females
were literate which has increased to 73.39% males and 53.33% females respectively.
The sex ratio of Bihar state has slightly decreased from 919 in 2001 to 916 in 2011. The
statistics shows an increase in the population density from 881 to 1102 from 2001 to 2011
respectively.
Table 3.3 Population of 38 districts of Bihar by sex and percentage share in the total
population15
Population of State/Districts by sex and percentage share of population in total population
District
Code
State/Districts Total Population % share in
total
population Persons Males Females
Bihar 103,804,637 54,185,347 49,619,290 100
1 West Champaran 3,922,780 2,057,669 1,865,111 3.78
2 East Champaran 5,082,868 2,674,037 2,408,831 4.9
3 Sheohar 656,916 347,614 309,302 0.63
4 Sitamarhi 3,419,622 1,800,441 1,619,181 3.29
5 Madhubani 4,476,044 2,324,984 2,151,060 4.31
6 Supaul 2,228,397 1,157,815 1,070,582 2.15
7 Araria 2,806,200 1,460,878 1,345,322 2.7
8 Kishanganj 1,690,948 868,845 822,103 1.63
9 Purnea 3,273,127 1,695,829 1,577,298 3.15
15 Source: Census of India, 2011

69
Population of State/Districts by sex and percentage share of population in total population
10 Katihar 3,068,149 1,601,158 1,466,991 2.96
11 Madhepura 1,994,618 1,042,373 952,245 1.92
12 Saharsa 1,897,102 995,502 901,600 1.83
13 Darbhanga 3,921,971 2,053,043 1,868,928 3.78
14 Muzaffarpur 4,778,610 2,517,500 2,261,110 4.6
15 Gopalganj 2,558,037 1,269,677 1,288,360 2.46
16 Siwan 3,318,176 1,672,121 1,646,055 3.2
17 Saran 3,943,098 2,023,476 1,919,622 3.8
18 Vaishali 3,495,249 1,847,058 1,648,191 3.37
19 Samastipur 4,254,782 2,228,432 2,026,350 4.1
20 Begusarai 2,954,367 1,560,203 1,394,164 2.85
21 Khagaria 1,657,599 880,065 777,534 1.6
22 Bhagalpur 3,032,226 1,614,014 1,418,212 2.92
23 Banka 2,029,339 1,064,307 965,032 1.95
24 Munger 1,359,054 723,280 635,774 1.31
25 Lakhisarai 1,000,717 526,651 474,066 0.96
26 Sheikhpura 634,927 329,593 305,334 0.61
27 Nalanda 2,872,523 1,495,577 1,376,946 2.77
28 Patna 5,772,804 3,051,117 2,721,687 5.56
29 Bhojpur 2,720,155 1,431,722 1,288,433 2.62
30 Buxar 1,707,643 888,356 819,287 1.65
31 Kaimur (Bhabua) 1,626,900 847,784 779,116 1.57
32 Rohtas 2,962,593 1,547,856 1,414,737 2.85
33 Aurangabad 2,511,243 1,310,867 1,200,376 2.42
34 Gaya 4,379,383 2,266,865 2,112,518 4.22
35 Nawada 2,216,653 1,145,123 1,071,530 2.14
36 Jamui 1,756,078 914,368 841,710 1.69
37 Jehanabad 1,124,176 586,202 537,974 1.08
38 Arwal 699,563 362,945 336,618 0.67
3.4.2 Number of Households in the State
The household size in the state of Bihar roughly stands at 6 members per household. Number of members per household in rural areas is about 6 (Table 3.4), whereas in urban areas it is about 6.5.
Table 3.4 No. of households in Bihar
S.N. Name Number
Total
1 No of occupied Residential houses 1,27,40,000
2 No. of House holds 1,37,44,000
3 Total Population 8,29,99,000
4 No. of persons per Household 6.04
Rural
5 No of occupied Residential houses 1,24,07,000
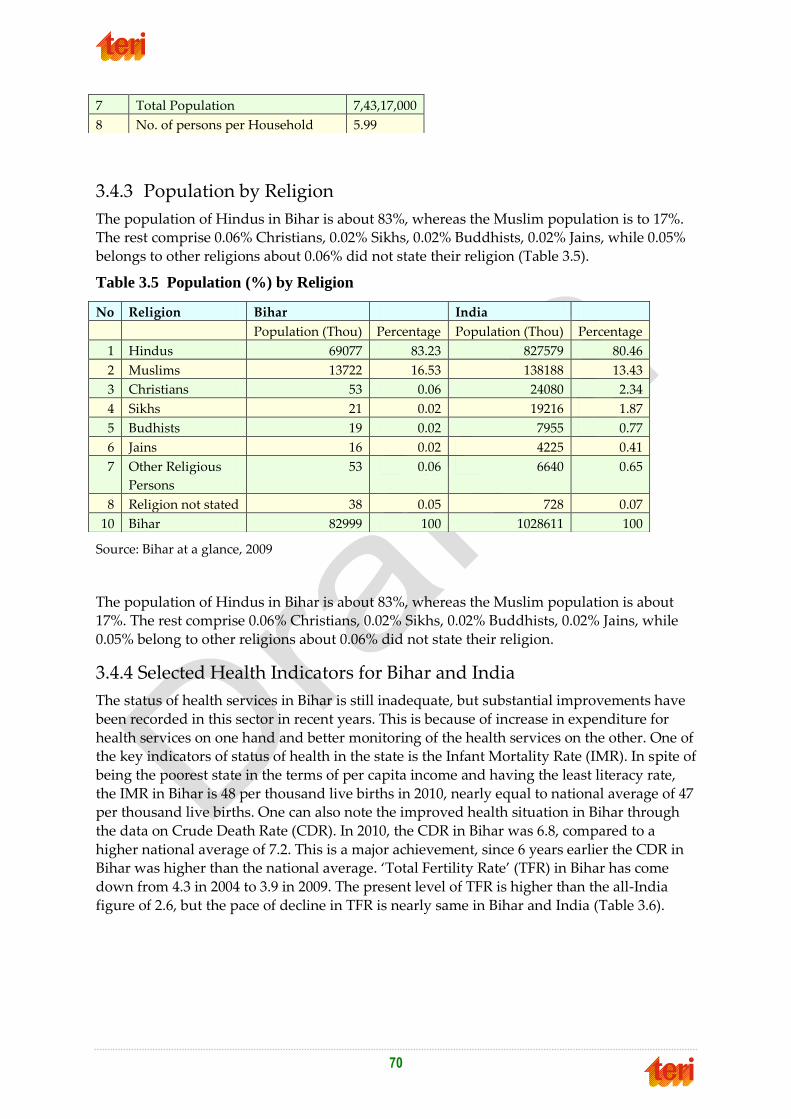
70
3.4.3 Population by Religion
The population of Hindus in Bihar is about 83%, whereas the Muslim population is to 17%. The rest comprise 0.06% Christians, 0.02% Sikhs, 0.02% Buddhists, 0.02% Jains, while 0.05%
belongs to other religions about 0.06% did not state their religion (Table 3.5).
Table 3.5 Population (%) by Religion
Source: Bihar at a glance, 2009
The population of Hindus in Bihar is about 83%, whereas the Muslim population is about 17%. The rest comprise 0.06% Christians, 0.02% Sikhs, 0.02% Buddhists, 0.02% Jains, while
0.05% belong to other religions about 0.06% did not state their religion.
3.4.4 Selected Health Indicators for Bihar and India
The status of health services in Bihar is still inadequate, but substantial improvements have
been recorded in this sector in recent years. This is because of increase in expenditure for
health services on one hand and better monitoring of the health services on the other. One of the key indicators of status of health in the state is the Infant Mortality Rate (IMR). In spite of
being the poorest state in the terms of per capita income and having the least literacy rate,
the IMR in Bihar is 48 per thousand live births in 2010, nearly equal to national average of 47 per thousand live births. One can also note the improved health situation in Bihar through
the data on Crude Death Rate (CDR). In 2010, the CDR in Bihar was 6.8, compared to a
higher national average of 7.2. This is a major achievement, since 6 years earlier the CDR in Bihar was higher than the national average. ‘Total Fertility Rate’ (TFR) in Bihar has come
down from 4.3 in 2004 to 3.9 in 2009. The present level of TFR is higher than the all-India
figure of 2.6, but the pace of decline in TFR is nearly same in Bihar and India (Table 3.6).
7 Total Population 7,43,17,000
8 No. of persons per Household 5.99
No Religion Bihar India
Population (Thou) Percentage Population (Thou) Percentage
1 Hindus 69077 83.23 827579 80.46
2 Muslims 13722 16.53 138188 13.43
3 Christians 53 0.06 24080 2.34
4 Sikhs 21 0.02 19216 1.87
5 Budhists 19 0.02 7955 0.77
6 Jains 16 0.02 4225 0.41
7 Other Religious
Persons
53 0.06 6640 0.65
8 Religion not stated 38 0.05 728 0.07
10 Bihar 82999 100 1028611 100

71
Table 3.6 Selected Health Indicators for Bihar and India (2004 to 2010)
The average crude birth rate per 1000 population for Bihar is 26.7, whereas the same is 21.2 for urban and 27.5 for rural. The average crude death rate per 1000 population is 7.2,
whereas the same is 5.7 for urban and 7.4 for rural. The infant mortality rate per 1000 live
births is 55, whereas the same is 56 for urban and 53 for rural. This data shows that there is significant difference in among rural and urban areas in terms of birth and death rates, as
the urban data is more promising. This information for four study districts has also been
given in table 3.7.
Table 3.7 Crude Birth and Crude Death Rates in Four Study Districts & Bihar State
Crude Birth Rate Crude Death Rate
Total Rural Urban Total Rural Urban
LL UL LL UL LL UL LL UL LL UL LL UL
1 Begusarai 25.3 28 25.7 28.5 17.6 25.7 6 7.1 6 7.2 3.7 7.8
2 Nawada 24 26 24.3 26.5 19.1 23.4 5.3 6.6 5.3 6.6 3.2 8.1
3 Pashchim Champ 25.9 31.3 26.5 32.1 15.3 27.1 7.8 10.1 7.6 9.9 6.7 15.4
4 Purnea 25.3 29.9 28 29.6 16.9 26.4 6.3 8.1 7.2 7.9 3.1 7.9
Bihar 26.4 27 27.3 27.8 20.3 22 7.1 7.3 7.3 7.5 5.4 6.1
3.4.5 SC/ST Population in Bihar State
According to 2001 census, out of total population of Bihar (8,29,98,509), scheduled caste population was (13048608) and scheduled tribe population was 758351. Following graph
shows the comparison of SC/ST population at national and state level (Fig. 3.2). Bihar state
has comparable scheduled caste population but very less scheduled tribe population than all India figures (<1% compared to >8.0%).
Year Crude Birth
Rate
Crude Death
Rate
Total Fertility
Rate (TFR)
Infant Mortality
Rate (IMR)
India Bihar India Bihar India Bihar India Bihar
2004 24.1 30.2 7.5 8.1 2.9 4.3 58 61
2005 23.8 30.4 7.6 8.1 2.9 4.3 58 61
2006 23.5 29.9 7.5 7.7 2.8 4.2 57 60
2007 23.1 29.4 7.4 7.5 2.7 3.9 55 58
2008 22.8 28.9 7.4 7.3 2.6 3.9 53 56
2009 22.5 28.5 7.3 7.0 2.6 3.9 50 52
2010 22.1 28.1 7.2 6.8 -- -- 47 48

72
Figure 3.2 Comparison of SC/ST population at India and Bihar
Table 3.8 Rural/Urban area wise SC/ST population division
Total Population Rural Urban
Total Male Female Total Male Female Total Male Female
Scheduled Caste 13048608 6784676 6263932 12178555 6321221 5857334 870053 463455 406598
% 15.70% 52% 48% 16.40% 51.90% 48.10% 10.00% 53.30% 46.70%
Scheduled Tribes 758351 393114 365237 717702 371009 346693 40649 22105 18544
% 0.90% 51.80% 48.20% 1.00% 51.70% 48.30% 0.50% 54.40% 45.60%
Source Census, 2001
It can be observed from above table that more number (or percentage) of SC and ST
population is living in rural area than urban areas of the state
3.4.5.1 District SC/ ST Population Percentage
Of the studied four districts in Bihar state (shown in bold letters in table 3.9), Nawada
district has highest percentage of SC population (24.09%) while Purnea has the highest
percentage of ST population (4.4%) among different districts of the state.

73
Table 3.9 District wise total SC/ST population and their percentage
No
District
Total Population
SC Population
ST Population
Population %
SC ST
1 Araria 2158608 293488 29423 13.6 1.36
2 Arwal 589476 111479 294 18.91 0.05
3 Aurangabad 2013055 472766 1640 23.49 0.08
4 Banka 1608773 200059 75070 12.44 4.67
5 Begusari 2349366 341173 1505 14.52 0.06
6 Bhagalpur 2423172 254686 55545 10.51 2.29
7 Bhojpur 2243144 343598 8337 15.32 0.37
8 Buxer 1402396 198014 8428 14.12 0.6
9 Darbhanga 3295789 511125 841 15.51 0.03
10 East Champ 3939773 514119 4812 13.05 0.12
11 Gaya 3473428 1029675 2945 29.64 0.08
12 Gopalganj 2152638 267250 6157 12.41 0.29
13 Jamui 1398796 242710 67357 17.35 4.82
14 Jehanabad 924839 174738 1019 18.89 0.11
15 Kaimur 1289074 286291 35662 22.21 2.77
16 Katihar 2392638 208384 140418 8.71 5.87
17 Khgaria 1280354 185122 332 14.46 0.03
18 Kishanganj 1296348 85833 47116 6.62 3.63
19 Lakhisari 802225 126575 5636 15.78 0.7
20 Madhepura 1526646 260461 9295 17.06 0.61
21 Maduhbani 3575281 481922 1260 13.48 0.04
22 Munger 1137797 150947 18060 13.27 1.59
23 Muzaffarpur 3746714 594577 3472 15.87 0.09
24 Nalanda 2370528 473786 970 19.99 0.04
25 Nawada 1809696 435975 2158 24.09 0.12
26 Patna 4718592 729988 9236 15.47 0.2
27 Purnea 2543942 312088 111947 12.27 4.4
28 Rohtas 2450748 444333 25663 18.13 1.05
29 Saharsa 1508182 242612 4642 16.09 0.31
30 Samastipur 3394793 628838 3362 18.52 0.1
31 Saran 3248701 389933 6667 12 0.21
32 Shekhpura 525502 103732 211 19.74 0.04
33 Sheohar 515961 74391 64 14.42 0.01
34 Sitamarhi 2682720 315646 1786 11.77 0.07
35 Siwan 2714349 309013 13822 11.38 0.51
36 Supaul 1732578 256444 5219 14.8 0.3
37 Vaishali 2718421 562123 3068 20.68 0.11
38 West Champ 3043466 434714 44912 14.28 1.48
Total 82998509 13048608 758351 15.72 0.91
Census, 2001

74
3.5 Literacy Trend in Bihar State The literacy rate in Bihar remains one of the lowest in the country, but the state has made remarkable progress in this field in the last decade. The literacy rate in Bihar increased from
47.0 per cent in 2001 to 63.8 per cent in 2011, implying an increase of 16.8 per cent during the
decade. This decadal increase is not only the highest among all the decadal growth rates in Bihar since 1961, it is also the highest among all the states in India for the decade 2001-2011.
Apart from recording the highest increase in literacy rates, Bihar has been able to
considerably reduce its gender difference in literacy rates.
In 2001, the male and female literacy rates in Bihar were 60.3% and 33.6% respectively,
implying a difference of 26.7%. In 2011, the gender-wise literacy rates were 73.4% (male) and
53.3% (female), implying a reduced gender difference of 20.1%.
Table 3.10 Trend of Literacy rates in India and Bihar16
Year India Bihar Gender Gap
Male Female Total Male Female Total India Bihar
1961 40.4 15.4 28.3 35.2 8.2 22.0 25.1 27.0
1971 46.0 22.0 34.5 35.8 10.2 23.2 24.0 25.5
1981 56.4 29.8 43.6 43.8 15.8 32.3 26.6 28.0
1991 64.1 39.3 52.2 52.5 22.9 37.5 24.8 29.6
2001 75.3 53.7 64.8 60.3 33.6 47.0 21.6 26.7
2011 82.1 65.5 74.0 73.4 53.3 63.8 16.6 20.1
Table 3.11 Literacy of sample surveyed districts
2011 Census Literates (Numbers) Literacy rate (%)
Districts Person Male Female Person Male Female
1 Pashchim
Champaran
1,839,984 1,139,136 700,848 58.06 68.16 46.79
2 Purnea 1,380,052 834,533 545,519 52.49 61.09 43.19
3 Begusarai 1,604,148 953,052 651,096 66.23 74.36 57.1
4 Nawada 1,139,832 685,513 454,319 61.63 71.4 51.09
Bihar 54,390,254 32,711,975 21,678,279 63.82 73.39 53.33
Four districts selected for study have lower male and female literacy percentages compared to state average except Nawada district.
3.6 Number of workers According to ‘The Economic Census 2005’, there were total 22.69 lakh workers working in 12.25 lakh establishments of the state. The number of total workers grew by only 1.62% in
2005 over 1998. Out of total workers, 61.90 per cent were in rural areas, while 38.10% were in
urban areas. There were 63.0 thousand workers in Agricultural establishments and 22.06 lakh workers in Non-Agricultural establishments.
16 Economic Survey, 2011-12, Government of Bihar

75
Table 3.12 Distribution of Workers by Rural/Urban Area
Rural Urban Total
1998 2005 1998 2005 1998 2005
1220972 1404857
(15.06)
1012363 864699
(-17.07)
2233332 2269556
(1.62)
Source: http://dse.bih.nic.in/Publications/Economic-Census-Report-2005.pdf
Fact Highlighted in Fifth Economic Census 2005
The growth of workers in rural area for whole of the state was 15.06 % as against a decline of 17.07% in the urban areas.
Comments on industry and labor in Economic Census 2011-12
The industries in Bihar remained plagued by a plethora of problems. According to Economic Census 2005, out of a total of 12.25 lakh enterprises, only 7% were financed by banks, 80 per
cent enterprises did not have power linkage, 11 per cent functioned without premises and
4% were seasonal. Only 63 per cent enterprises were registered and 82% had only 5 or less employees.
3.6.1 Workers in Agricultural
The number of workers in the Agricultural Establishments in the State decreased from 64010 in 1998 to 63021 in 2005, a decline of 1.57%. The number of workers in the Non-Agricultural
Establishments increased from 2169322 in 1998 to 2206535 in 2005 recording a growth of
1.72%. This might become serious implication for agriculture sector in the state, which is mainstay for livelihood of major population.
Table 3.13 Distribution of Workers by Agricultural/Non-Agricultural Establishments Agricultural Non-Agricultural Total 1998 2005 1998 2005 1998 2005 64010 63021
(-1.57%) 2169322 2206535
(1.72%) 2233332 2269556
(1.62%)
3.7 Economy of Bihar State The economy of Bihar grew at an annual rate of 11.36 percent during the period 2004-05 to
2010-11.17 This growth process can be termed as 'revival of a stagnant economy'. The growth rate of the state economy in 2010-11 over 2009-10 was 14.8 percent. This was possible
because there was substantial increase in public investment. However, there is still a stress
on infrastructural development.
During the period 2004-05 to 2010-11, the sectors reporting a growth rate of more than 15
percent are registered manufacturing (23.30 percent), construction (19.61 percent),
communications (27.23 percent) and trade, hotels and restaurant (20.22 percent). Bihar is a densely populated region, with no less than 1102 persons living per sq. km. As per the
estimates of Tendulkar Committee, in 2004-05, 54.5 percent of the population lived below
poverty line in Bihar. For rural and urban areas, the poverty levels were 55.7 percent and 43.7 percent respectively. Agriculture would continue to play an integral part of the
development process in the state as around 90 percent of the population still live in villages
17 Economic Survey, Government of Bihar, February 2012

76
and continue to depend on agriculture as a prime source of their livelihood. In view of this,
the state government is not only stressing for a second Green Revolution based on bio-technological improvement, but also putting forth a concept of 'Rainbow Revolution'. The
growth rate of agriculture and animal husbandry during the last 5 years has been 3.20
percent, compared to 2.40 percent in previous 5 years. There has been noticeable increase in the rate of growth of Bihar's economy, but this rate of growth shows wide fluctuations. One
source of this wide fluctuation is most likely the vagaries of monsoon, which tend to cause
upswing and downswing in the rate of growth of agriculture and the remaining sectors of state economy. There is, therefore, a need to stabilize the rate of growth of agriculture
through introduction of modern techniques and spread of irrigation.
3.8 Environmental Baseline of Bihar
3.8.1 Climate
Bihar has a continental monsoon type of climate. It is located in tropical to sub-tropical zone.
The Himalayas Mountains in the north significantly affect the distribution of monsoon rainfall in the state. Bihar experiences the four seasons: the seasons and their duration are
mentioned below18.
Cold Weather season extends from December to February
Hot weather season extends from March to May
Southwest monsoon extends from June to September
Retreating southwest monsoon extends from October to November
3.8.2 Rainfall
The average rainfall in Bihar is 1052.60 mms. It is largely due to South-west monsoon which
accounts for around 85 percent of total rainfall in the state. The other sources, viz, winter rain, hot weather rain and north-west monsoon account for remaining 15 percent. The
average normal rainfall in the state is more or less adequate for all its agricultural
operations. However, it is the year-to-year changes which lead to drought or flood. This causes extensive damage to crop production and the overall income of the state. This is
because of the fact that almost half of the cultivated area is un-irrigated.
During the period 2000 to 2010, the annual rainfall has varied between 677.85 cm in 2010 (64.4 percent of the average) to 1506.08 in 2007 (143.1 percent of the average). Total rainfall in
2010 was much below the average. Similarly, in 2009, the rainfall from south-west monsoon
was again less than the normal which led to draught like situation in many districts of Bihar.
Table 3.14 Annual Rainfall for Different Seasons (2001 to 2010) (Rainfall in mm.)
Year Winter
Rain
Hot-Weather
Rain
Southwest
Monsoon
Northwest
Monsoon
Total
2000 0.40 (2.5) 101.70 (131.1) 994.10 (110.4) 10.00 ( 16.8) 1106.20
(105.1)
2001 20.90
(132.7)
86.70 (111.7) 908.20 (100.9) 192.20 (321.9) 1208.00
(114.8)
18 http://gov.bih.nic.in/Profile/climate.htm#pagetop

77
Year Winter
Rain
Hot-Weather
Rain
Southwest
Monsoon
Northwest
Monsoon
Total
2002 48.90
(310.5)
66.80 ( 86.1) 896.90 ( 99.6) 33.20 ( 55.6) 1045.80 (
99.4)
2003 19.20
(121.9)
93.00 (119.8) 767.60 ( 85.2) 128.90 (215.9) 1008.70 (
95.8)
2004 23.70
(150.5)
41.40 ( 53.4) 906.10 (100.6) 60.10 (100.7) 1031.30 (
98.0)
2005 0.10 ( 0.6) 89.50 (115.3) 777.60 ( 86.4) 30.20 ( 50.6) 897.40 ( 85.3)
2006 0.10 ( 0.6) 88.97 (114.7) 925.86 (102.8) 27.77 ( 46.5) 1042.69 (
99.1)
2007 28.34
(179.9)
76.40 ( 98.5) 1360.85 (151.1) 40.49 ( 67.8) 1506.08
(143.1)
2008 30.61
(194.3)
61.78 ( 79.6) 1084.27 (120.4) 19.31 ( 32.3) 1195.97
(113.6)
2009 0.09 ( 0.6) 98.22 (126.6) 699.17 ( 77.6) 71.13 (119.1) 868.61 ( 82.5)
2010 0.74 ( 4.7) 49.30 ( 63.5) 584.40 ( 64.9) 43.41 ( 72.7) 677.85 ( 64.4)
Average
(2000-
10)
15.75 77.60 900.45 59.70 1052.60
The monthly average rainfall and potential evapo-transpiration in re-organized Bihar is
given in the following graph:
Figure 3.3 Monthly average rainfall in Bihar
3.8.2.1 District wise rainfall
The rainfall pattern in various districts of Bihar can be seen from following table. To have a
comparative view of the extent of rainfall and variation therein, total rainfall of the district
could be compared with Bihar's average for that particular year. In 2010, only 6 out of the 38 districts reported rainfall figures which exceeded the average for Bihar. Rainfall quantities

78
for year 2010 and 2011 for selected districts are highlighted in the table. It can be seen that
out of four study districts Nawada shows lowest rainfall and Purnea shows highest rainfall.
Table 3.15 District wise Annual Rainfall in Bihar for Different Seasons (2010 and 2011)
Rainfall in mm
Districts 2010 2011 (Upto September)
Winter
Rain
Hot
Weather
Rain
South
West
Monsoon
North
West
Monsoon
Total Winter
Rain
Hot
Weather
Rain
South-
West
Monsoon
Total
Patna 0.0 58.8 490.2 24.8 573.8 0.0 58.0 616.0 674.0
Nalanda 0.0 18.1 521 59.1 598.2 0.0 57.9 836.0 893.9
Bhojpur 0.9 4.3 558.8 59.1 623.1 1.2 37.3 708.7 747.2
Buxar 0.0 7.3 534.6 37.3 579.2 1.2 47.0 787.5 835.7
Rohtas 5.1 36.5 378.0 0.0 419.6 1.6 7.0 816.5 825.1
Kaimur 6.3 32.8 660.3 13.6 713.0 4.7 12.2 807.0 823.9
Gaya 0.0 19.0 296.9 49.8 365.7 9.4 22.4 617.9 649.7
Jehanabad 0.0 20.2 460.5 61.6 542.3 4.7 48.6 970.2 1023.5
Arwal 4.3 12.2 325.1 80.2 421.8 0.0 71.5 877.3 948.8
Nawada 0.0 24.2 506.1 116.3 646.6 6.3 82.2 622.0 710.5
Aurangabad 0.6 3.6 465.4 35.9 505.5 4.6 26.9 688.9 720.4
Saran 1.1 8.0 604.8 59.1 673.0 3.9 73.5 823.0 900.4
Siwan 0.0 0.0 787.8 47.8 835.6 0.0 0.0 691.4 691.4
Gopalganj 0.0 21.0 691.5 55.0 767.5 13.4 67.1 861.5 942.0
West
Champaran
0.8 109.0 1000.7 73.4 1183.9 5.0 61.4 891.8 958.2
East
Champaran
0.0 57.5 662.6 23.2 743.3 9.9 96.5 880.7 987.1
Muzaffarpur 0.0 0.9 597.0 29.2 627.1 1.2 74.7 767.9 843.8
Sitamarhi 0.0 13.8 5743.0 54.4 5811.2 8.1 0.0 840.0 848.1
Sheohar 4.3 0.0 532.1 46.9 583.3 13.3 45.3 743.3 801.9
Vaishali 0.0 21.0 453.8 99.9 574.7 1.6 64.8 672.5 738.9
Darbhanga 0.0 42.1 441.6 8.3 492.0 9.4 112.7 676.9 799.0
Madhubani 0.0 176.3 648.9 82.7 907.9 20.2 - 728.6 748.8
Samastipur 1.0 70.5 396.3 57.7 525.5 14.3 66.5 712.4 793.2
Begusarai 0.0 72.8 385.0 41.8 499.6 0.0 67.0 723.2 790.2
Munger 0.0 31.3 596.0 23.9 651.2 0.0 56.7 548.9 605.6
Sheikhpura 0.0 78.2 620.5 93.7 792.4 4.2 65.1 610.4 679.7
Lakhisarai 0.8 47.3 685.0 35.3 768.4 0.0 119.2 750.8 870.0
Jamui 0.0 22.0 535.7 19.2 576.9 1.8 142.9 646.6 791.3
Khagaria 0.0 83.4 98.6 0.0 182.0 0.0 119.6 763.3 882.9
Bhagalpur 0.5 62.3 385.4 26.8 475.0 4.2 190.0 736.0 930.2
Banka 2.6 40.0 617.4 13.2 673.2 0.2 179.4 790.6 970.2
Saharsa 0.0 25.3 346.4 3.9 375.6 2.3 46.6 594.2 643.1
Supaul 0.0 25.3 569.1 7.9 602.3 32.0 5.8 1022.5 1060.3
Madhepura 0.0 247.7 653.2 8.7 909.6 7.8 248.3 756.9 1013
Purnea 0.0 73.6 737.2 141.3 952.1 1.8 563 925.8 1490.6
Kishanganj 0.0 156.6 1810.0 27.2 1993.8 0.0 297.3 1388.4 1685.7

79
Districts 2010 2011 (Upto September)
Araria 0.0 94.8 1096.7 1.9 1193.4 6.7 21.3 1283.1 1311.1
Katihar 0.0 56.2 480.2 29.5 565.9 0.0 181.9 774.1 956.0
Bihar 0.7 49.3 720.4 43.4 813.8 5.4 95.5 788.2 883.8
3.8.3 Agro-climatic conditions
Bihar with a geographical area of about 94,200 sq. Km. is divided by river Ganges into two
parts, the north Bihar with an area of 53,300 sq. km. and the south Bihar having an area of 40,900 sq. km. Based on soil characterization, rainfall, temperature and terrain, four main
agro-climatic zones in Bihar have been identified each with its own unique prospects. These
are:
Zone-I, North Alluvial Plain
Zone- II, North East Alluvial Plain
Zone-III A South East Alluvial Plain
Zone-III B, South West Alluvial Plain
Table 1Agro-climatic Zones
S No Agro-climatic Zone District
1. Agro- climatic zone I
(Northern West)
West Champaran, East Champaran, Siwan, Saran, Sitamarhi,
Sheohar, Muzaffarpur, Vaishali, Madhubani, Darbhanga,
Samastipur, Gopalganj, Begusarai
2. Agro-climatic Zone II
(Northern East)
Purnea, Katihar, Saharsa, Supaul, Madhepura, Khagaria, Araria,
Kishanganj.
3. Agro-climatic zone IIIA
(Southern East)
Sheikhpura, Munger, Jamui, Lakhisarai, Bhagalpur & Banka.
4. Agro-climatic zone IIIB
(Southern West)
Rohtas, Bhojpur, Buxar, Bhabhua, Arwal, Patna, Nalanda,
Nawada, Jehanabad, Aurangabad, Gaya.
3.8.3.1 Agro-Climatic Zone-I
The lands of this zone which are alluvial plains are sloppy towards the south east direction
with a very low gradient as evidenced by the direction in which the rivers flow. However,
the rivers move eastward direction along the natural levee before they finally meet the Ganga. As a result, there are vast waterlogged areas in the districts of Saran, Vaishali and
Samastipur. Due to near flatness of the landscape, vast area gets flooded during rains. The
north–eastern portion of this zone, the ‚Don hills valleys‛ is glacial hills and valleys. Except for the northern portion and portion in the west of the zone under the influence of Adhwara
system of rivers, the entire zone is under the influence of rivers like Gandak, Burhi Gandak
and Ghaghra, all of which originate in the lime rich foothills of the Himalayas. Thus, the soil under the influence of Gandak, Burhi Gandak and Ghaghra are mostly calcareous having
different amounts of lime in them. As a result the soil of nearly flat lands of East and West
Champaran and Muzaffarpur are also salt affected. The soils of the northern part not under the influence of the above rivers are neutral, acidic or saline depending on the micro–relief
and local physiography.

80
This zone has the following six broad soil association groups:
i. Sub–Himalayan and forest soils
ii. Recent alluvial tarai soils
iii. Young alluvial calcareous soils
iv. Young alluvial calcareous saline soils
v. Young alluvial non–calcareous, non-saline soils, and
vi. Recent alluvial calcareous soils
3.8.3.2 Agro-Climatic Zone-II
This zone, the alluvial plains of Kosi, Mahananda and its tributes and Ganga (a narrow strip
in the south) is slightly undulating to rolling landscape mixed with long stretches of nearly
flat landscape with pockets of areas having sub–normal relief. The area is full of streams with abandoned dead channels of Kosi river, which becomes notorious for its frequent and
sudden change of courses forming small lakes and shallow marshes. In the south, in
between the natural levees of Ganga, on the one hand and Kosi and Mahananda on the other, there are vast areas which remain waterlogged for a considerable part of the year. The
general slope of the land is towards south east and the rivers on reaching Ganga moves
eastward for a long distance before they meet river Ganga. Unlike the rivers Gandak and Ghaghra, Kosi and Mahananda originate and have catchments in Himalayan region, which
are not calcareous but rich in acidic minerals. As a result, the soils of this zone are non-
calcareous, accumulation of sodium salts and sodium adsorption has taken place in areas where the drainage is poor. Salinity and alkalinity are, however, on an increase in Saharsa
and western part of Purnea and Katihar districts. As both Kosi and Mahananda carry a
tremendous load of sediments, the soils are mostly light textured except in backwaters of river Ganga and Kosi.
Three broad soil association groups have been identified in this zone are:
1. Recent alluvial tarai soil
2. Recent alluvial non calcareous soil, and
3. Recent alluvial calcareous soil
3.8.3.3 Agro-Climatic Zone-III
This zone is the alluvial plains of river Ganga on its southern side and the sediments are
received both from river Ganga and those flowing from the south having their origins in the
Chotanagpur Plateau, which rise abruptly from the plains. The land’s slope is towards northeast with gentle slope gradient and moderate to low gradient. In the south of the
natural levee of the Ganga, there is vast stretch of backwaters known as ‚Tal‛ lands
extending from Buxar to Pirpaity, where most of the rivers and rivulets coming from the south get lost. The flood plains of Ganga, which get reworked and get eroded and deposited
at regular intervals, are lighter than ‚Tal‛ lands and are known locally as Diara lands.
The river originating from the Chotanagpur plateau brings a lot of fine sediments. The coarser sediments that they bring are either deposited in their beds or on their banks and as
a consequence, the soils are mostly medium to heavy textured throughout the depth of the
profiled. There are no marshy lands in this zone.
The main broad soil association groups recognized in this zone are:

81
Recent alluvial calcareous soils
Tal land soils, light grey, dark grey medium to heavy textured soils
Old alluvial reddish yellow, yellowish grey centenary soils
Old alluvial grey, grayish yellow, heavy texture soils with cracking nature
Recent alluvial yellowish to reddish yellow non calcareous non saline soils
Old alluvial yellowish to red yellow soils of foot hills
Old alluvial saline and saline alkali soils
3.8.4 Soils
The soil and vegetation of Bihar constitute two of its most important natural resources.
Nearly all the economic activities of the state are directly or indirectly determined by the
nature of the soil and vegetation. Thus the soil and vegetation forms the foundation of its agricultural and industrial development.
The soil covering most of Bihar is thick alluvium which shrouds the Siwalik and older
tertiary rocks. The soil is mostly fresh loam replaced every year by intermittent deposition of silt, clay and sand by different rivers. It lacks phosphoric acid, nitrogen and humus but
potash and lime are generally present in large amounts.
There are three important types of soil in Bihar19:
Piedmont Swamp Soil - found in northwestern section of west Champaran district.
Terai Soil - found in northern section of the state along Nepal border
Gangetic Alluvium - covering the Bihar plains
19 http://www.mapsofindia.com/bihar/geography-and-history/soil-and-vegetation.html

82
Figure 3.4 Soil types in Bihar
3.8.4.1 District wise soils
Four districts selected for study viz. West Champaran, Nawadah, Purnea and Begu Sarai has
different types of soils. Out of that, alluvial soil is mainly found in the districts in entire north and south Bihar plains except the mid-western portion. This soil is most suitable for
cultivation of paddy. Another type of soil called as ‘Tarai soil’ is confined to the Siwalik hills
of Champaran district. Calcarious alluvial soil containing a high content of carbonate of lime and is found in a vast patch in the mid-western portion of north Bihar plain covering parts
of Champaran district. The transported soils are generally of alluvial origin. Alluvial soils
cover the entire land mass of the north of the Ganges, except the sub-Himalayan hills and forest soils which is mostly found in the northern parts of West Champaran district. There is
a considerable area to the south of the Ganges with alluvial deposits like deposits in the
Nawadah districts. According to size of soil structures, medium and fine structures are found in Purnea district and course and fine structure soils are found in West Champaran
District. Fine & Medium structured soils are found in Nawahah and Begu Sarai districts.
3.8.5 Land use
The percentage of actually farmed land comprising of net sown area and current fallow is
above the state average in all the districts lying in north and south Bihar plain. In
Chhotanagpur plateau, all the districts have less than 55% of actual farmed land. Patna district has the highest percentage of farmed land (80.58%) while it is lowest (29.93%) in
Hazaribagh district.
Of the total reported area of the state, 12.46% is under irrigation while 15.98% area is sown more than once. The districts lying in plains have a higher proportion of irrigated land than
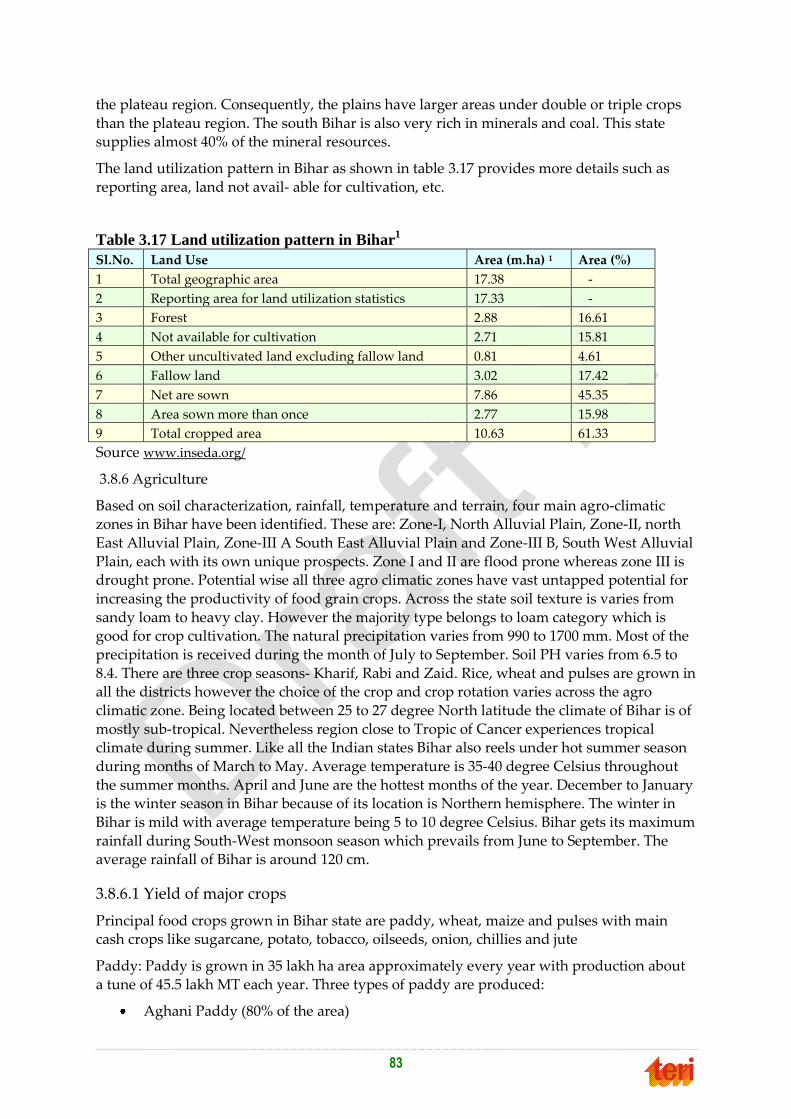
83
the plateau region. Consequently, the plains have larger areas under double or triple crops
than the plateau region. The south Bihar is also very rich in minerals and coal. This state supplies almost 40% of the mineral resources.
The land utilization pattern in Bihar as shown in table 3.17 provides more details such as
reporting area, land not avail- able for cultivation, etc.
Table 3.17 Land utilization pattern in Bihar1
Sl.No. Land Use Area (m.ha) 1 Area (%)
1 Total geographic area 17.38 -
2 Reporting area for land utilization statistics 17.33 -
3 Forest 2.88 16.61
4 Not available for cultivation 2.71 15.81
5 Other uncultivated land excluding fallow land 0.81 4.61
6 Fallow land 3.02 17.42
7 Net are sown 7.86 45.35
8 Area sown more than once 2.77 15.98
9 Total cropped area 10.63 61.33
Source www.inseda.org/
3.8.6 Agriculture
Based on soil characterization, rainfall, temperature and terrain, four main agro-climatic zones in Bihar have been identified. These are: Zone-I, North Alluvial Plain, Zone-II, north
East Alluvial Plain, Zone-III A South East Alluvial Plain and Zone-III B, South West Alluvial
Plain, each with its own unique prospects. Zone I and II are flood prone whereas zone III is drought prone. Potential wise all three agro climatic zones have vast untapped potential for
increasing the productivity of food grain crops. Across the state soil texture is varies from
sandy loam to heavy clay. However the majority type belongs to loam category which is good for crop cultivation. The natural precipitation varies from 990 to 1700 mm. Most of the
precipitation is received during the month of July to September. Soil PH varies from 6.5 to
8.4. There are three crop seasons- Kharif, Rabi and Zaid. Rice, wheat and pulses are grown in all the districts however the choice of the crop and crop rotation varies across the agro
climatic zone. Being located between 25 to 27 degree North latitude the climate of Bihar is of
mostly sub-tropical. Nevertheless region close to Tropic of Cancer experiences tropical climate during summer. Like all the Indian states Bihar also reels under hot summer season
during months of March to May. Average temperature is 35-40 degree Celsius throughout
the summer months. April and June are the hottest months of the year. December to January is the winter season in Bihar because of its location is Northern hemisphere. The winter in
Bihar is mild with average temperature being 5 to 10 degree Celsius. Bihar gets its maximum
rainfall during South-West monsoon season which prevails from June to September. The average rainfall of Bihar is around 120 cm.
3.8.6.1 Yield of major crops
Principal food crops grown in Bihar state are paddy, wheat, maize and pulses with main cash crops like sugarcane, potato, tobacco, oilseeds, onion, chillies and jute
Paddy: Paddy is grown in 35 lakh ha area approximately every year with production about
a tune of 45.5 lakh MT each year. Three types of paddy are produced:
Aghani Paddy (80% of the area)

84
Boro Paddy (2% of the area)
Summer Paddy (3% of the area)
The districts of Rohtas, Aurangabad, Bhabha, Banka and Nalanda have the highest rice
production (with productivity >2.3 tonnes/ha) while the lowest rice productivity is
seen in Shivhar (0.52 tonnes/ha), Samastipur and Muzaffarpur.
Wheat: Wheat is the second most predominant product. It is produced in about 22.5 lakh ha.
land and the yield is of a tune of 50.5 lakh ton every year. In the past two decades the
production in Bihar has increased many fold and it has attained the sixth position in the list of states producing wheat. The main wheat producing area is Ganga-Diara, Kosi basin,
Begusarai district, area falling west of river Bagmati and in the districts of Buxar, Rohtas,
Gaya, Jehanabad, Patna, Munger and Bhagalpur.
Rohtas, Gopalganj and Saran have the highest wheat production (with productivity >2.3
tonnes/ha) while the lowest wheat productivity is seen in Araria (0.7 tonnes/ha), Katihar and
Kishanganj.
Maize: Maize is the third main crop of Bihar and is sown in 8% of the cultivable area. It is
mainly grown in the area Southwest of Burhi Gandak River and in the districts of Saran,
Gopalganj, Siwan, Samastipur and Purbi and Pashcim Champaran. Approximately 18 lakh MT is produced every year.
The production of maize is the highest in Khagaria, Samastipur and Purnea (with
productivity >3.5 tonnes/ha) while Jamui, Buxar and East Champaran have the lowest productivity of this crop.
Barley: Barley is grown in almost similar ground situation as that of maize. It is sown as
mixed crop. Purbi and Paschim Champaran are the lead districts in its production.
Marua (Ragi): It is grown in the less fertile sandy soil and needs little water that is why its
seed is sown in the month of June and transplanted after rainfall. It is the main food of
labour and down trodden class of population. It is grown in the districts of Saharsa, Supaul, Madhepura and Darbhanga, etc.
Pulses: About 6-10 lakh ha land is used for growing such type of crops. The annual
production is of to a tune of 5-9 lakh MT.
Main Cash Crops: It includes Sugarcane, Tabacco, Potato, Jute and Chilli. Sugarcane is
grown in alluvial soil having lime as main ingredient. It is noted that area lying east of
Bagmati is not suitable for sugarcane cultivation. Broadly, it is the area lying Northeast of Bagmati river which is considered most suitable for sugarcane cultivation. Tabacco is grown
in 14000 ha land and the production is of a tune of 17000 ton every year. It is grown mainly
on the margin of river banks almost extending from Gandak river in the west to eastern boarder of Bihar. Potato is the main cash crop and is grown almost in every districts.
Nalanda district is considered as the leading producer of Potato. Jute is produced in the high
rainfall and humid area of Bihar. It is grown at the margin of water bodies where pure water is vailable for washing. It is mainly grown in the districts of Purnea, Kishanganj, Katihar
Saharsa, etc. Chilli is a product grown throughout the year in about 75,000 ha land.
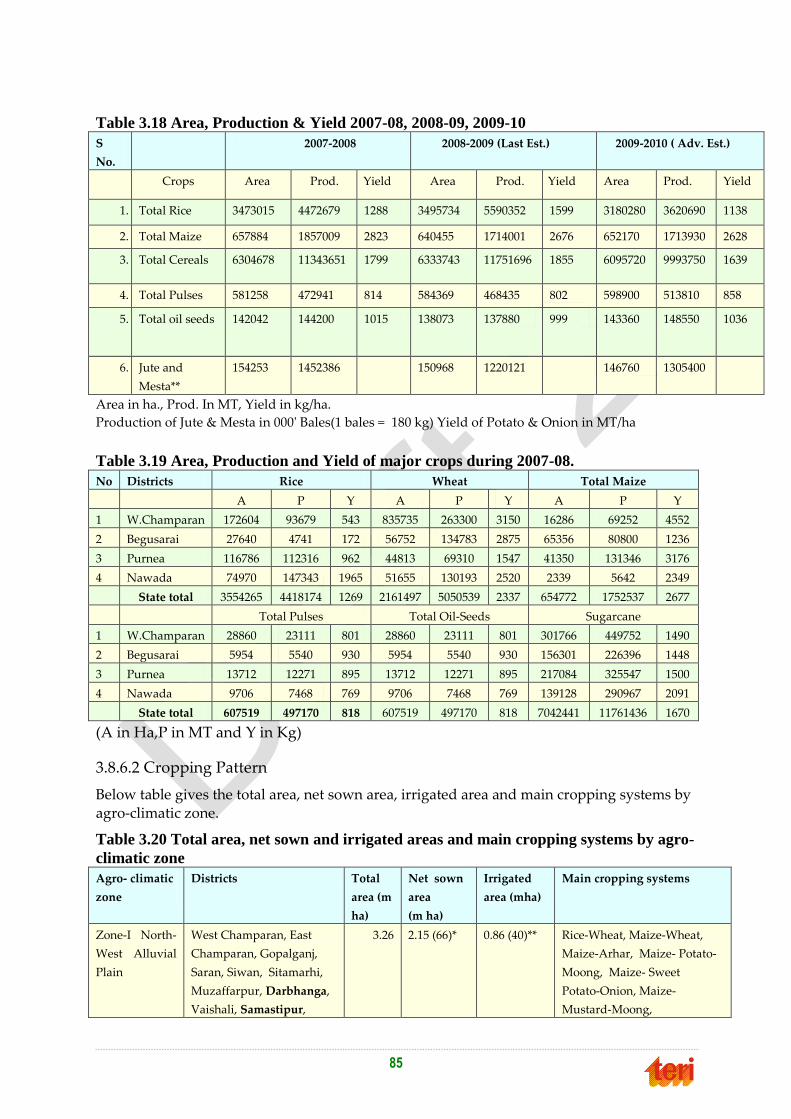
85
Table 3.18 Area, Production & Yield 2007-08, 2008-09, 2009-10
S
No.
2007-2008 2008-2009 (Last Est.) 2009-2010 ( Adv. Est.)
Crops Area Prod. Yield Area Prod. Yield Area Prod. Yield
1. 1 Total Rice 3473015 4472679 1288 3495734 5590352 1599 3180280 3620690 1138
2. 2 Total Maize 657884 1857009 2823 640455 1714001 2676 652170 1713930 2628
3. 3 Total Cereals 6304678 11343651 1799 6333743 11751696 1855 6095720 9993750 1639
4. 6 Total Pulses 581258 472941 814 584369 468435 802 598900 513810 858
5. 8 Total oil seeds 142042 144200 1015 138073 137880 999 143360 148550 1036
6. 9 Jute and
Mesta**
154253 1452386 150968 1220121 146760 1305400
Area in ha., Prod. In MT, Yield in kg/ha. Production of Jute & Mesta in 000' Bales(1 bales = 180 kg) Yield of Potato & Onion in MT/ha Table 3.19 Area, Production and Yield of major crops during 2007-08.
No Districts Rice Wheat Total Maize
A P Y A P Y A P Y
1 W.Champaran 172604 93679 543 835735 263300 3150 16286 69252 4552
2 Begusarai 27640 4741 172 56752 134783 2875 65356 80800 1236
3 Purnea 116786 112316 962 44813 69310 1547 41350 131346 3176
4 Nawada 74970 147343 1965 51655 130193 2520 2339 5642 2349
State total 3554265 4418174 1269 2161497 5050539 2337 654772 1752537 2677
Total Pulses Total Oil-Seeds Sugarcane
1 W.Champaran 28860 23111 801 28860 23111 801 301766 449752 1490
2 Begusarai 5954 5540 930 5954 5540 930 156301 226396 1448
3 Purnea 13712 12271 895 13712 12271 895 217084 325547 1500
4 Nawada 9706 7468 769 9706 7468 769 139128 290967 2091
State total 607519 497170 818 607519 497170 818 7042441 11761436 1670
(A in Ha,P in MT and Y in Kg)
3.8.6.2 Cropping Pattern
Below table gives the total area, net sown area, irrigated area and main cropping systems by agro-climatic zone.
Table 3.20 Total area, net sown and irrigated areas and main cropping systems by agro-
climatic zone
Agro- climatic
zone
Districts Total
area (m
ha)
Net sown
area
(m ha)
Irrigated
area (mha)
Main cropping systems
Zone-I North-
West Alluvial
Plain
West Champaran, East
Champaran, Gopalganj,
Saran, Siwan, Sitamarhi,
Muzaffarpur, Darbhanga,
Vaishali, Samastipur,
3.26 2.15 (66)* 0.86 (40)** Rice-Wheat, Maize-Wheat,
Maize-Arhar, Maize- Potato-
Moong, Maize- Sweet
Potato-Onion, Maize-
Mustard-Moong,

86
Agro- climatic
zone
Districts Total
area (m
ha)
Net sown
area
(m ha)
Irrigated
area (mha)
Main cropping systems
Sheohar, Madhubani
Zone-II
(North-East
Alluvial plain)
Purnea, Katihar,
Madhepura, Saharsa,
Araria, Akishanganj,
Supaul, Khagaria,
Begusarai
2.08 1.21 (58)* 0.24 (20)** Jute-Rice, Jute-Wheat, Jute-
Rice-Wheat, Jute- Potato, Jute-
Kalai-Wheat, Jute-Mustard,
Jute-Pea, Rice-Wheat-Moong
Zone-IIIA
(South Bihar
Alluvial plain
(East)
Banka, Munger, Jamui,
Lakhisarai, Shekhpura,
Bhagalpur
1.11 0.49 (44)* 0.21 (43)** Rice-Wheat, Rice-Wheat-
Moong, Rice-Gram-Rice, Rice-
Potato-Onion, Rice- Mustard-
Moong, Rice- Berseem
Zone-IIIB
(South Bihar
Alluvial plain
(West)
Patna, Gaya, Jahanabad,
Nawada, Nalanda, Rohtas,
Bhojpur, Aurangabad,
Buxar, Kaimur.
2.92 1.68 (58)* 1.37 (81)** Rice-Wheat-Moong, Rice-
Wheat-Rice, Rice-Gram- Rice,
Rice-Gram-Moong
Total 9.37 5.53 (59)* 2.68 (48)**
* Figures in parenthesis are % of geographical area.
*** Figures in parenthesis are % of net area sown.
Figure 3.5 Agricultural practices and distribution of major crops in Bihar20
20 ibid

87
3.8.6.3 Horticulture
Bihar ranks 8th with respect to the area (11.21 lakh ha) and 5th with respect to the production (173.35 lakh MT) of horticultural crops in the country. Major fruits grown in the
state are Mango, Litchi, Guava, Pineapple, Banana, Aonla, Bel and Makhana. The prime fruit
growing districts are Muzaffarpur, Vaishali, Samastipur, Bhagalpur, Banka, Darbhanga, Munger, Jamui, Gaya, Aurangabad, Nalanda, Patna, West Champaran, East
Champaran, Kishangaj, Purnea, Araria, Katihar and Khagaria. The major vegetables
grown on commercial scale in the state are Cauliflower, Potato, Okra, Brinjal, Onion, Chillies, Cabbage, Gourds, Peas, Cowpea and Melon.
Bihar has a net irrigated area of 34.61 lakh ha (61% of the net sown area of 56.65 lakh ha). Of
the net irrigated area, 64% is irrigated by tubewells and 27% is irrigated by canals. Irrigation by tanks is less than 5%. The districts with the highest dependence on tubewells for
irrigation (100%) are East Champaran, Samastipur, Madhubani, Araria, Kishenganj
and Sivhar. Rohtas, Darbhanga and Bhojpur have less than 30% of their net irrigated area irrigated by tubewells. Canals account for more than 90% of the net irrigated area in Rohtas
and for more than 70% area in Bhojpur.
Area and Production of horticultural crops for years 2005-06, 2006-07, 2007-08 and 2008-09 is given the table below:
Table 3.21 Area and Production of horticultural crops (Area – '000ha, Production –
'000MT.)
S.
No.
Particular
s
2005-06 2006-07 2007-08 2008-09
Are
a
Prodn. Area Prod
n.
Area Prod
n.
Area Prodn.
1. Fruits 276.44 3068.42 279.41 3426.48 286.24 3252.37 291.50 3853.88
2. Vegetables 498.52 7656.43 501.31 7866.62 508.24 8048.09 519.12 8329.02
3. Spices NA NA 11.10 12.30 12.25 14.10 12.75 14.98
4. Flowers NA NA 0.297 NA 0.325 NA 0.337 NA
5. Aromatic
Plants
NA NA 2.10 NA 2.45 NA 2.60 NA
3.8.6.4 Fertilizer and pesticides
The use of nitrogenous fertilizers in Bihar is much higher as compared to the national
average. The national averages for N, P and K stand at 77.9, 33.69 and 17.1 kg/ha.
respectively, while that of Bihar are 123.77, 33.37 and 21.83 kg/ha, respectively. In the year 2009-10, the consumption of N, P, K fertilizers was 8.94, 2.47 and 1.67 MT respectively
making the N : P : K ratio 8.04:1.98:1 (the optimum nutrient ratio recommended for Indian
soils is 4:2:1). The consumption of chemical pesticides in Bihar in 2006-07 was 890 MT and in the previous year it was 875 MT. Fertilizer in proper quantity is also very important for
enhancement of agricultural productivity. The consumption of fertilizer is steadily
increasing in the recent years (Table Below). This rising trend emphasises that the farmers are willing to adopt new technology in agriculture. The per hectare consumption went up to
183.4 kg/hectares in 2010-11 from a level of 181.1 kg/hectare in 2009-10.

88
Table 3.22 Fertilizer application in Bihar
Type of Fertilizer 2009-10 2010-11
Kharif Rabi Total Kharif Rabi Total
Urea 759.10 942.00 1701.10 664.40 1026.80 1691.21
DAP 152.96 244.11 397.07 225.76 233.60 459.37
SSP 3.82 3.71 7.53 20.35 2.79 23.14
MOP 56.74 169.35 226.09 55.98 141.40 197.38
Complex 105.70 161.59 267.29 130.08 182.09 312.17
Total (NPK) 537.05 772.88 1309.93 553.24 799.11 1352.35
N 391.92 502.53 894.45 366.23 541.67 907.91
P 96.41 151.19 247.60 138.26 150.67 288.93
K 48.72 119.16 167.88 48.75 106.77 155.51
Grand Total 1614.45 2293.64 3908.09 1649.81 2385.79 4035.60
Ferti. Consum (kg/ha.) 180.8 181.3 181.1 177.8 187.4 183.4
There is a trend towards a balanced use of fertilizer in last two years.
3.8.6.5 Livestock
Bihar has 5.6% of Cattle, 5.9% of buffaloes, and 7.7% of the goat population of the country.
About 35% of rural households in Bihar own cattle, 20 percent own buffalo, and 15 percent own sheep and goats. Of all rural households owning cattle and/or buffalo in Bihar, more
than three- quarters are either landless or have less than 1 ha of land. Sheep and goats tend
to be even more concentrated among landless and marginal rural households. The zone wise livestock population is given in the table below.
Table 3.23 Livestock population in India and Bihar21
21 Livestock census 2003
Population in Lakhs % of Bihar to
India Cattle India Bihar
Milch Cattle 1852 105 5.6
Buffaloes 979 58 5.9
Sheep 615 3.5 0.56
Goats 1244 96 7.7
Pigs 135 6 4.4
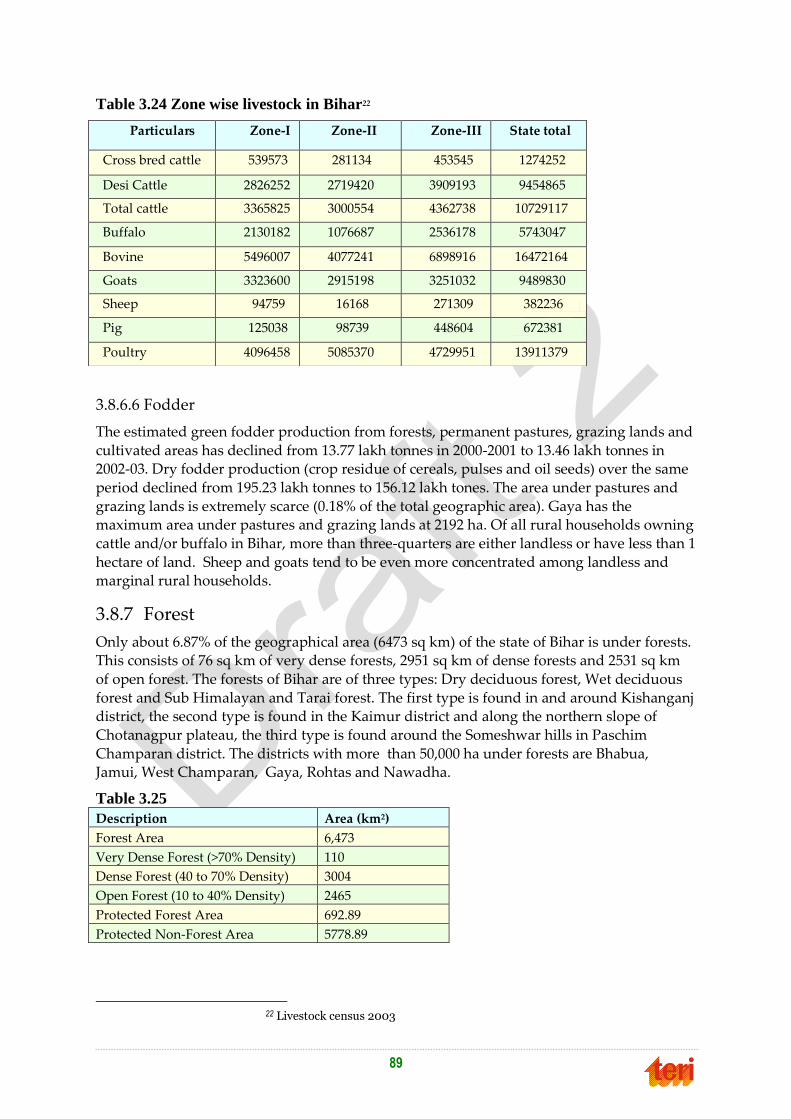
89
Table 3.24 Zone wise livestock in Bihar22
3.8.6.6 Fodder
The estimated green fodder production from forests, permanent pastures, grazing lands and
cultivated areas has declined from 13.77 lakh tonnes in 2000-2001 to 13.46 lakh tonnes in 2002-03. Dry fodder production (crop residue of cereals, pulses and oil seeds) over the same
period declined from 195.23 lakh tonnes to 156.12 lakh tones. The area under pastures and
grazing lands is extremely scarce (0.18% of the total geographic area). Gaya has the maximum area under pastures and grazing lands at 2192 ha. Of all rural households owning
cattle and/or buffalo in Bihar, more than three-quarters are either landless or have less than 1
hectare of land. Sheep and goats tend to be even more concentrated among landless and marginal rural households.
3.8.7 Forest
Only about 6.87% of the geographical area (6473 sq km) of the state of Bihar is under forests. This consists of 76 sq km of very dense forests, 2951 sq km of dense forests and 2531 sq km
of open forest. The forests of Bihar are of three types: Dry deciduous forest, Wet deciduous
forest and Sub Himalayan and Tarai forest. The first type is found in and around Kishanganj district, the second type is found in the Kaimur district and along the northern slope of
Chotanagpur plateau, the third type is found around the Someshwar hills in Paschim
Champaran district. The districts with more than 50,000 ha under forests are Bhabua, Jamui, West Champaran, Gaya, Rohtas and Nawadha.
Table 3.25
Description Area (km2)
Forest Area 6,473
Very Dense Forest (>70% Density) 110
Dense Forest (40 to 70% Density) 3004
Open Forest (10 to 40% Density) 2465
Protected Forest Area 692.89
Protected Non-Forest Area 5778.89
22 Livestock census 2003
Particulars Zone-I Zone-II Zone-III State total
Cross bred cattle 539573 281134 453545 1274252
Desi Cattle 2826252 2719420 3909193 9454865
Total cattle 3365825 3000554 4362738 10729117
Buffalo 2130182 1076687 2536178 5743047
Bovine 5496007 4077241 6898916 16472164
Goats 3323600 2915198 3251032 9489830
Sheep 94759 16168 271309 382236
Pig 125038 98739 448604 672381
Poultry 4096458 5085370 4729951 13911379

90
Figure 3.6 India vs Bihar forest area, forest cover and trees
Only about 6.87% of the geographical area (6473 sq km) of the state of Bihar is under forests
as compared to 23.6% of India. Afforestation and reforestation activities need focused efforts and long term planning
3.8.7.1 District wise forest
Following table shows the districtwise forest cover in Bihar state. This table will be helpful for concentrating efforts of Afforestation and reforestation activities. Table also shows area
under forest cover (Bold figures) for selected four districts for sample survey. Amongst the
four districts selected for study, two districts (Nawada & West Champaran) have highest forest cover and other two districts (Begusarai and Purnea) have lowest forest cover in the
state.
Table 3.26 District wise area under different types of forest cover
District Geographical
Area
Very
Dense
Forest
(>70%
Density)
Dense
Forest
(40 to
70%
Density)
Open
Forest
(10 to
40%
Density)
Total
Forest
Area
% of
total
Geo.
Area
Araria 2,830 0 16 74 90 3.18
Aurangabad 3,305 0 54 97 151 4.57
Banka 3,022 0 111 110 221 7.31
Begusarai 1,918 0 20 23 43 2.24
Bhabua 3,381 0 555 507 1062 31.41
Bhagalpur 2,567 0 29 13 42 1.64
Bhojpur 2,390 0 16 3 19 0.79
Buxar 1,708 0 2 1 3 0.18
Darbhanga 2,279 0 41 144 185 8.12
Gaya 4,976 0 124 506 630 12.66
Goplaganj 2,033 0 2 2 4 0.20
Jamui 3,107 0 383 249 632 20.34
Jehanabad 1,569 0 2 1 3 0.19
Katihar 3,057 0 18 44 62 2.03

91
District Geographical
Area
Very
Dense
Forest
(>70%
Density)
Dense
Forest
(40 to
70%
Density)
Open
Forest
(10 to
40%
Density)
Total
Forest
Area
% of
total
Geo.
Area
Khagaria 1,486 0 2 6 8 0.54
Kishanganj 1,884 0 26 49 75 3.98
Lakhisarai 1,356 0 180 14 194 14.31
Madhepura 1,788 0 6 20 26 1.45
Madhubani 3,501 0 18 118 136 3.88
Munger 1,347 0 251 14 265 19.67
Muzaffarpur 3,172 0 82 74 156 4.92
Nalanda 2,367 0 5 23 28 1.18
Nawada 2,494 0 187 323 510 20.45
Paschimi
Champaran
5,228 231 520 162 913 17.46
Patna 3,202 0 13 3 16 0.50
Purbi Champaran 3,968 0 76 88 164 4.13
Purnea 3,229 0 6 41 47 1.46
Rohtas 3,832 0 321 385 706 18.42
Saharsa 1,680 0 2 9 11 0.65
Samastipur 2,904 0 39 18 57 1.96
Saran 2,641 0 38 17 55 2.08
Sheikhpura 612 0 0 0 0 0.00
Sheohar 572 0 2 17 19 3.32
Sitamarhi 2,071 0 18 64 82 3.96
Siwan 2,219 0 1 1 2 0.09
Sapaul 2,432 0 8 93 101 4.15
Vaishali 2,036 0 74 12 86 4.22
Total 94,163 231 3,248 3,325 6,804 7.23
3.8.8 Industry
There are 1674 factories registered in Bihar with 1438 of them in operation. These factories
together put up a productive capital of Rs. 14,195 crores. These factories employ about 62,000 persons. While this data is as per annual survey of industries 2004-05, the situation is
fast changing with several industrial and corporate houses choosing Bihar as their
destination. The recent investment meet conducted during February 2012 at Patna was promising with several proposals made for investment. Bihar has emerged as brewery hub
with major domestic and foreign firms setting up production units in the state. Three major
firms, United Breweries Group, Danish Brewery Company Carlsberg Group and Cobra Beer, are to set up new units in Patna and Muzaffarpur during 2012.
Table 3.27 Annual Survey of Industries, Bihar
Sl.
No.
Item Year
2001-02 2002-03 2003-04 2004-05
1 No. of registered factories 1478 1403 1460 1674
2 No. of factories in operation 1319 1229 1224 1438

92
Sl.
No.
Item Year
3 Productive Capital (lakh Rs.) 822846 1160587 1172082 1419499
4 Number of persons employed 62618 54184 57404 61775
5 Ex-factory value of output (Gross) (Lakh Rs.) 671339 807680 887711 122169
6 Value added by manufacturer (Lakh Rs.) 77401 105921 80945 115415
Source: Annual Survey of Industries, CSO, Industrial Statistics Wing
The outturn of selected mineral in Bihar for the years 2003-04 to 2006-07 is given in below
table:
Table 3.28 Out Turn of Selected Minerals in Bihar (in M. Tonnes)
S. No. Minerals 2002-03 2003-04 2004-05 2005-06 2006-07
1 Limestones
('000)
448.00 241.00 244.00 313.00 436.00
2 Mica Crude 11.00 3.00 3.00 - -
3 Quartzite 1265.00 7942.00 12987.00 17061.00 30850.00
4 Steatite 260.00 1265.00 846.00 1466.00 1633.00
5 Quartzite - 1150.00 - 910.00 -
Source: (I) Indian Bureau of Mines Nagpur
(ii) Directorate of Economics & Statistics, Bihar, Patna
3.8.9 Biodiversity
Erstwhile Bihar, lying close to the foot hills of Nepal and covering an area of 1,73,877 sq km,
harbours a very rich and diverse flora. Its unique phytogeographical position, topography
and good precipitation are some of the important factors which are mainly responsible for high degree of plant diversity. The occurrence of different types of forests, ranging from
subtropical to tropical and consequently the establishment of three National Parks and
twenty Wildlife sanctuaries in the state, which constitute an important source of germplasm, are of considerable interest. Although the state has been botanically surveyed since 1848 and
the Flora was published during 1921-1925 which included Bihar, Orissa and parts of West
Bengal, but the complete Flora of Bihar itself is not in hand. Simultaneously, the natural vegetation since Haines’ publication has been continuously and increasingly under pressure
owing to developmental projects including mining activities and non-judicious exploitation
of plant resources. These reasons coupled with the publication of a number of new plant records for the state warrant the need of fresh estimation of current status of floristic account
of the state.
The jungles of Bihar abound in wildlife, though some of the notable game animals and birds like tiger, deer, buffalo, duck etc., are fast disappearing. In order to prevent the extinction of
any species and to preserve them and maintain their balance with nature, thirteen wildlife
sanctuaries have been set up. Three sanctuaries are in northern fringe of west Champaran district. As a result of strict management and proper protection given to wildlife, the present
form has become much richer than the past and the difficult task of wildlife resusciation and
conservation has been greatly acheived, so that some of the rare animals on the verge of extinction, such as elephant, gaur, etc., have considerably multiplied. Following table shows
information on different wild life sanctuaries and national parks and biological parks in
Bihar showing rich biodiversity.

93
Table 3.29 Wild Life Sanctuaries and National Parks and Biological Parks in Bihar
No Name District/Loc
ation
Area Est.
Year
Major Wild Animals/ Birds/Specialty
NATIONAL PARKS
1 Valmiki
National Park
West
Champaran
district
335.60 sq.
km
1989 The main fauna: Tiger, Leopard, Fishing Cat, Chital,
Sambar, Hog Deer, Black Buck, Gaur, Sloth Bear,
Langur and Rhesus Monkey,
The main flora: Sal (Shorea robusta), Asan, Karama,
Semal, Khair, Cane (Calamus tenuis), Jamun,
Siccharrum, and Teak etc.
Historical temples: Valmiki Ashram, Jatashankar
Temple, Nardevi Temple and Kaleshwar Temple
Archaeologically rich places: Lauriya Nandan Garh
and Someshwar Fort
Triveni Sangam: Naraini, Sohna and Pachnad- merge
here, to form Gandak
WILD LIFE SANCTUARIES
1 Valmiki
Sanctuary
West
Champaran
district
544.67 sq.
km
As above
2 Bhimbandh
Sanctuary
South West
of Munger
District
681.99 sq.
km
1976 Animals: Tiger, Leopards, Sloth Bear, Nilgai,
Sambhar, Barking deer, Wild Beer, four horned
Antelope
Vegetation: Sal, Kend, Semal
Several hot springs of which the finest are at
Bhimbandh, Sita Kund and Rishi Kund maximum
temperature (52° C to 65° C) and discharge (0.84-1.12
cum/sec) best area for the exploration of geothermal
energy potential
3 Rajgir
Sanctuary
Nalanda
District
35.84
Sq. Km
1978 Wildlife: Leopard, Hyena, Barking Deer, Nilgai And
Wild Bear Etc.
The Birds: Peafowl, Jungle Fowl, Partridge, Black
And Grey Quails, Hornbill, Parrot, Dove, Myna Etc.
Bamboo Park (Venuvana)
Deer Park With Cheetals, Nilgais And Sambhars
Hot Water Springs With Sulphur Content
4 Kaimur
Sanctuary
District of
Kaimur
under DFO
Shahabad
Division
1342
sq.km
1979 Animals: Black bucks, Nilgai, Chinkara, Tiger,
Leopard, Hyena, Wild boar, sloth bear
Other important tourist places: Mausoleum of Sher
Shah at Sasaram, Dhuan Kund (a natural water fall),
Karkat Gadh etc.
5 Gautam
Buddha
Sanctuary
20 km from
Gaya and
60 km from
Bodh Gaya
259 sq.km 1971 Wild Life: Tigers, Leopards, Hyenas, Sloth Bear,
Wolf, Wild Dog, Wild Boar, Sambhar, Spotted Deer
and Nilgai
6 Udayapur
Sanctuary
District of
West
Champaran
about 15 km
8.87
sq.km
1978 Spotted Deer, Barking Deer, Wild Boar, Nilgai, Wolf,
Jungle Cat etc.

94
No Name District/Loc
ation
Area Est.
Year
Major Wild Animals/ Birds/Specialty
from
Bettiah
7 Kabar Jheel
Bird Sanctuary
Located 22
km north
west of
District
Begusarai
63.11
sq.km
1989 This Lake is formed through the meander of River
Burhi Gandak that supports about 59 types of
migratory birds and 106 residential species as well
as 31 species of fishes.
8 Vikramshila
Gangetic
Dolphin
Sanctuary
Located in
Bhagalpur
District,
50 km
stretch of
the Ganga
River
from
Sultanganj
to
Kahalgaon
1990 Major attractions: Gangetic Dolphins (known as
Soons by Locals) which are classified as Endangered
on the 2006 IUCN Red List of Threatened Species and
included in Schedule-I of the Indian Wildlife
Protection Act, 1972. Threatened aquatic wildlife:
The Indian smooth-coated Otter (Lutrogale
perspicillata), Gharial (Gavialis gangeticus), Variety of
freshwater turtles, and 135 species of waterfowls
9 Barela Salim
Ali Zubba
saheni
1.96 sq.
km
1997
10 Nagi Dam Bird
Sanctuary
Jamui
district
7.91 sq.
km
1987 Bar-headed Goose (Anser indicus), Many waterbirds
atleast 20,000.00 individuals.
11 Nakti Dam
Bird Sanctuary
Jamui
district
3.33 sq.
km
1987 Leopard, jungle cat, Chinkara, Cheetal
12 Kusheshwar
Sthan WLS
Darbhanga 19.17 sq.
km
1994
13 Gogabil Bird
Sanctuary
Situated at a
distance of
26 km from
Katihar
217.99 sq.
km
By virtue of its global, national and regional
significance the State Government has declared
Gogabil Bird Sanctuary as a closed area. This wetland
is rich in aquatic flora and fauna and is a fascinating
wintering ground for the migratory birds.
BIOLOGICAL PARK
1 Sanjay Gandhi
Biological Park
(Protected
Forest)
Patna 152.95 ha 1983 The Botanical part of the park has more than 300
species of trees, herbs and shrubs. It has a nursery of
medicinal plants, an orchid house, a fern house, a
glass house, a rose garden and a number of grass
lawns.
The zoo has almost 100 species of animals. These
include tiger, lion, leopard, rhinoceros,
hippopotamus, Himalayan bear, lion tailed macaque,
golden cat, leopard cat, hog deer, giraffe, zebra,
crocodile, cassowary, emu, white peacock, etc. There
are almost 1200 animals in the zoo.
This park has an aquarium and a snake house which
contain 35 species of fish and 68 snakes belonging to 7
species.

95
Source: Bihar state tourism website at http://bstdc.bih.nic.in/WildLife.htm Last assessed on
04-03-2013 http://forest.bih.nic.in/Docs/Sanctuary.pdf BirdLife International (2013) Important Bird Areas factsheet: Nagi Dam and Nakti Dam Bird Sanctuary. Downloaded
from http://www.birdlife.org on 05/03/2013
NPs (No. 1 & Area 335.65); WLSs (No. 12 & Area 2,856.06); PAs (No. 13 & Area 3,191.71)
3.8.9.1 Ecologically sensitive areas
The state of Bihar is well endowed with natural vegetation and wildlife. The recorded forest
area (as compared to total geographical area) is 6.87%. There are currently 11 sanctuaries, 1 national park and a total of 3,208.47 km2 of protected forest area.23 Details of protected
areas of the state are shown in the table below:
Table 3.30 Names and locations of protected areas in Bihar24
Nr. Name of Park/Sanctuary District Type
1 Barela SAZS Sanctuary Vaishali Sanctuary
2 Bhimbandh Sanctuary Monghyr Sanctuary
3 Gogabil Pakshi Vihar Katihar Closed Area
4 Gautambuddha Sanctuary Gaya Sanctuary
5 Kaimur Sanctuary Rohtas Sanctuary
6 Kanwar Jheel Bird Sanctuary Begusarai Sanctuary
7 Kusheshwarsthan Darbhanga Closed Area
8 Nagi Dam Bird Sanctuary Jamui Sanctuary
9 Nakti Dam Bird Sanctuary Jamui Sanctuary
10 Rajgir Sanctuary Nalanda Sanctuary
11 Sanjay Gandhi Botanical Garden Patna Botanical Garden
12 Udaypur Sanctuary West Champaran Sanctuary
13 Valmiki National Park West Champaran National Park
14 Valmiki Sanctuary West Champaran Sanctuary
15 Vikramshila Gangetic Dolphin Bhagalpur Sanctuary
Major attention is required for conservation and development of following species found in
above protected areas :
Gangetic Dolphins (known as Soons by Locals) which are classified as Endangered on the 2006 IUCN Red List of Threatened Species and included in Schedule-I of the Indian Wildlife
Protection Act, 1972.
Threatened aquatic wildlife like The Indian smooth-coated Otter (Lutrogale perspicillata), Gharial (Gavialis gangeticus) and variety of freshwater turtles
Besides this, following table shows extent of forest cover in Ganga basin. Aquatic and
wildlife living in this area is completely dependent on the water condition in the Ganga river. Hence these areas are ecologically sensitive areas.
23 Environment and Forest Department, Government of Bihar <http://forest.bih.nic.in/> 24 Government of Bihar, ibid

96
Table 3.31 Extent of Forest Cover in Ganges Basin
Catchment area Dense
Forest Open
Forest Mangrove Total Scrub Non-
Forest Grand Total
Ganga Basin 63,011 47,682 2,119 1,12,812 9,898 7,28,965 8,51,675 Percentage of
Basin Area 7.40 5.60 0.25 13.25 1.16 85.60 100.00
Following three self-explanatory table shows environmentally sensitive flood prone areas, polluted river stretches and water quality problem habitations and need no explanation
about their sensitivity or the importance.
Table 3.32 showing environmentally sensitive flood prone areas25
Name of Basin Area Flood Prone Area (Sq.Km)
Ganga 19322 12920
Kosi 11410 10150
Burhi Gandak 9601 8210
Kiul Harohar 17225 6340
Punpun 9026 6130
Mahananda 6150 5150
Sone 15820 3700
Bagmati 6500 4440
Kamla Balan 4488 3700
Gandak 4188 3350
Ghaghra 2995 2530
Chandan 4093 1130
Badua 2215 1050
Table 3.33Polluted River stretches (Real time monitoring stations on Polluted Water
Stretches of Ganga River)
No Site Lattitude Longitude Comment
Bh1 Nalla at Buxar 2 SH13 25.570250° 83.969297° Impact
Bh2 Nalla at Buxar 1 25.582733° 83.986031° Impact
Bh3 Bridge at Buxar (on Ganga) 25.592294° 83.984608° Baseline – Ganga into
Bihar
Bh4 Bridge on Ghagra near
Manjhi
25.822952° 84.579596° Impact
Bh5 Bridge near Danapur Patna
2
25.655633° 85.047408° Baseline Patna
Bh6 Nalla in Danapur Patna 1 25.637375° 85.044508° Impact
Bh7 Nalla in Patna 2 25.647414° 85.080067° Impact
Bh8 Bridge near Hajipur in
Tributary
25.692678° 85.194731° Impact
Bh9 Rajapul Nalla 25.623461° 85.140108° Impact
Bh10 Nalla in Patna 3a 25.641686° 85.105233° Impact to Rajapur
Nallah
25 (Source: http://wrd.bih.nic.in/, viewed on: 4.3.2013)
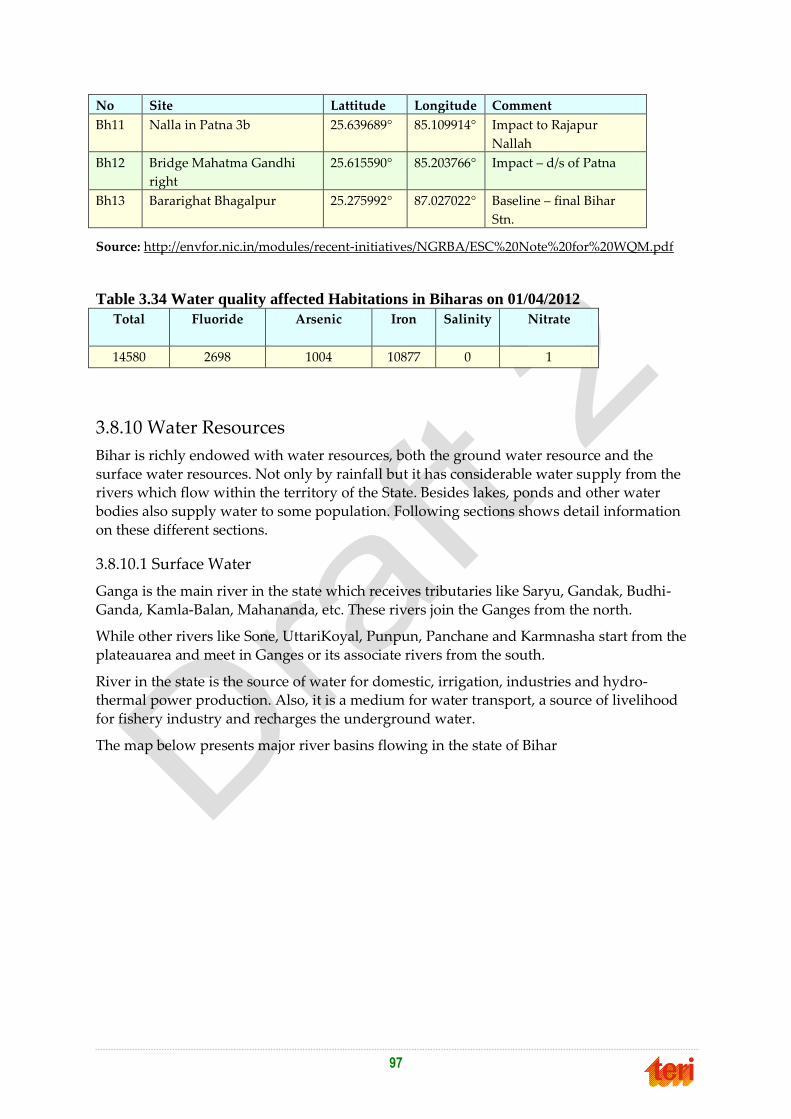
97
No Site Lattitude Longitude Comment
Bh11 Nalla in Patna 3b 25.639689° 85.109914° Impact to Rajapur
Nallah
Bh12 Bridge Mahatma Gandhi
right
25.615590° 85.203766° Impact – d/s of Patna
Bh13 Bararighat Bhagalpur 25.275992° 87.027022° Baseline – final Bihar
Stn.
Source: http://envfor.nic.in/modules/recent-initiatives/NGRBA/ESC%20Note%20for%20WQM.pdf
Table 3.34 Water quality affected Habitations in Biharas on 01/04/2012
Total
Fluoride Arsenic Iron Salinity Nitrate
14580 2698 1004 10877 0 1
3.8.10 Water Resources
Bihar is richly endowed with water resources, both the ground water resource and the
surface water resources. Not only by rainfall but it has considerable water supply from the rivers which flow within the territory of the State. Besides lakes, ponds and other water
bodies also supply water to some population. Following sections shows detail information
on these different sections.
3.8.10.1 Surface Water
Ganga is the main river in the state which receives tributaries like Saryu, Gandak, Budhi-
Ganda, Kamla-Balan, Mahananda, etc. These rivers join the Ganges from the north.
While other rivers like Sone, UttariKoyal, Punpun, Panchane and Karmnasha start from the
plateauarea and meet in Ganges or its associate rivers from the south.
River in the state is the source of water for domestic, irrigation, industries and hydro-thermal power production. Also, it is a medium for water transport, a source of livelihood
for fishery industry and recharges the underground water.
The map below presents major river basins flowing in the state of Bihar

98
Figure 3.7 Major river basins flowing in the state of Bihar
The Ganges in Bihar
Ganga is the major river basin of the state. It has the maximum catchment area and length of flow in the state. River Ganga is a snow fed and has its source at Gaumakh in the southern
Himalayan Glaciers on the Indian side of the Tibetan border. It crosses few cities in Uttar
Pradesh and enters in the boundary of Bihar at Chausa, near Buxar after its confluence with Karmanasa. It is joined by the three great effluents - the Ghaghra, the Gandak, and the Son
and their tributaries in Patna district. Further Punpun joins it at Fatuha in Patna district;
Koshi joins it at Khagaria district while the Harohar and the Kiul join it near Surajgarha, Distrct - Lakhisarai. It passes through the cities& towns like Patna, Barh, Mokama,
Begusarai, Munger, Khagaria, Bhagalpur, Kahalgaon, Pirpainti, in Bihar and exit to
Sahebganj in Jharkhand and then to West Bengal.
Tributaries of Ganga River in Bihar
GHAGHARA
Ghaghara is a perennial trans-boundary river, originating from the Tibetan Plateau near Lake Mansarovar in Nepal. It is a major left bank and largest tributary of the Ganges. After
meeting with tributaries in Uttar Pradesh it enters into Bihar near Guthani of Siwan district
and joins Ganga at Revilganj (Chapra) in district Saran. It carries more water than the Ganges before its confluence. Towns of Ghaghra River catchment area are Siwan, Saran
(Chapra) and Sonepur in Bihar.
GANDAK
The Gandak river originates from melting of snow, glaciers and from lakes of Himalayan
streams in Nepal and its border with Tibet, which contribute substantially to the lean season
flows of the river. It enters into Bihar at the Indo-Nepal border Triveni (in Nepal) and

99
Valmikinagar in Baghasub division of District-West Champaran, Bihar. The Gandak flows
through West Champaran, East Champaran, Gopalganj, Saran, Muzaffarpur and Vaishali districts. It joins the Ganges near Patna just downstream with one of river bank at near
KaunharaGhat, Hajipur, District-Vaishali and another at near Hariharnath Mandir, Sonepur,
District-Saran.
SONE
The Sone originates from the hills of Madhya Pradesh near Amarkantak. After flowing
through the states Madhya Pradesh, Uttar Pradesh and Jharkhand it enters to Bihar, near south of District - Kaimur. It passes through Aurangabad, Rohtas, Daudnagar (Jahanabad),
Koilwer, and rural areas of Patna district and finally joins the Ganges in downstream of
Chapra, nearby Doriganj, Distrct - Saran.
PUNPUN
The Punpun River is a tributary of the Ganges. It originates in Palamu district of Jharkhand
and flows through Chatra (Jharkhand), Aurangabad, Gaya and Patna districts of Bihar. The river joins the Ganges at Fatuha, 25km downstream of Patna. The river is mostly rain fed
and carries little water in the dry season, however, during rains the Punpun often causes
heavy flood in the Patna area.
KOSI
The Kosi is a trans-boundary river flowing through Nepaland India. In Nepal it emerges
from the mountains with other tributaries and becomes the Koshi. After flowing through Biratnagar& other places in Nepal it enters into Bihar near Bhimnagar, district Supaul and
after flowing approx. 260 km joins the Ganges near Kursela, district Katihar.
It is a river of unstable nature and shifts its course frequently. The river, which flowed near Purnea in the earlier, now flows west of Saharsa. Its unstable nature has been attributed to
the heavy silt carried during the monsoon season. Koshi has been the main responsible river
for extreme flooding in Bihar. For this reason, the Koshi River is known as ‚The Sorrow of Bihar‛ as it has been causing huge damage of lives and property through flooding and very
frequent changes in course. The worst flood affected districts includes Supaul, Araria,
Saharsa, Madhepura, Purnea, Katihar, parts of Khagaria and northern parts of Bhagalpur, as well as adjoining regions of Nepal also.
BAGMATI
The Bagmati originates from Shivapuri Hills about few kms from Kathmandu in Nepal. It is a rain fed river and passes the center of Kathmandu, Tarai then enters into India near
Dheng, district Sitamarhi, Bihar. It flows across Sitamarhi, Sheohar, Muzaffarpur and
Darbhanga districts. Main tributaries of this river are Manusmar, Lakhandei and KamlaBalan. It finally joins Budhi-Gandak near Hayaghat,District-Darbhanga.
BUDHI GANDAK
The Budhi-Gandak originates from ChautarwaChaur near Bisambharpur, West Champaran,
Bihar. It is a rain fed river and flows through West Champaran, East Champaran,
Muzaffarpur, Samastipur, Begusarai and ultimately flows in to the Ganges in Khagaria. This river initially is known as Sikrahana River uptoLalbagiaGhat, East Champaran. From it’s

100
downwards journey it is known as Budhi-Gandak. The main tributaries of this river are
Ramrekha, Harboura, Kohra, Sirisia and Bagmati.
MAHANANDA
Mahananda River is one of the tributaries of the Ganga. The origin of this mighty
Mahananda River is hills of Darjeeling, West Bengal. The Mahananda River flows through Siliguri, then enters to Thakurganj, District-Kishanganj, Bihar and flows through the fertile
agricultural area of Purnea&Katihar and then leaves to West Bengal. The Mahananda River
is mainly rain fed in the monsoon and flood also occurs by this river. It has a low water level during the summer or winter.
FALGU RIVER
Falgu River has historical importance as Gaya is located on the bank of this river. Falgu is not a separate river. It finds its existence by combination of Niranjana and Mohanarivers.
Niranjana originates from Simaria region of western Hazaribagh District of Jharkhand.
Mohana River also originates from Shila village region of Hazaribagh District .Niranjana joins Mohanariver in downstream of Bodh Gaya and known as Falgu River in it’s
downwards journey. It is rain fed river and almost find dry in summer season.
Table below presents river basins in Bihar along with their length, flood prone area and protected area.
Table 3.35 Details of river basins in Bihar
Name of the
Basin
Catchment
Area
Length
of
River
in
Bihar
Embankment
Constructed
Flood
Prone
Area
Protected
Area
(Sq. Km) (Km) (Km) (Sq.Km) (Sq. Km)
Ganga 19322 445 596.92 12920 4300
Kosi 11410 260 387.51 10150 9300
BurhiGandak 9601 320 704.26 8210 4010
KiulHarohar 17225 14 6340 NIL
Punpun 9026 235 37.62 6130 260
Mahananda 6150 376 225.33 5150 1210
Sone 15820 202 59.54 3700 210
Bagmati 6500 394 400.79 4440 3170
KamlaBalan 4488 120 184.9 3700 2810
Gandak 4188 260 511.66 3350 3350
Ghaghra 2995 83 132.9 2530 790
Chandan 4093 118 83.18 1130 80
Badua 2215 130 NIL 1050 NIL
Lalbakeya 54.35
Adhwara 181.5
Bhuthi 54.7
Total 3629.16 68800 29490

101
Groundwater is the major source of groundwater in the state. There is potential for using
surface water as drinking water source in the state. The annual flow of the River Ganga at Patna is 364,000 MCM. There are several tributaries of the River Ganga in Bihar. The annual
flows of some of the major tributaries are Ghagra (94,400 MCM), Gandak (52,200 MCM),
Sone (31,800 MCM), and Kosi (68,340)26. The total annual water requirement for the proposed World Bank assited drinking water schemes in 10 districts (Patna, Nalanda,
Nawada, Muzaffarpur, Purnea, West Champaran, Begusarai, Saran, Banka, Munger) of
Bihar is 67 MCM (please refer to chapter 4.3.1). This is a small amount compared to the surface water availability in Bihar. However, district-wise and location specific surface water
and groundwater availability in the state will have to be made before setting up any
drinking water scheme.
3.8.10.2 Ground Water
Based upon geological diversities, geomorphological set up and relative groundwater
potentialities, hydrogeologically, the various litho-units of the State can be grouped as
• Unconsolidated / Alluvial formation,
• Semi-consolidated formations and
• Consolidated/fissured formations
The main alluvial tract covers entire north Bihar and a sizeable area south of the Ganga
River. These alluvial formations constitute prolific aquifers where the tubewell can yield
between 120-247 m3/hr. The potential of these aquifers decreases due south in the marginal tract. Auto flow conditions occur in the sub-Tarai region of Madhubani, Sitamarhi and West
Champaran districts. In the hard rock areas of South Bihar, borewells located near
lineaments/fractures can yield between 10-50 m3/hr.
Table 3.36 Details of groundwater resources of Bihar state
Dynamic Ground Water Resources
Annual Replenishable Ground water Resource 29.19 BCM
Net Annual Ground Water Availability 27.42 BCM
Annual Ground Water Draft 10.77 BCM
Stage of Ground Water Development 39%
As shown in the table above, the stage of ground water development is only 39%, which when compared to the CGWB categorization of assessment units i.e. (<=70% is ‘safe’) is below the threshold of concern (over exploited, critical and semi-critical). Out of 533 assessment units (blocks), 529 have been categorized as Safe and 4 blocks have been categorized as Semi-critical. Though the ground water development is comparatively low in major part of the State, the higher development areas are mostly located in isolated patches.
26 Jain, S.K., Impact of retreat of Gangotri glacier on the flow of Ganga River. Current Science. 95(8):1012-1014 (2008)

102
The drilling data of CGWB indicates presence of potential aquifer down to a depth of 300 m bgl in the northern part of South Ganga alluvial plain and in major part of North Ganga alluvial plain.
Following table which shows district-wise groundwater availability for the state of Bihar is one of the important tables for employing drinking water schemes in different district based on the available ground water quantity.
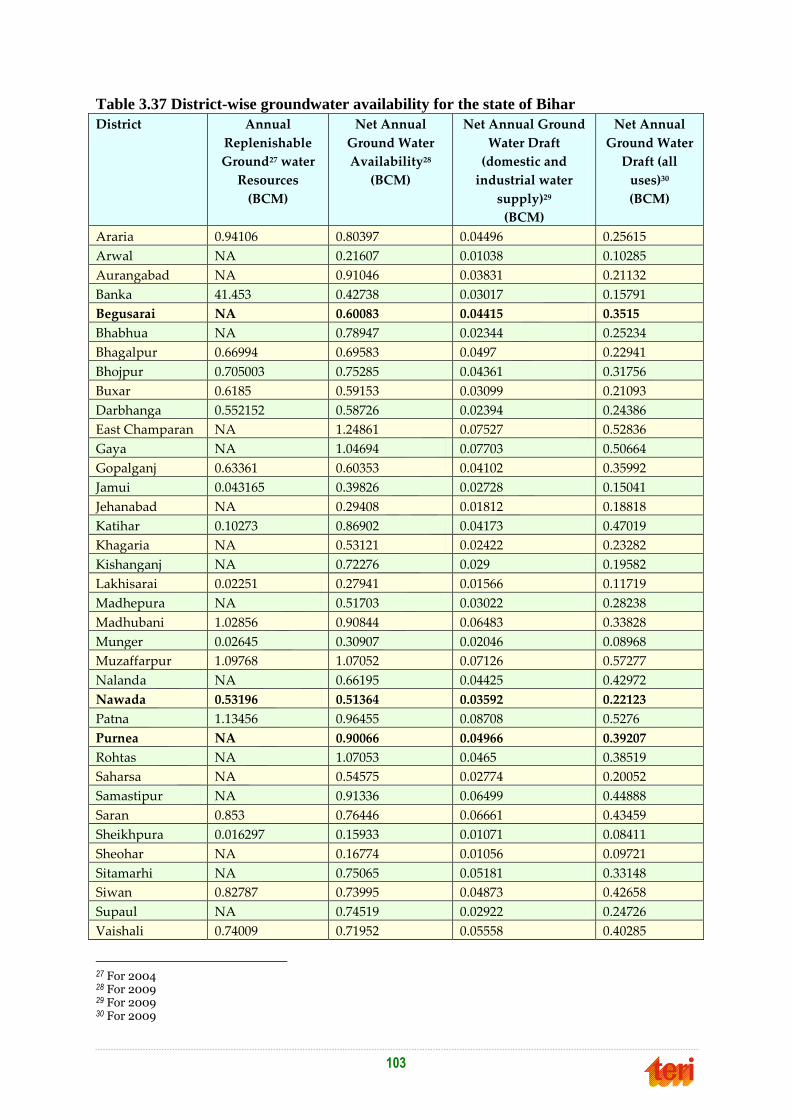
103
Table 3.37 District-wise groundwater availability for the state of Bihar
District Annual
Replenishable
Ground27 water
Resources
(BCM)
Net Annual
Ground Water
Availability28
(BCM)
Net Annual Ground
Water Draft
(domestic and
industrial water
supply)29
(BCM)
Net Annual
Ground Water
Draft (all
uses)30
(BCM)
Araria 0.94106 0.80397 0.04496 0.25615
Arwal NA 0.21607 0.01038 0.10285
Aurangabad NA 0.91046 0.03831 0.21132
Banka 41.453 0.42738 0.03017 0.15791
Begusarai NA 0.60083 0.04415 0.3515
Bhabhua NA 0.78947 0.02344 0.25234
Bhagalpur 0.66994 0.69583 0.0497 0.22941
Bhojpur 0.705003 0.75285 0.04361 0.31756
Buxar 0.6185 0.59153 0.03099 0.21093
Darbhanga 0.552152 0.58726 0.02394 0.24386
East Champaran NA 1.24861 0.07527 0.52836
Gaya NA 1.04694 0.07703 0.50664
Gopalganj 0.63361 0.60353 0.04102 0.35992
Jamui 0.043165 0.39826 0.02728 0.15041
Jehanabad NA 0.29408 0.01812 0.18818
Katihar 0.10273 0.86902 0.04173 0.47019
Khagaria NA 0.53121 0.02422 0.23282
Kishanganj NA 0.72276 0.029 0.19582
Lakhisarai 0.02251 0.27941 0.01566 0.11719
Madhepura NA 0.51703 0.03022 0.28238
Madhubani 1.02856 0.90844 0.06483 0.33828
Munger 0.02645 0.30907 0.02046 0.08968
Muzaffarpur 1.09768 1.07052 0.07126 0.57277
Nalanda NA 0.66195 0.04425 0.42972
Nawada 0.53196 0.51364 0.03592 0.22123
Patna 1.13456 0.96455 0.08708 0.5276
Purnea NA 0.90066 0.04966 0.39207
Rohtas NA 1.07053 0.0465 0.38519
Saharsa NA 0.54575 0.02774 0.20052
Samastipur NA 0.91336 0.06499 0.44888
Saran 0.853 0.76446 0.06661 0.43459
Sheikhpura 0.016297 0.15933 0.01071 0.08411
Sheohar NA 0.16774 0.01056 0.09721
Sitamarhi NA 0.75065 0.05181 0.33148
Siwan 0.82787 0.73995 0.04873 0.42658
Supaul NA 0.74519 0.02922 0.24726
Vaishali 0.74009 0.71952 0.05558 0.40285
27 For 2004 28 For 2009 29 For 2009 30 For 2009

104
District Annual
Replenishable
Ground27 water
Resources
(BCM)
Net Annual
Ground Water
Availability28
(BCM)
Net Annual Ground
Water Draft
(domestic and
industrial water
supply)29
(BCM)
Net Annual
Ground Water
Draft (all
uses)30
(BCM)
West Champaran NA 1.4145 0.05744 0.35964
Table 3.38 Details of Stage of Development of Groundwater in Bihar state
Stage of
Development of
Ground water
Number of
District
Percentage of
District
Name of District
Less than 30% 4 10.53 Aurangabad, Kishanganj, Munger, West
Champaran
30-40% 10 26.32 Araria, Banka, Bhabua, Bhagalpur, Buxar,
Jamui, MadhubaniRohtas, Saharsha,
Supaul
41-50% 11 28.95 Arwal, Bhojpur, Darbhanga, East
Champaran, Gaya, Khagaria, Lakhisarai,
Nawada, Purnea, Samastipur, Sitamarhi
51-60% 11 28.95 Begusarai, Gopalganj, Katihar, Madhepura,
Muzaffarpur, Patna, Saran, Shekhpura,
Sheohar, Siwan, Vaishali
61-70% 2 5.26 Jahanabad, Nalanda
With regard to groundwater recharge, there is significant natural recharge to the aquifers from the vast surface water bodies in the state, especially from the rivers. In addition, an area of 1650 sq. km has been identified for artificial recharge, as shown in the Table below.
Table 3.39 Details of Groundwater Development and Management in Bihar state
Ground Water Development & Management
Over Exploited NIL
Critical NIL
Semi- critical 4
Ground Water User Maps 38 districts
Artificial Recharge to Ground Water (AR) Area identified for AR: 1650 sq. km.
Quantity of Surface Water to be Recharged: 574
MCM
Feasible AR structures: 891 Percolation Tanks,
2260 Check Dams, 1630 Recharge Shaft, 1303
Contour Bunding, RWH in Urban Areas

105
Following table shows the semi critical blocks of Bihar. Water supply schemes in these areas
should have special emphasis on the recharge, water conservation or rain water harvesting activities. Also, districts having these blocks should be given priority for carrying out
watershed development, pond recharge and such schemes.
Table 3.40 Semi critical blocks of Bihar
District Semi critical blocks
Gaya Gaya Sadar
Nalanda Nagarnausa, Rajgir
Nawada Meskaur
3.8.10.3 Water Quality
Surface water quality
Central Pollution Control Board (CPCB) classifies river water quality in five classes
according to fitness as following. The standards of these classes have been specified on the basis of chemical and biological parameters.
Table 3.41 Central Pollution Control Board (CPCB) classification of river water quality
Classification Class Tolerance limit
Drinking water source
without conventional
treatment but after
disinfections
A Total coliform organisms MPN/100 ml
shall be 50 or less
pH between 6.5 and 8.5
Dissolved Oxygen 6mg/l or more
Biochemical oxygen demand 5 days 20
degreesCelsius2 mg/l or less
Outdoor bathing (organized) B Total coliform organisms MPN/100 ml
shall be 500 or less
pH between 6.5 and 8.5
Dissolved Oxygen 5 mg/l or more
Biochemical oxygen demand 5 days 20
degrees Celsius 3 mg/l or less
Drinking water source after
conventional treatment and
disinfections
C Total coliform organisms MPN/100 ml
shall be 5000 or less
pH between 6.5 and 8.5
Dissolved Oxygen 4 mg/l or more
Biochemical oxygen demand 5 days 20
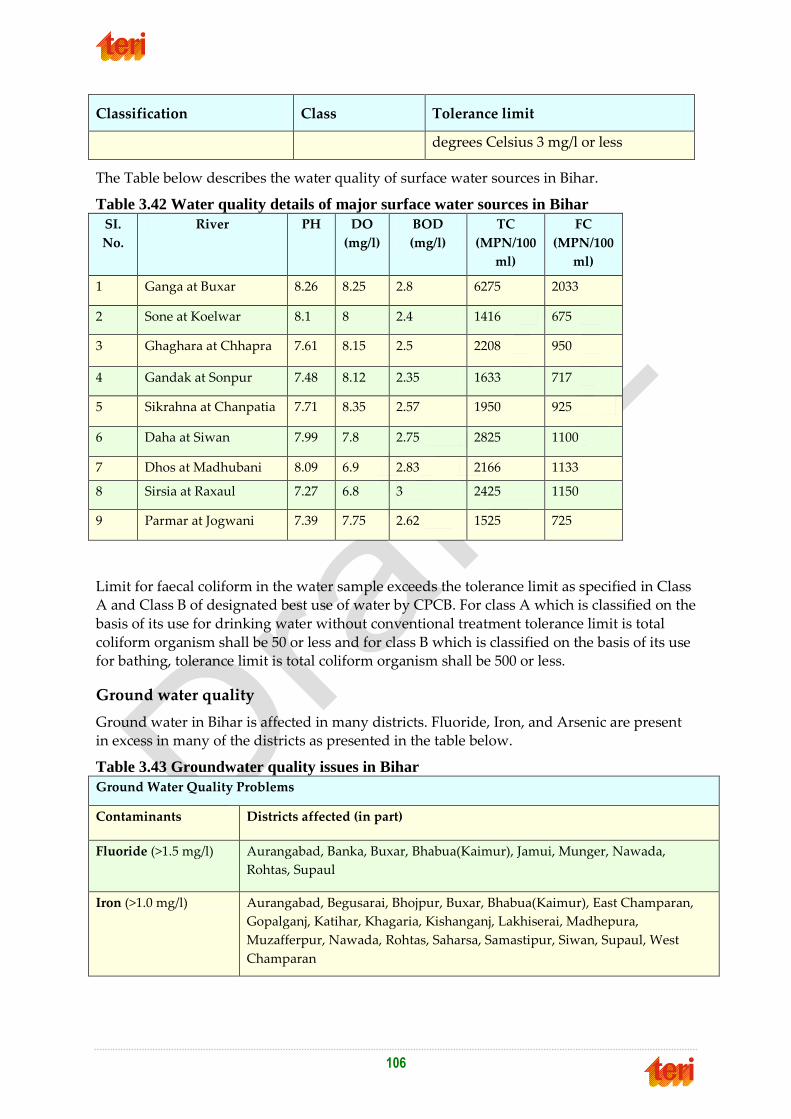
106
Classification Class Tolerance limit
degrees Celsius 3 mg/l or less
The Table below describes the water quality of surface water sources in Bihar.
Table 3.42 Water quality details of major surface water sources in Bihar
SI.
No.
River PH DO
(mg/l)
BOD
(mg/l)
TC
(MPN/100
ml)
FC
(MPN/100
ml)
1 Ganga at Buxar 8.26 8.25 2.8 6275 2033
2 Sone at Koelwar 8.1 8 2.4 1416 675
3 Ghaghara at Chhapra 7.61 8.15 2.5 2208 950
4 Gandak at Sonpur 7.48 8.12 2.35 1633 717
5 Sikrahna at Chanpatia 7.71 8.35 2.57 1950 925
6 Daha at Siwan 7.99 7.8 2.75 2825 1100
7 Dhos at Madhubani 8.09 6.9 2.83 2166 1133
8 Sirsia at Raxaul 7.27 6.8 3 2425 1150
9 Parmar at Jogwani 7.39 7.75 2.62 1525 725
Limit for faecal coliform in the water sample exceeds the tolerance limit as specified in Class A and Class B of designated best use of water by CPCB. For class A which is classified on the
basis of its use for drinking water without conventional treatment tolerance limit is total
coliform organism shall be 50 or less and for class B which is classified on the basis of its use for bathing, tolerance limit is total coliform organism shall be 500 or less.
Ground water quality
Ground water in Bihar is affected in many districts. Fluoride, Iron, and Arsenic are present in excess in many of the districts as presented in the table below.
Table 3.43 Groundwater quality issues in Bihar
Ground Water Quality Problems
Contaminants Districts affected (in part)
Fluoride (>1.5 mg/l) Aurangabad, Banka, Buxar, Bhabua(Kaimur), Jamui, Munger, Nawada,
Rohtas, Supaul
Iron (>1.0 mg/l) Aurangabad, Begusarai, Bhojpur, Buxar, Bhabua(Kaimur), East Champaran,
Gopalganj, Katihar, Khagaria, Kishanganj, Lakhiserai, Madhepura,
Muzafferpur, Nawada, Rohtas, Saharsa, Samastipur, Siwan, Supaul, West
Champaran

107
Ground Water Quality Problems
Arsenic (>0.05 mg/l ) Begusarai, Bhagalpur, Bhojpur, Buxar, Darbhanga, Katihar, Khagaria,
Kishanganj, Lakhiserai,Munger, Patna, Purnea, Samastipur, Saran, Vaishali
District wise water quality
Arsenic is a serious quality concern for many districts in Bihar like Begusarai, Bhagalpur, Bhojpur, Buxar, Darbhanga, Katihar, Khagaria, Kishanganj, Lakhiserai, Munger, Patna,
Purnea, Samastipur, Saran, Vaishali. All of these districts have been reported by CGWB to be
affected by arsenic with a concentration of more than 50 ppm (Fig. 3.8)
Figure 3.8 Arsenic affected areas in Bihar
Aurangabad, Begusarai, Bhojpur, Buxar, Bhabua(Kaimur), East Champaran, Gopalganj,
Katihar, Khagaria, Kishanganj, Lakhiserai, Madhepura, Muzafferpur, Nawada, Rohtas, Saharsa, Samastipur, Siwan, Supaul, West Champaran districts of the state have been
identified by CGWB to be affected by iron contamination of more than 1mg/L in
groundwater (Fig. 3.9).

108
Figure 3.9 Iron affected areas in Bihar
Southern belt of the state is affected by fluoride, with districts like Aurangabad, Banka, Buxar, Bhabua(Kaimur), Jamui, Munger, Nawada, Rohtas, Supaul having concentration
more than the standard limit of 1.5mg/L
Figure 3.10 Fluoride affected areas in Bihar
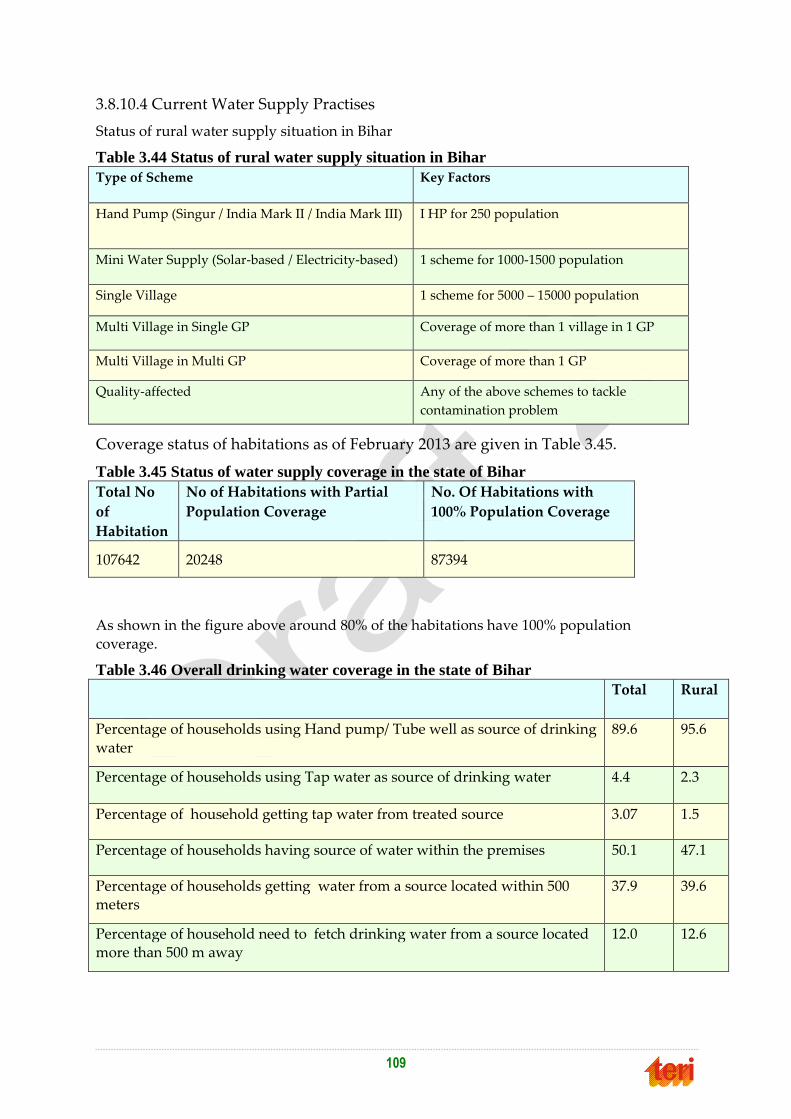
109
3.8.10.4 Current Water Supply Practises
Status of rural water supply situation in Bihar
Table 3.44 Status of rural water supply situation in Bihar
Type of Scheme Key Factors
Hand Pump (Singur / India Mark II / India Mark III) I HP for 250 population
Mini Water Supply (Solar-based / Electricity-based) 1 scheme for 1000-1500 population
Single Village 1 scheme for 5000 – 15000 population
Multi Village in Single GP Coverage of more than 1 village in 1 GP
Multi Village in Multi GP Coverage of more than 1 GP
Quality-affected Any of the above schemes to tackle
contamination problem
Coverage status of habitations as of February 2013 are given in Table 3.45.
Table 3.45 Status of water supply coverage in the state of Bihar
Total No
of
Habitation
No of Habitations with Partial
Population Coverage
No. Of Habitations with
100% Population Coverage
107642 20248 87394
As shown in the figure above around 80% of the habitations have 100% population
coverage.
Table 3.46 Overall drinking water coverage in the state of Bihar
Total Rural
Percentage of households using Hand pump/ Tube well as source of drinking
water
89.6 95.6
Percentage of households using Tap water as source of drinking water 4.4 2.3
Percentage of household getting tap water from treated source 3.07 1.5
Percentage of households having source of water within the premises 50.1 47.1
Percentage of households getting water from a source located within 500 meters
37.9 39.6
Percentage of household need to fetch drinking water from a source located more than 500 m away
12.0 12.6

110
According to the latest figures available from census 2011, most of the households in Bihar
rural areas use hand pump or tube well as a source of drinking water. The total percentage in the state is 89.6 while it is 95.6 in rural areas for the households using hand pump or tube
well as the source. The percentage is very less (1.5%) for the households getting tap water
from the treated source. In terms of access, around 47 % households have water source within the premise, while around 40% have water source located within 500 meters. Bihar
has still a long way to go in terms of access of water from safe sources.
3.8.10.5 Current Water Treatment Practises
Mini piped water supply treatment scheme: The Mini piped water supply scheme is designed to have a Water treatment plant along with stand posts (for supplying water) spread out inside the village through which filtered water is supplied. The water treatment plant will have a 3 or 4 stage Contaminant Removal Unit (Iron, Fluoride, Arsenic, etc.), a submersible reciprocating pump (mostly powered by solar panels), and an overhead tank along with 2-3 value addition tanks (VATs). The Contaminant Removal Unit filters out the chemical as well as the biological contaminants. The maintenance of this unit requires carrying out a backwash process regularly, which releases wastewater containing the filtered contaminants and this needs to be disposed safely.
3.8.10.6 Incidence of water and sanitation related diseases
Poor water quality is a serious threat. It hampers socio-economic development. Water contamination weakens or destroys natural ecosystems that support human health, food production, and biodiversity.
Arsenic in drinking water
Arsenic is introduced into water through the dissolution of rocks, minerals and ores, from industrial effluents, including mining wastes, and via atmospheric deposition. Arsenicosis or arsenic poisoning occurs when ground drinking water is contaminated with the element, either by natural occurrence or human influence such as mining, metal refining and timber treatment. People consuming water contaminated with arsenic could experience skin damage or problems with their circulatory system, and may have an increased risk of getting cancer.
Fluoride in drinking water
Naturally occurring fluorides in groundwater are a result of the dissolution of fluoride containing rock minerals by water while artificially high soil fluoride levels can occur through contamination by application of phosphate fertilizers, sewage sludge, or pesticides.
Table 3.47 Concentration of fluoride in drinking water and its effects on human health
Fluoride
Concentration
(mg/L)
Effect
Nil Limited growth and fertility
< 0.5 Dental caries
0.5 - 1.5 Promotes dental health, prevents tooth decay
1.5 - 4.0 Dental fluorosis (mottling and pitting of teeth)

111
Fluoride
Concentration
(mg/L)
Effect
4.0 - 10.0 Dental fluorosis, skeletal fluorosis (pain in neck bones and back)
> 10.00 Crippling fluorosis
Source: International Drinking Water Standards (1971), WHO, Geneva.
3.9 Important Observations from Analysis of Secondary Data Sources
Bihar is a landlocked state, yet it is rich with ample natural water resources. The most important river Ganga, flowing from west to east, divides the state into north and south Bihar. Eight major rivers – the Ghagra, Gandak, Budhi Gandak, Bagmati, the Adhwara group of rivers, Kamla, Kosi and Mahananda spread are across North Bihar. The major rivers of South Bihar are Karamnasha, Sone, Punpun, Kiul-Harohar, Badua, Falgu, Morhar, Chandan and Bilasi, having their origins in Jharkhand, Madhya Pradesh and Uttar Pradesh. Most of the rivers in north Bihar originate in Nepal flowing through the plains of Bihar before draining into the river Ganga. The abundance of water resources is both a blessing and a curse for the state. In fact, Bihar is one of the worst flood-affected states in India. About 68.8 lakh hectares of its total geographical area of 94.16 lakh hectares are flood prone. In addition, nearly 9.41 lakh hectares (8.32 lakh ha in north Bihar and 1.09 lakh ha in south Bihar), i.e., 10 percent of the total geographical area of the state is water logged. There are multiple reasons behind waterlogging which include: spilling of silted small rivers, encroachment of drainage channels, embankment induced waterlogging and the prevalence of saucer type depressions in the topography of the land. Through various measures, the state government is addressing these challenges. Extensive review of secondary sources of data has identified following additional observations
Bihar state have comparable scheduled caste population but very less scheduled tribe population than India (<1% compared to >8.0%).
State has made remarkable progress in literacy field in the last decade. The literacy rate in Bihar increased from 47.0 per cent in 2001 to 63.8 per cent in 2011, implying an increase of 16.8 per cent during the decade.
Apart from recording the highest increase in literacy rates, Bihar has been able to considerably reduce its gender difference in literacy rates
The industries in Bihar have remained plagued by many problems and this is one of the major challenges to resolve this multi-faceted problem.
Labor availability might become serious implication for agriculture sector in the state, which is mainstay for livelihood of major population
The economy of Bihar grew at an annual rate of 11.36 percent during the period 2004-05 to 2010-11. This growth process is promising for different sectors and for moving away from stagnant economy
The state’s divided into two states in the year 2000. After the division the state retained almost 75 percent of the population, while it is left with only 54 percent of the land, thus inducing a lot of strain on the available resources.
The Himalayas Mountains in the north significantly affect the distribution of monsoon rainfall in the state

112
Major rainfall is due to South-west monsoon which accounts for around 85 per cent of total rainfall in the state.
Year-to-year changes in rainfall leads to drought or flood situation in Bihar which causes extensive damage to crop production and the overall income of the state. Another reason for severe effect is the fact that almost half of the cultivated area is un-irrigated.
The average annual rainfall of Bihar is 1271.9 mm and the average numbers of rainy days are 52.5. South Bihar Alluvial Plains has the lowest rainfall ranging between 990-1240 mm. The districts of Saran, Darbhanga, Patna and Muzaffarpur have a higher probability of drought.
The soil in Bihar state is mostly fresh loam, replaced every year by intermittent deposition of silt, clay and sand by different rivers. It lacks phosphoric acid, nitrogen and humus but potash and lime are generally present in large amounts.
Rice-Wheat is dominant cropping system of the state with Maize-Wheat, Pulses-Wheat as substitute cropping combinations
Bihar ranks 8th with respect to the area (11.21 lakh ha) and 5th with respect to the production (173.35 lakh MT) of horticultural crops in the country. Major fruits grown in the state are Mango, Litchi, Guava, Pineapple, Banana, Aonla, Bel and Makhana.
The use of nitrogenous fertilizers in Bihar is much higher as compared to the national average. The national averages for N, P and K stand at 77.9, 33.69 and 17.1 kg/ha, respectively, while that of Bihar are 123.77, 33.37 and 21.83 kg/ha, respectively.
One can also observe a trend towards a balanced use of fertilizer in last two years and there is significant rise in organic farming and other related activities like vermi-composting, bio-fertilizers, bio-pesticides etc.
About 35 percent of rural households in Bihar own cattle, 20 percent own buffalo, and 15 percent own sheep and goats. Of all rural households owning cattle and/or buffalo in Bihar, more than three- quarters are either landless or have less than 1 hectare of land.
Only about 6.87% of the geographical area (6473 sq km) of the state of Bihar is under forests. This consists of 76 sq km of very dense forests, 2951 sq km of dense forests and 2531 sq km of open forest.
Afforestation and reforestation activities need focused efforts and long term planning in the state
Industrial sector in Bihar is growing at a fast space and still has large scope for development. Bihar has emerged as brewery hub with major domestic and foreign firms setting up production units in the state.
Following endangered species need special attention. Gangetic Dolphins (known as Soons by Locals) which are classified as Endangered on the 2006 IUCN Red List of Threatened Species and included in Schedule-I of the Indian Wildlife Protection Act, 1972. Threatened aquatic wildlife like “The Indian smooth-coated Otter‛ (Lutrogale perspicillata), Gharial (Gavialis gangeticus) and variety of freshwater turtles
Forest cover in Ganga basin, flood prone areas, polluted river stretches, areas of habitations with different water quality problem (like arsenic, fluoride, nitrate and iron) are environmentally sensitive areas and need special attention

113
According to the latest figures available from census 2011, most of the households in Bihar rural areas are using hand pump or tube well as a source of drinking water. The total percentage in the state is 89.6; it is 95.6 in rural areas.
Households getting tap water from the treated source is very less (1.5%). Poor water quality is a serious threat in the Bihar state. It hampers socio-
economic development. Water contamination weakens or destroys natural ecosystems that support human health, food production, and biodiversity

114
44.. EEnnvviirroonnmmeennttaall MMaannaaggeemmeenntt FFrraammeewwoorrkk
4.1 Environmental Analysis This chapter presents an overview of the key environmental issues related to the proposed BSWSM project and the Environment Management Framework (EMF). An analysis of the baseline environmental situation, observations during site visits (Annexure 2), discussions with state, district and village level functionaries as well as Focus Group Discussions (FGDs) have clearly brought out the following key environmental issues that need to be addressed in the project design and implementation. Annexure 25 includes pictures showing environmental issues in the RWSS sector.
4.2 Environmental issues identified during Focus group discussions and household surveys
4.2.1. Environmental issues identified during Focus group discussions (FGDs)
Fifteen FGDs were conducted in the four districts selected for field survey. The FGDs comprised of village heads, Panchayat members, teachers, lawyers, farmers, women etc.
The major environment-related issues identified during FGDs are:
There is no awareness about the water conservation and efficient water use practices which leads to wastage of precious water resources.
Piped water supply is inadequate in the villages
Water source is insufficient during winter
Water distribution lines for the piped water schemes are inadequate with frequent bursting of pipes, lack of O&M, and wastage of water
Inadequate water supply due to frequent power cuts
Water quality is poor in the villages
People remove the treatment attachment units from the Govt. sponsored hand pumps to get more water from the hand pumps with less effort.
Disposal of backwash water (with high concentration of chemicals) from water treatment systems into the field was observed by the field survey team. This backwash water infiltrates into groundwater.
Open defecation is rampant in all the study sites
There are inadequate number of latrines in all villages
There is no solid and liquid disposal system in place in the villages
The field survey team observed at Siuri Village (District: Begusarai) that the distance between hand pump and soak pit latrine was closer than the recommended minimum distance (10 m) between them. This is common in most of the villages (revealed from field observation and FGDs). This is another cause

115
for drinking water contamination. This is due to lack of awareness about water contamination and lack of sufficient land available.
Many of the toilets constructed in the village under the government scheme are of shallow depth, which lead to the filling up of the pits in a short duration, causing the villagers to go for open defecation.
It was observed in some of the villages that the wastewater is discharged into ponds inside the village leading to seepage of wastewater into the soil and causing further contamination of surface and groundwater.
It was observed in village Bhola Khura (Dist: Nawada) that setting up of a water treatment plant had led to cutting of palm trees.
One of the survey sites (Ghoghaghat, West Champaran Dist.) visited for proposed MVS, has an Orchard on the bank of the river Burhi Gandak. This orchard may have to be cleared for setting up of the MVS.
At one survey site (Bachwara block, Begusarai District) where a MVS is being proposed with River Ganga as water source, it was observed that river had changed course in the past and this may occur in the future, thus impacting sustainability of the water source for the scheme.
Use of pesticide in agricultural field was also reported in all surveyed village which may contaminate water sources.
4.2.2 Environmental issues identified from household surveys
Household surveys were carried out in three villages in each of the selected four
districts to understand the environmental issues in those villages. Below are the
major observations at the household level.
Based on the perception of 82% households in the villages surveyed, the groundwater level has gone down during the last 10 years. 81% of the respondents said that during summer season water level goes down and most of the hand pumps run dry to shallow depth of the hand pumps.
23% households expressed that the amount of water is not sufficient for daily needs.
55 % households expressed that potable water as an issue in the village and almost 78% households expressed the need for a better water supply system because of water availability issues.
Water quality of shallow hand pumps was perceived to be bad and poor in almost all surveyed villages in terms of colour (42% of the respondent households), odour (24% of the respondent households) and taste (19% of the respondent households).
50% respondents have the perception that during summer, water quality problem is ‚somewhat serious‛ and 25% respondents said that water quality problem is ‚somewhat serious‛ during winters.
100% respondents drink water without any treatment at household level.
Water logging in shallow open pits in front of hand pumps & stand posts was also observed by the field survey team. This may contaminate the ground water

116
quality. These waterlogged areas are breeding place for mosquitoes. Malaria and water borne diseases are rampant in the villages surveyed. Some of the diseases faces by the households are: Diarrhoea (13%), Malaria (37%), Typhoid (8%) and Skin diseases (18%).
78% respondents do not have a drainage facility for disposal of wastewater that leads to logging of wastewater near households and hand-pumps.
Solid waste generated from the households is disposed of in the open space (92% of the households) that leads to vector breeding, and this gets aggravated during the rainy season where rainwater mixes with the solid waste to further cause contamination and pollution.
78% respondents practice waste water disposal to the earthen drainage along the streets.
92% of the respondents dispose solid waste by throwing in open places.
Most of the surveyed households use cattle dung as fuel and in agricultural fields as fertilizer.
Sanitation standards and practices in the villages are still poor. Many of them still go for open defecation (74% of the households) due to non-availability and bad maintenance (filling up of pits) of the toilets.
74% respondents go for open defecation in all the surveyed villages and 88% respondents expressed the need for household toilets.
The key environmental issues in the villages have been discussed in detail below and mitigation measures have been suggested. ECOPS have been included in the report for avoiding, mitigating and safeguarding environmental issues. The EMF includes environmental monitoring and management plans for the proposed schemes in Bihar. Institutional arrangement and capacity building for environmental safeguard have also been provided in this chapter.
4.3 Key Environmental Issues
4.3.1 Water Availability
Groundwater has been the major source of water for drinking in Bihar. For a large number of rural households which are dependent on hand pumps, the declining and fluctuating groundwater levels are adversely affecting the water supply.
Most of the current schemes in Bihar are based on groundwater sources. Some of these sources show declining water levels during summer season (dry period). The potential of surface water source for drinking purposes has not been fully explored in Bihar.

117
Table 4.1 Proposed World Bank assisted schemes in Bihar
For these proposed schemes, the water requirement at 70 lpcd for the SHS (design population: 1000), SGS (design population 5000), Simple MVS (design population: 50000), and large MVS (design population: 100000) schemes are 67 MCM. This is a small fraction (less than 1%) of the annual replenishable groundwater available in the 10 districts in which these schemes are proposed. Also the total water requirement for these schemes (i.e. 67 MCM) is a small fraction of the available surface water in the state (please refer to sub-section 3.8.10.1, Chapter 3). Annexure 15 provides guidelines for protecting surface water supply source and ensuring sustainability and downstream minimum flows.
4.3.1.1 Environmental Issues
Inadequate and disrupted water supply affects human health and environmental sanitation. Tapping of semi-critical aquifers may cause quality deterioration with increased concentration of harmful substances like fluoride, Arsenic and Iron.
4.3.1.2 Measures to Augment Water Supplies
Intensification of existing water supplies can be achieved through various ways as mentioned below.
Upgradation of existing water supply schemes should be made a priority wherever feasible.
The existing water resources should be conserved and the availability should be augmented by maximizing retention through rainwater harvesting, creation of bunds and check-dams; eliminating pollution through appropriate mitigation measures; and minimizing losses through water-use efficiency by generating awareness on good practices.
In addition, measures like rehabilitation of existing water bodies for storing rainwater and groundwater recharge need to be taken up.
The potential for the use of surface water from river sources should be explored in some regions to augment water supply.
In cases where the drinking water supply source involves extraction from a semi-critical aquifer, the emphasis must be on water conservation (including ground water recharge and rainwater harvesting). In the long term, regulation of extractions from groundwater aquifers for irrigation needs to be ensured. Efficiency of use of water should be promoted through education, regulation, incentives and disincentives. IEC campaigns to improve water use efficiency should be organized.
WB assisted Schemes (Proposed) 2013/14 2014/15 2015/16 2016/17 2017/18 2018/19 TOTAL
Single Habitation Scheme (SHS) 10 40 0 0 0 0 50
Single Gram Panchayat Schemes
(SGS) 136 31 47 24 0 0 238
Total Simple MVS 3 3 4 0 0 0 10
Total Large MVS 1 1 0 2 0 0 4
Rehabilitation of Old Schemes
(SGS) 0 10 0 10 8 0 28

118
4.3.2 Water Quality
4.3.2.1 Surface Water Quality
Environmental Issues
Non point sources of pollution in the catchment areas resulting from widely prevalent practice of open defecation, and agricultural run-off containing fertilizers and pesticides, washing, bathing and other human activities contaminate the rivers/irrigation canals. In addition to this, sewerage from cities/towns and industrial effluents discharging into the surface water bodies form a major source of contamination.
4.3.2.2 Ground Water Quality
Environmental Issues
The shallow groundwater quality in many parts of Bihar is poor owing to natural presence of contaminants like Iron, Fluoride, Arsenic, Chloride, Nitrate etc. at concentrations exceeding the permissible levels for drinking water use. Annexure 24 provides monthly water quality information in the four surveyed districts (Data source: PHED, Patna). In addition, the quality of groundwater may also be affected by bacteriological contamination due to disposal of sullage into kaccha drains and pits, deep toilet pits, effluent from septic tanks, water logging near hand pumps, open defecation etc. According to PHED estimates, 13 districts in Bihar suffer from Arsenic contamination, 11 districts with Fluoride contamination and 9 districts with Iron contamination.
Mitigation Measures
It needs to be taken into consideration during the planning and design stage of the schemes that the selection of the source is conducted with due regard to water quality of the source, and also that the water quality at household delivery level meets the drinking water norms. More specifically:
1. Selection of the source for the water supply should be made after detailed examination of both surface and groundwater sources in the region; priority needs to be based on the guidelines provided in Annexures 5. These sources need to be tested for their water quality prior to the selection of source for the water supply schemes.
Sanitary protection of water supply sources is prescribed in Annexure 6. Annexure 7 describes ECOPs for sustainability of groundwater sources.
2. Depending on the water quality characteristics in the vicinity, advanced treatment options like Iron removal units, Fluoride removal units, Arsenic removal units, disinfection systems can be opted.
3. Regular cleaning of storage tank and disinfection of supply water using chlorination needs to be ensured.
4. Development of an Institutional arrangement for preventive and corrective maintenance of water distribution system (leak detection and repair, reinstallation of damaged/missing taps) and for preparedness in crisis management during major breakdowns.

119
5. Water supply sources need to be protected as per the guidelines given in Annexure 6.
6. A protocol for regular water quality testing and control has been developed by PHED (Bihar), which will be implemented through the operations phase of the water supply schemes. Water quality testing for industrial and agricultural chemical contaminants shall be conducted by the PHED (District and state level), in a phased manner based on an initial sampling of groundwater and river/ canal waters in all districts of the state before taking up subprojects in those areas. This cost will be included in the project preparation cost.
4.3.3 Environmental Sanitation
The present level of sanitation coverage in the rural areas of the state is less than 25 % with usage percentage much lower. This implies that still nearly a large fraction of the rural population resorts to open defecation with its associated risk to water supply sources and public health. Open defecation constitutes a major non-point source of pollution of surface and ground water sources. Poor environmental sanitation conditions and lack of adequate supply of safe water are factors responsible for high incidence of water borne and water related diseases among the rural population.
4.3.3.1 Environmental Issues
1. Large percentage of the population still resort to open defecation due to inadequate latrines, low usage of latrines and low levels of awareness, which leads to bacteriological contamination of soil and groundwater bodies.
2. Presence of deep leach pit latrine (>6 ft.) can lead to bacteriological contamination of groundwater.
3. Open field defecation leads to health problems among the community through vectors.
4.3.3.2 Mitigation Measures
Construction of latrines and awareness generation among the community for their increased usage.
Selection of safe sanitation technologies and environmental considerations in location of toilets as given in Annexure 9.
Annexure 10 presents recommended construction practices and pollution safeguards for Twin Pit Pour Flush Latrines.
4.3.4 Liquid waste disposal
The liquid waste is generated from households, usually containing wastes such as detergents, soap, kitchen waste and others. In addition to that, over-flow of water from hand-pumps and public stand posts also contributes to waste water generation.
4.3.4.1 Environmental Issues
1. Liquid waste generated by the households, including liquid-waste from cattle-sheds, flows into open surface drains leading to stagnation of water near houses and road side.

120
2. The lack of infrastructure for treatment and disposal of this liquid waste leads to contamination of groundwater through stagnation of wastewater inside the village, near water supply stand-posts, hand pumps, etc.
3. The presence of stagnant water in the villages combined with poor personal hygiene leads to the incidence of malaria and other vector borne diseases, like diarrhoea, etc.
4.3.4.2 Mitigation Measures
1. Construction of latrines and awareness generation for increased usage should be ensured. Selection of safe sanitation technologies and environmental considerations in location of toilets is given in Annexure 9. Annexure 10 presents recommended construction practices and pollution safeguards for Twin Pit Pour Flush Latrines.
2. Efficient design of surface sullage drains and adoption of good construction practices, along with a system of regular maintenance can ensure that stagnant pools of sullage are eliminated. Guidelines for safe sullage disposal at household and community levels are given in Annexure 11.
3. Placement of water supply pipeline at a safe distance away from the sullage lines on different sides of the road would reduce the risk of cross contamination.
4. Vector control measures need to be adopted for the ponds and drains carrying sullage to avoid water stagnation, and non-hazardous insecticides should be sprayed in accordance with the World Bank safeguard policy, i.e. OP 4.09.
5. The project needs to focus on improving personal hygiene standards, by supporting sustained IEC campaign to create and enhance awareness on hygiene aspects pertaining to hand washing, safe water collection, storage and handling practices.
4.3.5 Solid waste disposal
Different types of solid wastes like cattle dung, kitchen waste, agriculture waste, plastic and
paper are generated in the villages. These are usually dumped in open spaces close to the
households.
4.3.5.1 Environmental issues
Solid wastes of biodegradable and non-biodegradable nature are directly disposed by mere dumping along roads and open places leading to vector breeding, odour generation, and this gets aggravated during rainy season leading to health problems and contamination of soil and groundwater through leaching.
4.3.5.2 Mitigation measures
A good Solid waste management system needs to be put in place including the following features:
Segregation of wastes at source
Provision of household/cluster dust-bin
Recycling of non-degradable wastes through authorized waste-handling vendors.

121
Vermi-composting of biodegradable wastes
Guidelines for safe sullage disposal and Organic waste management are given in Annexure
12.
In rural areas the amount of waste generated is about 200- 300 gm/day/person, of which
25% is non- biodegradable and 75% is biodegradable in nature. Out of the non-
biodegradable waste about 75% is recyclable and the remaining 25% is non-recyclable.
For an average village of about 1000 population, the total solid waste generated is about
250 kg per day; out of which 187.5 kg is bio-degradable waste and 62.5 kg of non-
biodegradable waste. Out of this, 62.5 kg of non-biodegradable waste, 47 kg is recyclable
and 15.5 kg is non-recyclable. This non-recyclable waste is mostly inert material. These
are very small amounts of solid waste as the project is to be implemented in rural areas
and requires decentralized solutions and more of local action.
Hence segregation of solid waste at household level will be introduced through IEC
campaigns and house-to-house awareness creation activities. For managing bio-
degradable waste, composting or vermi-composting at household level or community
level, as required is proposed. All the recyclable waste will be segregated at household
level itself and reused. The remaining non-recyclable waste will be disposed at
commonly identified places by the community, as this quantity is too small.
For liquid waste, drains will be provided in the village and village households are
encouraged to build soak pits. Where required liquid waste will be collected and
disposed into waste stabilisation ponds for stabilisation.
The issue for final disposal of solid and liquid waste has been addressed in the reports
through Environmental Codes of Practice on Safe Disposal of Sullage and Organic
Waste Management and Safe Solid and Liquid Waste Management at Individual,
Household and Community level. All these rural villages are located among agricultural
fields, where the fields will readily absorb the liquid waste generated.
This is Rural water supply and Sanitation Project and addresses waste management at rural household level and cannot be taken up under integrated waste management plan.
4.3.6 Construction Stage Environmental Impacts
The project activities during its construction stage are likely to have temporary negative externalities on the environment, which will need to be addressed. Construction of project components like water supply schemes, underground drainage, drains and sanitation facilities would have the following impacts-
Erosion of top-soil due to earth work
Air pollution due to excavated soil and drilling operations
Cutting of trees or clearing of forest area
Noise pollution during drilling of bore-wells, movement of trucks

122
Soil contamination due to spillage of oil and fuel from the construction machinery and vehicles
Possible damage to places of cultural, heritage and recreational/aesthetic importance
Impact on human health and safety due to dust and noise pollution, and inadequate safety measures. Annexure 16 provides guidelines for public and workers’ health and safety.
4.3.6.1 Mitigation Measures
All project interventions will be appropriately designed to ensure minimum impact on the environment.
Safe storage of top soil for preservation of its nutrients, so as to ensure its reuse later
Use of curtains/barriers to minimize air and noise pollution during construction activities
All the physical works should be constructed on Common property/Panchayat lands so as to avoid usage of forest areas and areas with a good tree cover. In the absence of an alternate location, permission from the forest department shall be obtained for felling of trees and the department's guidelines on compensatory afforestation will be followed.
In case of some physical works associated with construction and maintenance, there might be presence of objects of cultural/ archaeological importance. In such cases, the regional offices of the relevant agency (e.g. the Archaeological Survey of India) will be immediately notified.
4.3.7 Operation Stage- Environmental Impacts
The project activities during its Operation stage are likely to have negative externalities on the environment, which will need to be addressed. Operation of project components like water supply schemes, drains and sanitation facilities would have the following impacts-
Back wash water from specific contamination treatment system like fluoride, arsenic & iron etc. in case of pipe water supply system (single village scheme & multi village scheme). This back wash may contaminate soil & water (surface and ground).
Disposal of sludge generated during water treatment processes in case of multi village scheme, may contaminate soil & ground water.
Water logging problem due to leakages from pipe lines & damaged taps.
Adverse impact on downstream flora & fauna in case of surface water source for multi village scheme.
Loss of supply water due to leakages in pipe line.
Degradation of water quality during non-supply time - suction of external logged water through leakages may contaminate the water.

123
4.3.7.1 Mitigation Measures
All project interventions will be appropriately designed to ensure minimum impact on the environment by ensuring.
Safe disposal of back wash water through evaporation pond.
Safe disposal of sludge through specific treatment method.
Proper maintenance of distribution pipe lines & treatment system.
4.4 Objectives of EMF The proposed Bihar Rural Water Supply and Sanitation Project will finance investments in rural water supply and sanitation improvement schemes to serve the rural populations in Bihar. The project interventions are, therefore, expected to result in public health benefits in the rural communities, through improved quality and delivery levels of RWSS services. Some of the main environmental health benefits expected under the project include: increased and better quality water supply for drinking, cooking, washing, bathing and cleaning purposes; time and energy savings through providing water supply closer to homes; improvements in personal hygiene and village sanitation levels; and reduced faecal oral contamination of drinking water resulting in lower occurrence of diseases. While the proposed project interventions are expected to result in overall environmental and public health improvements in the state, potential adverse environmental impacts can occur if the schemes are not properly designed, sited, implemented, and maintained. In order to ensure that the environmental issues are systematically identified and addressed in the various stages of the implementation of subprojects, an Environment Management Framework (EMF) has been developed for this project. The specific objectives of the EMF are as under:
To provide a systematic approach for identifying the various possible environmental impacts at the different stages of the scheme cycle.
To identify appropriate mitigation measures for addressing the identified environmental impacts.
To devise an institutional arrangement for mainstreaming environmental management in project implementation processes.
4.5 Components of the EMF
4.5.1 Main Elements of the EMF
The main elements of the EMF that may be applied to the BSWSM sponsored scheme are discussed below:
4.5.1.1 Basic Environmental Data Collection
The EMF requires that basic environmental data related to the proposed scheme(s) be recorded at the initial field data collection stage. For this purpose, Environmental Data Sheets (EDS) have been formulated for schemes on water supply, sanitation, solid and liquid waste management, etc. The formats for the EDSs for different types of schemes have been provided in Annexure 18. The AEE/EE of PHED will ensure the compilation of the information in the EDS with assistance from VWSC, GPWSC and with the facilitation support of the NGO/SO.

124
4.5.1.2 Environmental Classification of Schemes
At the Detailed Project Report (DPR) preparation stage, the available environmental information in the EDS will be evaluated and examined. Based on the level of expected environmental and public health impacts, the proposed scheme(s) would be classified as either Category I (limited environmental impact) and Category II (significant environmental impact) projects. For Category II schemes, detailed environmental appraisal will be required. The screening tool for the categorization of schemes is provided below. The environmental classification of schemes by using the screening tool will be undertaken by the EE of PHED. Please refer to annexure 3 for screening the category I and category II schemes.
In addition to actions mentioned above, the following points should be considered while developing projects or their design. Projects that fall under any of the criteria below should not be considered, and redesigning may be required.
Project or activities that destroy, encroach upon, degrade or damage or may risk the degradation of any protected area or reserve forest, or any biodiversity conservation hotspots, such as wildlife sanctuaries or national parks, and other significant natural reserves and areas
Any project that is not consistent with the State Forest Act
Project or activities that destroy or encroach upon wildlife migratory routes, corridors or fly paths
Activities that destroy or disturb any historical and culturally valuable sites, including archaeological sites. In case there is no choice but to pass near such as site, relevant laws and departments must be consulted for appropriate designing activities. For culturally valuable sites, consultation with the local population is a must.
Projects that result in environmental/natural resource degradation, such as watershed degradation, create or trigger landslides or result in resource degradation
Projects or activities involving the procurement of pesticides not allowable under Bank guidelines
Projects that are not consistent with the National, State or World Bank’s regulations
4.5.1.3 Environmental Appraisal and Approval
For the category I schemes, there will be no separate environment appraisal other than the EDS. For category II schemes, detailed environmental appraisals of the proposed schemes will be required. This will be done by the District Level Environmental Specialist (DES) attached to DPSU. In extreme cases, where the district level resources are not enough for conducting the environmental appraisal and formulating the appropriate mitigation measures, support from the Environmental Specialist at the state level (ES, as described later in this chapter) will be sought. The desired qualification of the State Level Environmental Specialist is included in Annexure 17. The environmental appraisal for category II schemes should be done within a month.
The Detailed Project Report (DPR) for category I schemes should be accompanied by the Environmental Data Sheet (EDS). This is the responsibility of the EE of PHED. The

125
Detailed Project Report (DPR) for category II schemes should be accompanied by the Environmental Data Sheet (EDS) as well as the environmental appraisal. The EE of PHED will confirm that these are taken care of.
4.5.1.4 Environmental Compliance Monitoring during Implementation and O&M phases
The EMF will ensure that:
1. The prescribed environmental mitigation measures (please refer to the EMP in Annexure 4) as identified through the environmental appraisal process are to be adequately implemented. The Implementation Completion Report of each scheme will include an Environmental Compliance Certificate given by the VWSC/GPWSC for SVS and DWSC for MVS indicating that the mitigation measures identified in the appraisal are implemented.
2. Regular supervision and monitoring including an independent external audit (Annexure
20) is to be conducted, as a part of the overall project monitoring program.
3. Capacity building and IEC activities are to be conducted to make sure that the EMF including evaluation, supervision, and monitoring have been implemented. This will also help community awareness on personal hygiene, environmental sanitation, water conservation, etc.
4.5.2 Application of EMF to Project
In order to mainstream environmental management and ensure that the EMF is
properly implemented for all the Drinking Water and Sanitation schemes, the EMF
needs to be integrated in the scheme cycle for all stages including Development,
Implementation and O&M. The table below (Table 4.2) provides an overview of
various EMF activities of the proposed scheme cycle for the project sponsored
schemes. The responsibilities and expected outcomes are mentioned against the
respective tasks.

126
Table 4.2 Matrix of Roles and Responsibilities for EMF implementation
Phase EMF
Activity
Objectives Process Responsibility Result
Desig
n and
Devel
opme
nt
Environmen
t related
Data
Collection
Baseline
environmental
data collection
related to
proposed
schemes to
assess
environmental
impacts.
Field visit, discussion with
the community to be
benefitted from the schemes
to identify environmental
issues and complete the
EDS.
VWSC, GPWSC
under the
guidance of
AAE/AE/SDO of
PHED in
consultation
with DES
Environmental
data sheet
filled up and
attached to PSR
and DPR.
Environmen
tal Screening
of schemes
To identify
environmental
issues early in
the project
intervention
cycle,
designing
environmental
improvements
into projects.
Study of the environmental
impacts of various stages of
project intervention
activities. Schemes will be
categorized as category I and
category II based on the
magnitude of the
environmental issues.
VWSC, GPWSC
under the
guidance of
AAE/AE/SDO of
PHED in
consultation
with DES
Identification
of
environmental
issues, and
scheme
categorization
(Category I and
category II)
Environmen
tal Appraisal
and
Approval
To ensure that
relevant
environmental
issues have
been identified
and
appropriate
mitigation
measures have
been developed
to address
them.
For category I schemes, there
shall be no separate
environment appraisal but
the environmental issues will
be included in the normal
appraisal and evaluation
process for the proposed
scheme, based on the EDS
The
environmental
assessment for
category I will
be done by the
District
Environment
Specialist (DES)
/ DPSU. For
Category II
schemes, ES will
help the DPSU.
Environmental
appraisal and
approval of the
proposed
scheme, with
decision to (i)
accept scheme
as submitted,
or (ii) accept
scheme with
modifications
suggested in
the
environmental
appraisal.
For Category II schemes, an
independent environmental
appraisal of the proposed
scheme is required. This
includes evaluation of
environmental and public
health impacts and risk
assessment
To ensure that
mitigation
measures and
their costs are
integrated in
scheme design
and
implementatio
Environmental Clearance
from DPMU will be required
for Technical Approval for
the schemes
EE for Category
I schemes and
SE for category
II schemes
Technical
approval for
scheme with
environmental
mitigation
measures and
accordingly its
costs are

127
Phase EMF
Activity
Objectives Process Responsibility Result
n plans integrated in
scheme design
and
implementatio
n plans.
Imple
menta
tion
Implementat
ion of
Environmen
tal
mitigation
measures
To ensure that
the prescribed
environmental
mitigation
measures are
implemented
Implementation Completion
Report (ICR) for scheme will
need to include compliance
certificate that all prescribed
environmental mitigation
measures have been
implemented.
VWSC for
single-village
schemes;
DWSC for
multi-village
schemes and
sewerage
schemes.
ICR completed
with
environmental
compliance
information
O&M Environmen
tal
supervision,
monitoring,
and
evaluation,
IEC and
capacity
building on
hygiene and
environment
al health
issues
To ensure that
environmental
aspects are
integrated in
the O & M
phase
Water quality monitoring
will be conducted as per
water quality monitoring
protocol.
Internal supervision will be
conducted for 30% of the
schemes completed once in a
year.
Environmental Audit
through external agency will
be conducted once in a year
by selecting about 15% of
schemes completed
IEC on waste disposal/
/sullage treatment in
villages, (ii) personal and
public hygiene, and (iii)
water conservation.
State Level
Environmental
Specialist (ES)
supported by
District Level
Environmental
Expert (DESs).
Water quality
monitoring
reports.
Periodic
environmental
supervision,
monitoring and
audit reports.
Training and
IEC
activity reports.
4.5.4 Environmental Management Plan
The Table below summarizes the environmental management plan that identifies the potential issues of various activities that are anticipated in the design and development, construction, and operation phases of the upcoming drinking water and sanitation schemes in Bihar state. The environmental management plan ensures to suggest appropriate mitigation measure against the issues/concerns identified for different

128
stages of project implementation viz. design and development, implementation, and O&M stage (Annexure 4).
4.5.5 Arrangements for Supervision, Monitoring and Environmental Audit of the Schemes
4.5.5.1 Environmental supervision: A sample of 30% of the completed schemes will be
visited at six monthly intervals by a team from the DWSC (including DES) to check if all
safeguard requirements are met and to identify any issues that need to be addressed.
The selected sample will have representation of both Category I and Category I1
schemes in water supply, sanitation and waste management. Annexure 19 gives details
of the sampling procedure for the supervision and Annexure 22 gives the format of the
supervision report. However, internal environmental monitoring will be done as part of
the regular monitoring by PHED.
4.5.5.2 Monitoring of relevant external environmental parameters: Once every year,
the state Project Monitoring Unit (SPMU) will prepare a report of the environmental
situation in the state including data and analysis of relevant parameters such as rainfall,
depth to water levels, status of groundwater basins, incidence of water borne diseases,
etc., as well as a listing of relevant new legislation and regulations that have a bearing on
the environmental performance of the project. The EMF will be suitably revised
annually on the basis of this document by the SPMU. It is suggested that the DPMU
supervise all the schemes on a monthly basis, SPMU monitor on a quarterly basis and
NPMU on an half yearly basis.
4.5.5.3. Environmental audit: Once every year, the SPMU will appoint an external
agency to undertake an independent audit of the environmental performance of the
project. 15% of the completed schemes will be covered in the audit having
representation of both Category I and Category I1 schemes in water supply, sanitation
and waste management. The Annexure 20 presents details of sampling and the
Annexure 23 gives a list of performance indicators to be used in these audits. A mid-
term and end term review of EMF may be carried out by third party agencies.
4.5.6 Overall coordination
The Director of BSWSM will supervise overall EMF implementation, and coordinate with SPMU and DPMU. There would also be periodic monitoring and supervision by the World Bank, to ensure compliance with the respective safeguard policies.
Monitoring of the water supply and sanitation schemes will be conducted by the use of certain performance indicators (Table 4.3). These indicators will be evaluated as follows:

129
Table 4.3 Monitoring of Performance Indicators during Operation Phase
Monitoring of Performance Indicators during Operation Phase
Sl.
#
Project Intervention/
Component
Performance Indicators Frequency Monitoring
Agency
Water Supply Schemes
1 Water Availability Safe drinking water supply of a
minimum of 70 lpcd to the target
communities
Once every 2
weeks (for 1st
6 months)
followed by
once per
month.
VWSC and GPWSC
(for SVS), DWSC
(for MVS) with
help from SLCs.
2 Water Quality Water (drinking water and
sanitation) quality testing
Monthly GPWSC/VWSC
with supervision
from DPMU
Independent water quality
monitoring
Half yearly Independent WQ
consultant
appointed by
PHED/BSWSM
3 Groundwater Table For schemes with groundwater as
the source of water supply.
Monthly GPWSC/VWSC
with supervision
from DPMU
4 Water Treatment
Backwash quality and
disposal practice
Monitoring of backwash quality
and the manner in which it is
disposed.
Monthly GPWSC/VWSC
with supervision
from DPMU
Sanitation System
5 Sanitation (Public) Increased access of household to
common sanitation system.
Half Yearly GPWSC and Block
Coordinators
6 Sanitation (HH) Increased access of individuals to
HH latrines.
Half Yearly GPWSC and Block
Coordinator
7 Health Improvement in Key Health
Indicators such as reduced faecal
contamination.
Monthly Block Coordinator
and DES (DPMU)
8 Better External
environment
Aesthetic value of surrounding
environment to be monitored
including odor, flies, pestilence
etc.
Monthly Block Coordinators
and DES (DPMU)
9 Industrial waste
discharge, if any
Checking of pretreatment of
waste and its characteristics
Quarterly Block Coordinator
and DES (DPMU)
10 Sludge Quality pH, BOD, COD, Sodium,
Potassium, Nitrogen,
Phosphorous, alkalinity/acidity,
and Heavy metals such as Cd, Ag,
Zn, and Cu
Half Yearly Block Coordinator
and DES (DPMU)

130
4.6 Institutional Arrangement
4.6.1. Village level Institutions
4.6.1.1 Village Water & Sanitation Committee (VWSC)
VWSC will be the village level institution set up as a subcommittee of the Gram Panchayat led by the Head of the Gram Panchayat. This committee is expected to take the responsibility for all activities related to BSWSM at the village level. The VWSC will be the implementing body for SVS and monitoring body for intra-habitation aspects of all other water schemes. The VWSCs will be supported by (non-government) Support Organizations (SOs), selected for a cluster of villages within a particular geographical boundary. These SOs (part of DPMC) will support the VWSCs in all activities from the initial planning to monitoring afterwards, providing support for community development and external liaising.
The responsibility of facilitating, planning and implementation of EMF activities at the village level is vested with the VWSC and SOs. The SOs would also have particular responsibilities concerning the EMF, like facilitation of the VWSC's participation in filling up the EDS, in certifying the implementation of the environmental mitigation measures, in identifying and meeting capacity building needs, etc. The JE/AEE/EE will support the VWSC and SOs in the execution of these functions. BSWSM will develop capacities of both VWSC and SO through training and other information sharing measures to execute these functions effectively.
4.6.1.2 Gram Panchayat (GP)
GPWSC will be responsible at the GP level for a number of activities including all approvals required through the passing of resolutions, tariff fixation and guidance to the VWSCs.
4.6.1.3 Scheme Level Committee (SLC) for MVSs
The Scheme Level Committee (SLC) will have one member from each of the VWSCs within the GPs covered by the Multi Village Schemes (MVS). This committee will be chaired by the Executive Engineer, PHED. With regard to the MVSs, the decisions regarding environmental appraisal, implementation of mitigation measures, supervision will be jointly taken up by the PHED in consultation with the SLC.
4.6.1.4 Block Level
Block Resource Centers (BRCs) should be to be made functional and Block Coordinator
and Cluster Coordinators will be appointed. BRCs will coordinate in providing
necessary capacity building support to the VWSCs particularly in the IEC area
4.6.1.5 District Level
The district level institutions comprises of the District Water & Sanitation Mission (DWSM), which would coordinate the overall activities of all Rural Water and Sanitation Programs and activities in the district. DWSM will be headed by Zilla Parishad President. District Project Monitoring Units (DPMUs) would be set up at the district level in all World Bank Program districts on a priority basis. These DPMUs would have
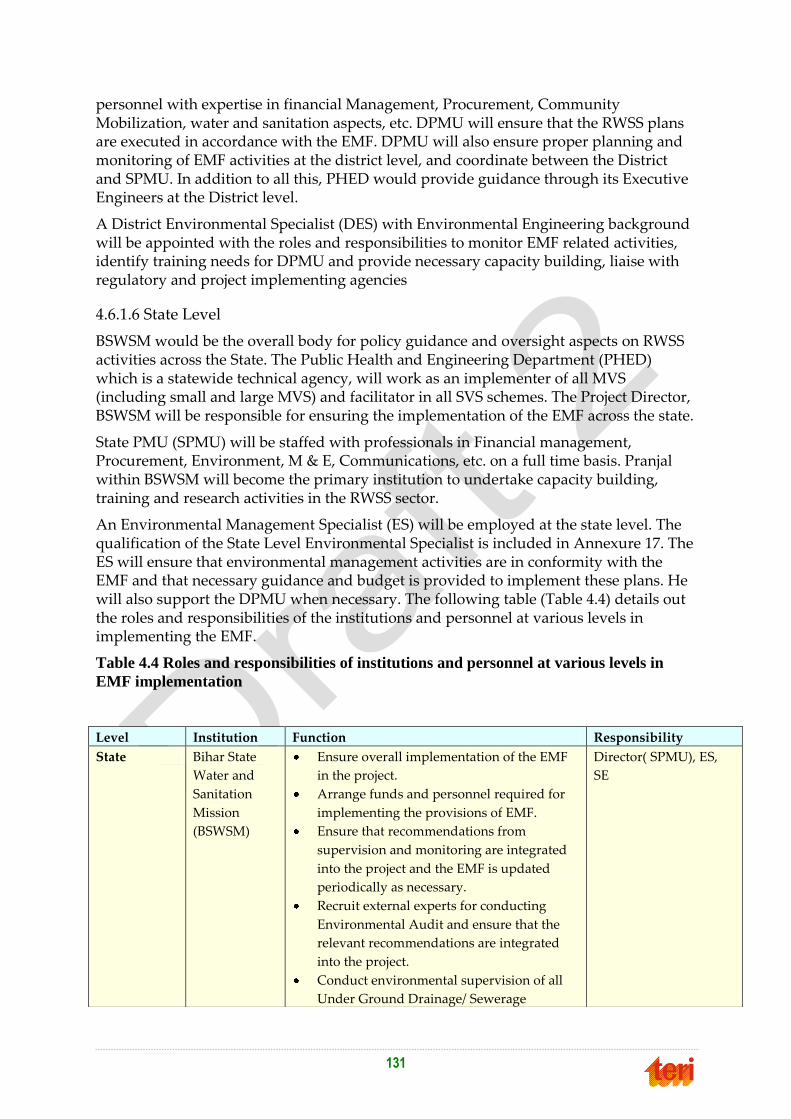
131
personnel with expertise in financial Management, Procurement, Community Mobilization, water and sanitation aspects, etc. DPMU will ensure that the RWSS plans are executed in accordance with the EMF. DPMU will also ensure proper planning and monitoring of EMF activities at the district level, and coordinate between the District and SPMU. In addition to all this, PHED would provide guidance through its Executive Engineers at the District level.
A District Environmental Specialist (DES) with Environmental Engineering background will be appointed with the roles and responsibilities to monitor EMF related activities, identify training needs for DPMU and provide necessary capacity building, liaise with regulatory and project implementing agencies
4.6.1.6 State Level
BSWSM would be the overall body for policy guidance and oversight aspects on RWSS activities across the State. The Public Health and Engineering Department (PHED) which is a statewide technical agency, will work as an implementer of all MVS (including small and large MVS) and facilitator in all SVS schemes. The Project Director, BSWSM will be responsible for ensuring the implementation of the EMF across the state.
State PMU (SPMU) will be staffed with professionals in Financial management, Procurement, Environment, M & E, Communications, etc. on a full time basis. Pranjal within BSWSM will become the primary institution to undertake capacity building, training and research activities in the RWSS sector.
An Environmental Management Specialist (ES) will be employed at the state level. The qualification of the State Level Environmental Specialist is included in Annexure 17. The ES will ensure that environmental management activities are in conformity with the EMF and that necessary guidance and budget is provided to implement these plans. He will also support the DPMU when necessary. The following table (Table 4.4) details out the roles and responsibilities of the institutions and personnel at various levels in implementing the EMF.
Table 4.4 Roles and responsibilities of institutions and personnel at various levels in
EMF implementation
Level Institution Function Responsibility
State Bihar State
Water and
Sanitation
Mission
(BSWSM)
Ensure overall implementation of the EMF
in the project.
Arrange funds and personnel required for
implementing the provisions of EMF.
Ensure that recommendations from
supervision and monitoring are integrated
into the project and the EMF is updated
periodically as necessary.
Recruit external experts for conducting
Environmental Audit and ensure that the
relevant recommendations are integrated
into the project.
Conduct environmental supervision of all
Under Ground Drainage/ Sewerage
Director( SPMU), ES,
SE

132
schemes.
District District Water
and
Sanitation
Mission
(DWSM)/DW
SC
Training and Capacity Building of SOs,
GPWSC, VWSC
Environmental Management on EMF.
Coordination among various organizations
and personnel involved in EMF.
Coordinate with other line departments on
environment related issues
SE, EE, AEE, supported
by DES
District
Project
Management
Unit (DPMU)
Day-to-day management, responsible for
undertaking all activities necessary for
implementation of the EMF.
Carry out regular monitoring and
supervision of the EMF implementation
through appropriate mechanisms
Supervising the accuracy of the
environmental appraisal conducted by
EE/AEE, PHED as part of the scrutiny of the
schemes - including checking if the
screening is accurate, if the Environmental
Data Sheet has been filled in as required etc.
Evaluation of EDS and categorize the
scheme into one of the categories I (limited)
& II (significant).
Conduct Category II environmental
appraisal using the Detailed Appraisal
Sheet, if required or in cases where external
technical support is required for conducting
Category II appraisal - forwarding to the SE
for decision on selection of suitable expert
for conducting detailed appraisal for
category II schemes and preparation of
Detailed Appraisal Sheet (DAS) to identify
the environmental impacts and designing
mitigation measures. The mitigation
measures are included in Environmental
Management Plan (EMP) to be implemented
along with various components of the
scheme.
Conduct supervision visits to 20% of the
completed schemes twice in the year (in
coordination with the PMU).
Provide technical advice and guidance on
environmental management to SO, GPWSC,
VWSC
Provide inputs to DWSC on relevant
environmental policies.
Ensure capacity building of all stakeholders
in environmental management.
Design and implement IEC campaigns on
SE, EE, DES

133
environmental management.
Maintain a database consisting of relevant
baseline environmental information of the
district, environmental appraisal of the
various ongoing and completed schemes,
Coordinate with institutions, agencies and
individuals relating to environmental
management including the regional offices
of the BPCB, Water Resources Department,
Minor irrigation department, Central
Ground Water Board, Forest Department
etc.
Collect, collate and publish data and
information on EMF implementation in the
project
Block Block
Resource
Centers
(BRCs)
Environmental management and
monitoring of projects at the Block level.
As part of the scrutiny of the schemes
submitted by the GP- will check if
environmental screening and appraisal has
been properly done before forwarding them
to the DPMU.
Coordination with NGOs for ensuring
integration of EMF in all relevant project
activities including capacity development,
communication, project management and
supervision.
AEE, JE, Block
Coordinator
Village Village Water
and
Sanitation
Committee
(VWSC)
Participation in preparation of
Environmental Data Sheet (EDS) to be
enclosed to Detailed Scheme Report (DSR).
The committee shall deliberate on
environmental safeguards relevant to the
schemes and adopt the same during
construction and implementation
Certifying the implementation of
environmental mitigation measures as part
of the implementation completion report.
Facilitate IEC activities regarding water
conservation, sanitation and hygiene among
the villagers.
VWSC,
SO, JE
Support
Organizations
(SO)
Provide support to the AEE/JE, PHED in
preparing the EDS.
Facilitating participation of the community
in preparation of EDS and in certification
process (for environmental mitigation
measures) for implementation completion
report.
Liaison with BPCB, Water Resources
Department, Minor irrigation department,
Heads of SO

134
4.7 Training and Capacity Building
4.7.1 Objectives
The objective of training and capacity building initiatives is to build and strengthen the capability of rural water and sanitation service delivery institutions (SPMU and PRANJAL) and other partners (NGOs, Contractors, Sanitation coordinators, Consultants in the Water and Sanitation sector and other field level stake holders) to ensure tangible skill enhancement of the stakeholders and to integrate sound environmental management into water and sanitation service delivery.
4.7.2 Training Needs Assessment (TNA)
In Bihar, it is required to empower Village Water and Sanitation Committee (VWSC) and to measure the impact of training and progress of sanitation in the state. Workshops need to be organized periodically for Training Needs Assessment of various stake holders with the following objectives:
i.) Identifying gaps in the existing set of knowledge, skills and capabilities of the existing Public Health Engineers, Sanitation Coordinators, and different stake holders of VWSC etc.
ii.) Identifying issues and means to upgrade the existing set of knowledge and skills in order to upgrade the efficiency of the various stake holders.
A SWOT (Strength, Weakness, Opportunities, and Threat) analysis has been conducted to understand the state of the existing RWSS system in Bihar (Table 4.5).
Central Ground Water Board, Forest
Department and other related departments
at scheme level for ensuring
implementation of identified mitigation
measures (permissions, technical support,
etc.).
Provide support in execution of the IEC
activities on EMF.
Provide support to the PHED in the
supervision, monitoring and audit activities
of the EMF.
Train the VWSC/GPWSC in conforming to
EMF requirements in operation and
maintenance of Under Ground Drainage
Sewerage schemes.
Scheme Level
Committee
Participation in EDS preparation of MVS.
Participation in certification process for
implementation of environmental
mitigation measures as part of
implementation completion report.
To make efforts for spreading awareness
regarding sanitation and hygiene among the
member villages of the MVSs.
President, VWSC, SO,
AEE/JE (PHED)

135
Table 4.5 SWOT analysis of the existing RWSS system in Bihar
Strengths Weakness State level A state level WATSAN mission to coordinate and
monitor activities amongst various departments, to
delegate power, to approve plans and budgets
Partnerships with development organizations like
UNICEF, WaterAid, Swasth, Viswash would enhance
the technical capacity and knowledge sharing of
BSWSM, PHED and other implementing
organizations
District and block level A good understanding among the field staff of the
WATSAN problems/issues on the ground and
challenges in implementation of schemes
Panchayat level Empowerment of the PRIs through decentralization
measures helps in localized planning and faster
decision making
Accountability and transparency measures in the
proposed schemes will ensure the proper utilization
of funds
Existence of State and district PMUs with the required
expertise would ensure the proper implementation of
the schemes and would enhance the state agency’s
knowledge and expertise for implementing future
schemes
A designated primary institution to undertake
capacity building, training and research activities in
RWSS sector would strengthen coordination and
success of these programs
Shortage of staff at the block level in
some of the sampled districts,
especially JEs and AEs (around 50%)
can prove to be a hindrance to the
proper implementation, operation
and monitoring of the schemes
A lack of comprehensive
understanding among the field staff,
of the environmental implications of
the WATSAN issues and challenges
on the ground
A lack of a proper engineering and
technical evaluation of the ground
situation and planning to handle
environmental risks prior to or
during implementation of the scheme
Currently, lack of local level
organizations like VWSCs/GPWSCs
may hinder implementation of
various programs.
Lack of civil society participation in
decision-making at the local
government may affect the
performance of WASH sector in Bihar
Opportunities Threats The BSWSM with the functional responsibility to
organize workshops and seminars, can leverage these
opportunities to create awareness about
environmental issues related to RWSS amongst the
different stakeholders
Convergence of water and sanitation measures:
preparation of comprehensive water security and
environmental sanitation plans for each of the
habitation.
Coordination with other schemes like MNREGA
would help in integrated planning of these schemes at
the local level
The proposed World Bank project provides an
opportunity for the PHED/BSWSM to identify
competent contractors/bidders, as prequalification
procedures requires strong capability (technical,
financial and business)
Lack of proper monitoring and
mitigation of the environmental
issues resulting from the schemes
No system in place to transfer the
responsibility of operation and
maintenance of the existing schemes
(water treatment) from the private
contractors to govt. departments or
local organizations.
Tight project deadlines may lead to a
lax attitude among project
implementers toward adherence to
environmental safeguards
Skills acquired through capacity
building for environmental
management may lead to exodus of
employees due to their increased

136
Presence of local NGOs provides the opportunity to
engage themselves effectively in the program
implementation and awareness activities
competencies
Lack of experience of the Gram
Panchayats in the RWSS activities
and the absence of VWSCs at the local
level would make implementation of
the schemes difficult at the local level
4.7.3 Training Approach
The training programme could be based on the felt need, relevance and principle of sustainability as well as the recommendations from the Training Need Assessment workshops.
An enabling condition should be created for stake holders to understand and implement programmes on rural drinking water and sanitation (as per NRDWP guidelines). Special emphasis needs to be given to participatory techniques, community facilitation and communication skills and gender based approaches.
4.7.4 Institutions for Training
In view of the specialized training and capacity building envisaged under the EMF of the project, it is necessary to identify nodal training institutes that will work closely work with capacity building of Bihar State Water Sanitation Mission (BSWSM) for conceptualizing, designing, conducting and managing training programs on the EMF.
Some such specialized institutions are:
Communication and Capacity Development Unit (CCDU)
Bihar Institute of Rural Development (BIPARD)
PRANJAL
Key Resource Centres in Water and Sanitation (KRCs)
4.7.5 Details of Training Programmes
4.7.5.1 TI. Training on the Environmental Management Framework
Purpose of the training:
To equip with knowledge and skills necessary for undertaking environmental appraisal
as per the requirements of the EMF To prepare for undertaking periodic supervision of environmental performance of
schemes
To prepare for implementing Community Based System for Water Quality Monitoring and Surveillance
Participants: Key officials of the project including AEE/AE, EE, SE as well as State and
District Level Environmental Experts and District Resource Persons – Environmental Management. The superintending Engineer of the district will be responsible for selection of
suitable candidates for the training, and the expenses will be borne by the overall project
capacity building budget.

137
Schedule: The training will include an initial orientation workshop, a main and annual
refresher training workshops on environmental assessment. The main and refresher training programs will be for duration of 2-3 days each, whereas the initial orientation workshop will
be of one day duration. Five Training programs will be conducted during the first year and 5
refresher programs per year will be conducted for the next 4 years. This will total to 25 programs.
4.7.5.2 T2. Training on Environmental Management
Purpose of the training:
To equip with knowledge and skills necessary for meaningful participation in the
environmental appraisal as per the requirements of the EMF
To prepare for planning and monitoring implementation of environmental mitigation measures identified through the appraisal process
To equip with skills necessary for water quality testing using the field kits under the
Community Based System for Water Quality Monitoring and Surveillance
Participants: SOs, members of VWSC and GPWSC – Environmental Management.
The Superintending Engineer of the district will be responsible for selection of suitable
candidates for the training, and the expenses will be borne by the overall project capacity building budget.
Schedule: The training will include an initial orientation workshop, a main and annual
refresher training workshops on environmental assessment. The main and refresher training programs will be for duration of 2-3 days each, whereas the initial orientation workshop will
be of one day duration. There will be about 1000 GPWSCs and VWSC and about 100 SOs
totalling to about 1,100. At about 50 per batch there will be about 22 training programs.
Considering that an equal number of refresher trainings will be conducted, the total T2
training programs will be about 44 for the project duration.
4.7.5.3 T3. Environmental Awareness and Sensitization
Purpose of the training:
To build awareness on safe drinking water, water conservation, environmental
sanitation and personal hygiene.
Participants: AEEs/ AEs, SOs, Members of GPWSC and NGOs.
Schedule: The training will involve one day workshops at the VWSC level. There will also
be one day refresher workshops organized annually. There will be about 1000 GPWSCs and
VWSCs and about 100 SOs totalling to about 1100. At about 50 per batch there will be about 22 training programs. Considering that an equal number of refresher trainings will be
conducted, the total T3 training programs will be about 44 for the project duration.
4.7.5.4 T4. Quality Construction Practices for Artisans
Purpose:
To equip with knowledge and skills for quality construction and maintenance of
water and sanitation structures (including aspects of environmental conservation,
human health and safety, etc.)

138
Participants: Masons, mechanics, electricians, plumbers etc., and for the contractors'
workforce involved in the project.
Schedule: The training will involve one day workshops at the VWSC level. There will also
be one day refresher workshops organized annually. There will be about 1000 artisans at one
per GPWSCs and VWSCs and about 100 resource persons totalling to about 1100. At about 50 per batch there will be about 22 training programs. Considering that an equal number of
refresher trainings will be conducted, the total T4 training programs will be about 44 for the
project duration.
The number of suggested training programs is presented in Table 4.6 below:
Table 4.6 Number of Training Programs
About 40 to 50 trainees would participate in each of the training programs. It is intended that these trained persons will in turn provide onsite training to RWSSD staff, SOs, GPWSCs, VWSCs, NGOs, Contractor staff, etc. onsite at village level.
4.7.6 Budget for training on environmental management
The total estimated cost of training on environmental management for members of GPWSCs, VWSC, NGOs/ SOs, Engineers of RWSSD, and artisans, under the proposed plan is presented in the Table 4.7 below.
Table 4.7 Estimated Cost of Training
Sl No Training Topic Number of trainings
1 T 1 - Environmental Management Framework
25
2 T2 - Environmental Management
44
3 T3 - Environmental Awareness and Sensitization
44
4 T4 - Quality Construction Practices for Artisans
44
5 Total 157
Sl No Activity Amount in Rs
1 Training and workshops (as estimated)
62,20,000
2 Internal supervision visits @ Rs. 10.0 lakhs per year for 5
years
50,00,000
3 Environmental Audit by the external agency once in a year (5
Nos) @Rs. 10.0 lakhs per year
50,00,000
4 Preparation of specific environment related community
awareness materials @ 1 lakh per district and 5 lakh at state
level
43,00,000
5 EA for Category 2 Schemes @ 10 lakhs per year for 5 years. 50,00,000
6 External Environmental Monitoring @ Rs. 2.0 lakhs per year
for 5 years (Includes remuneration to MRPs, DRPs and other
resource persons)
10,00,000

139
Table 4.8 Budget for Environmental Management
The total budget for environmental management activities under the proposed RWSS project has been worked out as approximately Rs. 2.92 crore. The detailed breakup of the
budget is presented in Table 4.8 below.
4.8 Budget for external audit of the category II schemes
The Multi-village Drinking water schemes (both simple and large) are category II
schemes with significant environmental impacts. A cost estimate has been made for
external audits of the proposed MVS (Table 4.9).
Table 4.9 Budget for external audit of the category II schemes Schemes 2013/14 2014/15 2015/16 2016/17 2017/18 Total
Small MVS 3 3 4 0 0
Supervision sample 1 1 1 0 0
Cost @Rs.
100,000/scheme
100,000 100,000 100,000 0 0
Large MVS 1 1 0 2 2
Supervision sample 1 1 0 1 1
Cost @Rs.
300,000/scheme
300,000 300,000 0 300,000 300,000
Cost 400,000 400,000 100,000 300,000 300,000 1,500,000
Sub Total 2,65,20,000
Contingencies @, 10% 26,52,000
Total 2,91,72,000
Sl
No. Training No. Of
Programs
Estimated unit
cost in Rs.
Total cost in
Rs.
1 T 1 - Environmental Management
Framework
25 50,000 12,50,000
2 T2 - Environmental Management
44 50,000 22,00,000
3 T3 - Environmental Awareness and
Sensitization
44 20,000 8,80,000
4 T4 - Quality Construction Practices for
Artisans
44 20,000 8,80,000
5 Workshops (State)
5 50,000 2,50,000
6 Workshops (District) 38 20,000 7,60,000
Total 62,20,000

140
4.9 Environmental Codes of Practice
4.9.1 Guidelines/Environmental Code of Practices
1. Guidelines/ Environmental Code of Practices (ECOPs) have been prepared for addressing the following environmental issues and are furnished in the Annexures as indicated.
2. Guidelines for Identification and Selection of water supply sources: The criteria for the selection of source for water supply are specified in Annexure 5.
3. Guideline for sanitary protection of water supply sources: The well to tap groundwater sources and intake arrangements to tap surface water sources are located at certain distance away from the pollution existing sources and the structures are protected with certain measures to protect the quality of water from getting contaminated. The detailed guidelines are furnished in Annexure 6.
4. Guidelines for Sustainability of groundwater Sources: The yield from the sources in general and ground water source in particular is likely to decrease during summer. In order to ensure sustainable yield throughout the year certain measures such as artificial recharge of the groundwater source with rainwater harvesting structures are necessary. These measures are furnished in Annexure 7.
5. Guideline for Water Quality Monitoring and Surveillance: The water quality of the sources and in the distribution system is deteriorating due to contamination especially after rains in surface water sources and in summer months in groundwater sources. Water quality monitoring should be undertaken periodically in order to take corrective measures if the quality changes. The procedure and protocol for water quality monitoring and surveillance are described in Annexure 8.
6. Selection and installation of safe sanitation technologies; the checklist for choice of technology and selection of location are furnished in Annexure 9.
7. Recommended Construction Practice and Pollution Safeguards for Twin Pit Pour Flush toilets: Twin Pit Pour Flush Latrines (TPPFL) are the most commonly adopted sanitation technology which is suitable in most of the environmental conditions except coastal areas with high groundwater table. Recommended construction practice and Pollution Safeguards for TPPFTs are described in Annexure 10.
8. Guidelines for Safe Sullage Disposal at Household and Community Levels: greywater/sullage disposal at village level is very important for maintaining the hygiene in and around the place; the guidelines for safe sullage disposal are described in Annexure 11.
9. Guidelines for safe sullage disposal and Organic waste management: Guidelines for managing sullage and organic waste disposal at household and community levels are described in Annexure 12.

141
AAnnnneexxuurree 11 EEnnvviirroonnmmeennttaall AAsssseessssmmeenntt
QQuueessttiioonnnnaaiirreess
Village Level Environmental Assessment (used in Focused Grouped
Discussion)
Environmental Assessment Questionnaire (Village level)
Name of district: Name of block:
Name of Gram panchayat: Name of village:
Date of survey: Name of respondent:
Interviewer's name: Respondent’s Contact no:
General Information
1 Terrain of the area Plain Rolling Hilly
2 Area in Acres
3 Population Total: ( SC…….,ST……….,OBC…….GEN…….)
4
Total number of
Households
5
Historical/Cultural
important sites
6
Critical natural habitats
(forest, lake recognized by
govt.)
6 Type of Roads Bituminous/Cemented/Brick paved/Kachcha/others
7 Average width of Road in m
8 Type of soil Alluvial ____ Silt ____ Silty clay ____ Sandy _____ Sandy clay ______
other _____
Water Supply
1 Sources of water (no. of sources) Canal/River Groundwater Other
2 Whether the proposed water
supply scheme is Single Village: Mini WSS / Rural WSS
Multi village: Small MV / Large MV

142
Hand pump : with attachment / without attachment unit
3 Any up gradation of the
existing scheme Yes / No, If yes, what type of upgradation……
4 Type of Water Supply & number
of units (working & non-
working)
1. Open Well 2. Tube well 3. Public Tap/Departmental
supply 4. Hand pump 5. Any Other (Pl specify)
5 Is there problem of water
shortage/scarcity?
If yes, which season?
6 In case of piped water supply,
capacity of overhead tank
7 Service Level of Water Supply in
lpcd
9 Groundwater Level
Is there any change in GW level
in last 5-10 years?
a)Shallow (0-20ft.) b)Moderate (20-40 ft.)
c) Deep aquifer (40 – 80 ft.) d) Very Deep (above 80 ft.)
Yes/No, If yes, increase or decrease?
10 Intensity of Rainfall Low Medium High
11 Has your village faced any such
problems in past 5-10 years?
Drought Yes / No.
Flood Yes / No.
If yes, in which month and year?
11 Any water treatment system (for
any specific contamination)
Yes No
If yes, what type of treatment system:
Is it cost effective? Yes / No Capital cost Rs._______O&M cost
Rs.___
Who takes care of O&M?
12. Mention the appropriate nature of the
quality problem
Fluoride Iron Heavy Metals
Bacteriological TDS Pesticide
Nitrate Others No Problem

143
13. Is there potential risk of contamination of
source due to
If yes, whether appropriate preventive/
corrective actions taken? (Write a note)
a. Industrial contaminants
b. Human waste discharge
c. Solid waste dumping
d. Use of agro chemicals (Fertilizers, pesticides etc?)
f. Mining site
17. Institution responsible for providing water supply and sanitation service?
a. Implementation__________________________
b. O & M ________________________________
18. Quality of service provided under O&M: Good_______________ Moderate _______________ Bad
__________________
Existing Sewerage and Sanitation Parameters
Presence of drainage facilities Sullage Sewerage
Current Sanitation
Practices
a) Borehole
latrine
b) Sing
le Pit Toilet
c) Twin Pit
Toilet
d) Toilet with
Septic tanks
e) Others (Open
Defecation)
Specify the Numbers of
above in respective
columns
Whether Existing Ponds are being used for Sewage Discharge a) Yes b) No
Is there water logging problem inside the village?
How many sites? Causes diseases?
Yes No
Sewage Treatment (if any) Yes No
How do you dispose your waste
water?
a. Earthen (Kattacha) drainage channel along the streets
b. Pukka drainage channel along the streets
c. Soak pit
d. Kitchen Garden
e. Any Other (please specify)
Is there any health & hygiene issue
due to sanitary discharges (or
existing sanitation practices)
Solid waste
1 How do you dispose your solid
waste?
a. Throwing in open places.
b. Disposing in open pits.
c. Disposing through burning

144
d. Any other …………
2 What are the different types of
solid waste generated?
3 Where do you dispose of fodder
waste dung?
4 Do you have compost pit for
fodder waste dung?
Yes or no
If yes; Location and distance from the house/village:
5 Is there any health & hygiene
issue due to disposal of fodder
waste dung
Health
1 What are the frequent illnesses in
your village and who is most
affected?
Diseases Reason perceived
Diarrhoea
Malaria
Typhoid
Any Skin disease
Others specify
2 How often is the disease
outbreak?
3 Was there a health epidemic due
to contaminated water in the past
2 yrs?
Potential environmental Risks during implementation & operation of schemes
1. Noise pollution during
construction of schemes
2. Air pollution (dust)
3. Soil quality/pollution
4. Clearance/cutting of trees
5. Pipe network crossing
forest/ sensitive/ sewrage
lines/ agricultural area
Yes/No
Yes/No
Yes/No
Yes/No
Operation
1. Disposal of backwash water
& sludge generated during
treatment process
Awareness
145
Any awareness programs
regarding water & sanitation
taken up?
Yes / No
How do you protect drinking
water sources?
Is there any occasion where the
whole village is cleaned &
sanitized compulsorily
Acceptance of interventions
1 Willingness to partially
contribute for an intervention
applied to your village or area
Yes No
Suggestions/Comments
3 Any other comments or
suggestions
4 Perception on environmental
Issues related to RWSS
5 Self-perception and suggestions
on Environmental Impacts and
issues
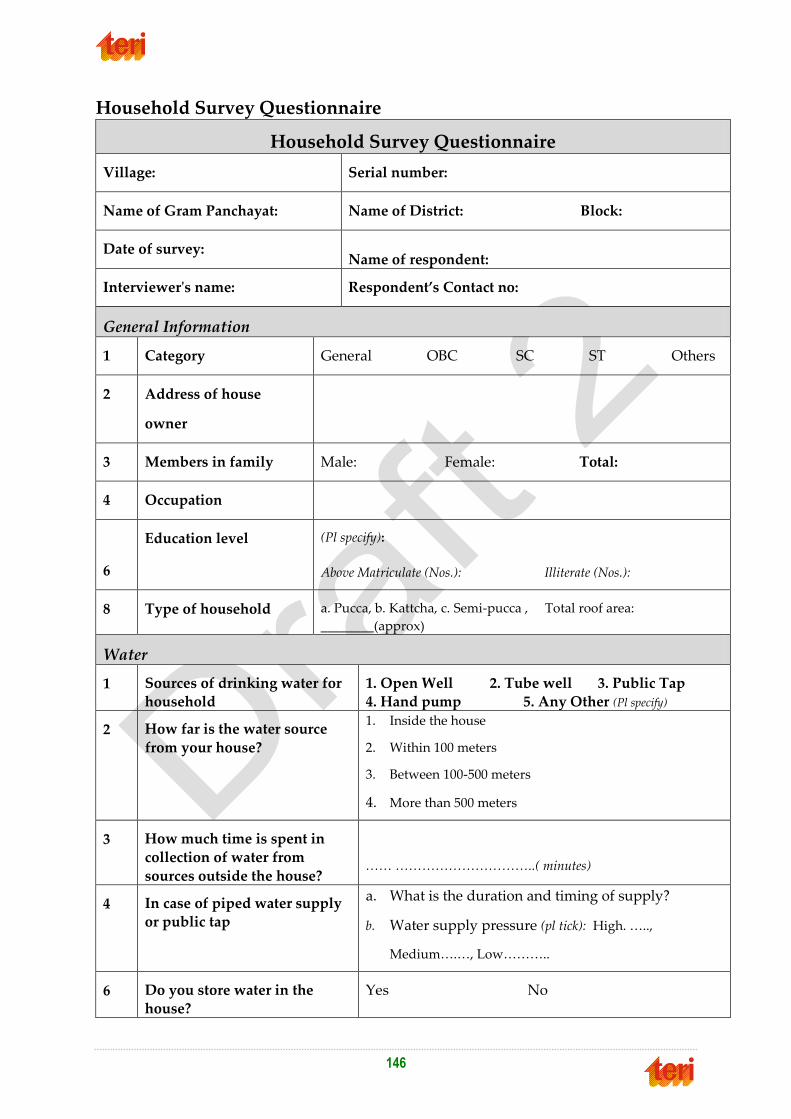
146
Household Survey Questionnaire
Household Survey Questionnaire
Village: Serial number:
Name of Gram Panchayat: Name of District: Block:
Date of survey: Name of respondent:
Interviewer's name: Respondent’s Contact no:
General Information
1 Category General OBC SC ST Others
2 Address of house
owner
3 Members in family Male: Female: Total:
4 Occupation
6
Education level (Pl specify):
Above Matriculate (Nos.): Illiterate (Nos.):
8 Type of household a. Pucca, b. Kattcha, c. Semi-pucca , Total roof area:
________(approx)
Water
1 Sources of drinking water for household
1. Open Well 2. Tube well 3. Public Tap 4. Hand pump 5. Any Other (Pl specify)
2 How far is the water source
from your house?
1. Inside the house
2. Within 100 meters
3. Between 100-500 meters
4. More than 500 meters
3 How much time is spent in collection of water from
sources outside the house?
…… …………………………..( minutes)
4 In case of piped water supply or public tap
a. What is the duration and timing of supply?
b. Water supply pressure (pl tick): High. …..,
Medium….…, Low………..
6 Do you store water in the house?
Yes No

147
If yes, what is the storage arrangement?
What is the period of storage?
7 Amount of water used for
households purposes
(Liters/day)
8 Is water quantity is sufficient?
If not, what is the quantity of
water required? (Mentions in
liters/day
9 What do you feel about
quality of your drinking water?
a. Odour : Yes No
b. Colour:
Clear……….Muddy………Blackish……..Other…………
……
c. Taste: Sweet
……… Salty……….Other……………………….
d. Any stomach problem? …………..(If Yes please
specify)………………
e. Any other :
11 Do you store your drinking
water?
Any problems.
Yes No
12 Do you treat your water before
drinking?
Yes No
If Yes, Then specify the method of treatment
a. Boiling
b. Use filter, ZeroB, Aquaguard etc,
c. Sieving with Cloth/Alum etc,
d. Sedimentation
e. Chlorination
f. Any other…………
13 With respect to potable water, rate the problem of
availability and quality using
the following codes:
Very serious ……………
1
Somewhat serious……..
2
No problem……………..
Availability Quality
In summer
In Winter
Overall

148
3
Don’t
know……………… 4
14 Do you pay any water
charges? Yes No
If Yes, please specify the amount paid monthly:
15 Is potable water a problem in your village or area?
Yes No
16 Do you want better water
supply system in your village?
If yes, why?
Yes No
17 Do you feel any initiative for
solving the drinking water
problem can work in your village or area?
Yes No
If Yes, What kind of intervention would be
appropriate? (please specify) Water kiosk
Mini piped water supply
Piped water supply
Hand pump
Filter units
Any other…………..
Would you like to be part of the initiative?
19 Do you get enough rainfall to suffice all of your water
needs?
Yes No
Any Comments:
20 Do you find any change in
groundwater level over the past 5-10 years in your village
or area?
Yes No
If yes, What kind of change (increase or decrease)?
Sanitation
1 What is the kind of sanitation
facility available to you?
1. Household Toilet 2. Public Toilet
3. Open defecation 4. Any other
2 If toilet is not available, what
type of toilet do you feel is
needed?
1. House hold toilet 2. Public toilet 3.
Any other
4 How do you dispose your
waste water?
f. Earthen (Kattcha) drainage channel along the
streets
g. Pukka drainage channel along the streets
h. Soak pit
i. Kitchen Garden
j. Any Other (please specify)
149
5 Do you feel the need of proper
wastewater drainage system in
your village or area?
Yes No
If Yes,
a. What kind of intervention would be appropriate?
(please specify)
Construction of new drain
Renovation of existing drain
Construction of soak pits
Kitchen gardening
Any other………….
b. Would you like to be part of the initiative?
6 How do you dispose your
solid waste?
e. Throwing in open places.
f. Disposing in open pits.
g. Disposing through burning
h. Any other …………
7 Do you feel the need of proper
solid waste disposal system in
your village or area?
Yes No
If Yes,
a. What kind of intervention would be appropriate?
(please specify)
Vermicomposting
Cluster dustbin installation
Household dustbins
Any other……………….
b. Would you like to be part of the initiative?
Health
1 What are the frequent
illnesses in your family?
Diseases Reason perceived
Diarrhoea
Malaria
Typhoid
Any Skin
disease
Others specify
Agriculture

150
2 Is there a change in cropping
pattern over the past 5-10
years?
Yes No
If Yes, reasons
3 Is the land irrigated? Yes No
If Yes, What is the main source of irrigation?
1. Tube well 2. Canal 3. Open
Well 4. Ponds & tanks 5. Any other
4 Have you adopted any micro
irrigation system?
Yes No
5 Do you wish to undertake any
measures for soil and water
conservation (SWC) activity?
1. Yes 2. No 3. Not
Applicable
Awareness
1 Any awareness programs regarding water & sanitation
taken up?
Yes / No
2 How do you protect drinking water sources?
Acceptance of interventions
1 Willingness to pay tariff for
interventions on drinking
water supply/provision
Yes No
If Yes, What is the amount you can afford to pay per
month? (please tick) Less Rs. 20/-…, Between Rs. 20 to 35…., Between Rs. 35
to 50…..
More than Rs. 50……..
2 Willingness to partially
contribute for an intervention
applied to your village or area
Yes No
3 Any other comments or
suggestions
4 Self-perception on
environmental issues
Check-list for Environmental Impacts of Existing/Proposed Programs S.
No.
Is the program/scheme likely to YES NO. Not
Known
1. Affect any natural feature, surface water hydrology, surface water
quality, soils, erosion, geology, climate or water resource adjacent to the
activity area?
2. Affect wildlife or fisheries?
3. Affect natural vegetation?

151
S.
No.
Is the program/scheme likely to YES NO. Not
Known
4. Affect or eliminate land suitable for agricultural or timber production?
5. Affect commercial fisheries or aquaculture resources or production?
6. Affect the quality of water resources or catchment areas within or
adjacent to the activity area through change in the water supply
downstream of irrigation or through human or animal toxins?
7. Affect air quality in the activity area or adjacent areas?
8. Require relocating the existing population, community facilities and
housing?
9. Lead to changes in the supply of or demand for infrastructural items?
10. Cause substantial change in income and traditional source of livelihood
of existing population?
11. Result in potential conflicts or affect physical, demographic or attitude/
value cohesion?
12. Affect archaeological sites or structures of historic or cultural
significance?
13. Include or exacerbate erosion in the watershed area?
14. Exacerbate water rights conflicts?
15. Provoke a significant reduction in downstream flow, impairing aquatic
life or endangering wetland water supply?
16. Create or exacerbate insect disease hazards?
17. Be designed without prior consultation or participation of affected
populations?
18. Provoke a shift in crop pattern in the region?
19. Provoke a shift from low-input to high-input farming practices?
20. Ignore provisions for post-project monitoring?
21. Require long-term extension services?
22. Induce new migration towards the projects area (around reservoirs)?
23. Be implemented in the absence of a training programme on techniques
for more efficient water use?
24. Create or exacerbate soil salinity problems?
25. Be designed without adequate drainage facilities?

152
AAnnnneexxuurree 22 HHoouusseehhoolldd ssuurrvveeyy aannaallyyssiiss
Name of districts surveyed: Nawada, West champaran, Begusarai and Purnea
No. of villages surveyed: 12 (3 villages from each district)
Introduction
As part of the environmental assessment, the household surveys were conducted in 12
villages, in the four districts viz. West Champaran, Nawada, Begusarai & Purnea on sample basis. The objectives of the primary data collection through household surveys were to
understand water supply and sanitation scenarios in the sampled villages, and gauge the
extent of quantity and quality problems and also to understand people’s perceptions on the available services. This survey was conducted during January 2013 in about 500 sampled
households in these villages.
Households were surveyed covering the entire villages including the General, OBC, SC & ST communities. The findings of household survey are discussed below. Figure 1.1 shows that
the villages comprise of General (27%), OBC (44%), SC (19%), and ST (10%) communities.
The sex ratio of the surveyed population is male (51%) and female (49%).
Figure 1.1 Community composition and sex ratio in the villages

153
1. Existing Water Supply System
1.1 Source of drinking Water
Figure 1.2 Existing water supply source in the village
The main source of drinking water in the all surveyed villages is Hand pump (Ground
water). Based on the household survey, 72% households use hand pumps, 20% use public tap water from SVS (Mini Pipe water supply scheme), while 6% & 2% households use
private tube wells and open wells, respectively (Fig. 1.2). It was observed that no surface
water sources have been utilized for drinking water in the surveyed villages.
Water availability
Figure 1.3 Water quantity status and Rating of water availability problem seasonal wise
Based on the household surveys, 77% respondents expressed that available water is
sufficient for daily water needs and only 23% respondents expressed that the amount of water is not sufficient for daily needs. Half of the respondents (50%) commented that water
availability issue is somewhat serious while 6% respondents commented that water
availability is very serious during summer. Only 10% respondents expressed that water availability problem is somewhat serious during winter.
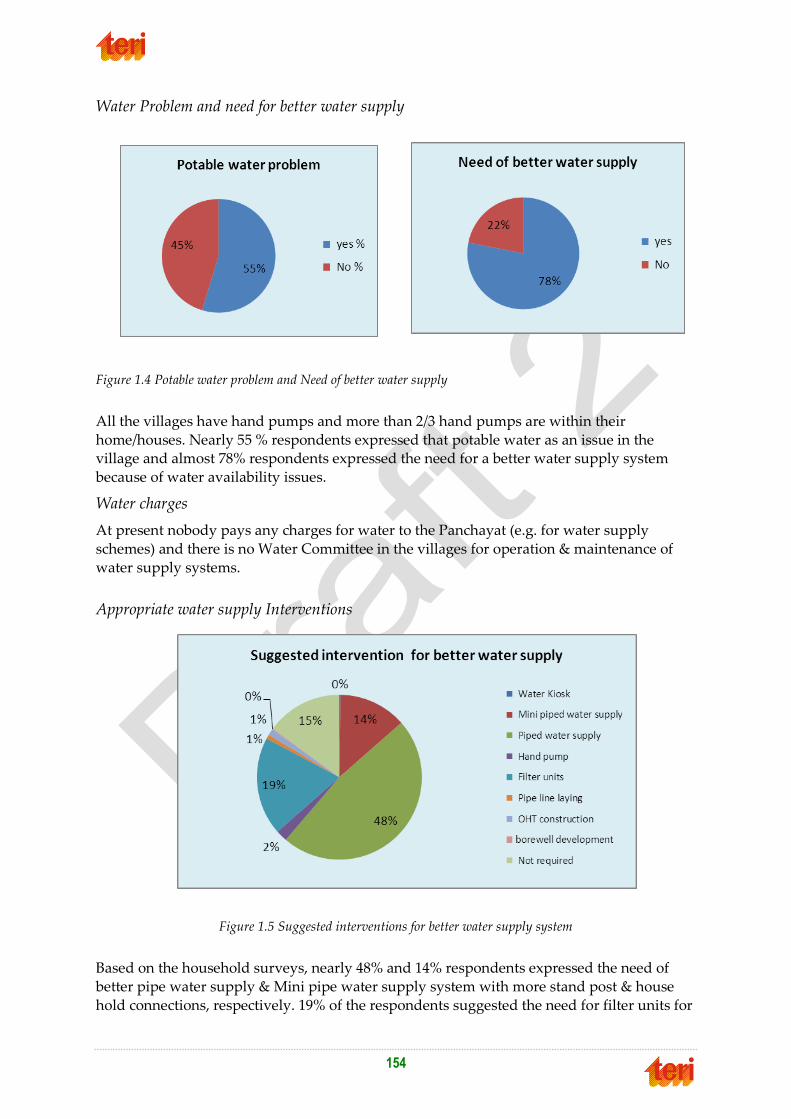
154
Water Problem and need for better water supply
Figure 1.4 Potable water problem and Need of better water supply
All the villages have hand pumps and more than 2/3 hand pumps are within their
home/houses. Nearly 55 % respondents expressed that potable water as an issue in the village and almost 78% respondents expressed the need for a better water supply system
because of water availability issues.
Water charges
At present nobody pays any charges for water to the Panchayat (e.g. for water supply
schemes) and there is no Water Committee in the villages for operation & maintenance of
water supply systems.
Appropriate water supply Interventions
Figure 1.5 Suggested interventions for better water supply system
Based on the household surveys, nearly 48% and 14% respondents expressed the need of
better pipe water supply & Mini pipe water supply system with more stand post & house
hold connections, respectively. 19% of the respondents suggested the need for filter units for

155
good quality water supply for the village while 15% are satisfied with existing water supply
system.
Water Quality
Figure 1.6 Physical Water Quality problems (Top) and Rating of Water Quality Problems (Bottom)
Based on the house hold interactions, 24% households complained about odour, 42% of the
households complained about water colour and 19% of the households complained about the taste of water. Most of the HH in the surveyed villages depends on hand pumps as their
water source, water, which has water quality problem. Approximately 50% respondents
have the perception that during summer, water quality problem is ‘somewhat serious, while 5% of the respondents said that water quality problem is very serious in summer.
Approximately 25% respondents said that water quality problem is somewhat serious in
winter while 2% said that water quality problem is very serious at that time.
Treatment of Drinking Water
Almost all surveyed households (100%) mentioned that they do not treat water at home
before drinking.
Perception on rainfall & groundwater level
Based on the household surveys, 82% respondents expressed that there is a trend of decrease in rainfall amounts in the past 10 years and this decreasing rainfall trend has reduced the
groundwater resources, especially in summer. 81% of the respondents perceived that the
ground water level has gone down over the past 5 to 10 years (Fig. 1.7).

156
Figure 1.7 Rainfall pattern (left) & Changing in ground water level (right)
2. Existing sanitation and waste management facility
2.1 Sanitation
Figure 2.1 Existing sanitation facilities and Need of sanitation interventions
As per the household surveys, 74% respondents go for open defecation in all surveyed
villages. Non-availability of sanitation facility is a major problem highlighted during the
Focused Group interviews/discussions. Approximately 88% respondents expressed the need for household toilets (Fig. 2.1).

157
2.2 Waste water management
Figure 2.2 Existing waste water disposal status and Need of waste water management interventions
About 78% respondents practice waste water disposal into the earthen drains along the
streets, while 6% use pukka drainage along the streets, 9% use soak pits and 5% use kitchen
garden for waste water disposal. 71% respondents suggested the construction of new drainage system for disposing the waste water from the households while 12% suggested for
renovation of existing drains and only 8% respondent suggested for the construction of soak
pits.
2.3 Solid waste Management
Figure 2.3 Existing solid waste disposal practices & Need of solid waste management interventions
As per household surveys, villages do not have any solid waste management facility.
Throwing of solid waste in open places was observed in the case of 92% of the respondents.
Based on the households interactions for better solid waste management facility, nearly 44% suggested for vermi-compositing method, 44% suggested for cluster dustbin facilities, and
5% households suggested for household dustbins (Fig. 2.3).

158
3. Willingness to pay for new water supply &sanitation interventions
Figure 3.1 Willingness to pay tariff and contribution
Approx. 63% respondents are willing to pay tariff, and 59% are willing to partially
contribute for new water supply & sanitation intervention. Unwillingness to pay tariff and contribute partially for new water supply &sanitation interventions by the rest of the
households was due to poverty.
4. Perception on Frequent diseases
Based on the perception of the surveyed communities on health related issues, various water
borne diseases are prevalent in the villages. Some of the diseases faces by the households
are: Diarrhoea (13%), Malaria (37%), Typhoid (8%) and Skin diseases (18%).
Figure 4.1 Perception on frequent disease

159
Summary of the household survey analysis
72% of the households use hand pumps (both Govt. sponsored scheme and private) and 20% households use Mini Pipe Water Supply scheme (Govt. sponsored scheme).
77% Households said that availability of water is adequate for daily needs. 50% of the households said that water availability is a problem to some extent, during the summer season.
Mini pipe water supply with treatment system is good in terms of quality.
48% and 14% households expressed the need for better pipe water supply and Mini Pipe Water Supply system with sufficient number of stand posts and household connections. 19% of respondents suggested the need for filter units for better water supply.
50% respondents have the perception that during summer, water quality problem is ‚somewhat serious‛ and 25% respondents said that water quality problem is ‚somewhat serious‛ during winters.
100% respondents drink water without any treatment at household level.
81% respondents perceived that the ground water level has gone down over the past 5 to 10 years.
74% respondents go for open defecation in all the surveyed villages and 88% respondents expressed the need for household toilets.
78% respondents practice waste water disposal to the earthen drainage along the streets.
92% of the respondents dispose solid waste by throwing in open places.
For better solid waste management, 44% households suggested for vermi-compositing, 44% suggested for cluster dustbins, and 5% suggested for household dustbins.
63% respondents are willing to pay tariff and 59% are willing to offer partial contribution for new water supply & sanitation interventions.
Most of the surveyed households use cattle dung as fuel and in agricultural fields as fertilizer.
The most common diseases in the villages are Diarrhea (13%), Malaria (37%), Typhoid (8%) and Skin diseases (18%).

160
AAnnnneexxuurree 33 SSccrreeeenniinngg cchheecckk--lliisstt ffoorr sscchheemmeess
Category I Category II
A. Water Supply Schemes
SVS with source in shallow aquifer in safe
and semi-critical zone
SVS with source in deep aquifer located in
safe zone of exploitation
SVS with perennial surface water source
requiring sand filtration only
SVS involving pumping, construction of
storage tanks and piped distribution
networks, with source as bore well.
Roof water harvesting units, where the
households cannot be served by piped
network.
SVSs/MVSs with shallow groundwater
source located in either critical or over
exploitation zones.
SVSs/MVSs with deep groundwater source
in semi-critical and over exploited zones.
SVS/MVS with involuntary rehabilitation
SVSs/MVSs with sources located at or nearer
(within 1 km) to natural habitats/sensitive
ecosystem such as National Park and
Wildlife Sanctuaries (Forest Department
approval required)
Impacts to water quality due to improper
disposal of backwash water from treatment
units
SVSs/MVSs with the water quality at the
source not treatable with conventional
treatment, and involves special treatment/RO
treatment.
SVSs/MVSc with source as river where water
will have to be conveyed from long distances.
B. Artificial Recharge Structure
Individual house hold roof top rainwater
harvesting
Ground water recharge measures.
All types of rain water harvesting structures
to augment water supply sources
Underground Drainage Schemes
All types of underground drainage schemes
Sanitation Schemes
Construction of ISL where subsurface
strata is favourable for adopting twin pit
pour flush toilet and groundwater table
is at depth greater than 3.0m below
ground level.
Construction of group owned latrines
where the subsoil strata is favourable for
adoption of twin pit pour flush toilets
and groundwater table is at depth
greater than 3.0 m below ground level.
Construction of ISL/community latrines
where subsoil strata is not favorable
(hard rock or low infiltration capacity)
Disposal of sewage through soak pits
where ground water table is less than 3
m below ground level
Construction of ISL/community latrines
in water logged areas.
Construction of group owned latrines
where subsoil strata is not favourable for
adoption of twin pit pour flush toilets

161
Construction ISL or group owned latrines
where groundwater table is at depth
lesser than 3.0 m below ground level
Storm water /Sullage Drains
If all the following conditions are satisfied:
Construction of drains where
groundwater table is greater than 3 m
Subsoil is having sufficient bearing
capacity
If any of the following conditions are satisfied:
Construction of drains where
groundwater table is at depths < 3.0m
Construction of drains in water logged
areas
Subsoil is not having sufficient bearing
capacity
F. Solid Waste Management
Household biogas plant
Household vermin-composting plant
Community based biogas plant
Processing unit for plastic waste

162
AAnnnneexxuurree 44 EEnnvviirroonnmmeennttaall mmaannaaggeemmeenntt
ppllaann ffoorr ssttaaggeess ooff pprroojjeecctt iimmpplleemmeennttaattiioonn
((ddeessiiggnn aanndd ddeevveellooppmmeenntt,, iimmpplleemmeennttaattiioonn,,
aanndd OO&&MM ssttaaggee))
Activity/consideration Impact Mitigation
Location of scheme site
in a sensitive forest
area
Felling of trees may be
necessary
Soil erosion due to
trenching
Loss of top soil
Loss of flora/fauna
Human-wildlife conflict
Ensure that construction activity is
planned in adherence to Legal and
Regulatory norms, as prescribed in EMF.
Location of scheme site
in a sensitive forest
area
Damage may be caused
to trees
Loss of flora/fauna
Soil erosion due to
trenching
Human-wildlife conflict
Damage to roots should be minimized
during trenching, placing backfill,
driving of heavy equipment, dumping of
oil and trash etc. Restrict these activities
outside the canopy of the tree. Also
avoid cut and fill in the root zones,
through delineating and fencing the drip
line.
To prevent excessive disturbance of
natural vegetation, the top soil excavated
should be stockpiled and utilized for re-
vegetation after completion of work.
Prevent construction within protected
forest area.
Please refer to ECOP on working in
forest areas (Annexure 13)
Excavation/trenching Top- Soil erosion due to
excavation activities
Topsoil and subsoil must be stockpiled,
in driest possible conditions, on opposite
sides of the trench and must be kept
separate throughout construction and
rehabilitation.
Proper stock piling of excavated soil and
must be bordered by berms.
Shoring trench sides by placing sheeting,
timber shores, trench jacks, bracing,
piles, or other materials to resist
pressures surrounding the excavation.
Spillage of oils/grease
from
machinery/engines
Oils and grease may be
released and lead to
groundwater as well as
surface water
Store tanks and drums for excess
capacity; forbid pouring into soils or
drains; enforce adequate equipment
maintenance procedures

163
contamination.
Workers Health and
Safety
Negative health impacts
on workers/locals by
inhaling of particulate
matter.
Injuries or death due to
on-site accidents
Setting up barricades and signposts
Use of and safety gear
(helmets/earmuffs/eye protection)
Air pollution due to
construction
Suspended particulate
matter (SPM, RSPM),
NOx, S0x
Fumes from
diesel/kerosene
Soot from burning of oils
and fuel used in
machinery/engines
Providing curtains around construction
site, control spreading of dust, sprinkling
of water to suppress dust, preventive
maintenance of construction equipment
and vehicles to meet emission standards.
Disposal of
Construction waste
Unorganized dumping of
construction wastes may
lead to contamination of
surface, groundwater
and flooding.
The construction waste material should
be stored on the higher lying areas of the
site and not in any storm water run-off
channels or any other areas where it is
likely to cause erosion or where water
would naturally accumulate causing
flooding.
The demolition/construction waste is
disposed strictly in the designated. The
disposal of waste into water reservoirs or
in the sites at their immediate vicinity is
prohibited.
Minimize volumes of generated waste.
Crash the disposed concrete blocks for
reuse as gravel substitute. Descend the
construction waste in closed containers
and transport in covered body trucks.
Proximity between
drinking water source
(handpump and
borewell) and rural
toilet
Contamination by fecal
coliform from leach pit
toilet to shallow aquifer
Ensure safe distance (>10m as per
MoRD31) between leach pit toilet and
water source.
Disposal of sludge
from Treatment Units
Improper Sludge
disposal may
contaminate surrounding
natural water bodies
Assign authorized hazardous waste
handling agencies or BSPCB.
Incineration of waste by authorized
agencies
Backwash from
treatment units
Backwash containing
high concentration of As,
Fe and F may
contaminate surrounding
Proper disposal facility
Solar evaporation ponds at village level
Assign authorized hazardous waste
handling agencies or BSPCB.
31 Technology Options for Household Sanitation - A report by Ministry of Rural Development and UNICEF (2010)

164
natural water bodies and
infiltration to
groundwater and soil.
Leakages and bursts Waterlogging due to
leakage
Water logging leading to
infestation of pests
Fix all leakages at regular intervals
(weekly)
Timing of supply Overflowing of water
due to irregular supply
timings
Ensure regular supply timings and
disseminate information regarding
timings to users, in advance.
Use of pipe water for
non-domestic purposes
Over-exploitation of
groundwater resources
Operation cost and
lifecycle cost of treatment
medium increase due to
excessive usage
Ensure that treated piped water is used
only for drinking, cooking and bathing
purposes.
Ensure that bathing of cattle and cattle
drinking/feeding is not encouraged near
the stand posts and hand pumps.
Aquifer characteristics Overexploitation may
lead to Critical, semi-
critical or over exploited
aquifers
Explore opportunities to recharge
groundwater and use surface water as
primary source.
In addition to the above EMP, for Multi-Village Schemes, the following additional considerations have to be made:
Environmental Management Plan (Additional) for Multi Village Schemes
MULTI VILLAGE SCHEMES
Activity/consideration Impact Mitigation
Source sustainability Source may be exhausted
due to increase in water
demand for MVS
Conduct prospecting for different water
sources to ensure a minimum of 1
surface water source and 1 safe
groundwater source.
Pre-feasibility study for river as source
(for example drying up of river during
dry season and change in river course).
Ensure implementation of rainwater
harvesting to augment groundwater
recharge.
Land requirement Land acquisition may
lead to loss of
agricultural land,
encroachment into forest
area, loss of livelihood,
resettlement of
communities.
Follow norms and regulations for Land
Acquisition and Rehabilitation as well as
Forest clearance as per EMF.
Downstream users and
ecosystems
Withdrawal of water
upstream may lead to
loss of minimum flows
downstream.
Consider planning for multiple sources
of water in order to sustain freshwater
ecosystems and the human livelihoods
and wellbeing for downstream users.
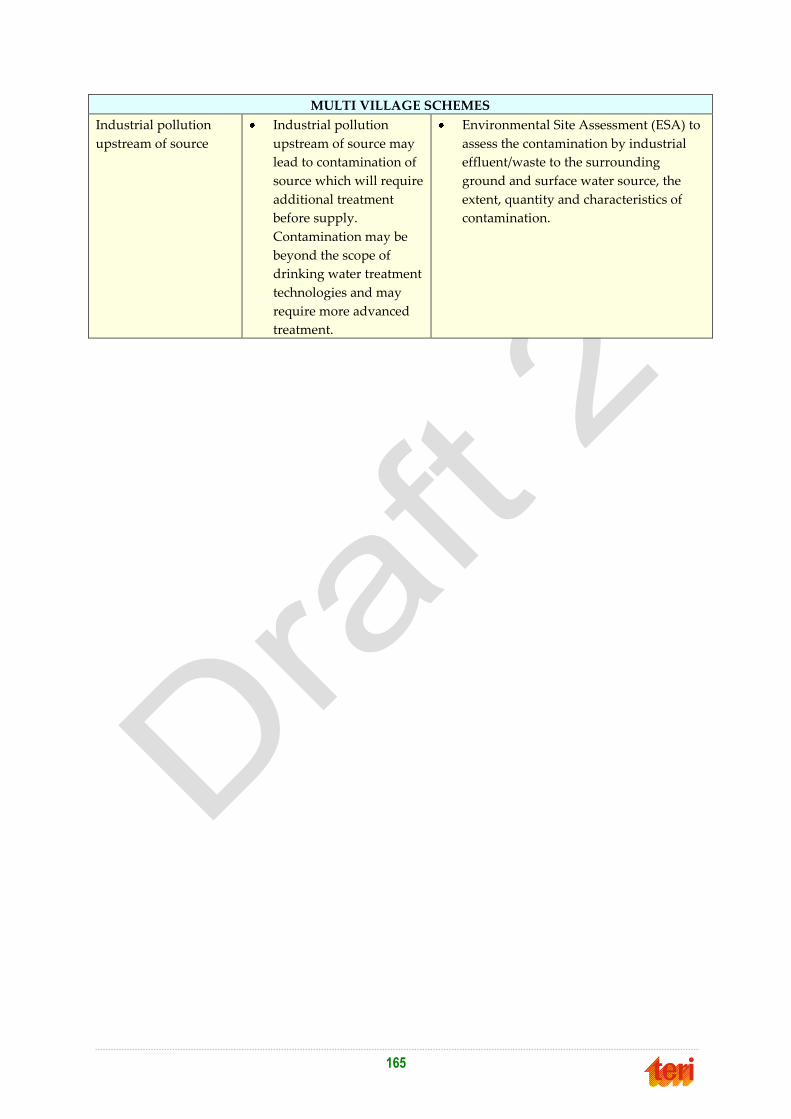
165
MULTI VILLAGE SCHEMES
Industrial pollution
upstream of source
Industrial pollution
upstream of source may
lead to contamination of
source which will require
additional treatment
before supply.
Contamination may be
beyond the scope of
drinking water treatment
technologies and may
require more advanced
treatment.
Environmental Site Assessment (ESA) to
assess the contamination by industrial
effluent/waste to the surrounding
ground and surface water source, the
extent, quantity and characteristics of
contamination.

166
AAnnnneexxuurree 55 GGuuiiddeelliinneess ffoorr tthhee
IIddeennttiiffiiccaattiioonn aanndd SSeelleeccttiioonn ooff WWaatteerr
SSuuppppllyy SSoouurrcceess
Groundwater aquifers are the main source of water in Bihar state for tapping water for various uses. Based upon geological diversities, geomorphological set up and relative groundwater potentialities, hydrogeologically, the various litho-units of the State can be grouped as
• Unconsolidated / Alluvial formation, • Semi-consolidated formations and • Consolidated/fissured formations.
Following section presents the procedure for identification of sources.
A. Priority for the selection of sustainable sources for rural water supply
1. Groundwater source with acceptable quality (without any treatment except disinfection). These sources are preferred for single village schemes (SVSs).
2. When option (1) is not possible as the groundwater quality is problematic (fluoride/brackish/nitrate/iron etc.), distant surface water source which requires only simple filtration and disinfection will be preferred. These sources are preferred for multi-village schemes (MVSs) involving number of habitations (MVSs may be located away from the habitations and require treatment and pumping adding to O&M costs).
3. When option (1) and (2) are not possible due to isolation of the habitation and its location at high elevation, and if the local groundwater source is sustainable throughout the year but high TDS (> 2000 mg/L) is the only problem, the local source will be selected. Water from the local source will be treated with innovative technology such as Reverse Osmosis (RO). As RO plants have certain problems (for example, safe disposal of brine) this option will be chosen only under exceptional circumstances.
B. Water Quality Testing
Before selecting the source the raw water quality will be tested to check conformity with the drinking water standards.
C. Spacing between the proposed well and the existing groundwater structure to avoid interference
When a new well is located close to an existing well, the cone of influence of both wells may overlap and affect the yielding potential of both the wells. While locating new wells the spacing between new well and the existing well will, therefore, be fixed appropriately. The following table recommends the spacing between the existing groundwater abstraction structures and the proposed wells.
S. No. Situation Recommended spacing between any two wells (m)
Filter point or shallow
wells
Deep bore wells
1. Non-command area 120 300 - 500

167
S. No. Situation Recommended spacing between any two wells (m)
2. Command area 160 200 - 300
3. Near perennial source
like river or pond
(within 200m)
160 200 - 300
4. Non-perennial stream 160 300 - 500
Source: NABARD

168
AAnnnneexxuurree 66 SSaanniittaarryy PPrrootteeccttiioonn ooff WWaatteerr
SSuuppppllyy SSoouurrcceess
Presently there is no department looking after the protection of water supply sources in Bihar. The recommended procedures ensuring safe quality water supplies are listed below. The main objectives of sanitary protection of the water supply sources are to avoid the sources getting contaminated. 1. Sanitary Protection of Surface Water Supply Sources
The area around the source should be inspected at least once in a year to identify and control any new pollution source.
Discharge of industrial/domestic wastewater on the upstream of the off-take arrangement should be prevented.
Activities that lead to contamination of the water such as washing clothes, washing cattle, dumping of solid waste and defecation should be prevented.
The area around sources including intake arrangements and upstream of river should be well protected and fenced. Trespassing by people and cattle around the source should be prevented.
2. Sanitary Protection of Ground Water Supply Sources Direct runoff of rain water into bore well sources should be prevented A concrete mat of sufficient thickness for 75 cm radius around the bore well shall
be provided to seal the outer periphery of the bore well. The casing pipe should be raised 60 cm above ground level and provided with a sanitary plug until the pump is installed.
Rainwater harvesting and recharge structure should be located at least 15 m away from the bore well to avoid direct contamination.
Soak pit for the disposal of effluent from septic tank or other sanitation facility should not allowed within 15 m radius from the bore well of water supply source to avoid direct contamination.
For bore wells, the annular open space on the outside of the well casing needs to be filled with neat cement grout.
3. Other preventive measures for maintaining quality of drinking water Sources of water supply including wells fitted with hand pumps should be
disinfected regularly. Free residual chlorine level of not less than 0.2 mg/L and more than 0.5 mg/L should be maintained throughout the distribution system
Over Head Tanks (OHTs) and storage sumps should be periodically cleaned at least once in three months
4. Leakages in pipelines should be arrested Pit taps both at public stand posts and house service connections should be
prevented- all taps and stand posts should be above ground level provided with platforms around
Surroundings of the OHTs, public stand posts and hand pumps should have clean and hygienic environment.

169
AAnnnneexxuurree 77 GGuuiiddeelliinneess ffoorr SSuussttaaiinnaabbiilliittyy ooff
GGrroouunnddwwaatteerr SSoouurrcceess
For sustainability of sources, especially ground water, it is essential to sustain the sources through different methods of recharging, which is described in the guideline given below.
Guidelines for Water Harvesting and Recharge
The guidelines presented in this Annexure are based on the guidelines provided in the publication Water Harvesting and Artificial Recharge published by the Rajiv Gandhi National Drinking Water Mission, Department of Drinking Water Supply, Ministry of Rural Development, Government of India (2004).
Recommended water harvesting and watershed management measures for Bihar
Agro-climatic zone Region Recommended water harvesting structures
Sub humid and humid Sutlej Ganga Alluvial Zone
Covers part of plains of Bihar
Ponds
Check das
Gully plugging
Contour bunding
High rainfall High runoff Chhotanagpur Plateau
Covers hilly areas of Bihar Tank/Ponds
Check dams/Anicuts
Gully plugging
Contour bunding
Roof Top Water Harvesting Systems
Roof top water harvesting systems can provide good quality potable water with the design features outlined below are taken into account:
The substances that go into the making the roof should be non-toxic in nature
Roof surfaces should be smooth, hard and dense since they are easier to clean and are less likely to the damage and released material / fiber into the water.
Roof painting is not advisable since most paints contain toxic substances and may peel off.
No overhanging tree should be left near the roof.
The nesting of birds on the roof should be prevented.
All gutter ends should be fitted with a wire mesh screen to keep out leaves etc.

170
A first-flush rainfall capacity, such as detachable down pipe section, should be installed.
A hygienic soak away channel should be built at water outlet and a screened overflow pipe should be provided.
The storage tank should have a tight fitting roof that excludes light a, manhole cover and a flushing pipe at the base of the tank (for standing tanks).
There should be a reliable sanitary extraction device such as a gravity tap or a hand pump to avoid contamination of the water in the tank.
There should be no possibility of contaminated wastewater flowing into the tank (especially for tanks installed at ground level)
Water from other sources, unless it is reliable source, should not be emptied into the tank through pipe connections or the manhole cover.
During the rainy season, the whole system (roof catchment, gutters, pipes, screens, first-flush and overflow) should be checked before and after each rain and preferably cleaned after every dry period exceeding a month.
At the end of the dry season and just before the first shower of rain is anticipated, the storage tank should be scrubbed and flushed all sediment and debris (the tank should be re-filled afterwards with a few centimeters of clean water to prevent cracking).
Ensure timely service (before the first rains are due) of all tanks features, including replacement of all worm screened and servicing of the outlet tap or handpump.
Percolation Tanks
Percolation tanks should normally be constructed in a terrain with highly fractured and weathered rock for speedy recharges; in case of alluvium the bouldary formations are ideal. However, the permeability shouldn't be too high that may result in the percolated water escaping the downstream.
Submergence area should be uncultivated as far as possible.
Rainfall pattern based on long-term evaluation is to be studied so that the percolation tanks gets filled up fully during monsoon (preferably more than once)
Soil in the catchment area should preferably be of light sandy type to avoid silting upon the tank bed.
The location of the tank should preferably be downstream of runoff zone or in the upper part of the transition zone, with a land slope gradient of 3 to 5%.
While designed, due care should be taken to keep the height of the ponded water column about 3 to 4.5 m above the bed level. It desirable to exhaust the storage by February since evaporation losses becomes substantial from February on wards. It is preferable that in the downstream area, the water table it is depth of 3 to 5 m below level during the post monsoon period, impaling that the benefited area possesses a potential shallow aquifer.

171
Construction-wise there is not much difference between a percolation tank and a minor irrigation tank, except for providing outlets for surface irrigation and the depth of the cut-off trench. The cut-off trench is to be provided below the earthen bund with depth limited to one fourth of the height between bed level and full storage level.
Check Dams
Check Dams are constructed in the drainage course of narrow streams in low rainfall area to impound run-off rainwater. The following are some guidelines for constructing of check dams.
The total catchment of the nala should normally be between 40 to 100 hectares though the local situations can be guiding factor in this.
The rainfall in the catchment should be less than 1000mm/ annum
The Nala bunds should be preferable located in area where contour or graded bunding of lands have been carried out
The rock strata exposed in the ponded area should be adequately permeable to cause ground water recharge through ponded water
Nala bund is generally a small earthen dam with cutoff core wall of bricks work, though masonry and concrete bunds/plugs are now prevalent
Dams should be built at sites that can produce relatively high depth to surface area so as to minimize evaporation loses.
Rocky surface should not be fractured or cracked, which may cause the water to leak away to deeper zones or beneath the dam.
Dam foundation must of solid impermeable rock with no soil pockets or fracture line
No soil erosion in the catchment area
Dams should be site along the edges of depressions or directly across the lower ends of deep gullies into rock.
Ponds/ Tanks
A good pond should possess the following traits:
The site should be narrow gorge with a fan shaped valley above: so that amount of earthwork gives a large capacity. Junctions of two tributaries, depressions and other sites of easily available fill material and favourable geology should be preferred
The capacity catchment ratio should be such that the pond can be fill upto about 2-3 months of rainfall. The capacity should not be too small to be choked up with sediments very soon
The pond should be located where it could serve a major purpose e.g. if irrigation it should be above irrigated field
The site should not have excessive seepage losses
The catchment areas should be put under conservative practices

172
Gully plugging, Contour bunds
The gully plugging measures includes vegetative plantings and brushwood check dams, boulder bunds, brick masonry and earthen bunds or a combination of both, sand bag plugs etc. Contour bunds involve construction of horizontal lines of small earthen or boulder bunds across the slopping land surface.
Ensure there is no open defecation in/near structure
No tethering of animals at the site
There must be no pit-latrines on the bank upstream
Avoid use of pesticides1 chemicals upstream of the site
Rainwater Harvesting Structures
In Bihar rectangular catchment basins called Ahars are built by building earthen embankments to impound rain water. Sometimes these are built at the lower end of a small seasonal rivulet. The channels for drawing water from the Ahars are called Pynes. Large storages across streams are called Katas, Mundas and Bandhas.
Guidelines for Implementation of Rainwater Harvesting Structures for Sustainability of Drinking water supply sources:
The rainwater harvesting (RWH) structures should be site specific closer to the source but 15 m away from the bore well to prevent direct contamination; the location should be certified by the hydrogeologists of the PHED department.
The local geological and hydrogeological conditions have to be studied in conjunction with the location of the groundwater source to facilitate maximum recharge from the structure.
No RWH structure should be installed in the supply/feeder channel of tanks.
RWH structure should be simple and suitable to the location and economically viable to the community.
All the works of RWH structure should be implemented before the onset of the monsoon.
Pre and post water level and water quality monitoring should be carried out in the well for water supply source to evaluate the benefit accrued of the RWH structures.
Erosion control in catchment
There is no unique solution for erosion control. The following are some of the erosion control measures used in many parts of the country.
Conservation cover: Establish and maintain perennial vegetative cover to protect soil and water resources.
Contour bunding/trenching: Forming contour bunding or trenching along the contour in steep sloped areas may be taken up for reducing runoff and erosion. Terraces are constructed with earthen embankments that retard runoff and reduce erosion by breaking the slope into numerous flat surfaces separated by slopes that are protected with permanent vegetation.

173
Critical area planting: Planting vegetation such as trees, shrubs, grasses or legumes on highly erodable or eroding areas. While undertaking any plantation programme care must be taken to plant only indigenous species with involving and close coordination with local people

174
AAnnnneexxuurree 88 WWaatteerr QQuuaalliittyy MMoonniittoorriinngg aanndd
SSuurrvveeiillllaannccee
Water Quality Standards
The Bureau of Indian Standards specifications IS:10500-1991 govern the quality of drinking water supplies in India by public agencies.
Physical and chemical Parameters
S1.No. Characteristics Desirable limits Maximum
Limits
1. Turbidity (NTU) 5.0 10
2. Colour (unit on Pt. Cobalt scale) 5.0 25.0
3. pH 6.5 to 8.5 No relaxation
4. TDS (mg/L) 500 2000
5. Total hardness (mg/L) 300 600
6. Calcium (mg/L) 75 200
7. Magnesium (mg/L) 30 100
8. Chloride (mg/L) 250 1000
9. Sulphate (mg/L) 200 400
10. Fluoride (mg/L) 1.0 1.5
11. Nitrates (mg/L) 45.0 No relaxation
12. Iron (mg/L) 0.3 1.0
13. Arsenic (mg/L) 0.01 No relaxation
Bacteriological Parameters
In 100 ml sample, the count of coliforrn organism and E-coli should be zero.
Current Water Quality Monitoring Efforts
There are 38 Water Quality Testing Laboratories functioning at the divisional level in all districts. There also exists a state level Water Quality Testing Laboratory at Patna.
Sampling
Recommended Frequency
Source Minimum frequency of sampling and analysis remarks
Bacteriological Physical/Chemical
Ground Water
Shallow tube wells
with hand pump
Every fortnight Once initially, then 4
times yearly
Deep tube wells with
hand pump
Once initially, then as
situation demands 4
times yearly
Once initially, then two
4 times yearly. Residual
chlorine test-daily
Wells and piped
supplies
Once initially,
thereafter as situation
demands
Once initially, then 4
times yearly
Test weekly for
Situations requiring
testing: change in
environmental
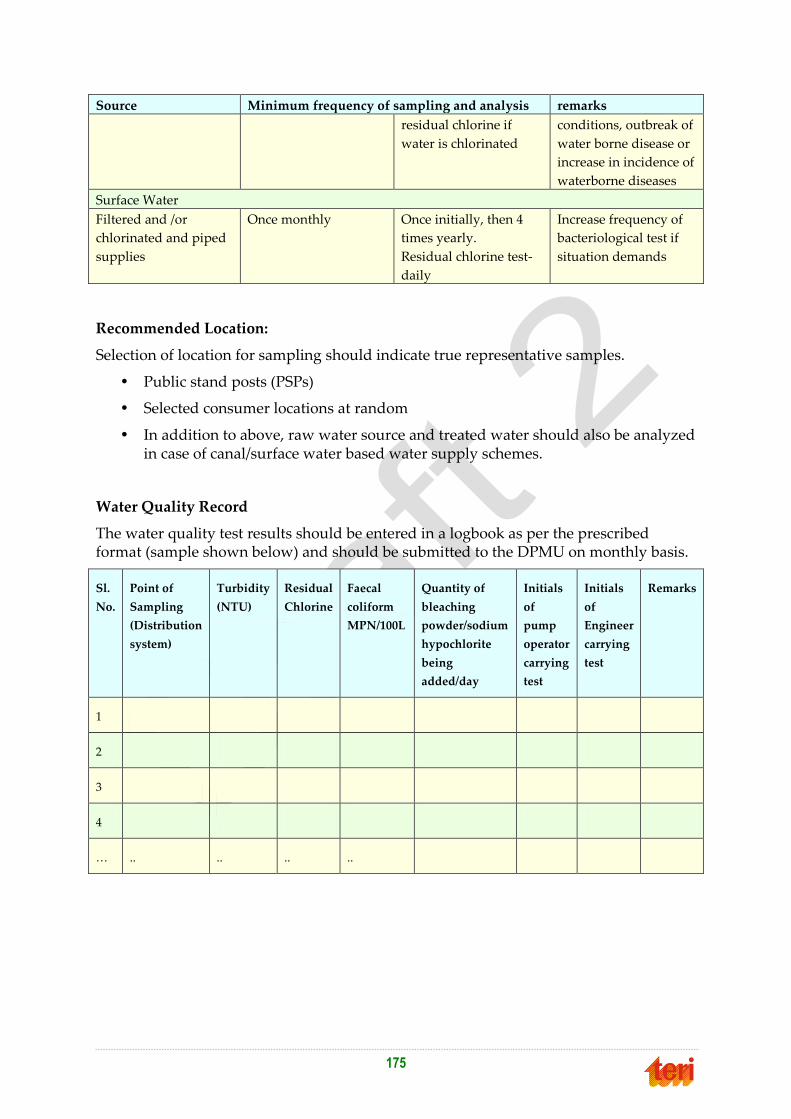
175
Source Minimum frequency of sampling and analysis remarks
residual chlorine if
water is chlorinated
conditions, outbreak of
water borne disease or
increase in incidence of
waterborne diseases
Surface Water
Filtered and /or
chlorinated and piped
supplies
Once monthly Once initially, then 4
times yearly.
Residual chlorine test-
daily
Increase frequency of
bacteriological test if
situation demands
Recommended Location:
Selection of location for sampling should indicate true representative samples.
• Public stand posts (PSPs)
• Selected consumer locations at random
• In addition to above, raw water source and treated water should also be analyzed in case of canal/surface water based water supply schemes.
Water Quality Record
The water quality test results should be entered in a logbook as per the prescribed format (sample shown below) and should be submitted to the DPMU on monthly basis.
Sl.
No.
Point of
Sampling
(Distribution
system)
Turbidity
(NTU)
Residual
Chlorine
Faecal
coliform
MPN/100L
Quantity of
bleaching
powder/sodium
hypochlorite
being
added/day
Initials
of
pump
operator
carrying
test
Initials
of
Engineer
carrying
test
Remarks
1
2
3
4
… .. .. .. ..
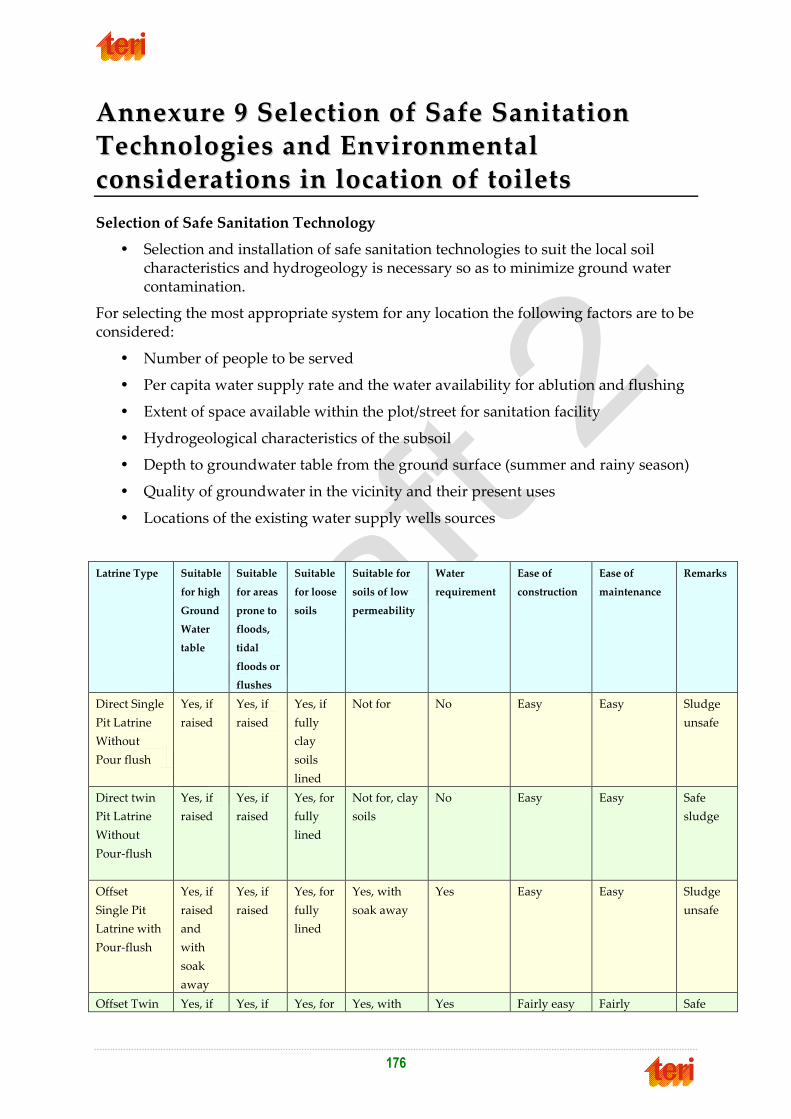
176
AAnnnneexxuurree 99 SSeelleeccttiioonn ooff SSaaffee SSaanniittaattiioonn
TTeecchhnnoollooggiieess aanndd EEnnvviirroonnmmeennttaall
ccoonnssiiddeerraattiioonnss iinn llooccaattiioonn ooff ttooiilleettss
Selection of Safe Sanitation Technology
• Selection and installation of safe sanitation technologies to suit the local soil characteristics and hydrogeology is necessary so as to minimize ground water contamination.
For selecting the most appropriate system for any location the following factors are to be considered:
• Number of people to be served
• Per capita water supply rate and the water availability for ablution and flushing
• Extent of space available within the plot/street for sanitation facility
• Hydrogeological characteristics of the subsoil
• Depth to groundwater table from the ground surface (summer and rainy season)
• Quality of groundwater in the vicinity and their present uses
• Locations of the existing water supply wells sources
Latrine Type Suitable
for high
Ground
Water
table
Suitable
for areas
prone to
floods,
tidal
floods or
flushes
Suitable
for loose
soils
Suitable for
soils of low
permeability
Water
requirement
Ease of
construction
Ease of
maintenance
Remarks
Direct Single
Pit Latrine
Without
Pour flush
Yes, if
raised
Yes, if
raised
Yes, if
fully
clay
soils
lined
Not for No Easy Easy Sludge
unsafe
Direct twin
Pit Latrine
Without
Pour-flush
Yes, if
raised
Yes, if
raised
Yes, for
fully
lined
Not for, clay
soils
No Easy Easy Safe
sludge
Offset
Single Pit
Latrine with
Pour-flush
Yes, if
raised
and
with
soak
away
Yes, if
raised
Yes, for
fully
lined
Yes, with
soak away
Yes Easy Easy Sludge
unsafe
Offset Twin Yes, if Yes, if Yes, for Yes, with Yes Fairly easy Fairly Safe
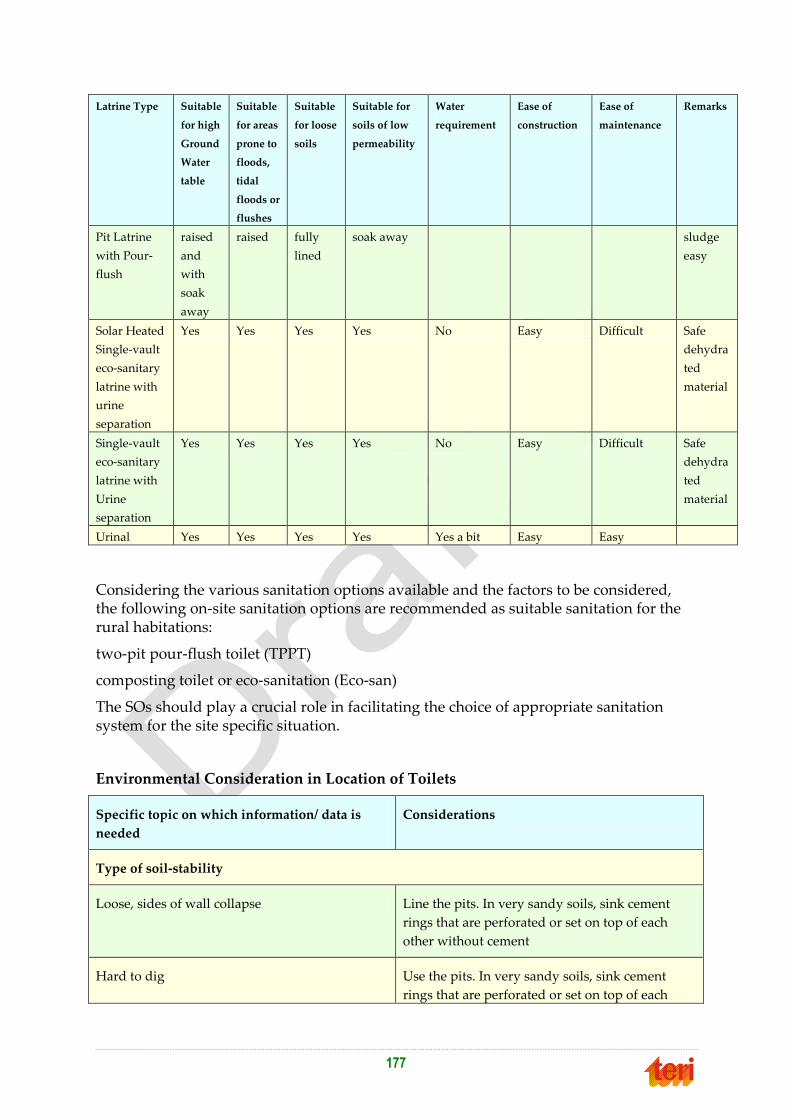
177
Latrine Type Suitable
for high
Ground
Water
table
Suitable
for areas
prone to
floods,
tidal
floods or
flushes
Suitable
for loose
soils
Suitable for
soils of low
permeability
Water
requirement
Ease of
construction
Ease of
maintenance
Remarks
Pit Latrine
with Pour-
flush
raised
and
with
soak
away
raised fully
lined
soak away sludge
easy
Solar Heated
Single-vault
eco-sanitary
latrine with
urine
separation
Yes Yes Yes Yes No Easy Difficult Safe
dehydra
ted
material
Single-vault
eco-sanitary
latrine with
Urine
separation
Yes Yes Yes Yes No Easy Difficult Safe
dehydra
ted
material
Urinal Yes Yes Yes Yes Yes a bit Easy Easy
Considering the various sanitation options available and the factors to be considered, the following on-site sanitation options are recommended as suitable sanitation for the rural habitations:
two-pit pour-flush toilet (TPPT)
composting toilet or eco-sanitation (Eco-san)
The SOs should play a crucial role in facilitating the choice of appropriate sanitation system for the site specific situation.
Environmental Consideration in Location of Toilets
Specific topic on which information/ data is
needed
Considerations
Type of soil-stability
Loose, sides of wall collapse Line the pits. In very sandy soils, sink cement
rings that are perforated or set on top of each
other without cement
Hard to dig Use the pits. In very sandy soils, sink cement
rings that are perforated or set on top of each

178
Specific topic on which information/ data is
needed
Considerations
other without cement
Permeability (how water is absorbed by soil)
Clay soil
Test by pouring water into a hole and measuring
how long it takes to be absorbed. Pits in dese clay
may need back filling about 1.2 meters with more
sandy soil.
Coarse sand
Back fill around the rings with denser soil and/or
locate the latrine pipes far 9 for example, 40
meters or more) from a well-used for drinking
Hard Latrine
If there might be cracks in the latrine, the latrine
pits can pollute nearby drinking water sources.
Place the latrine far from these sources.
Ground water level in wet season (deepest level)
Water rises higher than one meter from bottom of
the latrine pit, but never completely floods the
latrine pits
Locate the latrine pit far from any well used for
drinking purpose and should be away for
example, 40 meters or more
Water rises to or above the ground level and
sludge comes out the latrines
Raise the latrines above the ground level so that
the top third of the pit is always above the water
level. Place latrines far from drinking water
sources
Distance to Water sources
Distance from latrines pit to drinking water
sources
At least 15 meters
Children or teachers may be spent extra tie, for
example, more than 15 minutes going one-way to
collect water
VIP latrine is preferred as it uses less water

179
AAnnnneexxuurree 1100 RReeccoommmmeennddeedd CCoonnssttrruuccttiioonn
PPrraaccttiiccee aanndd PPoolllluuttiioonn SSaaffeegguuaarrddss ffoorr TTwwiinn
PPiitt PPoouurr FFlluusshh LLaattrriinneess3322
Construction of Pits
1. Pits in Water logged, Flood Prone and High Sub-soil Water Areas
In high sub-soil, water logged or flood-prone areas, the pits should be raised above the ground level to a height such that the invert of the incoming drains/pipes is just above the likely flood water or sub-soil water level. Raising the pipes will necessitate raising the latrine floor also.
In pits located in water logged or flood prone areas, earth should be filled and well compacted all around the pits in 1000 mm width and up to the top. It is not necessary to raise the pits by more than 300 mm above the plinth of the house. In these situations, the pits should be designed as wet pits, taking into consideration the infiltration rate of the type of soil.
2. Pits in Rocky Strata
In rocky strata with soil layers in between, leach pits are designed on the same principles as those for low sub-soil water level taking the infiltration capacity of the soil as 20 litres per sq.m per day. However, in rocks with fissures, chalk formations, or old root channels, pollution can flow over a very long distance; hence these conditions demand careful investigation and adoption of pollution safeguards. In impervious rocky strata the pits will function as holding tanks since there will be no infiltration of liquid. In such situations, a PF latrine with leaching pits is not a suitable system.
3. Pits in Soils with Low Infiltration Capacity
Leaching capacity tends to be the limiting factor when the infiltration capacity of soil is low. In these circumstances, there are two options: construct a larger pit, or increase the critical leaching area by backfilling and compacting with brick ballast, gravel, sand etc., for the required width all around the pit.
Emptying of Pits/Septic tanks
Emptying of pits becomes essential when they get filled. The three most important issues related to emptying of pits are frequency, cost, and hygiene. Manual methods of emptying are common for pour-flush latrines. The responsibility for emptying latrines is with the users. The main guidelines relating to latrine emptying include advising householders that the filling1 emptying cycle is likely to be between three to six years and that they need to make their own arrangements for emptying the pits.
Emptying g costs are location-specific; anticipated emptying costs should be ascertained with local contractors during programme planning.
32 Technical Guidelines on Twin Pit Pour Flush Latrines (1992), Ministry of Urban Development, Government of India

180
Groundwater pollution
A problem that is related to on-site sanitation is the potential for pollution of groundwater that is associated with these systems. Groundwater under or near pit latrines may become polluted, which can be a serious problem when it affects the quality of drinking-water drawn from wells and boreholes. Water in leaky pipes may also be contaminated if the pressure drops and polluted groundwater levels are above the pipes. A particular problem in densely populated areas is the possible proximity of latrine pits and shallow wells on neighboring plots. The key guideline is that a minimum distance of 15 m, other than in fractured formations, between a pit and a downstream water-point, is normally sufficient to remove all contaminants.
Pollution safeguards for twin pit pour flush latrines
To ensure that the risk of polluting ground water and drinking water sources is minimal, the following safeguards should be taken while locating the pits of the pour flush latrines:
Drinking water should be obtained from another source or from the same aquifer but at a point beyond the reach of any fecal pollution from the leach pits.
If the soil is fine (effective size 0.2 mm or less), the pits can be located at a minimum distance of 3 m from the drinking water sources, provided the maximum ground water level throughout the year is 2 m or more below the pit bottom (low water table). If the water table is higher, i.e., less than 2 m below the pit bottom, the safe distance should be increased to 10 m.
If the soil is coarse (effective size more than 0.2 mm), the same safe distances as specified above can be maintained by providing a 500 mm thick sand envelope, of fine sand of 0.2 mm effective size, all around the pit, and sealing the bottom of the pit with an impervious material such as puddle clay, a plastic sheet, lean cement concrete, or cement stabilized soil.
If the pits are located under a footpath or a road, or if a water supply main is within a distance of 3 m from the pits, the invert level of the pipes or drains connecting the leach pits should be kept below the level of the water main, or 1 m below the ground level. If this is not possible due to site considerations, the joints of the water main should be encased in concrete.
Operation and Maintenance – Do’s and Don’ts s of Twin-pit Pour-flush Latrines
DOs
Keep a bucket full of water outside the toilet.
Keep a 2 liters can in the toilet filled with water for flushing.
Before use, pour a little quantity of water to wet the pan so that excreta can slide smoothly into the pit.
Flush the excreta after each use.
Pour a little quantity of water, say half a liter, in the squatting pan after urination.

181
The squatting pan should be cleaned daily with a soft broom or soft brush with a long handle after sprinkling a small quantity of water and detergent powder/soap.
Use minimum quantity of water in washing the pan and toilet floor.
Wash hands, using soap or ash, after defecation at the assigned place.
If any construction defect is observed during the defect-liability period, report the matter to the local authority or the construction agency.
When the pit in use is full, divert the flow to the second pit
If the trap gets choked, rodding should be done from the pan side as well as from the rear side by means of a split bamboo stick, after removing the cover of the drain or junction chamber.
Care should be taken while de-sludging the pits located in water-logged or high water sub-soil water areas and in case of combined pits, as humus may not be safe for handling.
DON'Ts
Do not use both the pits at the same time.
Do not use more than 2 litres of water for each flushing (if the waste is not flushed with 2 litres, pour more water at the specific spots for flushing the waste).
Do not use caustic soda or acid for cleaning the pan.
Do not throw sweepings, vegetable or fruit peelings, rags, cotton waste, and cleaning materials like corn cobs, mud balls, stone pieces, leaves, etc. in the pan or the pits.
Do not allow rain water, kitchen or bath waste to enter the pits.
Do not provide water tap in the toilet.
Do not throw lighted cigarette butts in the pan.
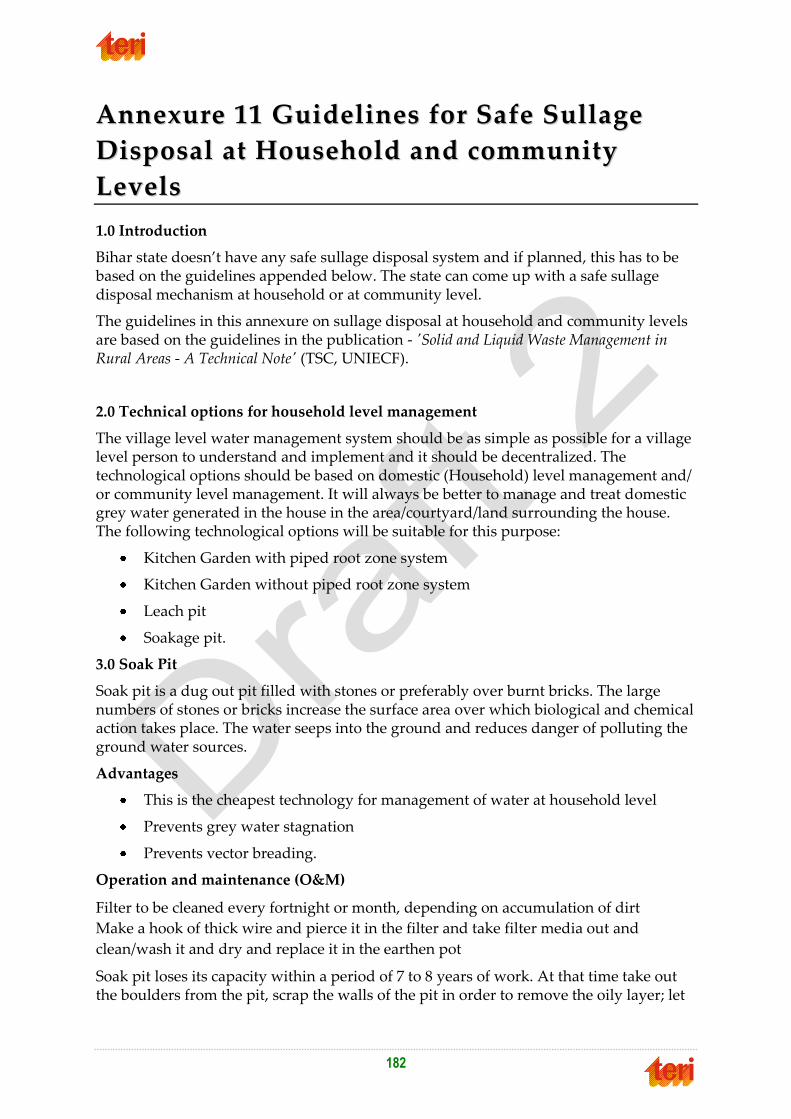
182
AAnnnneexxuurree 1111 GGuuiiddeelliinneess ffoorr SSaaffee SSuullllaaggee
DDiissppoossaall aatt HHoouusseehhoolldd aanndd ccoommmmuunniittyy
LLeevveellss
1.0 Introduction
Bihar state doesn’t have any safe sullage disposal system and if planned, this has to be based on the guidelines appended below. The state can come up with a safe sullage disposal mechanism at household or at community level.
The guidelines in this annexure on sullage disposal at household and community levels are based on the guidelines in the publication - 'Solid and Liquid Waste Management in Rural Areas - A Technical Note' (TSC, UNIECF).
2.0 Technical options for household level management
The village level water management system should be as simple as possible for a village level person to understand and implement and it should be decentralized. The technological options should be based on domestic (Household) level management and/ or community level management. It will always be better to manage and treat domestic grey water generated in the house in the area/courtyard/land surrounding the house. The following technological options will be suitable for this purpose:
Kitchen Garden with piped root zone system
Kitchen Garden without piped root zone system
Leach pit
Soakage pit.
3.0 Soak Pit
Soak pit is a dug out pit filled with stones or preferably over burnt bricks. The large numbers of stones or bricks increase the surface area over which biological and chemical action takes place. The water seeps into the ground and reduces danger of polluting the ground water sources.
Advantages
This is the cheapest technology for management of water at household level
Prevents grey water stagnation
Prevents vector breading.
Operation and maintenance (O&M)
Filter to be cleaned every fortnight or month, depending on accumulation of dirt
Make a hook of thick wire and pierce it in the filter and take filter media out and
clean/wash it and dry and replace it in the earthen pot
Soak pit loses its capacity within a period of 7 to 8 years of work. At that time take out the boulders from the pit, scrap the walls of the pit in order to remove the oily layer; let

183
the pit dry for a period of 2 to 3 days and clean and dry the boulders and replace into the pit.
Limitations
Soakage pit is not suitable for rocky terrain
It will over flow if wastewater flow in the pit exceeds the design flow
If suspended solids get into the pit, the choking of the pit will take place earlier.
4.0 Off Site Community Level Management:
For the community grey water of this type, the first step would be to establish a system for collecting and transporting this grey water for the final treatment on a suitable location. It will be necessary to establish a suitable drainage system for this purpose. This drainage system could be of two types
a. Open drain with technically sound design, involving semicircular base and trapezoidal cross section so as to maximize self-cleansing velocity for carrying away silt in grey water
b. Closed drain-small bore grey water draining system with intercepting tanks at suitable points.
1. Open or Surface Grey water Drainage System
For collection and transportation of grey water .owing out from the houses, surface drain has been the simplest system, whereby, the community grey water is carried away from the village for onward final treatment. This system can be established easily with available local mason at minimum cost.
Operation and maintenance (O&M)
Gram Panchayat will have to establish a system for periodical cleaning and silt removal from the drain
Community will have to be educated to keep the drain free from garbage, so as to avoid blockages in drain
Care needs to be taken to avoid over-flow water (effluent) from septic tank, from flowing to the open drain. This effluent should be led to leach pit covered at the top.
2. Closed Drainage
a. Small bore grey water drainage system
In rural areas, closed drain system akin to conventional sewerage systems will not be feasible because of the excessive capital & operation maintenance expenditure and the elaborate maintenance requirements.
The small bore grey water drainage system which is laid close to the soil surface is suitable and appropriate as it is low cost and requires minimum maintenance which is easy.

184
Advantages:
As the system is closed, materials like garbage, road side solid wastes, plastics, building materials etc. will not and access to the system
Operation and maintenance becomes easily manageable by Gram Panchayat
Construction cost is comparable to the cost for surface drain. It may be only marginally varying
Road space is fully utilized.
5.0 Final Treatment of Community Grey water
Once the community grey water is collected at one or multiple points outside the village, final treatment is required to convert it into harmless and reusable water.
The treatment technologies need to suit the following requirements.
As low cost as possible
O&M should be easy and low cost for Gram Panchayat
Same cost recovery may be possible by the farmers
Selling the treated water. Treated water could be used for public gardens or horticulture. The produce may be sold portably
Vector breeding is avoided
Pollution of water from nala or river is prevented.
Some appropriate technologies easily manageable by Gram Panchayat could be as follows:
o Sullage stabilization pound and reuse
o Sedimentation and reuse
o Screening stabilization tank systems like DOSIWAM, DEWATS etc.
A. Sullage Stabilization Ponds
The grey water collected via drainage system is passed to large shallow basins or ponds excavated at suitable land site and placed serially as a stabilization system in which grey water is stabilized, its pathogenicity is reduced and the stabilized water becomes useable.
a. Anaerobic ponds
The grey water reaching the pond via drain, usually has high solid content. In the anaerobic pond, these solids settle at the bottom, where these are digested anaerobically. Thus, the partially clarified liquid is discharged onwards into a facultative pond for further treatment.
b. Facultative ponds
The partially clarified water is led to facultative pond. 1n this pond oxidation of grey water takes place. It is called 'facultative' because in this pond in the upper layer aerobic conditions are maintained while in the lower layer, anaerobic conditions exist.

185
c. Maturation pond
The stabilized water from facultative pond is led to a maturation pond. The main function of the maturation period is the destruction of pathogens. This pond is wholly aerobic.
Operation and maintenance
It will be the responsibility of GP
Maintenance requirements are minimal. Regular cutting of grass on embankments and removal of any floating scum from pond surface are the only requirements
Occasional anti mosquito spraying treatment may be necessary.
B. Screening, Sedimentation and Filtration
The grey water collected from drainage system can be passed through a screening, sedimentation and filtration tank system. The treated water can be used for irrigation etc.
C. Reuse of Stabilized Water
Grey water stabilized and cleaned by the use of any of the above mentioned systems can be reused in many ways.
Irrigation for agricultural use
Irrigation for horticulture
Fish farming.
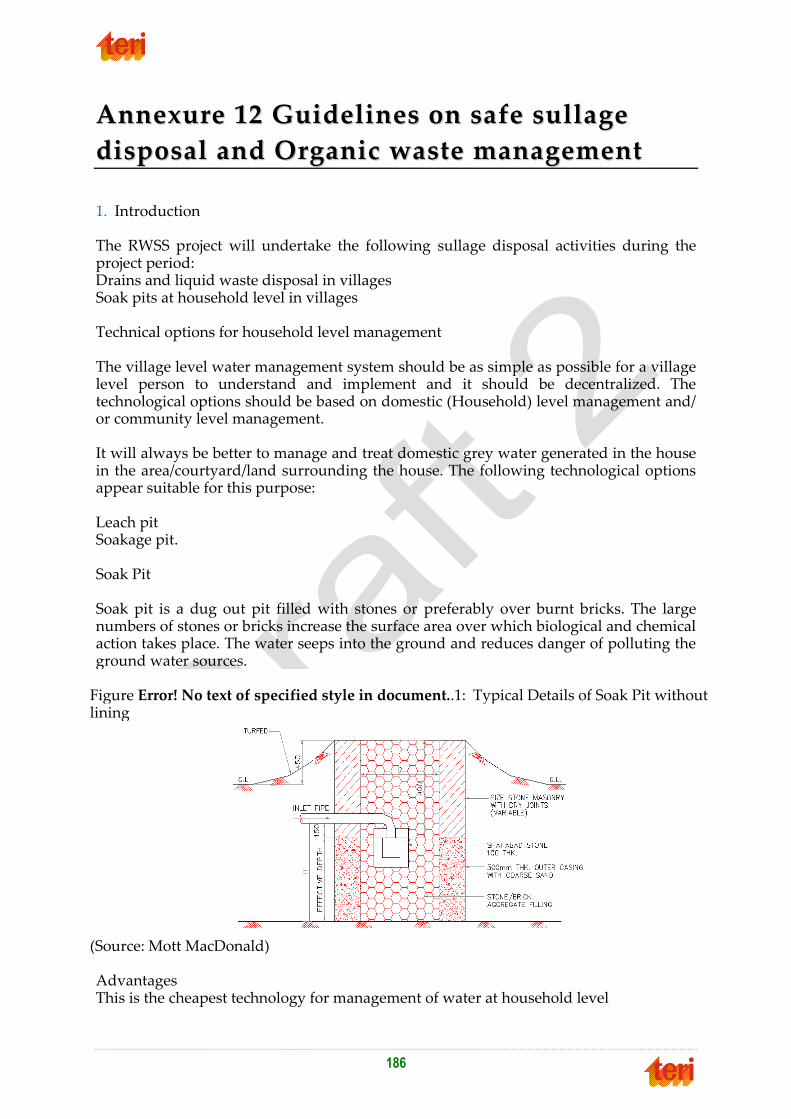
186
AAnnnneexxuurree 1122 GGuuiiddeelliinneess oonn ssaaffee ssuullllaaggee
ddiissppoossaall aanndd OOrrggaanniicc wwaassttee mmaannaaggeemmeenntt
1. Introduction
The RWSS project will undertake the following sullage disposal activities during the project period: Drains and liquid waste disposal in villages Soak pits at household level in villages
Technical options for household level management
The village level water management system should be as simple as possible for a village level person to understand and implement and it should be decentralized. The technological options should be based on domestic (Household) level management and/ or community level management.
It will always be better to manage and treat domestic grey water generated in the house in the area/courtyard/land surrounding the house. The following technological options appear suitable for this purpose: Leach pit Soakage pit.
Soak Pit
Soak pit is a dug out pit filled with stones or preferably over burnt bricks. The large numbers of stones or bricks increase the surface area over which biological and chemical action takes place. The water seeps into the ground and reduces danger of polluting the ground water sources.
Figure Error! No text of specified style in document..1: Typical Details of Soak Pit without lining
(Source: Mott MacDonald)
Advantages This is the cheapest technology for management of water at household level

187
Prevents grey water stagnation Prevents vector breeding.
Operation and maintenance (O&M) Filter to be cleaned every fortnight or month, depending on accumulation of dirt Make a hook of thick wire and pierce it in the filter and take filter media out and
clean/wash it and dry and replace it in the earthen pot Soak pit looses its capacity within a period of 7 to 8 years of work. At that time take out
the boulders from the pit, scrap the walls of the pit in order to remove the oily layer; let the pit dry for a period of 2 to 3 days and clean and dry the boulders and replace into the pit.
Limitations Soakage pit is not suitable for rocky terrain and areas having impermeable soil strata. It will overflow if wastewater flow in the pit exceeds the design flow If suspended solids get into the pit, the choking of the pit will take place earlier. Off Site Community Level Management:
For the community grey water of this type, the first step would be to establish a system for collecting and transporting this grey water for the treatment on a suitable location. It will be necessary to establish a suitable drainage system for this purpose. This drainage system could be of two types: Open drain with technically sound design, involving semicircular base and trapezoidal cross section so as to maximize self cleansing velocity for carrying away silt in grey water Closed drain-small bore grey water draining system with intercepting tanks at suitable points.
Open or Surface Grey water Drainage System
For collection and transportation of grey water flowing out from the houses, surface drain has been the simplest system, whereby, the community grey water is carried away from the village for treatment. This system can be established easily with available local mason at minimum cost.
Operation and maintenance (O&M) Gram Panchayat will have to establish a system for periodical cleaning and silt
removal from the drain. Community will have to be educated to keep the drain free from garbage, so as to
avoid blockages in drain. Care needs to be taken to avoid overflow water from flowing to the open drain.
This effluent should be led to leach pit/soak pit covered at the top.
Closed Drainage
Small bore grey water drainage system
In rural areas, closed drain system analogous to conventional sewerage systems will not be feasible because of the excessive capital & operation maintenance expenditure and the sophisticated maintenance requirements.
188
The small bore grey water drainage system which is laid close to the soil surface is suitable and appropriate as it is low cost and requires minimum maintenance which is easy.
Advantages: As the system is closed, materials like garbage, road side solid wastes, plastics, building
materials etc. will not find access to the system. Operation and maintenance becomes easily manageable by Gram Panchayat. Construction cost is comparable to the cost for surface drain. It may be only marginally
varying. Road space is fully utilized. Treatment of Community Grey water
Once the community grey water is collected at one or multiple points outside the village, treatment is required to convert it into harmless and reusable water. The treatment technologies need to suit the following requirements. As low cost as possible O&M should be easy and low cost for Gram Panchayat Some cost recovery may be possible by the farmers Selling the treated water. Treated water could be used for public gardens or horticulture.
The produce may be sold portably. Vector breeding is avoided Pollution of water from nallah or river is prevented. Some appropriate technologies easily manageable by Gram Panchayat/villagers could be
as follows: Sullage stabilization and reuse Systems like Decentralized Wastewater Treatment Systems (DEWATS).
Sullage Stabilization Ponds
The grey water collected via drainage system is passed to such ponds excavated at suitable land site and placed serially as a stabilization system in which grey water is stabilized, its pathogenicity is reduced and the stabilized water becomes useable.
Anaerobic ponds
The grey water reaching the pond via drain usually has high solid content. In the anaerobic pond, these solids settle at the bottom, where these are digested anaerobically. Thus, the partially clarified liquid is discharged onwards into a facultative pond for further treatment.
Facultative ponds
The partially clarified water is led to facultative pond. In this pond oxidation of grey water takes place. It is called ‘facultative’ because in this pond in the upper layer aerobic conditions are maintained while in the lower layer, anaerobic conditions exist.
Maturation pond
The stabilized water from facultative pond is led to a maturation pond. The main function of the maturation period is the destruction of pathogens. This pond is wholly aerobic.

189
Operation and maintenance It will be the responsibility of GP. Maintenance requirements are minimal. Regular cutting of grass on embankments and
removal of any floating scum from pond surface are the only requirements Occasional anti mosquito spraying treatment may be necessary.
Reuse of Stabilized Water
Grey water stabilized and cleaned by the use of any of the above mentioned systems can be reused in many ways such as irrigation for agricultural use and irrigation for horticulture.
ECOPs on safe solid waste management at individual household and community level
The guidelines in this annexure on solid waste disposal at household and community levels are based on the guidelines in the publication - 'Solid and Liquid Waste Management in Rural Areas - A Technical Note' (TSC, UNICEF). These guidelines will apply to the solid disposal activities undertaken in the Bihar RWSS.
Solid Waste
Biodegradable &
Recyclable
Non-biodegradable
Non-recyclable Recyclable Kitchen waste, Cattle waste,
Agriculture Leaves, Meat,
Bones Dead animals Paper
Wood, etc.
Plastic waste, wire caps,
Tin Metal, Ash/dirt etc. E-waste, Biomedical
waste etc.

190
Approaches for Solid Waste Management
For effective management of solid waste in rural areas, focus should be on management at household level. That which cannot be managed at household level should be managed at the community level. In general, the following approach should be followed: Segregation of solid waste at the household level (Biodegradable and non
biodegradable). Reuse of non biodegradable waste at the household level to the extent possible. Household level treatment of bio degradable waste. Collection and transportation of segregated waste at the household level to a place
identified at the community level (in cases where household level treatment is not possible).
Community level treatment or recycling/reuse of waste All the biodegradable waste should be composted at the community level Non biodegradable waste may be further segregated and sold or recycled Waste which cannot be composted, reused or recycled may be disposed at the landfill
sites following appropriate procedure, (such waste may usually be construction waste, debris etc).
Community level composting
Community level composting may be coursed to when management of solid waste at
household level is not possible. For community level composting, Panchayat should
select a suitable site as Compost Yard for the village. Site should be selected taking into
consideration wind flow direction, so that the inhabited areas don’t get any foul odour.
The site should be easily accessible for transportation of waste and manure. It should
not be a low lying area to avoid water logging.
a. Underground manure pit or garbage pit:
This is applicable for rural areas with low rainfall and villages where there is lack of space at household level for composting. This is not suitable for heavy rainfall areas and rocky terrain.
Use and maintenance of the pits Go on adding collected garbage in the pits (only biodegradable type) Wherever possible, it is advisable to add cattle dung slurry to the garbage to enhance the
composting process Spread a very thin layer of soil over it (once a week) to avoid odour & fly nuisance Continue to add garbage everyday Follow the above procedure & repeat the layers till the pit is full. It is recommended to fill the pit up to about 300mm above ground level After 3-4 days the garbage above ground settles down Plaster it with soil. Leave the pit as it is for 3-6 months for maturation and start other pits sequentially After 3-6 months take out the compost & use it in the fields. Underground brick lined manure pit or garbage pit:
191
This is applicable for rural areas with low rainfall and villages where there is lack of space at household level for composting. This is not suitable for heavy rainfall areas and rocky terrain and is a capital intensive option.
Use and maintenance of the pit Go on adding collected garbage from the houses in the pits (only biodegradable type). Wherever possible, it is advisable to add cow dung slurry to the garbage to enhance the
composting process. Spread a very thin layer of soil over it (once a week) to avoid odour & fly nuisance. Continue to add garbage every day. Follow the above procedure & repeat the layers till the pit is full. It is recommended to
fill the pit up to about 300mm above ground level. After 3-4 days the garbage above ground settles down. Plaster it with soil. Leave the pit as it is for 3-6 months for maturation and start other pits sequentially. After 3-6 months take out the compost & use it in the fields.
Over ground brick lined compost tank:
This is applicable for rural areas with high rainfall and rocky terrain and for villages where there is lack of space at household level for composting.
Use and maintenance of the tank Go on adding collected garbage from the houses in the tank (only biodegradable type) Wherever possible, it is advisable to add cow dung slurry to the garbage to enhance the
composting process Spread a very thin (1-2 inch) layer of soil over it (once a week) to avoid odour & .y
nuisance Continue to add garbage everyday Follow the above procedure & repeat the layers till the heap attains the height of 1m After 3-4 days the garbage above ground settles down Plaster it with soil Leave the heap as it is for 3-6 months for maturation After 3-6 months take out the compost & use it in the fields Till the manure in the tank matures, make another tank of the same dimensions at a
minimum distance of 1m from the first tank.
Vermi-composting at Community Level
The following steps need to be followed for vermi-composting at community level: Appropriate site selection: the site should be protected from direct sunlight and should
not be in low lying areas Vermiculture site preparation; Proper ramming of soil or preparation of platform is
required before preparation of vermi-compost beds Construction of appropriate shed: thatched roof/tin sheds on bamboo/metal poles with
proper slope to drain rain water, and proper ventilation The biodegradable waste should be pre-digested in a separate bed before transferring to
the treatment beds.
Precautions to be taken Proper covering of feed bed (local available materials may be used for covering of the
vermi-compost pit) Avoid excess water (only sprinkling)
192
Protect the shed area and the beds from red ants, cockroaches etc. Keep the feed beds away from birds/chicken/ducks/rodents from eating the worms.
Recycling
In all types of solid waste in rural areas, plastics have become a major cause of concern due to Non-biodegradability, nuisance value in waste stream and blockage of drainage channels, pollution of surface water and random burning here and there causing air pollution problem. There is no proper collection or disposal system of plastic waste.
Disposal on commonly agreed place
In spite of composting, re-use and recycling, some waste remains untreated/unmanaged which requires final disposal. Incineration is a technology where waste is burnt in a specially engineered machine called Incinerator. Incineration is not simply burning, but complete combustion. Incinerators are considered to be causes of air pollution. This is not a viable option for waste management. A disposal site is a properly designated and commonly agreed place and used for the disposal of non-biodegradable and non-recyclable inorganic solid waste. It is considered to be a viable option. This land takes care of the problem of disposal of non recyclable solid waste. Selection of disposal Site: Gram Panchayat in consultation with Zilla Parishad should
select the site which should be: Located at the outskirts of the village Accessible On vacant/uncultivated land Located in the natural depressions with slight slopes Before establishing any disposal site, baseline data of ground water quality in the area
shall be collected and kept as a record for future reference.
Operation and maintenance Gram Panchayat/Community should prevent entry of stray animals and persons
through protective measures Avoid entry of cattle and grazing on the site.

193
AAnnnneexxuurree 1133 GGuuiiddeelliinneess ffoorr wwoorrkkiinngg iinn
FFoorreesstt AArreeaass
Considering the planned activities by the project and the scale of these activities, it is
expected that there will be minimal disturbance to forest lands. Also, the Forest
Department has clearly identified procedures to minimize and mitigate impacts on
forestland. It also identifies procedures and approvals required under the Forest
(Conservation) Rules, 2003 for any forest land diversion. However, given below are
guidelines in case the project is in/near a forest area.
Avoid forest areas and identify alternate route for laying pipeline or other infrastructure
Where there are no alternate options and there is a need to lay pipelines through a forest consider possibility of laying pipelines along the road and within the right of way of the road or right of way alternate infrastructure, if possible.
Prior to finalizing the detailed design for work in the forest, discuss with Forest Department requirement and undertake a joint survey with them on proposed siting of infrastructure.
Based upon discussions with the Forest Department, identify compensation and clearances for the project and submit the required documents as identified by the forest act and rules.
After laying the underground pipelines in the forest, the soil should be compacted with adequate plantations.
The project will also ensure that small cross-bunds (stone pitching) are made on excavated/compacted areas to prevent water runoff over it and any further soil degradation.
Both during project design and construction minimize tree cutting.
No construction activity should be undertaken at night time or during any high wildlife activity
After construction is completed the area must be brought back as close to original as is possible
Ensure that there are no construction camps near or in the forest areas and ensure that there is no firewood procured from the forest area.
Ensure that machinery used during construction creates minimum disturbance to the area.
Compensatory plantation at the ratio of 1: 3 should be undertaken, where for every tree cut, 3 trees should be planted at appropriate area identified for the activity should be 3 trees of indigenous and local species. The compensatory plantation plan should include a minimum of 3 years of management plan to ensure survival of trees.

194
AAnnnneexxuurree 1144 GGuuiiddeelliinneess:: NNaattuurraall HHaabbiittaatt
While the list of negative projects suggests that natural habitats need to be avoided for
any project sightings. However, in case of no alternative resulting in the need to site
infrastructure in or near a natural habitat, these guidelines are to be used.
According to the World Bank Operation Policy (OP) 4.04 on Natural Habitats33, the
conservation of natural habitats is essential for long-term sustainable development.
Therefore a precautionary approach to natural resource management is required. The
policy on natural habitats contains two major provisions with respect to biodiversity
conservation and EA.
1. It prohibits Bank involvement in projects, which involve significant conversion or
degradation of critical natural habitats. These include: existing protected areas and
adjoining or linked areas or resources (such as water sources) on which the protected
areas depend; and sites identified as meriting protection.
2. Secondly, where natural habitats outside protected areas are within a project’s area
of influence, the project must not convert them significantly unless,
There are no feasible alternatives
The EA demonstrates that benefits substantially outweigh the costs
Mitigation measures acceptable to the Bank are implemented, which would
normally include support for one or more compensatory protected areas that are
ecologically similar to, and no smaller than, the natural habitats adversely
affected by the project
Guidelines for Planning and Design
To minimize the adverse impact on the ecology of the natural habitats, selection
of alignment should be in consultation with and agreed to by the State Forest
Department.
The designated officer of the Forest Department must accompany the project’s
design team while identifying project design and alternative locations/designs.
Inventory of ecological features and concerns must be carried out jointly with the
designated forest official from the Forest Department.
In case consultations with the forest officials and the transact walk identify the
need for further studies, they must be undertaken
Based upon the consultations, transact walk, review of information and data and
any studies that may have been conducted required mitigation and management
plan needs to be made.
For all sites located in natural habitats, the nature, type and magnitude of impact
from infrastructure siting must be identified before appropriate management and
mitigation actions are developed and incorporated in the project design,
construction and operation and management stage.
33 Natural habitats are land and water areas where (i) the ecosystems’ biological communities are formed largely by native plant and animal species, and (ii) human activity has not essentially modified the areas primary ecological functions.
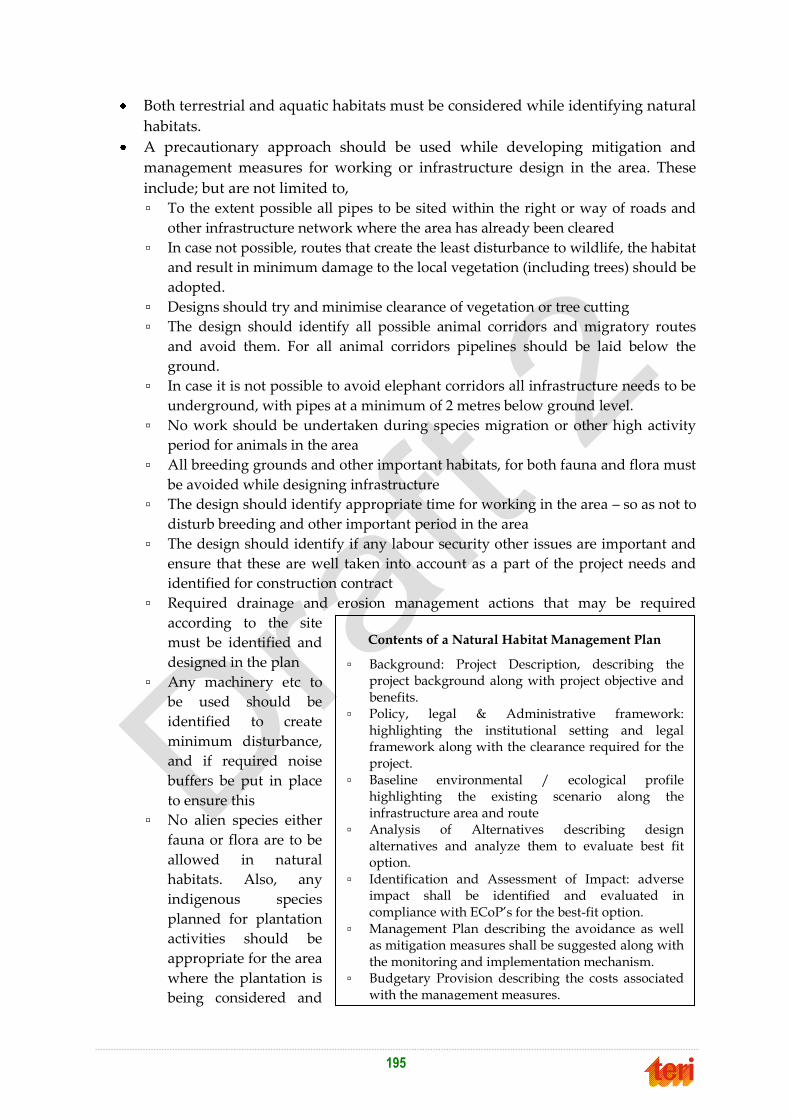
195
Both terrestrial and aquatic habitats must be considered while identifying natural
habitats.
A precautionary approach should be used while developing mitigation and
management measures for working or infrastructure design in the area. These
include; but are not limited to,
▫ To the extent possible all pipes to be sited within the right or way of roads and
other infrastructure network where the area has already been cleared
▫ In case not possible, routes that create the least disturbance to wildlife, the habitat
and result in minimum damage to the local vegetation (including trees) should be
adopted.
▫ Designs should try and minimise clearance of vegetation or tree cutting
▫ The design should identify all possible animal corridors and migratory routes
and avoid them. For all animal corridors pipelines should be laid below the
ground.
▫ In case it is not possible to avoid elephant corridors all infrastructure needs to be
underground, with pipes at a minimum of 2 metres below ground level.
▫ No work should be undertaken during species migration or other high activity
period for animals in the area
▫ All breeding grounds and other important habitats, for both fauna and flora must
be avoided while designing infrastructure
▫ The design should identify appropriate time for working in the area – so as not to
disturb breeding and other important period in the area
▫ The design should identify if any labour security other issues are important and
ensure that these are well taken into account as a part of the project needs and
identified for construction contract
▫ Required drainage and erosion management actions that may be required
according to the site
must be identified and
designed in the plan
▫ Any machinery etc to
be used should be
identified to create
minimum disturbance,
and if required noise
buffers be put in place
to ensure this
▫ No alien species either
fauna or flora are to be
allowed in natural
habitats. Also, any
indigenous species
planned for plantation
activities should be
appropriate for the area
where the plantation is
being considered and
Contents of a Natural Habitat Management Plan
▫ Background: Project Description, describing the project background along with project objective and benefits.
▫ Policy, legal & Administrative framework: highlighting the institutional setting and legal framework along with the clearance required for the project.
▫ Baseline environmental / ecological profile highlighting the existing scenario along the infrastructure area and route
▫ Analysis of Alternatives describing design alternatives and analyze them to evaluate best fit option.
▫ Identification and Assessment of Impact: adverse impact shall be identified and evaluated in compliance with ECoP’s for the best-fit option.
▫ Management Plan describing the avoidance as well as mitigation measures shall be suggested along with the monitoring and implementation mechanism.
▫ Budgetary Provision describing the costs associated with the management measures.

196
therefore should be a localised plan.
Guidelines for Construction
This section provides a brief set of guidelines for the construction stage of the project. As
required and identified in the project’s detained natural habitat management and
mitigation plan further concerns and issues should also be considered alongside.
Prior to entering a natural habitat and starting work, required permissions should be
taken up and all fee to be submitted and other formalities to be undertaken, should
be completed before commencing work
Construction contractor clauses to ensure that identified mitigation and management
measures are in place must be included in the contractor prior to work starting in
any natural habitat
No construction camps, stockyards etc. should be located within the natural habitat
or within 500m from its boundary.
Contractor in consultation with forest ranger or other appropriate authority will
prepare a schedule of construction in the natural habitat.
Areas for all activities, site plans etc. should be identified and clearly marked in the
habitat prior to starting work. This should include appropriate waste management
and material management systems and the identified systems and plans should be in
place, prior to work starting.
All construction supervisors should be trained to work in the area and for the
management of any emergencies or other difficult situations with emergency
measures clearly identified for workers and insure they are informed
Any safety issues identified in the design for workers must be ensure for the project
Workers must be trained for any actions and precautionary measures they need to
undertake and be informed about rules on how to work in the area, as identified as a
part of the project design. In case some safety equipment and gear is required to be
used by workers in the area, they must be trained prior to work commencing
The construction contractor and supervisors must be in constant contact with the
Forest Department official in charge of the area to ensure any unforeseen impacts are
mitigated in time.
There will be no material procurement for construction, for labour camps etc from
within the natural habitat shall be strictly prohibited
No water resources within the natural habitat shall be used for construction.
Use of mechanized equipment shall be kept minimal within the natural habitat.
Contractor must ensure that there will be no parking of vehicles machine and
equipment within the natural habitat.
Waste disposal in or near the natural habitat will be prohibited.
Operation and Maintenance
Apart from site specific concerns and those identified in the management and mitigation
plan for the area given below are a few concerns which must also be considered
Since there will be a need for post construction O&M for the project, required
permits etc should be kept up to date.
When there is a need to go into the natural habitat, prior permission and consents
should be taken and required information given to the officer in-charge of the area
Nobody workers etc should be allowed to stay overnight in the area, if work is not
completed and all precautions for the area as identified as a part of the construction
phase must also be adhered to for any repair and management activities

197
AAnnnneexxuurree 1155 GGuuiiddeelliinneess ffoorr pprrootteeccttiinngg
ssuurrffaaccee wwaatteerr ssuuppppllyy ssoouurrccee aanndd eennssuurriinngg
ssuussttaaiinnaabbiilliittyy
While tapping surface water especially in case of small rivulets, one of the key issues that needs to be addressed is the percentage of source discharge required to be tapped. The proportion to be tapped will depend on the other uses to which the water is being used now. If no other competing use of the water exists, about 1/3rd of the lean period supply must be left to sustain the downstream ecology.
If possible a small well be dug or a 4 or 5 m. long 4‛ diameter perforated pipe be laid along the stream at about 60 cm below ground and then connect it to the pipe taking water to the village. In this way cleaner water from the sand bed will be tapped.
In case of streams being used as source, the banks upto a few meters (say 10 m.) above tapping points be fenced to check any anthropogenic disturbance.
If possible a few check dams be made in the stream above the collection point to increase the water soaking and it will also improve the quality of water.
For wider streams, spurs will help instead of check-dams.
Catchment area treatment will be done.
The contamination, pollution and any degradation of the quality of water supply sources have damaging effects on health, well-being and economy, as well as on the general environment. The careful selection of the surface water supply source and its protection, are most important measures for preventing the spread of water borne enteric diseases.
Water, being an essential of life, is one of the most valuable resources of man. Therefore, everyone has a natural right to safe, acceptable quality water for drinking, culinary and other domestic uses.
The water supplier, an individual, a utility or the municipality, has a natural right to good quality raw water.
The responsibility for preventing and abating pollution and contamination of raw water sources rests with those who discharge, directly or indirectly, waste products into the water sources or the land, as well as with those who cause unacceptable land use conditions within the watershed.
All water and land users are responsible for taking effective action to identify and reduce to the lowest practical level pollution of surface water sources.
All levels of government and regional planning and water resources agencies must coordinate their efforts in managing, regulating and monitoring surface water resources.

198
Land, water and air are interrelated resources, and planning for their protection, management and use must consider their mutual impacts and influences in an integrated manner.
Where reasonable access to other water bodies is available, public water supply source must not be used for recreational purposes.
Primary body contact such as swimming and wading must not be allowed in water supply sources.
Distribution or equalizing reservoirs from which water is supplied directly to the public requires the strict controls and must under no circumstances be used for any type of recreation.
Control of the quality of surface water supply sources (including catchments basins, impoundments and distribution reservoirs) is imperative to facilitate the effective and economical production of safe, adequate and aesthetically acceptable water for domestic uses, and to enhance the economic value of the water for municipal and industrial purposes.
Surface Water Supply Source Monitoring and Inspection Considerations
Watershed Inspection
Physical Conditions within the watershed, near reservoirs, in relation to erosion,
sedimentation, silt movement, Floating solids, debris, oil, grease, algal mats
Excessive vegetative growth, unusually enriched growth of green grass
(indicative of sewage contamination, e.g., by failure of septic tanks)
Changes to water course path or conditions
Slumping, terrain heaving, drift wood etc
Waste Disposal
Solid wastes dumping
Oil drums, large chemical containers, other unwarranted
Industrial and household materials, equipment, appliances, and goods
Liquid waste discharges including septic tank effluents (pumpouts)
Land Use
Changes in site use (number of people, additions to buildings, repairs or
additions to septic systems).
Activities in watershed-recreation, waste disposal on land and injection wells,
construction, forestry operations etc.
Industrial storage facilities for fuels or chemicals.
Aerial spraying of pesticides or weed control agents within or surrounding the
watershed.
Condition of any road crossing, causeways, beaches, slopes, etc.
Grazing of domesticated animals (cattle, sheep, horses) and condition of the
yards.
Utilization of transportation corridors for the movement of materials which may
result in contamination should an accident occur.

199
AAnnnneexxuurree 1166 GGuuiiddeelliinneess ffoorr PPuubblliicc aanndd
wwoorrkkeerr ’’ss hheeaalltthh aanndd ssaaffeettyy
These guidelines identify possible hazards and the management and mitigation actions for
both workers in the various project stages on site and public who may be in the vicinity of
the activities.
Pre-construction stage
To ensure the safety, health and reduce possible conflicts with public, the PHED/DPMU and
the construction contractor need to provide information on the construction activities to the
public in the area. This should include
Location of construction camps, borrow areas and new quarry areas.
Extent of work
Time of construction
Diversions, if any
Precaution measures in sensitive areas
Involvement of local labours in the road construction
Health issues - water stagnation, exposure to dust, communicable disease
Mechanism for grievances
The Contractor must educate the workers to undertake the health and safety
precautions. The contractor needs to educate the workers on:
▫ Personal safety measures and location of safety devices.
▫ Interaction with the host community
▫ Protection of environment with respect to:
▫ Trampling of vegetation and cutting of trees for cooking
▫ Restriction of activities in forest areas and also on hunting
▫ Water bodies protection
▫ Storage and handling of materials
▫ Disposal of construction waste
Construction Stage
During construction all measures as identified in the bid document will be followed for the
safety and health of the construction workers and the neighbourhood. Additionally, safety
needs at the construction site would include,
Personal safety equipment (such as footwear and gloves) for the workers
Other provisions required:
▫ Adequate lighting arrangement
▫ Adequate drainage system to avoid any stagnation of water
▫ Lined surface with slope 1:40 (V:H) and provision of lined pit at the bottom, at
the storage site for chemicals and oil and at the location of the generator used for
provision of energy.
▫ Also, as required grease trap will be made.
▫ Facilities for administering first aid
The construction contractor will ensure public safety and comfort by

200
▫ Scheduling of construction work based upon sowing, harvesting and local
festival needs
▫ All the cautionary signs as per IRC: 67-2001 and traffic control devices (such as
barricades, etc.) to be
put in place as soon as
construction activity
get started and to be
kept in place till the
activities get
completed.
Following case specific
measures need to be
followed during the
progress of the activity:
▫ In case of blasting, the
Contractor must follow
The Explosives Rules,
1983
▫ During construction in
the settlement, the
contractor must ensure
there shall not be any
unauthorized parking
as well as storage of
material, adjacent to
road.
▫ Approved chemicals should be sprayed to prevent breeding of mosquitoes and
other disease-causing organisms, at all the water logging areas
The DPMU/PHED will need to carry out periodic inspections in order to ensure that
all the measures are being undertaken according to what has been agreed in the
contract.
First Aid and Safety System
The first aid kit should have a clearly marked
red cross on all sides and be white in color.
The minimum contents of the kit would include ▫ 6 small sterilized dressings ▫ 3 medium and large sterilized dressings ▫ 1 (30 mm bottle) containing 2% solution
of iodine ▫ 1 (30 mm bottle) containing an injury
disinfectant ▫ 1 snakebite lancet ▫ 1 pair of sterilized scissors ▫ 1 copy of the Government of India,
Factory Services and Labor institute leaflet
▫ 100 tablets of aspirin/painkiller ▫ Burn ointments ▫ Surgical antiseptic solution
Appropriate arrangements for emergencies and taking injured to hospitals should be made at the site
Trained health personal at the site during working hours

201
AAnnnneexxuurree 1177 TTeerrmmss ooff RReeffeerreennccee ffoorr tthhee
EEnnvviirroonnmmeennttaall SSppeecciiaalliisstt ,, SSPPMMUU
Objective
The objective of hiring of Environment Specialist is to ensure adequate management of
environmental safeguards aspects of the project, as detailed in the EA-EMF and the
same is implemented. In order to ensure effective implementation of the EMF and
provide guidance on environmental issues of the project, the SWSM intends to deploy a
full time Environment Specialist
Scope of work
The scope of work for the Environment Specialist to be positioned in the SPMU, will
comprise the following tasks:
Work closely with the project implementing agencies (Contractors and Consultants) and provide advice on the environmental aspects to be considered during design and implementation of sub- projects.
Review the EDS format and Environmental Assessments (EA) and other related documents with regard to their compliance with the EMF and approve the same.
Identify environmental issues related to sub-projects, asses the adequacy of management measures and provide necessary guidance to the consultants and contractors in improving the environment management quality.
Co-ordinate with and provide necessary support in securing regulatory clearances such as Environment and Forest Clearances or consents from the PCB and other agencies.
Carry out periodic visits to sub-project implementation sites to monitor as well as to provide onsite guidance to the contractors on the implementation of respective sub-project Environmental Management Plans (EMPs), if any, and other aspects of the EMF.
Participate in the progress review meetings of the SPMU and provide advice on environmental aspects of the respective sub-projects during implementation.
Prepare quarterly progress reports on environment management and forward the same to The World Bank for necessary approval / clearance.
Co-ordinate with the Consultants, Environmental Auditors and other consultants / agencies of the project (employed by the SPMU) and ensure that the environmental aspects related to the task of respective agencies are performed as per the EMF ;
Maintain a data base in a standard form, on the status of various environmental activities of (EDS reports, clearances, compliances, EA reports, progress reports, Monitoring data, etc.) and update the same on regular basis.
202
Prepare and submit periodic progress reports to the SWSM/ SPMU and the quarterly progress reports the World Bank, on all the aspects related to environmental management in RWSS-LIS;
Function as a single-point contact at the SPMU and for other external agencies, including The World Bank, and provide all support on environmental matters of RWSSP-LIS;
Follow up with the other agencies in addressing various environmental safeguard actions agreed during the World Bank Missions from time to time, and provide timely update to the SPMU and the Bank.
Qualification and Experience
The Consultant shall be an environment professional with post-graduation in
Environmental Engineering/ Planning /Science and 10 years of experience in
environmental management. At least 5 years of the above experience shall include
carrying out Environmental Assessment (EA/EIAs), preparation of Environmental
Management Plans (EMPs) and management of environmental issues in rural water and
sanitation projects.
Reporting and Deliverables
The Consultant shall report to the Executive Director, SPMU, RWSSP-LIS and shall
provide outputs by way of monthly reports, technical supervision reports, reviews on
various documents and other environmental matters related to the project.

203
AAnnnneexxuurree 1188 FFoorrmmaattss ffoorr EEnnvviirroonnmmeennttaall
DDaattaa SShheeeettss ((EEDDSS))
A. EDS for Water Supply
General Name of the Village: Gram Panchayat: Block: District: Type of scheme: Water source Water quality
Is water sample collected?
Test result:
Date of visit: Source location
1. Location of the water source:
2. Type of water source:
3. Is the scheme site located in a forest area/ecologically sensitive (National Park.
Wildlife Sanctuary) area?
4. Land acquisition: Govt land or private land? For groundwater source
1. What is the type of aquifer?
2. Total depth of well (metres)
3. Depth to groundwater table (Summer and Winter)
4. Is the groundwater tapping in safe zone (classified based on exploitation)?
5. Type of aquifer
6. If there is water sustainability issue, that are the steps taken for source
augmentation
In case of hand pump
1. What is the distance of this source from the nearest leach pit of any existing
sanitation facility? (It should be more than 15 metres)
2. Is the nearest latrine on a ground higher than hand pump?
3. Is there any other source of pollution within 10m of hand pump
4. Is the drainage poor causing stagnant water within 2 m of hand pump?
5. Total depth of well (meters)

204
6. Is a concrete mat (of at least 75 cm radius) planned around the bore well?
7. Is the cement floor less than 1m wide round the hand pump ?
8. Are there any cracks on the cement floor around the hand pump ?
In case of piped water
1. Is there any leakage in the distribution pipe between standpost(s) and the
reservoir?
2. Is the inspection cover on the reservoir unsanitary?
3. Is there leakage in the reservoir?
4. Is the reservoir water unchlorinated?
5. Is pressure low in any part of the distribution system? In case of water
quality problems, what are the steps taken for water treatment?
Water Quality
1. Is the water acceptable? (enclose the water quality test report)
2. If not acceptable, mention the type of water quality problem
3. Is there any chemical impurity present? Give details.
4. If the water is to be treated, mention the treatment process
5. What is the frequency planned for testing water for
bacteriological/physical/chemical contamination?
6. What is the frequency planned for testing residual chlorine?
7. What is the frequency planned for sanitary inspection? (should be 4
times/year)
8. In case of surface water sources, is there dumping of effluents/sewerage into
the surface water
9. How will the sludge and other residue from the water treatment plant be
disposed?
In case of surface water source
1. Will the scheme result in land erosion?
2. Is the surface water source sustainable?
3. Is there flood problem in the area, what measures are taken to handle
waterlogging?
4. Will the pipes go through forest, environmentally sensitive area(s)?
5. Did the river change course during the last ten years?
6. Is there an alternative/back up source (e.g. groundwater source) planned?
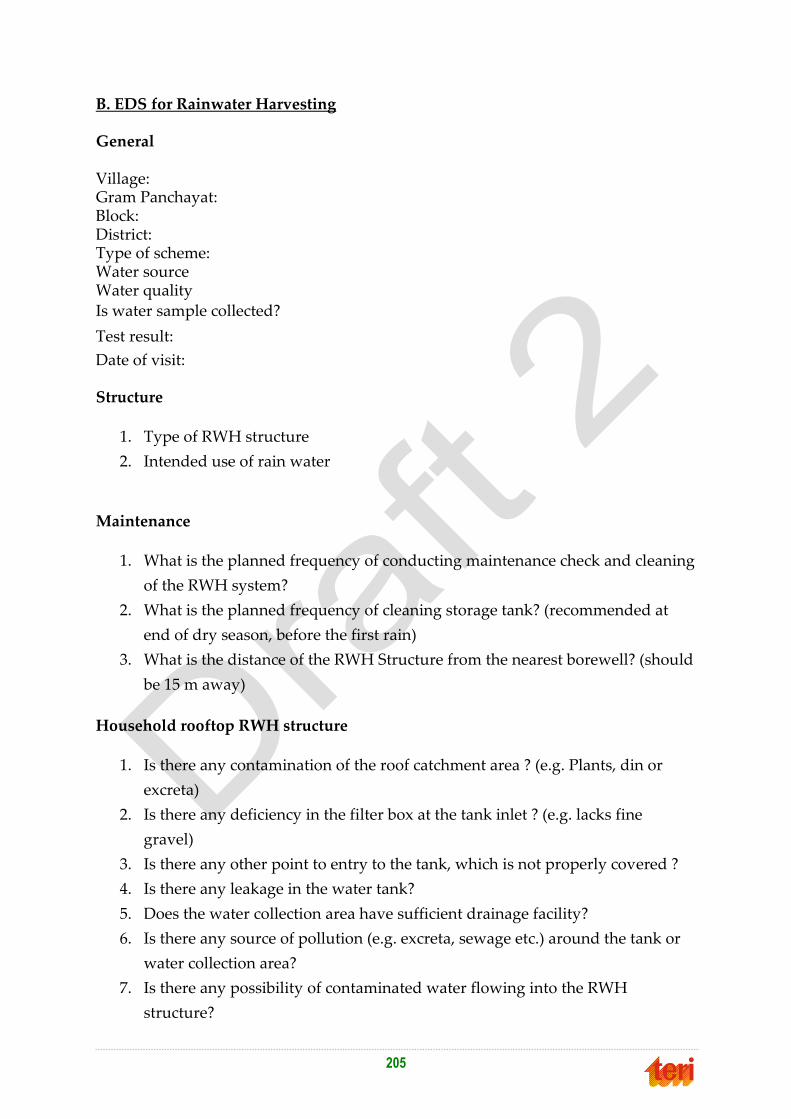
205
B. EDS for Rainwater Harvesting General Village: Gram Panchayat: Block: District: Type of scheme: Water source Water quality
Is water sample collected?
Test result:
Date of visit: Structure
1. Type of RWH structure
2. Intended use of rain water
Maintenance
1. What is the planned frequency of conducting maintenance check and cleaning
of the RWH system?
2. What is the planned frequency of cleaning storage tank? (recommended at
end of dry season, before the first rain)
3. What is the distance of the RWH Structure from the nearest borewell? (should
be 15 m away)
Household rooftop RWH structure
1. Is there any contamination of the roof catchment area ? (e.g. Plants, din or
excreta)
2. Is there any deficiency in the filter box at the tank inlet ? (e.g. lacks fine
gravel)
3. Is there any other point to entry to the tank, which is not properly covered ?
4. Is there any leakage in the water tank?
5. Does the water collection area have sufficient drainage facility?
6. Is there any source of pollution (e.g. excreta, sewage etc.) around the tank or
water collection area?
7. Is there any possibility of contaminated water flowing into the RWH
structure?
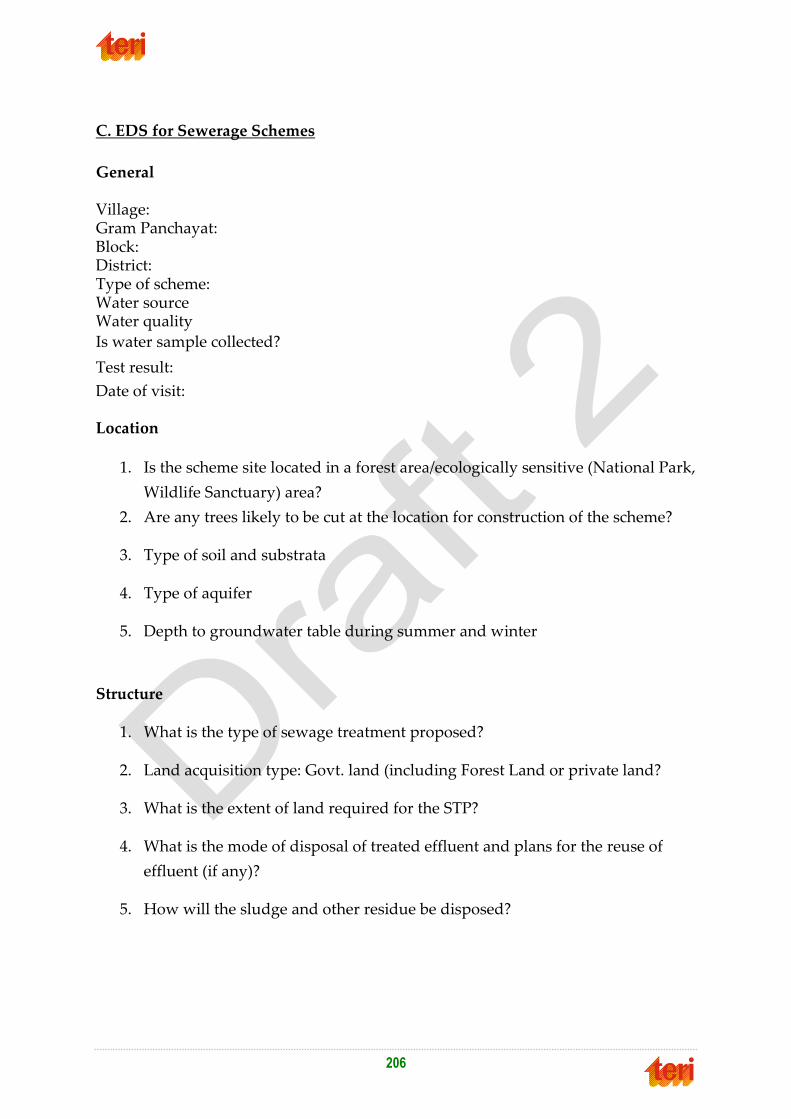
206
C. EDS for Sewerage Schemes
General Village: Gram Panchayat: Block: District: Type of scheme: Water source Water quality
Is water sample collected?
Test result:
Date of visit: Location
1. Is the scheme site located in a forest area/ecologically sensitive (National Park,
Wildlife Sanctuary) area?
2. Are any trees likely to be cut at the location for construction of the scheme?
3. Type of soil and substrata
4. Type of aquifer
5. Depth to groundwater table during summer and winter
Structure
1. What is the type of sewage treatment proposed?
2. Land acquisition type: Govt. land (including Forest Land or private land?
3. What is the extent of land required for the STP?
4. What is the mode of disposal of treated effluent and plans for the reuse of
effluent (if any)?
5. How will the sludge and other residue be disposed?

207
D. EDS for Sanitation Schemes
General Village: Gram Panchayat: Block: District: Type of scheme: Water source Water quality
Is water sample collected?
Test result:
Date of visit:
Location
1. Are any trees likely to be cut at the location for construction of the scheme? If
yes, mention the number of trees.
2. Type of soil, and substrata
3. Depth to groundwater table during summer and winter
4. Is a shallow aquifer used as source for drinking water supply in the
habitation?
5. Is a minimum distance of 10 m maintained between the pits and the nearest
drinking water sources?
Structure (For ISL)
1. Type and number of ISL proposed
2. What are the precautions taken to prevent groundwater contamination?
3. In case of high ground water table, is raising of platform, bottom sealing of pit
and earth filling outside along sides of pit planned?
4. In case of flood prone area, is raising of platform and earth filling outside
along sides of pit planned?
5. In case of loose soils, is lining of pits with perforated cement rings planned?
6. In case of soils with high permeability, is earth filling around rings with
denser soil planned?
7. Is an awareness programme for prospective users on proper use and
maintenance of the IHLs being planned?
8. What is the expected cleaning interval of pits?
9. What is the method of disposal of materials from pits?

208
E. EDS for Storm water / Sullage Drainage Scheme
General Village: Gram Panchayat: Block: District: Type of scheme: Water source Water quality
Is water sample collected?
Test result:
Date of visit:
Location
1. Current sullage disposal practice and status
2. Type of soil, substrate, aquifer
3. Is any component of the scheme located in a forest area?
Structure
1. Are any trees likely to be cut at the location for construction of the scheme? If yes, mention the number of trees.
2. Depth to groundwater table during summer and winter 3. What are the precautions taken to prevent groundwater contamination from
sullage? 4. What is the proposed length of drain? 5. How will the maintenance of the drains be conducted? 6. What is the treatment proposed for the sullage? 7. What is the elevation of the drain in relation to the road.
G. EDS for Community Solid Waste Management
General Village: Gram Panchayat: Block: District: Type of scheme: Water source Water quality

209
Waste Management
1. Current solid waste disposal practice and status 2. Type of soil, substrate, aquifer 3. Is any component of the scheme located in a forest area? 4. Depth to groundwater in summer and winter 5. What is the expected quantity of solid waste generation per day? (tons) 6. What is the expected quantity of biodegradable waste (waste that can be
composted) per day? (tons) 7. What is the expected quantity of non-biodegradable waste (waste that can not
be composted) per day? (tons) 8. Is segregation of wastes at household level (into biodegradable and non-
biodegradable wastes) being planned? 9. How will the household waste be collected? 10. Are the community waste bins planned to be located at least 15 m away from
any water sources? 11. What is the planned frequency of collecting waste (from community bins or
from individual households)? 12. What is the type of composting planned? Underground or overground 13. What part of the non-biodegradable waste will be recycled?

210
AAnnnneexxuurree 1199 IInntteerrnnaall SSuuppeerrvviissiioonn ooff tthhee
CCoommpplleetteedd SScchheemmeess
INTERNAL SUPERVISION OF THE COMPLETED SCHEMES
The objectives of the internal supervision of the completed schemes are to
check the adequacy/correctness of EDS, screening and environmental assessment of the
Category II schemes; and check in the field the quality of implementation and
effectiveness of the environmental mitigation measures with reference to the
performance indicators.
Scope:
Internal supervision will be carried twice a year for about 30% of schemes (as given in table below) completed in each districts. The supervision will be done by a team of officials formed from DWSCs of other districts by the Project Support Unit (PSU). Internal supervision should be done prior to taking up of the external audit.
Sampling of Schemes for Internal supervision:
Sampling of schemes for Internal Supervision will be done considering the significance of the scheme-type to the environment.
The following table indicates the number of samples of each type of scheme that will be included for internal supervision:
Table: Sampling of schemes for external supervision
Components
2013/14 2014/15 2015/16 2016/17 2017/18 Total Remarks
- SHS Schemes
(New Scheme) 10 40 0 0 0
50
Supervision
sample
3 12 0 0 0 15 About 30%
sample as
environmental
impacts are
significant
- SGS Schemes
(New Scheme) 136 31 47 24 0
238
Supervision
sample 41 9 14 7 0 71
About 30%
sample as
environmental
impacts are
significant

211
Table: Sampling of schemes for external supervision
- Simple MVS
(New Scheme) 3 3 4 0 0
10
Supervision
sample 1 1 1 0 0 3
About 30%
sample as
environmental
impacts are
significant
- Large MVS
(New Scheme) 1 1 0 2 0
4
Supervision
sample 1 1 0 1 0 3
About 30%
sample as
environmental
impacts are
significant
- SGS Schemes
(Rehabilitation
of Old
Schemes)
0 10 0 10 8 28
Supervision
sample 0 3 0 3 2 8
About 30%
sample as
environmental
impacts are
significant
Guidelines for Internal supervision:
A. Documents to be referred to prior to and during the Supervision visit:
Filled in EDS of the scheme type
Filled in Checklist for Environmental Assessment of the Category II Schemes (if
applicable)
Scheme specific supervision checklist given in Annexures 19 and 21.
Format of report of field visits undertaken during supervision given in Annexure
22
B. Process of supervision:
The supervision visit must include the following methodology:
Interaction with JE/AEE
Interaction with SO
Interaction with GPWSC
Field inspection of all components of the scheme under supervision
Interaction with beneficiaries
Photo documentation (highlighting any significant issues)
C. Report of Supervision: For each scheme visited in the supervision, a separate report
should be prepared as per the format given in Annexure 22. The report must be
submitted to the DPMU for action. A copy must be sent by the DPMU to the SPMU for
reference.

212
AAnnnneexxuurree 2200 EExxtteerrnnaall AAuuddiitt ooff tthhee
CCoommpplleetteedd SScchheemmeess
EXTERNAL AUDIT OF THE COMPLETED SCHEMES
Objectives:
Objectives of external audit are to verify/check the following:
To check the adequacy/correctness of EDS, screening and environmental evaluation of the Category II schemes;
To check in the field the quality of implementation and effectiveness of the environmental mitigation measures with reference to the performance indicators.
To assess the effectiveness of supervision and capacity building initiatives undertaken as part of the EMF
Scope:
External audit will be carried once in a year for about 15% (as given in the table below) of all schemes completed in each district. The audit will also conduct a desk review to verify whether the environmental assessments procedures are followed correctly. The external audit will be done by an external agency appointed by the SPSU.
Sampling of Schemes for External Audit:
Sampling of schemes for External Audit will be done considering the significance of the scheme-type to the environment. The following table indicates the number of samples of each type of scheme that will be included in the supervision:
Table: Sampling of schemes for external supervision
Components
2013/14 2014/15 2015/16 2016/17 2017/18 Total Remarks
- SHS Schemes
(New Scheme) 10 40 0 0 0 50
Supervision
sample 2 6 0 0 0 8
About 15%
sample as
environmental
impacts are
significant
- SGS Schemes
(New Scheme) 136 31 47 24 0 238
Supervision
sample 20 5 7 4 0 36
About 15%
sample as
environmental
impacts are
significant

213
Table: Sampling of schemes for external supervision
- Simple MVS
(New Scheme) 3 3 4 0 0 10
Supervision
sample 1 1 1 0 0 3
About 15%
sample as
environmental
impacts are
significant
- Large MVS
(New Scheme) 1 1 0 2 0 4
Supervision
sample 1 1 0 1 0 3
About 15%
sample as
environmental
impacts are
significant
- SGS Schemes
(Rehabilitation
of Old
Schemes)
0 10 0 10 8 28
Supervision
sample 0 2 0 2 1 5
About 15%
sample as
environmental
impacts are
significant
50% of the schemes taken up for external audit will be selected on the above basis from the
schemes already supervised internally to assess the effectiveness of internal supervision.
A. Documents to be referred to prior to and during the External Audit:
EA/EMF of the RWSS schemes
Reports of all supervision reports
List of performance indicators (Annexure 23)
Reports of previous External Audits (if applicable)
Reports of all capacity building programs related to the EMF
For the specific schemes selected for field visits:
7. Filled in EDS of the scheme-type
8. Filled in Checklist for Environmental Assessment of the Category II Schemes (if
applicable)
9. Report of any previous internal supervision visit undertaken to the scheme (if
applicable)
10. Scheme-specific audit checklist given in Annexures 20 and 21
11. Format of report of field visits undertaken during audit given in Annexure 22
B. Process of External Audit:
The audit include the following methodology:
Interaction with the SPSU and at least 30% of the DPSUs
Desk review of all relevant EMF documents (mentioned in A)

214
For the specific schemes selected for field visits:
Interaction with AEE/EE
Interaction with SO
Interaction with GPWSC
Field inspection of all components of the scheme under supervision
Interaction with beneficiaries
Photo documentation (highlighting any significant issues)
Report of Audit: A detailed report of the external audit as per the format given in
Annexure 22 must be submitted to the SPSU for action. The report must include the
following:
1. Description of methodology including details of sampling
2. Review of the following (implementation and issues):
3. Effectiveness of the environmental assessment system in identifying issues and
4. implementing appropriate mitigation measures
5. Institutional arrangements for implementation of the EMF
6. Capacity building on the EMF
7. Responsiveness of EMF to emerging environmental concerns
8. Overall environmental performance of the PHED with respect to the performance
indicators (Annexure 23)
9. Recommendations for strengthening the EMF
10. Individual reports of the field visits undertaken as per the Annexure 22 (Sample
Report of Field Visits Undertaken during Internal Supervision / External Audit).

215
AAnnnneexxuurree 2211 CChheecckk lliisstt ffoorr EEnnvviirroonnmmeennttaall
SSuuppeerrvviissiioonn//AAuuddiitt
CHECKLIST FOR SUPERVISION/AUDIT OF WATER SUPPLY SCHEMES
Groundwater sources
Construction:
Well construction: Total depth of well. Type of casing: diameter, material and length from surface. Screen or perforations: diameter, material, locations and lengths. Formation seal: Material (cement, sand, bentonite, etc.), depth intervals, annular thickness and method of placement.
Protection:
Protection of well at top: presence of sanitary well seal, casing height above ground or flood level, protection of well from erosion and animals. Is there any source of contamination within 15 m radius from the well? Is direct runoff of rain water into bore well sources prevented? Is a concrete mat of sufficient thickness for 75 cm radius around the bore well
provided to seal the outer periphery of the bore well with the casing pipe raised 60 cm above ground level? Is rainwater harvesting and recharge structure located within 15 m of the bore well
subject to direct contamination of the source? Is there any soak pit for the disposal of effluent from septic tank or other sanitation
facility is within 15 m radius from the bore well of water supply source subject to direct contamination? Is there any sand mining in the river bed within a radius of 500 m from the wells?
Water Oualitv:
Is there any unsafe supply available, usable in place of normal supply, hence involving danger to the public health? What is the type of disinfection arrangement provided? Is the test kit provided for
testing residual chlorine? What is the monthly consumption of bleaching powder?
Surface water sources
Protective measures in connection with the use of watershed to control fishing, boating, swimming, wading, permitting animals on marginal shore areas and in or upon the water etc. Treatment of water: kind and adequacy of equipment; duplication of parts;
effectiveness of treatment; adequacy of supervision and testing; contact period after disinfection; free chlorine residuals carried.

216
Pumping facilities: pump house, pump capacity and standby units, storage facilities.
Rainwater Harvesting Structures
• Are the rainwater harvesting (RWH) structures site specific closer to the source but 15m away from the bore well?
• Whether the location of the RWH structures was certified by the hydrogeologist of the PHED department?
• Whether the RWH structure was implemented before the onset of the monsoon'?
Water Quantity
• Any register maintained to record daily water supply to the habitation? • What are the average, maximum and minimum daily water supplies to the
community for each month? • What is average per capita water supply for each month? • What is the duration of supply?
Water Quality
Are water quality monitoring is being done as per protocol? Are records of water quality tests are maintained in a register? What are the parameters tested and the frequency of testing? Is the residual chlorine test carried out daily? What is the number of days in a month that the residual chlorine is absent? Analyze the results and report what percentage of the results are complying with the
drinking water standards.
CHECKLIST OF SUPERVISION / AUDIT OF SANITATION SCHEMES
Sanitation Coverage
Details of existing toilets in the habitation with types and categories
Number of latrines constructed prior to project =
Number of latrines constructed under the project =
Population having access to toilets = {(Number of latrines constructed prior to project+ number of latrines constructed under the project)/Population of the habitation)}*100%
Structure
Is the junction chamber of the toilet constructed with proper slope? Are the leach pits properly connected and covered with pre-cast slab? Is the facility for cleaning linked to soak pit?
Selection
Whether the selection of the toilet is appropriate to the substrata and groundwater table?

217
Operation and Maintenance
What is the condition of the toilet (including pan and fixtures such as doors)? Has the pan been cleaned after fixing and is free of cement droppings? Is the toilet and its surrounding area clean? Are the toilets being used? Is water supply available for the toilet? Are the people adopting the hygienic practices (such as cleaning hands after
using toilets)? What is the volume of the pit filled?
CHECKLIST OF SUPERVISION/AUDIT OF SANITATION SCHEMES
Sullage/ Drainage Coverage
Details of existing sullage/drainage in the habitation with types and categories
Details of existing sullage/drainage in the habitation with types and categories
Number of sullage systems (open+covered) constructed prior to project =
Number of sullage systems (open+covered) under World Bank project =
Percentage population having access to sullage/drainage = {(Number of sullage systems constructed prior to project+ number of sullage systems constructed under the WB project)/Population of the habitation)}*100%
Structure
Is the drain designed for the project population? Is the drain having proper slope and shape to maintain free flow without silting? Are there silt traps at the household connection and at the junctions? Is this drainage linked treatment facility?
Selection
Whether the selection of the pipe material appropriate to village population and soil conditions?
Operation and Maintenance
What is the condition of the drain (including manholes and treatment facility)? Is there is any pooling water in the open drains? Is there any mosquito breeding in the manholes and open drains? Do the Gram Panchayat has equipment for cleaning the drains?
CHECKLIST OF SUPERVISION I AUDIT OF SANITATION SCHEMES
Soak Pits Coverage
Details of existing soak pits in the habitation
Soak pits existing prior to projects =
Soak pits constructed under the WB Project =
218
Population using soak pits = {(Number of soak pits constructed prior to project+ number of soak pits constructed under the WB project)/Population of the habitation)}*100%
Structure
Is the soak pit filled with ballast/ boulders or brick bats? Is the soak pit filled with filter sand on top? Is there a pot with a holes attached to out let pipe to collect grit and debris? Is the soil permeable?
Selection
Whether the selection of the soak pit as choice made based on the local soil conditions?
Operation and Maintenance
Is the soak pit cleaned every fortnight/ month? Is the filter media being cleaned on a regular basis? Is there dirty water around the soak pit? Is the soak pit overflowing? Is there any mosquito breeding around the soak pit?
Sanitation Coverage
Details of existing Solid Waste Management systems in the habitation with types and
categories
Category Vermicomposting Total
Existing prior to projects E
Constructed under the Project P
Grand total
Operation and Maintenance
What is the temperature in the vermicompost pit (range 20 to 30°c)? Is there too much of water in the vermicompost plant? Is the compost being turned? Are there any solid inorganic objects or metals in the compost? Are there any ants, cockroaches, etc. around the plant?

219
AAnnnneexxuurree 2222 SSaammppllee FFiieelldd VViissiitt RReeppoorrttss ffoorr
IInntteerrnnaall SSuuppeerrvviissiioonn //EExxtteerrnnaall AAuuddiitt
Name and designation of team members
Dates of the visit:
1.
2.
3.
Name of district:
Name of Block:
Name of Gram Panchayat:
Name of habitation:
Type and category of scheme:
Brief description of the scheme components:
Has the EDS been filled in and attached to the DSR?
Has the screening been done correctly?
Has the Checklist for Environmental Assessment of Category II Schemes been filled
in properly (if applicable)?
What are the mitigation measures prescribed in the EDS and/or specified in the
Environmental Management Plan?
What is the implementation status of these mitigation measures?
Mitigation measure implemented:
Mitigation measures not implemented:
What environmental concerns were noted during the field visit:
Recommendations for managing the environmental concerns noted:
Did the beneficiaries of the scheme receive any relevant IEC? Give details of
participation in any training or awareness programme, any communication material
received, etc.
Any other findings:
Signature of GPWSC
Member
Signature of AEE/AEE Signature of the Leader of
Supervision/Audit Team
220
AAnnnneexxuurree 2233 EEnnvviirroonnmmeennttaall PPeerrffoorrmmaannccee
IInnddiiccaattoorrss
Water Quantity:
No. of habitations with availability of at least 40 Lpcd of drinking water during the
year as a percentage of total project habitations completed,
No. of habitations which have now been provided an alternative sustainable source
as a percentage of total project habitations previously depending on critical and
overexploited basins
No. of wells providing sustainable yield (throughout the year) as a percentage of
total wells constructed in the project
No. of functional rainwater harvesting structures as a percentage of total rainwater
harvesting structures supported by the project
Water Quality:
No. of habitations which were dependent on NSS (excess fluoride, brackishness, etc.)
that have now been provided a safe water source as a percentage of project-covered
NSS habitations
No. of habitations with bacterial/chemical contamination in drinking water supplies
as a percentage of total project habitations
No. of habitations with no residual chlorine levels at the public taps as percentage of
project habitations
No. of project habitations with disinfection facility as percentage of total project
habitations
Environmental Sanitation:
Number (and %) of households and institutions with access to safe sanitation
facilities Number (and %) of households and institutions with regular use of
sanitation facilities
Number of habitations with solid waste management including composting as
percentage of all project habitations
Number of habitations with liquid waste management including drainage and safe
disposal of sullage as percentage of all project habitations
Percentage of length of street/roads in project habitations provided with storm
Water/sullage drains
Institutional Arrangements and Capacity Building:
No. of districts with DRPs to anchor responsibility of EMF implementation as
percentage of all project districts
No. of project staff at state, district and block levels trained in EMF as a percentage of
all project staff at each level
No. of community institutions (VWSCs and SLCs) that participated in IEC
programmes conducted on EMF as a percentage of all community institutions
involved in the project
Number of external audits conducted as against the target number of audits for the
project

221
AAnnnneexxuurree 2244 GGrroouunndd wwaatteerr qquuaalliittyy sscceennaarriioo
ffrroomm tthhee ssuurrvveeyyeedd ddiissttrriiccttss 3344
Summary of monthly water quality test reports for Begusarai district
Month &
year
No. of
Samples
Iron
(mg/l)
>1.0
Fluoride
(mg/l)
> 1.5
Nitrate
(mg/l)
> 45.0
TDS
(mg/l)
> 2000
Arsenic
(mg/l) >0.01
to <0.05
Arsenic
(mg/l)
> 0.05
MPN/100
ml
Apr-12 208 123 -- -- -- -- -- --
May-12 195 169 -- -- -- 115 -- --
Jun-12 208 168 -- -- -- 36 1 --
Jul-12 104 79 -- -- -- 15 -- --
Aug-12 203 138 -- -- 54 -- -- --
Sep-12 204 62 -- -- -- -- -- --
Oct-12 204 134 -- 1 -- 81 1 --
Nov-12 -- -- -- -- -- -- -- --
Dec-12 -- -- -- -- -- -- -- --
Jan-13 -- -- -- -- -- -- -- --
34 Data source: PHED, Patna

222
Summary of Monthly water quality Test Reports for Nawada district
Month
& year
No. of
Samples
Iron
(mg/l)
>1.0
Fluoride
(mg/l) >
1.5
Nitrate
(mg/l) >
45.0
TDS
(mg/l) >
2000
Arsenic
(mg/l) >0.01
to <0.05
Arsenic
(mg/l) >
0.05
MPN/100
ml
Apr-12 206 -- 89 7 -- -- -- 39
May-12 201 -- 31 5 -- -- -- 34
Jun-12 223 -- 98 5 -- -- -- 49
Jul-12 205 -- 75 -- -- -- -- --
Aug-12 201 -- 79 -- -- -- -- --
Sep-12 205 -- 62 -- -- -- -- --
Oct-12 204 -- 6 1 1 -- -- --
Nov-12 200 2 35 2 3 -- -- --
Dec-12 150 -- 36 -- 1 -- -- --
Jan-13 200 -- 94 -- -- -- -- --

223
Summary of Monthly water quality Test Reports for Purnia district
Month
& year
No. of
Sample
s
Iron
(mg/l)
>1.0
Fluoride
(mg/l) >
1.5
Nitrate
(mg/l) >
45.0
TDS
(mg/l) >
2000
Arsenic
(mg/l) >0.01
to <0.05
Arsenic
(mg/l) >
0.05
MPN/100
ml
Apr-12 200 194 -- 4 -- -- -- --
May-12 235 230 1 1 -- -- -- --
Jun-12 250 -- -- -- -- -- -- --
Jul-12 -- -- -- -- -- -- -- --
Aug-12 -- -- -- -- -- -- -- --
Sep-12 216 -- -- -- -- -- -- --
Oct-12 247 2 -- -- -- -- -- --
Nov-12 211 12 -- 1 -- -- -- --
Dec-12 200 176 -- 81 1 -- -- --
Jan-13 200 181 -- 10 1 -- -- --

224
Summary of Monthly water quality Test Reports for West Champaran district
Month
& year
No. of
Samples
Iron
(mg/l)
>1.0
Fluoride
(mg/l) >
1.5
Nitrate
(mg/l) >
45.0
TDS
(mg/l) >
2000
Arsenic
(mg/l) >0.01
to <0.05
Arsenic
(mg/l) >
0.05
MPN/100
ml
Apr-12 53 3 -- -- -- -- -- 6
May-
12 55 -- 3 -- -- -- -- --
Jun-12 55 -- -- -- -- -- -- --
Jul-12 201 17 -- -- -- -- -- --
Aug-
12 107 5 -- -- -- -- -- --
Sep-12 112 1 -- -- -- -- -- --
Oct-12 114 -- -- -- -- -- -- --
Nov-
12 88 3 -- -- -- -- -- --
Dec-12 60 2 -- -- -- -- -- --
Jan-13 59 3 -- 1 -- -- -- --
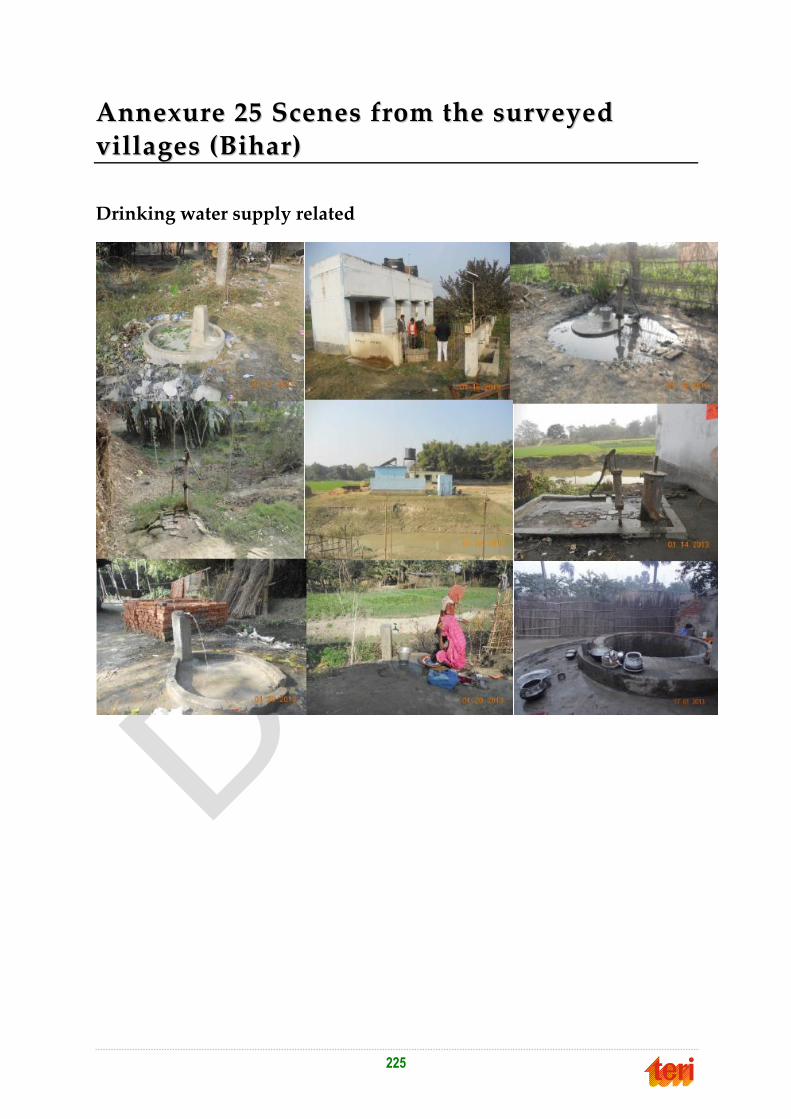
225
AAnnnneexxuurree 2255 SScceenneess ffrroomm tthhee ssuurrvveeyyeedd
vviillllaaggeess ((BBiihhaarr))
Drinking water supply related

226
Water Quality related
Effect on Fluoride on human body

227
Sanitation related

228
Solid waste disposal and use (as fuel)

229
Liquid waste disposal

230
Focused Group Discussions

231
Household Surveys