23801 - World Bank Documents
266
23801 Revised ENERGY EFFICIENCY IN CHINA: TECHNICAL AND SECTORAL ANALYSIS Report of a Joint Chinese-International Study Team Editors Barry G. Tunnah, Consultant, The World Bank Wang Shumao, Energy Research Institute, China State Planning Commission Liu Feng, Consultant, The World Bank Report prepared for a Chinese GovernmenttUNDP/World Bank study, China: Issues and Options in Greenhouse Gas Emissions Control October 1994 FiLE Y Public Disclosure Authorized Public Disclosure Authorized Public Disclosure Authorized Public Disclosure Authorized Public Disclosure Authorized Public Disclosure Authorized Public Disclosure Authorized Public Disclosure Authorized
-
Upload
khangminh22 -
Category
Documents
-
view
3 -
download
0
Transcript of 23801 - World Bank Documents

23801Revised
ENERGY EFFICIENCY IN CHINA:TECHNICAL AND SECTORAL ANALYSIS
Report of a Joint Chinese-International Study Team
Editors
Barry G. Tunnah, Consultant, The World BankWang Shumao, Energy Research Institute,
China State Planning CommissionLiu Feng, Consultant, The World Bank
Report prepared for a Chinese GovernmenttUNDP/World Bank study,China: Issues and Options
in Greenhouse Gas Emissions Control
October 1994
FiLE Y
Pub
lic D
iscl
osur
e A
utho
rized
Pub
lic D
iscl
osur
e A
utho
rized
Pub
lic D
iscl
osur
e A
utho
rized
Pub
lic D
iscl
osur
e A
utho
rized
Pub
lic D
iscl
osur
e A
utho
rized
Pub
lic D
iscl
osur
e A
utho
rized
Pub
lic D
iscl
osur
e A
utho
rized
Pub
lic D
iscl
osur
e A
utho
rized

Foreword
This report is one of eleven subreports prepared as inputs to the United NationsDevelopment Programme (UNDP) technical assistance study, "China: Issues and Optionsin Greenhouse Gas Emissions Control," supported by the Global Environment Facility andexecuted by the Industry and Energy Division, China and Mongolia Deparment, of theWorld Bank. The views and opinions expressed in this report are those of the authors anddo not necessarily represent the views of the World Bank.
Research for this subreport was managed by the Chinese State PlanningCommission (SPC). International experts visited China during three major missions inApri/May 1992, October/November 1992, and June/July 1993.
The report was edited by Barry G. Tunnah, together with Wang Shumao and LiuFeng. The following intemational and Chinese experts participated in the projectpreparing background sector reports, reviewing major trends, and selecting key energyefficiency projects for case study analysis (see subreport Energy Efficijency in China:Case Studies and Economic Analysis).

International Experts
Barry G. Tunnah, Senior Engineer and Energy Efficiency Specialist, Consultant, The World BankPaul Hayman, Senior Engineer, WS Atkins Inc., United KingdomG. Srinivasan, Senior Consultant, WS Atkins Inc., United KingdomMichael Bradford, ERA Technology, United KingdomKarl-Gustav Lauren, Lauren Consulting, FinlandKari Sarkkinen, Jaakko Poyry-International, FinlandJayant Sathaye, Energy Efficiency Specialist, Lawrence Berkeley Laboratory, U.S.A.Robert M. Wirtshafter, Energy Efficiency Specialist, University of Pennsylvania, U.S.A.Robert P. Taylor, Senior Energy Economist, The World BankTodd M. Johnson, Environmental Economist, The World Bank
Chinese Experts
State Planning Commission
Shen Longhai, Director, Departnent of Spacial Planning and Regional EconomyZhu Liangdong, Advisor and Senior EngineerZhou Changyi, Division Chief, Department of Raw Materials IndustryKong Fanzhu, Division ChiefXu Ningnan, EngineerZhou Fengqi, Director, Energy Researh Institute (ERI)Wang Shumao, Division Chief, ERIDai Yande, Deputy Division Chief. ERILi Youhui, Associate Professor, ERILiu Zhiping, Associate Professor, ERILiu Jingru, Engineer, ERI
Ministry of Metallurgy Industry
Xu Zhiqiang, Division Chief, Engineer, Energy Conservation Division, Production DeparnmentZeng Wu. Engineer, Energy Conservation Division , Production DepartmentJiang Hanhua, Senior Engineer, Anshan Thermal Energy Research Institute
State Administration of Building Materials
Chen Min, Division Chief, Senior Engineer, Energy DivisionZheng Ziyu, Senior Engineer, Energy DivisionHan Hong, Engineer, Energy Division
Ministry of Chemical Industry
Zhang Jintong, Deputy Division Chief, Senior Engineer, Energy Saving DivisionZhang Yuming, Senior Engineer, Chemical Fertilizer DepartmentLiu Fangbing, Engineer, Chemical Industry Departnent
China National Nonferrous Metals Industry Corporation
Song Shanming, Senior Engineer, Enterprise BureauYing Dehong, Senior Engineer, Enterprise BureauLi Jionghe, Senior Engineer, Equipment Company

Aluminum Industry Corporation
Li Yuhon& Deputy Division Chief, Senior Engineer, Production Technical Energy DivisionZhang Weihai, Engineer, Alurmina Plant
Ministry of Electric Power
Chen Yuji, Deputy Chief, Senior Engineer, Safety Supervision and Production DepartmentWang Aijuan, Engineer, Safety Supervision and Production DepartmentLu Shuxia, Senior Engineer, Production Technical Division, Electric Power Bureau of Jiangsu ProvinceYe Anliang, Senior Engineer, Zhenghai Electric Power Plant of Jiangsu Province
Ministry of Coal
Hong Shaohe, Deputy Director, Senior Engineer, Comprehensive Utilization and Diversified ManagementDepartment
Chen Shiming, Associate Chief Engineer, Production DepartmentHu Lingshi, Senior Engineer, Coal Comprehensive Utilization and Energy Savings CompanyLi Ping, Engineer, Comprehensive Utilization and Diversified Management DepartmentJi Maizheng, Associate Professor, Management Institute
Ministry of Machinergy Industry
Zhou Likun, Engineer, Science and Technology DepartmentYang Yuwu, Engineer, Science and Technology DeparmentPeng Youyuan, Deputy Director, Senior Engineer, Shanghai Electric Apparatus Research InstituteZhang Jinlan, Senior Engineer, Shanghai Electric Apparatus Research Institute
Textile Industry
Bi Guodian, Director, Technical Information Research Institute, China General SocietyXing Huilu, Senior Engineer, Economic Trading Division, China General SocietyJin Weiyan, Senior Engineer, Science and Technology Commission, China General SocietyFang Kaijun, Deputy Director, Yangzhou Dyeing and Printing PlantZhao Wenkang, Engineer, Yangzhou Dyeing and Printing PlantXue Kaiquan, Engineeer, Yangzhou Dyeing and Printing Plant
Light Industry
Jiang Manxia, Managcr, Senior Engineer, Technical Division of China Papemnaking IndustrySu Jin, Deputy Division Chief, Senior Engineer, Economic Trading Division of China General SocietyChen Xiangjing, Senior Engineer, China Papermaking Industry Development Corporation.Chen Zhongxin, Associate Chief Engineer, Designing Institute of China General Society
Transportation
Zhang Xiaoli, Engineer, Law & Regulation Department of Railway MinistryChen Baoliang, Division Chief, Engineer, Energy Division of Transportation & Communication MinistryHe Jinshu, Division Chief, Senior Engineer, Energy Division of Transportation & Communic.MinistryXiong Wei, Engineer, Energy Division of Transportation & Communication MinistryHuang Wanqing, Engineer, Energy Division of Transportation & Commsunication MinistryLi Jiaben, Chief Editor, Senior Engineer, People' s Transportation & Communication Publishing House
Ministry of Agriculture
Hao Xianrong, Engineer, Enviromnmental Protection & Energy DepartmentLi Jinming, Engineer, Environmental Protection & Energy Department
Other
Zhang Li, Engineer, Energy Savings Center of Steam Pipeline Network, China National Petrochemicaland General Machinery Engineering Company
Li Enshan, Engineer, City Construction Research Institute of China Construction MinistryLi Xianrui, Senior Engineer, China Science & Construction Research InstituteSun Hongzheng, Professor, Economic Management Institute of Zhejiang Province


CURRENCY EQUIVALENTS
Official exchange rates:Currency = RMB
Currency Unit = Yuan (Y)
1980: $1 = Y 1.51990: $1 = Y 4.71992: $1 = Y 5.5
WEIGHTS AND MEASURES
gCE = 106 TCEkgCE = 103 TCE
MTCW = 106 TCEMW = 103 kW
T'Wh = 10'kWhkcal = 4.19 kilojoules
TCE = 7 x 10⁶ kilocalorieston standard coal = 0.7143 TCE, average
TOE = 1.43 TCE
ABBREVIATIONS AND ACRONYMS
BOF - Basic oxygen fumaceCO2 - Carbon dioxideIRR - Internal rate of returnkGCE - Kilogram coal equivalentkj - KilojoulekW - KilowattkWh - Kilowatt-hourm - meterm2 Cubic metersMTCE - Million tons coal equivalentMW - MegawattNH 3 - AmmoniaNOx - Oxides of nitrogenSO2 - Sulfur dioxideSPC - State Planning Commissiont - metric tonTCE - Ton coal equivalentTOE - Ton oil equivalenttpy - tons per yeartsc - Ton standard coalTSP - Total suspended particulatesTVE - Township and village enterpriseTWh - Terawatt-hour

CONTENTS
Summary and Recommendations .............................. ix
Introduction ....................................... 1
A. Background to the Study ............................. 1B. Methodology .................................... 1C. Data .......................... 3
2 Overview of Energy Efficiency ........................... 4
A. Energy Management and Conservation. B. Energy Efficiency Improvement in Specific Sectors .... ......... 4C. Actions to Promote Energy Efficiency ..................... 8
3 Industrial Sector .. 11
A. Iron and Steel .11Industry Profile and Products .11Energy Use .12Specific Energy Consumption .16Energy Efficiency Trends .17Potential for Improvement .22Projected Industry Outputs and Energy Consumption .24Generic Investment Options .25Projected Impacts on Energy and Emissions .30Emissions ............... 30
B. Nonferrous Metals ................. 32Industry Profile and Products ....... ................. 32Energy Use ................................... 35Energy Efficiency . ............................... 37Energy Efficiency Trends ........ .................. 39Potential for Improvement ........ .................. 42Projected Industry Outputs and Energy Consumption .... ..... 43Generic Investment Options ........ ................. 45Projected Impacts on Energy and Emissions ....... . . . . . . . 46Emissions .................................. . 46

- 11 -
C. Building Materials ............ ..................... 48Industry Profile and Products ......... . . .. . . . . .. . . . . . 48Energy Use ..................... ..... .... .... . 52Specific Energy Consumption ......... . .. . . . . .. . . . . . . 53Energy Efficiency Trends .......... .. . .. . .. . .. . .. . . 55Potential for Improvement .......... .. . .. . .. . .. . .. . . 57Projected Industry Outputs and Energy Consumption ..... . . . . 61Generic Investment Options .......... . . .. . . .. . . .. . . . 61Projected Impacts on Energy and Emissions ...... . . . . . . . . . 64Emissions ......................... ..... ..... . 64
D. Paper ......................................... 66Industry Profile ........... ..................... 66Energy Use . ................................... 67Specific Energy Consumption ......... .. . . . . .. . . . . .. . 71Energy Efficiency Trends ....... ................... 72Potential for Improvement ....... ................... 74.Projected Industry Outputs and Energy Consumption ..... . . . . 75Generic Investment Options ........................ 75Projected Impacts on Energy and Emissions ...... . . . . . . . . . 78Emissions ...................................... 78
E. Textiles ........................................ 79Industry Profile and Products ......... ................ 79Energy Use ..................... .... .... .... . . 82Specific Energy Consumption ......... . .. . . . .. . . . . .. . 84Energy Efficiency Trends .......... .. . . .. . .. . .. . .. . 84Potential for Improvements .......... . . .. . . .. . . .. . . . 87Projected Industry Outputs and Energy Consumption ..... . . . . 88Generic Investment Options .......... . . .. . . . .. . . .. . . 89Impacts on Energy and Emissions ........ . . . . . . . . . . . . . 91-Emissions ........................ ...... ..... . 91
F. Chemicals.92F. heicls........................................ 9Industry Profile and Products ......... . . .. . . . . .. . . . . . 92Energy Use ..................... .... .... .... . . 98Energy Efficiency ..... ............ ............... . 107Energy Efficiency Trends .......... . .. . .. . .. . .. . .. . 107Potential for Improvement .......... . .. . .. . .. . .. . .. . 109Projected Industry Outputs and Energy Consumption ..... . . . . 110Generic Investment Options ......... .. . . .. . . .. . . .. . . 110Projected Impacts on Energy and Emissions ...... . . . . . . . . . 113Emissions . . . . . . . . . . . . . . . . . . . . . . . . . . . . . . . . . . . . 113
G. Petrochemicals . . . .... . . .. . . . .. .. . ...... .... .... .. 114Industry Profile and Products ........... .. .. .. . .. .. . . 114Energy Use . . . . . . . . . . .. ... .. ... . . . . . . . . . .... .. 117Energy Efficiency and Trends .......... .. .. . .. . .. . . . 119Potential for Improvement ............. ... .. .. .. ... . 124Projected Industry Outputs and Energy Consumption ..... . . . . 128Emissions .................................... 129

- 111 -
H. Equipment ...................................... 130Introduction to the Equipment Supply Industry ...... . . . . . . . 130Electric Motors .............. ... .. ... ... .. ... . . 131Fans ................ ... .. ... ... ... ... ... .. . 135Pumps ..................................... . 139Compressors .................... .... .... ..... . 140Industrial Purnaces .............. .. ... .. ... .. ... . 142Steam Systems and Traps .......... .. . .. .. . .. . .. . . . 144Boilers ..................................... . 145Potential for Improvements .......... . .. . .. . .. . . .. . . 148Generic Investment Options .......... . .. . .. . . .. . .. . . 148Projected Impacts on Energy and Emissions ...... . . . . . . . . . 152Emissions ........................... ...... .. . 153
4 Coal Mining Industry ....... .......................... . 154
A. Industry Profile and Products .......... .. .. . .. . .. . .. .. . 154B. Energy Use ..... ................................ . 155C. Energy Efficiency .................. ... .... .... ... . 155D. Energy Efficiency Measures ........... .. . .. .. .. . .. .. . . 157E. Potential for Improvement ............ .. .. .. .. .. .. .. . . 158F. The Environmental Situation ........... .. . .. .. .. . .. .. . . 159
5 Power Sector ..................................... . 161
A. Sector Profile ........................... ...... .. . 161B. Energy Use ................................ .... . 164C. Energy Efficiency ............... .................. . 165D. Energy Efficiency Trends ........... .. .. .. .. .. .. .. .. . 165E. Potential for Improvement ........... .. .. .. .. .. .. .. .. . 166
Generating Plant Mix ............ ... .. .. .. ... .. .. . 166Reduction of Line Losses ... .................... . 168Electricity Generation ............ .. . .. ... .. .. .. . . 169
F. Projected Outputs .................. ... .... .... ... . 172
6 Agriculture .173
A. Sector Profile .173B. Energy Use .173C. Energy Efficiency .175D. Potential for Improvement . 176E. Energy Use and Efficiency Trends .177

- iv -
7 Transportation Sector ................................. 178
A. Rail.................................. 178Subsector Characteristics .................... ... ... . 178Energy Use ................................. 180Energy Efficiency .............................. . 181Energy Efficiency Trends ................... ....... . 181Potential for Improvement ......................... . 183
B. HEghway Transportation ............................. 183Subsector Characteristics ........................... 183Energy Use ................................. 186Energy Efficiency ............................... 186Potential for Improvement ............ .............. 189Energy Use and Efficiency Trends ....... .............. 190
C. Water Transportation ............................... 191Subsector Characteristics . .......................... 191Energy Use ................................. 196Energy Efficiency ................................ 197Energy Efficiency Trends . .......................... 199Potential for Improvement ............ .............. 200Projected Activity and Energy Use ....... ............. 200
8 Energy Use in Buildings ............................... 202
A. Residential Sector ............................... . 202Sector Profile ................................. 202Energy Use ................................. 205Energy Efficiency .............................. . 207Potential for Improvement ................. .. ....... . 211Energy Use and Efficiency Trends ........... . .. . .. . .. . 212
B. Commercial Buildings ............................. . 213Sector Profile ................................. 213Energy Use ................................. 213Energy Efficiency .............................. . 214Potential for Improvement ................. ... .... . . 215Energy Use and Efficiency Trends .......... .. .. . .. . .. . 215
Annex A: Case Study Analyses: Forecasted Applications and Impactson Energy Use and Emissions ....................... 216

TABLES IN TEXT
3.1: Types of Enterprise and Product Output, 1990 ............... 123.2: Basic Statistics of Key Iron and Steel Enterprises ..... . . . . . . . . . 133.3: Capacity and Output for Major Products, 1990 ...... . . . . . . . . . 163.4: Basic Statistics for-the Steel Industry ....... . . . . . . . . . . . . . . 173.5: Production of Rolled Steel Products ....... . . . . . . . . . . . . . . . 193.6: Ferroalloy Production, 1990 ........ . .. . . . . . . . . . .. . . . . . 193.7: Relation of Sector Energy Use to National Energy Demand ..... . . . 203.8: Type of Energy Consumed, 1980-90 ....... . . . . . . . . . . . . . . . 203.9: Energy Consumption Data for the Iron and Steel
Industry, 1990 .213.10: Energy Prices for the Iron and Steel Industry ...... . . . . . . . . . . 213.11: Energy Consumed by Major Manufacturing Processes, 1990 ..... . . 223.12: Major Production Equipment in the Iron and Steel Sector ..... . . . . 233.13: Conversion Efficiency of Power Boilers of Several Enterprises .... . 243.14: Energy Outputs and Consumptions, Iron and Steel
Enterprises (1990) .253.15: Specific Energy Consumptions, 1978-90 ...... . . . . . . . . . . . . . 263.16: Forecasts of Output, Energy Consumption and Pollutant Discharges
for 2000 and 2010 ...... .. ................... . 273.17: Generation of Pollutants by the Iron and Steel Industry ..... . . . . . 313.18: Discharge of Pollutants by the Iron and Steel Industry ..... . . . . . . 323.19: Environmental Protection Facilities for Major Equipment ..... . . . . 333.20: Pollutant Emissions and Extent of Treatment ...... . . . . . . . . . . . 333.21: Energy Consumption of Nonferrous Enterprises, 1980-90 ..... . . . . 363.22: End Uses of Major Energy Sources, 1990 ...... . . . . . . . . . . . . 383.23: Typical Furnaces and Kilns and their Efficiency ...... . . . . . . . . . 393.24: Specific Energy Consumptions for Selected Process ..... . . . . . . . 403.25: Capacity and Efficiency of Major Equipment, 1990 ..... . . . . . . . 413.26: Forecasts of Process Capacities and Specific Energy Consumptions
for Copper, Aluminum, Lead and Zinc Production ..... . . . . . . . 443.27: Pollutant Discharges from Typical Process ...... . . . . . . . . . . . . 473.28: Historical Data on Energy Consumption Data for the Building
Materials Industry .553.29: Production Distribution for the Paper Industry, 1990 ..... . . . . . . . 693.30: Energy Consumption Data for the Pulp and Paper Sector, 1990 .... . 703.31: Energy Consumption in the Textile Industry Data for 1990 ..... . . . 853.32: Energy Conservation Measures ........ . . . . . . . . . . . . . . . . . 863.33: Output Value Indices and Growth Rates for the Chemicals Sector
and the Industrial Sector ......... . . . . .. . . . . . .. . . . .. . 933.34: Output of Selected Chemical Products ....... . . . . . . . . . . . . . . 943.35: Chemical Sector Enterprises and Output Values ..... . . . . . . . . . . 953.36: Chemicals Enterprises and Output Values by Location ..... . . . . . . 973.37: Share of Chemicals Output by Region ...... . . . . . . . . . . . . . . . 983.38: Composition of Fertilizer Products ....... . . . . . . . . . . . . . . . . 99

vi -
TABLES iN TExT (cont'd)
3.39: Feedstock for Ammonia Production, 1990 .................. 1003.40: Energy Consumption in the Chemical Industry ............... 1013.41: Energy Resource Consumption in 1990 .................... 1023.42: Energy Consumption for Production of Selected Chemicals ..... . . . 1063.43: Forecasts of Output and Specific Energy Consumption for the
Chemicals Industry ................ ... ... ... ... .. . 1113.44: Utilization of Waste Materials ....... .................... 1143.45: Chemical Industry Residues . ........................... 1153.46: Waste Gas Production and Utilization ..................... 1163.47: Economic and Other Indicators for SINOPEC, 1985-90 ...... . . . . 1183.48: Output of Main Products of SINOPEC, 1985-90 ...... . . . . . . . . 1203.49: Breakdown of Refinery Fuel and Power by Source ...... . . . . . . . 1213.50: Allocation of Refinery Energy Consumption ..... ............ 1213.51: Energy Consumption per Y 10,000 Output Value ...... . . . . . . . . 1223.52: Energy Consumption for Oil Refining ..................... 1223.53: Energy Consumption of Refinery Process Units ....... . . . . . . . . 1233.54: Energy Consumption for Chemical Products and Fibers ...... . . . . 1233.55: Energy Consumption for Nitrogen Fertilizer Production .... ...... 1243.56: Lowest Reported Energy Consumption Values ..... ........... 1253.57: Summary of Current and Best Energy Consumptions ...... . . . . . . 1263.58: Forecasts for Product Outputs ................ .. .. . .. .. . . . 1273.59: Crude Oil Processed in Major Refineries ..... .............. 1283.60: Major Electricity Consuming Electromechanical Products ..... . . . . 1323.61: Size Distribution of Annual Motor Output ..... ............. 1333.62: Comparison of Motor Efficiencies ......... .. . . . . .. . . . .. . 1333.63: Comparison of Methods for Speed Adjustment .............................. 1343.64: Major Fan Manufacturers, 1990 .......... . .. . . .. . . .. . . . 1363.65: Fan Production Data ................ ... ... .. ....... . 1393.66: Industrial Furnaces-Number and Energy Consumption in Major
Industries ............. .. .. .. .. .. .. .. ... .. .. .. . 1423.67: Energy Consumed by Various Types of Furnace and Kiln ..... . . . . 1433.68: Statistics of Compressor Manufacturer, 1987-91 ...... . . . . . . . . . 1463.69: Statistics on the Existing Industrial Boiler Stock ...... . . . . . . . . . 1473.70: Typical Boiler Operating Data in Major Cities ...... . . . . . . . . . . 149
4.1: Energy Consumption of Major Coal Mines, 1980-92 ..... . . . . . . . 1554.2: Specific Energy Consumptions of Major State-Owned Coal
Mines, 1980-92 .1564.3: Estimated Discharges of SO2 AND CO2 from Major Coal
Mines, 1980-92 .......... .. . . .. . .. . .. . .. . . .. . .. . 160
5.1: Power Sector Indicators since 1985 ....... . . . . . . . . . . . . . . . 1665.2: Energy Conservation Measures ....... . . . . . . . . . . . . . . . . . . 167

- vii -
TABLES IN TEXT (cont'd)
6.1: Stock of Agricultural Machinery, 1980-90 .................. 1746.2: Agricultural Energy Use, 1980-90 ....................... 175
7.1: Highway Freight and Passenger Traffic, 1980-90 .. .............. 1847.2: Motor Vehicle Stock in Thousands, 1980-90 ................. 1857.3: Road Traffic Mix on Highways ......................... 1867.4: Gasoline and Transport-Sector Diesel Use, 1980-90 .... ........ 1877.5: Fuel Economy of Transportation Companies, 1980-91 .... ....... 1887.6: Comparison of Truck Fuel Economy, Selected Countries .... ..... 1897.7: Comparison of Bus Fuel Economy, Chin and Japan .... ........ 1897.8: Historical Data on Numbers of Motor Ships ................. 1917.9: Passenger Traffic Data, 1980-91 ........................ 1927.10: Inland Water Lengths ............................... 1957.11: Inland Waterway Navigation Limits, 1991 .................. 1967.12: Main River Systems and Numbers of Ports .................. 1967.13: Average Distance for Freight Transport .................... 1977.14: Fuel Consumption of Water Transport .................... 1987.15: Fuel Consumption Comparisons for Ships .................. 198
8.1: Stock of Major Appliances, 1978-90 ...................... 2038.2: Estimate of Residential and Commercial Building Stock, 1989 ... ... 2048.3: Residential Energy Use by Energy Source, 1980 and 1990 ... ..... 2068.4: Urban Residential Energy Mix, 1980-90 ................... 2078.5: Rural Residential Energy Mix, 1979 and 1987 ................ 2088.6: Estimates of Residential Electricity End Uses,
1981 versus 1989 .2088.7: Heat-Transfer Coefficients of Typical Multi-story Chinese
Apartment Buildings versus Those of North American Houses .2118.8: Energy Use by Energy Source in the Commercial Sector,
1980-90 ... 214
FIGURE iN TEXT
3.1: Primary Energy Consumption in the Iron and SteelIndustry, 1990 .................................. 18

- IlA -.. .
-x -
SUMMARY AND RECOMMENDATIONS
Background
i. China, as a major coal user, is a major source of greenhouse gas emissions.Although per capita energy consumption is relatively low-about one quarter of the worldaverage and one tenth of typical developed country consumptions-the annual contributionof CO2 is already 9 percent of the world total. It is estimated that 80 percent comes fromthe use of fossil fuels as energy sources. The rapid growth of the Chinese economy meansthat the emissions will also continue to increase rapidly unless vigorous efforts are madeto improve energy efficiency.
ii. The basic objective of the study is the development of strategies for reducinggreenhouse gas emissions, based on a comprehensive investigation of the current situationand projections for energy use and emissions over the next 15-20 years. The studyincludes a number of related elements through which the sources and sinks for greenhousegases are characterized and options for modifying emissions are explored. Thisreport-part of Output 1.2 of the study which addresses the potential for improvements inenergy efficiency-summarizes the situation in major energy consuming sectors: industry,transport, agriculture, buildings, coal mining and electricity generation.
iii. The study was started in early 1992 with formulation of the terms ofreference. A team was set up to collect data, to write sector Background Reports, and toparticipate in case study evaluations. The latter consisted of analyses of selectedtechnologies with the potential to save energy and reduce greenhouse gas emissions, andwith broad applicability in the various sectors. The Chinese counterparts were coordinatedthrough the State Planning Commission (SPC) and team participants were drawn from awide range of ministries and agencies. The Energy Research Institute of SPC also tookpart in most aspects of the work.
iv. The measures reported here for improving energy efficiencies addressprincipally the short to medium term potential for energy savings. They mainly use wellknown technologies, proven in applications in China and other countries and likely to beapplied in the 1990s and early years of the next century. In general, structural changesto industries and significant shifts to the type of product made in a sector are not includedin this report, although it is recognized that such changes could eventually be much moresignificant than conventional "energy conservation measures." These important items aretherefore addressed in a separate part of the study.

Data
v. The data collected in the study were obtained from a variety of sources.Intemal data from various ministries and research institutes were used extensively, togetherwith published national statistics. Although the sector Background Reports were writtenin somewhat different formats, this final report attempts to present information in aconsistent format.
vi. For the most part, the data are reported for 1990 but some sectors havepresented data for 1991. To the extent possible, inconsistencies in the data have beeneliminated: some discrepancies always occur when so many different sources are involved,and central government statistics may differ from the corresponding figures of individualministries. Also, forecasts of sector outputs and energy use have been given by most ofthe ministries but there has been no attempt here to ensure total consistency between theforecasts. This consistency has been achieved in other parts of the study by usinginput/output modelling techniques.
Energy Management and Conservation
vii. This report-and the Background Reports for sectors and subsectors fromwhich it is derived-focuses principally on the short to medium term potential for energysavings. Measures already adopted, and most of those proposed, use proven equipmentand processes. The typical measures are appropriate for the present time and are likelyto continue to be applied for say 15-20 years in existing plants, and as part of the designof new facilities.
viii. Other changes that could have a profound effect on energy efficiency includethe location of new processing plants, of an economic scale by international standards, neareither raw material sources or markets. These plants would gradually replace existingsubeconomic-scale facilities dispersed all over the country that are often far from both rawmaterials and energy sources, and distant from their markets. This topic is outside thescope of this report.
ix. All sectors report that energy efficiency has been improved over the last tenyears or so in China. In addition, however, all report that more needs to be done and canbe done, mostly using similar methods, equipment and processes as before. Most sectorsrecognize the role of good energy management but there is also a strong desire to seetechnical solutions to the problem of high energy consumptions. While it is undoubtedlytrue that new equipment and new processes are essential for continued medium to longterm progress in reducing energy use and emissions of greenhouse gases, the contributionof good management and of more effective operation of existing facilities should not beunderrated. Indeed, it is unlikely that the optimum benefits will be obtained from modernequipment and new technologies in the absence of strong energy management.

-xi -
Case Studies
x. For each sector, technologies with good energy conservation potential andwith the potential to reduce emissions of greenhouse gases and local pollutants wereidentified. These were reviewed and 24 were selected for detailed analysis. All thetechnologies had been applied at least once in China or were about to be implemented, andall had good prospects of replication in their respective sectors. Actual plant data werethen collected on field visits around China.
xi. Returns on investment and payback periods were estimated for eachtechnology application. Forecasts of "business as usual" (BAU) and "accelerated"(ACCEL) scenarios for adoption of each of the technologies or modifications were made.Both BAU and ACCEL scenarios were developed from information supplied in theBackground Reports and by analogy with trends in the respective industries in othercountries. Technical judgement was used to develop the respective scenarios, which werethen used to calculate the forecasts of changes in energy consumption and emissions for2000 and 2010.
xii. Most of the measures were found beneficial to the industry or plantconcerned. Put simply, we can conclude that energy efficiency is usually very goodbusiness, and the reduced emissions of global warming gases that are achieved at the sametime are an extra bonus.
xiii. The technologies analyzed as case studies are as follows:
Iron and Steel Industry
* Ml Open hearth converters replaced by BOF systems* M2 Continuous casting* M3 Reheat fumace renovation
M4 BF gas recovery for steam/electricity generation
Nonferrous Metals
* M5 Aluminum plant renovation
Building Materials
* B1 Replace old dry kilns by preheater/precalciner systems* B2 Wet to dry conversion* B3 Vertical shaft kiln renovation
Paper
* Li Black liquor recovery* L2 Cogeneration in a paper mill

- xii -
Textiles
* Ti Cogeneration in a textile mill* T2 Caustic soda recovery* T3 Computerized energy management systems
Chemicals
* CH1 Medium size ammonia plant renovation* CH2 Small ammonia plant renovation and waste heat recovery* CH3 New membrane process at NaOH plant
Equipment
* El High efficiency motors* E2 Variable speed motors* E3 Electric motor repair centers* E4 Steam traps
Coal
* Cl Coal washing and screening* C2 Coal briquetting
Electricity
* P1 Reduction of line losses in low voltage distribution systems* P2 Technologies for improving power plant performance
xiv. For many of the technologies, the returns on investment and payback periodswere found to be attractive. Particularly attractive were variable speed motor drives andimproved steam traps, with good paybacks and the potential for widespread application inmany industrial plants.
Barriers to Energy Efficiency Improvement
xv. The attractiveness of most of the case studies, and the fact that energyconservation has been seen in every sector to some extent at least, suggests that furthergains in energy efficiency could be achieved by many firms for relatively low investments-or, where capital is needed, with excellent paybacks. However, the level of interest inenergy conservation remains moderate, with many firms simply not taking advantage ofthe profitable opportunities available to them. This is by no means confined to Chinesefirms: the same reluctance to invest in energy conservation is seen in many othercountries.

- xiii -
xvi. Why therefore is energy conservation not exploited fully as a means to lowercosts and higher profitability? Why is it necessary to promote energy efficiency andpersuade firms to take action, when in fact energy conservation is in their own interests?There are various reasons, some or all of which will apply in any particular firm, such as:
(a) A concern to maximize production, with little or no interest in the cost orefficiency of production.
(b) No appreciation of the potential benefits of simple, low cost, energy saving- measures.
(c) A belief that energy efficiency is a new and untried approach: conservativemanagement often prefers to stay with old methods of working.
(c) A belief that energy conservation requires major funding and newinvestments and therefore is not applicable.
(d) A proper economic analysis has not been done (perhaps the firm lacks theskills to carry out economic analyses).
(e) There is a lack of technical skills in the firm to identify and evaluate energysaving opportunities.
(f) The firm lacks technical skills to design and install energy saving measures,and assistance is not available locally.
(g) There is a lack of appreciation of modem technologies available for theirindustry Oack of information).
xvii. Promoting energy efficiency therefore needs to address technical, economicand institutional barriers. This can be done through educating managers and decisionmakers in the benefits of conservation, training plant personnel in the appropriate analyticaland engineering skills, and making cost effectiveness a cornerstone of decision-making inoperating enterprises. At the policy level, government can provide the right environmentfor cost effective conservation by offering financial incentives to reward good energymanagement. Both policy measures and specific actions which could encourage energyefficiency are discussed further below.
Energy Efficiency Improvement in Specific Sectors
xviii. For each sector and subsector, there are areas where more effort needs tobe placed to achieve continuing improvements in energy utilization and reduction oramelioration of pollutant emissions. Major sector or industry-specific items which wouldcontribute to energy savings and lower emissions include the following:
- xiv -
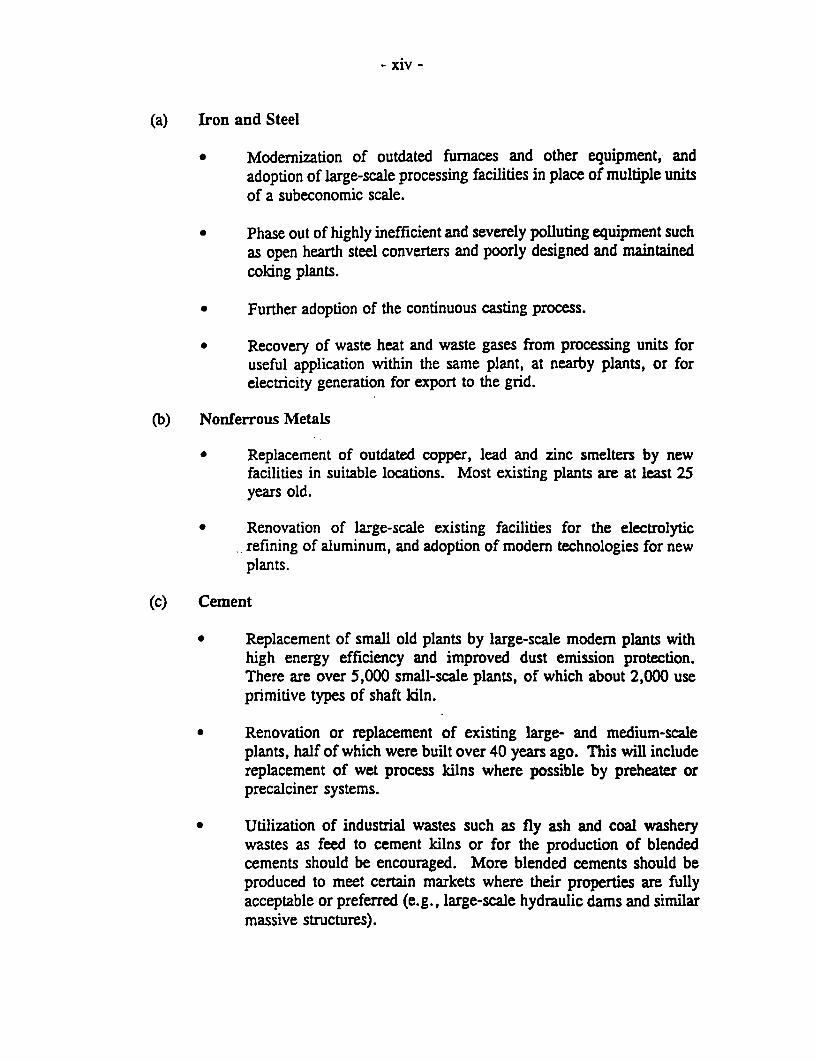
(a) Iron and Steel
* Modernization of outdated fumaces and other equipment, andadoption of large-scale processing facilities in place of multiple unitsof a subeconomic scale.
* Phase out of highly inefficient and severely polluting equipment suchas open hearth steel converters and poorly designed and maintainedcoking plants.
* Further adoption of the continuous casting process.
* Recovery of waste heat and waste gases from processing units foruseful application within the same plant, at nearby plants, or forelectricity generation for export to the grid.
(b) Nonferrous Metals
* Replacement of outdated copper, lead and zinc smelters by newfacilities in suitable locations. Most existing plants are at least 25years old.
* Renovation of large-scale existing facilities for the electrolyticrefining of aluminum, and adoption of modem technologies for newplants.
(c) Cement
Replacement of small old plants by large-scale modem plants withhigh energy efficiency and improved dust emission protection.There are over 5,000 small-scale plants, of which about 2,000 useprimitive types of shaft ldln.
Renovation or replacement of existing large- and medium-scaleplants, half of which were built over 40 years ago. This will includereplacement of wet process kilns where possible by preheater orprecalciner systems.
* Utilization of industrial wastes such as fly ash and coal washerywastes as feed to cement kilns or for the production of blendedcements should be encouraged. More blended cements should beproduced to meet certain markets where their properties are fullyacceptable or preferred (e.g., large-scale hydraulic dams and similarmassive structures).

- xv -
* Electricity generation by heat recovery in old kilns should beevaluated because the economic viability of this technique is suspect.All such plants have been shut down in western countries.
(d) Flat Glass, Ceramic Tiles, Lime
* As for much of the buildings material sector, old and outdatedplants, many of them very small by world standards, needreplacement by larger modern plants.
(e) Clay Bricks
* This sector is dominated by TVE plants, many of which are verysmall and use simple technologies. Plant size is increasing for newTVE plants, however, and there are process developments whichresult in good energy efficiency. TVE plants should therefore beencouraged to adopt the process developments that are alreadyavailable when planning new facilities.
* The proportion of hollow or perforated bricks remains very low inChina at about 0.3 percent of the total output. In many developedcountries, the extent of perforated brick production is high. Thistype of brick requires less energy to make, consumes less rawmaterial for a given construction volume, and has superior insulatingproperties in service.
(f) Paper
Adoption of black liquor recovery in more paper plants for energyand caustic soda recovery, and increased utilization of wastematerials such as bark, chips and sawdLrst.
* Increased use of cogeneration in the paper industry.
* Replacement of old small plants by larger modem facilities, in whichblack liquor recovery and cogeneration investments are more likelyto be economic.
(g) Textiles
* Replacement of old small plants, as for most other sectors, andgreater application of modern technologies and electronic controls.

- xvi -
(h) Chemicals, Petrochemicals
Renovation or replacement of small and medium-scale ammoniaplants, of which there are over 1,000 making ammoniumbicarbonate. These were mostly built over 20 years ago and areinefficient by typical developed country standards and are too smallto reach economic viability by normal evaluation criteria.
* Enterprise scale needs to be reviewed, as there are many small-scaleplants which are uneconomic by normal standards and are unlikelyto ever reach true commercial viability.
(i) Equipment
* Many items of equipment are not up to the standards of similar itemson the international marketplace. Technology transfer throughlicensing agreements should be considered for key items such ascertain types of electric motor, industrial scale boilers, steam traps,fans and pumps, controls and instrumentation.
(I) Coal Mining
* Old equipment and inefficient items such as ventilator fans and waterpumps (and associated motors) need to be replaced by modemenergy efficient designs.
* Coal washing and screening facilities are important in providinghigher quality coals-and coals of a constant quality-to customers.This would allow higher levels of coal combustion efficiency to beachieved by most users, and sulphur emission levels would also bereduced by selective removal of sulphur compounds in the washingstage.
(k) Power Sector
* Old generating plants based on low or medium pressure boilersshould continue to be replaced by modem, large, high pressureunits.
* Electricity distribution systems need upgrading to take higher loads.Power factor compensation in distribution systems should beimproved and many parts of the cable systems require renewal.
* All aspects of electricity distribution losses should be investigatedand action taken to reduce losses in order of priorities. As suggested

- xvii -
in item (2), certain equipment may need replacement, includingtransformers.Existing large power plants based on fossil fuels should be broughtup to higher efficiency by using available technologies such asmodem bumers and improved heat recovery from combustion gasesin water or air preheat systems, and by improving maintenancestandards.
Policy Actions to Promote Energy Efficiency
xix. The actions needed to stimulate interest in energy efficiency and to achievepositive results are varied in nature. It is necessary firstly to create an environment inwhich energy efficiency is seen as a priority because it will bring benefits to the enterpriseand the individual. These benefits may be seen in a variety of forms and combinations,such as through higher profitability and higher salaries or bonuses, through better workingand safer conditions in the enterprise itself, and as a cleaner and more pleasantenvironment for living in the area surrounding the enterprise due to reduced localpollution. Secondly, the skills and tools needed to achieve practical energy saving mustbe provided at the enterprise level.
xX. Actions at a policy level could include a combination of measures such asthe following:
(a) Focusing-in laws, regulations, and tax measures-on energy efficiency asa major contributor to the profitability of enterprises, to an improvement ofthe local environmental conditions, and to a reduction in global warming.This focus should be directed to improving the performance of existingplants and to ensuring that new plant design standards take account ofenergy efficiency.
(b) Maintaining pricing policies for fuels and electricity which reflect long runmarginal costs and which reduce, or eliminate, subsidies for energy.
(c) Supporting training to improve energy awareness at a general level and toraise skills in economic analysis and energy related technologies forenterprise and government agencies at all levels, from national to local.
(d) Providing funding support to enterprises investing in energy efficient andlow polluting processes, through financial incentives or in the form of loansand grants targeted to energy efficiency.
(e) Providing general industrial promotion policies which encouragemodernization of energy intensive industries. Adoption of best modempractice in new plants, coupled with proper analysis to ensure appropriateplant scale and location, will make a significant contribution to energysaving and emission reduction.

- xviii -
(f) Encouraging wider application of indigenous technologies whereappropriate. These may be more suitable for application in China thanlarge-scale technologies used internationally because they are cheaper, uselocal materials and take account of local skins in maldng the equipmentconcerned and operating it. It is necessary to compare options carefully ona case by case basis, but some examples of effective Chinese technologiesare:
* 3Brick-making kilns of the standard annular or hoffman type modifiedwith heat recovery systems and utilizing waste gangue from coalwashing plants.
* Modified and improved low polluting coke ovens capable ofoperating on a small scale (well below the economic efficient size ofmechanized coke ovens).
(g) Enforcing more effectively the existing regulations for emission control. Inaddition, building of new plants should not be allowed in areas where airquality standards are not met unless existing plants reduce their dischargesto accommodate the new discharge.
(h) Enforcing regulations for the phase out of inefficient products such asoutdated electric motor designs. There is also a need to stop old andinefficient equipment long past its normal useful life being passed on tosmall collective-owned enterprises from plants undergoing modernization.
Specif'ic Activities for the Short and Medium Term
xxi. To address some of the barriers to energy conservation quoted previously,there are a number of activities that could be undertaken at a practical level. There is, forexample, a need to promote low cost simple measures to save energy and reduceemissions. The claim that there is no money for energy conservation is frequently madeby enterprises, often as an excuse for inactivity. Indeed, the gains from simple low costactions can often pay for the next stage of a conservation plan, the investment in newequipment and processes.
xxii. There is a need to promote the "efficiency ethic' in all energy consumingactivities through proper management of energy and other resources. Thus, for example,wasteful consumption of raw materials should be reduced, especially materials such as steeland cement which have large amounts of energy embodied. This requires education toraise energy awareness, training in management practices and specific technologies, andtraining in the techniques of economic analysis for day-to-day decision making, both forenterprise personnel (operating and administrative) and for nonenterprise personnel suchas staff of local government planning and economic bureaux and local development banks.
xxiii. It is appropriate to adopt a local level approach to energy conservation wherepossible. There is often more enthusiasm for local projects as the national level approach

- xix -
can seem distant and unrelated to local needs. Usually a more direct involvement can bestimulated locally because the results of energy saving-and particularly emissionreduction-are experienced immediately at the local level. Municipalities are usually moremotivated to achieve results than national agencies because they are faced with real localproblems every day.
xxiv. Specific activities to raise awareness and skill levels can take a wide varietyof forms. For example:
(a) Setting up demonstrations of energy efficient equipment and processes, fromlow cost/no cost items such as energy management systems, improvedmaintenance procedures, and instrumentation, to higher capital investmentitems such as new boilers, high efficiency electric motors, and heatrecovery systems. Practical demonstrations in a Chinese context areimportant to convince enterprise managers of the technical and economicviability of "new" technologies, even though these may already havereceived broad acceptance internationally. Demonstrations should includepublicity activities such as seminars and plant visits.
(b) Promoting a customer service approach by equipment suppliers throughtraining in modern marketing methods, coupled with customer training toraise awareness of available alternatives and the need for economic analysesin equipment selection.
(c) Setting up specific demonstration and technical assistance programs toencourage the adoption of improved "generic" technologies. This may bedone firstly by creating a better awareness in users of the capabilities ofselected technologies through demonstrations and secondly by upgradingChinese industries to supply the energy efficient products. For example,such programs could be set up for steam traps, variable speed electric motordevices, industrial boilers and associated controls, steam system insulation,and cogeneration applications. A program for steam traps could includeassisting the manufacturers of traps with better designs, better manufacturingtechniques and quality control, and the use of better materials ofconstruction.
(d) Setting up local technical assistance centers-or raising the skill levels andequipment available in existing centers-to provide stronger support to localenterprises for economic and technical evaluations of both current operationsand planned investments. Through local centers, developing the concept ofmonitoring and targeting at a practical level by applying the technique inlocal enterprises as a demonstration project.
(e) Training in local service centers should be considered in three basiccategories:

- xx -
* 'Service orientation" for local service centers, planning and economiccommissions, TVE bureaux and similar agencies.
* Technical, mainly for enterprise personnel, to include the role of economicsin daily decision making, energy management principles, and the technicalaspects of relevant processes.
* Investment appraisal and postinvestment monitoring for enterprise managersand financial officers, and for local development bank officials responsiblefor loans to firms.
(f) Undertaking specific programs to address problems identified in key sectors,for example:
* A line loss reduction program for low voltage local electricitydistribution systems.
* A program to study systematically the availability and utilization ofindustrial wastes (e.g., cement and brick plant feedstock; syntheticconstruction materials).
* A program to study manufacturing techniques and applications forperforated bricks.
(g) Initiating vigorous efforts to upgrade coal quality by washing, screening andbriquetting, as this will have a beneficial effect on a wide range of users andallow them to improve the standard of their operations.

1. INTRODUCIION
A. BACKGROUND TO THE STUDY
1.1 China, as a major coal user, is a major contributor of greenhouse gasemissions. Although the energy consumption of China is relatively low-per capitaconsumption is about one quarter of the world average and one tenth of typical developedcountry consumptions-the contribution of CO2 is already about 9 percent of the annualworld total. Of the CO2 emissions, it is estimated that around 80 percent comes from theuse of fossil fuel as energy sources. The rapid growth of the Chinese economy means thatthe emissions will continue to increase rapidly unless vigorous efforts are made to improveenergy efficiency.
1.2 The basic objective of the study is the development of strategies for reducinggreenhouse gas emissions, based on a comprehensive investigation of the current situationand projections for energy use and emissions over the next 15-20 years. The studyincludes a number of related elements through which the sources and sinks for greenhousegases are characterized and options for modifying emissions are explored. Thisreport-part of Output 1.2 of the study which addresses the potential for improvements inenergy efficiency-summarizes the situation in major energy consuming sectors: industry,transport, agriculture, buildings, coal mining and electricity generation.
1.3 The study was started in early 1992 with formulation of the terms ofreference. A team was set up to collect data, to write sector Background Reports, and toparticipate in case study evaluations. These case studies are analyses of selectedtechnologies with the potential to save energy and reduce greenhouse gas emissions, andwith broad applicability in the various sectors. The Chinese counterparts were coordinatedthrough the State Planning Commission (SPC) and team participants were drawn from awide range of ministries and agencies. The Energy Research Institute of SPC also tookpart in most aspects of the work.
1.4 The measures reported here for improving energy efficiencies addressprincipally the short- to medium-term potential for energy savings. In general, the impactsof structural changes to sectors and significant shifts to the type of product made in asector are not included in this report, although it is recognized that such changes couldeventually be much more significant than short-term, conventional, "energy conservationmeasures." These important items are therefore addressed in a separate part of the study.
B. METODOLOGY
1.5 In summary, the work on Output 1.2 was conducted as follows:

- 2 -
(a) The scope of data requirements and the contents of 'Background Reports"were defined. Assignments for team members were made.
(b) The required data were assembled and incorporated in sector BackgroundReports. The sectors covered were:
(i) Industry, divided into iron and steel; nonferrous metals (copper,aluminum, lead, zinc); chemicals; petrochemicals; paper; textiles;industrial equipment (fans, motors, boilers, steam traps, etc.)
(ii) Agriculture
(iii) Transportation (rail, road, water)
(iv) Buildings (residential and commercial)
(v) Coal mining
(vi) Electricity generation
(c) Preliminary recommendations were made for case studies of energy-savingtechnologies with potentially wide application in relevant sectors. Thesewere examined further and a final list of 24 case studies agreed.
(d) Field visits were undertaken to plants around China in which the case studytechnologies have been adopted or have been studied extensively and forwhich realistic cost data are avaiable. The use of practical data fromtypical plants was seen as an important element to ensure the findings of thestudy were representative of commercial operations in a Chinese context.
(e) A one-week seminar was carried out in Beijing to teach project evaluationmethods to the main team members involved in the case studies. A standardmethodology was thus adopted for all sectors.
(f) The case study analyses were conducted in conjunction with ClemsonUniversity. The results are reported in detail elsewhere.
(g) The information given in the Background Reports and the case studyanalyses was reviewed and put into this shortened report.
(h) Case study data and estimates of potential application of each technologywere used to estimate the possible impact on energy use and emissions in2000 and 2010.
(i) The findings on energy efficiency and the problems faced in each sectorwere taken into consideration in developing recommendations for short-term

-3-
actions to promote energy efficiency and thus contribute to reducingemissions of greenhouse gases.
The main work on Output 1.2 was undertaken from early 1992 to the end of 1993.
C. DATA
1.6 The data collected in the course of the study were obtained from a varietyof sources. Intenal data from various ministries or research institutes were usedextensively, together with published national statistics. Although the Background Reportswere written in different formats, this final report attempts to present information in aconsistent format.
1.7 For the most part, the data are reported for 1990 but some sectors havepresented data for 1991. Sometimes there are inconsistencies in the data, particularly whendifferent sources are involved. Central government statistics may be different from thecorresponding figures collected by individual ministries. In this report, forecasts of sectoroutputs and energy use have been given by most of the ministries but there has been noattempt here to ensure consistency between the forecasts. This consistency has beenachieved in other parts of the study by using input/output modelling techniques.

-4-
2. OVERVIEW OF ENERGY EFFCIENCY
A. ENERGY MANAGEMENT AND CONSERVATION
2.1 This report-and the Background Reports for sectors and subsectors fromwhich it is derived-focusses principally on the short- to medium-term potential for energysavings. Measures already adopted, and most of those proposed, use proven equipmentand processes. The typical measures are appropriate for the present time and are likelyto continue to be applied for say 15-20 years in existing plants, and as part of the designof new facilities. Important items such as structural changes in Chinese industry and itsproducts are not included in this report, although it is recognized that such changes couldbe much more significant for energy consumption patterns and emission reduction in thelonger term than conventional 'energy conservation' as such.
2.2 Other changes that could have a profound effect on energy efficiency includethe location of processing plant, of an economic scale based on international standards,near either raw material sources or markets. These plants would gradually replace existingsubeconomic-scale facilities dispersed all over the country that are far from both rawmaterials and energy sources, and distant from their markets. This is also a topic outsidethe scope of this report.
2.3 All sectors report that energy efficiency has been improved over the last tenyears or so in China. In addition, however, all report that more needs to be done andindeed can be done, mostly using similar methods, equipment and processes as before.Most sectors recognize the role of good energy management but there is also a strongdesire to see technical solutions to the problem of high energy consumptions. While it isundoubtedly true that new equipment and new processes are essential for continuedmedium to long-term progress in reducing energy use and emissions of greenhouse gases,the contribution of good management and of more effective operation of existing facilitiesis often underrated. Also, it is unlikely that the optimum benefits will be obtained frommodern equipment and new technologies in the absence of strong energy management.
B. ENERGY EFCENCY IBeROVEMENT IN SPECIC SECTORS
2.4 Each sector and subsector quotes areas where more effort needs to be placedto achieve continuing improvements in energy utilization and reduction or amelioration ofpollutant emissions. Major sector or industry-specific items which would contribute toenergy savings and lower emissions include the following:

-5-
(a) Iron and Steel
* Modernization of outdated furnaces and other equipment, andadoption of large-scale processing facilities in place of multiple unitsof a subeconomic scale.
* Phase out of highly inefficient and severely polluting equipment suchas open hearth steel converters and poorly designed and maintainedcoking plants.
* Further adoption of the continuous casting process.
* Recovery of waste heat and waste gases from processing units foruseful application within the same plant, at nearby plants, or forelectricity generation for export to the grid.
(b) Nonferrous Metals
* Replacement of outdated copper, lead and zinc smelters by newfacilities in suitable locations. Most existing plants are at least 25years old.
* Renovation of large-scale existing facilities for the electrolyticrefining of aluminum, and adoption of modem technologies for newplants.
(c) Cement
Replacement of small old plants by large-scale modern plants withhigh energy efficiency and improved dust emission protection.There are over 5,000 small-scale plants, of which about 2,000 useprimitive types of shaft ldln.
* Renovation or replacement of existing large- and medium-scaleplants, half of which were built over 40 years ago. This will includereplacement of wet process kilns where possible by preheater orprecalciner systems.
* Utilization of industrial wastes such as fly ash and coal washerywastes as feed to cement lilns or for the production of blendedcements should be encouraged. More blended cements should beproduced to meet certain markets where their properties are fullyacceptable or preferred (e.g., large-scale hydraulic dams and similarmassive structures).

-6-
* Electricity generation by heat recovery in old kilns should beevaluated because the economic viability of this technique is suspect.All such plants have been shut down in western countries.
(d) Flat Glass, Ceramic Tiles, Lime
* As for much of the buildings material sector, old and outdatedplants, many of them very small by world standards, needreplacement by larger modem plants.
(e) Clay Bricks
* This sector is dominated by TVE plants, many of which are verysmall and use simple technologies. Plant size is increasing for newTVE plants, however, and there are process developments whichresult in good energy efficiency. TVE plants should therefore beencouraged to adopt the process developments that are alreadyavailable when planning new facilities.
* The proportion of hollow or perforated bricks remains very low inChina at about 0.3 percent of the total output. In many developedcountries, the extent of perforated brick production is high. Thistype of brick requires less energy to make, consumes less rawmaterial for a given construction volume, and has superior insulatingproperties in service.
(f) Paper
* Adoption of black liquor recovery in more paper plants for energyand caustic soda recovery, and increased utilization of wastematerials such as bark, chips and sawdust.
* Increased use of cogeneration in the paper industry.
* Replacement of old small plants by larger modem facilities, in whichblack liquor recovery and cogeneration investments are more likelyto be economic.
(g) Textiles
* Replacement of old small plants, as for most other sectors, andgreater application of modem technologies and electronic controls.

-7 -
(h) Chemicals, Petrochemicals
* Renovation or replacement of small and medium-scale ammoniaplants, of which there are over 1,000 making ammoniumbicarbonate. These were mostly built over 20 years ago and areinefficient by typical developed country standards and are too smallto reach economic viability by normal evaluation criteria.
* Enterprise scale needs to be reviewed, as there are many small-scaleplants which are uneconomic by normal standards and are unlielyto ever reach true commercial viability.
(i) Equipment
* Many items of equipment are not up to the standards of similar itemson the international marketplace. Technology trnsfer throughlicensing agreements should be considered for key items such ascertain types of electric motor, industrial scale boilers, steam traps,fans and pumps, controls and instrumentation.
aI) Coal Mining
* Old equipment and inefficient items such as ventilator fans and waterpumps (and associated motors) need to be replaced by modernenergy efficient designs.
* Coal washing and screening facilities are important in providinghigher quality coals-and coals of a constant quality-to customers.This would allow higher levels of coal combustion efficiency to beachieved by most users, and sulphur emission levels would also bereduced by selective removal of sulphur compounds in the washingstage.
(k) Power Sector
* Old generating plants based on low or medium pressure boilersshould continue to be replaced by moden, large, high pressureunits.
Electricity distribution systems need upgrading to take higher loads.Power factor compensation in distribution systems should beimproved and many parts of the cable systems require renewal.
All aspects of electricity distribution losses should be investigatedand action taken to reduce losses in order of priorities. As suggested

- 8 -
in item (2), certain equipment may need replacement, includingtransformers.
Existing large power plants based on fossil fuels should be broughtup to higher efficiency by using available technologies such asmodem burners and improved heat recovery from combustion gasesin water or air preheat systems, and by improving maintenancestandards.
C. ACIIONS TO PROMOTE ENERGY EmaIENcY
2.5 The actions needed to stimulate interest in energy efficiency and to achievepositive results are varied in nature. It is necessary firstly to create an environment inwhich energy efficiency is seen as a priority because it will bring benefits to the enterpriseand the individual. These benefits may be seen in a variety of forms and combinations,such as through higher profitability and higher salaries or bonuses, through better workingand safer conditions in the enterprise itself, and as a cleaner and more pleasantenvironment for living in the area surrounding the enterprise through reduced localpollution. Secondly, it is necessary to provide the skills and tools needed to achievepractical energy saving results in the enterprises.
2.6 Actions at a policy level could include a combination of measures such asthe following:
(a) Focussing on energy efficiency as a major contributor to the profitability ofenterprises, to an improvement of the local environmental conditions, andto a reduction in global warming. In practice, this means providingincentives to save energy, both in terms of energy pricing policies andpolicies to promote new investments in energy efficient equipment andprocesses.
(b) Supporting training to improve energy awareness at a general level and toraise skills in economic analysis and energy related technologies forenterprise and government agencies at all levels, national to local.
(c) Providing funding support to enterprises investing in energy efficient andlow polluting processes, through financial incentives or in the form of loansand grants targeted to energy efficiency.
(d) Providing general industrial promotion policies which encouragemodernization and restructuring of energy intensive sectors.
(e) Enforcing more effectively the existing regulations for emission control andfor the phase out of inefficient products such as outdated electric motordesigns.

- 9 -
(f) Encouraging the application of lower energy consuming and cleanerindigenous technologies where appropriate, as these are often better suitedto Chinese conditions (e.g., scale, maintenance needs, operator skills) andless costly than technologies used in developed countries. Each case needsthorough evaluation and whatever approach is finally adopted must bejustified by the economics of the specific case.
2.7 Specific activities to raise awareness and skill levels can take a wide varietyof forms. For example:
(a) Setting up demonstrations of energy efficient equipment and processes, fromlow cost/no cost items such as energy management systems, improvedmaintenance procedures, and instrumentation, to high capital investmentitems such as new higher efficiency boilers. Practical demonstrations in aChinese context are important to convince enterprise managers of thetechnical and economic viability of "new" technologies, even though thesemay already have received broad acceptance internationally.
(b) Promoting a customer service-oriented approach to equipment suppliersthrough training in modern marketing methods, coupled with customertraining to raise awareness of available alternatives and the need for propereconomic analyses for equipment selection.
(c) Setting up local technical assistance centers-or raising the skill levels andequipment available in existing centers-to provide stronger support to localenterprises for economic and technical evaluations of both current operationsand planned investments. Through local centers, developing the concept ofmonitoring and targeting at a practical level by applying the technique inlocal enterprises as a demonstration project.
(d) Setting up specific demonstration and technical assistance programs toencourage the adoption of improved technologies in China. This may bedone firstly by creating a better awareness of the capabilities of selectedtechnologies in customers or end-users, and secondly by upgrading Chineseindustries to supply the relevant energy efficient products. For example,such programs could be set up for steam traps, variable speed electric motordevices, industrial boilers and associated controls, steam system insulation,and cogeneration applications.
(e) Undertaking specific programs to address problems identified in key sectors,such as a major line loss reduction program for low voltage local electricitydistribution systems, a program to study systematically the availability andutilization of industrial wastes (e.g., cement and brick plant feedstock;making synthetic construction materials), and a program to studymanufacturing techniques and applications for perforated bricks.

- 10-
(f) Initiating stronger efforts to upgrade coal quality by washing, screening andbriquetting, as this will have a beneficial effect on a wide range of users andallow them to improve the standard of their operations.

- 11 -
3. INDUSTRIAL SECTOR
A. IRON AND STEE
Industry Profile and Products
3.1 The iron and steel sector consumed almost 100 million TCE in 1990,accounting for 10 percent of the national energy demand. The sector includes a widerange of activities, such as raw material mining and preparation, iron-making, steel-making, steel rolling and manufacture of finished products, coking and preparation ofauxiliary raw materials and refractories, machinery fabrication and repair, ferroalloyproduction, and various other activities related to iron and steel such as those for makingcement with water-granulated slag from blast furnaces.
3.2 In addition to manufacturing facilities, the industry has its own design andscientific research institutes, universities and colleges, hospitals and both living andrecreational buildings. In 1990, there were a total of 2,010 units subordinated to the ironand steel industry with 3.67 million personnel. Within the 2,010 units, there were 1,589operating enterprises:
151 iron ore mines41 coke plants
656 iron and steel works182 ferroalloy plants75 metal product factories38 carbon products factories
131 refractory factories166 other enterprises
A further breakdown of these enterprises and both output and energy consumption data aregiven in Tables 3.1 and 3.2.
3.3 The capacity of the sector in 1990 was 71.2 million tons of steel, 65.3million tons of pig iron, and 73.4 million tons of rolled steel products (Table 3.3). Theactual steel output was 66.35 million tons-ranking China as fourth in the world in termsof steel output-and total output value of the sector was Y 132.5 billion. Within thesector, there are 50 so-called key (or major) enterprises, consisting of 32 iron and steelworks, 7 ferroalloy plants, 4 refractory plants, 2 carbon product factories and 5 miningcompanies. Various statistics for the sector are given in Table 3.4.

- 12 -
Table 3.1: TYPES OF ENTEPPRISE AND PRODUCT OUnUT, 1990
Key Major Local medium Out of Totalenterpr. local and small sector
Enterprises 102 79 936 472 1,589
Outputs, milliontons per year
Crude steel 45.39 14.90 2.74 3.31 66.35Pig iron 37.58 14.93 6.55 3.31 62.37Rolled steel 32.54 12.27 5.00 1.73 51.53Ferroalloy 0.91 0.20 0.83 4.50 2.38Carbon products 0.18 0.01 0.15 0.58 0.91Refractories 2.12 0 1.67 4.29 8.07Coke 24.75 8.78 5.11 34.63 73.27Metal products 0.64 0.05 0.53 0.27 1.49
3.4 With respect to the products made in 1990, about 70 percent was ordinarysteel and 30 percent high quality steel, including 6.3 percent high alloy steel. Steel ismade by three main routes-19.9 percent by the open hearth method, 21.1 percent byelectric arc furnaces and 59.0 percent by the basic oxygen process. There were over20,000 different rolled steel products with a total output of 51.5 million tons; about onethird of these products were steel plate and pipe and the remainder consisted of rails,sections and wire (see Table 3.5). In general, the quality of Chinese steel is beingprogressively improved and 40 percent of output reached international specifications in1990.
3.5 In 1990, coke production reached 73 million tons, of which 50 million wasproduced in mechanized coke ovens (68 percent). Of this, output from the metallurgicalsector was 75 percent, the rest was made by the chemical, urban construction, coal andother industrial sectors, and TVE coke plants.
3.6 The production of ferroalloy was substantial at 2.3 million tons in 1990 outof a capacity of 3.24 million tons (see Table 3.6).
Energy Use
3.7 The main energy sources for the iron and steel industry are coking coal,steam coal, electricity, fuel oil and natural gas. The total energy consumption for thesector reached 98.7 million TCE in 1990 as reported in Table 3.7 (about 10 percent ofnational energy use), although the total for all iron and steel-related activities in China was

- 13 -
Table 3.2: BASIC STATLsnCS OF KEY IRON AND STEEL ENTERPRISES
Conmple- Annual energytion consunption SO,tim major Output (coalequivalent) miasions
Enterprises. Location (yor) Proceaaig route prodc (10' t) (10' t) (t)
Shoudu Ion and BEcijing 1920 ore blast fiunace Steel 435.6 537.0 30,445.37Steel Co. convertr lled product
Tianjin Tanjin - Pig iron - convener (open seel 158.5 1243 21,593.13Metallurgical hearth) olled steelBureau
TanshanIron and Tanhan, Hebei 1944 Ore- blas furnme- Steel 1S7.8 131.0 7,885.11Steel Co. Province convener - rolled product
Xuanhua Iron and Xuanhua, Hcbei 1918 Ore - bla furnace Pig irn 100.9 139.3 5,202.64Steel Co. Province
Taiyun Ion and Taiyuan, Shanxi 1939 Ore - blat uae - open SWl 179.1 238.2 20,958.04Steel Co. Province heartb, convemer, elctric (special
furnae - roiled furnace stel
Baotou Iron and Baotou, Inner 1958 Ore - blat fiurace - open Seel 252.3 338.1 31,158.73Steel Co. Mongolia herth (converter)- roIled
product
Anhan IWron and Anshan, Lisoning 1919 Ore - blast furace- open Steel 765.8 852.3 68,863.45Steel Co. Province hearth (converter) - roUed
product
Benxi Iron and Stcel Benxi, Liaoning 1910 Ore - bla furnce- SteeJ 2363 384.4 66,754.10Co. Province convener - rolled product
Fushun Steel Pant Fushun, Liaoning 1933 Stel scrap - electric Ste 33.5 33A4 97531Provine furce - rolled produet (special
Dalfis Steel Plant Dalien, Laning 1937 Sele crap - electic Sted 303 31.7 3,368.42Province rawe - rled product (special
Qiqihser Steel Plant Qiqihaer, 1957 Steel crap - electric Steel 47.6 43.4 1,482.79Hcilonnjiang furnace - rolled product (specialProvine stel
Shanghai MeliOan Nanjing, Jlaigsu 1969 Ore - blast fiurace Pig ron 159.5 138.5 19,916.63MetUurgical Co. Province
Shanghai Shanghai - Pig iron - Wen hearth Steel 507.5 329.9 8,117.78Metallrgical (conveter,eetric (peciaBureau urce) - oled product sel
Shuicheng Iron and Liupsnshui, 1969 Ore - blat funace - Pig in 53.3 76.1 11,422.41Steel Co. Guizhou Province convrter - rolled product
Shaanxi Steel Pant Xian, Sheanxi 1965 Seel scrap - electric Seel 14.6 14.7 781.9province furnace - toled product (special
Sh-anxi Peciaion Xian, Shaanxi 1965 Steel scrap - ectic Ste 038 -Alloy Plant Province fiunce - teel
Jiuquan Iron and Jiayuguan. Gansu 1970 Ore - blst furwce - Ion 44.6 88.9 8,964.00Steel Co. Province convenre - olled product
Xining Steel Plant Xining. Qinghai 1969 Steel scrmp - eleetdc Steel 32.0 313 1,207.00Province furnace - rolled product (special
steel
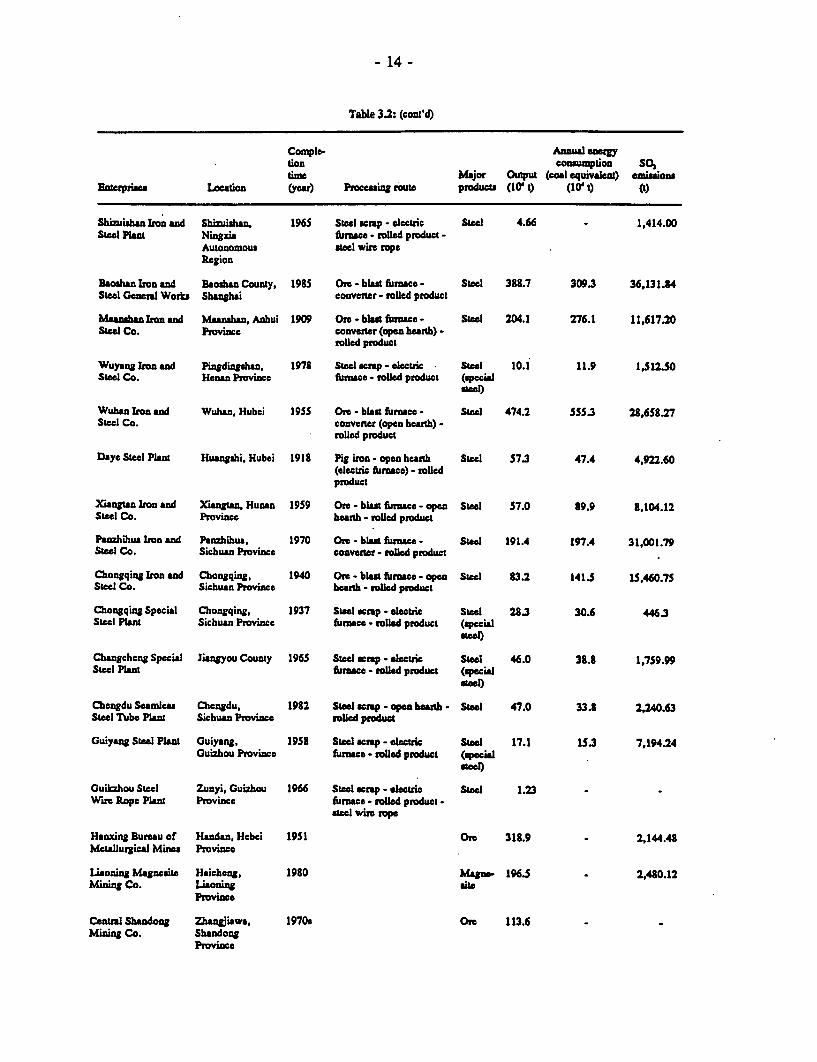
- 14 -
Table 3.2: (cont'd)
Comple- ARMa- ecgytion consumption SO,time Major Output (coal equivalent) emis1ion
Enterpries Lccation (year) Proceuig route producu (10' t) (10't) (t)
Shizuisha ron and Shizihazn, 1965 Steel scrp - ectric Steel 4.66 - 1,414.00Steel Plant Ningxi furnace - roled product -
Autonomous seel wirn topeRegion
Baohan Iron and Bcoxahn County, 1985 Ore - blast furace- Steel 3S8.7 309.3 36,131.34Steel General Works Shanghai convener- rolled poduct
Maanan kron and Manahan, Anhui 1909 Ore -blat rnmce- Steel 204.1 276.1 11,617.20Steel Co. Province converter (open hearth) -
rolled poduct
Wuyeng Iron and Pingdingshan, 1978 Steel scrp - electic Steel 10.1 11.9 1,I12.50Steel Co. Henan Province funace - rolled product (special
Wuhan Iron nd Wuhan, Hubei 1955 Ore - blast furace - Steel 474.2 555.3 28,658.27Steel Co. convener (open hearth) -
rolled product
Days Steel Plant Huangshi, Hubei 1918 Pig iron - open heanh Steel 57.3 47.4 4,922.60(electric furnce) - tolledproduct
Xiangtan Iron and Xangan, Human 1959 Ore - bias furnace - open Steel 57.0 89.9 8,104.12Steel Co. Province heanh - rolled product
Panzhihus Iron and Panzhihua, 1970 Ore - blast furnace- Steel 191.4 197.4 31,001.79Steel Co. Sichuan Province conveer - rolled prduct
Chongqing Iron and Chongqing, 1940 Ore - bls fumnace- open Steel 3.2 141.5 15,460.75Steel Co. Sichuan Province hearth - rolled product
Chongqing Special Chongqing, 1937 SLeel crap - electric Steel 28.3 30.6 446.3Steel Plant Sichuan Province furnce - rolled product (special
Changehng Special Jiangyou County 1965 Steel scp - electric Steel 46.0 33.8 1,759.99Steel Plat furace - olad product (special
Chengdu Seamles Chengdu, 1982 Steel crp - open h b - Stel 47.0 33.3 2,240.63Steel Tube Plant Sichuan Province rolled product
Guiyang Steel Plant Guiyang, 1953 Steel scp - electric Steel 17.1 153 7,194.24Guizhou Province furnace - roled product (special
Guikzhou Steel Zunyi, Guizhou 1966 Steel scrp - electric Steel 123Ware Rope Plant Province furnace - rolW product -
cel wire rope
Hanxing Bureau of Handan, Hebei 1951 Ore 313.9 - 2,144.48Metallurgical Mines Province
Liaonutg Magnesite Haicheng, 1980 Magn. 196.5 - 2,480.12Mining Co. laonitg ite
Province
Centml Shandong Zhazgjiawa, 1970c Ore 113.6Mining Co. Shandong
Province

- 15 -
Table 32: (cont'd)
Cornple- Anna enegythD atunption SO,
finm Major Output (coal equivalent) emaonEnterpaea Locaion (year) Procesing routse product (104 t) (0l t) (t)
Hainan Iron Mine Chanjiang, 195 - Ore 427.3 - S4838Hainan Province
Pan7itihua Mining Panzhihuc, 1970 Ore 885.4 - 125.00Co. Sichuan Province
Jiwzhou Forroalloy Jiwzhou, Liaoning 1942 Ore - ore iungc. Form- 6.2 - 1,260.19FactoMy Province furnce alloy
Liaoyang Ferroalloy Liaoyang, 1949 Ore - orn smelting FoITo- 6.2 - 259Factory Liaoning furnace alloy
Province
Jilin Fermalloy rI'in, Liaoning 1956 Ore - ore nelting Fern- 23.5 - 1,864.85Factory Province furnace alloy
Hunan Ferroalloy Xiangxiang. 1962 Ore - ore smelting Frno- 6.6 - 521.64Factory Hunan Province furnace alloy
Eaei Ferrolloy Emei, Sichuan 1972 Ore - ore smelting Ferro- 4.7 467.72Factory Province funce alloy
Zunyi FerroaUoy Zunyi, Guizhou 1966 Orn - oe amelting Feom- 9.2 - 441.00Factory Province furnace alloy
Nouthwert Lacamou, Gansu 1975 Ore - orc anlting Form- 7.4 - 121.90Ferroalloy Factory Province furnace alloy
Jilin Carbon Factory Jilin, Jlin 1955 Carbon 9.93 - 562.60Province prduct
La mhou Carbon La mhou, Ganeu 1966 Carbon 4.02 - 364.76Factory Provine product
Luoyang Refractory Luoyang, Henan 1959 R;efec- 12.02 - 240.33Factory Province tory
Northweat Yao County, 1970 Refoc- 3.7n - 720.00Refractory Factory Shaanxi Province tory
Deyang Refiactory Deyang, Sichuan 1970 Refiac- 3.90Factory Province tory
Guiyang Refractory Guiyang, 1958 Refioc- 6.17 - 7.50Factory Guizhou Province tory
106.89 million TCE. Energy consumptions by source are shown in Figure 3.1 and Tables3.8 and 3.9. Table 3.10 gives indications of energy prices, which are steadily increasingfor all enterprises, and shows the cost of energy now represents well over 20 percent oftotal manufacturing costs.

- 16 -
Table 3.3: CAPAC AND OurPrr FOR MAJOR PRODUCrS, 1990(million tons)
Major products Capacity Actual output
Crude steel 71.21 66.35Pig iron 65.31 62.37Rolled steel 73.38 51.53Coke, total 73.43 73.27
mechanized 50.87 50.03FerroaDoys 3.24 2.38
3.8 About two thirds of the energy used in the sector is for a few major processstages-coking, sintering, blast furnace operation, steel conversion and rolling (see Table3.11). About 30 percent is used for all auxiliary processes and services. The main energyconsuming equipment consists of furnaces, blast furnaces and converters and detailedinformation on such equipment in key enterprises is given in Table 3.12.
3.9 A reliable supply of electricity is important and the majority of enterprisesreceive power from the national transmission system for which the average generatingefficiency is 30.4 percent. About 56 bilion kWh of electricity were consumed in the ironand steel industry in 1990. A number of the larger plants generate their own electricitywith varying levels of efficiency: for example, Anshan Iron and Steel Co. operates quiteold facilities at about 31 percent while the new Baoshan plant reaches 39 percent.However, many older plants are operating under 30 percent, some as low as 25 percent.The total self generated electricity amounted to 10.4 bilion kWh in 1990, about 20 percentof plant demand.
3.10 Steam is also an important energy source: except for a few plants, steamis obtained from self contained boilerhouse systems. Many of the older boilers areoperated only to make steam for electricity generation although combined heat and powersystems are becoming more common. Table 3.13 gives some typical boiler efficiencyfigures, which vary from about 60 to 83 percent.
Specific Energy Consumption
3.11 There is a wide range of energy intensities shown by enterprises in thissector: this is illustrated in Table 3.14. Much of the equipment in this sector is quite oldand the technologies are relatively backward in many plants. Efficiencies are thereforegenerally lower than for the corresponding activities in developed countries but efforts tomodernize the industry have been pursued vigorously in recent years.

- 17 -
Table 3.4: BAsic STAT1SnCs FOR THE SEEL INDuRY
Item Unit 1985 1986 1987 19S8 1989 1990
Number of eatesprises andingitutions 1,925 2,002 2,022 2,100 1,931 2,010
Grom indusrial output value L Y 10 449.6 499.98 547.05 567.20 594.25 631.76(1,325.43)
Net industrial o ut value Y 10' 180.6 205.05 242.26 283.01 325.83 322.13Steel output 10' 4,679.0 5,220.8 5,627.61 5,943.0 6,158.7 6,634.86Total energy consumnption Ic 10' 7,829.0 8,457.5 ,821.43 9,101.21 9,308.76 9,871.84Tot number of gaff and workers
(yea-nd) 10'peron 328.4 399.13 349.06 356.93 360.70 366.80
Numberofenerpns 1,318 1,393 1,444 1,478 1,550 1,589Groa industria output value / Y 10' 4403 489.2 534.70 551.29 585.13 621.9Net industra output value lb Y 10' 175.8 199.8 236.26 276.78 321.81 211.78Output of major indusril products:
Steel 10 t 4,679.40 5,220.8 5,627.61 5,943 6,158.72 6,634.36Fmn;hed rolld teel prducts 10' t 3,69231 4,048.0 4,385.57 4,689.22 4,859.11 5,153.21Pig iron 10't 4,383.68 5,063.9 5,503.18 5,704.0 5,820.03 6,23731Coke 10' t 4,794.65 5,267.0 S,790.6 6,107.62 8,623.99 7,326.63Raw iron or 10 t 13,735.0 14,945.0 16,142.5 16,769.86 17,185.40 17,93436Iron concentate 10' t 4,330.20 4,714.0 S,200.79 5,300.64 5,444.90 5,706.90PFeroaloy 10' t 149.18 159.6 184.61 208.4S 236.9S 23S.27Rcfractory 10' t 614.18 596.4 682.88 27.12 821.11 80733Carbonproduct 10 t 60.S6 34.13 59.02 76.24 8832 91.27
Total energy coanumnption /c 10 * 7,779.63 8,403.9 8,765.4 9,064.8 9,283.56 9,871.U4Comprecansivc energy consunption per
ton stel eq. coal,/t steel 1.746 1.705 1.674 1.647 1.636 1.600
Totul number of stff *and workers(yce end) 10' persons 268.14 280.75 289.08 304.4 309.1 315.3
Fancil inAdexes:Original value of fixed as*se
(year-end) Y 10' 598.13 7133 793.64 8893 994.89 1,1143SNet value of fixed assets (year-end) Y 10' 397.00 502.8 553.4 621.4 693.60 774.91Total funds ld Y 10' 505.83 598.0 701.47 772.55 878.79 1,013.18of which: Net value of fixed ascus Y 10' 375.53 433.52 S10.53 65S8.23 634.01 701.01
Quota circulating funds Y 10' 130.33 164.48 190.94 204.32 244.78 312.17
/a Al 1980 coant prices, in parnthesis, at 1990 consant prie./b At current prices by allocation method./c Coal equivalent, 10' tons./d At anual average balance.
Energy Efficiency Trends
3.12 The iron and steel sector has placed strong emphasis on energy efficiencyfor more than 15 years: overall energy consumption has been cut from 2.5 to 1.6 TCE/t(Table 3.15 and Figure 3.2). From 1978 to 1982, the work started by stressing energyawareness, improving management and cutting obvious wastes and losses. Annual energysaving amounted to about 7 percent.

(105 TCE)73.80 72.69 70.90 64.95 66.75 69.12 73.56 77.80 84.03 87.65 90.65 92.81 98.72
ec 16r7 20.0 16.6 19.S 1 1 20.4 19.6 20.4 20.0 21.6 22.1 23.6 28.7
OA~~~~~~~~~~~~~~~~~~~~'
X w .- - - E 1- H - H . rJ.9. -. 64L -. S **.g ̂ - 6 .8 6 6.. ~~ sot - 8.1 ~~~~~~~~ -8 7.8 O
18.a 16. 16.7 1.4 1.8 17.6 1.8 1 0.1 18.3 18.1 19.1 18.8 18.4 1 4
C 1~68JI 643 84. 63. 53.7 6J.4 52.91 62.9 C2.4 8241 0.91 49.I6aX BO
Percentages are shown In the dlagram.

- 19 -
Table 3.5: PRODUCTION OF ROTLLD STEEL PRODUCTS(Percentage of total production)
Type of product 1985 1986 1987 1988 1989 1990
Steel items for railways 3.9 3.5 3.4 3.4 3.3 3.2Steel sections 45.1 45.4 44.6 42.7 41.1 40.0Wire rods 16.2 15.8 15.8 17.0 18.2 19.4Steel plates 23.5 23.4 23.7 25.2 25.5 23.4Steel pipes 8.7 7.9 9.3 8.3 8.4 8.4Steel strip 2.2 2.4 2.8 3.0 3.1 3.3Miscellaneous 0.4 1.6 0.4 0.4 0.4 2.3
Iotal 100.0 100.0Q 100.0Q 100. 100. I00Q
Table 3.6: FERROALLOY PRODUCTION, 1990
Percentages:Ferrosilicon 32.65Carbon ferromanganese 10.05Silicon manganese 16.44Blast furnace ferromanganese 17.75Other alloys 23.11
Total t%) 100.00
Total Output(million tons) 23
3.13 From 1982 to 1986, energy conservation was extended to iron ore mines andferroalloy, refractory, carbon product, metal product and other enterprises. Laws andregulations were introduced, working procedures improved, and a variety of energy savingtechnical measures introduced. These included converter gas recovery, continuous casting,multi-lance oxygen blowing of open hearth furnaces, blast furnace coal injection, andgreater utilization of waste heat. During the period, annual energy saving was almost3 percent.
3.14 From 1987, further energy saving was pursued, although this became moredifficult as operations developed towards smaller batches and higher quality. Shortage offunds and inadequate investment led to less energy saving, which dropped to an annual rateof less than 1 percent.

- 20 -
Table 3.7: RELATION OF SECTOR ENERGY USE TO NATIONAL ENERGY DEMAND
1980 1985 1986 1987 1988 1989 1990
Energy consumption,million TCEIron and steelindustry 70.90 77.80 84.03 80.05 91.01 91.55 98.72
National 802.75 766.82 808.50 866.32 929.97 969.34 980.00
Iron and steelindustry as apercentage ofnational demand 11.76 10.15 10.39 9.24 9.79 9.44 10.07
Index of energyuse by the steelindustry 100.0 109.7 118.5 112.9 128.4 129.1 139.2
Table 3.8: TYPE OF ENERGY CONSUME, 1980-90
Units 1980 1985 1986 1987 1988 1989 1990
Total demnnd 10' TCE 70.90 77.80 84.03 87.65 90.65 92.84 98.72
Coal 10' TCE 59.63 86.95 70.87 73.42 75.47 75.92 80.69% 71.3 72.0 70.7 70.5 70.0 68.6 68.8
Electricity TwVh 31.48 38.59 43.28 46.89 49.48 53.91 57.96% 18.6 20.4 20.0 21.6 22.1 23.3 23.7
Heavy oil 10 t 4.21 3.51 4.13 4.15 4.32 4.45 4.49% 8.3 6.4 6.9 6.8 6.8 6.8 6.5
Naturl gas 10' m' 957 677 733 730 796 790 742% 1.8 1.1 1.1 1.1 1.1 1.1 1.0
3.15 Many energy inefficient technologies and practices have been eliminated.Small blast furnaces (size under about 100 m3), electric furnaces and converters withcapacities under 5 tons, ore heating furnaces under 1,800 KVA are being shut down. Halfof the obsolete and inefficient blowers, pumps, tansformers and electric motors in theindustry are estimated to have been replaced or modified.

- 21 -
Table 3.9: ENERGY CONSumInION DATA FOR THr; IRON AND STEEL INDtRy,MgO
Enern consumed ToWlSector/Subaector Output Stm. coal Cok. comA Coke Oil Nat. gas Toul fiel Electricity neagy
(10) (10'/m) (10'TCE) 10kWh 10'TCB 10' TCE
Whole nation 66,34S
Iron and steel indutruy 63,035 25,372 55,313 46,241 4,486 742 75,302 57,96S 23,418 98,720of which:lCey ceterprises (stel) 45,394 984 33,859 18,10 3,320 514 36,863 20,731 8,395 4S,258Local nterpris (steel) 17,641 299 21.459 14,554 344 60 19,303 8,609 3,497 22,800Iron ore miner 166,339 791 800 - - 562 6,061 2,440 3,002enusaloy . 1,933 39S - 962 156 - 512 9,748 3,936 4,448
Refrctory material 3,786 692 699 89 - 619 2,203 890 1,509Carbon product 329 49 - 694 14 - 603 1,365 713 1,316Other - 22,159 - 10,022 563 168 16,840 8,748 3,547 20,387
Nonscotor (ateel) 3,313 - - - - - - -
Table 3.10: ENERGY PRICES FOR TmE IRON AND STEEL INDuISRY
Energy priceYear (Y/t coal equivalent) Percentage of energy to cost
Key Local major Key Local majorenterprise enterprise enterprise enterprise
1981 84.4 21.381982 85.8 - 22.181983 96.4 - 23.361984 96.2 - 22.701985 108.1 - 21.501986 116.1 79.2 20.36 23.541987 125.4 83.3 19.88 21.781988 150.9 109.9 20.90 22.861989 192.5 142.1 22.17 25.321990 230.3 161.6 22.81 25.97
Note: The statistics and average value cannot be obtained to the energy out-of-planbecause of its great difference in region, time and variety.
3.16 New energy saving facilities have been installed, e.g., 122 continuouscasting machines, bringing the extent of continuous casting up to 28 percent (comparedwith 90 percent in many developed countries). Blast furnace coal injection has beenadopted in 75 percent of key enterprises; 40 percent of steel converters recover by-product

- 22 -
Table 3.11: ENERGY CONSUMED BY MAJOR MANUFACTURING PROCFSSES, 1990
Coke iron Steel initial Sted Ferro-making Sintering making maldng rolling rolling alloys
Output 10' tons 37.71 87.03 59.06 63.04 48.23 49.80 1.93
Energy use (10' tce) 7.60 8.02 34.11 6.66 3.88 6.88 4.45
Energy use as %of sector use /a 7.7 8.1 34.6 6.7 3.9 6.2 4.5
La Total for these processes amounts to 71.7 percent.
gas. Four dry coke quenching systems have been installed. The concept of centralizedenergy centers has been utilized in large plants.
3.17 As a result of conservation efforts, which of course continue, steel outputwas increased 1.3 times from 1978 to 1990 while energy use increased by 45 percent from73.8 to 98.7 million TCE.
Potential for Improvement
3.18 Efforts to save energy are continuing as follows:
(a) Energy awareness is being promoted to all levels of staff. Rules andregulations for the energy management of enterprises have been set up,including procedures for carrying out energy balances and comparingconsumption with norms.
(b) Tests on operating equipment are made to check thermal efficiency.Upgrading of furnaces, ovens, processes and enterprises is carried out inparallel.
(c) Many energy saving measures have been disseminated to operating plants(see list above for typical examples).
3.19 Although further energy efficiency improvements are becoming moredifficult to find and more expensive to make, there remain cost effective opportunities tosave energy in the industry. For example, major savings will be achieved throughreplacement of backward technology such as open hearth steel furnaces and rehabilitationof reheat furnaces in rolling mills. Small-scale facilities will have to be expanded andmodernized to improve efficiency, or shut down. Steel and associated product qualitieswill have to be improved to reduce material consumption and avoid the need for still
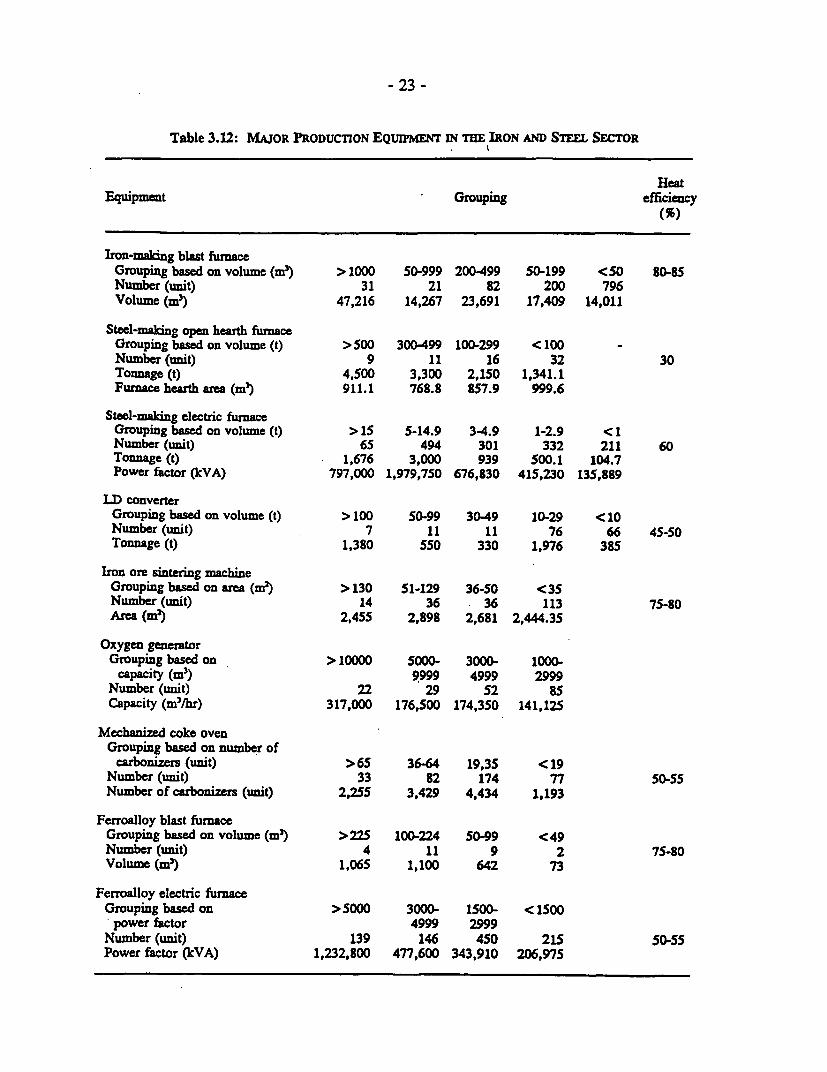
- 23 -
Table 3.12: MAJOR PRODUCTION EQuIPMENT IN THE IRON AND STEEL SECTOR
HeatEquipment Grouping efficiency
(M)
Iron-mang blast furnaceGrouping based on volume (m3 ) > 1000 50-999 200-499 50-199 <50 80-85Number (unit) 31 21 82 200 796Volume (n 3) 47,216 14,267 23,691 17,409 14,011
Steel-maling open hearth funaceGrouping based on volume (t) > 500 300-499 100-299 < 100 -Number (unit) 9 11 16 32 30Tonnage (t) 4,500 3,300 2,150 1,341.1Furnace hearth area (m3) 911.1 768.8 857.9 999.6
Steel-making electric fumnaceGrouping based on volume (t) > 15 5-14.9 3-4.9 1-2.9 < 1Number (unit) 65 494 301 332 211 60Tonnage (t) 1,676 3,000 939 500.1 104.7Power factor (kVA) 797,000 1,979,750 676,830 415,230 135,889
LD converterGrouping based on volume (t) > 100 50-99 30-49 10-29 <10Number (unit) 7 11 11 76 66 45-50Tonnage (t) 1,380 550 330 1,976 385
Iron ore sintering machineGrouping based on area (mn) > 130 51-129 36-50 <35Number (unit) 14 36 36 113 75-80Area (m) 2,455 2,898 2,681 2,.444.35
Oxygen generatorGrouping based on > 10000 5000- 3000- 1000-
capacity (m3) 9999 4999 2999Number (unit) 22 29 52 85Capacity (m3/hr) 317,000 176,500 174,350 141,125
Mechanized coke ovenGrouping based on number of
carbonizers (unit) >65 36-64 19,35 <19Number (unit) 33 82 174 77 50-55Number of carbonizers (unit) 2,255 3,429 4,434 1,193
Ferroalloy blast furnaceGrouping based on volume (m3) >225 100-224 50-99 <49Number (unit) 4 11 9 2 75-80Volume (m3) 1,065 1,100 642 73
Ferroalloy electric furnaceGrouping based on > 5000 3000- 1500- < 1500
power factor 4999 2999Number (unit) 139 146 450 215 50-55Power factor (kVA) 1,232,800 477,600 343,910 206,975

- 24 -
greater production levels with corresponding increased energy consumption. Allenterprises need to emphasize the role of good management.
Table 3.13: CONVESON E aCENCY OF PowR BouRsOF SEVERAL ENTERPRE
Steam conversion efficiency(%)
7ypical enterprises
Shoudu Iron and Steel Co. 74.0Anshan Iron and Steel Co. 78.1Jiuquan Iron and Steel Co. 78.3Maanshan Iron and Steel Co. 75.8Panzhihua Iron and Steel Co. 83.1Hanzhou Iron and Steel Works 60.3Anyan Iron and Steel Co. 65.9
3.20 Some specific measures expected to be implemented in the iron and steelindustry in the period to 2010 are illustrated in Table E: these include several specifictargets for improvement, such as increasing continuous casting to over 50 percent ofoutput. Other measures expected to receive priority attention include direct current electricsteel-making, enhanced heat and waste gas recovery, pulveized coal injection to blastfurnaces, reheat furnace renovation, cogeneration, variable speed motors for rolling milldrives, and replacement of inefficient small boilers. Estimates of energy saving potentialare given in the table.
3.21 It is evident that there remain large differences in energy consumption perunit steel production between China and advanced countries. Differences in the scale ofequipment are of course a major factor. For example, there were 1,130 blast fumaces inChina in 1990, with an average pig iron output of 52,000 tpy. In Japan, the average isalmost 240,000 tpy. Small equipment using backward technology obviously results in highenergy consumptions. To effect changes in the sector as a whole, very large capitalinvestments will be needed over many years.
Projected Industry Outputs and Energy Consumption
3.22 The iron and steel sectox is expected to continue to expand rapidly. Steeloutput is likely to be about 110 million tons per year by 2000 and 140 million tpy by 2010.Energy consumption per ton of steel should be reduced to 1.45 and 1.3 TCE/t by 2000 and2010 respectively (Table 3.16).

- 25 -
Table 3.14: ENERGY OUTPUTS AND CONSUmpTIONS, IRON AND STEEL ENTERISE (1990)
ComprehensiveOutput of Total energy energy
Category of enterprises major products consumption consumption(10,000 t) (coal equiv. (coal equiv.,
10' t) l/t)
1. Integrated iron and steel works steel: 4,449 5,525 1.242(a) Key enterprise 3,242 3,902 1.202(b) Local major enterprise 1,193 1,494 1.311(c) Local small enterprise 67 129 1.917
2. Ordinary steel enterprise steel: 1,086 589 0.541(a) Key enterprise 719 319 0.444(b) Local major enterprise 236 152 0.644
Local small enterprise 132 118 0.8963. Special steel enterprise 132 118 0.8964. Iron-producing enterprise pig iron: 1,359.4 1,671.2 1.211
(a) Key enterprise 474.1 562.3 1.186(b) Local major enterprise 356.4 407.3 1.143(c) Local small enterprise 528.9 701.6 1.327
5. Steel rolling enterprise steel product: 816.1 230.8 0.283(a) Local major enterprise 191.6 59.6 0.311(b) Local small enterprise 624.5 171.2 0.271
Total 8.377.2 85.6%/a
Key enterprise 5,144 52.6%Local major enterprise 2,113 21.6%Local small enterprise 1,119.2 11.4%
/a Percentage in the industry.
Generic Investment Options
3.23 A number of technologies were identified as having widespread replicationpotential in the iron and steel sector, from which the following energy efficiency measureswere selected for examination in detail as case studies. For these, actual plant data werecollected from various steel works around China to ensure the data on technicalperformance and costs were reliable. The four items studied for the iron and steel industrywere as follows:
(a) MI Replacement of open hearth steel converters by the basic oxygenprocess.
The open hearth converter (OH) was the traditional method of maldng steelfrom pig iron but consumes large amounts of energy and is responsible forserious pollutant emissions. The OH method has been superseded by the

- 26 -
Table 3.15: SPECICIc ENERGY CONSUMrPONS, 1978-90
Decreasein 1990 Annual
averageYear 1978 1980 1985 1990 978 decrease
Comprehensive energy consumption of iron andsteel industry (coal equiv., t/t steel) 2.524 2.039 1.746 1.611 36.17 3.87
Comparable energy consumption of iron andsteel industry (coal equiv., t/t steel) 1.55 1.30 1.12 1.03 33.55 3.73
Comprehensive energy consumption of keyenterprises (coal equiv., th steel) 1.757 1.461 1.295 1.202 31.59 3.28
Comparable energy consumption of keyenterprises (coal equiv., t/t steel) 1.400 1.201 1.062 0.997 28.79 3.03
Energy consumption of operating Processes ofkey enterprises (coal equiv., kgit product) - - -
Coke making 312 196 183 184 15.60 1.63
Sintering 104 95 85 77 25.98 2.70
Iron gmking 562 S31 S14 509 9.43 0.97
Open hearth 233 200 156 123 47.21 5.50
Converter 143/a 10 7I 39 28 - -
Electric funace 403 381 325 296 26.55 2.62
Steel rolling 281 157 152 135 51.96 6.45
Comprehensive energy consumption of localmajor enterprises (t coal equiv./tsteel) 3.081 2.233 1.720 1.436 53.39 6.29
Comparable energy consumption of localenterprises (t coail equiv./t steel) 2.320 1.554 1.220 1.043 55.04 6.58
Energy consumption of operating processes oflocal major enterprises (t coal equiv./t product) - - - - - -
Coke making 235 267 196 188 20.00 2.30
Sintering 135 120 106 86 36.30 3.62
Pelletizing 65 74 63 53 18.46 2.40(1979)
Iron making 674 613 585 557 17.36 1.72
Converter steel making 83 88 71 58 30.12 3.06
Electric furnace steel making 439 367 325 317 27.79 2.64
Breaking down 199 149 112 110 44.72 2.64
Steel rolling 230 209 138 127 44.78 6.38(1979)
La Including energy consumption of cupola.

- 27 -
Table 3.16: FoREcAsrs OF OurTur, ENERGY CONSUMPTION AND PoLLuTANTDISCEHARGES FOR 2000 AND 2010
Item Unit 1991 2000 2010
Steel:Total output (capacity) 106 t 71.0 100.0 140.0Output out of iron and steel industry 106 t 3.81 3.80 4.00
Comprehensive energy consump-tion per ton steel t coal equiv. 1.601 1.45 1.30
Energy Consumption:Total consumption 10' t coal equiv. 103.21 140.65 176.80
in which: Coldng coal 10' t 59.14 81.26 106.08Fuel coal 106 t 26.54 39.00 54.08Heavy oil 106 t 4.41 4.92 5.57Natural gas o109 m3 0.72 1.05 1.35Electric power 10' kWh 59.9 70.3 90.9
( 1O)La (140)La (280)LaCokeLb 106 t 4.57 4.35 -
Discharging Volume:Dust kg/t steel 9.5 8 3.5-
4.0SO2 kg/t steel 10-13 8.5 4.0NOx kg/t steel 1.0 0.8 0.5CO2 kg/t steel 2,500- 2,200- 2,000-
3,000 2,700 2,400
Note: (1) The equipped ratio of environmental protection facilities will be up to 100percent by the year 2000.
(2) The level of environmental protection facilities will reach the internationallevel of the end-1980's by the year 2010.
La Figure in parentheses indicates the amount of self-generated power.Lb Purchased coke.
basic oxygen furnace (BOF) which is self sufficient in energy and fromwhich fuel gas can be recovered. The last OH furnaces were shut down inmost western countries by the early 1980s. In China, the outdated OHprocess still represents almost 20 percent of steel-making capacity.

- 28 -
(b) M2 Replacement of ingot casting by the continuous casting process.
In the traditional steel-making process, molten steel is poured from theconverter into molds and ingots are produced. After cooling andsolidifying, these are transferred to reheat furnaces where they are raised toa high temperature again prior to rolling into the required products such asbars, billets or sheets. As cooling and reheating is very wasteful of energy,continuous casting and rolling of steel has been developed and applied inmany countries. The process saves energy and reduces metal losses throughlower scale and scrap production. While the average percentage of steelprocessed by continuous casting in the world is about 60 percent, in Chinait is about 23 percent.
(c) M3 Renovation of reheat fumaces in rolling mills.
The rolling of steel products is an important activity and consumes about70 percent of the total energy used in steel-making. The operatingefficiency of reheat fumaces is therefore a key item in achieving goodenergy efficiency. Many reheat fumaces in China are however in poorphysical condition and are only able to achieve quite low efficiencies.Renovation of the furnaces, equipping them with new burners and improvedcombustion air preheat, and applying modem instrumentation and controls,has broad application throughout the steel industry.
(d) M4 Recovery of blast furnace top gas for cogeneration.
In modem integrated steel works, blast furnace top gas is normallyrecovered as fuel gas for furnaces and coke ovens around the plant. Inplants producing only pig iron from blast furnaces, there are usually fewapplications for fuel gas and therefore many plants in China discharge gasin excess of their own requirements directly to atmosphere. This is a wasteof energy and is a major source of pollution. The gas may be recoveredand used to generate both steam and electricity in a modem cogenerationsystem.
3.24 Based on data from plants in China where the proposed measures have eitherbeen implemented or are planned, rates of return and payback periods (which includeconstruction time) were estimated:

- 29 -
IRR, % Payback, years
MI Replacement of open hearth 16.1 13M2 Continuous casting 18.6 9M3 Renovation of reheat fumaces 36.7 1M4 BF gas recovery 28.2 7
3.25 In addition to cost data, the energy consumption and pollutant emissioncharacteristics of plants with and without the technologies were determined. To calculatethe likely contribution of each measure to energy saving and reduction of greenhouse gasemissions, sector characteristics were then used and rates of adoption of each technologyby 2000 and 2010 were estimated, taking into account the calculated rates of return andpayback periods. Forecasts were made for 'business as usualw and "accelerated"scenarios, where the "accelerated" case assumes major awareness campaigns andpromotional efforts to persuade enterprise managements to adopt measures and invest inenergy efficiency. The forecasts were as follows:
1990 2000 2010
MI Replacement of open hearth (million tpy steel)BAU Open Hearth 11.7 8.7 8.7BOF 0.0 3.0 3.0Accel. Open Hearth 11.7 8.7 0.0BOF 0.0 3.0 11.7
M2 Continuous casting (million tpy steel)BAU Ingot casting 47.6 45.8 31.4Continuous casting 14.8 16.6 31.0Accel. Ingot casting 47.6 45.8 12.5Continuous casting 14.8 16.6 49.9
M3 Renovation of reheat furnaces (million tpy rolled)BAU Old furnaces 50.0 8.3 0.0Renovated furnaces 0.0 41.7 50.0Accel Old furnaces 50.0 0.0 0.0Renovated furnaces 0.0 50.0 50.0
M4 BF gas recovery (million tpy pig iron)BAU BF capacity, no recov. 10.0 4.0 0.0Capacity with recovery 0.0 6.0 10.0Accel. BF capacity, no recov. 10.0 2.0 0.0Capacity with recovery 0.0 8.0 10.0

- 30 -
3.26 Details of the present levels of use of the various technologies and theassumptions made regarding future adoption are given in Appendix A, together with theenergy consumption and emissions factors used in the calculations.
Projected Inpacts on Energy and Emissions
3.27 Using the BAU and accelerated forecasts indicated above, the expectedimpacts on the iron and steel sector energy use were calculated as follows:
Savin,es 103 Saviyngs 103TCE/yr by 2Q00 TCE/yr bv 2010
BAU Accel. BAU Accel.
MI Replace open hearth 146 146 146 568M2 Continuous casting 73 73 658 1,425M3 Reheat furnaces 459 550 550 550M4 BF gas recovery 296 394 493 493
3.28 Reductions in CO2 emissions were forecast as follows:
CO, reduction CO, reduction103 TPY by1~ 200103 TPY by 2010
BAU Accel. BAU Accel.
MI Replace open hearth 154 154 154 602M2 Continuous casting 48 48 428 928M3 Reheat furnaces 296 355 355 355M4 BF gas recovery 237 316 395 395
Emissions
3.29 Furnaces and ovens are the main sources of pollutants such as SO2 and CO2.Particulate emissions are also important in this industry. Tables 3.17 and 3.18 give someinformation on the current generation and discharge of pollutants from various processes.
3.30 Various measures have been taken to improve the situation. Slags arerecovered from blast furnaces, steel converters and ferroalloy plants for utilization incement production. Iron and steel plant operating equipment is now being fitted with dust
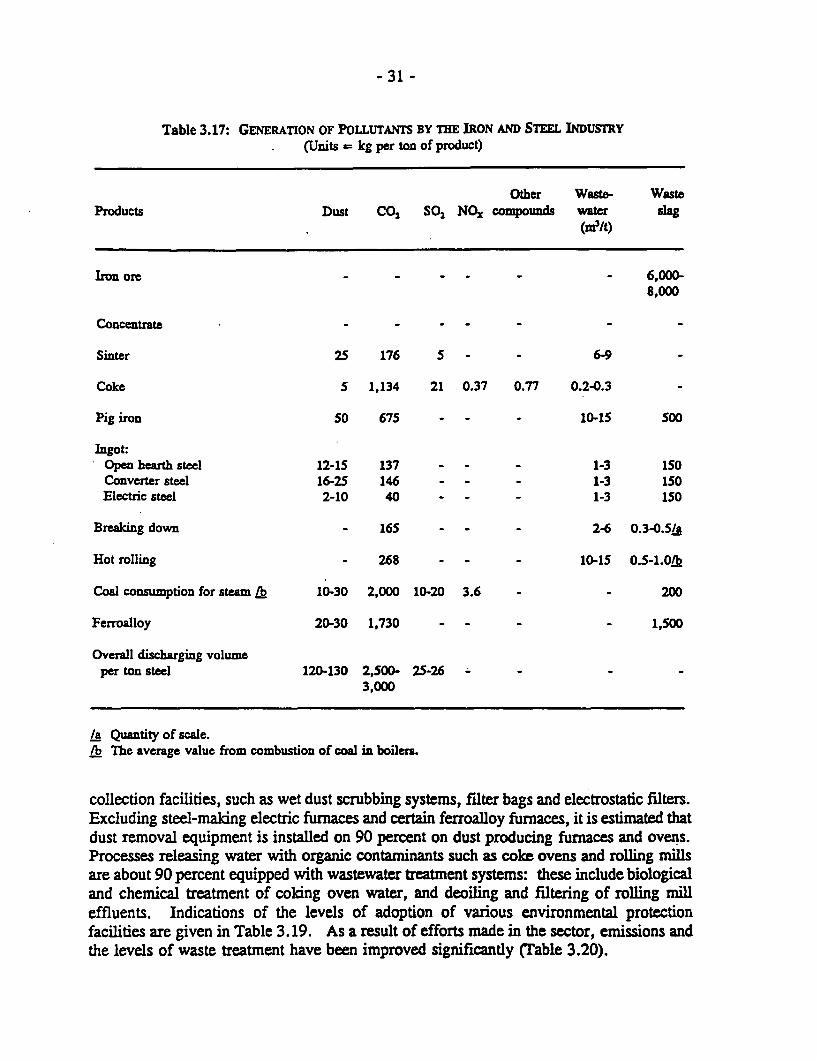
- 31 -
Table 3.17: GENERATION OF POLLUTANTS BY THE IRON AND STEEL INDUSrRY(Units = kg per ton of product)
Other Waste- WasteProducts Dust CO2 SO2 NOx compounds watcr slag
* ~~~~~~~~~~~~~(m31t)
Iron ore - - - - - - 6,000-
8,000
Concentrate -
Sinter 25 176 5 - - 6-9
Coke 5 1,134 21 0.37 0.77 0.2-0.3 -
Pig iron 50 675 - - - 10-15 500
Ingot:Open bearth steel 12-15 137 - - - 1-3 150Converter steel 16-25 146 - - - 1-3 150Electric steel 2-10 40 - - - 1-3 150
Breaking down - 165 - - - 2-6 0.3-0.5/a
Hot rolling - 268 - - - 10-15 0.S-1.0Lk
Coal consumption for steam / 10-30 2,000 10-20 3.6 - - 200
Ferroalloy 20-30 1,730 - - - - 1,500
Overall discharging volumeper ton steel 120-130 2,500- 25-26
3,000
/a Quantity of scale./b The averge value from combustion of coal in boilers.
collection facilities, such as wet dust scrubbing systems, filter bags and electrostatic filters.Excluding steel-making electric furnaces and certain ferroalloy furnaces, it is estimated thatdust removal equipment is installed on 90 percent on dust producing furnaces and ovens.Processes releasing water with organic contaminants such as coke ovens and rolling millsare about 90 percent equipped with wastewater treatment systems: these include biologicaland chemical treatment of coking oven water, and deoiling and filtering of rolling milleffluents. Indications of the levels of adoption of various environmental protectionfacilities are given in Table 3.19. As a result of efforts made in the sector, emissions andthe levels of waste treatment have been improved significantly (Table 3.20).

- 32 -
Table 3.18: DISCHARGE OF POLLUTANTS BY THE IRON AND STEEL INDUSTRY(UJnits = kg per ton of product)
Equipping rate ofenvironmental
Other Waste- Waste protectionProducts Dust CO 2 SO2 NOx compounds water slag facilities
(m3/t) (%)
Iron ore - - - - - - 6,000-
8,000
Concentrate - - - - - 1-2 - Wastewater, 100
Sinter 6.25. 176 5 - - - - Dedusting, 94-100
Coke 1.25 1,134 1.0 - - 0.02-0.03 - Biochemical, 90
Pig iron 2.5 675 - 1.5-2.0 500 Dedusting, 91
Ingot:OH steel 3.0-3.8 137 - - - 150 Dedusting, 91BOF steel 2.5 146 - - 1-3 1S0 100EAF steel 3-12 40 - - - - 150 61
Breaking down - 165 - - - 1-2 - Wastewater, 95
Hot rolling - 268 - - - 1-2 - Wastewater, 95
Coal combustionfor steam /a 7.5 2,000 10-20 3.6 - - 200
Ferfoalloy 12-25 1,730 - - - - 1,500
Overall discharg-ing volume per 9.5 2,500- 10-13 1.0ton steel 3,000
/a The average value from combustion of coal in boilers.
B. NONFERROUS METALS
Industry Profile and Products
3.31 In 1990, the nonferrous metals industry consisted of 917 enterprisesproducing metals and 240 organizations engaged in prospecting and construction,conducting scientific research, and operating universities and polytechnic schools. Thetotal employment was 1.37 million personnel for all branches of activity.

- 33 -
Table 3.19: ENVRONMENTAL PRoTcErION FACIxrTES FOR MAJOR EQuIPMENT
EquippingProduction equipment Environment protecting facilities rate (%)
Sintering machine Fume dedusting in the front of machine 100
Sintering machine Fume dedusting in the end of machine 94BOF First dedusting of fume 100EAF First dedusting of fume 81OH First dedusting of fume 91
Mineral dressing Wastewater purification and reusing 100
Coke oven Wastewater biochemical treatment 100
Blast furnace Wastewater recirculating use 90BOF Wastewater recirculating use 100
Rolling mill Wastewater recirculating use 95
Table 3.20: POLLTANT EMISSIONS AD EXTENT OF TnEATMENT
1981 1990
Ratio of waste gas treatment (%) 41 87
Emission of SO2 per ton steel (kg) 14 10
Emission of dust per ton steel (kg) 36 17
Ratio of wastewater treatment (%) 27 93
Recovery rate of iron bearing slurry (%) 81 93
Tree coverage rate of enterprises (%) 7 19
3.32 The main products of the sector are ten metals-aluminum, copper, lead,zinc, nickel, tin, antimony, mercury, magnesium, titanium-and their alloys in varioustypes of formed or shaped materials. Hundreds of other products and by-products are

- 34 -
produced in small quantities, made from elements such as tungsten, cobalt, molybdenum,bismuth, cadmium, rare earth metals and rare metals. The sector also produces sulphuricacid, cement and carbon products. China ranks sixth in the world for production ofnonferrous metals.
3.33 The present production capacity is about 3 million tons of metals per year.Those produced in the largest quantities are aluminum, copper, lead and zinc: together,these make up over 90 percent of the output of the ten metals and their manufacture takesabout 80 percent of the energy for the whole nonferrous industry. In 1990, 2.5 milliontons of nonferrous metals were produced, including 2.26 million tons of copper, aluminum,lead and zinc. Recent statistics are as follows:
1985 1989 1990 Capacity
Operating enterprises 747 894 917Construction, prospecting 73 56 54Universities, schools 125 172 186
Total 9S L1= 1M 1
Employment (millions) 1.26 1.35 1.37
Main products (million tons)Copper 0.413 0.562 0.559 0.60Aluminum 0.525 0.758 0.854 1.20Lead 0.225 0.302 0.297 0.40Zinc 0.306 0.451 0.552 0.55
lIotal 1 4A92 2LQ2 2.X2 2,75
Energy consumptions (106 TCE)For 4 major metals - - 14.91For 10 metals 13.63 17.52 18.14For entire sector - - 18.91
3.34 Aluminum is produced from bauxite by the Bayer process or by a sinteringprocess, or by a combination of the two. Chinese bauxite is usually the monohydrate type.The industry includes 65 smelters and aluminum oxide plants of which 12 major plants aresituated in the cities of Fushun, Zhengzhou, Guiyang, Lanzhou, Xinin and Baotou, in theNingxia Autonomous region and in Shanxi Province. Plant capacities vary from 30,000to 100,000 tpy electrolytic aluminum: almost all facilities were constructed in the 1950sand 1960s.

- 35 -
3.35 The copper industry is based mainly on the processing of sulphide orescontaining 0.5 to 2.0 percent copper. Operations include ore crushing and milling,followed by concentration in flotation processes to about 20-30 percent copper. Theconcentrates are dried, calcined or sintered in a variety of equipment to produce crudecopper, which is further refined by the electrolytic process. There are 120 mines andsmelters, of which 9 major plants are located in the cities of Baiyin, Tonglin, Shenyang,Kunming, Shanghai, and in the provinces of Hubei, Shanxi, Jiangxi and Guangdong.These have capacities from 20,000 to 70,000 tpy of copper. Most were built in the 1950sand 1960s and many have operated 30 years or more.
3.36 There are about 200 lead and zinc mines and smelters with capacities from10,000 to 16,000 tpy, most at least 25 years old. The main plants-about 16-are inZhuzhou, Shaogang, Shenyang, Baiyin, Jingxi and Changsha. The basic processes includesintering and smelting in blast furnaces.
3.37 Copper, aluminum, lead and zinc, and materials made from these metals,are sold mainly on the domestic market. For example, in 1990 only about 3 percentcopper, 8 percent aluminum, 15 percent lead and 10 percent zinc were exported althoughmuch of the production can meet the highest international specifications.
Energy Use
3.38 In 1990, the industry consumed in total 18.91 million TCE of which about13 million TCE or 70 percent were used by state-owned enterprises and 5.14 million TCEor 30 percent by local and TVE operations. For the 10 main metals, consumption was18.41 million TCE. The nonferrous sector consumes about 1.9 percent of the nationalenergy demand.
3.39 Energy use in 1990-including TVE plants-for manufacture of the 10 mainmetals and related products was as follows:
Elec. Coal Coke Oil Nat. gas Total109 10 103 103 10 10'
kWh t t t m3 TCE
10 major nonferrous metals 25.46 7,360 1,008 734 70.74 18.14of which: Copper 3.38 1,011 303 231 48.78 2.70
Aluminum 15.10 3,562 189 275 0.35 9.76Lead, zinc 0.21 1,320 311 46 0.00 2.18
Percent based on TCE Lg 56.7 29.0 5.4 5.8 0.5 100.0
La Other energy sources, not specified, 2.6 percent.

- 36 -
3.40 The 1990 energy consumption for the 10 metals may be broken down intothat used for national and local enterprises as follows:
Quantity 106 TCE Percent
National plants 13.00 71.7Local (TVEs) 5.14 28.3
.Bal 1824~IL 100Q
3.41 The total energy consumption is equivalent to 2.7 TCE per Y 10,000 outputvalue and 6.8 TCE per ton of nonferrous metal on average. The manufacture of one tonof nonferrous metal consumed on average 10,650 kWh of electricity, 3.08 tons of coal,0.42 tons of coke and 0.22 tons of oil. The highest energy consumption was for aluminummanufacture, mostly for smelting. For the manufacture of copper, mining operations took70 percent and smelter operation 30 percent. Further data on energy consumption from1980 to 1990 are given in Table 3.21.
Table 3.21: ENERGY CONSUMTON OF NoNFERRous ENMERPRLSES, 1980-90
1980 1985 1990Qty % Qty % Qty %
Whole Industry:Electricity 109 kWh 15.43 57.11 19.43 57.61 25.46 56.70Coal 103 t 4350 28.45 5302 27.78 7360 28.97Coke 103 t 576 5.12 900 6.41 1008 5.39Fuel oil 103 t 530 6.93 731 7.66 734 5.78Natural gas 106 m3 36.0 0.44 32.7 0.32 70.74 0.51Others 1.95 0.22 2.65
a 10TCE 10 92 100 0 136 100 ILL4 10 of which:
Consumption bystate-ownedenterprises 10' TCE 7.90 72.37 10.10 74.12 13.00 71.66
Consumption bylocal ent. 106 TCE 3.02 27.63 3.53 25.88 5.14 28.34

- 37 -
3.42 Estimates of the end uses of energy were made for 1990 operations and theseare shown in Table 3.22. About half the coal was used for electricity generation and60 percent of the electricity for electrolysis.
3.43 With respect to process energy use, several major technologies are appliedin this sector. For example, the production of copper consists of three basicstages-primary smelting, refining and electrolysis. The second and third stages are muchthe same for all plants but the first stage may be carried out in a blast furnace, an electricfurnace, a flash furnace or a reverberatory furnace, with quite different energyconsumptions (see Table 3.23). The production processes for the other major metals arealso quite diverse: some typical energy consumption data are given in Table 3.24.
3.44 With respect to coal supplies, about one seventh of energy is purchased ata negotiated market price and the remainder at the price set by the plan (which is aboutY 50 per ton less expensive). About 90 percent of the coke demand is supplied by the planat a price Y 80 to 100 cheaper than the open market price. In 1990, about 80 percent ofoil needs were supplied on the plan at Y 150/t, and the remaining 20 percent waspurchased at Y 320 to 350/t above that.
Energy Efficiency
3.45 The energy efficiency of nonferrous metal manufacture is not as good inChina as in many advanced countries for various reasons, including:
(a) Relatively poor resources and lower ore grades result in additional energyconsumption in mining and processing.
(b) Backward production technologies and equipment require higher energyinputs.
(c) In recent years, funds for capital investment and technical transformationhave been used primarily to increase production, with relatively little usedfor energy saving investments.
(d) Some processing plants carrying out trial production runs-either as newplants or after technical modifications-consume more than normalquantities of energy.
3.46 Information on the efficiency of major items of equipment was collected for1990 operations and is presented in Table 3.25 for boilers and gas generators and Table3.23 for furnaces and kilns. The combustion efficiency of the smallest boilers was50 percent and of the largest 85 percent. Furnace efficiencies are often quite low andsuggest potential for improvement through modernization and replacement of the oldest andleast efficient items.

- 38 -
Table 3.22: END USES OF MAJOR ENERGY SOURCES, 1990
Unit Quantity Percent
Coal:Electricity generation, gas supply 106 t 3.50 48.0Fuel and reductant 106 t 3.20 43.0Gas generation 106 t 0.50 6.8Other uses 106 t 0.16 2.2
Tot 106 t
Coke:Fuel and reductant 106 t 0.85 85.0Gas generation 106 t 0.15 15.0
TS19i 106t t00
Fuel oilFuel and reductant 106 t 0.47 88.0Boiler fuel 106 t 0.06 12.0
Total 106t 0.53 1t0
Electricity:Electrolysis of aluminum, copper, lead, zinc 109 kWh 14.6 57.5Electric furnaces, heating 109 kWh 1.2 4.7Motor drives 109 kWh 8.0 31.5Other 109 kWh 1.6 6.3
iQa1 109 kWh 21A 10
Steam:Electricity generation, steam supply 106 t 13.50 60.0Heating industrial buildings 106 t 2.00 8.9Metallurgical processes 106 t 15.70 69.8
Tota La IV t 22 010
Lg Note that steam for electricity generation and steam used for production processesare partially double-counted, thus the total do not add to 100 percent.

- 39 -
Table 3.23: TYPICAL FURNACES AN KILNS AN THER EmCINCY
No. Equipment Size and capacity Piece Heat efficiency(%)
1. Aluminum electrolytic cell Prebaked & top or sideconduct. Baked
2. Copper electrolytic cell 7,0003. Lead electrolytic cell 9,0004. Zinc electrolytic cell5. Sintering machine 20 to 100 m2 96. Boiling furnace 2.5 to42 ml 30 45 to 507. Copper blast furnace 5.3 to 12.6 m2 9 50 to 558. Copper reverberatory furnace 12 to 270 ml 15 15 to 25/a
25 to 30/b
9. Copper, nickel, and tin converter S to 50 t 35 35 to 5010. Lead blast furnace 2.5 to 8m 2 5 50 to 5511. Lead & zinc closed blast furnace YS2010 2 70
12. Copper & nickel smelting electricfumace 12,000 to 30,000 kVA 6 60 to 70
13. Concentrate calcining kiln $1.6 to 2.6 m 19 55 to 6514. Slag volatilizing kiln $l.5 to 2.4 m 8 2015. Aluminum oxide grog kiln $3.6 to 4.5 m 17 60 to 6516. Aluminum oxide calcining kiln $2.6 to 4.0 m 15 50 to 5517. Cement kiln $1.5 to 4.5 m 35 6018. Lime kiln 3.0 to 4.0 m 8 75 to 8019. Carbon. element calcining furnace 12 to 24 chambers 12
20. Carbon. element rotary kiln $2.0 to 2.5 m 421. Zinc distilling furnace 24 35 to4022. Zinc rectifying funace 21 35 to 45
/a Refining./b Smelting.
Energy Efficiency Trends
3.47 Efforts have been made since the early 1980s to reduce energy consumptionby process renovation, equipment modernization and the utilization of new technologies.In the mining area, improved methods and equipment have been adopted and large-scalemining in open pits is used in several new mines. Other changes include the use ofelectricity in place of compressed air for underground drilling, and using more efficientvehicles for underground mining and transportation. Crushing and milling operations havebeen improved also, modified flotation cells are used for ore concentration, and autopress

- 40 -
Table 3.24: SPECIC ENERGY CONSUM ONS FOR SELECTED PROCESSES
No. Tech. name of products Unit 1980 1985 1990
1. Aluminum oxide produced by caulking TCElt - 1.60 2.002. Aluminum oxide produced by
combination process TCE/t - 1.26 1.503. Aluminum oxide produced by byaer
method TCE/t - - 0.904. Electrolytic aluminum produced in
precalcining cell DC kWh/t - - 14,4505. Electrolytic aluminum produced
in upper insert cell DC kWh/t - - -15,8006. Electrolytic aluminum produced
in side insert cell DC kWh/t - - 14,8507. Crude copper from flash furnace TCElt - - 0.788. Crude copper from electric furnace TCElt - - 0.989. Crude copper from blast furnace TCElt - - 1.26
10. Crude copper from reverberatoryfurnace TCE/t - - 1.30
11. Lead from sintering blast furnace TCE/t - - 0.8012. Lead from closed blast furnace TCElt - - 0.8413. Zinc from closed blast furnace TCE/t - - 0.4514. Zinc produced by hydrometallurgical
proc. TCE/t - - 2.2215. Zinc from vertical retort. TCEJt - - 2.70
filters used instead of vacuum filters to remove water from concentrates before furtherprocessing. As a result, energy consumption per ton of contained copper in copperconcentrates has dropped from 5.8 TCE/t in 1980 to 4.0 TCE/t in 1990 in spite of thegradual decrease in ore grade and deeper mining.
3.48 For copper smelting, various measures have been adopted. These includemodem flash furnaces, adding oxygen rich air blowing to older furnaces to increasecapacity and reduce coke rate, utilizing waste heat from high temperature combustion gasesof reverberatory furnaces to raise steam for electricity generation, and reforming the designof such furnaces and adding automatic controls to reduce energy consumption by about50 percent. Consumption in copper smelting has dropped from 2.4 to 1.95 TCE/t from1980 to 1990.
3.49 In the processing of aluminum, aluminum oxide plants have been renovated,calcining dilns modified, the silicon removal process impmved and flash calcining adoptedin place of rotary lilns. Statistics on the energy consumption of the industry indicate an
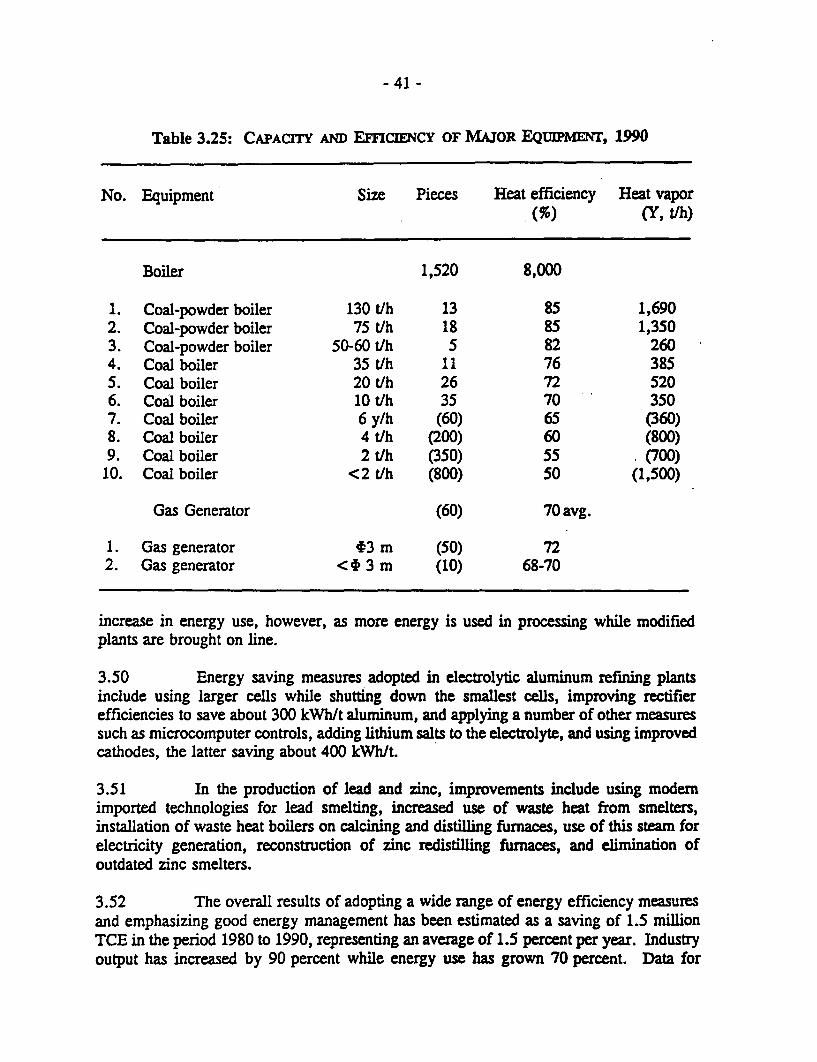
- 41 -
Table 3.25: CAPACITY AND Em[CENCY OF MAJOR EQUIPMENT, 1990
No. Equipment Size Pieces Heat efficiency Heat vapor(%) (Y, t/h)
Boiler 1,520 8,000
1. Coal-powder boiler 130 t/h 13 85 1,6902. Coal-powder boiler 75 t/h 18 85 1,3503. Coal-powder boiler 50-60 t/h 5 82 2604. Coal boiler 35 t/h 11 76 3855. Coal boiler 20 t/h 26 72 5206. Coal boiler 10 t/h 35 70 3507. Coal boiler 6 y/h (60) 65 (360)8. Coal boiler 4 t/h (200) 60 (800)9. Coal boiler 2 tlh (350) 55 (700)
10. Coal boiler <2 t/h (800) 50 (1,500)
Gas Generator (60) 70 avg.
1. Gas generator t3 m (50) 722. Gas generator <4 3 m (10) 68-70
increase in energy use, however, as more energy is used in processing while modifiedplants are brought on line.
3.50 Energy saving measures adopted in electrolytic aluminum refining plantsinclude using larger cells while shutting down the smallest cells, improving rectifierefficiencies to save about 300 kWh/t aluminum, and applying a number of other measuressuch as microcomputer controls, adding lithium salts to the electrolyte, and using improvedcathodes, the latter saving about 400 kWhlt.
3.51 In the production of lead and zinc, improvements include using modernimported technologies for lead smelting, increased use of waste heat from smelters,installation of waste heat boilers on calcining and distlling furnaces, use of this steam forelectricity generation, reconstruction of zinc redisdlling furnaces, and elimination ofoutdated zinc smelters.
3.52 The overall results of adopting a wide range of energy efficiency measuresand emphasizing good energy management has been estimated as a saving of 1.5 millionTCE in the period 1980 to 1990, representing an average of 1.5 percent per year. Industryoutput has increased by 90 percent while energy use has grown 70 percent. Data for

- 42 -
operations from 1980 to 1990 indicate relative energy consumptions and trends in unitenergy use:
(TCE/t metal) 1980 1985 1990
Average unit consumption for 10 metals 7.26 6.65 6.80Manufacture of aluminum oxide - 1.61 1.95LaAluminum ingot - 7.34 7.20Copper smelting 2.40 2.10 1.90Lead smelting -- 0.80Zinc smelting 2.80
La Energy consumption raised due to switch to oil from coal and non standardoperations.
Potential for Improvement
3.53 Technological changes in nonferrous metal processing and increased demandwill result in many new plants being built and old plants modernized. With respect to thecopper industry, about 550,000 tons were produced in 1990, consuming 1.1 TCE/t, outof a capacity of 600,000 tpy crude copper. By 2000, it is expected that capacity will haverisen to between 750 and 850,000 tpy. The total capacity of flash smelting will be doublethat of 1990 and the capacity of new and rebuilt bath smelters will be 450,000 tpy.Electric furnace capacity will be maintained but blast furnace capacity reduced to 15,000tpy. The overall energy consumption is expected to fall to 0.8 TCE/t of copper. By 2010,capacity should be 950,000 tpy and energy consumption say 0.6 TCE/t.
3.54 With respect to lead, capacity in 1990 was about 400,000 tpy although actualproduction was only 297,000 tons with an average consumption of 0.8 TCE/t of crudelead. By 2000, it is expected that capacity will be 600,000 tpy. The main purpose ofplant modernization will be to improve environmental conditions rather than save energy.Energy consumption is expected to drop to about 0.6 TCE/t. By 2010, capacity shouldreach 750,000 tpy and energy consumption 0.5 TCE/t.
3.55 Zinc smelting capacity in 1990 was about 550,000 tpy and output was equalto this: energy consumption was 2.5 TCE/t. By 2000, capacity is expected to be 800,000tpy. The modern ISP technology is expected to rise from 70,000 to 150,000 tpy capacity.Vertical vat smelting capacity will remain at 180,000 tpy and hydrometallurgical processcapacity will rise from 300,000 to 500,000 tpy. Energy consumption per ton of refinedzinc should be reduced by about 20 percent. By 2010, capacity should reach 1,240,000tpy and energy consumption 1.8 TCE/t.
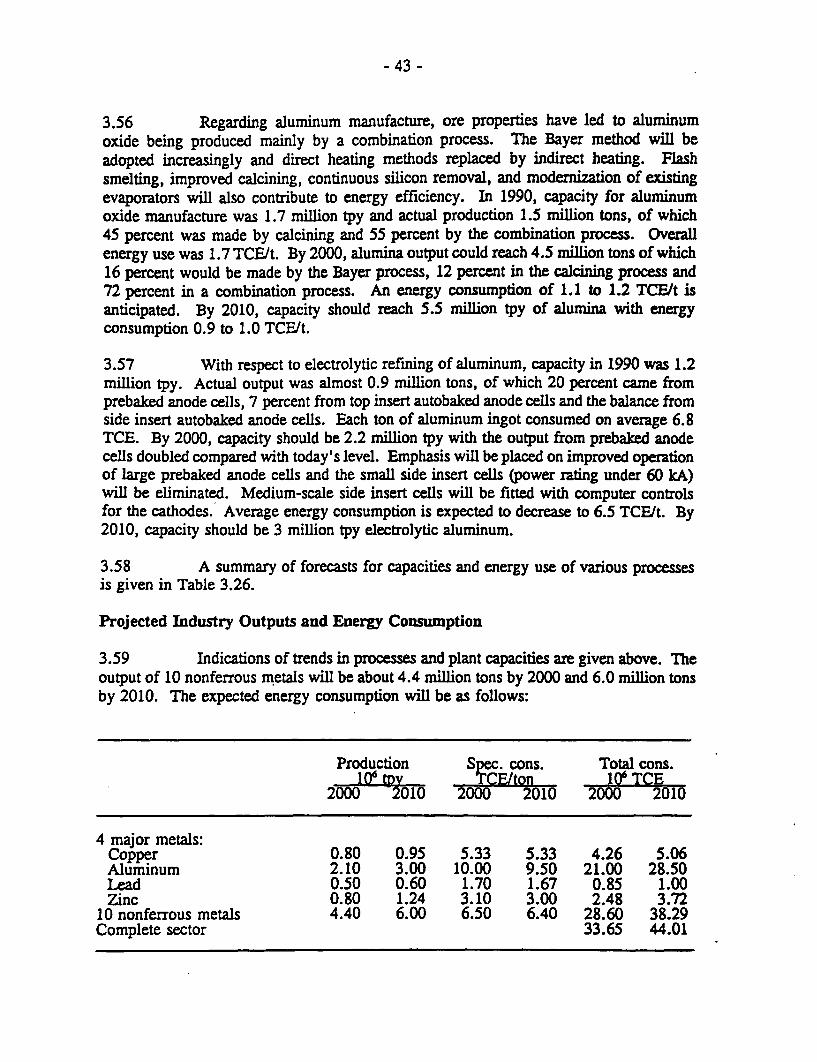
- 43 -
3.56 Regarding aluminum manufacture, ore properties have led to aluminumoxide being produced mainly by a combination process. The Bayer method will beadopted increasingly and direct heating methods replaced by indirect heating. Flashsmelting, improved calcining, continuous silicon removal, and modernization of existingevaporators will also contribute to energy efficiency. In 1990, capacity for aluminumoxide manufacture was 1.7 million tpy and actual production 1.5 million tons, of which45 percent was made by calcining and 55 percent by the combination process. Overallenergy use was 1.7 TCE/t. By 2000, alumina output could reach 4.5 million tons of which16 percent would be made by the Bayer process, 12 percent in the calcining process and72 percent in a combination process. An energy consumption of 1.1 to 1.2 TCE/t isanticipated. By 2010, capacity should reach 5.5 million tpy of alumina with energyconsumption 0.9 to 1.0 TCE/t.
3.57 With respect to electrolytic refining of aluminum, capacity in 1990 was 1.2million tpy. Actual output was almost 0.9 million tons, of which 20 percent came fromprebaked anode cells, 7 percent from top insert autobaked anode cells and the balance fromside insert autobaked anode cells. Each ton of aluminum ingot consumed on average 6.8TCE. By 2000, capacity should be 2.2 million tpy with the output from prebaked anodecells doubled compared with today's level. Emphasis will be placed on improved operationof large prebaked anode cells and the small side insert cells (power rating under 60 kA)will be eliminated. Medium-scale side insert cells will be fitted with computer controlsfor the cathodes. Average energy consumption is expected to decrease to 6.5 TCElt. By2010, capacity should be 3 million tpy electrolytic aluminum.
3.58 A summary of forecasts for capacities and energy use of various processesis given in Table 3.26.
Projected Industry Outputs and Energy Consumption
3.59 Indications of trends in processes and plant capacities are given above. Theoutput of 10 nonferrous metals will be about 4.4 million tons by 2000 and 6.0 million tonsby 2010. The expected energy consumption will be as follows:
Production Spec. cons. Total cons.10, tov -TCH/ton 10 TCE
2000 -2010 2000 2010 2000
4 major metals:Copper 0.80 0.95 5.33 5.33 4.26 5.06Aluminum 2.10 3.00 10.00 9.50 21.00 28.50Lead 0.50 0.60 1.70 1.67 0.85 1.00Zinc 0.80 1.24 3.10 3.00 2.48 3.72
10 nonferrous metals 4.40 6.00 6.50 6.40 28.60 38.29Complete sector 33.65 44.01

- 44 -
Table 3.26: FORECASrS OF PROCESS CAPACrrIES AND SPECEFIC ENERGYCONSumpTONS FOR COPPER, ALUMUM, IEAD AND ZINC PRODUCTION
No. Process 1,980 1985 1990Capac. Energy Capac. Energy Capac. Energy
consump. consump. consump.104 t TCE/t 104 t TCE/t 104 t TCE/t
Cu. Smelt1. Flash furnace 9.00 0.76 30.00 0.60 30.0 0.502. Bath smelting 0.00 - 45.00 0.70 45.0 0.803. Elect. furnace 7.00 0.98 7.00 0.95 7.0 0.854. Blast furnace 12.50 0.90 1.50 0.90 1.5 0.30
Lead Smelting1. Blast furnace 38.50 0.78 23.00 0.70 23.0 0.602. I.S.P. 4.20 0.84 8.00 0.70 8.0 0.603. Q.S.L. - 23.00 0.55 25.0 0.50
S.K.S
Zinc Smelting1. Wet-smelting 30.00 2.22 50.00 2.00 50.0 1.802. I.S.P. 7.00 2.45 15.00 2.00 21.0 1.803. Vertical retort 22.00 2.67 18.00 2.20 20.0 2.00
Aluminum Oxide1. Bayer - - 70.00 0.70 90.0 0.602. Sintering 70.00 2.00 60.00 1.60 70.0 1.553. Combination &
connection 80.00 1.50 320.00 1.10 400.0 0.98
Aluminum Electrolysis1. Upper-insert cell 6.00 7.00 3.00 6.80 8.0 6.352. Precalcining cell 19.00 8.52 100.00 6.20 100.0 5.853. Side-insert cell 60.00 6.80 93.00 6.50 120.0 5.85
3.60 The projected breakdown of energy consumptions for manufacture of the 10metals is as follows:

- 45 -
Unit 1990 2000 2010
Coal 103 t 7,360 11,200 15,900Coke 103 t 1,008 1,260 2,100Electricity 109 kWh 25.46 42.30 59.40Fuel oil 10' t 734 800 1,200Natural gas 106 m 70.74 11.42 16.20Petroleum coke 103 t 0 670 1,030Other 103 t 200 340 500
Total 106 TCE IL4 2L8 6L22
Generic Investment Options
3.61 A measure contributing to energy efficiency which has good replicationpotential in the aluminum industry is the renovation of alumina sintering kilns (Case StudyM5). This involves replacing old inefficient kilns with a modem flash drying andpreheater kiln process, saving energy and increasing plant capacity. Actual plant data forthis measure were obtained from the Shandong Aluminum Works. The internal rate ofreturn was calculated to be 84.3 percent and the payback three years.
3.62 Based on the existing plant capacity in the industry of 6 million tpy whichis considered to be appropriate for renovation in a similar manner, the following forecastswere made for "business as usual" and "accelerated" scenarios:
M5 aluminum plant renovation 1990 2000 2010(million tpy alumina)
BAU Unmodernized capacity 6.0 4.0 0.0Renovated capacity 0.0 2.0 6.0
Accel. Unmodernized capacity 6.0 3.0 0.0Renovated capacity 0.0 3.0 6.0
3.63 Details of the assumptions made regarding future renovation of aluminumplants, together with energy consumption and emissions factors for both unmodernized andrenovated plants, are given in Appendix A of this report.

- 46 -
Projected hnpacts on Energy and Emissions
3.64 The expected impacts of aluminum plant renovation on the nonferrous sectorenergy use and emissions were calculated as follows:
103 TCE/vl by 2Q0 103TCE/yr by 2010BAU Accel. BAU Accel.
Energy savings 330 494 989 989
103 tlyr by 200 103 t/yv by 2010BAU Accel. BAU Accel
Reductions in CO2 emissions 167 250 500 500
Emissions
3.65 The nonferrous metals sector includes many processes in which pollutantemissions occur, with the production of solid and liquid wastes and the release ofatmospheric discharges, both dust and smoke. Because of the toxic nature of many of themetals and their compounds, emissions are always potentially hazardous. Data on typicalemissions are given in Table 3.27.
3.66 Various measures have been taken to reduce pollution, so that emissions arenow only slightly higher than in 1982 although annual output has doubled from 1.2 tonearly 2.4 million tons. These measures include the following:
(a) Laws and Regulations. Several major regulations have been introducedsince 1984.
(b) Personnel. The numbers of environmental protection organizations andtheir staffing levels have been increased. These organizations areresponsible for environmental management, monitoring and scientificstudies.
(c) Treatment of Sulphur Dioxide. Increased quantities of sulphuric acid arenow made from waste gases, resulting in the S52 emissions being held to1982 levels. Several large acid production units have been commissioned,e.g., Jinchun Nickel Corp., Yunnan Smelting Co., Huludao Zinc Plant,Guixi smelting plant.
(d) Fluorides. Efforts have been made to reduce emissions of fluoride gasesfrom aluminum electrolysis operations. Cleaning processes and equipmenthave been installed at plants in Guizhou, Qinghai, Baiyin, Lanzhou,Qingtongxia, Shandong and Liangchen. Annual discharges of fluorides have

- 47 -
Table 3.27: PoLLuTANT DISCEARGES FROM TYPICAL PROCEssEs
Differencesfrom the
inter. advanc.No. Tech. name of products Measure unit 1980 1985 1990 level
1. Aluminum oxide productsby calcining
2. Aluminum oxide productsby series process
3. Aluminum oxide productionsby bayer process
4. Aluminum reduction inprebaked anode cell kg F/t Al 7.43 - 2.5-2.7 1
5. Aluminum reduction in top-electroconductive auto-baked anode cell kg F/t Al 20 20.00 20.00
6. Aluminum reduction in side-electroconductive auto-baked anode cell kg F/t Al 14.5 14.86 15-20
7. Copper smelting in flashfurnace kg S0 2/t Cu - - 36.86 100-50 (ppm)
8. Copper smelting in elec-tric furmace kg S02/t Cu 705 620 243.10 1
9. Copper smelting in blastfurnace kg SQ2/t Cu 11,457 12,870 830
10. Copper smelting in closedblast furnace kg SO2 t Cu 9,211 8,245 10,422
11. Lead sintering & smeltingin blast furnace kg S02/t Pb 266 112 110
12. Lead smelting in closedblast furnace kg S0 2/t Pb 32 31.8 30.66
13. Zinc smelting in verticalretort kg S0 2/t Cu 38 31.89 30.00
14. Zinc wet smelting kg S02/t Cu 230 222.87 200
been reduced by about half.
(e) Wastewater. Reuse ratios have been increased from about 50 to 66 percentand discharges cleaned by the installation of new treatment plants. Waterdischarges meeting national standards are now up to 70 percent.
(f) Particulates. Emissions are still high and only 93 percent of dischargesnow meet required standards. Further investment in cleaning equipment isnecessary.

- 48 -
(g) Solid Wastes. These are a serious problem and consist of about 60 milliontons annually of a wide variety of materials such as tailings, red mud, slags,coal dust and ashes. Only about 8 percent is utilized.
(h) Restoration of Tailings Reservoirs. These contain about 1 billion tons ofmine tailings and occupy over 8,000 hectares in addition to 400 hectares ofagricultural land. The size is increasing each year. At ten enterprises,restoration has begun with planting and sowing, and some reuse of land foragriculture has been achieved-e.g., at Zhongtiaoshan mines, Xiaoguanbauxite mine, Yangjiazhangzi mines, Hongtoushan copper mines, Yunnantin mines, and Xihuachan and Pangushan tungsten mines.
3.67 Overall, in the five years from 1985 to 1990, Y 660 million were spent on2,743 environmental protection projects, including 888 relating to wastewater, 817 togaseous emissions, 256 to waste slags, 282 to noise suppression, and 300 to a variety ofother items.
3.68 In the next few years, even greater efforts will be needed to reduce pollutantemissions and clean up contaminated areas. Specific projects have been identified forcompletion but many are behind schedule, mainly due to lack of funds. These projects andmany other smaller-scale measures should bring discharges of all the main pollutants,excluding fluoride-containing gases of some aluminum plants, under good control by 1995.Although industry output is increasing, the quantities of pollutants should remain about thesame. By 2000, further pollutant control will be established and it is expected that at least90 percent of emissions will reach national standards.
C. BULDING MATERIAS
Industry Profile and Products
3.69 The building material subsector includes manufacture of constructionmaterials, nonmetallic mineral products and inorganic materials. The sector covers overone thousand products, made by more than 63,000 enterprises (both state and collectivelyowned, but excluding rural enterprises) employing around 10 million personnel, with atotal output value of Y 97 billion. There are about 400 large-scale key enterprises.
3.70 The main products of the industry are cement, flat glass, ceramics, bricks,tiles and lime. China has become the largest producer in the world of most of theseproducts. Processes include sintering, firing and drying in kilns or furnaces, in which fuelconsumption is often high and emissions of CO2 and other pollutants are large. Productionquantities in 1990 and 1991 were as follows:

- 49 -
1990 1991
Cement 106 tons 209.70 252.61Flat glass 106 cases La 80.67 87.12Sanitary ware 106 pieces L2 k 18.90Floor and wall tiles 106 m2 2.27Bricks 109 pieces L 448.50 456.00Roofing tiles 109 pieces a 48.20 49.40Lime 106 tons 93.79 106.78
La 1 case = 50 kg.L 1 piece = 9 to 9.5 kg.L 1 standard brick is 240 x 115 x 53 mm.L 1 standard tile is 400 x 240 mm, thickness 10-17 mm.
3.71 With respect to cement, current capacity is 294 million tpy: the productionof 252.6 million tons in 1991 puts China into first place in the world. Cement plants maybe divided into two categories-large/medium-size cement plants and small-scale plantsserving localized markets. There are 68 enterprises with large/medium-scaleplants-average output 535,000 tpy-all using rotary Iilns (total 208, of which 108 use thewet process) and with a total output of 36.8 million tons in 1990. Medium and small-scaleplants down to county level-average output 62,000 tpy-produced 130 million tons andsmall-scale rural plants (TVEs, average output 13,000 tpy) contributed about 43 milliontons.
3.72 Large/medium-scale plants use a variety of different technologies. Someplants have the latest precalciner systems, while others are still using the technologies ofthe 1920s or 1930s. For example, of the large/medium-size state-owned plants, 29 werebuilt before 1950 and most of these have undergone renovation and reform since 1986.In terms of production methods, the following breakdown has been estimated:

- 50 -
Percent of Average fuel usecapacity La kgCE/t clinker
Total clinker production 100 190
Rotary kilns 29 199of which, wet process 11 210Lepol kilns 2.5 160dry process 16.5 185
of which, precalciner 4.5 105standard dry process 4 285with waste heat boiler 3 180with cyclone preheater 2.5 120with shaft preheater 2 138
Shaft kilns 71 186of which, mechanized 60 165ordinary shaft kilns 11 250indigenous kilns 1 330
La Some minor discrepancies due to rounding.
3.73 Some of the precalciner kilns have only recently been commissioned andtheir output remains under fuU capacity. There are 16 production lines and their outputwas 8.44 million tons in 1990.
3.74 There are over 5,000 small-scale cement plants of which 400 are using smallrotary kilns and the remainder use vertical shaft kilns. As indicated above, most cementis made in shaft kilns. Of the small-scale enterprises, around 3,000 use mechanized shaftkilns but almost 2,000 enterprises still use backward types of shaft kiln with no guaranteeof cement quality and whose energy consumption is often high. These kldns are expectedto be eliminated eventually but will remain an important means of production for manyyears.
3.75 With respect to flat glass, there are more than 130 fumaces with a capacityof 99.25 million cases. Within these, there are 23 float glass production lines, makingabout 40 percent of the glass output. Of the actual production of 80.67 million cases in1990, 71.65 million were manufactured by large and medium-scale enterprises, almost 90percent of the national output. There are three main production technologies employed:float glass, vertical draw and horizontal draw fumaces. Current production (1991) ispredominantly from the first two types:

Type of Number of Est. output Typicalfumace fumaces mill. cases size tons
Float 23 32.3 (40%) 300-700Vertical 71 40.3 (50%) <300Horizontal 42 8.1 (10%) small
3.76 The float glass fumaces were built mostly in the late 1970s and achieve highquality production, while the vertical draw fumaces date from the 1950s and quality islower. The horizontal draw furnaces are at a much lower technical level and are quitesmall: quality is often poor.
3.77 The ceramics categories include sanitary ware, floor and wall tiles. In 1991,there were 18.9 million pieces of sanitary ware made with a total weight of 0.17 milliontons. Tile production was 1.23 million m2 of glazed wall tiles and 1.04 million M2 of floortiles, making the total output 2.77 million in2, the largest in the world. Currently there areover 1,000 continuous firing kilns in 797 ceramics enterprises in China, of which 13 areconsidered key enterprises with an output of 3.4 million pieces of sanitary ware,0.1 million m2 of glazed wall tiles and 0.035 million rn2 of floor tiles. The larger plantsuse tunnel and roller hearth kilns. Most of the remaining production is carried out in over800 kilns by small-scale enterprises with older equipment. Product quality variesconsiderably, with the newer larger plants producing higher quality items for hotelconstruction, for example, and for export. Production from the large number of small-scale enterprises is often poor quality and is tolerated in the marketplace as demand is sohigh.
3.78 The clay brick and tile industries represent about one quarter of the totaloutput value and 40 percent of the energy consumption of the building materials sector.In 1990, the production of bricks reached 448.5 billion standard bricks and of roofing tiles,48.2 billion pieces. Brick production was divided as follows:
3.79 This shows that brick production is dominated by the TVEs. Most of theseoperate small plants, although plant size is increasing and a number of brick kilns withcapacity over 50 million bricks per year are now operated by TVEs. Tile production isalso dominated by the TVEs who represent over 90 percent of the national output. In1990, about 4.6 billion tiles were made by state-owned plants. In the clay brick and tileindustry, the competition provided by TVE plants is particularly strong,assisted by suchfactors as the following:
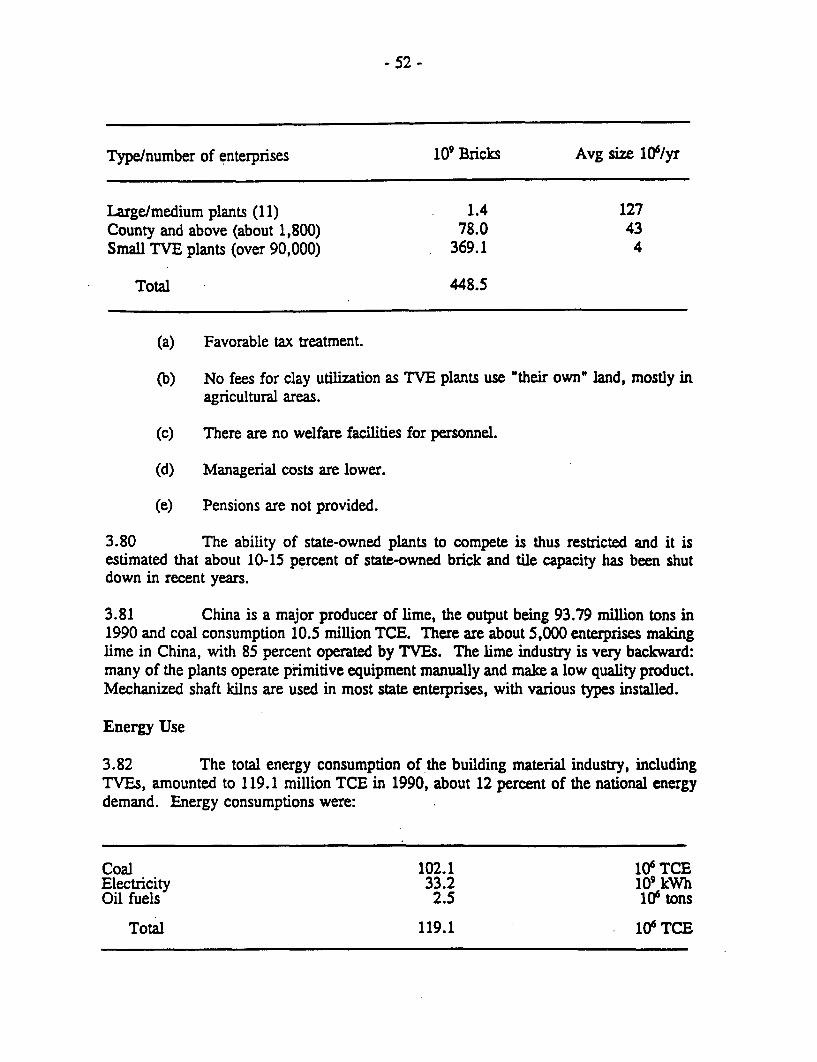
- 52 -
Type/number of enterprises 109 Bricks Avg size 106/yr
Large/medium plants (11) 1.4 127County and above (about 1,800) 78.0 43Small TVE plants (over 90,000) 369.1 4
Total 448.5
(a) Favorable tax treatment.
(b) No fees for clay utilization as TVE plants use 'their own" land, mostly inagricultural areas.
(c) There are no welfare facilities for personnel.
(d) Managerial costs are lower.
(e) Pensions are not provided.
3.80 The ability of state-owned plants to compete is thus restricted and it isestimated that about 10-15 percent of state-owned brick and tile capacity has been shutdown in recent years.
3.81 China is a major producer of lime, the output being 93.79 million tons in1990 and coal consumption 10.5 million TCE. There are about 5,000 enterprises malinglime in China, with 85 percent operated by TVEs. The lime industry is very backward:many of the plants operate primitive equipment manually and make a low quality product.Mechanized shaft kilns are used in most state enterprises, with various types installed.
Energy Use
3.82 The total energy consumption of the building material industry, includingTVEs, amounted to 119.1 million TCE in 1990, about 12 percent of the national energydemand. Energy consumptions were:
Coal 102.1 106 TCEElectricity 33.2 109 kWhOil fuels 2.5 10' tons
Total 119.1 106 TCE

- 53 -
A small amount of natural gas is also used but no consumption data are available.Including related activities, energy consumption for producing building materials was122.91 million TCE.
3.83 Energy consumptions for different types of product were as follows:
Energy use, 106 TCE Percent
Bricks, tiles 54-37 45-7Cement 40.71 34.2Lime 10.48 8.8Flat glass 3.13 2.6All other 10.41 8.7
Total 119.10 100.0
Specific Energy Consumption
Cement
3.84 Although there are some modern cement kilns operating at high efficiencyin China, the typical energy efficiencies of manufacturing processes lag behind comparableplants in advanced countries. For example, the following figures may be quoted:
Domestic industry Typical foreignenergy use plant energy use
kgCE/t clinker kgCE/t clinker
Wet process kiln 180-230 180Dry process kiln 140-180 115Preheater kiln 110-165 105Precalciner kiln 100-125 100Vertical shaft kiln 100-250 98
3.85 The average fuel consumption for the cement industry in 1990 was almost190 kgCE/t of clinker produced: the average electricity consumption is 99 kWhlt cement.

- 54 -
Flat Glass
3.86 The specific energy consumptions of the three main categories of glassfurnace vary considerably between enterprises, with large plants usually more efficient thansmall ones. The float glass process is more energy efficient, typically consuming fuels andelectricity equivalent to about 29 kg standard coal per case (0.58 TCE/t), large verticalfurnaces about 33 kg (0.66 TCE/t), small vertical furnaces about 40 kg (0.8 TCE/t), andhorizontal furnaces around 50 kg (1 TCEtt). In general terms, the energy consumption formanufacture of flat glass in China is about twice the level for advanced foreign countries,partly due to the small scale and also to the age of equipment and backward technologyemployed.
Ceramics
3.87 The ceramic industries consumed 3.74 million TCE in 1991 (almost 3percent of the building materials sector). Specific energy consumption amounts to 1.8TCE/t for sanitary ware. For glazed tiles, energy consumption is 12.5 kgCE/m2 and forfloor tiles, 10.5 kgCE/m2. These figures are high compared with advanced countries,especially for tiles where the consumption is often at levels of 2-3 kgCE/m2.
Clay Bricks and Tiles
3.88 The larger state-owned enterprises mostly use tunnel kilns and Hoffman typeannular kilns, with energy consumptions in the region of 0.8 to 1 TCE per 10,000 bricks.Most plants operate continuously over a long time. Some tunnel kilns operate with fullartificial drying, utilizing waste heat from the kiln combustion gases together with a smallamount of supplementary firing. The smaller TVE plants also reach energy consumptionfigures of about 1 TCE/10,000 bricks, operating annular or Hoffman type brick kilnswhich are in almost universal use in the countryside.
3.89 Currently, many brick plants mix coal ash or coal dust with the rawmaterials before firing. In the brick kiln, the energy is released through "internal firing",reducing the amount of fuel added to the kiln separately. In extreme cases, there is noneed to fire any coal separately and all the energy can be derived from wastes and lowgrade coals. More often, the amount of high grade coal fired in the kiln is reduced to say200-300 kgCE/10,000 bricks.
Lime
3.90 The lime industry in China remains relatively backward and energyefficiency is low. Typical coal use by small and old kilns is 180 kgCE/ton, and bymechanized shaft kilns say 135 kgCE/ton. As the basic process is simple, energy costs area high proportion of total costs, around 50-60 percent, with large kilns usually the mostefficient. There are mechanical vertical kilns with capacities of 30, 60, 90, 125 and 200tpd in common use in the industry.

- 55 -
Energy Efficiency Trends
3.91 Data indicating trends in energy consumption for the building materialindustry are given in Table 3.28. These show an overall decrease in energy use amountingto about 3 percent per year from 1980 to 1990. The estimated saving in energy useamounts to almost 27 million TCE over the period 1980 to 1990 and this has been achievedby a wide range of measures in each part of the industry, such as better management,waste heat recovery, and adoption of more up to date equipment.
3.92 Energy consumption for cement manufacture has improved steadily. Figuresfor total energy consumption, including electricity, for the last 10 years are as follows:
kgCE/t/t-clinker1980 208.81981 206.01982 206.91983 204.81984 211.31985 208.11986 207.61987 202.31988 199.81989 200.41990 189.9
Table 3.28: HIsTroracAL DATA ON ENERGY CONSUM ON DATA FOR T1BUVIING MATERIAS INDUSTRY
TCE per 10,000 Energy saving Estimated energyyuan output % per year saving, 106 TCE
1980 27.26 - -1981 26.09 4.29 2.281982 26.20 0.42 0.251983 24.87 5.08 3.261984 25.41 -2.17 -1.551985 23.87 6.06 5.401986 24.08 -0.92 -0.881987 23.04 4.36 4.691988 22.89 2.82 3.381989 21.42 4.33 5.391990 21.23 0.88 4.38
Note: Data calculated on the basis of constant 1980 yuan.

- 56 -
3.93 These results have been achieved in a number of ways. Low efficiencyplants have been shut down: for example, over 1,100 small-scale plants were closed after1980. More use has been made of higher efficiency imported technology, such as dryprocess precalciner equipment from Japan, roller mills from Germany, raw mealhomogenization equipment from Germany and Denmark, and grate coolers from the USA.
3.94 Energy efficiency data for the manufacture of flat glass show littleimprovement has been achieved since 1980:
Unit energv consumptionYear kgCE/case TCE/ton
1980 32.1 0.6421981 32.2 0.6441982 32.1 0.6421983 31.5 0.6301984 31.9 0.6381985 32.9 0.6581986 33.1 0.6621987 35.4 0.7081988 34.5 0.6901989 31.4 0.6281990 31.5 0.630
3.95 In the clay brick and tile industries, there has been a steady improvementin the energy use per unit of output. The performance of state-owned brick enterprises hasshown a steady improvement as follows:
Coal consumptionkgCE110,000 bricks
1983 1,1801984 1,1001985 9551986 9911987 9331988 7891989 8341990 850

- 57 -
Potential for Improvement
Cement
3.96 The main type of kiln in use in large/medium-scale plants is the wet processkiln, of which there are about 108 (half the number of kilns in large/medium-size plants).Some of these were built in the 1940s but remain in operation. The wet process consumesmore energy than the basic dry process, which itself has been improved by preheater andprecalciner technologies. There is therefore a large potential for saving energy althoughthe capital investment needed to upgrade cement manufacturing facilities will besubstantial. There are four types of action needed:
(a) New installations, involving the replacement of old wet process kilns bypreheater and precalciner kilns. About 26 production lines using precalcinertechnology have already been built in China, with daily capacities from 700to 4,000 tons of clinker. The investment required is typically Y 150 millionfor a precalciner kiln making 1,000 tpd clinker.
(b) Conversion of wet process kilns to the semi-dry process. There are somepilot projects for this change (e.g., a semi-dry line with vacuum slurryfiltration in Guangzhou). An investment of about Y 60 million is neededfor modifications.
(c) Rehabilitation of electricity generation equipment on old kilns. There areseveral old kilns built before 1949 which could be upgraded to increasecement production by 15 percent and electricity production from 100 kWhto 150 kWh/ton of clinker. The capital investment ranges from Y 30 to 100million per kiln. The economic viability of rehabilitation requires carefulchecking as electricity generation by waste heat has not been foundeconomic in western cement plants.
(d) Improved operation of wet process kilns, to be achieved by a variety ofsmaller-scale measures. Energy consumption could be reduced from say1,500 to 1,250 kcal/kg clinker by:
(i) installation of chains in ldlns(ii) use of higher heat resistant refractories
(iii) increased use of slurry thinners(iv) coal bumer modifications(v) coal grinding mill modifications
A rough estimate of the investment per kiln is Y 5 million.
3.97 In the case of small-scale rotary kilns, some of these could be modified withthe installation of 4 or 5 stage preheaters: a typical kiln-diameter 1.5 to 2 meters,

- 58 -
capacity 140-160 t/d-needs Y 18 million investment. Some small kilns with poorefficiency may be shut down.
3.98 With respect to shaft kilns, although these often show reasonably goodenergy efficiency, there are problems of maintaining good clinker quality. However, overthe last ten years or so, various measures-including computer control-have beendeveloped and applied to shaft kilns to reduce energy consumption and improve clinkerquality. Experience in several plants shows that kiln fuel consumption can be reduced to120 kgCE/t clinker (840 kcal/kg), which is close to the performance of a modern preheaterkiln. Electricity use of 80-85 kWh/t cement is also achieved and this is a goodperformance. The cost of modifications varies for different plants but is typicallyY 3 million. It is expected that around 3,000 mechanized shaft kilns will undergoprogressive modifications and improvements over a period of several years. For the mostprimitive kilns, the best will be modified into mechanized Iilns while many of the poorestones will be shut down.
3.99 Lower energy consumption for clinker grinding is also a potential area forsavings. Most of the current mills are low efficiency ball mills: total electricity useamounts to over 17,500 million kWh annually. Some measures to reduce this are:
(a) installation of higher efficiency vertical and roller mills,
(b) addition of pre-crushing stage and better air-separator,
(c) use of higher quality abrasion resistant grinding media,
(d) use of steel rods rather than balls, and
(e) elimination of ball mills under 1.8 m diameter.
3.100 Another area for significant energy saving is the increased application ofindustrial wastes for cement and concrete manufacture. Specifically, industrial slags, flyash and natural pozzolans could be used in much greater quantities in conjunction withclinker to produce blended cements. Chinese cement specifications allow significantquantities of waste materials to be used:
for blast furnace slag cement 20-70 percent of slagfor pozzolan portland cement 20-40 percent pozzolansfor portland fly ash cement 20-40 percent fly ash
3.101 The current production level of these blended cements is only 5-6 milliontons (of which 4 million tons are made by large/medium-scale enterprises) out of over 250million tons of cement. The potential saving of clinker by increased production of thesethree types of blended cement is probably 15-20 million tons annually in the shortterm-say within five years-equivalent to coal savings of say 4 million tpy. Over the longterm, say by 2010, savings could easily be doubled.

- 59 -
3.102 With respect to raw materials, coal shale and high carbon content fly ash areused in some plants to reduce overall coal consumption.
Flat Glass
3.103 Although the energy consumption of this industry is only 3.13 million TCEper year, about 2.6 percent of the energy used for building materials, the energy costs tendto be high due to the need for high quality fuels (e.g., heavy oil, low ash coals and naturalgas). There is therefore strong interest in energy efficiency and various modifications toplants are being adopted:
(a) Installation of Float Glass Furnaces. At present, the technology for 500tpd float glass production systems is imported from the USA at a cost ofY 350 million for a new installation and about Y 50 million for each revampof an existing plant. The new system results in a decrease in energyconsumption of almost 50 percent.
(b) Modifications to vertical and horizontal draw furnaces-various techniquesand improvements have been developed:
(i) Insulation and sealing on the glass melting furnace.(ii) Modification of the furnace structure.
(iii) Enhancement of heat recovery with improved regenerators.(iv) New types of oil burner and better combustion efficiency.(v) Higher efficiency of coal gas generation, including better automatic
controls.(vi) Improved feeders for charging raw materials.
(vii) Instrumentation for process and combustion control.(viii) Higher efficiency fans.
3.104 Overall, these types of improvement can give energy savings of 30-40percent for existing furnaces.
Ceramics
3.105 Energy consumption in this part of the sector is rather high and thereforea good potential for improvement clearly exists. Some typical measures already beingadopted include:
(a) Fuel Changes. Because coal and heavy oil are used extensively, indirectfiring methods have been used to avoid pollutants affecting product quality.To improve heat transfer and to save energy, clean gas-such as purifiedcoal gas and city gas-may sometimes be utilized.
(b) Adoption of modem kiln technologies-such as the replacement of olddownward draft and multi-pass kilns by roller hearth and shuttle kilns.

- 60 -
(c) Modifications for energy saving on existing kilns-consisting of a numberof items which apply in many cases, such as new oil and gas burners, lowmass kiln cars and accessories, better insulating materials for kilns, and heatrecovery from exhaust gases to dry and preheat incoming materials.
Clay Bricks and Tiles
3.106 Measures being taken to improve energy efficiency in the brick and tileindustry range from increasing the utilization of carbon-containing wastes such as fly ashesand coal washery rejects-as already mentioned above-to the increased use of hollowbricks. In China, the proportion of hollow bricks remains about 0.3 percent of the nationaloutput, while other countries use hollow bricks extensively. Hollow bricks require lessclay per unit volume, consume less fuel for firing in the kiln, are lighter and easier tohandle during construction, and have superior insulating properties when used in typicalbuildings. A void space of say 30 percent is quite feasible without substantially alteringthe properties of the brick but saving about 20 to 25 percent of the energy needed inmanufacturing. By ensuring proper quality control in manufacturing, large energy savingsare thus possible in the clay brick industry.
3.107 In the building material industry in general, there are possibilities for usingwaste materials such as slags and fly ash to make lightweight bricks and panels forbuildings. These can save large amounts of energy currently used to make clay bricks.The use of aerated concrete could also be encouraged.
3.108 With respect to the Iilns and manufacturing process itself, better insulationto reduce heat losses and increased use of waste heat for artificial drying is being adoptedin many plants. The internal structure of existing kilns should be checked to ensure thatthere is no bypassing of useful heat direct to the stack due to intemal gas duct faults.Also, the continued use of small kilns with old and primitive technology must bequestioned and the lowest efficiency plants should be shut down.
Lime
3.109 The main thrust of efficiency improvements is to replace old backward ldlnsby mechanized kilns using modern technology. Other modifications being adopted includeimproved insulation and enhanced C0 recovery for alternative uses. Management ofoperations needs upgrading too, with better day to day control of the size of limestone fedto the kiln, of the coal to limestone ratio, of the combustion air volume and the use ofwaste heat. Some economies in fuel costs are also achievable by utilizing coal washerywastes. It is estimated that energy savings of about 20 percent in terms of TCE/t productare possible using such simple and well known measures.

- 61 -
Projected Industry Outputs and Energy Consumption
3.110 There is a great demand for building materials of all types and the sector isexpected to continue to show strong growth, generally faster than the average growth ofthe economy. Estimated outputs of key products are thus as follows:
1990 2000 2010
Cement 106 tons 210 460 500Flat glass 106 cases 81 150 180Floor and wall tiles million M2 227 300 350Sanitary ware 106 tons 0.17 0.25 0.32Bricks, tiles 109 pieces 497 650 700Lime million t 94 180 220
3.111 While most products will increase in output, brick production is expectedto slow down and decline as lighter and more efficient products replace conventional claybricks.
3.112 In terms of energy use, the importance of the building material sector willalso remain high. Assuming efforts are continued to improve energy efficiency, theforecasted energy consumption for the sector is as follows:
(106 TCE) 1990 2000 2010
Cement 40.7 62.5 87.9Flat glass 3.1 4.7 5.0Bricks and tiles 54.4 70.0 70.0Lime 10.5 18.0 21.0All others 14.2 24.8 26.1
12298 210 0
Generic Investment Options
3.113 The main opportunities for energy saving and reduction of greenhouse gasemissions are in the cement industry. Three typical items were chosen for detailed analysisas case studies:

- 62 -
(a) B1 Renovation of old cement plants by upgrading dry process kilns topreheater/precalciner systems.
Much of the Chinese cement industry was established before 1950 andutilises obsolete equipment and outdated processes. With few exceptionseven those plants using the dry process route have problems with oldequipment, often operated long after the end of its economic life. Thiscauses poor energy efficiencies and high levels of pollution, especially dustemissions. Profitabilities are often low. The renovation of typical dryprocess plants can therefore make a major contribution to the well-being ofthe industry, by replacing old dry 1dlns with modem preheater andprecalciner kilns.
(b) B2 Conversion from wet process to dry process kilns.
More than half the kilns used in large and medium-scale enterprises areusing the traditional wet process in which raw materials are mixed withwater during the initial grinding stages and enter the kiln as a slurry. Thiswater requires extra energy to evaporate during the clinkering step. Mostmodern plants use the dry process route in which the raw materials areprocessed without water addition, consuming much less energy per ton ofcement produced. Conversion of wet process plants to the dry processoffers the opportunity to save significant energy and to upgrade equipmentgenerally.
(c) B3 Renovation of small-scale vertical cement kilns.
Out of a total cement production of about 250 million tons per year, 190million tons are made in small-scale vertical kilns in over 5,000 plants.While many of the oldest and smallest plants with outdated equipment inpoor condition will undoubtedly be shut down in the next few years, manyplants will remain in operation to satisfy the growing market demand forcement. A large number of measures can be taken to upgrade the plants,including improvements to raw material preparation and mixing stages,adoption of modem instrumentation for better process control, andmodernization of exhaust gas dust removal equipment.
3.114 Actual plant data were collected at representative cement plants for eachoption. Internal rates of return and paybacks, including construction time, were calculatedas follows:

- 63 -
IRR % Payback, years
B1 Renovation of dry kilns 16.9 11B2 Wet to dry conversion 19.2 10B3 Vertical kiln renovation 32.3 7
3.115 Based on the characteristics of the cement industry, the following forecastswere made for the business as usual and accelerated scenarios:
1990 2000 2010
B1 Renovation of dry kilns (million tpy cement):
BAU Old ldlns 6.0 3.0 0.0Renov. kilns 0.0 3.0 6.0
Accel. Old kilns 6.0 0.0 0.0Renov. ldlns 0.0 6.0 6.0
B2 Wet to dry conversion (million tpy cement):
BAU Wet process 22.0 22.0 11.0Dry process 0.0 0.0 11.0
Accel. Wet process 22.0 22.0 0.0Dry process 0.0 0.0 22.0
B3 Vertical kiln renovation (million tpy cement):
BAU Old kilns 50.0 37.5 0.0New kilns 0.0 12.5 50.0
Accel. Old kilns 50.0 32.5 0.0New kilns 0.0 17.5 50.0
3.116 Further details of the assumptions made and the energy and emissions factorsused in the calculations are given in Annex A.

- 64 -
Projected Impacts on Energy and Emissions
3.117 Using the forecasts given above, the expected impacts on energy use in thebuilding materials sector were calculated as follows:
Savings 103 Savings 103TCE/yr by 2000 TCE/yr by 2010
BAU Accel. BAU Accel.
B1 Renovation of dry kiln 376 752 752 752B2 Wet to dry conversion 0 0 865 1,730B3 Vertical kiln renovation 776 1,086 3,103 3,103
3.118 Reductions in CO2 emissions were estimated as follows:
CO2 reduction CO2 reduction103 tpy by 2-000 103 y by 2010
BAU Accel. BAU Accel.
B1 Renov. of dry kilns 245 489 489 489B2 Wet to dry conversion 0 0 560 1,120B3 Vertical kiln renov. 380 531 1,518 1,518
Emissions
3.119 Major pollutants from the building material industries include dust, CO2,nitrogen oxides and SO2 from the manufacture of cement. Cement dust is often a highlyvisible pollution problem, and -greater attention needs to be paid to removal of particulatesfrom stack exhausts using bag filters or electrostatic precipitators. The recovered dust canoften be recycled to be mixed with the cement product. There are regulations to limit dustemissions but enforcement is sometimes lacking.
3.120 Carbon dioxide is produced as a part of the cement making process itself.A major component of the raw material is calcium carbonate which is heated in the kilnand CO2 is driven off in the reaction. The amount of CO2 released is about 1-1.1 tons perton of clinker produced. Thus, in 1991, the production of clinker was 176.8 million tons,corresponding to a release of say 180 million tons of CO2.

- 65 -
3.121 The emission of nitrogen oxides varies according to combustion conditions.The following estimates have been made of NOx emissions for different types of kiln:
Type of kiln NOX DmAverage Maximum
Precalciner 410 1,010Preheater 500 1,260Lepol (semi-wet) 270 900Kiln generating elec. with waste heat 460 680Wet process 550 1,120Vertical shaft 200 n.a.
At present, there are no limitations on NOx emissions in China. In Japan, for example,there are limits of 480 ppm for old and 250 ppm for new kilns.
3.122 The emission of S°2 from cement plants is not a major problem as the coalused is typically under 2 percent sulphur. In any case, much of the S02 is absorbed by thecement process materials.
3.123 Carbon monoxide release from conventional rotary kilns is normally not aproblem as combustion is completed within the kiln. For vertical shaft kilns, however,there are sometimes problems due to incomplete combustion, resulting in some cases frominadequate supply of combustion air or poor distribution of the air in the shaft. CO canreach 2-3 percent in the exhaust gases, posing a safety and health hazard.
3.124 Pollutants from the glass industry consist of particulates from the rawmaterials and some gaseous emissions generated by the process reactions. Many of theraw materials contain carbonates and sulphates, which lead to emissions of CO.2 and S%2respectively. NOx is generated in the combustion process in the melting furnace. As aguide, the emissions from a typical glass plant amount to 12.2 nm3 of waste gas per 100gm of raw material batch, of which CO2 is 7.9 nm3 (15.5 kg) and SO2 0.5 nm3 (1.42 kg).In addition, there are the emissions from the fuel to consider. As a guide, 1 nm3 of coalgas (heating value 1430 kcal/nm3) produces 2.05 nm3 exhaust gas of which 0.35 nm3 isCO2. For heavy fuel oil buming (heating value 10,000 kcal/kg), the exhaust gas is about13.5 nm3/kg fuel of which CO2 is 1.7 nm3.
3.125 Pollutants from the ceramics, clay brick and tile industries are all producedduring fuel combustion; there are no significant effects from chemical reactions. In thecase of the lime industry however, a large amount of CO2 is released as calcium carbonatedecomposes. The quantity is about 1.18 tons of CO2 per ton of lime produced, includingthe CO2 from the fuel.

- 66 -
3.126 For 1991, the total emission of CC2 is thus estimated to have been 450million tons, with contributions as indicated below. With respect to emission levels in thefuture, projected industry outputs and energy consumptions have been used to give thefollowing forecasts for emissions of CC2:
1991 2000 2010(million tons)
Cement 177 260 329Flat glass 7 9 12Ceramics 7 10 13Bricks and tiles 114 152 145Lime 125 165 188Others 20 24 28
Total45 071
D. PAPER
Industry Profile
3.127 The Chinese paper industry has grown steadily since 1949 at an average of12.5 percent per year until it now produces over 17 million tons per year (1992), rankingfourth in the world. Production statistics for 1990 are as follows:
Pulp 106 t 12.303Paper and board 10' t 13.719Number of grades 500Products:
Printing, writing paper % 27Wrapping, packaging % 28Household, sanitary % 5Board % 40
Further increases in paper and board production were seen in 1991 and 1992, to 14.28 and17.25 million tons respectively. About 60 percent of the raw material is straw.
3.128 Most of the production is consumed domestically. Production of fine coatedprinting papers, cigarette paper, and various liner boards cannot meet demand and

- 67 -
therefore some products are imported. In 1990, for example, imports were 342,000 tonsof pulp and 962,000 tons of paper and board: about 385,000 tons of paper and boardproducts were exported.
3.129 Although the output of paper products is large on a world scale, per capitaconsumption is relatively low. The total world average figure was 44.8 kg per capita in1990; for the USA it was 311.4, in Asia 19.8, and in China it was only 12.6 kg.
3.130 The industry in China comprises 5,360 paper-making enterprises with 1.25million employees. While the average production of all paper mills is around 2,550 tonsper year, the range of plant sizes is great. For example, 242 large and medium-sizeenterprises produced 5.067 million tons in 1990, 37 percent of the total nationalproduction: each of these plants produces over 10,000 tons annually. The industry isspread widely in China, with Shandong, Henan and Guangdong Provinces producing thelargest tonnages. Of these, only Henan Province represents over 10 percent of the nationaloutput of pulp or paper (Table 3.29).
3.131 Production responsibilities in the industry are divided into several branches-such as plants under agencies for light Industry, forestry, agriculture, military, etc. Underthe Ministry of Light Industry heading, there are 1,716 plants producing 56 percent of thenational total.
Energy Use
3.132 Of the total energy used in pulp and paper mills, electricity accounts for 30percent and heat energy 70 percent. Electricity is used mainly in stock preparation andpulping for sawing and chipping wood, cutting straw, grinding and screening, as well asfor operating motors on pumps and blowers. Fuels are used mainly for the production ofsteam, which in turn is used for electricity generation in some plants and process use inall plants, such as cooldng, bleaching, black liquor evaporation and the drying of pulp andpaper.
3.133 Table 3.30 shows the consumption of different energy forms. The industryconsumed 12.25 million TCE of fuels and 11.98 billion kWh of electricity in 1990, a totalof 16.94 million TCE. The installed power of electrical equipment in 1990 was estimatedat 4,500 MW. The total energy consumed for paper-making was 2.5 percent of thenational energy consumption: this is relatively low, the' corresponding figure being about10.5 percent in the USA and 5 percent in Japan.
3.134 The cost of energy for the paper industry is 10-15 percent of totalmanufacturing costs. This can of course vary widely for different enterprises in differentregions and is generally based on the market price for energy. The paper industrypurchases relatively little energy at "planned" state-controlled price levels. Typical figuresfor April 1992 were:

- 68 -
"Planned" prices Market prices
Fuel oil (Y/ton) 290 480Raw coal (Y/ton) 65 100-160Electricity (Y/kWh) 0.16 0.25-0.60
3.135 With respect to electricity generation within the paper industry, only 60 millshave their own power stations out of over 5,000 enterprises in China. Typical boilerefficiencies are 80 to 90 percent. Some statistics for the equipment in use in 1990 is asfollows:
Number Capacity
Boilers 152 5,300 t/h
Steam Turbines:Back pressure, extraction (non condensing) 61 163 MW (40.0%)Extraction & condensing) 29 109 MW (46.4%)Condensing only 5 55 MW (13.6%)Total turbines 95 407 MW
3.136 The trend is toward the shutting down of ordinary condensing turbines andtheir replacement by extraction types. The size range of turbines is wide, although about40 percent can be considered large:
Size, MW Installed, MW Percent
< 3 42.7 10.53-6 69.6 17.16 -12 139.6 34.3> 12 155.1 38.1
Tntnl an7 n 1nn nQ24

- 69 -
Table 3.29: PRODUCIION DLSTILBUTION FOR THE PAPER INDUSMRY, 1990
Province, PUI Paper and boardmunicipality 103 t percent 103 t percentor region
Beijing 132.0 1.07 254.1 1.85Tianjin 166.3 1.35 267.5 1.95Hebei 853.3 6.94 887.5 6.47Shanxi 363.0 2.94 354.4 2.58Neimenggu 135.1 1.10 135.9 0.99Liaoning 774.9 6.30 775.0 5.65Jin 511.7 4.16 570.2 4.16Heilongjiang 460.6 3.74 535.3 3.90Shanghai 343.9 2.80 464.9 3.39Jiangsu 663.2 5.39 748.1 5.45Zhejiang 332.2 2.70 785.2 5.72Anhui 267.4 2.17 383.6 2.80Fujian 538.1 4.37 520.9 3.80Jiangxi 249.8 2.03 255.9 1.87Shandong 964.0 7.84 1161.1 8.46Henan 1476.7 12.00 1484.1 10.82Hubei 349.8 2.84 430.3 3.14Guangdong 966.1 7.85 1041.3 7.59Guangxi 336.5 2.74 335.0 2.44Hainan 3.6 0.03 4.0 0.03Sichuan 816.1 6.63 774.4 5.64Guizhou 66.0 0.54 62.1 0.45Yunnan 163.6 1.33 154.3 1.12Shaanxi 447.7 3.64 417.5 3.04Gansu 105.2 0.86 102.4 0.75Qinghai 4.0 0.03 7.1 0.05Ningxia 70.4 0.57 66.8 0.49Xinjiang 97.6 0.79 90.9 0.66
Subtotal 11.657.8 413.069.8 95
All others 302.7 2.46 71.9 0.52Net imports 342.0 2.78 577.0 4.21
Total 12.302.5 100.00 13.718.7 100.00
3.137 Units with a capacity of 6 MW or higher are normally found in largerenterprises built during the Sixth Five-Year Plan. Those under 3 MW were typicallyinstalled during the Seventh Five-Year Plan and many are associated with cogenerationsystems.

Table 3.30: ENERGY CoNSumrlON DATA FOR THE PULP AND PAPER SECrOR, 1990
Energy CoesumedOutput of
paper Fudes 10'TCE Electrkity Total eneryproducts
Subsector 10' T Steam Coking Nat. Totalcoal coal Coke Oil Gas Other FPue 10' kWh 10' TCE 10' TCE Percmet
iUght indutrPI plants 7,710.0 7.675 0.000 0.000 0.403 0.027 0.000 t.105 7.92 3.105 11.210 66.16
Snall scale
far.n 3t0.0 0.395 0.000 0.000 0.021 0.000 0.000 0.416 0.41 0.161 0.577 3.40townships 5,230.0 3.125 0.000 0.000 0.164 0.000 0.000 3.289 3.22 1.262 4.551 26.86
Smallforetry 100.0. 0.104 0.000 0.000 0.005 0.000 0.000 0.109 0.11 0.043 0.152 0.90
All other 300.0 0.313 0.000 0.000 0.016 0.000 0.000 0.329 0.32 0.125 0.454 2.68
Total 13,720.0 11.61U 0.000 0.000 0.609 0.027 0.000 12.248 11.980 4.696 16.944 100.00percentages 68.53 0.00 0.00 3.59 0.16 0.00 72.23 - 27.72 100.00

- 71 -
Specific Energy Consumption
3.138 The specific energy consumption differs greatly from enterprise toenterprise, depending on the scale of operation, the materials used for fibre, the specificprocesses employed, product grades and quality, and management. Most pulp producersin China are integrated, with few producing only pulp for the market. Many paper mills-especially smaller ones in cities-purchase pulp or use waste paper. Township paper-making enterprises mainly produce lime straw pulp to make straw board or use waste paperto make packaging materials. Paper mills under forestry agencies mainly producewood-based unbleached pulp and board. Enterprises under the Ministry of Agriculture andwithin the military system are straw based integrated paper mills. For the same grade ofpaper or board, the unit energy consumption of plants under the Ministry of Light Industryis generally lower than plants under other agencies.
3.139 The average unit consumption was 1.23 TCE per ton of product:
Energy inc. Unit energyOutput electricity consumption
103 t 103 TCE TCE/t
Light industry 7,710 11,200 1.45Agriculture:
Farm 380 576 1.52Township 5,230 4,557 0.87Forestry 100 152 1.52Army and other 300 457 1.51
All China 13,720 16,942 1.23
The energy consumption for the paper industry in 1990 represents about 4.6 TCE perY 10,000 output value.
3.140 Typical energy consumptions for certain activities in plants under theMinistry of Light Industry are as follows:

- 72 -
Product Units 1985 1988 1989 1990
Heat Energy:Pulp TCE/t pulp 0.64 0.62 0.68Paper, board TCE/t product 0.99 0.92 0.87
Electricity:MechanicalWood pulp kWh/t 1,522 1,588 1,560 1,566Newsprint kWh/t 556 565 568 583
These figures show fluctuations over time, although the general trend seems to be downfor thermal energy and up for electricity.
3.141 In integrated pulp and paper mills, the average energy consumption was 1.55TCE per ton of paper, based on 1990 data for 870 enterprises. The cost of energy forthese plants represents 10 to 15 percent of the total production cost. These larger plantsnormally use medium pressure boilers with efficiencies in the region of 80 percent, whilesmaller plants have only low pressure boilers with efficiencies as low as 50-60 percent.The total steam raising capacity in the paper industry is around 14,000 tth.
3.142 The efficiency of electricity generation varies considerably. For 42 plantsinvestigated, the following data were obtained:
Energy consumption, kg CE/kWh No. of plants
< 0.404 150.404-0.600 12
> 0.600 15
Min 0.155/ avg 0.40/ max 0.70 42
Of the figures given for energy consumption, about 15-25 percent of this is for internalpower plant use.
Energy Efficiency Trends
3.143 With respect to changes in energy efficiency, the industry has paidincreasing attention to all aspects of operations. In addition to strengthening enterprisemanagement and training personnel, the following measures have been adopted:

- 73 -
(a) Increased Application of Cogeneration. Installed capacity MW in 1990,with self-generated electricity, totalling 1.65 billion kWh. However, only60 mills out of about 5,000 have their own cogeneration equipment,although essentially all newly built medium and large enterprises nowinclude cogeneration systems.
(b) Increased Black Liquor Recovery. Energy recovery from black liquor isnow equivalent to about 200,000 TCE annually.
(c) Recovery of Waste Heat. Including heat from paper machine hoods.
(d) Use of Wood Wastes. These include bark, sawdust, wood chips and strawdust, which are now being used in waste boilers.
(e) Increased Instrumentation. This includes computer control of operationssuch as rapid cooking of straw at low temperatures, and on-line papermoisture measurement.
(f) Various Process Improvements. These include recycling white water,reducing the moisture content of formed paper entering the drying section,condensate recycle from cylinder dryers, and greater use of continuousdigesters.
3.144 The results of such activities are suggested by the following figures forplants under the Ministry of Light Industry:
1985 1990 Growth %/y La
Output value:Y 109 (1990) 16.69 24.56 8.03Enterprises 1,616 1,716
Production (million tons) 6.59 7.71
Energy consumption (106 TCE) 10.01 11.20 2.27
Energy/outputTCE/Y 10,000 6.00 4.60TCE/t 1.52 1.45
/a Energy growth %/Output growth % = 0.28.

- 74 -
3.145 The data suggest the savings are about 5.3 percent per year over the 5 years.However, although useful savings have been achieved, some of the improvement is due tochanges in the product structure in the industry. For example, letter press paper has beenupgraded to offset paper quality by many enterprises, and ordinary newsprint to high gradeoffset newsprint. HIigher value-added products such as kaft liner board and white boardare maling up a greater proportion of output. These changes lead to a higher output valuewith relatively modest energy increases. In addition, there have been increases in the useof imported pulp and recycled paper, thus decreasing the energy needs for pulp-making.
Potential for Improvement
3.146 Apart from potential management deficiencies, there are five major reasonsfor high energy consumption by the Chinese paper industry:
(a) Structure of Energy Consumption. In China, coal represents about 95percent of fuel use while the paper industry in many western countries usesa high proportion of natural gas.
(b) Raw Materials. In 1990, wood fiber made up only 14.6 percent of rawmaterial in China, while in other countries it is generally 90 percent ormore. Straw is the main source of fibers for paper production and there istherefore very little wood waste or bark that can be used as a fuel. On thecontrary, there are large quantities of straw and reed dust that are notutilized. It is believed there are only very few waste dust boilers in China.
(c) Black Liquor Recovery. Although this is increasing, recovery remainslow. In 1990, there were 57 black liquor recovery systems in service witha capacity of 0.45 million tons alkali recovery per year: the actual amountrecovered amounted to 0.35 million tons. The efficiency of recovery isabout 80-90 percent in China compared with typical levels of 90-95 percentoverseas. Of the 57 mills with black liquor recovery, only 8 havecogeneration systems, the remainder simply make low pressure steam forheating. The concentration of solids in black liquor from straw pulping islower than for wood pulp processing, thus the energy requirement for alkalirecovery is higher.
(d) Enterprise Scale. The average production of Chinese paper enterprises is2,550 tpy, and only 37 percent of annual production is made by plants withcapacities in excess of 10,000 tpy. Out of over 5,000 plants, only about200 may be classified as medium or large. Overseas, plant sizes are usuallymuch greater: typically, paper and board production of enterprises is 60,000tpy. The economic application of black liquor recovery and cogenerationsystems is therefore less often found in China.
(e) Equipment Technology. This tends to be somewhat backward in Chinaand equipment at most medium and large enterprises can be considered

- 75 -
equivalent to international standards of the 1960s and 1970s. Papermachines in China are usually under 2 meters in width and run at speeds of200 m/min or less, while corresponding machines in western plants areoften 5-10 meters in width and run at 800-1200 m/min.
3.147 Some potential changes which should lead to lower energy use include higherlevels of black liquor recovery and cogeneration, as already indicated. In addition,improvements in digester technologies are being widely adopted, such as continuoussystems which replace both spherical and vertical batch digesters. Increased waterrecycling is also being encouraged, including more condensate recovery from papermachine drying cylinders (currently estimated at only 50 percent). Greater use of wastessuch as bark, wood chips and straw dust is also expected. The increased use of wastepaper as a raw material could also lower overall energy consumption. Currently, only 27percent of paper raw material is made up from waste paper and it is thought that this couldbe increased to about 30-35 percent in the short to medium term.
3.148 Other technical measures include improvements that are not exclusive to thepaper industry, such as improved boiler operations, the use of variable speed electric motordrives, elimination of condensing turbines in electricity production, replacing lowefficiency blowers and pumps, improving steam system insulation, installing more steamtraps, and replacing defective traps more frequently.
3.149 Longer-term technological developments are expected to concentrate on longfiber pulps and the adoption of more wood-based pulping. Larger plant sizes can beexpected, with new wood pulp mills in the range of 50,000 tpy capacity or more, andnonwood pulp mills to 17,000 tpy or above.
3.150 With respect to environmental protection, reduction in waste waterdischarges and increased water recycling will be pursued. Higher levels of black liquorprocessing and alkali recovery will help, as will higher levels of waste water treatment.Lower energy consumption in general will lead to lower emissions to atmosphere of CO2,SO2 and particulates.
Projected Industry Outputs and Energy Consumption
3.151 It is expected that the annual growth rate of the paper industry will be a littlehigher than the overall growth rate of the economy. It is also anticipated that the qualityof most major products will continue to improve to world standards. The following figuresfor output and corresponding energy use and emissions have been estimated, assuming theachievement of higher energy efficiency and greater attention to pollutant emissions:
Generic Investment Options
3.152 Based on a review of the paper industry and likely changes in technologiesused, two case studies were developed for the paper industry:

- 76 -
1990 1995 2000 2010
Output 106 tons 13.72 20.15 25.00 35.00Energy
Fuels 106 TCE 12.25 16.73 22.04 22.75Electricity 109 kWh 11.98 16.70 22.27 23.10
106 TCE eq 4.79 6.68 8.91 9.24Total 106 TCE 17.04 23.41 0.95 31.99
Specific e.c. TCE/ton 1.24 1.16 1.07 0.91
Emissions:CO2 103 tons 2,340 3,194 4,210 4,345S02 103 tons 296 360 445 428SO2 removal % 10 20 25 30
(a) LI Black Liquor Recovery
In pulp plants, raw materials are treated with caustic soda as an essentialfirst step. Much of the spent caustic is discharged by Chinese plants tolocal rivers and is responsible for 80 percent of the organic pollutant loadin paper industry effluents. Processing of black liquor is well establishedin most developed countries and is used to reduce pollution emissions, torecover caustic soda for reuse in the pulping process, and to recover energyby burning combustible materials in the black liquor itself.
(b) L2 Cogeneration
The paper industry is a lrge consumer of both electricity and steam. Mostpaper mills in China generate their own steam in boilers which operate atlow pressures and moderate efficiencies. Some of the larger enterprisesgenerate their own electricity, also using boilers to produce steam atrelatively low pressure and at efficiencies of 50-60 percent. Increasedadoption of cogeneration systems in the paper industry will permit muchhigher generation efficiencies for both steam and electricity, partly throughthe application of a process that is inherently more efficient than separategeneration and partly by the effect of replacing old and outdated equipment.
3.153 As indicated previously, these technologies have already been adopted bysome paper plants and therefore it is useful-based on actual plant experiences-todetermine their economic viabilities, to assess impacts on industry energy consumption and

- 77 -
greenhouse gas emissions from their further adoption, and to estimate the potential energyand pollution benefits from accelerating the present rate of adoption of the technologies.
3.154 The details of the two case studies are reported elsewhere. Analyses gavethe following internal rates of return and paybacks (including construction times):
IRR % Payback, years
Li Black liquor recovery 24.6 5L2 Cogeneration 24.5 9
3.155 Based on the characteristics of the sector, the following forecasts of adoptionof these technologies were made:
1990 2000 2010
Ll Black liquor recovery (106 tpy pulping capacity):
BAU Without BL recovery 1.2 0.8 0.0With BL recovery 0.0 0.4 1.2
Accel. Without BL recovery 1.2 0.6 0.0with BL recovery 0.0 0.6 1.2
L2 Cogeneration (106 tpy paper products):
BAU Plants without cogeneration 2.4 1.9 0.0Plants with cogeneration 0.0 0.5 2.4
Accel. Plants without cogeneration 2.4 1.4 0.0Plants with cogeneration 0.0 1.0 2.4
Details of the assumptions made including energy and emissions factors are given inAppendix A.

- 78 -
Projected Impacts on Energy and Emissions
3.156 Based on the above forecasts, the expected impacts on the energyconsumption of the paper sector are as follows:
Savings 103 Savings i03TCE/yr by 2000 TCE/yr by 2010
BAU Accel. BAU Accel.
LI Black 1. recovery 74 110 221 221L2 Cogeneration 17 33 79 79
Reductions in CO2 emissions were forecast as follows:
C02 reduction C02 reduction103 XVy by 2000 103 y by 2010
BAU Accel. BAU Accel.
Li Black 1. recovery 253 379 759 759L2 Cogeneration 11 21 50 50
Emissions
3.157 The paper industry releases air pollutants through the combustion of fuelsin boilers, in common with most manufacturing operations, but the major pollution impactof the industry is on water pollution. Spent chemicals such as caustic soda containingorganic contaminants are discharged to local rivers and laces. Increasing the recovery ofcaustic soda from black liquor will thus contribute significantly to reducing local waterpollution.
3.158 Estimates of the current air pollutant emissions and forecasts through to 2010are as follows:

- 79 -
1990 1995 2000 2010
Industry output 106 tons 13.72 20.15 29.00 35.00Emissions:
CO2 103 tons 2,340 3,194 4,210 4,345SO2 103 tons 296 360 445 428S% removal % 10 20 25 30
3.159 The most important measures to reduce air pollutant emissions are toimprove combustion efficiency on existing boilers and to ensure that new boiler designsadopt good modem practice. Other pollutants are released from associated operations suchas lime kilns and digesters: good management is needed to keep operating practices at thehighest levels, and to ensure that proper environmental protection equipment is fitted (e.g.,dust collectors on lime kilns and boilers).
E. TExILEs
Industry Profile and Products
3.160 The textile industry may be divided into "upstream", midstream" and"downstream", according to the process route from fibers to final products:
(a) Upstream Covering raw fibre production, both natural and synthetic.Natural fibers include cotton, silk and wool, while synthetic fibers cover awide range of materials such as viscose, acetate, polyester, nylon andacrylic materials. Preparation of natural fibers is classified as anagricultural activity and that of chemical fibers as industrial.
(b) Midstream. Processing of fibers into fabrics. This may be further dividedinto the manufacture of cotton, wool, silk and artificial fibers, includingspinning, weaving, knitting, bleaching, dyeing, printing and finishing. Theseare the main activities of the textile industry.
(c) Downstream. Preparation of final products from fabrics. This covers themaking of garments, footwear and headwear, and the manufacture ofcurtains, carpets and industrial textiles.
3.161 The textile industry in China is amongst the largest in the world, with thenumber of cotton yarn spinning spindles ranked first, of wool spinning spindles second andchemical fibre output fourth. About 0.4 million tons of yarns and silks and 6 billionmeters of fabrics are exported annually.

- 80 -
3.162 In 1990, there were 11,223 enterprises reporting to the Ministry of TextileIndustry with an output value of Y 198 billion. The total employed was 7.46 million.These figures do not include establishments operated by TVEs which are very numerousbut are often quite small plants. Plants under the Ministry can be divided as follows:
Number Percent
Large 472 4.2Medium 1,251 11.1Small 9,500 84.7
11.223 100.
3.163 For the record, the classification is made as follows:
Large Medium Small
Cotton manufact. > 100,000 50-100,000 < 50,000 spindlesDyeing, printing > 100 50-100 < 50 million M/yChemical fiber > 8,000 3-8,000 < 6,000 tpy staples
3.164 In terms of numbers, the large and medium plants represent about 15 percentof the sector and provide about two thirds of the output value of the textiles industry.
3.165 Enterprises are located all over China, although one third are in the east:
Number Percent
North 1,442 12.9Northeast 1,458 13.0East 3,804 33.9Middle, south 2,724 24.3Southwest 1,094 9.7Northwest 701 6.2
1122 l rw=n

3.166 Production statistics for the textile industry, excluding TVE plants, are asfollows for 1985-90:
1985 1986 1987 1988 1989 1990
Number of enterprises 14,476 14 600 14 701 14 585 10 913 11 223Employees (year end) 106 6.69 7.00 7.36 1.68 7.35 7.46Production aata
Chemical fiber 103 t 948 1 017 1,175 1,301 1,478 1,650Cotton ya 06 t 3.53 3.98 4.37 4.66 4.77 4.62Cotton fabric 10 m 14.67 16.47 17.31 18.79 18.92 18.80Printed/dyed fabric 109 mld 7.53 7.95 8.31 9.52 8.70 9.10Woolen fabric 10'mLa 218.16 251.86 265.40 286.11 279.60 295.00Silk 103 t 42.20 47.20 51.90 51.00 52.20 56.50Garments 109 pieces 3.0Footwear 106 pairs 765Headwear 109 pieces 117
La Standard width of fabric is 1 meter.
3.167 The following data are available on capacities in 1990:
Capacity
Chemical fibers 2.02 106 tpyCotton yarn spinning 38.82 103 spindlesCotton fabric
weaving and knitting 0.86 106 loomsWool yard spinning 2.65 106 spindlesWool fabric weaving
and knitting 0.33 106 loomsSilk reels 2.4 106 endsSilk textile weaving
and knitting 0.18 10' loomsCotton fabric
printing and dyeing 13.2 10' metersly
3.168 The range of products produced in the Chinese textile industry is consideredlimited compared with developed countries. There are also problems of variability inquality and low added value. Textile exports from China achieve a value of about $ 5000per ton while exports from developed countries are valued at twice that amount. For theworld industry on average, the consumption of chemical fibers for textile productionamounts to 46 percent while China uses only 20 percent.

- 82 -
3.169 The structure of textile products lags behind many developed countries, asthe following table of relative production values:
Curtains, Industrialwall coverings uses-belts,
Fabrics for carpets, and tires, filters,(percent) garments automotive use etc.
USA 40 37 23W. Europe 50 34 16Japan 35 30 35
China 75 15 10
3.170 The textile industry also suffers from old and outdated equipment, with aboutone third of the cotton manufacturing machinery having a life of 30 years or more. MuchChinese machinery is still at an early stage of development with respect to electroniccontrol. It is believed that about half the textile machinery built today in China is only atthe international level of the 1960s. For example, open end spinning machines, shuttlelesslooms and rotary screen printing machines represent 3, 3 and 10 percent of the market inChina compared with 13, 15 and 50 percent in the world market.
3.171 Labor productivity is also low in China. For example, 30 man-hours areneeded to produce one ton of yarn, 3.5 times as much as Japan today and about the sameas Japan in the mid-1960s.
3.172 The textile industry is however modernizing as it expands to meet growingdomestic and international demands. Production is expected to increase by 0.45 milliontpy by 1995 compared with 1990 and by a further 1 million tpy by 2000. The proportionof garments, knitted goods, decorative and industrial textiles will increase. Quality isexpected to increase, as will the diversity of products, to meet market requirements.
Energy Use
3.173 In 1990, the resources consumed by the textile industry were as follows:

- 83 -
Consumption TCE Percent
Coal 15.21 10' t 15.59 56.4Fuel oil 0.48 106 t 0.69 2.5Electricity La 23.3 109 kWh 9.65 34.9Purchased steam 47,940 109 kJ 1.66 6.0Coal gas 102 109 M3 0.06 0.2
La Under 3 percent self generated, which is included in thefigure quoted for kWh (fuels for self generation areincluded in the coal, oil, etc.).
3.174 The energy consumption may be allocated to various parts of the industryas follows:
Upstream Midstream Downstream Misc.chem. fibers textiles garments etc. uses Total
Coal 10' t 2.63 11.56 0.31 0.71 15.21Fuel oil 10' t 0.09 0.36 0.01 0.02 0.48Electricity I09 kWh 4.1 18.2 0.27 0.73 23.3Purch. steam 109 kJ 8,450 38,450 100 850 47,940Coal gas l0 m3 - 110 - 10 120
3.175 A complete breakdown of energy consumption by the Chinese textileindustry is given in Table 3.31.
3.176 With regard to energy prices, typical regional prices for electricity are:
North China 0.25 to 0.30 Y/kWhEast China 0.40 to 0.50South China 0.60 to 0.80
3.177 As a percentage of total manufacturing cost, including raw materials, thecost of energy is about 3.5 to 5 percent for textile production, 4.5 to 6.5 percent forchemical fibre production and 5 to 6 percent for dyeing and printing.

- 84 -
Specific Energy Consumption
3.178 In 1990, unit energy consumptions were as follows:
Electricity FuelskWh/t TCE/t
SyntheticsViscose staple fibers 1,999 2.28Viscose filament yarns 10,439 9.17Nylon fibers 3,564 1.47Polyester staples 749 0.72Acrylic fibers 1,540 4.99Vinylon 2,291 2.34
NaturalCotton yarns 2,129 n.a.Cotton fabrics 25 n.a.Dyed and printed fabrics n.a. 43 kgCE/100 mNatural silk n.a. 1,680Silk fabrics 51 kWh/100 m n.a.
Energy Efficiency Trends
3.179 Based on constant 1980 yuan, the ratio of coal use to output value droppedabout 16 percent from 1980 to 1990:
Output value Energy use Ratio109 RMB 106 TCE TCE/10,000 RMB
1980 66.6 16.31 2.451990 136.2 27.65 2.03
3.180 It is estimated that the annual energy savings amount to 3.4 percent. Thishas been achieved by improving management and by investments in new equipment andtechnologies. For example, textile enterprises have made strong efforts to introduce goodenergy management practices throughout the industry, including better metering andreporting, better data analysis, improved scheduling of operations, training programs on

Table 3.31: ENERGY CONSUMPTION IN THE TEXTlLE INDusTRY DATA FOR 1990
EnerRY ConsumedFuel (10' Tsc e0uiv.) Electricity
Standard TOtalOutput Coal Oil Gas Steam Total 10' 10t Energy
Sector/Subsector & Unit 10 T 10' T 104 Ml 109 Kj 10' Tsc KWH Tsc 10' Tsc
Chemical 1.65 * 0.09 8,450Fibers 10' T 2.63 (0.13) (0.288) 3.0048 4,192 1,593 4.747
Cotton Yarn/ 4.62 * 0.109 0.019 14,450Fabric 10' T 4.13 (0.155) (0.0006) (0.493) 4.784 13,510 5,458 10.242
Wool Yam/ 295 * 0.049 0.00263 5,034Fabric 106 * 1.54 (0.070) (0.0009) (0.171) 1.781 1,173 413 2.194
Printing/ 9.10 * 0.035 0.039 14,194Dyeing 109M 2.04 (0.121) (0.0317) (0.484) 2.676 1,008 407 3.083 cO
Silk 1.70 * 0.061 0.00176 1,771Textiles 109 M 1.44 (0.087) (0.0006) (0.060) 1.587 1,030 416 2.003
Garments 8 * 0.011Footwear 10'Headwear PCs 0.31 (0.015) 0.321 278 112 0.433
0.075 0.00761 4,040Others 3.12 (0.107) (0.0027) (0.187) 8.866 2,109 852 3.897
15.21 0.48 0.12 47,940Total (15.21) (0.685) (0.0428) (1.635) 17.572 23,300 9,413 26.985
Conversion 148Factor 1.4286 0.3571 0.03412 0.404
( ) Converted to Standard Coal.

- 86 -
energy saving and on the technologies used by the industry. Systems of incentives andpenalties have been introduced, and awareness campaigns conducted.
Table 3.32: ENERGY CONSERVATION MEASURES
InvesmentEnergy for unit
Coal Raw ' Electric- SViUZ energy Retumnequiv. coal ity Oil value sviag period
Projects (Y 100 m) (lOhk) (lOhi) (100 GWh) (10 la) (Y 100 m) (tce) (Year)
Cogenerttion (supply) 70 950 1,330 - H 14.25 737 4.91New type of burner for
coal powder boiler 1.35 139 174 10.8 2.9 97 0.47Boiler sealing for heat protection 2.4 aS 119 - - 1.2 282 1.88Water pumper speed adjusting 10 120 30 - 7.5 33 1.33Comprehensive innovation for unit of
0.2 MkW 15 220 308 - 3.3 622 4.5SWashing steam-condenserby rubble ball 0.5 160 224 - 2.4 31 0.21Motor innovation of magnetic slot 0.08 15.2 - 3.8 0.95 52.6 0.0 4Surplus heat recycling of pipe
heat exchanging 8.2 403 465 17.79 9.46 230 0.37Micmrconputer online analysis for
energy lous 4 3S0 490 - 5.25 114 0.76improvinS for nonpower compensation 12 80 - 20 5 1,500 2.4Innovation on electricity distribution
of urban area 22.8 348 - 7 - 21.75 625 1.05
Total 146.33 2,S70.2 3.950 15S19 10.3 74.04 7U 1.94
Note: (I) Thermal supply is not included in thermal power cogenerstion.(2) Energy prices apply the shadow price: Y 150/tce, Y 0.2S/kWh, Y 930/t. Invemenau ame ealculated with hSed prices(3) The investments and energy saving are forecasted based on the average reults of the complete projec.u
3.181 With respect to investments for energy efficiency in the period 1980-90, over2200 projects were authorized with a total investment of over Y 700 million, withanticipated energy savings of 1.2 million TCE/yr. Examples of projects are:
(a) Cogeneration. One hundred one projects built or under construction for atotal investment of over Y 300 million. Anticipated savings are 0.6 millionTCE/yr and electricity generation capacity will total 0.4 million kW.
(b) Steam distribution. More than 600 projects have been completed orscheduled to update old steam systems, with a total investment ofY 200 million.
(c) Air conditioning. Typically, this requires 15 to 20 percent of site energyconsumption for dust removal and the control of temperature and humidity.Various improvements are being made, such as blower renewal, lower waterpumping rates, variable speed operation, LiBr systems, and new airconditioners.

- 87 -
(d) Motors and transformers. These are being replaced with modemequipment to achieve lower power factors and lower electricityconsumption. High efficiency motors are used in most spinning machines.
(e) Increased use of coal. Energy distribution by hot air and hot oil, heatedby coal fired equipment, is being used to replace electricity or fuel oilsystems.
Other measures include attention to water consumption and to routine maintenance.
Potential for Improvements in Energy Efficiency
3.182 The potential for energy efficiency improvement is significant. There are,of course, many factors such as process route, size of production facilities, range ofproducts, and climate. However, the specific energy consumption for chemical fibreproduction is generally higher than in developed countries, although for natural products,it is usually lower. Average figures for the Chinese industry and typical developed countrydata are as follows:
China Typical overseasElectricity Fuels Electricity Fuels
kWh/t TCE/t kWh/t TCE/t
Viscose staple fibers 1,999 2.28 1,020/1,470 0.82/1.28Viscose filament fibers 10,439 9.17 3,700 4.08Polyester staples 749 0.72 586 0.8Polyester filaments 2,678 0.63 830/1,030 0.4/1.28Nylon fibers 3,564 1.47 4,900 2.0Acrylic fibers 1,540 4.99 1,000 3.0Vinylon 2,291 2.34 2,100 1.2Cotton yarns 2,129 - 3,458Cotton fabrics 25 kWh/100 m - 39 kWh/100 mDyed, printed fabrics - 43 kg/100 m 50 kgCE1100 m
3.183 Energy consumptions in developed countries have risen in recent years-astheir textile industries have adopted higher speed machines and automated operations tosave manpower and cut costs. Also, many products are made in small batches with variousspecifications to meet rapidly changing markets. Standards for space conditioning and dustremoval are generally higher than in China (e.g., 30 to 50 percent of site energy useversus 15 to 20 percent in China). These factors add to energy use in the developedcountries, although this has been offset to a large extent in the chemical fibers industriesby introduction of energy efficient technologies in large-scale chemical plants.

- 88 -
3.184 For the future, savings in the Chinese textile industry are expected to beachieved by improvements in processes and better management. Some typical technicalrenovations which are expected to be accomplished by 2000 are as follows:
Investment Energy savingItem Capacity 109 RMB 102 TCE/y
Cogeneration 0.4 106 kWh 1.0 1,000Boiler renewal 12,000 t steam/h 1.2 900Motor renewal 0.3 106 kWh 0.2 40Air conditioningimprovement 3,000 sets 0.2 1,200
Chiller improv. 200 sets 0.1 60Water supply 200 sets 0.2 600Others 0.6 280
Projected Industry Outputs and Energy Consumption
3.185 The share of chemical fibers in the industry output is expected to grow from20 percent in 1990 to 33 percent in 1995 and 39 percent in 2000. It is expected that moreproductive machinery will be increasingly adopted-e.g., open-end spinning machines to0.6 million and shuttleless looms to say 5 to 6 percent. Although this may increase energyconsumption in the industry, the output will be increased more and the specific energyconsumption will be lower. Electronic controls will be more widely used. The productsof the industry will show more variety and will have a higher value added.
3.186 Forecasts of industry output have been made as follows:
1995 2000 2010
Total output value 196 269 350 109 RMBExport value 15 20 35 10' USDProcessed fibers 7.8 9.0 11.0 106 tonsChemical fibers 2.1 3.0 5.0 10' tonsCotton yarns 5.66 6.47 7.27 106 tonsWool fabrics 320 106 metersSilk fabrics 2.5 10' metersGarments 5.0 10' pieces

- 89 -
3.187 Forecasts of industry energy consumption are as follows:
(106 TCE) 1990 1995 2000 2010
Chemical fiber production 4.75 5.94 8.55 10.45Textile production 20.53 30.80 36.96 48.25Garments, footwear,headwear 0.45 0.72 1.00 1.06Other production 1.47 2.20 2.64 2.94
Total 2720 39.6 49.1 62:7
Generic Investment Options
3.188 Three measures were selected for detailed examination as case studies, eachwith good potential for wide replication in the textiles industry:
(a) Ti Cogeneration. The textiles industry is similar in many ways to thepaper industry in that it uses large amounts of both electricity and steam.While essentially all plants produce their own steam, only a few generatetheir own electricity. The on-site generation of both steam and electricityin modem cogeneration systems will raise energy efficiency, and thusreduce greenhouse gas emissions, by replacing old and obsolete equipmentand by introducing a process that is inherently more efficient than separategeneration.
(b) T2 Caustic soda recovery. Caustic soda is used in many textile mills fortreating cloth prior to dyeing or printing to improve the dye absorption andlustre of the finished material. Most plants do not recover the caustic sodafrom the dilute spent solution and this is therefore discharged to waste watertreatment facilities. These are often unable to effect proper teatment andcontaminated water may then be dumped into local rivers. Recovery of thecaustic soda from dilute spent solutions by a multiple effect evaporatorsystem would reduce water pollution significantly and reduce the need forpurchasing fresh chemicals. In this way, the demand for caustic soda couldbe reduced and the corresponding energy saved.
(c) T3 Computerized energy management systems. The operations at manytextile mills are relatively complex and good energy management requiresa variety of parameters to be checked regularly. Adoption of computerizeddata collection and analysis systems can assist management to detect adversetrends in efficiency promptly and thus to make appropriate adjustments tokey operating conditions in a timely manner. Such systems are of course

- 90 -
applicable throughout manufacturing industry and could show major benefitswell beyond the textiles sector.
3.189 Based on data obtained on each of these measures from actual plants inChina, the following rates of return and payback were estimated. The results-with thepayback period including the time taken for construction-are as follows:
IRR % Payback, years
TI Cogeneration 37.6 6T2 Caustic soda recovery 57.9 3T3 Computerized e. mgmt. - -
3.190 Based on the characteristics of the textiles sector and taking into account thepotential for applying the measures listed, forecasts for adoption under business as usualand accelerated scenarios were made. These were expressed in terms of million metersof fabric per year, by referring the required cogeneration capacity to an actual plantprocessing a known amount of fabric annually (and which has already invested in acogeneration system). A similar argument was used for estimating the extent of causticsoda recovery and of energy management system computerization. The forecasts are asfollows:
1990 2000 2010(million meters/yr)
Ti CogenerationBAU without cogeneration 30,000 25,200 6,000
with cogeneration 0 4,800 24,000Accel. without cogeneration 30,000 22,800 3,000
with cogeneration 0 7,200 27,00012 Caustic Soda Recovery
BAU without recovery 30,000 25,000 3,000with recovery 0 5,000 27,000
Accel. without recovery 30,000 21,000 0with recovery 0 9,000 30,000
T3 Computerized Energy ManagementBAU without computer system 30,000 22,500 0
with computer system 0 7,500 30,000Accel. without computer system 30,000 18,000 0
with computer system 0 12,000 30,000

- 91 -
Further details of the energy and emissions factors used for the calculations are given inAppendix A.
Impacts on Energy and Emissions
3.191 Using the forecasts indicated above, the impact of the various measures onenergy consumption in the textiles sector was estimated as follows:
Savings 103 Savings 103TCE/vr by 2000 TCE/yr by 2010
BAU Accel. BAU Accel.
Ti Cogeneration 290.9 436.3 1,454.4 1,636.2T2 Caustic recov. 50.7 91.3 273.8 304.2T3 Computer e.m. 53.0 84.8 212.1 212.1
With respect to greenhouse gas emissions, the reductions in CO2 were forecast as follows:
CO2 reduction CO2 reduction103 TPY by 200 103 TPY by 2010BAU Accel. BAU Accel.
TI Cogeneration 211.8 317.6 1,058.8 1,191.1T2 Caustic recov. 32.3 58.1 174.4 193.7T3 Computer e.m. 35.2 56.3 140.8 140.8
Emissions
3.192 Pollutants emitted by the textiles industry are as follows:
(a) Wastewater. About 750 million tons need to be treated annually, of which80 percent is from printing and dyeing. It is estimated that 67 percent istreated (1990) and 72 percent of printing/dyeing waste water is treated tomeet the national discharge standards.
(b) Waste gases. These are mainly the 228 billion cubic meters of combustiongases emitted from the burning of 22 million tpy coal in boilers, containing387,200 t of S02, 44 million t of CO2 and 200,000 t of nitrogen oxides:

- 92 -
123,200 t of particulates are also emitted. The textile industry (excludingTVEs) operates almost 18,000 boilers with a total steam raising capacity ofabout 55,000 t/h.
(C) Solid wastes. These are mainly the ashes and slags from coal burningboilers, amounting to about 5.5 million tpy. This material is used in ruralareas for road building and brick maling. Any waste industrial material iseither sold or buried.
3.193 It is recognized that proper combustion control is necessary to reduceemissions of carbon particles (unburned fuel) and dust, and to reduce carbon dioxideproduction by using less fuel. Most boilers are now fitted with dry or wet dust removingequipment.
F. CEMICALS
Industry Prolile and Products
3.194 The growth of the chemical industry since 1949 has been substantial. Inthe 1970s, as petroleum and natural gas production expanded, major chemical plantconstruction included 13 large ammonia plants and one large ethylene plant (300,000 tpycapacity): these were built using imported technology. During the Sixth and SeventhFive-Year Plans (1976 to 1985), a large number of chemical plants were built and majorproduction sites developed, mainly using locally-based technologies and some importedequipment. The rate of development of the chemical industry was higher than most otherbranches of industry until about 1970. Growth rates and output value indices are presentedin Table 3.33.
3.195 The Chinese chemical industry is very diverse and manufactures over 30,000different products, many based on coal as a fuel and feedstock, others on oil or naturalgas. For some items, such as chemical fertilizers, sulphonates, caustic soda, calciumcarbide and synthetic rubber, China ranks amongst the largest producers in the world.Output data for major products are given in Table 3.34.
3.196 There are over 20 subsectors of the chemicals industry-important onesinclude mining of chemical products, synthetic fertilizers, inorganic and organic basicchemicals, plastics and similar synthetic materials, fine chemicals, petrochemicals,synthetic rubber and rubber articles, and the production of chemical plant machinery.Numbers of enterprises and output values for various subsectors are shown in Table 3.35.
3.197 There are now more than 6,500 enterprises in the chemical industry, dividedinto large, medium and small-scale plants according to capacity or total fixed assets.Table 3.35 shows the chemical industry consisted of 3.5 percent large plants, 10.1 percentmedium and 86.4 percent small plants in 1990. Many of the large and medium enterpriseswere built in the late 1970s, although some date from the 1950s. The proportion of largeand medium plants has risen from about 4 percent in the late 1970s to about 13 percent by

- 93 -
Table 3.33: OurPuT VALUE INDICES AND GROWr RATES FOR THE CHEMICALSSECTOR AND THE INDUSTRIAL SECTOR
Output index Annual growth rateChemical Total Chemical Total
Year/period sector industry sector industry
1952 100.0 100.01950-52 60.8 34.8
1953 131.8 130.31954 172.3 151.6.1955 190.7 160.01956 285.9 204.91957 353.6 228.6
1953-57 28.7 18.01958 678.4 353.01959 956.8 481.71960 1,139.0 535.71961 727.5 330.31962 632.4 276.0
1958-62 - 12.3 3.81963 745.2 299.41964 947.4 358.11965 1170.8 452.8
1963-65 22.8 17.91966 1,502.0 547.41967 1,362.8 471.81968 1,282.3 448.11969 1,889.1 601.61970 2,243.0 793.1
1966-70 13.1 12.01971 2,662.3 915.31972 2,971.5 978.21973 3,284.2 1,071.21974 3,103.8 1,077.71975 3,672.5 1,244.7
1971-75 10.4 9.31976 3,612.5 1,274.91977 2,488.7 1,461.11978 4,980.4 1,659.01979 5,354.1 1,805.31980 5,643.5 1,972.3
1976-80 9.0 9.61981 5,611.3 2,057.21982 6,186.8 2,217.8 10.3 7.81983 6,926.2 2,465.9 12.0 11.21984 7,509.9 2,867.4 8.4 16.31985 7,916.7 3,480.9 5.4 21.4
1981-85 7.0 12.01986 8,521.7 3,887.0 7.6 11.71987 9,794.5 4,574.7 14.9 17.71988 11,064.2 5,525.6 12.9 20.81989 11,742.7 5,997.3 6.1 8.51990 12,428.5 6,465.1 5.8 7.8
1986-90 7.8 13.2

Table 3.34: Ourpur OF SELECTED CIEMICAL PRODUCTSAll figures expressed as thousand tons per year
CalciumSelected Ores Acids Caustic Sodium Chemical Ferilienrs carbide Carbon
Year FeS Ore Phosphor. Sulfuric Nitric Sodi Carbonate Nitrogen Phosphor. Potassium Total Ammonia (300 Ilkg black35% Ore 30% Acid Acid HCL 100 pet (Soda ash) fert. (N) Fert (P) Fest. (K) acetylene)
1981 5,380 10.860 7,807 184 1,296 1.923 1,652 9.,57 2,08 26 12,391 14,834 1,513 1441982 6,190 1,t730 8,174 246 1,483 2.073 1,735 10.21t 2,537 25 12,780 15.464 1.564 1641933 7,350 11,630 3,695 256 1.583 2.123 1,793 11.094 2,665 29 13,788 16,671 1,807 1901934 8,010 14,210 8,17 258 1,704 2,222 1,330 12.211 2,359 31 14,601 18.371 1,346 223
.1985 6,820 6,970 6.715 274 1,856 2,349 2,009 11,439 1,753 21 13,218 16,409 1,933 2471986 7,830 9,790 7,630 275 2,059 2.158 2,144 11,588 2,325 25 13,933 16,579 2,147 2801987 10,550 14.870 9,830 290 2,270 2,735 2.334 13,422 3.239 40 16,701 19,392 2,391 2901988 11,160 13,220 11,112 302 2,462 2.978 2,619 13,608 3.607 53 17,263 19,793 2,253 2901989 12,200 19,980 11,526 412 2,570 3.208 3,029 14,240 3,663 32 17,935 20,691 2,460 3201990 12,740 21,550 11,969 318 2,023 3,352 3,793 14.637 4,116 46 18.799 21,290 2,281 327

- 95 -
Table 3.35: CHEMICAL SECrOR ENIERPRISES AND OUrPUT VALUES
1990 1991Number of Output Number of Outputenterprises value enterprises value
(%) Y 109 Y 109
Total 6,668 1,394.3 6,564 1,519.3Large scale 232 (3.5%) 477.7 253 561.9Middle scale 672 (10.1%) 365.2 755 405.6Small scale 5764 (86.4%) 551.4 5,556 551.8
Mining 205 (3.1) 18.1 202 20.0of which, sand/stones 2 0.1 2 0.1Chemical ores 203 18.0 200 19.9
Basic chem. materials 1,065 (16.0) 234.4 1,044 237.6Chemical fertilizers 1,775 (26.6) 344.8 1,737 368.8
of which, N fert. 1,093 263.0 1,052 273.7Small ammonia 1,033 167.4 993 173.4P fertilizer 592 78.1 573 96.2K fertilizer 1 0.1 1 0.1compound fertil. 89 3.7 111 8.8
Chemical pesticides 210 (3.1) 64.1 333 75.4Organic chemicals 1,329 (19.9) 297.6 1,307 337.1
of which, basic mat. 325 105.5 323 126.5Paint, pigments 343 79.5 338 89.2Colorants 100 36.2 97 38.3Chemical reagents 88 8.9 88 9.0Catalysts 266 38.1 267 43.8Adhesives 27 1.9 267 43.8Magnetic materials 16 2.5 11 1.5Miscellaneous 164 25.1 159 26.7
Synthetic materials 106 (1.6) 39.8 112 58.4Light sensitive materials 8 (0.1) 4.8 7 5.6Rubber products 1,049 (15.7) 290.1 1,015 308.2Chemical machinery 245 (3.7) 23.8 238 26.0Others 676 (10.1) 76.8 680 82.2
the late 1980s. The fertilizer enterprises represented 26.6 percent of the total number ofenterprises (the largest category), with other major subsectors being organic chemicals(19.9 percent of enterprises), basic chemicals (16 percent) and rubber processing(15.7 percent).

- 96 -
3.198 The smaller plants are very widely distributed: for example, almost everycounty has a fertilizer plant. Larger plants are located in areas with greater industrialconcentrations and good technical support. The location of enterprises and the distributionof output values are given in Table 3.36 and summarized in Table 3.37.
3.199 The annual output of fertilizers has been around 18-19 million tons in recentyears. The output of nitrogen fertilizer is over 14.5 tpy, about 80 percent of the totalproduction, within which urea makes up 33 and ammonium bicarbonate 60 percent(Table 3.38). The raw material for nitrogen-based fertilizers is synthetic ammonia, theoutput of which is about 20 million tpy, 22 percent from medium-scale plants, 22 percentfrom large plants and 56 percent from small plants. A variety of feedstocks are used butmore than half the ammonia is made from coal (see Table 3.39).
3.200 The annual output of phosphorous fertilizer-mainly calcium phosphate andcalcium magnesium phosphate-has been around 4 million tons in recent years, or about20 percent of fertilizer production. The output of ammonium phosphate has beenincreasing and is now about 3 percent of phosphorous fertilizer production. The trend istowards a greater proportion of phosphorous fertilizer in the total chemical fertilizerproduction.
3.201 There is relatively little production of potassium-based fertilizers. The annualoutput is only about 30-40,000 tons, 0.2 percent of fertilizer production.
3.202 Another basic material is sulfuric acid, the annual output of which has been11-12 million tons recently, about 82 percent of which is typically made from pyrites, 15percent from smelter gas and 3 percent from raw sulphur. Various grades of sulfuric acidand related products are made, such as high concentrate oleum, battery acid and liquidS03. Oleum production is about 350,000 tpy and liquid sulfuric acid about 40,000 tpy.Some plants still produce ammonium bisulphite, ammonium sulphite and liquid S02.
3.203 Caustic soda manufacture is important and output has been increasing inrecent years to around 3 to 3.4 million tpy. A number of technologies are used, such aselectrolysis by the diaphragm or mercury cathode process: about 90 percent of causticsoda is now made by the diaphragm electrolysis route. In 1988, China imported a 10,000tpy plant for maldng caustic by the ion-exchange membrane process. This uses less energyand gives high quality product with less pollution. Caustic soda output by this technologyhas now reached about 300,000 tpy and is expected to increase.
3.204 The output of soda ash exceeded 3 million tpy in 1989, of which about 70percent was made in eight large plants and the remainder in small or medium-scale plants.It is expected that the proportion made in the larger plants will increase-three plants withcapacity of 600,000 tpy each are to be brought on-line soon. The processes used are theammonia-soda route and the joint process, the former representing about 56 percent of thepresent production after commissioning the new plants.

- 97 -
Table 3.36: CEMICALS ENTERPRLSES AND OUrTPU VALUES BY LOCATION
1990 1991No. of Gross output No. of Gross output
enterprises value 10' Y enterprises value 109 Y
Total 6,668 1,394.3 6,564 1519.3
Beijing 38 49.0 38 50.4Tianjin 209 58.1 210 58.8Hebei 442 72.4 432 80.5Shanxi 245 36.7 230 38.0Neimeng 137 13.5 137 14.1Liaoning 489 100.3 512 107.0Jilin 244 66.5 171 68.7Heilongjiang 218 36.2 236 38.4Shanghai 235 108.8 225 117.6Jiangsu 446 125.9 443 137.1Zhejiang 239 60.8 232 70.5Anhui 252 38.1 254 42.2Fujian 142 28.3 142 31.6Jiangxi 171 18.7 159 19.7Shandong 455 125.7 465 138.5Henan 395 63.4 371 75.0Hubei 313 60.8 328 65.6Hunan 349 54.7 346 60.3Guangdong 324 64.8 325 77.9Guangxi 142 24.2 138 25.9Hainan 14 2.2 14 2.5Sichuan 376 81.2 380 87.3Guizhou 125 21.1 113 22.7Yunnan 198 32.0 199 34.7Xizhang 1 1Shaanxi 169 20.2 159 21.5Gansu 84 11.0 88 1.8Qinghai 29 2.7 29 2.6Ningxia 41 8.6 46 9.0Xinjiang 146 8.5 141 9.6

- 98 -
Table 3.37: SHARE OF CHEMICALS OUTPUT BY REGION
Percentages of 1987 1988 1989 1990national output
Eastern coastal /a 58.6 58.4 57.8 58.0
Central inland Lb 34.1 34.2 34.5 33.9
West region L 7.3 7.4 7.7 8.1
L4 Liaoning, Hebei, Shandong, Jiangsu, Zhejiang, Fujian, Guangzhou, Hainan, Tianjin,Beijing, Shanghai.
Lb Heilongjiang, Jilin, Shanxi, Shaanxi, Anhui, Jianxi, Henan, Hubei, Hunan, Sichuan.L~ Neiming, Ningxia, Gansu, Qinghai, Xinjiang, Xizhang, Yunnan, Guizhou, Guangxi.
3.205 The output of calcium carbide is now about 2.3 million tpy, more than halfproduced by small furnaces. It is not expected that carbide production will increase infuture.
Energy Use
3.206 For fuels, electricity and feedstocks, the chemical industry consumes around90 million TCE of energy every year, representing about 9 percent of the national energyconsumption. Energy use is increasing at 2-3 percent each year. Figures for energy useby type of energy and by subsector of the industry are presented in Table 3.40. Asindicated in this table, the chemical industry uses a large amount of energy resources asfeedstock (over one third of total consumption of energy products). A detailed breakdownof energy use by industry subsectors and by type of energy source is given in Table 3.41.
3.207 The variation in energy consumption across more than 6,500 enterprises isof course very large. However, many of the plants are small and there are relatively fewwhich can be considered large energy consumers. The following approximate figures areavailable:
Annual consumption < 20,000 TCE say 4,700 enterprises> 20,000 TCE say 2,000> 50,000 TCE say 200
3.208 Steam is used widely in the chemical industry as a heating medium, a rawmaterial and as a means of producing electricity. About 150 million tpy are used-80million for processes, 30 for heating and 40 for electricity generation. With respect to

- 99 -
Table 3.38: CoMPosrmON OF FERTn:R PRODUCTS
Production Percent Percent of10C t of total each type
Nitrogen fertilizer
Ammonium sulphate 0.104 0.7Ammonium nitrate 0.579 4.0Urea 4.885 33.4Ammonium chloride 0.387 2.6Ammonium bicarbonate 8.480 58.0Urea solution 0.071 0.5Other 0.126 0.9
Subtotal 14.632 77.9 1000
Phosphorous .fertilizer
Calcium phosphate 2.891 70.2NPK fertilizer 0.975 23.7Ammonium phosphate 0.110 2.7Other 0.140 3.4
Subtotal 4.116 100
Potassium fertilizer 0.046 0.2
IMS1 18.794 1CHQ8D
electricity, 63 billion kWh are consumed annually, with a very rough breakdown estimatedas follows:
109 kWh
Process (e.g., electrolytic) 5Air compression 7Pumping 20Ammonia compressors 11Lighting, maintenance 3Heating, all other uses, losses 17
Total 0

- 100 -
Table 3.39: FEEDsTOCK FOR AMMOmA PBODUCIION, 1990
Quantity Percent106t
Anthracite 11.598 52.6Coke 0.933 4.2Coke from TVE's 0.909 4.1Brown coal 0.600 2.7Heavy oil 2.200 10.0Natural gas 3.610 16.4Oilfield gas 0.238 1.1Coke oven gas 0.230 1.0Refinery gas 0.081 0.4Light oil 1.641 7.4Others 0.014 0.1
Total 22.054
3.209 Energy consumption data for the manufacture of major products arepresented in Table 3.42 in terms of total energy and specific energy consumptions.
3.210 Part of the energy consumed by the chemical industry is provided bygovernment (the "planned" amount) and some must be purchased on the open market.Prices can vary considerably: for example, the price of heavy oil in late 1992 was aboutY 200 per ton for "plan" oil but around Y 480/t on the open market. The insufficiencyof supply of natural gas and oil fuels is particularly acute, with the potential demand beingsatisfied to an extent of only about 60-80 percent. Only about 80 percent of potentialelectricity demand is met. Even the demand for coal cannot be met due to seriouslimitations on coal transport.

Table 3.40: ENERGY CONSUMPTrON IN THIE CIMICAL INDUSTRY
1959 0 1988 1QQ1990-- ~ ~ 1981989100 TCE Percent 10' TCE Percent 10° TCE Percent 10 TCE PerCent
Primary energy use excI. electricity 210.98 51.0 44.10 52.2 45.83 52.0 46.67 52.1Energy as feedstock 152.78 36.9 30.96 36.7 32.22 36.6 32.03 35.8
Subtotal 363.76 88.0 75.06 88.9 78.05 88.6 78.70 87.9Electricity 49.80 12.0 9.35 11.1 10.04 11.4 10.86 12.1
Total 413.56 100.0 84.41 100.0 88.09 100.0 89.56 100.0
Share of national energy use 9.2 9.2 9.2 9.1
By energY tYPecoke and purchased steam 237.10 57.3 49.36 58.5 51.00 57.9 50.57 56.5oil fuels 23.85 5.8 4.50 5.3 4.88 5.5 5.06 5.6gas 30.66 7.4 5.90 7.0 6.70 7.6 6.09 6.8electricity 115.29 27.9 22.94 27.2 23.85 27.1 24.50 27.4other 6.66 1.6 1.71 2.0 1.66 1.9 3.34 3.7
Total 43.56 1 84.41 IQ0 88.0 10.0 8956 100.0
By subsectorchemical mines 3.71 0.98 0.64 0.8 1.38 1.6 0.79 0.9basic chemicals 68.70 16.6 13.66 16.2 13.73 15.6 14.99 16.7fertilizers 249.53 60.3 52.76 62.5 53.36 60.6 51.97 58.0
of which, N fertilizers 290.58 55.8 48.61 57.6 49.25 55.9 48.07 58.7pesticides 5.91 1.4 1.20 1.4 1.30 1.5 1.35 1.5organic chemicals 49.91 12.1 10.84 12.8 10.73 12.2 11.45 12.8rubber products 13.56 3.3 2.61 3.1 2.85 3.2 2.91 3.2chemical machinery/equipment 1.17 0.3 0.24 0.3 0.24 0.3 0.23 0.3other 21.07 5.1 2.46 2.9 4.50 5.1 5.87 6.6
Total 413.56 10Q0- 84.41 100-0 88-09 100-0 9 1

Table 3.41: ENERGY RESOURCE CONSUMPTON IN 1990 (I)The whole nation
MewUd uti too
Raw coal Coal by eokima Coke Coke Heavy oilamong among amongEnter- AAmona whkh: which: among which: Cnrde whtcbprise Bought Bitwni. Wubal Other aelf- which: self- - oil self-unit Sub- Antiha. outer nite 5g- Sub- rertal washed Sub- supply mechine supply sub- Sub- supplyName number total cite briquet coal nite total coal coal total & use coke & use total totl & use
First 1 2 3 4 5 6 7 a 9 10 I1 12 13 14 25 16
I. Total 4.395 55.020.073 25.912.997 34.971 27.897.254 1,174.848 5,109.6294,339,682 174.128 7,361.278 858,128 1,35t.788 557.878 199,254 3.044.223 511,9572. tLae sized enterprise 210 10,583,481 1.7151,58 8 8.657.251 168.650 3.655,141 3.655.011 56.254 2.232.423 634,391 1,652.277 550.878 129.418 1.727.829 478.5483. Modium sized enterprise 589 11.182,932 3.410.043 27 7,182.012 899.t50 832.151 533.853 29.089 1.843.598 2.558 12t.294 0 33,759 824.117 04. Smll sized enterprise 3.587 33.273.680 20.745,438 34.943 12.087,951 405.343 622.337 150.793 I8t823 3.292.258 21.242 178.217 0 38,077 293.077 3.4195. Chemlal industry sew materia total 1.75t 24,454,372 22.245.824 5.843 2.007,400 195.765 209 0 48,785 8,434.309 578.398 1,117.222 517.249 188,908 1.253,257 299.2806. Non-metallicmining It5 423.578 91,238 0 332.310 29 4.530 4.494 0 110.731 0 1.048 0 14 1.983 07. sm g which: oil-aand tone mnbLLng 2 0 0 0 0 0 0 0 0 0 0 0 0 0 0 08. Cbntry mining 289 423.518 91.238 0 332,310 29 4,530 4,494 0 110,731 0 1.048 0 14 1.983 09. Elnentazy e--nks sew materal
Indusy 628 8.109,801 1,323,481 I 878,610 70.508 317.38 317.1381 59.331 1,295.497 168.0t8 581.768 168.888 16.100 253,661 4,77010. Fat;liwhlndsuy 1.621 36.676,789 23.,42.068 25,644 1,209,773 713,34121,072,487 1,002.009 79,392 5,248,9921,940.171 395,354 272,523 2,326 811.944 5,84211. amon wbich nitogen feitlire
industry 1.07 3S.286,738 23,205.303 25,442 1.138,074 892,244 894.702 824.349 75,075 3.913,724 157,142 284,980 133,345 1.297 805.944 5.,4212. Small thoget reutiliaehdiutay 1,017 28,583.210 20.326.359 25,442 72011 231.293 258.087 115,1734 72.255 1.713,953 23.797 55.117 0 1.097 195,887 642I3. Poaphatfer(izes lhdusty 50t 1,37.182 638.477 202 70.813 20,887 I7.785 177.660 1,802 1,335.204 39,175 113,394 39,175 28 65,998 014. Potdsh featizhdustry 0 0 0 0 0 0 0 0 0 0 0 0 0 0IS. Cmomd felizeri Indota 33 14,869 288 0 10,351 230 0 0 2.55 84 0 0 0 7 0 0

Table 3.41: cont'dThle whale nation Meaoed uami ton
Raw Coal Coal by aokifl Coke Coke Hex" oil
among among amongEnter- Aumna which: which: among which: Cnse which.prie Bought Bitumi- Washed Other setf- which: eUf- oil *U-unit Sub- Anthm- outer nite Lig- Sub- refined washed Sub- supply mchine upply ub- Sub- supply
Name nmber total cie briquet cool nite total codl col total & use coke & use total total h ue
Fa"t I 2 3 4 5 6 7 8 9 to It 12 13 14 IS 16
16. Chemical peaticde industzy 169 878.272 135.781 0 710.,6i 14.64t 0 0 900 18.322 0 4.166 0 * 1.654 0
17. Orqanic chancproducts industy 732 4.413.896 183.31 394 4.024.083 205.612 61t.142 61t.142 4.796 358.376 216.46t 252.262 216.46S 171.159 311.350 450.509
13. among which: organic emical swmstual induy 217 2.157.428 83.129 4 2,010.149 55.150 482.494 482.494 0 323.914 216.46t 244.057 216.463 21.474 407.212 400.3S7
19. Coating and pigment Ind" 173 499.339 41.874 0 463.574 7.591 2.535 2.585 0 13.066 0 1.901 0 8.354 31.469 0
20. Dyeaffioduyty 61 633.09 19.355 269 590.018 19.858 0 0 0 5.532 0 5,204 0 0 10.901 0
21. Cbemca lgat idudty 29 50.532 0 0 50.532 0 3.092 3.092 0 277 0 0 0 0 0 0 t
22. Catayst and oert of dtanicl 0auxiliary Induta 14t 333.512 27.S21 107 500.621 105.263 149.971 149.971 4.793 15,5t7 0 1.700 0 140.592 222.509 2.261
23. A eive hduat 13 12.375 1.771 0 11,t04 0 0 0 0 0 0 0 0 99 0 0
24. Msgnd t creunmateri isdtutq 9 8.743 0 0 743 0 0 0 0 0 0 0 0 0 334 0
25. Other organi ebnical productbduhby 32 418,369 10.3t1 14 390.024 17.950 0 0 0 0 0 0 0 140 79.42S 3.512
26. Syntheab material usby 76 500.059 31.935 4.350 463.274 0 2.414 2.414 0 113.709 0 11.453 0 0 81.241 24.231
27. Lght amidve -- teinda uby I 30,M 0 0 30.m 0 0 0 0 0 0 0 0 o 6.327 0
23. Ruberpmoducts Indtua 328 2.71.751 249.487 4.038 2.383.021 15.225 15.053 15.053 24.122 409 0 179 0 943 85.215 0
29.Chabnkalaegineermechanks nduaby 16t 110.542 7.781 27 10.50 5,154 0 0 7 12.701 0 4.911 0 1.022 10.022 0
30. Other indudty 302 1.036.313 44.435 24 1,041,521 338 3.079,6222.330.819 5.61t 209.612 76,515 105,047 0 3,6t3 140.330 27.777

Table 3.41: cont'dTbe whole nation tenured unie ton
ElectricityOil ferfiloI plant Coke oven gm (ten power (ten
dry IU Natusi thou. cubic meter) thousand kWh)Uqui- Among &m Among Among Otber anersv reource (ton normal coal
(Isso- Keao- ifed whkb: (ten which: which: Amonit which:line mne Dicel petro- selI- thousand self- Bought eU- Other Other Othersub- sub- Sub- leun Sub- supply cubic Sub- supply outer Sub- supply Sub- coi petrol pyro
NaLme total total total gI" total & use meter) total & use vspor toua & use total gma products products Total
Second 17 IS 19 20 21 22 23 24 23 26 27 23 29 30 11 32 33
1. Total 470.209 20.324 131,140 22,319 111.733 94.440 474.443 212.527 105.,54 20.541,934 t.375.455 311.673 1.321.871 26.427 855.173 298.969 89,5J1.973
2. Large isizl enterprise 141.173 14.1S3 37.259 270 78.2U4 76.2U4 332.443 It.510 94,095 15,019.63t 2.042.895 257.142 933.430 19.618 555,171 143,112 3.129.022
3. Medium sized enterprise 128.734 1,599 33,924 17.322 1.942 0 24.308 22.354 8,194 3,943.383 1.335.007 31.,48 246.363 3,459 39,U45 114.350 17,431,015
4. Small ized enterprise 199.732 4.541 59,957 4.727 33.507 1.05t 117,1t4 3,993 3.585 1.57t,913 3.027.373 22,606 112.023 3.152 t0.153 41.0D7 40.334.700
5. Cbical raw materi l total 167.435 12.730 5.774 149 0 0 3t2.770 43,370 13.373 909.912 245,435 2.131 1.036.,47 3,321 570,903 131.395 32,033.540
6. Noa-mdft *lMing 21.252 33 20.379 0 0 0 0 0 0 0 78.089 4,314 0 0 0 0 785,525
7. Among whlch soil-sanddoncesmiing 0 0 0 0 0 0 0 0 0 0 30 0 0 0 0 0 274
3. Cbamlssmlhnn 21.252 33 20.379 0 0 0 0 0 0 0 7t,001 4.014 0 0 0 0 785,251
9. Elanentauy dchmcalltw material 47.618 2.337 38.575 13 0 0 17.15 t.l03 0 5.33,035 1.806.283 133,015 51.297 t.435 7.69t 7.915 14,9tt,070
10. Fertilizer hdustry 148.112 1.027 70,253 213 0 0 435,234 43.363 13.758 4,094.746 3.451t.76 136.503 51.597 3,449 13.9t5 273 51.985.556
11. Among whichl aitrogenfertlier 122.502 7m 5t.052 124 0 0 434.040 48.363 13.753 3.133.928 3.141.183 116,467 51.353 3.449 18.985 273 48.070.428
12. Small nitren ferftilker 61,622 533 13.313 24 0 0 112.621 2.165 2.165 91.709 2.203.459 21513 10.600 1.590 4.533 273 32.162.174
13. bophate fertilier 25.113 254 13,91 94 0 0 1.141 0 0 905.741 307.923 20.037 244 0 0 0 3.369.451
14. Potsh feutlizer 0 0 0 0 0 0 0 0 0 0 0 0 0 0 0 0 0
1s. Cmpoud fatilize 492 1 216 0 0 0 53 0 0 79 2.770 4 0 0 0 0 25,77

Table 3.41: cont'dThe whoke U Meaued uilt: ton
EktrityOil mrtety plant Coke oven gSu (ten power (ten
dry tan Natural thou. cubic meter) thouand kWh)lJqui- Amon gan Among Among Other en reaotUM (ton noml ce
Giso- Kero- ried which: (ten which: which, Amoftt which:
line eae Disel petro- se- thouand sef- Bought self- Otder Other Othersub- sub- sub- team Sub- supply cubic Sub- suply outer Sub- supply Sub- coad petrol pytn
Name total total toal s total t & use meter) total & ue vapor totl & we total gs prodnu products Total
Second 17 is 19 20 21 22 23 24 25 26 27 2t 29 30 31 32 33
16. Cbhaical petiide 10.779 174 8.233 231 0 0 0 0 0 1.359.901 14t.200 7.924 170 3 0 0 1.34S.285
17. organic eibcdl 161.734 4.183 32.743 3.863 74.644 74.644 1.69t 1.69t 15.373 5,292.9i 492.571 28.23U 1,079,493 1.924 576,436 225.497 9.5U3.261
It. Atong which: organkc*tmical Itw atera 18.051 1.027 .560 8.639 73.574 73.574 7.52t 10.549 10.542 4.571,193 343.500 17.972 743.115 151 53t.55S 21.363 5.743.375
19. Costing od pigmt 127.336 1.604 16.531 a5 0 0 329 329 0 130.619 29.449 46 7.024 1.52t 30 0 789.723
20. DyetIef 3.793 100 1.4t6 2 0 0 1.191 1.429 0 126.723 34.292 2.103 13,033 174 0 9.193 645,S40
21. Cemia msgeat tl99 33 123 0 0 0 19 223 0 19t.337 3.391 0 3.620 0 0 2.667 31,7t9
22. catayst a sont orchemical auxilnary 7.22t 1.1,1 3.609 i5 a 0 7.629 5.633 5.334 139.t63 46.,51 t.653 306.177 0 33.393 192.274 1,742.537
23. healfe 280 0 27 0 0 0 0 0 0 11,03 t09 1 22 0 0 0 13.212
24. Msgndaetordmatla 134 0 323 0 0 0 0 0 0 443 1.001 23 59 0 0 0 11.447
25. Oth otstnlc chnlcalptedcttb 3.733 232 2.034 2 1.070 1.070 0 515 0 114.6t9 33.472 1.430 6.332 73 4.455 0 569,088
26. Synthesmatesidl 3.360 37 1313 11,5U4 1,t40 1.340 1.654 1.497 0 2.209.085 203.280 533 23.549 3-41 5.593 3.137 1.754.821
27. UIght enaidwemal 936 3 t5 0 0 0 0 0 0 o 37.007 7,307 0 9 0 0 0 109.,t6
23. Rubber prducts 57,033 37 4.783 19 0 0 3 0 0 639.691 253.206 197 2,360 343 27 6.367 2.903,834
29. Chembcal engiert -chanIcl 5.696 96 2.446 44 0 0 I.5432 151 0 99.230 13,901 10 646 77 7 0 225.095
30. Odter 11335t 11.487 7,912 1.431 35.449 IMSS3 1.468 135.715 71,220 1.0t7.201 110.,05 931 112.750 11.305 43,135 50,227 5,t93964

- 106 -
Table 3.42: ENERGY CONSUMPTON FOR PRODUCTION OF SELCTED CEMCALS
1986 1987 1988 1989 1990
AmmoniaLarge scale
energy per ton ammonia MJ 41,168 41,868 41,575 40,110 39,374
Medium scalecoal kglt 1,279 1,315 1,299 12,79 1,293electricity kWh/t 1,384 1,409 1,408 1,413 1,393steam kg/t 2,730 2,600 2,690 2,550 2,526energy per ton ammonia MJ 65,531 66,018 64,828 64,272 63,785
Small scalecoal kg/t 1,722 1,851 1,829 1,782 1,676electricity kWh/t 1,293 1,445 1,455 1,383 1,333energy per ton ammonia MJ 68,216 71,347 70,836 68,622 66,323
Fertilizers, energy and feedstockN fertilizer TCE/t 4.12 3.90 4.14 3.94 3.86P fertilizer TCE/t 1.38 1.13 1.13 1.11 0.94Overall TCE/t 3.54 3.27 3.42 3.37 3.13
Fertilizers, electricityN fertilizer kWh/t 2,374 2,534 2,549 2,484 2,522P fertilizer kWh/t 815 850 776 833 747Overall kWh/t 2,070 2,154 2,128 2,158 2,078
Caustic sodatotal energy consumption 106 TCE 4.54 1.92 5.31 5.82 6.00
of which, coal 106 TCE 1.87 2.03 2.17 2.42 2.41electricity GWh 6,613 7,163 7,774 8,422 8,884
AC electricity kWhlt 2,626 2,619 2,610 2,625 2,650steam t/t 5.20 5.19 5.09 5.29 5.08overall TCE/t 1.80 1.80 1.78 1.82 1.79
Calcium carbidetotal energy consumption 106 TCE 4.95 5.26 4.95 5.66 5.02
of which, electricity 109 kWh 77.1 78.3 80.3 89.1 81.0
electricity use kWh/t 3,585 3,559 3,567 3,621 3,550total energy use TCE/t 2.3 2.2 2.2 2.3 2.2
Soda ashtotal energy use 10 TCE 1.05 1.16 1.21 1.43 1.94
in ammonia soda process TCE/t 0.560 0.570 0.544 0.539 0.613in joint process TCE/t 0.410 0.410 0.400 0.416 0.391overall TCE/t 0.486 0.494 0.475 0.479 0.517

- 107 -
3.211 With respect to the proportion of energy costs in relation to overallmanufacturing costs, these are generally high for many subsectors of this industry. Forexample, energy costs as a percentage of total manufacturing costs for some key productsare as follows:
(percent) Fuels Elec. Fuel & elec. Total energy
N fertilizer 25 70-75Caustic soda 7.5 17.5 25Calcium carbide 8 29 37Soda ash 19Sulfuric acid 12.5
Energy Efficiency
3.212 The wide range of processes, plant scale and age within the chemicals sectormeans that energy efficiencies are extremely variable. However, it is recognized that theenergy efficiency in the industry is generally rather low. Most furnaces are small, manyare chain grate stokers: the average combustion efficiency of chemical industry furnacesand kilns is estimated at 65 percent. Allowing for an efficiency of steam distribution ofsay 90 percent (and this may be too high) and of heat utilizing equipment of up to 70percent, the overall energy utilization is around 30-40 percent.
3.213 Some key process efficiencies are known to be low. For example, theefficiency of gasification for synthetic ammonia production is typically 50-60 percent, andthe evaporation stage to produce solid caustic soda say 15-20 percent.
Energy Efficiency Trends
3.214 Greater attention is being paid to energy efficiency and it is estimated thatthe overall energy consumption per unit of product was reduced by about 5.4 percentannually during the Sixth Five-Year Plan (1981-85) and is now being reduced by about 4percent per year. The elasticity coefficient for energy use (percent change in energy usedivided by percent change in production) from 1981 to 1990 was 0.57.
3.215 Measures taken by the industry in recent years range from improvingmanagement to major investments in new equipment and technologies. Greater attentionis paid to the recovery of by-product materials or wastes, including better heat recovery.Some examples of measures adopted in the production of ammonia and fertilizers inmedium and large plants are as follows:

- 108 -
(a) Recovery of hydrogen from purge gases.(b) Heat recovery in the synthesis gas reformer.-(c) Use of flash steam in CO2 recovery systems.(d) Computer monitoring and control of key process parameters, such as the
ratio of hydrogen to nitrogen, combustion systems, purge gas rates, etc.(e) Upgrading and increasing the size of small gasification units.(f) Gasification grate improvements and automated coke feeding.(g) Use of superheated steam in gasification.(h) Improved automatic control.(i) Use of heavy oil with carbon slurry for gasification feed.(j) More efficient CO and CO2 removal technologies.(k) Installation of waste heat boilers on medium-scale reformers.(1) Adoption of improved catalyst.
3.216 Small-scale ammonia plants are typical in the Chinese chemicals industry.About 40 specific measures are being widely enforced to save energy and reduce materialwaste. Many of these are similar to the measures listed above, and also include variousrevamp procedures such as improved gas recycling, measures for self-sufficiency in steam,and increased water recycling.
3.217 In phosphorous fertilizer manufacture, emphasis is being placed onmodifying furnace types, to waste heat recovery and to better process operation.
3.218 In the manufacture of caustic soda, a variety of energy saving measures arebeing utilized, such as:
(a) Improved electricity rectification.(b) Improvements to brine purity.(c) Replacement of graphite anodes by metal anodes.(d) Ion exchange techniques.(e) Adoption of triple effect evaporation.(f) Increased condensate recovery and heat utilization.(g) Control of electrolyte concentration.(h) Recovery of residual heat in hydrogen and chlorine.(i) Waste heat recovery from HCL synthesis reaction.
3.219 During the early 1980s, the production of calcium carbide was raised andtechnical improvements to the process were introduced, some of which were imported.These included:
(a) Converting open furnaces to sealed types allowing gas recovery.(b) Use of hollow electrode technology.(c) Using waste furnace gas for limestone calcining kilns, with improved gas
cleaning methods (estimated saving, 0.17 t coke per t carbide).(d) Wider use of computer control for reactor optimization.

- 109 -
3.220 Also during the first half of the 1980s, the soda ash industry expandedrapidly and the technical level was raised. Computers are now being used moreextensively and process improvements include the use of steam calciners, flash distillationof liquid wastes, larger carbonization towers, and vacuum distillation techniques.
3.221 Although the Chinese output of sulfuric acid is ranked third in the world,most plants are small. Only 40 percent of the production is made in medium or largeplants with capacities over 4,000 tpy. However, improvements in energy efficiency arebeing made, such as:
(a) Recovery of the heat of reaction to reach total heat self-sufficiency, and heatexport in some cases.
(b) Generation of electricity from steam produced by high temperature heatrecovery.
(c) Improved catalysts.(d) Adoption of heat pumps.
It is recognized that much medium and low level waste heat is available and could possiblybe recovered for useful applications.
Potential for Improvement
3.222 For the manufacture of fertilizers, the potential to improve energy efficiencyis good. The average energy consumption of a large-scale ammonia plant in China isabout 1.3 TCE compared with perhaps 1.2 TCE in more advanced countries. However,for medium-scale ammonia plants, the figure is 2.5 TCE, for small plants 2.2 TCE. Thereis estimated to be a potential saving of 0.1 to 0.2 TCE per ton of ammonia production, atleast in medium and large-scale plants. This amounts to about 1.3 million TCE savingsper year.
3.223 In the making of caustic soda, it is estimated that the difference betweenChinese electricity consumption and consumption in advanced countries is about 400 kWhper ton of product (2,500 versus 2,100 kWhMt). Overall energy consumption, includingthermal and electrical energy, differs by say 0.2 TCE/t (1.8 TCE/t in China versus1.5-1.6). Based on present output, this represents a potential saving of around 0.6 millionTCE/yr. If the ion exchange technology were to be adopted widely, this potential savingcould be doubled.
3.224 Similarly, it is estimated that potential savings for the manufacture of sodaash are of the order of 0.6 million TCE/yr, while savings for the calcium carbide are over130 million kWh/yr.
3.225 For the sector as a whole, it is expected that the energy used per Y 10,000output value will decrease from 13.75 in 1990 to 10 in 2000, with savings of around 60million TCE/yr.

- 110 -
Projected Industry Outputs and Energy Consuimption
3.226 According to plans, the chemical industry output is expected to increase by6.7 percent a year to reach Y 145 billion by 2000 from 77 billion in 1990, itself a doublingof the output in 1980. Chemical product quality will be improved and the pattern ofproducts will change, with a shift towards more downstream processing and moreconsumer products.
3.227 The anticipated outputs of major products are indicated in Table 3.43,together with forecasted specific energy consumptions. For the chemical industry, it isexpected that energy consumption will increase by about 3.7 percent annually. The totalenergy use by the industry is expected to reach about 125 million TCE in 1995 and 140million TCE in 2000.
Generic Investment Options
3.228 Three measures were selected for detailed examination as case studies in thechemicals sector, two concerning ammonia production and one relating to the manufactureof caustic soda:
CHI Renovation of medium-scale coal based ammonia plants.
Most small and medium-scale chemical fertilizer plants in China are basedon coal as a raw material and energy source. Many were built in the 1950sand 1960s and use old equipment and outdated process technology. Effortshave continued from the early 1980s to improve their operation by applyinga wide range of measures, and some success has been achieved. Majorrenovations to upgrade equipment and processes are possible, resulting inhigher energy efficiency and increased capacities. These include adoptingcogeneration systems, the use of steam turbines in place of large electricmotors, the use of improved shift reaction catalysts, and improvements toammonia synthesis towers.
CH2 Waste heat recovery in small coal based ammonia plants.
There are over 1,000 small coal based plants producing ammonia, mostlybuilt in the 1960s and 1970s: these make ammonium bicarbonate and areresponsible for over half the annual output of ammonia in China. Althoughefforts have been made to improve their energy efficiency over the years,equipment and processes are generally outdated. Major renovation of theprocess is possible, including improvements to synthesis gas generation, gascompression and treatment, and substantial improvements to heat exchangernetworks and more effective use of heat.
CH3 New membrane technology for caustic soda electrolysis.

- 111 -
Table 3.43: FoRECASTS OF OUTPUT AND SPECIFC ENERGY CONSUMPTONFOR THE CHEMICALS INDUSTRY
1990 1995 2000 2010
Output forecasts (million tons per year)
N fertilizers 14.64 15.70 18.35 20.00P fertilizers 4.12 5.00 5.50 9.00K fertilizers 0.05 0.30 0.48 1.00
Total fertilizers 11 210 24
Caustic soda 3.35 4.00 6.00 7.00Soda ash 3.79 5.20 6.85 8.00Sulfuric acid 11.89 14.00 13.00 20.00Calcium carbide 2.28 2.70 3.00 3.50
Specific energy consumptions (TCE/ton)
N fertilizers 3.86 3.40 3.26 3.05P fertilizers 0.94 0.92 0.89 0.87Average 3.13 2.80 2.65 2.45
Caustic soda 1.79 1.70 1.60 1.45Soda ash, Solvay process 0.61 0.59 0.55 0.46Soda ash 0.39 0.38 0.35 0.30Calcium carbide 2.20 2.14 2.00 1.80Ammonia -- large scale 1.10 1.07 1.00Ammonia -- medium scale 1.93 1.79 1.75Ammonia - small scale 2.00 1.88' 1.80
Electrolysis of brine for caustic soda production consumed about 15 percentof all the electricity used by the chemical industry in 1990. Most Chineseplants use either metal or graphite electrode technology and energyefficiencies are moderate to low. Modern membrane technology can allowimportant reductions in electricity use and will also allow higher qualitycaustic soda to be produced which is suitable for export markets.
3.229 Based on actual plant data from enterprises where the above measures havebeen or will be installed, economic evaluations were carried out with the following results:

- 112 -
IRR % Payback, years La
CH1 Renov. medium plants 19.5 10CH2 Waste heat recovery 71.4 3CH3 Membrane technology 29.4 6
La Payback includes construction time.
3.230 Based on sector characteristics, forecasts of adoption of the measures listedwere made for business as usual and accelerated scenarios. These are as follows, referredto annual plant capacity in million tpy ammonia:
1990 2000 2010
CH1 Renov. Medium-Size Plants (million tpy NH3 )
BAU not renovated 1.5 1.5 1.5renovated 0.0 0.0 0.0
Accel. not renovated 1.5 1.2 0.6renovated 0.0 0.3. 0.9
CH2 Waste Heat Recovery, Small Plants (million tpy NH3BAU unmodified 7.5 6.0 0.0
with WHIR 0.0 1.5 7.5Accel. unmodified 7.5 4.5 0.0
with VHR 0.0 3.0 7.5
CH3 Membrane for Caustic Soda (million tpy caustic)BAU unchanged technology 3.0 3.0 2.7
with membrane 0.0 0.0 0.3Accel. unchanged technology 3.0 2.4 1.5
with membrane 0.0 0.6 1.5
3.231 Further details of the assuimptions made and the energy and emissions factorsused in the calculation are given in Appendix A.

- 113 -
Projected Impacts on Energy and Emissions
3.232 Using the forecasts indicated above, the expected impacts on energyconsumption in the chemicals sector are as follows:
Savings 103 Savings 103TCE/vr by 2000 TCE/yr by 2010
BAU Accel. BAU Accel.
CH1 Renov. medium plants 0 123.7 0 371.0CH2 Waste heat recovery 414.1 828.2 2,070.4 2,070.4CH3 Membrane technology 0 528.7 264.3 1,321.7
Reductions in CO2 emissions were calculated as follows:
CO2 reduction CO2 reduction1l3TPY by 2000 1J03 TPYby 2010
BAU Accel. BAU Accel.
CH1 Renov. medium plants 0 93.3 0 280.0CH2 Waste heat recovery 270.2 540.4 1,350.9 1,350.9CH3 Membrane technology 0 352.2 176.1 880.6
Emissions
3.233 The chemical industry is a source of a wide variety of pollutants and wastematerials. In 1990, the industry produced about 40 million tpy of solid wastes, of which14 million tpy were produced from furnaces of all kinds. Gaseous wastes totalled about700 billion cubic meters and liquid wastes about 6.9 billion cubic meters.
3.234 Solid wastes are very diverse and include unreacted materials, products thatfail to meet specification, spent catalysts, ashes discharged from furnaces and frompollution control equipment, and muds from water treatment systems. The quantity ofsolid waste produced by the industry is substantial-typically, one ton of product is madein conjunction with 1-3 tons of solid waste (and sometimes as much as 12 tons). Anindication of the quantities of important waste materials produced each year is given inTable 3.44 together with estimates of the proportion of materials that are used. Table 3.45provides examples of waste products and their potential utilization.

- 114 -
Table 3.44: UU=ZATION OF WASTE MATEPILS
Annual Amount PercentType of waste material production reused utilization
103t 103t
Coal ashes and residues 11,200 10,700 95.5Oil residues 75 59 78.7Waste from caustic soda 1,300 210 16.2Residues from FeS ores 7,700 5,800 75.3Residues from yellow P 340 328 96.5Industrial kiln slags 795 566 71.2Waste water treatment sludge 236 210 89.0Residue from carbide manufact. 1,128 843 74.7Residue from chromium manufact. 110 45 40.9Residue from soda ash manufact.- 400 43 10.8
3.235 Large quantities of liquid wastes are also made by the chemicals industry,which consumes 13 billion cubic meters of water annually. Of this, about 6.9 billion cubicmeters are discharged as liquid pollutants. It has been estimated that, on average, therecycling of water in the chemical industry is 35-40 percent, and the industry dischargesabout 0.05 tons of waste liquid per Y 10,000 output value. In some enterprises locatedin areas where water is scarce, water recycling has reached 80 percent, indicating thescope for improvement generally.
3.236 The chemical industry is also responsible for large quantities of waste gasdischarges. It is estimated that about 25 million tons of CO2 and 0.85 million tons of S02are emitted each year. Table 3.46 provides information on the quantities produced andextent of utilization of some major gaseous emissions.
3.237 In future, the absolute quantities of solid, liquid and gaseous emissions areexpected to increase because the output of the chemical industry is expected to continueto grow at 6 to 7 percent annually. However, with improved energy efficiency and greaterconcern for pollutant reduction, emissions per unit of production will be decreased.
G. PrrRocEEScAxS
Industry Profile and Products
3.238 The petrochemical sector is a major energy consumer, using energyresources both for operating plants and processes and as a raw material for most of theproducts. Most of the sector is under the overall management of the China Petrochemical
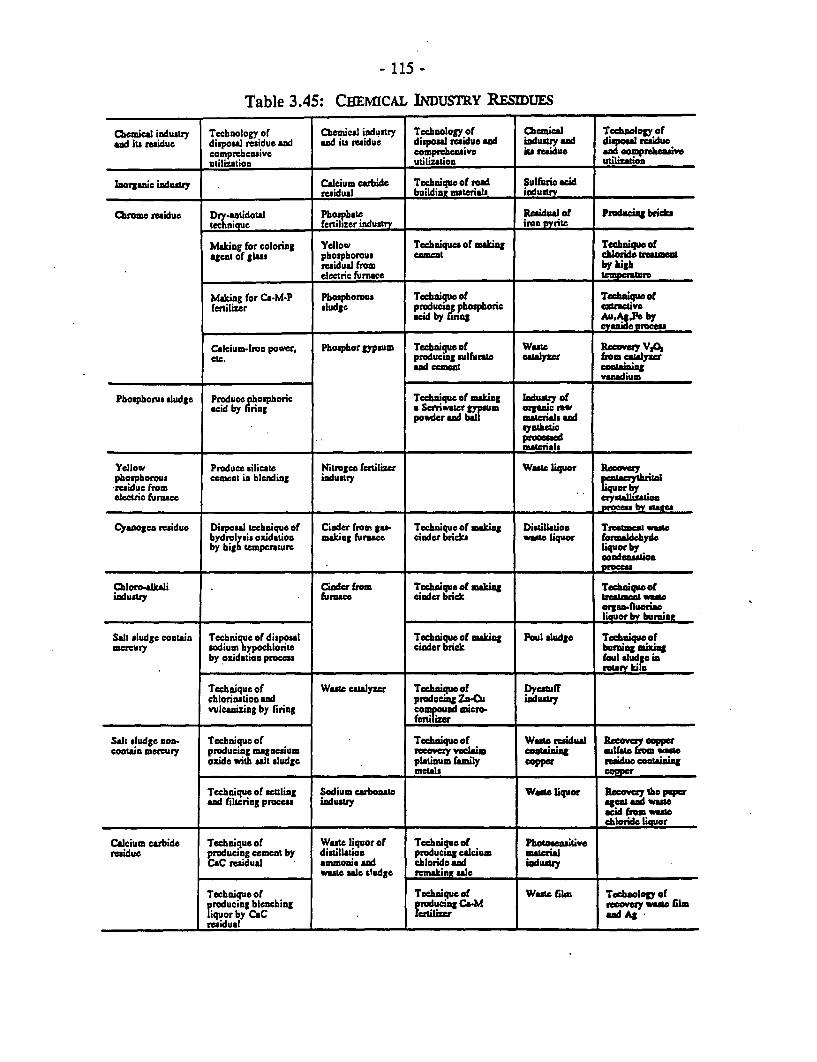
- 115 -
Table 3.45: CHEMICAL INDUSTRY RESIDUES
Cbemical industry Technology of Ciemicsl industry Technology of Cbsaeicl Techology ofand iu residue disposal rsidue and and iu ruidue disposal residue and industry and disposal residue
comphensvive comprehensivo iu rsidue and oomprehensiveumtilizetion utilization utilization
Ixnoranic induatsy Cailium carbide Tochnique of rend Sulfuric acid_reidual buildint materials industry
Chme raidue Dry e tidoqul Pborpt Residuac of Producig brikbtechnidqol fertilizer industry iron pyrite
Making for coloring Yellow Techniques of making Teiqueofagent of glas phosphorous cement chloride
esidual from by highelectric furnace tempeausre
Making for Cn-M-P Phosphorous Toechiqueof Tedniquoofferitizer sludpe producing phosphoric eetivo
acid by firngs AssA,Peby
Calcium-Iron power, Phosphor gypsum Technique of Was"e Reovey VAetc. producing sulfur,e Catalyze from catalyzer
and cemeat containingvandium
Phosphorus sludge Produce phosphoric Technique of maing Indu"try ofacid by tiring a Seriwatergypum organie rnw
posder and ball materials Nd
procamd.___________ ___________ . __________________ .________ Pm aterials
Yellow Produce silicate Nitrogen fertilizer Wasto liquor Rveqyphosphorous cemeat in blending industry-midue froms rCq1uW*r b,rl Ieleetric furnace bysization_ _______________ _______________ __________________ ____________ process b y cate
Cyanogen rmsiduc Diposal tecbnique of Cinder fror gas- Technique of making Distiaton Treatmn wTAtehydrolysis oxidation making furnace cinder bricks waft liquor foraldeydeby high tcperturc liquor by
oondnaation_ _ _ _ _ _ _ _ _ p~~~~~~~~~~~~~~~~~~~rocess
Cbloro-alkali Cinder from Technique of making Techniquo ofindusty furmce cinder brick trtmnt WaS
organ.-fluorineliquor by burning
Salt sludge conuain Technique of disposal Techniquc of making Poul sludge Tochniquoofmercury aodium bypochlorite cinder brick burnag msxsn
by oxidation proceus fool alud Gs's.~~~~~~~~~~~~~~~~~~~mr . Otkilo
Technique of Wate catalyzer Tochnique of Dycatuffchlorination and producing Z-Os industvulcaniing by firing compound eicro-
fertilizer
Salt sludge non- Techniqueof Technque of Wast residual Reowvy coppeconatin meccury producing magnesium recowey vcaim coaiin ulfato fom wa
oxide with salt sludge platinum family copper rasidue COtaininmetals copper
Technique of sculing Sodium carbonatc Waft liquor Recovery the pprand filtering proceu industry Sgnt and wat
acid froste_______ _______ ______________ _____ _chloride liquor
Calcium carbide Technique of Waste liquor of Technique of Photosensitiveresidue producing cement by distillation producing calcium matel
CsC reidual ammonia Sad chloride and industywaste sale Ltudge remaking sale
Technique of Tchnique of WA"t film Technology ofproducing bleaching producing C-M recowery wa filmliquorby CC ae Artilizer udAresidual

- 116 -
Corporation (SINOPEC) and this report covers primarily these activities, which includeboth oil refining and petrochemical manufacture.
Table 3.46: WASTE GAS PRoDucrToN AM UTLZATION
Annual Amount PercentType of waste gas production utilized utilized
106 m3 106 m3
Calcium carbide furnace gas 9,840 128 1.3Coke oven gas 1,500 1,410 94.0Yellow P furnace gas 3,250 946 29.1Fertilizer furnace gases 720 346 48.0Electrolytic hydrogen 40 27 66.8Benzene plant tail gas 240 29 12.0Synthetic ammonia plant gases 39,744 28,218 71.0Carbon black tail gas 3,520 2,288 65.0
Total 58.854 33.391 57
3.239 In 1990, the total industrial output of SINOPEC reached Y 44.2 billion.The SINOPEC plants processed 96.9 million tons of oil out of 107.2 million tonsprocessed in China. About 4 million tons of crude oil were imported in 1990. Productsincluded:
Product Quantity 103 t
Gasoline, diesel, luboils 47.21Ethylene 1.44Synthetic fibers 0.40Synthetic rubber 0.23Ammonia 3.18Urea 4.96Organic products 3.21
Although the majority of products were sold domestically, SINOPEC also exported 33million tons of finished petroleum products and petrochemicals in 1990.

- 117-
3.240 Crude oil distillation capacity in China is 144 million tpy, of which 124million is under SINOPEC. This ranks China fourth in the world in terms of distillationcapacity, which is now equivalent to about 2.9 million barrels per day. With respect toethylene production, China is ranked eighth in the world, with 1.96 million tpy capacityof which SINOPEC operates 1.82 million tpy.
3.241 From 1985 to 1990, SINOPEC has invested in technical renovations in about300 main production units at a cost of Y 8.3 billion for over 900 major projects.
3.242 Data on the facilities and production of SINOPEC are given in Tables 3.47and 3.48.
Energy Use
3.243 The consumption of energy resources by SINOPEC has reached over 26million TOE for fuels, power, and feedstock (equivalent to 37 million TCE). Energyconsumption per Y 10,000 of output value was 4.84 TOE in 1989, broken down asfollows:
TOE per Average annualY 10,000 reduction 1983-9
Refining 2.46 2.2Petrochemicals 8.65 3.7Chem. fibers 1.74 17.9Fertilizers 22.42 2.0Whole SINOPEC 4.84 3.6
3.244 The growth in energy use, has been quite rapid in recent years due to thecommissioning of three large ethylene plants and associated downstream units. This hascontributed to the noticeable emphasis on petrochemical and chemical fiber opertions:

- 118 -
Fuel/power Feedstock Total Oil Petrochem & Chem106 TOE % 106 TOE % 106 TOE refining chem fiber fert.
Year Energy consumption - Percent by subsectors
1983 10.47 71.4 4.19 28.6 14.66 37.3 34.9 27.81984 10.63 71.0 4.35 29.0 14.98 34.7 37.8 27.51985 11.03 69.2 4.01 30.8 15.94 32.8 38.4 28.31986 11.63 70.0 4.98 30.0 16.61 34.2 38.8 27.01987 11.76 67.9 5.56 32.1 17.31 34.8 40.5 24.81988 14.19 64.9 7.66 35.1 21.85 28.2 53.4 18.31989 13.63 61.2 8.65 38.8 22.28 28.8 52.4 18.91990 14.97 57.3 11.14 42.7 26.11 25.3 59.7 15.0
Table 3.47: ECOnOMIC AND OTHER INDICATORS FOR SINOPEC, 1985-90
1985 1986 1987 1988 1989 1990
Industrial output value(Y billion)
1980 constant prices 30.0 32.6 35.4 39.2 41.8 44.1Current value 33.7 38.7 43.2 50.0 58.8 63.2
Total staff (103 persons) 536 567 596 629 651 672Of which, technical 49 53 59 69 74 78Managerial 67 73 76 76 81 85
Fixed assets, original valueat year end (billion RMB) 24.7 27.8 31.0 42.7 49.9 60.8
3.245 The energy consumption of each subsector may be subdivided further.Tables 3.49 and 3.50 give the position for oil refining. It will be seen that there has beena steady increase in the amount of energy contributed by coke burning in the FCC units,now up to about 23 percent of the total energy supply. This is probably due to greaterdemand for light products such as gasoline and diesel compared with heavy fuel oilrequiring greater levels of cracking in the refining stage.
3.246 For the chemicals operations, the energy consumed in 1990 may be dividedas follows:

- 119 -
Fuel & power Feedstocks
Petrochemicals, chemical fibers 41% 59%Chemical fertilizers 35% 65%
For the petrochemicals and fiber production, the fuel and power may be broken downfurther (data based on 1989 figures):
Energy used for water supply 10.4%Electncity 17.4Steam 39.9Fuel for process heaters 30.2Miscellaneous 2.1
100.0
Energy Efriciency and Trends
3.247 Efforts to improve energy efficiency have been maintained for several years.The results are shown for refining and petrochemical activities in terms of energyconsumption per Y 10,000 in Table 3.51 and as kgOE per ton of crude processed for therefining industry in Table 3.52. Details of energy consumption improvements for aselection of major refining processes are given in Table 3.53 and for selected chemicalprocesses in Table 3.54. In all processes, energy consumptions have been reducedsteadily: for refining processes, the rate ranges from 1 to 6 percent per year, and forchemical processes from about 3 to 11 percent per year. For nitrogen fertilizer production,improvements have been made but at a slower rate-well below 1 percent per year, asshown in Table 3.55.
3.248 Figures for the lowest energy consumptions for selected processingoperations are reported in Table 3.56 and compared with current levels of energy use, asreported in previous tables, in Table 3.57. Although good results have been achieved inalmost all areas, there remain significant differences between the energy efficiency ofsimilar processes in China and overseas.
3.249 The improvements seen in the data for energy use in a wide range ofprocessing operations have been achieved through technical revamping of units, replacingsmall old units by larger new units, and by close attention to management of the plants.Investments in energy conservation projects reached Y 890 million in the six years up to1990:

- 120 -
Table 3.48: OUTPUT OF MAIN PRODUCIS OF SINOPEC, 1985-1990
106 tons 1985 1986 1987 1988 1989 1990
Crude processedSINOPEC 79.04 85.65 90.00 93.28 96.23 9696whole industry 84.50 91.58 97.18 101.61 105.28 10723So of total 93.5 93.5 92.6 91.8 91.4 90.4
Total oil productsSINOPEC 37.72 41.86 43.43 44.88 47.03 4721whole industry 39.88 44.24 46.45 48.43 51.12 521)% of total 94.5 94.6 93.5 92.7 92.0 90.7
includingGasoline
SINOPEC 13.46 15.39 15.83 17.12 18.39 1895whole industry 14.38 16.47 17.12 18.66 20.21 31.16So of total 93.6 93.5 92.4 91.7 91.0 89.5
KerosineSINOPEC 3.94 4.05 4.07 3.73 3.85 3.75whole industry 4.03 4.14 4.16 3.81 3.93 35% of total 97.8 97.9 97.9 97.8 97.8 97.6
Diesel fuelSINOPEC 18.90 20.92 21.94 22.39 23.15 2207whole industry 19.89 21.99 23.38 24.13 25.17 25379% of total 95.0 95.1 93.8 92.8 91.9 90.5
LuboilSINOPEC 1.43 1.50 1.60 1.64 1.64 15Mwhole industry 1.58 1.64 1.79 1.83 1.81 1 JD% of total 89.5 91.4 89.3 89.3 90.4 91.0
EthyleneSINOPEC 0.55 0.59 0.82 1.11 1.27 1.44whole industry 0.65 0.70 0.94 1.23 1.40 157% of total 84.5 84.4 87.3 90.2 91.1 91.6
PlasticsSINOPEC 0.50 0.56 0.73 1.03 1.20 136whole industry 1.23 1.32 1.53 1.91 2.06 229% of total 40.4 42.1 47.7 53.8 58.5 59.5
Synthetic rubberSINOPEC 0.13 0.13 0.15 0.19 0.22 024whole industry 0.18 0.19 0.22 0.26 0.29 03296 of total 71.0 68.8 66.7 74.9 75.6 75.0
Synthetic fibersSINOPEC 0.31 0.31 0.33 0.35 0.38 OADwhole industry 0.77 0.88 0.98 1.13 1.28 1A3
So of total 40.0 37.7 33.5 30.9 29.7 28.1including monomersSINOPEC 0.49 0.51 0.53 0.59 0.61 0.78whole industry 0.49 0.52 0.53 0.60 0.62 OJD% of total 98.7 97.7 98.7 98.5 98.1 98.9
and polymersSINOPEC 0.45 0.46 0.48 0.49 0.50 05)whole industry 0.61 0.61 0.78 0.90 0.96 0o8SO of total 73.6 75.5 61.8 54.6 51.5 56.8

- 121 -
Table 3.49: BREAKDOWN OF REINERY FEL AND POWE BY SOuRCE
Fresh Elect. Steam Heater FCCPercentages water fuel coke
1983 2.49 13.85 33.18 35.44 15.041984 2.40 14.31 31.57 36.45 15.271985 2.58 14.05 32.32 34.26 15.801986 2.60 15.54 28.75 35.53 17.581987 2.64 15.09 28.48 35.99 17.801988 2.54 15.80 28.39 33.36 19.911989 2.59 15.71 28.09 31.52 22.091990 2.76 16.04 28.00 30.68 22.52
Table 3.50: ALLOCATION OF REFIERY ENERGY CoNsumIroN
Units Storage Waste water Domestic Heat Power(Percent) & handling treatment uses loss loss
1983 84.5 7.2 1.3 4.7 1.8 0.61984 84.4 7.5 1.3 4.5 1.8 0.61986 84.0 8.0 1.4 4.3 1.8 0.51987 84.2 8.0 1.2 4.3 1.9 0.51988 84.6 7.4 1.1 4.4 2.0 0.51989 85.3 7.4 0.9 4.1 1.8 0.51990 85.3 7.4 1.0 4.3 1.8 0.5
1985 1986 1987 1988 1989 1990 Total
Y Million 112.3 144.2 193.6 195.5 115.1 129.0 889.7
3.250 The results of these energy conservation investments are estimated to havebeen savings of 0.9 million tons oil equivalent. It is estimated that the investment neededto save 1 ton oil equivalent is about Y 990 and the payback for the investment is onaverage 1.1 years.

- 122 -
Table 3.51: ENERGY CONSUMPION PER Y 10,000 OUnur VALUE
Tons oil equivalent per Y 10,000
1984 1985 1986 1987 1988 1989 %/yr
SINOPEC 5.44 5.28 5.12 4.93 4.80 4.84 -3.6Refining 2.70 2.59 2.52 2.51 2.37 2.46 -2.2Petrochemicals 10.03 9.91 8.40 8.48 8.74 8.65 -3.7Chemical fibers 4.14 3.56 2.01 1.93 1.84 1.74 -17.9Chem. fertiliser 24.75 23.85 21.78 21.75 - 22.42 -2.0
Note: The energy consumption of three major new ethylene plants not included.
Table 3.52: ENERGY CONSUMPION FOR OIL REFnING
1984 1985 1986 1987 1988 1989 1990 %/yr
Overall refineryenergy usekg OE/ton crude 71.2 70.1 70.4 68.0 69.4 71.0 72.7 -0.02
Refinery processingkg OE/t crude 66.8 65.8 66.5 64.6 66.5 69.2 70.2 -0.05
3.251 Some specific measures that have been taken to improve energy efficiencyare as follows:
(a) Revamping refinery processing units by improving process efficiency andusing higher efficiency equipment.
(b) Increasing the recovery of energy, e.g., using multi-effect evaporators atMaoming to reduce energy consumption 34 percent; low temperature wasteheat recovery; recovery of heat from stack gases.
(c) Application of computers for improving management of facilities, optimizingenergy use and improving product yields, e.g., computer control on 26 outof 39 FCC units and on 16 out of 64 crude distilation units; microprocessorcontrol on 140 large process heaters raising combustion efficiency by2-5 percent; refinery optimization at the Jinxi Complex reducing overallenergy consumption by 3 percent; on-line control systems at 6 majorfertilizer plants.

- 123 -
Table 3.53: ENERGY CONSUMPTION OF REFINERY PROCESs UNITS
kg OE/t feed 1984 1985 1986 1987 1988 1989 1990 %/yr
Atmospheric andvacuum dist. 14.6 13.6 13.0 13.4 13.2 12.3 12.3 -2.6
FCC 78.4 74.6 73.0 72.6 75.4 70.4 71.5 -1.0Cat. reforming 159.9 160.4 161.4 153.6 146.7 147.2 131.0 -2.5Thermal cracking 39.8 40.0 38.5 34.5 34.3 33.2 33.2 -3.9Delayed coking 37.2 37.6 34.5 30.0 30.1 28.1 28.3 -5.2Propane deasph. 58.6 54.3 50.5 45.3 44.2 40.9 39.2 -6.0Phenol refining 60.1 56.2 55.7 48.4 46.9 48.1 46.4 -3.7Furfural ref. 48.8 43.4 39.8 38.6 36.0 33.4 31.6 -4.4Acetone/benzene
dewaxing 98.6 92.3 75.3 72.8 67.9 65.3 66.0 -5.5
Table 3.54: ENERGY CONSUMPTnON FOR CEMICAL PRODUCIS AND FIBERS
kg OE/ton 1984 1985 1986 1987 1988 1989 1990 %/yr
Ethylene 1,354 1,252 - 1,222 1,240 1,225 1,121 -3.3Polypropylene 626 618 521 453 473 423 422 -6.4Butyl rubber 1,036 1,074 808 801 773 744 740 -5.5Phenol 2,151 2,062 1,580 1,227 1,124 1,054 1,086 -10.8Ethylene oxide 1,141 1,079 1,015 1,064 908 752 674 -8.4Acrylonitrile 1,040 854 804 771 - 770 647 -7.6Poly acrylonit. 2,700 2,670 2,571 - 2,450 2,445 2,401 -2.1Terylene staple 792 608 596 401 380 382 366 -12.1Vinylon 1,692 1,622 1,546 1,551 1,511 1,425 1,402 -3.1Nylon staple 1,050 988 827 806 803 725 - -7.1
(d) Process improvement for FCC units and the increased deeper processing ofheavier crudes.
(e) Introduction of new ethylene plants and renovation of older facilities,especially pyrolysis furnaces, to increase ethylene yields from poorerfeedstocks.

- 124 -
Table 3.55: ENERGY CONSUMPION FOR NiTROGEN FERTruzER PRODUCTIONkg OE/ton
1983 1984 1985 1986 1987 1988 1989 1990 %/yr
1,733 1,670 1,663 1,699 1,652 1,666 1,635 1,650 -0.06
Note: 1990 data includes high energy consuming Ningxia Chemical Works whichentered operation.
Potential for Improvement
3.252 The gaps between average energy consumption and the best recordedperformance for a range of products and processes are shown in Table 3.57, indicating thepossibilities for further improvement. For refinery processing, the difference is about20 percent and for many chemical processes 30 percent, and for fertilizer production about11 percent. Renovation measures need to be checked for economic viability but experiencein many plants suggests that energy conservation is usually an attractive investment. It istherefore expected that energy efficiency will continue to rise by adopting many of thesame technologies as applied already, such as those listed above.
3.253 In particular, efforts should continue to close down small and primitive crudeoil refining facilities. For example, there are 56 small refineries with annual throughputunder 500,000 tons, scattered through 14 provinces and cities: their total distillationcapacity is 8.265 million tpy. Of these small refineries, 16 are run by oilfieldadministrations (3.99 million tpy) and 40 are run by local govemments (4.275 milliontpy). Tests at 12 of the better small refineries indicate that energy consumption runs about60 percent higher than typical large refineries. In addition, a number of primitiveprocessing units installed in the 1930s remain in service in spite of central governmentefforts to have them banned. About 3,000 such units in 1986 were reduced to 400 in1990. Most of these use simple and obsolete equipment and yield perhaps 20 percent oftheir feed as petroleum products, often below specification. Excessive energy consumptionis estimated to be 1 million tpy.
3.254 With respect to SINOPEC refineries, there are 34 in operation with anaverage crude distillation capacity of 3.65 million tpy which is about half the average ofoil refineries in developed countries. The actual amount of crude processed in Chineserefineries in 1990 was under 3 million tpy (see Table 3.59). Production scale shouldtherefore be increased to achieve higher energy efficiencies and better use of capitalinvestments.
3.255 Another area where savings may be made is in the effective use of wellheadgas. About 13 percent of this is typically flared off and wasted. For example, the natural

- 125 -
Table 3.56: LowEST REPORTED ENERGY CONSUMPTON VALUES
Processing unit kgOE/t Year Location
Refinery unitsAtmos/Vacuum distill. 10.6 1987 Maoming Petrochemical Co.FCC 59.0 1990 Refinery of Jilin Chem Co.Thermal cracking 49.2 1989 Maoming P.C.Delayed coking 20.4 1990 Dushanzi RefineryCat. reforming 132.2 1989 Shenli RefineryAcetone/benzene dewax. 57.5 1988 Dushanzi RefineryPhenol refining 43.8 1990 Shanghai Ref, Gaoqiao P.C.Furfural refining 27.1 1989 Maoniing P.C.Propane deasphalting 31.2 1990 Maoming P.C.
PetrochemicalsEthylene 854.3 1989 Qianjin Plant, Yanshan PCHDPE 306.4 1989 Qianjin Plant, Yanshan PCLDPE 280.9 1989 Chem Plant 3, Liaoyang PCPhenol 874.4 1989 Xiangyang Plant, Yan.PCEthylene oxide 576.8 1989 Chem Plant 2, Jinling PCButyl rubber 711.3 1990 Shengli Plant, Yan.PC
Chemical fibersPolyester 159.0 1990 Terylene Factory 2,Shanghai GPWAcrylonitrile 472.9 1990 Chem plant 2, Daqing GPWAcrylic fiber 2,282.7 1990 Acrylic Fiber Pit. Shanghai GPWTerylene staple 291.3 1990 Terylene Factory, Tianjin PCVinylon staple 1,319.2 1990 Chem Fiber Plt. Sichuan Vinylon
Chemical fertilisersLarge scale N fert. 1,491 1985 Fert Pt 2, Qilu Petrochem Co.Ammonia consumed forurea prod'tion kg/t 582 1984 Fert Pt 2, Qilu Petrochem Co.
Ammonia synthesisgas feedstock 865 1986 Fert Pt 2, Qilu Petrochem Co.naphtha feed. 881 1990 Fert Pt Jinling PCresidual oil feed. 1,013 1987Fert Plant, Zhenhai GPW
gas recovered and sold by pipeline from the Xinjiang oilfield is only 83 percent of totaloutput (dropping to about 68 percent during the summer). The Daqing oilfield produces2.5 billion m3 annually and yet sells only 1 billion n3. The Zhongyuan oilfield blew offand flared the equivalent of 1 million tons of crude oil from 1979 to 1985. The Anzhaioilfield produces 500,000 tpy of crude and 36 million m3 of associated gas is unrecovered.

- 126 -
Table 3.57: SUMMARY OF CURRBENT AND BEST ENERGY CONSUMrIONS
kg OE/t Average 1990 Best reported Difference %
Refinery unitsAtm/vac distillation 12.8 10.6 21.3FCC 71.5 59.0 21.3Cat reforming 131.0 132.2Thermal cracking 33.2 19.2 73.3Delayed coking 28.3 20.4 38.9Acet/benz. dewaxing 66.0 57.5 14.8Phenol refining 46.4 43.8 6.0Furfural refining 31.6 27.1 16.7Propane deashalt. 39.2 31.5 24.5
ChemicalsEthylene 1,121 854.3 31.2Butyl rubber 740 711.3 4.0Phenol 1,086 874.4 24.2Propylene oxide 674 576.8 16.9Acrylonitrile 647 472.9 36.8Acrylic fiber 2,401 2,282.7 5.2Terylene staple 366 291.3 25.6Vinylon 1,402 1,319.2 6.3Major fertilisers 1,659 1,491.0 11.3
A rough estimate suggests that about 80,000 tons of propane and ethane are lost every yearfrom oil and gasfield in China. Additional recovery of light hydrocarbons could make asignificant contribution to petrochemical feedstocks.
3.256 Improving product quality will also be a factor in the future. For example,the main part of the gasoline pool is 70 MON. Improved efficiency of gasoline drivenvehicles can be achieved using higher octane fuels and it is planned to increase theproportion of FCC gasoline in gasoline blends. Diesel fuel often cannot meet the 45 cetanenumber specification: some refineries can barely reach 40. Efforts are therefore neededto increase cetane numbers, improve fuel stability and lower the pour point.
3.257 A program to reduce product losses by greater use of floating roof storagetanks for light products is needed. Potential savings have been estimated at 4.5 million tpyof products for an investment of Y 1.12 billion, equivalent to Y 250 per annual ton saved.
3.258 Finally, efforts will be made to improve the level of energy conservationmanagement, both in a technical sense and by applying management principles. Sometechnical examples are:

- 127 -
Table 3.58: FORECASTS FOR PRODUCT OUrPUTS
1990 1995 2000106 tons % 106 tons % 106 tons S
Crude oilprocessed .107.23 150 200
Total products 96.88 100 125.05 100 157.92 100
Gasoline 21.16 21.8 29.14 23.3 37.13 23.5Kerosene 3.85 4.0 6.18 4.9 7.65 3.8Light oil forchemicals 7.85 8.1 16.58 13.3 21.64 13.7
Diesel oil 25.37 26.2 38.88 30.7 54.25 34.4Luboils 1.69 1.7 2.99 2.4 3.92 2.5Resid fuel oil 32.17 33.2 25.53 20.4 25.01 15.8Bitumen 2.73 2.8 4.23 3.4 5.83 3.7Pet. coke 1.36 1.4 2.07 1.7 2.44 1.5Wax 0.69 0.7 - - - -
Ethylene 1.44 2.30 3.45
Fuel and powerfor petrochemicalindustry 14.97 18.7 23.2
(a) Computer optimization techniques for operating units.
(b) Pinch point (or process integration) techniques for optimizing heat exchangesystems.
(c) Improved combustion efficiency of fired heaters.
(d) Improved trays and packing in fractionating towers.
(e) Higher efficiency electric motors.
(f) Improved process technologies (e.g., better catalysts in FC and naphthareforming units, different solvents for luboil refining, and by equipment andprocess flow modifications of many kinds).
(g) Waste heat recovery and utilization of recovered energy.

- 128 -
Table 3.59: CRUDE OIL PROCESSED IN MAOR RPSINERIES
106 tons, 1990
1 Yanshan Petrochemical Co. 6.542 Tianjin Petrochemical Co. 2.973 Fushun Petrochemical Co. (3 refineries) 8.014 Jinzhou Petrochemical Co. 2.455 Dalian Petrochemical Co. 4.766 Liaoyang Petrochemical Fiber Co. 2.697 Gaoqiao Petrochemical Co. 4.588 Jinling Petrochemical Co. 5.329 Yangzi Petrochemical Co. 2.30
10 Baling Petrochemical Co. 3.2011 Maoming Petrochemical Co. 5.7612 Lanzhou Chemical Industry Co. 0.6313 Daqing General Petrochemical Works 5.3214 Shanghai General Petrochemical Works 3.3915 Lanzhou Petroleum Processing and Chemical Complex 2.7616 Jinxi Petroleum Processing and Chemical Complex 8.8017 Zhenhai General Petrochemical Works 2.7818 Anqing General Petrochemical Works 2.5719 Guangzhou General Petrochemical Works 3.0520 Urumqi General Petrochemical Works 1.7121 Shijiazhuang Refinery 1.3822 Cangzhou Refinery 0.7723 Qiangguo Refinery 0.9924 Harbin Refinery 0.8425 Linyuan Refinery 1.3626 Jiujiang General Petrochemical Works 1.5527 Jinan Refinery 1.3628 Louyang General Petrochemical Works 1.5729 Wuhan Petrochemical Works 2.0230 Jingmen General Petrochemical Works 2.8031 Dushanzi Refinery 1.8432 Qilu Petrochemical Co. 6.72
Total 10217 million tons
Projected Industry Outputs and Energy Consumption
3.259 Forecasts of growth in crude oil refining and trends in the output of selectedrefinery products are summarized in Table 3.58. Table 3.59 presents forecasts of ethyleneproduction and overall fuel and power for the petrochemical sector.

- 129 -
3.260 The changes in product mix in the future will influence refinery energyconsumption because of the need to convert heavy oil fractions into light oils, partly foruse directly as fuels and partly to increase the production of petrochemicals. There islikely to be a significant increase in the use of diesel as a fuel for transport at the expenseof gasoline. At the same time, this increase may be offset by efforts to reduce the use ofagricultural tractors for rural transport and to reduce the amount of diesel oil used. forpower generation in TVEs (about 3 million tons will be used in 1995).
Emissions
3.261 The petrochemical industry is a major energy consumer and also uses largevolumes of water for process applications and cooling. Each year, the 30 large-scalepetrochemical complexes discharge 760 million tons of waste water and 4.7 million tonsof solid wastes. The main achievements of the industry in the period from 1986 to 1990are as follows:
(a) Waste water discharges have been reduced 3 percent and the amount ofthese meeting environmental standards has risen by 18.6 percent comparedwith 1985 (to reach a total of 84 percent of discharges).
(b) Total COD discharged in 1990 was reduced by 24.9 percent compared with1985.
(c) Utilization of combustible gases reached 94 percent, an increase of 4 percentover 1985.
(d) The proportion of toxic gases meeting emission standards reached over90 percent.
(e) The use of waste solid residues increased by 35 percent to reach a total of80 percent.
(f) The proportion of enterprises complying with noise emission standardsreached over 95 percent.
(g) Energy conservation contributed to a reduction in the quantity of fuel usedof 2.25 million tons oil equivalent and a corresponding reduction in CO2discharges of 7 million tons in the five-year period.
3.262 Currently the main objectives is to ensure that facilities meet environmentalstandards. This will require effective management of existing facilities and proper use ofexisting equipment, as well as modermization of facilities to control pollution sources.New techniques of environmental control need to be developed and disseminated. Themain quantitative targets are:

- 130 -
Item Target
Waste water disposal meeting emission standards > 85%COD discharges per 10,000 RMB output value < 18 kgUtilization of combustible gases > 95%Toxic gas emissions complying with standards > 95%Utilization of solid wastes > 90%Compliance with noise standards at the boundary > 95%
H. EQuIPMENT
Introduction to the Equipment Supply Industry
3.263 The machinery and electronic industries in China are large and complex, andplay a key role in the national economy by providing a very wide range of equipment tothe manufacturing industries, to agricultural enterprises, to the transport sector and indeedto all other energy consuming sectors. The activities of the industry include productionof machine tools, electrical machines and motors, construction machinery, scientific andtechnical instruments, agricultural machinery, automobiles and trucks, ships, radios andtelevisions, computers, and all types of mechanical and electrical components and spareparts.
3.264 In 1990, the machinery and electronic industries consisted of 104,800enterprises (excluding township and village enterprises) with 20.62 million employees.Total industrial output was Y 376.5 billion, about one quarter of Chinese industrial output.
3.265 The energy consumption of the mechanical and electronic industriesthemselves is not particularly large: it is about 1.6 percent of national energyconsumption, including 16.52 million TCE of coal. Overall energy consumption was1.013 TCE per Y 10,000 in 1990, reducing to 0.893 in 1991. Electricity use droppedfrom 960.2 kWh per Y 10,000 in 1980 to 800.1 in 1991.
3.266 However, the mechanical and electronic industries have a very importantinfluence on Chinese energy consumption in terms of the type of equipment manufacturedfor the market and its performance (e.g., energy consumption, efficiency, service life,maintenance needs, capital and operating costs). In some cases, the domestic market canpurchase modem equipment with good performance: for other items, the Chineseequipment lags behind similar items available in western countries in terms of energyefficiency and other technical features.
3.267 Because of the key role of equipment used by energy consumers indetermining their energy consumption, a review of the mechanical and electronic industries

- 131 -
was made to determine the status of key products manufactured and to document the effortsbeing made to improve their quality and energy efficiency. The main products includedelectric motors, fans and pumps, compressors, industrial furnaces, steam traps andinstruments. A separate study of boiler availability and performance was also made.
Electric Motors
3.268 An indication of the scope of the electro-mechanical manufacturing industryis given by the production data presented in Table 3.60. Seven major items of equipmentrepresent over half the national electricity consumption. Motors are the single mostimportant electro-mechanical product, with applications throughout China in all sectors ofthe economy.
3.269 There are 1,180 motor factories with 58 key enterprises and 640 othersunder the Ministry, 408 county level factories and 74 others classified as TVEs. It hasbeen estimated that there are now 152 major series of motors and more than 4,000specifications of motors in China, with the present inventory representing 330 million kWinstalled load. The annual output of motors in the size range 0.55 to 200 kW is equivalentto 34 million kW: a breakdown by motor size is given in Table 3.61. Over 60 percentof electricity generated in China is used in motors, with motor losses totalling about5 percent of national demand.
3.270 The main motor series are as follows:
(a) Y series induction motors-available in sizes from 0.55 to 200 kW, theseare the most common type of motor and they supersede the widely used Iseries. Their efficiency on average is 0.4 percent higher than the J seriesmotors replaced. The annual output volume is equivalent to 20 million kW.
(b) YCT series variable speed motors-available in sizes from 0.55 to 90 kW,these motors use an electromagnetic slipping clutch system to change speed.Ten plants provide an annual output of about 450,000 kW.
(c) YD pole changing multi-speed motors-these are modified Y series motorswith speeds adjustable in steps depending on the connections for thewindings.
.(d) YX series high efficiency motors-available in sizes from 1.5 to 90 kW,motor efficiencies are 3 percent higher than the standard Y series motors.Annual output. remains low at about 10,000 kW.
3.271 A comparison of motor efficiencies is shown in Table 3.62, showing theimprovement of the Y series over the previous J series but also showing that efficiencieslag behind the developed countries.

Table 3.60: MAJOR ELECTRICIrY CONSUMIG ELECTROMECHNCAL PRODUCTS
Percent ofAnnual national Total Forecast
Total in Main Approx. Annual electricity electric, output of output TotalItem China manufact. varieties output consumption generated value increase employment
I0 'kWh % 10'Y pctlyear 10'
Small and 0.35 x 10' kW 300 557 45 x 106kW 32.5 5 6.0 18 200medium-sizeclec. motors
Blowers and 5 x 10' units 300 2,500 0.2 x 10' units 65 10 1.0 16 50fans, inc.motors
Water pumps 20 x 105 units 923 1,282 4.2 x 10' units 130 20 2.0 17 70
Air I x 105units 161 303 45 x 10 units 58.5 9 1.44 15 60compressors
Power 0.8 x 10' kVA 200 1,155 87 x 10' kW 13 2 3.0 17 90transformners
Electric 0.7 x 10' units 60 76 0.6 10' kW 32.5 5 0.27 13 13furnaces
Electric I x 10' units 120 83 0.1 x 10' units 3.25 0.5 0.38 14 20welde35
Total 305

- 133 -
Table 3.61: SIZE DISUTION OF ANNUAL MOTOR OUTPUT
Rate power Annual output Rated power Annual outputkW 103 kW kW 103 kW
0.55 55 22.0 2,5000.75 75 30.0 2,3001.1 150 37.0 2,0001.5 600 45.0 1,9002.2 800 55.0 1,8003.0 1,000 75.0 1,5004.0 1,400 90.0 1,0005.5 2,000 100.0 1,0007.5 2,500 110.0 900
11.0 3,000 132.0 80015.0 3,000 160.0 70018.5 2,800 200.0 400
Table 3.62:- COMPARISON OF MOTOR ECIENCIES
Power China USA USA FrancekW Y series YX series J02 ser. MAC XE M2E
1.5 79 81.5-84.05.5 88.5 89.5-90.2 86 88.5-90.2 88.5-90.27.5 87 90.3-90.7 87 88.5-90.2 88.5-90.2
22 91.5 93.0-93.5 89.5 91.7-93.0 91.7-93.0 92.5.55 92.6 94.2-94.8 91.5 93.0-94.1 94.1-95.0 94.475 92.7 94.6-95.0 92 94.1-95.0 94.1-95.0 95.090 93.5 94.8-95.2 94.1-95.0 94.1-95.0 95.4
3.272 . According to available statistics, the annual repair rate of small motors isabout 3-5 percent of the population or about 10 million kW. Most repairs involve statorrewinding. The largest motors are repaired in motor manufacturing plants or in largeenterprises but smaller motors are repaired in factories or in repair shops. It is believedthere are 100 small repair firms around the country, often with very basic equipment andlacking strict technical supervision. Better control of motor rewinding could contribute tomaintaining higher motor efficiencies and thus saving energy.

- 134 -
3.273 Another means of saving energy in many applications is the use of variableor multi speed motors. The most common equipment in China is the electromagneticclutch or the pole changing motor. Unlike many developed countries, there is relativelylittle use of variable frequency control systems. These devices lead to much greater energysavings but their cost is higher, as Table 3.63 shows. There is a good potential for savingenergy, both by greater use of variable frequency equipment and by a greater adoption ofvariable speed controls in general.
Table 3.63: COMPARISON OF MAHODS FOR SPEED ADJUSnENT
YCT YD pole Variable frequencyelectromagnetic changing device
motors motor
Principle Change slip Change pole Change frequencynumber
Application For stepless speed Stepped speed Stepless speedadjusting adjusting adjusting
Maintenance Easy Easy High technicalrequirement
Reliability High High Can vary
Interference withpower supply No No Can interfere
Cost Y 300/kW Y 200/kW Y 1,000/kW
Power factor High Fairly high High
Energy saving About 20% About 20% About 30%
Forecast demand (103 kWh)1993 400 400 1802000 2,800 2,650 350
Number of > 20 > 30 > 10manufacturers

- 135 -
3.274 Finally, it is worth noting that the replacement of J series motors by Y serieshas already resulted in electricity savings. However, even though the manufacture of Jseries motors is restricted, it is known that some enterprises still produce them. The Jmotors are cheaper and are often selected for rural enterprises. Stricter enforcement ofregulations restricting the use of old and inefficient J motors could lead to useful savingsin electricity.
Fans
3.275 The total number of fans and blowers of all types is around 5 minion,consuming about 10 percent of national electricity production (about 65 billion kWh peryear). About 400,000 new fans are made annually. It is estimated that about one quarterof these new fans are energy efficient new designs.
3.276 There are over 300 firms making fans, most of them being TVEs. Aboutone third can be considered large companies with good capabilities. There are 85 firmswhich are members of the Fan Institute of the China General Machinery Corporation andthese are widely dispersed throughout the country (Table 3.64). For the whole fanindustry, employment was 51,390 in 1990, including 4,207 technicians and 7,209management staff.
3.277 The industry may be divided into 7 basic groups of products-centrifugalcompressors, axial flow compressors, centrifugal blowers, Roots blowers, vane typeblowers, and centrifugal and axial flow ventilators. Data on the annual production levelsare given in Table 3.65. Overall, there are about 2,500 different products.
3.278 With respect to technological level, it is judged that the large centrifugal andaxial flow compressors have reached the international level of the mid-1980s, while lowpressure axial flow fans are at the level of the late 1970s. Many fan manufacturers areonly just beginning to utilize modern design techniques such as CAD/CAM. For some ofthe largest fan and blower applications, imported equipment has to be used. The mediumand smaller companies lack modern machine tools with fully computerized operation.
3.279 In spite of the backward technology possessed by some firms, efforts arebeing made to improve fan and blower efficiencies and to upgrade the quality of theproducts. Several agreements have been made to import more recent technology forselected types of fans and further technology transfer arrangements are planned. It wasestimated that adoption of newer designs for over 45,000 equipment sets saved 414 millionkWh in 1989. This is under 1 percent of the energy consumed in fans and blowers andtherefore there remains a very large potential for energy saving.
3.280 Some difficulties exist, however: for example, many users are unwilling toadapt equipment foundations to install more recent and more efficient machinery. Thereis also the problem of low efficiency designs being cheaper and easier to make, allowingsmall firms to sell products with outdated technologies when users fail to make proper life-cycle cost comparisons.

- 136 -
Table 3.64: MAJOR FAN MANUFACrURERS1990
Fixed ProductionName of Company Employees assets Area m2 equipment
(Y 10,000) (unit)
Northeast AreaShenyang Blower Works 4,161 19,152 300,382 374No. 1 Branch of
Shenyang Blower Works 707 782.1 50,430 92Shenyang Ventilator Co. 1,043 1,640 113,600 176Shenyang People Ventilator Co. 917 1,002 51,000 107Shenyang Cold warm Ventilator Co. 948 1,117.6 38,754 66Anshan Ventilator Co. 711 627.7 28,265 88Yingkou Ventilator Co. 252 162 22,500 44Dalian Ventilator Co. 350 1,989.5 11,640 47Jingzhou Ventilator Co. 267 267,3 12,762 74Jilin Blower Co. 669 820.3 40,300 90Siping Blower Co. 891 1,174.2 115,416 69Siping Ventilator Co. 453 139 5,120 39Harbin Ventilator Co. 510 144.5 8,772 56Harbin Blower Auxiliary Co. 327 82.8 6,872 39Jinausi Blower Co. 730 693.5 64,498 120Zhaodong Ventilator Co. 310 203.1 90,628 45
North China and Northwest China AreaShanxi Blower Co. 3,337 7,551.2 444,440 277Shanxi Lishan Ventilator Co. 340 171.1 13,332 38Xian Ventilator Co. 362 220.5 16,370 46Xian Chaoyang Ventilator Co. 161 65.6 7,693 28Beijing Blower Co. 1,749 1,195.2 51,203 136Beijing Ventilator No. 2 Co. 509 1,388.4 32,439 68Tianjin Blower Co. 706 1,081.1 29,363 116Tianjin Ventilator Co. 501 331 17,233 72Tianjin Warm Ventilator Co. 423 448 10,893 39Shijiazhuang Ventilator Co. 273 778.8 21,800 108Baoding Ventilator Co. 627 1,056.4 68,040 84Xuanhua Ventilator Co. 224 197.8 36,377 33Yuanping Blower Co. 512 527.3 114,116 88Huhhot Ventilator Co. 180 200.5 18,584 32Bactou Ventilator Co. 342 259 63,480 41Jinyuan Ventilator Co. 153 250.1 32,253 50Yinchuan Ventilator Co. 316 1,037 454,741 122Xinjian 7.1 Ventilator Co. 322 252.4 14,848 73

- 137 -
Table 3.64: cont'd
Fixed ProductionName of Company Employees assets Area m2 equipment
(Y 10,000) (unit)
East China AreaShanghai Blower Co. 2,040 4,648.3 121,242 307Shanghai PengJiang Machinery Co. 152 76.5 2,600 27Shanghai Great Wall Blower Co. 632 213 8,762 64
Nanjing Blower Co. 533 272.2 29,119 77Yixing Blower Co. 273 155.2 14,343 32Changshu Blower Co. 516 675.6 46,800 84Yangzhou general Ventilator Co. 178 143.9 9,027 27Nantong Ventilator Co. 681 804.3 36,562 90Ningbo Ventilator Co. 447 746 43.23 88
Yuyao Ventiator Co. 125 148.2 9,045 31
Zhejiang Shanlu Ventilator Co. 516 859 48,000 90
Fujiang Blower Co. 327 334.5 50,020 96Jinan Ventilator Co. 847 1,015.7 41,850 119
State-owned Jinan Ventiator Co. 182 194 8,800 45
Jinan No. 2 Ventilator Co. 274 153.3 18,000 27Shandong Power Equipment Co. 776 2,435.4 115,061 140Qindao Ventilator Co. 468 498.9 27,111 64Zhaozhuang general Machinery Co. 516 482.1 102,087 54
Zhibe Ventilator Co. 326 128.2 19,200 28
Shandong Zhangquo Ventilator Co. 621 764.7 81,272 147
Weihai Ventilator Co. 156 189.2 25,020 32
Fuzhou Blower Co. 459 708 87,042 167
Fuzhou Chemical Machinery
repairing Co. 316 103.77 14,904 44Anhui Ventilator Co. 525 781.3 72,782 .77
Nanchang Blower Co. 420 311.1 37,490 54
Pingxing South Coal Machine Co. 117 127 8,046 46

- 138 -
Table 3.64: cont'd
Fixed ProductionName of Company Employees assets Area m2 equipment
(Y 10,000) (unit)
South Middle and South-West Area
Wuhan Blower Co. 2,037 4,086 257,960 227Wuhan Silencer Co. 358 51.23 7,000 13Wuhan Ventilator Co. 219 262.2 12,335 41Hubei Ventilator Co. 563 556.8 44,940 55Yichang Blower Co. 91 62.12 7,425 35Changsha Blower Co. 1,511 3,092.6 224,171 183Changsha No. 2 Ventilator Co. 263 3098.9 61,000 57Changsha Xiangjiang Ventilator Co. 249 178.2 64,119 50Chongqing General Machinery Co. 3,288 5,044.3 305,471 290Chongqing Blower Co. 298 222.3 16,112 34Chongqing Jiangbei Ventilator Co. 314 187.1 7,710 30Chengdu Power Machinery Co. 1,507 2,903.8 96,326 152Chengdu Ventilator Co. 221 196.3 72,000 36Sichuan Blower Co. 531 454.6 38,056 66Sichuan Chunabei Ventilator Co. 186 290.5 25,000 42Xiniang Blower Co. 517 465.2 52,043 58Henan Zhoukou Ventilator Co. 656 556.9 56,916 80Guiyang Blower Co. 324 155.2 7,000 47Guiyang No. 2 Blowre Co. 303 263.5 51,200 56Guangzhou Ventilator Co. 384 446.6 59,194 58Foshan Ventilator Co. 439 570 81,000 100Wuzhou Ventilator Co. 197 132.1 11,000 33Dali general Machinery Co. 436 436.7 32,052 57Gejiu Ventilating Machinery Co. 213 134.3 2,346 30

- 139 -
Pumps
3.281 The Chinese pump industry is very large, consisting of 923 enterprisesemploying 200,036 personnel in 1990 (excluding village level firms). There are over 20million water pumps throughout the country and typically 4.2 million new pumps are madeeach year. The associated electricity consumption amounts to 20 percent of the nationalelectricity demand: diesel powered pump sets consume about 5 percent of the nationaldiesel oil consumption.
3.282 There is a wide variety of pumps made but single stage and single suctionclean water pumps represent 50 percent of the output. There are around 100 pumpmanufacturers, amongst which there are estimated to be 16 major pump manufacturers withtechnology transfer arrangements with foreign firms (e.g., from the USA, Germany, UK,Australia, Switzerland and the former Czechoslovakia. Overall, the standard of Chinesepumps is judged to be at the level of western countries in the early 1980s. In terms ofefficiencies, it is believed that the average test efficiencies of Chinese pumps are 2-5 percent lower than comparable foreign products. Nevertheless, the latest pump designsdo represent a major improvement over older designs which are gradually being phasedout.
Table 3.65: FAN PRODUCMON DATA
1989 1990 1991
Centrifugal compressor 79 59 38Axial flow compressor 3 3 1Centrifugal blower 422 795 656Roots blower 5,340 4,549 4,070Vane type blower 257 126 154Centrif. ventilator 116,737 97,432 99,830Axial flow ventilator 51,973 48,141 42,289Other types 9,238 22,608 38,135
Total 184.139 173.713 185.173
3.283 Unfortunately, the improvements in efficiency of many pump products onoffer to the market may not be achieved by many users. Existing pumps are oftenincorrectly sized and operate well below design efficiency (sometimes at half the designfigure). Manufacturing techniques vary greatly and there are still some enterprises makingproducts at the level of western countries in the 1950s and 1960s. In such firms, thequality of internal castings is poor and the reject rate is 10-13 percent. The reject rate ofimpeller castings may reach 40 percent, while the comparable figure in western firms

- 140 -
might be 3 percent. Low machining accuracy and large tolerances lead to higher materialsand energy consumption of the manufacturers, and can contribute to a lower energyefficiency of the products also.
3.284 The potential for saving energy by pump users is substantial. The efficiencyof new pump types is typically 5 to 10 percent better than older designs, bettermanufacturing techniques could give pumps with better performance characteristics, andproper application of pumps (e.g., correct type for the application, correctly sized) couldadd say 10-20 percent savings, a total of perhaps 30 percent energy savings.
Compressors
3.285 There are about 1 million compressors in China-excluding fans, blowersand refrigeration compressors-of which small units with capacity under 1 m3 per minuterepresent 75 percent. Electricity consumption is about 9 percent of national demand, anddomestically made compressors take 7 percent of the national electric motor production formotors in the range 0.2 to 4,000 kW.
3.286 There are 161 compressor manufacturers (including 7 key enterprises underthe Ministry of Machinery) and 37 accessories plants. The most important firms are:
Key EnterpriseShenyang Gas Compressor Factory B/LShanghai Compressor Factory B/LHuaxi General Machinery Company B/L *Beijing No. 1 General Machinery Company B/LWuxi Compressor Works A/M **Bengbu Compressor Factory A/MLiuzhou No.2 Air Compressor Factory A/M *
Large Scale PlantsShenyang Air Compressor Factory A/MShanghai No.1 Compressor Factory B/M **Nanjing Compressor Factory A/MJiangxi Gas Compressor Factory B/MLiuzhou Compressor Factory A/M **Xiangtan Compressor Factory B/MChongqing Gas Compressor Factory B/MYuyao General Machinery Factory BIMChangde General Machinery Factory B/MZigong Compressor Factory B/M
Classifications are: A/M Class A medium scaleB/L Class B large scaleB/M Class B medium scale
** Firms whose statistics are in Table 3.68 under "importantfirms."

- 141. -
3.287 In 1987, the China Compressor Association was established and this nowhas 131 members, including one research institute, two universities, and a range ofmanufacturers. The Association is subordinate to the China General Machinery IndustryAssociation. Statistics for the compressor industry are presented in Table 3.68: the dataare given for 85 firms in the information division of the Association for which statisticsare collected routinely.
3.288 The overall efficiency of domestic compressors is now about the same as thatfor imported machines, although reliability and available accessories such as controlsystems do not match the imports. This is mainly because of poorer manufacturingprocesses and design factors. Many manufacturers use old and backward machiningmethods. As there are a large number of manufacturers in China, production batches aresmall and manufacturing costs are high, quality is unreliable and the manufacturing processitself consumes high amounts of energy. Quality variability can of course affect operatingreliability adversely.
3.289 As an example of the problem of small-scale production, miniature aircompressors may be quoted. The annual production is about 100,000 units from 80 plants.There are only 7 enterprises which produce more than 5,000 units per year:
Compressor Factory Units made, 1991
Dafeng CF 18,171Nanjing No.2 CF 8,380Shanghai No.2 CF 7,185Beijing Small Size CF 6,673Shanghai Tonglian CF 6,467Ma'anshan CF 5,998Guangzhou Air CF 5,996
Total 58.870
Balance from 73 plants73 x avg 560 units/yr 41,000
The 73 plants which produce relatively few units each year operate at relatively lowproduction efficiency.
3.290 Although operating efficiency of domestic compressors are now quite good,it must be recognized that some older designs were rather poorer. Most old compressorsremain in operation in Chinese factories. For example, about 50 percent of chemicalfertilizer output comes from small-scale plants mostly using old types of compressor.

- 142 -
Phasing out such compressors could make a substantial contribution to energy savings inthe chemicals industry.
3.291 In addition to checking the performance of the compressors themselves, itis important for manufacturing plants to ensure that drive motors are properly sized tomatch compressor characteristics. Indeed, a high efficiency compressor coupled with aninappropriate motor presents a good opportunity for energy saving.
Industrial Furnaces
3.292 The total energy consumption of industrial fumaces represents about onequarter of the national energy demand. Most furnaces are built for specific requirementsand are non standard equipment. Since 1989, some supervision of fumace designs andperformance has been exercised by the Industrial Furnace Institute of the Fifth Design andResearch Institute affiliated to the Ministry of Machinery and Electronics Industry. Thereare about 200 furnace product manufacturing plants in China, most of them being smallto medium-size enterprises or TVEs. There are no large-scale industrial furnacemanufacturers yet.
3.293 There are more than 110,000 furnaces of various types in factories abovethe TVE level. The annual energy consumption of these is 160 million TCE. IncludingTVEs, the number of furnaces is about 180,000 consuming over 190 million TCE/year.A breakdown of industrial furnace users by type of industry is given in Table 3.66 and bytype of furnace operation in Table 3.67.
Table 3.66: INDusRIAL FURNACES-NUMBER AND ENERGY CONSUEMPONIN MAJOR INDUSTRES
The furace The proponinoEnergy consumption energy coammipLion of furn ce
Number of industrial of furnace and kiln proponion energy conaumputonfurnace and kiln (xIO ton atandard coal/vr) to the toual eergy of She depaitmnat
Electric Fuel Electric Fuel consumptiona o e to the totl ofDcpanlment furnace furnace Sum furnace furace Sum deparunme() which in China (5)
Metallurgy 730 4,147 4,877 335.0 4,083.00 4,418.00 79.60 2730Nonferrous metal 2,202 448 2.650 194.76 IS4.86 349.62 33.81 2.16Building matrial 196 15.733 15,969 67.6 5,331.58 5,399.18 87.70 33.36Ught industry 17 5,467 S,484 69.38 605.54 674.92 15.04 4.17Chemical industry 511 8,177 8,688 401.00 3,726.00 4.127.00 53.00 25.50Oil chemiitry 611 611 539.80 539.80 35.80 3.34Machinery 19,467 18,120 37,587 131.19 328.27 459.46 33.00 2.84Weapon 8,260 1,732 9,992 31.36 43.51 74.87 20.74 0.47Aviation 9,117 988 10,105 11.80 11.60 32.40 21.70 0.15Shipping 1,472 793 2.265 1.20 8.40 9.60 19.32 0.06Railway 3.345 4,960 8,305 1.28 48.72 65.00 2.80 0.41Electronics 6.600 520 7.120 15.50 23.30 37.80 31.50 0.24
Total 51,917 1,736 113,653 1,275.07 14,90358 16,178.6S 56.54 100.00

- 143 -
Table 3.67: ENERGY CONSUMED BY VARIOUS TYPES OF FURNACE AND KILN
Energy consumptionx 104 tons standard Proportion of the total
Kind of fumace coal/yr %
Firing fumace & kiln 5,688.66 35.16Smelting furnace & kiln 4,258.86 26.32Chemical industry fumace & kiln 3,498.19 21.62Purnace for metal reheating 695.73 4.30Oil chemistry heating fumace& kiln 610.00 3.77
Sintering fumace & kiln 592.40 3.66Heat-treatment fumace & kiln 229.49 1.42Roasting fumace & kiln 193.34 1.20Drying fumace & kiln 93.78 0.58Others 318.20 1.97
Total 16,178.65 100.00
3.294 In general, the energy consumption of fumaces in China is much higher thanin comparable operations in developed countries. For example, electric furnaces for steelproduction consume on average about 300 kWh/t of product, around 50 percent higher thantypical electric furnaces in developed countries. It is estimated that energy savings fromthe adoption of better fumace designs and their correct operation could amount-in manyindustries-to about 30 percent.
3.295 To achieve such savings, many measures need to be taken. For example,combustion control needs to be improved. New bumer designs are needed, to improveair/fuel mixing and to allow more rapid fumace warm-up times. The use of computercontrols may be justified on larger equipment. Heat recovery from exhaust gases couldbe applied on many furnaces, with the recovered energy used to preheat incomingcombustion air. Better refractories need to be used to line furnaces to reduce heat lossesfrom the structure itself.
3.296 While the benefits of these and other measures are generally well known,improved technologies are limited in application for a number of reasons:
(a) Industrial enterprises are short of investment funds.(b) Enterprise managements are often unaware of the potential benefits.(c) There is a lack of technical manpower at enterprises to design and
implement improvements.

- 144 -
(d) Incentives to plant personnel to save energy in furnace operations areabsent.
Steam Systems and Traps
3.297 The efficient distribution of steam or hot water from boilers to the users isa major factor in the energy consumption of most enterprises. Compared with developedcountries, the overall efficiency of steam systems is rather low. Some typical figuresillustrate the differences:
China W Europe
* Steam generation 55-60% 80-90%Distribution piping 85-90% 95-98%Combined efficiency 46-54% 76-88%
* Steam using equipment, say 35-40% 60-70%* Overall system efficiency 16-22% 45-62%
Boiler operation is clearly a major area for improvement. However, the potential forenergy saving is also significant through the reduction of losses in the distribution systemitself. These losses result from a combination of poor insulation, incorrect pipe diameters,inappropriate piping layouts, and poor condensate drainage and air venting caused byinsufficient or poorly performing steam traps. There is also a lack of certain types ofauxiliary equipment, such as automatic condensate pumps.
3.298 There are about 45 steam trap manufacturing plants in China. The trapsavailable from Chinese manufacturers are often not well made and have short service lives(say 3-4 months compared with a European, Japanese or US steam trap which would lastsay 1-2 years in the same duty). The poor trap quality causes additional maintenance andmany users prefer not to replace a defective trap or do not install a trap at all where oneis really needed. There is a lack of customer service orientation by the trap manufacturers,with little assistance to customers to select the right type and size of trap, insufficientmarketing effort, and little or no after sales service.
3.299 There is therefore a major opportunity to save energy by the promotion ofbetter distribution systems and better steam traps. Through these measures, savings of atleast 10 percent of the steam currently generated should be easily achieved over the next5-10 years for relatively little capital expenditure.

- 145 -
Boilers
3.300 There are about 430,000 industrial steam boilers in China-excluding thoseused in power plants, locomotives and ships-and these consume 300 million TCE whileproducing up to 980,000 tons per hour of steam or steam equivalent. The energyconsumed is about one third of the national energy demand. The importance of efficientboilers is therefore obvious and a special study was carried out on this topic in conjunctionwith the Greenhouse Gas Project.
3.301 The report of the boiler study provides comprehensive data on industrialboilers in service in China and most of these data are not repeated here. However, a fewimportant facts may be summarized as follows:
(a) There are 280,000 steam boilers with a thermal capacity of 700,000 tph ofsteam. There are 150,000 hot water boilers with a thermal output of200,000 MW (28.5 percent of the total thermal capacity of boilers). Boilersare widely distributed throughout China (Table 3.69).
(b) Of these boilers, process industries use 195,000 units (580,000 tph) whilethe residential sector uses 235,000 units (400,000 tph or equivalent).
(c) The most widely used type of industrial boiler is a horizontal packagedboiler based on a combined water tube and fire tube design, representingmore than 60 percent of the existing stock. Water tube boilers representabout 25 percent of thermal capacity, and small vertical boilers of varioustypes represent about 15-20 percent.
(d) Boilers fired by chain grate stokers are almost 60 percent of capacity and65 percent of the number of units. Reciprocating grate stokers representabout 20-25 percent, spreader stokers less than 1 percent. The remainingcapacity is mostly hand stoked boilers.
(e) Almost all industrial boilers fire raw, unwashed coal. About 5 percent ofthe capacity fires oil or gas. Of the coal fired in boilers, the followingbreakdown is estimated:
Type of coal Percent of capacity
Bituminous coal 75.6Anthracite 9.7Low grade coal 9.1Lignite 5.6

- 146 -
Table 3.68: STATISTICS ON COMPRESSOR MANuFAcTURE, 1987-1991Data for 85 firms in the statistics network of the China Compressor Association.
1987 1988 1989 1990 1991
Industry gross productionvalue, Y 106
85 firms 850.9 1,026.4 1,096.1 1,261.1 1,440.114 important firms 442.1 518.5 613.5 813.6 795.2
Average workers85 firms 61,197 61,802 62,789 62,564 63,22014 firms 26,094 26,582 30,171 30,291 31,138
Metal working machines85 firms 9,096 8,931 9,706 9,351 9,26214 firms 3,598 3,424 3,907 3,957 3,898
Castings, tonnes acceptable85 firms 43,754 50,369 48,089 37,976 40,71914 firms 25,180 29,048 30,440 24,525 26,063
Castings, tonnes unaccept.85 firms 5,239 6,555 6,545 5,064 5,00914 firms 3,107 3,482 3,876 3,248 3,119
Steel used, tonnes (% utilised)85 firms 49,078 50,923 46,730 38,739 43,900
(63.4) (64.5) (64.6) (66.1) (65.5)14 firms 22,213 22,734 21,961 17,887 20,293
(59.6) (63.6) (65.0) (64.8) (64.2)
Energy use, TCE85 firms 124,017 122,805 119,750 104,978 112,92614 firms 60,392 64,208 70,031 60,446 64,092
Energy use, 103 kWh85 firms 84,079 86,035 83,607 74,929 82,27614 firms 44,204 43,641 47,034 40,678 45,953
Production,Total compressors
85 firms units 135,423 126,040 122,203 113,428 114,139103 kW 1,456.9 1,789.4 1,736.5 1,516.0 1,554.8
14 firms units 8,604 8,892 10,459 9,061 9,316103 kW 755.1 932.5 1,001.9 850.4 804.1

- 147 -
Table 3.69: STATISTICS ON TH3E EISTING INDUSTRIAL BoTLR STOCK
IB quantities (sets) MB evaporation capacity WM/h)Region Home Production Total Steam Hot water Home Production Tota StIam Hot water
Nation total 2236,300 195,801 432,101 282,47s 149,626 400,544 S82,541 983,085 702,466 280,619
Beijing 14,025 6,813 20,838 7,857 12,981 31,621 20,794 52,415 22,878 29,537rianjing 8.021 6,264 14,276 9,201 5,066 11,093 12,808 23,901 17,124 29,537Hebei 16,412 14,540 30,952 17,650 13,302 29,994 40,357 70,351 46,342 24,009Sharxi 11,755 6,545 18,300 10,470 7,830 35,301 22,125 57,426 37,963 19,463Neimeng 12,728 4,383 17,111 5,677 11,434 22,933 12,514 35,447 14,274 21,173Liaoning 31,465 133403 44,868 20.984 23,884 61,647 47,353 109,000 S6,420 52,580Jilin 18,573 7,478 26,051 9,279 16,772 28,693 32,511 61.204 35,085 26,119Heilongjiang 35,541 10,177 45,688 13,752 31,966 52,521 26,921 79,442 34,368 45,074Shanghai 3,720 6,495 10.215 10,191 24 1,521 9,294 10,815 10,805 1oJiangsu 6,444 17,764 24,208 23,865 243 5,473 38,153 43,626 42,842 784Zhejiang 6,973 9,358 16,311 16,320 11 2,420 16,773 19,193 19,126 67Anhui 3,432 4,685 8,117 8,020 97 4,181 13,036 17,217 16,936 231Fujian 1,843 4,541 6,384 6,326 58 1,036 9,619 10,655 10,638 17Jangxi 3,470 4,693 8,163 7,899 264 2,760 13,670 16,430 16,389 41Shandong 14,418 16,457 30,875 23,337 7,538 22,831 48,154 70,895 56,435 144,550Henan 5,023 10,864 15.890 15,010 877 10,669 29,940 40,609 38,238 2,371Hubei 4,622 7.472 12,094 11,526 568 11,676 18,736 30,412 29,443 969Hunan 7,466 7,195 14,661 14,521 40 8,103 26,971 35,074 34,954 120Guangdong 1,438 7,563 8,999 8,143 856 1,351 22,879 24,230 24,111 119Guangxi 1,649 3,460 5,309 5,105 4 1,709 11,301 13,010 13,007 , 3Hainan 34 375 409 407 2 40 689 729 728 1Sichuan 3,387 8,851 12,238 12,091 147 3,376 25,341 28,717 28,573 144Guizhou 2,094 2,153 4,247 4,140 107 2,781 6,010 8,791 8,661 130Yunnan 3,528 3,046 6,574 4,759 1,805 2,580 21,691 24,271 23,908 363Xizang 367 135 502 454 48 589 597 1,286 1,159 127Shanxi 3,622 4,807 8,429 6,811 1,,618 9,056 13,133 22,189 19,433 2,756Gansu 4,755 3,624 8,379 4,241 4,138 9,910 18,059 27,969 19,152 8,817Qianghai 1,786 707 2,493 1,505 988 4,581 2,480 7,061. 4,144 2,917Ningxia 1,755 902 2,657 1,314 1,343 4,725 3,619 8,345 4,652 3,693Xinjiang 5,963 1,053 7,016 1,501 ,S515 15,321 18,439 33,760 20,753 13,007
(f) The existing stock is dominated by medium and small boilers. A survey of13,930 boilers in Beijing showed:
Evaporation rate tph Percent of capacity
<1 12.92-4 65.4> 6 21.7
(g) Boilers often operate under low load conditions, high carbon levels in theash, high excess air ratios and high stack gas temperatures. As a result,combustion efficiencies are usually low. Various surveys of hundreds ofboilers in Guangzhou, Lanzhou and Shanghai, for example, show that thetypical combustion efficiency ranges from 50-78 percent, even though

- 148 -
prototype testing gave results 10-15 percent higher. Table 3.70 presents theresults of some of these surveys.
(h) With respect to pollutant emissions, coal consumption is about 30 percentof the national total while dust emissions from boilers are about36.6 percent of the total, S02 emissions are 38.8 percent and CO2 emissionsare over 500 million tpy.
3.302 While the boiler study identifies some technical areas where improvementscan be made to new boiler designs, there could be substantial improvements in theoperation of existing boilers. Proper attention to combustion control, and a greateravailability of gas testing equipment for routine monitoring of boiler conditions, shouldallow low cost savings to be achieved in the near term, mostly without capital investment.Operator training and improved energy management are needed.
Potential for Improvements
3.303 The improvements in energy efficiency in manufacturing enterprises thatcould come from the adoption of more efficient equipment and equipment that is properlysized for its application (as well as properly operated and maintained) are believed to besubstantial. Of course, the magnitudes of these improvements are highly variable fromenterprise to enterprise and it is impossible to generalize-every case is different. As ageneral rule however, those responsible for the specifying and purchasing of major itemsof equipment need to be more aware of technical developments in equipment designs andmust be diligent in seeking higher performance equipment.
3.304 Capital costs should be considered in conjunction with operating costs so thatfull consideration is given to more expensive but more efficient equipment. The principleof life cycle costing and the selection of equipment based on economic evaluations needto become standard practice: lowest first cost should not be the selection criterion. Aboveall, the customer must learn how to influence product quality and product characteristics,while manufacturers need to adopt a more service-oriented approach to survive and prosperin a market environment.
3.305 Although many beneficial changes will occur under the influence of themarket, government policies and regulations can promote faster changes. For example,stricter enforcement should be ensured of regulations prohibiting the manufacture and saleof electric motors made to out-dated standards. Fiscal incentives should be considered tohelp enterprises justify more rapid replacement of old equipment using backwardtechnologies. Financial support should be considered for research and development onenergy efficient products, and for popularization of new and efficient products.
Generic Investment Options
3.306 The energy efficiency measures selected for study in this sector-from agreat many possible measures in a very complex sector-were the following:

- 149 -
Table 3.70: TYPICAL BOILER OPERAITING DATA IN MAJOR CIESOperational Thermal EMciency of Industrial Boilers in Guangzhou City
No. Boiler type Sets Measured efficiency (%)Avcrage Minimum
1 Hand-fired boiler 20 50.5 45.02 Reciprocating grate 101 64.7 43.33 FBC 11 65.8 61.54 Chain grate 22 69.9 65.1S Pulvcrized coal 21 77.6 71.86 Oil fired 26 81.7 67.07 Others 11 62.1 58.4
Actual Measured Results of IB in Lanzhou City
No. Item Boiler (tlh)< 0.5 1 2 4 6 10
1 Set measured 3 11 SS 75 S 12 Local capacity (tlh) 1.2 11 113 300 32 103 Averagc output of boiler (tth) 0.39 0.73 1.21 2.37 5.06 5.814 Flue gas temperature IC 211 139 134 145 133 128
Max (IC) 297 211 212 210 169 128Min (-C) 139 76 96 78 98 -
5 Excess air ratio (a) 2.97 2.73 3.28 3.48 3.36 3.37Max 3.73 6.79 5.53 5.88 5.13 3.37Min 2.03 1.68 1.79 2.10 1.90 -
6 Carbon content of slag (%) 20.5 27.6 18.9 23.4 25.4 18.2Max (%) 58.7 66.5 59.6 57.6 32.1 18.2Min (%) 2.64 2.35 2.71 3.03 16.7 -
7 Heat efriciency of boiler (%) 63.5 67.2 68 69.7 72.2 74.5Max (%) 69.9 76.3 75.07 81.0 78.0 74.5Min (%) 64.1 54.3 52.3 55.3 60.0 -
Measured Thermal Efriciencies of Industrial Boilers in Shanghai
Year Item Boiler (tlh)< 1 1 2 4 > 6 Toul
1987 Number (sets) 59 46 71 89 77 283Mean heat off. (%) 60.86 67.27 68.70 70.49 65.51 -
1988 Number (sets) 39 50 63 105 17 274Mean heat eff. (f) 61.31 65.80 68.93 70.71 70.19 -
1989 Number (sets) 46 47 40 66 13 212Mean heat eff. (%) 62.58 68.15 68.78 71.99 74.02 -
1990 Numbcr (sets) 32 37 32 61 7 169Mean heat eff. (%) 62.05 70.88 70.35 73.14 75.77 -
1991 Number (sets) 38 36 37 42 27 180Mean heat eff. (%) 77.26 68.41 72.59 72.55 73.74 -
5 years Number (sets) 214 216 243 363 81 1,117Mean heat eff. (%) 64.8 68.1 69.9 71.8 72.1 -

- 150 -
El High efficiency electric motors
The annual output of small and medium size three phase induction motors (0.5 to1000 kW) runs at about 3.5 GW of which 3.1 GW are under 200 kW size.Electricity consumption in all these small and medium size motors is estimated tobe 60 percent of total industry electricity consumption. About 70 percent of theexisting motor inventory is from the old J series (typical of the motors made indeveloped countries 30 years ago) and about 30 percent are Y series (typical ofmotors from 20 years ago). The efficiency of such motors ranges from 2 to 5percentage points below modem standards in the USA, Europe and Japan. Newdesigns of motors with higher efficiency are now manufactured in China (the YXseries) and, in sizes above say 15 kW, these have efficiencies around 3 percentagepoints better than the conventional Y series used for most industrial applications.
E2 Variable speed motors
Fans and pumps have an installed motor capacity of 90 GW or 27 percent of thenational total, consuming 165 TWh or 31 percent of national electricityconsumption. It is estimated that at least 50 percent of these fans and pumpsoperate under conditions of variable load and throughput, mostly controlled bybaffles or valves in an energy -inefficient manner. Recycling from the pumpdischarge side to the suction side is also common, resulting in waste of electricity.By introducing variable speed drives for fans and pumps, lower throughputs couldbe achieved while using less electricity: exact savings depend on the load profileof the particular application but 20-30 percent is often possible. Variable speedmotors are made in China but output is limited. Many motors use anelectromagnetic clutch for stepless speed variation or pole changing motors (2speed, 3 speed, 4 speed). Variable frequency systems are generally imported andare costly (although usually more efficient).
E3 Electric motor repair centers
Of the total installed capacity of electric motors of about 330 GW, about 10 GWor 3 percent are repaired each year. Repairs are mainly rewinding, estimated at80 percent of all work. There are no specialized rewinding companies in China atpresent, and larger motors are often sent back to the manufacturer for repair.Smaller motors are repaired by a wide variety of workshops or enterprises. Mostuse crude equipment for burning off the old motor windings and do not work tostrict technical specifications. There is no means of checking the efficiency of therewound motors. An investigation of the effectiveness of repairs showed that thedrop in efficiency averaged about 1 percent, with the greatest decrease-almost2 percent-for the smallest motors. A significant improvement in rewindingpractices is possible and this could have an impact on electricity consumption in allindustries.

- 151 -
E4 Steam trap production
About 300 million tons of coal are consumed annually to produce over 800,000 tonsof steam per hour. Boiler efficiency is clearly important but a major factor is alsothe proper operation of steam distribution and condensate recovery systems inindustrial plants (as indicated by figures given previously, the overall efficiency ofsteam systems is around 20 percent). A key element is the steam trap: Chinese-made traps are often of outdated design, poorly machined and have a short servicelife. It is estimated that under 10 percent of the traps needed for effective steamsystem operation are actually installed. The upgrading of steam trap productioncould therefore help all industries to save steam and thus to save boiler fuel on alarge scale.
3.307 Based on data obtained from motor manufacturers and research institutes,the above measures were examined and the benefits to electric motor and steam trap userswere evaluated. Other than for the establishment of motor repair centers, the rate of returnfor an investment in the measures listed is dependent on the specific situation of the user.In general, it is believed that most of the measures can give good payback periods forindustrial enterprises but that more promotional efforts are needed to encourage greaterlevels of adoption.
3.308 With respect to the motor repair centers, the calculated rate of return andpayback (including construction time) are as follows:
IRR percent Payback, years
E3 Motor repair centers 45 4
3.309 Forecasts of the potential extent of application of each measure were madefor business as usual and accelerated scenarios. For El and E2, the figures given are fornew motors sold (expressed as MW/year) over and above present levels. For E3, thefigures are for the capacity of motors repaired annually (MW/yr). For E4, the figures arefor the number of steam traps made above present levels. The forecasts are:

- 152 -
1990 2000 2010
El High Efficiency Motors (MW/yr)BAU motor capacity sold 0 2,500 15,000Accel. motor cap. sold 0 5,000 25,000
E2 Variable Speed Motors (MW/yr)BAU motor capacity sold 0 1,000 3,000Accel.motor cap. sold 0 1,500 4,500
E3 Motor Repair Centers (MW/yr)BAU repair capacity ° 2,500 5,000Accel.repair capacity 0 3,500 8,000
E4 Steam Traps (million items per year)BAU extra traps made 0 2 10Accel.extra traps made 0 4 10
3.310 Details of the assumptions made and the energy and emissions factors usedin the calculations are given in Appendix A.
Projected Impacts on Energy and Emissions
3.311 Using the forecasts indicated, the following are the expected impacts onenergy consumption in China by users of the improved equipment:
Savings 103 Savings 103TCE/yr by 2000 TCE/yr by 2010BAU Accel. BAU Accel.
El High efficiency motors 103 206 618 1,029E2 Variable speed motors 247 370 741 1,111E3 Motor repair centers 55 73 110 176E4 Steam traps 2,000 4,000 10,000 10,000
3.312 Similarly, expected impacts on greenhouse gas emissions are indicated interms of the reduced tonnages of C02:

- 153 -
CO, reduction CO2 reduction103 TPY by 2000 103 TPY by 2010BAU Accel. BAU Accel.
El High efficiency motors 65 131 392 653E2 Var. speed motors 157 235 470 705E3 Motor repair centers 35 49 70 111E4 Steam traps 1,302 2,604 6,510 6,510
Emissions
3.313 For this sector-the manufacture of equipment-no emissions were reportedor estimated as the sector itself is not a major user of energy and pollutant emissions arenot large. The impacts on energy use and CO2 emissions estimated in the previous sectionare therefore expected to be observed as changes in other sectors throughout theeconomy-sectors that use electric motors or employ steam traps.

- 154 -
4. COAL MJING INDUSTRY
A. INDUSTRY PROFLE AND PRODUCTS
4.1 Coal is of course the most important energy source in China and the coalmining industry is therefore a key contributor to the national economy. In 1992, the totalproduction of raw coal reached 1.11 billion tons. The coal mining industry is itself amajor energy consumer for coal mine exploration, mine construction and coal production,washing, preparation and transportation. Significant energy is also consumed in subsidiaryenterprises such as service trades to the mines and to the industry personnel.
4.2 Coal mining in China is conducted by both state-owned enterprises andenterprises owned by local collectives (TVEs). To improve the economic performance ofmany coal mining departments, their business activities have broadened in recent years.In addition to coal production, many enterprises undertake such activities as electricitygeneration, coking, coal gasification, coal processing, chemicals production, and utilizationof minerals associated with coal mining. At present, there are 21,037 enterprises in thecoal industry employing 7 million persons and operating the following facilities, singly orin combinations:
Mines, state owned 1,866Mines, local collectives 17,408Coal washing plants about 300Machinery plants over 190Power stations using gangue 60Power stations using coal 30Building material plants using
gangue and wastes about 300Service enterprises, other businesses over 2000
4.3 Within these enterprises, there are 21 with an annual coal productioncapacity of over 10 million tons, 12 with over 5 million tons and 18 with over 3 milliontons. Collective-owned mines generally use hand mining methods and their productivityis particularly low. Amongst larger state-owned mines, two thirds are using mechanicalmining techniques and one third have fully integrated mechanical mining systems.However, it is estimated that about one third of the machinery in even the larger state-owned mines can be considered backward, using old out-of-date technology and consuminglarge amounts of energy.

- 155 -
4.4 By 1990, the coal washing capability of key coal mines reached 223.6million tons per year, annually disposing of wastes of about 37.4 million tons. The energysaved in coal transport is estimated to be about 13.6 million TCE per year.
B. ENERGY USE
4.5 Energy consumed in the industry is mainly in the form of coal andelectricity, with typically about 2 percent as petroleum-based fuels. A breakdown ofenergy consumption from 1980 to 1992 is shown in Table 4.1. A significant amount ofthe coal is used in small-scale boilers scattered around the enterprise sites. A total of15,500 small boilers are in service, with a steam raising capacity of about 47,000 t/h andconsuming about 10 million tons of coal annually.
Table 4.1: ENERGY CONSUMPION OF MAJOR COAL MMES, 198092
Petroleum TotalRaw coal Electricity products energy
10 6 t % GWh % 103 t % 10'TCE
1980 12.60 62.95 1,170 35.47 15 1.58 13.951981 13.00 65.09 1,179 33.26 16 1.65 14.321982 13.52 65.05 1,236 33.45 15 1.50 14.931983 14.09 64.78 1,299 33.62 17 1.60 15.611984 15.77 65.47 1,423 33.00 18 1.53 17.301985 15.52 64.06 1,511 34.68 15 1.26 17.601986 15.52 61.97 1,609 36.11 19 1.56 18.001987 14.46 60.00 1,651 37.90 25 2.10 17.601988 15.03 59.20 1,732 38.60 27 2.20 18.131989 16.24 58.23 1,955 39.67 28 2.10 19.911990 18.77 58.79 2,198 38.95 35 2.26 22.801991 16.40 54.33 2,264 43.43 32 2.24 21.061992 17.92 56.50 2,324 41.48 31 2.02 22.64
Note: These data were provided by the Energy Conservation Office of the coalindustry and do not include the energy consumed in coal washing plants.
C. ENERGY EICEENCY
4.6 Energy consumptions per ton of coal output from 1980 to 1992 are shownin Table 4.2. There are of course many factors affecting the development, efficiency andenergy consumption of the coal mining industry. For example, some of the moreimportant factors are as follows:

- 156 -
(a) Location within China. South of the Huanghe or Yellow River, there isno energy required for space heating in the winter months, in contrast withthe need for heating in the northeast and northwest of the country. As anexample of the internal use of coal, the Mongolian Integrated Coal Companyin the northeast produces over 110 million tons per year of coal but uses 7.5million tons of this for its own purposes.
Table 4.2: SPECFc ENERGY CONSUMPTXONS OF MAJORSTATE-OWNED COAL MNES, 1980-92
Raw coal Coal Electricityoutput consumption consumption
106 t t/106 t kWh/t
1980 344.39 36,586 33.971981 335.05 38,800 35.191982 349.90 38,640 35.321983 363.12 38,803 35.771984 394.70 39,954 36.051985 406.26 38,202 37.191986 413.92 37,495 38.871987 427.98 33,787 38.581988 435.79 34,489 39.741989 462.35 35,125 42.281990 492.54 38,109 44.631991 505.00 32,475 44.831992 476.00 37,647 48.82
(b) The Hydrogeological Conditions. Mines exploiting thin coal seams atgreat depths, needing to pump water out regularly, and with large quantitiesof associated gas necessitating high ventilation rates, will clearly consumerelatively high amounts of energy.
(c) Period of AMine Exploitation. At the beginning of the working life of amine, before full production is reached, or at the end of the working life asthe coal seams are worked out, energy consumption per ton of usefulproduct will be high.
(d) Status of Mining Equipment. In the older mines, the equipment used formining and for associated services will generally use inefficient technologyand be wasteful of energy, compared with new mines using up-to-datemechanized mining methods.

- 157 -
(e) Energy Management. Mining enterprises can vary greatly in their levelsof professional management, of measuring equipment and of moderninstrumentation for monitoring performance.
In general, the use of energy in the Chinese coal mining industry can be consideredsomewhat inefficient and below the average levels of efficiency found in most large-scaleenterprises in the country.
D. ENERGY EFnCIENCY MEAsuRES
4.7 From 1981 to 1990, a total investment of Y 1.62 billion was made in keycoal mines for energy saving measures and energy efficient technologies. This investmentbrought energy savings of almost 8 million TCE, representing an investment of Y 203 perTCE. The measures applied to save energy included the following:
(a) Electric Motor Applications
Typical measures are replacing ventilation fan blades with more efficientdesigns, applying modified designs of drainage pumps, and adjusting electricmotor speeds by electronic devices and hydraulic coupling systems.Theseand similar measures have resulted in the renewal of over 30,000 highenergy consuming mechanical and electrical items, saving up to 0.5 billionkWh per year.
(b) Coal Mine Gases
There are 43 gas utilization systems in operation and 355,500 families usingthe gas: the annual methane consumption is 0.36 million m3 and the annualsavings equivalent to 600,000 TCE.
(c) Coal Briquetting
About 160 coal briquetting plants have been established with an annualoutput of 1.2 million tons. The energy savings are estimated to be 550,000TCE per year, due to the reuse of coal fines and the more efficient use ofthe briquettes.
(d) District Heating
District heating systems have been expanded, covering an area of 8 millionm2 and saving 550,000 TCE/yr.
(e) Cogeneration
A major power plant at Kailuan coal mine has converted to cogenerationoperation from the conventional condensing mode, producing electricity and

- 158 -
heat for various uses including district heating in the Linxi area. The heatsupply has allowed 38 small boilers to be replaced: since 1982, theaccumulated coal savings have reached 415,000 tons of coal and electricitysavings 10.1 million kWh.
(f) Use of Coal Wastes
Coal waste-fired power plants now amount to 57 plants with a total installedcapacity of 533 MW.
4.8 In spite of these successes, there are currently shortages of funds forinvestment in energy saving and some regions in particular are seeing very littleinvestment. There are no laws or regulations for energy saving and energy efficiency doesnot feature in coal mine designs. Even new coal mines include obsolescent, high energyconsuming equipment.
E. POTENTAL FOR MPROVmEN
4.9 Measures already adopted in the industry, as indicated above, will continueto be made. Old and outdated technologies will be replaced by modem energy efficienttechnologies and equipment. For example, ventilation fans generally account for15-30 percent of total electricity consumption in coal production, and sometimes as muchas 40 percent. Statistics for ventilation fans in 1990 show that there are large numbers offans installed -50,775 units in coal mines owned by county or higher level governmentsand 2864 main ventilator fans in key coal mines. Under 5 percent of these fans reachadvanced national or intemational standards, indicating a major opportunity for energysaving by replacing outdated equipment. In conjunction with improved fan equipment,further application of variable speed drives can be expected to better match fan output withsystem requirements, and thus to save energy.
4.10 Another example for the application of modem equipment is water pumps,whose motors use about 10-30 percent of total electricity consumption in coal production,rising to 80 percent in extreme cases. Key coal mines use 27 percent of total electricityor 2.5 billion kWh annually, representing about 5 kWh per ton of coal produced. Coalmines owned by county and higher level governments have installed 85,519 pumps,dominated by units made in the 1950s and 1960s. Drainage systems typically run atefficiencies of 30-40 percent, offering another. opportunity for large electricity savingsthrough updating of equipment.
4.11 Use of coal wastes will be increased, as there are over 50 million tpy ofwashed coal wastes and 5.5 million tpy of coal muds available for exploitation. Thisquantity of wastes-with some additional low to middle quality coals-could be applied toelectricity generation in cogeneration stations with installed capacities totalling about 3,000MW. The coal savings could be in excess of 10 million tpy.

- 159 -
4.12 Extension of coal washing capacity is also expected. Doubling capacity tosay 450 million tpy by 2000 would result in 75 million tpy coal wastes being removed andtransportation energy equivalent to about 27 million TCE per year being saved. Betterclassification of coal into narrower size ranges is likely to be used increasingly to providea better quality product for customers and to help them utilize the coal more efficiently.
4.13 Modem mining technologies and procedures will be applied, including morestrip mining of surface or shallow coal seems. Strip mining is estimated to save 30 percentover conventional deep mining.
F. TeE ENVIRONMETAL SiTUATION
4.14 All coal mining areas in China have been severely polluted, showing thedetrimental effects of water and air pollution and of solid waste in various forms. Theeffect of air pollution in particular is seen in the higher incidence of respiratory problemsin the local population, and higher cancer rates are being observed.
4.15 Water pollution is seen in the destruction of underground water formationsand their contamination by dirty surface drainage. This dirty water can come from manysources, such as pit drainage water, effluent from coal washing plants, and water fromcoking plants (e.g., water used to quench coke), with the latter particularly prone tocontamination by toxic chemicals released in the coke-making process.
4.16 Air pollution is caused by the combustion of coal in boilers, heating stovesfor living areas, power plants, coking plants, coal gasification plants, and associatedoperations such as brick ovens, cement mills and machinery maintenance facilities. Theefficiency of coal mine enterprise boilers is typically 50-60 percent, as much of theequipment is very old. Table 4.3 shows the trends in major air pollutant emissions for thelargest state-owned coal mines.
4.17 In addition to the emissions quoted, the self-combustion of gangue residuesproduces a large amount of pollution by SO2 and CO2. Another source of air pollution isthe release of coal mine gas: each year, about 500 million m3 of gas are pumped out of pitsbut only 290 million m3 are used, the remainder being discharged to atmosphere.Typically, this gas has a high methane content.
4.18 Solid wastes are mainly derived from dusts and residues obtained from coalscreening, washing, gasification, coking, cement processing, power plants andtransportation. It is estimated that about 0.3 million tons of dust are emitted into the airby major state-owned coal mines each year, 4.7 million tons of ash discharged fromboilerhouses, and 5 million tons of gangue from coal washing plants. By 1992, theaccumulation of gangue in coal mines had reached about 200 million tons.

- 160 -
Table 4.3: EsIMATED DISCHARGES OF S0 2 AND CO2 FROM MAJOR COAL MINES,1980-92
S02 CA106 t 10 6 t
1980 0.252 5.541981 0.260 5.721982 0.270 5.951983 0.282 6.201984 0.315 6.941985 0.310 6.831986 0.310 6.831987 0.289 6.361988 0.300 6.611989 0.324 7.151990 0.375 8.261991 0.328 7.221992 0.360 7.92Average 0.310 6.73

- 161 -
5. POWER SECTOR
A. SECrOR PROME
5.1 The Chinese power generation sector is based predominantly on coal, thisresource representing about 90 percent of the energy used in power stations. The totalinstalled generating capacity has now exceeded 166,000 MW, included in which is acontribution of hydroelectric power of over 40,000 MW. The total electricity generatedis in excess of 750 TWh and this has been growing at about 8 percent annually for the last10 years. Recent figures for generating capacity and power generated are as follows:
Installed generating Power generatedcapacity MW 109 kWh per year
Of which of which:Total Hydro. Total Hydro.
1980 65,270 20,230 300.6 58.21985 87,050 26,420 410.7 92.41986 93,819 27,542 449.6 94.51987 102,897 30,193 497.2 100.31988 115,497 32,698 545.1 109.21990 137,890 36,046 621.3 126.41991 151,473 37,884 677.6 125.11992 166,532 40,680 754.2 131.5
5.2 Although there remain shortages of electricity in many parts of the country,the growth in generating capacity is now keeping up with the growth of national incomeand with the overall increase in energy consumption:

- 162 -
National Energy Energy Electricityincome production consumption consumption
growth % increase % increase % growth %
1985 13.5 9.9 8.2 9.01986 7.7 3.0 5.4 9.51987 10.2 3.6 7.2 10.61988 11.3 5.0 7.4 9.71989 3.7 6.0 4.2 7.31990 4.8 2.3 1.8 6.2
Some imbalances in the situations in various parts of China are shown in the followingfigures for 1990:
Region Energy ElectricityGNP production consumption
Y 109 % 106 TCE % TWh %
East 923.4 53.3 256.6 25.6 310.5 49.8Central 512.8 28.9 558.5 53.7 202.4 32.5West 281.0 15.8 196.4 18.9 109.3 17.5
The distribution of power plant units by size at the end of 1990 was as follows:

- 163 -
Size, size range %
< 50 MW, low pressure units 22.6< 50 MW, high pressure units 9.8Cogeneration systems 9.1100 - 110 MW 11.5125 MW 8.6200 - 210 MW 23.0250 - 350 MW 14.2500 - 600 MW 1.2
Total
By the end of 1992, there were 26 power plants, including both thermal and hydroplants, with total capacity over 1,000 MW. These plants are:
Name MW Name MW
Hydroelectric:Gezhouba 2,715 Longyangxia 1,280Baishan 1,400 Liujiaxia 1,225
Thermal:Jianbi 1,625 Shidongkou 1,200Douhe 1,550 Shidongkou #2 1,200Qinghe 1,300 Dagang 12,00Shengtou 1,300 Huangpu 1,100Xuzhou 1,300 Wangting 1,100Pingyu 1,200 Xingtai 1,090Datong 1,200 Qinling 1,050Jinzhou 1,200 Liaoning 1,050Fulaerji #2 1,200 Zhenhai 1,050Zouxian 1,200 Zhangze 1,040Yaomeng 1,200 Jiaozuo 1,024

-164-
5.3 With respect to power grids, there are thirteen large grids with capacitiesin excess of 1 GW. There are over 480,000 kilometers of power transmission linesoperating at over 35kV:
Voltage Length, km
Over 35 kV 480,000Among which:
500 kV 8,000330 kV 4,000220 kV 77,000110 kV 120,000
5.4 Data on grid capacities and power generated for 1991 are as follows:
Grid Connected canacities Power generatedHvdro Thermal Total Hvdro Thermal Iotal
GW % GW % GW TWh % TWh % TWh
E. China 2.5 11 21.3 89 23.8 6.8 6 112.0 94 118.8NE China 3.9 17 19.1 83 23.0 11.1 11 91.9 89 103.0Cen. China 8.2 37 13.8 63 22.0 34.7 34 67.2 66 102.0N China 0.9 5 18.0 95 18.8 1.4 1 95.8 99 97.2W China 4.4 47 5.0 53 9.4 15.7 34 30.1 66 45.8Shandong 0.1 1 9.0 99 9.1 0.1 < 1 49.3 >99 49.4Guangdong 2.2 24 6.8 76 8.9 4.8 13 33.1 87 37.9Sichuan 2.3 32 4.8 68 7.0 10.3 32 21.6 68 31.9Fujian 1.6 49 1.6 51 3.2 4.7 35 8.9 65 13.6Yunnan 1.7 57 1.3 43 2.9 7.1 61 4.5 39 11.7Guangxi 1.4 52 1.3 48 2.8 5.4 44 6.8 56 12.1Guizhou 0.9 42 1.3 58 2.2 3.3 32 7.0 68 10.3W in Mongolia 0 0 1.6 100 1.6 0 0 8.7 100 8.7
5.5 Further statistics for the power sector are given in Table S.1. These dataconfirm that hydroelectricity is now around 18 percent of power generated and25 percent of installed generating capacity.
B. ENERGY USE
5.6 The fuels used for electricity generation are shown below, with thepredominant role of coal clearly shown:

- 165 -
Power Totalgenerated fuel Coal Oil Gas Effic.
109 kWh 106TCE 106 t % 10 t % 10m %
1985 318.5 123.5 156.6 84.5 13.5 15.1 3.6 30.91986 355.0 137.5 192.5 86.1 13.5 13.5 5.5 30.91987 397.3 153.8 196.2 87.1 13.4 12.3 5.7 28.41988 436.1 168.0 223.9 87.8 14.3 11.8 4.2 28.41989 466.4 180.1 274.3 89.5 17.1 10.2 9.2 28.41990 494.5 189.4 291.0 90.3 15.5 8.8 9.7 28.81991 552.8 209.8 325.9 91.4 15.0 7.7 10.6 28.7
Note: Data for units over 6 MW only. Gas includes natural gas, coke oven gas, etc.
5.7 In the near future, the contribution of nuclear power will amount to 1200MW-two 600 MW units at the Qingshan nuclear plant, the first of which beganoperating in 1993.
C. ENERGY EmCIENCY
5.8 The average coal consumption of thermal power generation for thecountry was 427 gCE/kWh in 1991 and 420 in 1992. The efficiency of different typesand sizes of equipment can vary widely. For example, data for large units in 1990 areas follows:
Coal consumption (gCE/kWh)Size MW Design Best Average Worst
100 388-390 390 418 460125 355-358 364 392 474200 345-360 373 394 491300 338-344 357 362 390600 320 - 358 -
D. ENERGY EFFICENCY TRENDS
5.9 The gradual and steady reduction in coal consumption for electricitygeneration is shown in Table 5.1.

- 166 -
Table 5.1: POwER SECrOR INDICATORS SINcE 1985
1985 1986 1987' 1988 1989 1990 1991 1992
Capacity, GW 87.1 93.8 102.9 115.5 126.6 137.9 151.5 166.5inc hydro, GW 26.4 27.5 30.2 32.7 34.6 36.1 37.9 40.7
Generation TWh 410.7 449.6 497.3 545.1 584.7 621.3 677.6 754.2inc hydro Twh 92.4 94.5 100.2 109.2 118.4 126.4 125.1 131.5
Coal rate (net)gCE/kWh 431 432 432 431 432 427 424 420
Coal rate (gross)gCE/kWh 398 398 397 397 397 392 390 386
Plant internal useaverage % 6.42 6.54 6.67 6.69 6.81 6.90 6.94 7.00hydro 0.28 0.28 0.31 0.34 0.30 0.30 0.32 0.37thermal 7.78 7.83 7.87 7.94 8.12 8.22 8.13 8.08
Line losses % 8.18 8.15 8.48 8.18 8.18 8.06 8.15 8.23
Utilization hoursaverage 5,308 5,388 5,392 5,313 5,171 5,036 5,020 5,029hydro 3,853 3,982 3,771 3,710 3,691 3,800 3,675 3,567thermal 5,893 5,974 6,011 5,907 5,716 5,413 5,451 5,462
Per capita generationkWh/person 246 - - 495 519 543 585
Electricity as %of energy demand 18.4 22.1 22.9 23.3 24.0 25.0 26.0
5.10 Some typical measures adopted in recent years to improve power plantefficiency are illustrated in Table 5.2. This lists 11 items and the costs and associatedbenefits. In most cases, the payback periods are under two years.
E. POTENTIL FOR IMPROVEMENT
Generating Plant Mix
5.11 There are three main areas for reducing the coal consumption in thepower sector-achieving a better mix of generating plants through increased exploitation

Table 5.2: ENERGY CONSERVATION MEASURES
InvestmentCoal Energy for unitequiv- Raw Elec- Technical innova- saving energy Return
No Projects alent coal tricity Oil No tion projects value saving period(Y loom) (10 Kr) (10 Kt) (lOO GWh) (10 K) (Y lOOm) (TCE)
I Cogeneration (supply) 70 950 1,330 - I Cogeneration (supply) 14.25 737 4.91
2 New Type o Burner ror 1.35 139 174 10.3 2 New Type of Burner for 2.9 97 0.47Coal Powder Boiler Coal Powder Boiler
3 Boiler Sealing for Heat 2.4 85 119 - 3 Boiler Sealing for Heat 1.2S 282 1.8Protection Protection Water Pump-
er Speed Adjusting
4 Water Pumper Speed 10 120 - 30 - 4 Water Pumper Speed 7.5 833 1.33Adjusting Adjusting
5 Comprehensive Inno- 15 220 308 5 Comprhensive lmo- 3.3 682 4.55vation for Uailt of 0.2 vation for Unit of 0.2MkW MkW
6 Washing Steam Conden- 0.5 160 224 - - 6 Washing Steam Con- 2.4 31 0.21ser by Rubble Ball denser by Rubble Ball
7 Motor Innovation of 0.03 15.2 - 3.3 - 7 Motor Innovation of 0.95 52.6 0.084Magnetic Slot Magnetic Slot
8 Surplus Heat Recycling 8.2 403 465 17.79 - a Surplus Heat Recycling 9.46 230 0.87of Pipe Heat Exchanging of Pipe Heat Exchang-
ing
9 MicrocomtputerOnline 4 350 490 - - 9 MicrocomputerOnline 5.25 114 0.76Analysis for Energy Loss Analysis for EnergyAnalysis for EneftY Loss ~~~~~~Lou
10 InWroving for Nonpower 12 sO - 20 - 10 Inmproving for Non- 5 1,500 2.4Compensation power Compensution
II Innovation on Electricity 22.3 348 37 - II Innovation on Electric- 21.75 625 1.05Distribution of Urboan Ity Distribution of Ur-Distnbudon of Urban ~~~~~~~~~~~~~~~ban AmeaArea
LC"i 146.33 2,t70.2 3.950 15t.59 1Ot 7404 782 1.94
Note: (i) Thermal supPly is nad inlded in themal power cogY0nrstlot re calculated witi fixed prices.(2) Energy prices apply the shadow price: Y I SOITCE., Y 0.25 /kWh, Y 930At. tzivestments ar aeatdwhfidpics(3) The investments and energy saving am. forecasted based on the average results of the cormplete projects.

- 168 -
of hydroelectric resources and cogeneration systems, reduced losses in transmission anddistribution, and improved efficiency of power plants.
5.12 The potential for further exploitation of hydroelectricity resources issubstantial. It is estimated that 380,000 MW could be utilized, while the presentinstalled capacity is only about 40,700 MW (10.7 percent of exploitable resources).Most of the hydroelectric resources are found in the west of the country, such as theupper and middle reaches of the Yellow River, the upper reaches of the Yangtze River,the Hongshuihe and Lanchangjian Rivers. These would all represent largehydroelectric projects, in addition to which there are opportunities for developing smalland medium size hydroelectric plants on smaller rivers in the western regions.
5.13 With respect to thermal units, the large proportion of small andlow/medium pressure steam plants-about 30 percent-will be reduced as the older andleast efficient ones are shut down and as new large units are brought on line.Cogeneration systems, accounting for 9 percent in 1990, will increase in importance: itis expected that 10,000 MW will be added by 2000, resulting in the contribution ofcogeneration rising to 12 percent. Both these actions will lead to an improvement inthe efficiency of electricity generation and a reduction in the coal consumption rate ofsay 60 gCE/kWh (to about 370 gCE/kWh).
Reduction of Line Losses
5.14 Efforts can be made to decrease the losses now being incurred intransmitting and distrit-uting electricity. Line losses are about 8.2 percent currently forlong distance transmission, excluding local distribution networks. In 1989, a study offive major regions in the north and northeast of China gave the following results:
Main grids > 220 kV 2-4% lossLocal urban grids < 110 kV 3-6%Rural grids < 110 kV 7-9%Rural grids, low voltage 12-20%Industrial user networks 3-8%
5.15 The main sources of losses are:
(a) High loads are put onto old distribution systems.
(b) Expanded power generation facilities have not been accompanied byincreased distribution systems.
(c) Power factor compensation is often inadequate, leading to high linelosses.

- 169 -
(d) Networks have little or no spare capacity and thus distributionmanagement is inflexible; transmission distances are often long but thereare no alternative routings.
(e) Recent changes in electricity demand patterns-such as increased urbanelectricity consumption-have not been mirrored by increased distributioncapacity.
To reduce losses, old and overloaded systems are being replaced, although this is aslow and costly undertaking. Replacement takes into account both increased loads andsafety considerations. Reduction of the line losses by 1 percent is estimated to beequivalent to saving 6 billion kWh or 2.2 million TCE per year.
Electricity Generation
5.16 Finally, improving the efficiency of electricity generation is being carriedout. In 1991, the generation of electricity consumed 326 million tons of coal or22.4 percent of national primary, energy demand: it is expected that this could rise toone third of total coal production by 2000. Improving generating efficiency couldtherefore make a major contribution both to reducing greenhouse gas emissions and toalleviating coal supply and transportation problems.
5.17 The present levels of coal consumption are significantly higher than indeveloped countries:
gCE per kWh 1980 1985 1987 1990 1991
China 448 431 432 427 424USA 378 377 351 - -UK 383 358 358 - -Former Soviet Union 328 327 325 -Japan 338 327 325 -Germany 340 327 321 -
5.18 From the present level of 427 gCE/kWh, it is expected that consumptioncan be reduced by about 60 gCE/kWh to 360 gCE/kWh by 2000 by measures such asthe following:
(a) Ensure new generating capacity is efficient. In the next ten years or so,100,000 MW of new capacity will need to be added to the Chinese powersystem. Units with capacities over 125 MW are expected to reach over80 percent by 2000. For new coal fired condensing units of 300 MWand above, energy consumption should be under 330 gCE/kWh. For

- 170 -
cogeneration plants, this should be 270-280 gCE/kWh. Efforts will bemade to limit the construction of new medium and small size steamcondensing power plants. The contribution of new units is equivalent toa reduction in energy use of about 24 gCE/kWh by 2000.
(b) Rehabilitation of old plants. Existing low and medium pressure steamturbine generating plant often have high coal consumptions. The averageis about 600 gCE/kWh and some operate at 1 kgCE/kWh. Theseinefficient units are rebuilt to modem specifications or shut down. It isimportant that old equipment is not sold to other plants where it can berecommissioned later. By 1995, about 1600 MW of these units willremain in operation in remote regions of China but about 5500 MW willbe replaced or reconstructed, reducing the national coal rate by over 6gCE/kWh. By 2000, a further 10,500 MW will be reconstructed and2,500 MW shut down, and new capacity will be provided by large highefficiency plants, reducing coal use by about 15 gCE/kWh.
(c) Improved operation of existing large plants. The design energyconsumptions for new plants are often 10 percent or more higher thandeveloped countries. In many cases, design efficiencies are not reachedfor a variety of reasons, such as:
(i) Boiler feedwater temperatures 30°C or more below design.
(ii) Vacuum levels in condensing equipment are not adequate.
(iii) Stack gas exhaust temperatures are high.
(iv) Excess combustion air is much higher than design rates.
(v) Plants serving the peak loads are not able to meet demand andother units are brought on line for short periods. These plants arerun at low loads and low efficiency at other times.
(vi) Poor maintenance leads to lower reliability and forced outages:unplanned breakdowns cause high coal consumption throughexcessive start ups and shutdowns.
Through technical renovation, it is expected that coal consumption will be reduced by-2000 by about 15-20 gCE/kWh and a further 5-10 gCElkWh by 2010. Typicalconsumptions for different units are thus expected to be approximately as follows:

- 171 -
Size, MW 1995 2000 2010
500-600 335-350 325 320250-350 345-350 325 320200-210 375-385 365 355125 370-400 390 380100-110 410-415 390 38050 and below
HP steam 430-440 420-430LP/MP steam 580-610 560-590
(d) Increased adoption of cogeneration. By the year 2000, 7,000 MW ofcogeneration capacity are planned. These are much more efficientsuppliers of both heat and electricity, giving an equivalent coalconsumption rate of say 280 gCE/kWh on the basis of sharing the energyinput between the two products.
(e) Reduced in-plant use of electricity. The consumption of electricity withinthe generating plant itself is generally about 8 percent of the generatedpower. Some typical data are:
Size Own use of electricity %High Average Low
125 MW 10.2 8.0 5.9200 MW 10.8 8.2 5.1300 MW 6.8 5.3 4.3
In the smallest plants, values of 12 percent are not unknown. High consumption can bedue to operating inefficient machinery such as water pumps, fans and conveyors, someof which are poorly sized or are based on old and outdated technology. There is littleuse of variable speed motors on combustion air fans, for example, so that these areoperated at full rate all the time, regardless of the actual need for air. Air rates may beadjusted in some cases by using dampers on the fan suction, reducing the air flow andimproving combustion conditions, but still maintaining the high electrical load.
5.19 Other auxiliary machines such as coal grinding equipment are simplyhigh energy consumers compared with the type of equipment operated in developed

- 172 -
countries. Replacement of outdated auxiliary machines by modem equipment willtherefore contribute to improving the efficiency of the power plants themselves. Effortsare being made, especially in the larger plants, to adopt better designs, with experienceshowing that payback periods are usually well below two years.
F. PRoJEcTED OUTPurs
5.20 According to existing plans, the forecast electricity output in 2000 is1,350 billion k}Wh. This may be broken down as follows:
2000 2010Source I09 kWh % 109 kWh %
Nuclear 19.8 1.5 35.2 1.8Thermal 994.4 73.6 1,460.4 73.0Hydro 334.9 24.8 500.0 25.0Renewables 0.9 0.1 4.4 0.2
Total 1,350.0 100.0 2.000.0 1.0m

- 173 -
6. AGRICULTURE
A. SECTOR PROFILE
6.1 The agricultural sector includes farming, fishing, animal husbandry, forestry(not including lumber industry), and water management. Although its share in GNP hasbeen continuously declining, agriculture is still the second largest economic sector inChina. Agriculture's share of GNP was 24 percent in 1990, compared with its 30 percentshare in 1980.
6.2 China is the largest grain, cotton, and meat producer. Outputs of othermajor agricultural products such as peanut and soybean are also high. There was 95.65million hectare (ha) cultivated land as of 1991, including 47.82 million ha irrigated land.Tractors plough about 52 percent of the cultivated land and diesel and electric pumps areapplied to about 58 percent of the irrigated land. The land area that is under fullymechanized farming is small, probably around 10 percent of the total cultivated land.Most farming work in China is still done by human and animal power.
6.3 As of 1990, the total power of agricultural machinery was 287 GW, up from150 GW in 1980. Tractors accounted for the largest share, with a total power of 90 GW.Small tractors (with an average unit power of 8.9 kW, or about 10 horsepower) provided69 percent of the total tractor power. Irrigation pumps are the second largest group, witha total power of 71 GW, of which 53 percent was electric. Trucks used in agriculture hada total power of 46 GW (with average unit power of about 75.6 kW, or about 85 hp),motorized boats (including fishing boats) had total power of 7 GW, and the remaining 73GW was unspecified. Table 6.1 details the stock of major energy-using equipment in theagricultural sector.
B. ENERGY USE
6.4 Due to the fact that China's agriculture continues to be very labor intensive,direct energy use in agricultural production remains small, accounting for about 5 percentof total commercial energy use in China. Energy consumption in agriculture was 48.5MTCE in 1990, including 20.7 Mt coal, 8.8 Mt diesel, 1.5 Mt gasoline, and 42.7 TWhelectricity. It is uncommon that China's agriculture consumes a large amount of coalwhich is supposedly used for drying products and cooking animal feed. Some accountingprocedures which may have included coal consumption of small village enterprisesprobably helped inflating the real agricultural coal use figure.
6.5 About one third of the country's total diesel supply is distributed to the ruralareas. While much of this fuel is used for farming activities like ploughing and irrigation,

- 174 -
Table 6.1: STOCK OF AGRICULTURAL MACHINERY, 1980-90 (GW)
Motor-Large & Small & Boat Rice ized Motor- Balance/medium walking tractors trans Drainage and irrigation motors fishing driven other
Year tractors tractors /a planters Diesel Electric Other Subtotal Trucks boats sprayers k ToWa
1980 (c) 24.02 16.38 0.58 0.21 27.57 20.35 7.74 55.66 9.09 2.62 0.54 40.40 149S01981 (c) 25.59 17.85 0.62 0.16 27.12 20.81 7.99 55.92 11.75 2.97 0.59 43.52 158.971982 (c) 26.49 20.16 0.55 0.12 26.92 29.75 0.52 57.19 14.08 3.27 0.62 45.97 168.451983 (c) 27.46 24.25 0.48 0.07 27.41 30.66 0.46 58.53 19.11 3.31 0.67 48.85 182.731984 (c) 27.57 29.27 0.39 0.05 26.54 31.59 0.44 58.57 24.97 3.40 0.64 52.85 197.681985 (c) 27.82 34.14 0.32 0.03 26.03 31.95 0.36 5835 31.18 3.72 0.57 55.90 212.031986 28.07 40.03 0.30 0.03 26.90 32.91 0.63 60.44 35.81 4.24 0.53 60.0S 229.501987 28.76 47.13 0.28 0.04 28.18 33.97 0.43 62.58 39.66 4.86 0.S3 64.53 248.361988 28.96 53.19 0.29 0.04 29.98 35.17 0.53 65.68 43.25 5.45 0.60 68.29 265.7S1989 28.14 58.48 0.25 0.04 32.07 36.07 0.39 68.53 4634 6.09 0.61 72.19 280.671990 27.46 62.31 0.26 0.05 33.49 37.49 0.32 71.29 46.21 6.96 0.75 71.79 287.08
/c Values in these rows (except for irrigation motor subtotals, boats, and totals, which are given in watts in the Energy StatiilYearbook) were calculated using a factor of I kW - 1.341 hp, derived from figures for the same year given in horsepower in theStatistical Yearbook of China and figures given in watts in the Energy Statistical Yearbook of China, 1989.
/b 'Other includes pumps, sprinkler machines, combine harvesters, motor-driven harvesters, motor-driven threahers, seed seectingmnchines, grain drying machines, rice and wheat mills, cotton-ginning mill, oil presces, foddergrtindea nd foragegras harvester.This column also indicates discrepancies in reported values for categories nd totals.
/s 'Boat tractors are used in rice cultivation.
Source: Orna Energy S:adsdcal Yearbook, 1989- Sitdsdeal Yearbook of Cuna, various yers.
a significant amount is also used by tractors providing transport. Transportation is animportant function of tractors in rural China, and this fuel usc is accounted for in theagricultural sector.
6.6 It was estimated that about 25 percent of agricultural diesel use was used forirrigation in the mid 1980s and about 40 percent of agricultural electricity was used forirrigation. Figures for today may not have changed significantly.
6.7 While total agricultural machinery power grew at an average annual rate of7 percent from 1980 to 1990. Diesel and electricity uses in this sector grew more slowlyat less than 2 percent and 5 percent per annum, respectively. Diesel use changed littlethroughout most of this period. This may be attributed in part to increased energyefficiency, but it is more likely due to machinery left idle because of chronic fuelshortages.
6.8 Because of the low level of mechanization, energy input per unit agriculturaloutput is lower in China than in industrialized countries. For example, the diesel/landratio for grain production was 41 liter/ha for China and 51 liter/ha in the US in the mid-1980s. The electricity/land ratio for grain production was 126 kWh/ha in China and 236kWh/ha in the US. The gain of production efficiency from mechanization is great. Thelabor productivity of American grain production is more than 100 times higher than thatof China.

- 175 -
Table 6.2: AGRICULTURAL ENERGY USE, 1980-90
Coal Diesel Gasoline Electricity Total(Mt) (Mt) (Mt) CMW)
1980 15.50 7.49 0.53 27.00 34.711981 15.69 7.05 0.58 28.16 34.591982 17.14 6.54 0.61 28.64 35.021983 18.35 6.65 0.72 28.64 36.081984 20.18 7.05 0.89 28.84 38.441985 22.08 6.29 1.22 31.74 40.451980 22.74 6.71 1.42 32.19 42.381987 22.7 17.30 1.46 35.96 44.721988 23.55 7.67 1.54 37.89 47.091989 21.59 8.26 1.34 41.05 47.421990 20.74 8.82 1.46 42.68 48.52
Note: Total energy use in the table includes a small amount (less than 2%) otherenergy sources such as coke and kerosene.
Source: Chlina Energy Statistical Yearbook, 1989 and 1991.
6.9 While China's agriculture presently requires less direct energy inputscompared to its Western counterparts, its demand for chemical fertilizers is comparable.Chemical fertilizer use has more than doubled, while grain production has increased littlesince the late 1970s. High demand for fertilizer will require more energy inputs in thechemical industrial sector. Another related issue is the burning of crop residues forcooking and space heating in the rural area. Additional fertilizer input will be needed toreplace nitrogen that would probably have otherwise returned to the soil.
6.10 As more and more farmers leave the fields, switching to nonagriculturaloccupations and often migrating to cities, energy-using equipment will be substituted forlabor and the energy intensity of agriculture will increase. Increasing use of chemicalfertilizers and pesticides has relieved Chinese farmers from the intensive laborrequirements of organic farming, but has increased the indirect energy intensity of farming.
C. ENERGY EFnCIENcY
6.11 Despite recent improvements, energy inefficiency in agricultural machineryis still widespread. Two cases are examined here.
6.12 Irrigation. In practice, the efficiency of irrigation pumps is 20 percentbelow their designed performance and 30 percent below the efficiency of their modem

- 176 -
foreign counterparts. Four contributing factors have been identified: (a) blind drilling,without careful consideration of site groundwater reserves, has contributed to a 50 percentdecrease of average irrigated area per unit pump power nationwide since the 1970s(depletion of ground water may also have contributed to this problem); (b) poor ditch andcanal quality allows for seepage and decreases water delivered per unit energy input intoirrigation; (c) pumps are often operated at partial load because of poor matching of pumplift with required lift, which impairs efficiency. For example, 60 percent of the irrigationpumps used in Jilin province were mainly used for water lifting below their designed liftheights; and (d) like much of other Chinese-made machinery, pump design andmanufacturing technologies are backward compared to international standards. Obsoletepumps are still widely used.
6.13 Tractors. There two main groups of tractors presently operating in China.The fist group consists of models of 1950s Soviet design. Their fuel intensity is 10-20grams of diesel per horsepower-hour (g/hp-hr) higher than that of their moderncounterparts. The second group consists of domestic designed models based on 1960stechnologies. Their fuel consumption is 5-10 g/hp-hr higher than that of their moderncounterparts. In 1984, the average tractor fuel intensity was 195 g/hp-hr which was about10 percent higher than that in industrialized countries. Poor maintenance also contributesto further worsening of tractor fuel economy.
D. POTENTIAL FOR IMPROVEMENT
6.14 Energy management is commonly weak in agricultural production becauseof the lack of skills and commitment. Energy shortages in agriculture may not cause asmuch attention as in the industrial sector because ample manpower can always be used asthe substitution. Since current agricultural production does not require much energy inputthe lure of energy savings is small. The govemment's attention in the rural area is alsopreoccupied by rural household energy use which is certainly a more serious issue tocontend with. In addition, agricultural energy demand has significant seasonal variation.Ad hoc supply measures are adopted and are often effective for relieving the fuel andpower shortage problems. Nonetheless, energy efficiency improvement deservesconsideration in the nationwide energy conservation plan since agricultural electricity anddiesel uses are by no means small quantities.
6.15 The improvement of agricultural energy use efficiency largely depends onthe improvement of efficiency of energy-using equipment and in the ways they areoperated. The former factor need to be addressed through proper production policies forthe agricultural machinery manufacturing industry. Introducing modern technologiesrepresent about 10 percent increase in tractor fuel economy and similar scale improvementof pump efficiency. Training of machine operators and routine maintenance help toprevent wasting energy in actual operation. A case study indicates that by investing inmaintenance, significant amount of tractor diesel use can be saved. The cost for such kindof investment (mostly spent on purchasing equipment) is about Y 32/TCE, a very cost-effective figure.

- 177 -
E. ENERGY USE AND EFFICIENCY TRENDS
6.16 The mechanization of farm work, the expansion of ocean fishery, and theindustrialization of animal husbandry all demand for more energy. Rural electrificationis likely to cause the switch from diesel-driven pumps to electric pumps in most irrigationactivities. The increasing availability of gasoline or diesel-driven light trucks mayeventually put an end to the use of tractors for rural transportation. The increasedmechanization of farm work will increase diesel demand. Deeper and faster processingof farm products will increase electricity as well as diesel demand. Increasing activity inocean fishery also increases diesel demand. It is unlikely that coal consumption willincrease significantly because its applications in agriculture are very limited.
6.17 The trend of physical energy intensity (energy use per ton of product) in theagricultural sector is very much decided by the extent of energy efficiency improvementand productivity growth because intensified machine use and irrigation tend to increaseoverall energy consumption. It is often true that the value-added energy intensity willdecrease because of escalating production costs and the appreciation of farm land and otherfactors.
6.18 Agriculture is not an important direct energy user and it will never be onefrom the experience in the US. Share of agricultural energy use in total energyconsumption is expected to become even smaller than current 5 percent. The absoluteenergy consumption of agriculture, however, will grow until reaching saturation.

- 178 -
7. TRANSPORTATION SECTOR
7.1 The transport sector has been divided into three parts for the purposes of theGreenhouse Gas Study-rail, road and water transport. Transport by air has not beenincluded. Water and rail transport are particularly important for freight movements,representing 49.5 and 46.1 percent respectively of the national traffic in 1990, comparedwith 1.7 percent for road and 2.7 percent for all other freight traffic.
A. RAIL
Subsector Characteristics
7.2 The first rail line was built in 1,876 and the system expanded slowly toabout 21,000 km of line by 1949. However, the standard of the lines and equipmentremained low and only about half these lines were operable. In recent times, priority hasbeen given to upgrading and expanding the rail network, so that the total length reached57,802 km by the end of 1990, excluding special purpose lines:
Track under central government authority 53378 anof which: Double track 13,024
Electrified 6,941Track under local governments 4,424
Total track length 57.802
7.3 With the exception of the Tibet Autonomous Region, every province,municipality and autonomous region has been linked by rail. In 1990, the rail system wasresponsible for 53.5 percent of national passenger traffic and 71.3 percent of freightmovement.
7.4 The rail subsector is divided into three functional activities under theMinistry of Railways: transportation, industry and engineering. These are supported byscientific and technological educational institutions. The Ministry is thus responsible fororganizing and managing rail transportation throughout China, for operating factories tomake locomotives, rolling stock and associated equipment and materials, and for designand construction of railway lines and related facilities.

- 179 -
7.5 With respect to transportation, there are 12 bureaux to operate different partsof the system. The industrial activities are undertaken by the General Locomotive andRolling Stock Corporation, the General Communication and Signal Corporation, and theGeneral Goods and Material Supply Corporation, under the responsibility of the Ministry.For construction, there are the General Engineering Corporation and the GeneralConstruction Corporation. Under the control of the respective Corporations, there aremany major facilities such as the following:
Type of facility Number
Engineering bureau 19Locomotive and rolling stock works 35Communications and signals factories 10Bridge factories 8Sleeper factories 2Engineering machinery factories 2Wood preservative factories 9Special equipment and tool factories 3Offices for goods and materials supply 9Survey and design institutes 5
Activities in 1990 included the following:
Industrial productionLocomotives 655Passenger coaches 1,866Rolling stock/wagons 18,597
Construction of track, kmNew track in operation 128Doubled lines 355Electrified lines 567
With respect to freight traffic, the rail system has been averaging an annual increase ofabout 4.5 percent per year since 1985:
1985 1,496.6 (109 ton-km)1990 1,928.9

- 180 -
7.6 The inventory of locomotives reached over 13,000 by the end of 1990, anincrease of 15.4 percent from the end of 1985: with respect to the total of diesel andelectric locomotives, this reached 53.8 percent of the inventory, up 19 percent from 1985.Figures for the end of 1990 are as follows:
Type of locomotive Number Percent
Steam 6,279 46.2Diesel 5,680 41.8Electric 1,633 12.0
Total 13.592
It is estimated that the proportion of work done by diesel and electric locomotives has beenraised from 39 percent in 1985 to 71 percent in 1990.
Energy Use
7.7 Energy use may be divided into the three categories mentioned:transportation, industry and engineering. The rail subsector energy consumption amountsto about 2.5 percent of the national energy demand. In 1990, consumption was as follows:
Coal Diesel oil Electricity Total(106 t) (106 t) (109 kWh) (106 TCE)
TransportLocomotives 13.97 2.70 4.10 16.21 (68.0%)Non loco. - - - 5.01
Subtotal 212 (89.0Z)
Industry - - 1.78 (7.5%)
Engineering - - - 0.85 (3.6%)
Total 20.83 3.01 7.13 23 (I 00.0%)

- 181 -
For the various types of locomotive, it can be seen that coal still provides almost 70percent of the energy used:
Fuel Quantity 106 TCE Percent
Coal 13.97 (tons) 11.05 68.0Diesel 2.70 (tons) 3.66 22.5Electricity 4.1 (109 kWh) 1.53 9.4
7.8 Energy costs represent about 19 percent of total running costs. The energycosts per million ton-km are estimated as Y 1,523 for steam, Y 2,008 for diesel andY 1,357 for electric locomotives.
Energy Efriciency
7.9 The overall energy consumption for locomotives was equivalent to 11.9kgCE per 1000 ton-km in 1985 and fell to 8.4 kgCE per 1000 ton-km in 1990, a decreaseof 5.8 percent per year, reflected in a drop in energy consumption from 17.9 million TCEin 1985 to 16.2 million TCE in 1990.
7.10 The current efficiency of locomotives is reported as follows:
Steam 6.1%Diesel 19.0%Electricity 20.8%
Energy Efriciency Trends
7.11 The following data covering the period of the Seventh Five Year Plan (1986-1990) shows the trends to greater efficiency:

- 182 -
Plan period1985 1986-90 1990
Transportation
Activity109 t-km 1,496.6 +4.5%/yr 1,928.9
Loco. energy use106 TCE 17.9 -1.8%/yr 16.2kgCE/t-an 11.9 -5.3 %/yr 8.4
Output valueY 106 per year +424percent per year +9.8%/yrTCE/Y 10,000 -0.28 (- 7 .1 %/yr)
Construction
Output valueY 106 per year +416percent +9.8%/yr
Energy consumptionTCE/year -26,200percent -2.6%/yrTCE/Y 10,000 -0.28 (-11.3%Iyr)
7.12 Savings in energy consumption continue to be made although savings arebecoming more difficult and costly to achieve. For example, the energy saving in 1985over the previous year was 9.1 percent while. the corresponding figure for 1990 was5.3 percent.
7.13 Energy efficiency has been improved through a number of measures, suchas:
(a) Campaigns to improve energy awareness of staff;
(b) Rules and regulations to promote energy saving;
(c) Introduction of improved technology;

- 183 -
(d) Replacement of outdated and inefficient technology;
(e) Replacement of steam locomotives by diesel and electric locomotives, withthe emphasis on high horsepower machines;
(f) In industrial plants associated with railways, funds have been allocated toreforming boilers, electric arc furnaces and kilns;
(g) Application of energy saving techniques on locomotives, e.g., improvedwheel lubrication; and
(h) Increased use of computerized equipment for controlling transformersystems, power factor correction, temperature and heat supply monitoring.
Potential for Improvement
7.14 A major factor which will contribute to energy efficiency is improvedmanagement of operations. For example, it has been estimated that 100,000 TCE couldbe saved each year if stoppage of locomotives outside stations could be eliminated andstop-start operation minimized. Optimizing train weights and running speeds will also helpsave energy, as will maximizing the use of diesel and electric traction.
7.15 Technological changes will lead to higher energy efficiency. These includeimproved AC/DC driving systems, and continuing replacement of inefficient equipment infactories.
B. HIGHWAY TRANSPORTATION
Subsector Characteristics
7.16 Highway transportation is a fast growing segment of China's transportationsector. The average growth rates of road freight movement and road passenger trafficregistered 16 and 14 percent per annum respectively from 1980 to 1990. In 1990, roadfreight movement reached 335.81 billion ton-kIn, accounting for 12.8 percent of totalfreight movement, and road passenger traffic reached 262.03 billion passenger-kIn,accounting for 46.6 percent of total passenger traffic (Table 7.1).
7.17 Current per capita road freight movement and passenger traffic are about300 ton-km and 240 passenger-km, respectively. They are very low compared with about4,000 ton-km and 10,000 passenger-km per capita in the US, indicating great potential forgrowth.
7.18 The stock of motor vehicles (trucks, buses, vans and cars) has beenincreasing at 12 percent per year since 1980. There were over 5.5 million freight andpassenger vehicles in 1990, with each category sharing 66.8 percent and 29.4 percent,
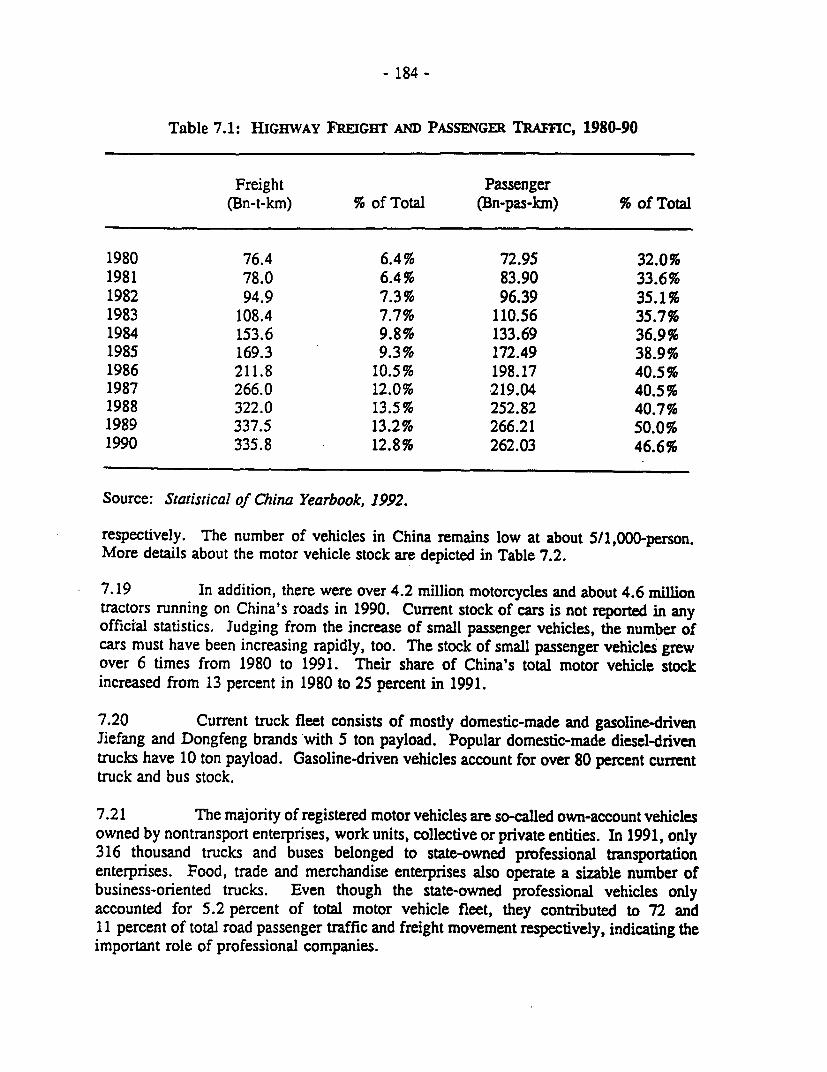
- 184-
Table 7.1: HIGEWAY FREIGHT AND PASSENGER TRAmc, 1980-90
Freight Passenger(Bn-t-km) % of Total (Bn-pas-km) % of Total
1980 76.4 6.4% 72.95 32.0%1981 78.0 6.4% 83.90 33.6%1982 94.9 7.3% 96.39 35.1%1983 108.4 7.7% 110.56 35.7%1984 153.6 9.8% 133.69 36.9%1985 169.3 9.3% 172.49 38.9%1986 211.8 10.5% 198.17 40.5%1987 266.0 12.0% 219.04 40.5%1988 322.0 13.5% 252.82 40.7%1989 337.5 13.2% 266.21 50.0%1990 335.8 12.8% 262.03 46.6%
Source: Statistical of China Yearbook, 1992.
respectively. The number of vehicles in China remains low at about 5/1,000-person.More details about the motor vehicle stock are depicted in Table 7.2.
7.19 In addition, there were over 4.2 million motorcycles and about 4.6 milliontractors running on China's roads in 1990. Current stock of cars is not reported in anyofficial statistics. Judging from the increase of small passenger vehicles, the number ofcars must have been increasing rapidly, too. The stock of small passenger vehicles grewover 6 times from 1980 to 1991. Their share of China's total motor vehicle stockincreased from 13 percent in 1980 to 25 percent in 1991.
7.20 Current truck fleet consists of mostly domestic-made and gasoline-drivenJiefang and Dongfeng brands'with 5 ton payload. Popular domestic-made diesel-driventrucks have 10 ton payload. Gasoline-driven vehicles account for over 80 percent currenttruck and bus stock.
7.21 The majority of registered motor vehicles are so-called own-account vehiclesowned by nontransport enterprises, work units, collective or private entities. In 1991, only316 thousand trucks and buses belonged to state-owned professional transportationenterprises. Food, trade and merchandise enterprises also operate a sizable number ofbusiness-oriented trucks. Even though the state-owned professional vehicles onlyaccounted for 5.2 percent of total motor vehicle fleet, they contributed to 72 and11 percent of total road passenger traffic and freight movement respectively, indicating theimportant role of professional companies.

- 185 -
Table 7.2: MOTOR VEHICLE STOCK IN THOUSANDS, 1980-90
Large Smalltrucks trucks Buses Vans & cars Total
1980 1,257.6 41.4 113.0 237.8 1,782.91981 1,374.1 66.8 130.4 275.3 1,991.41982 1,480.6 86.9 145.6 296.2 2,157.51983 1,576.7 117.7 161.3 316.5 2,326.31984 1,695.6 188.1 182.3 380.5 2,604.11985 - - - - 3,211.21986 - - - - 3,619.51987 2,191.9 620.3 273.6 841.0 4,080.71988 2,370.1 718.8 299.4 1,004.4 4,643.91989 - - 311.9 1,152.4 5,113.21990 2,604.9 1,079.9 333.0 1,288.9 5,513.6
Note: Total figures also include specialty vehicles. Large trucks have an averagepayload of about 5 tons. Small trucks have an average payload of 1.7 tons.Buses have an average of 40 seats. Vans and cars are classified as smallpassenger vehicles in official statistics and have an average of 8 seats.
Source: Statistical of Clhina Yearbook 1992.
7.22 There was total 1.04 million km of roads in 1991, compared with 88.83million km in 1980. Road quality is poor. First class highway (15-m wide with speedlimit of 80-100 km/hr) only accounted for 0.33 percent of total road mileage and the shareof second class highway (9-m wide with speed limit of 40-80 km/hr) was 4.6 percent ofthe total mileage of the roads. About 27 percent of the roads have asphalt or cementsurfaces and the rest have stone or even dirt surface. Construction of first and secondclass roads has been extensive in recent years.
7.23 The efficiency of road transportation is low not only because of poor roadquality but also because of the mix-up of multi transportation modes. Motor vehicles sharehighways with tractors, bicycles, and animal-pulled wagons (Table 7.3).
7.24 The Ministry of Transportation administrates the national roadway andwaterway systems and is responsible for formulating regulations and policies of highwayand water transportation, making development plans, and managing large enterprisesaffiliated with the ministry. Provincial transportation departments, which reports to theMinistry of Transportation, manage local roads and road transportation.

- 186 -
Table 7.3: RoAD TRAFC Mi ON HIGHIWAYS (%)
Total Motor Tractors Bicycles &traffic vehicles & others animal wagons
All roads 100 48.7 34.8 16.5State Highways 100 65.0 23.8 11.2Provincial Highways 100 56.5 32.0 11.5County Roads 100 42.8 39.6 17.6Rural Roads 100 28.1 44.6 27.3
Note: Motor vehicles include trucks, buses, vans, and cars.
Energy Use
7.25 There is no official statistics of energy consumption in highwaytransportation. Since road vehicles in China consumes mostly gasoline and diesel (thereis a small number of buses powered by electricity and natural gas), we could assume thatall gasoline use is for road transportation. It is difficult to estimate diesel use in roadtransportation because there are quite a few applications of diesel. As indicated by datain Table 7.4, gasoline and transportation-sector diesel consumption have increasedsignificantly in the 1980s, registering 7.4 and 8.4 percent per year from 1980 to 1990.Shortages of gasoline and diesel are widespread and leave many vehicles idling.
Energy Efficiency
7.26 In general, fuel intensity of freight transportation has been declining whilethat of passenger transportation has been increasing, indicating the gradual efficiencyimprovement in trucking and the increasing comfort (which usually offsets efficiencyimprovement) level in passenger transportation. Table 7.5 reveals fuel intensity trends ofprofessional trucking and passenger transportation. Vehicles operated by nonprofessionalenterprises or work units usually perform not as well.
7.27 Compared with industrialized countries, China's road transportation is poorin fuel economy and low in operation efficiency. The contributing factors to the mediocreperformance of road vehicles includes:
(a) Inefricient Engine Design. Domestic-made trucks and buses usually havefuel efficiencies that are 10-20 percent lower than their modem foreigncounterparts. Table 7.6 and Table 7.7 compares popular models ofdomestic-made trucks and buses with comparable foreign ones.Unlike those of Western countries, motor vehicle manufacturers in China
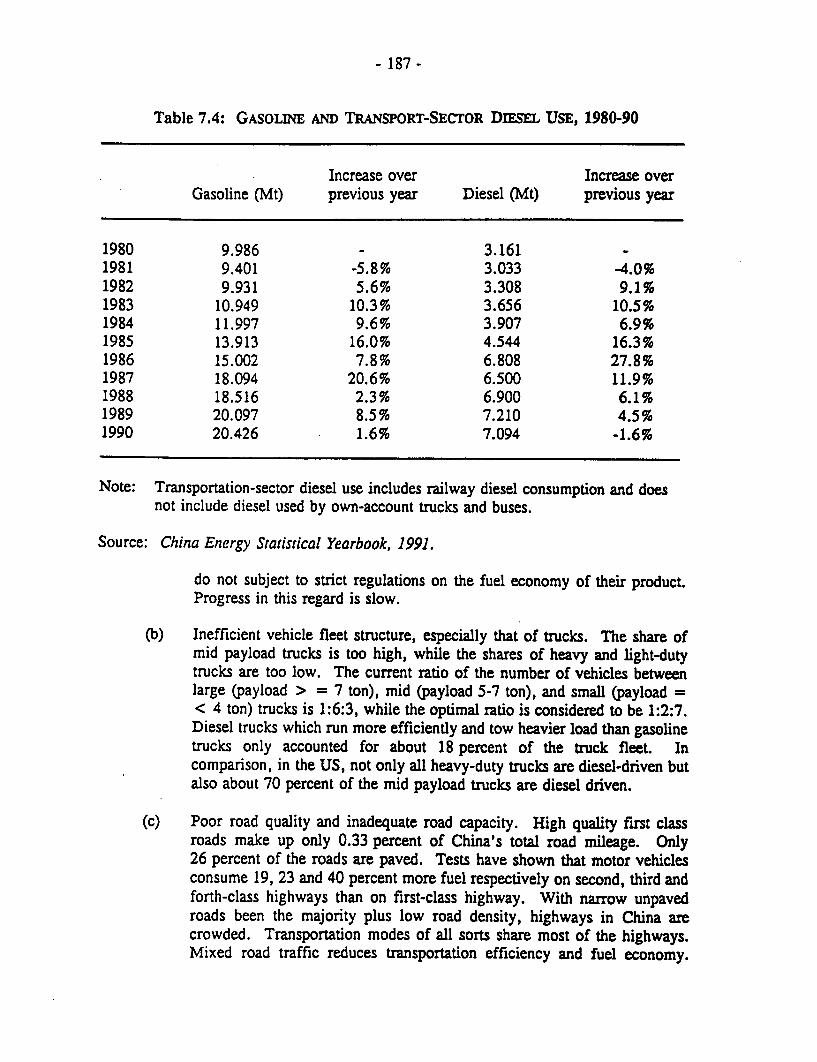
- 187 -
Table 7.4: GASOLINE AND TRANSPORT-SECrOR DEEL USE, 1980-90
Increase over Increase overGasoline (Mt) previous year Diesel (Mt) previous year
1980 9.986 3.1611981 9.401 -5.8% 3.033 -4.0%1982 9.931 5.6% 3.308 9.1%1983 10.949 10.3% 3.656 10.5%1984 11.997 9.6% 3.907 6.9%1985 13.913 16.0% 4.544 16.3%1986 15.002 7.8% 6.808 27.8%1987 18.094 20.6% 6.500 11.9%1988 18.516 2.3% 6.900 6.1%1989 20.097 8.5% 7.210 4.5%1990 20.426 1.6% 7.094 -1.6%
Note: Transportation-sector diesel use includes railway diesel consumption and doesnot include diesel used by own-account trucks and buses.
Source: China Energy Statistical Yearbook, 1991.
do not subject to strict regulations on the fuel economy of their product.Progress in this regard is slow.
(b) Inefficient vehicle fleet structure, especially that of trucks. The share ofmid payload trucks is too high, while the shares of heavy and light-dutytrucks are too low. The current ratio of the number of vehicles betweenlarge (payload > = 7 ton), mid (payload 5-7 ton), and small (payload =< 4 ton) trucks is 1:6:3, while the optimal ratio is considered to be 1:2:7.
Diesel trucks which run more efficiently and tow heavier load than gasolinetrucks only accounted for about 18 percent of the truck fleet. Incomparison, in the US, not only all heavy-duty trucks are diesel-driven butalso about 70 percent of the mid payload trucks are diesel driven.
(c) Poor road quality and inadequate road capacity. High quality first classroads make up only 0.33 percent of China's total road mileage. Only26 percent of the roads are paved. Tests have shown that motor vehiclesconsume 19, 23 and 40 percent more fuel respectively on second, third andforth-class highways than on first-class highway. With narrow unpavedroads been the majority plus low road density, highways in China arecrowded. Transportation modes of all sorts share most of the highways.Mixed road traffic reduces transportation efficiency and fuel economy.

- 188 -
Table 7.5: FUEL ECONOMY OF TRANSPORTAIION COMPANES, 1980-91(in liter/1000-ton-km)
Gasoline trucks Diesel trucks Gasoline buses Diesel buses
1980 87 62 78 661981 85 60 80 551982 82 59 79 561983 80 58 81 571984 79 57 79 561985 77 53 80 611986 76 51 81 641987 76 51 82 681988 72 48 82 641989 71 47 81 651990 71 48 87 721991 69 46 88 72
Note: Bus fuel intensity is converted from liter/vehicle-km.
Source: China Energy Statistical Yearbook, 1991.
According to the investigation of Anchin city highway management office,mixed traffic reduces vehicle speed by 18 percent compared with divided-lane traffic. A study about the Goubei highway in Liaolin province revealsthat mixed traffic reduces vehicle speed by 32 percent, increases fuelconsumption by 16 percent, and increases gear change five times comparedwith divided-lane traffic.
(d) Small share of professional road transportation and mediocre operationmanagement. Trucks owned by enterprises or work units that have nobusiness-oriented trucking operation contribute to about half of the total roadfreight movement. The payload utilization rate of these trucks is about30 percent compared with over 60 percent for trucks operated by theprofessional transportation companies.
7.28 China's car fleet consists of mostly imported cars and cars assembled in jointventures, representing technologies of early to late 1980s. The fleet fuel economy of carsoperated in China are considered low because poor road condition, lack of maintenance,and low octane gasoline all reduce energy efficiency. Gasoline consumption by cars is stillsmall compared to that by trucks and buses. Since domestic car manufacturing is still inits formative stage, regulation on fuel economy and selectively choosing eager foreigninvestors could have great preventive impact on future gasoline demand.

- 189 -
Table 7.6: COMPARISON OF TRUCK FUEL ECONOMY, SELECTED COUNTRIES
Engine Gross Payload Fuel economytype Model weight (ton) (ton) Horsepower (liter/,000-t-km)
Gasoline Jiefang CA15 (China) 9.1 5.0 115 53Dongfeng EQ140 (China) 9.3 5.0 135 56
Diesel Yuejing NJ131 (China) 5.7 3.0 88 55Huanghe JN162 (China) 17.3 10.0 210 26.5Mitsubishi KFK216 7.8 4.3 33.3Mitsubishi KFM316 12.3 7.0 21.3Benz i217L (Germany) 14.0 8.0 192 19.3
Note: Fuel economy figures are converted from liter/1000-vehicle-km to liter/1,000-ton-kin by dividingthe former with payload. Actual fuel economy varies with payload utilization.
Table 7.7: COM1PARISON OF BUS FUEL ECONOMY, CIIINA AND JAPAN
Engine Gross Seats Fuel economytype Model weight (ton) (person) Horsepower (liter/1,000-t-kn)
Gasoline JT662 (China) 9.3 45 135 6.0Diesel JT680 (China) 15.1 60 160 4.2
Nissan KDASOT 17.5 60 3.9Hino RU236 16 48 320 3.5
Note: Fuel economy figures are converted from liter/1,000-vehicle-km to liter/1,000-passenger-km bydividing the former with passenger capacity. Actual fuel economy varies with seats utilization.
Potential for Improvement
7.29 Introducing modem engine designs and manufacturing technologiesrepresents 10-20 percent increase in fuel economy over popular domestic engine models.
7.30 Increasing the share of diesel trucks in freight transportation saves fuel. Onthe average, diesel trucks use 20 percent less fuel per unit freight movement than gasolinetrucks. This measure also calls for production adjustment of truck manufacturing industryand oil refining industry. Road conditions have to be improved to accommodate more andlarger and heavier diesel trucks. Increasing the share of light-duty trucks may displacemany large trucks owned by work units and make miscellaneous uses of trucks moreefficient.
7.31 Promoting the development of professional trucking also help to displaceunderutilized own-account trucks. Fuel savings can be achieved by improved load

- 190 -
utilization rate and better maintenance of vehicles. There is significant potential forimprovement in operation efficiency of the professional trucking companies. Investmentin management and skill enhancement usually have very attractive economic returns.
7.32 Increasing gasoline octane value improves fuel economy. Studies have foundthat increasing gasoline octane value from previous 70 to current 80 resulted in 10 percentincrease in fuel economy of popular gasoline truck models. Most operating gasoline truckshave to be modified to use higher octane-value gasoline. The payback time for theadjustment ranges from 16 to 28 months. The estimated gasoline savings from thismeasure are about 1 Mt gasoline per year. Considering that trucks in China usually haveprolonged life, this measure is considered viable.
7.33 Improving road quality would greatly increases road transportation efficiencyand significantly reduces fuel use. Over 90 percent of current highways is third and lowerclass roads. Upgrading roads, however, calls for major investment.
7.34 Other measures that help to improve energy efficiency include moreextensive use of radial tires, preventive maintenance, and driver education.
Energy Use and Efficiency Trends
7.35 Transportation has become an important constraint of China's economicdevelopment. Developing highway transportation is a major part of the integratedapproach to resolve issues concerning transportation bottlenecks. Overll efficiency oftransportation can be improved if the highway system could handle more of short-to-medium range movement of freight and passengers and make the railway system moreavailable for large and long-haul activities.
7.36 Extrapolating current trends, we expect the importance of highwaytransportation to continue to increase. China's automotive industry has highlighted twomajor areas for development: heavy-duty trucks and passenger cars. Connecting majorcities with super-highways is a high priority of China's planners and is encouraged byforeign investors.
7.37 Transportation activity tends to increase in tandem with the overall economicgrowth. With increasing trucking capacity and car ownership, large increase of gasolineand diesel consumption is expected. This development may cause large quantity of oilimport if domestic supply falls short.
7.38 In freight transportation, energy efficiency is expected improve with new andbetter trucks replacing inefficient old trucks and with increasing fleet share of diesel-driventrucks. In passenger transportation, energy efficiency improvement may be offset byincreasing comfort level (less crowded buses). The growing number of cars also reducethe overall energy efficiency of passenger transportation.
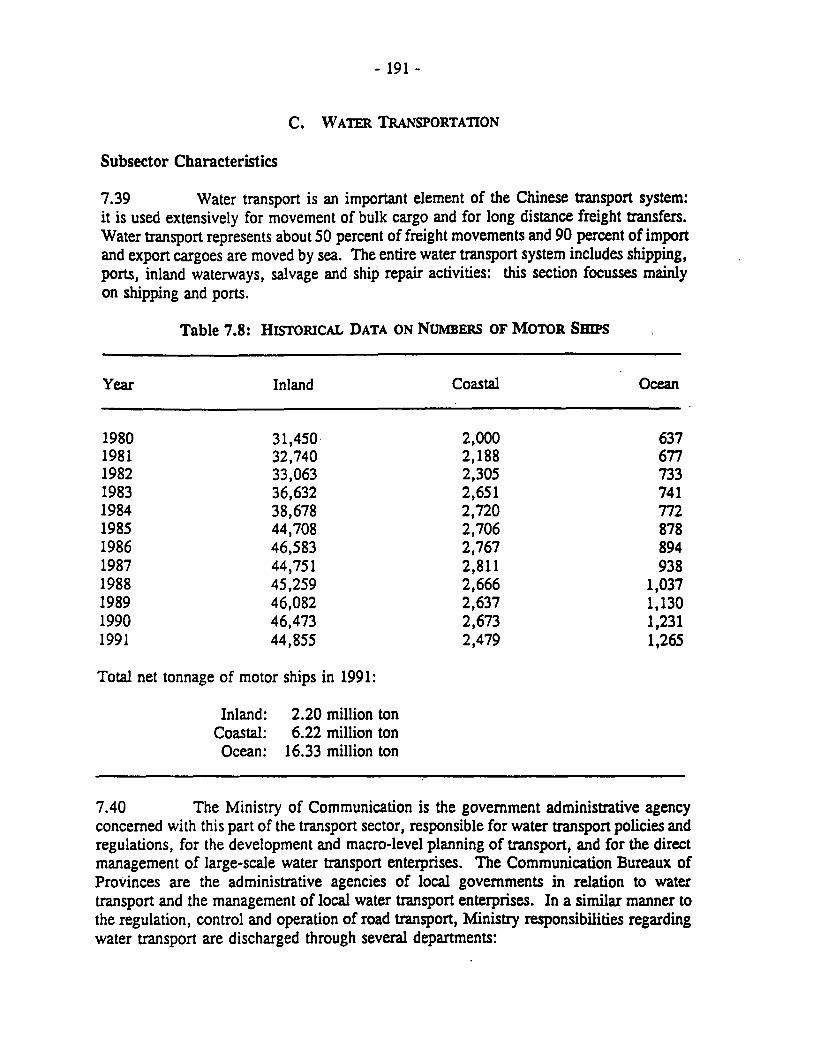
- 191 -
C. WATER TRANSPORTATION
Subsector Characteristics
7.39 Water transport is an important element of the Chinese transport system:it is used extensively for movement of bulk cargo and for long distance freight transfers.Water transport represents about 50 percent of freight movements and 90 percent of importand export cargoes are moved by sea. The entire water transport system includes shipping,ports, inland waterways, salvage and ship repair activities: this section focusses mainlyon shipping and ports.
Table 7.8: HLsTORICAL DATA ON NUmBERS OF MOTOR SmPS
Year Inland Coastal Ocean
1980 31,450 2,000 6371981 32,740 2,188 6771982 33,063 2,305 7331983 36,632 2,651 7411984 38,678 2,720 7721985 44,708 2,706 8781986 46,583 2,767 8941987 44,751 2,811 9381988 45,259 2,666 1,0371989 46,082 2,637 1,1301990 46,473 2,673 1,2311991 44,855 2,479 1,265
Total net tonnage of motor ships in 1991:
Inland: 2.20 million tonCoastal: 6.22 million ton
Ocean: 16.33 million ton
7.40 The Ministry of Communication is the government administrative agencyconcerned with this part of the transport sector, responsible for water transport policies andregulations, for the development and macro-level planning of transport, and for the directmanagement of large-scale water transport enterprises. The Communication Bureaux ofProvinces are the administrative agencies of local governments in relation to watertransport and the management of local water transport enterprises. In a similar manner tothe regulation, control and operation of road transport, Ministry responsibilities regardingwater transport are discharged through several departments:

- 192 -
Table 7.9: PASSENGER TRAFlC DATA, 1980-91
Year Inland Coastal Ocean
Historical Passenger Turnover by Ship(100 million passenger-km)
1980 110 17 1.51981 110 26 1.71982 114 27 2.21983 120 31 2.41984 119 32 2.31985 133 38 2.81986 131 37 2.51987 134 41 3.41988 142 44 3.11989 131 42 3.11990 110 39 3.51991 116 42 4.1
Historical Freight Turnover by Ship(100 million ton-km)
1980 560 937 3,5391981 564 942 3,6431982 650 1,057 3,7681983 698 1,102 3,9771984 763 1,189 4,3731985 827 1,419 5,3281986 894 1,590 5,9471987 947 1,735 6,5751988 1,019 1,890 6,9651989 1,021 2,244 7,6881990 904 2,338 8,1401991 960 2,772 8,990
(a) Planning-responsible for medium and long term planning and for annualplans for the water transport industry in accordance with national economicand social development, supervising implementation and ensuring statedirectives are met and urgent material transport needs are fulfilled.
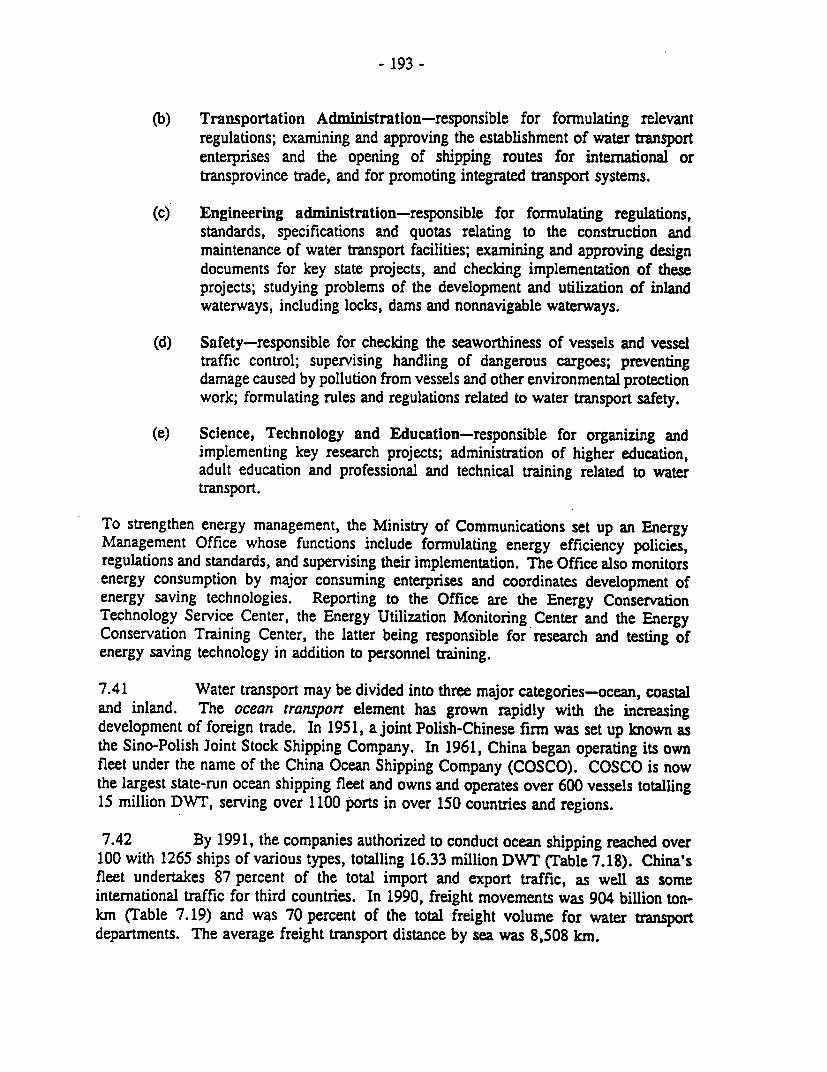
- 193 -
(b) Transportation Administration-responsible for formulating relevantregulations; examining and approving the establishment of water transportenterprises and the opening of shipping routes for international ortransprovince trade, and for promoting integrated transport systems.
(c) Engineering administration-responsible for formulating regulations,standards, specifications and quotas relating to the construction andmaintenance of water transport facilities; examining and approving designdocuments for key state projects, and checking implementation of theseprojects; studying problems of the development and utilization of inlandwaterways, including locks, dams and nonnavigable waterways.
(d) Safety-responsible for checking the seaworthiness of vessels and vesseltraffic control; supervising handling of dangerous cargoes; preventingdamage caused by pollution from vessels and other environmental protectionwork; formulating rules and regulations related to water transport safety.
(e) Science, Technology and Education-responsible for organizing andimplementing key research projects; administration of higher education,adult education and professional and technical training related to watertransport.
To strengthen energy management, the Ministry of Communications set up an EnergyManagement Office whose functions include formulating energy efficiency policies,regulations and standards, and supervising their implementation. The Office also monitorsenergy consumption by major consuming enterprises and coordinates development ofenergy saving technologies. Reporting to the Office are the Energy ConservationTechnology Service Center, the Energy Utilization Monitoring Center and the EnergyConservation Training Center, the latter being responsible for research and testing ofenergy saving technology in addition to personnel training.
7.41 Water transport may be divided into three major categories-ocean, coastaland inland. The ocean transport element has grown rapidly with the increasingdevelopment of foreign trade. In 1951, a joint Polish-Chinese firm was set up known asthe Sino-Polish Joint Stock Shipping Company. In 1961, China began operating its ownfleet under the name of the China Ocean Shipping Company (COSCO). COSCO is nowthe largest state-run ocean shipping fleet and owns and operates over 600 vessels totalling15 million DWT, serving over 1100 ports in over 150 countries and regions.
7.42 By 1991, the companies authorized to conduct ocean shipping reached over100 with 1265 ships of various types, totalling 16.33 million DWT (Table 7.18). China'sfleet undertakes 87 percent of the total import and export traffic, as well as someinternational traffic for third countries. In 1990, freight movements was 904 billion ton-km (Table 7.19) and was 70 percent of the total freight volume for water transportdepartments. The average freight transport distance by sea was 8,508 km.

- 194 -
7.43 The Chinese mainland coastline is 18,000 km long. Coastal transport formsan important north/south corridor for delivering domestic cargoes and has played a majorpart in the economic development of coastal areas. Coal is transported from north to southand grain form south to north: raw materials, industrial products and people are movedby a fleet of 2,479 vessels totalling 6.6 million DWT. There are 29 major seaports,including several large modernized ports such as Dalian, Qinghuangdao, Tianjin, Shanghaiand Guangzhou. There are many modern terminals for crude oil, ore, bulk grain andcontainers with a total of 968 berths, 296 of which can accommodate vessels of 10,000DWT and above.
7.44 The largest ports are Shanghai and Dalian-primarily for coal, crude oil,steel, iron, timber and salt from north to south, and grain, metal ores and industrialproducts from south to north. Guangzhou is also important for transporting agriculturalproducts, ores, salt and coal.
7.45 In 1990, freight movements amounted to 240 billion ton-kin, about20 percent of water transport trade (277.2 billion ton-km in 1991). The average distancefor coastal shipments was -almost 1,900 km. Three major companies under the Ministryof Communications-Shanghai Maritime Transport Bureau, Guangzhou MTB and DalianSteamship Company-are responsible for 85.8 percent of coastal freight capacity and carryannually over 48 million tons of coal, 21 million tons of petroleum, 4 million tons of ironand steel, as well as over 9 million passengers. Total freight throughput in 1990 was532.2 million tons via major coastal seaports.
7.46 There are 96 coastal shipping routes for passengers. Transport departmentsalone transported 25.84 passengers in 1990 out of a total of 51.33 million passengersthrough major ports in 1990. Table 7.19 provides historical data on passenger traffic.
7.47 Inland waterways are important in China. The main river systems includethe Yangtze, Heilong iang, Zhujiang Rivers and the Beijing-Hangzhou Grand Canalsystem. Motorized vessels for inland water transport number 44,855 and total 2.2 millionDWT. In 1991, passenger traffic was 11.6 billion passenger-km (72 percent of the trafficof water transport departments) and freight traffic to 96 billion ton-km (8 percent of thetotal). The average inland freight transfer distance was 290 km in 1990 and 301 in 1991(Table 7.13).
7.48 The Yangtze River is the most important artery for inland water transport,carrying 26 million persons and 63.45 million tons of freight in 1991. The ChinaChangjiang River Shipping Corporation is the largest inland water transport enterprise,involved mostly in bulk cargo transport such as coal, petroleum, steel, building materialsand grain, as well as passengers.
7.49 The characteristics and condition of inland waterways are important factorsaffecting vessel performance and fuel consumption. The gradual deterioration of waterwayconditions and decrease of navigable channel lengths in the 20 years up to 1980 resultedin the proportion of freight being carried on inland waterways dropping to 7 percent and

- 195 -
waterways to 108,500 km in that year. While the situation has improved a little, statisticsfor 1991 show the length of inland waterways is still only 109,700 km (Table 7.10), ofwhich 60,336 km (55 percent) have a water depth of 1 meter or more (Table 7.11). About5,700 km (5.2 percent) are navigable for vessels of 1,000 DWT or above and about 15,850km (14.5 percent) for vessels of 300 DWT or above. As Table 7.12 shows, there are1,754 inland river ports: of these, 264 (15 percent) have an annual capacity of over500,000 tons.
Table 7.10: INLAND WATERWAY LENGTHS
Year Total Length with 1 meter(km) and above depth
1980 108,508 54,8001981 108,665 54,9221982 108,634 55,5951983 108,904 56,1771984 109,273 56,7321985 109,075 57,4561986 109,404 57,4561987 109,829 58,1651988 109,364 57,9711989 109,040 58,1311990 109,192 59,5751991 109,703 60,336
7.50 The construction of inland waterways and ports depends mainly oninvestment by the government and the levy of waterway maintenance tolls. The toll islevied on the basis of 8 percent of shipping company operating incomes and totals Y 200to Y 300 million annually. This amount, together with other investments made by thegovernment, is not enough to improve the condition of waterways through major projectsand therefore most remain in much the same condition from year to year. In 1986, theaverage tonnage of inland waterway vessels was 100 DWT which gives rise to relativelyhigh costs and fuel consumption. The situation is not believed to have changed much sincethen.

- 196 -
Table 7.11: INLAND WATERWAY NAVIGATION LMrs, 1991
Type Navigable ship Depth Length(tonnage) (m) (kIn)
1st grade 3,000 3.5-4.0 1,3782nd grade 2,000 3.4-3.8 1623rd grade 1,000 2.0-2.4 4,2024th grade 500 1.6-1.9 4,5595th grade 300 1.3-1.6 5,5536th grade 100 1.0-1.2 18,0137th grade 50 0.7-1.0 13,608Other <50 <0.7 62,164
Total 109.427
Table 7.12: MAiN RIVER SYsTEs AND NUmBERS OF PORTS
Mileage Number of(km) ports ?
Changjiang Rivers 70,340 1,168 198Heilongjiang Rivers 5,808 40 3Zhujiang Rivers 12,619 161 26Jing-hang Canal 1,221 65 29Huanghe Rivers 1,754 18
Total 91.742 1.452
Energy Use
7.51 Most of the energy consumed in water transport is in the form of diesel oil.Consumption by ships of the water transport departments was 5.71 million tons in 1991:
Million tons Percent
River vessels 0.83 15Coastal 1.38 24Ocean 3.50 61

- 197 -
Table 7.13: AVERAGE DISTANCE FOR FREIGHT TRANSPORT (kin)
Year Inland Coastal Highway Railway
1980 198 1,320 34 5261981 189 1,323 35 5441982 203 1,373 38 5391983 218 1,382 42 5591984 234 1,398 45 5971985 248 1,560 46 6361986 261 1,512 47 6621987 267 1,556 49 6901988 273 1,575 55 7021989 294 1,682 58 7071990 290 1,758 56 7251991 301 1,897 55 740
Historical data for fuel consumption are given in Table 7.14.
Energy Efficiency
7.52 Table 7.15 gives historical data for fuel consumptions in the water transportsubsector. In 1991, the average fuel consumption for freight movements by ship was asfollows:
kg per 1,000 ton-km Relative traffic
River 8.15 100Coastal 4.94 288Ocean 3.89 936
7.53 The main factors affecting fuel consumption are the water transportinfrastructure (e.g., ports and waterways), the technical performance of ships, andoperations management. Most of the inland waterways in China remain in a natural stateand many are unable to be used within the transport network due to blockage of thechannels. Congestion in coastal ports of both vessels and cargo is a common problem dueto insufficient capacity-lack of handling facilities for freight, low number of general cargoand container berths, etc.

- 198 -
Table 7.14: FUEL CONSUMrTON OF WATER TRANSPORT (10,000 ton)
Year Inland Coastal Ocean Total
1980 76 71 181 3281981 72 68 178 3181982 78 75 181 3341983 77 76 183 3361984 82 79 190 3511985 82 87 242 4111986 84 94. 270 4481987 86 96 300 4821988 90 101 289 4801989 92 115 323 5301990 83 119 360 5621991 83 138 350 571
Table 7.15: FUEL CONSUMPION COMPARISONS FOR SHPS (kg/1,000 ton-km)
Year Inland Coastal Ocean Average
1980 12.4 7.50 5.11 6.431981 11.6 7.12 4.88 6.111982 11.1 7.01 4.79 6.031983 10.2 6.81 4.59 5.741984 9.97 6.56 4.34 5.481985 9.18 6.05 4.54 4.861986 8.75 5.84- 4.54 5.261987 8.47 5.47 4.56 5.151988 8.25 5.28 4.15 4.811989 8.46 5.08 4.21 4.791990 8.65 5.05 4.42 4.911991 8.15 4.94 3.89 4.46
7.54 The technical level of the vessels themselves is equivalent to internationallevels of the early 1980s, representing a technology gap of say 10 years. The fleetcomposition is typically oriented to small ships. Container and other specialist shipsrepresent a small proportion of the tonnage: for example, about 60 percent of generalcargo is containerized in developed countries and only 25 percent in China. The age ofships is also rather high. Of national fleets over 20 million DWT, China ranks 25 out of

- 199 -
35 for the age of its ships. The average age of ships in the ocean-going category is 15years and the coastal fleet has 30 percent of hips over 20 years old. Older ships havepoorer fuel consumptions due to the aging of engines and the deterioration of hulls bycorrosion.
7.55 Ship engines have been improved throughout the world and advanced foreigndiesel engines operate at about 115-gm fuel per HP hour. It is estimated that Chineseocean-going ships use 20 gm/hp.hr more than typical foreign counterparts. Inland andlocal coastal ships use older technology engines using typically 175-180 gm/hp.hr.
7.56 The operating rate of ships is also lower than foreign counterparts. Forexample, the average operating rate for ships is about 85 percent for China. Ocean-goingships may reach 93 percent but this is still far behind foreign fleets which often reach98 percent or 355-360 operating days per year.
Energy Efficiency Trends
7.57 In 1986, the Ministry of Communication issued 'Regulations on theManagement of Energy Conservation in the Transport Industry" which were "to strengthenenergy management in a scientific way, to renew and renovate energy intensive equipmentin a planned way, to utilize energy rationally" and utilize technological advances. Theregulations include instructions for keeping proper energy consumption records andconducting routine analysis of performance.
7.58 Some results of attention lo energy efficiency are as follows:
(a) Old ships have been renovated and engines replaced with a saving of up to20 percent of fuel. Large numbers of old steam ships have been replaced.
(b) Optimization of the operation of older ships allows them to sail at lowerspeeds and decreased power, thus decreasing energy use by 8-10 percent.
(c) Improvements to propeller design have led to energy savings of 8-10 percentwithout reducing the speed of the ships.
(d) Improvements have been made to the load distribution of ships, regulatingthe length, depth and geometry of the ship's waterline and reducing waveresistance and friction around the ship: propulsion efficiency improves 5-20 percent.
(e) Hull roughness has been reduced by clearing rust and marine growth withunderwater cleaners and coating the hull with smooth compounds to reducefriction. Results show energy savings of 5-20 percent.
(f) Adding fins and nozzles near the stern of ships to improve flow patterns canreduce fuel consumption by 6-10 percent.

- 200 -
(g) Improved navigation systems are being adopted to help ships make full useof favorable weather conditions (e.g., winds) and the state of the sea (e.g.,currents, waves).
(h) Energy efficient ships are being tested, such as a shallow draft/wide beambulk carrier, ships with modified stem shapes to improve water flowpatterns, and sail aided motor ships. Energy savings from 8-30 percent areanticipated.
Potential for Improvement
7.59 By continuing to apply the methods and technologies listed above, furtherimprovements are expected. In addition:
(a) The replacement of old ships by new energy efficient vessels will lead tomajor energy savings also, as many of the ships in the present fleet arealready quite old.
(b) Larger ships should form a larger proportion of the total, and this mayrequire upgrading of ports, handling facilities and channel depths.
(c) Further use of roll-on, roll-off transfer methods for cargo and passengervehicles will shorten journey times and lead to more effective use of ships.
(d) The average loading capacity of inland waterway barges will be increased.
(e) The average transport distance of river vessels and increased power of tugscould reduce energy consumption by 20-40 percent.
(f) Use of containerized transport should be promoted.
Projected Activity and Energy Use
7.60 Forecasts of freight and passenger traffic have been made:

- 201 -
Freight Freight Number of Passengerquantity activity passengers traffic
lo6 t 109 ton-km lo 10' pass-lkm
1990 539 1,139 188 15.82000 956 2,240 198 18.62010 1,499 4,011 204 21.52020 2,115 5,937 208 23.7
The following energy forecasts have been estimated:
2000 2010 2020
Freight and passenger activity(10' ton-km equivalent) 2,249.3 4,021.5 5,953.4
Fuel consumption (kg oil/1,000 ton-krr) 4.52 4.29 4.16
Forecast diesel fuel use (10' tons) 10.17 17.25 24.77

- 202 -
8. ENERGY USE IN BUILDINGS
8.1 Energy use in buildings, namely residential and commercial buildings, is animportant issue not only because huge amount of energy is involved, about one fifth oftotal commercial energy consumption and all of biomass consumption, but also becausehealth hazards of current building energy use are severe and extensive. Energyconservation measures that include fuel switching, energy-efficiency equipment, andimprovement of energy services would reduce future energy demand as well as the costsof health care.
A. RESIDENTAL SECrOR
Sector Profile
8.2 In 1990, China's population was 1.14 billion. According to averagehousehold sizes in urban and rural areas, the residential sector includes about 280households and about 70 percent of them are located in rural areas. Since the late 1970s,there have been two distinctive demographic changes that have long-term impact onresidential energy demand. China's population is moving faster than ever to urban areasand households are becoming smaller. Censuses in 1982 and 1990 indicated that the shareof urban population increased five percentage points and the growth rate in the number ofhouseholds outpaced that of the population by a factor of two. In contrast, there wasvirtually no net migration of population between rural and urban areas in the 1960s and1970s and the growth rate of households lagged behind that of population from 1953 to1982.
8.3 Households are smaller and richer than ever before. Official statistics haveshown that the average real wage per employed person increased about 1.5 times from1978 to 1990. The actually increase of personal income may be significantly largerbecause bonuses and cash awards have become very important nonwage income avenues.Corresponding to the increase in personal income, per capita living expenditure (in realterms) of rural and urban residents increased 2.1 and 1.8 times respectively from 1978 to1990. The increase of household appliances such as color TV sets and refrigerators isphenomenal (Table 8.1).

- 203 -
Table 8.1: STOCK OF MAJOR APPLIANcES, 1978-90(million)
ElectricElectric clothes
Year fans TV sets washers Refrigerators
1978 9.20 3.04 0.01 0.091979 10.50 4.85 0.03 0.131980 13.65 9.02 0.26 0.191981 17.92 15.62 1.50 0.251982 25.91 27.61 5.90 0.441983 333.57 36.11 12.52 1.051984 43.40 47.63 19.28 1.821985 63.60 69.65 30.30 4.101986 86.05 92.14 43.33 7.271987 111.88 1116.01 57.62 11.811988 145.46 143.44 74.64 19.271989 173.33 165.93 87.01 25.541990 201.27 185.46 96.28 29.96
8.4 According to a survey conducted in 1989, there were about 3,543 millionm3 residential floor space in the urban areas, about 1,547 million m3 of it located in theofficial heating zone. I/ Table 8.2 reveals more details about China's building stock.
8.5 For both urban and rural residents, the largest increase in living space wasachieved since the late 1970s. Per capita floor space for urban and rural residents wasabout 7 and 9 m2, respectively, in 1979 and increased to about 12 and 17 ml in 1989.Although rural residents generally have greater floor space, the quality of housing isusually higher in urban areas.
8.6 The urban building stock consists of mainly low-rise buildings. By the endof 1985, about 50 percent of the building stock was single-floor buildings and another28 percent was two or three-story buildings. - There was no significant change in this
I/ Traditionally, the government has divided the nation into three climate zones for selecting differentheating options. Areas that have more than 90 days of below 5C outdoor daily average temperatureper year are classified as heating zone. Areas that have 60-89 such days, or areas that have morethan 75 days per year during which the average daily outdoor temperature is less than 8C areclassified as transition zone. The rest of the country falls into the nonheating zone. The heatingzone occupies about two thirds of China's territory and has about 50 and 40 percent of the nation'surban and rural population, respectively.

- 204 -
Table 8.2: ESTIATE OF RESEDENTIAL AND COMMECiAL BUILDING STOCK, 1989
Urban /a Rural /a Comm. lb Urban res. Rural res. All bldgspopulation population buildings buildings buildings floor area
(mln) (mln) (mln m) (mln m) b (mln m2 /b (mln m )
Heating zone 146.5 338.5 458 1,547 5,755 7,760Transition zone 87.7 280.2 330 1,176 4,763 6,269Nonheating zone 61.2 212.9 231 821 3,619 4,671
Total 295.4 831.6 1.019 3.544 14.137 18.700
La Population distribution derived from the official 10% sample data (SYC 1991)./b The total figures and the heating zone figures for urban buildings are from Tu and Wang (1991).
Transition zone and nonheating zone figures are derived from the population ratio. Ruralresidential building stock is estimated from survey data of per capita floor space. ,
Source: Lawrence Berkeley Laboratpry, Report No. LBL-33867.
situation by the end of 1989. Buildings are also relatively new. Close to 80 percent ofcurrent building stock has less than 20 years of service.
8.7 A great part of China is under the impact of the east Asian monsoon. Eachyear from October to March, cold winter monsoons from Siberia and the Mongolianplateau sweep down southward. This climate condition makes a large portion of Chinavery dry and cold in the winter. Extreme differences in winter temperatures can reachmore than 40°C between the north and the south. Compared with other regions of theworld at the same latitudes, China's winter temperatures are 5-20°C lower on the averagefrom south to north. This climate condition determined that extensive winter space-heatingis needed in about two thirds of China.
8.8 Summer is long and humid in areas to the south of Yangzi river. Atpresent, most households and offices use electric fans to drive off summer heat. Potentialfor the use of air conditioners is great.
8.9 In 1986 the Ministry of Construction introduced the "Energy-EfficientDesign Standards for Residential Buildings in Heating Zone" and began to experiment ondemonstration projects. The standards set two goals for saving space-heating energy. Thefirst goal was to reduce space-heating fuel intensity of new buildings to the level thatwould be 30 percent less than their 1981 value by 1990. The second goal was to furtherreduce space-heating energy intensity of new buildings to the level that would be30 percent less than their 1990 value by 2000. Local govemments in heating zone wererequired to formulate their own energy-efficient residential building standards accordingto the national code. But it was not until 1990 that a few cities, including Beijing andXian, announced detailed local standards.

- 205 -
8.10 Progress in compliance with the building standards is not satisfactorybecause of the nonmandatory nature of the standards. Taking Beijing for example, from1987 to 1990, the floor space of new residential buildings built up to par with the standards(most of it from demonstration projects) only accounted for about 10 percent of the totalnew residential floor space constructed in the same period. The situations in othernorthern cities are considered to be worse.
Energy Use
8.11 Residential energy use in China has two distinctive features: (a) massive useof low-grade energy sources such as coal and solid biomass, and (b) space heating andcooking dominate end uses. These features reflect China's special climate condition aswell as relatively low standard of living.
8.12 The residential sector consumed about 430 MTCE energy in 1990, including170 Mt coal, 240 Mt dry firewood, 280 Mt dry crop stalks, and 48 billion kWh electricity.Consumptions of gaseous fuel and cogenerated heat were small. More details are revealedin Table 8.3.
8.13 Cooking and space heating are responsible for an unusually high percentageshare of fuel consumption, accounting for about 95 percent of total residential energy usein 1990. Electricity's share increased from less than 2 percent in 1980 to about 5 percentin 1990. In comparison, over 60 percent of the U.S. residential energy use is fromelectricity.
8.14 Large-scale biomass consumption is a striking feature of residential energyuse in China. The growth rate of biomass consumption is gradually diminishing as end-useefficiency improves and coal becomes more accessible. Biomass still commanded about65 percent of residential energy use in 1990, compared with its share of 70 percent in1980. Current firewood consumption is estimated to exceed sustainable amount by40 percent. About half of the available crop residues are also consumed for cooking andspace-heating. This practice reduces the amount of organic materials that needs to bereturned to the soil.
8.15 While anthracite resources in China are abundant and the quality is generallyhigh, current anthracite supplies to the residential sector seem to be inadequate. Theannual production of anthracite is about 200 Mt. Only 30 Mt is distributed to theresidential sector while twice as much may be needed according to current cooking coaluse. Similar situation exist in natural gas supply with more than 80 percent of it beingused by industries.
8.16 Characteristics of Urban Residential Energy Use. Energy consumptionof urban households is dominated by coal, which made up of about 75 percent of urbanresidential energy use in'1990 (Table 8.4). The growth rates of demand for electricity andgaseous fuel from 1985 to 1990 were about 17 and 18 percent per year, while that of coaluse was negligible.

- 206 -
Table 8.3: RESIENTIAL ENERGY USE BY ENERGY SOURCE, 1980, 1990(MTCE)
Biomass Coal Gaseous Heat Elec-La /b Kerosene fuel L/ ad tricity
1980 228.7 82.6 1.5 1.7 1.6 4.31981 233.7 86.3 1.7 1.8 1.6 4.81982 238.8 88.9 1.5 1.8 1.6 4.91983 244.0 93.3 1.8 2.0 1.7 5.51984 249.4 99.8 2.2 2.4 1.8 6.41985 254.8 111.6 1.8 2.9 1.9 9.01986 260.4 113.0 2.0 3.6 2.2 10.01987 266.1 117.7 1.9 4.0 2.7 11.61988 272.0 125.1 1.8 5.2 2.6 13.91989 277.4 121.7 1.9 6.2 2.8 16.01990 283.0 119.2 1.5 6.6 3.1 19.4
La Figures are linearly extrapolated from 1979 and 1987 data. Biomass includesmostly firewood and crop stalks.
lb Includes raw coal and briquettes.Lc Includes LPG, natural gas, and gases derived from coal.La cogenerated heat for district heating.
Source: Lawrence Berkeley Laboratory, Report No. LBL-33867.
8.17 Characteristics of Rural Residential Energy Use. Rural households showquite different patterns of energy use from those of urban households. Although coaldominates modern energy use, it is overshadowed by the enormous amount of biomassconsumption in the rural areas. In 1987, biomass commanded about 80 percent of ruralhousehold energy use while coal only contributed 18 percent. Kerosene is considered tobe mostly used for lighting. About 40 million rural households still have no access toelectricity. Table 8.5 reveals survey data on rural household energy use in 1979 and 1987.
8.18 If current biomass consumption is to be replaced by coal, about 160 MTCE,or 230 Mt raw coal-approximately one fifth of current total coal production-would beneeded. By guiding the energy transition toward levels of modern and sustainable uses ofbiomass and other renewable energy sources, the government plays an essential role inminimizing the energy stresses of urbanization.
8.19 Electricity Use. Because of the rapid increase in appliance ownership,lighting has become a much less important component of residential electricity use todaythan in the early 1980s. For an above-average urban household that owns a refrigerator,
- 207 -
Table 8.4: URBAN RESIDENrIAL ENERGY MIX, 1980-90(MTCE)
Bri-Raw quettes Kero- Town Cogen. Elec-
coal La La sene LPG gas Lk heat tricity
1980 33.2 13.2 0.1 0.7 1.0 1.6 2.51981 34.3 14.3 0.1 0.8 1.0 1.6 2.81982 34.4 15.5 0.1 0.8 1.0 1.6 2.81983 35.7 16.8 0.1 1.0 1.0 1.7 3.21984 38.0 18.2 0.1 1.0 1.4 1.8 3.71985 42.7 19.7 0.1 1.6 1.3 1.9 5.01986 43.0 20.9 0.2 2.0 1.6 2.2 5.91987 42.6 22.2 0.1 2.1 1.9 2.7 6.61988 43.4 23.6 0.2 2.3 2.9 2.6 7.91989 39.1 25.1 0.1 2.6 3.6 2.8 9.11990 36.9 26.6 0.2 2.7 3.9 3.1 11.0
La Figures are linear extrapolation of 1981, 1985, and 1988 data. Raw coal use iscalculated by subtracting briquettes consumption from total coal use.
Lb Town gas includes natural gas and gases derived from coal.
Source: Statistical Yearbook of China, 1992.
a color TV set, and a clothes washer, lighting may only account for 10-15 percent of itsannual electricity use. On the other hand, for an average rural household, lighting stillaccounts for most of its annual electricity use. The greatly changed residential electricityconsumption pattern is revealed in Table 8.6.
Energy Efficiency
8.20 Households in China not only consume great amounts of inferior energysources such as coal and solid biomass, but also consume energy inefficiently, resultingin more pollution and fewer energy services per unit energy consumed. In rural areas,firewood is often bumed in stoves that have roughly 10 percent heat efficiency. In manyurban households, raw coal is burned for daily use. Coal-fired stoves are still popular forspace heating. In addition, most buildings are simply constructed, with minimuminsulation, which increases energy use and decreases comfort.
8.21 Efforts have been made to improve energy services in residential sector sincethe late 1970s. The massive efficient-stove program in rural areas and the promotion ofgaseous fuel and honeycomb coal briquettes in urban areas are successful examples. Many

- 208 -
Table 8.5: RVRAL RESIDENTIAL ENERGY Mi, 1979 AND 1987(MTCE)
Materials 1979 % 1987 %
Crop stalks 113.7 43.6 130.3 39.2Dung cake 6.3 2.4 3.2 1.0Firewood 103.8 39.8 132.6 39.9Coal 32.6 12.5 59.6 17.9Kerosene 1.5 0.6 1.9 0.6Electricity 3.1 1.2 5 1.5
Source: Lawrence Berkeley Laboratory, Report No. LBL-33867.
Table 8.6: ESIMATES OF RESIDENT1AL ELEcnucrrY END UsEs, 1981 VERSUS 1989(billion kWh)
Lighting Refrigerators TVs Fans Clothes washers Other
1981 10 0. r 0.5 0.6 0 0.6
1989 15 10 7 4 2 2
Source: Lawrence Berkeley Laboratory, Report No. LBL-33867.
other conservation efforts such as developing district heating and adopting energy-efficientbuilding standards, however, are still preliminary and experimental.
8.22 Cooking and Domestic Water Heating. Cooking is the number one energyuse in China's residential sector, due, in part to the inefficient use of solid fuels. Mostrural households use firewood stoves and most urban households, coal fired stoves. Onlyabout 10 percent of current urban population use gaseous fuel for cooking. The usage ofhot water is limited. Households boil water for tea and cooking and other necessary dailyuses. Most households do not have hot-water shower devices which, however, are gainingpopularity with increasing accessibility of gaseous fuel.
8.23 The promotion of honeycomb briquettes has been a major residential coal-saving activity. Firing honeycomb briquettes in efficient stoves could achieve heat

- 209 -
efficiency as high as 40 percent, about three times that of stoves burning raw coal. Indaily practice, heat efficiency may be significantly lower, usually about 20 percent. Incomparison, heat efficiency of gas-fired stoves usually reaches 50 percent.
8.24 While cooking fuel is basically guaranteed for urban households, many ruralfamilies still suffer from shortages. Because ordinary firewood stoves have only about10 percent heat efficiency, the demand for firewood and crop residues in rural areas isoften excessive. Seeing the danger of chronic rural fuel shortages and unsustainablefirewood consumption, the government launched efficient-stove and tree-planting programsin the early 1980s. By 1987, about 45 percent of rural households had been equipped withenergy-efficient stoves with rated heat efficiency of 25-30 percent. This program wasestimated to have been able to save 20 MTCE of firewood per year as of 1987.
8.25 One other energy-efficient and much cleaner option for rural cooking is theutilization of biogass, a viable fuel source in areas to the south of Yangzi river. Programsof constructing biogas digesters for rural households has been undertaking for about twodecades. The results are mixed, depending on regional conditions and the commitment ofboth the households involved and local management.
8.26 Space Heating. There are three modes of space heating in urban areas:coal-fired stoves, central heating provided by small boilers, and district heating providedby large boilers or cogeneration plants. Rural households use either firewood or coal-firedstoves for space heating. About two thirds of the urban households in heating zone areheated by coal-fired stoves and the rest is heated mostly by small-boiler central heatingsystems. The share of district heating systems is small, probably about 5 percent.
8.27 Stove heating is unhealthy and low in comfort levels. Households usingheating stoves often have lower indoor temperatures and shorter heating time. Usuallyonly one room is heated and the stove may be moved outside of the apartment in the nightto avoid CO poisoning. For these reasons, households that use stoves for space heatinghave much lower seasonal heating fuel intensities than those using central heating facilities--18 versus 30 kgce per square meter floor space.
8.28 Centrally heated buildings are mostly serviced by small boilers with typicalcapacities of 1-4 ton steam per hour (ts/h). One ts/h boiler capacity typically heats a floorarea of about 4,000 m2, approximately 100 households. Small-boiler central heatingsystems have two major energy-efficiency problems: low capacity factor (average heatingload/rated boiler heating capacity in terms of heated floor space) and poor boiler heatefficiency. While the former is usually related to the design and operation of the heatingsystems, the latter is basically due to outdated boiler manufacturing technology. With thecombined problems of the distribution network and the boiler itself, small-boiler centralheating systems usually have 50 percent or lower overall efficiency.
8.29 District heating systems usually utilize medium to large industrial boilers(10, 20 and 40 ts/h). The 10 ts/h boilers are most popular, with a usual 70-80 percentrated heat efficiency. Problems, such as partial loads, operation by unskilled personnel,

- 210 -
and the use of low-quality coal, that exist in small boiler systems also impair the energyefficiency of large-boiler heating systems. Conservation measures may yield significanteconomic benefits in the case of large boilers because of the high replacement costs. Theresidential sector does not benefit much from existing cogeneration capacity whichprimarily serves industrial users. With serious shortages in electricity supply at present,heat supply may be sacrificed for power generation.
8.30 Technically speaking, large district heating systems are efficient heatingmodes in northern China, giving the climate condition and the dwelling pattern. Inpractice, 'difficulties are often encountered when these systems try to meet expectations.Reports indicate that some of the newly built district-heating systems actually run lessefficiently than many of the well-operated small-boiler systems because of insufficienthook-ups or the slowness in maldng new hook-ups.
8.31 The efficiency of China's central heating systems is significantly impairedby the poor quality of heat distribution networks, which are often not well-insulated andare operated with malfunctioning equipment. The average heat loss of the distributionnetworks is about 15 percent, while 10 percent is considered to be appropriate. Theunbalanced hydraulic working state and the lack of flow control valves create problemssuch as overheating for households near the mains and underheating for those end-of-the-pipe households. The common practice of resolving the problem is to increase pumpingcapacity which reduces boiler operation efficiency because of reduced outgoing andretuming water temperature difference.
8.32 Promoting central heating systems may not help save heating coal use if wecompare their fuel intensity to that of stoves. But using central heating facilities representsa major improvement of the standard of living for urban households in northern China withrespect to both thermal comfort and indoor air quality. By applying district heating, thegovernment would also have much easier control over the emissions of air pollutants.
8.33 Poor thermal integrity of residential buildings in China reduces thermalcomfort and increases space conditioning energy use. Solid bricks are the predominantwall material in China. Heat loss is substantial through exterior walls and roofs that haveonly minimum insulation. Table 8.7 compares some heat performance features of typicalapartment buildings in northern China with those of Canada residential buildings in areasof similar heating degree-days. The difference are striking. Since Canadian residentialbuildings are mostly wooden structures, a low heat transfer coefficient is achieved moreeasily. Using hollowed bricks and double-glazed windows can reduce heat losses inbuildings significantly.
8.34 Lighting. Although fluorescent lamps are commonly used in urbanhouseholds, incandescent light bulbs are still the popular choice for lighting. This can bepartly informed from the annual production of light bulbs which registered 2 billion forincandescent bulbs and 200 million for fluorescent lamps in 1990. Lighting lumen levelsare usually low in Chinese households and people usually do their best to save electricity.

- 211 -
Table 8.7: HEAT-TRANSFER COEFFCENTS OF TyPIcAL MULTI-STORY CmESEAPARTMENT BUILDINGS VESUS THOSE OF NORTH AME:ICAN HoUsES
Exterior wall Window Roof(W/m2-0 C) (W/M2-_C) (W/Im2 -C)
BeijingPresent status 1.57 6.40 1.26New standards 1.28 6.40 0.91
HarbinPresent status 1.28 3.26 0.77New standards 0.73 3.26 0.64
CanadaComparable to Beijing 0.36 2.86 0.23-0.40Comparable to Harbin 0.27 2.22 0.17-0.31
Source: Lawrence Berkeley Laboratory, Report No. LBL-33867.
Installations of compact fluorescent lamps are rare because their high purchasing costs andconsumer's disbelieve in their reliability.
8.35 Appliances. Major electricity-consuming appliances include refrigerators,TV sets, clothes washers, and electric fans. Air conditioners are still rare in households.Popular domestic-made refrigerators (two-door 170 liter) consume about 400 kWhelectricity per years which is significantly higher than similar contemporary models madein Japan or Korea. For example, the average electricity consumption of 200 liter two-doorKorean models already reached 240 kWh/year in 1986.
Potential for Improvement
8.36 A household would be able to save about 20 percent of its cooking coal byswitching from raw coal to honeycomb briquettes, other conditions being equal. Switchingfrom coal to gaseous fuel represents the largest efficiency gain and help to reduce indooras well as ambient air pollution. Limited natural gas resources and financial andtechnological difficulties in large-scale coal gasification may hinder this process.
8.37 Many least-cost measures, such as better quality coal for boilers and bettertraining for boiler operators, can save coal use in central heating. Resolving problems inthe distribution networks and optimizing boiler operation will significantly improve theenergy efficiency of existing central heating systems. In a demonstration project, a teamof engineers is able to raise the seasonal operation energy efficiency of a central heatingsystem (with a 10 ts/h boiler) from 55 percent to 64 percent by installing new flow-controlvalves and a computer system for boiler operation. The cost of the measure is only Y 50

- 212 -
per annual TCE which is substantially lower than the cost of bring 1 TCE coal to themarket.
8.38 Improving building thermal integrity is a major step in saving spaceconditioning energy use and is the primary goal of energy efficient building standards.
-The long-term effect of high thermal-integrity buildings cannot be underestimated.Unfortunately building construction in the past have failed to adopt this important energy-saving measure and is continuing to perform poorly in this respect due to inadequateregulatory enforcement, insufficient technical support, temporary financial constraint, andthe pressure of soaring housing demand.
8.39 Improving lighting efficiency mainly lies in the hands of the lampmanufacturers because current household lighting practice is already very frugal. The cost-effectiveness of introducing compact fluorescent lamps depends on what wattage ofincandescent bulbs that are replaced, the time of use, and electricity prices.
8.40 Great improvement can be achieved in reducing refrigerator electricityconsumption. For example, a modified two-door 177 liter model produced by a Shanghaiplant consumes 292 kWh/year, representing a 27 percent reduction in electricity usecompared with popular comparable models. The Korean refrigerator industry, with theassistance from the government, was able to reduce the average unit electricity use of 200liter refrigerators from 672 kWh/year in 1980 to 240 kWh/year in 1986. The Koreanexperience is a good example of the potential and swiftness of possible energy efficiencyimprovement for refrigerators.
Energy Use and Efficiency Trends
8.41 The demand for electricity and gaseous fuels will continue to increasestrongly and the dominance of coal will gradually decline. But a large decrease in coal useis unlikely in the near future because of the nature of domestic energy resources and thelarge space-heating demand.
8.42 From the experiences in the 1980s, construction of district-heating facilities(especially cogeneration facilities) is quite expensive. From the aspect of providing equalservices with minimum pollution and high energy efficiency, district heating systems dohave advantages over small coal-fired central heating systems and stoves in heating-zoneareas. But future technological development may also make small coal-fired centralheating systems attractive and the increasing availability of gaseous fuels is also likely tomake gas-fired heating a possible alternative.
8.43 The continuing efficient stove program aims at equipping all ruralhouseholds with energy-efficient stoves by the year 2000. If the goal materializes,potential firewood and crop stalk savings are considerable. Although end-use efficiencyis of great importance to China's rural energy development, it is unlikely that conservationalone can solve rural fuel supply problems. History has shown that while people havebeen using more efficient equipment, they are also using more energy as the standard of

- 213 -
living rises and their lifestyle changes. Thus, it is essential to develop other alternativefuel supplies. The Chinese government has shown strong interest in planning a sustainableenergy future for rural areas and has made great efforts to address this important issue.
8.44 Rising household incomes are expected to foster two developments inresidential energy use. Domestic water heating (for showing) has become an increasinglypopular activity as gaseous fuels become more accessible. Market research shows that thedemand for air conditioners has grown significantly since 1990. Such trends will lead togreater demand for gaseous fuels and electricity in the future.
8.45 Compared with appliances used in American households, those used in Chinaare small and low-power machines, especially in the categories of refrigerators and clotheswashers. The Chinese households are also much more conscious about electricity used byappliances. Continuing increase in personal income has made possible for households topurchase larger refrigerators and TV sets and clothes washers with spinning cylindersinstead of single washing cylinder washers. This trend is sure to offset some gains inenergy efficiency.
B. COMMmRCIAL BUILDINGS
Sector Profile
8.46 All nonindustrial and nonresidential civilian buildings are considered ascommercial buildings. According to the latest survey, commercial building stock stood at1,019 million m2 in 1989. About 52 percent of the total stock was classified as commercebuildings, i.e., those that house shops, restaurants, and other for-profit businesses. Officebuildings accounted for 30 percent of the total stock and the share for educational andacademic buildings was 3 percent. The unclassified commercial building stock wassignificant with a 15 percent share of the total stock.
8.47 Commercial buildings in China basically share similar physicalcharacteristics with residential buildings. Most of them are not insulated and about halfof them need extensive winter space heating. Low-rise buildings contribute to much of thetotal floor space.
8.48 Construction of new commercial buildings has been intensive since the late1970s. The large increase of fully conditioned commercial buildings (with completecooling and heating systems) is a major development with great long-term impact oncommercial building energy use.
Energy Use
8.49 Commercial buildings, presumably all in urban areas, consumed about 40MTCE energy in 1990 in which coal contributed 55 percent and electricity shared28 percent. Table 8.8 depicts the mix of energy demand from commercial buildings.

- 214 -
Table 8.8: ENERGY USE BY ENERGY SOURCE IN THE COMMERCIAL SECrOR,1980-90(MTCE)
Coal Oil Gas Cogen. heat Electricity
1980 11.1 4.1 0.3 0.7 3.51981 11.7 3.6 0.3 0.7 3.81982 12.6 3.5 0.2 0.7 4.11983 13.8 3.7 0.2 0.7 4.61984 15.7 3.3 0.2 0.8 5.21985 16.6 3.9 0.3 0.3 6.51986 17.6 3.7 0.4 0.3 6.81987 18.4 3.8 0.5 0.4 8.01988 20.4 5.2 0.5 0.5 9.21989 20.8 6.0.. 0.5 0.4 10.11990 21.8 5.6 0.5 0.5 11.3
Source: China Energy Statistical Yearbook, 1991.
8.50 Energy is mainly used for space heating and lighting in commercialbuildings. Cooking fuel is also significant because of the popularity of restaurants andwork-unit cafeterias in China. Other uses include public bathhouses and teahouse boilers.
8.51 Lighting is still the largest electricity user in commercial buildings.Buildings with heating, ventilation and air conditioning (HVAC) systems are becomingimportant energy users in large cities and coastal urban areas.
Energy Efficiency
8.52 Most restaurants and cafeterias use raw coal as cooking fuel, resulting in lowenergy efficiency and high air pollution.
8.53 Coal or charcoal-fired stoves provide space heating for about 75 percent ofthe floor space in heated commercial, indicating the low quality of energy service incommercial buildings. Seasonal fuel intensity of space heating is lower in commercialbuildings than in residential buildings, registering 15 kgce/m2 for stove-heated space and20 kgce/m2 for centrally heated space.
8.54 Lighting efficiency is considered low because most fluorescent fixtures incommercial buildings are equipped with electromagnetic ballasts and large wattageincandescent lamps are also widely used.
- 215 -
8.55 Most HVAC systems installed in space-conditioned commercial buildings areinefficiently operated because of poor building design, lack of maintenance andmismanagement.
Potential for Improvement
8.56 There have been attempts to use large honeycomb briquettes for commercialcooking and teahouse boilers. Many commercial users such as restaurants prefer raw coalbecause they usually need fast combustion and high flames. For these users, gaseous fuelmay be the only favorable substitution. Using briquettes in small boilers, however, couldbe an effective measure of saving coal and reducing air pollution.
8.57 Lighting efficiency improvement is considered great in commercial buildingsbecause of large wattage lamps are used and the operating time is usually long. High-efficiency fluorescent tubes and electronic ballasts are considered very cost-effectivemeasures. Estimate rate the electronic ballast/fluorescent lamp system 25 percent moreefficient than the electromagnetic ballast/fluorescent lamp systems. A 36W high-efficientTLD fluorescent tube is able to put out the same amount of lumens as a 40W conventionalTL tube.
8.58 Many tourist hotels with HVAC systems do not have any better insulationthan ordinary hotels. Electricity can be saved by improving the thermal integrity of thebuilding envelope, which includes window improvement, wall and roof insulation, andbetter building design.
Energy Use and Efficiency Trends
8.59 Until recently there have been limited energy-conservation efforts incommercial buildings and there is no specific conservation policy aimed at commercialbuildings. Since the stock of modem hotels and office buildings is increasing at rapid ratein major cities and coastal areas, HVAC systems is likely to emerge as a major energy usein commercial buildings in the next 10 years. There has also been a fast increase in theuse of room air conditioners in offices in recent years, so electricity use for airconditioning will increase dramatically.
8.60 In order to save coal and electricity, there is an urgent need to improve thethermal integrity of commercial buildings. This calls for the establishment andenforcement of energy-efficient commercial building standards. If current practicecontinues, the high-volume construction in the next 10 years will have a significant impacton energy demand of commercial buildings in the decades to come. Retrofitting oldbuildings is often costly.

APPENDIX A
Case Study Analyses: Forecasted Applications and Impacts on EnergyUse and Emissions
This section presents the results of forecasts of the "businessas usual" (BAU) and "accelerated" (ACCEL) scenarios for adoption ofeach of the technologies or modifications evaluated as case studies.Both BAU and ACCEL scenarios were developed from information suppliedin the Background Reports and by studying trends in the respectiveindustries in other countries. Technical judgement was used to developthe respective scenarios, which were then used to calculate theforecasts of changes in energy consumption and emissions for 2000 and2010.
Various ratios were also calculated, including the requiredinvestment cost (per unit of processing capacity) necessary to adoptthe various technologies, and the investment per annual tonne of COemission reduction and per annual TCE saved. These ratios are reportedin the full outputs of each case study evaluation and in the summarytable included in this Appendix. However, the numbers are a only arough guide to the attractiveness of each measure and are thereforenot highlighted.
A better guide to relative economic attractiveness is the netannualised benefit (or cost) per tonne C02 reduction or per TCE saved.These figures take into account the fact that many measures are indeedpositively beneficial to the industry or plant concerned: these dataare developed in a separate report. Put simply, energy efficiency isusually very good business, and the redu-ed emissions of globalwarming gases that are achieved at the same time are an extra bonus.
Calculation data are reported for the following case studies:
Iron and Steel Industry
Ml Open hearth converters replaced by BOF systemsM2 Continuous castingM3 Reheat furnace renovationM4 BF gas recovery for steam/electricity generation
Non Ferrous Metals
M5 Aluminium plant renovation
Building Materials
Bl Replace old dry kilns by preheater/precalciner systemsB2 Wet to dry conversionB3 Vertical shaft kiln renovation
PaRer
Ll Black liquor recoveryL2 Cogeneration in a paper mill

Textiles
Ti Cogeneration in a textile millT2 NaOH recoveryT3 Energy management
Chemicals
CH1 Medium size ammonia plant renovationCH2 Small ammonia plant renovation and waste heat recoveryCH3 New membrane process at NaOH plant
Epuinment
El High efficiency motorsE2 Variable speed motorsE3 Electric motor repair centresE4 Steam traps


CRSE STUDY RNALYSIS NUHBER ml Open Hearth Converters Replaced by BOF
Uithout With -project project
Open Hearth BOF NOTES
Net energy use kgCE/t 75.11 26.60 1 Current OH capacity about 13 MHtpy steel of
which about 10 percent will convert toC02 emission kg/t 92.02 40.56 electric steel making.S02 emission kg/t 14.23 0.60TSP emission kg/t 222.05 45.20 2 This leaves 11.7 MHtpy OH capacity to be
Investment For CS million QMB 0 1050 converted to BOF.Capacity For CS million TPY 2.60 3.00 3 It is assumed that only one large plantInvestment per TPY RHB/tpy BOF 350 (capacity 3 MMtpy aFter conversion, likePresent cap. OH million TPY 11.7 Rnshan) will convert to BOF by 2000.
4 For the BRU case, it is assumed no otherconversion occurs before 2010, the cost
Calculated -- financial -- IRQ 16.1 percent being high. IRR and payback not particularlyCalculated payback inc construction time 13 years attractive.
BRU FOQECRST 1990 2000 2010 S For the RCCEL case, it Is assumed thatCapacity OH 1OA6 tpy 11.7 6.7 8.7 Funding is made available to all existing OHCapacity BOF IGA6 tpy 0.0 3.0 3.0 operators and conversion is completed by
2010.Energy OH 10A3 tCe/yr 876.8 653.5 653.5Energy BOF 10A3 tceo/yr 0 79.6 79.6 6 Note that original capacity oF 0 for BOFTotal energy 10^3 tce/yr 876.8 733.3 733.3 does not imply this technology does notEnergy saved 10A3 tee/yr 0 145.5 145.5 m" ewist in China; For this emercise, only theC02 10A3 t/y 1076.6 922.3 922.3 conversion oF 11.7 OH capacity is considered.S02 10A3 t/y 166.5 125.6 125.6TSP 10A3 tOy 2596.0 2067.4 2067.4
C02 removal 10A3 t/y 0 154.3 154.3 mmInvestment million RHO 1050.0 1050.0Invest C02 removal RMS per t/y 6804 6804 NW
Invest TCE saved RHO per TCE/y 7215 7215 mm
RCCELERATED FORECASTCapacity OH I1A6 tpy 11.7 8.7 0.0Capacity BOF IOA6 tpy 0.0 3.0 11.7
Energy OH 10A3 tce/yr 978.8 653.5 0.0Energy BOF 10A3 tceo/yr 0.0 79.8 311.2Total energy 10^3 tceo/yr 676.8 733.3 311.2Energy saved 10A3 tce/yr 0.0 145.5 567.6 MM
C02 10^3 t/y 1076.6 922.3 474.6S02 10A3 t/y 166.5 125.6 7.0TSP 10A3 t/y 2596.0 2067.4 526.6
C02 removal 1A3 t/y 0.0 154.3 601.68MInvestment million RHO 1050.0 4095.0Invest C02 removal. RH per t/y 6804 604 M
Invest TCE saved RHO per TCE/y 7215 7215 MM

CRSE STUDV INALVSIS NHUnER Q2 Continuous Costing Replacing Ingot Route--------------------------------------------------------------------- __------__-----------------------------------------
Uithout Uithproject project
ingot castg con cCsting NOTES
Net energy use kgCE/t 64.79 24.19 1 Estinate of current continuous casting
capacitg based on 23.?Z of pig ironC02 e"ission kg/t 42.19 15.75 production.S02 enission kg/t 1.77 0.66TsP enission kg/t 0.71 0.27 2 Assune 90Z of future steel make uill be
processed by ingot or concast routes.Investuent for CS l0ft6 RnB 0 1590Capacity for CS l0'6 tpg 1.60 3.50 3 For neu capacityj. 90Z uill be concastInvest"ent per TPY RHD/tpy concast 451 anyupag. By 2000, 502 of pig iron uill be1990 pig iron cap l0'6 tpy 62.4 concast, 7oz by 2010 for BRU and 90Z for2010 pig iron cap 10^6 tpy 62.4 RCCEL case (as stated by the "inistrg).
4 By naterial balances, amounts of enistingCalculated -- financial -- IRR 19.6 percent ingot casting capacitg to convert to concastCalculated payback inc construction tine 9 years to reach these objectives nag be estinated
-- see sumnmary belou.RRU FORECASt 1990 2000 2010
Cap ingot casting till tpg 47.6 4S.8 31.4Cap con costing n1 tpy 14.8 26.6 31.0 0.237Cap total nn tpg 62.4 62.4 62.4Energy ingot cast. 10A3 tce/g 3094.0 2967.4 2034.4Enerog concastg 10^3 tce/g 359.0. 401.6 749.9 Calculation surnnaryTota7 energp 10^3 tcer7 3442.0 3369.9 2794.3Energy saved 10n3 tce4p 0.0 73.1 657.7 UN 1990 BOTH CASES 2000C02 103 t/p 2240.9 2193.3 1912.7 --------------------------- -502 l0^3 t/j 94.0 92.0 76.0 nn tpyp percent Neu Neu pct Old Total Total pctrsP 10^3 t/7g 37.9 37.0 30.7 Ingot 47.6 76.3 3.7 10 4S.9 49.5 so
IF SAlE PERCENt CONCRSTINO Concast 14.9 23.7 32.9 90 16.6 49.5 50
Cap ingot casting nf tpY 47.6 47.6 47.6 rotal 62.4 100.0 36.6 62.4 99
Cap con casting nn tpu, 14.9 14.9 14.9 (pig iron) (pig iron 90.0 pct of steel)Cap total fn tpu- 62.4 62.4 62.4 stel 110
Energip ingot cast 10^3 tce/Yp 3084.0 3084.0 3094.0Energy concostg 10^3 tceAp 359.0 3s9.0 3s9.0 BR0 CASE 2010Total energy 10^3 tce/y 3442.0 3442.0 3442.0
0.0 73.1 6S7.7 Xx "~~~~~~eu Neu pct Old total Total pctENERGY SAvED UITH CONCAST 0.0 73.2 657.7 UNNu Nupt Od eo oo c6.4 10 31.4 37.9 30
57.2 90 31.0 99.2 70IF SfllE PERCENT CONCRSTINO 63.2 62.4 es.0
C02 10n3 t/p 2240.9 2240.9 2240.9 iron 90.0 ptfteReduction in C02 10A3 t*' 0.0 47.6 428.2 (pig iron 9010 p .t of steel)
Investnent l0-6 Rnl 912.6 7313.1 total to 2000Invest C02 removal d Rtl per tpyp 17080 17080 NM ACCEL CRSE 2010Invest TCE saved R119 per TCE/yp 11119 11119 UN
Neu Neu pct Old total Total pctRCCELERRtED FOREcAsr 47.6 45.8 12.S ~~~~~~6.4 10 12.5 19.9 15
Cap ingot casting N"n tpg 47.. 6l64. 5o 12. 507 asCap con castinig fl itpig 14.9 16.6 4.Total capacitg n111 tpy 62.4 62.4 62.4 63.6 62.4 126.0T tal capacity ~~~~~~~~~~~~~~~~(pig iron 90.0 pct of steel)
Energy ingot cast 10^3 tcep9 3094.0 2967.4 909.9 stel 140.0Energgj con cast 10n3 tceeAp 359.0 401.6 1207.1

Energy con cost 10^,3 tceV/ 359.0 401.6 1207.1rtotal energy 10^3 tce/y 3442.0 3360.9 2017.0Energy saved 10^3 tce/y -- 73.1 1425.1 wxC02 10^3 t/y 2240.9 2193.3 1313.2S02 10^3 tty 94.0 92.0 55.1TSP 10^3 Vy 37.8 37.0 22.3
IF SR"E PERCENT CONCRSTINOCap ingot casting ntl tpy 47.6 47.6 47.6Cap con casting til tpy 14.0 14.8 14.9Cap total nn tpy 62.4 62.4 62.4
Energy ingot cast 10^3 tce/y 3004.0 3084.0 3094.0Energy concastg 10^3 tce/y 359.0 359.0 350.0total energy 10^3 tce/y 3442.0 3442.0 3442.0
ENERGY SRVED U1TH CONCRST 0.0 73.1 1425.1 mm
IF SRhE PERCENT CONCASTINOC02 10^3 t/y 2240.9 2240.9 2240.9Reduction in C02 10^3 t/y 0.0 47.6 927.7 Mx
lnvest"ent 10^6 R"B 912.6 15945.1 total to 2000Invest C02 renoval Rhn per tpy 17000 17090 KmInvest TCE saved RHO per TCE/y 11119 11119 Mx

CRSE STUDY RNRLYSIS NUMBER H3 Reheat Furnace Renovation
Without WithProject project
old Furnace (renovated) NOTES
Net energy use kgCE/t 101 90 1 Capacity For rolling is in excess oF 50 mm
tpy and there are about 480 Furnaces oF allC02 emission kggt 65.30 58.20 types installed. say 370 need attention.502 emission kcg/t 2.74 2.44TSP emission kgit 1.02 0.91 2 It is assumed all these will be renovated
Investment For CS 10^6 RHB 0.000 0.282 and upgraded by 2010.Capacity For CS million TPY 0.120 0.132 3 For BRU. it is assumed that renovation willInvestment per TPY Rt8/tpy renov.Furnaces 2 take about 12 years From 1990 at a rate oFPresent capacity 10^6 TPY 50 old rolling mills about 30-40 Furnaces per year.
4 For RCCEL case. it is assumed all renovation
Calculated -- Financial -- IRR 36.7 percent completed by 200.
Calculated payback inc construction time - I year
BRU FORECRST 1990 2000 2010Capacity old fur 10^6 tpy 50.0 9.3 0.0Capacity renov. 10^6 tpy 0.0 41.7 50.0
Energy old Fu- 10A3 tceo'yr 5045.0 837.5 0.0Energy renov. 10^3 tce/yr 0.0 3749.8 4495.0Total energy l0A3 tce/yr 5045.0 4586.3 4495.0Energy saved 10^3 tce.yr 0.0 4S5.7 s550.0 m"C02 10A3 t/y 3265.0 2969.9 2910.0S02 10A3 t/y 137.0 .124.5 122.0TSP l0^3 t/y 51.0 46.4 45.5
C02 removal l0'3 t/y 296.1 355.0 mm
tnvestment IOAS RMB 89.1 106.9Invest C02 removal RuB per tpy 301 301 mmInvest TCE saved RMP per TCE/y 194 194 mm
RCCELERRTED FORECRSTCapacity old fur IbAG tpy 50.0 0-0 0.0Capacity renov. l0^6 tpy 0.0 50.0 50.0
Energy old Fur I0A3 tce/yr 5045.0 0.0 0.0Energy renov. I0'3 tce/yr 0.0 4495.0 4495.0Total energy IOb3 tce/yr 5045.0 4495.0 4495.0Energy saved 10^3 tce'yr 0.0 550.0 550.0 vWC02 10A3 t/y 3265.0 2910.0 2910.0S02 10^3 t/y 137.0 122.0 122.0TSP 10A3 tEy 51.0 45.5 45.5
C02 removal 10A3 t/y 355.0 355.0 NM
Investment 10^6 RHO 106.8 106.8Invest C02 removal RHO per tpy 301 301 NM
Invest TCE saved RQO per TCE/y 194 194 "m

CRSE STUDY RnHLYSIS NUMBEP M4 OF gas recovery For- steam/elec. generation…-- - - - - - - - - - - - - - - - - - - - - - - - - - - - - - - - - - - - - - - - - - - - - - - - - - - --_- - - - - - - - - - - - - - - - - - - --_ _- - - - - - - - - - - - - - - - - - - - - - --__ _ _ _ _ _ _ _ _ _ _ _ _ _ _ _
Without Uithproject project
no recovery BF gas recovered NOTES
Net energy use kgCE/t 108.6 59.3 I Example plant (Xingtai) produces about
C02 emission kgzt 70.? 31.2 50SOOO tpy pig iron. It is assumed thereC02 emission kgzt 370.7 312 are about 25 such plants, total capacity sayS02 emission kgtL 3.0 0.2 10 NHi tpy. suitable For gas cecover-y systemn.TSP emission kg/t 1.2 0.4
2 For BARU, assume 60% installed by 2000. For-Investment for CS l0A6 RHO 0 17.45 rCCEL case, 8OX: all completed by 2010.Capacity For CS OA^6 TPY 0 0.505 pig iron outputInvestment per TPY RHO/tpy 8F 34.55Present capacity 10^6 TPY 10 mm tpy pig iron, no recovery
Calculated -- financial -- IRR 28.2 percentCalculated payback inc construction time 7 years
1990 2000 20108RU FORECRSTCapacity no rec 1OAS TPY 10.0 4.0 0.0Capacity with rec 10^6 TPY 0.0 6.0 10.0
Energy no rec 10A3 tce/yr 1086.0 434.4 0.0Energy with rec 10^3 tce/yr 0.0 355.8 593.0Total energy 10A3 tceZyr 1086.0 790.2 593.0Energy saved 10A3 tce/yr 0.0 295.8 493.0 mmC02 10^3 t/y 707.0 470.0 312.0S02 10A^ t/y 29.7 13.2 2.2TSP I1A3 t/y 12.0 7.3 4.2
C02 removal 10`3 t.y 237.0 395.0 mmInvestment lOA6 RHO 207.3 345.5Invest C02 removal RHO per t/y 875 875 mmInvest TCE saved RHO per TCE/y 701 701 MM
RCCELERRTED FORECRSTCapacity no rec 10^6 TPY 10.0 2.0 0.0Capacity with rec 10^6 TPY 0.0 0.0 10.0
Energy no rec 10A3 tECe/yr 1086.0 217.2 0.0Energy with rec 10^3 tee/yr 0.0 474.4 593.0Total energy 10^3 tce/yr 1066.0 691.6 593.0Energy saved 10^3 tce/yr 0.0 394.4 493.0 MM
C02 10^3 t/y 707.0 391.0 312.0502 10A3 t/y 29.7 7.7 2.2TSP 10A3 t/y 12.0 5.8 4.2
C02 removal 10A3 t/y 316.0 395.0 mmInvestment 10A6 RHO 276.4 345.5Invest C02 removal RHO per t/y 975 975 MM
Invest TCE saved RHO per TCE/y 701 701

CnSE STUDY RNRLYSIS NUMBER Ms Rluminium plant renovation
Uithout Withproject project
old equipmt new equipmt NOTES
Net energy use kgCE/t 2023.78 1858.97 1 There are 16 other similar plants to the
Shandong wor-ks used For the case studygC02 emission kg/t 1121.6 1038.2 total alumina capacity about 6 mm tpy.S02 emission kg/t 45.8 42.7TSP emission kg/t 20.4 19.0 2 For BRUA assume one third -- about 5-6
Investment l0A6 RHO 0 80.74 plants -- renovated by 2000, For RCCEL caseInvestment 10^6 80S O BO.74 assume at least half. say 8 plants.Capacity 10^6 TPY 0.470 0.500Investment per TPY PMB/tpy new equipment 161.480 3 By 2010. assume all conversions are complete.Present capacity 10^6 TPY 6Final capacity 10^6 TPY 0
Calculated -- Financial -- IQR 84.3 percentCalculated payback inc construction time 3 years
BMU FORECRST 1990 2000 2010Capacity old 10^6 TPY 6.0 4.0 0.0Capacity neu 10^6 TPY 0.0 2.0 6.0
Energy OH 10^3 tce/yr 12142.7 8095.1 0.0Energy BOF 1 0 A3 tce.yr 0.0 3717.9 11153.8Total energy 10^3 tce/yr 12142.7 11813.1 11153.8Energy saved 1 0 ^3 tce/yr 0.0 329.6 988.9 MMC02 1 0 A3 t/y 6729.5 6562.8 6229.4S02 10^3 t/y 275.0 268.8 256.3TSP 1 0 3̂ t/y 122.1 119.5 114.2
C02 removal 10^3 t/y 166.7 500.1 MM
Investment 10^6 RKS 323.0 968.9Invest C02 removal RMB per t/y 1937 1937 rvInvest TCE saved RQh per TCE/y 980 980 MM
RCCELERRTED FORECRSTCapacity OH 10^6 TPY 6.0 3.0 0.0Capacity BOF 10^6 TPY 0.0 3.0 6.0
Energy OH IO^3 tce/yr 12142.7 6071.3 0.0Energy BOF 10^3 tce/yr 0.0 5576.9 11153.8Total energy 10^3 tce/yr 12142.7 11648.3 11153.8Energy saved 10^3 tcegyr 0.0 494.4 989.9 mm
C02 10^3 t/*y 6729.5 6479.4 6229.4S02 lOA%3 t.'y 275.0 265.7 256.3TSP 10A3 t/y 122.1 118.1 114.2
C02 removal 10^3 t/g 240.40 968. 9InveStment 10^6 RM 8.Invest C02 removal RQB per t/y 1937 1937Invest TCE saved RuB per TCE/y 990 980
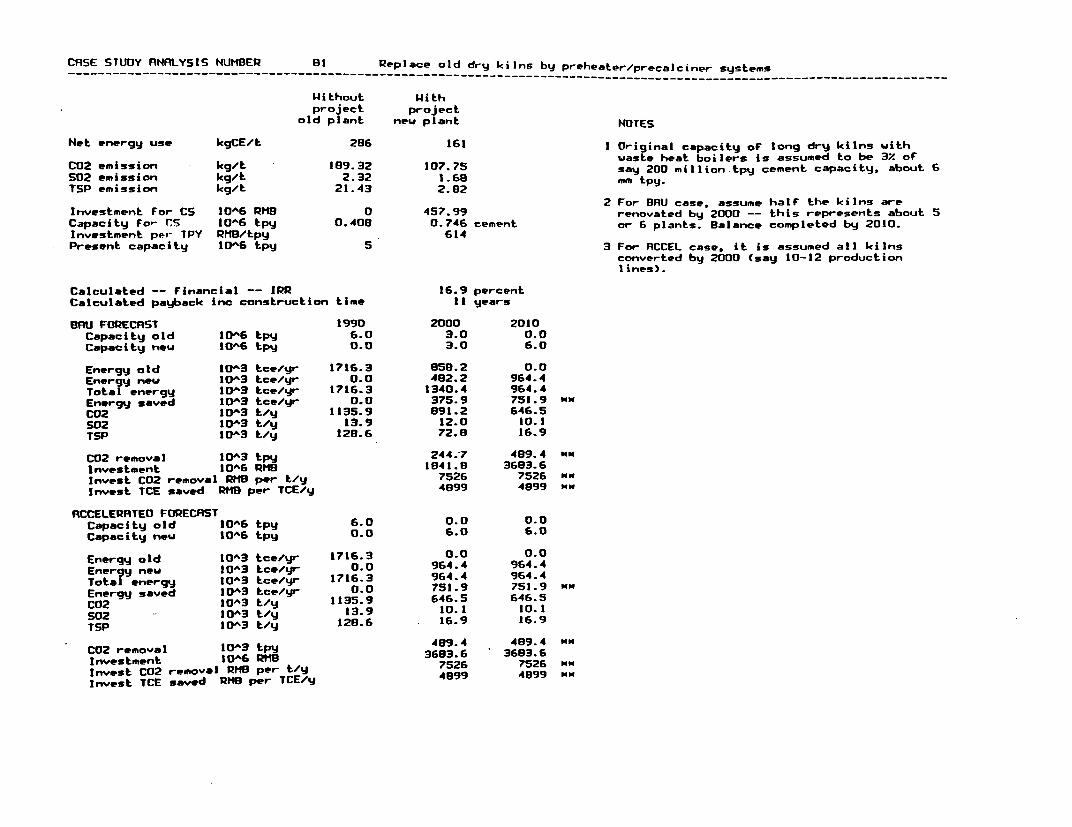
CRSE STUDY RNRLYSIS NUMBER a1 Replace old dry kilns by preheater/precalciner systems…_______________________________________________________________________________ ------ __--_________________________
Without Withproject project
old plant new plant NOTES
Net energy use kgCE/t 286 161 1 Original capacity oF long dry kilns withwaste heat boilers is assumed to be 3X of
C02 emission kg/t 189.32 107.75 say 200 million tpy cement capacity, about 6502 emission kg/t 2.32 1.68 mm tpy.TSP emission kg/t 21.43 2.82
2 For BRU case, assume halF the ki Ins areInvestment For CS 10^6 RHB 0 457.99 renovated by 2000 -- this represents about 5Capacity for CS 10^6 tpy 0.409 0.746 cement or 6 plants Balance completed by ZOIOInvestment per- PY RHB/tpy 614Present capacity bAG6 tpy 5 3 For RCCEL case, it is assumed all kilns
converted by 2000 (say 10-12 productionlines).
Calculated -- financial -- IPR 16.9 percentCalculated payback inc construction time 11 years
ORU FORECRST 1990 2000 2010Capacity old 10^6 tpy 6.0 3.0 0.0Capacity new 10^6 tpy 0.0 3.0 6. 0
Energy old 10A3 tceyr 1716.3 958.2 0.0Energy neu 10A3 tce/yr 0.0 482.2 964.4Total energy 10A3 tce/yr 1716.3 1340.4 964.4Energy saved 10^3 tce/yr 0.0 375.9 751.9 MMC02 10A3 ty/ 1135.9 891.2 646.5S02 10^3 t/y 13.9 12.0 10.1TSP 10A3 t/y 129.6 72.8 16.9
C02 removal JOA3 tpy 244.7 489.4 poInvestment 10AG RHO 1941.9 3663.6Invest C02 removal RHO per t/y 7526 7526 KMInvest TCE saved RnB per TCE/y 4899 4999 MM
ACCELERATED FORECRSTCapacity old 10A6 tpy 6.0 0.0 0.0Capacity neu IOA6 tpy 0.0 6.0 6.0
Energy old 10^3 tce/yr 1716.3 0.0 0.0Energy new 10^ tce/yr 0.0 964.4 964.4Total energy 10A^ tce/yr 1716.3 964.4 964.4Energy saved 10bA tce/yr 0.0 751.9 751.9 MM
C02 1OA3 t/y 1135.9 646.5 646.5502 10A3 ty 13.9 10.1 10.1TSP 10A3 t/y 128.6 16.9 16.9
C02 removal 103 tpy 489.4 489.4 mmInvestment bOAG R19 3693.6 3693.6Invest C02 removal RHO per t/y 7526 7526 MM
Invest TCE saved RHO per TCE/y 4899 499

CRSE STUDY RNRLYSIS NUMBER 82 Wet to dry conversion
Scenario I wiLh wet grinding. dry kilnwithout Withproject project
wet process dry process NOTES
Net energy use kgCE/t 248 170 1 Wet process capacity is about IIX of 200
C02 emission cg/t 164.29 113.39 million tpy, say 22 mm tpy.502 emission kg/t 6.67 4.51 2 IL is assumed that no conversions will be
TSP emission kg't 3.59 2.72 completed beFore 2000 but about halF this
capaciLy will be converted by 2010 under theInvestment For CS lOA6 PHD 0 130 DM casc . This means about 40-50 kilns.
Capacity For CS 10^A6 tpy 0.1O 6 0.433Investment per TPY Y/tpy 300 3 It is assumed that all kiIlns -- say 100 --Present capacity 10A6 tpy 22 could be converted by 2010 under the RCCEL
case.
Calculated -- financial -- IRR 19.2 percentCalculated payback inc construction time 10 years
BOM FORECRST 1990 2000 2010Capacity old wet 10^6 tpy 22.0 22.0 11.0Capacity new dry 10A6 tpy 0.0 0.0 11.0
Energy old wet 10A3 tceOyr 5460.8 5460.8 2730.4Energy new dry 10O3 tce-yr 0.0 0.0 1865.3Total energy I0^3 tce/yr 5460.8 5460.8 4595.7Energy saved 10'"3 tce/gr 0.0 .0 865. 1 WN
C02 10^3 t/y 3614.4 3614.4 3054.5S02 10^3 t/y 146.7 146.7 123.0TSP 10D3 t/y 79.0 79.0 69.4
C02 removal 10^3 t/y 0 559.9 N"
Investment 10^6 RH8 0.0 3301.0Invest C02 removal RHD per tWy 0 5896 m"Invest TCE saved RHO per TCE/y 0 3916 "N
RCCELERRTED FORECRSTCapacity old wet I1A 6 tpy 22.0 22.0 0.0Capacity new dry 10A6 tpy 0.0 0.0 22.0
Energy old wet 10A3 tce/yr 5460.8 5460.8 0.0Energy new dry 10A3 tce/yr 0.0 0.0 3730.5Total energy I1A3 tceyr 5460.9 5460.8 3730.5Energy saved 10^3 tce/yr 0.0 .0 1730.3 "m
C02 10^3 t/y 3614.4 3614.4 2494.6502 10^3 t/y 146.7 146.7 99.2TSP 10^3 t/y 79.0 79.0 59.8
C02 removal 10-3 t/y .0 1119.9 N"
Investment 0AG6 RH8 0.0 6602.0Invest C02 removal RHO per t/y 0 5996 NM
Invest TCE saved RM8 per TCE/y 0 3916

CRSE STUDY RNRLYSIS NUHBER 83 Vertical shaFt kiln renovation
without Withproject project
old plant new plant NOTES
Net energy use kgCE/t 189 127 1 ShaFt kilns represent about 150 mm tpy
C02 emission tl1090 80.54 cement capacity, many being quite small.502 emission kg/t 4 4e Many are very old and use outdated502 emission kg/t 4.49 3.22 equipment.
TSP emission kg/t 2.50 1.91
2 It is assumed that about one third, say 50Investment for CS 10A6 RHO 0 26.7 mm tpy capac ity, repr-esents k ilIns that areo
Capacity for CS 10^6 tpy 0.510 0.6S5 wormth renovating -- many will be too old to
Investment per TPY RHB/tpy 41 upgrade and may well be replaced by new
Present capacity 10^6 tpy 50 plants.
3 For the BRU case, it is assumed that up toone quarter could be renovated by 2000 and
Calculated -- Financial -- IRR 32.3 percent the balance by 2010. This represents about
Calculated payback inc construction time 7 years 25 plants by 2000 and the full 100 or so by
2010.BRU FORECnST 1990 2000 2010
Capacity old 10A6 tpy 50.0 37.5 0.0 4 In the RCCEL case, the renovation of 35X by
Capacity renov. IDA6 tpy 0.0 12.5 50.0 2000 is assumed -- 30-40 plants -- and the
balance by 2010.Energy old 10A3 tceoyr 9444 7083 0
Energy renov. 10A3 tce/yr 0 158S 6341
Total energy 10^3 tce/yr 9444 8668 6341
Energy saved 10A3 tce#yr 0 776 3103 ww
C02 10A3 t/y 5545 5166 4027S02 10^3 t/y 224 206 161
TSP 10A3 t/y 125 11e 96
C02 removal 10A3 t/y 380 1518 mm
Investment 10^6 RHO 513 2053
Invest C02 removal PHO per t/y 1352.5 1352.5 mm
Invest TCE saved RHO per TCE/y 661.6 661.6 mm
RCCELERATED FORECASTCapacity old IOA6 tpy 50.0 32.5 0.0
Capacity renov. 1OAS tpy 0.0 17.5 50.0
Energy old 10^3 tce/yr 9444 6138 0
Energy renov. 10A3 tee/yr 0 2219 6341Total energy 10A3 tce/yr 9444 8357 6341
Energy saved 10A3 tCe/yr 0 1086 3103 mm
C02 10A3 t/y 5545 5014 4027
S02 10A3 t/y 224 202 161
TSP 10A3 t/y 125 115 96
C02 removal 10A3 t/y 531 1519 mm
Investment IOA1 RHO 719 2053
Invest C02 removal RMD per t/y 1352.5 1352.5 "
Invest TCE saved RMB per TCE/y 661.6 661.6 MM

CRSE STUDY ANRLYSIS NUHBER LI Black liquor recovery
Without Withproject project
with BL recovery NOTES
Net energy use kgCELt 532 348 1 The situation with respect to causticrecovery (black liquor recovery) may beC02 em i ssion kg/t 1054.70 422.35 summarised as Foll1ows5:
502 emission kg/t 6.52 9.47TSP emission kg/t 11.31 2.17 Wood base Straw Total
with rec. 800 400 1200Investment For CS 10^6 RHO 0 11.32 no rec. 100 1600 1700Capacity for CS 10^6 tpy 0.017 0.017 --------- -------- --------Investment per TPY RHMBtpy 666 900 2000 2900Present capacity 10^6 tpy 1.2 All Figures reFer to 10^3 tpy pulping capacitwithout bi recovery
2 OF the 1700 without recovery. systems For500 are under construction. The potential is
Calculated -- financial -- IRR 24.5 percent thus 1,200,000 tpy.Calculated payback inc con5truction time 9 years
3 For the BRU case, it is assumed that allBAU FORECRST 1990 2000 2010 plants will be Fitted with black liquor
Capacity no rec tO^A tpy 1.2 0.8 0.0 recovery systems by 2010 but only one thirdCapacity with rec 10^6 tpy 0.0 0.4 1.2 -- say 20 plants -- by 2000.
Energy no rec 10A3 tce/yr 638.4 425.6 0.0 4 For the RCCEL case, half -- say 30 plants --Energy with rec 10A3 tcegyr 0.0 139.2 417.6 will be fitted with Bt. recovery by 2000.Total energy 10^3 tceyr 638.4 564.9 417.6Energy saved 10^3 tceoyr 0.0 73.6 220.8 MM 5 It is assumed that all new pulping plantsC02 10^3 tZY 1265.6 1012.7 506.9 will automatically have BL recovery502 10^3 t/y 7.9 9.6 10.2 Facilities built into the design.TSP 10^3 tOy 13.6 9.9 2.6
6 Energy use and emission Factors estimated asC02 removal 10A3 t/Y 252.9 758.9 MM follows:Investment 10^6 RHB 266.4 799.1 without withInvest C02 removal RHO per t/y 1053 1053 " project projectInvest TCE saved RHB per TCE/y 3619 3619 m" Het energy use 9043.13 5918.54 TCEpy
C02 17930 7180 tpyRCCELERATED FORECAST S02 110.90 144.00 tpy
Capacity no rec 10^6 tpy 1.2 0.6 0.0 TSP 192.25 36.01 tpyCapacity with rec 10^6 tpr 0.0 0.6 1.2 To relate these to pulp produced, each
Energy no rec 10^3 tce/yr 638.4 319.2 0.0 Figure was divided by 17000 -- the pulpEnergjy with '-ec 1OA3 tceoyr 0.0 208.8 417.6 production in tpy for the case study plant,Total energy 1 0 ^3 tce/yr 638.4 528.0 417.6 Bostenghu Paper Hill, Kulle City. XinjiangEnergy saved I G' 3 tee/yjr 0.0 110.4 220.8 "" utonomous Region.C02 10A.3 t/Y 1265.6 886.2 506.8S02 10^3 t/y 7.9 9. 0 10.2TSP 10^3 t/Y 13.6 8.1 2.6
C02 removal 10a3 t/y 379.4 759.1 wMInvestment 10^6 PRD 1053 1057 99Invest C02 removal RMO per t/y 10 1053 "wInvest TCE saved RMB per TCE/y 3619 3619 "w

~nDm sIUUT HNHLY5IS NUMBER L2 Cogeneration in paper Aill------------------------------------------------------------------
__---------__-----------------------------------------
Uithout withproject project
with cogen NOTESNet energy use kgCE/t 2094 1691 1 Of the 5000+ paper- plants in China, only 60or- so have their own power plant. It isC02 emission kg/t 1363.4 1101.0 estimated that 80 new miliscould install 300S02 emission kg/t 67.0 54.1 HU generating capacity (cogeneration),TSP emission kg/t 0.0 0.0 average size say 4 MW.Investment For CS 10^6 RHO 0 46.52 2 Based on 80 mills oF average size 30,000 tpyCapacity for CS l0A6 tpy 0.0o3 0.083 paper products -- which correspondsInvestment per- TPY RMB per tpy ses approximately to 4 MW electrical load -- thePresent capacity IOA6 tpy 2.4
capacity oF mills with the potential towith no cogeneration
install cogeneration is estimated to be 2.4mm tpy paper.Calculated -- Financial -- IRR 24.6 percent 3 It is assumed that all these mills will haveCalculated payback inc construction time 5 years installed such systems by 2010 and that allnew mills oF comparable size will installBRU FORECRST 1990 2000 2010 cogeneration.Capacity no cogen 10^6 tpy 2.4 1.9 0.0Capacity with cog 106 tpy 0.0 0.5 2.4 4 For the BAU case. it is assumed that 15 to20 mills will have installed cogeneration byEnergy no cogen 10A3 tce/yr 5025.6 3970.6 0.0 2000 representing say 0.5 mm tpy capacity.Energy with cogen 10A3 tEc/yr 0.0 945.5 4058.4Total energy 10^3 tce/yr 5025.6 4924.1 4059.4 5 For the ACCEL case, it is assumed 30-35Energy saved 10A3 tce/yr 0.0 201.5 967.2 mm mills will have installed cogeneration byC02 1OA3 t/Y 3272.2 3141.0 2642.4 2000, a capacity oF I mm tpy paper.502 10A3 t/y 160.8 154.4 129.9TSP 10^3 tAg 0.0 0.0 0.0 6 Energy and emissions Factors derived asfollows:C02 removal 10A3 t/y 131.2 629.9 MM without withInvestment 10A6 RMH 292.3 1403.0 project projectInvest C02 removal RHO per tpy 2228 2229 "m Energy" TCEi'yr 173825 140345Invest TCE saved RHB per TCE/y 1451 1451 MM C02 tpy 113160 91365S02 tpy 5562 4491RCCELERBTED FORECRSTCapacity no cogen IDA6 tpg 2.4 1.4 0.0 To relate these to paper production, theseCapacity with cog IOA6 tpy 0.0 1.0 2.4 figures were divided by 83000, the paperoutput in tpy of the case study plant,Energy no cogen 10A3 tce/yr 5025.6 2931.6 0.0 Yalujiang Paper Hill. Dandong City, LiaoningEnergy with cogen 10A3 tCe/yr 0.0 1691.0 4058.4 Province.Total energy 10^3 tee/yr 5025.6 4622.6 4058.4 " Note that the energy and emissionsEnergy saved 10b3 tce/yr 0.0 403.0 967.2 mm associated with the electricity export fromC02 10A%3 t/y 3272.2 3009.9 2642.4 the cogeneration system are included asSOZ 10^3 t/y 160.8 147.9 129.8 energy and emissions for the "without" case,TSP 103 t/y 0.0 0.0 0.0 as the electricity would have been generated
TSP ~~~~~~~~~~~~~~~~~~elsewhere.C02 removal 10A3 t/y 262.4 629.0 "Investment 106 RHO 59228 1403.Invest C02 removal RMB per tpy 2229 2251Invest TCE saved RMB per TCE/y 1451 1451 w

CRSE STUDY RNRLYSIS NUHBER TI Cogener-ation in textile mill
Without withproject projectno cogen with cogen NOTES
Net energy use kgCE/mm H 375600 315000 I The example plant chosen for the case studyanalyjsis produces about 60 mill ion mneters
C02 emission kg/mm H 245600 201485 per year of fabric and there are about 500
S02 emission kg/mm H 10209 8738 similar plants. This represents a capacity
TSP emission kg/mm H 4768 2960 oF 30,000 million m/y.
Investment For CS IOAS RHB 0 7.13 incremental 2 For the 8RU case, it is assumed that about
Capacity for CS IOA6 H/y 60.0 60.0 80 plants (capacity 4,800 million m/y) will
Investment per H RMB per H/y 0.119 have installed cogeneration by 2000 and 400
Present capacity 10^6 H/y 30000 plants (24,000 mm m/y or 80Z oF the
potential) by 2010.
3 For the (CCEL case, 120 plants are assumedCalculated -- financial -- IRR 37.6 percent to have cogeneration by 2000 (7.200 mm m/y
Calculated payback inc construction time 6 years or 24X) and 90X by 2010 (27,000 mm m/y).
8nu FORECAST 1990 2000 2010 4 Energy and emission factors were derived
Capacity no cogen IO1^6 W/y 30000 25200 600 from the case study data as Follows:
Cap. with cogen 10D6 H/y 0 4800 24000without With
Energy no cogen 10A3 tce/yr 11268.0 9465.1 2253.6 project project
Ener gy with cogen 10^3 tce/yr 0.0 1512.0 7560.0 Energy TCE/yr 22534 18902
Total energy IOA3 tCe/yr 11268.0 10977.1 9913.6 C02 tpy 14739 12089
Energy saved ag3 tce/yr 0.0 290.9 1454.4 mm 502 tpy 613 524
C02 IOA3 t/y 7368.0 7156.2 6309.2 TSP tpy 286 178
S02 10^3 t/y 306.3 299.2 271.0TSP 10^3 t/y 143.0 134.4 99.6 These figures were then divided by 60
million metres, the annual output of the
C02 removal 10A3 t/y 211.; 1058.8 MM case study pInt (Yangzhou Dyeing and
Investment 10^6 PMB 570.4 2852.0 Printing Hill. Jiangsu Province) in order to
Invest C02 removal RHO per tpy 2694 2694 mm relate changes in energy and emissions to
Invest TCE saved RHB per TCE/y 1961 1961 mm textile production for sector aggregationpurposes.
RCCELERnTED FORECRSTCapacity no cogen 10^6 l/y 30000 22900 3000Cap. with cogen 10 A6 HWY 0 7200 27000
Energy no cogen 10A3 tCeo/yr 11268.0 9563.7 1126.0
Energy with cogen 10^3 tce/yr 0.0 2268.0 8505.0Total energy 10^3 tce/yr 11268.0 10831.7 9631.8Energy saved 10^3 tce/yr 0.0 436.3 1636.2 mm
C02 10^3 t/y 7368.0 7050.4 6176.9
S02 10A3 t/y 306.3 295.7 266.6
TSP 1OA3 t/y 143.0 130.0 94.2
C02 removal 10A3 t/y 317.6 1191.1 mmInvestment 10^6Q8OA 855.6 3209.5Invest C02 removal RHO per tpy 2694 2694 NHInvest TCE saved RHO per 1961 1961 T"

CnSE STUDY RNRLYSIS NUMBER T2 NaOH recovery, textiles sector…__
_ _ _ _ _ _ _ _ _ _ _ _ _ _ _ _ _ _ _- -_- -__ _ _- -__ _ _ _ _ _ _ _ _ _ _ _ _ _ _ _ _ _ _ _ _ _ _
Without Withproject project
no recovery with recov NOTES
Net energy use kgCE/t 42974 32835 I As for case study Ti, the estimated capacityoF plants without caustic soda r-ecovery isC02 emission kg/mm metre 28004 21546 (500 x 60) or 30, 000 m illi on m/yis502 emission kg/mm metre 0 4
TSP emission kg/mm metre 336 259 2 For the BRU case, about 60 plants areassumed able to install recovery systems byInvestment For CS 10^6 PH8 0 2.01 2000 (capacity 5,000 mm m/y) and 450 plants.Capacity for CS 10^6 m/y 60.0 60.0 say 90X by 2010 (capacity 27,000 mm m/y).Investment per TPY RHO per m/y 0.034
Present capacity 10^6 m/y 30000 3 For the RCCEL case. 150 plants are assumedto install recovery systems by 2000(capacity 9000 mm m/y) and all plants, about500, by 2010.Calculated -- financial -- IRR 57.9 percent
Calculated payback inc construction time 3 years 4 For the case study at Yangzhou Dyeing andPrinting Hill, the incremental investmentBRU FORECRST 1990 2000 2010 was 2.01 million RHB, the difference betweenCapacity no rec 10^6 m/y 30000 25000 3000 the new investment of 3.89 mm and the amountCapacity with rec 10S6 m/y 0 5000 27000 needed to keep the old system operating(1.89 million for tanks, controls, etc).Energy no rec 10^3 tce/yr 1289.2 1074.4 128.9
Energy with rec 10^3 tce/yr 0.0 164.2 966.5 S Energy and emissions factors were derived asTotal energy 10^3 tce/yr 1289.2 1238.5 1015.5 Follows:Energy saved 1003 tce/yr 0.0 SO.7 273.8 without withC02 10A3 t/y 840.1 807.8 665.8 project projectS02 10'3 t/y. 0.0 .0 0.1 Energy TCE/yrTSP l0'3 t/y 10.1 9.7 9.0 in plant 25.41 1002.62for caustic 2553.04 967.26C02 removal l0'3 t/y 32.3 174.4 rM total 2578.45 1970.08Investment 10^6 RHO 167.5 904.5
Invest C02 removal RHO per t/y 5187 5187 C02 tpy 1680.25 1292.78Invest TCE saved RQO per TCE/y 3304 3304 mm 502 tpy 0.00 0.23TSP tpy 20.16 15.51RCCELERRTED FORECRSTCapacity no rec 10S6 m/y 30000 21000 0 These figures were divided by 60 millionCapacity with rec 1O'6 m/y 0 9000 30000 metres, the annual output of the Yangzhou
plant, to relate changes in energy use andEnergy no rec 10^3 tce/yr -1289.2 902.5 0.0 emissions to tewtile production.Energy with rec 10^3 tce/yr 0.0 295.5 985.1Total energy l0'3 tce/yr 1289.2 1198.0 965.1Energy saved l0A3 tce/yr 0.0 91.3 304.2 mmC02 10^3 t/y 840.1 782.0 646.4S02 10'3 t/y 0.0 .0 0.1TSP 10A3 t/y 10.1 9.4 7.8
C02 removal l0'3 t/ej301 5 193.7 MM
Invest C02 removal RHO per t/y 3504 517 M0Invest TCE saved RHO per TCE/y 3 3

CASE STUDY RNRLYSIS NUHMER T3 Energy management
Without withproject project
computerised NOTES
Net energy use kgCE/mm m 70687 63618 1 It is assumed that about IOX oF energy canbe saved by computerising the production
C02 emission kg/mm metre 46917 42225 systems and adding e ters.502 emission kg/mm metre 1995 1706TSP emission kg/mm metre 1053 948
Investment for CS 1OA6 RHO 0 1.5Capacity For CS 10^6 mZg 60.0 60.0Investment per TPY RHO per m/y 0.025Present capacity 10^6 m/y 30000
BRU FORECRST 1990 2000 2010Capacity eMisting 1OA6 m/y 30000 22500 0Capacity computer.10A6 m/y 0 7500 30000
Energy ewisting 10A3 tce/yr 2120.6 1590.5 0.0Energy computer. 10^3 tee/yr 0.0 477.1 1908.5Total energy 10A^ tce/yr 2120.6 2067.6 1908.5Energy saved 10^3 tce/yr 0.0 53.0 212.1 "mC02 10^3 t/y 1407.5 1372.3 1266.9S02 10A3 t/y 56.9 55.4 51.2TSP 10A3 t/y 31.6 30.8 28.4
C02 removal 10A3 t/y 35.2 140.8 "N
Investment 10^6 RMB 197.5 750.0Invest C02 removal RHO per t/y 5328 5328 mmInvest TCE saved 0M1 per TCE/y 3537 3537 "N
RCCELERnTED FORECASTCapacity ewisting 10^6 m/y 30000 26000 0Capacity computer.I0A6 msy 0 12000 30000
Energy existing 10^3 tee/yr 2120.6 1272.4 0.0Energy computer. 10'3 tce/yr 0.0 763.4 1908.5Total energy 10^3 tcee/r 2120.6 2035.8 1908.5Energy saved b0'3 tce/yr 0.0 94.9 212.1 "mC02 1D^3 t/y 1407.5 1351.2 1266.9502 10^3 tOy 56.9 54.6 51.2TSP 10^3 t/y 31.6 30.3 28.4
C02 removal 10^3 t/y 56.3 140.8 Investment b0'6 RHO 300.0 750.0Invest C02 removal QM9 per t/Y 5328 532 Invest TCE saved PM8 per TCE/y 3537 3537

CnSE STUDY ANALYSIS NUMBER CHI Medium size ammonia renovation
Without Withproject project
(old plants) (renovated) NOTES
Net energy use kgCE/t 2135 1723 I There are about 56 medium size plants,
C02 emission kgjt 1437.20 1326.06 typical capacity 60,000 tpy ammonia, oFS2mision kg/t 563.50 416.06 which 34 use coal and the others oil/gas.
S02 emission kg/t 56.50 46.88TSP emission kg/t 36.35 21.66 2 The 34 plants represent up to 3 mm tpy
Investment For Cs IOAS RMB 0 370.69 ~capacity but perhaps half will not beInvestment For CS JOA6 RMe a 370.69 renovated -- rather, new plants will beCapacity For CS 10^6 tpy 0.080 0.180 built, much larger, to replace them. Assume
Investment per TPY RHe/tpy 2059 thereFore that the realistic maximumPresent capacity 10^6 tpy 1.5 capacity for renovation is 1.5 mm tpy (say
IS to 20 plants).
3 For the BRU case, assume no plants at allCalculated -- financial -- IRR 19.5 percent will be renovated -- IQR not very attractive.Calculated payback inc construction time 10 years
4 For the ACCEL case, assume up to 20Z ofBRU FORECRST 1990 2000 2010 capacity renovated by 2000, say 4-5 plants.
Capacity old ID'6 tpy 1.S 1.5 .5 and up to 6OX by 2010 (10-12 plants).Capacity renov. l0'6 tpy 0.0 0.0 0.0
Energy old 10'3 tc-/yr 3203.1 3203.1 3203.1Energy renov. I0^3 tc./yr 0.0 0.0 0.0Total energy 10^3 tc-/yr 3203.1 3203.1 3203.1Energy saved 10A3 tce/yr 0.0 .0 .0 mmC02 10^3 t/y 2155.9 2155.9 2155.9S02 10^3 t/y 94.8 94.8 94.8TSP 10'3 t/y 54.5 54.5 54.5
C02 removal 10^3 t/y .0 .0 m"Investment l0'6 RHe .0 0.0Invest C02 removal RHM per t/y 0 0 mmInvest TCE saved RMB per TCE/y 0 0 MM
RCCELERRTEO FORECRSTCapacity old 10^6 tpy 1.5 1.2 0.6Capacity renov. 10^6 tpy 0.0 0.3 0.9
Energy old 10^3 tce/yr 3203.1 2562.5 1281.2Energy renov. 10^3 tce/yr 0.0 516.9 1550.6Total energy 10A3 tce/yr 3203.1 3079.4 2832.0Energy saved 3QA3 tce/yr 0.0 123.7 371.0 MM
C02 I0^3 t/y 2155.6 2062.5 187S.6502 l0'3 t/y 94.9 91.9 76.3TSP 10'3 t/y 54.5 50.1 41.3
C02 removal 10A3 t/y 93.3 280.0 mmInvestment 10^6 QHB 617.9 1653.5Invest C02 removal RMB per t/y 6619 6619 mmInvest TCE saved RMB per TCEy 4995 499S mm

CnSE STUDY RNRLYSIS NUHBER CRZ Small ammonia renovation and waste heat recovery
Without Withproject project
old plant with JHR NOTES
Net energy use kgCE/L 217S 1899 I Prooduction by small plants (under 45,000 EpyC02 emission kg/t 1451.15 1271.03 ammonia) represents over half of national502 emission kgO't 58.05 50.52 ammonia Production. Over 1000 suchTSP emission kggt 34.10 30.70 enterp,ises over 900 using anthr-acite.
2 Rmmonia production by such small plants isInvestment for CS 1DA06RHO 0 3.01 thus about 11 mm tpy. Hot all plants will beCapacity for'CS 10^6 tpy 0.017 0.019 ammonia suitable for- renovation -- many are likelyInvestment per TPY RHB/tpy 158 to be replaced by new large scale plants.Present capacity 10^6 tpy 7.5 Rssume therefore that about two thirds of
capacity -- 7.5 mm tpu -- is the fullpotential.
Calculated -- financial -- IRR 71.4 per-cent 3 For BARU case. assume about 100 plantsCalculated payback inc construction time 3 years renovated by 2000, while 200 or more arerenovated under the RCCEL case.BRUI FORECRST 1990 2000 2010Capacity old 1OA6 tpy 7.5 6.0 0.0 4 By 2010, assume all plants renovated --Capacity renov. 1a^6 tpy 0.0 I.S 7.5 about 500 in total.
Energy old 10^3 tce/yr 16314.0 13051.2 0.0Energy renov. 10A3 tce/yr 0.0 2048.7 14243.6Total energy 10A3 tce/yr 16314.0 15899.9 14243.6Energy saved 10A3 tce/yr 0.0 414.1 2070.4 mmC02 10^3 t/y 10883.6 10613.4 9532.7S02 10A3 t/y 435.4 424.1 378.9TSP 10A3 t'y 255.9 250.7 230.3
C02 removal 10A3 t/y 270.2 1350.9 wwInvestment 10A6 HRB 237.6 1198.2Invest C02 removal PMB per t/y 880 860 mmInvest TCE saved RHO per- TCE/y 574 574 mm
RCCELERATED FORECRSTCapacity old 10^6 tpy 7.5 4.5 0.0Capacity renov. 10^6 Epy 0.0 3.0 7.5
Energy old 10^3 tceuyr 16314.0 9788.4 0.0Energ renov. 1OA3 tce/yr 0.0 5697.4 14243.6Total energy 10A3 tce/yr 16314.0 15485.8 14243.6Energy saved 1O^3 tce/yr 0.0 628.2 2070.4 MMC02 10^3 t/y 10883.6 10343.3 9532.7502 IDA3 t/y 435.4 412.0 378.9TSP 10A3 t/y 255.8 245.6 230.3C02 removal 10A3 t/y 540.4 1350.9 mgInvestment 10A6 RHB 475.3 1189.2Invest C02 removal RMB per t,y 880 890 8 MInvest TCE saved RH8 per TCE/y 574 574 MM

CnSE STUDY RNnLYS15 NUHBER CH3 New membrane process at NaOH plant
Without Withproject project
old plant new membrane NOTES
Net energy use kgCE/t 1899 1018 IA bout 150-200 plants similar to the case
study excample have the potential For
C02 emission kg/t 1316.22 729.14 modiFication to membrane technology.
S02 emission kg/t 48.79 25.25
TSP emission kg/t 41.02 27.37 2 Rssume 150 plants, each with capacity 20,000
tpy caustic soda. The full potential is thusInvestment For CS IOAS AMB 52.14 incremental 3 mm tpy.
Capacity for CS 1OA6 tpy 0.020 0.020
Investment per TPY RhB/tpy 2607 3 For the ORU case, assume no modifications
Present capacity 1O^6 tpy 4 until after 2000, when only about lOZ will
be modiFied.
4 For the RCCEL case, assume 20Z -- say 30
Calculated -- financial -- IPR 29.4 percent plants -- modified by 2000 and 50Z or say
Calculated payback inc construction time 6 years 70-80 plants by 2010.
ORU FORECRST 1990 2000 2010
Capacity old IOA6 tpy 3.0 3.0 2.7
Capacity new 10A6 tpy 0.0 0.0 0.3
Energy old 10A3 t.ceZyr 5696.9 5696.9 5127.2
Energy new 10A3 tce.yr 0.0 0.0 305.4
Total energy 10A3 tceZyr 5696.9 5696.9 5432.6
Energy saved 10^3 tce/yr 0.0 .0 264.3 mm
C02 10A3 t/y 3948.7 3946.7 3772.5
502 10A3 t/y 146.4 146.4 139.3
TSP 10^3 t/y 123.1 123.1 119.0
C02 removal lOA3 t/y :0 176.1 m"
Investment 10^6 RHE 0.0 7e2.1
Invest C02 removal RK9 per t/y 0 4441 mm
Invest TCE saved RHO per TCE/y 0 2959 mm
ACCELERATED FORECASTCapacity old OA^6 tpy 3.0 2.4 1.5
Capacity new 1OA6 tpy 0.0 0.6 1.5
Energy old 10A3 tce/yr 5696.9 4557.6 2848.5
Energy new 10A3 tce/yr 0.0 610.7 1526.8
Total energy 10A3 tce/yr 5696.9 5168.3 4375.3
Energy saved 10A3 tce/yr 0.0 528.7 1321.7 Dm
C02 10A3 t/y 3948.7 3596.4 3068.0
S02 10A3 t/y 146.4 132.2 111.1
TSP 10^3 t/y 123.1 114.9 102.6
C02 removal 10A3 t/y 352.2 880.6 MM
Investment 10A6 AND 1564.2 3910.5
Invest C02 removal RnD per t/y 4441 4441 S
Invest TCE saved R"P per TCE/y 2959 2959 wu

CRSE STUDY RNRLYSIS NUMBER El High eFFiciency motors
Uithout Withproject project NOTESstandard motors high eFf motors
I Investment figur-e shown is For- motor'Energy savings MWh/MU installed 90 manuFactutre only and does not relate to theC02 emission kg/HUh 290.00 290.00 emission Factors consumer5opurchasers oF motors.S02 emission kg/Mlh 10.00 10.00 kg/HUh 2 The case study estimates savings oF 450,000TSP emission kg/HUh 11.00 11.00 HUh for 5000 MU installed motors (90 HUh perInvestment For CS 10^6 RHM 0 240Capacity for CS HU manuFact/yr 5000 3 Motor population is about 330,000 MU. ToInvestment per HU RMB per annual MU manuf. 48000 replace emisting motors with high efficiencyPresent capacity MU manuf/yr 0 0 units. it is estimated that 5000 MU oF newFinal capacity MU manuf/yrr 0 60000 motors will be needed (Directive GB 12497 on
"The economic operation of 3-phase inductionmotors"). R Further- 6500 MU will be neededCalculated -- Financial -- IRR )4x4W percent for new applications.Calculated payback inc construction time NHW$ years
4 It is assumed sales of high efficiencymotors will reach half the 5000 HU (2-38RU FORECRST 1990 2000 2010 plants) under BRU conditions and the FullHE motors made MU/yr 0 2500 IS5OO amount iF accelerated (say 5 new orrenovated motor manuFacturing plants). ByEnergy saved 10^6 kWh 0 225.0 1350.0 2010, outputs could be 3 to 5 times thateq 10^3 TCE/Ir at 3200 kcal/kUh 102.9 617.1 mm amount -- to meet replacement and newC02 reduction 10^3 t/y 0 65.3 391.5 MM application demands.S02 reduction 10^3 t/y 0 2.3 13.5TSP r-duction 10^3 t/y 0 2.5 14.9
Investment 10^6 RMB 120.0 720.0Invest C02 removal RHO per t/y 1839 1939 MMInvest TCE saved RHO per TCE/y 1167 1167 mm
RCCELERRTED FORECRST
HE motors made MU/yr 0 5000 25000
Energy saved 10^6 kWh 0 450.0 2250.0eq 10^3 TCE/yr at 3200 kcal/kWh 205.7 1028.6 MrC02 reduction 10A3 t/y 0 130.5 652.5 MMS02 reduction 10A3 t/y 0 4.5 22.5TSP reduction 10^3 t/y 0 5.0 24.6
Investment 10^6 RHB 240.0 1200.0Invest C02 removal RMH per ty 1939 1639 mmInvest TCE saved RM8 per TCE/y 1167 1167 mm

CRSE STUDY ANALYSIS NUMBEP E2 Variable speed motors
Without Uith NOTESproject project
standard motors var speed motors I Market for VS motors estimated at say 1500
MU for replacements and 1500 MU for newEnergy s avings MUhzHUW installed 540 applications each year.
C02 emission kg/mwh 290.00 290.00 emission FactorsS02 emission kg/HUh 10.00 10.00 kg/MUh 2 Investment data are For motor manufactureTSP emission kg/HUh 11.00 11.00 only, not for the users/customers.
Investment For CS 10A6 RHB 0 100 3 From data for Zhejiang and Shenyang motorCapacity for CS MU manufact/yr 3000 manuFacturing plants, it is estimated thatInvestment per HU RHO/annual MU manuFact 33333 3000 MU motor capacity needs an investmentPresent capacity MU manuf/yr 0 0 of 3000 million RHO (say 7-10 plants).Final capacity HU manuf/yr 0 12000
4 Total annual savings are estimated to beabout 1.62 million HUh (20Z savings, 4500
Calculated -- financial -- IRR x*oxxxx percent hrs., load 60Z) for 3000 HU installedCalculated payback inc construction time )x4HmMM years capacity.
5 It is assumed the installed capacity willBRU FORECRST 1990 2000 2010 reach 1/3 (8RU) or 1/2 (RCCEL) of the 3000
VS motors made MU/yr 0 1000 3000 MU by 2000 and the Full amount (BRU) or even50X more (ACCEL) by 2010.
Energy saved OA^6 kWh 0 540.0 1620.0eq 10"3 TCE/yr at 3200 kcal/kUh 246.9 740.6 mmC02 reduction 10A3 t/y 0 156.6 469.8 mmS02 reduction 10A3 t/y 0 5.4 16.2TSP reduction 10A3 t/y 0 5.9 17.8
Investment IA06 QHB 33.3 100.0Invest C02 removal RMB per t/y 213 213 mmInvest TCE saved RMB per TCE/y 135 135 MM
RCCELERRTED FORECAST
VS motors made HW/yr 0 1500 4500
Energy saved 10^6 kWh 0 910.0 2430.0eq IOAS TCE/yr at 3200 kcal/kWh 370.3 1110.9 MNC02 reduction 10A3 t/y 0 234.9 704.7 mm502 reduction 10A3 t/y 0 9.1 24.3TSP reduction 10A3 t/y 0 8.9 26.7
Investment I^6S RMB 50.0 150.0Invest C02 removal RHB per t/y 213 213Invest TCE saved RHB per TCE/y 135 135 MM

CnSE STUDY RNRLYSIS NUMBER E3 Electric motor repair- centres…__ _ _ _ _ _ _ _ _ _ _ _ _ _ _ _ _ _ _ _ _- -_ _- - --_- --__ _ _ _ _ _ _ _ _ _ _ _ _ _ _ _ _ _ _ _ _ _ _ _ _ _ _ _ _ _ _ _
Without withproject project
ord repairs repair centre NOTES
Energy savings HWh/HU rep 0 48 1 Rbout 10.000 HU motors need repair- each
C02 emission kg/HUh 290.00 290.00 emission factors year, of uhich 5,000 MM need reuinding.502 emission kg/HUh 10.00 10.00 kg/HWh 2 Savings estimate is based on 2Z efficiencyTSP emission kg/"Uh 11.00 11.00 improvement:
Investment for CS ID"6 RHO 0 7.123 4000 hrs m 0.02 w 0.6 , SO0 = 240,000Capacity for CS HU rep/yr 0 600 load KW HUh/yearInvestment per NW RHO/annual MM repaired 11872Present capacity HU rep/yr 0 0 240,000 / 5000 46 8Wh/NW repairedFinal capacity MN rep/yr 0 1 D0
3 Investment based on Shanghai motor plant,1.123 million RHO for 600 NW annual repair-
Calculated IQR 45 percent capacity.Calculated payback inc construction time 2 to 3 years
4 For BRU, it is assumed that 1/2 the repair-capacity (4-S plants) are in place by 2000
BOM FORECRST 1990 2000 2010 and the full SOW MU by 2010.Repair capacity NW/yr 0 2500 SOOO
5 For- RCCEL case, it is assumed 70 in placeEnergy saved 10-6 kWh/y 0 120.0 240.0 by 2000 and a total of 8000 HU by 2010.
equiv 10^3 TCE at 3200 kcal/kWh 54.9 109.7C02 reduction 10^3 t/y 0 34.8 69.6502 reduction 10A3 t/y 0 1.2 2.4TSP reduction 10A3 t/y 0 1.3 2.6
Investment million Y 29.7 59.4Invest C02 removal RHO per t/y 853 853Invest TCE saved RQB per TCE/y 541 541
RCCELERATED FORECRST
Repair capacity 1W/yr 0 3500 9O00
Energy saved 10^D6 k1h/y 0 168.0 384.0equiv l0'3 TCE at 3200 kcal/kUh 76.8 175.5
C02 reduction l0'3 t/y 0 48.7 111.4S02 reduction 10^3 t/y 0 1.7 3.8TSP reduction 10'3 t/y 0 1.8 4.2
Investment million Y 41.6 95.0Invest C02 removal RHB per t/y 853 853Invest TCE saved RHB per TCE/y 541 541

CRSE STUDY RNRLYASIS NUMBER E4 Steam traps
Without Withproject project
more traps NOTES
Energy savings TCE/trap I I A shortage of about 12 million traps uasidentified in the case study report.C02 emission kg/TCE 651.00 651.00 emission factors
502 emission kg/TCE 27.30 27.30 kg/TCE 2 Rdded capacity at the Yangzhou Valve FactoryTSP emission kg/TCE 12.00 12.00 is expected to be 186,000 traps per year Foran investment oF IS.6 million RHB.Investment for CS IOA6 PHD3 0 15.6 Investment shown is for trap manuFacture andCapacity for CS 10A6 traps/yr 0.1O 0 has no relation to the trap purchaser.Investment Y/annual trap manufact 83
3 Savings using good quality traps wasestimated as follows:
W Duty say 0.2 t/h steam per trap.Calculated -- financial -- IRR wxxo percent W Savings sag IX or 0.002 t/h, equivalentCalculated payback inc construction time XwsXX years to say 10 tpy steam or I TCE per yearper trap.
BRU FORECRST 1990 2000 2010 4 For BRU, assume additional 10 million trapsSteam traps made 10^6 per yr 0 2 10 per year will be made, 2 million/y (say 10neu or upgraded plants) by 2000 and all (50Energy saved 10A3 TCE/y a 2000.0 10000. 0 plants) by 2010.
C02 reduction 10A3 t/y 0 1302.0 6510.0 5 For accel. case. assume 4 million traps/y by502 reduction 10A3 t/y 0 54.6 273.0 2000 (up to 20 plants).TSP reduction 10A3 t/y 0 24.0 120.0
Investment 10^6 RHO 166.0 829.9Invest C02 removal RMB per t/y 127 127Invest TCE saved RHO per TCE/y 83 83
ACCELERRTED FORECRST
Steam traps made million/yr 0 4 to
Energy saved I0^3 TCE/y 0 4000.0 10000.0
C02 reduction 10A3 t/y 0 2604.0 6510.0S02 reduction 10A3 t/y 0 109.2 273.0TSP reduction 10A3 t/y 0 40.0 120.0
Investment l0A6 RMO 331.9 929.8Invest C02 removal RHO per t/y 127 127Invest TCE saved RHO per TCE/y 83 83