DRD23100Box3770et000Chile0... - World Bank Documents
72
DRD DISCUSSION PAPER Report No. DRD231 REFORt-1, EXTERNAL SHOCKS AND THE LABOR MARKET: CHILE 1974-1983 by Alejandra Cox Edwards October 1986 ------------·--------·------------------------------------------l Development Research Departnent and Research Staff Bank ·:'he lJ. Bank ;:h)es not c1ceept responsibility for vievJs expressed herein ,.,r£11\:L are th;JS•• the aut:hor(s) and should not be attributed to the Bank or to its urgani2ations9 The findings, interpretations, and co:.11.:lusions :1r...:: uw ts of rest"arch supported by the Bank; they do not necessarily repr0sent policy of the Banko The designations tile of ;.u1d any :::wps used in this doeument are fn!:' tht 71 cnnvenl\?nce of and do not imply the expression of any .,)n the part of the Bank or its affilirtU::>s cor.cerni.ng legal stc1tas of any territory, eity, area, or of its nr ti1t' delimit:itions of its boundaries, or national affiliation" Public Disclosure Authorized Public Disclosure Authorized Public Disclosure Authorized Public Disclosure Authorized Public Disclosure Authorized Public Disclosure Authorized Public Disclosure Authorized Public Disclosure Authorized
-
Upload
khangminh22 -
Category
Documents
-
view
2 -
download
0
Transcript of DRD23100Box3770et000Chile0... - World Bank Documents
DRD DISCUSSION PAPER
Report No. DRD231
E\~d:Io:Ut~ REFORt-1, EXTERNAL SHOCKS AND THE LABOR MARKET: CHILE 1974-1983
by
Alejandra Cox Edwards
October 1986
------------·--------·------------------------------------------l
Development Research Departnent E~ono~ics and Research Staff
~~orld Bank
·:'he ~.J,;,r lJ. Bank ;:h)es not c1ceept responsibility for tht~ vievJs expressed herein ,.,r£11\:L are th;JS•• ~Jf the aut:hor(s) and should not be attributed to the ~lorld Bank or to its ;lffiliat~d urgani2ations9 The findings, interpretations, and co:.11.:lusions :1r...:: uw r~su ts of rest"arch supported by the Bank; they do not necessarily repr0sent officl~l policy of the Banko The designations employed~ tile pr1;~S(~nt.1ti1)n of l'lat.~tAial, ;.u1d any :::wps used in this doeument are solE~ly
fn!:' tht71 cnnvenl\?nce of U~>:, rt.~ad~::r and do not imply the expression of any J~)i:1i•)n ',;fl,ltSOf.~·.:,_::JA .,)n the part of the ~..J'orld Bank or its affilirtU::>s cor.cerni.ng the:~ legal stc1tas of any ~:ountry, territory, eity, area, or of its authorities~ nr conet~rning ti1t' delimit:itions of its boundaries, or national affiliation"
Pub
lic D
iscl
osur
e A
utho
rized
Pub
lic D
iscl
osur
e A
utho
rized
Pub
lic D
iscl
osur
e A
utho
rized
Pub
lic D
iscl
osur
e A
utho
rized
Pub
lic D
iscl
osur
e A
utho
rized
Pub
lic D
iscl
osur
e A
utho
rized
Pub
lic D
iscl
osur
e A
utho
rized
Pub
lic D
iscl
osur
e A
utho
rized
zcoamtiC UPOIM, EXTEIDL SRCXZS AIID THE LAlOR MUDT:
CHILE 1974.-1.983
by
Alejandra Cox Edwards
University of California, Los Angeles
Revised: October 1986
This is a revised version of a paper presented at the Conference on "Adjustment of Labor Markets in LDCs: 1970-1985", World Bank, June 26-1.7, 19~6.

ECONOMIC REFORM, EXTERNAL SHOCKS A.~D THE LABOR. MARKET
by
Alejandra Cox Edwards
ABSTRACT
The Chilean economy has experienced, since 1973, external shocks as
well as a change in policies oriented towards freer markett;o Foreign trade
was liberalized, the publitc sector's size was reduced, and the·re was
disinflation. At the same time unemployment became a serious .and persistent
problem, and the paper analyses its connection with the foregoing policies and
with specific changes occurring during this period in. labot· legislation. The
fr:tmework of analysis is a model of segmented labor market which emphasizes
various employment and wage rigidities.
I' i/ II
ECONOMIC REFORM, EXTERNAL SHOCKS AMDD THE LABOR MARKET: CHILE 1974-1983
Table of contents
1. Introduction • • • • • • • • • • • • • •
2. Governmer~t Intervention and Labo·r Market Structure
3 •. Population and Labor Force Participation . . . . . . . . . 4. The Behavior· of Employment . . . . . . . . . . . . . . . . . 5. Wages and Indexation • • • ~ . . . . . . . . . . . . . 6. The Unemployment "Puzzl,e": A .Suggested Interpretation.
A. Three Segments: A Selection Rule •••••• B. Preliminary Evidence on Market Segmentation ••
The Structure of Chile's I.abor Market and Unemployment
The Model . . . . . . . . . . . . . . . . . . . . . . . . . Segmentation in Chile. . . . . . . . ~ ~ . . ~ . . . . . . .
7. Summary., • • • • • • • • • • • • • ~ Q • • • • • • • •
lt"ootnotes • . . . . . . . . . . . . . . . . . . . . . . . ~ . . . References. . . . ~ . . . . . . . . . . . . . . . . ~ . . . . . .
\, \
~~
\1·
\ ~~
Page
1
9
13
15
22
29
31 33
39
41
44
55
59
64
1
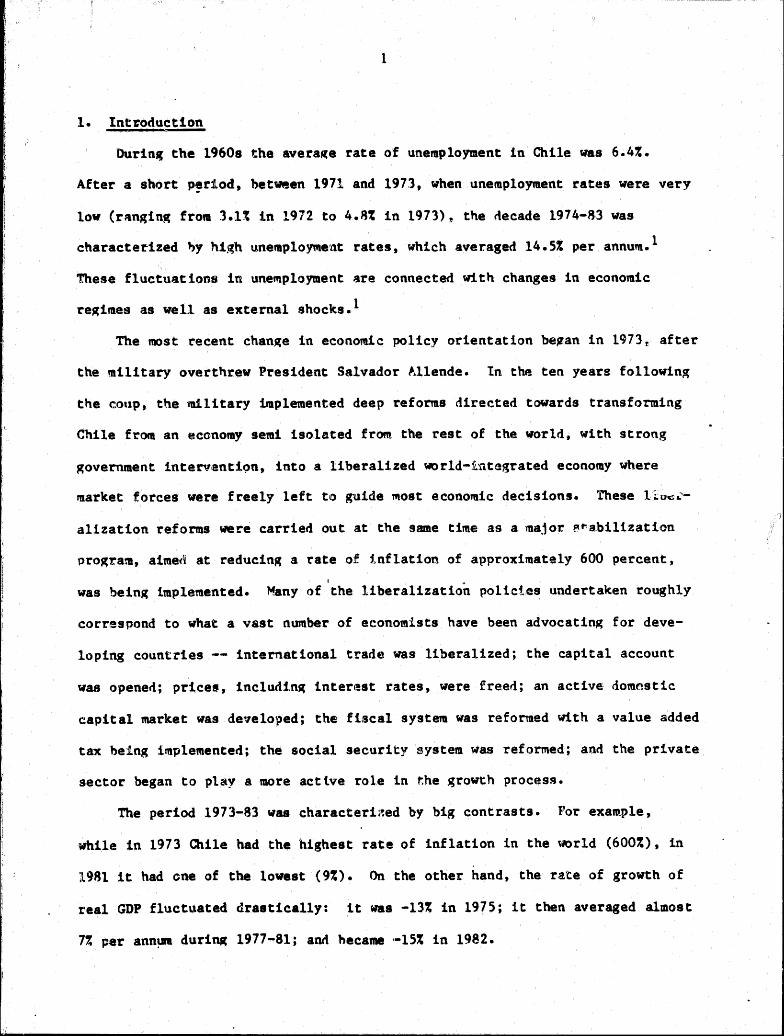
1. Int~oduetion
Durin~ the l960s the averaf(e rate of unemployment in Chile was 6.4%.
After a short p~riod, between 1971 and 1973, when unemployment rates were very
low (r~ngin~ from 3.1% in 1972 to 4.~% in 1973)~ the ~ecade 1974-R3 was
characterized ~y high une~plo1Ment rates, which averaged 14.5% per annum. 1
These fluctuations in unemployment are connected with changes in economic
1 re~imes as well as external shocks.
The most recent chan~e in economic policy orientation be~an in 1973r after
the military overthr~w President Salvador Allende. In the ten yearg following
the coup, the military ~plemented deep reforms directed towards transforming
Chile from an eccnomy semi isolated from the rest of the world. with strong
government interventi~n. into a liberalized world-:fi:ntegrated economy where
market forces were freely left to guide ntost econort~ic decisions. 'rhese lio~a:--
alization reforms were carried out at the same time as a ma.1or. ~~a.bilizaticn
program, aime~ at reducing a rate of inflation of approximately 600 percent, I
was bein~ implemented. f'f.any of the liberalization policies undertaken roughly
correspond to what a vast number of economists have been advocating for deve-
loping countries -- international trade was liberalized; the capital account
was opened; prices, includi.nSl; inter,!st rates, were freer!; an active domestic
capital market was develorped; the fi1scal system was refot111ed with a value added
tax being implemented; the social security system was reformed; and the private
sector began to play a more act t'J•e role in t:he growth process.
The period 1973-83 was characterir;~ed by big contrasts. For exam.ple,
while in 1973 <llile had the highest rate of inflation in the world (600%), in
1981 it had ane of the lowest { 9%). On the other hand, the rate of growth of
real GDP fluctuated drastically: it was -13% in 1975; it then averaged almost
7% per ann!R duri~ 1977-81; anti hecame ·-15% in 1982.
2
In\ termtJ of economic POlicy as we 11, thl'! first decade of the mlli tary
regime was by no means homogeneous. tn fact, i·t is possible to distinguish
f·our differetnt phases. The first covers September 1973 through April 1975,
and was chalC'acterized by an attempt to corri!ct the most serious economic
distortions introduced durin~ the ~llende re~ime. Durin~ this phase 3 ~radual
anti-inflationary policy was implemented, and inflat.ion declined only
sli~htly. Output experienced a very ~ild recovery, and the first steps of
some of thf~ liberalization reforms were delineated. 'P.t.,rhaps the most import-I
ant characf:ertstic of this period is that the process of priv·atization o.f
hanks and ·public enterprise& -- some of them previously nati~cmalized during ,. t
the Allende regime -- began, Partially as a J:"esult of this t,rivatization
process some very big conglomerates (the so-called "grupos'') emerged, which
played a·n :lmportant role in the ma\in events that took place du:r.i_ng the first
ten years of the military regime.
The se.cond phase run& from April 1975 until early 1978, and corresponds
to the~ first serious effort to curb infl:tLtion. This was attempted by follow-
in~ an orthotlox closed acononay stabilization program. based on tight nlonetary
policy·, and 011 the elimination of the f1Lseal rlefici t. Ouring this time the
free-market ch•1racter of the military program was accentuated, and important
steps t;.:owards r~!fornairtg a1t1d liberalizing the domestic financial sector and
international tr11de were 11.mplemented. It was during this phase that the group
of economists popularly known as the "Chica~o boys" began to gain great
influence, and, in fact, t<> fully run the economic policy. Many of these
economis~~s had beet.\ trained at the University of Chicago, and other U.S.
universit'ies, and had a strt>ng ideological stance against any kind of
governmen~': intervent'.ion in t·he deve~lopment process.

t·
3
Tht~ early part of this phase s:;aw a dramatic reduction of output -- 12.9%
decline in GDP in 197 5 and a steep increase il1L unemployment. This phase
was also characterized by a marked deterioration in the international environ-
ment. In 1975 real copper prices fell to their l•owest level in two decades,
inducing a resource loss to the economy equivalent: to about 10 percent of GOP.
Mditional resources, equivalent to 2.5 percent of GDP were used to service
the debt. Over and above this, oil prices int~reas~ed, introducing further
constraints on the alreGdy weak economic structure ..
The thit•d phase goes from early 197~ through t'.he first half of 1981, and
is ch~racteri:?:ed by a marked change in emphasis in the stabilization program ..
Ouri.n~ the initial phases of the reform the anti-1.n17lation program was based on
orthodox monetary principles. The emphasis was placed almost exclusively on
controlling the eate of growth of rnoney and the fiSCi!l defici.t. In early 1978,
with the rate of inflation still standing at RO% per annW'Il, a drastic change :f.n
the monetarist approach took place. At this time thE! policyntakets be~an to
emphasize the fact that Chile had becoma an open economy, and the mt\nipulation
of the exchange rat~ replaced· the control of the quantity of money as the main
stabilization tool. In January 1978 Chile introduced the· preannouncement of
the rate of devaluation (the so-called "tablita") as the main anti-inflation
measure. This novel approach to stabilization was later adopted by Argentina
and Uruguay. In 1979 the policy of preannouncing the rate of devaluation was
replaced by a fixed exchange rate. It was expected that this move would help
to finally eliminate inflation.
This phase corresponds to the days of the "miracle" -- or the "boom" as
the Chileans referred to these few years. Output grew at fast rates, the
availability of imported goods increased drastically and inflation -- Chile's
almost eternal malaise -- finally subsided, reachinR 9 percent in 1981.

4
Unemployment, however, stubbornly rena~ined at high levels, constituting one of ·
the unresolved puzzles of the military regime.
A number of important reforms were implemented during this phase,
including the enactment of the labor law, which ~o~ other things legally
established a mechanism of 100% wage indexation with respect to past infla
tion. Also, the financial reform was pushed further, by relaxin~ a l!eries of
controls on capital inflows •
.\nother important, and puzzling aspect of this phase relates to the
behavior of two key prices -- the real interest rate and the real exchange
rate. Whereas the first remained at extraordinarily high levels during ~ost
of the period, the real exchange rate experienced a steady real appreciation,
g:reatly harming the degt<ee of competitiveness of the domestic sector,
includin~ nonotraditional ex~orts.
Finally, the fourth phase begins in late 1981 and is characterized by the
collapse of the "miracle". lJy late 1981 it became aoparent that the high rates
of growth experienced during the previQ.us year~ were coming to an end. The
fourth quarter of 1981 was chara~terize~ by extraordinarily ~igh real interest
rates; by a huge current account deficit; rising unemployment; and a reduction
of real GDP of 3.3% with respect to the fourth quarter of 1980. On the
positive side, inflation was only 9% that year. In 1982 the economic situation
worsened and becaMe almost chaotic. GOP declined by 14.3~; in September of
that year open ur.Lentployment (excluding the emer~ency eraployaaent programs)
reached 23.7%; the exchange rate was devalued by al~ost 100%; 3 major financial
crisis developed; and there were serious .problems to service the foreign debt.
Table 1 St111111larizes the major accomplish11ents in ter'118 of policy goals;
the eli11ination of the fiscal deficit and control of inflation and reduction
o1! tariffs., The sa• table show the unfa~'orable evolution of the teru of
5
trade that had a large drop in 1975, with no signs of recovery, and a second
fall in 1981. Coluran (6) shows the evolution of the real exchange rate, which
indicates the de~ree of competitiveness of Chilean exports in the world
markets. The evolution of GDP, shown in column (5), and the low overall rate
of growth of the economy for the entire period, have to be looked at in the
context of the interrelation between policy cha~nges, external shocks and
macroeconomic management (see S. Edwards and A. Cox Edwards (1986)).
The mar~ets liberalization process induced si~nificant price changes to
which sectoral allocation of productive resources had to respond. This would
induce at least a short run increase in the rate of •Jnemplcyrllent, mainly
because frictional unem~loym~nt would rise. Moreover, if labor is considered
a quasi-fixed factor in the short run (Oi, 1962), the firm or industry speci-
fie attributes of human capital would experience p!"ice chc&n~es, resulting in
incipient changes in relative wages. The reallocation of productive capital
required investment, in fact, the increase in demanrl for funds contributed to
a high. real interest rate in the Chilean capital market during the 1974-79
period. Thus, duri~ lftajor economic reforms like the one experienced in
Chile, both a lar~e degree of wage flexibility and access to additional
sources of investment funds (for physical or human capital ~ccumulation) w·ould
facilitate the reallocation of productive resources. The challenge here is to
carefully balance the needs of foreign funds for investment in the new export
oriented sectors, and at the same time avoid a~ exchange rate app~eciation
above long run sustainable levels, that would induce ~n incorrect allocation
of the same funds (see s. Edwards (1984)).
This paper analyzes the relationships between these overall changes and
the labor market performance. In the Chilean case, we will see, unemployment
became a serious and persistent probl~ from the early years of the refo~.

6
TA.BLE 1
The Chilean Economy: 1973-1983
(Selected Indicators)
External Real Inflation Fiscal Average Terms E'lCchange Rate of
Rate Deficit Tariff (%) of Trade Rate Growth Year ( Dec.-Dec ·.l. (1o GOP) (June) (1973~el00) (1975•100) (~ GDP) (!) ( 2) ( 3) (4) (5) (6) (7)
1973 605.9 24.6 94.11 100.0 42.1 -5.6
1974 639.2 10.5 67.0 105.7 74.4 1.0
1975 343 .• 2 2 .. 6 52.0 70e3 100.0 -12.9
1976 197.9 2.3 33.0 75.7 93.2 3.5
1977 84.2 l.q 22.4 67.8 85.2 9.9
1978 37.2 .9 13:.9 67.7 107.2 8.2
1979 38.0 -1.7 10.0 72.2 111.7 8.3
1980 31.2 -3.1 10.0 69.2 99.8 7.5
19Rl 9.5 -1.7 10.0 55 .. 9 80.4 5.3
1982 20.7 2.3 10.0 50.4 83.6 -1·4.1
lq83 23.1 3.8 20.0 53.1 102.9 -0.7
Source: Column (2) Cortazar and Marshall (1980) and Banco Central de Chile, Columns (3), (4) and (7) Banco Central de Chile. Column (6) Edwards and Ng (1975). Column (5) is defined as ratio of exports to imports priceA and was obtained from the U.N. Econo~ic Commission for Latin America.
7
Already in late 1974 the rate of unemployment began to experience a ~~teep ·
increase and tn Septe111ber of that year it reached 9.4% in the greate1r Santiago
area, gignifica~tly bi~ber than the 5.9% average of the 1960s. But ilt was at
the same time understood that the stabilization effort -- with the ir.ttroduc
tion of fiscal discipline and the enhanced degree of competition across the
economy would result in a change in hiring and personal management
pr11ctices, with a on.ce-and-for-all number of layoffs associated to "redundant"
labor. This was particularly true after the Allende ?eriod, because public
sector hiring policies at the central ~overnment level and in the publicly
controlled enterprises had been very loose.
At this time the go·vernment basically saw the increase in unemployment as
a temporary problem, and consequently decided to tackle it with temporary
measures. But time passed and unemployment did not decline to historical
levels (see Table 2).
This paper analyzes in detail the behavior of employment, unemployment
and wages during the 1974-83 perio~. Not surprisiq~ly, the high and persist
ent rates of unemployment cannot be attributed to a sole cause. Our analysis
indicates that unemployment was basically the result of four interrelated
factors. First, the slow average rate of growth of economic activity between
1974 and 1981 resulted in a sluggish rate of increase of employment creation.
Second, the reducti.on in government employment had a nirect negative impact on
emplo~ent growth. Third, during this period there was an important increase
in the labor force·or total supply of labor. And fourth-- and more important
for explaining the persistence of unemployment, the existence of a number of
rigidities precluded a smoother adjustment of the labor market to a number of
shocks, including the structural reforms. In fact, in the absence of these
rigidities the first three factors -- slowdown in rate of jobs creation,

TABLE 2
Unemployment and Wages in Chile: 1970-1983
Minimum El'ltploynaent
Total Open Prograna as Index of Total Unemploy- Unemploy- ~ of Labor Index of Real GOP
Yeatj .1!.!!2r Foree ment ment rate Foree Real Wases Per Caeita
(Thousands) (Thousands) (%) (%) (1970•100) (1970•100) (1) ( 2) (3) (4) ( 5) (6)
1970 2,923.2 167.1 5.7 100 100 . 1971 2,968.8 112.8 3 .. 8 125.4 107.,3
1972 3,000.8 93.0 3.1 121+ .o 104.0
1973 3,037.0 145.8 4.R 86.0 96.7
1974 3,066.8 282.1 9.2 90.2 99.3
1975 3,152.9 425.6 13.5 1.3 8897 82.1
1976 3,216.4 511.4 15.9 5.2 86.3 83.8
1977 3,259.7 1+62.9 14.2 5.7 96.6 90.,5
1978 3,370.1 478.6 ·14.2 4.4 97.5 96.0
19'79 3,480.7 480.3 . 13.8 3.7 98.7 102.3
1980 3,539.8 417.7 ll.CJ 5.3 108.3 108.3
1981 3,669.3 400.0 10.9 4.7 115.7 112.6
1982 3,729.7 760.9 20.4 5.1 112.2 95.0
1983 3,797.5 . 706.3 18.6 10.3 n.a. 92.7
Notes: 'lbe Minimum Employment Pro~raa was .a temporary palliative systena created by the government in 197~ ~o alleviate the unemployment problem. See Section 6.1 for naore details on this program.
Sources: The labor force a~d unemployment figures (Columns (1), (2) and (3) refer to June of each year and were eatimated by Castaneda (1983). Column (4) is based on Banco Central (1983) PP• 212-13. ColUIIII'l (5) was constructed using National Accounts data. (See Edwards 1984, p. 85 for further details.) Column (6) is based on Banco Central.
9
reduction in government .1obs, and faster growth in the labor force - could
not ex~lain the persistence in the rate of unemployment; in a perfectly
flexible te~tbook type labor lllarket, higher supply and lower demand. of labor
would reduce wages but not ~enerate unemployaent.
The paper is organi~ed in the following fo~: in Section 2 we discuss the
traditional role that government had in Chile's labor market, and we briefly
describe the segmented structure of the Chilean labor 111arke~. In Section 3 we
deal with some aspacts related to the supply of labor, and the rate of
participation of the labor force. In S~ction 4 we analyze the behavior of
employment, focusing on the relation between economic activity and aggr~~ate
employment creation. tn this section we also look in detail at sectoral
employment, emphasizing the decline of the public sectoc as a source of jobs
creation.. Section 5 is devoted .to the analysis of wages anri indexation. Here
we further discuss t~.40 important pieces of legislation: the Labor Law of 1979
anrl the Social Security Law of 1980. In Section 6 we provide an at~alytical
interpretation for the persistence of unemployment. Our analysis here is based
on a model of segmented labor !llarkets and emphasizes the role of rigidities.
2. Government Intervention and Labor Market Structure
Government Intervention
The Chilean labor market has been characterized by an old tradition of
government intervention in labor relations. Even during the military rule,
and in spite of tbe major institutional. market-oriented reforms, government
involvament in the labor market was to soqe extent·maintained.
·aistori~ally, the influence of the government has been present at
different levels. First, public sector wa~es have had an important impact on
all wa~;es and salaries across the economy. Second; through labor legislation,
(\
10
the ~overnment has ·imposed generalized minimt.D wages, across-the-board wage
adjustments, and mandatory fringe benefits and bonuses that: have to be paid by
the private sec:t:or. Third, b.igh social security taxes have increased the
relative cost of labor in the economy. And fourth, the government also
intervened in the labor market directly through its hiring :policies and
indire~:t:ly through the sectoral biases induced by the economic: policies.
Titroughout the years, for exam~le, the import substitution policies induced
massive transfer.s of workers to the cities, some of whi~h were absorbed by the
new industries or by the public sector; the less fortunate, however, engrossed
the ranks of the urban unemployed.
Traditionally the government: also played an important· role in settling
labor disputes. Until 1973, unions were allowed to organize across firms in a
given indu.stry, and to negotiate wages at the industry level, thus exercising
considerable monopolistic: power. Consequently, in order to protect the
"public interest", government intervention was most of the times called for in
cases of collective bargaining settlements.
As a result of this system of government intervention serious distortions
emerged towards the late 1960s and early 1970s. 'or example, some industries,
which were highly proteeted from competition thxough import tariffs, export
drawbacks, subsidies or tax exemptions, were able to accede to worker6'
demands by increasing wages considerably above productivity gains. Al~~:
unions were able to keep employment beluw competitive levels, inducing a bias
towards the use of capital intensive tec:hniques. 2 In short, the un~onized
sector worked under noncompetitive conditions, most of them supported by the
e'Jtisting labor legislation. Government intervention in the labor market
reached unprecedented proportions during the Unidad Popular period. Betw.en
1970 a•f.iT,d 1972, public: sector employment grew at an average rate of 11.4% per
11
year.3 This, in fact, is.one of the reasons why, during the Unidad Popular
government, in spite of the massive distortions prevailing in the labor
market, t.he rat~ of unemployment dropped significantly~4
After the military coup, from 1974 to mid-1979, union power was greatly
reduced, with strikes being prohibitE!d and with a,ll activities related to
unionism being greatly curtailed. Some important steps t~wards reforming the
labor market were taken, like the reduction of social security taxes, the re
moval of the ley cle· inamovili~ which had made termination of labor contracts
very expensive for employers, and the reform of the legisl~tion regulating
collective bargaining. Unfortunately, however, the backward wage indexation
mechanism applied by the government since 1974, and a minimum wage that in
creased in real terms between 1974 and 1978, became increasingly more
distortive.s
In 1975, and as a way to provide a temporary solution to the unemployment
pro~lem the government created the so-called Minimum Employment Program (PEM},
where unemployed performed, for a reduced number of hours a week and for a
very low salary, some menial public works, like raking leaves in public parks.
At first the government imposed severe restrictions to entry into the program.
Slowly through time most of these restrictions were lifted,6 permi~ting a
larger number of unemployed to participate in it. In Table 2 we present data
on the number of people enrolled in this program. As may be seen, in spite of
the recovery and "boom" between 1976 and 1981 and of the reduction through
time in the real compensation offered relative to real wages in the rest of
the economy, the proportion of the labor force covered by the program remained
virtually constant. This was because, as mentioned, with time more and more
people became eligible. Additional measures to deal with unemployment
include: a. total reform of the unemployment insurance program increasing
12
protection to manual workers against losses of income due to unemployment; a
wage subsidy program adopted in 1975 whi~h was a stimulus to unskilled employ
ment; and a spec~al training program implemented in early 1977 under which
. p~ivate employers were eligibl~ for inco111e tax credits for the cost of
providing special training to their workers.
In 1q79 a new labor law was enacted which gave unions a greatly reduced
role in the process of wage determination. ~is law, which established a
complex bargaining mechanism, departed significantly from the traditional
legislation; union affiliation within a firm became voluntary and all net~tot:ia
tions now t«>uld have to be conducted at the firm level; with multifirm
bargaining being eliminated. The new law contemplated that in the event of a
strike, a firm could impose a lockout and temporarily lay off workers.7
Possibly, however, the most significant innovation, in terms ·of its immediate
impact, was the introduction of a backward indexation clause into collective
bargaining. {In Section 5 we discuss some of the more interesting aspects of
this law.)
Labor Market Structure and Segmentation
Historically the pervasi.ve government intervention in the labor market
plus the existence of powerful unions resulted in the emergence of a segmented
structure of the Chilean labor market, which maintained its relative t.port•
artce during the military rule. Traditionally, as in many developinR count
ries, it has been ·possible to distinguish at least two segments in Chile's
labor urket. '11\e first is the protected sector where due t;., a n\Dber of
institutional reasons, including the existence of labor unions and large
multinational fir.s, wages are set exogenouely above their market clearing
level. 'lbe second sector. is the unprotectad or .!!:!!. sepent where wages are
set coapetitively.B As we show in ·Section 5 below, the existence of eapirical
'lf;

11
evidence sup~orts the hypothesis of labor market segmentation in Chile even
for the years of the military rule. tn fact, cNr explanation of Chile's
unemployment "puzl~" provided below relies qu:f.te heavily on the existence of
such a segmented structure for the labor market. tn applying this model to
Chile it is useful to think that the se~mented structure of differentiated
wages was first (prior to 1973) imposed by uni,ons and large firm$, and was
later perpetuated by the mechanism of across-the-board backward indexation.
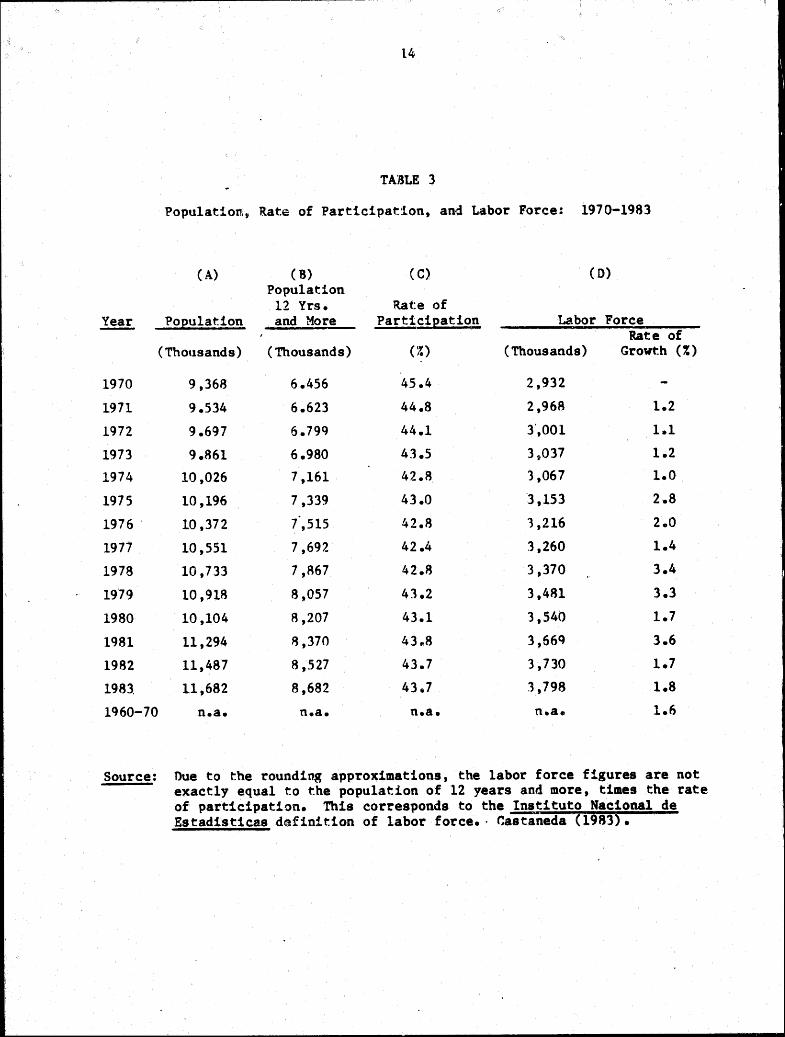
1. l?opulation and Labor Force Participati!>ll
In Table 1 we present some data related fto the behavior of the supply of
labor duri~ the period. The table includes 'information on population, the
rate of participation, and the labor foreee As can be seen, during 1973-83
the labor force grew at 3% per annum, a pace significantly faster than in the
1960s (1.6% per year). ntis faster growth it!l the labor force was the result
of both demo~raphic factors-- a fairly high rate of growth of·the population
of 12 years and older - and of a failure of~ the rate of participation to
continue to decline at the pace it had durinK the 1960s (see column (C)).
This higher rate of growth of the labor force, combined with a lower rate
of growth in the level of economic activity and therefore in ag~regate labor
deaand, for the 1973-83 period, contributed to the creation of a situation of
excess labor supply. Por example, the difference in the average rate of
growth of the labor force between 1960-70 and 1973-83 explains an annual
average increase in the unemployment rate of ~ne half of a point, while the
difference in the rate of growth in employ.ent between the two decades
explains an annual avera«e increase in the unemployment rate of almost one
point. 9
14
TAlaLE 3
Populationt,, Rate of Participat:ton, and L;abor Force: 1970-1983
(A) (B) (C) (D) Population
12 Yrs. Rat:e of ~ Poeulation and More Particieatio!!. Labor Force
Rate of (Thousands) (Thousands) ( ~t) (Thousands) Growt:h (%)
1970 9,368 6.456 45.4 2,932
1971 9.534 6.623 44.8 2,968 1.2
1972 9.697 6.79q 44.1 3',001 1al
1973 9.861 6.980 43.5 3,037 1.2
1974 10,026 7,161 42.8 3,067 1.0
1975 10,196 7,339 43.0 '3 ,153 2.8
1976 10,372 i,515 42.8 1,216 2.0
1977 10,551 7,692 42.4 3,260 1.4
1978 10,733 7,867 42.8 3,370 3.4
1979 10,918 8,057 43.2 3,481 3.3
1980 10,104 8,207 43.1 3,540 1.7
1981 11,294 ~,370 43,8 3,66Q 3.6
1982 11,487 8,527 43.7 3,730 1.7
1983. 11,682 8,682 43.7 1,798 1.8
1960-70 n.a. n.a. n.a. n.a. 1.6
Source: Due to the rounding approximations, the labor force figures are not exactly equal to the population of 12 years and more, times the rate of participation. This corresponds to the Instituto Nacional de Estadisticas definition of labor force.· Castaneda (1983).
15
4. The Behavior of Employment
During the first ten years of the military rule emplHlyment grew on
average at a ra~e significantly lower than the average of the 1960s. In fact,
for 1973-83 the average rate of growth of employtl\ent was 1only 0. 7 percent per
year, less than half of the 1960-70 average of l.R%. HOWII!Ver, the evolution
of employment during the di.fferent phases of th.e military regime was not
homogeneous, llor was the distribution of eu1ployment chang1,es across sectors.
~omic Growth and Employment
In order to fully understand the evolution of emplo·~rment it is useful to
first investigate the inter~lct:ton between the levels of economic activ1.ty and
employment. An interesting· pattern is obtained from the estimates of the
ratios between the rates of growth in em~loyment and the rates of growth in
output. These ex-pos-t average elasticities reflect the actual chang1a in
employment associated to a one percent increase in aggregate output over a
gi,,en time period. Table 4 presents data on these elasticities and on the
average annual rates of growth of the labor force, employment, and aggregate
output. As can be seen the ex-post elasticities for the 1960s and for 1973-83
ax·e somewhat similar (0.43 and 0.54), suggesting that the bulk of the e1tplana
tion for the r.eduction in the pace of increase in labor demand lays on the
s1Lowdown of the level of economic activity for the overall period.
But as we discussed earlier, the 1970-83 period was marked by big
Ctlntrasts. From 1970 to 1973, the economy experienced a slow average gro~rth
while employment kept growing at almost the sam~ pace of the preceding deccJ.de
(tJee Table 4). The estimated employment-output elasticity is 3 .o for this
ptariod, reflecting an extraordinary creation of jobs within the public sectt>r
and in the economy as a whole. Between 1973 and 1976, on the other hand, the
economy showed a severe contraction and so did the employment level. From

16
TI~BLE 4
Chile: Labor Market Indicators
(Average 'Rates of G1rovth For Each Period)
Period Labor Porce .Emelo!!ent ., '< 1) (2) (1)
1960-1970 1.6 1.8
1970-1973 1.2 1.5
1973-1976 1.9 -2.2
1976-1981 2.7 1.9
1981-1983 1A!1 -2.8
1973-1983 2.3 Oo7
Source: (2),(1), calculated froa Castaneda (1983). (4), Barlco Central (1984).
GDP (4)
4.2
o.s
-3.1
7.9
-7.6
1.3
Elasticity ~3~l~4l
(5)
.43
3.00
.71
.49
.36
.54

17
1976 to 1981 the level of eeonond.c activity recovered at a fast pace and
finally between lq81 and 1q83 there was another, even ~ore severe recession.
It is inter~sting to note the difference in the relation between output
decline and employment reduction between these two recessions. A 1~ decline
in output between 1973 and 1976 'ila& associated with a 0.71% decline in
4nployment, while the same change in output between 19~1 and 1983 wa~; only
associated with a 0.36~ decline in employment. This difference reflects the
presence of "redundant" employment by 1973, which was the result of the hiring
practices used throughout the lq7Q-73 period. Starting in 1974, and as a
consequence of the diffetent reforms implemented by the military, competition
forced employers to reduce costs and to change their hiring practices. During
the 1981-83 recession emplo~ent reduction was mainly a response to the
reduction in the level of production without the "redundant" labor force
element playing any role.
'rhe relatively faster rate of growth of labor supply coupled with· the
slowdown <)f the rate of increase in labor demand created a situation of excess
supply for labor. A crucial question at this point, however, is why didn't
real wages decline sufficiently to their new lower long run equilibrium as to
reduce (or even eliminate) the excess supply of labor? In fact, Table 2
indicates that average wages did experience an important reduction in 1973,
partly because aggregate wages had in~reased significantly, and above
productivity gains between 1970 and 1Q72. As we note in Section 6.4 the
explanation on why wages did not fall sufficiently lays i.n part on the role
played by across-the-board indexation.
Sectoral !!plof!ent
Table 5 contains data on changes in sectoral eaplo~ent for 1960 through
1982. Aa can be seen, between 1960 and 1970 there were about 45,000 jobs

18
TABLE 5
Employment By Sectors: 1960-1982
Annual Average Rat~ of Grovth8 and
Nu.ber of Jobs Created Par Period (Thocs~nds)
19()0-1970 1970-1973 1973-1976 1976-1981 1981-19~
Agriculture -1.3% -7.6% 1.3% 0.5% -11.7% (-87.5) (-127.7) (19.5) ( 11.6) (-59.6)
'F1shifll~ 3.8% 3.81. 7.1% 2.5% n.a. (5 .5) (2 .1) (-17.5) (3 .2) (n.a.)
Mining -0.5% 5.8~ -1.5% -2.4% -1.3% (-4.3) (16.4) (-4.6) ( -11.5) (-9.7)
Manufacturing 2.9% 3.5% -2.8% 2.6% ··32.2% (122.1) (52.8) ( -·45 .5) (67.4) (-166.1)
U'ti1itit!S 3.8% 9.9% -1.8% 5.8% -15.6% (11.6) (7.3) (-1.6) (9 .1) (-4.1)
Construction 7.6% -4.8% -14.8% 7.7% -52.9% (59.5) (-26,1) ( -1)2.4) (45.4) (-90.0)
Col'lftlerce 4.2% 3.0% -·1.5% 7.7% -23.1% (53.2) (36.6) (-1.6.7) (158.6) (-143.7)
Transportation and 1.7% 3.5% ·-2 .9% 4.7% -20.6% Communication• (61.6) (17.1) (-17.0) (47.4) (-45.1)
'Financial Services 3.5% 2.1% :J.l% 2.6% -13.3% (15.3) (3.4) (5.4) (8.3) (-15.6)
Other Service• 3.2% 5.8% 01.4% 2.5% 19.2% ( 212 .1) (143.2) ( 10. 5) (122.1) ( 168 .7)
Total 1.8% 1.5% -1.3% 3.1% -11.6% (449.1) (125.1) (--107.9) (461.6) (-365.2)
Source: Banco Central (1983).
8 Pigurea for rate• of growth correspond to annual avera~••·

19
creat:ed per year on average. About half of those jobs were created in
services and one fourth in the industrial sector, while the agricultural
sector showed a ~eduction of about 9,000 jobs per year (or 1.3% per annum).
As a result of this trend; the economy ~-• concentrating employment in the
nontradables sector, with construction growing at the fastest rate (7~6% per
year) and transportation growing very slowly relative to the other nontrad
ables (1.7% per year). Within the tradables sector ~mployment was declining
in agriculture and growing in the manufacturing sector; however, the overall
tradable& sector share in employment was falling.
Ouring the Unidad Popular ~overnment (1970-73) there were a~ain about
45 !000 new jobs per year, but this time the growth in employ"111ent in services
accelerated to ~.R% per year from 3.2~ per year between 1960 and 1970. This
higher employment in services corresponded, almost exclusively, to hi~her
government employment. Moreover, the number of jobs created in services was
larger than the absolute change in employment for the economy. This occurred
because the reduction in the number of jobs in the agri~ultural sector more
than offset the employment creation in the other sectors. Throughout this
period aaplo}'llent in agriculture declined at 7.6% per year. 'nlis not only
affected the sectoral allocation of labor, but also the geographical alloca
tion of the labor force.
During 1973-76, and in part due to the shock stabilization program,
employment experienced a major dip. The governaent's major effort to reduce
the size of the public sector was translated in a reduction of around 100,000
central government eaployee•• In fact, the governaent's com.itment to reduce
the public sector's size continued steadily through the military regime and in
1982 there were only 130,000 government employe .. compared to 196,000 in 1960
and 308,000 in 1973.
20
During the late 1970s there was an important change in the pattern of
employment growth. Employment in agriculture stopped declining, mainly as a
result of the improvement in the relativs prices of agricultural products,
until at least mid-1979. Migration flows out of the agricultural sector,
which had been around 11,000 per year between 1965 and 1970 were reduced in
half to 5,500 per year between 1975 and 1981.1° In the tradab1es sector,
employment grew relatively fast, in spite of the slowdown of employment growth
in manufacturing. While in tha 1960s, 7.7~ of the new jobs were created in
the tradables sector, between 1976 and 1981 that percentage was 12.8~ The
relatively slow rate of ~rowth of employment in manufacturing was partially
the result of the international trade reform, because most firms adjusted to
the increased degree of forei~n competition generated by the opening up of the
economy by reducing their wage bills and by greatly increasing the lev·el of
productivity. .Also, about half oi the jobs created during this period were
concentrated in "commerce" and the "transportation and communications" sector.
The construc?.ion sector, on the other hand, showed a signi.ficanr. recovery
towards the end of this period, but in tems of eaployment, the rate of growth
was just comparable to the historical rates of the 1960s, and the 1rtwaber of
jobs created between 1976 and 1981 did not offset the employment r~tduction of
the lq70-73 period. However, productivity in construction, as in 11\0st other
sectors, increased quite dra•atically.
Tariff Reftorm and Employeent
There is little doubt that'as a result of the tariff reform a number of
contracting, and even disappearing naanufacturing firms laid off la1r-ge nwabers
of workers. On the other hand, expanding firm• froa the exporting sectors
increased e~~loyMnt, part~· ~lly offsettiq the negative effect.

21
There were three main ways in which the tariff liberalization generated
short-run unemployment. First, there was a natural adjustment period where
laid off workers took time to start searching for work in a different, expand
ing, sector. Second, the fact that in reality -- contrary to the simplest
textbook case -- physical capital is fixed in its sector of origin made the
expansion of production in a number of the exporting sectors somewhat sluggish
at first. Only as additional investment took place through time was it
possible to fully increase production and employment in these expanding
sectors. And third, the existence of a minimum wage in real terms made the
absorption of labor by the expanding industries more difficult. The reason
for this is that, in an eco.nomy where imports are capital intensive as in
Chile, to the extent that capital is sector specific in the short run, a
. tariff reduction will require a short run reduction in the rea.:! wage of low
skill labor in order to maintain the level of employment. If this reduction
is precluded by a minimum wag~ unemployment will result.
The proportion of total une~~ploymen.t that can be attributed to the tarj.ff
refom is, howe·~er, relatively small when compared to the ugnitude of the
overall une.ployaent problem. Edwards (1982), for example, calculated that an
upper bound for the unemployment effects of the trade reform was 3.5 percent
age points of the labor force, or.129,000 people, with the bulk of this
uneaploy.ent located in the food, beverages, tobacco, textiles and leather
products subsectors (57 ,O~JO people). More recently, de la Cuadra and Hachette
( 1986) have calculated that the trade ref om\ generated a reduction of employ
.. nt in the manufacturing sector of approximately SQ,OOO workers. Even though
the•• are not negliJ~ible nwabers, they clearly indicate that an explanation
for the bulk of the unemployment should be sought elsewhere.
22
5 Wages and Indexation
Aggre~ate real wages declined significantly durin~ the initial yearg of
the milita1~ rule, from 1976 onward average real wages increased steadily
until in 191~1 they stood 16% above their 1970 level (see Table 2). In this
section we analyze the behavior of w·a~es, placin~ particular emphasis on thf~
roles of indexation and le~ally established minimum wages.
Wage Indexation
Starting i.n October of 1974, and tlntil 1982, the ·military government
mandated periodi.c across-the-board nominal wage increases of ma.~nitudes
somewhat related to past :l.nflation. 'l'hese adjustments represented the minimum
increase in wages that eve~ry em~loyer had to pay to their employees. Initial
ly, this wage indexation mechaniSI!l was quite flexible, as the magnitudes of
the required nominal wage adjustments were not e~actly linked to the level of
past inflation. In fact, as shown in Table 6, in many instances the mandated
wage ad.1 ustment differe..n markedly from the accumulated past inflation. In the
later years, how2ver, the indexation rule came close to a 100% indexation
rule, as the legally required increases in wa~es were almost exactly equal to
past inflation. This downwa\r<i rigidity in real wages was in some sense
institutionalized with the implementation o1f the Labor Law of 1979.1
1
In October 1974 it wa.s established that for the rest of 1974 and for 1975
there would be quarterly adjustment of nominal wages by (at least) the full
amount of the change in the CPI during the second, thiri and fourth months
prior to the ad1ustment. By late 1975 and as part of the renewed efforts to
reduce inflation, a new wage adjustment: formula was enacted. 'Beginning with
September 1975 the nomirtal wage increa.se was based in the S\D'Il of the inflation
rates of the three months ending in the month of adjust~ent. Since at the
time the wage rate adjustment was def!reed, the last month's inflation was not

C;
23
TABLE 6
Wage Indexation: 1974-1980
(1) (2) (3} End of Period
Accumulated Inflation * Mandated Nominal Wage1 Period (Percent) Increase (Percent
10/1/73 - 1/1/74 107.7 5o.oa,c
1/1/74 - 5/1/74 87.1 61.1a
5/1/75 - 7/1/74 31.3 34.5
7/1/75 - 10/1/74 39.5 24.1
10/1/7, - 12/1/74 30 .• 4 35.2
12/1/75 - 3/1/75 41.4 33.1
3/1/75 - 7/1/75 103.2 71.0
7/1/75 - 9/1/75 19.0 24.0
9/1/75 - 12/1/75 28.1 28.0
12/1/75 - 3/1/76 30.2 32.0
3/l/76 - 7/1/76 56.8 39.0
7/1/76 - 9/1/76 14.8 26.0
9/1/76 - 12/1/76 lq.z 18.0
12/1/76 - 3/1/77 17.8 19.0
3/1/77 - 7/1/77 19.2 18.0
7/1/77 - 1.2/1/77 18.7 18.0
12/1/77 - 3/1/78 7.5 8.0
3/1/78 - 7/1/78 10.0 10.0
7/1/78 - 12/1/78 11.9 12.0
12/1/78 - 3/1/79 5.15 6.0
3/1/79 - 7/1/79 10.8 11.0
7 /l/79 - 12/1/79 18~0 18.0
12/1/79 - 4/1/80 9.4 8.0
4/1/80 - 10/1/80 13.9 t4.ob
10/1/80 - 8/1/81 14.3 14.ob
8/1/81 - 7/1/83 37.1 5.ob,d
7/1/83 - 1/1/84 11.8 15.ob

24
Table 6 (continued)
8 Corresponds to increase in minimum wage •
. bNot binding for· work.ers subject to collective bargaining.
cBetween October of 1'~73 and January of 1974 two bonuses were paid. Their nominal value was eq,ual to the April 1973 taxable salary.
dThe 23.4~ loss in real income was partially offset by four bonuses of 30%, 15%, 15% and 15% of current wages paid in September, October, November and December of 19&3.
(*) Corresponds to the official CPt
Source: Banco Central (1985) and A. edwards (19~5).
25
known, it was esti~ated at one-half the preceding month rate, with any short
fall he!ng made up at the time of the next quarterly adjustment. The new
formula shorten~ the lag of wage adjustments, offering greater protection
against subsequent price increases, but its immediate impact was a substantial
reduction of the real increment being mandated.
Wage policy in lq76 remained essentially unchanged from that of the
previous year. But, as a consequence of the deceleration of the rate of
inflation, real wage and salaries started to increase. tn view of the declin
ing inflation rate, the government decided to lengthen gradually the intervals
between wage adjustments. Between March of 1978 and late 1q79 wages were
adjusted only thre times ·each year; in March, July and December. During 1980
there were only two official wage increases; in April and October. In August
of 1981, when annualized domestic inflation had reached on~ digit rates, a
nomi.nal wage adjust:ment of 14% was mandated. However, this wage increase, as
well as those decreed in 1980; excluded those workers s~bject to collective·
bargaining, since their wages' 100% backward indexation was explicitly
specified in the new 'ttabor Law governing unions behavior.
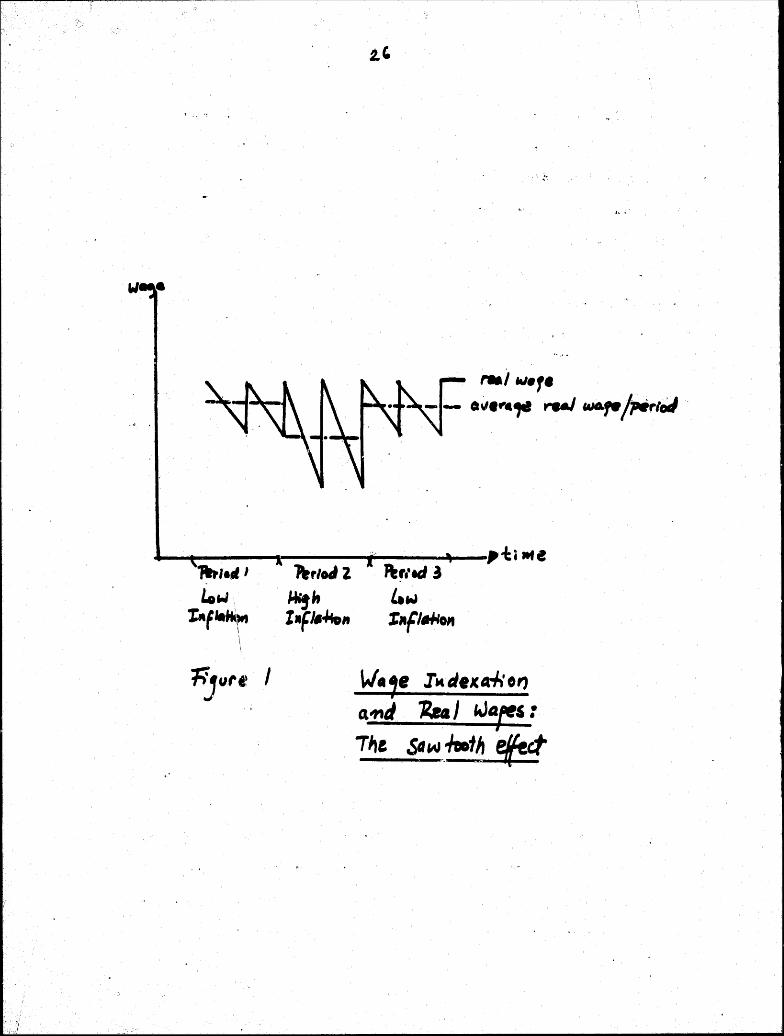
In principle th~ 100% indexation formula applied by the government could
result in increasing or declining real wages, depending on the dynamics of the
inflation rate. Under declining inflation (increasing) a 100% indexation
formula results in increasing (declining) average real wages. This has been
called the sawtooth effect and is described in Figure 1, where it is assumed
that there are three inflationary periods with nominal wages constant at 100
and two wage readjustments per period. These wage readjustments reestablish
the real wage to its initial level, but the average real wage for the period
depends on the real wage deterioration due to inflation throughout the periode
~ ' . '~
w •
,..., w.,. -- •~•"•1" reaJ~MAr-/,.rtOtl ·
..._......, __ _,., ___ ....... __ ~_,-t:; ... "f'tletf I
L.w .. t..F,. .. rs
\ \ w.,. IMdeJCa-+;o,
4111d ~} IJGf!S : •
7~£ Slw-htoth ef{ec:t
·.
27.
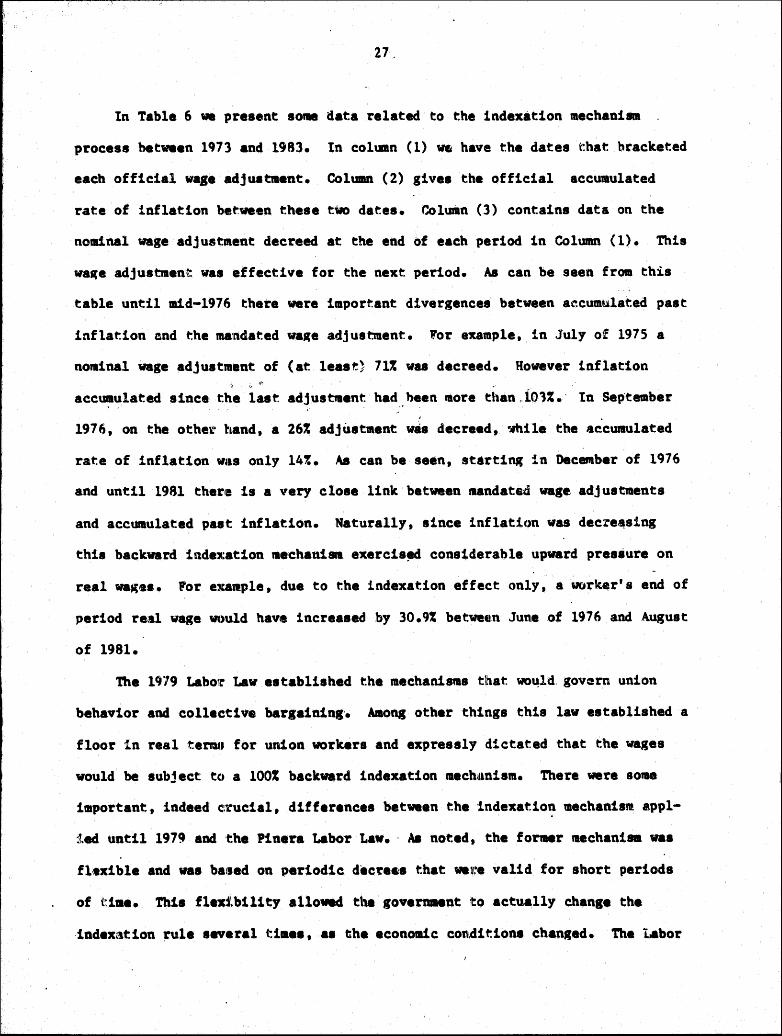
In Table 6 wa present some data related to the indexation mechaniaa
process between 1973 and 1983. In column (1) ~ have the dates that bracketed
each official wage adjuat.ent. Column (2) gives the official accumulated
rate of inflation between these tWo dates. Column (3) contains data on the
nominal wage adjustment decreed at the end of each period in Column (1). This
wa~e adjustment was effective for the next period. As can be seen from this
table until mid-1976 there were important divergences between aecumulated past
inflation and the ma1ttdated wa~e adjust:naent. 'or example, in July of 1975 a
no11inal wage adjustment of (at least} 71% was decreed. Howe·qer inflation
accw;aulated since th.e last adjusblent had been lllore than "i01%. · In Sep'tember .
1976, on the other hand, a 26% adjustment was decreed, ~i.le the aecU11ulated
rate of inflation ~as only 14%. As can be seen, starting in December of 1976
and until 1981 ther1e is a very close link between 11andated wage adjustments
and accUIIlulated past inflation. Naturally, since inflati•:,n was decre•sing
this backward indeJ:ation aechatti811 exercis~ constderable upward pressure on
real wag~••. For e1ca•ple, due to the indexation effect only, a worker's end of
period real wage W.)uld have increased by 30.9% betwet11n June of 1976 and August
of 1981.
The l<fj'9 Labo1~ Law established the mechani811s tl!\at wo~ld. govam union
behavior and colle~~tive bargaininl·· Aaong other things this law established a
floor in real t.eran for uniott workers and expressly dictated that the wages
would be subject tc• a 100% backward indexation mech11lnism. There were sorae
important, indeed c~rucial, differences between the 'indexation mechanism appl-
:~.ed until 197~ and the Pinera Labor Law. · AI noted,, the former 11ecbani• waa
fl,exible and waa ba11ed on periodic dec:rees that wan:e valid for short periods
of t:iae. This flexf. bi 11 ty allowel the govermaent ito actually chan1• the
indexation rule several tiaea, aa the econOIIlic col!tditions chanRed. The Labor
28
Law of 1979, on the contrary, was very ri~id. Its Article 26 established that
independently of the econo~c conditions, unionized workers nominal wages
should he adjus~ by at least past inflation. A-rticle 26 established: "The
employer's response [to the union requests] could not contain a proposal for
remunerations ••• lower, in currency of the saft~ purchasing power, as those
established in the previous work contract" [•!mphasis added]. This Article
then proceeded to establish that in order to co1Dpute the salary of t:he same
purchasing power, past inflation as co111puted by the National Inst.itute of
Statistics should be used. Most other provisions of the law -- including
those on salaries for firms ~~ere unions coul~ not ~trike -- established that
the mechanism of Article 26 was applicable to all workers. 12
Minimum Wages
In January of 1974 the existing minimum wages for blue and whi.te collar
workers were unified into & single rate, whose level was increased 50% above
the minimum pay established in the prev:Lous quarter. From that period until
1978 the minimum wage was periodically adjusted, increasing in real te~s.
Durin~ 1974-79 the minimum wa~e was re.lat,Lvely higher than during the previous
years, represent in~, on avera.~e, 54% ~of the wage rate for blue collar workers
in manufacturing. In March 1978 the minimum wage was incorporated into the
'Public Sector Wage scale and since t;hen f.t followed the same path as general
wage ad_justments.
Althoup;h there is little ttoubt that the minimum wage added sotaewhat to
the rigidities existing in the la.bor raar'ket, it is difficult to distinguish
its effects from the eff•!cts of the overall indexation mechnnin on the
generation and persistence of u·neaployment. One of the ways in which the
minimum wage played a role was by !D&king the adjustment following the tradt1
reform more difficult. A stw!y by Edwards (1980b) calculates that tbe
• 0 \
29
elimination of the mioimum wage would have resulted in an increase in
aggregate employment over the longer run of approximately SO,OOO jobs. Of
course, the minimllll wage directly affects labor demand at the lolW~er skills
levels. But to the extent that the minimum wages affect the det1!rmination of
other wages, the effects can escalate. 13
Taxes on Labor
In 1980 the social security system was reformed. This mean!: "lloving from
a traditional -- and basically bankrupt - pay-as-you-go system l:o a
capitalization system, where workers had their own individual re1tirement
accounts which were administ~red by privately owned coropanies. rraditionally
social security taxes had been very high, introducin~ important distortions in
the labor market. In 1974, for example, total taxes on blue collar workers,
as a proportion of net wa~es, amounted to 56.9~. 14
An important goal of the government, and a measure directed towards
reducin~ unemployment, was to reduce these taxes on labor. This was done
slowly through time. In 1977 the social security tax had been reduced to the
still extraordinary fi~ure of 48.3%, and hy 1979 it ~as 36.3%. The 1980
social security reform further reduced the tax on labor. ·Under the new
capitalization system, in 1981 the average tax had been reduced to 24.4%, and
in 1983 it was 20.8% on average.
6 The Unemplo,rment "Puzzle": ·A Suggested Interpretation
In the pr4!ceding sections we described the behavior of employment,
unemployment at~ wages during the first ten years of the military rule. We
haven't yet, however, attempted to provide an explanation for the persistent
and high rates of unemploymente
...
\\ '\
30
In this sect:lon we argue that the persis1tence of unemployment can be
explained once it is recognized that Chile's lahor market is characterized by
segmentation, ~hic~h greatly reduced flexibilf.ty anrl inhibited the economy to
adjust efficiently to various shocks. Furthe:rmore we show that this segmented
markets representation is able to explain the evolution of both employment,
unemployment and wages.
Se~mented Labor Markets
A number of studies ort labor 'llarkets i,n developing countries have taken
the segmented labor market demand 8tructure as a working hypothesis. Harris
and Todaro (lq7Q) and Harberger (1971) explain the persistence of une~ployment
by wa~~e differentials institutionally imposed in a protected segment of the
market.l5 Employed ~rorkers in the protected segment acquire rents, therefore
protected sector jobs are preferred to other jobs in the economy and this
genet~ates an excess supply of labor to the protected segment. Under general
assur11ptions, some labor force participants will stay unemployed rather than
taking a non-protected segment job.
In the Chilean case there is little doubt that until 1974 unions were the
main force behind labor segmentation. Those firms that had strong unions
traditionally pairl wages way abo~e the market wage. Although after the milit-
ary took over, unions' power was greatly reduced, the "unionized" sector
continued to pay reAl wages that exceeded the market level. The hypothesis
off:ered bere is that the across-the-board indexation mechanism introduced
important rigidities in the relative wage structures, allowing the persistance
of the wage differentials. In addition, at that time the newly emerging
lLE~ became another important element behind segmentation. In fact during
the period 1rupos acted in a way similar to that suggested by Rarberger (1971,
P• 162):
31
( P] rotectecl sector wages ••• can be held above the market clearing level by minimum wage laws, by collective bargaining agreements, or (as is often the case with large ••• concerns operating in lessdeveloped countries) by the policy of the hiring company itself. {emphasis added.]
In a 1980 survey that covered 12 large grupo related firms, Edwards
(1980a) found that these corporations indeed paid salaries that significantly
exceeded the wages they could have paitl for labor of equivalent skills.l6 Fo~
example, in 1977 when the open rate of unemployment was 12:t and the PEM program
covered 6% of the labor force, these firms paid on avtarage to their lowest
s~illed workers, 2.6 times above the minimum wage. This ratio was, on average,
2.1 in 1978 and it was 2.2 times in 1979. Additional support for the labor
market seg~entation hypothesis is provided by A. Erlwards (1984) who used a
15,000 observation data set to estimate earnin~ functions for different sectors
for 1974-80. Afte~ dividing the data set into three segments -- protected,
covered by the minimum wage and uncovered she found that the Mincer-type
earning functions across these segments were statistically different, providing
important support to the hypothesis of labor market segmentation.
Market Se Evidence for the Greater Santia o Area Labor Mar
These results are taken from A. Cox Edwards (1984) where the hypothesis
being analyzed was that segmentation is present due to institutional factors.
Therefore, the criterion to define the segments is based on factors like
unionization or minimum wage legislation.
A. Three Segments: A Selection Rule
The GSA labor ~rket can be characterized by three institutional
segMents. First, the "protected" segments includes the traditionally strongly
unionized sectors and the ones requiring relatively high amounts of specific
training. 'lbe hypothesis is that individual differences in firm-specific human
32
capital hehavior lead, via wage effects, to heterogeneity in mobility behavior,
and to "tenure effects" on attachment to the firm (see Mincer and Jovanovic
(1981), Stigli~ (1982) and 01 (1986). The study of earning equations for the
protected segment compared to the rest of the labor market should show us
higher wage levels or ~ents in the former ~e~ment for homogeneous workers.
These higher wages are not necessarily responding to llighe~ returns to educa
tion only or e~perience only. Returns to fi~specific human capital are
positively correlated with general human capital. Second, the ~e.gment covered
by the minimum wage law (~) includes the nonprotected segment that is within
the purview of the minimum ~age and all the legal restrictions applicable like
social security taxes, minimum legal wage readjustments, etc. 'Third, the
uncovered segm9nt is a free sector. According to Chilee.n law, throughout the
period in question, the wages of domestic servjlce employees .and trainees were
outside the purview of the MW law. Another exc~eption is the group of farm
~ot•kers that can be paid up to 35% of their salary in nonmonetary form.
The UCEUS (University of Chile, Employment and Unemployment Survey)
provides a two-digit classification of workers acco~ding to Economic Activity
with 39 subsectors. It also classifies workers into 8 alternative occupational
strata (eml)loyer, white collar worker, blue collar worker, unpaid family
worker, self-employed, domestic service worke~, armed forces, other). There is
also a classification according to occupation.
Using the occupational stratification, the following groups were left out:
employers, self-employed, unpaid family workers and armed forces. The reason
for not considering the first fhree groups is the low significance of their
reported wage as a measure of tt:hei r true compens.ation. The amed forces, on
the other hand, have their own, system of wage deltermination unrelated to short
run labor market situations. The study will als(> concentrate on male workers.
33
O~ganized and stroQR unions are comaon for bi~ firms in typically
specific areas (banking and finance, copper ~nin~, public utilities, steel).
The clasaificat~on of industries according to the protected, covered by MW,
and uncovered by HW segments is given in Table 7.
B. Preliminary !vidence on Market SesNentation
Mincer-type earning profiles were estimated for 1!l sample that includes
between 1930 and 1940 males each year. Coefficients t!or education (Ed),
exper-ience (E1t) and experience squared (Ex2) were esti.matetl, and the equality
of these coefficients across market se~ments was tested. One set of equations
was estimated for each year, and each set contained fi'ITe equations. These
equations includeG d~mmies for each segment (DP for protected, DC for
covered and DU for uncovered) inte~actin~ with the co1nstant and the
coefficients for education, experience and experience squared.
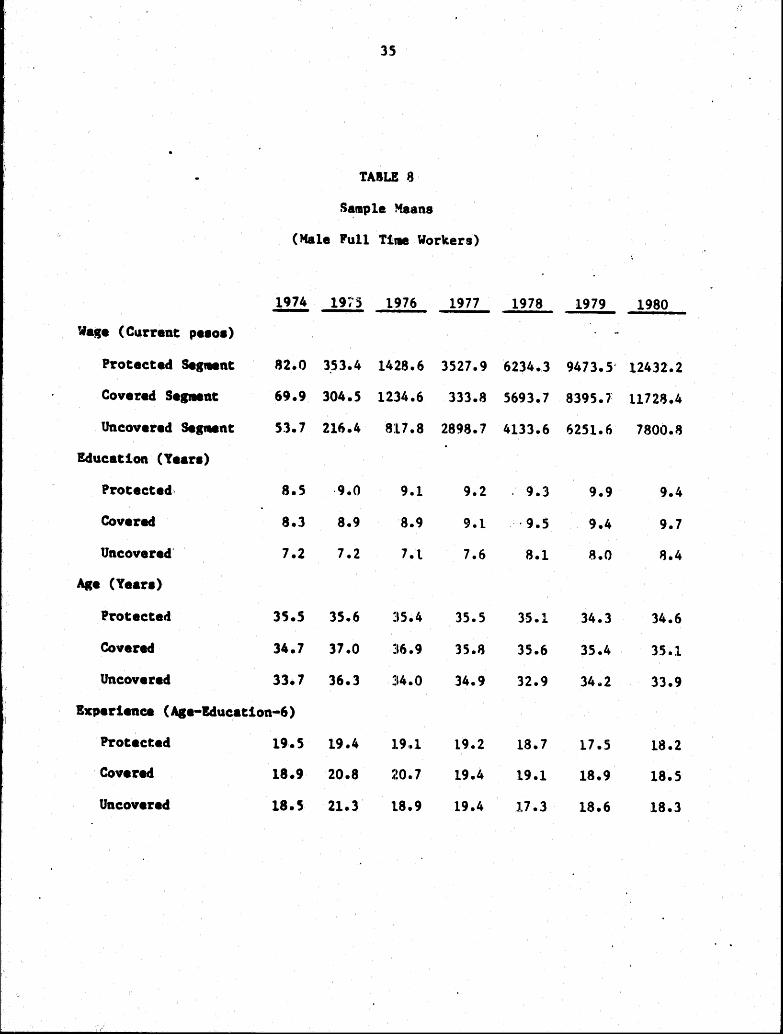
Full ti~e male workers (working more than 35 hours a week) were
distributed app~oxi~tely. in the followi~ way: 27~ in protected, 65% in
covered and 8% in uncove~ed segments. Table 8 presents general information on
the means of the independent variables for the sample and for each segment
each year from 1974 to 1980.
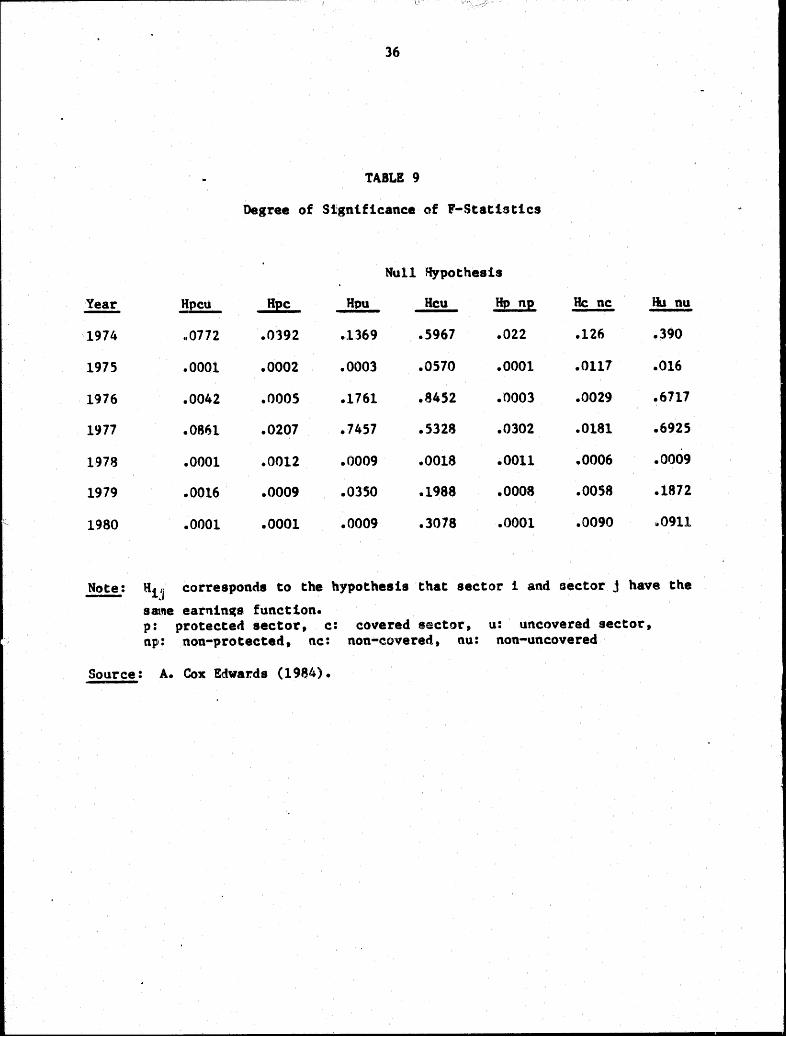
Table 9 indicates that there are statistically significant differences in
earning functions between the protected and covered segment that persist over
ti~e, and that there are statistically significant differences between the
uncovered or free segment and the rest of the labor market in 1975 and 1978.
But this is just preliminary evidence, because "wage differentials" associated
to different sectors fo employment might be "equalizing" differences and might
also be short run wage variations. In fact the evidence on fluctuations on
these wage differentials throughout the period in4icated that was necessary to
incorporate addit~onal variables into the analysis.
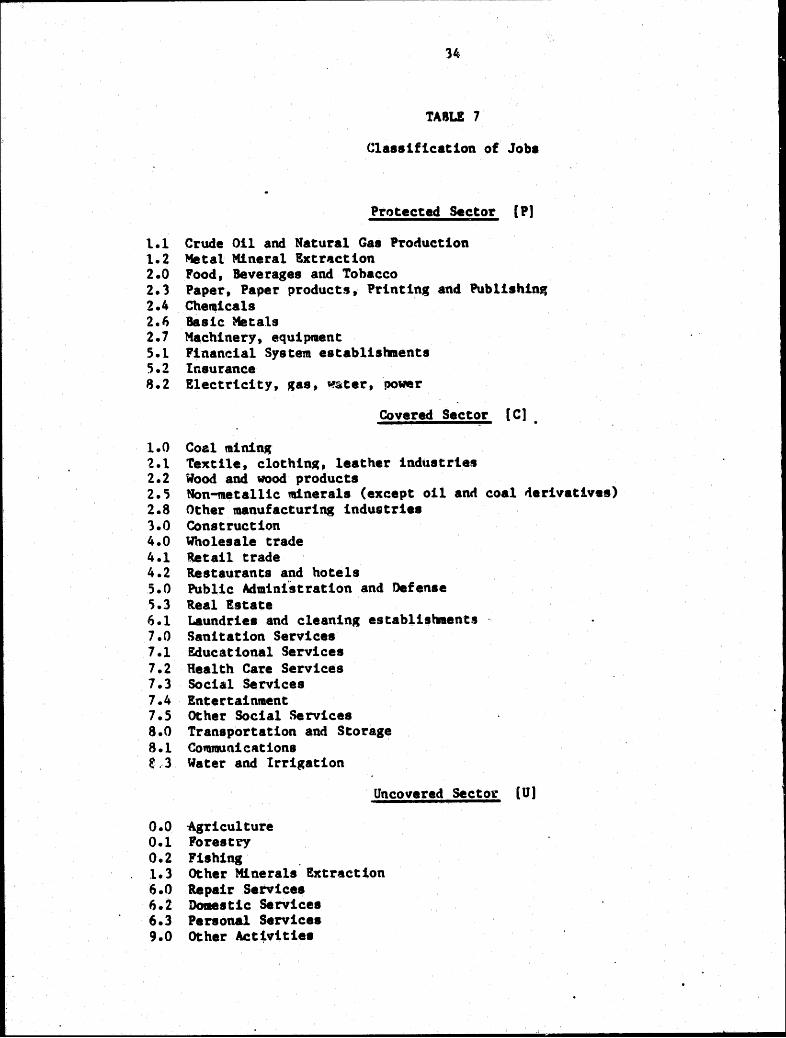
TABLE 7
Classification of Joba
Protected Sector [P)
t.l Crude Oil and Natural Gas P~oductioa 1.2 ~tal Mineral Extr4ction 2.0 Food, Beverages and Tobacco 2.1 Paper, Paper products, Printing and PublishinR 2.4 Cbe"-icals 2.~ Basic Metals 2.7 Machinery, equipment 5.1 Financial System establishments 5.2 Insurance 8.2 Elect~icity, ~as, ~ater, power
Covered Sector [C) •
1.0 Co&l minin~ 2.1 Textile, clothin~, leather industries 2.2 Wood and wood products 2.; Non-metallic ~nerals (except oil and coal ~erivatives) 2.8 Other manufacturing industries 1.0 Construction 4.0 ~nolesale trade 4.1 aetail trade 4.2 Restaurants and hotels 5.0 Public Admtnt'stration and Defense ;.3 Real Estate 6.1 Laundries and cleaning establishaents 7.0 Sanitation Services 7.1 Educational Services 7.2 Health Care Services 7.3 Social Services 7.4 Entertainment 7. 5 Other Social Services 8.0 Transportation and Storage 8.1 Co~nicAtions f:.3 Water and Irrigation
0.0 ·Agriculture 0.1 Forestry 0.2 Fishing .
Uncovered Sector [U]
1.3 Other Minerals Extraction 6.0 Repair Services 6.2 Domestic Services 6.3 Personal Services 9.0 Other Act~vitiea
35
TABLE 8
Sample Means
(Male Full Tine Workers)
.!ill. Wage (Current pe•o•)
Protected s.a .. nt 82.0
Covered Sea-at 69.9
Uncovered s...-nt 53.7
Education (Year•)
Protected. 8.5
Covered 8.3
Uncovered· 7.2
AI• (Year•)
Protected 35.5
Covered 34.7
Uncovered 33.7
Experieace (Aie-lducation-6)
Protected
Covered
Uncovered
' ' ,,
19.5
18.9
18.5
19;'5 1976 1977
353.4 1428.6 3527.9
304.5 1234.6 333.8
216.4 817.8 2898.7
·9.0 9.1 9.2
8.9 8.9 9.1
7.2 7.t 7.6
35.6 :t5.4 35.5
37.0 ~h).9 35.8
36.3 ~~4~.o 34.9
19.4 1.9 .• 1 19.2
20.8 ~~o. 1 19.4
21.3 18.9 19.4
1978 1979 1980
6234.3 9473. 5' 12432.2
5693.7 8395.l 11728.4
4133.6 6251.6 7800.8
9.3 9.9 9.4
'. 9.5 9.4 9.7
8.1 8.0 )1.4
3S.l 34.3 34.6
35.6 35.4 35.1
32.9 34e2 33.9
18.7 17.5 18.2
19.1 18.9 18.5
17.3 18.6 18.3
36
TABLE 9
Degree of Sfgntficance of P-Statistics
Null Rypothesis
Year _!!pcu Rpc Hpu Hc:u Hp np He nc Iii nu
1974 110772 .0'392 .1369 .5967 .022 .126 .390
1975 .0001 .0002 .0003 .0570 .0001 .0117 .016
1976 .0042 .0005 .1761 .8452 .0003 .0029 .6717
1977 .0861 .0207 .7457 .5328 .0302 .0181 .6925
1978 .0001 .0012 .0009 .0018 .0011 .0006 .0009
1979 .0016 .0009 .0350 .1988 .0008 .0058 .1872
1980 .0001 .0001 .0009 .3078 .0001 .0090 ~~0911
~: a1j corresponds to the hypothesis that sector 1 and sector j have the
sa1.ne earnin~s function. p: protected sector, c: np: non-protected, nc:
Source: A. Cox Edwards (1984).
covered sector, non-covered, nu:
u: uncovered sector, non-uncovered
37
A set of variables correcting for sectoral characteristics that generate
compensating wage differentials was incorporated, anrl also a set of variables
controlling fo~ short run wage variations was included. Unfortunately, a big
price was paid for improvin~ the measurement of the ••wage differential" and
this is the fact that the uncovered segment had to be left out of the
analysis. The reason for this was that the variations in employment ~ithin
the uncovered segment, for the GSA correspond statistically mainly to Domestic
Services employment, but since our sample includes only males, this employment
series was certainly not a proxy for labor demand in the free segment.
Agricultural sector eMployment for the. greater Santiago area was not a good
proxy either.
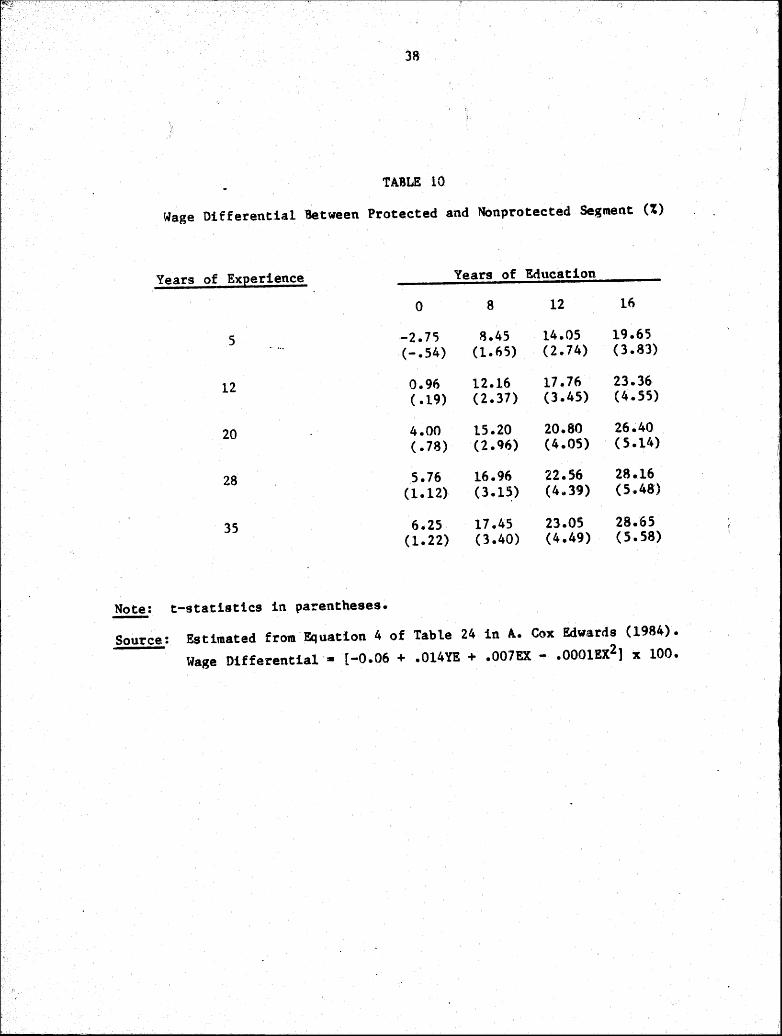
After including these set of variables, the wage differences by segments
are still significant (see Table 10) indicating that in spite of the lack of
power of unions, during the 1974-1980 period, the traditionally organized
labor maintained their relative position wage-wise (here we are just looking
at wa~es and not at employment). Tile reader should be reminded that short-run
wage variations associated to cyclical changes in labor demand were estimated
or controlled for in this study. tn fact, 1-:hese estimated effects were rela
tively important (sta~tistically significant) among uneducated workers in the
protected se~qent, but were not statistically significant for other labor
c•tegories indicating either wage rigidity or a high degree of labor mobility.
Given the unet~ploY'Bent evidence we opt for the wage rigidity i.nterpretation.
The interpretation of theee results is that wages tend to follow the
general indexation ~le ll&intaining the wage d·ifferentials across segments
that prevailed in the early 1970s. Only among uneducated workers within the
protected segment, negative (positive) labor demand fluctuation had short run
negative (positive) effects on wages. It should be clear that these results
38
TABLE 10.
Wage Differential Between Protected and NOnprotected Segment (%)
Years of Experience Years of Education
0 8 12 16
5 -2.7'5 8.45 14.05 19.65 (-.54) (1.65) (2.74) ( 3. 83)
12 0.96 12.16 17.76 23.36 ( .19) (2.37) (3.45) (4.55)
20 4.00 15.20 20.80 26~40
(.78) (2.q6) (4.05) ( 5 .14)
28 5.76 16.96 22.56 28.16 (1.12) (3.15) (4 .. 39) (5 .• 48)
35 6.25 17.45 23.05 28.65 (1.22) (3.40) (4.49) (5.58)
~: t-statistics in parentheses.
Source: Estimated from Equation 4 of Table 24 in A. Cox Edwards (1984).
Wage Differential • [-0.06 + .Ol4YE + .007EX ~ .0001EX2] x 100.
39
do not rule out 1!2!!!_ relative wagf! variations within or among segments, but
they indicate that the structure of d.ifferentials tends to persist .f.n spite of
the large cha·nges in demand. This evidence is the one that allows us to use a
mod.el of "pro\tected" vs. "free" segments during a period where unions did not
have the power to ma~e or maintain wage gains.
The Structure of Chile's Labor Market and Un.employment
One way to reconcile the evolution of the unemployment rate and real
wages during 1973-83 is to think about the Chilean labo~r market as a two-seg
ment market. One segment, which we have called .. protected", comprises all
workers in those sectors whe-re wages have been protected from changi.ng market
conditions by virtue of the indexation mechanism and the minimum wage laws.
These 'include mining, manufacturing, const:ru(;tion, utilities, commerce, trans
portation and communications, financial services and government. Th.e "free"
segment, on the other hand, couaprises employment in those sect(~rs where wages
are set freely 11 either because they are not co·\Tered by th~: minimum wage or
indexation legislation or because employment ls of temporatry nature. l~e have
included here, agriculture, fishing, social, personal and domestic servicea.l7
The main feature of tnis labor structure is that all thosf~ workers whose
reservation wage is between the free segment wage and the protected segment
wage who arE! not employed in the protected megment are in fact unemployed.
Although these workers would not take a job in th1a free market segment
because its wage is below their reservatiat:t wage - they would like to be
employed in the prot~cted sector. In a way th~y are quasi-voluntarily
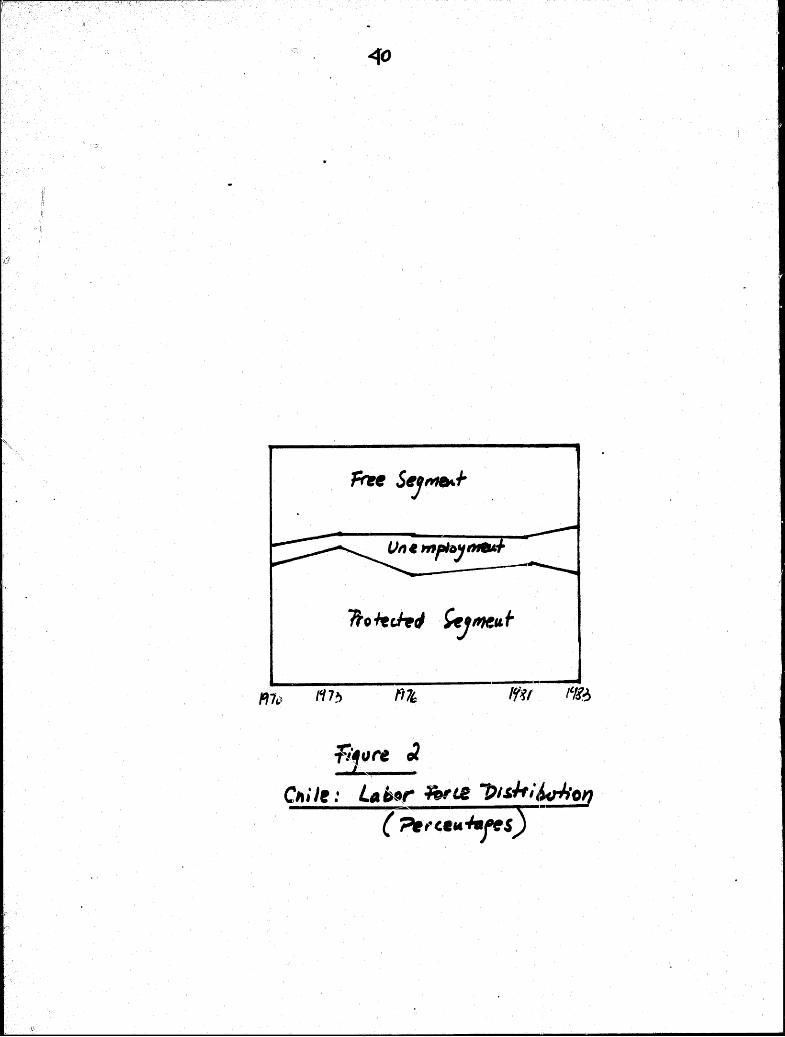
.~nemployed. Figure 2 SU11D'4ar1.zes the changes tn the dist:ribution of the labor
force across these .two segmt!nts. As can be seen employrnent in the protecte!d
sector became significantly less important, in relative terms, after 1973.
(J
fi'ftJre t2 ~-,-
C~ti lr : L. h•r ~'" -p,~hi.~~·on ( ";letceM+-ps)
41
The Model
We assWile that one i~ndivtdual -- with certain skills and knowledge -
would get a W<sge W, if ~em-ployed in the.!!.!!.. segment of the labor market, and
a wage W'(W' > W) if employed in the protected segment of the labor market.
This wage differential (11J' -W) is not ~ compensating wage differential,
originates on. the institu·tional constraints unde1: which the protected segment
~ operates, and. can prevail in the long run if the protected segment has market
power. The t-rage differential between the protected and free segments creates
quasi-voluntary unemploym1ent among workers willing to take a protected segment
job, but not willin~ to become part of the free sector labor supply at the
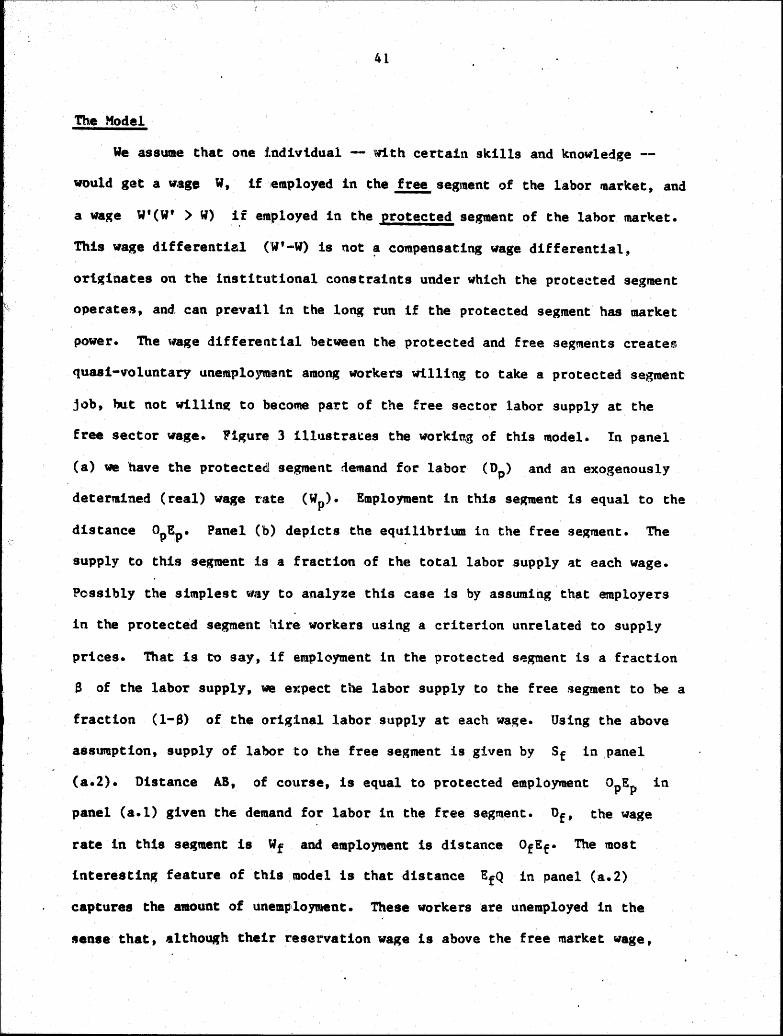
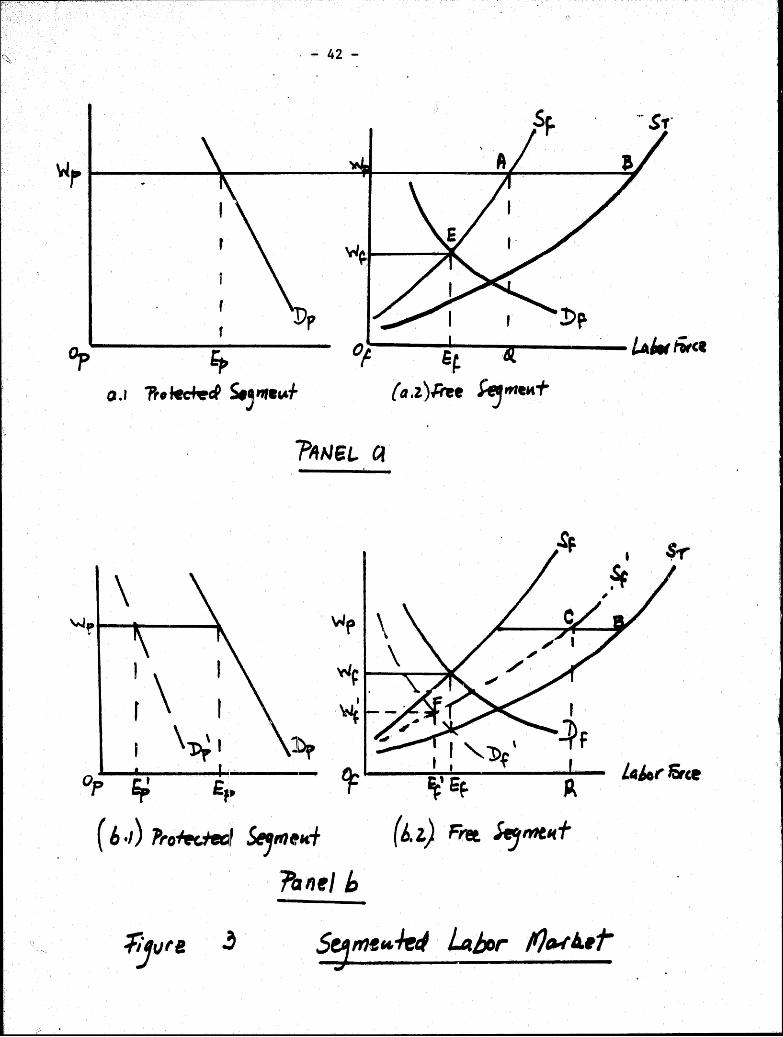
free sector wage. Figure 3 illustrates the working of this model. In panel
(a) we 'have the protected segment de1ftand for labor (DP) and an exogenously
determined (real) wage rtlte ( WP). Employment in this segment is equal to the
distance OPEP. Panel ('b) depicts the equilibrium in the free segment. The
supply to this segment ls a fraction of thE! total labor supply at each wage.
Possibly the simplest WllY to a·nalyze this case is by assuming that employers
in the protected segment hire workers using a criterion unrelated to supply
prices. That is to say, if empl~yment in the protected s~gment is a fraction
a of the labor supply, we expect the labor supply to the free segment to be a
fraction (1-8) of the original labor supply at each wage. Using the above
assU1Uption, supply of labor 'to the free segment is given by Sf in panel
(a.2). Distance AB, of course, is equal to protected employment OPEP in
panel (a.l) given the demand for labor in the fre~e segment. Of, the wage
rate in this se~ent is Wf and employment is distance OfEf• The most
interesting feature of this model is that distance EfQ in panel (a.2)
captures the amount of unemp110ynlent. These workers are unemployed in the
sense that, although their rese1:vation wage is abt)Ve the free 111arket wage,
. - 42 -
Dp
Op ~ 0 .I ~o *"ref s., rtte,.,f
of:---=e~~-~--~ LAIM titce
(a.z.)Hee ~wrett+
\
' \ r r r
\~I
( h ·I) "Pro~' ~trltM1' f'anrl b
~' Ef. A
(b.z.) Ftet Sejrr~t.lff
I~· .
ij.
43
they·are still willing to work at the protected market wage Wp• In a sense,
then, tltese workers are quasi-voluntary unemployed. ~
P;atiel (b) "ln Figure 3 captures the effects of a recession on wa~es,
employment a~d unemployment. This type of aggregate shock is similar to the
effect of the 1975 recession in Chile, and is reflected by a leftward. shift of
the demand for labor in both sectors. Since the wage rate in the pr<>tected
se~ent is exogenously determined, it does not change. Employment in that
se~ment. however, drops to distance 0 E'. p p
Consequently, we now havre to
redraw the supply of labor to the free segment (which is equal to a fraction
8' < B of total labor supply). The new labor supply to the free segment is
Sf' whe1:-e now distance CB is equal to employment in the protectf!d segment.
As a ros\lllt of the recession, demand for labor in the free segment falls to
Df, and a new equilibrium is determined in this· segment by the interaction of
the new S1t11)ply cur1.re Sf and the new demand curve Df. Tile new free segment
wage rate is W' f
and the new level of employment is
As can be seen from panel (b) in Figure 3 this model prerlicts that as a
result of the recession the following things will happen:
(a) Total e11ployment will fall from (OPEP + OfEf) to (OPE~+ OfEf).
(b) Free segment's wages will decline to W£· (e) Measured averages wages will generally decline because free segment
·wages decline. The ehan~e in the distribution of employment across
sepents would ultimately determine the change :Ln measured average wages.
(d) More~ iBportant. however, the model clearly indicates that the number of
uneaployed and the rate of unemployment will go up. In Figure 3,
uneMployment goes up from EfQ to EfR.
44
Segmentation in Chile
In order to make this simple model operational in our interpretation, it
is necessary to.define in a ~or~ precise way what do we mean by the protected
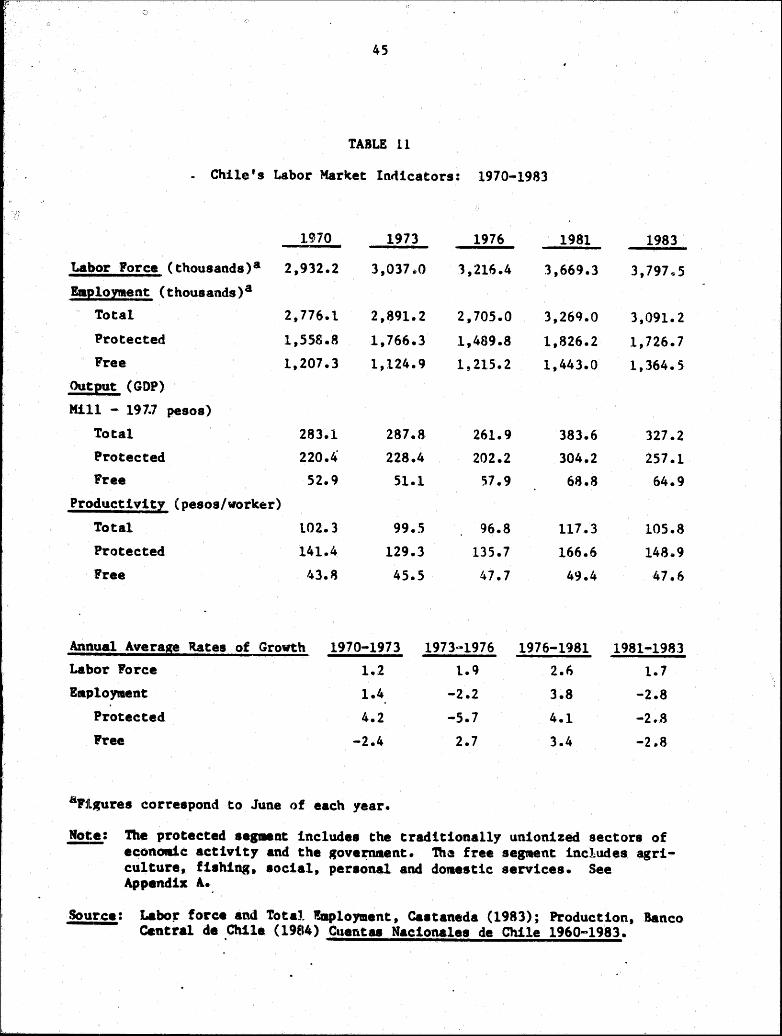
and free seg~nts in the context of the Chilean case. ~is is done in Table 11
where we have rtistributed the labor~force in two se~ments according to sector
of employment. Given the availabil1.ty of data, this :iistribution is, of
course, an ap~roximation. It is now consistent, but not entirely equivalent to
the classification used in A. Cox Edwards (1984) for the greater Santiago area
labor market, where a two digit industrial classification was used.
The allocation of the labor force. to the t~ segments was approximated with
employment classified in ten sectors of economic activity. Unfortunately, the
data available on wages cannot be Matched directly with employ.ent by sectors.
In particular, we do not have reliable estimates for wages in agr.iculture. For
t~is reason, we used a wage se~ies for each se~ent that was representative of a
r1articular tYPft of skill within the segment - reducing the effect of changes in
the skills co~position of employment. Wages of domestic service employees were
used to study wa~e variatiuns within the free segment, and wages of blue collar
workers in manufacturing were used to study wage variations within the p~otected
segment. These series are presented in Table 12.
From the blue-~ollar workers wages series it can be seen that ~nthly
wages (estimates for May of each year) throughout the period showed a cyclical
behavior with no significant trend. This is not too surprising given the
evolution of real income for the Chilean economy. Wages in 1973, 1979, 1980
and 1983 were very close to the average of 3,558 pesos for the 14 years
period. The years 1971-72 and 1981-82 are characterized by substantial raal
wage increases of between 25 and 30% above the average. During the 1974-77
period~ on the contrary, wages are about 30% below the trend~
''0
45
TABLE 11
- Chile's Labor Market In~icators: 1970-1983
1970 1973 1976 1981 1983
tabor Force (thousands) 8 2,932.2 3,037.0 3,216.4 3,669.3 3,797~5
Eaployment (thousands) 8
Total 2,776.1 2,891.2 2,705.0 3,26q.o 3,091.2 Protected 1,558.8 1,766.3 1,489.8 1,826.2 1,726.7 Free 1,207.3 1,124.9 1,215.2 1,443.0 1,364.5
Output (GOP)
Mill - 19~7 pesos)
Total 283.1 287.8 261.9 383.6 327.2 Protected 220.4 228.4 202.2 304.2 257.1 Free 52.9 51.1 57.9 68.8 64.9
Productivitl (pesos/worker)
Total t02.3 99.5 96.8 117.3 105.8
Protected 141.4 129.3 135.7 166.6 148.9
Free 43.8 45.5 47.7 49.4 47.6
Annual Ave rase Rates of Growth 1970-1973 1973-1976 1976-1981 1981-1983 Labor Force 1.2 1.9 2.6 1.7 EaploJ'I'Ient 1.4 -2.2 3.8 -2.8
Protected 4.2 -5.7 4.1 -2~.8
Free -2.4 2.7 3.4 -2.8
8PjlS~ures correspond to June of each year.
The protected segment includes the traditionally unionized sectors of econOIIie activity and the gove~ent. 'l'h~ free sepent includes agriculture, fishing, social, personal and do•estic services. See Appendix A..
Sour.ce: -- Labo~ force and Total !mployment, Castaneda (1983); Production, Banco Central de Chile (19El4) Cuentu Nacionales de Chile 1960-1983.
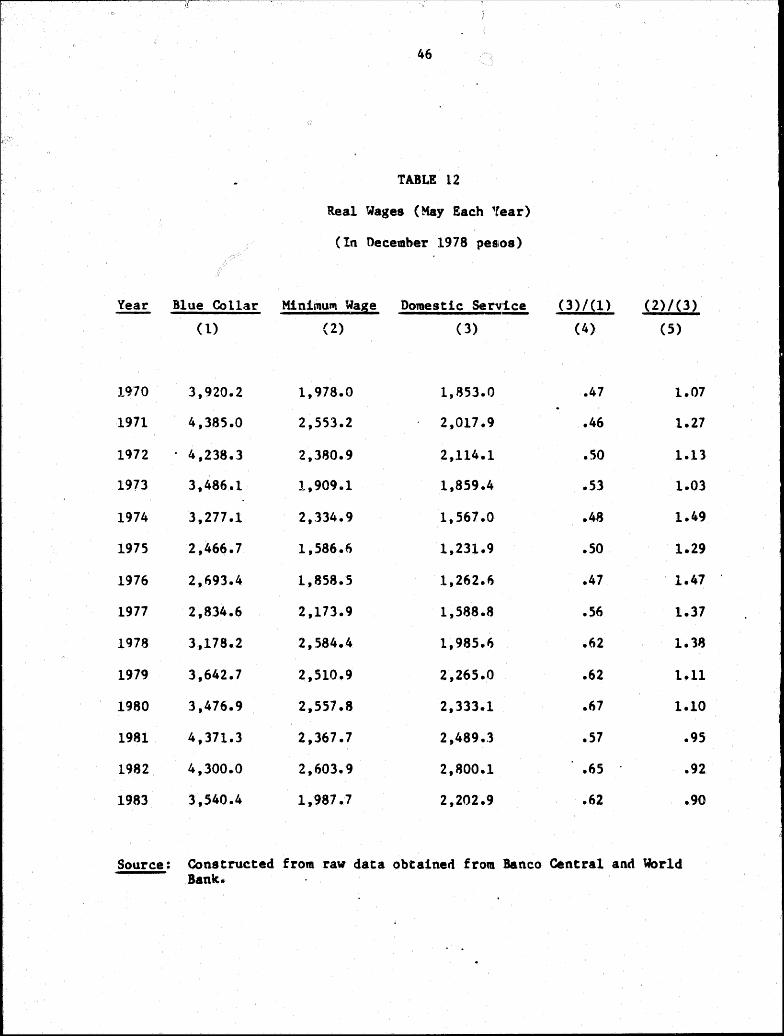
46
TABLE 12
Real Wages (May Each Year)
(In December 1978 pes1os)
Year Blue Collar Mini~u~ Wage Domestic Serv·~
(1) (2) (3)
1970 3,920.2 1,978.0 1,853.0
1971 4,385.0 2,553.2 2,017.9
1972 . 4,238.3 2,380.9 2,114.1
1973 3,486.1 1,909.1 1,859.4
1974 3,277.1 2,334.9 1,567.0
1975 2,466.7 1,586.6 1,231.9
1976 2,693.4 1,858.5 1,262.6
1977 2,834.6 2,173.9 1,588.8
1978 3,178.2 2,584.4 1,985.6
1979 3,642.7 2,510.9 2,265.0
1980 3,476.9 2,557.8 2,333.1
1981 4,371.3 2,367.7 2,489.3
1982 4,300.0 2,603.9 2,800.1
1983 3,540.4 1,987.7 2,202.9
(3)/(1)
(4)
.47
.46
.50
.53
.48
.so
.47
.56
.62
.62
.67
.57
.65
.62
(2)/(3)
(5)
1.07
1.27
1.13
1.03
1.49
1.29
1.47
1.37
1.38
1.11
1.10
.95
.92
.90
Source: Constructed from raw data obtained from Banco Central and World Bank.
47
The path of the minimum wage relative to domestic service wages (column 5
in Table 12) is, to a la~ge extent, a result of the effort of the authorities
to maintain th- real purchasing power of wages th~ough the indexation mechan
ism. This effort, nevertheless, had negative implications for the unemployment
problem.
The ratio of domestic service wages to blue-collar wages (column (4))
highlights in the context of our model, how the two segments of the labor
market #!d_1usted to these changes. For example, between 1973 and 1976 labor
demand declined in the protected segment, but we see wages in the free segment
cieclin'in,; relati·te to the l!)rotecteci segt1lent. 'lb.is is consistent r.rlth what our
'lllodel would predict. If ~~1ges are hi~her and relatively inflexible in the
protected segment, ilnd demand is J:>educed there, we will expect an increase in
unemployment and also ~n increase in labor supply to the free segment that will
tend to depress the free segment real wage •
. \lthough this model hae the advantage of being very schematic and
appropriate to analyze some of the important questions regarding the Chilean
experience, it is too a~gregated to be of much help in understanding the more
intricate effects of the trade liberalization on the labor market. tn each
segment, we have added up all employment, without making ariy attempt to
decompose it in different labor categories. Some additional analysis will be
necessary in some of the subperiods studied below.
1973-1976
We first concentrate on 1973-76, a period where unemployment grew very
drastically8 Ae a result of the government's effort to reduce its size, labor
demand within the protected seg~ent -- which includes government -- declined by
276,500 (5.6% per year), where 100,000 of this reduced job vacencies can be
identified with the emploY"ftent t"eduction within the public sector. 'lbe rest of
48
the dema~ decline (176,000) was.the result of the effects of the world
recession and especially of the drastic stabilization policy imple.ented by the
government in 197 3. A.t the sallle tillle, labor supply continued t:o increase,
adding 179,400 workers throughout the period. As a result tabor sul)ply to the
free segment increased, inducing a reduction in the wage rate there. According
to available fi~ures, the a~ricultural sector was the one that absorbed most of
the additio,r.tal employment within the free segmertt• Table ll summarizes the
changes in the key variables for the labor ~rket situation in 1973, 1976, 1981
and 1983.
In our view the employment policies of the public sector play an
important role in understanding the high unemployment rates observed in Chile
since 1974. Previously, some papers have provided a somewhat casual discus
sion of this problem. Tockman (1984), for example, estimated the public
sector ~plo~ent level for the period 1970-82 if the trend observed in the
1960s for public employment would have been maintained. Using these estimates
he concluded that the reduction in public sector employment between 1973 and
1976 explains less than 10% of the increase in the unemployment rate for the
same period. Meller (1984) has pointed out the cyclical pattern of the public
sector employment and has argued that if 1973 is used as the base of compari
son f(•r the later evolution of public sector employment, the reduction in the
emplo1~ent level within the public sector between 1973 and 1976 explains about
30% of the increment of the unemployment rate for the same period (about 3% of
the labor force). This is exactly what the model used in this section
emphasizes. The change in the employment policy between 1973 and 1976 oper
ates on a labor market that had already been adjusted to the structure of
labor demand of the 1970-·73 years; that is, to a higher level of protected
segment depnd for labor ..
49
Figure 4 illustrates, within the context of our segmented labor. market
~odel, the chan~es in the labor ~arket situation between 1973 and 1976. Labor
supply tQ the econo•y and therefore to the protected segment, 'increased by
about 200,000 individuals while demand in the protected segment declined by
276,50Q. The excess supply of labor to the protected segment does not
entirely beco~e part of the free segment labor supply, since only a fr~ction
of the unemployed would be willin~ to take a job at the free segment wage. In
the free se,~raent, ewaployment ~ctually increased and the wage rate, measured by
the evolution of d0111estic service w;ages, declined relative to other wages.
These changes could be consistent w~th a ~rowing free segment labor demand,
but lt is assumed that demand in the free segment declined at the original
wa~e, and that the level of emplo~nent in the same sector increased due to the
effect of the growing labor supply on the free segment real wage. As a
result, 11nemployaaent increased frona about 150,000 in 1973 to over 500,000 in
1976. AccordinR to Table ~. wa.ge11 did experience a substantial decline, but,
as our l"'lodel suggests, this decl1.ne was more pronounced within the free
segment while it was in the protf!cted segment that the policy of em·ployment
reduction had a direct impact. Clearly, a larger reduction in real wages
within the protected segment ~•u~d have diminished the decline in employment
there and reduce!li the resultin1~ unemployment rate.
1976-1981
During the 1recovery and "boom'' years of 1976-81, employment grew at all
annual average r~ate of 3. 8% ( fJcae Table 11), and the labor force shoiied record
growth rates of ~~.6% per year on average. All of this is consistent with a
recovery period SLnd declining unemployment. Tile fact that wages recovered
quickly, while 1ltlt•ployaaent wra.s still well above the past normal rates has
been puzzling. A~ ·posaible e:lp,lanation will be attempted het'e. In our vi.ew,
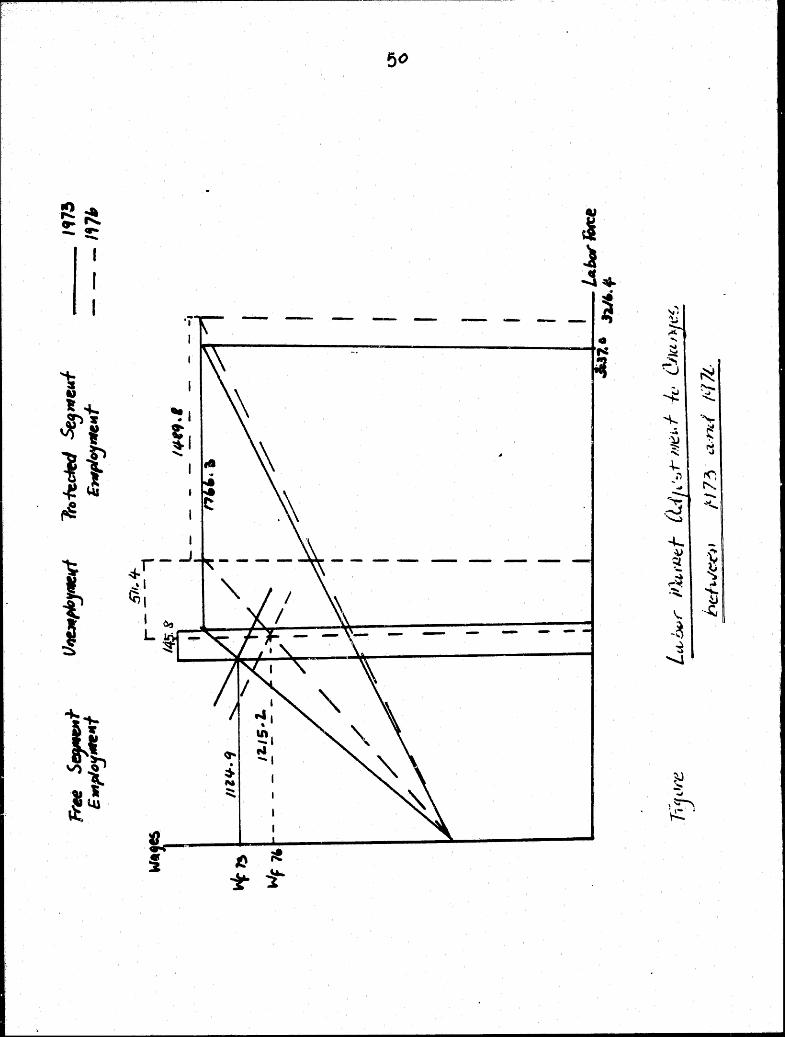
I i ........ ~ ,.c. .... ...; ~
' ~ ~ ~
~
' ~ -~ ... .... ·~ ~ ~ ~ "' 1--....
H r<; ' ... ['..,
~~ -..
.--J ~ ..... ' ~
I 4....
r-...J ----~I . {f) I
L ~--._--~~-----~~~---~~~~=-~-=~
.\) ·E . ~ ~ 'i ~~ ~
-~ "' ~ ~ ··~,
~~ ~ L-~~~~---~~--------------·
..) ..,)
'-1
............
~~ <t-\/)~ $ ~ } N s ~~
~ .... . ~ 'r!:. i
(I
~ ~ ;!
~ ~
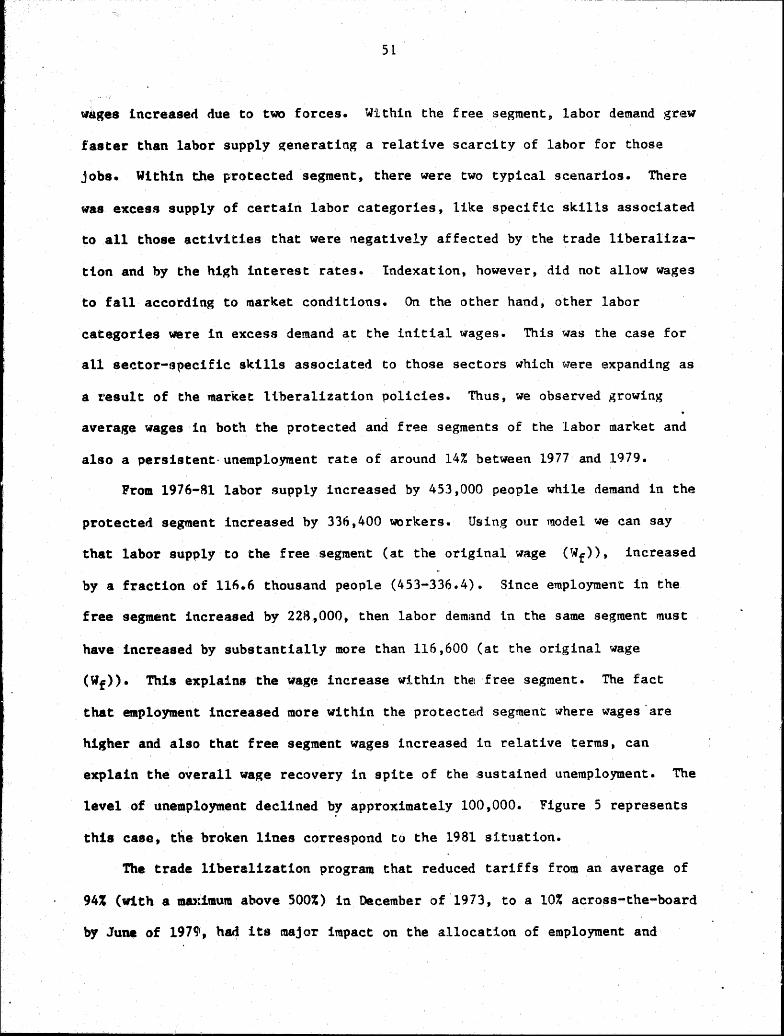
Sl
wages increased due to two forces. Within the free segment, labor demand gr~ew
faster than labor supply .~enerating a relative scarcity of labor for those
jobs. Within the protected segment, there were two typical scenarios. There
was excess supply of certain labor categories, like specific skills associated
to all those activities that were negatively affected by the trade liberaliza
tion and by the high inte~est rates. Indexation, however, did not allow wages
to fall according to market conditions. On the other hand, other labor
categories were in excess demand at the initial wages. This was the case for
all seetor-tJpecific skills associated to those sectors ~hich t..;ere expanding as
a t:esult of the market 1 tberalization policies. Thus, we observed growing
average wages in both the protected and fr~e segments of the labor market and
also a persistent·unemplo~!ent rate of around 14% between 1977 and 1979.
From 1976-81 labor supply increased by 453,000 people while demand in the
protected segment i.ncreased by 336,400 workers. Using our model we can say
that labor supply to the free segment (at the original wage (Wf)), increased
by a fraction of lln.6 thousand people (453-336.4). Since employment in the
free segment increased by 2213,000, then labor demilnd i.n the same segment must
have increased by substantially more than 116,600 (at the original wage
(Wf)). This explains the wagt! increase within the! free segment. The fact
that employment increased more within the protecte:rl segment where wages are
higher and also that free segment wages increased in relative terms, can
explain the overall wage recovery in spite of the ;Sustained unemployment. The
level of unemployment declined by approximately 100,000. Figure 5 represents
this case, t&e broken lines correspond to the 1981 situation.
The trade liberalization program that reduced tariffs from an average of
94% (with a mmcimum above 500%) in December of 1973, to a 10% across-the-board
by June of 197~1, had its major impact on the allocation of employment and

I l
. I
I
-5-t -

53
investment throughout this period. The effect of t::he trade liberalization on
the labor market represenl~s a vast and r..::ritical area of research. In prin
ciple, changes ·in relative prices of goods would t:ranslate in a reallocation
of resources, and apart from short run adjustment la~s, we should expe~t no
long-run effect on the rate of unemployment. Mos~ likely, the amount of
frictional unemployment will increase in the presence of large and sudden
changes in relative prices of commodities, because individuals have to learn
ahout the new employment opportunities. On the other hand, if there is wage
rigidity of the type introduced by minimum wages, and if capital is immobile
~n the short run, the liberalization process can result in short run
involuntary unemployment. Alon~ these lines, Edwards (1982) reports that the
upper bound for the unemployment effect of the trade liberalization between
1975 and 1978 would be 3.5% of the labor force (or about 129,000 jobs).
Lahor reallocation takes place by workers leaving one job to take
another, but capital mobility requires investment. Therefore, the realloca
tion of resources induced by the liberalization policies, generated an
increase in demand f~r investment funds. In fact, the scarcity of capital in
Chile during this period was reflected by the unprecedently high interest
rates. The recovery of the economy, and therefore the growth in labor demand,
was limited by the destree of capital mobility or in other words, by the amount
of funds available for investment. It was only with the openi~g of the capi
tal account that this process could be speeded up and the level of unemploy
ment due to the reallocation effect could disappear.
Since the liberalization of the capital account started in June of 1979,
the 1976-79 period can in a way be ·characterized by immobile C&J!)ital, while in
the 1980-81 period capital was more easily moved. !y mid-1979 the Construc
tion sector, which until then had still been quite depressed, showed a frantic
54
recovery and unemployment declined. Nevertheless at 1the end of this recovery
period (mid-1981), unemployment was still ~round 11% of the labor force. If
we take Edwards-' estimate of 3. 5% unemployment assoc:ILated to the trade
liberalization, we are left with an unexplained', uneftl·ployment rate of around
11% (14.5% - 3.5%) for the 1976-79 period and a sli~lihtly higher rate of 11.4%
on average for the 1 tlR0-81 period. Certainly, t:he level of real wages in the
economy was above the level consistent with a historical rate of unemployment
of 5 or 6%.
These rates of unemployment, two times the historical rates for the
Chilean economy, can be explained by the process of wages determination and by
a resulting inconsistency between workers' expectations about wages and actual
market wages. As is described in Figure 5, the recovery of labor demand
durin~ this period induced wage increases, in spite of the unemployment
level. Therefore, the actual recovery of employment was relatively moderate.
Moreover, towards the end of this recovery period wages show a
significant real increase. In 197q the new Labor Law and the fi.xed exchange
rate policy favored the ~rowth of real wages in the economy and particularly
within the "protected" segment. Real wages increased dramatically in 1980.
To give just an indication, the proportion of labor income out of GDP went
from 36.1 in 1979 to 38.2 in 1980 to 40 .. 5 in 1981 and 41.2 in 19U2.
1981-1983
The strong recovery of the preceding period came to an abrupt end by mid-
1981. This period has been extensively analyzed in relation to the
macroeconomic management of the economy.l8
The financial market situation was giving signs of a turning point in
1981, as interest rates climbed. 19 During the second semester of 1981,
industrial production started to decline. Nevertheless, nominal wages were
55
officially granted a 14% increase in August of 1981 -- to reestablish the real
wa~e as of October 1980 -- and collective bargaining agreements were setting
nominal wage readjustMents thllt greatly exceeded the legally required minimum
of accumulated past inflation. FirtllS, especially in the tradables sectors,
could only afford this wage increase by borrowing from the financial syste1'1l.
When in 1982 foreign banks decided that Chile was not a good risk any more,
bankruptcies mounted. Between 1981 and 1983 the level of production measured
by GDP fell by 15%. Unemployment in 1982 reached 20.4% of the labor force.
The labor market adjustment between 1981 and 1983 is represented in
Figure 6. ~e lq83 case is represente~ hy the broken lines. In Figure 6 we
have o•itted any change in the protected segm6nt wage. The idea is that
between 1981 and 1982 real ~ages increased above equilibrium and then declined
in 198'3. But due to the initial downward inflexibility of wages, the
reduction in demand that took place was considerable. As an indicator of the
disequilibrium that resulted, the unemployment level rose to 700,000 in 1983.
Summarizing, the higher rate of unemployment for the 1974-83 period is
explained by the low average rate of growth of the economy for the period
coupled with a lack of downward flexibility of wages in the "protected"
segment of the labor market. nte recovery of the level of economic activity
between 1976 and 1981 was not sustained for a long enoubh period to succeed in
reducing unemployment to historical levels.
7 Summary
In this paper we have analyzed several aspects related. to employment,
wages and unemployment during the~ period of ect)nomic reforms in Chile, 1974-
83. We have shown that the hi~h level of unemployment observed throughout the
period responded to a lttumber of it'lterrelated factors. Fi1~st, the slow average
rate of growth of economic activity during the period resulted in a slow rate
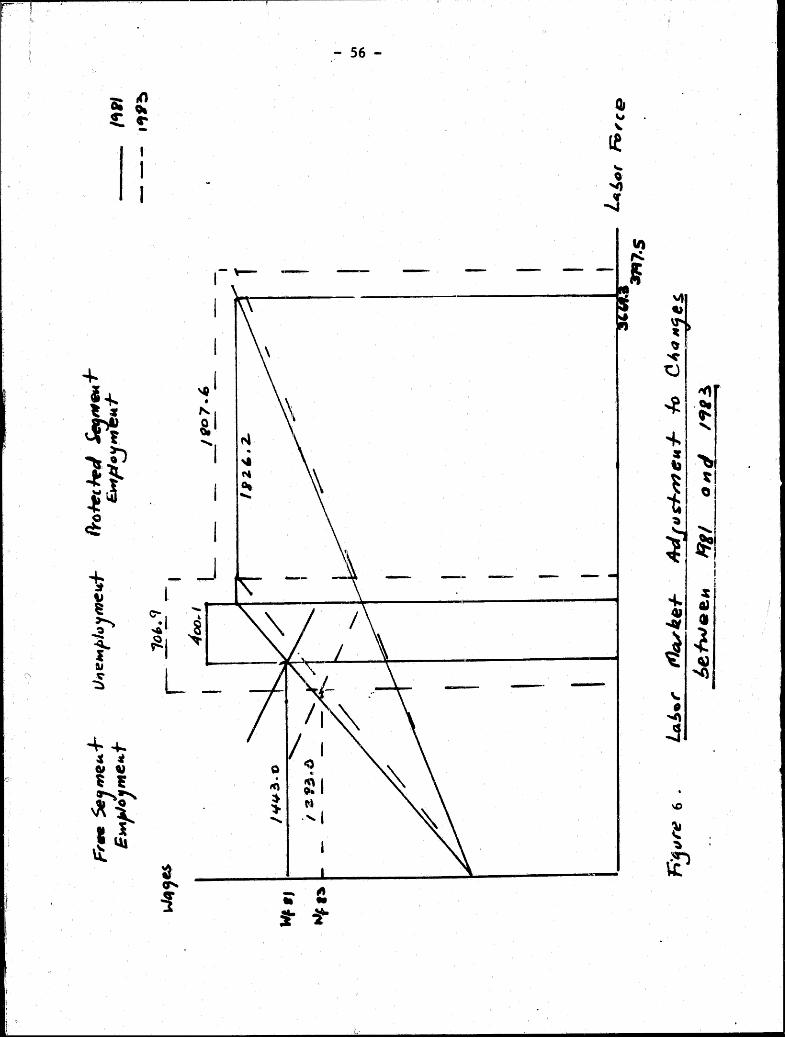
.- 56 -
I l I \-- ·-I
~ ~~ "' l ~
•
~ "I &
"':1 'I ._t'"!l .!J I
~
' ~ _J --
" @
~ ~I -~ ....... ~ ~ ~I IU -~ l_ ':::)
"""--+-~ :l Ql u t ! ~;"
"' ,.:\ I
,} 0111 N
\l:.l.ll ·' l
~ CJ'
! -.. !-
57
of e•ploy.ent creation. Second, the labor force grew at rates substantially
higher than the historical average. Third, the reduction in the government
size generated' ~jar reduction in the number of jobs, contributing to the
overall unemploy.ent problem and fourth, the persistance of unemployment
responded to a number of rigidities that precluded a smooth adjusttaent to
various shocks, including the liberalization reforms. In particular, the
across-the-board wage indexation mechanism d:f..d not allow relative wages to
chan~e sufficiently. In fact, tn Section 5 we developed a
segmented labor market, which highlights the role of these
which is very useful to e~plain the evolution of employment, •1nenaployment and
wages durinR the period.
We divided the period into three subperiods according to the type of
r;•efont or external shock affecting the labor market. The years 19;· J-76 are a
period of stabilization effort complicated wtth. a negative external 3hock.
The 1976-81 period experienced the trade liberalization reforms, and finally
in 1981-83 another major negative external shock took place.
Unemployment growth in Chile during the period analyzed is associaterl
with two types of episodes: employment reduction within the public sector,
and negative external shocks. The explanation we provide is the following.
The replacement of government jobs by new jobs (at the same wage) would
require enough time so that the economy builds up the complementary factors to
use this labor productively. On the other hand, ne~ative external shocks
induce a reduction in a~~regate demand for tradables, through a reduction in
real income. The reduced demand fo-r tradables gene·rates a reduction in labor
deaand that would generate unemployment, unless real wages decline. There-
fore, the lack of downward flexibility of real wages is a fundamental
explanatory factor behind the unemployment generated in the two types of
1\ f!l

58
episodes. We argue that the ~echanism of backward wage indexation, in
particular since inflation was declining, was a key factor behind the real
wages inertia and that it contributed in a significant portion to the
persistence of unemployment. We argue that for an important segment of the
labor market wages were too high given the market conditions throughout ~ost
of the period analyzed.
59
Footnotes -----'··'·-
1For a degcription of the Chilean economy during the 1970s see Harberger
(1982.), S. Edwards (1985a), Corbo (1985), .Bardon et al. (1985), s. Edwards and
A. Cox !dwards (1986). On the market oriented reforms and their effect on
une•ployment see, for example, Cortes and Sjaastad (1981), S. Edwards (1982)'
Cortez (1983), Meller (1984), Arellano (1984), Riveros (1984).
2corbo and Meller (1981) document how the import substitution trade
policy resulted in highly capital intensive productive techniquec;.
3see J. Marshall and Romaguer;:\, "La Evolucion del Empleo Publico en
Chtle: 1970-1978," Notas Tecnicas, No~ 26, CIEPLAN, Santiago (February 1981).
4During the decade of the 1960s, the rate of 11nemployment was at aproxi-
~ately the avera~e level for Latin America. For example, during the second
half of that decade the annual r;ates of open unemployment (country-wide)
were: 1977, 6.8%; 1967, 5.5%; 1968, 5.0%; 1969, 4.1%; 1970, 3.5%.
5The existing em?irtcal evidence shows that, although real c:Jages across
the economy significantly fluctuated during this period, relative wages
between any two sectors for comparable workers (given education and experi-
ence), were quite inflexible. This was, i.o an important degree, a consequence
of the indexation mechanism. What the evidence shows is that there were no
significant wage responses to sectoral variations in labor demand throughout
the 1974-80 period. (See the econometric cross-sector analysis in A. Edwards
(1985). See also Cortazar (1983)). At this point, it is convenient to con-
s~tder labor as a quasi-fixed factor in the short run ( Oi, 1962). In response
to changes in relative prices of goods, or to changes in the employment policy
of the public sector, firm <.lr industry specific attributes of human capital
should. experience price ch.'!nges. Consequently we should observe changes in
60
relative wages across industries or sectors of economic a,ctivity. Alternativ
ely, we would observe unenaploY'flent in all those labor catiegories that have
experienced de•and reductions. It is also reasonable to :expect that an
economy going through a serious stabilization. and liberalrization program r«)uld
present a higher rate of frictional unemployment for a sh:ort period of time.
6The existence of 'this e11ergency program int:roduces some difficulties
into the analysis of the emplo:rment problem. Since some, but not all, of the
participants in the PEK program consider themselves as beting employed full
{!;.ime, it is not easy to compute the actual rate of une!'llpl.oyment. On this
oroblem see Meller (1984). On the PEM emergency program see Schmidt-Hebbel
(1981).
7If after 60 days of ne~otiations there wasn't a ne111 agreewaent, workers
could resume their jobs ~nder the same conditions established by the previous
contr~ct, with the e~ception of nominal wages, ~ich were inereased by the
rate of inflation incurred since the last contract. Acc.ording to the law, it
was understood that if a worker did not resume his job 60 days after the
strike had begun he "would have .. implicitly resigned" ltis1 post.
8This structure can be altet:ed to consider the pre:e1ence of a binding
minimum wage. In this cas~! in the unprotected segment ilt is ttecessary to
distinguish between the covered sector, which is subjec1t to the legal ~nimu~
wage, and the uncovered sector where wage rates are ful:Ly set according to
market forces. Since workers in the protected or cover1ed sectors get rents,
labor mobility frowa these sectors to the free segment 1$ slofll, and major
shocks to the economy are usually translated into large and persistent
unnplo}'M·ftt.
9r£ E is the level of eaployment and P is the labor force, then u •
1 - E/~ is the rate of uneal)loyaent. Consequently du • E/P(dF/F - dl/1).
61
Assuming an initial level of unemployment of 6% (E/F:. .94), and the same
rate of growth in employment of the 1960s, the higher rate of ~rowth of the
labor force in ~he 1973-83 period explains an annual average increase in the
unentployment rate of half of a point, or an accumulated increase of 5 points
in ten years [du =- .94x (.023-.018) =- .0047]. If we assume the same growth
in the labor force of the 1960s, the reduction in employment gro~th explains
an annual incrf'ase in the unemployment rate of 9/lOth of a point, or an
accumulaterl increase of 9 points in ten years [du = .84x (.Oln-.007) =-
0.0085] ..
10Estimates hased on World Rank data.
11The 1979 law established 100% backr<~ard indexation for workers subject
to collective bargaining only, but it added· to the overall rigidity of the
indexation mechanism in two ways. First, although !t legally focused on wages
in a particular se•,ctor, other wages were also affected via labor mobility and
turnover. Second, and more important, by mandating 100% wage indexation for
unionized workers, the government was in a way forced -- to the extent it
didn't want to be discriminatory -- to decree 100% indexation for nonunion
workers.
12Recall that in 1979 General Pinochet said that the law "assures workers
an increaae of remunerations of at least 100%· of the increase of the cost of
life ••• " (Bole tin Banco Central, September 1979, p. 1489). Of course, was not
strictly correct. Whether real wages would decline or increase due to Article
26 depended on whether inflation was increasing or decreasing. How can we
explain that, in an otherwise SOI)histicated piece of legislation, an aberra
tion such as the institutionalization of backward indexation was included?
The answer to this probably lies in the realm of politics. The wage floor and
indexation clauses were includeti in the law as a way to show that this piece
62
of legislation was not "anti-labor" as some ,generals had argued. In fact, it
was pointed out that t:his law was, if anything, "pro-labor'" since it assured
that real ~ages. wtould '"never" decline again.
13see for example Paldam, ti., and Riveros, L. ( 1986).
14of this 56.9'! the employer's contribution amounted to 45.4% and the
e~ployers cont~ibution was 7.5%.
15on the econo:nics of toTage differentials see Stiglitz (1974), Oi
(1986). An alternativ1e approach to the existence of segmentaltion is implicit
in the '"dual'" lahar market theory (see Doerin~er and ?iore 1.<~71). Ac¢ording
to the "du.ality'" approach, segmentation is a structural failure in the way
labor markets function in developing countries and the evidence of its
existence is in the widespread poverty observed in these countries. Empirical
analyses of the dual labor market hypothesis have encountered two problems .•
First, the nonoperational character of the theory that limits the testable
hypothesis to the alleged inadequacy of human capital investment in the
se~condary market. Se(.!Ond, and most important, the th1eory does not contain a
clearly defined criterion to distin~uish the two se~~ents.
l6Th~re are a number of reasons why large firms, including ~~ fit1119,
paid atJ a matter of policy wages above market levels. For example, firm.s
mi ~ht be interes.ted in. minimizing hiring/ training costs. In a context of
imperfe:ct information where the firm cannot identify quitters, a wage above
equilibrium ~ill reduce quits. Also, since supervision is costly, wage
premiums will induce workers to perform better and to be loyal to the firm.
The itifomational gaps tend to be more important in large firms. Finally, if
a firm has some kind of market power, it cotHd pay wages above narrowly
defined market wages and still survive.

61
17 Accordin~ to Chi.lean la'J throu~hout period 1973-81, (Jages of domestic
service employees and trainees were not subject to the minimum wage.
18see for ~xampl•:!, Harber~~er (1984), S. Edwards (1985b), Corbo (1985) and
S. &!wards and A. Cox Edwards (1986).
19The deplorablf! situatiot1l of the financial system had cieveloped earlier
(1979-80), when barl l<)ans were l"o!Lled over in order to maintain the apparent
credit worthiness of !3ome hanks' and keep goin~ some "nonviable" economic
ventures of their aff:lliates. Remember, as was pointed out in the introduc
tion, the economy was subject t.o al severe negative external shock in 1981.
Aggregate demand fell. Then, the already existing financial problem grew, and
as interest rates cli1nbed, i.t c:omp:romised economic activities that ~oTere
"•1iable" in the long run.

- 64 -
References
Arellano, J. 1984. "Una Nota sobre las Causas del Desempleo en Chile." [A Note on the causes of unemplyment in Chile]. Coleccion Estudios Cieplan no.l4, (September).
Banco Central de Chile. 1983. Indicadores Economicos y Sociales 1960-198~. (Social and Economic Indicators]. Santiago.
Banco Central de Chile. 1984a. Cuentas Naciona1es de Chile. 1960-1983. [National Accounts]. Santiago.
Banco Central de Chile. 1984b. Boletin Mensual. [Monthly Bulletin]. (December).
Banco Central de Chile. 1985. Boletin Mensual (Monthly Bulletin]. (December).
Bardon, A.; C. Carrasco; and A. Vial. 1985. Una Decada de Cambios Economicos: La experiencia Chilena 1973-1983. [A Decade of Economic Changes]. Santiago, Chile: Ed. Andres Bello.
Castaneda, T. 1983. "Evolucion del Empleo y Desempleo y el Impacto de Cambios Demograficos sobre la tasa de Desempleo en Chile:l960-1983." [Employment and Unemployment and the Effect of Demographic changes of the Unemployment Rate in Chile], Documento Serie Investigaci~n no.64. Departamento de Economia, Universidad de Chile.
Corbo 11 V. 1985. "Reforms and Macroeconomic Adjustment in Chile during 1974-1983." World Development, (August).
Corbo, V., and P. Meller. 1981. "Alternative Trade Strategies and Employment Implications: Chile". In Trade and Employment in Developini Countries, vol. 1, edited by A.O. Krueger, H.B. Lary, T. Monson and N. Akrasanee. Chicago, Illinois: University of Chicago Press.
Cortazar, R. and J. Marshall. 1980. "Indice de Precios al Consumidor en Chile, 1970-1978" ["Consumers' Price Index in Chile, 1970-1978"] Coleccion Estudios Cieplan no.lj. (November): 159-201.
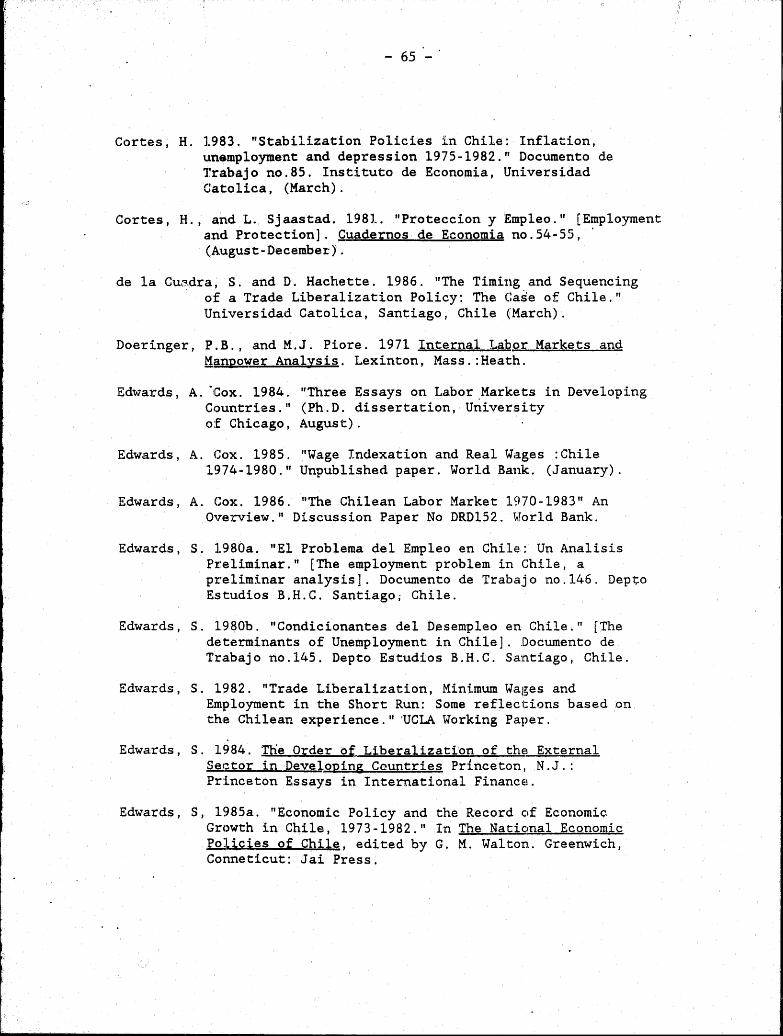
- 65 -
Cortes, H. 1983. "Stabilization Policies in Chile: Inflation, unemployment and depression 1975-1982." Documento de Trabajo no.85. Institute de Economia, Universidad Catolica, (March).
Cortes, H., and L. Sjaastad. 1981. "Proteccion y iE:mpleo." [Employment a.nd Protection]. Cuadernos de Economia no. 54-55, · (August-December).
de la Cu~.dra, S. and D. Hachette. 1986. "The Timing and Sequencing of a Trade Liberalization Policy: The Case of Chile." Universidad Catolica, Santiago, Chile (March).
Doeringer, P.B., and M.J. Piore. 1971 Internal Labor Markets and Manpower Analysis. Lexinton, Mass.:Heath.
Ed'\o7ards, A. ·cox. 1984. "Three Essays on Labor .Markets in Developing Ct:>untries." (Ph. D. dissertation, University of Chicago, August).
Edwards, A. Cox. 1985. "Wage Indexation and Real Wages :Chile 1974-1980." Unpublished paper. World Bank. (January).
Edwards, A. Cox. 1986. "The Chilean Labor Market 1970-1983" An Overview." Discussion Paper No DRD152. ~Torld Bank.
Edwards, S. 1980a. "El Problema del Empleo en Chile: Un Analisis Pt:eliminar." [The employment problem in Chj .. le, a preliminar analysis]. Documento de Traba.jo no.l46. Dept;:o Estudios B.H.C. Santiago; Chile.
Edwards, S. 1980b. "Condicionantes del Desempleo en Chile. 11 [The determinants of Unemployment in Chile] . .Documento de Trabajo no.l45. Depto Estudios B.H.C. Santiago, Chile.
Edw·ards, S. 1982. "Trade Liberalization, Minimum Wages and Employment in the Short Run: Some reflec 1:ions based ,on the Chilean experience." ·ucLA Working Paper.
Edwards, S. 1'984. The Order of. Liberalization of the~ External Set:.tor in Developing Countries Princeton, N.J.: Princeton Essays in International Finance!.
Edwards, S, 198Sa. "Economic Policy and the Record ctf Economic. Gr()wth in Chile, 1973-1982." In The Natic•nal Economic Policies of Chile, edited by G. M. Walton. Greenwich, Conneticut: Jai Press.
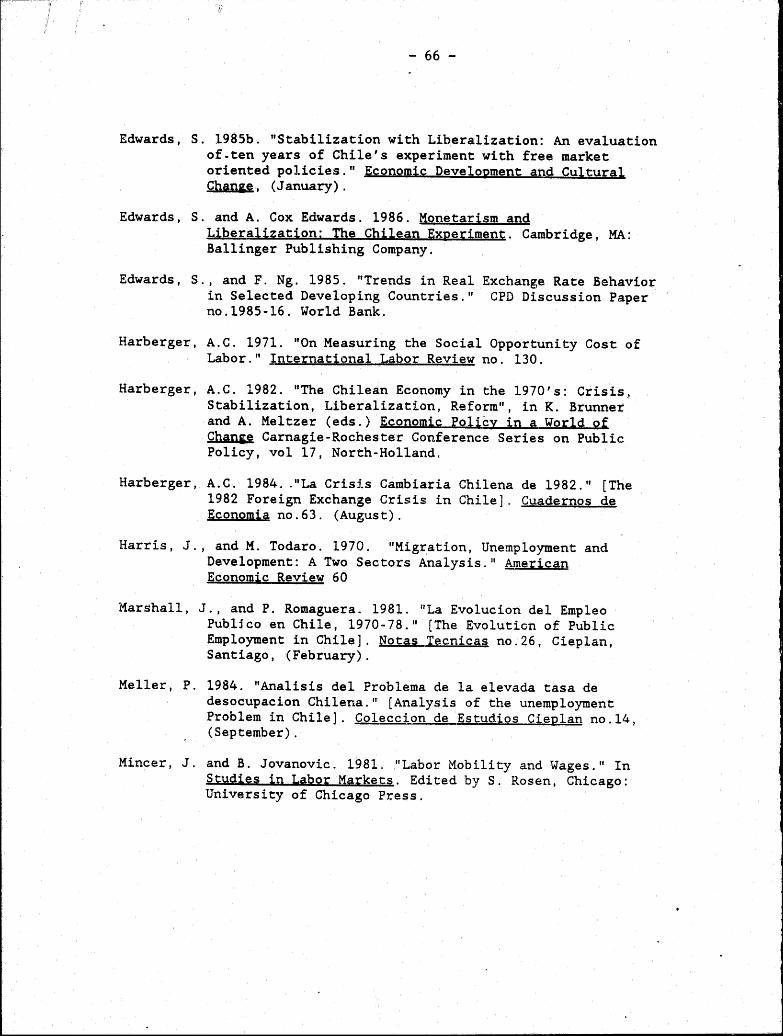
cf I
I
- 66 -
Edwards, S. 1985b. "Stabilization with Liberalization: An evaluation of-ten years of Chile's experiment with free market oriented policies." Economic Development and Cultural Chan&e, (January).
Edwards, S. and A. Cox Edwards. 1986. Monetarism and Liberalization: Tbe Chilean Experiment. Cambridge, MA: Ballinger Publishing Company.
Edwards, S., and F. Ng. 1985. "Trends in Real Exchange Rate Behavior in Selected Developing Countries." CPD Discussion Paper no.1985-16. World Bank.
Harberger, A.C. 1971. "On Measuring the Social Opportunity Cost of Labor." Jnternational Labor Review no. 130.
Harberger, A.C. 1982. "The Chilean Economy in the 1970's: Crisis! Stabilization, Liberalization, Reform", inK. Brunner and A. Meltzer (eds.} Economic Policy in a World of Chan&e Carnagie-Rochester Conference Series on Public Policy, val 17, North-Holland.
Harberger, A.C. 1984 .. "La Crisj.s Cambiaria Chilena de 1982." [The 1982 Foreign Exchange Crisis in Chile]. Cuadernos de Economia no.63. (August).
Harris, J., and M. Todaro. 1970. "Migration, Unemployment and Development: A Two Sectors Analysis. 11 American Economic Review 60
Marshall, J., and P. Romaguera. 1981. "La Evolucion del Empleo Publjco en Chile, 1970-78." [The Evolution of Public Employment in Chile]. Notas Tecnicas no.26, Cieplan, Santiago, (February).
Meller, P. 1984. "Analisis del Problema de la elevada tasa de desocupacion Chilena." (Analysis of the unemployment Problem in Chile]. Coleccion de Estudios Cieplan no.l4, (September).
Mincer, J. and B. Jovanovic. 1981. "Labor Mobility and Wages." In Studies in Labor Markets. Edited by S. Rosen, Chicago: University of Chicago Press.
- 67 -
Oi, W. 1962. "LaLbor as a Quasi-Fixed Factor." Journal •2-f Political Economy 70 (December).
Oi, W. 1986. "EJl[lployment Rela.tions in Dual Labor Marke·ts". Unpublished manuscript, presented at the UCLA Workshop in Labor Economics. (May).
Paldam, M. and L. Riveros. 1986. "Minimum TJages and Av,erage Wages, Analyzing the Causality: the cases of Argentina, Brazil and Chile". Paper pres~nted at the Conference on Labor Markcats Adjustment, World Bank, Washington D.C. June 26-27.
Riveros, L. 1984. "Un Anal isis sobre el Problema del E:mpleo en Chile en la decada del 70." [Analysis of the Employment Problem in Chile during the 70s]. Estudios de Economia no.23, (October).
Schmidt-Hebbel, K. 1981. "El Programa del Empleo Minimo en Chile." [The Minimum Employment Program ir Chile]. Departamento de Estudios B.H.C. Documento no.·ls~. Santiago, Chile.
Stiglitz, J. 1974. "Wage Determination and Unemp.~..uy,uent in LDCs" Quarterly Journal of Economics 88. (May).
Stiglitz, J. 1982. "Alternative Theories of Wage Determination and Unemployment: The Efficiency Wage Model" Iu The Theory ~xperience of Economic Development. Essays in Honor of Sir W.A. Lewis. Edited by M. Gersovitz, et al. Londcm: George Allen and Urwin.
Tockman, V. 1984·. "Reactivacion con Transformacion, el efecto empleto." [Recovery with Reforms, the employment effect]. QQ.W:cion Estudios Cieplan no.14.
World Bank. 1980. Chile: An Economy in Transition. A World Bank Country Study. Washington, D.C.
Yanez, J. 1978. "Una Correccion del Indice de Precios al Consumidor durante el periodo 1971-1973." [A correction of the Consumers' Price Index for the 1971-1973 period]. In pomentarios sobre 1a Situacion Economica, Universidad de Chile, (2nd semester).
Some Recent DRD Discussion Papers
211. On the Excess Burden of Tax Evasion, by s. Yitzhaki.
212. Public Finance for Market-Oriented Developing Countries, by A. Lindbeck.
213. Building Agricultural Research Capacity: India's Experience with the Rockefeller Foundation and its Significance for Africa, by U. Lele.
214. Export Mix Adjustment to the Imposition of VERs: Alternative License Allocation Schemes, by T. Bark and J. de Melo.
215. The Political Economy of Industrialization in Primary Product Exporting Economies: Some Cautionary Tales, by D. Lal.
216. Markets, Mandarins and Mathematicians, by D. Lal.
217. Foreign Trade Regimes and Economic Growth in Developing Countries, by D. Lal and S. Rajapatirana.
218. Ideology and Industrialization in India and East Asia9
by D. Lal.
219. Minimum Wages and Average Wages, Analyzing the Causality: The Cases of Argentina, Brazil & Chile, by M. Paldam and L.A. Riveros.
220. The VAT and Financial Services, by M. Gillis.
221. The Value Added Tax in Korea, by S.S. Han.
222. Lessons from the Brazilian Experience with the VAT, by C,. Longo.
223. The Tax Treatment of Farmers and Small Firms under Value Added Taxes, by J. Due.
224. Value Added Taxation and Real Estate, by R.F. Conrad •
.225. The Value-Added Tax: Revenue Inflation and the Foreign Trade Balance, by A.A .. Tait.
:226. VAT, Income Distribution, and Tax Incidence, by C.E. McLu'l~e.
227. The Value-Added Tax in the Cote d'Ivoire, by B. Heian.
228. Development of a Value Added Tax in Colombia, by G. Perry, A.L. 0. de Triana Mejia.
22 9. Strike and Lock..,out Threats and Fiscal Policy, by A. Lindb1!!ck and D. Snower.
:230. An Intercountry Analysis of Employment and Returns to Labor in Agriculture, by Y. Kislev and P. Siegel.