JWttIJE - World Bank Documents
195
_ JWttIJE nergy Secor Management Assistance Programme Ecuador Energy Pricing, Subsidies and Interfuel Substitution ReportNo. 11798-EC Public Disclosure Authorized Public Disclosure Authorized Public Disclosure Authorized Public Disclosure Authorized
-
Upload
khangminh22 -
Category
Documents
-
view
0 -
download
0
Transcript of JWttIJE - World Bank Documents

_ JWttIJE nergy Secor Management Assistance Programme
EcuadorEnergy Pricing, Subsidies and
Interfuel SubstitutionReport No. 11798-EC
Pub
lic D
iscl
osur
e A
utho
rized
Pub
lic D
iscl
osur
e A
utho
rized
Pub
lic D
iscl
osur
e A
utho
rized
Pub
lic D
iscl
osur
e A
utho
rized

JOINT UNDP / WORLD BANKENERGY SECTOR MANAGEMENT ASSISTANCE PROGRAMME (ESMAP)
PURPOSE
The Joint UNDPtWorld Bank Energy Sector Management Assistance Programme (ESMAP) waslaunched in 1983 to complement the Energy Assessment Programme, established three years earlier.ESMAP's original purpose was to implement key recommendations of the Energy Assessmentreports and ensure that proposed investments in the energy sector represented the most efficient useof scarce domestic and external resources. In 1990, an international Commission addressedESMAP's role for the 1990s and, noting the vital role of adequate and affordable energy ineconomic growth, concluded that the Programme should intensify its efforts to assist developingcountries to manage their energy sectors more effectively. The Commission also recommended thatESMAP concentrate on making long-term efforts in a smaller number of countries. TheCommission's report was endorsed at ESMAP's November 1990 Annual Meeting and prompted anextensive reorganization and reorientation of the Programme. Today, ESMAP is conducting EnergyAssessments, performing preinvestment and prefeasibility work, and providing institutional andpolicy advice in selected developing countries. Through these efforts, ESMAP aims to assistgovernments, donors, and potential investors in identifying, funding, and implementing economicallyand environmentally sound energy strategies.
GOVERNANCE AND OPERATIONS
ESMAP is governed by a Consultative Group (ESMAP CG), composed of representatives of theUNDP and World Bank, the governments and institutions providing financial support, andrepresentatives of the recipients of ESMAP's assistance. The ESMAP CG is chaired by the WorldBank's Vice President, Finance and Private Sector Development, and advised by a TechnicalAdvisory Group (TAG) of independent energy experts that reviews the Programme's strategicagenda, its work program, and other issues. ESMAP is staffed by a cadre of engineers, energyplanners and economists from the Industry and Energy Department of the World Bank. TheDirector of this Department is also the Manager of ESMAP, responsible for administering theProgramme.
FUNDING
ESMAP is a cooperative effort supported by the World Bank, UNDP and other United Nationsagencies, the European Community, Organization of American States (OAS), Latin AmericanEnergy Organization (OLADE), and countries including Australia, Belgium, Canada, Denmark,Germany, Finland, France, Iceland, Ireland, Italy, Japan, the Netherlands, New Zealand, Norway,Portugal, Sweden, Switzerland, the United Kingdom, and the United States.
FURTHER INFORMATION
For further information or copies of completed ESMAP reports, contact:
ESMAPc/o Industry and Energy Department
The World Bank1818 H Street N.W.
Washington, D.C. 20433U.S.A.

ECUADOR:
Energy Pricing, Subsidies and Interfuel Substitution
August 1994
This Study was carried out between June and December 1992,mostly in Ecuador, by a group of national and internationalconsultants and World Bank/ESMAP staff. It is one of anumber of studies carried out under ESMAP to contribute tothe analysis of issues and help improve the performance ofEcuador's energy sector. This Study is cofinanced by theWorld Bank, UNDP and the Government of the Kingdom ofBelgium.


ECUADOR:Precios de la Energia, Subsidios y Sustituci6n de Combustibles
Agosto 1994
Este documento tiene distribuci6n restringida y puede ser usado s6lo por quieneslo reciben en el desempefio de sus obligaciones oficiales. De lo contrario sucontenido no puede ser divulgado sin la autorizaci6n del PNUD y del BancoMundial.


ABBREVIATIONS AND ACRONYMS
BEICIP Consulting arm of the French Petroleum InstituteESMAP Energy Sector Management Assistance ProgramGLP Gas Licuado de Petroleo-Liquified Petroleum GasLPG Liquified Petroleum GasGDP Gross Domestic ProductCIF Cost, Insurance and FreightLRMC Long Run Marginal CostINECEL Ecuadorean Electrification Institute (State Power Utility)EMELEC Empresea Electrica del Ecuador (Guayaquil Power Distribution
Company)CAF Corporacion Andina de FomentoSRMC Short Run Marginal CostLOAFYC Ecuadorean Law of Public Finance and ProcurementFOB Free on BoardOLADE Organizacion Latinoamericana de EnergiaPNUD Programa de Naciones Unidas para el Desarrollo (UNDP)BCE Banco Central del EcuadorNFPS Non-Financial Public SectorMEM Ministry of Energy and Mines
EXCHANGE RATES
1992 S/1500 per US Dollar1993 S/1800 per US DollarJuly 1994 S/2150 per US Dollar
CONVERSION FACTORS
LPG 1.14 kgoe/kgFirewood 0.30 kgoe/kgCharcoal 0.690 kgoe/kgAgricultural Residues 0.20 kgoe/kgGasoline 2.9071 kgoe/galKerosene 3.1643 kgoe/galElectricity 0.086 kgoe/kWh


CONTENTS
Page
INTRODUCTION ............................................... iEXECUTIVE SUMMARY ........................................ iiiINTRODUCCION ............. ................................. xRESUMEN EJECUTIVO ........................................ xii
ANALYSIS OF ENERGY, PRICES, SUBSIDIES AND STATE REVENUES .... 1Introduction ............................................. 1Oil Products ............................................. 2Electric Power Tariffs ...................................... 7Subsidies on Consumption of Petroleum Products and Electricity .... ... 10Subsidies on Oil Products ................................... 11Subsidies on Electricity .................................... 12Alternate Calculation of Subsidy on Oil Products .................. 14Impact of Oil Products and Power Tariff Increases
on Production Costs and on the Price Index ................. 15Oil ............ ................................. 15Power ........................................... 16
State Revenues From oil Product Salesin the Domestic Market and Exports ...................... 17
II. ELIMINATION OF OIL AND POWER SUBSIDIES: IMPACTS OFFISCAL DEFICIT, MONEY SUPPLY AND INFLATION .19
Introduction .19The Results .21The Measurements .23
A. Adjustments in Fiscal Deficit .23B. Measurement of the Monetary Impact .24C. Measurement of the Deflationary Impact .24
Conclusion .26
III. POWER: PERFORMANCE, RECENT DEVELOPMENTS AND NEED FOR POLICYAND SUBSECTORAL REFORMS .28
Introduction .28Sector Overview .28
Institutional Framework and Regulatory Structure .28Sector Development and Infrastructure .30Markets .31Sector Performance .32Sector Expansion Program .33Tariffs .34Subsidies .37

Conclusions ........... ............................ 39Policy Reforms . ......................................... 40
Tariffs . .......................................... 40Optimal Tariffs ..................................... 40Responsible Electricity Pricing .......................... 41Tariff Design ...................................... 42Policy Reforms: Institutional Issues, Ideas and
Guidelines for Power Subsector Reforms ............... 42Excessive Politization ................................ 43Highly Constraining Administrative Procedures .............. 43
Insufficient Tariffs ................................ 43Overlap of Operational and Regulatory Activities
Undertaken by INECEL ............................ 44Powerful Impact of Trade Unions
and Low Efficiency ............................... 44Inadequate Legal Framework ........................... 44Basic Ideas on Restructuring ........................... 45The Electric Power Industry, an Industry Like any Other .... ... 45Relationship between the Electric Power Distribution
Companies (EE) and INECEL ........................ 45Reciprocal Debts Between INECEL and the
Distribution Companies ............................ 46Investments of the Distribution Companies ................. 46Opening up the Distribution Companies to other Shareholders ... . 46INECEL'S Focus on Generation and Transmission Activities ..... 47Institutional Reforms and Restructuring .................... 47An Autonomous and Highly Competent Regulation .... ........ 48Description of the Regulator's Main Duties or Prerogatives .... .. 48Punctual and/or Specific Issues .......................... 49Dialogue with the Trade Unions ......................... 49Conclusions ........... ............................ 49
IV. HYDROCARBONS ............................................ 51Introduction ............................................ 51Overview .............................................. 51Price Policies ........................................... 53Marketing of Kerosene (KEREX) ............................. 54Social Impact ........................................... 55Deregulation/Privatization of the Hydrocarbons Subsector .... ........ 56Reserves and Exploration: Current Situation ...................... 57Prospects .............................................. 58Production: Current Situations . .............................. 58Prospects .............................................. 58Production Scenarios ...................................... 59Tertiary or Enhanced Recovery .............................. 60Prospects .............................................. 61

Environmental Aspects . ..................................... 62
Petroleum Refinery and Related Issues: ........................ 62
Conclusions . ...................................... 62
Recommendations ............. ...................... 63
Background . ...................................... 64
Ecuador's Refinery and Supply Strategy ..... .............. 65
Beicip Proposals . ................................... 69
Synthetic Crude Proposal ......... ..................... 71
Net Refining Margins, MM$/year ....... ................. 72
Gasoline Quality Improvement .......................... 73
ANNEXES
1 Power: Optimal Tariff and Responsible Energy Pricing: a Fuller
Discussion ..... 75
2 Power: Tariff Design: Critique and Implementation of
New Bank-Financed Tariff Study .80
3 Power: Calculation of Incremental Generating Costs .84
4 Elimination of Oil and Power Subisidies:Impacts on Fiscal Deficit, Money Supply and Inflation .... ..... 86
5 Pricing and Marketing of Kerosene (Investigaci6n sobre
el Precio del Kerex) ............. 106
Tables and Calculations
I Internal Prices Calculated Using CIF PlusMarketing Costs and Margins .120
2 Revenues from Oil Product Sales in the Internal Market .120
3 Revenues from Oil Product Sales in the Internal Market .121
4 Revenues from Oil Product Sales in the Internal Market .122
5 Ingresos por Concepto de Ventas de Derivados del Petroleo
en el Mercado Interno .123
6 Subsidy Estimate to Electricity Consumption .124
7 Subsidy Estimate to Electricity Consumption .127
8 Subsidy Estimate to Electricity Consumption .128
9 Increase of Sectoral Costs as a Result of Rise in the Average
Price of Oil Products ............. 133
10 Increase of Sectoral Costs as A Result of the Rise
of Electriciy Tariffs .134
11 Revised Least Cost Capacity Expansion (1997-2008) .135
12 Power Generation by Source (GWh) .136
13 Peak Demand and Available Energy by DistributionCompany (December 1991) .137
14 Average Annual Rates of Increase in Electricity Consumption .138
15 Average Tariffs by Sector .................................. 139

16 Average Cost of Electricity Supply by System Level (March 1992) ...... 14017 Inecel's Supply Costs by System, Season and Load (March 1992) ...... 141
Petroleum
18 Fields in Production, without Additional Investment .14219 Fields in Production - Programmed Investment - New Fields
Partially Incorporated (Middle Production Scenario) .14320 Fields in Production - Programmed Investment - New Fields
Totally Incorporated (High Production Scenario) .14421 Current Estimated Refining Economics .14522 La Peninsula Refinery, Oriente, Versus Synthetic Crude .14623 Distribuci6n Trimestral de Kerex por Ciudades .14724 Consumo de Kerex y Diesel 1 .14725 Venta de Kerex en las Ferias Libres de Quito .14826 Precio del Kerex en las Ferias Libres en Puestos Fijos .14827 Consumo de Combustibles en el Sector Domestico: 1982 .... ......... 14928 Consumo de Combustibles en el Sector Domestico: 1990 .... ......... 15029 Consumo de Combustibles en el Sector Domestico: 1990 .... ......... 15130 Consumo de Combustibles en el Sector Domestico: 1982 .... ......... 15131 Consumo de Combustibles en el Sector Domestico: 1991 .... ......... 15132 Volumen en Galones y Puestos de Distribuci6n de Kerex .15233 Venta de Kerex en las Ferias y Oferta Te6rica .152

CONTENIDO
INTRODUCCION .............................................. xRESUMEN EJECUTIVO ........................................ xii
ANALISIS DE LOS PRECIOS DE LA ENERGIA, SUBSIDIOS EINGRESOS PUBLICOS .......................................... 1
Introducci6n ............................................. 1Derivados del Petr6leo ...................................... 2Tarifas de Energia El6ctrica .................................. 7Subsidio al Consumo de los Derivados del
Petr6leo y la Electricidad ............................. 10Subsidios a los Derivados del Petr6leo .......................... 11Subsidios a la Electricidad .................................. 12Calculo Alternativo del Subsidio a los
Derivados del Petr6leo ................................ 14Impacto del Aumento de los Precios de los Derivados del Petr6leo y de
las Tarifas de la Electricidad en los Costos de Producci6n y elIndice de los Precios ................................ 15
Petr6leo ......................................... 15Electricidad ....................................... 16
Ingresos Estatales por la Venta de los Derivados del Petr6leo en el MercadoDom6stico y Exportaciones .................. 17
II. ELIMINACION DE LOS SUBSIDIOS AL PETR6LEo Y LA ELECTRICIDAD:IMPACTOS EN EL DEFICIT FISCAL, OFERTA MONETARIA E INFLACI6N 19
Introducci6n ............................................ 19Los Resultados ... ...... 21Las Medidas ... ...... 23
A. Ajustes en el Deficit Fiscal ......... ................. 23B. Mediaci6n del Impacto Monetario ....... .............. 24C. Mediaci6n del Impacto deflacionario ...... ............. 24
Conclusi6n ....................................... 26
Ill. ELECTRICIDAD: DESEMPENO, DESARROLLOS RECIENTES, Y NECESIDADDE REFORMAS DE POLITICA Y SUBSECTORIALES ..... ............ 28
Introducci6n ....................................... 28Panorama del Sector ...................................... 28
Marco Institucional y Estructura Regulatoria ..... ........... 28Desarrollo del Sector e Infraestructura ....... .............. 30Mercados ...................................... 31Desempefio del Sector . ............................... 32Programa de Expansi6n del Sector ....... ................ 33

Tarifas ........................................... 34Subsidios ................... ...................... 37Conclusiones ....... ........ .. ..................... 39
Reformas Poifticas ........................................ 40Tarifas ........................................... 40Tarifas Optimas ....... ....... .. .................... 40Fijaci6n Responsable de Precios de la Electricidad .... ........ 41Diseiio de Tarifas ....... ....... .. ................... 42Reformas de Poifticas: Asuntos Institucionales, Ideas y Lineamientos
para las Reformas en el Subsector Electrico .... ........ 42Politizaci6n Excesiva ...................................... 43Procedimientos Administrativos Altamente Impeditivos .............. 43Tarifas Insuficientes ....................................... 43Sobreposici6n de Actividades Operacionales y Regulatorias
Empedidas por INECEL .............................. 44Influyente Impacto de los Sindicatos y Bajo Rendimiento .... ........ 44Marco Legal Inadecuado ................................... 44Ideas Basicas de Reestructuraci6n ............................. 45La Industria de la Energia El6ctrica, una Industria
como Cualquier Otra ................................ 45Relaci6n entre las Compafifas de Distribuci6n de EnergfaEl6ctrica (EE) e INECEL ................................... 45Deudas Reciprocas entre INECEL y las
Empresas de Distribuci6n (EE) .......................... 46Inversiones de las EE's .................................... 46Apertura de las Empresas de Distribuci6n
a otros Accionistas .................................. 46Enfoque de INECEL hacia las Actividades
de Generaci6n y Transmisi6n .......................... 47Reformas Institucionales y Reestructuraci6n ...................... 47Una Regulaci6n Aut6noma y Altamente Competente ............... 48Descripci6n de los Principales Deberes
o Prerrogativas de los Reguladores ....................... 48Asuntos Puntuales y/o Especificos ............................. 49Diflogo con los Sindicatos .................................. 49Conclusiones ........................................... 49
IV. HIDROCARBUROS ........................................... 51
Introducci6n ............................................ 51Panorama .............................................. 51Polifticas de Precios ....................................... 53Mercado del Querosen (kerex) ............................... 54Impacto Social .......................................... 55Deregulaci6n/Privatizaci6n del Subsector de Hidrocarburos .... ....... 56Reservas y Exploraci6n: Situaci6n Acutal ....................... 57

Perspectivas 58Producci6n: Situaci6n Acutal ................................ 58Perspectivas .............. .............................. 58Escenarios de Producci6n ................................... 59Recuperaci6n Terciaria o Mejorada ............................ 60Perspectivas .............. .............................. 61Aspectos Ambientales ..................................... 62Refinaci6n de Petr6leo y Asuntos Relacionados: ................... 62
Conclusiones ...................................... 62Recomendaciones ................................... 63Antecedentes ...................................... 64Estrategia de Refinaci6n del Ecuador ...................... 65Propuestas de Beicip ................................. 69Propuesta de Crudo Sintetico (o reconstituido) .... ........... 71Margenes Netos de Refinaci6n, $MM por Aflo .... ........... 72Mejoras en la Calidad de la Gasolina ..................... 73
ANEXOS
1 Electricidad: Tarifa Optima y Fijaci6n Responsable de los Precios de la Energfa:Una Discusi6n mas Profunda ................... 75
2 Electricidad: Disefio de Tarifas: Critica e Implementaci6n de un Nuevo Estudio deTarifas Financiado por el Banco Mundial .80
3 Electricidad: Calculo de los Costos Incrementales de Generaci6n .844 Eliminaci6n de los Subsidios al Petr6leo y la Electricidad: Impactos sobre el Deficit
Fiscal, Oferta Monetaria e Inflaci6n ......... ............... 865 Precio y Mercadeo del Querosen
(Investigaci6n sobre el Precio del Kerex) ............................ 106
Cuadros y Cdlculos
1 Precios Domesticos Calculados UtilizandoCIF mas Costos de Mercadeo y Margenes ............................ 120
2 Ingresos por Ventas de los Derivados delPetr6leo en el Mercado Intemo ..................... 120
3 Ingresos por Ventas de los Derivados delPetr6leo en el Mercado Intemo ..................... 121
4 Ingresos por Ventas de los Derivadosdel Petr6leo en el Mercado Intemo ......... ............... 122
5 Ingresos por Ventas de los Derivados delPetr6leo en el Mercado Intemo .123
6 Estimativo del Subsidio al Consumo de Electricidad .1247 Estimativo del Subsidio al Consumo de Electricidad .1278 Estimativo del Subsidio al Consumo de Electricidad .1289 Incremento en los Costos Sectoriales como Resultado del Aumento en el
Precio Promedio de los Derivados del Petr6leo ........... .............. 133

10 Incremento en los Costos Sectoriales como Resultado del Aumentoen las tarifas de la Electricidad ............ ............... 134
11 Programa Revisado de Expansi6n de Capacidada Costos Minimos (1997-2008) .135
12 Generaci6n Electrica por Fuente (GWh) .............................. 13613 Demanda Pico y Energfa Disponible por Empresa
de Distribuci6n (diciembre 1991) ...................... 13714 Promedio de Tasas Anuales de Aumento en
el Consumo de Electricidad ...................................... 13815 Tarifa Promedio por Sector ....................................... 13916 Costo Promedio de Oferta de Electricidad
por Nivel en el Sistema (marzo 1992) ............................... 14017 Costo de Oferta de INECEL por Sistema,
Estaci6n y Carga (marzo 1992) .................................... 141
Petr6leo
18 Campos en Producci6n, sin Inversi6n Adicional ........................ 14219 Campos en Producci6n-Inversi6n Programada-Nuevos Campos Incorporados
Parcialmente (Altemativa de Producci6n Media) ........................ 14320 Campos en Producci6n-Inversi6n Programada-Nuevos Campos Incorporados
Totalmente (Altemativa de Producci6n Alta) ........................... 14421 Estimativos Corrientes de la Economfa de la Refinaci6n .................. 14522 Refinerfa La Peninsula, Oriente versus Crudo Sint6tico ................... 146
Distribuci6n del Queros6n
23 Distribuci6n Trimestral de Kerex por Ciudades ......................... 14724 Consumo de Kerex y Diesel ...................................... 14725 Venta de Kerex en las Ferias Libres de Quito .......................... 14826 Precio del Kerex en las Ferias Libres en Puestos Fijos .................... 14827 Consumo de Combustibles en el Sector Dom6stico: 1982 .14928 Consumo de Combustibles en el Sector Domestico: 1990 .15029 Consumo de Combustibles en el Sector Domestico: 1982 .15130 Consumo de Combustibles en el Sector Domestico: 1982 .15131 Consumo de Combustibles en el Sector Dom6stico: 1991 .15132 Volumen en Galones y Puestos de Distribuci6n del Kerex ..... ............ 15233 Volumen en Galones y Puestos de Distribuci6n del Kerex ..... ............ 152

Introduction
INTRODUCTION
1. The goal of this Study is to analyze how energy prices (those ruling until September
1992) could be raised to cover their economic costs and what effect this would have on the
economy, on the level and structure of consumption, and on the welfare of (especially) low-
income consumers. The adjustments that were required are substantial, not gigantic but they
would still have important positive effects on public finances (on the fiscal deficit and its
financing, thereby lowering inflation) and on economic efficiency (improvement in resource
allocation). The price adjustments would cause modest increases in costs of production in
general and have some negative effects on the welfare (and on the budgets) of low-incomeconsumers (especially urban and rural low-income communities, women and children). The
effect of higher prices on household budgets are being analyzed through a survey conducted in
late 1992, whose results are presented and analyzed in a companion report, to be issued in the
near future.
2. Very little hard data were available about the energy consumption habits of low-incomehouseholds in Ecuador, although studies in other Latin American countries could be considered
broadly representative. A recently completed joint OLADE/ESMAP report on energy pricing in
Latin America concludes that the share of energy subsidies accruing to low-income consumers
is typically small because the consumption of LPG, most petroleum products (except for
kerosene) and electricity is highly correlated with incomes. A survey of energy consumption
(national, urban, and rural) commissioned by ESMAP appears to support the above conclusion
also for Ecuador.
3. Since this Study was initiated, the government of Ecuador made important changes in the
prices of energy products (on September 4, 1992 and in May 1993) which have gone a long way
toward resolving the main issue analyzed in this report. While an effort has been made to clearly
label "prices" as referring to either before or after the adjustment, this may not have been done
everywhere. Generally, however, the context will make clear whether the "prices" referred to are
those before or after the adjustment. Electric power tariffs were adjusted a second time, in May1993.
4. The government of Ecuador cooperated fully with the study team. The team wishes to
thank the Ministry of Energy and Mines (especially the Subsecretariates for Hydrocarbons andElectrification) Petroecuador and its subsidiaries, INECEL and its main departments and INE, the
National Energy Institute. The team would also like to express its gratitude to the Government
of Belgium who cofinanced this Study and to UNDP Quito for managing Study funds expendedin Ecuador.

ii Ecuador: Energy Pricing, Subsidies and Interfuel Substitution
5. The team that carried out the Study consisted of:
-Ms. Ines Mencfas, Energy Economist, Coordinator of National Consultants;
-Mr. Oswaldo Boada, Power Engineer, Power Restructuring;
-Mr. Guillermo Chulde, Economist, Study of Kerosene Marketing;
-Mr. Alvaro Morales, Mechanical Engineer, statistics and computation;
-Mr. Marcelo Jaramillo Carrera, Power Engineer, revised some technical points on electricpower.
International Consultants
-Mr. Robert G. Grosman, Member of th EC study group for restructuring of the electricpower industry in Europe, who participated in the drafting of the section dealing withelctricity reforms.
-Mr. Jean Roger Dreze, Economist, who estimated the macroeconomic impact of changesin energy prices;
-Mr. John Shillingford, Chemical Engineer, Specialist in petroleum refining;
-Mr. Joao Baptista, Power Engineer, who made a critical review of INECEL's recentlycompleted tariff study;
World Bank Staff
-Mr. Douglas Barnes, Energy Planner, ESMAP/Survey Specialist;
-Mr. Witold Teplitz-Sembitzky, Senior Energy Economist,Department of Industry and Energy;
-Mr. Michel Del Buono, Senior Economist, ESMAP/Team Leader.
6. Principal authors of this report are Michel Del Buono, Witold Teplitz-Sembitzky and InesMencfas. Mmes. Patricia Viscaino de Andrade, Valerie Valdiviezo Genicq, Lisa Klein andMonica Rodriguez contributed to the report with editing, translation and word processingassistance. Sylvia Lanzetta assisted with tranlation into Spanish and editing. Finally, the teamwould like to thank our colleagues in the Quito World Bank Liaison Office, Ms. Rocfo deMontalvo and Mr. David Salgado for their invaluable support.

Executive Summary iii
EXECUTIVE SUMMARY
1. This report was written to assist the new Ecuadorean Government which took office on
August 10, 1992, in taking urgent, important decisions with respect to energy pricing and energy
sector reforms. Energy subsidies in Ecuador have been large, persistent and their social effect
had never been verified, although the main justification for low prices had always been that they
helped the poor. This subsidization policy has had a 20-year history; the first steps away from
it were taken on September 4, 1992 with substantial price increases for oil products and
electricity.
2. Low energy prices, and the concomitant subsidy (i.e. negative taxes), however, had an
obvious impact on macroeconomic performance. In any given year, energy subsidies typically
exceeded the Consolidated Public Sector Deficit (for example, in recent years, the Consolidated
Public Sector Deficit has varied between 1% and 4% of GDP; for 1991 the estimate of energy
subsidies exceeds US$600 million or about 6% of GDP). Without access to external savings
(except through the incurring of arrears) and with difficult and costly internal borrowing, a maijor
share of the Consolidated Public Sector Deficit has historically been financed through monetary
emission. These causes largely explain the stubborn rate of inflation, varying between 50% and
80% p.a., that has existed during most of the last decade.
3. The rationale behind this report's recommendation to essentially eliminate energy
subsidies is threefold:
(a) The energy subsidies were, by and large, regressive (i.e., they helped the rich more than
the poor); data from a recent ESMAP study of power losses show the highly regressive
nature of electric power subsidies (see paragraph 1.32); as for oil products, the results of
survey that has been recently taken broadly support this statement.
(b) The elimination of energy subsidies would go a long way toward reducing, if not
eliminating the, generally small, structural public sector deficit and its associated,
persistent rate of inflation.
(c) Efficiency gains, on both the demand and supply sides would accrue from the setting of
energy prices closer to economic costs. Furthermore, energy conservation would, in the
short run, allow exports to grow (and higher prices would discourage the heavy smuggling
of refined products to Colombia and Peru) and, in the longer run, stretch out Ecuador's
crude oil reserves into the future. Environmental benefits would also be realized if less
energy were to be produced and consumed for any given growth rate and/or level of GDP.

iv Ecuador: Energy Pricing, Subsidies and Interfuel Substitution
The Incidence of Energy Subsidies
4. Energy Consumption subsidies in 1991 are estimated at $624 million annually, with about$400 million on petroleum products and about $223 million on electric power. The total subsidyto power users was about US$223 million and the subsidy per connection per annum wasUS$1,092 for residential consumers using 1000 kWh/month or more, versus US$21.6 for thoseusing less than 80 kWh/month. Mission calculations show that up until July of 1992 a majorshare of electric power subsidies (US$68 million out of a total of US$128.2 million for allresidential users) accrued to middle- and high-income households. After the tariff increase ofSeptember 1992, the total subsidy to power users was reduced to US$104.8 million per year, ofwhich the lion's share (that is, 100%) went to residential users. As for petroleum, calculationsmade for this report (see Chapter I, paragraphs 1-26.9 and Annex Tables 1-7) show that in 1991,the subsidy to internal consumption of petroleum derivatives was estimated at about US$400million, equivalent to 4% of GDP, about equal to the total public sector deficit for that year.After the September pricing measures, the subsidy was eliminated in global terms (averageinternal, tax-inclusive prices now exceed the CIF values) and although a substantial subsidyremains on LPG and kerosene, it is more than offset by surpluses on other products, notablygasolines. As for the social impact, studies in neighboring countries show that, except forkerosene, subsidies correlate strongly with income and are thus regressive. A survey of energyconsumption was commissioned to obtain empirical data on the consumption of energy(especially modern fuels) by Ecuador's poor households. The survey is almost complete, and itspreliminary results confirm those obtained in neighboring countries. The full results of thesurvey are presented in a companion Report to be issued shortly.
New Pricing Measures
5. With the new pricing measures enacted in September 1992, subsidies on oil consumptionas a whole were eliminated and a surplus of US$3.4 million has emerged (only LPG, fuel oil andkerosene consumption are receiving a cross subsidy of about US$90 million, US $3.3 million andUS $5.1 million respectively,' financed from higher prices of gasoline). While the measures takenrepresent a substantial step in the right direction, much still remains to be done. With the furthergasoline price increase of February 1994 and the recent decline in world oil prices, averageinternal oil prices are now above the former. In power, the structure of tariffs needs to bechanged to reflect the cost of service to different users, although the level of tariffs after theSeptember 92 measures is close to 75% of LRMC. After the adjustment of May 93, tariffs areclose to LRMC but their structure is not. This Report strongly recommends the implementationof the tariff system proposed in the recently completed Bank-financed tariff study. While this
' It should be noted that these magnitudes are only approximations as there are noreally accurate data on internal marketing costs. Furthermore, these magnitudes arechanging daily (i.e. the surplus is being reduced) pari-passu with the depreciation of theSucre and the variation in world prices of oil and oil derivatives.

Executive Summary v
report suggests some methodological improvements (see Annexes I, II and III), they representrefinements but do not imply that the implementation of the new tariff methodology should bedelayed. In the case of petroleum products, the average price is now above the opportunity costs(US$0.63/gallon versus US$0.57/gallon CIF value plus internal marketing costs) but the problemof household fuels has not been well thought out, especially in relation to the problems of low-income households. While the new price for LPG cut the subsidy, the fact that low-incomeconsumers are still being encouraged to use LPG (rather than kerosene) suggests that thegovernment will not eliminate the remaining subsidy to LPG. This Report recommends thefreeing of trade in kerosene to eliminate the monopolization from which it has suffered under theso-called "Plan Bandera" of restricted sales. As documented in Chapter IV and Annex 5 on themarketing of kerosene, almost none of the subsidy on kerosene reached poor consumers. Thisreport recommends the open sale of kerosene at a reasonable discount from diesel (not with thehuge differential that currently exists viz. S/60 per gallon for kerosene versus S/1460 per gallonfor diesels 1 and 2) and facilitating the supply of efficient kerosene stoves at the lowest possibleprices.
6. This Report further suggests some specific measures to correct the few remainingaberrations in energy pricing. First, with respect to electric power, there is, at present, noaccepted system of raising tariffs; they have been fixed at the level set in September 1992,andadjusted again in May 1993. A socially-inspired, life-line tariff for residential users could bejustified but it should:
(a) apply only to those consumers who use less than the life-line quantity, say, 50 kWh permonth (and not to the first 200 kWh of all residential users as has been the practice untilrecently); the average low income household uses less than 50 kWh/month;
(b) be set as a percentage of the cost of service to those consumers, say, 50% so that t h esubsidy should not get out of hand and the price become so low that the costs of billingand collection exceed the sale revenue for these consumers; as has been the case untilApril 93; and
(c) that this subsidy be financed directly from the State Budget or, less theoreticallyjustifiable, through charging wealthier consumers slightly more than their specific costof service.
These measures are all consistent with the adoption of the new tariff methodology,namely, the establishment of a tariff structure that reflects costs of serving each category ofconsumers.
7. Second, with respect to hydrocarbons, the government should prepare a plan to raise theprice of LPG to its economic cost over a reasonable period of time. The economic cost of LPGapproximates the current import and internal handling and distribution costs. Alternatively, theaverage financial cost of supply (import plus domestic production) could be used as a pricesetting guide. This financial cost is of the order of about US $200/ton (rather than about US$

vi Ecuador: Energy Pricing, Subsidies and Interfuel Substitution
260-300/ton import cost plus about US $100/ton for internal distribution costs which is currentlyconsidered the economic cost) and would thus require approximately doubling the September 92price as opposed to a near tripling to reach economic costs. Sold at financial cost, LPG wouldcontinue to have an economic subsidy, but not a financial one.
8. This Report further proposes that kerosene be chosen as the fuel for poorer households,especially those in suburban areas who do not have access to traditional fuels (which willcontinue being important in rural areas). Before kerosene can play this role, however, itsmarketing must be freed and its price must be raised to within a reasonable margin of those ofDiesels 2 and 1 (which is really kerosene sold for industrial use). The current official price ofS/.60 per gallon is merely the first in a chain of prices that reach to the final consumer. Thefinal consumer price, especially in small quantities and in rural areas exceeds the price of itssubstitute (Diesel 1 at S/1460 per gallon). When domestic kerosene is cornered and sold in largerquantities for industrial use, the upper limit of the price is set by Diesel 1. So, under the currentsystem, virtually none of the State's foregone revenue (S/1460 - 60 = 1400/gallon) benefits lowincome consumers but some does accrue to industrial users. It is obvious that both prices shouldbe increased simultaneously after measures are taken to improve the supply of more efficientkerosene stoves. Kerosene stopped being distributed for residential use in June 1993, or ratherit stopped being sold at s/60/gallon. Furthermore, the supply of so-called "regular" gasolinecould be discontinued as there are only a few hundred users in Cuenca (and they should becompensated, possibly, with the gift of kerosene stoves to replace their gasoline burners).
9. Finally, the additional revenues due to higher energy prices could be enough to practicallyeliminate the fiscal deficit and allow an increase in social expenditures to compensate poorconsumers. This would be so, provided that the price level and the exchange rate stabilize. Ifprices continue to rise (meaning that additional revenues are not assigned to cutting the deficitbut cause higher expenditures) then another round of price increases will be inevitable tomaintain real prices at their September level (although some selective price increases were stillneeded, over and above September prices, e.g., for LPG, kerosene and residential electricitysupply). Fortunately, however, inflation seems to be slowing and this would help in keeping realoil prices constant, without having to raise nominal prices too often.
Medium-Term Sectoral Issues
10. Petroleum Reserves and Production: At present (late 1992), total proven crude petroleumreserves are estimated at nearly 2 billion barrels (or about 17 years at the current rate ofproduction) of which approximately 1.5 billion are of light crudes (API of 290) and the rest, ofheavy crudes (API of 150 to 200). These reserve figures are higher than the official figurespublished by the National Directorate for Hydrocarbons, but lower than figures used byPetroecuador and the private oil companies. Similarly, the potential for increasing current outputin the short run is the object of intense debate, with the private oil companies again being themost optimistic, claiming that output could be raised by 100,000 b/d, largely in the fieldsproduced by Petroamazonas. This report suggests the truth may lie somewhere between themiddle and high scenarios reported in the text (see below Annex Tables 18-20). In this case,

Executive Summary vii
output would peak in 1996 at about 400,000 b/d but this would be highly dependent on massiveinvestments (of the order of US$1.2 billion) by the private oil companies over 1992-95, as wellas in the fields now operated by Petroecuador. Whether this investment is from public or privatesources will depend on what happens to Petroecuador who is just entering the study phase of aprivatization process. Since the public sector has neither the resources nor the enthousiasm (orthe will) to commit itself to such high levels of expenditures, and the private sector is no longerexcited about prospects, given the poor quality of recent discoveries and low crude prices,investment will most probably lag.
11. No exploration contracts were signed during the Borja Government (1988-92) and thisneeds to be remedied to prevent a steep decline in oil reserves, especially if current output is torise significantly. This report suggests simplifying the exploration legislation (possibly bymoving toward Production Sharing, concessions or direct negotiations), and opening up to foreignoil companies areas reserved for Petroecuador. In addition, discriminatory taxation of foreignoil companies needs to be eliminated - this measure has the support of the new government'senergy-policy makers. On the other hand, the huge enhanced recovery project proposed for thePetroamazonas fields seems no longer justified, and primary and secondary recovery methods aresufficient, for the time being, to recover almost as large a share of in situ oil than with the vastlymore expensive tertiary methods. At the time of this writing, the seventh round of oil explorationnegotiations was just setting under way (Dec 93).
12. In downstream activities, present refining, storage and pipeline capacities appear sufficientfor the short to medium term. Except for minor increases in crude oil storage and pipelinecapacity (including use of the crude pipeline spur through Colombia) the only other investmentthat could be justified is a minor capacity increase in the Esmeraldas refinery, and, possiblyinvestments at Balao to allow larger crude carriers to operate. Given the more correct pricingpolicies introduced recently, forecast growth in domestic demand for oil products will probablyslow (and smuggling has already started to decline) and so, the need for additional refiningcapacity may well be postponed. Therefore, the idea of building a new grass-roots refinery inthe Peninsula (with public funds) is an unnecessary, risky gamble that fortunately, thegovernment chose to abandon.
13. Also, none of the major refinery development schemes based on refining heavier crudeshould be seriously considered at present. The supply of light Oriente Crude that can be refinedat Esmeraldas will, for many years, exceed domestic demand while the output of heavy crudeswill most likely remain below 50,000 b/d until the end of the century. It would seem imprudentto commit Ecuador to refinery investments exceeding US$1 billion when there is no pressingneed to do so. Some efficiency gains, however, could be achieved by closing the refineries ofthe Peninsula while upgrading the Esmeraldas and, possibly, Amazonas refineries.

viii Ecuador: Energy Pricing, Subsidies and Interfuel Substitution
Electric Power
14. The financial crisis in the electric power subsector has been caused mostly by the lackof a forward-looking tariff policy. This problem was masked in the late 1970's and early 1980'sby large transfers of oil resources, which paid for major power investments over the last decade.This crisis has led to delays (of several years) in investments so that the system has no back-upcapacity for meeting incremental demand (although demand growth may slow because of therecent tariff increase) and may face severe capacity and energy constraints immediately and forthe medium term, both in terms of generation and transmission. Dry season energy constraintsare getting worse because the planning system has been biased in favor of hydroelectric solutionsbut the thermal support plants that were required were never built. As a result, Ecuador now hasto scramble to build gas turbines which may or may not be least cost, to meet demand over thecoming several years. In addition, the expansion plan calls for further investment on the Pauteriver, where 90% of Ecuador's hydroelectric capacity is located and the technical feasibility ofbuilding Paute Mazar has not yet been firmly established. While not much can be gained in theshort and medium term by reviewing the generation expansion plan, in the longer run, such areview could help correct any potential flaw in the program, and should definitely be carried out,together with a general strengthening of the planning process to give greater weight to economicvariables, risk and the environment.
Electric Power Subsector Reforms
15. Given the rather poor performance of the electric power subsector, this Study suggests thatmajor reforms are in order. These reforms should deal with the regulatory framework, tariffpolicies and institutional reorganization. This report suggests that the new regulatory agency(possibly for the energy sector as a whole)2 would need to be independent of the politicalprocess (as much as possible) yet have access to the highest levels of government and betechnically excellent, so as to carry immediate credibility with sector authorities and operatingfirms. INECEL should be shorn of its regulatory prerogatives, concentrate on generation andtransmission (i.e. become a true enterprise), shed some excess manpower (especially in theEngineering and Projects, and Distribution and Marketing Departments) and cut lose theelectricity distribution companies (which could be easily privatized as they have the legal formsof limited liability companies). Whether private or publicly owned, INECEL would benefit fromcompetition from private independent generators. An in-depth study of tariff policies has recentlybeen completed by INECEL with Bank funding and this report recommends its speedyimplementation. Since a study, proposed to be financed under an ongoing Bank project willconsider regulatory aspects and institutional reforms, this report only treats these matters in a
2 The regulator would only set oil prices on the basis of world market prices, during thetransition to a full, free market for oil, i.e. the regulator would have simply the power ofobserving and gathering information about domestic oil market behavior to help establish andthen maintain a free and open market.

Executive Summary ix
general manner, suggesting a broad framework of actions that need to be taken whatever theprecise manner in which Ecuador ultimately decides to reform its power subsector. Similarly,a study should be undertaken to set up a pricing and taxation structure for petroleum derivativesthat would allow the deregulation of the hydrocarbons subsector and the introduction ofcompetition, especially in downstream operations.

x
INTRODUCCION
1. El objetivo de este Estudio es analizar c6mo los precios de la energia (aquellosvigentes hasta septiembre de 1992) podrian ser incrementadog para cubrir sus costosecon6micos y que efecto esto tendria en la economia, sobre el nivel y la estructura delconsumo, y en el bienestar de (especialmente) los consumidores de bajos ingresos. Losajustes que se requieren son sustanciales, no gigantescos pero sin embargo tendrianefectos positivos importantes en las finanzas publicas (en el deficit fiscal y sufinanciaci6n, disminuyendo de ese modo la inflaci6n) y en la eficiencia econ6mica(mejora en la asignaci6n de recursos). El ajuste de los precios causaria en generalmodestos aumentos en los costos de producci6n y tendria algunos efectos negativos en elbienestar (y en los presupuestos) de los consumidores de bajos ingresos (especialmente enlas comunidades urbanas y rurales de bajos ingresos, mujeres y ninios). El efecto deprecios mas altos en los presupuestos de las familias esta siendo analizado a traves de unaencuesta llevada a cabo a finales de 1992, cuyos resultados son presentados y analizadosen un informe separado, que sera publicado en un futuro cercano.
2. Muy pocos datos concretos eran disponibles acerca de los habitos de consumo deenergia de las familias de bajos ingresos en el Ecuador, aunque estudios hechos en otrospaises latinoamericanos podrian ser considerados a grosso modo representativos. Uninforme recientemente publicado, elaborado conjuntamente entre OLADE y ESMAPacerca del precio de la energia en Latino America concluye que la porci6n de lossubsidios a la energia que efectivamente reciben los consumidores de bajos-ingresos estipicamente pequefia debido a que el consumo de GLP, de la mayor parte de los productosderivados del petr6leo (excepto el querosen) y de la electricidad esta altamentecorrelacionado con los ingresos. Una encuesta sobre el consumo de energia (nacional,urbano y rural) encargada por ESMAP parece apoyar la conclusi6n anterior tambien parael Ecuador.
3. Desde que este Estudio se inici6, el gobierno del Ecuador hiz6 importantescambios en los precios de los productos de la energia (el 4 de septiembre de 1992 y enmayo de 1993) que han contribuido sustancialmente a resolver la cuestion principalanalizada en este informe. Aunque se ha hecho un esfuerzo para designar claramente los"precios" como antes o despues del ajuste, puede haber casos en que esta designaci6n noaparezca. Generalmente, sin embargo, el contexto aclarara si los "precios" referidos sonaquellos antes o despues del ajuste. Las tarifas de energia electrica fueron ajustadas unasegunda vez, en mayo de 1993.
4. El gobiemo del Ecuador cooper6 ampliamente con el equipo de estudio. El equipodesea agradecer al Ministerio de Energia y Minas (especialmente a las Subsecretarias deHidrocarburos y Electrificaci6n) Petroecuador y sus filiales, INECEL y sus principalesdepartamentos y al INE, Instituto Nacional de Energia. El equipo tambidn quisieraexpresar su gratitud al Gobierno de Belgica quien cofinanci6 este estudio y al PNUD/Quito por manejar los fondos del Estudio gastados en el Ecuador.

xi
El equipo que llev6 a cabo el Estudio estuvo integrado por:
- Sra. Ines Mencias, Economista energetica, Coordinadora de consultoresnacionales;
- Sr. Oswaldo Boada, Ingeniero electrico, reestructuraci6n energetica
- Sr. Guillermo Chulde, Economista, Estudio del mercadeo del querosen;
- Sr. Alvaro Morales, Ingeniero mecanico, estadisticas y calculos;
- Sr. Marcelo Jaramillo Carrera, Ingeniero electrico, revis6 algunos puntos tecnicosen energia electrica;
Consultores Internacionales
- Sr. Robert G. Grosman, Miembro del grupo de estudio de la Comunidad Europeapara la reestructuraci6n de la industria de la energia electrica en Europa, particip6en la redacci6n de la secci6n sobre refornas a la electricidad.
- Sr. Jean Roger Dreze, Economista, estim6 el impacto macroecon6mico de loscambios en los precios de la energia;
- Sr. John Shillingford, Ingeniero Quimico, especialista en refinaci6n del petr6leo;
- Sr. Joao Baptista, Ingeniero electrico, hizo una revisi6n critica del estudio sobretarifas completado recientemente por INECEL;
Personal del Banco Mundial
Sr. Douglas Barnes, Planeador energetico y especialista en encuestas (ESMAP);
Sr. Witold Teplitz-Sembitzky. Economista energetico senior, Departarnento deIndustria y Energia;
Sr. Michel Del Buono, Economista senior, ESMAP/coordinador del equipo.
Los principales autores de este informe son Michel Del Buono, Witold Teplitz-Sembitzky e Ines Mencias. Las Sras. Patricia Viscaino de Andrade, Valerie ValdiviezoGenicq, Lisa Klein y M6nica Rodriguez contribuyeron al informe con edici6n, traducci6ny asistencia en el procesamiento de palabras. La Sra. Sylvia Lanzetta tradujo el resumenejecutivo al Espafiol. Finalmente, el equipo quisiera agradecer a nuestros colegas de laOficina del Banco Mundial en Quito, Sra. Rocio de Montalvo y Sr. David Salgado por suvalioso apoyo.

xii
RESUMEN EJECUTIVO
1. Este informe fue escrito para ayudar al nuevo Gobiemo Ecuatoriano, el cual seposesion6 el 10 de Agosto de 1992, en la toma de decisiones urgentes e importantes conrespecto al precio de la energia y las reformas del sector de la energia. Los subsidios a laenergia en el Ecuador han sido grandes, persistentes y su efecto social nunca habia sidoverificado, a pesar de que la principal justificaci6n a los precios bajos siempre habia sidoque ellos ayudaban a los pobres. Esta politica de subsidios ha tenido una historia de 20afios; mas los primeros pasos apartandose de ella fueron dados el 4 de septiembre de 1992con unos aumentos sustanciales en los precios de los derivados del petr6leo y de laelectricidad.
2. El precio bajo de la energia, y el subsidio concomitante (ej. impuestos negativos),sin embargo, tuvo un impacto evidente en el desempefio macroecon6mico. En cualquierafno dado los subsidios a la energia tipicamente excedieron el Deficit Consolidado delSector Puiblico (por ejemplo, en afios recientes, el Deficit Consolidado del Sector Piublicoha variado entre el 1% y 4% del PIB; para 1991 el estimativo de los subsidios a la energiaexcede los US$600 millones o cerca del 6% del PIB). Sin acceso a ahorros externos(excepto a traves de atrasos en el pago de la deuda) y con dificil y costoso credito interno,una gran proporci6n del Deficit Consolidado del Sector Puiblico ha sido financiadohist6ricamente a traves de la emisi6n monetaria. Estas causas explican ampliamente latasa de inflaci6n persistente, que varia entre un 50% y 80% al aflo, y que ha existidodurante casi toda la uiltima decada.
3. El raciocinio tras la recomendaci6n de este informe, de esencialmente eliminar lossubsidios a la energia, es triple:
(a) Los subsidios a la energia fueron, de una manera general, regresivos (ej.ellos ayudaron mas a los ricos que a los pobres); datos de un estudioreciente de ESMAP sobre perdidas electricas muestran la naturalezaaltamente regresiva de los subsidios a la energia electrica (ver parrafo1.32); para los productos derivados del petr6leo, los resultados de unaencuesta que se hizo recientemente apoyan ampliamente esta afirmaci6n.
(b) La eliminaci6n de los subsidios a la energia iria muy lejos hacia lareducci6n, sino a la eliminaci6n, del pequeflo deficit estructural del sectorpuiblico y la persistente tasa de inflaci6n asociada a este.
(c) Se aumentaria la eficiencia,tanto en la demanda como en la oferta al fijarlos precios de la energia a un nivel mas cercano de sus costos econ6micos.Ademas, a corto plazo, la conservaci6n de energia permitiria elcrecimiento de las exportaciones (y precios mas altos desalentarfan elimportante contrabando de productos refinados hacia Colombia y Peru), ya largo plazo, extenderia las reservas de petr6leo crudo del Ecuador haciael futuro. Tambien habrian beneficios ambientales si menos energia fuera
xiii
producida y consumida para cualquier tasa de crecimiento y/o nivel delPIB.
La Incidencia de los Subsidios a la Electricidad
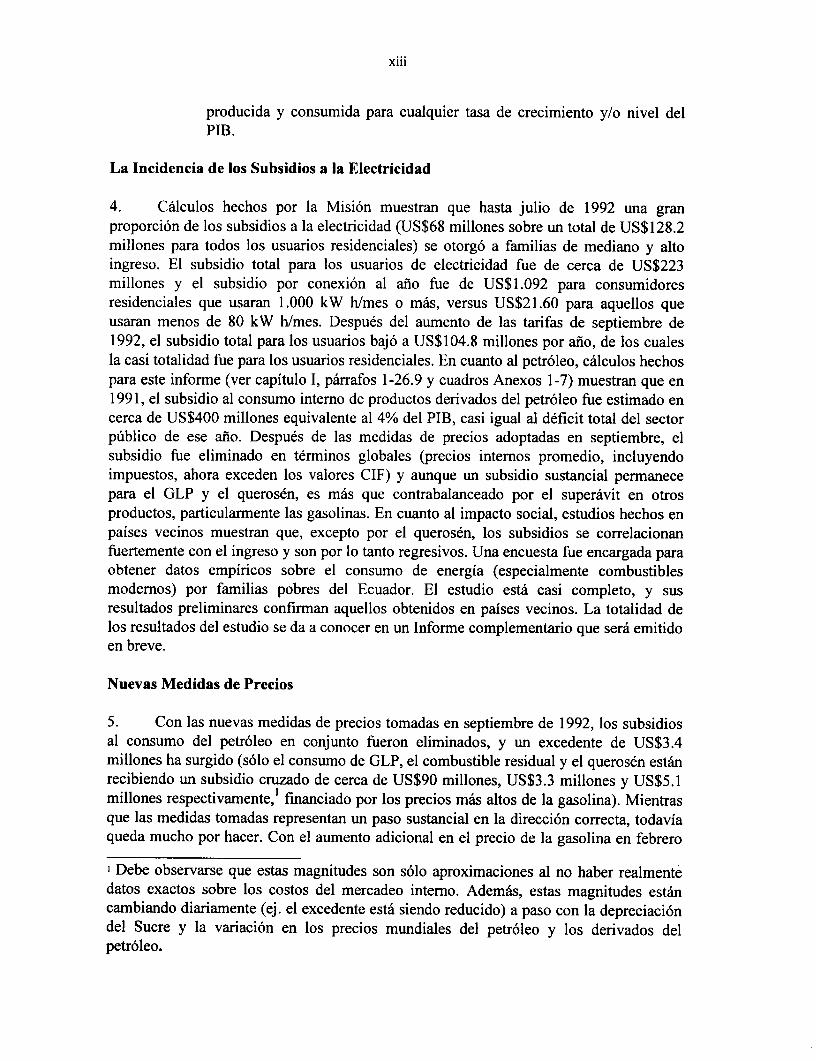
4. Calculos hechos por la Misi6n muestran que hasta julio de 1992 una granproporci6n de los subsidios a la electricidad (US$68 millones sobre un total de US$128.2millones para todos los usuarios residenciales) se otorg6 a familias de mediano y altoingreso. El subsidio total para los usuarios de electricidad fue de cerca de US$223millones y el subsidio por conexi6n al afno fue de US$ 1.092 para consumidoresresidenciales que usaran 1.000 kW h/mes o mas, versus US$21.60 para aquellos queusaran menos de 80 kW h/mes. Despues del aumento de las tarifas de septiembre de1992, el subsidio total para los usuarios baj6 a US$104.8 millones por afio, de los cualesla casi totalidad fue para los usuarios residenciales. En cuanto al petr6leo, calculos hechospara este informe (ver capitulo I, pirrafos 1-26.9 y cuadros Anexos 1-7) muestran que en1991, el subsidio al consumo interno de productos derivados del petr6leo fue estimado encerca de US$400 millones equivalente al 4% del PIB, casi igual al deficit total del sectorpublico de ese afio. Despues de las medidas de precios adoptadas en septiembre, elsubsidio fue eliminado en terminos globales (precios intemos promedio, incluyendoimpuestos, ahora exceden los valores CIF) y aunque un subsidio sustancial permanecepara el GLP y el querosen, es mas que contrabalanceado por el superavit en otrosproductos, particularmente las gasolinas. En cuanto al impacto social, estudios hechos enpaises vecinos muestran que, excepto por el querosen, los subsidios se correlacionanfuertemente con el ingreso y son por lo tanto regresivos. Una encuesta fue encargada paraobtener datos empiricos sobre el consumo de energia (especialmente combustiblesmodemos) por familias pobres del Ecuador. El estudio esta casi completo, y susresultados preliminares confirman aquellos obtenidos en paises vecinos. La totalidad delos resultados del estudio se da a conocer en un Informe complementario que sera emitidoen breve.
Nuevas Medidas de Precios
5. Con las nuevas medidas de precios tomadas en septiembre de 1992, los subsidiosal consumo del petr6leo en conjunto fueron eliminados, y un excedente de US$3.4millones ha surgido (s6lo el consumo de GLP, el combustible residual y el querosen estanrecibiendo un subsidio cruzado de cerca de US$90 millones, US$3.3 millones y US$5.1millones respectivamente,' financiado por los precios mas altos de la gasolina). Mientrasque las medidas tomadas representan un paso sustancial en la direcci6n correcta, todaviaqueda mucho por hacer. Con el aumento adicional en el precio de la gasolina en febrero
1 Debe observarse que estas magnitudes son s6lo aproximaciones al no haber realmentedatos exactos sobre los costos del mercadeo intemo. Ademas, estas magnitudes estancambiando diariamente (ej. el excedente esta siendo reducido) a paso con la depreciaci6ndel Sucre y la variaci6n en los precios mundiales del petr6leo y los derivados delpetr6leo.

xiv
de 1994 y el reciente descenso de los precios mundiales del petr6leo, el promedio intemode los precios del petr6leo esta ahora por encima del primero. En electricidad, laestructura de las tarifas debe ser cambiada para reflejar el costo del servicio a losdiferentes usuarios, aunque el nivel de las tarifas despues de las medidas tomadas enseptiembre de 1992 esta cerca del 75% de los CMLP. Despues de los ajustes de mayo de1993, las tarifas estan cerca de los CMLP pero no su estructura. Este Informe recomiendafirmemente la puesta en practica del sistema de tarifas propuesto en el estudio sobretarifas recientemente acabado con fondos del Banco . Mientras que este informe sugierealgunas mejoras metodol6gicas (ver Anexos I, II y III), ellas representan refinamientospero no implican que la implementaci6n de la nueva metodologia de tarifas debera seraplazada. En el caso de los derivados del petr6leo, el precio promedio esta ahora porencima de los costos de oportunidad (US$0.63/gal6n versus US$0.57/gal6n valor CIFmas costo intemo de mercadeo) pero el problema de los combustibles de uso dometico noha sido bien solucionado, especialmente en relaci6n con los problemas de las familias debajos ingresos. Mientras que el nuevo precio del GLP cort6 el subsidio, el hecho de quelos consumidores de bajos ingresos siguen siendo estimulados a usar el GLP (en lugar delquerosen) sugiere que el gobierno no eliminara el subsidio restante al GLP. Este Informerecomienda la liberalizaci6n del comercio del querosen para eliminar la monopolizaci6nde la cual ha sufrido bajo el Ilamado "Plan Bandera" de ventas restringidas. Como ha sidodocumentado en el Capitulo IV y Anexo 5, en el mercadeo del querosen, casi nada delsubsidio al queros6n llega a los consumidores pobres. Este informe recomienda la ventaabierta del querosen a un descuento razonable del diesel (no con el inmenso diferencialque actualmente existe, a saber S/60 por gal6n de querosen versus S/1460 por gal6n delos diesels 1 y 2) y la facilitaci6n del abastecimiento de estufas eficientes de querosen alos precios mas bajos posibles.
6. Este Informe ademas sugiere algunas medidas especificas para corregir las pocasaberraciones que quedan en el precio de la energia. Primero, con relaci6n a la energiaelectrica, no hay actualmente un sistema aceptado para el aumento de tarifas; ellas hansido fijadas al nivel determinado en septiembre de 1992, y ajustadas una vez mAs enmayo de 1993. Una tarifa socialmente-inspirada, "life-line" para usuarios residenciales sepodriajustificar, pero deberia:
(a) aplicarse s6lo a aquellos consumidores que usen menos de la cantidad"life-line", por ejemplo, 50 kWh por mes (y na a los primeros 200 kWhpara IQdo los usuarios residenciales como ha sido la prictica hastarecientemente); el promedio de las familias de bajos ingresos usa menosde 50 kWh/mes;
(b) fijarse como un porcentaje del costo del servicio a aquellosconsumidores, por ejemplo, 50%, para que el subsidio no se vuelvainmanejable y el precio baje tanto que los costos de facturaci6n ycobranza excedan los ingresos por ventas a estos consumidores; como hasido el caso hasta abril de 1993; y

xv
(c) que este subsidio sea directamente financiado por el Presupuesto delEstado o, menos justificable te6ricamente, mediante el cobro a losconsumidores mas adinerados ligeramente mas que el costo especifico deservirlos.
Todas estas medidas son consistentes con la adopci6n de la nueva metodologia detarificaci6n, es decir, el establecimiento de una estructura de tarifas que refleje los costosdel servicio de cada categoria de usuarios.
7. Segundo, con relaci6n a los hidrocarburos, el gobiemo debera preparar un planpara aumentar el precio del GLP a su costo econ6mico en un periodo razonable detiempo. El costo econ6mico del GLP se aproxima a los costos presentes de importaci6n,manejo intemo y distribuci6n. Alternativamente, el promedio de los costos financieros desuministro (importaci6n mas producci6n domestica) podria ser usado como guia paraestablecer un precio. Este costo financiero esta por el orden de US $200/ton (en vez deUS $260-300/ton por costo de importaci6n mas US $100/ton por costo de distribuci6ninterna el cual es actualmente considerado el costo econ6mico) y por lo tanto requeriraduplicar aproximadamente el precio de septiembre de 1992 en vez de casi triplicarlo paraalcanzar su costo econ6mico. Vendido al costo financiero, el GLP continuara teniendo unsubsidio econ6mico, mas no uno financiero.
8. Este Informe ademas propone que el querosen sea escogido como el combustiblepara las fanilias mas pobres, especialmente aquellas en las areas suburbanas donde no setiene acceso a los combustibles tradicionales (que continuaran siendo importantes en lasareas rurales). Sin embargo, antes de que el querosen pueda desempefiar este rol, sucomercio debera ser liberalizado y su precio aumentado hasta liegar a un nivel razonableen relaci6n con el precio del Diesel 2 y I (que es realmente querosen vendido para usoindustrial). El actual precio oficial de S/.60 por gal6n es tan s6lo el primero en la cadenade precios que liega al consumidor final. El precio final al consumidor, especialmente enpequefias cantidades y en areas rurales excede al precio de su sustituto (Diesel 1 a S/1460por gal6n). Cuando el querosen domestico es arrinconado y vendido en grandescantidades para uso industrial, el limite superio del precio es establecido en base alDiesel 1. Por lo tanto, bajo el sistema actual, virtualmente ninguno de los ingresos nopercibidos por el Estado (S/1460 - 60 = 1400/gal6n de lucro cesante) beneficia a losconsumidores de bajos ingresos pero si a usuarios industriales. Es obvio que ambosprecios deberian ser aumentados simultaneamente despues de que sean tomadas lasmedidas para mejorar el suministro de estufas mas eficientes de querosen . El querosendej6 de ser distribuido para uso residencial en junio de 1993, o mas bien dej6 de servendido a S/60 por gal6n. Adicionalmente, el abastecimiento de la Ilamada gasolina"regular" podria ser eliminado ya que hay s6lo unos pocos cientos de usuarios en Cuenca(y ellos deberian ser compensados, posiblemente ,con la donaci6n de estufas de querosenpara reemplazar los quemadores de gasolina).
9. Finalmente, los ingresos adicionales provenientes de los precios mas altos de laenergia podrian ser suficientes para eliminar practicamente el deficit fiscal y permitir un

xvi
aumento en gastos sociales para compensar a los consumidores pobres. Esto podria ser,con tal de que el nivel del precio y la tasa de cambio se estabilicen. Si los precioscontinuaran subiendo (o sea, que los ingresos adicionales no corten el deficit sinoaumenten los gastos) entonces otra ronda de aumento de precios sera inevitable paramantener los precios reales al nivel de septiembre, (aunque algunos aumentos selectivosde precios fueran todavia necesitados, por encima de los precios de septiembre ej., para elabastecimiento de GLP, querosen y electricidad para uso residencial). Afortunadamente,sin embargo, la inflaci6n parece estar disminuyendo y esto ayudaria a mantener losprecios reales del petr6leo constantes, sin tener que aumentar los precios nominalesfrecuentemente.
Asuntos sectoriales de mediano plazo
10. Reservas Petroleras y Producci6n: En la actualidad (finales de 1992) el total dereservas probadas de petr6leo crudo esta estimado en cerca de 2 mil millones de barriles(o alrededor de 17 afios a la presente tasa de producci6n) de los cuales aproximadamente1.500 millones son de crudos ligeros (API de 290) y el resto, de crudos pesados (API de15'a 200). Estas cifras de las reservas son mas altas que las oficiales publicadas por laDirecci6n Nacional de Hidrocarburos, pero mas bajas que las usadas por Petroecuador ylas compafnias petroleras privadas. Igualmente, el potencial para incrementar la actualproducci6n a corto plazo es objeto de un intenso debate, siendo las compafnias petrolerasprivadas una vez mas las mas optimistas, sosteniendo que la producci6n podria seraumentada de 100.000 barriles/dia, principalmente en los campos de producci6n dePetroamazonas. Este informe sugiere que la verdad se ubique en algun lugar entre lasituaci6n media y alta reportadas en el texto (ver mas adelante Cuadros Anexos 18-20).En este caso, la producci6n Ilegaria a su maximo en 1996 con cerca de 400.000 b/d peroesto dependeria de inversiones masivas (del orden de US$1.200 millones) por lascompaniias petroleras privadas durante 1992-95, asi como en los campos operados porPetroecuador. Que esta inversi6n provenga de una fuente puiblica o privada dependera delo que suceda con Petroecuador, quien esta entrando en la fase de estudio del proceso dereestructuraci6n. Ya que el sector publico no tiene ni los recursos ni el entusiasmo (o eldeseo) en comprometerse en tan alto nivel de gastos, y el sector privado no estAentusiasmado con las perspectivas, dada la baja calidad de los recientes hallazgos y losbajos precios del crudo, la inversi6n probablemente se retrasara.
11. Durante el Gobierno del Dr. Borja (1988-92) no se firmaron contratos deexploraci6n lo cual necesita ser remediado para evitar un descenso precipitado en lasreservas de petr6leo, especialmente si la producci6n actual aumentara significativamente.Este informe sugiere la simplificaci6n de la legislaci6n de exploraci6n (posiblementemoviendose hacia acuerdos de producci6n compartida/ "production sharing agreements,"concesiones o negociaciones directas), y hacer accesible a compafias extranjeras depetr6leo areas reservadas para Petroecuador. Fuera de esto, la tributaci6n discriminadorade las companlias extranjeras de petr6leo debe ser eliminada - esta medida tiene el apoyo

xvii
de los responsables de la politica energetica del nuevo gobiemo.2 Por otro lado, elinmenso proyecto de recuperaci6n mejorada propuesto para los campos dePetroamazonas parece no justificarse mas, y los metodos de recuperacion primaria ysecundaria son suficientes, por el momento, para recuperar una proporci6n de petr6leo insitu casi tan grande como con los metodos terciarios sustancialmente mas caros. En elmomento en que se escribi6 esto, la septima ronda de negociaciones de exploraci6n depetr6leo estaba empezando. (diciembre de 1993)
12. En actividades posteriores a la extracci6n (downstream), la presente capacidad derefinaci6n, almacenamiento y oleoductos parece suficiente para el corto y mediano plazo.Excepto por aumentos menores en el almacenamiento de petr6leo crudo y en la capacidadde los oleoductos (incluyendo el uso del ramal del oleoducto de Colombia) la unica otrainversi6n que podria ser justificada es un aumento menor en la capacidad de la refineriade Esmeraldas, y, posibles inversiones en Balao que permitan la operaci6n de tanquerosde crudo mas grandes. Dadas las politicas de precios mas correctas introducidasrecientemente, el pron6stico de crecimiento en la demanda domestica de los derivados delpetr6leo probablemente disminuira (y el contrabando ya ha comenzado a descender), porlo tanto, la necesidad de capacidad adicional para refinaci6n bien puede ser postergada.Por lo tanto, la idea de construir una refineria completamente nueva en la Peninsula (confondos puiblicos) es unajugada innecesaria y arriesgada que afortunadamente, el gobiemoresolvi6 abandonar.
13. Igualmente, ninguno de los esquemas de desarrollo refinero basados en larefinaci6n de crudos pesados deberia considerarse seriamente en la actualidad. Elabastecimiento de crudo liviano de Oriente que puede ser refinado en Esmeraldas, pormuchos afios, excedera la demanda domestica mientras que la producci6n de crudospesados muy posiblemente permanecera por debajo de los 50.000 b/d hasta el final delsiglo. Pareceria imprudente comprometer al Ecuador en inversiones de refineria queexcedan los US$1.000 millones cuando no hay una necesidad apremiante para hacerlo.Sin embargo, algunas mejoras en eficiencia, podrian lograrse cerrando las refinerias de laPeninsula y mejorando a la vez las refinerias de Esmeraldas y, posiblemente, Amazonas.
Energia Electrica
14. La crisis financiera en el subsector de la energia electrica ha sido causadaprincipalmente por la falta de una politica tarifaria con miras al futuro. Este problema fueencubierto a finales de los 70 y principios de los 80 por amplias transferencias derecursos del petr6leo, que pagaron por las grandes inversiones electricas en la decadapasada. La crisis ha llevado a demoras (de varios afios) en las inversiones, por lo tanto elsistema no tiene una capacidad que cubra la demanda incremental (aunque el crecimientode la demanda puede disminuirse debido al reciente aumento en las tarifas.) y puede
2 Esta ya se hizo; y la septima ronda de negociaciones petroleras, usando lo que es, enesencia, un production-sharing agreement, esta teniendo buen exito.

xviii
enfrentar severas restricciones de capacidad y de energia inmediatamente y por el t6rminomedio, tanto en t6rminos de generaci6n como de transmisi6n. Las restricciones de energiaen temporada de sequia se estan empeorando ya que el sistema de planeaci6n hafavorecido las soluciones hidroelectricas pero las plantas de apoyo termicas que eranrequeridas nunca fueron construidas. Como resultado, Ecuador ahora tiene que bregarpara construir turbinas a gas las cuales pueden o no ser lo menos costoso para satisfacer lademanda de los pr6ximos afnos. Fuera de esto, el plan de expansi6n requiere una inversi6nadicional en el rio Paute, donde esta localizado el 90% de la capacidad hidroelectrica delEcuador y la factibilidad tecnica de construir Paute Mazar no ha sido todavia firmementeestablecida. Mientras que a corto y a mediano termino no es mucho lo que se puede ganarrevisando el plan de expansi6n de generaci6n, a la larga, esta revisi6n podria ayudar acorregir cualquier falla potencial en el programa, y definitivamente deberia ser lievada acabo, junto con el fortalecimiento del proceso de planeaci6n para dar mas peso a lasvariables econ6micas, riesgo y ambiente.
Reformas en el Subsector de Energia Electrica
15. Dado el mas bien debil desempefno del subsector de la energia electrica, esteestudio sugiere que se necesitan reformas sustanciales. Estas reformas deberian afectar elmarco regulatorio,la politica de tarifas y la reorganizaci6n institucional. Este Informesugiere que la nueva agencia regulatoria (posiblemente para el sector de la energia enconjunto)3 necesitaria ser independiente del proceso politico (tanto como sea posible),pero tener acceso a los niveles mas altos del gobierno y ser tecnicamente excelente, a finde conseguir credibilidad inmediata con las autoridades y empresas del sector. INECELdeberia dejar sus funciones regulatorias, concentrandose en la generaci6n y transmisi6n(ej. Ilegar a ser una verdadera empresa), deshacerse de parte de su exceso de personal(especialmente en los Departamentos de Ingenieria y Proyectos, y Distribucion yMercadeo) e independizar a las companiias distribuidoras de electricidad (las cualespodrian ser facilmente privatizadas ya que tienen la forma legal de compafiias deresponsabilidad limitada). Bien sea de propiedad privada o puiblica, INECEL sebeneficiaria de la competencia de generadores privados independientes. Un estudio afondo sobre las politicas tarifarias ha sido recientemente completado por INECEL confondos del Banco y este informe recomienda su acelerada implementaci6n. Puesto que unestudio que sera financiado bajo un proyecto en curso del Banco considerara aspectosregulatorios y reformas institucionales, este informe s6lo trata estos asuntos en una formageneral, sugiriendo un amplio marco de acciones que necesitan ser tomadas cualquieraque sea la manera precisa en la cual Ecuador decida reformar su subsector electrico.Igualmente, debe ser emprendido un estudio para establecer la estructura de precios y detributaci6n de los derivados del petr6leo que permitira la desregulaci6n del subsector de
3 El regulador s6lo establecera los precios del petr6leo basado en los precios del mercadomundial, durante la transici6n hacia un pleno mercado libre del petr6leo, ej. el reguladortendra simplemente el poder de observar y reunir informaci6n acerca del comportamientodel mercado domestico del petr6leo para ayudar a establecer y luego a mantener unmercado libre y abierto.

xix
los hidrocarburos y la introducci6n de competencia, especialmente en operacionesposteriores a la extracci6n (downstream).


1
ANALYSIS OF ENERGY PRICES, SUBSIDIES ANDSTATE REVENUES
Introduction
1.1 The present chapter reviews the evolution of energy prices since 1980, estimatesthe size and impact of subsidies granted to energy users, and examines recent reform measureslaunched to remedy the shortcomings of past pricing policies. It is worth noting in this connectionthat public sector prices as well as the foreign exchange rate were fixed between 1972 and 1981.In the subsequent years, the Ecuadorian economy experienced increasing imbalances (trade,fiscal) financed through sizeable external borrowing. Initially, this kept inflation at a relativelylow level; in the longer-run, though, higher inflation, in combination with the fixed exchangerate, led to a steady erosion of Ecuador's international competitiveness. Exports were reducedbasically to crude oil and a declining quantity of bananas. At the same time, domestic energyconsumption was heavily subsidized, either directly through extremely low petroleum productprices, or through oil export revenues spent on operating and expanding the electric power sector.In fact, until the mid-1980s, oil export revenues, supplemented with borrowed money, were usedto subsidize everything else, from antibiotics to credit.
1.2 As is shown in the following paragraphs, real energy prices were low (indeed,below economic cost) in 1980 and have since declined almost constantly, with the exception of1981 and 1988 when unsuccessful steps were taken to reverse this trend. For instance, by 1991,electricity tariffs for residential users and household fuel prices were down to 53.9% and 35%,respectively, of their 1980 levels (see Tables 3 and 4).
1.3 The subsidies on petroleum products and electricity, which reached 6% of GDPin 1991, used to account for a major share, if not all, of the fiscal deficit. In the mid-1980s, whenexternal borrowing became more difficult, Ecuador started financing its fiscal deficit by incurringarrears and creating credit. This caused a surge in inflation, with rates ranging between 50% and80% per annum. As is argued below, energy prices closer to economic costs can help cut theballooning fiscal deficits and, by obviating the need to create money (to finance the governmentdeficit), reduce inflation.

2 Ecuador: Energy Pricing, Subsidies and Interfuel Substitution
Oil Products
1.4 According to the Hydrocarbons Law, the prices of fuels for the domestic market(including imports, but net of exports) are required to comply with some concept of historic(average) accounting cost. They thus do not reflect replacement costs and, much less, opportunitycosts. Price adjustments, even when designed to cover accounting costs, have been subject topolitical pressure, lagged behind other prices in the economy and eroded rapidly because ofinflation. In practice, oil product prices have only been revised when revenues of the State'sGeneral Budget (Presupuesto General del Estado - PGE) from domestic petroleum product salesproved totally insufficient to cover scheduled expenditures so that an immediate cash inflowbecame imperative.
1.5 In 1989, the preceding govemment's administration introduced a policy of gradual,slow price adjustments. From April until September 1992, however, prices were frozen by orderof the Constitutional Rights Court (Tribunal de Garantias Constitucionales). Real prices,therefore, resumed their decline until their recovery after the marked price increases of September1992, followed by a new round of increases in May 1993. Thus, the new government pursuesa policy of discrete price increases in lieu of the former gradual adjustment approach.
1.6 The pricing policy pursued in the past provided no guidance for the economic useof scarce and valuable resources such as oil. It rather encouraged wasteful, low priorityconsumption, fostered contraband and militated against energy conservation. Moreover, lowdomestic prices hampered the development of non-conventional energy sources.
1.7 In fact, the policy for setting fuel prices and electric power tariffs was touted asa vehicle for income-distribution. Energy pricing, however, is an inefficient means ofredistributing wealth. It is thus hardly surprising that this policy failed to reach its redistributiveobjectives. In fact, under the prices that prevailed until September 1992, power subsidies accruedmostly to upper- and middle-income consumers (see paragraph 1.32). As for petroleum products,the subsidies on vehicle fuels were reaped mostly by higher- and middle-income groups who ownprivate cars. The subsidies on kerex, which is no longer available to households at its low officialprice, have been dissipated among a new breed of dealers (see praragraph 1.14). And whilepoorer households using LPG have benefitted from the subsidies granted to this fuel, an evenlarger amount of the hand-outs has been enjoyed by the more affluent households.
1.8 Moreover, the lack of sufficient coordination in setting the relative prices of energysubstitutes has had severe distortive impacts. A good example is LPG which has been sold notonly below cost, but also below the price of electric power and other substitute fuels. As aconsequence, LPG is now used by many households on a large scale and in a variety of activitieswhere other fuels are more economic or could prove a competitive alternative. Since LPG, of

Analysis of Energy Prices, Subsidies and State Revenues 3
which a large share has to be imported (51% in 1991), sells at a high loss, this policy prompteda major drain on public sector resources (see paragraph 1.27 and Annex IV).
1.9 The new pricing structure put in place in September 1992 still implied crosssubsidies among the different petroleum products. The price of household LPG accounted for34.6% and that of kerex for only 5.3% of the average price of all oil products. Gasolines, on theother hand, were priced 110.2% (Super) and 27.9% (Extra) above the average. Moreover, the newdomestic price structure did not match the structure of costs at import parity (see Table 1). Itshould also be noted that since the entire proceeds from sales in the domestic market accrue tothe state treasury, there is no such thing as a "net of tax" price which could be considered a"producer" price. For this reason, it is suggested to establish a pricing and taxation frameworkthat distinguishes between producer prices and the taxes added on for the purpose of raisingpublic revenue. ESMAP could assist the Government in devising and implementing thisframework.
TABLE 1: PRICING STRUCTURE OF OIL PRODUCTSDomestic Prices World Prices'
% S./Gallon S/. Per Gallon
Gasoline (Super) 210.2 2400 1133
Gasoline (Extra) 127.9 1400 1018
Gasoline (Regular) 21.0 240 1048
Kerex 5.3 60 1141
Diesel 1 and 2 127.9 1460 1076
Fuel Oil 60.0 685 598
Turbo Fuel 140.2 1600
Avgas 192.7 2200 1585
Household LPG 34.55 394 994
Industrial LPG 100.9 1152 994
Average 100.0 1,141.56
a Gulf Coast CIF Guayaquil, late July 1992.
1.10 During the 1980s, the most pronounced decline in domestic price was for LPG,which, along with an expansive marketing policy, has fostered its rapid dissemination. GrowingLPG demand was also the result of constraints placed on the marketing of kerex, thus leadingto a large-scale substitution of LPG for kerosene, even among the lowest-income families. As isshown in Table 2, LPG is the product with the highest rate of consumption growth between 1980

4 Ecuador: Energy Pricing, Subsidies and Interfuel Substitution
and 1991. Diesel consumption has grown considerably during the last five years, and althoughannual average growth of gasoline consumption was modest, it should be kept in mind that thelevel of gasoline consumption is already high3 .
TABLE 2: ANNUAL GROWTH RATE OF FUEL CONSUMPTION
Period Gasolines Kerex Diesel Fuel Oil LPG
1980-1985 -0.8% 3.6% 8.4% 15.4% 13.2%
1986-1991 1.3% -20.1% 4.6% -8.2% 11.8%
1.11 At present, refining capacity is sufficient to meet domestic demand (fiverefineries with a production capacity of 148,000 barrels per day), except for LPG, and permitsthe export of small quantities of diesel (2.1 million barrels in 1991 and 552,000 barrels betweenJanuary and March 1992). Although expansion of the Shushufindi gas plant would reduceimports and cover a greater share of national consumption, the expected replacement of LPGimports has not yet taken place. At any rate, the present situation is strongly in favor of pricingpolicies that provide compelling incentives to use all petroleum products in a more efficient way.
1.12 Until September 1992, household LPG, which is bottled in 15 kg cylinders, soldfor S/80/kg (US$ 0.05 per kg), far below the international price Petroecuador reported to pay forimports (US$ 265 per metric ton CIF). Even worse, this price failed to cover the costs ofstorage, bottling, bulk and retail transport and the distributors' margin, which at that time addedup to an average of S/120/kg. LPG for industrial and commercial use had a much higher price(US$0.30 per kg) more closely reflecting economic cost, but in practice, attracted only fewcustomers as the price differential was overwhelmingly in favor of the 15 kg cylinder. SinceSeptember 1992, LPG has been priced at S/193 per kg, equivalent to USc 10.7 per kg (at anexchange rate of S/l1,900 per US$ as of May 1993), while the price of LPG for industrial use hasbeen S/564 per kg (about USc31.3 per kg). In late 1993, economic cost (import parity plusdownstream expenses), though, was estimated at US$ 400 per ton (S/760/kg). Thus, householdLPG currently sells for less than a third of its economic costs.
3 In 1985, gasoline consumption was about 10.19 million barrels compared to 6.62 millionbarrels for diesel. Furthermore, in the same year, per-capita consumption was very much lowerin Peru than in Ecuador (0.047 barrels per capita versus 1.14 barrels per capita).

Analysis of Energy Prices, Subsidies and State Revenues 5
1.13 Before the September 1992 adjustments, the price of diesel, measured in terms ofuseful energy, amounted to 85% of the price of gasoline. Thereafter, the price differential hasbeen narrowing to the point where prices are on a par. Inefficiencies in vehicle fuel consumption,however, remain high, mainly because of the obsolescence of the passenger transport fleet, butalso because the fuels' price level was still too low to encourage conservation.
1.14 Kerex distribution through regular service stations was discontinued in 1991 whenPetroecuador changed its marketing policy. In order to stem the diversion of this highlysubsidized product toward industrial users, it was decided to restrict the supply of kerex to so-called traditional markets in cities and other urban and rural outlets, including agents such ascommunities and social welfare institutions. However, this has neither checked the product'sdiversion toward non-household users, nor has it helped target the subsidies at low-incomegroups. On the contrary, the restricted marketing of kerex has led to the cornering of its supplyby a few major middlemen. Moreover, as a response to the large differential between the officialkerex price of S/60 and the prices of its substitutes, Diesel 1 and Diesel 2 (S/630 and S/1,460before and after the adjustment, respectively), a black market, with a chain of middlemen, hasdeveloped around this product. In fact, kerex is nowhere available at its regulated price. Beforethe adjustments of September 1992, residential consumers had been charged between S/250 andS/650 per gallon or even more in remote rural areas. After the adjustments, the average retailprice soared to S/1,360 per gallon. In-the-field research done for this Study indicates that only45% of the kerex supply ends in household appliances. Consequently, the beneficiaries ofsubsidies, far from being low-income groups, are the middlemen and industrialists who acquirekerex cheaper than its substitutes, Diesel 1 and Diesel 2.
1.15 In July 1992, petroleum product prices (not including fuel oil), adjusted forinflation, were lower than in the preceding year, but still higher than in 1980, except for kerexand LPG which sold at 63% and 27% of their 1980 price levels (see Table 3). With theadjustments of September 1992, the real prices of gasolines, diesel and fuel oil reached thehighest level since 1980; and the real price of LPG rose beyond any level since 1986. The onlyexception was kerex whose inflation-adjusted price continued to decline. Needless to say,inflation, which kept being high, immediately started to erode the effects that the nominal priceincreases had in real terms.
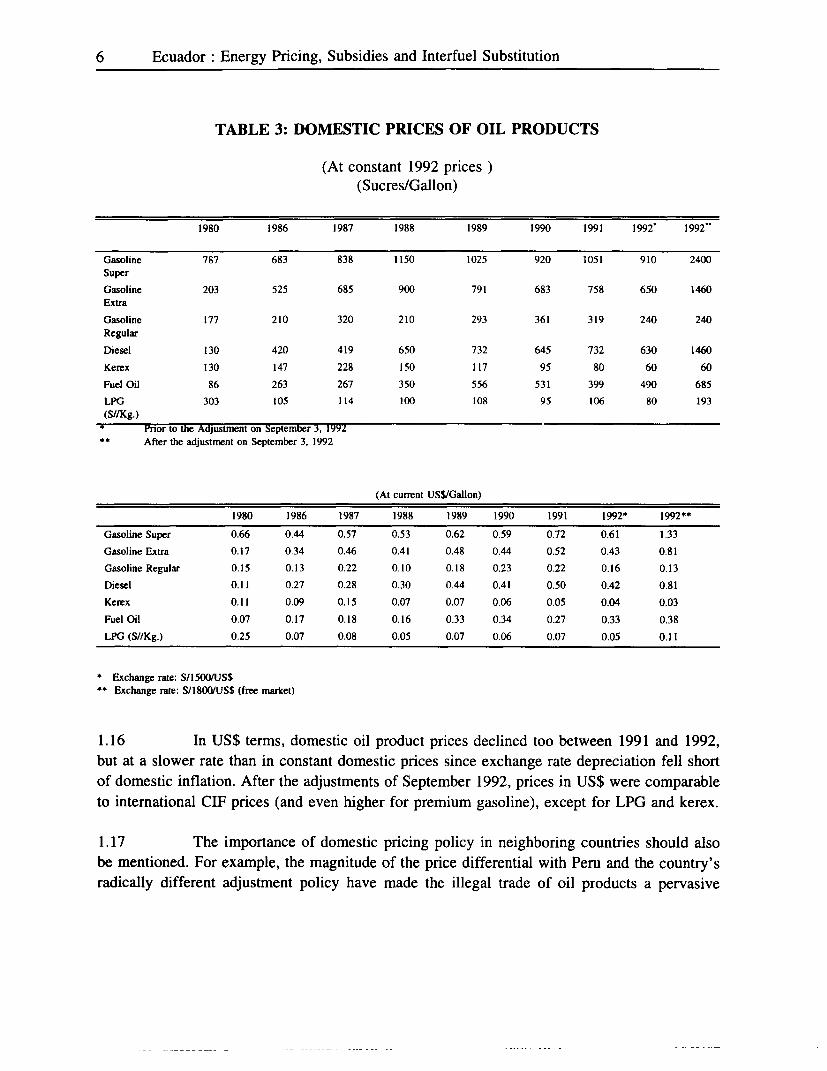
6 Ecuador: Energy Pricing, Subsidies and Interfuel Substitution
TABLE 3: DOMESTIC PRICES OF OIL PRODUCTS
(At constant 1992 prices)(Sucres/Gallon)
1980 1986 1987 1988 1989 1990 1991 1992' 1992-
Gasoline 787 683 838 1150 1025 920 1051 910 2400Super
Gasoline 203 525 685 900 791 683 758 650 1460Extra
Gasoline 177 210 320 210 293 361 319 240 240Regular
Diesel 130 420 419 650 732 645 732 630 1460Kerex 130 147 228 150 117 95 80 60 60Fuel Oil 86 263 267 350 556 531 399 490 685LPG 303 105 114 100 108 95 106 80 193(SI/Kg.)
Prior to the Adjustment on September 3, 1992* * After the adjustment on September 3, 1992
(At current US$/Gallon)
1980 1986 1987 1988 1989 1990 1991 1992* 1992**
Gasoline Super 0.66 0.44 0.57 0.53 0.62 0.59 0.72 0.61 1.33Gasoline Extra 0.17 0.34 0.46 0.41 0.48 0.44 0.52 0.43 0.81Gasoline Regular 0.15 0.13 0.22 0.10 0.18 0.23 0.22 0.16 0.13Diesel 0.11 0.27 0.28 0.30 0.44 0.41 0.50 0.42 0.81Kerex 0.11 0.09 0.15 0.07 0.07 0.06 0.05 0.04 0.03Fuel Oil 0.07 0.17 0.18 0.16 0.33 0.34 0.27 0.33 0.38LPG (S//Kg.) 0.25 0.07 0.08 0.05 0.07 0.06 0.07 0.05 0.11
* Exchange rate: S/1500/US$Exchange rate: S/1800/US$ (free market)
1.16 In US$ terms, domestic oil product prices declined too between 1991 and 1992,but at a slower rate than in constant domestic prices since exchange rate depreciation fell shortof domestic inflation. After the adjustments of September 1992, prices in US$ were comparableto international CIF prices (and even higher for premium gasoline), except for LPG and kerex.
1.17 The importance of domestic pricing policy in neighboring countries should alsobe mentioned. For example, the magnitude of the price differential with Peru and the country'sradically different adjustment policy have made the illegal trade of oil products a pervasive

Analysis of Energy Prices, Subsidies and State Revenues 7
problem. In 1990, it was estimated that the value of fuels smuggled across the border amountedto US$131.8 million (based on an opportunity cost of US$ 20.05 per barrel of Ecuadorean oilsold during that year), which in terms of volume accounted for 6.3% of total hydrocarbonsproduction in that year.
Electric Power Tariffs
1.18 Pursuant to the Basic Electrification Law, tariffs must reflect service costs which,among other things, include operating expenses, reserves for depreciation and an annual profit.INECEL's Board of Directors sets electric power tariffs on the basis of information provided bythe power utilities.
1.19 The tariff structure is based on different consumer groups and end users(residential, commercial, industrial, public lighting and government agencies), rather than on thecosts of supply and time of use, which would be more appropriate. In addition, there are chargesfor contracted demand of larger industrial and commercial users. Different capacity and energycharges apply to medium-to-high voltage consumers. Within each consumer category, there are
increasing block rates, except for customers paying a separate demand or capacity charge, whoserates for energy decline as consumption increases. The highest average tariffs are charged toindustrial users, followed by commercial users; average residential tariffs are the lowest. Thisis opposite to the policy applied in most Latin American countries where industrial tariffs onaverage are lower than residential and commercial tariffs, thus accounting for differences in thecost of service and load characteristics.
1.20 While there is a uniform tariff system for non-utility users throughout the country,the charges for bulk power sold by INECEL to utilities (which in many cases are meredistribution companies) are discriminatory. In 1991, the average bulk tariff was USc 1.68 perkWh. Small distribution companies or those with financial difficulties are offered the lowestprices for both contracted demand and energy. In 1991, the highest average wholesale rates werecharged to the Cotopaxi and Quito utilities (USc 2.01 per kWh and USc 1.95 per kWh,respectively) and the lowest were billed to the Milagro and Bolivar utilities (USc 0.69 per kWhand USc 0.65 per kWh, respectively). Thus, pricing of bulk power implies cross subsidies amongdistribution companies. This system was created to favor utilities supplying unattractive marketswith a large proportion of small and dispersed customers, thus fostering regional and socialdevelopment. However, cross-subsidization may have adverse effects on efficiency, both for thoseutilities paying more and those protected. An alternative approach would be to set bulk powerrates more in line with the different costs of supply and, at the same time, let the utilities havethe discretion to taylor the retail tariffs to their customers.

8 Ecuador: Energy Pricing, Subsidies and Interfuel Substitution
1.21 Just as for fuel prices, electric power tariffs have been handled with a politicalbias, mainly in order to redistribute income toward poorer consumers, a goal which has only beenachieved to a limited extent. On the other hand, what the low level and distortive structure of thetariffs have brought about until late 1992 is high, wasteful consumption, particularly amongresidential users and in the industrial sector. Also, little attention has been given to anotherimportant objective of rate setting, that of providing sufficient resources to generation anddistribution companies. The tariffs prevailing until September 1992 did not even cover thesystem's operating costs, and much less the financial requirements of expanding supply to meetfuture demand. While the average tariff in 1991 was USc 3.23 per kWh, the cost at the retaillevel amounted to USc 5.62 per kWh. This imbalance aggravated INECEL's poor financial andeconomic condition. In 1991, power sales accounted for only 52.2% of the Institute's cash flowrequirements (the balance was made up of government transfers and borrowing). The low shareof revenues accounted for by power sales, together with INECEL's high debt and the parallelreduction in revenues from oil royalties, have considerably increased the company's dependenceon National Government contributions, which accounted for 42.4% of its cash flow in 1991, and43.6% in the period between January and June 1992. In fact, INECEL was receiving in excessof US$100 million/year in oil transfers between the mid 1970s and 1985. Thereafter, oil transfersfell to about US$50 million in 1986 and US$20 million in 1987, becoming negligible after 1988.
1.22 In 1989, INECEL resorted to automatic, monthly rate adjustments of 3% in orderto protect the tariff's (real) value against the detrimental effects of inflation. However, the first80 kWh/month, and from November 1990 onwards, the first 200 kWh/month of all residentialcustomers, as well as the first 80 kWh/month of commercial users not subjected to a demandcharge were exempted from this rule. The tariffs on these special blocks increased in line withthe rise in the minimum wage. The 200 kWh/month ceiling for residential customers wasmaintained after the September 1992 price reform, but commercial users were no longer entitledto benefit from the freeze.
1.23 Table 4 shows that, in constant Sucres, the average tariff paid by the residentialsector during the period 1986-1991 was lower than in 1980 (the 1991 tariff was 53.9% of the1980 tariff and the average tariff of 1991 was 84.5% of the tariff) prevailing 1980. Althoughthe average industrial sector tariff ended up 31% higher in 1991 than in 1980, this was notsufficient to match the system's operating costs. As a consequence, the situation beforeSeptember 1992 was so financially unsustainable that it urgently required a substantial rise intariffs, to allow both INECEL and the distribution companies to improve their cash flow and startcovering their costs.

Analysis of Energy Prices, Subsidies and State Revenues 9
TABLE 4: ELECTRICITY TARIFFS BY END USE(Current Sucres/kWh annual average)
Use:Year Household Industrial Commercial Others Average
1980 1.3 1.1 1.7 1.2 1.3
1986 4.1 4.9 5.1 4.6 4.6
1987 5.8 7.0 7.2 6.4 6.5
1988 7.7 9.5 9.8 8.9 8.8
1989 10.7 19.2 18.9 17.9 15.7
1990 14.9 28.2 27.3 25.9 22.6
1991 22.8 46.9 44.5 38.8 35.7
1992* 50.7 70.7 59.7 57.6 57.3
1992** 96.4 123.9 151.7 176.7 113.6
ELECTRICITY TARIFFS BY END USE ANNUAL AVERAGES(Constant Sucres /kWh, 1992=100)
Year Use:Household Industrial Commercial Others Average
1980 56.2 47.6 73.5 51.9 56.2
1986 43.1 51.5 53.6 48.3 48.3
1987 44.2 53.3 54.8 48.7 49.5
1988 38.5 47.5 49.0 44.5 44
1989 31.3 56.2 55.3 52.4 46.0
1990 28.3 53.5 51.8 49.1 42.9
1991 30.3 62.4 59.2 51.6 47.5
1992* 50.7 70.7 59.7 57.6 57.3
1992** 96.4 123.9 151.7 176.7 113.6
Before September 3, 1992After September 3, 1992

10 Ecuador: Energy Pricing, Subsidies and Interfuel Substitution
1.24 In keeping with the system proposed in the recently completed tariff study, end-usediscrimination should be abandoned. Rather, tariffs should be based on service costs, includinga surcharge accounting for the comparatively high generation cost during the dry season. Inaddition, the study has defined dual-rate tariffs, varying by time and use. They could be applied,at first, to the industrial sector and to other large consumers. The September 1992 adjustmentonly raised the level of tariffs without changing their structure or the rate base (i.e. cost ofservice, rather than end-use).
1.25 Equity and efficiency considerations would suggest that the state itself pay anysubsidies that were decided on "lifeline" consumptions. A second best solution would be forhigher-income consumers (eg, those using, say, more than 500 or 1000 kWh per month) tofinance this subsidy. Lifeline consumption should be set at a reasonable level, say, 50-80 kWhper month and apply only to consumers using those quantities of electricity or less. The tariffincrease of September 1992, however, did not raise the price of the first 200 kWh of anyconsumer and stated that, henceforth, "tariffs would remain fixed". This meant that no one knew(there was, and still is, no coherent policy) what would happen when the next tariff increasewould be needed. Furthermore, the subsidy on lifeline consumption should be set at a suitablepercentage (say, 50%) of the cost of serving this consumer class (to make sure that the subsidydoes not grow without limit).
Subsidies on Consumption of Petroleum Products and Electricity: A Summary
1.26 Prior to the September 1992 adjustments, the annual subsidy to energyconsumption in Ecuador totaled US$624.3 million. Of this, US$ 400.9 (64%) was on oilderivatives and US$ 223 million (36%) on electric power. After the September price increase,the overall subsidy on energy consumption fell to US$ 101.36 million, of which US$ 3.45 millionis a net tax charged on consumption of oil products and US$ 104.81 million is the subsidy onelectricity. Table 5 below shows details.

Analysis of Energy Prices, Subsidies and State Revenues 11
TABLE 5: ECUADOR: ESTIMATE OF SUBSIDY ON ENERGY CONSUMPTION(US$ thousands)
1992' 19932
July September January-MayUS$/Gal. US$'000 US$/Gal US$'000 US$/Gal US$'000
Premium Gasoline 0.15 2,962 -0.56 -11,273 -0.49 -2,535Gaoline 02.26 120,211 -0.12 -53,515 -0.07 -13,669Regular Gasoline 0.51 524 0.52 534 naKerex 0.71 5.326 0.68 5,119 0.68 1681Diesel 1 0.29 5,746 -0.10 -1,927 naDiesel 2 0.29 130,559 -0.10 -43,791 -0.06 -9,807Fuel Oil Nacional 0.07 26,547 0.01 3,334 n.a.Jet Fuel AVGAS 0.04 2,618 0.14 8.628 n.a.LPG (Gallons) 0.54 106,253 0.46 89,367 0.46 43,004LPG (Industry, Gal) 0.04 145 0.02 78 n.a.Petroleum Products 400,891 -3,450 18,675Total Electricity 223,413 104,810 27,7703Total Energy 624,304 101,360
1) Annual subsidy is estimated on the basis of average 1992 consumption at prices beforeand after September 1992. Exchange rates: S/1.525/US$ in July and S/1.800/US$ inSeptember 1992.
2) Based on prices/tariffs prevailing since September 1992, but reflecting changes inconsumption levels and exchange rates.
3) Estimated on the basis of consumption figures of January 1992.
Source: Annex Tables 1,3,5.
Subsidies on Oil Products
1.27 Without the price reform of September 1992, aggregate subsidies on domestic salesof petroleum products would have risen to US$ 400.9 million a year. The fuel price adjustments,however, resulted in a surplus of about US$3.45 million.4 After the reform, LPG, kerosene and
4 The above subsidy was calculated by estimating the CIF value of oil products based onthe domestic consumption structure for 1992 (Annex, Table 1) and comparing this to thedomestic prices prevailing until September 1992, using sales for oil products of that year, withthe costs estimated by the National Hydrocarbons Directorate (Direcci6n Nacional deHidrocarburos- DNH).
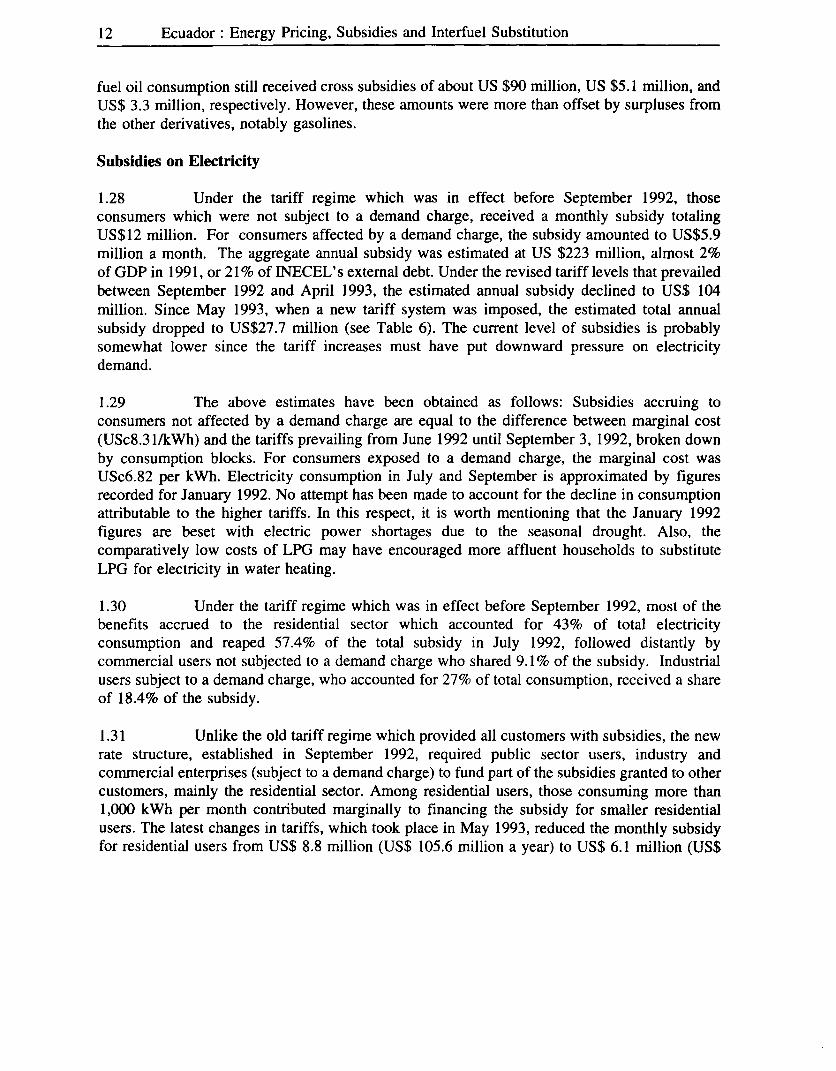
12 Ecuador: Energy Pricing, Subsidies and Interfuel Substitution
fuel oil consumption still received cross subsidies of about US $90 million, US $5.1 million, andUS$ 3.3 million, respectively. However, these amounts were more than offset by surpluses fromthe other derivatives, notably gasolines.
Subsidies on Electricity
1.28 Under the tariff regime which was in effect before September 1992, thoseconsumers which were not subject to a demand charge, received a monthly subsidy totalingUS$12 million. For consumers affected by a demand charge, the subsidy amounted to US$5.9million a month. The aggregate annual subsidy was estimated at US $223 million, almost 2%of GDP in 1991, or 21 % of INECEL' s external debt. Under the revised tariff levels that prevailedbetween September 1992 and April 1993, the estimated annual subsidy declined to US$ 104million. Since May 1993, when a new tariff system was imposed, the estimated total annualsubsidy dropped to US$27.7 million (see Table 6). The current level of subsidies is probablysomewhat lower since the tariff increases must have put downward pressure on electricitydemand.
1.29 The above estimates have been obtained as follows: Subsidies accruing toconsumers not affected by a demand charge are equal to the difference between marginal cost(USc8.3 1/kWh) and the tariffs prevailing from June 1992 until September 3, 1992, broken downby consumption blocks. For consumers exposed to a demand charge, the marginal cost wasUSc6.82 per kWh. Electricity consumption in July and September is approximated by figuresrecorded for January 1992. No attempt has been made to account for the decline in consumptionattributable to the higher tariffs. In this respect, it is worth mentioning that the January 1992figures are beset with electric power shortages due to the seasonal drought. Also, thecomparatively low costs of LPG may have encouraged more affluent households to substituteLPG for electricity in water heating.
1.30 Under the tariff regime which was in effect before September 1992, most of thebenefits accrued to the residential sector which accounted for 43% of total electricityconsumption and reaped 57.4% of the total subsidy in July 1992, followed distantly bycommercial users not subjected to a demand charge who shared 9.1% of the subsidy. Industrialusers subject to a demand charge, who accounted for 27% of total consumption, received a shareof 18.4% of the subsidy.
1.31 Unlike the old tariff regime which provided all customers with subsidies, the newrate structure, established in September 1992, required public sector users, industry andcommercial enterprises (subject to a demand charge) to fund part of the subsidies granted to othercustomers, mainly the residential sector. Among residential users, those consuming more than1,000 kWh per month contributed marginally to financing the subsidy for smaller residentialusers. The latest changes in tariffs, which took place in May 1993, reduced the monthly subsidyfor residential users from US$ 8.8 million (US$ 105.6 million a year) to US$ 6.1 million (US$

Analysis of Energy Prices, Subsidies and State Revenues 13
73 million a year). Since large consumers were already paying higher tariffs, the May 1993 tariffincreases were highest (504%) for customers using no more than 20 kWh/month, and lowest (onaverage 54%) for those consuming more than 1,500 kWh/month. In addition, a marketing chargewas imposed to recover metering costs. However, inflation continued to erode the real impact ofthese increases. The following Table provides a breakdown of subsidies on electricity by enduse and date.
TABLE 6: ANNUAL SUBSIDIES ON ELECTRICITY CONSUMPTIONBY END USE
(US$ THOUSANDS)
JULY 1992 SEPTEMBER 1992 MAY 1993'
Without Demand ChargeHouseholds 128,220 105,660 73,080
Commercial 20,424 1,560 -5,604
Handicrafts 2,088 672 -588
Gov. Institutions 2,028 -792 -1,560
Public Lighting 12,396 -5 -60
With Demand Charge:Commercial 6,288 -3,156 -8,784
Gov. Institutions 4,296 -720 -3984
Industry 41,196 -636 -23,724
Water Pumping 6,480 2,244 -1,068
TOTAL 223,4193 104,610 27,722
(-) Indicates a net excess of the tariff over economic cost.
1) The May 1993 figures are based on the consumption structure underlying the estimatesfor 1992 and, therefore, only reflect the tariff increase and changes in the rate ofexchange which was S/1,525/US$ in July 1992.
1.32 It is worth noting that the large share of subsidies accounted for by the residentialsector masks the fact that the subsidization of residential electrity consumption was highlyregressive. While households using no more than 50 kWh per month represented 35% ofresidential customers, until September 1992 they benefitted from only 1.9% (equivalent to US$0.44/month/user) of the total subsidy granted to the sector. Likewise, users consuming more than300 kWh, 500 kWh and 1,000 kWh a month received a monthly subsidy of US$ 20, US$ 33,

14 Ecuador: Energy Pricing, Subsidies and Interfuel Substitution
and US$ 91, respectively. This confirms the view that the old tariff regime failed to meet itsredistributive objectives. With the new (September 1992) tariff structure, the monthly subsidy forusers consuming no more than 20 kWh/month declined to US$ 0.3 1/month/user, and the subsidyto users buying more than 300 kWh and 500 kWh dropped to (still formidable) US$I.1/month/user and US$ 12/month/user, respectively. Hence, the tariff reform reduced, but didnot eliminate the regressive nature of the residential rate structure.
Alternate Calculation of Subsidy on Oil Products
1.33 An alternative approach to estimating the subsidies on petroleum products is tofocus on the price differential between export crude and crude supplied to the domestic market(through domestic refineries). Assuming that the downstream costs by and large were matchedby sales revenues, the subsidies on domestic consumption of petroleum derivatives (approximatedin terms of forgone export revenues) would have amounted to US$ 475.2 million in 1991 andUS$ 528.6 million in 1992, equivalent to 4.3% of GDP. These figures are fairly close to theestimates based on opportunity cost imputed to the different products sold in domestic markets.
TABLE 7: ESTIMATE OF ANNUAL SUBSIDY ON DOMESTIC SALES OF FUELSBASED ON THE DIFFERENCE BETWEEN CRUDE OIL PRICES
FOR DOMESTIC AND EXPORT MARKETS
YEAR Subsidies GDP Subsidies/GDPUS$ Million US$ Million
1980 962.5 11733 8.2%1986 81.9 10515 0.8%1987 178.7 9450 1.9%1991 475.2 11554 4.1%1992 528.6 12483 4.2%
1.34 Another way of appreciating the size of the subsidy on oil products to the domesticconsumer is to look at the value added of oil refining in the National Accounts. This has anegative value because intermediate purchases of crude, costed at international prices, exceedthe gross value of production at domestic market prices. Between 1986 and 1992, this negativevalue has increased by 47%, from S/6.4 billion in 1966 to S/9.4 billion in 1992 (in constantprices of 1975). These figures are broadly consistent with the two estimates presented above,i.e., opportunity cost of products; opportunity cost of crude.

Analysis of Energy Prices, Subsidies and State Revenues 15
Impact of Oil Products Price and Power Tariff Increases on Production Costs and on thePrice Index
Oil
1.35 Bringing the domestic prices that were charged for oil products before September1992 in line with import/export parity costs would have resulted in an aggregate price increaseof approximately 100%. Such an increase would have raised the producer price index by 5.42%,the consumer price index by 5.90% and the export price index by 5.03%. Table 8 provides amore detailed picture of the effects that higher petroleum product prices would have on thedifferent price indices.
TABLE 8: INCREASE IN COSTS FROM INCREASEIN A VERA GE FUEL PRICE
(% Cost Increase)
% Increase in Average Prices:
Sectors 10 20 50 100 150 200 300
Growth in Producer PriceIndex 0.54 1.08 2.71 5.42 8.13 10.84 16.26
Growth in HouseholdConsumer Price Index 0.59 1.18 2.95 5.90 8.85 11.80 17.70
Other Exports 0.50 1.01 2.52 5.03 7.55 10.07 15.10
Source: Banco Central del Ecuador, lmput-Output Matrix and ESMAP calculations (Table 9 Annex VI)
1.36 As expected, transportation is one of the sectors most hurt by a 100% increase infuel prices: costs would rise by 21.6%. This may pose social problems that the Governmenthas to cope with. In fact, many of the urban mass transport passengers belong to the lowerincome group and, therefore, might find it difficult to absorb higher fares. Consequentely, in1993, i.e. after the upward adjustment of fuel prices, each urban mass transport vehicle wasreceiving a subsidy of S/600,000 (US$ 310) a month to keep the fares fixed. But thetransportation associations, which wield considerable power, have been fighting to raise fares.
1.37 Another important sector that would be impacted is electricity generation, sinceoil products account for about 15% of the intermediate demand of the power generation industry
5 According to a study conducted by the National Energy Institute (Instituto Nacional deEnergia), prior to September 1992, fuel accounted for 23% of total operating costs in urban bustransportation. So the price increase of September 1992 may just have had the predicted effecton total transport cost.

16 Ecuador: Energy Pricing, Subsidies and Interfuel Substitution
(although most of the country's electric power is generated by hydropower, with a 77.03% sharein 1991). The burden that higher fuel prices place on electric power could rise even more asa result of the increasing share of thermal generation which is due to unusually low precipitationsin recent years.
1.38 This Study used the input-output matrix of the Central Bank to estimate the short-term impact of changes in oil product prices and electricity tariffs on production costs, thegeneral price index and the export price index. The latter was included because of the importancethe external sector to the economy. To this end, the matrix, which covers, 34 sectors wasconsolidated into 17 by merging similar sectors and singling out those with a high energyintensity. The matrix with the latest information was that of 1989. Only increases in energy costswere taken into account and not those of other primary inputs. In addition, it was assumed thatthe cost increases are passed on to consumers. The imput-output table further assumes that theprice elasticity of energy demand is zero. All this is truer in the short-term than in the mediumto long term. With the passing of time, though, interfuel substitution and conservation measuresbecome feasible alternatives and will weaken the impact of the cost increases to some extent.
1.39 The findings show that the chemical and basic mineral industries, among whichis the cement industry, would experience an increase in production costs of 9.1 % and 8.4%. Theconstruction sector would suffer from a 6% rise in cost. Thus, even in the case of energy-intensive industries the inflationary effect of a 100% increase in fuel prices is bound to bemodest.
Power
1.40 Before September 1992, the weighted average electricity tariff was S/50/kWh.Increasing this figure by 150% gives the marginal costs of S/125/kWh calculated in INECEL'stariff study. This increase would have raised the consumer price index by 3.5%, the producerprice index by 3.7%, and the general index by 3.1%. The impact on export prices would havebeen negligible (less than 2%) since the export-oriented sectors have a low electricity intensity.Table 9 summarizes the results.

Analysis of Energy Prices, Subsidies and State Revenues 17
TABLE 9: COST INCREASES DUE TO INCREASE IN AVERAGE ELECTRIC POWER TARIFFS
Price Increase
Sectors 10% 20% 50% 100% 150% 200% 300%
Growth in general inflation 0.20% 0.41% 1.02% 2.04% 3.06% 4.08% 6.12%
Growth in producer index 0.25% 0.49% 1.23% 2.45% 3.68% 4.90% 7.35%
Growth in household consumer price 0.24% 0.47% 1.18% 2.35% 3.53% 4.70% 7.05%indexOther exports 0.13% 0.26% 0.64% 1.28% 1.92% 2.56% 3.84%
Source: Input-Output Matrix Banco Central de Ecuador and ESMAP calculations
1.41 The sectors most affected by higher tariffs would be basic minerals, chemicals,
machinery and equipment, with cost increases of 7.8%, 6.0% and 5.7%, respectively. Again, these
figures suggest that the inflationary impact of even large tariff adjustments is moderate.
State Revenues from Oil Product Sales in the Domestic Market and Exports
1.42 As required by law, revenues from oil product sales, once production, refining and
marketing costs are deducted by Petroecuador, are distributed as follows: 10% flow into the Oil
Investments Fund (Fondo de Inversiones Petroleras) and 90% to the General State Budget (PGE)
and other participants. The PGE also receives revenues amounting to 10% of domestic sales in
the form of a value-added tax and collects a so called "single" tax which, expressed in sucres per
gallon, amounts to S/1.71 for gasoline, S/0.22 for kerex, S/0.34 for diesel, and S/0.05 for fuel oil.
1.43 In 1991, the 90% share accounted for 21% of total oil revenues collected by the
PGE. Bearing in mind that oil accounts for 46% of the PGE's overall revenues during 1991,domestic sales contributed about S/178 billion.
1.44 During the first half of 1992, the PGE received 46.7% of the value of oil products
sold in the domestic market. Total sales were S/322.9 billion and the Budget received S/150.7
billion (including the value-added tax).
1.45 To obtain an estimate of the increase in earnings which resulted from the
September 1992 increase in oil product prices on the domestic market, a sales forecast from the
DNH's pricing study and its underlying consumption structure was used as a reference. The
costs estimated by the DNH for refining, evaporation and marketing as well as the distributor

18 Ecuador: Energy Pricing, Subsidies and Interfuel Substitution
margins were subtracted from the set retail prices. Revenues which would be generated by the10% VAT were also added (Annex VI Tables 2-5). The price of crude for the domestic marketwas adjusted to US$4.19 per barrel (from the previous level of US$2.32), and the refining marginwas set at US$3.15. The price elasticity of demand was supposed to be -0.2. Under theseassumptions, the increase in revenues from domestic sales for the last four-month period of 1992would total US$98.4 million, plus US$40.6 from increasing crude exports. For 1993, the increasein revenues would be US$294.4, plus US$121.7 from higher crude exports. Moreover, toprevent the extra-revenues from flowing to the so-called "participants" of oil earnings, a specialtax accruing to the PGE could be levied on oil sales (with appropriate restrictions to avoid anautomatic increase in expenditures).
1.46 To mitigate the impact that the pricing reforms may have (and might have had)on the budget and living conditions of low-income groups, up to a third of the public sectorrevenue gains could be earmarked to strenghten social support programs and to ease theadjustment to pending price increases, particularly that of LPG. A companion report offers amore detailed description of a suggested mitigation policy. Briefly put, the first component of theproposal is to free the supply of kerex prior to the liberalization of the LPG price and to establisha temporary energy subsidy fund targeted at the poorest households. In addition, it isrecommended to commit part of the extra revenues to selected social services and relief programsthat have proven effective and are highly appreciated by the beneficiaries (i.e., those focusing onnutrition, health, and human resource development).

2
ELIMINATION OF OIL AND POWER SUBSIDIES:IMPACTS ON FISCAL DEFICIT,
MONEY SUPPLY AND INFLATION
Introduction
2.1 This section presents the results of a simulation, for 1991, of the impact on thefollowing variables of putting energy prices at their economic levels:
The fiscal deficit,the need for monetary emission (to finance the deficit)the effect on inflation (its reduction) thanks to the lower fiscal deficit and reducedemission.
2.2 In brief, the results are that setting oil prices at opportunity costs and electricpower tariffs at their Long-Run Marginal Costs (LRMC) would have increased oil revenues byabout S/342 billion (2.9% of GDP), power revenues by about S/233 billion (1.9% of GDP) fora total of S/575 billion (4.7% of GDP). If about one-third of the additional revenues were usedfor social compensation/mitigation programs there would still remain additional revenues of S/383billion (3.2% of GDP). This would finally repay the "social debt" and essentially wipe out thefiscal deficit thereby greatly reducing the need for monetary emission and, hence, the rate ofinflation. The rate of inflation would not, however, fall to zero because of the monetary impactof changes in external assets. This would diminish, in the longer term, or could, if thought reallynecessary, be sterilized by monetary/fiscal counter measures. However, recent research at theBank6 shows that while stopping a hyperinflation is comparatively easy, eliminating this residual,expectations-related, low inflation takes time. Even with this proviso, inflation would fall by
6 Kiguel, M. and N. Liviatan: Stopping Three Big Inflations (Argentina, Brazil andPeru); World Bank Working Paper No. WPS 999; October 1992.
20 Ecuador: Energy Pricing, Subsidies and Interfuel Substitution
approximately 60% within the year and this positive result would hold even if about a third ofadditional public revenues were used to mitigate/compensate low-income consumers (throughpublic expenditures or direct money subsidies) for the rise in the prices of energy and energy-intensive goods and services they consumed.
2.3 This section implies that a lot more could be done in favor of low-income,disadvantaged Ecuadoreans by selling energy at economic prices (rather than subsidizing it) andusing a fraction of additional revenues to address the specific problems of poverty or of low-productivity employment (the working poor, as most poor Ecuadoreans really are). Furthermore,having sensible economic policies would improve the prospects for economic growth, a benefitthat goes beyond the simple expenditure of revenues (raised via taxation or the selling of publiclysupplied goods and services) to solve specific poverty problems. Curing inflation will also bebeneficial to low-income people because they are the least able to defend themselves againstinflation and to protect their incomes from the inflation tax. The data in this section are notexactly the same as in the rest of this report because of the need to use time series (monetaryaggregates, fiscal and quasi fiscal deficits, ... etc.) so the size of revenues and subsidies may bedifferent in some cases but this would not invalidate the general conclusion of this section thathigher energy prices would reduce inflation rather than increase it, as is the popular belief inEcuador. A fuller technical treatment of the analysis on which this section is based is attachedas Annex IV.
2.4 The economic measures proposed in this report are to essentially bring prices totheir economic levels, namely for oil prices to reflect opportunity costs (mostly world prices CIFEcuador) and for electricity tariffs to reflect Long-Run Marginal Costs (LRMC). These measureshave substantial economic and social impacts. An attempt was made, via a simple monetarymodel, to estimate the impact of increased public revenues on monetary emission and thence, oninflation, a chronic problem of the Ecuadorean economy, due partly to the Central Bank'sfinancing of a large share of the fiscal deficit. The proposed pricing policy would eliminate thefiscal deficit (see below) and the need for monetary emission. These powerful results will onlybecome permanent if fiscal financial discipline is maintained, otherwise, higher domestic priceswill only result in higher expenditures: the well known tax-tax, spend-spend cycle. In addition,as part and parcel of a program of measures designed to improve the allocation of resources,higher energy prices will contribute to efficiency and competitiveness in Ecuadorean productiveactivities.

Elimination of Oil and Power Subsidies 21
The results
2.5 The effects of increased energy prices on public revenues, fiscal deficit, moneysupply and inflation are summarized in Table 10. The results show that eliminating oil and powersubsidies would definitely eliminate the fiscal deficit and in addition, generate a substantial fiscalsurplus of 345 billion sucres or 2.9% of GDP (based on the lower estimate). Monetary financingof the public deficit would no longer be required. And, since the domestic component ofmonetary emission would be eliminated, the rate of inflation would be drastically reduced byabout 60%. The remaining 40% of inflation is mainly the monetary consequence of theaccumulation of international reserves. In the long term, however, the impact on inflation of thisexternal origin of monetary emission could be offset.
2.6 Monetary and deflationary goals would be achieved even if, in line with morerecent pronouncements, some of the additional revenues were used to compensate the poor peoplewho bear a large share of adjustment costs, i.e. even if the "social debt" were paid off. In fact,our calculations show that even if one third of additional revenues (192 billion sucres) were usedto mitigate the impact of price adjustments on low-income households, there would nonethelessbe sufficient revenues to eliminate the deficit, the need for monetary emission and, thence, todramatically reduce inflation. Thus, even in the case of sizeable social mitigation, theconsolidated fiscal deficit would be more than eliminated, going from -230.8 billion sucres in1991 (-1.9% of GDP) to a surplus of 152.6 billion (+1.2% of GDP). In this case, the absolutereduction in inflation, in the long term, is in the order of 95%, that is, virtually no inflation.Since, this price correction is the result of an 86.4% reduction in monetary emission, the relatedelasticity will be about 1.10 which is very much in line with the recent evolution of theEcuadorean economy. This a posteriori justification fully validates the impact calculations.

22 Ecuador: Energy Pricing, Subsidies and Interfuel Substitution
Table 10: Impact on Increased Energy Prices on Public Revenues,Fiscal Deficit Money Creation and Inflation, 1991
(billion current sucres)
Measure Proposed Price Deregulation Policy ADDITIONALSOCIALMITIGATIONPOLICY /2
Impact on: Elimination of Elimination of Elimination of Assigning 1/3Oil Subsidies Power Subsidies Oil and Power Additional Revenues
Subsidies to Social Spending
Public S/3,525 bn S/3,416 bn S.3,758 bn S/3,566 bnRevenues (NFPS) + 2.8% +1.9% GDP + 4.7% GDP +3.2 % GDP
Consolidated Fiscal (Surplus) (Surplus) (Surplus)Deficit (NFPS) SI+ Ill bn S/-3 bn S/ +344 BN S/+ 153 bn
(0.9% GDP) (2.8% GDP) (1.3% GDP)
Money (+42 bn) (+86 bn)Emission I/ None Practically
(excluding international Required nonerequiredreserve monetization)
Correction obtained Sl-141 bn S/-96 bn S/237 bn(in %) -77% -52% -129%
Price Index (1978=100)Short-term
Adjustment 4/(in %)
-35% -24.5% -59% -40%
Price Index 774.3 1,913.0 0 227.7(1978=100)
After Long-termAdjustment 4/
Inflation rate +8.5% +21% No more inflation No more(annual growth) inflation
After adjustments
1/ After deduction of monetary emission due to the annual variation in International Monetary Reserves (IR), whosesize is exogenous.2/ Part of additional revenues used to compensate the impact of the price adjustment costs on low-incomehouseholds.3/ Memo item: GDP 1991=12,149.1 bn current sucres (p) and 1991 inflation rate: 50.5%4/ Residual inflation is due to the monetary consequences of the accumulation of International Reserves. In the longterm, these monetary consequences should de offset.Memo item (1991 Oil Subsidies Power Subs. Oil and Power Subs.High estimate S/495 bn S/280 bn S/775 bnLow estimate S/342 bn S/233 bn S/575 bn

Elimination of Oil and Power Subsidies 23
The measurements
2.7 A two-equation model was used to capture Ecuador's monetary and inflationarytrends from 1986 to 1991, on a quarterly basis (Lismand & Sandee method). Based on thismodel, simulation of monetary and deflationary impacts were performed for 1991. The model(two equation, Ordinary Least Squares) and the econometric results are shown below.
ME-IR = +5,128 - 0.451 CFD + 543.0 trend(CPS) - 11,462.2 EXA (1)[R2 =.84] (.079) (187) (3,667)
In PRICE = -4.84 - 0.054 In trend (y) + 1.151 In EMISSION (2)[R2 =.99] (.042) (.048)
Where: ME-IR = Monetary emission net of international reserves (dIRJdt)EMISSION = Overall monetary emission or money supply, ml)CFD = Consolidated fiscal deficit (NFPS & Quasi-fiscal)EXA = External interest arrears (on external debt)CPS = Credit to private sector (represented by a trend)Y = Economic activity level (proxy for money velocity)
A. Adjustments in Fiscal Deficit
2.8 The fiscal deficit in Ecuador has two origins: the Non-Financial Public Sector(NFPS) and the Central Bank. Current fiscal expenditures are mostly assumed by the NFPS,which is disproportionately large compared to the rest of the economy. In 1990, NFPS grossexpenditures amounted to 38.1% of GDP. Moreover, this does not include all of the interestpayments due, since about one-half of the interest payments due by the NFPS is serviced by theCentral Bank. It is thus clear that, in the case of Ecuador, the relevant concept to measure thefinancial needs of the public sector is the consolidation of both the NFPS deficit and the netresults of Central Bank operations or Quasi-Fiscal deficit.
2.9 This illustrates how tenuous the fiscal balance is when it depends on a singlesource of revenue for so much. Fiscal years 1989-1991 closed balanced on a cash basis (but 50%interests obligations are assumed by the Central Bank) but accrued interest on the external debtreached 21% of current expenditures in 1989 and 1990. The oil price windfall in 1990contributed decisively to this outcome.
2.10 The Central Bank's quasi-fiscal deficit is mainly due to the extraneous fiscal roleof the Bank, which is at the center of a complex maze of subsidies to and from the NFPS andthe private sector. By far the most important is the assumption by the bank of the external debtof both the public and private sectors (39.7% of GDP in 1989). This large external indebtednessis mainly due to the rescheduled public debt of the Treasury shifted onto the books of the CentralBank (20% GDP). These external interests due amounted to S/227.7 bn in 1990.

24 Ecuador: Energy Pricing, Subsidies and Interfuel Substitution
B. Measurement of the monetary impact
2.11 The consistency between consolidated fiscal deficits and other macroeconomictargets can be judged by looking at the government budget constraint. This constraint says thatthe sum of the noninterest deficit and the interest bill on foreign and domestic debt is equal tothe sum of financing from all sources. Fiscal deficits can be financed in three ways; issuingexternal debt (or incurring arrears), issuing interest-bearing internal debt, and obtaining monetaryfinancing. It is important to capture the difference between monetary financing and the externalaccrued debt. As monetary emission is performed on a cash basis, the overall fiscal deficit wascalculated both on a cash and accrual basis, to allow for estimation of external arrears. Between1987 and 1991, some of the monetary consequences of fiscal deficits have been avoided throughthe accumulation of arrears on external interest payments.
2.12 The second approach to monetary emission is on the supply side. From the CentralBank balance sheet we can derive that high powered money (H) is the sum of monetary financing(or domestic credit to the government (DCg) plus the monetization of international reserves, assetaccumulation (IR) and credit to the private sector (CPS) with other liabilities of the Central Bank.The external origin of monetary emission due to reserves accumulation or revaluation was 53%of total emmission in 1990 and 57.6% in 1991. In equation 1, only the money supply ofdomestic origin was considered: it demonstrates a strong elasticity of 1.15 in respect to changesin the fiscal deficit.
C. Measurement of the deflationary impact
2.13 The econometric model underlying equation 2 is based on a pragmatic view ofinflation from the perspectives of public finance (Phelps, 1973) and of monetary approach (J. J.Polak, 1977). In the short run, demand pressure or cost push factors such as changes in the wageor in the nominal exchange rate may be important determinants of inflation. Such factors,however, contribute little to the understanding of sustained inflation. Excess demand pressure,as Friedman (1978) points out, should lead to accelerating rather than sustained inflation. Toexplain sustained inflation rates requires analyzing the fiscal implications of such inflation. Thefiscal view of inflation points that short-term links between inflation and deficits are likely to betenuous, but that any deficit coupled with a sustainable, constant ratio of debt to output impliesa particular inflation rate.
2.14 There are three main sources of sustained inflation in Ecuador: the NFPS fiscaldeficit, the quasi-fiscal deficit of the Central Bank and the monetization of international reserves.In the short run, the elimination of the NFPS fiscal deficit, by the way of eliminating subsidies,will reduce inflation by about 60%. The residual inflation is mainly due to the fiscal role of theCentral Bank and its related policy of reserves monetization as an additional and less obviousway of financing the public deficit. However, in the long term, this residual source of inflation

Elimination of Oil and Power Subsidies 25
would be offset as a rational consequence of fiscal adjustments. Recent World Bank research,however, may suggest that this may take time and effort.7
2.15 The elimination of subsidies should help the Central Bank (BCE) to recover itsmonetary policy function. In fact, a large fiscal surplus will provide the Government with theability to service its own external debt. Public external debt could thus be retransferred to theCentral Government. There is no reason why the BCE should continue to play a marked role infiscal and financial intermediation. As the paper shows, the BCE would not need to run anydeficit, if its only function were that of regulating monetary aggregates. In addition, the BCEshould recover sufficient resources in order to regulate the monetary consequences of theaccumulation of reserves due to real surpluses in the balance of payments. The monetization ofreserves is the third cause of inflation. In fact, two factors can offset the monetary consequencesof the accumulation of international reserves. First, the net accumulation of positive balances inthe Central Bank by the Non-Financial Public Sector (NFPS) will offset the balance of paymentssurpluses and the related increase in monetary base. Inflation will be reduced. As a result,domestic savings will increase, leading to additional sterilization of high powered money. Second,curing inflation will restore Ecuadorean competitiveness. The process of depreciation of the localcurrency will stop, as well as the related revaluation (in sucres) of the stock of internationalmonetary reserves. Monetary consequences of this latter appreciation will be eliminated. Thesevirtuous circles will lead to successive reduction of inflation, within an interval between -60%and -100%, or more.
2.16 The price increases themselves will cause an increase in the costs of all economicactivities and of consumption. The table below summarizes these impacts. It should be noted thatthese are maximum and short-term impacts as consumers and producers will adjust theirconsumption and thus lower the impact of these higher prices on their costs and budgets.Furthermore, these cost increases are a once and for all phenomenon and are thereforeinsignificant during an inflationary process.
7 See: Kiguel and Liviatan; op.cit
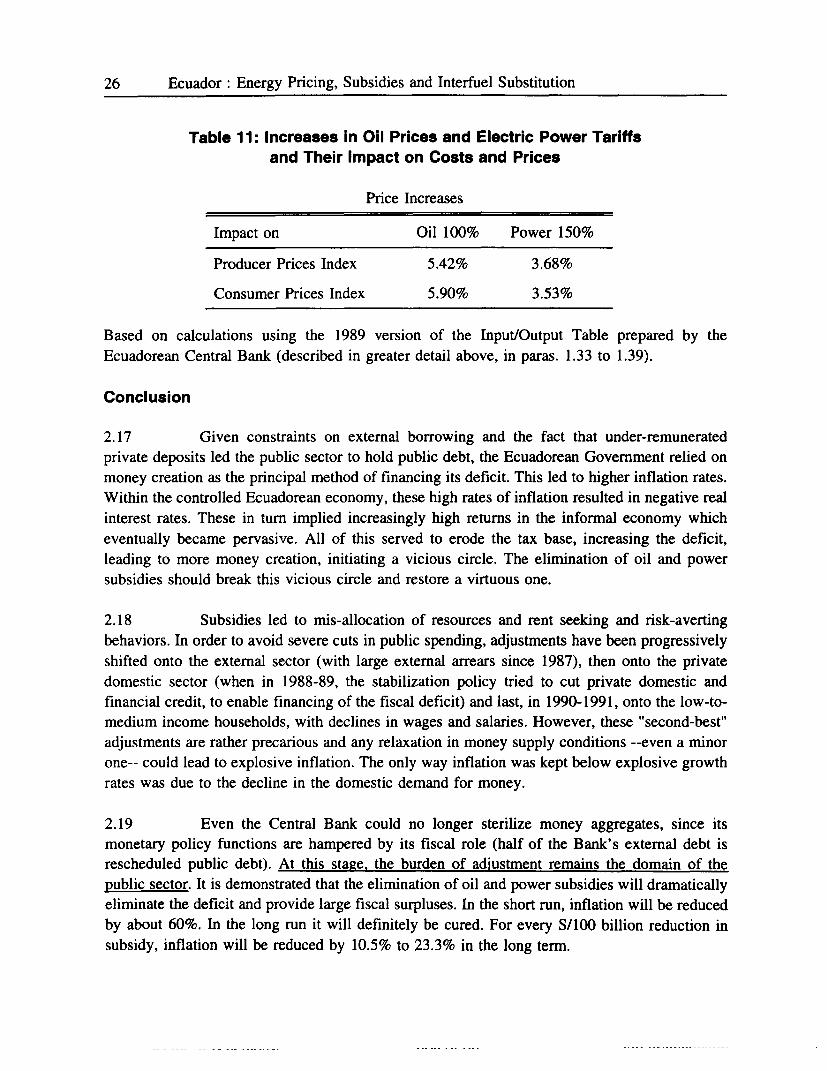
26 Ecuador: Energy Pricing, Subsidies and Interfuel Substitution
Table 11: Increases in Oil Prices and Electric Power Tariffsand Their Impact on Costs and Prices
Price Increases
Impact on Oil 100% Power 150%
Producer Prices Index 5.42% 3.68%
Consumer Prices Index 5.90% 3.53%
Based on calculations using the 1989 version of the Input/Output Table prepared by theEcuadorean Central Bank (described in greater detail above, in paras. 1.33 to 1.39).
Conclusion
2.17 Given constraints on external borrowing and the fact that under-remuneratedprivate deposits led the public sector to hold public debt, the Ecuadorean Government relied onmoney creation as the principal method of financing its deficit. This led to higher inflation rates.Within the controlled Ecuadorean economy, these high rates of inflation resulted in negative realinterest rates. These in turn implied increasingly high returns in the informal economy whicheventually became pervasive. All of this served to erode the tax base, increasing the deficit,leading to more money creation, initiating a vicious circle. The elimination of oil and powersubsidies should break this vicious circle and restore a virtuous one.
2.18 Subsidies led to mis-allocation of resources and rent seeking and risk-avertingbehaviors. In order to avoid severe cuts in public spending, adjustments have been progressivelyshifted onto the external sector (with large external arrears since 1987), then onto the privatedomestic sector (when in 1988-89, the stabilization policy tried to cut private domestic andfinancial credit, to enable financing of the fiscal deficit) and last, in 1990-1991, onto the low-to-medium income households, with declines in wages and salaries. However, these "second-best"adjustments are rather precarious and any relaxation in money supply conditions --even a minorone-- could lead to explosive inflation. The only way inflation was kept below explosive growthrates was due to the decline in the domestic demand for money.
2.19 Even the Central Bank could no longer sterilize money aggregates, since itsmonetary policy functions are hampered by its fiscal role (half of the Bank's external debt isrescheduled public debt). At this stage. the burden of adiustment remains the domain of thepublic sector. It is demonstrated that the elimination of oil and power subsidies will dramaticallyeliminate the deficit and provide large fiscal surpluses. In the short run, inflation will be reducedby about 60%. In the long run it will definitely be cured. For every S/100 billion reduction insubsidy, inflation will be reduced by 10.5% to 23.3% in the long term.

Elimination of Oil and Power Subsidies 27
2.20 The welfare of low-income households and poor people was the primary cause ofconcern of this study. The elimination of subsidies is implemented on a responsible basis: thehypothesis is that one-third of additional revenues are assigned to social spending. In fact, theremoval of inflation will provide low-income households with a more stable framework in whichthey will be more productive, earn higher incomes, be ble to save (without having to pay the"inflation tax"), with better access to social services and to services needed to improve theirhuman capital, thanks to additional resources (from higher energy prices) going to these activities.

3
POWER:PERFORMANCE, RECENT DEVELOPMENTS,
NEED FOR POLICY AND SUBSECTORAL REFORMS
Introduction
3.1 This section deals with the main issues faced by Ecuador's electric powersubsector. The first part of the section presents a diagnosis of the situation (technical andfinancial perforrmance, tariffs, and subsidies). The latter part of the section deals mainly withinstitutional issues and ideas and guidelines for institutional reforms (regulatory framework,deregulation, restructuring, privatization). The main recommendations of this section are: toadopt the tariff policy defined in the recently completed INECEL tariff study (funded under anongoing World Bank project); to separate regulatory from operational responsibilities, implyingchanges in the structure and functions of INECEL; and to improve both planning and selectionof investments.
Sector Overview
Institutional Framework and Regulatory Structure
3.2 Ecuador's power sector is composed of a vertically integrated public utility,INECEL, responsible for bulk power generation and transmission and nineteen regionaldistribution companies that serve their customers with bulk purchases and autogenerated power.One of these distribution companies, EMELEC, serving Guayaquil, is owned by private foreigninvestors. The other 18, although organized as limited liability companies are owned by the Stateeither through INECEL or regional governments. There are also a number of smaller facilitiesowned by municipalities and isolated power users. INECEL is also responsible for the operationof these latter facilities.
3.3 The Basic Electrification Law of 1961 which defines generation, transmission,distribution, and commercialization of power as a public service to be performed by a publicentity, has led to the creation of INECEL, the Ecuadorean Electrification Institute. Placed underthe direct jurisdiction of the Ministry of Energy and Mines (MEM) and, thus, operating as anexecutive branch of the Central Government, INECEL is in charge of sector planning,

Power: Performance, Recent Developments 29
development, and coordination, and its Board assumes supervisory and regulatory functions,including the approval of rates applied to the distribution companies and the design of tariffscharged at the retail level (with the exception of EMELEC's tariffs which are handled by theMEM). A Higher Council of Energy (CSE) established to develop and coordinate energy policiesacross different subsectors has not been operative to date. There is also a National EnergyInstitute (INE) which advises the MEM, but has no political leverage. INE should be reorganizedand turned into the regulatory agency the sector lacks, or given the resources and the autonomyto perform its mandated role as an advisory body on energy policies.
3.4 Before the inflow of large windfall profits that crude oil exports began to generatein the 1970s, INECEL's role had been restricted to that of a planning agency without financialresources. Thanks to its share in the country's oil revenues, INECEL graduated from a minorpower company to a major public utility.
3.5 During the 1980s INECEL became the sector's largest power generator, currentlyaccounting for more than 85% of total electricity supply, operating the interconnected grid, andcontrolling, at least nominally, the regional distribution companies by dint of being their majorityshareholder. On the other hand, as a public utility, INECEL is subject to numerous legal,administrative, and financial restrictions, ranging from the dependence on budget allocations ofthe Central Government and the approval of its budget by the Congress, to public sectorprocurement procedures and civil service regulations that bog it down in its daily business.Moreover, INECEL is saddled with a Board of Directors representing several Ministries, theArmed Forces, and other stakeholders whose opinions and interests intrude on the Board'sAgenda, limit the autonomy of the Executive Directors, and have a strong bearing on the utility'soverall performance.
3.6 INECEL's organizational structure was designed to be simple, but failed to workin practice. The weakness of administrative and operational direction in tandem with an ill-defined allocation of duties have fostered the growth of functional areas and an overlap ofresponsibilities. The general management is required to exercise its authority through asubmanagerial unit that duplicates the decision-making process at the top of INECEL's hierarchy.A technical and administrative committee (Comite de Coordinaci6n T6cnico-Administrativo)directly attached to the general management did not really work. In addition, the managementis stuck with a number of subordinate advisory and support units of which many are redundant.And the core operational areas, i.e. engineering and construction, system operation, anddistribution/commercialization, have been placed on an equal footing with lower-ranking taskssuch as rural electrification and small hydropower development. Due to the proliferation of tasksand duplication of responsibilities, INECEL's organizational set-up has become a major obstacleto efficient power sector development.
3.7 Unlike INECEL, the nineteen distribution companies have a corporate structure,with the majority of the shares in 18 of them held by INECEL and the rest, by municipalities

30 Ecuador: Energy Pricing, Subsidies and Interfuel Substitution
(only a tiny fraction of the shares is held by the public). The 19th, EMELEC (Electricity
Company of Ecuador Inc.) serving the city of Guayaquil, remains the only company owned by
private investors. Its concession, though, expired in 1985. The Government had made the decision
to buy out the company, and according to an arbitration decision it is required to pay US$43
million for the assets and to assume EMELEC's debt to INECEL and Petroecuador.
3.8 While the distribution companies are not exposed to Central Government
interference, they are controlled through the pro-forma majority of Board members appointed by
INECEL. Defacto, however, the representatives of local/regional authorities and organizations
exert a disproportionately strong influence on the companies' policies. As a result, the distribution
companies' way of conducting business is driven not so much by corporate interests or system-
wide considerations but by the political clout of local and regional pressure groups.
3.9 In brief, the governance structure of Ecuador's Power Sector is a public monopoly
which clears (within the Board of Directors) and executes Central Government policies, has the
operational responsibility for bulk power generation and transmission, and is supposed to regulate
and control the performance of its regional subsidiaries, the distribution companies, and to a
lesser extent, EMELEC. The structure does not lend itself to a decision-making process which
should be driven mainly by sound corporate principles. On the part of INECEL, the proliferation
of responsibilities, the weakness of managerial leadership, and limited financial leeway go hand
in hand with a lack of accountability and financial discipline. While being subject to INECEL's
corporate and regulatory supervision, in practice, the distribution companies tend to self-regulate
their activities in accordance with the political interests of their local/regional shareholders and
clients.
Sector Development and Infrastructure
3.10 Between 1977 and 1991 INECEL's installed capacity increased from 100 MW to
1,676 MW. Its capacity expansion program has been geared towards the exploitation of the
country's huge hydro potential of about 22 GW. By the end of 1991, INECEL's hydro power
facilities (located at three sites) accounted for a nominal capacity of 1,300 MW, with the
remainder of 376 MW provided by thermal plant. On the other hand, since the early 1970s little
generating capacity has been added to the plant operated by distribution companies, probably
reflecting the superior economics of the large hydro plants built by INECEL. In fact, their
effective capacity shrunk as an increasing share of the old plant became obsolete or inoperative.
In 1991, the distribution companies' effective capacity was estimated at 353 MW, of which 271
MW were provided by thermal facilities, most of them owned by EMELEC. Including the plants
operated by INECEL, the sector's total effective generating capacity is in the vicinity of 1,700
MW, with hydropower accounting for 1,100 MW (as of early 1992). The core infrastructure of
the system also comprises 664 Km of 230 kV transmission lines forming a rectangular inner
network from which 138 kV lines with a total length of 1,162 Km spread throughout the country.
The distribution network comprises about 3,200 Km of 22-69 kV lines.

Power: Performance, Recent Developments 31
3.11 During the 1980s, total electricity consumption (=sales) increased at an averageannual rate of 6.1 %. Sales slowed down in 1983/84 and 1988/89. Thereafter, consumption growthresumed and rose at an annual rate exceeding 8%. By 1991, residential users accounted for 39%of total consumption, followed by industry (31%), "others" (15.5%) and the commercial sector(14.5%).
3.12 Between 1979 and 1989, the sector's gross generation rose from 2,718 GWh to5,770 GWh, while peak load climbed from 600 MW to 1,093 MW. During the same period,thermal generation increased from 2,040 GWh in 1979 to 2,950 GWh in 1982 and then fell to836 GWh in 1989. However, this trend came to a halt in 1990 when gross generation began tosoar by almost 10% a year. As gross generation jumped from 5,770 GWh in 1989 to 6,989 GWhin 1991, with peak load reaching the level of 1,246 MW, available hydropower capacity whichat the end of 1991 expected to provide an annual average of about 6,500 GWh failed to matcheither the growth or load profile of demand. As a consequence, the system had to increasinglyresort to thermal generating facilities that according to INECEL's forecasting and master planningshould have been mothballed by 1991. Indeed, between 1989 and 1991 thermal generation rosefrom 836 GWh to 1,919 GWh, with its share in total gross supply increasing from 14.5% to27.5%, essentially because of hydrological factors.
3.13 Since additional hydro capacity is not likely to come on stream before 1995 andgiven the fact that the installed thermal plant, plagued by wear and tear and a neglect ofmaintenance, provides unreliable backup capacity for meeting incremental demand, the systemmay face severe capacity and energy constraints in the immediate future. Another factorcontributing to the reliability problems is the transmission network. Its current design is notsuited to safely match demand when thermal plants make up for a large share in generation.(There is also no reactive power control). The vulnerability of the sector became manifest in early1992 when the drought considerably reduced the level of hydroreservoirs, resulting in periodicdisruptions in electricity supply which were exacerbated by failures in the transmission system.
Markets
3.14 At the end of 1991, the nineteen distribution companies served a total of 1.5million customers. Residential Users account for 86% of the connections and have a 38% sharein total electricity consumption. On the other hand, with 13% of the connections, commercial andindustrial clients account for 45% of total consumption. Almost 90% of the customers are locatedin urban areas. The major load centers are in Guayaquil with 33% of the system's noncoincidentpeak demand, and Quito which contributes 25% to the system peak. Likewise, 61 % of totalelectricity consumption can be ascribed to the cities of Guayaquil and Quito. Ten distributioncompanies have a market share of less than 2% each. Average monthly household consumptionis highest in Guayaquil (177 kWh) and lowest in Sucumbios (92 kWh). Average monthlyconsumption of industrial customers ranges from 18,000 kWh (Guayaquil) to 1,200 kWh(Sucumbios).

32 Ecuador: Energy Pricing, Subsidies and Interfuel Substitution
3.15 System peak occurs in December, i.e. during the dry season which -relative to thedeveloped hydro resources- lasts from October to February. Industrial power demand is highestbetween July and October, and lowest between December and February. Residential andcommercial demand shows the reverse pattern. It is highest in the dry season and lowest fromJuly to October. The daily peak occurs between 7 and 10pm. The residential users' peakresponsibility is 100%, while industrial customers account for 78%, and commercial users for70% of the daily peak.
3.16 In 1991, bulk power transactions amounted to 81% of the electricity generated(net) by the sector. Only 0.4% of the sector's bulk power sales came from distribution companies(equivalent to about 2% of their net generation); the remainder was provided by INECEL. Almost99% of the bulk power purchases were undertaken by distribution companies; approximately0.2% (12.3 GWh) was exported to Colombia (from EMELNORTE), and the balance of about0.8% was not accounted for in INECEL's records. In any case, INECEL did not buy fromdistribution companies, and the trade among distribution companies was minuscule.
Sector Performance
3.17 During the 1980s, INECEL's ambitious investment program was financed mainlyby earmarked oil revenues and, to a lesser extent, through foreign borrowing. The sector itselfwas unable to contribute to the financing of the expansion program. Consequently, when thecountry's oil revenues became less plentiful, the sector encountered an increasingly criticalsituation, leading to a delay in planned investments in power generation and transmission.INECEL not only experienced rising deficits, but was left with having to service a total debt ofabout US$ 1.1 billion by 1992 (which has been assumed by the Central Government). Apart fromcomparatively high operating expenses, the major factors contributing to INECEL's financialweakness were and continue to be (i) its inability to raise and keep tariffs at a level compatiblewith cost recovery (although, with the measures applied on September 4, 1992, an important stepwas taken toward a more logical tariff-setting policy), and (ii) the distribution companies'unwillingness to pay their bills. As the latter (and more so Government institutions) notoriouslyfall behind on payments due to INECEL and on average fulfill only 50% of their financialobligations, INECEL frequently resorted to swapping the companies' debt for equity, which mayhave pleased the distribution companies, but entailed little financial relief for INECEL.
3.18 By international standards, INECEL and its subsidiaries are overstaffed. The sectoremploys about 10,200 persons. With 521 kWh a year, the volume of sales per employee issignificantly lower than in comparable countries. Too much decision power is vested inINECEL's Board of Directors which represents diverse economic and political interests ratherthan being a unit forging corporate strategies, leaving little managerial autonomy to the ExecutiveDirectors. Many of the appointees representing INECEL in the Board of distribution companiesare not overly interested in the performance and efficiency of the companies. Within INECEL'sadministration, a major shortcoming has been that planning, which is given a high priority, oftenignores sound economic reasoning and lacks appropriate technical expertise.

Power: Performance, Recent Developments 33
3.19 Quality of supply seems to be deteriorating. For instance, voltage and frequency
fluctuations are costly, particularly for industrial users. There is no economic dispatch, and the
central dispatch facilities which are currently being installed will do little to improve the situationas long as shortages at the generation end as well as reliability constraints faced by the
transmission system tend to swamp merit order considerations.
3.20 Another problem for the power sector, negatively influencing overall performance,
is the high level of transmission and distribution losses. Total losses are on the order of 24% of
net power generation (4% in transmission and 20% in distribution, of which the largest share,possible around 13%, results from non-technical losses, that is, theft and administrative and
billing weaknesses). In developed countries, distribution losses range from 4% to 5% so that there
is great potential to reduce these losses in Ecuador. ESMAP, with the collaboration of the
Ecuadorean power sector (and with cofinancing from Belgium and Switzerland) has recently
completed a study on loss reduction which recommends investments of US$106 million whose
yield varies between 30% (reduction of technical losses) and 12% (reduction of non-technical
losses). CAF (Corporaci6n Andina de Fomento) has recently provided a loan/grant of US$40
million, with Belgian funds, to begin the recommended investments.
Sector Expansion Program
3.21 A major dilemma of Ecuador's power sector is that while the implementation of
a number of expansion projects is behind schedule, demand is growing faster than expected.
Paute Phase C, with a capacity addition of 575 MW, was supposed to be operative at the end of
the 1980s, but came on stream only in November 1991. The construction works of the multi-
purpose project, Daule Peripa which were planned to start in 1988 are still not complete. As a
consequence, the 130 MW of the hydro component are not likely to be available before 1997.
A second 230 kV transmission line from Paute to Guayaquil was planned and should have been
completed at the same time as Paute C but has still not been built. This is why generation at
Paute is limited to 820 MW out of an installed capacity of 1075 MW. A project aimed at the
rehabilitation of 49 thermal plants that are owned by distribution companies and could provide
a total of 129 MW, is being delayed because of a lack of finance. Finally, the Paute-Mazarproject (180 MW) located upstream of the Paute hydroplant is reported to be in the design stage
since 1987. The project would help stem the sedimentation of the Amaluza reservoir, and
increase the Paute plant's storage capacity which currently is limited to five days of operation.
However, conclusive studies on the technical feasibility and economic viability of the project donot exist yet. Finally, since the Paute watershed already accounts for about 90% of the country'shydropower capacity, the risk of drought-induced shortages could become even greater than it
is today.
3.22 The sector total investments scheduled for the 1990s amount to about US$2.9
billion, of which 63% are accounted for by proposed capacity additions. Also, INECEL reckonsthat, at the turn of the century, an additional one million customers will be connected to the grid.

34 Ecuador: Energy Pricing, Subsidies and Interfuel Substitution
In view of the sector's financial difficulties and the resulting backlog of investment activities,none of the proposed projects is likely to materialize on time. For that reason the recentlycompleted tariff study has revised INECEL's master plan of 1989 to obtain a more realistic basisfor calculating long-run marginal costs (LRMC). The least-cost expansion plan favored by thestudy begins in 1997 and calls for the installation of a gas turbine (85 MW) in October 1997, thecompletion of San Francisco (210 MW hydro) in November 1997, and the comnmissioning ofChespi (167 MW hydro) in November 2,000, assuming that until 1997 demand can be met withthe existing plant plus the capacity additions scheduled for the period 1992-1996. It seems,though, that the picture drawn by the tariff study is still optimistic. The revised capacityexpansion strategy is most likely to be thwarted by financial realities. And if electricity demandcontinues to grow at the rates observed in the last two years, shortages will become pervasivein the short-to-medium term (i.e. within the 1992 - 1996 presidential period). Higher tariffs sincelate 1992 (see below) will hopefully dampen demand growth.
Tariffs
3.23 According to the Basic Electrification Law, electricity tariffs are subject to theapproval of INECEL's Board of Directors; they should reflect costs and provide the sector withan adequate rate of return on investment. In practice, though, tariffs are fixed by the Board onpolitical grounds with little regard to economic considerations. Based on the fallacy that as apublic service the provision of electricity can defy economic reasoning, pricing of electricity hasbecome a political matter. The policy imperative has been to serve as many consumers aspossible with as much electricity as is available, without letting them know what costs they incur.Things went well as long as the Central Government was able to invest huge amounts in a small,but rapidly growing sector run by a public utility whose sales revenues covered its operatingcosts. However, low tariffs encouraged excessive consumption, rendered the sector financiallyweak, and failed to generate extra revenues needed to sustain the reinforcement and expansionof supply facilities that the Government found increasingly difficult to finance.
3.24 The most recent increase in tariffs took place on September 4, 1992, together withan increase in domestic oil prices and those of other publicly-supplied goods and services. Thetariff increase of September 1992 initially reduced to 150 kWh the amount of monthlyconsumption whose tariff is to remain frozen and tied to the increase in minimum wages. Shortlythereafter, however, this level was set again at 200 kWh. This freeze applies to the first 200 kWhof monthly consumption of all residential consumers and is thus not a particularly progressivesocial measure. Overall, however, the increase was significant, resulting in a 66.3% increase inthe average tariff. The increase is more fully described in the table below, as well as the marginalaverage cost per consumer class.

Power: Performance, Recent Developments 35
Table 12: Average Tariffs by Consumer Class
(US$/kWh)
September 1992
Margi. Cost Tariff July 1992 Increase %
Without DC:
Residential 0.0831 0.053 0.034 57.9
Commercial " 0.089 0.045 96.5
Handicrafts " 0.077 0.042 85.8
Govt. Instit. " 0.101 0.047 114.2
With DC*
Commercial 0.0682 0.077 0.049 57.1
Govt. Instit. 0.072 0.047 53.2
Industrial 0.068 0.040 72.8
Water Lifting 0.055 0.030 83.3
Public 0.0831 0.083 0.035 137.1Lighting
Average 0.066 0.038 73.7
* It includes charges for capacity. DC = Demand Charge
3.25 During the 1980s, electricity users by and large paid between S/34 and S/51 perkWh (in prices of 1991), in spite of four major attempts INECEL made to raise and keep tariffsat a higher level. The next to last significant rate increase took place in 1989 when the price forbulk supplies doubled and retail tariffs on average rose by 50%. The increase was highest for
industrial customers and lowest for residential users. Also, since January 1989 until September3, 1992, prices for both wholesale and retail transactions were increased by 3% a month (about
40 % a year), with the exception of the first 200 kWh/month of consumption, which face
automatic rate increases tied to the minimum wage. In real terms, however, the impact of themeasures gradually lost momentum as inflation continued to eat up the adjustments in nominaltariffs. Moreover, since the increases in residential tariffs lagged behind the sector average, thewedge between residential and nonresidential rates became larger. Between 1988 and 1991 theratio of average residential to average industrial rates fell from 0.8 to 0.5 (while costs of serviceare usually in the reverse ratio) but in September, 1992, this ratio rose to 0.74.

36 Ecuador: Energy Pricing, Subsidies and Interfuel Substitution
3.26 Tariffs for bulk purchases from INECEL are composed of a per-kW charge forsubscribed capacity and an energy charge. There is also a penalty on capacity drawn in excessof the contracted amount of kWs. While these rates apply uniformly to all distribution companies,a discriminatory scheme of energy discounts has the effect that the companies' average costs ofbuying electricity from INECEL can vary considerably. The rationale for the discounts is to(cross) subsidize companies that are placed at a disadvantage in terms of location, the numberand composition of customers, etc. However, since the undiscounted bulk purchase tariffs coveronly a fraction of INECEL's supply costs, the subsidies' impact is to increase INECEL'sfinancial losses. As of July 1992, the capacity charge imposed at the subtransmission level (138kV) amounted to S/2,980/kW/month, while energy was sold at an average of s/56/kWh. The loadfactor relevant to the transmission level under consideration is about 0.54. Hence, the distributioncompanies on average paid s/32.16/kWh (0.021 US$/kWh) or less, depending on the size of thediscount. For comparison, INECEL's tariff study of March '92 estimates that the average costsof bulk power supplied at the subtransmission level amount to s/94.5/kWh, equivalent to 0.0636US$/kWh (at a rate of exchange of s/1,500/US$). As of September 1992, the bulk charges wereS/127,3/kwh (US$0.0707/kWh at an exchange rate of S/1800/US$).
3.27 The tariffs charged at the retail level vary by customer class. Residentialconsumers pay a fixed charge up to 20 kWh/month, and are subject to increasing block rates ifmonthly consumption exceeds the threshold of 20 kWh. In July 1992, the average rate paid byresidential customers was s/50.87/kWh (0.0339 US$/kWh). Industrial customers face a multiparttariff schedule that includes a demand charge and declining block rates. On average, they werebilled s/59.61/kWh, equivalent to US$0.0397/kWh (as of July 1992). Commercial customers aresubject to either a two-part tariff comprising a demand charge and an energy rate, or anincreasing block schedule, with a flat rate for a consumption level of 20 kWh/month or less. Asimilar scheme applies to Government institutions. In July 1992, commercial users withoutdemand charge on average were charged S/68.02/kWh (0.0453 US$/kWh, at a S/1500/US$exchange rate) and S/74,44 (US$0.0496) for user with demand charge. As of September 1992,tariffs for users with contracted capacity were as follows: commercial users were chargeds/139.51/kWh (US$0.077/kWh) and government institutions s/129/kWh (US$0.072, at a exchangerate of S/1800/US$). Special rates apply to water pumping, public lighting, and some largeconsumers such as the refineries. Also, in some cities, notably Quito, the monthly electricity billpresented to final consumers often includes a separate fixed charge for fire protection servicesand a garbage removal fee are assessed as a percentage of electricity consumption.

Power: Performance, Recent Developments 37
Subsidies
3.28 In July 1992, the total subsidy accruing to electric power consumers totalledUS$223.4 million (nearly 2% of GDP of 1991). In September 1992, after the increase in tariffs,the total subsidy was cut to about U$104.8 (less than 1% of GDP) or may be a little bit less, asconsumers, especially those who are no longer subsidized attempt to reduce their consumption.In fact, large residential consumers (those using in excess of 1500 kWh/month), commercialconsumers with a demand charge, government institutions and public lighting are no longersubsidized and contribute to covering part of the subsidy accruing to households, commercial andsmall enterprise (handicrafts) users without demand charge.
3.29 Most of the financial burden arising from subsidies granted to electricity users iscarried by INECEL. Under the current tariff regime (with the tariffs in force until September 3,1992), INECEL forgoes at least US$0.043 per kwh supplied to the distribution companies(compared to a tariff system for bulk purchases that would reflect the costs incurred by INECEL).On the other hand, since the distribution companies buy electricity at US$0.021/kWh or less andon average sell for US$0.036/kWh, their margin is in the vicinity of US$0.015/kWh. Dependingon the type of customer served, the companies' average costs (covering losses in the distributionsystem, operating expenses, and depreciation, but not including the costs of bulk supplies) rangebetween US$0.005 and US$0.020/kWh. Hence, the distribution sector as a whole does not seemto experience major financial difficulties (even if the companies were to pay INECEL promptly,which they don't). The lion's share of the subsidies enjoyed by electricity users is reflected inlosses by INECEL, with the Government acting as the financier of last resort. The situation sinceSeptember 3, 1992, has improved considerably. the average tariff for the distribution companieswill be around US$0.0361 1/kWh, compared to US$0.0653 which is the estimated average tarifffaced by consumers.
3.30 Most of the subsidies (i.e. 57.4%) benefitted residential customers. If subsidies aredefined as direct economic costs to the power sector that customers do not pay, then thehouseholds connected to the grid received in July 1992 a total subsidy of US$10.7 million. Onan annual basis, this amounts to US$128 million. The subsidy per connection increases with thenumber of kWh consumed. While households using not more than 20 kWh/month are subsidizedby US$0.44/month, the subsidy is US$91/month if the monthly consumption exceeds 1,000 kWh(July 1992 figures). However, the cumulative subsidy is highest for households that consume 300kWh/month or less. These households account for 58% of total residential consumption and 91%of the total number of consumers, receiving 64% of the total subsidies to the residential sector.this situation has changed since september 4 as follows: the subsidy received by householdsamounts to US$8.8 million/month, which works out at US$105.6 Million a year; the householdsconsuming less than 300 kwh/month account for 75.6% of the subsidy to the residential sectorand those consuming between 1000 and 1500 kwh/month are subsidized by US$24 instead ofUS$91 as before. Moreover, it was estimated that the highest consumption households (above

38 Ecuador: Energy Pricing, Subsidies and Interfuel Substitution
1500 kwh/month), provide a cross subsidy of US$61.6/user/month which accounts for 3.8% ofthe total subsidy for the residential sector.
3.31 Industry was the second largest recipient of subsidies supported by the tariffsystem. In July 1992, it received about US$3.4 million, which works out at US$41.2 million ayear. Next is the commercial sector which accounts for US$26.7 million a year, followed bypublic lighting and water lifting with an annual subsidy of US$12.4 million and US$6.5 millionrespectively. The annual take of Government institutions is worth US$6.3 million, and smallmanufacturers receive US$2.1 million a year (all figures are extrapolated from July 1992estimates). This situation has changed since September 3, 1992, as industry no longer receivesa subsidy. This sector contributes to financing the subsidy for residential, commercial andhandicrafts users (without demand charge). Government institutions, commercial users withdemand charge and public lighting are also transferring cross subsidies to the above- mentionedusers.
3.32 The table shown below summarizes the distribution of the subsidy component ofthe present tariff regime by customer class, compared to the July regime. The economic costs ofthe subsidies are likely to be higher due to deadweight losses (e.g. the adverse impact that thefinancial drain has on sector operation and development) that the above figure does not take intoaccount. In particular, government transfers to the sector do not made up for the financial lossesentailed by the subsidies. At any rate, the size of the subsidies as well as its distortionaryimpacts, place a burden on the power sector and the economy at large that is neither defendablenor sustainable.

Power: Performance, Recent Developments 39
Table 13: Subsidy Component of Electricity Tariffs by Consumer Class'
Average Share in Total Total Share inSubsidiary Subsidiaries Subsidiaries Total cons
(UScents/kWh) (%) (USS thousand) (%)
July 92 Sept 92 July 92 Sept 92 July 92 Sept 92 July 92
Residential 5.7 4.7 57.4 100.8 10685 8805 43.1
Commercial without DC 4.3 0.3 9.1 1.5 1702 130 9.1
Commercial with DC 1.4 -0.9 2.8 -3.0 524 -263 6.6
Handicraft 5.3 1.7 0.9 0.6 174 56 0.1
Industrial 2.3 -0.0 18.4 -0.6 3433 53 27.6
Govt. Instit. without DC 3.8 -1.4 0.9 -0.8 169 -66 1.0
Govt. Instit. with DC 2.0 -0.9 1.9 -0.7 358 -60 4.0
Water Pumping 3.8 1.3 2.9 2.1 540 187 3.4
Public lighting 4.8 -0.0 5.5 -0.1 1033 -5 5.1
Total 4.2 2.0 100.0 100.0 18618 8734 100.0
Memo: Exchange Rate July 1992: s/1500/US$Exchange Rate October 1992: s/1800/US$
1DC=demand charge
Conclusions
3.33 Ecuador's electricity sector has reached the point where drastic efforts and changesin policy are required to meet the challenges of the future. Economic growth and social progresswill call for additional electricity supplies, improved services, the expansion of service areas, andcost-efficient utility performance. The sector, however, needs to be assisted to accomplish thesetasks.
3.34 Sector institutions are exposed to government intervention and political pressureexerted by various interest groups. Legal and administrative impediments limit the sector'soperational autonomy and have fostered the growth of bureaucratic structures and inefficiencieswithin the electric utilities. The utilities are heavily dependent on Government funds, tend tomisallocate resources, and are unable to generate and raise the finance needed to sustain andexpand the sector's services. Their tariff system is hostage to an ineffective redistribution policythat has never been assessed in terms of its financial (costly) and allocative (regressive)implications. And corporate responsibility, true market discipline, and accountability are criteria
40 Ecuador: Energy Pricing, Subsidies and Interfuel Substitution
that did not really guide the behavior of sector institutions. As a result of these shortcomings,investments in essential infrastructure are lagging behind the growth of demand, service qualityis deteriorating, and the sector has neither the incentives nor the resources to redress theincreasing imbalances.
3.35 Ecuador's electricity sector is stuck with problems that piecemeal policy changesare unlikely to resolve. What is needed are far-reaching reforms that reshape the sector, redefineits responsibilities, and establish a revised system of regulatory control and supervision. The keyingredients of the reform package will be a new tariff policy and a new institutional framework.
Policy Reforms
Tariffs
3.36 While electricity appears to be a homogeneous good, it in fact has multipledimensions, depending on where, when, and how it is generated or used. For that reason, pricingof electricity becomes a complicated task. In particular, the cost of generating a kWh and thevalue it has to a consumer may vary during the day, month, or year. Moreover, since electricityin general cannot be stored or retraded, generating capacity must be sized to meet peak demand,even though the peak may last only a short period of time. While the load (level of demand)changes over time, generating plants differ in terms of (unit) capital and operating costs. Oneconomic grounds, it is therefore expedient to dispatch the generating facilities in accordancewith the time profile of demand. This minimizes costs, but minimum costs will change over time.Also, the costs of a kWh vary with the level of reliability at which it is supplied. The higher thelevel of reliability, the more expensive is supply. Finally, transport of electricity entails losses,depending on the technical characteristics of the transmission and distribution lines, the transportdistance, and the flows through the lines. As is argued below, an optimal tariff system shouldtake all these factors into consideration.
Optimal Tariffs
3.37 Electricity tariffs can be designed to meet a number of objectives, the mostcommon ones are:
(a) Economic efficiency(b) Equity(c) Cost recovery(d) Transparency and ease of implementation. A brief summary of this topic is given
here, with a fuller, more rigorous treatment given in Annex 1.
Economic efficiency is required to maximize welfare, And economic theory states that welfaremaximization calls for short-run marginal cost (SRMC) pricing. Efficient prices must clear themarket at every point in time for every location. Such prices properly reflect the costs of

Power: Performance, Recent Developments 41
generating and supplying electricity, taking into account the load to be met, the merit orderdispatch, transmission losses, and the design limits of the system. Stated differently, they informconsumers of the different costs that the system incurs to serve their demand. Moreover, sinceefficient prices have to clear the market, they are just equal to what consumers are willing to payfor being supplied with electricity.
3.38 In addition, efficient prices are equitable in the sense that they provide consumers(or suppliers) with no incentives to retrade or recontract electricity among themselves. Eventhough this is a strong argument, different views may be held. Equity considerations aside, thereare other problems with SRMC-pricing. One is that efficient prices may not enable the supplierto recover total costs. This happens when marginal costs are below average costs. While non-distortionary government transfers could, in theory, solve this problem, in practice, an insolventutility that depends on government transfers lacks incentives to operate efficiently. Also, inpractice it is difficult for a government to raise revenue and to subsidize without distortion.Moreover, a utility that is required to operate like a non-profit organization will find it difficultto raise funds from non-government sources or, as the case may be, attract private investorswhenever this is needed or desirable. Finally, electricity prices that support commercial goals,but are not fully congruent with the ideal of economic efficiency, tend to outperform tariffsystems that (at best) are designed to be economically efficient, yet provide the utility with noincentives (rewards and penalties) to operate in an efficient way. So convincing is the case thatcan be made for SRMC-pricing on theoretical grounds, so difficult is its implementation inpractice. So in most circumstances, particularly when demand and supply are not very diversified,the pursuit of a perfectly efficient pricing policy is not worth the effort.
Responsible Electricity Pricing
3.39 Responsible electricity pricing is a compromise between the requirements ofeconomic efficiency and the actual capabilities to meet these requirements. As has been outlinedbefore, there are a number of constraints and difficulties that beset the task of devising electricitytariffs. Responsible pricing takes account of these factors. First and foremost, electricity tariffsshould be structured so as to inform users about the costs they impose on the system. Second,prices should be financially viable, i.e. allow the utility to at least recover its costs. Third, thetariff system should be compatible with commercial goals. In particular, if the power sector hasto strive for scarce financial resources, the regulatory framework should permit utilities togenerate positive returns. Fourth, the tariff system should be vertically desintegrated. This means,prices should provide separate information about costs attributable to the consecutive services(generation, transmission, etc), that the sector performs in supplying its customers. Fifth, the tariffsystem should be horizontally desegregated. This postulate says that if it is feasible to diversifyservices in terms of price, customers should be given the opportunity to choose among theseservices.

42 Ecuador: Energy Pricing, Subsidies and Interfuel Substitution
3.40 The last two requirements often are subsumed under the term "unbundling ofservices". In the context of Ecuador's electricity sector, unbundling is an issue relevant to thedivision of labor between power generation, transmission, and distribution. Since services andcosts vary across the country's franchised distribution areas, the companies should be givendiscretion to custom-tailor their tariffs to the conditions under which they operate, subject, ofcourse, to regulatory supervision. This would result in a dual tariff system: One for bulk powertransactions between the generation and transmission complex and its wholesale customers (thedistribution companies and, as the case may be, large industrial users), and one that applies tothe retail level and reflects the different infrastructural and economic characteristics of thedistribution areas. Once a coherent system of tariffs for bulk supplies is in place (differentiatedby load, voltage level, and location), the distribution companies should be held responsible forselecting a mix of bulk supplies and own generation that serves their customers at least cost.Retail tariffs that take account of regional differences may appear to be discriminatory. However,this will not be the case as long as tariff differentials are a mere response to the diversity ofdemand and costs (rather than a means of reaping monopoly profits).
Tariff Design
3.41 INECEL's new tariff study was completed in March 1992. Its implementation(which this report strongly endorses) could make an important contribution to restoring thefinancial health of the sector and enhancing the incentive framework of its operators andcustomers. The study is based on a careful examination of short- and long-run system-costs,operational features of the system, and the profile of loads. It calls for an increase in the leveland a change in the structure and number of rates applying to wholesale and retail transactions.The suggested changes in the tariff system are directionally correct and would bring aboutsignificant improvements on how electricity is generated, transmitted, distributed, and used. Inparticular, the proposed tariffs vary by time-of-use, reflect seasonal variations of supply anddemand (although some dilution of seasonal cost differences occurs), and account for line lossesand the costs of transmission and distribution services. Compared to the rates which were inplace in july 1992, the new system would have increased average tariffs by USc3.0/kWh forindustrial users, USc3.5/kWh for commercial users, and USc5.7/kWh for residential customers.Annex II presents a critical evaluation of the recently completed Tariff study and of itsimplementation and Annex III presents a method to more exactly calculate average incrementalgenerating costs (when the additional required information becomes available), which the TariffStudy merely approximates.
Policy Reforms: Institutional Issues, Ideas and Guidelines for Power Reforms
3.42 There are several factors exerting a negative impact on the efficiency, managementand financial performance of the electric power sector. Among these, excessive politization,highly constraining administrative procedures, insufficient tariffs, INECEL's load of operationaland regulatory activities, and strong trade union activity have been specially noticed. Most ofthese factors are due to an inadequate and obsolete legal framework and regulatory setup. Many
Power: Performance, Recent Developments 43
have been analyzed in the earlier part of this section. This second part of the section on electricpower will analyze the main institutional issues and make very general recommendations on howto go about introducing institutional reforms.
Excessive Politization
3.43 Excessive politization is obvious in operational and decisional matters and in thefact that INECEL's Board of Directors is mainly comprised of ministers (or their representatives).INECEL's top-level management is unstable because the general manager is replaced after eachpresidential election and at times, even more frequently. Likewise, some managerial positions(executive director) are assigned to persons outside the institution, that is, not by internalpromotion which may imply a lack of "esprit de corps" in the management team's group loyalty.Moreover, management team instability is harmful to cohesion, co-responsibility in makingdecisions and to their ability to make difficult and necessary medium- to long-term choices (withshort-term decisions favored). Although the Board of Directors is chaired by the Minister, certaindifficult decisions are trapsferred to the President of the Republic. This occurs in institutionalstructure matters, in the case of substantial investments and in the setting of tariffs.
Highly constraining administrative procedures
3.44 As a State institute, all the administrative proceedings characteristic of publicbodies apply to INECEL. These are, as in most countries, too numerous, long, tedious andcomplex and totally unadapted to the operation of companies or institutions active in commercialand competitive industrial markets. For example, expenditures exceeding US$40,000 must beapproved by the Board of Directors. The chain of administrative procedures characteristic of allpublic entities, such as that of the Procurator's office and the Comptroller's office apply toINECEL. As the electric power industry certainly plays an essential strategic role within acountry's economic and social development it must, therefore, implement missions of generalinterest. Pursuing these general interest objectives is perfectly compatible with a dynamic andefficient company management. Whatever INECEL's status, (i.e. private or public) it would beadvisable to distinguish between the procedures applicable to public entities evolving within anindustrial and commercial market (such as the electric power companies) and those which are not(for example, hospitals or ministries).
Insufficient tariffs
3.45 Tariff setting is the aim of a more in depth study which has just been completedand is commented on in more detail in the preceding section. Suffice it to say, insofar as itconcerns this section, that tariffs in force during August 1992 did not reflect the costs of electricpower generation, transmission and distribution. This situation stems from the Government'spermanent refusal to adjust tariffs to costs and their evolution. The structural insufficiency oftariffs to cover costs (direct and indirect, including a fair and equitable reward on invested

44 Ecuador: Energy Pricing, Subsidies and Interfuel Substitution
capital-fair rate of return-) on a permanent basis produced catastrophic consequences for theoverall economy of the country, for INECEL and for the distribution companies. With the tariffincrease of September 1992, however, the situation has improved markedly although further tariffincreases are needed to reach LRMC.
Overlap of operational and regulatory activities undertaken by INECEL
3.46 In addition to its operating activities of generation, transmission, distribution andmarketing (through 18 private limited liability distribution companies of which INECEL is themain shareholder), and EMELEC which is a privately owned distribution company, INECELperforms a series of other activities in keeping with the Basic Electrification Law (Ley Basicade Electrificaci6n), which range from the development of rural electrification, to the constructionand engineering of the installations of the National Interconnected Grid, as well as the purchaseof materials and spare parts for the distribution companies (E.E.). In addition, by order of thesame Basic Electrification Law, INECEL assumes the dual role of judge and defendant andcarries out other activities such as approving the tariffs to be applied by distribution companies.This duality does not constitute a sound management policy in general, nor in this specificsituation. The systematic blockage of electric power prices by the relevant politicians to whomINECEL's Board of Directors refers tariff-setting decisions, provokes the well-known doublereaction: an explosive deficit for INECEL and incomplete payment for the power sold byINECEL to the distribution companies, even though INECEL is their majority shareholder. Thereis no doubt that combining operational and regulatory activities within INECEL iscounterproductive for the electric power subsector as a whole, as well as for power users.
Powerful impact of trade unions and low efficiency
3.47 The extremely powerful position held by the trade unions should be mentioned.Regardless of the classic arguments, the problem of trade union intervention in management, theimpossibility of firing labor, overstaffing and low productivity are, among others, factors whichmust be emphasized. The role of these organizations should be correctly appreciated so that theymay be focussed on within the framework of the restructuring measures that need to beimplemented. In addition to the many factors leading to inefficient sector management mentionedabove, power transmission losses (line losses) and commercial losses, reach unacceptable levelsand reflect important inefficiencies.
Inadequate legal framework
3.48 The Political Constitution of the Republic, the Basic Electrification Law, and theOrganic Law of Financial Management and Control (Ley Orgdnica de Administraci6n Financieray Control -LOAFYC) form a very rigid framework that establishes the supply of electric poweras a private function of the State, conducted through INECEL. However, INECEL is a publicinstitution subject to regulations and controls that impede it from carrying out the tasks entrustedto it. The power conceded to INECEL to create private limited companies has not resolved this

Power: Performance, Recent Developments 45
basic issue because these limited companies (18 out of the 19 distribution companies) are createdby the public sector (virtually 100% government-owned) and are therefore subject to themonitoring and control system applicable to public institutions (that is, LOAFYC), any way.
Basic Ideas on Restructuring
3.49 This section aims to formulate ideas that could lead to proposals on how torestructure the institutional and regulatory system within which the Ecuadorean electric powersector evolves. Due to the short time available and the fact that a complete restructuring studyis about to be started under a World Bank funded project, only a few comments are presentedon the nature of essential changes in the operational and regulatory framework.
3.50 In outline, restructuring concerns the redefinition of INECEL's activities and role,its legal status, the regulatory framework, growth of competition, improvement of quality ofservice and relative autonomy of the distribution companies. Likewise, legislative changes mustbe made to enable any company or private individual to perform any of the electric poweractivities currently reserved for the State. INECEL's restructuring essentially consists of removingits regulatory prerogatives and transforming it into one or several companies. INECEL'soperational activities (essentially power generation and transmission) must be removed from whatis a public institute dependent on the Ministry of Energy and Mines. INECEL must be subjectedto the discipline of the market whether it becomes one or several private company(ies) or oneor several mixed public/private company(ies), depending on the speed of its transfer from publicto private ownership and according to the degree of privatization and decentralization wished tobe achieved.
The electric power industry, an industry like any other
3.51 Regardless of the degree of privatization, the sector's managerial or operatingcomponent must be directed and managed, in its entirety, under management rules identical tothose of classic private commercial or industrial companies (normal corporate rules) operatingin market economies. Within this context, contracts between sector companies must be controlledby private law, not public law, as must the relationship between all types of suppliers (equipmentgoods, investments or repairs, and services).
Relationship between the electric power distribution companies (EE) and INECEL
3.52 The relationship between the electric power distribution companies (exceptEMELEC) and their major shareholder, INECEL, is not as clear as it should be between ashareholder and the private limited company in which it holds shares (the electric powercompanies are legally private, limited companies). Moreover, as INECEL has neither managedto consolidate its position as majority shareholder nor its political capacity to control the electricpower companies, it has tried to do this by using managerial and bureaucratic measures, which

46 Ecuador: Energy Pricing, Subsidies and Interfuel Substitution
the permanent financial dependency of the electric power companies on INECEL forces them toaccept. This has resulted in the creation of huge obstacles to the efficient management of thedistribution companies. Although relations between the distribution companies, INECEL as powersupplier and INECEL as shareholder, are perfectly compatible under a normal private companysystem, the aforementioned situation necessitates the complete separation of the relationshipbetween distribution company and shareholder, and between distribution company and the agencysupplying bulk power.
Reciprocal debts between INECEL and the distribution companies
3.53 Often, when INECEL implements work or sees that work is carried out for thedistribution companies, the value of the work undertaken is often presented as a capitalcontribution from INECEL to the distribution companies (since INECEL is usually unable toobtain cash payment for this work). INECEL may also request the distribution companies toundertake work for it or they may make purchases for INECEL. Although, the distributioncompanies pay the contractor directly they are often not reimbursed by INECEL and theycompensate, by not paying INECEL for all their power purchases. These "self-compensations"are unsound and do not constitute proper management. INECEL needs to document reciprocaldebts and compensations between itself and the distribution companies. This document shoulddetail the financial obligations incurred by each party, stating the amounts paid, the amountscompensated and naturally, the expenditures.
Investments of the Distribution companies
3.54 The distribution companies must be able to implement thermal and hydrogeneration facilities within their own areas and for their own needs. The tariff-setting formulafor bulk power supplied by INECEL should promote competition and optimized dispatch betweenINECEL's generating facilities and the distribution companies. Up until now, however,distribution company investments have been decided by their respective Boards of Directorslargely without considering any analytical or economic criteria.
Opening up the distribution companies to other shareholders
3.55 The distribution companies should be able to count on industrial clients asshareholders (for example, the Chamber of Industry), so that they are involved in financing newgeneration units, rehabilitating current power stations or other investments. In addition, thecurrent system of small, private companies (private limited companies) should be maintainedbecause their privatization could be relatively easy through the sale of shares. Moreover, tariffsshould differ according to distribution area so that the technical, economic and financialconditions (for example, quality of service, geographic dispersion, structure of client) of each oneof the 19 distribution companies can be taken into account. This would enable the distributioncompanies to offer their clients a mixture of autogenerated power and power purchased fromINECEL that minimizes costs (see Annex 1, paragraph 8).

Power: Performance, Recent Developments 47
INECEL's focus on generation and transmission activities
3.56 The preceding paragraphs state that INECEL performs many activities which
unnecessarily complicate management of the Institute and corner all the financial means available.
For this reason, INECEL should focus on the generation and transmission of electric power. This
focus will also facilitate the privatization process. In addition, the generating activity must be
opened up to independent generators. Independently generated power should be purchased by the
system under conditions predefined by the regulator (for example, avoided cost). A dispatching
center must be created to coordinate the system's integral operation and all the units belonging
to the different operators (generation, distribution company and independent producers).
Institutional reforms and restructuring
3.57 The Ecuadorean electric power sector's institutional situation was very briefly
reviewed in the preceding paragraphs (more detailed information is found in the reports prepared
as background to this study). Several areas have also been mentioned where substantial changes
need to be made. In fact, the aforementioned ideas for reform make up a general framework,
which is common to many countries, and which Ecuador will need to follow if restructuring the
electric power sector is to be considered seriously. This general framework for evolution from
a totally state-owned sector (with its numerous failings as mentioned in the preceding pages),
toward a decentralized, de-monopolized, dynamic (technically and financially), partially or totally
private electric power sector requires moving through the following stages, which are often
almost simultaneous:
a. Legislative changes to abolish the State monopoly (which is presently complete
in Ecuador) and to specify the basic rules of the electric power industry,
separating it from the regulatory system (existing or about to be created);
b. The creation of a regulatory agency whose characteristics and attributes are
defined in the basic electrification law (basically the establishment of cost-based
tariffs or perhaps, "incentive" regulation). This regulator could be in charge of the
whole energy sector (electricity, oil and other sources);
c. Reorganization and restructuring, which often includes total or partial privatization
of state electric power entities (companies or pseudo-companies).
Several issues which must be borne in mind when starting on the road to reforms,
in keeping with the general framework described here, are mentioned in the following paragraph.
Specific recommendations, as well as the sequence of actions and mechanisms to be used, will
be defined in a more detailed study which is about to be started with funds provided through an
ongoing World Bank project.

48 Ecuador: Energy Pricing, Subsidies and Interfuel Substitution
An autonomous and highly competent regulation
3.58 Reform of the Ecuadorean regulatory system is the keystone of the reformproposals for the entire electric power sector. This section lists a number of general principlesregarding the status and prerogatives of the regulatory agency. These principles need to beadjusted to the specific prevailing condition of the power industry before being finalized in detailand implemented. While there is no universal truth in these matters, the general principlesmentioned below have been found to have general applicability and they are suggested by theBank to its member countries in a recently published Policy Paper on the Power Sector.
3.59 Regulation should be removed from INECEL's responsibilities and should bemanaged by an independent and highly competent agency (called the regulator). "Independent"means that the regulator cannot be part of or depend on the Ministry of Energy and Mines or anyother governmental office of that same level. "Highly competent" implies that the regulator'spersonnel must be hired on the basis of technical, economic and financial qualifications, and offerskills or qualification which will enable the agency to implement its regulatory activities withutmost technical credibility, completely independently from the electric power sector companiesand to conduct and/or supervise studies necessary for the overall discharging of itsresponsibilities. Responsibility for the daily running of this regulatory agency could be entrustedto a high-ranking official who would try to obtain the greatest possible efficiency, be asindependent as possible from political pressures and have rapid access to the highest levels ofthe State (either the Presidency or the Council of Ministers). Moreover, the regulator should haveits own independent budget. This budget should ensure that the cost of studies (whetherconducted by agency personnel or contracted out), as well as the regulator's operating expensesare covered. To constitute a dynamic agency, the total number of personnel should be limited bylaw.
Description of the regulator's main duties or prerogatives
3.60 The main duties of the regulatory agency should be:
a. To approve and maintain current and appropriate tariffs to enable the electricpower activities to be separated in parts (see Annex I on tariff setting), whichcould potentially be managed by different public and/or private companies (thatis, which enable an "unbundling" of services). For example, this regulatoryagency could have had performed a tariff study such as the one recentlycompleted, and could now be in charge of putting it into practice.
b. To promote the entry of private capital into all areas of the electric power industryand to establish a contractual framework to enable the commercial interchange ofelectric power between all the companies (public and/or private), throughout allphases of the electric power industry, thus allowing specialization and an increasein the industry's efficiency.

Power: Performance, Recent Developments 49
c To direct the indicative planning of generation and transmission projects ofnational importance (to plan, but to be willing to consider the alternativesproposed by the companies).
d. To advise, counsel and explain the basic issues and options of energy policy to thehighest national authorities.
Punctual and/or specific issues
INECEL: the specific problem of the Directorate of Engineering and Construction, theDirectorate of Small Hydropower Stations and the Directorate of Distribution andMarketing (DISCOM).
3.61 This first Directorate has a large staff (on the order of 700 persons). The currentorganization needs to be flexible because most construction workers are unemployed due to alack of financial resources (for building new installations). In 1980, demand was forecast toincrease by 10% annually and although it is currently 6%, the personnel hired to implement theneeded projects are still employed by INECEL. A reduction in force is unavoidable although abasic capacity must be maintained for the eventual resumption of projects. Redundancies couldalso occur in other areas of INECEL, such as the Directorate of Small Hydropower Stationswhich implements small-scale studies and projects (and employs 37 persons), and the Directorateof Distribution and Marketing (DISCOM, which employs 260 persons) which manages relationswith the electric power companies in which INECEL is a shareholder, a relationship which wouldtend to disappear with the independence of electric power companies. While this is mentionedhere under "reforms" it is really merely a cost-cutting measure which INECEL should have takenlong ago.
Dialogue with the Trade Unions
3.62 As the importance of the unions is obvious, dialogue with them on the proposedinstitutional and regulatory reforms is unavoidable. Although dialogue is essential to improve theprospects of the restructuring measures, selecting with whom and when to hold the discussionshould be decided carefully. As demonstrated by recent experience in Bolivia, where the publicsector union's considerable influence almost made the country ungovernable, sector restructuringhas to involve discussion with the trade unions and a reduction in their intervention inmanagement.
Conclusions
3.63 This report strongly suggests that a number of structural reforms should beintroduced as soon as possible. The main points of the restructuring of the Ecuadorean electric

50 Ecuador: Energy Pricing, Subsidies and Interfuel Substitution
power industry and several reasons for why these structural reforms are urgent, are outlinedbelow:
a. Establishment of an autonomous, highly capable and experienced regulatoryagency.
b. Restructuring and eventual privatization of the electric power industry, that is, thetransformation of INECEL and the electric power companies into normal, ordinaryindustrial companies (whether private, public or mixed).
c. The specific problem of INECEL's engineering and construction department (and,to a lesser extent, DISCOM and the Small Hydro Stations Directorates) should besolved.
3.64 The main reasons justifying the urgency of the thorough reforms mentioned in this studyare:
a. that there is very low motivation and productivity throughout the system;
b. that the sector's financial deterioration persists;
c. and that the current political context is especially suitable for the introduction ofthorough reforms.
3.65 Nevertheless, a social and political consensus on the urgency of these reforms has to beforged and the way of carrying them out, transparent and honorable, must be agreed. The studiesnecessary to arrive at the concrete modalities of implementation must also be conducted.

4
HYDROCARBONS
Introduction
4.1 The section that follows deals with a number of issues in the hydrocarbons
subsector. Since this study was mainly a short/medium term pricing and strategy study, coverage
of the hydrocarbons subsector is not complete. For example, while some aspects of upstream
legislation (exploration and production) are mentioned, they are not analyzed in depth. On the
other hand, the marketing of domestic kerosene (kerex) is dealt with in detail (a study of just this
matter is attached as Annex V). The largest investment being considered, enhanced recovery in
the Petroamazonas fields appears, under scrutiny, to be unnecessary and uneconomic.
Investments proposed in downstream operations are reviewed critically and most are found to be
uneconomic, and more importantly, not needed at this stage. This chapter will cover:
- a general overview of the hydrocarbons subsector;- a brief discussion of the price policies with emphasis on LPG and kerex (domestic
kerosene);- a discussion of the marketing of kerosene and suggestions for improving it;
- deregulation/privatization of the oil industry (i.e. continuation of reforms in Petroecuador);
- reserves and explorations;- discussions/analysis of issues in refining and other downstream activities.
Overview
4.2 In exploration and production, the lion's share of the investments needed should
be done through foreign companies. Petroproducci6n and Petroamazonas should only invest in
discovered fields in their production areas, or near them. Also, Petroecuador should open to
foreign companies the exploration of areas that have a good potential, which it has reserved to
itself. These areas present good prospectivity of finding light crudes which are needed to move
the heavier ones.
4.3 If the foreign private companies start producing the crude (heavy) from their
recently discovered reserves, total potential production in 1995 could reach 340,000-350,000 B/D
(based on 320,000 B/D in mid 1992). This will require an investment of about US$750 million
by these companies over the next 2-3 years. Optimistic forecasts

52 Ecuador: Energy Pricing, Subsidies and Interfuel Substitution
by private oil companies and Petroecuador suggest that an output of 400,000 B/D may beattainable in 1996 or 97.
4.4 To encourage foreign investments in exploration and production, it should be takeninto account that the fifth round of exploration (which discovered the heavy crudes that are soonto be produced), suffered some setbacks:
- The crude price a posteriori was lower than what was expected.- The quality of the crude was lower than what was expected (15-21° API rather
than 290 API, like the Oriente crude).- The fields that have been discovered were smaller than expected.- Since then, environmental aspects have acquired more importance and will cause
higher costs in exploration and production (as well as in processing andutilization).
This means that the profitability of the companies is lower than was expected and thatmaybe the government would need to help the companies (the "R" factor is now unrealistic)provided it remains economic to exploit these heavy crudes. Since the economics of thesediscoveries are marginal, the narrow margin must be split carefully between the state and the oilcompanies otherwise one of the parties may end up with a loss-making situation (which wouldnot be sustainable). While companies naturally take this into account when they negotiatecontracts, in this case there were several factors which gave unfavorable outcomes and so, theeconomics of these discoveries are marginal. Also, the contractual arrangements (contrato deprestaci6n de servicios) are not attractive enough and complicate the relationship between thecompanies, Petroecuador and the State and cause double taxation in some cases. This reportstrongly recommends the adoption of different arrangements such as Production SharingAgreements, concessions or direct negotiations with oil companies. This will require legalchanges but not constitutional ones (because the crude can still be owned by the State).
4.5 As for investments, the analysis of several recent studies suggests that neither thebig upstream nor downstream projects that are being discussed are really justified. The primaryand secondary recovery methods currently being used in the Shushufindi and Sasha fields are themost appropriate and show a very good recovery of the crude petroleum in situ. Therefore, adecision on whether to move to tertiary (or enhanced) is no longer so urgent. In any case, thetraditional exploration methods are still, for now, the most economic way of adding to reserves(rather than tertiary or enhanced recovery).
4.6 As for refining, present capacity could be sufficient (even more so if better pricepolicies give greater incentive to conservation) until the end of the century (with smallinvestments in Esmeraldas). It is too early to talk about a new refinery for heavy crudes (whoseproduction has not started yet) and whose production by the end of the century might only reach40,000 B/D. Also, nothing at present suggests that domestic refining of this crude will be the bestoption (in, say, 1998). The actual production of Oriente crude could stabilize and it will continue

Hydrocarbons 53
to exceed the intemal needs of the country for quite some time. In addition, recent studies madefor the processing of heavy crudes have been carried out by institutions interested in theexecution of the projects being studied (and this creates a conflict of interest). The best optionfor refining would consist of closing the refineries on the Peninsula and consolidating all refiningat Esmeraldas.
4.7 Small investments to add to the capacity of the transecuadorean pipeline could bejustified, but after having studied the possibility of using the existing pipeline spur to Colombia.The expansion of the terminal in Balao to receive bigger carriers (Very Large Crude Carriers -VLCC) to export crude to the Far East could also be justified. This investment could become lessurgent if Ecuador were to recover nearby markets, like Peru and Chile who need to importOriente crude to optimize refinery runs (Peru) or because crude output falls short of needs(Chile).
Price Policies
4.8 Ecuador is one of the few countries that until recently continued to subsidizepetroleum products heavily and indiscriminately. The elimination of the subsidy to petroleum willallow more rational use of the resource; give incentive to conservation; eliminate a good part ofthe contraband trade and allow the State to substantially reduce the fiscal deficit and theconcomitant monetary emission which causes the stubborn inflation that besets the country. Inaddition, this price policy would allow an increase in public expenditure in the social sectors (ascompensation to poor households for the higher prices and tariffs for goods and services suppliedby the State).
4.9 Because Kerosene is marginally cheaper than LPG in economic terms and becauseit can be purchased in small quantities (whereas LPG is "lumpy"), it is proposed in this study thatkerosene should be the onlv socially important fuel. However, its price should never have fallento the ridiculous level of S/60/gallon (US$0.04/gallon in mid 1992). In the price structure thatis to be established, it should not be too cheap in relation to diesel and it should be sold freelyto avoid the monopolization of which it is the object right now and which is resulting in finalprices in excess of S/600 per gallon,8 (before the September price increases). Therefore, asubstantial first step increase in the ex-refinery price (for example, from S/60 to S/900- 1000 pergallon) could mean little or no increase to the final consumer, provided that the product is soldfreely. Its free marketing (at a higher price) through gasoline service stations and otherfranchised dealers would eliminate these rents thus allowing the State to have higher revenuesand consumers, a better access to the product. The price of kerosene should be brought close toits economic price (around S/1142 per gallon) over a short period of, say, one year. For LPG,its domestic price could also be brought to its economic price (S/750/Kg) in three steps, say:
8. Resale in secondary markets occurs at S/.250 - 400 per gallon. This was before the Sept.92 price increase. Since then, final prices rose to about S/1300/gallon. See background paperon the marketing and pricing of kerosene prepared for this study and attached as Annex VIII.

54 Ecuador: Energy Pricing, Subsidies and Interfuel Substitution
- First: from S/80 to S/200 per Kg (this was done in Sept. '92);- Second: from S/200 to S/500 per Kg- Third: from S/500 to S/750, over a 6-8 month period.
4.10 The price of other derivatives (ex-refinery) could simply be their CIF values.Domestic prices ex-refinery could also be set to cover refining costs, assuming that the price ofthe crude for domestic refining were increased to its economic price (FOB value, US$16/barrel).As computed from available information, the value resulting from this latter option is still inferiorto the CIF value of the products because of two reasons: i) refining cost are underestimated and,ii) the setting of the price of crude at its FOB value for domestic refining - and setting ex-refinery price at the CIF level - provide protection (equivalent to freight costs) to domesticrefining.
Marketing of Kerosene (KEREX)
4.11 The drastic fall in domestic consumption of kerex, from 33.8 million gallons in1991, is a result of both the restricted marketing system itself and persistent low prices forliquefied petroleum gas, a fuel that, in addition, is more consumer-friendly. On the grounds thatkerex is a fuel mostly consumed by low-income sectors, it has been highly subsidized.Paradoxically, however, these sectors are getting only a low share of this subsidy. The currentmarketing system involves distribution of kerex directly to communities and public healthorganization, etc., by Petroecuador. In the cities, kerex is sold to the final consumer in traditionalmarkets (ferias libres) and at specific outlets.
4.12 Rationing at the distribution outlets, however, is widespread and in some cases,the sale of kerex is limited to a maximum of two gallons per person. Because of this rationing,there are long lines of organized groups involving the whole family, including children, whogenerally buy the product mainly for resale. Final prices (before the September increase) varybetween S/250 and S/650 per gallon and maybe even more, depending on the remoteness andisolation of the place. In rural and marginal areas this product is even traded in bottles, at pricesfar exceeding the above. These prices should currently be much higher, since the reference price(that of diesel 1 for sale to industry) amounts to S/1460 per gallon since September, instead ofthe previous S/630. The September 92 price increase has widened the price differential betweenthe two products and thus increased the incentive to divert kerex.
4.13 Indeed, as the price of diesel 1 is considerably higher than the price of kerex, evenbefore September 3, a black market had developed supplying industry, small-scale dishing andother productive activities with kerex at a price substantially lower than that of diesel 1 (or diesel2). Ample evidence from Quito's traditional markets has confirmed this situation. For example,only 45% of available kerex at these outlets is sold to the intended beneficiaries, to industrialusers (if all of it had gone to household use) and the remainder is diverted and sold to substituteeither diesel 1 or diesel 2. Likewise, on the basis of Petroecuador's sales and the number ofhouseholds consuming this fuel, it was found that only 9% of sales can be justified as residential

Hydrocarbons 55
consumption. Although the number of households consuming the product in 1990 amounted toonly 13% of that of 1982, consumption in 1990 was 40% of that of 1982. In 1990, averagekerex consumption amounted to 90 gallons per month per household, which is exaggeratedcompared to an estimated average real consumption of no more than 10 gallons per month perhousehold. Obviously, 80 gallons are diverted to other (industry?) users.
4.14 The main conclusion is therefore that the beneficiaries of the subsidies aregenerally not low-income consumers but the middlemen, as well as the final users of kerex whoacquire it cheaper than diesel 1 (or diesel 2). Two substitute oil products, kerex and LPG, arecurrently being subsidized for household use. This is not advisable: sound pricing policy, wouldreserve kerex for low-income groups with a lower price compared to LPG, which should reachits economic value in the short run. Moreover, the margin between the price of kerex and diesel1 needs to be reduced. The new kerex price could be based on the average of what consumersare actually paying. The lower margin would discourage diversion. Likewise, its marketingshould be decontrolled so that it can be distributed again from service stations, with more outletsin marginal areas of cities and rural areas, to discourage monopolization and enable the productto reach final consumers at the lowest possible cost. In rural areas, where LPG has not fullypenetrated, the possibility of broadening the marketing of kerex is quite good, in order tosubstitute grasses, straw and fuelwood, reduce ecological damage and lower the time cost ofgathering traditional fuels. Similarly, in many suburban areas with low income households,kerosene is considered a good substitute for LPG, provided its supply became more reliable.Once kerex prices are increased, compensatory social actions should be accelerated, among whichthe supply of more efficient kerosene stoves should be given priority. The so-called "regular"gasoline could be discontinued when kerosene supply became more reliable and efficient stoves,widely available.
Social Impact
4.15 A key element of this study is its attempt to measure the impact of the use ofenergy on low-income households. A survey was carried out (August-December 1992) about theuse of energy in poor urban and rural households. The survey also attempts to investigateconsumer attitudes in relation to different forms of energy and their prices. The survey wouldalso try to measure the consumption of goods and services with a high energy content (such astransport) and the impact of higher prices on family budgets. Survey results are presented in aforthcoming companion report.
4.16 The felt needs of the marginal populations are also being investigated as well asthe delivery and support system that serve them. The idea is that a part (say, a third) of theadditional public revenues could be spent on social programs that directly support the welfare ofpoor populations (rather the present situation where the subsidy to LPG and power and otherpetroleum derivatives accrue much more to the upper and middle classes than to the poor). Thisaffirmation now has rigorous empirical support in Ecuador (as it does in other countries) on thebasis of results from the survey mentioned above.

56 Ecuador: Energy Pricing, Subsidies and Interfuel Substitution
Deregulation/Privatization of the Hydrocarbons Subsector
4.17 Whatever the type of restructuring that Ecuador ultimately choses for its hydrocarbonssubsector, it will need to take steps similar to those mentioned below:
A. Amend the Hydrocarbons Law by:
a. Eliminating state monopolies over downstream activities;b. Establishing that economic costs must be used as a basis for pricing policy
decisions;c. Setting strict but clear environmental guidelines;d. Modifying exploration and production legislation towards other
contractual forms (such as production sharing, joint ventures, directlynegotiated contracts, like for example, in the case of marginal fields) andto give more attention to the heavy crudes that have been discoveredrecently as well as to natural gas.
B. Establish a system of pricing and taxation which allows the deregulation ofpetroleum and gas activities by clearly separating costs from taxes. (i.e. creatinga producer price e.g at the refinery gate).
4.18 At the first stage, and to start with the more urgent matters, the crude for internalrefining would be valued at its economic costs (FOB price). This would generate additionalpublic revenues of US$240 million per year, plus US$98 million per year from the increase inexports. This amount was calculated on 1992 consumption assuming a price elasticity of 0.20 andassuming that crude production costs would not increase materially as a result of this measure.
4.19 In a second stage, the ex-refinery prices would be set at their CIF levels, (exceptfor fuel oil which would have a FOB price because it is exported). In a third stage, after theelimination of the monopoly of the State in "downstream" activities, storage, transport anddistribution would be liberalized. In a fourth stage, the import of refined products would befreed, so that the refineries would have to compete against the importers (who could also be finalconsumers). This could push refineries to be more efficient or face loss of market.
4.20 As for exploration and production, the role of the private sector has beenpredominant until recently. Companies like Petroamazonas and Petroproducci6n are relativelyefficient (this is not the case for downstream activities). In any case, the process ofcorporatization of Petroecuador should be completed. This would mean that Petroamazonas andPetroproducci6n would become independent, limited liability corporations (S.A.) initially state-owned but whose shares could be eventually sold. To make these companies stronger, high cost,marginal fields could be heaved off and transferred to private investors who would operate them.
Hydrocarbons 57
4.21 What is now the Petroecuador head office would cease to exist and its functions,could be divided between:
a. Those that should be handled directly by the State, including the promotion ofexploration and production by oil companies which could be assigned to aregulatory entity (which could be the same one that regulates the electric powersubsector).
b. Operational functions (to the extent there are any) would go to the subsidiaries.
In addition, while some of Petroecuador's subsidiaries or affiliates have beenmerged, over the objection of a previous Bank economic mission (June/July 1992) this reportsuggests that in order to prevent declines in productivity and preserve the ease of privatization,Petroamazonas and Petroproducci6n should not be merged. In the same way the Esmeraldasrefinery could become an independent company (S.A.), buying its crude at the FOB price andselling its products at their CIF value (the State would directly intervene if it wanted to subsidizeany product). If a system such as this were adopted, it is likely that the old refineries (ex Angloand Repetrol) of La Peninsula would not be able to compete and would have to close (maybethey should have been closed earlier, as soon as they reverted to the State in 1990).
Reserves and Exploration: Current Situation
4.22 The amount of reserves has always been a controversial issue because figuresdiffer according to how they are assessed and, above all, who assesses them. The officiallyaccepted figures are those of the National Hydrocarbons Directorate (Direcci6n Nacional deHidrocarburos), which are more conservative than Petroecuador's assessment and less optimisticthan those of oil companies and international organizations.
4.23 It can now be reasonably be said that the country has 1.5 billion barrels of lightoil (290 API) out of about 2 billion barrels in proven reserves. Of this, about 70% are inPetroecuador's oil fields. Also, about 400 million barrels of heavy crudes (15-20° API) have beendiscovered by international oil companies in the last 5 years, as a result of the service contractsfor hydrocarbons exploration and exploitation (These are included in the 2 billion reserve figure).
4.24 In view of the limited public financial resources available, foreign investment willcontinue to be essential, especially since, during the last decade, exploration results from servicecontracts were relatively modest. Discovered reserves, on the order of 400 million barrels, area great deal lower than the goal of 1 billion barrels which was decided when contracting began.Moreover, the quality of crudes found is considerably lower than expected, and the estimatedtime between the start of exploration and incorporation of production has doubled from five toten years. Production costs will be between US$8 and US$10 per barrel, compared with presentcosts of US$2-3 per barrel. At current, relatively low oil prices (late cy93), the economics ofthese discoveries will be, at best, marginal.

58 Ecuador: Energy Pricing, Subsidies and Interfuel Substitution
Prospects
4.25 Because no service contracts were signed during the preceding government'sadministration, there will be a four-year delay in the search for new reserves. Increased reserveswill come almost exclusively from those found through foreign investment, since oil explorationis a highly risky activity and the use of limited public resources for this purpose is not desirable.Moreover, the current form of contracting should evolve toward concessions, direct negotiationsor perhaps the classic Production-Sharing Agreement (PSA). This could help accelerate theexploratory process due to better acceptance by international oil companies.
Production: Current Situation
4.26 Current national oil production, close to 315 thousand barrels per day, is one ofthe highest recorded so far and will most likely be maintained, or even increased, within the next5 years. Ecuador's oil production basically comes from the Amazon region. In 1992, average oilproduction amounted to 300,000 barrels per day and 315,000 barrels per day in March 1992, ofwhich 98% was accounted for by Petroecuador (73% Petroamazonas and 25% Petroproducci6n)and 2% by foreign companies (City and Oryx). Private, foreign company output will continueto rise with production from the new fields of other international companies, but it is estimatedthat until 1996 at least 85% of production will come from Petroecuador's fields.
Prospects
4.27 To maintain Petroecuador's current production and incorporate new oil fields, itis imperative to implement planned investments, especially in Petroamazonas' fields. In addition,it is estimated that the companies that have made commercial discoveries (MAXUS,OCCIDENTAL, ORYX, ELF and TRIPETROL) will have to make investments of no less thanUS$750 million within the next 3 years to incorporate production of about 40,000 barrels perday. These investments could amount to US$1.2 billion during 1992-1996, if the potential ofabout 70,000 barrels per day is to be attained. To achieve this, security will have to be ensuredand the problems currently besetting private oil companies will have to be solved.
4.28 The production of heavy crudes needs to be carefully analyzed to determinewhether the optimistic production forecasts made by the company Maxus, to the south of Bloc16, can be achieved. Moreover, it has to be borne in mind that heavy crudes can only beproduced and transported while light crudes are available to dilute them. In view of theuncertainty concerning the volume of heavy crudes that the aforementioned company willproduce, the overall solutions proposed for the incorporation of these crudes in the oil industry(specially with respect to pipeline transport, refining and exports) will have to be carefullyanalyzed. In fact, the domestic refining of these crudes could be left for the future, since withprices nearer to economic levels, the current refining capacity could perhaps be sufficient untilthe close of the decade if it is carefully complemented with the import of certain products.

Hydrocarbons 59
Production Scenarios
4.29 Three production scenarios have been proposed.
a. The low-production scenario assumes that production of the different onstreamfields would continue to decline if there are no further investments in them. Thisyear's (1992) production would fall to 291,000 barrels per day; this trend wouldpersist and by 1996 production would be down to 236,000 barrels per day and by2000 down to 181,000 barrels per day.
b. The average-production scenario assumes that the next Government wouldcontinue with the investment scheduled in Petroecuador's fields, which includesthe allocation of resources to incorporate several fields and internationalcompanies making investments of the order of US$750 million to incorporatebetween 20,000 and 43,000 barrels per day within the next few years. Under thisscenario, production of 305,000 barrels per day in 1992 would increase to 331,000barrels per day in 1995 and fall to 314,000 barrels per day in 1996.
c. The high- or optimistic-production scenario assumes that the resources needed forinvestments in producing fields would be allocated; that investment needed todevelop all discovered fields would be made; and that international companieswould incorporate all the reserves found with an investment of US$1.2 billion, andthat their optimistic forecasts would be achieved. According to this scenario, thecurrent year's production would average 318,000 barrels per day; productionwould rise to 377,000 barrels per day in 1994 and to 407,000 barrels per day in1996, then fall to 312,000 barrels per day and 130,000 barrels per day in the years2000 and 2010, respectively.
4.30 The average-production scenario is the most likely, although it may be a bitconservative and many observers believe that a peak output around 400 000 B/D is possible inthe latter part of the decade, especially if increased output can be obtained, through increasedinvestments in the fields now operated by Petroamazonas. Slightly more detail is shown in thefollowing Table (and in Annex Tables 18-20).

60 Ecuador: Energy Pricing, Subsidies and Interfuel Substitution
Average Oil Production Scenario
(thousand barrels per day)
Field 1992 1993 1994 1995 1996
Petroamazonas 225 223 221 218 209
Petroproduction 76 66 65 65 57
P. Ecuador City 4 5 5 5 5
Other companies 0 20 37 43 43
Total 305 314 328 332 314
Memo: Optimistic 317 356 376 367 407Scenario
Source: Annex-Table 20 and Petroecuador
Tertiary or Enhanced Recovery
4.31 Enhanced recovery became controversial when, on February 2, 1990, Texacoproposed an ambitious investment program totalling US$1.109 billion, which indicated that oilreserves could be increased to 710 million barrels, after the large-scale injection of carbondioxide (C02) in the Shushufindi-Aguarico and Sacha fields, the implementation of stratigraphicexploration, and a water-injection project in the Auca field.
4.32 The need for technically solid studies, shared by the company, led to the creationof a group of Texaco-Government specialists to complete them in September 1990, in Houston.In turn, another commission would analyze the contractual framework and the procedure which,in accordance with the Law, could be applicable to the Texaco proposal.
4.33 On July 1, 1992, the new operator, Petroamazonas, summoned international bidfor offers for reserve assessment and field behavior studies and performance forecasting of theShushufindi-Aguarico field, the largest in the country.
4.34 The winner was American Scientific Software Intercomp, an internationallyrecognized company, which recently completed its report and providing the following mainconclusions:
a. With a relatively low investment of US$148 million, a discounted cash flow ofUS$ 1.355 billion can be produced and obtained, during the 33 years assessed, thatis, an investment-return ratio of 1/9.

Hydrocarbons 61
b. The field's current production could be maintained at 100,000 barrels per day until2003, thereafter declining to 34,000 barrels per day toward 2024.
c. It is forecast that the accumulated production between 1972 and 1992 (700 millionbarrels) and between 1992 and 2024 (893 million barrels) will be close to 1.6billion barrels, exceeding Texaco's previous estimate of reserves by 250 millionbarrels.
d. Another 130 million barrels could be recovered in the decades after 2024 until thefield becomes uneconomic.
4.35 The results of this study are based on production systems where the field operateson its own energy (primary recovery) and the installation of an artificial water-injection system(secondary recovery), and reveal the exceptional characteristics of the Shushufindi field oildeposits, where over 50% of the oil trapped underground could be recovered.
4.36 In view of Texaco's concern over injection of C02 (tertiary recovery),Petroecuador established a Coordination Unit to conduct, along with Scientific Software, thetertiary recovery studies applicable to the field and to study the availability of C02 in thecountry. These studies are being carried out and will be completed soon. These studies have tobe completed and the performance of the fields should be carefully observed, to confirm whetherthe studies are as reliable as they are believed to be.
4.37 To implement tertiary recovery, however, huge investments are required.According to Texaco figures, the Pilot Plan (to assess whether this method operatesexperimentally) alone would cost on the order of US$80 million. In addition, Petroamazonascalculates that, for an assessment in the area of well P-80 (C02 producer), US$1 million wouldhave to be invested in seismic lines and at least US$4 million to drill an additional well.
Prospects
4.38 Preliminary results indicate that secondary recovery could be more economicalthan tertiary recovery. Although tertiary recovery, technically speaking, could achieve 6-9% moreproduction than combined primary and secondary recovery, the estimated investment andoperating costs, based on current price levels, would postpone the decision about tertiary recoveryin Shushufindi by several years. When tertiary recovery eventually proves to be technically andeconomically feasible, international bids could be called, whereby the winner would sign acontract in keeping with laws prevailing at that time.
4.39 The preceding pages have especially focused on the supply-side of oil, that is,factors such as legislation, exploration and development investments etc. The demand-sideaspects, that is, factors affecting consumer behavior (prices, taxes, availability and substitutionpossibilities, etc.), have been touched on in the preceding paragraphs and in the earlier sections

62 Ecuador: Energy Pricing, Subsidies and Interfuel Substitution
dealing with prices and subsidies. The pricing policy for oil products has been identified as themajor cause of sector problems and should therefore be modified. Moreover, amendments shouldeventually be made to the Hydrocarbons Law, as follows:
Elimination of the monopoly exercised by Petroecuador (and its affiliates) in oilactivities.
The valuation of oil at its economic cost, that is, its opportunity cost (the valueof a barrel or gallon of oil sold at the best price that can be obtained).
A more thorough regulatory framework dealing with the environmental aspects ofoil exploration, production and industrialization to mitigate the negative impact oftheir activities on the environment.
Environmental Aspects
4.40 Oil production, although crucial for Ecuador, should not necessarily damage theenvironment. There are techniques and procedures that are not prohibitive although they do entailsome costs that would prevent damage. Also, regarding environmental impact, the HydrocarbonsLaw has been negative because it has not included the costs for avoiding, alleviating or repairingenvironmental damage in the price base. Likewise, maintaining very low prices for domesticconsumption promoted rising exploration and production (and the environmental problems thisimplies) and has resulted in very high consumption (Chile, with a per-capita GDP more thantwice that of Ecuador, uses only 25% more oil) contributing to air pollution in cities as well assoil and water pollution in production, refining, storage and transport areas. Once oil productsare sold at their economic price, (that is, a price that fosters conservation and rational use of theproduct), efforts should be focused on repairing the damage incurred and establishing thestandards to avoid a relapse (which would be more costly, due to the higher prevailing prices)
Petroleum Refining and Related Issues
Conclusions
4.41 Present refining capacity in Ecuador is insufficient to meet the demand forecastby Petroecuador. If finance for expanded refining capacity is limited, the shortfall in supplycould hypothetically be made up by either importing products, or importing a synthetic crude oilto be processed at La Peninsula refinery instead of Oriente crude as at present. However,demand management options (pricing, energy conservation) have not been considered and futuredemand may well be over estimated.
4.42 The economics of refining in Ecuador should be relatively favorable, since bothcrude and product transport costs will lead to higher gross margins (in excess of $2/Bbl overall)compared to the U.S. Gulf. Operating costs in Ecuador should in total be no higher than in the

Hydrocarbons 63
U.S., while capital investment costs should be only about 5% higher than the U.S. But refiningmargins are volatile everywhere, and the economics of new capacity should be consideredcautiously. Considering the Petroleum Sector as a whole, investment in the upstream (explorationand production) is likely to warrant first priority.
4.43 Ecuador's refineries are deficient in conversion capacity, with a "conversion index"of about 24 compared with an average of 56 in the U.S. (Ref. Oil and Gas Journal, May 4, 1992).With a surplus production of fuel oil now and expected in the future, as well as the productionof heavier oils in the eastern regions, more conversion capacity must be a priority if anyexpansion can be justified.
4.44 Petroecuador has commissioned several studies that were carried out mostly byBEICIP. The main recommendations are:
To commence expansion with the installation of a fluid cracker for vacuum gasoil at La Peninsula, followed by a resid cracker at Esmeraldas at a future date;
To revamp Esmeraldas to maintain light product output when Oriente crudegravity increases.9
The number of cases studied by BEICIP were limited however, and did not fully explorethe option of abandoning refining at Santa Elena, combined with further expansion of Esmeraldasbenefitting from economies of scale and, possibly, Amazonas. These options are worth furtherstudy.
4.45 As an interim measure, processing a synthetic crude at La Peninsula could be anattractive option, but the pricing terms of C. Itoh for a synthetic crude are unrealistic and wouldbe less advantageous than continuing to process Oriente.
4.46 In the absence of good data on the extent of Ecuador's urban air pollutionproblem, improvements to gasoline should be limited to provision of a low lead, high octanegasoline. Quito would best be supplied with a lower octane product than Guayaquil.
Recommendations
4.47 The recommendations for refining development should be reviewed in the lightof overall energy policy issues, including product pricing, energy conservation, petroleum productsubstitution, and priorities for investment.
9 Oriente gravity does not increase (i.e. API does not decrease). This happens only if theheavier crude output is blended with Oriente.

64 Ecuador: Energy Pricing, Subsidies and Interfuel Substitution
4.48 Before proceeding with any proposed addition of conversion units at the LaPeninsula refinery, the option of closing down refining operations at Santa Elena, with anexpansion of capacity at Esmeraldas, should be studied. The proposed modifications toEsmeraldas refinery to accommodate heavier crude oil could be justified if output of heaviercrude does grow (and refining it domestically is the best option) and should be implemented, soas to become operational in about 5 years.
4.49 The feasibility of expanding Amazonas to a higher capacity conversion refineryshould also be screened, although the minimum scale (40,000-50,000 BPD) to make conversioneconomic may be too large given the environmental sensitivity of the upper Amazon basis.
4.50 The proposal to import a synthetic crude to be processed at La Peninsula refineryshould be followed up with negotiation for a more realistic price, and more detailed considerationof the synthetic crude quality. The economics of any such proposal must be based on gasolineand distillate products valued at import parity.
4.51 Cost/benefit studies should be initiated to determine whether the marketing ofhigher quality transportation fuels is justified. As an interim measure, BEICIP's recommendationto market a low lead, higher octane product could be implemented. The feasibility of supplyingQuito and the Sierra with a lower octane gasoline than Guayaquil and the lowlands should beevaluated.
Background
4.52 Ecuador's national oil company has since 1972 had the exclusive right to marketrefined products throughout Ecuador, and has built up its refining capacity with the objective offully satisfying local demand from domestic refineries, processing domestic crude oil. Since theexploitation of the Oriente oilfields in the 1970s, the country's most important refining centermoved to Esmeraldas with the construction of a 55,000 B/D refinery convenient to the exportpipeline, and convenient for the export of surplus heavy fuel oil. Debottlenecking measures,taken in the eighties have increased Esmeraldas's throughput to 90.000 B/D. At present,Petroecuador is planning further expansion of the refining industry in view of continuing highrates of market growth. This growth in consumption may well slow as major changes in energypricing policies are being considered by the new government. (August 1992). Extensive studieshave been made by Petroecuador with the assistance of BEICIP. At the same time, considerableexpansion of the pipeline network has been made. A further factor in future refinerydevelopment is the fact that Ecuador's reserves of light crudes have not increased and that futureproduction will be heavier as the heavy crudes to be produced in block 16 are added to theOriente crude mix. As an interim measure, Petroecuador is considering importing a syntheticcrude to be processed at the La Penfnsula refinery, to increase product supply prior to refineryexpansion. A study of this has been made by Petroecuador, with an internal report issued May1992. This section reviews the above studies in the context of Ecuador's overall energy situation.

Hydrocarbons 65
4.53 Completely new refining centers have been proposed by the national company, e.g.at Pascuales to specifically serve Guayaquil. Feasibility studies have usually shown such projectsto be economically unattractive. In general, a study of world refining expansion shows that mostcurrent expansion is through adding to large, existing refineries. There are several reasons fordistributing refinery activity in several areas, rather than concentrating in a single plant. Supplyis likely to be more secure, in the event of a major disruption to a refinery or pipeline such asan accidental explosion, sabotage, or earthquake.
4.54 The development of an optimum refining and supply strategy is a very complexproblem involving the simultaneous optimization of refinery location, selection of crude to beprocessed, of refining processes, of transportation modes, and of product quality specifications.This is most efficiently done by a comprehensive linear programming model, as was used byBEICIP. It must nevertheless depend to a large extent on forecasting of demand growth, andcrude and product prices. It must also depend on judgement decisions as to what options arepermitted to be considered by the model. As discussed below, Petroecuador may have excludedsome economically attractive alternatives, either for deliberate policy reasons or due to oversight.The option of closing the Peninsula refineries and supplying all product from Esmeraldas andAmazonas, expanded as required to balance demand growth, does not appear to have beenexplored by Petroecuador. It would reduce refining overhead costs; increase economies of scale;and permit the maximum exploitation of the specific advantages of the two sites with good accessto crude supplies from the eastern producing areas.
4.55 The economics of refining in Ecuador will continue to be dependent refiningconditions in the North American area, since both crude and product prices relate to prices in theU.S. Ecuador's gross refining margins should be higher than U.S. margins due to the lowercrude value and higher clean product value, but reduced somewhat by the lower value of heavyfuel oil exported. Considering Esmeraldas yields and current freight costs, this would indicatea gross margin about $2.2/Bbl higher than an equivalent U.S. plant.
Ecuador's Refining and Supply Strategy
4.56 The principal obiectives of the government related to refining are likelyto be:
To assure a secure supply of petroleum products to the domestic market, atminimum cost;
To continue to develop the existing refining network, as an important part of theindustrial sector and to provide specialized fuels for other industries such as powergeneration and cement manufacture;
To add the maximum value to domestic petroleum resources;

66 Ecuador: Energy Pricing, Subsidies and Interfuel Substitution
- To spread this development over several regions for logistical, social andsecurity reasons;
- To supply products with qualities most suited to the specific needs of the country,e.g. for environmental reasons.
4.57 Some major trends in world refining are:
- Conservation efforts have slowed the growth of crude distillation capacity;
- Reduced use of heavy fuel oil, as well as the trend to heavier crudes, hasaccelerated the growth of conversion capacity, i.e. to convert heavy fractions tolight fractions for mainly transportation fuels;
- Most growth in the refining sector is now through the expansion of existing larger,complex refineries; while many small hydroskimming refineries (such as thePenfnsula ones) are being shut down, since few are economically viable;
- Tough environmental standards are leading to major investments in plants toproduce higher quality fuels, as well as to control refinery effluent. These trendswill affect Ecuador's refinery development strategy.

Hydrocarbons 67
4.58 Presently, Ecuador has three main refining centers:
Ecuador: Breakdown of Refining Capacity
Capacity MBD Market*
Esmeraldas 63.4 42.8
Peninsula 28.9 55.0
Amazonas 11.0 2.2
100.0 100
The "% Market" refers to the area most logicallysupplied by each refinery.
The Amazonas refinery is in the major oil producing region, which however onlyrepresents 2% of demand. The main advantage of this location is access to both crude andassociated gas. The gas can be used both as refinery fuel, and also as a source of hydrogen forthe treating of heavy oils. Also, the refinery could be integrated with heavy oil production, e.g.supplying fuel for steam generation, or supplying diluents. Another advantage of this locationis that the plant is integrated with a gas processing plant recovering natural gas liquids fromassociated gas. These liquids are blended into gasoline and LPG products.
4.59 The main disadvantages of this location are:
The distance to major market areas, and to labor and services required for refineryoperation;
The difficulty of disposal of surplus residual fuel oil. Small quantities may beblended in the crude oil stream to be pipelined to the coast;
It's location in an environmentally sensitive region, the upper Amazon basin.
4.60 The major advantage of the Esmeraldas location is its access to both the maincrude export pipeline, and to the port of Balao which facilitates both residual fuel exports andtransportation of products by tanker to other Ecuadorean ports. It is relatively well located toserve the Quito area by pipeline, and now can also serve Guayaquil by pipeline. With the largestand most complex refinery in the country, it is a logical center for further expansion.

68 Ecuador: Energy Pricing, Subsidies and Interfuel Substitution
4.61 The location of refineries at Santa Elena was related to the early production of
crude in this region, dating from the 1920s. Currently, crude production in this region is below1,000B/D, so that crude supply proximity is no longer a reason for refining at Santa Elena. Thepresent La Peninsula refinery, made up of two separate plants, only operates as a topping plant.In common with most simple refineries of this type without conversion capacity, the refinery is
not now profitable when crude and products are valued at opportunity cost. The location has thedisadvantage of a water shortage. On the positive side, it does have access to a port (withlimitations), and is reasonably close to the Guayaquil market. Also, it is now connected byproduct pipelines to both Guayaquil and Manta.
4.62 Esmeraldas operating costs, quoted as $1.81$/Bbl by Petroecuador, appearcompetitive with average US. costs recently estimated to be $2.7/Bbl for an average refinery ofsomewhat higher complexity than Esmeraldas. However, there are good reasons why costs atEsmeraldas may be underestimated.
4.63 Based on figures extracted from the reports under review, the relation betweencurrent refinery output and present and forecast demand are as follows:
Refinery Product Surplus/Shortfall, MBD:
1991 1995 2000
Gasoline -0.5 -2.8 -6.9
Distillates 6.0 -0.0 -7.0
Fuel Oil 32.0 21.7 17.1
LPG -6.6 -15.4 -22.3
The shortfall of clean products would indicate a need for about 20 MBD newcapacity by the year 2000. The shortfall in LPG relates to the low subsidized retail price of thisproduct. This demand projection assumes no changes in pricing policies. The new governmenthas indicated that it intends to introduce major shifts in these policies. If so, the growth in
consumption would be stemmed, especially for LPG. Thus additional demand by the year 2000might only be about 10.000 B/D and could be handled through imports or additional investmentat Esmeraldas, depending on which option offers lower costs.
4.64 Ecuador's produced surplus of heavy fuel oil, increasing supplies of heavier crudes,and relative lack of conversion capacity by world standards all confirm that a next increment ofprocessing capacity should include a conversion element. The balance shown above wouldsuggest that this increment should be in service by the end of the decade. The economics of suchan expansion are not assured however, considering the volatility of refining margins.

Hydrocarbons 69
BEICIP Proposals '°
4.65 The final refining recommendation of the above reports was for Petroecuador toselect a program of upgrading of both the Esmeraldas and La Peninsula (Santa Elena) refineries,over a period of eight years; (described as "Case 6C"). In order to process the heavier Orientecrude anticipated, Esmeraldas would be debottlenecked to a feed rate of 110,000 B/D. The majorequipment additions and modifications included in Case 6C and the Esmeraldas debottleneck arepredicated on processing a "Total Blend" which would include all the heavy oil production in asingle mix both for export and for domestic processing. Although Case 6C shows a better NetPresent Value than the other six cases selected for detailed study, the economics are not veryrobust, with a negative Net Present Value at a discount rate of 12%. However, "Overall RefiningDistribution Cost" indicate that Case 1 ("as Is i.e. not doing anything) results in the lowestoverall cost in all years through to 2010.
4.66 Some questions arise with regard to the selection of options investigated byBEICIP, as follows:
Since one of the original reasons for locating at Santa Elena is no longer relevant,the closure of this refinery could provide savings in overall refining costs. Closureof the plant was only considered by BEICIP in conjunction with a new refineryat Pascuales. It could be more attractive combined with a major expansion atEsmeraldas. Expansion of Esmeraldas beyond 110MB/D was not considered inany case studied, although with a 30 year horizon, this possibility must beevaluated.
Why is an expansion of Amazonas not considered in conjunction with otherrefinery expansion? Considering the potential advantages of Amazonas thepossibility of a conversion refinery at Amazonas, with an expansion of pipelinecapacity to the Quito area, could be worth study.
The investment in refinery capacity required in Ecuador to balance demand growth,would be reduced if a lighter crude were segregated for domestic refining. Although there isstatement that there would be a marginal advantage to process "Oriente remaining", a lightercrude that could be segregated, this advantage is not quantified in the report. Furthermore, the
'° The BEICIP reports reviewed are:
i) Crudos Pesados Project: "Summary of the Studies", Final Report,undated draft.
ii) "Study of the Development of Refining and Distribution inEcuador", Phase 2, Jan. 1992.

70 Ecuador: Energy Pricing, Subsidies and Interfuel Substitution
output of Oriente crude will exceed domestic requirements for many years to come and none ofthe heavier crude has, as yet, been produced.
4.67 In considering the expansion of La Peninsula, BEICIP point out that the revampingof the existing distillation units included in their proposals might not be feasible if detailedinspection showed the condition of the plants to be deteriorated (which it most likely is, giventhe age of the plants). They also recommend replacement of the topping plants with a new unit.This almost means building a new grassroots refinery and could be thus be almost as unattractiveas the Pascuales refinery proposal. It would depend on the remaining useful life of otherfacilities such as tankage, utility plants, maintenance facilities, etc. This leads to the question ofpossible abandonment of this refinery location; or just preserving if for certain functions such asthe processing of reconstituted crudes discussed below, or operating it as an oil terminal andstorage facility.
4.68 In case La Peninsula refinery were to be modernized and expanded, the proposalalso calls for the construction of a crude oil pipeline from Santo Domingo to La Peninsula.However, the economics (illustrated on page 83 of the first report) are not convincing. It is notclear why tanker costs are expected to escalate at 8% per annum, a key assumption in theeconomic analysis. The use of tanker transport would likely require some port and storageimprovements, but at lower cost than the pipeline. It may be noted that a similar concern wasexpressed during the energy assessment of 1985, with regard to the Libertad-Manta pipeline, theconstruction of which resulted in transport costs significantly higher than previously experiencedwith marine transport.
4.69 BEICIP's recommendations for modifications to Esmeraldas to accommodateheavier crude oils are likely to be the best and lowest cost option, unless a supply of light crudewere segregated specifically for local refining. This last option, which under presentcircumstances would remain feasible into the next century, would result in the lowest investment.
4.70 The economics of all cases were calculated by BEICIP assuming a 20 year projectlife and a 30% residual value. This is optimistic for refinery processing projects which aresubject and often sensitive to the following risks:
- crude and product price variations,- changes in refining technology,- changes in country economic conditions,- changes in crude availability and quality due to the success or failure of
exploration and development,- changes in the technology of fuel utilization.
among others. In particular, the 30% residual value is unrealistic since most refining equipmenthas a zero or negative residual value, considering site cleanup and dismantling cost.

Hydrocarbons 71
Synthetic Crude Proposal
4.71 This proposal is set out in a Petroecuador report dated May, 1992. It is based onan offer by the company C. Itoh to supply a synthetic crude oil, to be processed in the LaPeninsula refinery to make lead free gasoline, middle distillates, and virtually no heavy fuel oil.The operation is proposed as an interim measure, prior to the installation of conversion capacityat La Peninsula.
4.72 A "synthetic crude" is a mixture of semirefined petroleum fractions that can befurther refined to specification products in a relatively simple refinery such as a hydroskimmingrefinery. It could be produced from a heavy oil, such as the synthetic crudes produced inCanada, or it could be similar to the reconstituted crudes that have been produced in theCaribbean export refineries for many years, from conventional crudes. The yields of productsshown in the report indicate that it is this latter type of reconstituted crude ("recon") virtually amixture of semi-finished products.
4.73 The concept of processing a recon crude at La Peninsula refinery could beattractive for Ecuador for a number of reasons:
It would reduce the volume of low value residual fuel that must be exported, priorto expansion of conversion capacity;
It could delay the need to install new refining capacity, while providing productat lower cost than product imports;
The imported material would be transported in dirty rather than clean tankers,providing transport cost savings relative to product imports. These savings wouldbe further enhanced by the possibility of using backhauls in tankers that carryexport crude oil from Ecuador (which is the case);
It would be a good use for the refinery in its present configuration, not requiringeither cracking or catalytic reforming capacity;
It would allow La Peninsula to immediately deliver larger volumes of cleanproduct to the major market of the Guayaquil area, closer to this refinery;
It would in effect utilize surplus refining capacity that may exist in foreigncountries, and available at marginal cost, thus allowing potential supply costsavings.
4.74 Whereas the proposal is potentially attractive, the price asked for the syntheticcrude is too high. The price proposed CIF La Peninsula was to be according to the formula:1.8* (Oriente price FOB Balao). The price of the synthetic should be lower than the CIF price

72 Ecuador: Energy Pricing, Subsidies and Interfuel Substitution
of the various products of which the synthetic is composed. Based on the import parity pricesshown in BEICIP's study, the synthetic factor in the formula should be 1.68, without allowingfor the lower freight cost of dirty versus clean tankers, or the savings accruing from a backhaul.When these savings are considered, the factor should be below 1.60.
4.75 The Petroecuador study considered four cases, all related to La Penfnsulaoperations. They included:
a. Processing Oriente as at present,b Processing a light crude, e.g. Bonny Light,c. Adding conversion capacity to the refinery,d. C. Itoh's recon crude proposal.
The last three all represent ways to reduce surplus heavy fuel production and givea better balance with demand. No changes to Esmeraldas or Amazonas refineries are consideredin combination with the above options.
4.76 The economic analysis (commencing on page 21 of Petroecuador's report), isflawed in that it uses domestic (subsidized) prices to evaluate the gasoline and distillate productssold in Ecuador. Since this demand must in any case be met, the appropriate value should bethe opportunity cost, i.e. the cost of product imports. When import parity prices are used in theanalysis, the advantage for the recon proposal disappears. Refining Oriente crude as at presentbecomes more attractive. This is (shown in Appendix 2) summarized as follows:
Net Refining Margins. MM$/year:
Domestic Price Opportunity CostBasis Basis
Oriente Crude -32.6 -5.3Synthetic Crude -15.4 -8.1
4.77 The report points out that the economics are sensitive to the difference in valuesbetween Oriente crude and the recon crude. The value of export fuel oil used in their study was9.72$/B; this is lower than would be expected at present. The current USG spot price of 3%sulfur fuel oil is 13.0$/B, indicating a price FOB La Libertad of about 11.0 $/B. This alsodistorts the economics in favor of the recon proposal.
4.78 Any contract for the supply of a synthetic crude should make provision for qualityvariations to best balance any shortfalls in domestic production, and to match current marketquality requirements. The inclusion of lead free gasoline may not be in Ecuador's best interestat the present time, as discussed below.

Hydrocarbons 73
4.79 Appendix 2 also shows that the net refinery margin at La Peninsula would benegative for either of the product pricing bases, or crude oils used. This is consistent with theunfavorable economics of most refineries without conversion capacity.
4.80 The overall conclusion is that the synthetic crude option is not economicallyattractive as presently proposed. It is also very sensitive to variations in the relative prices ofOriente crude, the synthetic crude, and residual fuel. It also represents what could potentiallybe an attractive interim measure to improve the balance of refinery output without capitalexpenditure, and is worthy of further study. Its urgency, however, may diminish if demandmanagement measures (including higher prices) are taken a result in a slowing of the growth ofdemand.
Gasoline Quality Improvement
4.81 The BEICIP report's comments on this subject are in summary as follows:
- There have been no detailed on-site studies of air pollution in the major cities ofEcuador to provide a firm basis for an evaluation of the need for higher qualitygasolines.
- But observations of the urban areas, and general world trends, indicate that higherquality gasolines will likely become justified at some time in the near future.
- Reductions in air pollution could be achieved at a first level by marketing a lowlead, higher octane gasoline; and at a higher level with a lead free productpermitting the use of catalytic converters.
- BEICIP recommend the first stage at this time, i.e. a low lead, higher octaneproduct, combined with engine adjustments to optimize the use of the higheroctane.
4.82 An important conclusion is that more detailed studies of both current urbanpollution levels, and the type and condition of the automobile engine population, should certainlybe undertaken by specialists in this field before costly quality improvement measures areinitiated. The municipal government of Quito had initiated a pilot project to measure air qualitybut its conclusions are not known.
4.83 It is also noted that the octane requirements of the two major urban areas, Quitoand Guayaquil, are quite different in view of the different elevations. Guayaquil will require ahigher octane. Particularly insofar as the two cities are each mainly supplied by differentrefineries, it will likely be most economical to produce a different octane product for each city.

74 Ecuador: Energy Pricing, Subsidies and Interfuel Substitution
4.84 The reason that a low lead product is proportionally less costly than a zero leadproduct, is due to the fact that the response of gasoline to lead addition is not linear. A smalladdition of lead has a disproportionally large benefit in terms of octane; and at low lead levels,lead addition is by far the most economical method of octane improvement.
4.85 The question of aromatic content was not raised in the BEICIP report. New U.S.regulations require a significant reduction in aromatics which play a role in smog formation.This should also be addressed if a detailed study of Ecuador's needs were carried out in thefuture.
4.86 In the short term, BEICIP's recommendation for a low lead product is as far ascould presently be justified, prior to the acquisition of detailed data.

Hydrocarbons 75
Annex IOPTIMAL TARIFFS AND RESPONSIBLE ELECTRICITY PRICING:
A FULLER DISCUSSION
OPTIMAL TARIFFS
1. Electricity tariff can be designed to meet a number of objectives. The most common onesare:
I. Economic efficiencyII. EquityIm. Cost recoveryIV. Transparency and ease of implementation
Economic efficiency is required to maximize welfare. And economic theory tells thatwelfare maximizations calls for short-run marginal cost (SRMC) pricing. Simply put,electricity prices based on SRMC are defined as:
P(t,l) = SRMGC(t) + CG(t) + L(t) + CT(t) where:
P = price (cents/kWh)
SRMGC = minimum short-run marginal system generating costs (i.e., the costs ofgenerating an additional kWh in accordance with the merit order dispatchof available plant)
CG = curtailment premium that applies if demand exceeds the capacity ofinstalled generating plant (if not, the premium is equal to zero)
L = losses in the transmission and distribution system (which may be positiveor negative)
CT = curtailment premium that applies if demand does not match the designlimits of the transmission and distribution network (otherwise the premiumis equal to zero)
t = index of time1 = index of location where demand is met
Efficient prices must satisfy the above equation and are required to clear the market atevery point in time (t) for every location (1). Such prices properly reflect the costs ofgenerating and supplying electricity, taking into account the load to be met, the merit

76 Ecuador: Energy Pricing, Subsidies and Interfuel Substitution
order dispatch, transmission losses, and the design limits of the system (see para 29).Stated differently, they provide consumers/buyers with the correct information about thedifferent costs that the system incurs to serve demand. Moreover, since efficient priceshave to clear the market, they are just equal to what consumers are willing to pay forbeing supplied with electricity.
2. Efficient electricity pricing is compatible with striking long-term contracts. In fact, sinceefficient prices may vary by time of use due to factors that are beyond the control of aparticular consumer/supplier, long-term contracts offer the opportunity to hedge againstthe risk of price fluctuations. For example, a generator can sell a contract under whichthe consumer/buyer has the option to purchase (at some date in the future), say, 1 MWhfor $30 (3 cents/kWh). At any point in time, the value that this contract has to theconsumer is equal to the difference between the actual (efficient) price prevailing in themarket, p(t), and 3 cents/kWh, times 1,000 kWh, i.e. [p(t) - 3 cents/kWh] 1,000 kWh. Bythe same token, if the generator's SRMGC amounted to 3 cents/kWh, his/her net revenueswould be equal to the consumer's net benefits should the latter exercise the option to buy.Moreover, in perfect markets, the price of the contract/option would approach a level atwhich the generator recovers the costs of generating capacity needed to supply 1 MWh(disregarding any constraints and costs imposed by the transmission system). Thus, underideal conditions, fixed-price fixed-quantity contracts would divest sellers/buyers of the riskin the returns/benefits from trading electricity, without violating the principle of efficientpricing.
3. Efficient prices are equitable in the sense that they provide consumers (or suppliers) withno incentives to retrade or recontract electricity among themselves. Hence, efficient pricesrule out cross-subsidies. This is because if there were cross-subsidies among consumers,some users would be willing to pay a higher price than that granted to the subsidized onesso that brokering of electricity -if it were feasible- would eventually make both partiesbetter off. Even though the above equity argument is a particularly strong one, peoplemay have different opinions about what characterizes equitable prices. For instance, it canbe argued that low-income consumers should be served at a price set below costs. Inmaking this point, though, one implicitly calls for a tariff system that cannot beeconomically efficient. This means that the provision of subsidies will cause extra costsabove and beyond the monetary value of the subsidies. The size of these extra costsdepends on how and by whom the subsidy is granted and financed. So if subsidies aredeemed desirable, they should be applied in a cost efficient manner. In this context, cost-efficiency means that (i) the costs of administering the subsidy are kept at a minimum,(ii) the subsidies are financed in a neutral way, (iii) the subsidies are precisely targetedto the group that is intended to benefit from the measure, and (iv) the (estimated) benefitsthat accrue to the target group are at least as high as the direct costs of the subsidies.
4. Equity considerations aside, there are other problems with SRMC-pricing. One is thatefficient prices may not enable the supplier to recover total costs. This happens when

Annex 1: Optimal Tariffs and Responsible Electricity Pricing 77
marginal costs are below average costs. Furthermore, even if efficient prices help recoup
total costs, they may not yield a "fair" or "adequate" rate of return. It can be argued,
however, that cost recovery, and more so profits , may come at the expense of economic
efficiency (to the extend that it requires a departure from SRMC-pricing). While the
argument is valid in theory (where it is assumed that prompt and non-distortionary
government transfers would render a cost efficient, but loss-making utility financially
viable), it misses an important point when applied to real-world conditions. In practice,
an insolvent utility that depends on government transfers lacks incentives to operate
efficiently. Moreover, a utility that is required to operate like a non-profit organization
will find it difficult to raise funds from non-government sources or, as the case may be,
attract private investors whenever this is needed or desirable. Finally, a regulated utility
that does business in the quest of profits is more likely to cut costs and diversify its
services than would be an executive branch of the government that runs the sector on the
basis of general budget allocations. Likewise, electricity prices that support commercial
goals, but are not fully congruent with the ideal of economic efficiency, tend to
outperform tariff systems that (at best) are designed to be economically efficient, yet
provide the utility with no incentives (rewards and penalties) to operate in an efficient
way.
5. So convincing is the case that can be made for SRMC-pricing on theoretical grounds, so
difficult is its implementation in practice. As has been stressed in para 1, perfectly
designed efficient tariffs have to continuously adjust over time (and space). Bearing this
in mind, efficient electricity prices are often called "spot prices". Obviously, perfect spot
pricing is an elusive goal. Even tariffs that only remotely resemble the ideal of spot
pricing are rather complicated to design and apply. Advanced and costly metering and
(two-way) communications technologies would be required to render some kind of spot
pricing feasible. Also, utilities and electricity users must be able to digest and harness a
large amount of information. So in most circumstances, particularly when demand and
supply are not very diversified, the pursuit of a perfectly efficient pricing policy is not
worth the effort. Consequently, the ideal of economic efficiency has to be reconciled with
the limited abilities of electricity suppliers and users to signal, and respond to, changes
in costs and preferences.
RESPONSIBLE ELECTRICITY PRICING
6. Responsible electricity pricing is a compromise between the requirements of economic
efficiency and the actual capabilities to meet these requirements. As has been outlined
before, there are number of constraints and risks that beset the task of devising electricity
tariffs. Responsible pricing takes account of these factors.
7. First and foremost, electricity tariffs should be structured so as to inform users about the
costs they impose on the system. That is, the design of the tariff system should be
structurally correct, not necessarily at the margin, but on average. Second, prices should

78 Ecuador: Energy Pricing, Subsidies and Interfuel Substitution
be financially viable, i.e. allow the utility to at least recover its costs. It is worth notingin this connection that if prices are based on load-specific average costs, they will satisfythe first two requirements. Third, the tariff system should be compatible with commercialgoals. In particular, if the power sector has to strive for scarce financial resources, the
regulatory framework should permit utilities to generate positive returns. Moreover, undersuch conditions, profitability should become a measure of good performance and, thus,will have a decisive impact on whether and to what extent scarce resources are madeavailable to the sector. Fourth, the tariff system should be vertically disintegrated. Thismeans, prices should provide separate information about costs attributable to theconsecutive services (generation, transmission, etc), that the sector performs in supplyingits customers. Fifth, the tariff system should be horizontally disaggregated. This postulatesays that if it is feasible to diversify services in terms of price, customers should be giventhe opportunity to choose among these services.
8. The last two requirements often are subsumed under the term "unbundling of services".Sectorwide, unbundling is an issue relevant to the division of labor between powergeneration, transmission, and distribution. In particular, the current structure of Ecuador'spower sector lends itself to a solution that strengthens the corporate identity of thedistribution companies. By the same token, it is opportune to increase the distributioncompanies' responsibility for tariffs set at the retail level. Since services and costs varyacross the country's franchised distribution areas, the companies should be givendiscretion to custom-tailor their tariffs to the conditions under which they operate, subject,of course, to regulatory supervision. This would result in a dual tariff system: One forbulk power transactions between the generation and transmission complex and itswholesale customers (the distribution companies and, as the case may be, large industrialusers), and one that applies to the retail level and reflects the different infrastructural andeconomic characteristics of the distribution areas. Once a coherent system of tariffs forbulk supplies is in place (differentiated by load, voltage level, and location), thedistribution companies should be held responsible for selecting a mix of bulk supplies andown generation that serves their customers at least cost. In a later stage, it may alsobecome feasible that the transmission system facilitates power wheeling operationsbetween different distribution companies, provided that this option proves to beeconomically advantageous.
9. Retail tariffs that take account of regional differences may appear to be discriminatory.However, this will not be the case as long as tariff differentials are a mere response tothe diversity of demand and costs (rather than a means of reaping monopoly profits). Ofcourse, they may also reflect imbalances that impair the distribution companies' abilityto cut costs. In this event, policy makers may find it desirable to alleviate the impact ofregional disparity and uneven development with the aid of electricity tariffs. Government,however, should resist this temptation and choose among other measures better suited toaddress the problem of regional imbalances. Also, in the past policy makers seemed tobelieve that they have a social obligation to subsidize and encourage the residential use

Annex 1: Optimal Tariffs and Responsible Electricity Pricing 79
of electricity. Electricity, however is a valuable good, and in general households that areable to pay for the consumption of this good are also willing to do so. So there isabsolutely no need to charge them less than it costs to meet their demand. Differentconsiderations may apply to low-income, low-volume consumers that have access to, orcan easily be connected to the grid, and would gain substantial benefits from usingelectricity. Subsidies granted to this category of consumers should be transparent, properlytargeted, and accounted for, and must be financiable without large deadweight losses.
10. While it appears logical and feasible to diversify tariffs at the retail level, perfectunbundling of transmission services is often considered to be too complex an issue to bemanageable in practical applications. Also, the benefits from sophisticated transmissioncharges may not justify the effort required to design and administer such a refinement.So it comes not much as a surprise that INECEL's recently completed tariff studyproposes a vertically (by voltage level) disintegrated scheme oftransmission/subtransmission rates that uniformly apply across the grid. No attempt ismade to horizontally disaggregate transmission charges. This approach can be justified fortwo reasons. First, from an accounting point of view, it is more convenient to chargenetwork costs and the costs transmission services on a per kW and per kWh basis,without regard to spatial differences along the network. Moreover, if bulk powergeneration and transmission are performed by a singly entity (as is the case under thecurrent institutional framework of Ecuador's power sector), transmission support services(e.g. voltage support, frequency control) and line losses can be considered a common costto the system (e.g. generation and transmission). And as long as unbundled tariffs for bulkpower supplies recover these costs, there is no pressing need to disaggregate and priceunderlying cause and effect relationships. Second, and more importantly, disaggregatedtransmission pricing that takes account of the impact that net-injections at each node haveon the whole system (e.g. in terms of line flows, dispatch) may be redundant if spatialdifferences are negligible or net themselves out over time. Whether or not this is the caseunder the current operating conditions of Ecuador's power sector remains to beinvestigated.
11. At any rate, some sort of disaggregated transmission pricing will be required onceindependent power generators (IPP's) or generating facilities operated by the distributioncompanies are permitted to wheel power across the transmission system. In this event,these supplies should be priced on the basis of "avoided costs" to the rest of the system,i.e., the costs, net of any savings, that the system would experience in the absence ofthese supplies. Clearly, avoided savings, i.e. the extra costs that these supplies mayimpose on the system strongly depend on the way in which they impact the line flows inthe network and the merit order dispatch of the system's generating plant. A rational tariffsystem should account for these factors to induce the optimal use of generating facilitiesowned by independent or non-utility suppliers, particularly when their supplies make upa large share of bulk power transactions across the main grid.

80 Ecuador: Energy Pricing, Subsidies and Interfuel Substitution
Annex 2TARIFF DESIGN: CRITIOUE AND IMPLEMENTATION OF INECEL'S
NEW WORLD BANK FINANCED TARIFF STUDY
1. INECEL's new tariff study was completed in March 1992. Its implementation (which thisreport strongly endorses) could make an important contribution to restoring the financialhealth of the sector and enhancing the incentive framework of its operators and customers.The study is based on a careful examination of short-and long-run system-costs,operational features of the system, and the profile of loads. It calls for an increase in thelevel and a change in the structure and number of rates applying to wholesale and retailtransactions. The suggested changes in the tariff system are directionally correct andwould bring about significant improvements on how electricity is generated, transmitted,distributed, and used. In particular, the proposed tariffs vary by time-of-use, reflectseasonal variations (although some dilution of the seasonal cost differences occurs) ofsupply and demand, and account for line losses and the costs of transmission anddistribution services. Compared to the rates which are currently in place, the new systemwould increase average tariffs by 3.0 UScents/kWh for industrial users, 3.5 UScents/kWhfor commercial users, and 5.7 UScents/kWh for residential customers.
2. In order to calculate the system's unit generating costs, the study assumed that the costsof meeting a marginal increase in peak load (CMP) plus the system's average marginalenergy costs (CME) are equal to average incremental generating costs. The latter aredefined as the ratio (R) of discounted annual changes in system expansion costs (net oftransmission and generation) to discounted annual changes in future demand, averagedover a planning horizon of 13 years (T). Hence, the basic equation can be written as
R/T = CMP + CME
(For details, see Annex III). The study also assumed that the peaker plant is a gas turbinewith annuitized costs of 78.9$/kW and a load factor of 0.61. Consequently, CMP = 14.8USCents/kWh. Moreover, based on the least cost system expansion plan and thecorresponding demand forecast, the study's estimate of R is 481 USCents/kWh so thatRIT = 40.1 USCents/kWh. Therefore, CME = 25.3 USCents/kWh. Expressed in prices ofJanuary 1992, the figures translate into 90.3 $kW/year for the peaker plant, correspondingto 1.66 USCents/kWh, and 2.93 USCents/kWh for the system's marginated energy costs,as is shown in the first row of Table 1.7.
3. The average costs of providing, maintaining, and operating transmission andsubtransmission capacity are usually expressed as the ratio of discounted expenses forthese services to the discounted future flows (in kW) through the lines of the network. Itis also common to lump these costs together with the costs of load that under normal

Annex 2: Tariff Design 81
conditions gets lost (for technical reasons) within the transmission and subtransmissionnetwork. The same approach has been used by the tariff study, and the resulting figures($/kW) are presented in the first column of Table 1.7. The second column of the tableindicates how average energy costs increase in direct proportion to line losses that occuralong the transmission chain. Similar considerations apply to distribution networks,although costs may vary significantly among different service areas. The cost estimatesshown in Table 1.7 are broken down along the distribution chain and reflect systemwideaverages.
4. Table 1.8 shows how electricity supply costs, broken down to the subtransmission levelon average vary by season and time-of-day. The dry season, which under the currentlyused hydropotential lasts from November to March, accounts for about 150 days a year.Peak demand occurs between 7pm and lOpm, whereas base load demand is referred tothe period between lOpm and 8am. The seasonal impact on energy costs overwhelm thatassociated with daily fluctuations of load. Energy costs vary by about 6 USCents/kWhseasonally, while the cost differential during the day is at most 1 USCents/kWh.
5. Based on the calculation of electricity supply costs, the study proposes a system of tariffsthat can be categorized in terms of the location where load is met.
(i) Interconnection Points (Nodes): Tariffs apply to bulk suppliespurchased by distribution companies at nodes along the 230 kVtransmission system.
(ii) High voltage level: Tariffs apply to bulk supplies delivered to largeusers at voltage levels between 138 and 46 kV.
(iii) Medium voltage level: Tariffs apply to customers served bydistribution companies at voltage levels between 22 and 6.3 kV.
(iv) Low voltage level: Tariffs apply to customers served bydistribution companies at voltage levels of 115/120 and 210/220 V.
In addition, the tariffs falling into the first three categories include an hourly capacitycharge for peak and off-peak demand, and energy charges differentiated by season and time-of-day. Medium voltage consumers face an optional two-part tariff with a monthly demand chargeand a seasonal energy fee. Low voltage users are subject to two-part tariffs tailored to customerclasses, comprising a demand charge and an undifferentiated unit price for energy. The resultingtariff system looks as follows:
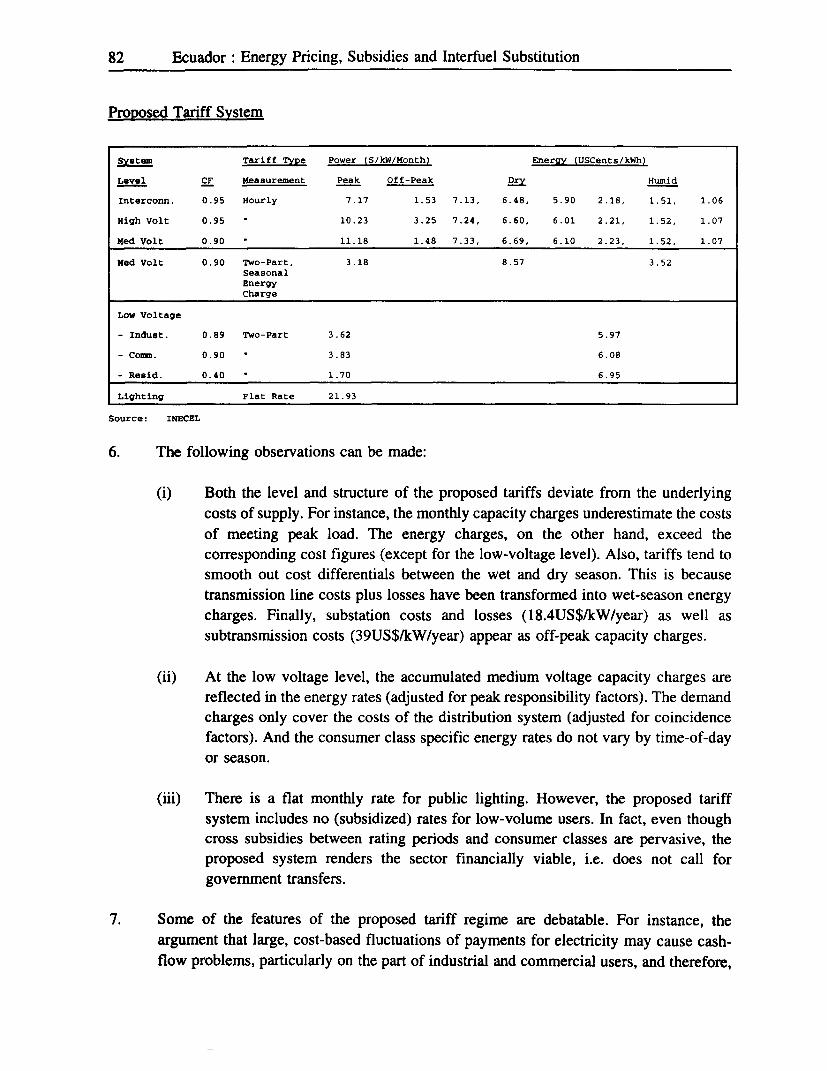
82 Ecuador: Energy Pricing, Subsidies and Interfuel Substitution
Proposed Tariff System
System Tariff Type Power (S/kW/Month) Energy (USCents/kWh)
Level CF Measurement Peak Off-Peak Dry Humid
Interconn. 0.95 Hourly 7.17 1.53 7.13, 6.48, 5.90 2.18, 1.51, 1.06
High Volt 0.95 10.23 3.25 7.24, 6.60, 6.01 2.21, 1.52, 1.07
Med Volt 0.90 11.18 1.48 7.33, 6.69, 6.10 2.23, 1.52, 1.07
Med Volt 0.90 Two-Part, 3.18 8.57 3.52SeasonalEnergyCharge
Low Voltage
- Indust. 0.89 Two-Part 3.62 5.97
- Comm. 0.90 3.83 6.08
- Resid. 0.40 * 1.70 6.95
Lighting Flat Rate 21.93
Source: INECEL
6. The following observations can be made:
(i) Both the level and structure of the proposed tariffs deviate from the underlyingcosts of supply. For instance, the monthly capacity charges underestimate the costsof meeting peak load. The energy charges, on the other hand, exceed thecorresponding cost figures (except for the low-voltage level). Also, tariffs tend tosmooth out cost differentials between the wet and dry season. This is becausetransmission line costs plus losses have been transformed into wet-season energycharges. Finally, substation costs and losses (18.4US$/kW/year) as well assubtransmission costs (39US$/kW/year) appear as off-peak capacity charges.
(ii) At the low voltage level, the accumulated medium voltage capacity charges arereflected in the energy rates (adjusted for peak responsibility factors). The demandcharges only cover the costs of the distribution system (adjusted for coincidencefactors). And the consumer class specific energy rates do not vary by time-of-dayor season.
(iii) There is a flat monthly rate for public lighting. However, the proposed tariffsystem includes no (subsidized) rates for low-volume users. In fact, even thoughcross subsidies between rating periods and consumer classes are pervasive, theproposed system renders the sector financially viable, i.e. does not call forgovernment transfers.
7. Some of the features of the proposed tariff regime are debatable. For instance, theargument that large, cost-based fluctuations of payments for electricity may cause cash-flow problems, particularly on the part of industrial and commercial users, and therefore,

Annex 2: Tariff Design 83
should be reduced through proper adjustments in the tariff structure, is not very
persuasive. More importantly, there is no need for off-peak capacity charges since buyers
of bulk supplies can be charged for peak load on an hourly basis. Also, the allocation oftransmission line costs in form of wet season energy charges lacks plausibility. If
transmission line design limits are more binding in the wet season, the corresponding
costs should be made transparent in the form of separate charges. There are othershortcomings that are attributable to the lack of reliable information on demand
characteristics. For example, the coincidence factors used by study appear to be flawed.
However, once additional data are available, such problems can be resolved through tariffrevisions and fine tuning. At any rate, while there are several ways of refining the
proposed tariff regime, this should by no means delay its implementation. Rather,
INECEL and policy makers should take immediate steps to replace the existing tariff
regime with the new one.
8. Given the fact that Ecuador's electricity sector is not only capacity-and energyconstrained, but also faces formidable difficulties in obtaining the resources needed for
further expansion, the implementation of the new tariff system becomes a matter of
utmost concern. It will curb excessive demand through price, -which is a more efficient
way of allocating scarce supplies than rationing-, and help the sector to regain a sound
financial basis for improving and increasing its services. To achieve these goals, there is
no long way to go. Highest priority should be given to the revision of the Board'sresolution No.0263 of September 1988 which guides de current tariff policy and is
incompatible with the proposed new tariff regime. This will lay the groundwork for a
rapid implementation of the urgently needed changes in tariff policy. In a second step, the
legal and regulatory framework can be adjusted to comply with the requirements of thenew tariff policy.

84 Ecuador: Energy Pricing, Subsidies and Interfuel Substitution
Annex 3
CALCULATION OF AVERAGE INCREMENTAL GENERATING COSTS
The study approximates the projected stream of future electricity sales E (t), expressed in MWh,by the exponential growth function.
(1) E (t) = E (0) exp [bt], t= 0,1,2 ...... T - 1,
Where sales = demand, and
t = Index of time,
T = Planning horizon,
b = Parameter to be estimated,
exp = exponent
The corresponding stream of costs (in US$) is approximated by the function.
(2) C (t) = C (0) exp [at], t = 0,1,2 ......, T - 1,
Where a is a parameter to be estimated.
The ratio of present value of costs, PVC, to present value of sales, PVE, is givenby
(3) PVCIPVE= b C (0) i I - exp [-ia (T - 1) 1I,a E (0) {1 - exp [-ib (T - 1)1]
Where i denotes the discount rate.
Marginal expansion costs at date t are defined by
(4) d C (t) / dt = a C (0) exp [at]
Likewise, the marginal increase in sales at date and can be expressed as

Annex 3: Calculation of Average Incremental Generating Costs 85
(5) d E (t)/dt = b E (0) exp [bt].
Dividing (4) by (5) yields the ratio of marginal costs to marginal electricity salesat date t, i.e.
(6) dC(t)/dE(t)=[aC(O)/bE(0)]exp[(a-b)t]
The present value of the ratios of marginal costs to marginal sales is defined as
(7) R= aC(0) I1 -exp l-i(a-b)(T- 1)1l,b E (0) i (a - b)
Hence, the present value of the ratios of marginal costs to marginal sales,averaged over the planning horizon, is given by RIT. The study uses R/T as aproxy for the long-run marginal costs of electricity generation. RIT is estimatedat 40.1 US$/MWh.
Clearly PVC/PVE > R/T. To see this, let T -->00.
Then PVC/PVE - RIT = b C (0) / a E (0), i.e. the ratio of present value of coststo present value of electricity sales exceeds the average planning horizon's presentvalue of the ratios of marginal costs to marginal sales.

86 Ecuador: Energy Pricing, Subsidies and Interfuel Substitution
Annex 4ELIMINATION OF OIL AND POWER SUBSIDIES:
IMPACTS ON FISCAL DEFICIT, MONEY SUPPLY AND INFLATION.
I. PURPOSE OF THE STUDY
1. Economic measures proposed for Ecuador are to essentially bring prices to their economiclevels, namely for oil prices to reflect opportunity costs (mostly world prices FOB Ecuador) andfor electricity tariffs to reflect Long Run Marginal Costs (LRMC).
2. These measures have substantial macroeconomic and social impacts. As the proposedpricing policy would eliminate the fiscal deficit and the need for monetary emission, lowerinflation rates would be achieved and would stabilize the real income of the population,especially of low-income households. In addition, prices at economic level would restoreEcuadorean competitiveness by improving efficiency in resource allocation.
3. The central question this section addresses is whether a "mitigated" removal of the oil andpower subsidies, that is price deregulation along with social mitigation policies, would generateenough public revenues to eliminate the fiscal deficit, and by eliminating the need for monetaryfinancing of this deficit, eliminate inflation. Can social welfare and a fiscal surplus bereconciled? In other words, what would low-income households and the economy as a wholegain from the elimination of energy price subsidies? Will the chronic inflation problem of theEcuadorean economy be ever resolved? The analysis of this issue focuses on three groups ofquestions:
(a) How much the fiscal deficit would be reduced by the removal of oil and powersubsidies? The answer deals with the limits of public choice and political decisionprocess. However, in the short run it can be assumed that public revenuesgenerated by prices at economic level would not be offset by automatic equivalentexpenditure growth.
(b) The extent to which monetary emission would be reduced if the fiscal deficit wereeliminated depends upon external financing of the deficit. That is, on the ratiobetween external and domestic funding of the public sector. The answer alsodepends upon the balance of payments origin of the money supply and the relatedsterilization policy.
(c) The third question is about the impact of a reduced fiscal deficit upon theinflationary process. The relation among these macroeconomic targets is notstraightforward. One needs to consider imported inflation, the liquidity ratio ofthe economy, the velocity of money and consumer behavior in terms of demandfor real balances.

Annex 4: Elimination of Oil and Power Subsidies 87
Data are from the Ministry of Finance and from the Banco Central Del Ecuador. A uniformstatistical source is used for consistency, even through available statistics on public finance aresketchy. In fact, National Accounts and IMF data differ in coverage precluding a directcomparison.
4. The second part of this section summarizes the macroeconomic impacts of variousscenarios of higher energy prices, including the short-term fiscal impact. The paragraphs thatfollow present the equation models to capture Ecuador's monetary and inflationary trends from1986 to 1991. This model is used to simulate the deflationary impact for 1991. Conclusionsfollow.
II. MAIN RESULTS
A. Results of the Global Elimination of Subsidies
5. The effects of increased energy prices on public revenues, fiscal deficit, money supplyand inflation are summarized in Table 1. The simulation for 1991 show that eliminating oil andpower subsidies would definitely eliminate the fiscal deficit and in addition would generate asubstantial fiscal surplus of 344 billion Sucres or 2.8 per cent of GDP. Monetary financing ofthe public deficit will no longer be required, and since the domestic component of monetaryemission will be eliminated, the rate of inflation will be drastically reduced, by about 60 per cent.Moreover, negative changes in monetary base (-237 bn Sucres, resulting from a -129 per centimpact) will represent a net accumulation of positive balances in the Central Bank and in otherpublic financial institutions. In 1991, eliminating oil subsidies would increased oil revenues byS/342 billion (or 2.8% of GDP), while eliminating power subsidies would have raised additionalS/233 billion (or 1.9% of GDP), the sum of both would be S/575 billion of 4.7 of GDP.
6. In the short-term, the external component of monetary emission will subsist as a resultof the accumulation of international reserves. This residual emission explains, interalia the 40per cent residual inflation. In the long term, however, this external cause of inflation could beoffset. Calculation shows that, if the monetary consequences (of international reserves) could betotally avoided, the inflation rate would be reduced by more than 100%. In fact, two factors canoffset the monetary consequences of the accumulation of international reserves. First, the netaccumulation of positive balances in the Central Bank by the Non-Financial Public Sector (NFPS)will compensate the balance of payments surpluses and the related increase in monetary base.Inflation will be reduced. As a result, domestic saving will increase, leading to additionalsterilization of high powered money. Second, the cure of inflation will restore Ecuadoreancompetitiveness. Depreciation of the local currency will stop as well as the revaluation of thestock of international monetary reserves. Monetary consequences of this latter appreciation willbe eliminated. These virtuous circles will lead to successive reduction of inflation, within aninterval between -60 and -100 per cent, definitely stopping the inflationary process.

88 Ecuador: Energy Pricing, Subsidies and Interfuel Substitution
B. Social Mitiation
7. Monetary and deflationary performances will be achieved even if, in line withmore recent pronouncements, some of the additional revenues were used to compensate the poorpeople who bear a large share of adjustment costs. In fact, calculations show that even if one-third of additional revenues (192 billion Sucres) were used to mitigate the impact of priceadjustments on low-income households, there would be nonetheless sufficient revenues toeliminate the deficit, the need for monetary emission and, thence, to dramatically reduce inflation.Thus, even in the case of sizeable social mitigation, (arising 1/3 of new revenues to this purpose)the consolidated fiscal deficit will be more thant eliminated, going from 230.8 billion Sucres in1991 (-1.9 per cent of GDP) to a surplus of 152.6 billion (+1.2 per cent of GDP). While thesefigures do not seem important in terms of GDP, it is worth noting that this surplus is a netsurplus, since social costs are already covered. In this case, the absolute reduction in inflation,in the long-term, is of the order of 95 per cent, that is, virtually no inflation. Since this pricecorrection is the result of 86.4 per cent reduction in monetary emission, the related price elasticitywill be about 1.10, which is very much in line with the recent evolution of the Ecuadoreaneconomy (see para. 34). This a posteriori justification fully validates the impact calculations.

Annex 4: Elimination of Oil and Power Subsidies 89
TABLE 1
ECUADOR - Impact of Increased Energy Prices on Public Revenues,Fiscal Deficit. Money Creation and Inflation, 1992
(Billions of Current Sucres)MEASURE ACUTAL PROPOSED PRICE DEREGULATION POLICY ADDITIONAL
SITUATION SOCIALMITIGATION
POLICY /2
IMPACT ON OIL AND POWER ELIMINATION ELIMINATION ELIMINATION ASSINGING 1/3PRICES ARE OF OIL SUBSIDIES OF POWER OF OIL AND ADDMONAL
REGULATED 1991 SUBSIDIES POWER REVENUES TOSUBSIDIES SOCIAL
SPENDING
PUBLIC S13,183 BN S/3,525 S13,416 BN S13,758 BN Sf3,566 BNREVENUES (NFPS) (26.2% GDP)3/ A+2.8% A+1.9% GDP A+4.7% GDP A+3.2% GDP
CONSOLIDATED S/230 BN (SURPLUS) (SURPLUS) (SURPLUS)FISCAL (-1.9% GDP) SI+llI BN S/-3 BN S/+344 BN S/+153 BNDEFICIT (0.9% GDP) (2.8% GDP) (1.3% GDP)
MONEYEMISSION 11 S\+ 183.5 BN (+42 BN) (+86 BN) None Practically(EXCLUDING Required none required
INTERNATIONALRESERVE
MONETIZATION)S/-141 bn S/-96 bn S/237 bn
CORRECIION -77% -52% -129%OBTAINED
(IN %) _
PRICE INDEX(1978 = 100) 4,554.9
SHORT-TERMADJUSTMENT 4 -35% -24.5% -59% -40%
(IN %)
PRICE INDEX 4,554.9 774.3 1,913.0 0 227.7(1978 = 100)
LONG-TERMADJUSTMENT 4 - -83% -58% -134.6% -95%
(IN %)
INFLATION RATE +50.5% +8.5% +21% No more No more(ANNUAL GROWTH) inflation Inflation
AFTER ADJUSTMENTS (+2.5%)
After deduction of monetary emission due to the annual variation in Intemational Monetary Reserves (IR), whose size is exogenous.2/ Part of additional revenues used to compensate the impact of the price adjustment costs on low-income households.3/ Memo item: GDP 1991 = 12,149.1 bn current sucres (p).4 Residual inflation is due to the monetary consequences of the accumulation of International Reserves. In the long term, these monetary consequences
should be offset.

90 Ecuador: Energy Pricing, Subsidies and Interfuel Substitution
C. Results of the Elimination of Oil Subsidies
8. The removal of oil subsidies would result in a 111 bn Sucre fiscal surplus. This wouldlead to a 77 per cent reduction in the domestic component of monetary emission and, mutatisrnutandis, a successive decrease from -35 to -83 per cent in the general price index. The 1991simulation shows that inflation would have fallen from 50 per cent to the much more acceptablelimit of 8.5 per cent. In fact, this reduction of inflation will be more profitable to low-incomehouseholds in terms of increase in real income and purchasing power, than the revenues savedfrom having subsidized prices on oil products such as gasoline or LPG. The monetary anddeflationary impacts could even be more important. In fact, implicit subsidies on petroleumprices were estimated for 1991 between 342 Mio US$ (low production scenario) and 464.7 MioUS$ (high scenario). Here, only the low production scenario (342 bn subsidies) was considered.Economic measures proposed are to bring all prices to their economic levels. Simulations weremade under this assumption.
D. Results of the Elimination of Power Subsidies
9. Similarly, elimination of 233 billion sucres in subsidies in the power subsector in 1991would result in a 58 per cent reduced inflation. This result is important compared to the size ofthe power sub-sector in terms of GDP. Figures for one sub-sector are given for ease ofcomprehension, since price deregulation in only one sub-sector would lead to massive interfuelsubstitution and factor reallocation process (and therefore, these partial impacts would not takeplace).
III. DETERMINATION OF THE FISCAL DEFICIT
Additional Public Revenues
10. The oil and power subsectors are state property, under the monopolistic control of publicenterprises. Non-Financial Public Sector revenues will increase by the same amount as oil andpower subsidies are cut, since oil and power revenues are assigned by law to the public sector(not necessarily the public enterprises as Petroecuador's income is largely independent of theprices at which its products are sold domestically). The Ecuadorean Public Sector receives thegross revenues of public enterprises after deduction of retail margins. According to law,Petroecuador must deposit all of its revenues at the Central Bank, which in turn distributes themaccording to the rules of earmarked revenues, including those to be received by the company (tocover its costs). Thus, the financial results of Petroecuador are net results for the State. Theseresults assume essentially no reduction in consumption (although if that were to happen, higherexport sales would offset lower domestic sales), and no drastic increase in the operating costs ofsector enterprises.
11. Total subsidies that can be recovered (under the low estimate) are S/575 billion for 1991,and S/775 billion under the high estimate. The calculation of electric power subsidies was basedon the ratio of US$0.041 subsidy per kWh consumed, reflecting the long-run marginal coststructure (LRMC) of UScent8.31 and UScent6.36 per kWh. Total electricity consumption

Annex 4: Elimination of Oil and Power Subsidies 91
amounted to 5,260.3 GWh in 1991, requiring a S/233 billion subsidy ". The oil subsidy. atUS$11.5 per barrel, was calculated as potential additional income per domestic barrel, that is, thebalance between the opportunity cost (US$15/barrel in 1991) and the implicit price of domesticcrude entering the refinery (US$3.5/barrel). The low estimate of total oil subsidies for 1991 wasabout S/342 billion'2 .
12. The ratio of oil subsidies to total Non-Financial Public Sector (NFPS) oil revenues(exports and domestic sales) declined during the current period (1988-1991) as oil prices werefalling and as exports increased comparative to domestic sales. Table 3 demonstrates that forevery US$ increase in the price of a domestic barrel, oil revenues of the NFPS would haveincreased by approximately 0.6% of GDP in 1990, against only 0.3% in 1991. However, in thelong run (after 1996), exports will decrease relatively to domestic demand since oil output willthen start to decline (Table 4).
TABLE 2ECUADOR - Estimates of Oil and Power Subsidies. 1991
(Billions of Sucres)
1991 Oil Prices Power Oil and (After SocialSubsidies Prices Power Mitigation)
Subsidies Subsidies
High Estimate S/493 bn S/280 bn S/775 bn (S/520 bn)
Low Estimate S/342 bn S/233 bn S/575 bn (S/383 bn)
(2.87% GDP) (1.9) (4.7) (3.2)
Source: World Bank estimates and INE. The low estimates area used in this econometricanalysis.
13. The ratio of oil subsidies to total Non-Financial Public Sector (NFPS) oil revenues(exports and domestic sales) declined during the current period 1988-1991 as oil prices werefalling and as exports increased comparatively to the domestic sales. Table 3 demonstrates thatfor every US dollar increase in the price of a domestic barrel, oil revenues of the NFPS wouldhave increased by approximately 0.6 per cent of GDP in 1990, against only 0.3 per cent in 1991.In the long run however (after 1996), exports will decrease relatively to domestic demand, sinceoil output will then start to decline (Table 4).
The definitive LRMC structure of 8.31 and 6.82 UScents/kWh leads to an average subsidyper unit consumption of 0.050 US$/kWh. This represents a subsidy level of US$263million. Calculations are based on a subsidy level of US$215.6 million. In both cases, foroil and power, we have referred to the low estimate, to be sure that proposed impacts arenot exaggerated.
12 A higher estimate of US$464 million was calculated by INE (1992, see Annex). Thisamounts to 495.3 billion Sucres at the average intervention and free market exchangerates of S/1,067.5 for US$ in 1991.

92 Ecuador: Energy Pricing, Subsidies and Interfuel Substitution
TABLE 3ECUADOR - Oil Subsidies and Oil Revenues, 1988-1991
1988 1989 1990 1991
Oil Revenues 233.2 479.0 955.3 1,093.4
Implicit Oil Subsidies 116.6 217.0 354.5 341.8
Subsidies as percentage 50.0% 45.3% 37.1% 31.1%
of Revenues
Source: Ministry of Finance and World Bank calculations.
TABLE 4Projected Non-Financial Public Sector Oil Revenues for 1991-1998 1/
(Percentage of GDP)
1990 1991 1993 1994 1996 1997 1998
Total NFPS 26.4 26.2 25.4 24.5 24.0 23.3 22.6
Revenues
Oil Revenues 11.4 9.1 9.2 8.4 7.8 7.2 6.5
.From Domestic 1.8 1.7 1.8 1.8 1.8 1.7 1.7
Products
|.From Exports 9.7 7.2 7.4 6.5 6.1 5.4 4.8
1/ Projections are based on constant real world prices of petroleum prevailing in 1991.
Source: Ministry of Finance
Situation of Public Expenditure
14. Oil and power revenues are largely assigned to the public sector. However, the
immediate effect of the elimination of subsidies on the fiscal deficit will depend on the amount
of related public expenditures. Extra-budgetary allocations ensure that increased oil revenues
translate automatically into somewhat higher expenditures (through earmarked funds and through
the investment budget of PETROECUADOR). However, this automatic effect would be limited
to the short-run, if increases in expenditures matching the increased revenues were deliberately
avoided by the Government. In fact, an Oil Stabilization Fund has been instituted, which could
be used to sterilize the oil windfall, thus contributing to macroeconomic stability.

Annex 4: Elimination of Oil and Power Subsidies 93
Determination of the Non-Financial Public Sector Deficit
15. The best estimates of the NFPS and Quasi-Fiscal Deficits, as well as the consolidatedsector accounts are presented in Tables 5 to 7. These estimates are based on data from BCE,Minfin, IMF and World Bank repGrts. A number of qualifications and definitions required inthese estimates are not mentioned here as not being germane to the objective of this exercise.
TABLE 5
ECUADOR - Trends in Available Financing of Non-Financial Public Sector Deficit(Percentage of GDP)
1986 1987 1988 1989 1990 1991
Deficit -5.1 -9.6 -4.9 -0.9 +0.8 -1.6
Financing Requirements 5.1 9.6 4.9 0.9 -0.8 1.6
External Finncing 5.5 3.2 1.7 2.1 -2.6 -1.9
Drawings 7.7 7.5 4.9 5.0 3.5 4.1
Amortizations -2.2 -4.3 -3.2 -3.5 -6.1 -6.0
External Arrears - 4.5 1.3 3.5 5.1 4.0
Domestic Financing -0.4 1.8 1.9 -1.6 -3.3 -0.5
Central Bank -0.5 2.4 1.4 -1.3 -3.6 -1.1
Other Banks 0.4 -0.4 -0.2 0.4 0.1 0.1
Other -0.3 -0.2 0.7 -0.3 0.2 0.5
Source: Central Bank and Ministry of Finance.

94 Ecuador: Energy Pricing, Subsidies and Interfuel Substitution
TABLE 6
ECUADOR - Central Bank's Quasi-Fiscal Deficit, 1989-1990
19 ,9 1290
Million (%) of Million (%) ofSucres GDP Sucres GDP
A. Domestic Result (+) 47.557 0.91 (+) 65.439 0.88
Interest-bearing Assets (30.795) 0.59 (52.607) 0.71
(Credit to Private Sector) (16.761) 0.32 (12.832) 0.17
(Credit to Public Sector) (-) 17.760 -0.30 (-) 29,600 -0.40
Interest-bearing Liability l
B. External Result
Interest on Inter. Resev. (+) 11.448 0.22 (+) 29,847 0.40
Inter. Due on Ext. Debt (-) 144.431 -2.76 (-) 227,783 -3.05
Other Income:
Transaction Tax (+) 33.379 0.64 (+) 35,000 0.47
Exch. Risk Sucretization (+) 18.672 0.36 (+) 24,700 0.33
C. Net Operating Costs (-) 20.434 -0.39 (-) -25,420 -0.34
D. Quasi-Fiscal Result (-) 71.570 -1.37 (-) 163,656 -2.19
A+B+C
Source: Banco Central del Ecuador, World Bank

Annex 4: Elimination of Oil and Power Subsidies 95
Table 7: Consolidated Public Sector Accounts, 1986-1991(Billions of Sucres)
1986 1987 1988 1989 1990 1991
A. Non-Financial Public Sector
Oil Revenuel/ 115.5 107.0 233.2 479.0 955.3 __
Non-oil Revenue 314.6 409.6 669.6 1315.9 1957.3 __
(1) Total Revenues 430.1 516.6 902.8 1794.9 2912.6 3851.2
Non-interest current expenditures 332.9 476.2 708.7 1116.4 1756 2454.1
Interest payments 54.7 86.8 168.3 308.3 442.7 643.9
(2) Total current expenditures 387.6 563.0 877.0 1424.7 2198.7 3098
Savings of NFPS
(1)-(2) 42.5 -46.4 25.8 370.2 713.9 753.2
(3) Capital expenditures 112.4 126.7 185.4 385.5 632.4 947.6
Accrual Deficit/Surplus
(1)-(2+3) -69.9 -173.2 -159.6 -15.3 +81.5 -194.4
Interest Arrears
1st source: CBE & MinFin __ 80.7 39.2 180.9 416.1 485.9
2nd source: World Bank2/ (--) (--) (190.2) (330.9) 481.4 643.9
Cash Fiscal Deficit from 1st -69.9 -92.4 -120.4 +165.6 +497.6 +291.5source (from 2nd source) (-69.9) (--) (+31.2) (315.6) (562.1) (449.5)
B. Quasi-fiscal Result
Domestic result __ __ __ 29.8 35.8
External result __ __ __ -80.9 -138.2
Operating costs __ __ __ -20.4 -25.4
Accrual Q-F. Def/Surplus -23.5 -46.6 78.5 -71.5 -163.6 -315.8
External interest arrears __ __ 67.8(p) 144.4 227.7 127.7(p)
Cash Q-F. Deficit/Surplus __ __ -10.7 +72.9 +64.1 -188.1
Memo items:
Net external interest __ __ __ -132.9 -197.9
C. Consolidated public sector
Accrual Fiscal Def/Surplus -93.4 -219.8 -238.1 -86.8 -82.1 -510.2
External arrears __ --3/ 107.0 325.3 643.8 613.6
Cash Fiscal Deficit/Surplus -131.1 +238.5 +561.7 +103.4
Source: Ministry of Finance & BCE
1/ Including revenues distributed to public enterprises.2/ Large discrepancies between sources 1 and 2, is mainly due to the exchange rate sucre/US$.3/ Lack of adequate statistics on the external interest areas.
The consolidated fiscal deficit and the impact of the elimination of subsidies
15. The consolidated fiscal deficit is presented in Tables 6 and 7 as a percentage of GDP andin nominal amounts, respectively. The impact of increased energy prices on the overall fiscalresult will be substantial on a cash basis. First, because on a cash basis NFPS fiscal adjustments
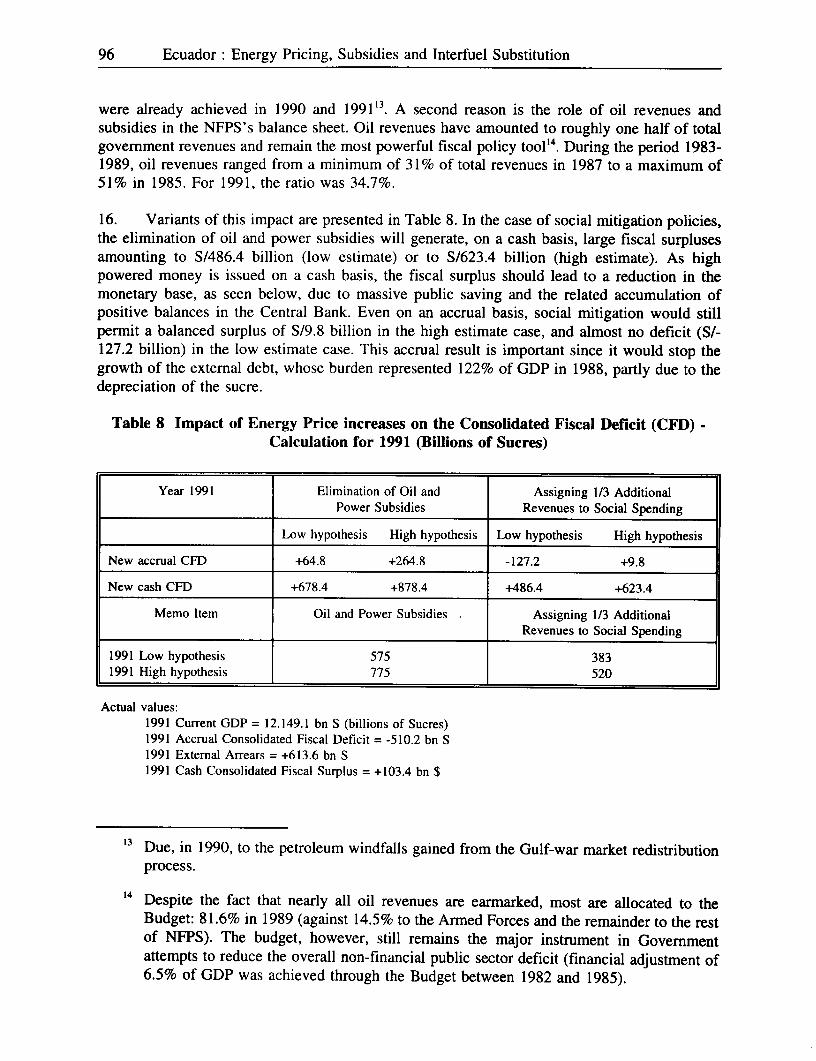
96 Ecuador: Energy Pricing, Subsidies and Interfuel Substitution
were already achieved in 1990 and 199113 . A second reason is the role of oil revenues andsubsidies in the NFPS's balance sheet. Oil revenues have amounted to roughly one half of totalgovernment revenues and remain the most powerful fiscal policy tool'4 . During the period 1983-1989, oil revenues ranged from a minimum of 31% of total revenues in 1987 to a maximum of51% in 1985. For 1991, the ratio was 34.7%.
16. Variants of this impact are presented in Table 8. In the case of social mnitigation policies,the elimination of oil and power subsidies will generate, on a cash basis, large fiscal surplusesamounting to S/486.4 billion (low estimate) or to S/623.4 billion (high estimate). As highpowered money is issued on a cash basis, the fiscal surplus should lead to a reduction in themonetary base, as seen below, due to massive public saving and the related accumulation ofpositive balances in the Central Bank. Even on an accrual basis, social mitigation would stillpermit a balanced surplus of S/9.8 billion in the high estimate case, and almost no deficit (S/-127.2 billion) in the low estimate case. This accrual result is important since it would stop thegrowth of the external debt, whose burden represented 122% of GDP in 1988, partly due to thedepreciation of the sucre.
Table 8 Impact of Energy Price increases on the Consolidated Fiscal Deficit (CFD) -Calculation for 1991 (Billions of Sucres)
Year 1991 Elimination of Oil and Assigning 1/3 AdditionalPower Subsidies Revenues to Social Spending
Low hypothesis High hypothesis Low hypothesis High hypothesis
New accrual CFD +64.8 +264.8 -127.2 +9.8
New cash CFD +678.4 +878.4 +486.4 +623.4
Memo Item Oil and Power Subsidies . Assigning 1/3 AdditionalRevenues to Social Spending
1991 Low hypothesis 575 3831991 High hypothesis 775 520
Actual values:1991 Current GDP = 12.149.1 bn S (billions of Sucres)1991 Accrual Consolidated Fiscal Deficit = -510.2 bn S1991 External Arrears = +613.6 bn S1991 Cash Consolidated Fiscal Surplus = +103.4 bn $
'3 Due, in 1990, to the petroleum windfalls gained from the Gulf-war market redistributionprocess.
14 Despite the fact that nearly all oil revenues are earmarked, most are allocated to theBudget: 81.6% in 1989 (against 14.5% to the Armed Forces and the remainder to the restof NFPS). The budget, however, still remains the major instrument in Governmentattempts to reduce the overall non-financial public sector deficit (financial adjustment of6.5% of GDP was achieved through the Budget between 1982 and 1985).

Annex 4: Elimination of Oil and Power Subsidies 97
IV. MEASUREMENT OF THE MONETARY IMPACT
Empirical Preliminaries
16. The consistency between fiscal deficits and other macroeconomic targets can be judgedby looking at the Government Budget's constraint. This constraint says that the sum of the non-interest deficit and the interest bill on foreign and domestic debt is equal to the sum of financingfrom all sources. Fiscal deficits can be financed in three ways: issuing external debt, issuinginterest-bearing internal debt, and obtaining monetary financing, which is monetary emission
17. The first approach to the monetary financing is on the demand-side. Expendituresdemand of the public sector (all government entities along with the Central Bank) must becovered as follows:
(1) CFD = EF* + DCg + DLgwhere:CFD = consolidated fiscal deficit, on an accrual basis
= D + iB + i*(B* - IR)e, as calculated in Table 7 15
DCg = Central Bank advances to the public sector = the monetaryfinancing.
DLg = Loans of the domestic banking system to the government andpublic entities. DLg is the domestic debt. DLg equal privatedeposits short of the loans to the private sector:
DL = D(l-m) - Lpwhere D are private deposits.
EF* = external financing, which is the sum of voluntary external financing(VEF) and of interest arrears (EXA) or involuntary financing. EF*is thus the accrued external debt. EF* is exogenous.
(2) EF* = VEF + EXA
Given the lack of private domestic resources (DLg decreased as deposits D were under-remunerated) and the sharp decrease in the net voluntary external borrowing (VEF was -2.6 %of GDP in 1990 and -1.9 % in 1991, as shown in Table 5), the Ecuadorean Government askedfor monetary creation (DCg) as the principal method of financing the fiscal deficit. However,monetary emissions were complemented by the accumulation of external-interest arrears. Between1987 and 1991, impacts on inflation, economic growth and balance of payments have beenlessened by the fact that Ecuador was granted grace periods on its external debt. Deriving the
IS See Table 7, where:
D = non-interest deficiti (i*) = nominal interest rate on domestic (or foreign*) debtB (B*) = domestic (or foreign*) debte = nominal exchange rateIR = international exchange reserves

98 Ecuador: Energy Pricing, Subsidies and Interfuel Substitution
relation between the fiscal deficit and money creation should thus be performed on a cash basis.The consolidated fiscal deficit must be made net of external arrears (EXA). From demand-equation (1) and identity (2) we can derive that:
(3) CFD = (VEF + EXA)* + DCg + DLgrearranging:(3') CFD - EXA* = VEF* + DCg + DLg
18. The second approach to the monetary financing -i.e. to money creation - is on the supplyside. First, the Central bank issues base money (H) to cover credits to the government (DCg) andto the private sector (CPS), and to cover the Central Bank's accumulated profits or net worth(NW). It is the endogenous component of monetary emission.
In a small and open economy, monetary emission will also result from the accumulationof international reserves (IR *) due to the surplus of the balance of payments 16. It constitutes theexogenous component of the monetary emission. The supply-equation of base money yields:
(4) H = DCg + IR*e - NW + CPSwhere:H = high powered money or base money (B)
mD + (c + m(l-c)). Mwhere: M = MI = f (Price P, domestic interest id, Y)
D = private deposits = f (P, id, Y)m = reserve ratio on deposits Dc = currency/MI ratio
IR*e = international reserves IR*, revaluated at the current exchange ratee
NW = the Central Bank's profit counterpart.
Central Bank's profits (NW) consist of interest earnings on net foreign assets and internationalreserves, NW = i*IR*e. However, interest on external reserves provided 0.2 per cent of GDP in1989, that is Sucres 11,448 Mio (see Table 6). Thus, income on external operations are negligiblefor the Ecuadorean Central Bank. So we can simplify:
(4') H = DCg + IR*e + CPS
18. In most developing countries, however, the exogenous monetary emission will reflect therevaluation of reserves (IR*e), without any stock movement, in periods of chronic devaluationof the domestic currency. The origin of monetary emission could be external and yet serve adomestic purpose: financing, in Ecuador, a devaluation (e) of 3 % to 8.5 % per month. A viciouscircle is initiated, leading from excess monetary emission to inflation and thence devaluationalong with related revaluation of international reserves, leading itself to more monetary emission.
16 Large surpluses of the balance of payments were at play in Ecuador in 1989 and 1990.These amounts of USD 382 million and USD 402 million, as shown in Table 10, were theorigin of exogenous monetary emission for these respective years.

Annex 4: Elimination of Oil and Power Subsidies 99
The model
19. Deriving the relation between the fiscal deficit, money creation and debt will thus beginwith the following accounting balances of the Central Bank:
(5) DCg = H - IR*e - CPS (from 4')(6) DCg = CFD - EXA* - VEF* - DLg (from 3')
substituting (5) within (6) yields,
(7) H - IR*e - CPS = CFD - EXA* - VEF* - DLg
VEF* and DLg were subject to constraints and insignificant over the period 1987-1991 (issuingStabilisation Bonds was -17.7 billions of Sucres in 1989). Eliminating these values yields:
(8) ME -IR*e = H - IR*e = CFD - EXA + CPS
Equation (8) as it stands, although, no more than accounting, supports with evidence theeconometric simulation to come.
Table 9 ECUADOR: COMPARISON BETWEEN BALANCE OF PAYMENTS SURPLUSAND MONETARY EMISSION DUE TO RESERVES ACCUMULATION
Units 1987 1988 1989 1990 1991
Commercial surplus of the Mio USS -33,00 619,00 661,00 1003,00 644,00balance of payments .
Current balances Mio USE -1124,00 -536,00 -514,00 -166,00 -4,00
Capital balances Mio USS 1036,00 517,00 896,00 568,00 630,00
International Reserves Mio US$ -88,00 -19,00 382,00 402,00 163,00accumulation (IR 1/
Ir x E (official exchange bn Sucres - -3,70 148490 156570 245.30
Part of monetary emission 4/due to ir accumulation in bn Sucres 54,20 1478 155,90 245,50the Central Bank 3/
Global money emission bn Sucres - 132,40 190,40 294,70 425,00(ME) % 0,00 77,60 53,00 57,60External origin of ME
Memo item: Sucres/ 95,00 194,45 77,60 390,00 390,00Official exchange rate 2/ USS
Source: Banco Central Del Ecuador
1/ Excluding revaluation adjustments2/ "Mediante Decreto N° 50 de agosto 30 de 1988, se fijo la tasa oficial de cambio en S/390,00 por d6lar, que rige dnicamente para
efectos contables en el balance del Banco Central" (BCE, Boletfn n' 15 de 1991)3/ BCE, Memoria annual 1990,: "corresponde a cambio contable".4/ BCE, idem: "Al 31 de diciembre de 1990, la emisi6n monetaria registr6 un saldo de 294,7 billiones de Sucres. La variacion absoluta
en el dinero primario, tiene su origen externo en 155,9 billiones de Sucres, por el incremento de la Reserva Monetaria Intemacional".

100 Ecuador: Energy Pricing, Subsidies and Interfuel Substitution
Econometric Results
20. In equation (8), the consolidated fiscal deficit (CFD) is calculated on a cash basis.However, nominal data on external arrears (EXA) are absent from the statistics. (Moreover,available percentages, in terms of GDP, are sketchy and often arbitrary or questionable, and datafrom the Ministry of Finance or from IMF-World Bank differ substantially). To solve thisproblem, external arrears will enter the regression under the form of a 'dummy' variable, withzero-values before 1987 and relative-values from 1987 to 1991. The same conclusions apply tothe CPS values (Credit to the Private Sector): National Accounts and IMF data differ in coverage,precluding consistent comparisons. Figures were thus replaced by a broken trend, which alsoprovided for the March 1987 earthquake and the stabilisation policies of 1988-1989. Severalequations were tested. The best fitted relation is:
(9) (ME - IR*e) = ao + al CFD + a2 trend (CPS) - a3 EXA(al > 0) (a2 > 0) (a3 <0)
The coefficients al and a3 are the semi-elasticities of monetary financing with respect to changesin the cash consolidated fiscal deficit (accrual deficit minus arrears); al is expected to bepositive; a3 negative since in case of involuntary additional external financing (i.e. externalarrears) money emission will be complemented and then reduced. The coefficient a2 should bepositive since additional credit to private sector increases money base Ml. The resulting equationyields:
(10) (ME - IR*e) = +5,128 - 0.45 (CFD) + 543.0 trend(CPS) - 11,462.2EXA
(0.07) (187) (3,667.2)
(R2 = .84 32 observations; 29 degrees of freedom. The model isquarterly distributed from 1-1984 to IV-1991. Trimestrialisation are calculated upon the Lismanand Sandee method)
21. The results show that both fiscal deficit (CFD) and external arrears (EXA) have a strongand significant impact on the endogenous money emission (ME-IR*e): global elasticity is highwith respect to cash consolidated fiscal deficit. Signs of the coefficients are as expected : al ispositive since CFD enters the regression with negative values (-al . -CFD > 0). Errors are notautocorrelated, multicollinearities are weak.
Monetary Impact Simulation
22. Simulation is based on the scenario that eliminates the whole oil-and-power-subsidies for1991 (575 billions of Sucres). It brings an equivalent additional amount in public revenues. Underthis scenario, the consolidated fiscal deficit (CFD) disappears as a whole (on an accrual basis),coming from a gap of -510.2 bn Sucres to a fiscal surplus of +64.8 bn Sucres (the absolutevariation is -112.7 as compared with the initial deficit). The magnitude of the monetary impactconsecutive to the restoration of the above fiscal surplus is calculated using equation (10).Calculation is performed on the domestic or endogenous monetary emission (ME-IR*e), i.e. thepart of the monetary emission covering public gap. For 1991, calculation shows that the -112.7

Annex 4: Elimination of Oil and Power Subsidies 101
absolute variation in fiscal deficit yields to a 129.5 per cent reduction in (ME-IR*e), whichrepresents a 1.15 elasticity. Variants are presented in Table 1.
23. If one-third of the additional public revenues are used to finance social mnitigation policies,thence benefits will only be 383 bn Sucres and consolidated fiscal deficit (CFD) will be -127.2bn Sucres (if compared with the initial deficit, this reduction = 75 % in absolute figures).Lowering the fiscal deficit will result in 86.4 per cent absolute reduction in the endogenousmonetary emission (ME-IR*e). Both cases (with or without social mitigation policies) demonstratea strong 1.15 elasticity between endogenous monetary emission and fiscal deficits. Monetaryemission reduces more than fiscal deficit does. There is a multiplicative virtuous effect of cuttingdown public deficit, in a debt situation.
V. MEASUREMENT OF THE DEFLATIONARY IMPACT
Empirical preliminaries .-
24. Does the monetary impact (consequent to setting prices at their economic level) translateitself into a deflationary impact of same magnitude ? Inflation is a complex process. However,in case of fiscal deficits coupled with constant ratios of debt to output, the public financeapproach to inflation becomes relevant to explain short-run as well as long-run sustainedinflation. Empirically, a strong relation is observed in Ecuador between inflation and monetaryemission. However, this relation can be dampened or accelerated by business factors. Second,general price level reacts to the global monetary emission (Ms), not specifically to the fiscalmonetary financing (the endogenous Ms-IR). Monetization of international reserves (IR) isimportant too. A technical appendix to this chapter is attached, addressing these two problems"7 .
Monetary financing of the external debt
25. The Banco Central del Ecuador often used to monetize its international reserves as anindirect way of financing the public external debt. In case of such bookkeeping practice, wecould assimilate the global monetary emission (Ms) to the addition of direct and indirect (hidden)fiscal monetary financings:
(11) Ms = (Ms-IR) + IRwhere:(Ms-IR) = monetary financing of CFD = direct flnancin2IR = hidden monetary financing of quasi-fiscal deficits =
indirect financing (and exogenous monetary emission)
Identity (11) means that, in 1988 and 1991 for example, most of the monetary emission (Ms) wasdevoted to finance the public sector (Table 9).
'7While many of the considerations in this appendix are not germane to the analysis of energysubsidies, they are attached for the sake for completeness, in case some readers may want to seehow equations were formulated and justified.

102 Ecuador: Energy Pricing, Subsidies and Interfuel Substitution
26. Impact of monetary emission (Ms) on inflation starts with the equilibrium condition onthe money market:
(13) Ms = Md= P . y . 1/v (P) (Friedman's quantity theory)= P . y . m/y (since v = y/m and dP/P = k)
Rearranging terms:P Ms . l/y . y/m
Where Md is the demand for nominal balances, m the demand for real balances, y the realincome, v the velocity of money, P the general price level. Econometric calculation demonstratesthat the above price equation'8 should capture most of the Ecuadorean money market realities:
(21c) In PRICE, = -4.84 + 1.151 In ME, - .054 In Trend(y),(.048) (.042)
where: PRICE is for P; Trend(y) for y; ME for monetary emission (Ms).t = 1-1986 to I-1992. From equation (21c) and identity (11) we can derive:
(22) In PRICE, = -4.84 + 1.151 In ((ME-IR*e) + IR*e) - .054 In Trend(y)t
where (ME-IR*e) is the monetary financing of the consolidated fiscal deficit; It is the internalor endogenous component of monetary emission.IR*e is the monetization of international reserves and the external or exogenous componentof monetary emission; (e) is the current exchange rate, (IR) the international reserves.
27. As (ME-IR*e) is referred to as the direct fiscal financing, and IR*e as the indirectfinancing, any variation in the fiscal deficit, in case of monetization, will affect the globalmonetary emission (Ms), and thence inflation (P), directlv via (ME-IR*e) and indirectly via IR*e.The direct price impact is a short-run impact, due to the monetization of the cash consolidatedfiscal deficit (CFD). The indirect impact, due to reserves monetization, could be assimilate to along-run impact since it occurs only under mutatis mutandis condition: if the current exchangerate (e) will be or not stabilised, or if the balance of payments surpluses will be or not sterilised.Lags will occur. The long-run inflationary impact is the consequence of the external debt of theCentral Bank (the accrued quasi-fiscal deficit), which is 50 per cent rescheduled external publicdebt.
Direct deflationary impact
28. Price simulation was performed for the year 1991. Various scenarios are presented inTable 1. Thereunder we envisage the case of putting all prices at their economic level. Theresults show that under this scenario the above-mentioned reduction of 129.5 per cent (ascompared with the initial level) in the direct financing of the fiscal deficit (ME-IR*e) will reduce
"See technical Appendix

Annex 4: Elimination of Oil and Power Subsidies 103
inflation as much as 59 %19. Price index will fall from +4,554.9 points (index level in 1991) to+1,822 points (simulated 1991 figure). Figures for inflation growth rate will reduce from +50.5% (actual 1991 rate) to a +20.2 % growth rate.
In case of social mitigation, the related 86 % reduction in the endogenous monetary emission(ME-IR*e) will lead to a direct deflationary impact in the order of 40 %. Price index will fallfrom +4,554.9 to +2,733 points.
Indirect or alobal deflationary impact
29. Global impact on inflation is the result of the whole monetary emission (Ms) or ((ME-IR*e) + IR*e). Global price impact is the addition of the direct and indirect impacts. Indirectimpact due to the monetization of international reserves IR*e, will performed only after directimpact, due to the financing of the consolidate cash deficit (ME-IR*e) has occurred and will bea long-run consequence of the direct impact. Taken solely, indirect impact does not make sense.20.In the same way, global price impact will be a long-run process, since involving "mutatismutandis" conditions. If easy to calculate, the global impact should nevertheless be envisagedwith caution.
30. The short-run or direct reduction of 59 % in the inflation level, will lead mutatis mutandisto lowering the local devaluation process or will allow for the sterilisation of the balance ofpayments' surpluses. Reserves monetization (IR*e) will be slowed or stopped. If the globalmonetary emission ((ME-IR*e) + IR*e) is eliminated as much as 100 %, simulation shows thatinflation (P) should be 'theoretically' reduced as much as 134 % from its actual 1991 level. Priceindex will fall from +4,554.9 points (actual index level for 1991) to 'zero' point (theoreticallyto a -1,548.6 index-point). Inflation growth rate should 'theoretically' be stopped. However,curing low-inflation take times.
31. In case of social mitigation policies - to give economic adjustments a human face - long-run adjustment of prices will be in the order of -95 % : price index should be reduced from+4,554.9 points (actual index level for 1991) to +227.7 points (simulated index-points for 1991).Inflation growth rate will fall from +50.5 % (actual 1991 rate) to +2.5 %, that is practically nomore inflation.
19 The remainder 41 % inflation are due to the monetization of international reserves: i.e. theindirect (or hidden) fiscal financing.
20 Separate calculations are not easy. The linear regression's coefficient al in equation (22) isreferred to as the elasticity of (P) with respect to variation in the whole monetary emission (Ms).Calculating the semi-elasticities for, and respective to internal and external components ofmonetary emission (Ms) asks for more complete statistical data, which were not available.

104 Ecuador: Energy Pricing, Subsidies and Interfuel Substitution
Discussion
32. Eliminating both the consolidated fiscal deficit and the monetization of the internationalreserves (after BCE had recovered its monetary functions) will stop the monetary emission. Inequation (22) Ms = ((ME-IR*e) + IR*e) = 0. Thence, equation (22) yields:
(23) In PRICE = -4.84 -.054 In TREND(y)(aO < O) (a2 < 0)
Depressed business factors lead in 1991 to a negative price index (-1,548.6) or at least to a zeroprice index in equation (23). It means that the real Ecuadorean economy is deflate: the privatesector, referred to as the productive sector, is depressed because unremunerated. Resources aremis-allocated. Demand for money (m) is falling to compensate for expected high fiscal-relatedinflation.
33. In the long-run, some of the direct and indirect sources of inflation could be offset as arational consequence of better resources allocation. First, the elimination of subsidies should helpthe Banco Central del Ecuador (BCE) to recover its monetary policy function. In fact, a largefiscal surplus could provide the Government with the ability to service its own externalindebtedness. Public external debt should thus be re-transferred to the Central Government. Thereis no reason why the BCE should continue to play a marked role in fiscal and financialintermediation. As the paper shows, the BCE does not need to run any deficit, if its only functionwere that of regulating monetary aggregates. In addition, the BCE should recover sufficientresources in order to regulate the monetary consequences of reserve's accumulation due tosurpluses of the balance of payments.
34. Reserve monetization is the other cause of inflation. In fact, two factors can offset themonetary consequences of the accumulation of international resources. First, the net accumulationof positive balances in the CBE by the Non-Financial Public Sector (NFPS) will compensate thebalance of payments' surpluses and the related increase in monetary base. Inflation will bereduced. As a result, domestic saving will increase, leading to additional sterilisation of highpowered money. Second the cure of inflation will restore Ecuadorean competitiveness.Depreciation of the local currency will be slowed, as will the related revaluation of the stock ofinternational monetary reserves. These virtuous circles should lead to successive reduction ofinflation within an interval between -60 % and -100 %.

Annex 4: Elimination of Oil and Power Subsidies 105
STATISTICAL APPENDIX
Table 10: ECUADOR - ELASTICITY OF PRICES WITH RESPECT TOMONETARY EMISSION, 1986-1991
(Annual growth rates in percent)
| (End-year values) 1986 1987 1988 1989 1990 1991
dPrices/Prices 27.3 32.5 85.7 54.2 49.5 49.0
dMe/ME 28.03 34.72 65.06 43.74 54.79 44.37
Epm = (dPlP):(dm/M) 0.97 0/93 | 1.31 1.24 0.90 1.10
Table II: ECUADOR-GDP, MONEY SUPPLY AND MONEYVELOCITY, 1986-1991
(bilions of sucres and ratios)
1986 1987 1988 1989 1990 1991
GDP 1,382.2 1,794.5 3,019.7 5,170.5 8,160.0 1 2,149.2
Money Supply (ml) 166.0 219.0 337.6 466.3 709.6 1,039.5
Ml/GDP ratio .12 .12 .11 .09 .087 .085
MI velocity 8.33 8.17 8.94 11.08 11.50 11.70
Table 12:ECUADOR - EVOLUTION IN DOMESTIC CREDIT,MONEY BASE,1986-1990
BCE's Domestic Credit(in percent of GDP) 1986 1987 1988 1989 1990 1991
Domestic Credit 15.61 13.88 9.28 7.55 5.91 4.94
Credit to public sector 1.53 3.42 3.82 2.78 2.09 1.67
Credit to financial sector 12.01 9.34 4.84 3 3.04 2.61
Credit to private sector 2.07 1.12 0.62 1.00 0.79 0.66
Monetary Base (% of GDP) 6.88 l7.49 6.99 5.85 5.79 5.10
Currency in circulation 4.31 4.47 4.27 3.33 3.48 3.15
Reserves | 2.58 | 3.02 2.72 2.52 2.30 1.95
ource: Banco Central Del Ecuador (BCE)
Table 13: ECUADOR - MONETARY EMISSION IN TERMS OF REAL GDP[ (Billions of Sucres) 1984 1987 1988 1989 1990 1991 1Monetary emission (Ms) 37.8 80.2 132.4 190.4 294.7 425.0
In % of real GDP 4.7 4.4 4.3 3.6 3.6 3.5

106 Ecuador: Energy Pricing, Subsidies and Interfuel Substitution
Annex 5
ESMAP/ PROGRAMA CONJUNTO PNUD / BANCO MUNDIALDE ASISTENCIA A LA GESTION DEL SECTOR ENERGETICO
INVESTIGACION SOBRE EL PRECIO DEL KEREX
Quito, Agosto 1992

Annex 5: Investigacion Sobre El Precio Del Kerex 107
INTRODUCCION
Esta investigaci6n responde a un requerimiento del Sefior Ministro de Energia, para conocer elcomportamiento de la oferta, demanda y precio del k6rex.
La investigaci6n se realiz6 en base a documentos y estudios realizados anteriormente y a untrabajo de campo en las ciudades de Quito, Guayaquil y Cuenca, en las ferias libres y en lospuestos fijos de distribuci6n, mediante entrevistas a mas de 200 demandantes y a 12distribuidores.
Las conclusiones y recomendaciones responden a las vivencias de la investigaci6n de campo ya la informaci6n sistematizada, proporcionada por Petrocomercial.
Aspiramos que este documento contribuya al esclarecimiento del problema para la toma dedecisiones en beneficio del Estado y del bienestar de los consumidores.

108 Ecuador: Energy Pricing, Subsidies and Interfuel Substitution
RESUMEN EJECUTIVO
Esta investigaci6n fue realizada antes de la expedici6n de las medidas de incremento de preciosde los combustibles por lo que los precios de venta del kerex que se detectaron tienen comoreferencia los precios vigentes para esa epoca.
En primer lugar, es notoria la drastica reducci6n del consumo de kerex a nivel nacional, de 33.8millones de galones en 1988 a 16.2 en 1991, como consecuencia, por un lado, del propio sistemade comercializaci6n restringida y, por otro, del precio del gas licuado de petr6leo que se hamantenido en niveles bajos y que al mismo tiempo ofrece un elevado nivel de confort para losusuarios.
Bajo la perspectiva de que el kerex es un combustible estrechamente vinculado al consumo delos sectores populares, ha recibido elevados niveles de subsidio, pero parad6jicamente estossectores se benefician en una reducida proporci6n del mismo al altisimo subsidio extendido alGLP. El actual sistema de comercializaci6n consiste en la distribuci6n directa a comunidades,organismos publicos de salud, etc, por parte de Petroecuador y, en las ciudades, la venta alconsumidor final se localiza en las ferias libres y en puestos especificos.
En los centros de distribuci6n existe racionamiento, que en algunos casos restringe la venta a unmaximo de dos galones por persona. Este racionamiento ocasiona la formaci6n de largas colas,concurridas por grupos organizados que involucran la participaci6n de toda la familia, incluidosmenores de edad y que generalmente acaparan el producto para revenderlo a los consumidoresfinales a precios que oscilaban entre S/250 y S/650 / gal6n y aun mas, dependiendo de ladistancia y el grado de aislamiento del lugar. En el area rural y en areas marginales este productose comercializa aun en botellas, con costos que superaban con creces lo indicado. Estos preciosactualmente deben ser mucho mas altos, considerando que el precio referencial, que es el deldiesel 1, para la venta a las industrias es de S/1460/gal6n a partir del 3 de septiembre, en lugardel anterior de S/630, con lo que se ha ampliado mucho mas el diferencial de precio entre losdos productos y por consiguiente existe un mayor incentivo para desviarlo.
Por otra parte, al ser el precio del diesel 1 considerablemente mas alto que el del kerex, aun antesdel 3 de septiembre, se ha consolidado un mercado negro del producto, a traves del cual esteIlega a un precio mas bajo a las industrias, a la pesca artesanal y a otras actividades productivas.Existen evidencias de este fen6meno, asi, de acuerdo a la informaci6n obtenida en los centrosde distribuci6n de las tres ferias libres de Quito, por ejemplo, las personas que acceden alcombustible, adquieren tan solo un 45% del kerex disponible y que efectivamente es vendido enesos centros, con lo que se deduce que el remanente es desviado y vendido en sustituci6n deldiesel 1 y diesel 2. Igualmente, al obtener promedios de consumo de kerex por hogar,relacionando las ventas de Petroecuador, con el numero de hogares que consumen estecombustible, se encontr6 que apenas un 9% esta justificado en terminos de consumo residencial,pues mientras el numero de hogares que consumian el producto en 1990 represent6 solamenteel 13% de 1982, el consumo de aquel anio fue un 40% del de 1982. Para 1990 se obtiene unpromedio de consumo de kerex de 90 galones/mes/hogar, cifra que es exagerada, comparado conun promedio estimado de consumo real que no pasa de los 10 galones/mes/hogar.

Annex 5: Investigacion Sobre El Precio Del Kerex 109
De lo anterior se deduce que los beneficiarios del subsidio no son en general los consumidoresde bajos ingresos sino los intermediarios, y los usuarios finales del kerex que lo adquieren masbarato que el diesel 1 (o diesel 2).
Al momento actual se esta subsidiando dos productos sustitutos para uso dom6stico, el kerex yel GLP, lo que no es recomendable en terminos de una sana poiftica de precios, por lo que serecomienda reservar el kerex para el consumo de los grupos de bajos ingresos y con un preciorelativo inferior al del GLP, el que debera alcanzar su valor econ6mico en el corto plazo.
Por otra parte, se precisa reducir el margen entre el precio del kerex y el diesel 1. El nuevoprecio del kerex podria encontrarse en el promedio que actualmente estan pagando en realidadlos consumidores. La reducci6n del margen desestimularfa el acaparamiento y su venta a lossectores productivos. Paralelamente se debe liberalizar la comercializaci6n, de manera que sedistribuya nuevamente en las gasolineras y se multipliquen los puestos de distribuci6n en lasareas marginales de las ciudades y en el area rural, para desestimular el acaparamiento,permitiendo que el subsidio produzca un real beneficio social. En las areas rurales donde no hapenetrado completamente el GLP existen buenas posibilidades de ampliar la comercializaci6n dekerex, en sustituci6n de la paja y la lefia, reduciendo danios ecol6gicos y reduciendo los costosen tiempo que significa para el usuario la recolecci6n de este ultimo producto.
No puede dejarse a un lado la aplicaci6n de polfticas sociales compensatorias, al mismo tiempoque se ejecute el incremento de precios del kerex, entre las que se encuentra el estimular la ofertade estufas eficientes de kerosene que ofrezcan mejores condiciones que las actuales y laaplicaci6n de otros programas de educaci6n, salud, capacitaci6n, empleo temporal, etc.
PRECIO ACTUAL DEL KEREX: RESULTADOS RELEVANTES DE LAINVESTIGACION DE CAMPO EN LAS CIUDADES DE OUITO, GUAYAQUIL Y
CUENCA
La presente investigaci6n se realiz6 durante las primeros dfas de agosto de 1992, antes de la tomade medidas econ6micas decretadas por el actual Gobierno, el 3 de septiembre del mismo afno.
Entre las medidas dictadas esta la relacionada con la elevaci6n del precio de los combustibles.Asi, los precios del diesel 1 y diesel 2 subieron de S/.630/gal6n a S/. 1460/gal6n, el del GLP deS/.80/kg. fue reajustado a S/.235/kg.; en tanto que el precio del kerex se congel6 en S/.60/gal6n,anunciandose su futura desaparici6n del mercado.
Bajo los actuales precios, el diferencial entre el precio del kerex y su sustituto, el diesel 1, se haampliado sustancialmente, pues el precio del primero representa apenas el 4% del precio delsegundo, lo que estarfa incentivando en mayor medida el desvfo del kerex con fines diferentesal del domestico, y al mismo tiempo asegurando mas elevados margenes de ganancia a losintermediarios que participan en la comercializaci6n del producto y a los consumidores finales,artesanos, industriales, pescadores, que lo compran a precios mas bajos que el diesel 1.
Las primeras indagaciones realizadas para establecer los reales beneficiarios del subsidio al kerexen las ciudades de Quito, Guayaquil y Cuenca dieron lugar a m6ltiples inquietudes y

110 Ecuador: Energy Pricing, Subsidies and Interfuel Substitution
cuestionamientos que exigieron modificaciones en la estrategia de investigaci6n. En una primerainstancia, aparecia como suficiente la investigaci6n de campo en los sitios de distribuci6n oficialdel combustible, especialmente ferias libres, con el prop6sito de poder determinar el numero deusuarios, la cantidad demandada y el uso para el que seria destinado el kerex. Sin embargo, laexperiencia demostr6 que los datos proporcionados eran s6lo parcialmente ciertos. Este hechoescondia un fen6meno subterraneo tan propio de los sectores marginados y/o informales que sehan desarrollado prolificamente en anios recientes en el medio urbano del pais. Asi, las denunciasrealizadas por varios de los consumidores, sumadas a la informaci6n proporcionada porautoridades responsables de la distribuci6n de kerex y transportistas conocedores del medio,exigieron un seguimiento de los compradores, cuesti6n que permiti6 establecer la presencia degrupos organizados de especuladores que desviaban el combustible a prop6sitos ajenos a losdeclarados en la entrevista. Este desvio se realizaba a vehiculos y/o sitios cercanos a los dedistribuci6n en los que era entregado el k6rex a precios muy por encima del nivel fijadooficialmente.
El consumidor final en las ciudades esta constituido, por familias de modestos ingresos y porpequenios industriales, pequefios empresarios y artesanos que en su afan por reducir costos, sonabastecidos por un mercado negro del k6rex.
El mecanismo utilizado consiste en un convenio entre especulador y grupos familiares depequefios ingresos que son encargados de formar largas colas (frecuentemente por mas de 12horas) para acceder al combustible. El convenio termina con la entrega del k6rex al especulador,comprado supuestamente para consumo del hogar. Este ultimo paga por gal6n una cantidad deaproximadamente tres veces el precio oficial y tiene establecido contactos con los consumidoresarriba nombrados a los que se vendfa el kerex a un precio promedio no inferior a 250 sucres.
Pero estos pequefios empresarios -- entre los que destacan los pescadores artesanales de la costa --, no son los unicos destinatarios del kerex: la cadena se prolonga al abastecimiento de pequefiospueblos que circundan las ciudades que abastecen finalmente al medio rural, (para alumbrado)en donde el combustible es distribuido en botellas (generalmente de menos de un litro) por unprecio de hasta 300 sucres/botella, aproximadamente 15 veces superior al oficial.
CONSUMO DE KEREX EN LAS CIUDADES DE QUITO, GUAYAQUIL Y CUENCA
La investigaci6n realizada ha permitido determinar la brusca caida -- al parecer definitiva -- delconsumo de kerex a nivel nacional, debido fundamentalmente a cambios en los habitos deconsumo de la poblaci6n (sustituci6n con GLP), debido a su bajo precio y al mayor confort queeste producto ofrece. La informaci6n disponible no deja dudas al respecto: en 1988 el consumonacional alcanzaba a 33.8 millones de galones, que se reduce a 16.2 millones en 1991.
Las estadisticas mas recientes muestran que esa tendencia, se mantiene: la confrontaci6n delconsumo del primer trimestre de 1992 en relaci6n al primer trimestre de 1991 indica una caida,a nivel nacional, del 39.5%. En las ciudades investigadas, Quito, Guayaquil y Cuenca, elconsumo ha disminuido -- siempre comparando el primer semestre de 1992 respecto a su similarde 1991 --, en el 56, 47.5 y 24.7 por ciento respectivamente. Actualmente, el consumo en lastres ciudades es de aproximadamente 513 mil galones promedio/mes y representa el 62.3% delconsumo nacional. (Annex Table 23). Sin ser definitiva, la explicaci6n al parecer radica en el

Annex 5: Investigacion Sobre El Precio Del Kerex 111
desvio del k6rex a actividades a las que no esta destinado, como el creciente consumo en lapequenia industria y la pesca artesanal, que lo utilizan como combustible alternativo al diesel 1,cuyo precio es sustancialmente superior al del k6rex. (Annex Table 24).
DISTRIBUCION A NIVEL POPULAR
El kerex es un combustible estrechamente vinculado al consumo de los sectores populares. Enesta perspectiva, con el prop6sito de no afectar la economia de los hogares de menores ingresos,el k6rex mantiene altos niveles de subsidio gubernamental. Con la intenci6n de incentivar suconsumo, el Gobierno anterior aplic6 un programa de distribuci6n en las liamadas "ferias libres",donde se supone acuden a realizar sus compras las familias de bajos ingresos. Paralelamente seelimin6 la distribuci6n en las gasolineras, con la finalidad de evitar el desvio a la industria, ensustituci6n del diesel 1. Sin embargo, estos objetivos no se estan cumpliendo, al contrario, seha conformado un sistema de venta restringida que ha dado lugar al acaparamiento.
En la ciudad de Quito, semanalmente se realizan tres ferias libres en los barrios Gatazo, Mariny La Ofelia. Con el prop6sito de investigar la distribuci6n de kerex a nivel popular y determinarsi se esta cumpliendo el prop6sito social del subsidio al combustible, se destacaron grupos deinvestigadores a los tres sitios de distribuci6n, con los resultados que se observan en el AnnexTable 25.
De la informaci6n de este cuadro, se desprende que semanalmente se distribuyen, en los tressitios, 6600 galones. Sin embargo, menos de 3000 galones (es decir un 45.4%) son distribuidosdirectamente a los aproximadamente 400 demandantes que acuden a los sitios de distribuci6n.Desagregando esta informaci6n puede destacarse que a la feria de Gatazo asisten paraaprovisionarse de k6rex alrededor de 113 personas, 115 asisten a La Marin y 167 lo hacen a LaOfelia. Los volumenes de k6rex a los que tienen acceso estas personas (especialmente nifios) son1068, 1136 y 791 galones respectivamente en las tres ferias libres, que representan el 48.5, el47.3 y el 39.5% del total de combustible que se destina a los tres sitios indicados.
Cuando las personas que acuden, formando largas colas, a proveerse de kerex son preguntadassobre el uso que daran al combustible, se estima que aproximadamente el 69% responde que espara cocinar; el 12% lo destinara al alumbrado, el 7% lo utilizard para el calentamiento de aguapara bafios. En porcentajes menores, el k6rex serd utilizado en la fabricaci6n de cera para pisos(4%), para el aseo directo de pisos (2%), en labores de fundici6n (4%) y en otras actividades el2%. (Annex Table 25).
En funci6n del volumen que se destina a cada uno de los usos descritos, se encuentra que el31%, el 29% y el 18% se utiliza para "cocina", "banos" y fabricaci6n de cera, respectivamente.Las actividades restantes consumen volumenes menores (Annex Table 25).
Respecto a los precios de venta a nivel de tanqueros en las ferias libres, se obtuvo un promediode S/68/gal6n en las diferentes ciudades observadas. (Annex Table 26). Sin embargo, el preciopromedio de consumidor final es de S/337/gal6n con un rango que fluctua entre S/250 yS/650/gal6n, dependiendo de la ciudad y distancia en que se ubica el consumidor final.

112 Ecuador: Energy Pricing, Subsidies and Interfuel Substitution
ASPECTOS RELEVANTES DE LA INVESTIGACION
De acuerdo a la informaci6n obtenida en los centros de distribuci6n, las personas quedirectamente acceden al combustible adquieren menos de la mitad del k6rex disponible, vendidonormalmente en las ferias libres. Hubo que preguntarse, entonces, sobre el destino del diferencialentre el volumen total de kerex destinado a la distribuci6n (6600 galones) y el adquirido por losconsumidores (2995 galones).
De entrevistas a funcionarios responsables y a personas conocedoras y ligadas al mercado delkerex, pudo establecerse la existencia de un mercado negro o mercado secundario que distribuyeel k6rex a distintas actividades productivas que legalmente (al no ser destinatarias del subsidio)deberfan adquirir diesel 1 para sus actividades.
Debido a denuncias recibidas y al comentario generalizado sobre el desvlo del producto, se hizoun seguimiento de algunos compradores. Como resultado de esta especie de "pesquizaje" pudodeterminarse la veracidad de las denuncias presentadas, dandose casos -- los mas evidentes -- enlos que a muy corta distancia de los sitios de distribuci6n se hallaban ubicados otros en los queera entregado gran parte del combustible adquirido, cuyo volumen es dificil de cuantificar porobvias razones.
Esta realidad permite destacar los siguientes aspectos:
El numero de beneficiarios directos contabilizados en las ferias libres es mas bienreducido y s6lo representa un pequefno porcentaje de las familias de bajos ingresos,incluso en relaci6n con las residentes en los barrios perifericos donde se realizan las feriaslibres.
Alrededor del 80 por ciento del combustible destinado a beneficiar a las familias demenores ingresos de la ciudad -- de acuerdo a las investigaciones realizadas -- es desviadoa prop6sitos distintos a los originales.
Las investigaciones han permitido detectar la presencia de grupos de personas -vinculadas al mercado secundario - que acuden a comprar kerex a los tres sitios derealizaci6n de las ferias libres en Quito, utilizando familiares - frecuentemente nifnos -para que les guarden puesto en las "colas".
Las razones que explican este fen6meno son varias:
Las "colas" se forman en los sitios de distribuci6n, la noche anterior al de las ferias libres,situaci6n a la que en general no estan dispuestas las familias que requieren semanalmentede 2 o 3 galones de kerex, quienes prefieren comprar el combustible a los revendedores,a un precio mas alto sin movilizarse, compensando asf el costo del transporte desde otrobarrio o desde pueblos aledafios al sitio de distribucion, y el tiempo muerto de espera.
La diferencia significativa de precios entre el k6rex y el diesel 1, y la venta en unreducido numero de sitios, ha dado paso a la conformaci6n de un mercado ilegal osecundario, en el que se revende kerex a precios que fluctuan entre 250 y 650 sucres el

Annex 5: Investigacion Sobre El Precio Del Kerex 113
gal6n (Annex Table 26) dependiendo del lugar de venta, de su distancia del lugar originalde distribuci6n y del numero de intermediarios. La investigaci6n ha demostrado que lapoblaci6n mas castigada por este fen6meno es la campesina, a la que Ilega el kerex a unprecio aproximado de 500 sucres el gal6n y aun mayor en zonas distantes y aisladas.
El mercado secundario al que se hace referencia, tiene como sustento a grupos bienorganizados de especuladores que acaparan el kerex para su posterior venta al consumidorfinal, constituido por lo general por pequeiios industriales, familias que utilizan el k6rexcomo combustible y poblaci6n campesina para el alumbrado.
Se ha podido establecer que quienes conforman las "colas" para la compra del kerex,aunque declaren que sera utilizado en fines domesticos, en realidad lo adquieren conprop6sitos especulativos. En forma paralela, ha sido posible detectar que actualmente, enla ciudad de Quito, son muy pocas familias - con tendencia decreciente - las que aunutilizan cocinas a kerex. Explican este criterio generalizado -- dado por la experiencia -- de que las cocinas a k6rex, a mas de las molestias que causan, tienen una durabilidadmucho menor que las cocinas a gas (G.L.P.); ademas el costo del k6rex en el mercadosecundario es similar, para fines de cocci6n, al del gas licuado por lo que en la actualidaden forma generalizada se utiliza G.L.P.; la restringida comercializaci6n del k6rexdesincentiva su uso.
ESTIMACION DEL CONSUMO DE KEREX EN EL SECTOR DOMESTICO
Si se analizan los datos correspondientes a las ventas de kerex registradas porPETROECUADOR, se nota una gran diferencia con las estimaciones del requerimientode este combustible en el sector dom6stico del pais.
En efecto, de acuerdo a los resultados de los Censos de Poblaci6n y Vivienda, en 1982existian alrededor de 275 mil viviendas que utilizaban este combustible para la cocci6nde alimentos, habiendo disminuido esta cifra considerablemente para 1990, al registrarseun total nacional de aproximadamente 35 mil viviendas. Por su parte, las ventas de kerexal sector residencial en este mismo lapso, disminuyeron de 99.2 a 39.9 millones degalones, sin considerar las cifras correspondientes a las ventas a instituciones publicas.En terminos relativos, esto implica que mientras la cantidad de hogares que consumieronkerex en 1990 fue de tan s6lo el 13% del nuimero registrado en 1982, el volumen vendidode este combustible represent6 en 1990 el 40% del valor registrado en 1982 (AnnexTables 27 a 31), de lo que no puede deducirse que el consumo por familia ha aumentadopara 1990, sino que mas bien se esta produciendo un desvio a otros sectores, pues resultaimposible que el consumo por hogar se haya incrementado en mas de 4 veces durante esteperiodo de analisis .
Si se considera que el consumo especifico de kerex por habitante no supera los 2galones/mes, en los hogares que utilizan este combustible (segun datos de encuestasrealizadas en el sector), se estima que unicamente el 34.5% de las ventas realizadas en1982 correspondieron a la demanda del sector residencial, con tamaino promedio de hogarde cinco miembros.

114 Ecuador: Energy Pricing, Subsidies and Interfuel Substitution
Para 1990 la situaci6n es mucho mas crftica, pues de acuerdo a los datos reales obtenidos,el consumo por vivienda serfa de 94 galones por mes (205 gal./mes en la zona norte y 81gal./mes en la zona sur), es decir, mAs de 22 galones por habitante/mes. Con estas cifras,y si se considera el consumo estimado por habitante (2 gal./mes), resulta que durante esteafio solamente el 9% de las ventas realizadas se destinaron al sector residencial.
Durante 1991 y 1992 la situaci6n es similar. Las ventas de kerex en el sector domesticohabrfan disminufdo en un 62% en 1991, respecto al afio anterior, ubicandose en alrededorde 15 millones de galones. La estimaci6n del numero de hogares demandados en este aino(27 mil viviendas, de acuerdo a la tendencia intercensal), indica un requerimiento totalde 2.66 millones de galones, es decir, alrededor del 18% de las ventas contabilizadas. Sise relacionan las cifras de las ventas producidas en cada zona con el numero de hogaresque consumen este combustible, los promedios de 1992 indican consumos mensuales dealrededor de 140 y 22 galones/vivienda, para los distritos norte y sur, respectivamente,lo cual representa consumos especificos de mas de 7.7 galones/habitante/mes.
CONCLUSIONES OUE SE DESTACAN
En la actualidad, las familias con pequefios recursos, en favor de quienes se mantiene enprincipio el subsidio del kerex, no se benefician - sino en muy corta medida - del bajoprecio de ese combustible. En el mejor de los casos, el porcentaje de familiasbeneficiadas por el subsidio, no supera el 0.2% de los hogares quitefios y no es mayoral 1% de los hogares pobres de la ciudad. Esta realidad, con pocas diferencias, es similaren ei resto del pais.
Si la investigaci6n es concluyente en el sentido de que quienes realmente se beneficiandel subsidio al kerex son los usuarios industriales de k6rex que lo compran mas baratoque el diesel 1, ademas se beneficia a grupos bien organizados de especuladores yrevendedores, que en el proceso de comercializaci6n en el mercado secundario obtienenutilidades. Por otra parte esta actividad se ha constituido tambien en una estrategia desuperviviencia de los grupos de bajos ingresos que especulan con pequeiias cantidades delproducto.
Abandonando el ambito de las ciudades, se ha comprobado que un alto porcentaje deconsumo de k6rex en la costa ecuatoriana, se orienta a la pesca artesanal, que lo utilizacomo altemativa al diesel 1.
Por la marcada tendencia a la caida del consumo de kerex y su sustituci6n generalizadapor el G.L.P., a mds de las razones que se han anotado, es dificil pensar en un programaque se plantee la generalizaci6n del consumo de k6rex a nivel familiar en los barriospopulares del medio urbano del pais, al menos en las circunstancias actuales de preciorelativamente bajo del gas licuado. Parecerfa conveniente plantear una iniciativa similarque beneficie al medio rural ecuatoriano, en donde las pautas de consumo citadino agnno tienen arraigo, dado que un 57% de la distribuci6n se lo hace en comunidades delsector rural o a trav6s de 218 puestos de distribuci6n que representa el 57% del volumendistribufdo. Se necesita por tanto una mayor investigaci6n de lo que estA ocurriendo enel medio rural. (Annex Table 32).

Annex 5: Investigacion Sobre El Precio Del Kerex 115
Llama la atenci6n la irregularidad en la oferta de kerex en todas las ciudades, para juniode 1992 se habia proyectado una distribuci6n mensual de 538.000 galones a traves de lasferias libres, habiendose distribufdo solamente 125.847 galones, que representa solamenteel 23% de esa oferta te6rica. (Annex Table 33).
Para los hogares que auin consumen kerex en el medio urbano, su costo finalmente resultamas oneroso, pues en el mejor de los casos - dadas las condiciones de distribuci6n -deben pagar por un gal6n de k6rex 400 sucres, costo similar o muy cercano al de gaslicuado de petr6leo (5 galones de kerex significarfan 2000 sucres, en tanto que 15Kgr. deG.L.P. tiene un precio de s/1500 a domicilio) (a julio de 1992, aun mas alto al vigenteen ese mes).
ALGUNAS RECOMENDACIONES
Es necesaria la elevaci6n inmediata del precio del k6rex, reduciendo asf el enormediferencial existente con el diesel 1, a fin de ELIMINAR LAS RESTRICCIONESACTUALES AL SISTEMA DE COMERCIALIZACION, HACIENDO ASf MASDIFfCIL LA EXISTENCIA DE MONOPOLIOS PARA LA DISTRIBUCION. Debeexistir suficiente numero de distribuidores ubicados adecuadamente de conformidad conla localizaci6n de la demanda.
La distribuci6n deberfa volverse a las gasolineras, y en los lugares donde no existe elsuficiente numero de surtidores debera autorizarse distribuidores privados, en condicionesque atiendan eficazmente la demanda. Esto ultimo sera generalmente aplicable en Areasmarginales de las ciudades y en zonas rurales aisladas.
Paralelamente al incremento de precio se deben implementar programas socialescompensatorios, como la oferta de estufas de kerex mas eficientes que las actuales yactividades tendientes a mejorar las condiciones de educaci6n, saneamiento, atenci6nprimaria de salud, y pequenia infraestructura productiva a nivel local, apoyo a gesti6nmicroempresarial, microempleo, etc. A los pescadores artesanales se les deberfacompensar mediante proyectos tendientes a organizarse, a mejorar sus tecnicas de capturay procesamiento en tierra, asi como apoyarles en las fases de transporte ycomercializaci6n.
Sin embargo, por consideraciones sociales, el incremento del precio del kerex a nivel deldiesel 1 no puede hacerse de inmediato, por lo que se propone que en primera instancia,el precio se eleve al nivel del promedio que actualmente estAn pagando en la realidad losconsumidores, precio que refleja la voluntad de pagar de estos, dadas sus necesidades.Esto se debera hacer siempre y cuando se consiga la eliminacion de los actualesacaparadores. De lo contrario solamente se estaria garantizando margenes mas elevadospara ellos.
Por otra parte, es preciso considerar el precio del kerex, en el contexto de todos losprecios de los energeticos, en particular el GLP que es uno de los sustitutos. Este seencuentra todavfa subsidiado por lo que en un futuro debera alcanzar su valor econ6mico.

116 Ecuador: Energy Pricing, Subsidies and Interfuel Substitution
Si el incremento del precio del GLP en las magnitudes anotadas se produce,implicitamente se estarfa reservando al kerex como un producto orientado a los consumosde los grupos de bajos ingresos y con un precio relativo inferior al de aquel; puesto queno conviene en terminos de una sana poiftica de precios de los energeticos, el subsidiardos productos sustitutos como ocurre actualmente.
Una forma de superar las distorsiones que se vienen comentando, serfa la de ampliar eintensificar la distribuci6n de kerex a las parroquias aledafias a las ciudades y al mediorural en las que existe una mayor demanda y mejores posibilidades de desarrollo de unmercado potencialmente significativo. De otra parte, un sistema de distribuci6n libreeliminaria el desarrollo de actividades especulativas, permitiendo que el subsidio cumplasu prop6sito de beneficio social.
En los medios rural y campesino, en los que aun no se ha difundido el consumo de gaslicuado y/o kerex, seria conveniente y provechoso la comercializaci6n del kerex comocombustible alternativo y sustitutivo de la paja, la lefia y el carb6n, evitando mayoresdafios ecol6gicos provocados por la deforestaci6n.

Annex 5: Investigacion Sobre El Precio Del Kerex 117
DESCRIPCION DE LUGARES VISITADOS
Quito
En la ciudad de Quito se investig6 en las ferias libres de La Ofelia, Marian y La Gatazo, tambiense hizo una observaci6n en los puestos fijos de la Ermita y las Calles Bogota y Uruguay.
Las personas consultadas, en las tres partes, manifestaron que su residencia la tienen en: SanRoque, Turubamba, Hospital del Sur, Nanegal, La Tola, San Blas, Vicentina, Tejar, Monjas, VillaFlora, San Bartolo, La Marfn, San Juan, Recreo, Clader6n, Amaguafia, Solanda, Placer, Puengasf,Luluncoto, Atahualpa, Tanasa, Ferroviaria Baja, Guajal6, Calacali, Puembo y San Jos6 de Minas.Esto nos demuestra que los demandantes son de los barrios perif6ricos y de las parroquiasaledafias al Quito Metropolitano.
El destino que le dan al kerex, es para cocina, piso, alumbrado, mecanica, tratamiento de lamadera, calefacci6n bafios, industrializaci6n de la cera para pisos, etc.
En estos puestos se detect6 que existe una cadena de intermediarios que estan bien organizadosy se apoyan mutuamente para defenderse de futuros competidores o para obtener mayor cantidaddel combustible, ellos lo revenden a intermediarios que lo receptan en camionetas a s/1 50 o s/250el gal6n. Estos acaparadores distribuyen a su vez en algunas pequefias industrias y en lospueblos aledafios y los duefnos de tiendas pequenias a un precio que oscila entre 300 y 400 sucres.
Los pequefios intermediarios (primeros) tienen que hacer cola desde el dia viernes a las 16 horashasta las 10 horas del sabado en que se distribuye el kerex a sf70.
En los puestos fijos por el contrario venden el kerex y el diesel 1 a los siguientes precios 630,650 y 700 el gal6n, en estos lugares no existe aglomeraci6n ni agresi6n fisica, como sucede enlas ferias libres.
De los entrevistados, fue novedad el sistema que ha optado la directiva de una Comuna de SanJose de Minas. El presidente y el tesorero comprar generalmente 20 galones para distribuirlo alas familias de la comuna a un precio promedio de 200 sucres el gal6n. Estos sefiores sugirieronque el kerex en la zona rural deberia distribuirlo la Junta de Agua Potable, porque tienenexperiencia en el manejo de dinero publico, esta medida contribuiria a los objetivos que sepropone el Estado de beneficiar a los estratos pobres. Ellos confiesan tambien que las familiasde ingresos medios y altos prefieren abastecerse de diesel 1 en vez de kerex. El destino que ledan al combustible es para alumbrado, cocina y motores.
Cuando se les consult6 si estarian de acuerdo en que el kerex se expenda en las bombas el 90%se manifest6 positivamente.
La capacidad de los tanqueros que acuden a estos lugares es de 800 galones, pero s6lodistribuyen las tres cuartas partes, la diferencia no pudieron explicar, se infiere que esa cantidadla venden a los especuladores.

118 Ecuador: Energy Pricing, Subsidies and Interfuel Substitution
Guayaquil
En la ciudad de Guayaquil se investig6 el sistema de distribuci6n de kerex en Pascuales,Francisco Jacome y el recinto denominado "Tres Postes".
En Pascuales hay un dep6sito que expende permanentemente, mediante un convenio conPetrocomercial el distribuidor obtiene por concepto de arriendo del local la cantidad de S/60000mensuales, mas adecuaciones del inmueble. En este lugar se ven de entre 450 y 550 galones a300 personas en promedio por dia. (son compradores de todos los dias entre hermanos y madresde familia).
Las personas entrevistadas manifiestan que el kerex lo utilizan en la cocina (67%), en tratamientode la madera, (8%), en mecanicas, (5%), para desinfecci6n (6%), para quemar basura (7%), ypara alumbrado (7%). De las 300 personas que hicieron cola el dia sabado 8 de agosto, el 46%son menores de edad (13 - 16 afios), son quienes venden inmediatamente a uno de losintermediarios, o lo venden en el muelle a pequefias embarcaciones que se dedican a la pesca.Las personas mayores de edad protestan porque la medida del gal6n no es completa, de s/60.00.Este problema tambi6n lo comparten los choferes de los tanqueros que dicen que a ellos tambienlesentregan menos en el lugar de abastecimiento. (Los tanqueros reciben de Petrocomercial medidopor varilla).
En Francisco Jacome, lugar importante de distribuci6n, el Sefior Mancero, Director del Programade Distribuci6n del Kerex de Petrocomercial, en la provincia del Guayas, manifest6 "en base asu experiencia, que calcula que aquf el 80% de los compradores son revendedores, razon por laque se vende racionado, maximo dos galones por persona", en 6sta actividad de reventa participanpor lo menos 30 familias, cuya responsabilidad esta a cargo de los ninios y las mujeres.
En el Recinto "Los Tres Postes", hay un lugar de expendio controlado por Petrocomercial, previoconvenio con un representante de la poblaci6n quien esta encargado de distribuir a laspoblaciones rurales pero estos dfas no esta operando, porque los responsables manifiestan que elprograma esta paralizado hasta que el nuevo gobierno tome nuevas decisiones. En lugaresaledafios 5 kil6metros de este lugar expenden en tiendas 6 cobachas pequefnas a s/400 el litro,cuyos habitantes lo utilizan para alumbrado, quemar basura o como desinfectante.
En Guayas existen 63 convenios para distribuci6n en el sector rural. En cada poblaci6n existeun responsable quien generalmente es un lider de la parroquia o resinto, o quien ha trabajado poralgdn candidato ganador. Generalmente el responsable de distribuci6n se convierte en el majoracaparador del combustible para beneficio personal en reventa.
Cuenca
En la ciudad de Cuenca, se visit6 la Feria del Arenal, la feria de Tatoracocha, el Sector de laCarcel, San Sebastfan y Banios de Cuenca, los resultados no fueron tan halagadores por la fechaespecial de cambio de gobierno, que esta incidiendo en estos dias - en un cambio diametral delos precios, fluctuando entre 400 y 600 sucres el gal6n de kerex. Esta actitud ha inclinado a losdemandantes urbanos a consumir diesel 1 que lo expenden a s/650.00 en cantidad suficiente y

Annex 5: Investigacion Sobre El Precio Del Kerex 119
sin atropellos en la bomba del Mercado 9 de Octubre. Algunas de las personas consultadas,manifiestan que serfa loable que se distribuya el kerex en el campo en mayor volumen, y en lasciudades se debe incrementar los puestos de distribuci6n en los barrios populares, pero no estande acuerdo en que se venda en las bombas de gasolina, porque adulteran otros productos (debidoal elevado diferencial entre el k6rex y los demds productos).
En la ciudad de Cuenca, al igual que en Quito y Guayaquil, hay familias que se han dedicadodesde hace tres afios aproximadamente a esta actividad de reventa del kerex. Hay dosmodalidades de distribuci6n, la una en las ferias libres y la otra en puestos fijos. En las feriaslibres se realizan el viemes, ese dia los revendedores compran a s/60 el gal6n y de lunes a juevescompran en los puestos fijos a s/70; para ello tienen que acudir a las 3 horas a ganar tumo (lesponen numeros en el antebrazo derecho) para proveerse de cuatro galones, para revenderlos a los"camioneteros" a 150 a 200 sucres. Esta transacci6n les genera una utilidad de aproximadamente36.000 sucres que significa el 61% del Salario Minimo Vital (SMV).
Los "caminoneteros", como los conocen, entregan el kerex a s/400 en mecanicas, lugares que dantratamiento a la madera, planteles avicolas, tiendas pequefias y rurales.
Esto puede ser una explicaci6n del descenso de la demanda de Diesel 1, en la industria, en dondetambi6n existen cupos para distribuci6n por parte de Petrocomercial a este sector.
Los demandantes potenciales son los indigenas que utilizan en la cocina y alumbrado. Laspersonas consultadas en la zona periferica de Cuenca atestiguan que el gal6n de kerex se vendea 400 y 500 sucres el gal6n, y en lugares mas alejados a un precio mayor.
En las ferias, los tenderos condicionan la venta del kerex, es factible siempre y cuando comprenotros productos fundamentales como la sal, arroz, azucar, manteca y jab6n. Para estos tenderosla botella de kerex (litro) es parte de la canasta basica.
Otras ciudades
Bajo otras modalidades, se investig6 el precio de venta del kerex en las ferias libres y en puestosde distribuci6n fijos, en las ciudades de Ibarra, Latacunga, Cayambe, Balsapamba, Bolivar, enlas cuales se comprueba que la tendencia de la distorsi6n del precio del kerex que existenespeculadores y que el precio promedio del kerex es de s/364, es decir, mas de seis veces elprecio original.

INTERNAL PRICES CALCULATED USING Cif PRICES PLUS KARKETING COSTS AND MARGINS TABLE 1July, 1992
MKTGEOUIV CIF CIF COSTS MARGINS MARGINS PRICE PRICE
Barr/lon US/Ton USc/gallon USc/gaLLon S//gallon USc/gallon USc /gall S//gallon
Premium Gasoline 8.75 242.5 65.99 5.404 34.50 2.26 73.65 1,123
Special GasolIne 8.75 222.0 60.41 5.404 25.50 1.67 67.4d 1,029
Regular Gasoline 8.75 219.0 59.59 5.404 4.70 0.31 65.30 996
K6rex 7.81 217.0 66.15 5.404 2.18 0.14 71.70 1,093
Diesel 7.31 191.0 62.21 5.404 24.50 1.61 69.22 1,056
Fuel Oil 6.58 93.5 33.83 5.404 39.24 598
LPG 11.65 267.0 54.57 5.404 42.84 2.81 62.78 957
Exchange Rate, July 1. S/1.525AJ .
NOTE; CIF Prices of the Gulf Coast, third week of July.
REVEIIUS FROM OIL PRMDUCT SALES IN THE INfERNAL KMAET TABLE 2
(prices at July I. 1992)
(STIill1E1) Pi-ice DISTRIB. DISTRIII. VNiu( EvApOII [VAPOR VALIE PROD VALLIE MKTG VAltA VALUE VALUE NET NET REVENI4E
COuiSLIPT COWAWT S// MARHIU MARIN DIST-w KMAGI II R6I EVAPORN. Cn ST PAOWCOST COST rol.COST VAT VAT REVIA VAT INCLMED
total 92 Estruct gallon S//gi I Il I hill SI S//'gall I Mill. S/S//gal Mll. S/ S/Gall Mill.S; Hill.SI SIGall, Hil.S/ mill. s/ MjI.SI
PI gubiu56.-U~I igkf 20.24'j 1.252 910 34.50 3.9 698 8.76 0.96? 177 166 3.35) 82 1.668 S.O25 82.73 3.675 10.847 12.522
hit.011ne X4fi.1/2 28.491 604 25.50 3 923 11760 6.25 0.96t 2.162 166 76.470 B2 38.005 114.4I5 59.09 27.251 143l 394 170,645
.iyOular G.iooline 1.027 0206t 240 4.70 I 961 1 2.35 0.98? 2 166 170 82 85 :'6 21.82 2 (318) (16)
a;LoGu.1.1 0.462 60 2 II 3.631 16 0.58 0.989 4 166 1.246 82 619 9.84 5.45 41 (.417)) (1.436)
tll 1 I 19.656 1.21St 630 24 50 3 192 482 6.06 0.962 119 166 3.259 82 1.620 4.8719 57.27 1.126 5.778 6.903
Iuic'ei 2 446.654 27.592 630 24.50 3 892 10.943 6.06 0.962 2.707 166 74.062 8 6891081 5.7 2.8 3.9 5.7
A-.1 OIl ii.. 3481 2.6 9 166 62.156 82 30.891 93.04) 44.55 16.698 73.931 90.6291 3 1~~ 15.208 0.941 200 166 2. 522 82 1.253 3.775 18.38 27) (1.010) (733)
3.764 0.232 600 166 6i24 82 310 934 54.55 205 1.1 9 1.2
pid ail 7.809 0.481 580 166 1.295 82 644 1.938 52.73 412 2. 79 2.591
Alolu.,l%i AVGbAS 61 .877 3.822 1.520 166 10.260 82 5.099 15.359 138.18 8.550 70.143 78.694
1PIA (Gsllons) 194.998 12.052 163 42.84 26 *252 8.354 166 32.334 82 16.070 48.403 14.84 2.893 (27.827) (24.933)
tP~G tikldustry. Gaillon 3.978 0 252 938 166 660 82 328 W~7 85.31 339 2.406 2.745
§Vo}At u..jlns 1houanjlas 1,618.752 100.00t
408.330 493,061
BJ.rels IIou'SJI(JI 38.447 Net Reveoue US$ Million 323.3

RfVflIES fROMt OIL PltrC SALES ItI Ilf INITERIAL HAI_ ET TABLE 3(Internial pwiLes . Jully VP92. c,lculated witi I(If pi-Ices)
I ,I IHtIII (11) WY(SS UlSlf.R VAIllf 'VAPUR. VAlUE POW VMALI HKTING VAII VA.ll: vAlfAl llf.l NI KIVtI RJEVEIAUSI(VrISiPl Price RIVIINS l1AAl4I1 DIST H HWAiNII EVAPOR. COST PfVCOST COST WHTl(rXll 1(11 til. VAI VA] l(fVflf VAI INICIUD INCR[ASr
tutal 92 Estruct S//GW l Hlfl S/ S//Adll Hill 8 S//gall. Hill.S/ SI/gal hill. S/ S/Gal Hill S/t 11111 I Ili 5/ I Hill. S/ Hill S/ hill S/
1I.'1 w Gd)ulhi.. dU 245 1.25t 1,133 1/?.9i10 5.1 39 1.0,91 0 00 0 166 3.357 82 1.66H , 025 103 Oi 2 tH' 1-1 /49 16.834 4.312uw:o Iine- -IOI 172 28 491 1.0-1U 4ul. 01 50U 26 ?3.110 10 48 4.831 166 76,470 82 38.00-, 11.14/. 95 23 413 9I) ?2'(,.fil2 340,598 169.9539,uIar Gasulint, 1.021 0 06t 1.01H 1.0116 29 26 30 10 18 10 166 170 82 11, 255 9; 56 95 uW/ 750 766IeeA 7.SI/ 0 461 1.141 8.5/3 50 8 378 11 41 86 166 1.246 82 fil 1.8(, 103 68 719 .. -11 ,- 6.244 7.679
DIes,1 1 19.656 1.21t 1.0/6 21.145 5U J2 989 10.16 211 166 3,259 82 I.6.1, 4.879 97.80 1.9)2 IJ 11.1 15.065 8.162Dies l 2 .1i16.654 27 592 1,076 480.494 51 22 22.88t1 10.16 4 805 166 74.062 82 36.80') 110.871 91780 43.6fil 98.!2,1J 341.939 185.068fuel All fi4Lioai.i J/4.84) 23 162 5911 224.159 0 00 166 62.156 82 30.891 93.0-17 54.36 20.378 110.734 131.112 40.483A,vt.4It s 15,208 0.94t 200 3.042 0 00 166 2.52 82 1.25:1 3.7/, 18 Il 2/7 (1,1tl) (733) 0,olv nts 3.764 0.231 61)0 2.2.8 0 00 166 62.1 112 310 934 54 55 205 1.119 1.324 (0)Kay (blil 7.809 0.48t 580 4.529 0 00 166 1.295 82 641 1.938 52 73 41 ; 1)9 ;. 591 (0)
.erotuels AVGAS 61.877 3.82t 1.585 98.046 0.00 166 10,260 82 5.099 15.359 144f05 8.91J 73.774 82.687 3.993IfN (GIC o11s) 194.998 12.05t 991 193.859 80 00 15.600 166 32.334 82 16.070 48.403 9038 17.624 11: .32 1)9.856 154.789lSG (liKlustiy baluitm 3,978 0.251 99)1 3.)9.5 166 660 82 3J8 987 90 38 360 ? 608 2.967 222
TOTAL 1.543.1/5 64.131 267.755 133.1111 400.828 140.289 937.9?2 1.ti.8.261 575.2066ljlI)ns l.uiaida.h 1.618.752:8Brrelh I1.,ttiNa,Ji 38,44/ Revenes increase Hillaon IfSS 377 2
Econaic Subsidy Million US$ 400 9
ti) CII V.it - ,H LSTIHAIED interinal costs.

TA8LE 4RLVEUfUS FROM OIL PROUICT SALES IN Tit IITERNAL PWAFST
(Prices at Septeuber 1992)
ESTIMATED Price GROSS DISTRIB DISTRI1 VALIE EVAFflt. EVAPO VALUE PROD VAtltE tiKiG VALUE tiLt HIT REVfrIW,CrniSIrI(ON S// REVE(MS mARilN IARGIN DIST.H. WAIN HWNI EVAPOR.H COST PROD COX) (' CoSt tKl( COST VAT VAT RlVENUlS VAT INIJIlIUD
total 92 Estruct gallon Hill SI S//qall S Hill. SI S//gall. I Hill SI S//gall Mill S/ S/Gal Hill S/ S/Gall Hill S/ Hill S/ Hill S/
Prmium Gdsoli,ie 20.245 1 462 2.400 48.588 96.00 4 00S 1.944 21.82 1.00t 442 275 5.55 92 1.86i 218.18 4.417 34 364 38.t82Gasoline 461.112 28 60t 1460 6/3.311 58.40 4.00S 26.932 13.27 1.00t 6.121 275 126.592 92 42.461 132 13 61.210 409 995 471.205Regular Gasoline 1.027 0.071 240 246 9.60 4.00t 10 2.18 1.002 2 275 282 92 95 21 82 22 (164) (142)Kerex 7.517 0 572 60 451 2.40 4.002 18 0.55 1.00S 4 275 2.063 92 692 5.45 41 (2.368) (2.327)Diesel 1 19.656 1.041 1.460 28.698 58.40 4 002 1.148 13.27 1.00S 261 275 5 396 92 1.810 132 73 2.609 17 475 20.084Diesel 2 446.654 26 402 1.460 652.115 58 40 4.00S 26.08s 13.27 1.002 5.928 275 122.607 92 41.124 132.73 S9.283 397.088 456.371Fuel Oil llacional 374.847 23.50t 685 256.770 275 102.896 92 34.513 62.27 23.343 96.019 119.362 1Asphalts 15.208 0 832 200 3.042 275 4.175 92 1.400 18.18 211 (2.810) (2.533)Solvents 3.764 0 232 1.750 6,587 275 1.033 92 347 159.09 595' 4.608 5.207spray oil 7.809 0.54t 1-00 9.371 275 2.144 92 719 109 09 852 5.656 6.506aerofuels AVGAS 61.877 3.83l 1.614 99,869 275 16.985 92 5.697 146 73 9.079 68.108 77.187LPG (Gallons) 194.998 12.671 394 76.907 145.00 36 762 28.275 275 53.527 92 17.954 3S 85 6.992 (29.840) (22.848)LPG (industry, Gallon) 3.978 0.26S 1.152 4.583 113 00 275 1.092 92 366 104.73 417 2.708 3.124
TOTAL 100.00t 1.855.956 USt HIlLt S/ MlIwioluis Thousands 1.618.752 * Goverrent Revenues/year 650 1.169.981
Revenue Increase/ year 316 676.920

REVENUES fRfJ4 OIL PRODUCT SALES IN THE INTERNAL HARKET TABLE 5(Iiiteinational Prices) September 1992
ESIIMATED Price GROSS DISTRI1 DISTRIB VALUE EVAPOR. EVAPO VALUE PROD VALUE MKTG VALUE N[T NET REVEMiES REVENLECOiSLUPTION S/l REVENUS MARGIN MARGIN DIST.M. MARGIN MARGI EVAPOR.M. COST PROD.COST COST WIG COST VAT VAT REVENIES VAT INCLLOED INCREASEtotal 92 Estruct gallon HIill Suc. S//gdll K Mill. S/ S//gall. I Mill. S/ S//gall Mill. S/ S/Gal Mill. S/ S/Gall Mill S/ Mill. SI Mill. S/ Mill. S/(O)
r'.a.iua Gasoli ne ?0.245 1.46t 1.398 28.297 55 91 4.002 1.132 12.71 1.00t 257 275 5,557 92 1.864 127 06 2.572 16.914 19.486 (19.295)Gasoline 461,172 28 602 1.251 576.983 50.04 4.002 23.079 11.37 1.002 5.245 275 126.592 92 42.461 113.74 52.453 327.153 379.606 (91.599)Regular Gasoline 1.027 0.071 1.176 1.208 47.06 4 002 48 10.70 1.00t 11 275 28? 92 95 106.95 110 663 772 915.ereA 7.517 0.57t 1.286 9.665 51.43 4.001 387 11.69 1.00S 88 275 2.063 92 692 116.88 879 5.556 6,435 8.761Iliesel I 19 656 1.042 1,284 25.229 51.34 4.001 1.009 11.67 1.002 229 275 5.396 92 1.810 116.68 2.294 14.492 16.785 (3.299)Ilesel 2 44H.654 26.40S 1.284 573.291 51 34 4.00t 22.932 11.67 1.00S 5.212 275 122,607 92 41.124 116.68 52.117 329.300 381.417 (74,954)fuel Oil 374.847 23.502 701 262.772 275 102.896 92 34.513 63 73 23.888 101.475 125.364 6.002 t.Asoa Its 15.208 0.832 200 3,042 275 4.175 92 1.400 18.18 277 (2.810) (2,533) 0.olvenitS 3.764 0.232 1.750 6.587 275 1.033 92 347 159.09 599 4.608 5.207 0spray oil 7.809 0 542 1.200 9.371 275 2.144 92 719 109.09 852 5.656 6.508 0.,erofuels AVGA. 61.877 3.83S 1.865 115.405 275 16.985 92 5.697 169.55 10.491 82.232 92.723 15.536t.PG (Gallons) 194.998 12.67t 1.219 237.767 145.00 11.892 28.275 275 53.527 92 17.954 110 85 21.615 116.397 138.012 160.860IPG (liidustry Gall ) 3.978 0.262 1.187 4.723 113.00 275 1.092 9; 366 107.94 429 2.836 3.265 3.265TOTAL 100.002 1.854.340 1.004.472 1,173.048 3.067tallons (thousands) 1.618.752Barrels (thousands) 38.447 Econromic Ainual Subsidy Mill USS (*) -3.4
(ti CIF price plus estimated operating costs.(*) Difference between CIF costs plus actual internal marketing costs and margins, and actual Internal prices at September 1992.

- 124
SUBSIDY ESTIMATE TO ELECTRICITY CONSUMPTION (1) TABLE 6HOUSEHOLD USE(July. 1992)
Tariff Subsidy Number of Consuiption Tot.Subs. Accumut. Accumul ACCUmJl Accumul Accumut AccumutUS$/ consumer Consumers per block per block Subsidy Subsidy No of Consumers Consump. ConaWp
BLOCK kUh USStwAnth per block kWh USS Th. USS Th. S Consuters X Kwh X
0-20 * 0.07 0.4358 240935 1464629 105 105 1.0 240935 18.51 1464629 0.8221-50 0.00 0.4481 215200 7653862 96 201 1.92 456135 35.0 9118491 4.9251-80 0.01 5.2245 180329 12050611 942 1144 10.82 636464 48.82 21169102 11.3281-100 0.02 6.8994 102050 9337473 704 1848 17.4X 738514 56.62 30506573 16.32
101-120 0.03 7.9804 81543 9025602 651 2498 23.52 820057 62.92 39532177 21.12121-150 0.03 9.2587 105525 14298430 977 3475 32.72 925582 71.02 53850607 28.OX151-200 0.03 11.1891 128755 22424478 11U 4916 46.32 1054337 80.92 76255085 40.82201-300 0.04 14.4265 1288 31275434 1858 6m 63.7X 1183162 9O.72 107530519 57.52301-500 0.04 20.4133 73571 27711207 1502 8276 77.9X 1256733 96.42 135241726 72.32
501-1000 0.06 33.0662 33561 22628485 1110 9386 88.32 1290294 99.OX 157870211 84.42Excess 0C. 90.9769 13660 29186585 1243 10629 100.02 1303954 100.0 187056796 100.02
TOTAL 1303954 187056796 10629
TEMPORAL0-50 1.29 0.00 6101 94659 0 0 0.0$ 6101 50.8X 94659 8.1X
51-100 0.03 5.06 2136 139257 11 11 19.2X 8237 68.6X 233916 19.92Excess 0.04 12.11 3770 939700 46 56 100.0 12007 100.02 1173616 100.02TOTAL 12007 1173616 56 26345 1502191
TOTAL HOUSEHO SUBSIDY/N 1315961 188230412 10685TOTAL NHL8 SUGSIDY/ONOTH 128224
Subsidy per coruner/month 8.12subsidy per ba 0.0568
1 Marginl oost USc/ 8.31/kWh Exchange Rate: 1500 sucres/uSS* : fixad Charge

- 125 -
SUBSIDY ESTIMATE TO ELECTRICITY CONSUMPTION (1) TABLE 6CChMERCIAL, HANOICRAFTS, AND GOVERNMENT . July 1992 (Cont)(July, 1992)
Tarlff Subsidy Number of Consumption Tot.Subs. Accum.aul. Accuni. Accumul. Accumul Accumul. Accum4.US$ conumer Conwumers per block per block Subsidy Subsidy No of Consumars Coneip. Consump.BLOCK &A USS/mnth per block kWh USS Th. USS Th. S Conumers X Kwh XCOERCIAL
0-20 0.10 0.37 28105 158791 10 10 0.6X 28105 16.3X 158791 0.4121-80 0.01 3.70 37635 1885427 139 149 8.81 65740 38.11 2044218 5.2181-150 0.04 6.70 35921 4098636 241 390 22.9X 101661 s5.91 6142854 15.61157-SOC 0.05 11.98 53954 1436447a 646 1036 60.91 155615 90.21 2050s732 51.91501-100 0.05 26.02 l111s 7668774 290 1326 77.91 1667m 96.71 28176106 71.41Excess 0.05 65.01 5772 11304246 375 1702 100.01 172545 100.01 394803S2 o100.0Totsl 172545 39480352 1702Subsidy per con umer USS 9.86SLubfdy per kMA USS 0.0431HANDICRAFTS
0-100 2.29 0.84 5116 193052 4 4 2.51 5116 41.01 193052 5.91101-50 0.04 15.98 5785 1336741 92 97 55.71 10901 87.41 1529793 46.73501-10 0.04 34.91 983 671194 34 131 75.51 1188 95.31 2200987 67.21Excess 0.05 72.30 588 1073685 43 174 .100.01 12472 100.01 3274672 100.01Total 12472 3274672 174Subsfdy p cumer USS 13.92Ssidy p.er &b^ Us$ 0.0530ERUEFNT INSTITUTIONS
0-20 0.10 0.21 1557 5884 0 0 0.21 1557 22.71 5884 0.1121-80 0.01 3.64 1161 57224 4 5 2.71 2718 39.51 63108 1.4.81-150 0.03 6.91 84 98168 6 10 6.11 3562 51.8x 161276 3.61151-500 0.04 12.61 1899 514634 24 34 20.31 5461 79.51 675910 15.11501-100 0.05 28.08 684 482406 19 54 * 31.61 6145 89.41 1158316 25.81Excess 0.05 158.82 728 3330051 116 169 100.01 6873 100.01 4488367 100.01Total 6873 448W367 169subsidy per consuner USS 24.61SL*Asdy per kih USS 0.0377
(1) Marfinal cost USc/ 8.31/kwh

SUBSIDY ESTIMATE TO ELECTRICITY COwSUMPTION (2) TABLE 6 (Cont.)CO)ISUERS WITH DEMAND CHARGE
(Juty, 1992)(Dol lars)
Tariff Subsidy NLuber of Consumozcion Total subsid.USS/ per consumer Consuners per block per blockkwh USS/montn per block kWh USS Thousands
CCOKERCIALDemiand Charge 1.35 131.29 3989 28202050 524Tariff 0.05
Subsidy per kWh USS 0.0186GCVER1MENT INSTITUTIONS
Demand Charge 1.29 316.13 1132 17171069 358Tariff 0.04
Subsidy per kwh usS 0.0208INDUSTRY, DEMAND CHARGE I
Deind Charge 1.35 414.93 6099 82085896 2531Tariff 0.04
Subsldy per kWh uss 0.030aINDUSTRY, OEMAND CHARGE 11
De0snd Charge 1.21 1852.54 487 38539953 902Tariff 0.04
Subsidy per kWh USS 0.0234WATER LIFTING
De nci Charge 1.Z1 796.89 678 14184873 540Tariff 0.03
Subsidy per kWh USS 0.0381PUBLIC LIGHTING
Tariff 0.03 57412.39 18 21387065 1033
Subsidy per kWh USS 0.0483
SUBSIDY TO THE CONS.UERS WITH DEMAND CHARGE 201570906 5888USS THOUSANDSM/NT1
TOTAL SUBSIDIES PER MOUTH. USS THOUSANDS 18618TOTAL SUBSIDIES PER YEAR. USS THOUSANDS 223413TOTAL CONPUJTIOM PER MONTH KWH 43704709SUBSIDY PER KWM, USS 0.0426
(2) Marginal cost USc/ 6.82JkWhNOTE: The d na charge per kWh was calculated with a toad factor of 0.54.
( Dem nd Charge/72O hours per month * 0.54)Ptblic lighting subsidy was catculated with a marginal costs of USc 8.31/kWh

- 127
SUBSIDY ESTIMATE TO ELECTRICITY CONSUMPTION (1) TABLE 7HOUSEHOLD USE
(September, 1992)
Tariff Subsidy No. of Consurv. Tot.Subs. Accumul. Accumus Accumut. Accumul Accurut. Accmt.BLOCK USS/ consumer ConsLners per block per block Subsidy Subsid No of Consumers Corsump. Coesu*.
kWh USS/month per block kWh USS Th. USS Th. X Consumers X Kuh X
0-20 * 0.06 0.4474 240935 1464629 108 108 1.2X 240935 18.6S 1464629 0.3121-50 0.00 0.4505 215200 7653862 97 205 2.2X 456135 35.11 9118491 4.9X51-80 0.01 5.2793 180329 12050611 952 1157 12.72 636464 49.01 21169102 11.32
81-100 0.02 7.0168 102050 9337473 716 1873 20.5X 738514 56.9X 3050657 16.31101-120 0.02 8.1833 81543 9025602 667 2540 27.82 820057 63.2X 39532177 21.1X121-150 0.03 9.5922 105525 14298430 1012 3552 38.92 925582 71.31 538306G7 28.3X151-200 0.03 11.7364 128735 22424478 1511 5063 55.41 1054337 81.21 76255085 40.81201-300 0.06 14.2893 128825 31275434 1841 6904 75.6X 1183162 91.12 107530519 57.5Z301-500 0.06 17.3551 73571 27711207 1277 8181 89.5X 1256733 96.81 135241726 72.31501-1000 0.07 22.5757 33561 22628485 758 8939 97.81 1290294 99.41 157870211 84.X1001-1500 0.09 24.0395 8196 11090902 197 9136 100.01 1303954 100.4X 1870S6796 100.6XExcess 0.13 -61.6503 5464 18095683 -337
TOTAL 1303954 187056796 8799
TEMPORAL0.50 1.11 0.18 6101 0 1.12 1 8.62 6101 50.8%51-100 0.07 3.64 2136 233916 8 9 68.12 823T 68.61
Excess 0.10 -0.63 3770 939700 -2 7 50.01 12007 100.01Totat 12007 1173616 7 13 100.0X 26345
TOTAL HOUSEHOLD ¶315961 188230.12 8805Subsidy per consumer/month 6.69Subsidy per kWh 0.0468
1 marginal cost USc/ 8.31/kWhFixed ChargeExchange Rate: 1500 sucres/USS

*12,
SUBSIDY ESTIMATE TO ELECTRICITY CONSUMPTION (2) TAILE 7CONSUMERS WITH DEMAND CHARGE (Cant.)
(Septemer, 1992)(DoLLars)
Tariff Subsidy Yo. of Consump. Tot.Subs IBLOCK USsi consumer Consumers per block per bloc
kWh uSS/moncn per bLock kWh USS Th.
COMMERCIALDemand Charge 2.06 -65.82 39a9 28202050 -263Tariff 0.07
SLubidy per kWh USS -0.0093GOVERNMENT INSTITUTIONS
Dinand Charge 1.94 -52.60 1132 17171069 -60Tariff 0.07Sub idy per consumer uSS 52.6025Subsidy per kWh USS -0.0035
* INDUSTRY, DEMAND CHARGE IIo nd Charge 3.33 -19.98 6099 82083896 122Tariff 0.06
Subsidy per kwh USS -0.0015IWDUSTRY, DEMAND CHARGE 11
Deomad Charge 2.C6 142.60 487 38539953 69Tariff 0.06
Subsidy per kWh USS 0.0018WATER LIFTING
Subsidy per consut 1.94 276.14 678 14184873 187Subsidy per kWh US 0.05
PUBLIC LIGHTINGTariff 0.08 -277.24 18 21387065 -5Subsidy por kWh USS -0.0002
SUWSIDY TO THE CONSUMERS WITH DEMAND CHARGE 201570906 -192
TOTAL SUBSIDIES PER MONTH/USS THCUSANDS 8734TOTAL SU8SIDIES PER YEAR/USS THOUSAUOS 104810TOTAL CONSUBPTION KWN 437044709SuESIDY PER KWH, USS 0.0200
(2) Marginal cost UScI 6.82/kwhNOTE: The dmwsnd charge per kWh was caelculated with a Load factor of 0.54.
t 0enna Charge/720 hours per month * 0.54)Public lighting subsidy was calcuisted with a marginal costs of USc 8.311kwhExchange Rate: S/1800/USS

- 129
SUBSIDY ESTIMATE TO ELECTRICITY CONSUMPTION (1) TABLE 7CO"MERCIAL, HANOICRAFTS, AND GOVERNMENT (Cant.)
(Septwb er 1992)
Tariff SubsIdy No. of Cconsump. Tot.Subs. ACCumul. Accumul AccumuI. Accumul Accumul. Accumul.BLOCK USS/ consun r Consumers per block per block Subsidy Subsid No of Consumers Consump. Corsump.
kWh USS/month per block kWh USS Th. USS Th. X Consumers X K$h X
COMMERCIAL0-20 0.17 0.30 28105 158791 9 9 0.0X 28105 16.3X 158791 0.4X21-80 0.03 3.16 37635 1885427 119 127 0.1X 65740 38.11 2044218 5.2%81-150 0.06 4.81 35921 4098636 173 300 0.1X 101661 58.91 6142854 15.6X151-500 0.08 5.42 53954 14364478 93 593 0.31 155615 90.21 20507332 51.9X501-1000 0.09 0.66 11158 7668774 7 600 0.31 1667m 96.7% 28176106 71.4XExcess 0.13 -81.45 5772 11304246 -470 130 0.1X 172545 100.01 39480352 100.0STotal 172545 39480352 130
Subsidy per consumer USS 0.75Subsidy per kWh USS 0.0033
NAMOICRAF7S0-100 3.0 0.09 5116 193052 0 0 0.0X 5116 41.01 193052 5.9X101-500 0.06 10.77 5785 1336741 62 63 0.11 10901 87.41 1529793 46.71501-100 0.08 9.15 983 671194 9 72 0.11 11884 95.31 2200987 67.21Excess ... JZ6.2 58 8 1073685 -15 56 0.11 12472 100.0% 3274672 100.0XTotat 12472 3274672 56
Subsidy per consunr USS 4.51Subsidy per kWh USS 0.0172
GOVERNENXT INSTITUTIONS0-20 0.17 0.15 1557 5884 0 0 -0.01 1557 22.7% 5884 0.11
21-80 0.03 3.12 1161 57224 4 4 -0.01 2718 39.5X 63108 1.4181-150 0.05 5.05 8C44 98168 4 8 -0.01 3562 51.81 161276 3.61
151-500 0.07 6.19 1899 514634 12 20 -0.01 5461 79.51 675910 15.11501-1000 0.08 3.47 684 482406 2 22 -0.01 6145 89.41 1158316 25.81Excess 0.11 -120.55 728 3330051 -88 -66 0.11 6873 100.01 4488367 100.01Total 6873 4488367 -66
Subsidy per consumer USS -9.53Subsldy per kWh USS -0.0146
(1) marginst cost USc/ 8.31/kwh

- 130 -
SUtSIDY ESTIKATE TO ELECTRICITY CONSUMPTION (1) (HOUSEHOLD USE) TABLE 8May 1993
AccumuliUSS/ consuner Consumers per block per btock Subsidy Subsidy No of ConsumersBLOCK kWh USShmrnth per btock kWh USS Th. USS Th. X Conmufre X
0-20 * 0.34 0.164J 240935 1464629 40 40 0.61 240935 18.6X21-50 0.01 0.3112 215200 7653862 67 107 1.6" 456135 35.1t51-80 0.02 4.5339 180329 12050611 118 924 13.91 63MM 49.0X01-100 0.03 6.0470 102050 93473 617 1541 23.2X 78514 56.9S101-120 0.03 7.0370 81543 9025602 574 2115 31.81 820057 63.2X121-150 0.04 8.1166 10SS25 14298430 857 2972 44.7X 925582 71.3X151-200 0.05 9.5128 128755 22424478 1225 4197 63.2X 1054337 81.22201-300 0.08 10.5701 1282S 3127543 1362 5558 83.71 1183162 91.11301-500 0.08 11.0208 73571 27711207 811 6369 95.;. 1256733 96.80501-1000 0.09 10.0686 33561 22628485 338 6707 100.9X 1290294 99.411001-150 0.13 -7.6818 8196 11090902 -63 6644 100.0X 1303954 100.4XExcess 0.13 -93.0795 5464 18095683 -509
TOTAL 1303954 187056796 6135
TEMPORAL0-50 3.66 -2.38 6101 94659 -14.49 -14 15.81 6101 50.8X51-100 0.09 0.10 2136 139257 0 -14 15.61 8237 68.61Excese 0.13 -6.35 3770 939700 -31 -46 50.0X 12007 100.01Totat 12007 1173616 -46 *91 100.0% 26345
TOTAL HOUSEHOLD SECTOR 1315961 18O230412 6090
Subsidy per corns r per month USS 4.63Subuidy per kwh 0.0324
Ffixd chargeExchane rate: 1910 sucres/USS

-- 131
SUBSIDY ESTIMATE TO ELECTRICITY CONSUMPTION:CXOMERCIAL, HANDICRAFTS, GOVERNMENT. TABLE 8MAY, 1993 (Cant)
Tariff Subsidy No of Consuptio Tot.Subs. Accum l. Accumui . Accujil. AccumulUSS corumr Consmers per block per block Subsidy Subsidy No of Cornsrs
BLOCK kWh USS/manth per block kWh USS Th. USS Th. - ransrs X
COMMERCIAL0-20 1.43 -0.96 28105 1587Y1 -27 -27 0.0 28105 16.31
21-80 0.05 1.16 37635 1885427 44 17 -0.0 65740 38.1181-150 0.09 0.67 35921 4098636 24 41 -0.01 101661 58.91151-500 0.11 -3.49 53954 14364478 -188 -147 0.0 155615 90.21501-1000 0.12 -19.00 11158 7668774 -212 -359 0.0 166M 96.71Excess 0.09 -18.63 sm 113042U -108 -47 0.11 172545 100.0OTotal 172545 39480352 -47
subdy per consumer USS -2.71SubsldV per kWh tISS -0.0118
IAD ICRAFTS0-100 5.24 -2.10 5116 193052 -11 -11 0.01 5116 41.0X
101-5ud d.0 3.04 5785 1336741 la 7 -11 0X 10901 87.4X501-1000 0.11 -12.93 983 671194 -13 -6 U.0X 11i4 95.3ZExcess 0.13 -72.90 588 1073683 -43 -49 0.11 12472 100.01Total 12472 3274672 -49
subsidy per consinr USS -3.91S uIdy per kwh LUSS -0.0149
GOVERNMENT INSTITUTIONS0-20 1.43 -1.11 1557 5884 -2 -2 0.0 1557 22.7X
21-80 0.05 1.14 1161 57224 I 0 0.01 2718 39.5X81-150 0.09 0.82 844 98168 1 0 -0.01 3562 51.81
151-500 0.10 -2.52 1899 514634 -5 -5 0.01 5461 79.51501-1000 0.11 -16.25 684 482406 -11 -16 0.01 6145 89.4XExcess 0.12 -156.82 728 3330051 -114 -130 O.1X 6873 100.0Total 6873 448867 -130
Subsidy per conumer USS -18.88Subsidy per kWh USS1 -0.0289
(1) Marginal cost USc/ 8.31/kwh

- 132
SUBSIDY ESTIMATE TO ELECTRICITY CONSUKPTION (2)CONSUMERS WITH DEMAND CHARGE TABLE 8
(may 1993) (Cant.)
Tariff Subsidv No of Consumptio Tot.Subs.1USS/ consumer Consumers per btock per block
SLOCX kWh USS/mnth oer black kWh USS Th.
COMMERCIALDemwc Charge 2.62 -183.59 3989 28202050 -732Tariff 0.09Subsiay per consumer USS -0.1836Subsidy per kWh USS -0.0260
GOVERNMENT INSTITUTIONSDem nd Charge 2.49 -293.49 1132 17171069 -332Tariff 0.08Subsidy per conrumer USS -293.4889Subsidy per kWh USS -0.0193
INDUSTRY, DEMAND CHARGE IDennd Charge 3.14 -247.83 6099 82083896 -1512Tariff 0.07Subsidy per eomuar USS -247.8279Subsidy per kWh USS -0.0184
IMNWSTRY, DEMAMD CHARGE 110e d Charge 2.70 -953.90 487 38a39s53 -46STariff 0.07Subsioy per consumer USS -953.a952Subsidy per kWh USS -0.0121
WATER LIFTINGO-nd Charge 2.49 -130.95 678 14184873 -89Tariff 0.07Subsidy per consumer USS -130.9528Subsidy per kWh USS -0. 0063
PUBLIC LIGHTING -0.0063Tariff 0.08 -261.27 l8 21387065 -5Subsidy par kWh USS -0.0002
SUBSIDIES TO THE CONSUMERS WITH DEMAND CHARGE 201570906 -3134
TOTAL SUBSIDIES PER MONTH/USS THCUSANOS 2310TOTAL SUBSIDIES PER YEAR/USS THOJSAMDS 27722TOTAL CONSItO IENSUAL KWH 437044709SUBSIDY PER KWN, USt 0.0053
Excahwge Rate: S/1910/USS

- 133 -
INCREASE OF SECTCRAL COSTS AS A RESULT CF THE RISE IN THE AVERAGE PRICE OF OIL PRODUCTS TABLE 9
SECTORS 10X 201 501 100l 150X 2001 3001
I AGR.SILVICULT ANO FISHIWG 0.30X 0.60X 1.501 3.00X 4.50X 6.00X 9.00X2 OIL ANO NATURAL GAS 0.13X 0.27X 0.67X 1.35X 2.02X 2.69X 4.04X3 OIL REFINING 3.89X 7.78X 19.46X 38.92X 58.38X 77.84X 116.76X4 OTHER MINING PRCOUCTS 0.51X 1.021 2.54X 5.08X 7.621 10.16X 15.25X5 FOOD INDUSTRY, BEBEERAGES ANO TGSACCO 0.351 0.691 1.731 3.45X 5.181 6.911 10.3616 TEXTILES 0.291 0.571 1.43X 2.86X 4.291 5.72nx 8.5a17 W 0.391 0.781 1.951 3.90X 5.85X 7.80X 11.7018 PAPER AND PRINTING INDUSTRIES 0.39X 0.181 1.961 3.92X 5.89X 7.85X 11.779 CHEMICALS ANO RU UER INDUSTRIES 0.911 1.83X 4.57Z 9.14X 13.711 1.27X 27.41S10 OTHER BASIC MINERALS INDUSTRIES 0.84X 1.69X 4.221 8.45X 12.67X 16.89X 25.34311 IACaINERY,EOUIPMENT.TRANSP. PARTS 0.631 1.261 3.15X 6.301 9.4U 12.591 18.812 OTHER MUIUFACTURES 0.261 0.51X 1.281 2.55X 3.83X 5.11t 7.66113 ELECTRICITY. LPG AND WATER 1.591 3.171 7.931 15.861 23.791 31.721 47.5m14 CONSTRUCTION: PRIVATE AND PUBLIC 0.591 1.171 2.93X 5.861 8.79x 11.71 17.58115 COERCE 0.381 0.75S 1.891 3.771 5.661 7.54X 11.32=16 TRANSPORTATION 2.16X 4.321 10.791 21.581 32.37X 43.16X 64.74117 SERVICES 0.211 0.43X 1.07X 2.15X 3.221 4.301 6.45SIncrease of the productor Price Irdex 0.54X 1.08S 2.71X 5.42X 8.13X 10.84X 16.26X
Increase of the Consunwr Price Index 0.59X 1.18X 2.95X 5.90X 8.85X 11.801 17.70X:ncrease of the Exoorts Price Inoex 0.50S 1.01 2.52X 5.03X 7.55X 10.07X 15.10X
Source: Banco Central del Ecuaccr. :rxat-Outout matrix.

134
INCREASE OF SECTCRAL C_STS AS A RESULT CF THE RISE OF ELECTRICITY TARIFFS TABLE 10
SECTORS 10 201 501 100t 150X 2001 3COX
1 AGA.SILVICULT AND FISHING 0.071 0.14X 0.35x 0.711 1.06S 1.421 2.13X2 OIL AND NATURAL GAS 0.081 0.16X 0.401 0.80X 1.21X 1.61X 2.41X3 OIL REFINING 0.221 0.44X 1.10X Z.21X 3.31X 4.41X 6.621* OTHER MINING PRODUCTS 0.281 0.57X 1.41X 2.83X 4.24X 5.66X 8.49X5 FOD IMDUSTRY. BERAGES AND TOBACCO 0.16X 0.31X 0.78X 1.571 2.35X 3.14X 4.71X6 TEXTILES 0.21X 0.421 1.05S 2.111 3.16X 4.211 6.32X7 W 0.17X 0.34X 0.861 1.72Z 2.S7X 3.43U 5.1SXJ P11A AND PIINTING INDUSTRIES 0.17X 0.34X 0.8U 1.71S 2.571 3.421 5.19 CIICAUS AD 1U INDUSTRIES 0.40X 0.81X 2.011 4.03X 6.04X 8.06X 12.MW
10 01 SAIC MINERALS INDUSTRIES 0.52 1.051 2.61X 5.231 7.a1. 10.461 15.69111 XACNIMERY.E1 UIPMENT,TRANSP. PARTS 0.381 0.761 1.901 3.801 5.701 7.591 11.39112 OTHER AIWIACTMREU 0.16X 0.31X 0.781 1.S5 2.34X 3.11X 4.67113 ELECTRICITY, LPG AND WATER 1.33X 2.65X 6.63X 13.26X 19.901 26.53X 39.79114 CMONSTRUCTI0N: PRIVATE AND PUBLIC 0.281 0.55X 1.38X 2.771 4.15X 5.54X 8.31X1S CCPERCE 0.16X 0.311 0.78X 1.S61 2.33X 3.11X 4.67X16 TRANSPOUTATION 0.301 0.59X 1.481 2.961 4.43X 5.91X 8.8717 SERVICES 0.18X 0.36X 0.891 1.791 2.681 3.581 5.37X
Increase of the Pric* Index 0.201 0.41X 1.02X 2.04X 3.06X 4.081 6.121Increase of the Productor Price Incex 0.251 0.491 1.23X 2.451 3.681 4.901 7.351Incream of the Cormur Price Incux 0.241 0.471 1.181 2.35X 3.53X 4.70X 7.05XIncrease of the Exports Price Irscx 0.131 0.26X 0.64X 1.281 1.92 2.56X 3.a4X

- 135 -
TABLE I I REVTSED LEAS-T COST CAPACrTy EXPANSION (1997-2008~)
Installed Estimated PlannedCapacity Invement Costs Commissioning
l (Mr1W) tUSS. million)
Tbermal Rehabilitation 130 ?
Paute-Mazar 180 ? ?Daule-Peripa (Hydro) 130 1994/95San Francisco (Hydro) 210 220 1997Gas Turbine 60 45 1997Chespi (Hydro) 167 ? 2000Sopladora 400 ? 2001
Gas Turbine 100 70 2003Codo Sinclair I (Hydra) 492 ? 2005Codo Sinclair II (Hydro) 492 ? 2008
Source: INECEL and Own esm

-- 136
TABLE 12 POWVER GENERATION BY SOURCE (GNh)
I N I C E L DISTRIBUTION COMPANIES T 0 t A LHy*u Thwm. Total Hydro Therm. Total Hydro Thorm. Total Peakiod
(MWI1980 262 83 1,097 575 1,408 1,983 837 2,243 3,WO NO1931 1U3 I'3 1,276 606 1.511 2Z117 749 2,64 3,393 7061902 190 1,617 1,87 680 1,333 2,012 869 2.9ff 3,819 743193 9" 1,37 2,301 72. °90 1,714 1688 2,327 4,015 7641934 2,41 436 2,897 747 573 1,320 3,207 1,010 ',217 804193 2,du 631 3,269 613 6' 1,277 3,252 1, 29 4,34 8721936 3,2 130 3,7Z5 701 54 1,247 3,976 996 4,972 941937 3,901 339 4,240 642 506 1,143 *,543 845 5,388 1,02=1988 4,080 365 4,4& 721 464 1,183 4,01 832 5,633 1,04119 4,1" 398 4,553 766 4L 1,212 4,934 36 5,77 I, 0931990 4,365 84 5,213 604 509 1,113 4,972 1,353 6,37 1,180199 4,407 1,400 5.807 662 519 1.181 5.069 1.919 6.918 1,24,
Saim'gg NI CEL

137
TABLE 13 PEAK DEMAND AND AVAMLABLE ENERGY BYDISTBLBUrTON CONMPANY (DECEMBER 1991)
Noncoincident N Available lPeak Demanc Share Energy (MWh) Share
EMELEC 402 32.3 2,362.6 36.0
EEQSA ;01 24.2 1,608.2 24.5ENfELMANABI 83 6.7 402.8 6.1
EMhLGUR 58 4.7 322.2 4.9
EER CENTRO SUR 56 4.5 279.5 4.2
El ELORO 52 4.2 243.0 3.7
EMELNORTE 40 3.2 191.2 2.9
E.E. AMBATO 40 3.2 171.0 2.6
EMELESA 29 2.3 112.5 1.7
E.E.MILAGRO 29 2.3 166.3 2.5
E.E. RIOBAMBA 28 2.3 125.5 1.9
E.E. S. DOMINGO 23 1.9 101.6 1.6
E.E. P. HELENA 24 1.9 112.5 1.7
E.E. COTOPAXI 21 1.7 104.6 1.6
E.E. R. SUR 22 1.8 86.6 1.3
EME OS 21 1.7 117.6 1.8
E.E. BOLIVAR 6 0.5 23.7 0.4
E.E. AZOGUES 5 0.4 17.7 0.3
SUCITMBIOSQ 0.4 16.3 0.3
TOTAL 1,245 100.0 6,S65.4 100.0
Source: INErFr

13' --
TABLE 14 AVERAGE ANNUAL RATES OF INCREASE IN' ELECTRICITY CON'SUMPION'
198085 1985.-90 1980-90
Total Consumption 6.25 5.67 6.06- Residential 6.28 5.47 5.78
- Industrial 3.91 5.15 4.94
- Commercial 7.54 5.27 6.69- Others 11.79 8.10 9.57Gross Genertion 7.20
Peak Load 6.13
Source: INECEL and own calculations
Lezt Squw Istmtes

TABLE 15 'VERAGE TARTFFS BY SECTOR' (Sucres/KkWh)
Year Residential Industrial Commercali Other-s Total
1980 40.7 36.1 54.6 37.1 40.7
1981 43.9 43.8 57.5 44.2 45.9
1982 49.4 49.8 61.9 45.7 50.9
1983 33.0 35.9 42.8 33.2 35.1
1984 3i.8 36.1 42.1 35.1 35.6
1985 30.6 36.0 38.6 32.9 33.9
1986 32.6 38.9 40.6 36.2 36.4
19i7 35.3 42.9 44.4 39.1 39.7
1988 29.9 36.9 38.1 34.7 34.1
1989 23.7 42.4 41.8 39.6 34.7
1990 22.2 41.9 40.6 38.5 33.6
1991 21.8 45.3 43.0 36.9 34.6
Source: INECEL and own caiculations
2 In prices of 191.

TABLE 16 AVERAGE COST OF ELECTRTCTTY SUPPLY BY SYSTEM LEVEL (fARCH 1992)
System Level Power' Average Total Average Load(USS.fkW/Year) Energy' Costs Factor
(UScentsAkWh) (TScents/kWh)
1 Generation 90.3 2.93 4.59 0.622 Transmission 4.6.5 0.06 0.94 0.61
3 Subtotai (1+2) 136.8 2.99 5.534 Subuansmission 39.0 0.05 0.83 0.575 Subtal (3+4) 175.8 3.04 6.36 |
Distribution:
6 Primary 19.7 0.04 0.46 0.547 S ubtol (5 +6) 195.5 3.08 6.82 -
8 Transformation 22.6 0.05 0.55 0.529 Subtotal (7+8) 218.1 3.13 7.37 -
10 Secondary 28.5 0.09 0.95 0.50
11 Tobl (9+ 10) 246.6 3.22 8.32
Source: INECEL
I 1reiL.ing tosses
W.ighted asera-e of wet saw dr- seas.'.

141 -
TABLE 17 TNECEL'S SRPPLy COSTrS BY SYSTEf. SEASON AND LOAD (MARCH 19921
Energy (UScents/kWVh)
Power Dry Season Vet Season
Systen Level (USS/'kW Hizh Nledium Low High Medium Low
-Geon 90.3 6.23 6.16 6.16 1.37 0.46 0.40
Transmission 136.8 6.37 6.30 6.30 1.40 0.47 0.41(138-230 kVa)
Subuansmiusion 175.8 6.48 6.41 6.41 1.43 0.48 0.42
Source: INECEL.

FIELDS IN PRODUCtiON, WITIIOtrr ADIDmONAL INVMsrMENT
(LOW PRODUCTION SCENARIO)
. ~~~ ______ ______ _ =____
FIElUD 1992 1993 1994 1995 1996 2000 2010
PETROECUADOR-TEXACO PROD.(MBD) 223.0 221.5 217.3 209.7 200.0 160.9 64.6
API 28.8 28.8 28.8 28.9 2R1 28.9 29.2
PELROPRODUCTION PROD.(MBD) 63.8 54.3 46.4 39.7 34.0 18.6 4.4
API 29.1 29.1 29.1 29.2 29.2 29.2 29.0
PETROECUADOR - CITY PROD.(MBD) 4.4 3.9 3.4 2.8 2.4 1.0 0.2
AP[ 1 19. 19.8 19.8 19.8 19.8 19.7 19.7
.~~~~~~1.
lTFAL PROD.(MBD) 291.2 279.7 267.1 252.2 236.4 180.5 69.2
I I___ _=_L_8.5_ 28.S 28.5 28. 28.5 [ 285_ 28.2
AVERAGE AUGM -AlUG/96 2U.21 MBD,_ __ _

FiEJS)S IN PRODUCTION - PROGRAMNIED INVEST1NIN -NiibIU2NEW MELDS PARTIALLY INCORPOHAT ElD
(1IDDLE PRODUCTION SCENARIO)
FIE1D __ 1992 1993 1994 1995 1996 2000 2010
PETROECUAIDOR-TEXACO PROD.(MBD) 225.1 222.5 220.7 218.1 209.1 169.4 68.2
API 28.5 283 28.3 28.3 28.2 28.2 28.2
PEIrRORRODUCTION lPROD.(MBD) 75.7 66.4 65.3 65.2 57.3 42 .9 12.5
AP'I 29.1 29.1 29.0 29.0 29.0 2 9.0 28.8
PEFROICUADOR - CrTY PROD.(MBD) 4.4 5.0 5.0 5.0 4.8 4.0 2.0
AP[ 19.8 19.8 19.8 19.8 19.8 19.7 19.7
OTIIER COMPANIES PROD.(MBD) 0.0 20.0 36.7 43.2 43.2 35.0 15.0
OXY, IAXIUS, ELIF, BELCO API 0.0 28.0 22.0 23.0 22.0 17.0 17.0
TOTAL PROD.(MBD) 305.0 313.9 327.7 331.5 314.4 251.3 97.7.. _ _- I IAPI 28.5 28.3 26.5 27.6 27.3 26.6 26.3
AVERAGE AUGI92 - AUG/96 320.95 MIBD

I;1ELDS IN PRODUCTION - PROGRAMMED) INVIMSFENT - T Dlol 2_
NE* IElDS TOTALLY JNCORPORATI.I(IIIGII PRODUCTION SCENARIO)
FnLD Im 1993 1994 1995 1996 2000 2010
PEFROECUADOR-TEXACO PROD.(MBD) 227.2 234.4 234.4 236.1 229.7 185.1 88.4
AP[ 28.8 28.6 28.6 28.1 28.0 27.0 28.0
PETROPRODUCTION PROD.(MOID) 86.1 81.6 78.1 76.1 66.6 51.2 30.4
API 29.1 29.1 29.0 29.0 29.0 28.0) 26.0
PEFROECUADOR - CIrY PROD.(MBD) 4.4 6.5 6.0 7.5 7.5 7.0 3.0
API 19.8 19.8 19.8 19.8 19.8 19.7 19.7
OlThER COMPANIES() PROD.(MBD) 0.0 33.7 58.2 49.2 103.9 68.5 8.4
API 0.0 26.2 22.9 22.9 20.7 19.2 17.0
TOTAL PROb.(MBD) 317.0 3562 376.7 368.9 407.7 | 311.8 | 130.2
Ii 28.3 28.3 27.7 27.4 26.2 25.3 25.3
AVERAGE AUG/9 - AUG/96 388.56 MIlD
() Projections made by the companies
YEAR 193 YEAR 1994 YEAR 1996
OCCIDENTAL 28.0 MBD OCCIDENTAL 29.0 MBI) OCCIDENTAL 30.7 MBD
BELCO 3.0 MUD MMAXIIS 20.5 MIlD MAXIIS 57.6 MInD
ELF 2.7 MUD BELCO 4.0 MBD BELCO 5.5 MLD
-ELF 4.7 MBD ELF 10.4 MID
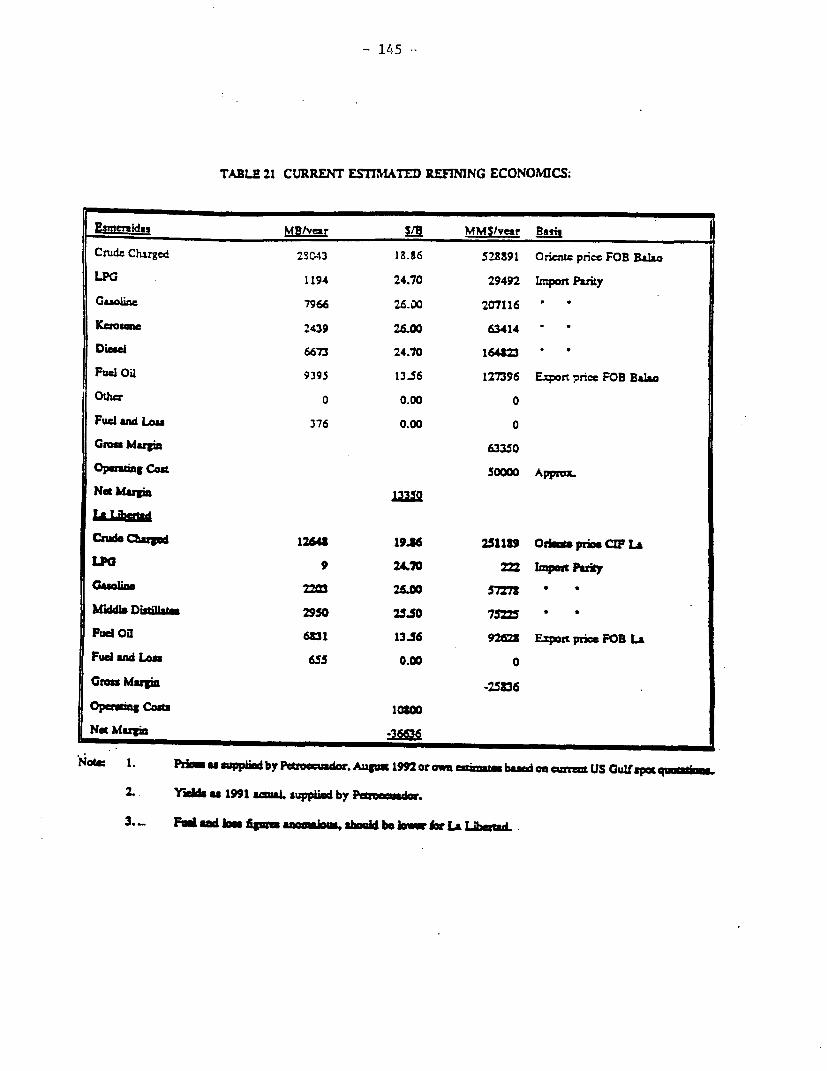
- 14/5
TABLE 21 CURRENT ESTIMATED REFIMNG ECONOMICS.
4Deraidis MBvear SLl MMS/vear BarsCrude Chirged 23C43 18.86 528891 Oriece price FOB BalaoLPG 1194 24.70 29492 Lmpo ParityGasolisu 7966 26.00 207116Kaale '439 26.00 63414Di-e 6673 24.70 164t23Fuel oil 9395 13.56 127396 Export price FOB BalaOtha 0 0.00 0Fuel nd Los 376 0.00 0
Cn Margi 63350Opeauang Cost 50000 Apprx.Not Margin
Cnude Charp 12648 19.36 251139 O0C Prism CI? LaLPG 9 2L70 2 import PerkyGOine rm 2&0 57: * *Middl Didlasm 2950 25.50 75225Pud OH 6931 1336 923 Expott pric FOB LaFued and Len 655 0.00 0Gss Maui -25336
Ope Cosg 10300Not Margin -36
Not= 1. PI spied by Pbtrocado. Augu 1992 or own etm basd o cnmr US Gulf spa q_d.
2.. as a 1991 aca. suppied by P _atrusad.
3._ Fed a#ad os hum anoinjkmu sh-ud be lo Sw LA Lbmud.

146 -
TABLE 2: LA PENINSULA REFINERY. ORIENTE VERSUS SYN ETIC CRUDE
A: Imaort Pavr PTeu for Clen Product:
Can 1 2 1 2
Crude Type Orient Synthaic Oriente Synuhetic1-MD/Ycar- -Values. USSfB- Basin
Cude MBNYeazr 1=10 S910 1620 21.55 Synth: 1.6' Orien
Produda. MWYecar.Guoline 2100 3315 25.14 27.35 Impot Pity
3euiKro AS& 650 24.30 24.30
Dimi 2796 2333 23.40 23.40
Fuel Oil 6643 3333 11.00 11.00 Expoer Parity
FUWl,oan 1.5% 13 134 0.00 0.00
ToWl 110 8910
Gram Margin Smmyear 5.6 -1.5
Opemiag Camta 10.3 6.6
Noargin -S3 4.1
3. P~for lo fu.Pvadu
Cans 1 2 1 2.
Cawd Type Oriouz Synthci. Ori;tA Syntheic-.M BtYU.-. -Valu. US/B- Bask
Cnas MIYCw 12=10 3910 1620 20.22 Rea 1.68 0t1
P? MWYOtr
Gaolims 2100 33U5 19.50 26.00 Domano prim
iUiKaga 4U 650 1.90 1.90
D;as 2796 23U 1.90 18.90
Fuel Oil 6643 2353 11.00 11.00 ExporiParky
Fueld/LI, 15 S lt3 134 0.00 0.00
ToWs! 1230 t910
Oaes Masr Sunluymr -21.7 4.1
Opmmuimg C4in S10 6.
.Not moron-32A -l5A
Nelc Pxhin tAYhm paPeinmdor ttpoaofMay, 1992. Exci fotr d ol. bad oan Pb'ls USO apo lm fF ld N a e an mum a or diiillmdom irio.

- 147 --
TABLE 23
DISTRIRUCION TRIMESTRAL DE KEREX FOR CIUlDADES
ZONA NORTnE I TRIMESNnR 1992 I lTmiLEs 19u l91 vARIuACOrECAULOhNES G)ALOhNES
Ctuibo 129,192 292.11- l^Latacunga 21,000 37X5S- 4Ambato 152.000 166;25Riabaulba 39,425 57,0 -31Sto domingo 89,270 151,926 -41EsimeraJdas 84343 75.7 16Shushufincii 32320 57,592 - 43Cuenca 2021i00 269,A48 - 24
ZONA SURGuayaquil U1208.937 2,306,21 -47--Lunta 263,100 137,587 9Pfurnusuh 8,0904MachaJa e86o 194,16214. 119AS80 120TotalbL Nackw 2,477790 4W.U953
FUm4:h PEIROCOMERCAL
TAKBE 24CONSUMO DE KULCE Y DIESEL 1
h .ES DE CALONES
ANOS 1985-1992
ANOS ICE DIE IEL1
198S 92,853
1986 88,1451987 46W79 15,1121988 33,7M 2291198 2Ct0 2249131990 418o6 12A0461991 164,24 i1s"319929 4V6 8X3
*ENERO- LJUIOFV: PEMOECUADOR BiFORMES ESTASTICOSFTABOR.AcIOl4: BANCO MUNDILL

- 148-
TAILEDV04TA 0E ] Pi LAS FtLIAS U11KE DE QUITO
AGCIO DE 1992
DEScRWCtIN FERXA i F-RcA l FEP.AM m
OEMAN- N5MERO 2UEMAN- -'JMUO DE"N- STJMERO DEOAN- % %,Us, DANTES CALONES )ANTES CALCNTS DANZES CALNES DANIES CEAlUN
A 63 4O 93 733 115 O7 271 65. 1AM 321BAOS is 2Y 0 v 3 c 2J 7.1 Sv.8 U.FABNICAD CC A a 215 . 35 5 3 15 3.J 33A 17wALUMBRADO 9 32 as 4J 171 1448 7.2POO Y MADE£A 4 :5 1 4 3 12 a 2.0 41D 2.1FUND(C3J 12 104 1 30 3 35 16 4.1 lea SiOTIOS 2 0 1 30 6 43 9 2.3 40. 4
TOrAL 113 1065 ILS 116 la 791 395 l0o. 2.. lo.OWTKIUIOON NOWLAAL 240 mm 6AOPAXIC1PAO 1% 4J5 47 39.6
FU`NM DeKr:A2 Dat&CrAELA8OXACCN: SAN1O MUNCL1
TA13.X S?RISCIO VUL KOM V4 LAS SUIA sM Y EN IUUvOS 71IJS
`1100 DE RANG DE FR1 jTANQnD PY3 * RLI4
Qt=O 70 250 27NCAYAQUIL 2U .
CA 40 36W3 350AMIA U~~~~~g 3000 93
~~~~~~~~~~~o 3wm 39040 300 2N040 U 2O 300
C=U~~~~~~~~~s *0 2 2SSAZ 70 1.4 25
R 30. 32M 00ICJITrr A 7 4000 m
n111RC BAa .
RMnuN INO ^AL

TABLE 27: CONSUMO DE COMBUSTIBLES EN EL SECTOR DOMESTICO: 1982I *'o I
VIVIUNiAS VENTAS VENTAS SEC. ROMEDIOJ IPROXtEDIO *CONSUMO DIFERENC. RELACIONQUID WAN TOTAL TOTAL ANUALAS DOMESTIO VIVEDA l(AEITANTES EMMADO RESPECTO RESPECTO
K |IR HALIT. VIVlEN. ICALONESI (CALONS) (CAIMES) VIVIENDA ANIJAL (CL.) A VENTAS A VENTASAzuey 15151 42019 94993 55889S 44152 24 4.7 1f692006 2723261 61.7%Dalh 184I 145959 30420 1132500 8475 40 4 R 212792 681883 76 2%Cur S6W7 174510 371U 6066324 4806196 70 47 641248 4166948 86 7%Ccl 5618 127779 25229 1324470 1046331 15 5I 6h410 362221 34 6%Cotopi 3124 277678 58079 9909 7M2311 21 4 h 3584J3 424348 54 2%C?mbO ao 7771 316948 71313 214080 1691232 18 4 4 828910 862322 51 0%.ElOm 33756 334872 64093 5916280 4673861 12 S 2 4232826 441035 09 4%Esmunklm 3S23 249003 44664 198240 1573610 34 5 6 512199 1066410 67.6%Cuayi 106953 2M8454 :84498 53864139 42552670 34 5 3 13227446 29325224 68.9%InmbWuir 33 2472"7 51315 692540 547137 6 4.8 951965Loa 7309 360767 71300 2460630 1943677 22 5.1 587578 1056)99 54.3 I
Los Rios 20(30 455869 82002 7438(31 5876034 24 5 6 272S80 3150276 53.6%manb 9665 68598 144436 41W616 3241067 28 6 0 1394943 1846124 57 Of%.M eorM SenL 429 70217 13444 229160 181036 35 5 2 53775 127261 70.3%Napo.Sucumblas 1416 115110 20310 55601 430073 26 5.7 192609 247263 562%Pbaza 363 317 9 5975 322800 255012 58 53 46974 20883 81 6%pkfcb ba 3890 1382125 289191 9498035 75064 16 4 8 4-162969 3040479 40 5%Tummrsua 7197 326m 70303 1093000 863420 10 4 6 802861 60609 07.0%.Z2a Cldnch. 521 46691 8922 60600 47874 8 5 2 65436Capmgoe 6119 1265 0 0 4.8 10797Zo,nodell. 1357 42156 7545 0 0 56 181966
TOTAL 276676 8060712 1576441 105496581 83342299 25 5 1 33953020 49389279 59-30%
Se estima un cons=t) esp flfco de 2 VI./Ines/hab.

TABE 2 CONSiJMO DE COMBUSTILES IN I LSUCIt DOMESTICO: 190
VIVIENDD VENrAS VENUA S EC. 1IoWEIoI FpIOMEDoI o CONSUMO DIFERENC. RELACION
QtUNVSAN TOTAL TOTAL ANtIALIS DOMtCO ., YJDY A IIAIffANTES ESTIMADO RES50CTO RESPECTO
KEREX IIAblY. VIVIDU. (CALONES) (CALONb) jGALMES) VIVIENDA ANtlAL (CI A VENTAS A VENlAS
Axan 977 5W06090 14355 2017612 -115- 161 3.4 79l1 107435 95 8%
Ida 11M I S 62623 9o0 am'U 62 36 10130 76350 183%
U17 11947 53420 596000 56 3 53 3 5 754SS 4(4785 865%
Cwdd 129 141482 33223 isSM 14s0 94 4 3 11114 132516 910%
CS" 171 276324 76693 50 m19 290 36 151392 M0591 975%
Cg&fazzo 227 364682 loom 193110 law 67 3 6 19854 1(1669 69.1%
Ot s5306 41257 96ff3 2252750 211)5 33 4 3 542107 IS75483 74 4%
bowalAs 306 306623 6969S S25050 447 134 4 4 31309 461238 93 5%
C;uys low7 2515146 570124 26"376 246 112 4.4 1940423 22756917 92.1%
Iwpabura 162 2654 65211 439447 4t120 212 4.1 15830 397251 962%
L* 90 386" 9974 527076 49541 45 38 38155 411596 131%
Lts lws 3S30 52795 115427 400 U132 1 4 6 31213
labir 1338 103192 216959 79438 7 46 4 6 152714 593H70 79 5%
Mm A' L 56 84216 2146 0 a 0 39 s272
M.9 .5.nmbios 130 11M39 41743 65u2I7 611204 392 4.3 13479 597s 77 H%
rwas 32 41811 9m 0 0 0 4 3 3286
l uda 1538 1756221 443310 5871455 5519163 299 4.0 146222 5172916 97 4%
Togwuba 1" '361960 97445 756400 711016 353 3.7 14978 6MM038 97.9%
ZM MChhe h 63 66167 17596 0 - 0 0 3 6 5666
; Sloi 5 91s5 2S73 0 0 0 38 4S6
Zmmnodell. 152 70621 16066 0 a 0 4 4 11416
raJrAL 34537 964819 2339251 41846J21 393301S4 95 4.1 341t1686 35911497 91.30%
*S e>aUma sUR mnsumo 5p.dllco de 2 gal/.nicIsb.

TABLE 29: CONSUMO DE COMBUSTIBLES EN EL SECTOR DOMESTICO5 199
VIVIENDAS VENTAS VENTASSEC PtlOEDIof FROMEDIG CoNSUMO DIFERENC. RELACIONQOIUSAN TOTAL TOTAL ANUALES DOM!S0NCO IVUIDA IIADITANTES ESTIMADO REScro RESPECrO
lmsex HABFf. VIVIUN (GALONES) (GALON3 IGAAUMES) VIVIENDA ANIJAL ECL) A VENTAS A VENTAS
ZONA NORMh 3757 3841210 990613 9t49179 I" 3 9 3535 b /1 B311)f 96%
ZONA StR 31515 5882595 138f)52 32591442 30635955 di 42 3210211 27124741 9(m7
rtLA L 35272 9766915 2176615 41540621 39330184 93 4 1561772 WI764I2 912
TABLE30: CONSUMO DE COMBUSTIBLES EN EL SECTOR DOMESTICO: 1M
VIVIENDAS VENTAS VENTASSWC VIOMUDIGI VRO8EI)10 'CONSUMO DIFERENC. iELACIONQU3 WAN TOTAL TOTAL ANUAL1S DOMElO YWIVIUDA IHAUITANTES ESTIMADO RI:S2ECTO RESPECO;
IREKtX HASIT. VIVEN. fCALONES) (GAELO ECALMPS VIVIENDA ANtlALICL) A VENTAS A VENTAS
ZONA NORTE 76472 3074491 636379 15617586 1750W! 19 48 MAW661S ti 13646 49%
ZONA SUR 198U4 4944065 932517 86878995 81666255 34 5 3 25302166 Sl)B49 69%
TarAL 275319 8I1RS56 16889 X196581 99166M 30 5 1 34169051 64997715 6%
TAILE 31: CONSUMO DR COMBUSTIBLES EN EL SECTOR DOMEMCO 199
VIVIENDAS VENTAS VENTAS SiC, VUOMEDIOI PROMEDIO CONSUIMu DIFERENC RELACIONQUIIUSAN TOTAL TOTAL ANUALES DOWMlCO VIVIWIDA IIAUI1ANTES ESTIMADO RESPECTO RESPECao
11ltO3 HAIIT, ViVIEN. (CALONES) fGAWONM AIJUMES) VIVIENI)A ANIII (IC.) A VFNTAS A VENTAS
ZONA NORTM 1925 3753430 984299 3699193 337722 15 E 3s 177(68 3299642 95%
ZONASUR 25113 6012W0 1456611 12424I88 116191 39 41 2409%18 9199652 7'1%
roTaAL 2m 1 2440910 I612mt isisU 47 40 266616 124924 12%

- 152
Table 32
VOLUMEN EN GALONES Y PUESTOS DE DISTRIBUaION DE XCEREXJUNIO DE 1992
DESCRIPCION GALONES % PUESTOS DE PROMEDIO
DSTUCION GAL:ONES_ ~~~~~~~~~~~~~~~~~POR PUES.
COM1JNID. SEC. RUR. 190.338 5CZ9 n1 873CASAS DE SALU. Y CAS. REL 1665 SD 13 I'mPUESTOS JOS ilo1,000 0.3 1 1,000'yTNTAS DMECrAS 600 02 1 600TCOrAL VENDIDO 334.485 100 261 1=21
OFERTA TEORICA 1,096,957
FUENTE: PETROCOMERCIALELABORACION: BANCO MUNDIAL
Table 33
VENTA DE KE I EN LAS FEMaAS l Y OFA TEORICAUN1O DE 1992
CIUDAD VOLULMEN OFMTA PCA| _DISIRIBUID0 TECRICA D! LA oFrUA
TECAa ~~~~~~b a/b
IBARRA M2A39 3,0009LA~TACUNGA 4,000 1 000 AMBAT0 12,50 7!1iO6.7000ESMERALDAS 4,00 40W00 100
STO.DOMINGO 9,600 70,000MACHALA 201=73 702000 IATA sw800 70,OW0
23M00 7U,000 HUSHUFINDI w10p00 234000
TOTAL UM147 531200
FUENT PE: hOCOMURALELABORACION: BANCO MUNDALJ

Joint UNDP/World BankENERGY SECTOR MANAGEMENT ASSISTANCE PROGRAMME (ESMAP)
LIST OF REPORTS ON COMPLETED ACTIVITIES
Region/Count Actvity/Report Title Date Number
SUB-SAHARAN AFRICA (AFR)
Africa Regional Anglophone Africa Household Energy Workshop (English) 07/88 085/88Regional Power Seminar on Reducing Electric Power System
Losses in Africa (English) 08/88 087/88Institutional Evaluation of EGL (English) 02/89 098/89Biomass Mapping Regional Workshops (English - Out of Print) 05/89 --Francophone Household Energy Workshop (French) 08/89 103/89Interafrican Electrical Engineering College: Proposals for Short-and Long-Term Development (English) 03/90 112/90
Biomass Assessment and Mapping (English - Out of Print) 03/90 --Angola Energy Assessment (English and Portuguese) 05/89 4708-ANG
Power Rehabilitation and Technical Assistance (English) 10/91 142/91Benin Energy Assessment (English and French) 06/85 5222-BENBotswana Energy Assessment (English) 09/84 4998-BT
Pump Electrification Prefeasibility Study (English) 01/86 047/86Review of Electricity Service Connection Policy (English) 07/87 071/87Tuli Block Farms Electrification Study (English) 07/87 072/87Household Energy Issues Study (English - Out of Print) 02/88 --Urban Household Energy Strategy Study (English) 05/91 132/91
Burkina Faso Energy Assessment (English and French) 01/86 5730-BURTechnical Assistance Progran (English) 03/86 052/86Urban Household Energy Strategy Study (English and French) 06/91 134/91
Burundi Energy Assessment (English) 06/82 3778-BUPetroleum Supply Management (English) 01/84 012/84Status Report (English and French) 02/84 011/84Presentation of Energy Projects for the Fourth Five-Year Plan
(1983-1987) (English and French) 05/85 036/85Improved Charcoal Cookstove Strategy (English and French) 09/85 042/85Peat Utilization Project (English) 11/85 046/85Energy Assessment (English and French) 01/92 9215-BU
Cape Verde Energy Assessment (English and Portuguese) 08/84 5073-CVHousehold Energy Strategy Study (English) 02/90 110/90
Central AfricanRepublic Energy Assessement (French) 08/92 9898-CAR
Chad Elements of Strategy for Urban Household EnergyThe Case of N'djamena (French) 12/93 160/94
Comoros Energy Assessment (English and French) 01/88 7104-COMCongo Energy Assessment (English) 01/88 6420-COB
Power Development Plan (English and French) 03/90 106/90Cote d'lvoire Energy Assessment (English and French) 04/85 5250-IVC
Improved Biomass Utilization (English and French) 04/87 069/87Power System Efficiency Study (Out of Print) 12/87 --Power Sector Efficiency Study (French) 02/92 140/91
Ethiopia Energy Assessment (English) 07/84 4741-ET

Region/Countv Acdvity/Repofl 7tie Date Number
Ethiopia Power System Efficiency Study (English) 10/85 045/85Agricultural Residue Briquetting Pilot Project (English) 12/86 062/86Bagasse Study (English) 12/86 063/86Cooking Efficiency Project (English) 12/87 --
Gabon Energy Assessment (English) 07/88 6915-GAThe Gambia Energy Assessment (English) 11/83 4743-GM
Solar Water Heating Retrofit Project (English) 02/85 030/85Solar Photovoltaic Applications (English) 03/85 032/85Petroleum Supply Management Assistance (English) 04/85 035/85
Ghana Energy Assessment (English) 11/86 6234-GHEnergy Rationalization in the Industrial Sector (English) 06/88 084/88Sawmill Residues Utilization Study (English) 11/88 074/87Industrial Energy Efficiency (English) 11/92 148/92
Guinea Energy Assessment (Out of Print) 11/86 6137-GUIHousehold Energy Strategy (English and French) 01/94 163/94
Guinea-Bissau Energy Assessment (English and Portuguese) 08/84 5083-GUBRecommended Technical Assistance Projects (English &
Portuguese) 04/85 033/85Management Options for the Electric Power and Water Supply
Subsectors (English) 02/90 100/90Power and Water Institutional Restructuring (French) 04/91 118/91
Kenya Energy Assessment (English) 05/82 3800-KEPower System Efficiency Study (English) 03/84 014/84Status Report (English) 05/84 016/84Coal Conversion Action Plan (English - Out of Print) 02/87 --Solar Water Heating Study (English) 02/87 066/87Peri-Urban Woodfuel Development (English) 10/87 076/87Power Master Plan (English - Out of Print) 11/87 --
Lesotho Energy Assessment (English) 01184 4676-LSOLiberia Energy Assessment (English) 12/84 5279-LBR
Recommended Technical Assistance Projects (English) 06/85 038/85Power System Efficiency Study (English) 12/87 081/87
Madagascar Energy Assessment (English) 01/87 5700-MAGPower System Efficiency Study (English and French) 12/87 075/87
Malawi Energy Assessment (English) 08/82 3903-MALTechnical Assistance to Improve the Efficiency of Fuelwood
Use in the Tobacco Industry (English) 11/83 009/83Status Report (English) 01/84 013/84
Mali Energy Assessment (English and French) 11/91 8423-MLIHousehold Energy Strategy (English and French) 03/92 147/92
Islamic Republicof Mauritania Energy Assessment (English and French) 04/85 5224-MAU
Household Energy Strategy Study (English and French) 07/90 123/90Mauritius Energy Assessment (English) 12/81 3510-MAS
Status Report (English) 10/83 008/83Power System Efficiency Audit (English) 05/87 070/87Bagasse Power Potential (English) 10/87 077/87
Mozambique Energy Assessment (English) 01/87 6128-MOZHousehold Electricity Utilization Study (English) 03/90 113/90
Namibia Energy Assessment (English) 03/93 11320-NAM

- 3 -
Region/Coanty Activity/Report 7tle Date Number
Niger Energy Assessment (French) 05/84 4642-NIRStatus Report (English and French) 02/86 051/86Improved Stoves Project (English and French) 12/87 080/87Household Energy Conservation and Substitution (English
and French) 01/88 082/88Nigeria Energy Assessment (English) 08/83 4440-UNI
Energy Assessment (English) 07/93 11672-UNIRwanda Energy Assessment (English) 06/82 3779-RW
Energy Assessment (English and French) 07/91 8017-RWStatus Report (English and French) 05/84 017/84Improved Charcoal Cookstove Strategy (English and French) 08/86 059/86Improved Charcoal Production Techniques (English and French) 02/87 065/87Commercialization of Improved Charcoal Stoves and Carbonization
Techniques Mid-Term Progress Report (English and French) 12/91 141/91SADCC SADCC Regional Sector: Regional Capacity-Building Program
for Energy Surveys and Policy Analysis (English) 11/91 --Sao Tomeand Principe Energy Assessment (English) 10/85 5803-STP
Senegal Energy Assessment (English) 07/83 4182-SEStatus Report (English and French) 10/84 025/84Industrial Energy Conservation Study (English) 05/85 037/85Preparatory Assistance for Donor Meeting (English and French) 04/86 056/86Urban Household Energy Strategy (English) 02/89 096/89Industrial Energy Conservation Program 05/94 165/94
Seychelles Energy Assessment (English) 01/84 4693-SEYElectric Power System Efficiency Study (English) 08/84 021/84
Sierra Leone Energy Assessment (English) 10/87 6597-SLSomalia Energy Assessment (English) 12/85 5796-SOSudan Management Assistance to the Ministry of Energy and Mining 05/83 003/83
Energy Assessment (English) 07/83 4511-SUPower System Efficiency Study (English) 06/84 018/84Status Report (English) 11/84 026/84Wood Energy/Forestry Feasibility (English - Out of Print) 07/87 073/87
Swaziland Energy Assessment (English) 02/87 6262-SWTanzania Energy Assessment (English) 11/84 4969-TA
Peri-Urban Woodfuels Feasibility Study (English) 08/88 086/88Tobacco Curing Efficiency Study (English) 05/89 102/89Remote Sensing and Mapping of Woodlands (English) 06/90 --Industrial Energy Efficiency Technical Assistance
(English - Out of Print) 08/90 122/90Togo Energy Assessment (English) 06/85 5221-TO
Wood Recovery in the Nangbeto Lake (English and French) 04/86 055/86Power Efficiency Improvement (English and French) 12/87 078/87
Uganda Energy Assessment (English) 07/83 4453-UGStatus Report (English) 08/84 020/84Institutional Review of the Energy Sector (English) 01/85 029/85Energy Efficiency in Tobacco Curing Industry (English) 02/86 049/86Fuelwood/Forestry Feasibility Study (English) 03/86 053/86Power System Efficiency Study (English) 12/88 092/88

Region/Countxy Actvity/Repot Title Date Number
Uganda Energy Efficiency Improvement in the Brick andTile Industry (English) 02/89 097/89
Tobacco Curing Pilot Project (English - Out of Print) 03/89 UNDP TerminalReport
Zaire Energy Assessment (English) 05/86 5837-ZRZambia Energy Assessment (English) 01/83 4110-ZA
Status Report (English) 08/85 039/85Energy Sector Institutional Review (English) 11/86 060/86
Zambia Power Subsector Efficiency Study (English) 02/89 093/88Energy Strategy Study (English) 02/89 094/88Urban Household Energy Strategy Study (English) 08/90 121/90
Zimbabwe Energy Assessment (English) 06/82 3765-ZIMPower System Efficiency Study (English) 06/83 005/83Status Report (English) 08/84 019/84Power Sector Management Assistance Project (English) 04/85 034/85Petroleum Management Assistance (English) 12/89 109/89Power Sector Management Institution Building
(English - Out of Print) 09/89
Charcoal Utilization Prefeasibility Study (English) 06/90 119/90Integrated Energy Strategy Evaluation (English) 01/92 8768-ZIM
EAST ASIA AND PACIFC (EAP)
Asia Regional Pacific Household and Rural Energy Seminar (English) 11/90 --
China County-Level Rural Energy Assessments (English) 05/89 101/89Fuelwood Forestry Preinvestment Study (English) 12/89 105/89Strategic Options for Power Sector Reform in China (English) 07/93 156/93
Fiji Energy Assessment (English) 06/83 4462-FUIndonesia Energy Assessment (English) 11/81 3543-IND
Status Report (English) 09/84 022/84Power Generation Efficiency Study (English) 02/86 050/86Energy Efficiency in the Brick, Tile and
Lime Industries (English) 04/87 067/87Diesel Generating Plant Efficiency Study (English) 12/88 095/88Urban Household Energy Strategy Study (English) 02/90 107/90Biomass Gasifier Preinvestment Study Vols. I & 11 (English) 12/90 124/90
Lao PDR Urban Electricity Demand Assessment Study (English) 03/93 154/93Malaysia Sabah Power System Efficiency Study (English) 03/87 068/87
Gas Utilization Study (English) 09/91 9645-MAMyanmar Energy Assessment (English) 06/85 5416-BAPapua New
Guinea Energy Assessment (English) 06/82 3882-PNGStatus Report (English) 07/83 006/83Energy Strategy Paper (English - Out of Print) -- --
Institutional Review in the Energy Sector (English) 10/84 023/84Power Tariff Study (English) 10/84 024/84
Philippines Commercial Potential for Power Production fromAgricultural Residues (English) 12/93 157/93

- 5 -
Region/Country Activity/Report Title Date Number
Solomon Islands Energy Assessment (English) 06/83 4404-SOLEnergy Assessment (English) 01/92 979/SOL
South Pacific Petroleum Transport in the South Pacific (English-Out of Print) 05/86 --Thailand Energy Assessment (English) 09/85 5793-TH
Rural Energy Issues and Options (English - Out of Print) 09/85 044/85Accelerated Dissemination of Improved Stoves and
Charcoal Kilns (English - Out of Print) 09/87 079/87Northeast Region Village Forestry and WoodfuelsPreinvestment Study (English) 02/88 083/88
Impact of Lower Oil Prices (English) 08/88 --Coal Development and Utilization Study (English) 10/89 --
Tonga Energy Assessment (English) 06/85 5498-TONVanuatu Energy Assessment (English) 06/85 5577-VAVietnam Rural and Household Energy-Issues and Options (English) 01/94 161/94Western Samoa Energy Assessment (English) 06/85 5497-WSO
SOUTH ASIA (SAS)
Bangladesh Energy Assessment (English) 10/82 3873-BDPriority Investment Program 05/83 002/83Status Report (English) 04/84 015/84Power System Efficiency Study (English) 02/85 031/85Small Scale Uses of Gas Prefeasibility Study (English -
(Out of Print) 12/88 --India Opportunities for Commercialization of Nonconventional
Energy Systems (English) 11/88 091/88Maharashtra Bagasse Energy Efficiency Project (English) 05/91 120/91Mini-Hydro Development on Irrigation Dams andCanal Drops Vols. 1, II and III (English) 07/91 139/91
WindFarm Pre-Investment Study (English) 12/92 150/92Power Sector Reform Seminar 04/94 166/94
Nepal Energy Assessment (English) 08/83 4474-NEPStatus Report (English) 01/85 028/84Energy Efficiency & Fuel Substitution in Industries (English) 06/93 158/93
Pakistan Household Energy Assessment (English - Out of Print) 05/88 --Assessment of Photovoltaic Programs, Applications, and
Markets (English) 10/89 103/89Sri Lanka Energy Assessment (English) 05/82 3792-CE
Power System Loss Reduction Study (English) 07/83 007/83Status Report (English) 01/84 010/84Industrial Energy Conservation Study (English) 03/86 054/86
EUROPE AND CENTRAL ASIA (ECA)
Eastern Europe The Future of Natural Gas in Eastern Europe (English) 08/92 149/92Poland Energy Sector Restructuring Program Vols. I-V (English) 01/93 153/93Portugal Energy Assessment (English) 04/84 4824-POTurkey Energy Assessment (English) 03/83 3877-TU

- 6 -
Region/Countiy Activity/Report litk Date Number
MIDDLE EAST AND NORTH AFRICA (MNA)
Morocco Energy Assessment (English and French) 03/84 4157-MORStatus Report (English and French) 01/86 048/86
Syria Energy Assessment (English) 05/86 5822-SYRElectric Power Efficiency Study (English) 09/88 089/88Energy Efficiency Improvement in the Cement Sector (English) 04/89 099/89Energy Efficiency Improvement in the Fertilizer Sector(English) 06/90 115/90
Tunisia Fuel Substitution (English and French) 03/90 --Power Efficiency Study (English and French) 02/92 136/91Energy Management Strategy in the Residential and
Tertiary Sectors (English) 04/92 146/92Yemen Energy Assessment (English) 12/84 4892-YAR
Energy Investment Priorities (English - Out of Print) 02/87 6376-YARHousehold Energy Strategy Study Phase I (English) 03/91 126/91
LATIN AMERICA AND THE CARIBBEAN (LAC)
LAC Regional Regional Seminar on Electric Power System Loss Reductionin the Caribbean (English) 07/89 --
Bolivia Energy Assessment (English) 04/83 4213-BONational Energy Plan (English) 12/87 --National Energy Plan (Spanish) 08/91 131/91La Paz Private Power Technical Assistance (English) 11/90 111/90Natural Gas Distribution: Economics and Regulation (English) 03/92 125/92Prefeasibility Evaluation Rural Electrification and Demand
Assessment (English and Spanish) 04/91 129/91Private Power Generation and Transmission (English) 01/92 137/91Household Rural Energy Strategy (English and Spanish) 01/94 162/94Natural Gas Sector Policies and Issues (English and Spanish) 12/93 164/93
Chile Energy Sector Review (English - Out of Print) 08/88 7129-CHColombia Energy Strategy Paper (English) 12/86 --Costa Rica Energy Assessment (English and Spanish) 01/84 4655-CR
Recommended Technical Assistance Projects (English) 11/84 027/84Forest Residues Utilization Study (English and Spanish) 02/90 108/90
DominicanRepublic Energy Assessment (English) 05/91 8234-DO
Ecuador Energy Assessment (Spanish) 12/85 5865-ECEnergy Strategy Phase I (Spanish) 07/88 --
Energy Strategy (English) 04/91 --
Private Minihydropower Development Study (English) 11/92 --
Energy Pricing Subsidies and Interfuel Substitution (English) 08/94 11798-ECEnergy Pricing, Poverty and Social Mitigation (English) 08/94 12831 -EC
Guatemala Issues and Options in the Energy Sector (English) 09/93 12160-GUHaiti Energy Assessment (English and French) 06/82 3672-HA
Status Report (English and French) 08/85 041/85Household Energy Strategy (English and French) 12/91 143/91
Honduras Energy Assessment (English) 08/87 6476-HOPetroleum Supply Management (English) 03/91 128/91

- 7 -
Region/Country Activity/Report Title Date Number
Jamaica Energy Assessment (English) 04/85 5466-JMPetroleum Procurement, Refining, and
Distribution Study (English) 11/86 061/86Energy Efficiency Building Code Phase I (English-Out of Print) 03/88 --Energy Efficiency Standards and
Labels Phase I (English - Out of Print) 03/88 --Management Information System Phase I (English - Out of Print) 03/88 --
Charcoal Production Project (English) 09/88 090/88FIDCO Sawmill Residues Utilization Study (English) 09/88 088/88Energy Sector Strategy and Investment Planning Study (English) 07/92 135/92
Mexico Improved Charcoal Production Within Forest Management for 08/91 138/91the State of Veracruz (English and Spanish)
Panama Power System Efficiency Study (English - Out of Print) 06/83 004/83Paraguay Energy Assessment (English) 10/84 5145-PA
Recommended Technical Assistance Projects (English-(Out of Print) 09/85 --
Status Report (English and Spanish) 09/85 043/85Peru Energy Assessment (English) 01/84 4677-PE
Status Report (English - Out of Print) 08/85 040/85Proposal for a Stove Dissemination Program inthe Sierra (English and Spanish) 02/87 064/87
Energy Strategy (English and Spanish) 12/90 --Study of Energy Taxation and Liberalization
of the Hydrocarbons Sector (English and Spanish) 120/93 159/93Saint Lucia Energy Assessment (English) 09/84 5111-SLU
St. Vincent andthe Grenadines Energy Assessment (English) 09/84 5103-STV
Trinidad andTobago Energy Assessment (English - Out of Print) 12/85 5930-TR
GLOBAL
Energy End Use Efficiency: Research and Strategy(English - Out of Print) 11/89 --
Guidelines for Utility Customer Management andMetering (English and Spanish) 07/91 --
Women and Energy--A Resource GuideThe International Network: Policies and Experience (English) 04/90 --
Assessment of Personal Computer Models for EnergyPlanning in Developing Countries (English) 10/91 --
Long-Term Gas Contracts Principles and Applications (English) 02/93 152/93Comparative Behavior of Firms Under Public and PrivateOwnership (English) 05/93 155/93
10/31/94