68358 - World Bank Documents
322
CLIMATE CHANGE, DISASTER RISK, AND THE URBAN POOR Cities Building Resilience for a Changing World Judy L. Baker, editor Public Disclosure Authorized Public Disclosure Authorized Public Disclosure Authorized ublic Disclosure Authorized Public Disclosure Authorized Public Disclosure Authorized Public Disclosure Authorized ublic Disclosure Authorized
-
Upload
khangminh22 -
Category
Documents
-
view
0 -
download
0
Transcript of 68358 - World Bank Documents

CLIMATE CHANGE, DISASTER RISK, AND THE URBAN POORCities Building Resilience for a Changing World
Judy L. Baker, editor
Pub
lic D
iscl
osur
e A
utho
rized
Pub
lic D
iscl
osur
e A
utho
rized
Pub
lic D
iscl
osur
e A
utho
rized
Pub
lic D
iscl
osur
e A
utho
rized
Pub
lic D
iscl
osur
e A
utho
rized
Pub
lic D
iscl
osur
e A
utho
rized
Pub
lic D
iscl
osur
e A
utho
rized
Pub
lic D
iscl
osur
e A
utho
rized
wb406484
Typewritten Text
wb406484
Typewritten Text
68358


CLIMATE CHANGE, DISASTER RISK, AND THE URBAN POOR


CLIMATE CHANGE, DISASTER RISK, AND THE URBAN POORCities Building Resilience for a Changing WorldJudy L. Baker, Editor

© 2012 Th e International Bank for Reconstruction and Development / Th e World Bank
1818 H Street NW
Washington DC 20433
Telephone: 202-473-1000
Internet: www.worldbank.org
All rights reserved
1 2 3 4 15 14 13 12
Th is volume is a product of the staff of the International Bank for Reconstruction and
Development / Th e World Bank. Th e fi ndings, interpretations, and conclusions expressed
in this volume do not necessarily refl ect the views of the Executive Directors of Th e World
Bank or the governments they represent.
Th e World Bank does not guarantee the accuracy of the data included in this work. Th e
boundaries, colors, denominations, and other information shown on any map in this work
do not imply any judgement on the part of Th e World Bank concerning the legal status of
any territory or the endorsement or acceptance of such boundaries.
Rights and Permissions
Th e material in this publication is copyrighted. Copying and/or transmitting portions or
all of this work without permission may be a violation of applicable law. Th e International
Bank for Reconstruction and Development / Th e World Bank encourages dissemination of
its work and will normally grant permission to reproduce portions of the work promptly.
For permission to photocopy or reprint any part of this work, please send a request
with complete information to the Copyright Clearance Center Inc., 222 Rosewood Drive,
Danvers, MA 01923, USA; telephone: 978-750-8400; fax: 978-750-4470; Internet: www.
copyright.com.
All other queries on rights and licenses, including subsidiary rights, should be
addressed to the Offi ce of the Publisher, Th e World Bank, 1818 H Street NW, Washington,
DC 20433, USA; fax: 202-522-2422; e-mail: [email protected].
ISBN: 978-0-8213-8845-7
eISBN: 978-0-8213-8960-7
DOI: 10.1596/978-0-8213-8845-7
Cover design: Naylor Design, Inc.
Cover photo: iStockphoto.com
Library of Congress Cataloging-in-Publication Data has been requested

■ v
Foreword xiii
Acknowledgments xv
Abbreviations xvii
Overview 1
Recommended Actions to Build Resilience of the Urban Poor 2
Chapter 1. Vulnerable Cities: Assessing Climate Change and Disaster Risk in Urban Centers of the Developing World 7
Introduction and Objective of the Study 7Background, Analytical Framework, and Approach 9Climate Change, Disaster Risk, and Urban Areas: Assessing Hazard Risk 12Efforts to Estimate Exposure in Cities 22Notes 23References 23
Chapter 2. Vulnerability of the Urban Poor 27
Exposure: Location and Settlement Patterns of the Urban Poor 28Climate Change, Disaster Risk, and the Delivery of Basic Services for the Urban Poor 38Other Key Issues Affecting the Vulnerability of the Urban Poor 51
Contents

vi ■ CONTENTS
Notes 58References 59
Chapter 3. Building Resilience for the Urban Poor 63
Assessing Risk at the City and Community Levels to Inform Decision Making and Action Planning 64Integrating Climate Change and Disaster Risk Reduction Policies for the Poor into Urban Planning and Management 70Balancing Policy Tradeoffs among Risk Reduction, Urban Development, and Poverty Reduction in Decision Making 76Strengthening Institutional Capacity to Deliver Basic Services and Reduce Vulnerability to Climate and Disaster Risk 86Bridging Communities and Local Governments to Work Together on Local Solutions 89Notes 94References 94
Chapter 4. Opening New Finance Opportunities for Cities to Address Pro-poor Adaptation and Risk Reduction 99
Costing Adaptation and Risk Reduction 100Sources of Financing for Adaptation and Risk Reduction 103Bringing It All Together 121Notes 122References 122
Annex 1: Literature Review 125
Linking Climate Change and DRR 128Climate Change, DRR, and Urban Poverty 128Service Delivery and the Urban Poor 129Housing 131Climate Change: Adaptation and Mitigation 132Finance 134Gaps in Existing Literature 134References 135

CONTENTS ■ vii
Annex 2: Efforts to Estimate Exposure in Cities 141
OECD Study on Ranking Port Cities with High Exposure and Vulnerability to Climate Extremes 141Munich Re’s Study on Megacities—Megacities Megarisks 143GFDRR—Economics of Disaster Risk Reduction 144Mega-Stress for Mega-Cities: A Climate Vulnerability Ranking of Major Coastal Cities in Asia 144Earthquake Disaster Risk Index 145Multi-Hazard City Risk Index (MHCRI) 145Note 146References 146
Annex 3: Learning from Project and Program Experiences: Individuals, Community, and Local Government Partnering to Manage Risk 149
Introduction 149Educate—Good Practices in Knowledge Sharing and Training 151Identify—Good Practices in Risk Identifi cation 155Prepare—Good Practices in Risk Reduction through Early-Warning Systems 158Mitigate—Good Practices in Risk Reduction through Mitigation 160Flood Management and Urban Planning 160Water Supply and Sanitation 163Wastewater Management and Energy 164Water Supply and Energy Effi ciency 165Neighborhood Upgrading 166Job Creation 167Transfer—Recent Practices in Risk Defl ection 168Recover—Good Practices in Building-Back-Better 170Lessons Learned and Recommendations 173Notes 177References 177
Annex 4: Dar es Salaam Case Study 181
Overview and Key Findings 181Case Study Summary 186Reference 197

viii ■ CONTENTS
Annex 5: Jakarta Case Study 199
Overview and Key Findings 199Case Study Summary 204Notes 215Reference 215
Annex 6: Mexico City Case Study 217
Overview and Key Findings 217Case Study Summary 220Notes 233Reference 233
Annex 7: São Paulo Case Study 235
Overview and Key Findings 235Case Study Summary 239Notes 267Reference 267
Color Section 269
Index 277
Boxes
1.1 Increase in the Number of Heat Waves in the Mexico City Metropolitan Area (MCMA) 21
2.1 Locating Vulnerable Households in the Mexico City Metropolitan Area (MCMA) 31
2.2 Jardim Ana Maria: A Slum Pocket in São Paulo 332.3 São Paulo’s Geotechnical Hazard Areas and Declivity
Hazard Areas 352.4 Pattern between Flood-Prone Areas and Where the Poor
Live in Jakarta 362.5 Exposure in Slums of South Asia and Latin America 372.6 Water Supply in Dar es Salaam 432.7 Water Scarcity in Mexico City 452.8 Incidents of Dengue in Jakarta 502.9 Settlements and Environmentally Sensitive Lands 523.1 Urban Risk Assessment 663.2 Lessons Learned from Carrying out City-level Risk
Assessments under the Mayor’s Task Force 67
CONTENTS ■ ix
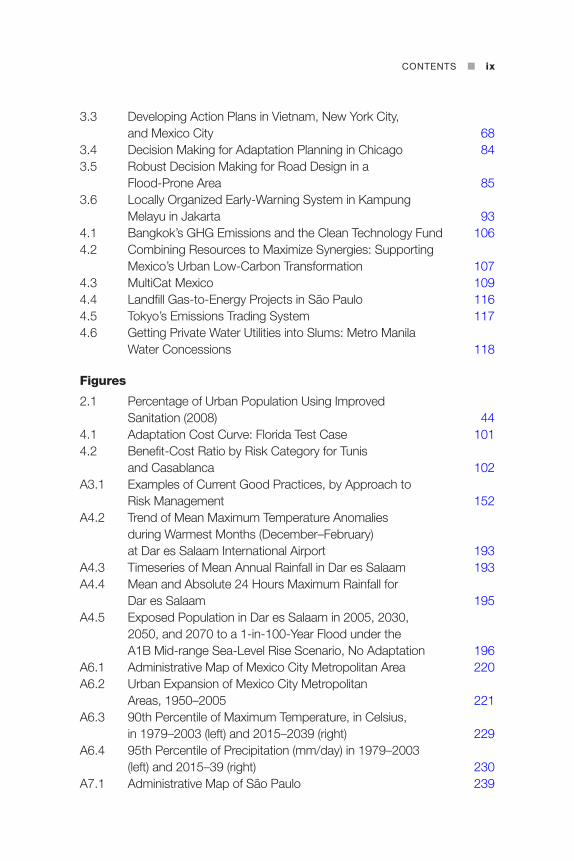
3.3 Developing Action Plans in Vietnam, New York City, and Mexico City 68
3.4 Decision Making for Adaptation Planning in Chicago 843.5 Robust Decision Making for Road Design in a
Flood-Prone Area 853.6 Locally Organized Early-Warning System in Kampung
Melayu in Jakarta 934.1 Bangkok’s GHG Emissions and the Clean Technology Fund 1064.2 Combining Resources to Maximize Synergies: Supporting
Mexico’s Urban Low-Carbon Transformation 1074.3 MultiCat Mexico 1094.4 Landfi ll Gas-to-Energy Projects in São Paulo 1164.5 Tokyo’s Emissions Trading System 1174.6 Getting Private Water Utilities into Slums: Metro Manila
Water Concessions 118
Figures
2.1 Percentage of Urban Population Using Improved Sanitation (2008) 44
4.1 Adaptation Cost Curve: Florida Test Case 1014.2 Benefi t-Cost Ratio by Risk Category for Tunis
and Casablanca 102A3.1 Examples of Current Good Practices, by Approach to
Risk Management 152A4.2 Trend of Mean Maximum Temperature Anomalies
during Warm est Months (December–February) at Dar es Salaam International Airport 193
A4.3 Timeseries of Mean Annual Rainfall in Dar es Salaam 193A4.4 Mean and Absolute 24 Hours Maximum Rainfall for
Dar es Salaam 195A4.5 Exposed Population in Dar es Salaam in 2005, 2030,
2050, and 2070 to a 1-in-100-Year Flood under the A1B Mid-range Sea-Level Rise Scenario, No Adaptation 196
A6.1 Administrative Map of Mexico City Metropolitan Area 220A6.2 Urban Expansion of Mexico City Metropolitan
Areas, 1950–2005 221A6.3 90th Percentile of Maximum Temperature, in Celsius,
in 1979–2003 (left) and 2015–2039 (right) 229A6.4 95th Percentile of Precipitation (mm/day) in 1979–2003
(left) and 2015–39 (right) 230A7.1 Administrative Map of São Paulo 239
x ■ CONTENTS
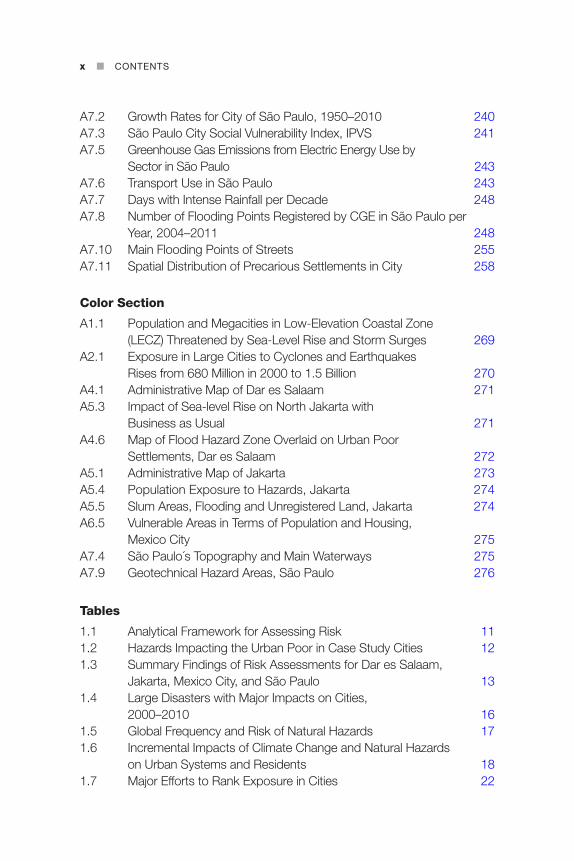
A7.2 Growth Rates for City of São Paulo, 1950–2010 240A7.3 São Paulo City Social Vulnerability Index, IPVS 241A7.5 Greenhouse Gas Emissions from Electric Energy Use by
Sector in São Paulo 243A7.6 Transport Use in São Paulo 243A7.7 Days with Intense Rainfall per Decade 248A7.8 Number of Flooding Points Registered by CGE in São Paulo per
Year, 2004–2011 248A7.10 Main Flooding Points of Streets 255A7.11 Spatial Distribution of Precarious Settlements in City 258
Color Section
A1.1 Population and Megacities in Low-Elevation Coastal Zone (LECZ) Threatened by Sea-Level Rise and Storm Surges 269
A2.1 Exposure in Large Cities to Cyclones and Earthquakes Rises from 680 Million in 2000 to 1.5 Billion 270
A4.1 Administrative Map of Dar es Salaam 271A5.3 Impact of Sea-level Rise on North Jakarta with
Business as Usual 271A4.6 Map of Flood Hazard Zone Overlaid on Urban Poor
Settlements, Dar es Salaam 272A5.1 Administrative Map of Jakarta 273A5.4 Population Exposure to Hazards, Jakarta 274A5.5 Slum Areas, Flooding and Unregistered Land, Jakarta 274A6.5 Vulnerable Areas in Terms of Population and Housing,
Mexico City 275A7.4 São Paulo´s Topography and Main Waterways 275A7.9 Geotechnical Hazard Areas, São Paulo 276
Tables
1.1 Analytical Framework for Assessing Risk 111.2 Hazards Impacting the Urban Poor in Case Study Cities 121.3 Summary Findings of Risk Assessments for Dar es Salaam,
Jakarta, Mexico City, and São Paulo 131.4 Large Disasters with Major Impacts on Cities,
2000–2010 161.5 Global Frequency and Risk of Natural Hazards 171.6 Incremental Impacts of Climate Change and Natural Hazards
on Urban Systems and Residents 181.7 Major Efforts to Rank Exposure in Cities 22

CONTENTS ■ xi
2.1 Impacts of Recent Disasters in Informal Settlements: The Philippines 41
2.2 Adaptation Strategies Applied during Heavy Rain 563.1 Consequences of Risk-Reduction Policies and Actions in
Urban Areas 783.2 Sectors for which Climate Change Should Be Incorporated
Due to Time Scale or Sensitivity to Climate Conditions 833.3 Capacity Programs Aimed at Knowledge Sharing, Education,
and Training for Urban Resilience 904.1 Current Sources of Financing and Instruments for
Climate Change, Disaster Risk, and Slum Improvements 1034.2 Summary of Catalytic Financing and Technical Assistance
Programs at the World Bank 1084.3 Main Instruments for Financing Climate Action in the
Urban Context 111A2.1 Port Cities with Populations over 1 Million Estimated to
Have Highest Increased Exposure to Surge-Induced Floods, 2005 to 2070 142
A3.1 Matrix of Recent Practice Cases 174A4.1 Dar es Salaam Profi le 187A4.2 Natural Hazards 192A4.3 Effects and Losses 194A4.4 Signifi cant Floods in Dar es Salaam, 1983–2006 194A5.1 Jakarta Profi le 205A5.2 Infrastructure Investments per Year DKI 209A5.3 Institutional Mapping of Disaster Risk Management
Functions 210A5.4 Natural Hazards 211A5.5 Jakarta’s Kota in National Ranking of Kabupaten or
Regencies at High Risk for Various Disasters 211A5.6 Main Climate Hazards 212A5.7 Social Assessment 214A6.1 Mexico City Profi le 222A6.2 Institutional Responsibilities Relating to Climate
and Disasters 224A6.3 Status of Main Projects to Adapt to Climate Change 226A6.4 Natural Hazards 228A6.5 Vulnerability Matrix in Terms of Population and Housing 231A6.6 Social Assessment 231A6.7 Distribution of Vulnerable Groups Located in High-Risk Zones 232A6.8 Costs in Terms of GDP and Additional Poor 233

xii ■ CONTENTS
A7.1 São Paulo Profi le 240A7.2 Institutional Mapping of Disaster Risk Management Functions 247A7.3 Natural Hazards 247A7.4 Hazards, Effects, and Losses 247A7.5 Climate Projection for Metropolitan São Paulo 250A7.6 Incidence of Hazardous Areas in Informal Settlements
in São Paulo 252A7.7 Degrees of Landslide Hazard 253A7.8 Cross-Referencing Data: Areas Ranked by Their Critical
Level and Types of Settlements in São Paulo 253A7.9 Social Assessment 254A7.10 Houses by Type of Precarious Settlements and
Administrative Regions of City Housing Secretariat 259A7.11 Access to Urban Services and Infrastructure in
Precarious Settlements in São Paulo 259A7.12 Number of Precarious Inhabitants per Level of Poverty 260

■ xiii
Th e number of people living in slums is on the rise all over the developing world.
Increasingly, as cities grow, marginal land is consumed by residents who cannot
aff ord to live elsewhere. Th is land is oft en on steep hillsides, fl ood plains, coastal
zones, or situated near hazardous waste, putting residents at high risk from the
impacts of climate change and natural hazards.
Slum dwellers typically live in poor quality and overcrowded housing, and
have limited access to water, energy, sanitation, and solid waste services. A
heavy rain can quickly turn to a disastrous fl ood. Such fl ooding can destroy
the assets of the poor, halt economic activity, destroy their productivity, and
interrupt their income. It can contaminate the water supply, lead to disease, and
displace populations.
Th is study calls on cities to take a lead role in proactively addressing the risks
of climate change and natural hazards at the local level, with a focus on popula-
tions at highest risk. It suggests a number of actions that cities can take to build
resilience, beginning with mainstreaming pro-poor risk reduction policies into
urban planning and management. Such policies—including those dealing with
land use, relocation, or new development—come with diffi cult tradeoff s that
must be carefully balanced in consultation with stakeholders at the local level.
Th ey also come with substantial fi nancing needs that must be met through
public and private resources, and will require new fi nancing opportunities.
Th e cities of the Mayor’s Task Force on Climate Change, Disaster Risk, and
the Urban Poor—Dar es Salaam, Jakarta, Mexico City, and São Paulo—provide
examples of good practice at the local level to address risk, through slum upgrad-
ing programs, early warning systems, safety net programs, and adaptation plan-
ning. Such examples demonstrate what is possible when local governments work
across boundaries—both administrative and institutional, and in collaboration
with communities—to develop and implement sustainable solutions.
Foreword

xiv ■ FOREWORD
We invite other cities to share successful examples of programs and policies
that have built resilience for the urban poor so that this knowledge can be broadly
disseminated. We also call upon the development community to work with cities
to identify fi nancing solutions for the pressing needs that are faced by the urban
poor in today’s changing environment. Th e World Bank is committed to support-
ing such eff orts through both our fi nancing and our global knowledge products
and services.
Rachel Kyte Sanjay Pradhan
Vice President Vice President
Sustainable Development Network World Bank Institute
Th e World Bank Th e World Bank

■ xv
Th is study was prepared by a team led by Judy L. Baker, lead economist, the
World Bank. Key contributions to the overall study and case studies were pro-
vided by Christa Anderson and Maria Catalina Ochoa. Background papers were
prepared by Anthony Bigio and Stephane Hallegatte (Planning, Policy, Synergies
and Tradeoff s for Urban Risk Management, Climate Change Adaptation and Pov-
erty Reduction); JoAnne Carmin, Sabrina McCormick, Sai Balakrishnan, and Eric
Chu (Institutions and Governance in a Changing Climate: Implications for Service
Provision for the Urban Poor); Soumya Dharmavaram (Courting Hazards: Where
the Urban Poor Live); Ari Huhtala, Daniel Hoornweg, and Marcus Lee (Climate
Finance for Cities); Kristina Katich (Beyond Assessment: A Review of Global Best
Practices Addressing Climate Change and Disaster Risk Management for the Urban
Poor, and Th e Impacts of Climate Change and Disasters on Urban Services); and
David Satterthwaite (How Local Governments Can Work with Communities in the
Delivery of Basic Services). Background research was conducted by Aafrin Kidwai
and Austin Kilroy.
Th e study was part of the work program of the Mayor’s Task Force on Climate
Change, Disaster Risk, and the Urban Poor, comprising the mayors of Dar es
Salaam, Jakarta, Mexico City, and São Paulo. David Miller, mayor of Toronto
(2003–10) and Chair of C–40 (the Large Cities Climate Change Group) (2008–
10) was an adviser to the Task Force.
Th e preparation of city-level case studies for Dar es Salaam, Jakarta, Mexico
City, and São Paulo were carried out as part of the work program, with teams
led by each city government. From the World Bank, these studies were led
by Eric Dickson (Mexico City), with Gisela Campillo, Marcus Lee, and Peter
Ellis (Jakarta), and Federica Ranghieri and Andre Herzog (São Paulo and Dar
es Salaam). Each of the case studies has resulted in an individual report that
acknowledges the extensive teams involved in the report’s preparation. Th e
Acknowledgments

xvi ■ ACKNOWLEDGMENTS
work benefi tted from the fi nancial support and insight provided by Cities
Alliance, the Global Facility for Disaster Risk Reduction, and the World Bank
Institute Climate Change Practice (WBICC).
Peer reviewers included Margaret Arnold, Uwe Deichmann, and Abhas Jha.
Helpful comments were also received from David Miller, Glen Pearce-Oroz,
Apurva Sanghi, and the team members listed above.
Th e work is a joint eff ort by the Finance, Economics, and Urban Department
and the World Bank Institute. Th e study was carried out under the overall guid-
ance of Zoubida Allaoua, Marianne Fay, Abha Joshi-Ghani, Christine Kessides,
and Konrad von Ritter.

■ xvii
ACCRN Asian Cities Climate Change Resilience Network
ADB Asian Development Bank
ASCCUE Adaptation Strategies for Climate Change in the Urban
Environment
AURAN African Urban Risk Analysis Network
BAPPEDA Badan Perencanaan Pembangunan Daerah (Jakarta)
B/C benefi t/cost ratio
BEHD buildings expected to be heavily damaged
BMA Bangkok Metropolitan Administration
BPBD Badan Penanggulangan Bencana Daerah (Jakarta)
BPLHD Badan Pengelola Linkungan Hidup Daerah (Jakarta)
CAT DDO Catastrophe Risk Deferred Drawdown Option
CCRIF Caribbean Catastrophe Risk Insurance Facility
CDCF Community Development Carbon Fund
CDM Clean Development Mechanism
CER certifi ed emission reduction
CGE Emergency Management Center (São Paulo)
CIUP Community Infrastructure Upgrading Program
CLACC Capacity Strengthening of Least Developing Countries for
Adaptation to Climate Change
CODEL local emergency committee
COMDEC City Emergency Management Agency (São Paulo)
COP Conference of the Parties
CRC climate resilient cities
CRED Centre for Research on the Epidemiology of Disasters
CTF Clean Technology Fund
CVCCCM Virtual Center on Climate Change for Mexico City
Abbreviations

xviii ■ ABBREVIATIONS
DANIDA Danish International Development Agency
DAWASA Dar es Salaam Water Supply and Sewerage Agency
DCC Dar es Salaam City Council
DKI Special Capital District of Jakarta
DRR disaster risk reduction
ETS emissions trading system
FAR Floor-area ratio
FIP Forest Investment Program
FONDEN Fondo de Desastres Naturales (Mexico)
GDP gross domestic product
GEF Global Environment Facility
GEO-CAN Global Watch Observation Catastrophe Assessment Network
GFDRR Global Facility for Disaster Reduction and Recovery
GHG greenhouse gas
GPOBA Global Partnership on Output-Based Aid
Ha hectare
HABISP Sistema de informações para habitação social (São Paulo)
HRM Halifax Region Municipality
IBGE Instituto Brasileiro de Geografi a e Estatística
IBRD International Bank for Reconstruction and Development
ICLEI Local Governments for Sustainability
IDA International Development Association
IFRC International Federation of Red Cross and Red Crescent
Societies
IIED International Institute for Environment and Development
INPE Instituto Nacional de Pesquisas Espaciais (São Paulo)
IPCC Inter-Governmental Panel on Climate Change
IPT Instituto de Pesquisas Tecnológicas do Estado de São Paulo
IPVS Index of social vulnerability (São Paulo)
ISDR United Nations International Strategy for Disaster Reduction
JMP Joint Monitoring Programme
KICAMP Kinondoni Integrated Coastal Area Management Project
(Tanzania)
LDCF Least Developed Countries Fund
LECZ Low Elevation Coastal Zones
LRAP Local Resilience Action Plan
MAMUCA Mancomunidad de los Municipios del Centro de Atlantida
(Honduras)
MCCAP Mexico City’s Climate Action Program
MCMA Mexico City Metropolitan Area
NAPA national adaptation program of action

ABBREVIATIONS ■ xix
NAP-DRR National Action Plan for Disaster Risk Reduction
NGO nongovernmental organization
NYCPCC New York City Panel on Climate Change
OBA output-based aid
OECD Organisation for Economic Co-operation and Development
OFDA Offi ce of Foreign Disaster Assistance
OPP-RTI Orangi Pilot Project Research and Training Institute (Pakistan)
PCG partial credit guarantee
Pemprov Provincial Government of the Special Capital District of Jakarta
PHPF Philippines Homeless People’s Federation
PNPM Program Nasional Pemberdayaan Masyarakat (Indonesia)
PPIAF World Bank Public-Private Infrastructure Advisory Facility
PPP public-private partnership
RBF results-based fi nancing
REDD Reduced Emissions from Deforestation and Forest Degradation
SATKORLAK Satuan Tugas Koordinasi dan Pelaksana (Indonesia)
SEHAB Secretaria da Habitação e Desenvolvimento Urbano (São Paulo)
SLD Shared Learning Dialogue
SMART Sustainable Mitigation and Adaptation Risk Toolkit
SPDMI Strategic Plan for Disaster Mitigation in Istanbul
SVMA Green and Environment Secretariat (São Paulo)
TCIP Turkish Catastrophic Insurance Pool
UNEP United Nations Environmental Programme
UNFCCC United Nations Framework Convention on Climate Change
URA Urban Risk Assessment
VTC Volunteer Technology Community
VUUP Vietnam National Urban Upgrading Program
WDR World Development Report
WHO World Health Organization
WWF World Wildlife Fund


■ 1
Overview
Poor people living in slums are at particularly high risk from the impacts of cli-
mate change and natural hazards. Th ey live on the most vulnerable land within
cities, typically areas deemed undesirable by others and thus aff ordable. Resi-
dents are exposed to the impacts of landslides, sea-level rise, fl ooding, and other
hazards.
Exposure to risk is exacerbated by overcrowded living conditions, lack of ade-
quate infrastructure and services, unsafe housing, inadequate nutrition, and poor
health. Th ese conditions can swift ly turn a natural hazard or change in climate
into a disaster, and result in the loss of basic services, damage or destruction to
homes, loss of livelihoods, malnutrition, disease, disability, and loss of life.
Th is study analyzes the key challenges facing the urban poor, given the risks
associated with climate change and disasters, particularly with regard to the
delivery of basic services, and identifi es strategies and fi nancing opportunities
for addressing these risks. Th e main audience for this study includes mayors and
other city managers, national governments, donors, and practitioners in the fi elds
of climate change, disaster-risk management, and urban development.
Th e work is part of a broader program under the Mayor’s Task Force on
Climate Change, Disaster Risk and the Urban Poor. Th is task force was launched
at the Mayor’s Summit in Copenhagen in 2009 with the aim to better understand
these issues, identify examples of good practices, and propose policy and invest-
ment programs to improve the resilience of the urban poor. Th e task force com-
prises the mayors of Dar es Salaam, Jakarta, Mexico City, and São Paulo, who have
recognized the importance of these issues in their cities and have demonstrated
strong support for taking action. In each of the four cities, urban risk assessments
have been carried out that provide the basis for much of the knowledge in the
study. Summaries of those cases are included in annexes 5–7 of this report.

2 ■ CLIMATE CHANGE, DISASTER RISK, AND THE URBAN POOR
Th e study is organized in four chapters covering (1) a broad look at climate
change and disaster risk in cities of the developing world, with particular impli-
cations for the urban poor; (2) analysis of the vulnerability of the urban poor;
(3) discussion of recommended approaches for building resilience for the urban
poor; and (4) review of the fi nancing opportunities for covering investments in
basic services and other needs associated with climate and disaster risk.
Several key fi ndings emerge from the study and provide guidance for address-
ing risk:
• Th e urban poor are on the front line. Th e poor are particularly vulnerable to
climate change and natural hazards because of where they live within cities,
and the lack of reliable basic services there.
• City governments are the drivers for addressing risks. Local governments
play a vital role in providing basic services that are critical to improving the
resilience of the urban poor.
• City offi cials build resilience by mainstreaming risk reduction into urban
management. Adapting to climate change and reducing disaster risk can be
best addressed and sustained over time through integration with existing
urban planning and management practices.
• Signifi cant fi nancial support is needed. Local governments need to leverage
existing and new resources to meet shortfalls in service delivery and basic
infrastructure adaptation.
Recommended Actions to Build Resilience of the Urban Poor
Th ere are a number of actions that can help build resilience for those at greatest
risk in cities. Implementing these actions will involve a strong commitment by
local governments working with communities, as well as national and interna-
tional institutions.
Assessing risk at the city and community levels to inform decision making
and action planning. City-level case studies carried out in Dar es Salaam,
Jakarta, Mexico City, and São Paulo as part of the Mayor’s Task Force program
have demonstrated the importance of understanding environmental, socioeco-
nomic, and institutional risks as an important fi rst step to developing plans for
adaptation and disaster risk reduction. A risk assessment can defi ne the nature of
risks, answer questions about the characteristics of potential hazards, and identify
community vulnerabilities and potential exposure to given hazards. Such infor-
mation helps in prioritizing risk measures, giving due consideration to the prob-
ability and impact of potential events, the cost eff ectiveness of the measures, and
resource availability. Experiences from the four task force cities and elsewhere
OVERVIEW ■ 3
also demonstrate that, through the process of assessing risk, it is imperative to
get multiple agencies and community residents involved to exchange ideas, col-
laborate, and communicate with the aim of establishing eff ective adaptation and
disaster risk reduction plans.
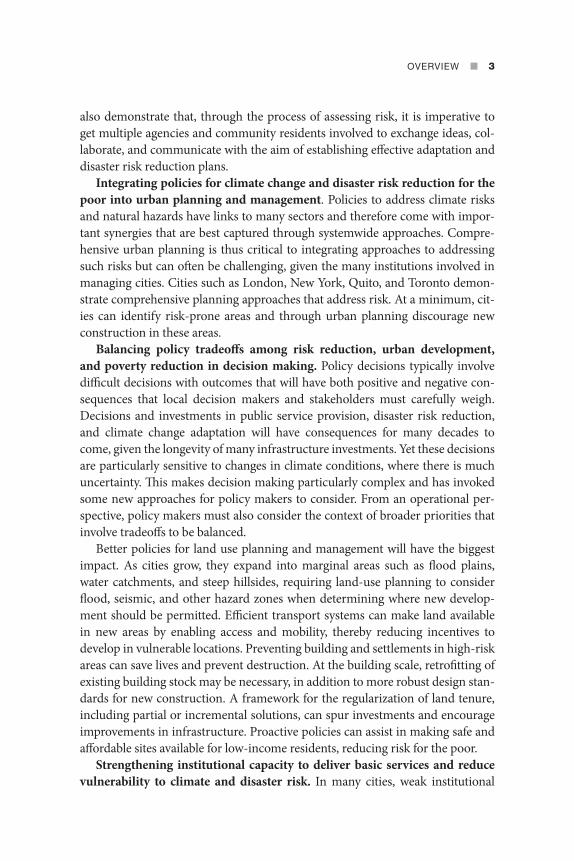
Integrating policies for climate change and disaster risk reduction for the
poor into urban planning and management. Policies to address climate risks
and natural hazards have links to many sectors and therefore come with impor-
tant synergies that are best captured through systemwide approaches. Compre-
hensive urban planning is thus critical to integrating approaches to addressing
such risks but can oft en be challenging, given the many institutions involved in
managing cities. Cities such as London, New York, Quito, and Toronto demon-
strate comprehensive planning approaches that address risk. At a minimum, cit-
ies can identify risk-prone areas and through urban planning discourage new
construction in these areas.
Balancing policy tradeoff s among risk reduction, urban development,
and poverty reduction in decision making. Policy decisions typically involve
diffi cult decisions with outcomes that will have both positive and negative con-
sequences that local decision makers and stakeholders must carefully weigh.
Decisions and investments in public service provision, disaster risk reduction,
and climate change adaptation will have consequences for many decades to
come, given the longevity of many infrastructure investments. Yet these decisions
are particularly sensitive to changes in climate conditions, where there is much
uncertainty. Th is makes decision making particularly complex and has invoked
some new approaches for policy makers to consider. From an operational per-
spective, policy makers must also consider the context of broader priorities that
involve tradeoff s to be balanced.
Better policies for land use planning and management will have the biggest
impact. As cities grow, they expand into marginal areas such as fl ood plains,
water catchments, and steep hillsides, requiring land-use planning to consider
fl ood, seismic, and other hazard zones when determining where new develop-
ment should be permitted. Effi cient transport systems can make land available
in new areas by enabling access and mobility, thereby reducing incentives to
develop in vulnerable locations. Preventing building and settlements in high-risk
areas can save lives and prevent destruction. At the building scale, retrofi tting of
existing building stock may be necessary, in addition to more robust design stan-
dards for new construction. A framework for the regularization of land tenure,
including partial or incremental solutions, can spur investments and encourage
improvements in infrastructure. Proactive policies can assist in making safe and
aff ordable sites available for low-income residents, reducing risk for the poor.
Strengthening institutional capacity to deliver basic services and reduce
vulnerability to climate and disaster risk. In many cities, weak institutional

4 ■ CLIMATE CHANGE, DISASTER RISK, AND THE URBAN POOR
capacity is a major constraint to delivering services. Local governments oft en do
not have adequate staffi ng, technical skills, or fi nancial capacity. Climate change
and disaster risk only exacerbate the challenges of urban management and ser-
vice delivery. Informal institutions, such as nongovernmental organizations and
community-based organizations, have emerged to respond to the needs of the
urban poor in the absence of formal institutions. Th ey contribute to adaptive
capacity by addressing gaps in service delivery and, at times, facilitating coordi-
nated action in both ongoing and emergency contexts. Th ese institutions play an
important role; however, they are not a substitute for formal institutions and the
associated provision of basic and infrastructure services. Investments in build-
ing capacity for better urban planning and management have the potential to
strengthen the resilience of cities. Th ere are several approaches to capacity devel-
opment at the city level, with many successes in city networks at the country,
regional, and international levels; training programs; and knowledge exchange
through twinning and other programs that allow cities to learn from each other.
Emerging examples include Boston, Cape Town, Ho Chi Minh City, London,
New York City, Quito, Rotterdam, and Toronto.
Bridging communities and local governments to work together on local
solutions. At the household and community levels, much is already happening
that governments can draw upon. Th ere are also examples of successful part-
nerships between community organizations and local governments around
basic services. For example, initiatives in Ilolo, Philippines, and Quelimane City,
Mozambique, demonstrate eff ective community mapping and the creation of
partnerships for eff ective service delivery. Such partnerships show that coop-
eration can be facilitated through mutual recognition of the role that each group
plays, improving the dialogue to dispel misunderstandings, understanding and
recognizing what is happening at the local level, and forming partnerships with
local organizations. For the poor, understanding what the city can and cannot
provide and what its constraints are is a fi rst step. Th is also can mean commu-
nities proactively demonstrating what resources and capacity they have rather
than making demands and opposing government policies or practices that go
against their needs. For local governments, this means recognizing the contri-
bution that the urban poor make to a city’s economy and society and involving
them in discussions about needs and priorities. Local participation is crucial to
ensure that the approach taken suits the needs of residents and meets quality
standards. Many of the examples of partnerships between local governments and
community organizations in Africa and Asia have been initiated by federations
of slum dwellers who are engaged in initiatives to upgrade slums, secure land ten-
ure, develop new housing that low-income households can aff ord, and improve
provision for infrastructure and services.

OVERVIEW ■ 5
Opening new fi nance opportunities for cities to address pro-poor adapta-
tion and risk reduction. Cities need fi nancing for urban infrastructure, basic
services for the urban poor, capacity building, risk assessments, and tools for
integrating climate change and disaster risk management into urban planning.
Cities currently rely on national and local tax revenues, the private sector, public-
private partnerships, and loans and concessional sources through multilateral
development banks and donors. Existing programs also provide smaller-scale
grants or technical assistance for projects and programs at the city level. Most
international funds, however, are channeled through national implementing
entities. Given the enormous need, it is recommended that international donors
consider a new Program for Climate Finance and Assistance for Cities that would
bring together existing resources and draw on new and innovative instruments.
Th is program would facilitate access to resources through a more unifi ed “window”
that would reduce overhead and administrative complexity. To encourage cities
to achieve specifi ed targets, such a program could consider a more standardized
approach to benchmarking and monitoring through metrics commonly agreed
upon by the international community, such as a city-level greenhouse gas index,
urban risk assessments, or Local Resilience Action Plans. By meeting specifi ed
targets, cities would then be eligible for accessing such fi nancing through a des-
ignated window.


■ 7
Vulnerable Cities: Assessing Climate Change and Disaster Risk in Urban Centers of the
Developing World
Key Messages
• Exposure to the impacts of climate change and natural hazards is on the rise in cities.
• The urban poor disproportionately bear the brunt of changing weather patterns and natural hazards.
• The scope and intensity of disaster risks vary considerably across cities, with differential impacts on the urban poor.
• The increased exposure of the urban poor to extensive risks can transform frequent everyday hazards into disasters.
Introduction and Objective of the Study
Cities are concentrated centers of people, assets, and economic activity. Th is con-
centration increases exposure to the impacts of climate change and natural haz-
ards, making urban residents particularly vulnerable to rising sea levels, storm
surges, earthquakes, and fl oods. Climate change also poses risks of drought and
extreme heat.
Th e risks for the urban poor are oft en even greater, exacerbated by their limited
access to basic infrastructure and services, and by where they live within cities.
1

8 ■ CLIMATE CHANGE, DISASTER RISK, AND THE URBAN POOR
With rapid urbanization, cities throughout the developing world struggle to meet
the basic needs of their growing populations. Today, some 1 billion urban resi-
dents live in slums, which lack basic infrastructure and services. More than half
the urban population in Sub-Saharan Africa and 40 percent in South Asia lack
access to basic sanitation (Joint Monitoring Programme (JMP) 2010). In Sub-
Saharan Africa, close to 20 percent of urban residents do not have access to safe
water (JMP 2010). Many more live without access to proper drainage or waste-
water removal.
Th e poor typically settle in areas undesirable to others and thus aff ordable.
Th is includes informal settlements on precarious land, at high risk from land-
slides, sea-level rise, and fl ooding. Th ese neighborhoods are made even more
vulnerable by overcrowded living conditions, unsafe housing, inadequate nutri-
tion, poor health, and lack of safety nets. When a disaster hits, impacts can
include the loss of basic services, damage or destruction to homes, reduction or
loss of livelihoods, threats to food security, and the rapid spread of malnutrition
and water- and vector-borne diseases.
One has to look back only to the past few years to get a sense of the destruc-
tion natural hazards can cause in cities, particularly for low-income residents. In
the past two years alone, major disasters—such as earthquakes in Japan (2011),
Haiti (2010), Chile (2010), and China, (2010); and fl ooding in China (2010),
Pakistan (2010), and Brazil (2010, 2011)—have killed many. Annually, almost
70,000 people are killed by natural hazards, with the majority of related mortality
and economic losses being concentrated in low- and middle-income countries.1
Th e objective of this study is to analyze the key challenges facing the urban
poor, given the risks associated with climate change and disasters, particularly
regarding the delivery of basic services, and to identify strategies and fi nancing
opportunities for addressing these risks. Th e study is aimed at mayors and other
city managers, national governments, donors, and practitioners in the fi elds of
climate change, disaster risk management, and urban development. It is orga-
nized into four main chapters. Chapter 1 introduces the study and presents an
overview of risk in cities of the developing world and the implications of those
risks for the urban poor. Chapter 2 analyzes the vulnerability of the urban poor
based on location and other characteristics, particularly those related to access
to basic services and infrastructure. Chapter 3 is more forward looking, focusing
on recommended approaches to building resilience for the urban poor and dis-
cussing the key policy issues and tradeoff s that must be considered. Chapter 4
concludes with a practical discussion of existing fi nancing tools for climate
change, disaster risk, and urban development and how they could be further
oriented for growing needs. Th roughout the study are examples from the four
city-level case studies undertaken as part of this work, as well as good practices

VULNERABLE CITIES ■ 9
from other cities. Annexes include a literature review, good practice cases, and
summaries of the four city-level case studies.
Th is study is part of a larger program under the Mayor’s Task Force on Cli-
mate Change, Disaster Risk and the Urban Poor. Th is task force was created in
December 2009 at the Climate Summit for Mayors in Copenhagen, with strong
support by key members: the mayors of Mexico City (lead convener), Jakarta,
Dar es Salaam, and São Paulo. Th e task force’s work program has three main
objectives and is supported by the World Bank Group. Th ese objectives are
to (1) take stock of our understanding of the linkages between urban poverty
and climate change; (2) identify examples of good practices where shelter and
services for the urban poor have been improved and have resulted in reduced
vulnerability; and (3) propose policy and investment programs and municipal
management practices that benefi t the urban poor. Each of the four cities has
carried out in-depth studies to assess risk in their cities with a particular focus
on the urban poor that provides an important contribution to the overall study.
Background, Analytical Framework, and Approach
Th e existing literature on climate change, disaster risk management, urbanization,
and urban poverty is expanding rapidly with important contributions emerg-
ing in recent years. Some of the key documents include the Inter Governmental
Panel on Climate Change (IPCC) Assessment Reports; the World Bank’s 2010
World Development Report on Climate Change; the World Bank and UN study,
Natural Hazards, UnNatural Disasters, 2010; the World Watch Institute’s State of
the World Report, Our Urban Future (2007); the Global Assessment Report on
Disaster Risk Reduction (ISDR 2009); and the World Disasters Report: Focus on
Urban Risk (IFPC 2010). Th ese studies, reviewed in annex 1, have brought to the
fore many of the risks that cities face, and in a few cases, some coverage of the
particular challenges in low-income areas.
Th ere is consensus that the poor disproportionately bear the brunt of chang-
ing weather patterns and natural hazards, and have limited adaptive capacity to
cope with climate change. Th ere is much reference regarding vulnerabilities to
fl ooding, land subsidence, heat waves, and increased health risks. One of the fre-
quently cited works is Moser et al. (2008), which refers to pro-poor adaptation
in cities. It examines the role of assets—“natural, physical, social, fi nancial, and
human capital”—in increasing the adaptive capacity of the urban poor. Th ese
assets are particularly important because city authorities may not have adequate
fi nancial resources to provide services, and may be reluctant to work with the
poor, particularly in informal settlements, where formalizing the assets of the

10 ■ CLIMATE CHANGE, DISASTER RISK, AND THE URBAN POOR
poor could increase the likelihood of holding local governments accountable for
provision of services.
Th ere is relatively less published research available on the relationship between
the impacts of climate change and natural hazards on access to basic services,
and vice versa. Of all basic services, water, sanitation, and drainage have received
more attention because of their direct impact on human health. Other gaps in the
literature include limited empirical evidence on the impacts of climate change
and disasters on the urban poor, and little documentation of how risks for the
urban poor have been addressed and how cities can integrate policies for improv-
ing resiliency among the urban poor into urban planning. While this study does
not purport to fully fi ll this void, it attempts to contribute to improving our
understanding of the issues.
Analytical Framework
Th e analytical framework used in the study is based on the approach developed
by the IPCC, which looks at the risks posed by natural hazards and defi nes vul-
nerability as a function of a system’s exposure, sensitivity, and adaptive capacity.
Th is framework was introduced in the 2001 IPCC Th ird Assessment Report and
has been adapted somewhat over time. Various studies analyzing the impact of
climate change have used diff erent adaptations of this framework. As discussed
in the IPCC Fourth Assessment Report (2007, Section 19.1.2), “Key impacts that
may be associated with key vulnerabilities are found in many social, economic,
biological, and geophysical systems, and various tabulations of risks, impacts and
vulnerabilities have been provided in the literature.”
Th e application of the analytical framework will focus on a core function of
cities—the provision of basic protection and services for its residents. For the
purposes of the study, these basic services will include housing, water and sanita-
tion, drainage, solid-waste treatment, transport, roads, and public and environ-
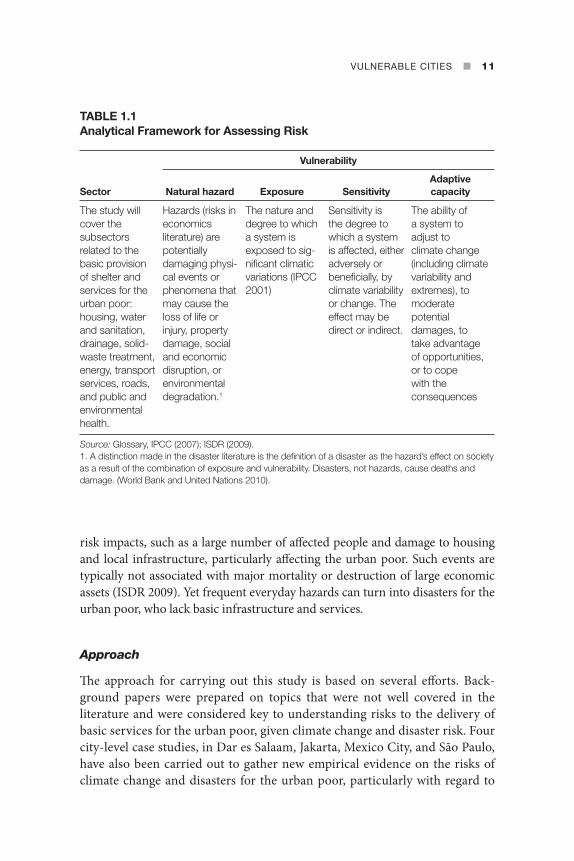
mental health. Table 1.1 presents the analytical framework, with defi nitions used
most commonly by the IPCC working groups.
A further distinction useful for the analysis of risk is the concept of inten-
sive and extensive risks found in the disaster risk literature. Intensive risk refers
to areas where major concentrations of vulnerable people and economic assets
are exposed to very severe hazards (for example, major earthquakes, tropical
cyclones, severe fl ooding, or tsunamis). In contrast, extensive risks refer to wide
regions exposed to more frequently occurring low- or moderate-intensity losses
(for example, localized fl ooding, fi res, and landslides in informal settlements).
Th e frequency and intensity of such everyday hazards is increasing with the very
gradual rise in variability and extremes in temperature and rainfall induced by
climate change. Th ese widespread low-intensity losses are associated with other
VULNERABLE CITIES ■ 11
risk impacts, such as a large number of aff ected people and damage to housing
and local infrastructure, particularly aff ecting the urban poor. Such events are
typically not associated with major mortality or destruction of large economic
assets (ISDR 2009). Yet frequent everyday hazards can turn into disasters for the
urban poor, who lack basic infrastructure and services.
Approach
Th e approach for carrying out this study is based on several eff orts. Back-
ground papers were prepared on topics that were not well covered in the
literature and were considered key to understanding risks to the delivery of
basic services for the urban poor, given climate change and disaster risk. Four
city-level case studies, in Dar es Salaam, Jakarta, Mexico City, and São Paulo,
have also been carried out to gather new empirical evidence on the risks of
climate change and disasters for the urban poor, particularly with regard to
TABLE 1.1Analytical Framework for Assessing Risk
Sector
Vulnerability
Natural hazard Exposure SensitivityAdaptive capacity
The study will cover the subsectors related to the basic provision of shelter and services for the urban poor: housing, water and sanitation, drainage, solid-waste treatment, energy, transport services, roads, and public and environmental health.
Hazards (risks in economics literature) are potentially damaging physi-cal events or phenomena that may cause the loss of life or injury, property damage, social and economic disruption, or environmental degradation.1
The nature and degree to which a system is exposed to sig-nifi cant climatic variations (IPCC 2001)
Sensitivity is the degree to which a system is affected, either adversely or benefi cially, by climate variability or change. The effect may be direct or indirect.
The ability of a system to adjust to climate change (including climate variability and extremes), to moderate potential damages, to take advantage of opportunities, or to cope with the consequences
Source: Glossary, IPCC (2007); ISDR (2009). 1. A distinction made in the disaster literature is the defi nition of a disaster as the hazard’s effect on society as a result of the combination of exposure and vulnerability. Disasters, not hazards, cause deaths and damage. (World Bank and United Nations 2010).

12 ■ CLIMATE CHANGE, DISASTER RISK, AND THE URBAN POOR
the delivery of basic services. Key fi ndings from those studies are integrated
throughout this report, and case study summaries for each city are included
in annexes 5–7.2 Th e case studies follow a methodology for assessing urban
risk that is based on three pillars: institutional assessment, hazard assessment,
and social assessment.3 Because the amount of data available for the diff erent
cities varies, the depth of the information on each case study varies. Th e key
fi ndings are summarized in tables 1.2 and 1.3.
Climate Change, Disaster Risk, and Urban Areas: Assessing Hazard Risk
Th e unprecedented rate of urban growth in the developing world is increasingly
exposing the population and economic assets to the potential impacts of climate
change and natural hazards. Th e world’s urban population is currently estimated
at 3.3 billion. Most of the urban population resides in the developing world,
where nearly all future urban growth will take place. During the next 20 years, it
is projected that over 95 percent of the population growth in developing coun-
tries will take place in urban areas, with the urban populations of Africa and
South Asia increasing by an average of 62 million people each year.4 In East Asia
TABLE 1.2 Hazards Impacting the Urban Poor in Case Study Cities
HazardDar es Salaam Jakarta São Paulo
Mexico City
Earthquake
Wind storm
River fl ow
Floods, inundations, and waterlogsDrought
Volcano
Landslide
Storm surge
Extreme temperature NA
Source: Author.
High risk Medium risk Low risk

VU
LN
ER
AB
LE
CIT
IES
■
1
3
TABLE 1.3 Summary Findings of Risk Assessments for Dar es Salaam, Jakarta, Mexico City, and São Paulo
Dar es Salaam Jakarta Mexico City São Paulo
Ove
rvie
w
Pop
.
• 2.5 million in 1,590 km2
• Between 4% and 8% annual population growth
• 9.6 million in the metro area (650 km2); 28 million in greater Jakarta
• 250,000 immigrate to Jakarta yearly
• 21.2 million in the metro area (4,250 km2)
• 3% annual population growth rate
• 19.7 million in the metro area (2,140 km2)
• Increasing low-income population in the periphery
Vuln
erab
ility
of t
he u
rban
po
or
Haz
ards
, vul
nera
bilit
y, a
nd b
asic
ser
vice
s
• Main hazards—heavy rainfall, fl ooding, droughts
• 70% of Dar es Salaam’s population lives in poor, unplanned settlements; human development indicators very low.
• Basic infrastructure is very low; access to clean water and sanitation is a major problem; less than 60% of the road network is paved.
• Drainage channels are regularly blocked, causing houses to be fl ooded by sewage-based waste-water, causing water-borne diseases.
• Main hazards—water management and fl ood control. About 40% of the city is below sea level.
• Regular fl ooding affects city throughout the year with impacts on traffi c, damage to homes, and economic losses.
• There is currently no citywide solid waste–management plan for Jakarta.
• Poorest people live close to river banks, canals, drainage areas.
• Main hazards—high seismic risk, no natural drainage for runoff from the surrounding mountains, and vulnerability to fl ooding. Regularly affected by severe storms, heat waves, and droughts
• Projections estimate rise in mean temperature by 2–3 °C by end of this century; extreme precipitation episodes expected to increase.
• By 2015, water consumption rates will increase by 20% compared with 2000 levels.
• Infrastructure and public services are stretched thin.
• City’s generation of garbage is increasing at a rate of 5% a year.
• 15% of the population is ranked with high level of housing and population vulnerability.
• Main hazards—heavy rains, fl ooding, landslides, and washouts.
• 13% of the population is considered as having high or very high social vulnerability.
• More than 85% of high-risk households (890,000) are located in slums across the city.
• More than 5% of slum areas are highly likely to be affected by destructive events.
• 52% of households in slums are without access to sanitation facilities and 33% of households in slums have no access to paved roads close to their homes.
• 20% of sewage lacks proper treatment.
(continued next page)

14
■
C
LIM
AT
E C
HA
NG
E, D
ISA
ST
ER
RIS
K, A
ND
TH
E U
RB
AN
PO
OR
Bui
ldin
g r
esili
ence
for
the
urb
an p
oo
r
Ach
ieve
men
ts
• Government is identifying all properties in informal settlements in Dar es Salaam and issuing land/property licenses or right of occupancy to improve security of tenure, which could be used as collateral for economic empowerment.
• Signifi cant slum upgrading program is also under way.
• Large-scale adaptation infrastructure projects being developed include Jakarta Coastal Defense to protect from tidal surges, and Jakarta Urgent Flood Mitigation Plan.
• Innovative early-warning systems via SMS at the urban ward level inform people of upcoming fl oods.
• First city in Latin America to introduce a local climate action strategy to reduce emissions by 7 million MT between 2008 and 2012.
• Strategy is part of a 15-year plan in which the city is investing US$1 billion a year (9% of the yearly budget) in land conservation, public spaces, air pollution, waste management and recycling, water supply and sanitation, transportation, and mobility.
• The São Paulo Agenda 2012 and the Municipal Climate Law set out targets by sector to be reached by the municipality, private actors, and other public bodies.
• Risky areas for landslides are already identifi ed and geo-referenced by the municipality, allowing the prioritization of adaptation actions.
• Major slum upgrading efforts based on social vulnerability index and incidence of areas subject to landslides.
Cha
lleng
es
• Disaster risk management has largely been ignored and needs to be integrated in all aspects of urban planning in Dar es Salaam.
• Limited capacity in city planning departments to assess the long-term sectoral impacts of climate change for the city.
• Adaptation plans to cope with extreme weather and sea level rise are not coordinated across multiple agencies.
• Lack of comprehensive disaster risk management program or disaster response plan for Jakarta.
• Disaster risk in Mexico City is primarily handled in a reactive manner and limited preventative measures have been implemented.
• Evident need to improve the sharing of information among the relevant government agencies.
• Additional efforts are needed to increase coverage of sewage system and avoid illegal disposal of sewage into water courses.
• Mitigate risks in fl ood- and landslide-prone areas and consider relocating families where mitigation proves ineffective.
Source: Author.
TABLE 1.3 continued
Dar es Salaam Jakarta Mexico City São Paulo

VULNERABLE CITIES ■ 15
alone, 500 million people will become urban residents over the next 25 years,
joining the current 750 million people living in cities.
Likewise the geographic location where the bulk of the urban growth is hap-
pening also increases population exposure to climate change and natural hazards.
Urban centers are oft en located in naturally hazardous zones, prone to fl oods and
cyclones—Low Elevation Coastal Zones (LECZ); earthquake, volcanic, and land-
slide zones; and drought zones (fi gure 1.1 in color section). Nearly two-thirds of
the urban settlements with more than 5 million people are located partly in a low-
elevation coastal zone (Mc Granahan, Balk, and Anderson 2007). Indeed, 70 per-
cent of the countries with population in the low-elevation coastal zone have their
largest urban area extending into that zone (Mc Granahan, Balk, and Anderson
2007). Climate change poses a risk of more extreme weather and can cause dev-
astating urban fl ooding and coastal storms, as well as longer-term changes such
as sea-level rise and increased ambient temperatures. Risks are especially high in
low- and middle-income countries, where a third to a half of the population in
cities lives in slums (Kinyanjui 2010).
Urban exposure of population and economic assets to natural hazards and
to the impacts of climate change is therefore increasing signifi cantly, with a high
degree of vulnerability for a large share of cities, especially those located along the
coastal areas. At the same time, the frequency and intensity of natural hazards are
becoming more signifi cant, compounded by the early manifestations of climate
change, which are likely to result in more severe impacts in the decades to come.
Table 1.4 shows the impacts of the major disaster events that aff ected cities over
the past decade.
Th e risks for each hazard—fl oods and cyclones, earthquakes, volcanoes and
landslides, drought, and heat waves—vary considerably, with diff erent impacts
on the population. Notably, many cities are aff ected by multiple hazards. Th e
Mexico City metropolitan area, for example, is aff ected by seismic risk, severe
storms, heat waves, and droughts. Also, with no natural drainage for runoff from
the surrounding mountains, the area is vulnerable to fl ooding, particularly to the
west. Main risks for cities, with particular implications for the urban poor, are
discussed below, followed by a summary (tables 1.5 and 1.6).
Floods and Cyclones
Close to 2 billion people, or 38 percent of the world’s populations, live in highly
fl ood-prone areas. Low Elevation Coastal Zones (LECZ) that are oft en exposed
to cyclones and storm surges cover 2 percent of the world’s land area, but contain
13 percent of the world’s urban population (McGranahan, Balk, and Anderson
2007). Tropical storms and cyclones aff ect 1.4 billion people, or 24 percent of the
world’s population that live in densely populated coastal areas. Areas most prone

16
■
C
LIM
AT
E C
HA
NG
E, D
ISA
ST
ER
RIS
K, A
ND
TH
E U
RB
AN
PO
OR
TABLE 1.4 Large Disasters with Major Impacts on Cities, 2000–2010
Disaster Main countries affected Year Main cities affectedTotal number
of deathsTotal number
affectedTotal damages
(US$)
Floods Pakistan 2010 Peshawar, Sukkur, Thatta, Mingora, Multan, Chilas
1,985 18,102,327 9.5 billion
Floods China 2010 Fujian, Guangxi, Fuzhou, Nanping 1,691 134,000,000 18 billionEarthquake Chile 2010 Concepción 562 2,671,556 30 billionEarthquake Haiti 2010 Port-au-Prince 222,570 3,700,000 8 billionSichuan earthquake
China 2008 Beichuan, Dujiangyan, Shifang, Mianzhu, Juyuan, Jiangyou, Mianyang, Chengdu, Qionglai, Deyang
87,476 45,976,596 85 billion
Cyclone Nargis Myanmar 2008 Yangon 138,366 2,420,000 4 billionJava earthquake Indonesia 2006 Yogyakarta 5,778 3,177,923 3.1 billionKashmir earthquake
Pakistan 2005 Muzaffarabad 73,338 5,128,000 5.2 billion
Hurricane Katrina United States 2005 New Orleans 1,833 500,000 125 billionFloods India 2005 Mumbai 1,200 20,000,055 3.3 billionSouth Asian tsunami
Indonesia, Sri Lanka, India, Thailand, Malaysia, Maldives, Myanmar
2004 Banda Aceh, Chennai (some damages)
226,408 2,321,700 9.2 billion
Earthquake Iran 2003 Bam 26,796 267,628 500 millionEuropean heat wave
Italy, France, Spain, Germany, Portugal, Switzerland
2003 Various 72,210 Not reported Not reported
Floods Germany 2002 Dresden 27 330,108 11.6 billionGujurat earthquake India 2001 Bhuj, Ahmedabad 20,005 6,321,812 2.6 billion
Source: EM-DAT: The OFDA/CRED International Disaster Database, Université catholique de Louvain-Brussels—Belgium and IFRC (2010).
Note: Technological and biological disasters are not included. OFDA: Offi ce of Foreign Disaster Assistance; CRED: Centre for Research on the Epidemiology of Disasters; IFRC: International Federation of Red Cross and Red Crescent Societies.
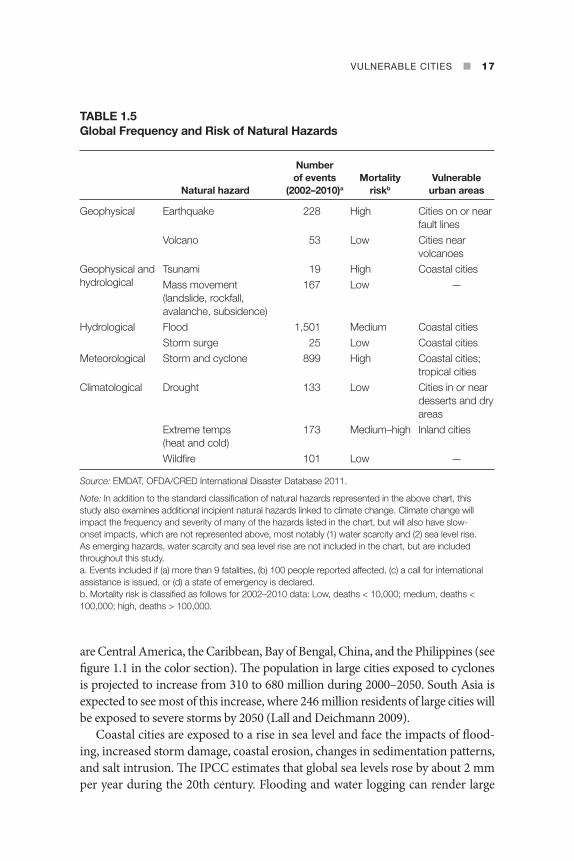
VULNERABLE CITIES ■ 17
are Central America, the Caribbean, Bay of Bengal, China, and the Philippines (see
fi gure 1.1 in the color section). Th e population in large cities exposed to cyclones
is projected to increase from 310 to 680 million during 2000–2050. South Asia is
expected to see most of this increase, where 246 million residents of large cities will
be exposed to severe storms by 2050 (Lall and Deichmann 2009).
Coastal cities are exposed to a rise in sea level and face the impacts of fl ood-
ing, increased storm damage, coastal erosion, changes in sedimentation patterns,
and salt intrusion. Th e IPCC estimates that global sea levels rose by about 2 mm
per year during the 20th century. Flooding and water logging can render large
TABLE 1.5 Global Frequency and Risk of Natural Hazards
Natural hazard
Number of events
(2002–2010)a
Mortality riskb
Vulnerable urban areas
Geophysical Earthquake 228 High Cities on or near fault lines
Volcano 53 Low Cities near volcanoes
Geophysical and hydrological
Tsunami 19 High Coastal citiesMass movement(landslide, rockfall, avalanche, subsidence)
167 Low —
Hydrological Flood 1,501 Medium Coastal citiesStorm surge 25 Low Coastal cities
Meteorological Storm and cyclone 899 High Coastal cities; tropical cities
Climatological Drought 133 Low Cities in or near desserts and dry areas
Extreme temps (heat and cold)
173 Medium–high Inland cities
Wildfi re 101 Low —
Source: EMDAT, OFDA/CRED International Disaster Database 2011.
Note: In addition to the standard classifi cation of natural hazards represented in the above chart, this study also examines additional incipient natural hazards linked to climate change. Climate change will impact the frequency and severity of many of the hazards listed in the chart, but will also have slow-onset impacts, which are not represented above, most notably (1) water scarcity and (2) sea level rise. As emerging hazards, water scarcity and sea level rise are not included in the chart, but are included throughout this study.a. Events included if (a) more than 9 fatalities, (b) 100 people reported affected, (c) a call for international assistance is issued, or (d) a state of emergency is declared.b. Mortality risk is classifi ed as follows for 2002–2010 data: Low, deaths < 10,000; medium, deaths < 100,000; high, deaths > 100,000.

18 ■ CLIMATE CHANGE, DISASTER RISK, AND THE URBAN POOR
Table 1.6 Incremental Impacts of Climate Change and Natural Hazards on Urban Systems and Residents
Incremental impacts on urban systems Impacts on urban residents
Built environment• Stress on building foundations• Road washouts• Changing disease vectors• Stress on storm-water and sewage
systems• Stress on water treatment systems• Disruption to shipping and ports• Increased energy demand• Increased road surface damage• Increased demand for water
Natural environment• Coastal erosion, altered ecosystems and
wetlands• Salinization of water sources• Slope instability• Groundwater depletion• Reduction in green space and growing
conditions, including urban agriculture• Changes in fi sh populations• Increased runoff contamination• Increased heat island effect• Increased air pollution
• Illness—heat stress, stroke, malnutrition, water-borne disease, asthma, physical and mental disability
• Exposure to elements from substandard construction
• Disruption of basic service provision and access to supplies
• Housing instability• Property loss and relocation• Loss of livelihoods• Community fragmentation• Exposure to fl ood-related toxins and
wastes• Disruption in availability of potable water,
food, and other supplies• Water shortages• Food shortages; higher food prices• Disruptions of electricity
Source: Adapted from Carmin and Zhang (2009); Dickson et al. (2010); Dodman and Satterthwaite (2008); Wilbanks et al. (2007).
areas of a city completely uninhabitable, or damage existing infrastructure such
as transportation systems and energy plants.
For the urban poor, fl oods and storms can have multiple impacts. Th e lack
of storm drainage or of solid-waste disposal in slums can worsen and extend
fl ooding, thus increasing exposure for slum residents. Extended fl ooding can
result in disability and death by drowning or collapsing structures, sickness
transmitted by water-borne vectors, displacement, and destruction of property
and livelihood. Drowning and physical injury during storm surges are a sig-
nifi cant cause of mortality in coastal storms in South Asia and Latin America
(IPCC 2007). Overcrowded slums are particularly exposed to the rapid spread
of infectious diseases that are transmitted through fl ood waters (for exam-
ple, diarrhea, cholera, typhoid, leptospirosis, and meningitis). Malaria- and
dengue-carrying mosquitoes also breed in stagnant water—especially when
temperatures are high. Exposed wells and broken water pipes elevate the risk
VULNERABLE CITIES ■ 19
of water-borne diseases. Fecal and other hazardous matter such as chemicals
and heavy metals can contaminate fl ood-waters, leading to chronic illnesses
and epidemics long aft er fl ood-waters recede. In Dar es Salaam, when residents
in low-income neighborhoods were asked about major problems they face in
general, 35 percent identifi ed fl oods as the top problem, followed by disease and
heat/increased temperatures.
Salt-water intrusion can aff ect coastal habitats and aff ect the livelihoods of
populations dependent on fi sheries and other coastal industries and can result
in permanent damage to sensitive ecosystems. In Mombasa, Kenya, a city of
870,000 on a low-lying coastal plain, a rise in sea level of just 0.3 meters would
submerge about 4,600 Ha (17 percent of the city’s land area). Salt stress in
Mombasa is expected to have two signifi cant impacts. It can potentially leave
large areas of agricultural lands that surround the city unproductive, as well
as salinate inland waterways that supply potable water. A decrease in agricul-
tural productivity can result in rising food prices, which would impact low-
income families the most. Similarly in the poor neighborhood of Kamal Muara
in Jakarta, residents rely on fi shing for their livelihood. For them, salt intrusion
can result in the loss of valuable wetlands, increased salination of ground water
and soil, and a greater infl ux of diverse pollutants—all of which threaten their
sources of income and their livelihoods particularly in the absence of poor with
no safety nets to fall back on.
Earthquakes, Volcanoes, and Landslides
Close to 1.2 billion people (20 percent of the world’s population) live in highly
earthquake-prone areas (7.5 percent of the world’s land area). Half of the
world’s cities are located on seismic fault lines. Th e urban population in areas
with a signifi cant probability of a major earthquake is projected to increase
from 370 million in 2000 to 870 million in 2050. Th e urban population
exposed to earthquakes is expected to increase the most in East Asia and the
Pacifi c from 83 million in 2000 to 267 million in 2050 (Lall and Deichmann
2009). China, India, and Indonesia are the countries with the highest absolute
mortality risk (ISDR 2009).
Landslides are oft en a result of fl oods and storms, or earthquakes. Approxi-
mately 2.2 million people are exposed to landslides globally. Exposure is very
high in several large Asian countries, especially India, Indonesia, and China
(ISDR 2009). Increased construction on steep and unstable hillsides, oft en by the
urban poor, has contributed to landslides, intensifying the impacts of fl ooding
and earthquakes in cities. Heavy rains in early 2011 in the states of Rio de Janeiro
and São Paulo caused landslides resulting in an estimated 647 deaths and almost
6,000 people homeless (Fohla do São Paulo, January 2011).

20 ■ CLIMATE CHANGE, DISASTER RISK, AND THE URBAN POOR
Volcanic regions are spatially concentrated, with about 9 percent of the
world’s population living within a 100 kilometer range of a historically active
volcano (Small and Naumann 2001). A larger proportion of people live near
historically active volcanoes in Southeast Asia and Central America, and most
cities exposed are in developing countries (Small and Naumann 2001; Lall and
Deichmann 2009). Cities that have long experienced volcanoes report that the
most important components of dealing with volcanic activity are (1) early warn-
ing and (2) advanced risk assessment, especially for vulnerable communities,
facilities, and infrastructure (VSJ and IAVECI 2007). In addition to possible
mud and lava fl ows, volcanoes emit large quantities of ash that can aff ect a much
larger area and population through impacts on agricultural production.
Drought
With climate change, dryland cities experience extended droughts that cre-
ate water scarcity and frequent sandstorms aggravated by poor infrastructure.
Water shortages increase food prices, particularly aff ecting the urban poor, and
water stored during droughts has a higher risk of contamination. Th irst, hunger,
under-nutrition, protein energy malnutrition, and micronutrient defi ciencies are
common during drought, which have long-lasting consequences for the health
and well-being of the population, particularly children (IPCC 2007). Drought
is prevalent in interior and coastal regions of semiarid tropical areas. Close to
70 percent of the world’s population live in drought-prone areas (38 percent of
world’s land area). Sub-Saharan Africa is the most aff ected (Dilley et al. 2005).
It is estimated that 75 million to 250 million people in Africa will be exposed to
water stress due to desertifi cation induced by climate change (IIED undated). In
cities, drought is also linked to a rise in infectious diseases, such as meningitis,
malaria, dengue, and the West Nile Virus. In Dar es Salaam, for example, between
2 percent and 10 percent of school children living in the city are infected with
malaria (De Castro et al. 2010).
Heat Waves
Climate change has resulted in extreme temperature fl uctuations—aggravat-
ing a variety of existing health conditions and pollutants, and bringing about
additional unhealthy changes in water and air quality. Heat waves can also con-
tribute to an increase in fi res. Th e IPCC predicts an increase in the frequency
and intensity of heat waves in populations in high-density urban areas with poor
housing, increasing heat-related deaths (IPCC 2007). Most of those who died
during the heat wave in France in 2003 were the elderly, women, and poor living
in the urban areas of Paris (Poumadère et al. 2005).

VULNERABLE CITIES ■ 21
Such “excess deaths”—or deaths above established seasonal norms (Rabie
et al. 2010)—are increasing at an alarming rate. Hot days, hot nights, and heat
waves have become more frequent due to global warming, and this risk of
heat-induced morbidity and mortality will increase (IPCC 2007). Cities expe-
rience more intense heat waves due to denser populations, buildings, traffi c,
and sparse vegetation. Climate change is expected to increase the occurrence of
this “urban heat island” eff ect, resulting in locally acute harm to human health
(Corburn 2009).
Again, the urban poor are particularly aff ected, as they cannot avoid expo-
sure by remaining indoors in cool or air-conditioned surroundings. Heat is an
BOX 1.1
Increase in the Number of Heat Waves in the Mexico City Metropolitan Area (MCMA)
The temperature in MCMA is expected to rise between 2°C and 3°C by the end of the century. This temperature increase will be more noticeable during the spring months. Therefore, it is expected that heat waves (defi ned as two or more consecutive days with temperatures above 30°C) during this time of the year would become longer and more intense. The comparison of number of heat waves in MCMA between 1986 and 1997 and between 1998 and 2009 clearly shows an increase in frequency. The elderly population and infants are at highest risk of dehydration. Given that the number of adults above 65 is rapidly increasing (0.66 percent to 1.22 percent between the 1980s and 1990s), more people will be exposed to the damaging effects of heat waves.
Source: Leon et al. (2010).
Comparison of number of heat waves in MCMAbetween 1986 and 1997 and between 1998 and 2009
0–34–78–1011–1516–2021–3031–4041–70
22 ■ CLIMATE CHANGE, DISASTER RISK, AND THE URBAN POOR
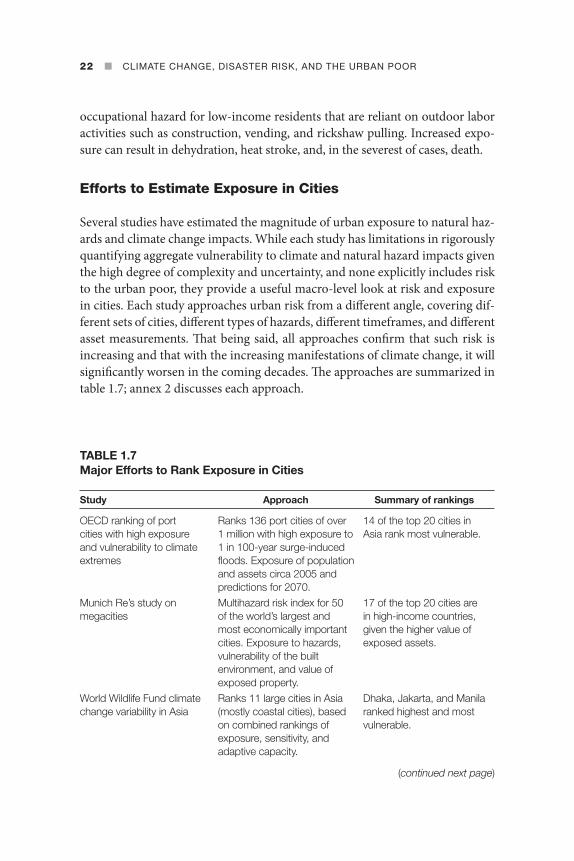
TABLE 1.7 Major Efforts to Rank Exposure in Cities
Study Approach Summary of rankings
OECD ranking of port cities with high exposure and vulnerability to climate extremes
Ranks 136 port cities of over 1 million with high exposure to 1 in 100-year surge-induced fl oods. Exposure of population and assets circa 2005 and predictions for 2070.
14 of the top 20 cities in Asia rank most vulnerable.
Munich Re’s study on megacities
Multihazard risk index for 50 of the world’s largest and most economically important cities. Exposure to hazards, vulnerability of the built environment, and value of exposed property.
17 of the top 20 cities are in high-income countries, given the higher value of exposed assets.
World Wildlife Fund climate change variability in Asia
Ranks 11 large cities in Asia (mostly coastal cities), based on combined rankings of exposure, sensitivity, and adaptive capacity.
Dhaka, Jakarta, and Manila ranked highest and most vulnerable.
(continued next page)
occupational hazard for low-income residents that are reliant on outdoor labor
activities such as construction, vending, and rickshaw pulling. Increased expo-
sure can result in dehydration, heat stroke, and, in the severest of cases, death.
Efforts to Estimate Exposure in Cities
Several studies have estimated the magnitude of urban exposure to natural haz-
ards and climate change impacts. While each study has limitations in rigorously
quantifying aggregate vulnerability to climate and natural hazard impacts given
the high degree of complexity and uncertainty, and none explicitly includes risk
to the urban poor, they provide a useful macro-level look at risk and exposure
in cities. Each study approaches urban risk from a diff erent angle, covering dif-
ferent sets of cities, diff erent types of hazards, diff erent timeframes, and diff erent
asset measurements. Th at being said, all approaches confi rm that such risk is
increasing and that with the increasing manifestations of climate change, it will
signifi cantly worsen in the coming decades. Th e approaches are summarized in
table 1.7; annex 2 discusses each approach.

VULNERABLE CITIES ■ 23
Earthquake disaster risk index for cities (Stanford University)
Ranks earthquake risk in cities based on hazard, exposure, vulnerability, external context, and emergency response and recovery. Methodology developed and used for sample of 10 cities.
Of the 10-city sample, Tokyo was ranked highest.
Resilient Cities: A Multi-Hazard City Risk Index (methodology report and city profi les)
A model has been developed to rank cities based on risk to population, buildings, and infrastructure using data on metropolitan elements, indices for 13 hazards, and vulnerability parameters. Current (2010) and future (2030) risk is calculated. The methodology was piloted in Bangkok, Ningbo, and Manila.
Metro Manila ranks the highest among the three pilot cities. Risk is growing for all cities in 2030 compared to 2010; risks from more frequent events (2-year return periods) is higher than less frequent events (30-year return).
Source: Author.
TABLE 1.7 continued
Study Approach Summary of rankings
Notes
1. ISDR (2009) based on EMDAT data. Between 1975 and 2008, 78.2 percent of mortal-
ity in signifi cant natural hazards occurred in only 0.3 percent of recorded events.
2. Th e full case studies are also available.
3. See Dickson et al. (2010).
4. United Nations, “World Urbanization Prospects,” http://esa.un.org/unup/. Th is table
covers through 2010 and thus does not include the recent earthquake and tsunami in
Japan.
References
Carmin, JoAnn, and Yan F. Zhang. 2009. “Achieving Urban Climate Adaptation in Europe
and Central Asia.” Policy Research Working Paper 5088, World Bank, Washington, DC.
Corburn, Jason. 2009. “Cities, Climate Change and Urban Heat Island Mitigation: Localis-
ing Global Environmental Science.” Urban Studies 46 (2): 413–427.
De Castro, M.C., Y. Yamagata, D. Mtasiwa, M. Tanner, J. Utzinger, J. Keiser, and B.H.
Singer. 2004. “Integrated Urban Malaria Control: A Case Study in Dar es Salaam, Tan-
zania.” American Journal of Tropical Medicine and Hygiene, 103–117.

24 ■ CLIMATE CHANGE, DISASTER RISK, AND THE URBAN POOR
Dickson, Eric, Judy Baker, Daniel Hoornweg, and Asmita Tiwari. 2012. “Urban Risk
Assessments World Bank, Washington, DC.
Dilley, Maxx, Robert S. Chen, Uwe Deichmann, Art L. Lerner-Lam, and Margaret Arnold.
2005. Natural Disaster Hotspots: A Global Risk Analysis. Washington, DC: World Bank/
Columbia University.
Dodman, David, and David Satterthwaite. 2008. “Institutional Capacity, Climate Change
Adaptation and the Urban Poor.” IDS Bulletin 39(4): 67–74.
Intergovernmental Panel on Climate Change (IPCC). 2007. IPCC Fourth Assessment
Report: Climate Change 2007.
International Federation of Red Cross and Red Cresent Societies (IFRC). 2010. World
Disasters Report: Focus on Urban Risk. Geneva: IFRC.
International Institute for Environment and Development (IIED). 2009. Adapting Cities
to Climate Change: Understanding and Addressing the Development Challenges. Ed. by
Jane Bicknell, David Dodman and David Satterthwaite. London: Earthscan.
———. undated. Climate Change and the Urban Poor: Risk and Resilience in 15 of the
World’s Most Vulnerable Cities. London: IIED.
ISDR. 2009. Global Assessment Report on Disaster Risk Reduction. Geneva: UN Interna-
tional Strategy for Disaster Reduction.
Kinyanjui, Micahel. 2010. “Development Context and the Millennium Agenda.” In Th e
Challenge of Slums: Global Report on Human Settlements 2003, revised and updated
version (April 2010). UN-HABITAT: Nairobi, Kenya.
Lall, S.V., and U. Deichmann. 2009. “Density and Disasters: Economics of Urban Hazard
Risk.” Policy Research Working Paper 5161, World Bank, Washington, DC.
Leon, C., V. Magaña, B. Graizbord, R. González, A. Damian, and F. Estrada. 2010. “Pobreza
Urbana y Cambio Climático para La Ciudad de México.” Unpublished, Mayor’s Task
Force Study, Mexico City.
McGranahan, Gordon, Deborah Balk, and Bridget Anderson. 2007. “Th e Rising Tide:
Assessing the Risks of Climate Change and Human Settlements in Low Elevation
Coastal Zones.” Environment and Urbanization 19 (1): 17–37.
Moser, Caroline, David Satterthwaite, et al.. 2008. “Pro-Poor Climate Change Adap-
tation in the Urban Centres of Low- and Middle-Income Countries.” Background
paper for the “Social Dimensions of Climate Change” workshop, Washington, DC,
March 5–6.
Poumadère, M., C. Mays, S. Le Mer, and R. Blong. 2005. “Th e 2003 Heat Wave in France:
Dangerous Climate Change Here and Now.” Risk Analysis 25: 1483–1494.
Small, Christopher, and Terry Naumann. 2001. “Th e Global Distribution of Human Popu-
lation and Recent Volcanism.” Global Environmental Change Part B: Environmental
Hazards 3 (3–4): 93–109.
UN-HABITAT. 2003a. Th e Challenge of Slums: Global Report on Human Settlements. Lon-
don/Sterling, VA: Earthscan Publications Ltd.
UN-HABITAT. 2003b. “Slums of the World: Th e Face of Urban Poverty in the New Mil-
lennium? Monitoring the Millennium Development Goal, Target 11 – World Wide
Slum Dweller Estimation.” Working Paper.
Volcanological Society of Japan (VSJ) and International Association of Volcanology and
Chemistry of the Earth’s Interior (IAVCEI). 2007. Cities on Volcanoes 5 Conference Pro-
ceedings. http://www.eri.u-tokyo.ac.jp/nakada/cov5_hp/documents/abstract_e.pdf

VULNERABLE CITIES ■ 25
Wilbanks, Tom J., Patricia Romero Lankao, Manzhu Bao, Frans Berkhout, Sandy
Cairncross, Jean-Paul Ceron, Manmohan Kapshe, Robert Muir-Wood, and Ricardo
Zapata-Marti. 2007. “Industry, Settlement and Society.” In Climate Change 2007:
Impacts, Adaptation and Vulnerability. Contribution of Working Group II to the Fourth
Assessment Report of the Intergovernmental Panel on Climate Change, ed. by Martin
Parry, Osvaldo Canziani, Jean Palutikof, Paul van der Linden and Clair Hanson.
Cambridge, UK: Cambridge University Press.
World Watch Institute. 2007. State of the World: Our Urban Future. New York: W.W.
Norton and Company.
World Bank and United Nations. 2010. Natural Hazards, UnNatural Disasters. Washing-
ton, DC: World Bank.


■ 27
Vulnerability of the Urban Poor
Key Messages
• Distinctions in spatial and location characteristics affect the nature and degree to which slum residents are impacted by natural disaster and climate change events.
• Exposure to risk by the urban poor is exacerbated by where they live within cities and their limited access to basic infrastructure and services.
• Cities typically do not have the resources or capacity to keep up with growing needs of service provision in poor urban areas.
• Land tenure, employment, fi nancial security, and availability of social net-works affect the sensitivity and adaptive capacity of the urban poor to climate change and disaster risk.
As discussed in Chapter 1, the risks in cities are on the rise as countries urban-
ize, particularly in cyclone-prone coastal areas and earthquake zones. Th is has
major implications for the urban poor, with estimates that the population living
in informal settlements is increasing by about 25 million per year (ISDR 2009).
A number of characteristics directly relate to where and how the urban poor live
and their access to basic services that increase their exposure and sensitivity to
the risks associated with climate change and natural hazards. Other factors such
as social networks and density can positively aff ect their adaptive capacity. Th is
chapter discusses how the location, physical layout, and lack of infrastructure
2

28 ■ CLIMATE CHANGE, DISASTER RISK, AND THE URBAN POOR
and basic services in slums increase exposure to risk, and how key characteristics
such as tenure, employment, fi nancial insecurity, and social networks aff ect their
vulnerability.
Exposure: Location and Settlement Patterns of the Urban Poor
Th e choice of where to live within cities is driven by tradeoff s between what is
aff ordable, proximity to income-earning opportunities, and where individuals
may have social networks and kinship ties. Typically the areas aff ordable to the
poor are those that others deem undesirable for residential purposes, or unus-
able for other urban activities. Slums have resulted from squatting on vacant or
undeveloped lands, or from the deterioration of existing neighborhoods such
as inner cities and public and industrial housing (UN-HABITAT 2003a). Many,
though not all, of the urban poor live in slums that have the most visible con-
centrations of poor people, with lower-quality housing and services. Yet not all
slum residents are poor. In many cities, such as Mumbai, where housing supply is
extremely limited, the cost of housing, even for middle-income families, is unaf-
fordable, with some living in slums.
Slum sites may be unsafe, and un-serviced, two conditions exacerbated by lack
of security of tenure. Unsafe sites can be on fragile, dangerous, or polluted lands
that are fl ood prone, on unstable soils, such as steep slopes or landfi lls, or are close
to physical or environmental hazards such as toxic urban and industrial wastes,
rail corridors, and electricity lines. Housing is typically small, overcrowded, of
substandard quality, in poor structural condition, and located in highly dense
areas with haphazard or irregular layouts that lack basic services. Th e insecurity
of tenure puts the poor at constant risk of eviction, hampering residents from
investing in housing improvements and eff orts to provide services.
Th e lack of aff ordable land is, in many cities, attributed to ineffi cient land use
and housing regulations, and a lack of public and private housing fi nance. Den-
sity regulations, such as low fl oor-area ratio (FAR)1 and unaff ordable minimum
development and housing standards restrict the supply of land and housing and
drive up prices, particularly aff ecting low-income groups.
Although the percentage share of urban population living in slums has
decreased markedly over the last 20 years, in absolute terms the number of slum-
dwellers is growing and is expected to rise due to both rural–urban migration
and natural increase. It is estimated that about one-third of the urban population
in developing countries—nearly 1 billion people are living in slums.2 In Africa,
the proportion of urban residents living in slums is astoundingly at 72 percent, up
from 62 percent a decade ago (UN-HABITAT 2010).

VULNERABILITY OF THE URBAN POOR ■ 29
Across slums, there are many diff erent types, with important distinctions in
spatial and location characteristics that aff ect the nature and degree to which
slum residents are impacted by natural disaster and climate change.
Slum Formation
Th e physical formation of slums can be categorized as follows: (1) the inner city
or historic core, (2) scattered pockets within the city, and (3) peri-urban areas
(UN-HABITAT 2003a). Each has its own characteristics, which result in diff erent
types of vulnerability for residents.
Inner-City SlumsIn many older cities, a common urbanization pattern has been an increase in
commercial and manufacturing activities in the historic core, which results in
deterioration of residential areas as wealthier residents move out to newer neigh-
borhoods. Abandoned buildings have been subdivided to provide rental hous-
ing with shared amenities that oft en degenerate into slum conditions. Inner-city
slums are highly dense, rooming houses are overcrowded, and very small apart-
ments accommodate growing families. Th e older parts of most Asian and African
cities, such as Delhi, Dhaka, Cairo, and Istanbul, are inner-city slums.
Although the structures are made of permanent materials, they are typically in
poor condition due to deterioration over time and lack of maintenance. Absentee
landlords have little incentive to maintain or redevelop the structures due to rent
controls and cost, and renters lack the incentive and are too poor to invest in
maintenance.3 In an earthquake or landslide, the poor condition of such struc-
tures can amplify the destruction and damage.
Scattered Slum PocketsSquatter settlements interspersed within a city account for much of the low-
income housing in rapidly developing cities. Most low-income households
illegally occupy or “squat” on vacant land close to their work place without the
consent of the owner or the local authorities.4 Th e land may be left vacant for sev-
eral reasons: it may be reserved for public amenities, under litigation, owned by
absentee landlords, or physically and environmentally hazardous. Land is infor-
mally divided, sold, leased, sub-leased to households who build dwelling units
incrementally, with limited or no services (UN-HABITAT 2003a).
Although eviction in such areas is always a possibility, in many cities contin-
ued presence has given squatters a de facto right to develop and, in fact, older
slums have better access to services and more permanent structures. Th ey face
little political opposition since they off er sizable vote banks. In the older slums, a
vast majority of residents invest in upgrading their structures with more durable

30 ■ CLIMATE CHANGE, DISASTER RISK, AND THE URBAN POOR
and permanent materials over time. Older slums have more owner-occupied and
self-employed residents than newer, poorer settlements. However, renting and
subletting from subsistence landlords, absentee landlords, developers, and rent
agents is common (UN-HABITAT 2003a).
Peri-urban SlumsSlums in peri-urban areas are formed by one of three processes: squatting; dete-
rioration of public and industrial housing that created slum estates; and illegal
subdivision of land with the permission of the owner, but not of local authorities.
While land is less expensive than in the inner cities, the cost of transportation
can be high and travel times long, making access to work, markets, and social
amenities more diffi cult and costly. Slum estates were typically built between the
1950s and 1970s, when many cities built public housing to rehabilitate residents
of center-city slums and squatter settlements with minimal services. Although
the structures are relatively recent, they were built of poor materials and con-
struction quality. Examples include “newtowns” in Cairo (Helwan, Moktam, and
Shubra), Ciudad Kenedy in Bogota, large State Housing Board housing develop-
ments constructed in almost all the major Indian cities during the 1970s and
1980s, and housing for industrial workers, such as hostels and estates of small
dwellings for mine workers in Southern Africa, “chawls” built for textile industry
workers in Mumbai, India, and slab blocs in the former communist countries
(UN-HABITAT 2003a).
In illegal subdivisions, low-income households purchase or rent private land
of relatively lower value at the periphery from developers that is developed
without the consent of the local authorities, and hence is illegal. Th e devel-
oper may be a well-connected businessman or politician who has the resources
and power to purchase, lay out, and allocate land. Th e layouts, however, may
not meet offi cial development standards. Since trunk infrastructure is limited
in peri-urban locations, most illegal subdivisions have poor or no services.
Housing conditions are typically better than adjoining rural areas and squatter
settlements of the same age. Dwellings are mostly owner occupied, although
renting also exists.
Spatial Contiguity and Size
Th ere are slums laid out contiguously that are typically either physically iso-
lated from surrounding planned neighborhoods by canals, storm drains, railway
tracks, and motorways, or may be interspersed within planned residential areas.
Th e size of slums can also vary substantially, also aff ecting exposure.
Although some slums are larger than many cities, medium-sized slums are
more common. Kibera, in Nairobi, is a 550-acre slum with between 200,000

VULNERABILITY OF THE URBAN POOR ■ 31
BOX 2.1
Locating Vulnerable Households in the Mexico City Metropolitan Area (MCMA)
In preparing a socioeconomic assessment of Mexico City, two areas were selected for determining household vulnerability: population and housing characteristics. Understanding the characteristics of population and hous-ing separately can have signifi cant policy implications related to more effec-tive targeting of social programs or housing upgrades. Overlaying the spatial distribution of vulnerable population and vulnerable housing also provided an expanded understanding of at-risk areas, which was critical for subsequently assessing hazard impact.
The top map was developed to assess vulnerable populations based on an index using the following indicators: percentage of adult population without formal education, percentage of population over 65 years old, percentage
Distribution of vulnerable population in MCMA
vulnerable populations
Legend
Distribution of vulnerable housing in MCMA
vulnerable housing
Legend
(continued next page)

32 ■ CLIMATE CHANGE, DISASTER RISK, AND THE URBAN POOR
BOX 2.1 continued
of recent migrants, percentage of households headed by women, and per-centage of adult population earning below the minimum wage. The analysis determined that 42 percent of the urban population is highly vulnerable from a demographic and human development point of view.
The lower map was developed to assess housing vulnerability based on an index combining indicators of roof quality, walls quality, availability of basic services, availability of a refrigerator, and security of tenure. The analysis found that 30 percent of the population (27 percent of households) lives in highly vulnerable housing units.
An overlay of housing vulnerability and population vulnerability—through a simple vulnerability matrix—shows that 27 percent of the total population of MCMA is vulnerable individuals living in vulnerable housing. It is evident also from the map above that in MCMA most vulnerable houses are located in the peri-urban areas.
Distribution of highly vulnerable areas in MCMA
Population and housing not vulnerable
Vulnerable population and housing
Vulnerable housing
Vulnerable population
Legend
Source: Leon et al. (2010).
and 1 million inhabitants;5 Dharavi, the largest slum in India (in Mumbai), has
a population estimated between 600,000 and 1 million residing on 430 acres.6 In
Ghana, Aishaman (population 150,000), is as large as or larger than Tema, the
city it is located in (population 140,000) (UN-HABITAT 2003a). Th ese very large
slums are, however, relatively uncommon. More common are medium-sized
slums interspersed within a city or peri-urban slums described above.
Th e layout of slums may have costs and benefi ts in terms of destruction or
damage from extreme weather or hazards. For example, if contiguous slums

VULNERABILITY OF THE URBAN POOR ■ 33
share the same network of services, the disruption of water supply, sanitation,
drainage, and electricity can aff ect more slum residents. Contamination of water
sources and poor solid-waste disposal can spread infectious diseases more easily
over the larger area and aff ect more residents. At the same time, it is possible to
provide safety and emergency relief to more slum households in a contiguous
area through reaching one location. Equally, it is possible to effi ciently provide
services to more urban poor, improving their resilience to hazards.
Households in interspersed slum pockets might have a slightly higher adap-
tive capacity due to stronger linkages with higher-income households for whom
they perform services. Th eir employers may be in a better position to provide
emergency fi nancial relief than other slum residents and these relationships may
improve their adaptive capacity in crisis. Small slums use mostly the services of
the neighboring planned areas. Th ey illegally tap the public water supply, as well
as use open public drains and public open space for sanitation and garbage dis-
posal. Th ese slum pockets are oft en overlooked or even protected by neighbor-
ing upper-income areas, since they depend on the slum residents for domestic
services (UN-HABITAT 2003)—thereby improving the coping capacity of the
residents to impacts of disasters.
BOX 2.2
Jardim Ana Maria: A Slum Pocket in São Paulo
Jardim Ana Maria is a slum area in São Paulo with 600 housing units in approx-imately 21,000 square meters. Located in the district of Brasilandia, one of the poorest in the city, Jardim Ana Maria is classifi ed as highly and very highly vul-nerable in 97 percent of its territory. More than 99 percent of the slum is under some kind of hazard; 92 percent of the area is exposed to landslides and
(continued next page)

34 ■ CLIMATE CHANGE, DISASTER RISK, AND THE URBAN POOR
Site Conditions
Hazardous sites, where slums are oft en located, may be in fl ood zones, low-lying
dry season river beds, swamps, marshes, steep slopes, and garbage landfi lls. Th e
sites may be dangerous, such as close to high-tension lines, railway tracks, or
highways, or may be polluted because of being close to toxic industries. Poor
conditions of structures, as well as the lack of services, compound the impact of
hazards on the urban poor and increase their risks.
In São Paulo, approximately 20 percent of the land where slums are located
is subject to geo-technical hazard, vulnerable to landslides and washouts. Th is
includes 407 highly hazardous areas located in 26 subdistricts, all of which are
informal settlements. Overall, more than 5 percent of slum areas are highly or
very highly exposed. Th is means that the areas are highly prone to be aff ected by
destructive events in the next 12 months (box 2.3).
Density and MorphologySlum density is measured by a combination of population density and density of
dwelling units and can be both a liability and an asset. It is no surprise that due to
the high cost of urban land, slums have high population and dwelling density. For
example, in Mumbai, 60 percent of its total population lives in slums that occupy
a mere 8 percent of its total area.
Although spatial contiguity and high density might increase the adaptive
capacity of the urban poor, these factors might also increase the population
exposure of the urban poor to loss of life and injury, and destruction and dam-
age to infrastructure and transportation linkages. Lack of, or poorly maintained,
infrastructure in dense slums can magnify the impact of small hazards and aff ect
BOX 2.2 continued
6 percent to washout alongside the water courses. Exposure is exacerbated by poverty and high concentrations of garbage and construction rubbish in the streets, lack of a superfi cial drainage system, and lack of a water supply in some of the residences. Jardim Ana Maria only began to be occupied in 1973. Today, the government of São Paulo has classifi ed Jardim Ana Maria as a Special Interest Area, a denomination that guarantees that the area can be used only for social housing; this will prevent future evictions motivated by commercial purposes.
Source: World Bank and Diagonal Ltd. (2011).

VULNERABILITY OF THE URBAN POOR ■ 35
BOX 2.3
São Paulo’s Geotechnical Hazard Areas and Declivity Hazard Areas
Areas ranked by their critical level and by types of settlements in São Paulo City.
Source: HABISP [Sistema de informações para habitação social] – SEHAB [ Secretaria da Habitação e Desenvolvimento Urbano]; IPT [Instituto de Pesquisas Tecnológicas do Estado de São Paulo] 2010; World Bank and Diagonal Ltd. (2011).
Legend
Slope0–5%5–25%25–60%>60%
Geotechnical Risk Areas Legend
Informal settlementsSlumsWellsprings
Rivers
Low hazard
Medium hazard
High hazard
Very high hazard
Slums 2.92% 11.90% 4.11% 1.40%Settlements/allotments
0.65% 2.93% 0.97% 0.43%
Urbanized centers 4.59% 7.62% 0.56% 0.09%
more slum residents. As mentioned above, in dense inner-city slums, aging
infrastructure and poor conditions of old, historic structures aggravate damages
from hazards. Infrastructure in such areas was typically planned for a smaller
population and is now inadequate. Frequent rainfall can cause drainage chal-
lenges, dis ruption of transportation services, and destruction or damage to roads.

36 ■ CLIMATE CHANGE, DISASTER RISK, AND THE URBAN POOR
BOX 2.4
Pattern between Flood-Prone Areas and Where the Poor Live in Jakarta
Source: World Bank (2011b). The map on the top illustrates the areas of Jakarta that would be affected by a fl ood with the same magnitude as the one that affected the city in 2007. The map on the bottom shows the concentration of poor households in Jakarta by subdistrict. An overlay of the two maps confi rms that the poor are more likely to live in disaster-prone areas.
Flood AreasJAKARTA
District Boundary
Subdistrict Boundary
Administrative Village BoundaryNumber of Poor Household
0–150151–450451–750751–1,0501,051–3,000

VULNERABILITY OF THE URBAN POOR ■ 37
Th e economies of scale off ered by the high density of slum settlements can, on
the other hand, increase the adaptive capacity of cities through effi ciencies in the
provision of basic services.
Th e morphology of slums refers to the layout of slums and the distribution of
built-up areas to open areas. Slums are usually characterized by irregular layouts,
with very little open space in comparison to built-up areas. Haphazard layouts
with minimal open space, such as those in inner-city slums, can create poorly
ventilated living conditions, and extensive built-up areas increase local ambient
temperatures. Irregular layouts and narrow streets that were originally suited for
pedestrian traffi c also limit the possible locations for water supply, sanitation ser-
vices, and the collection of solid waste. During crises, irregular street networks
impede relief eff orts, especially in larger slums. Aft er the Gujarat (India) earth-
quake of 2001, major casualties were seen in the old parts of towns where the
traditional street network trapped residents and hindered rescue eff orts.
Subdivisions in peripheral areas have increasingly gridiron layouts, since land
is not a constraint and therefore easy to lay out; additionally, residents recognize
that it is easy to install services later. Such a pattern reduces the exposure of these
residents to hazards.
BOX 2.5
Exposure in Slums of South Asia and Latin America
A study of slums in six cities in Bangladesh showed that the major concentra-tions of slum settlements were on both sides of railway lines, low-lying river-banks, or along embankments that have poor drainage. More than 50 percent of the slum clusters were typically fully fl ooded or partially fl ooded when the country experienced fl oods due to moderate-to-heavy rainfall during the rainy season (Center for Urban Studies 2006).
In Kathmandu, Nepal, a city of 1 million people located in a Himalayan valley, squatter settlements in the city are growing at an alarming rate. Most are located along the banks of its three rivers on steep slopes. Approximately 25 percent of the households fl ood due to inadequate drainage. The squat-ter settlements fl ood when water levels rise in the monsoon season. Some seek shelter with relatives and friends during the monsoon season as rising water inundates their homes. People who live here are also susceptible to water-borne diseases that increase when fl ood water stagnates in and around their homes. Solid waste is regularly thrown into the rivers, since the squatter
(continued next page)

38 ■ CLIMATE CHANGE, DISASTER RISK, AND THE URBAN POOR
Climate Change, Disaster Risk, and the Delivery of Basic Services for the Urban Poor
Access to safe shelter, water, sanitation, proper drainage, reliable transport, roads,
solid-waste removal, and public health services remains an elusive goal for many
of the urban poor. With rapid urbanization comes the challenge of providing
basic services to a growing population, oft en to people with limited means and
living in informal settlements. Cities typically do not have the resources or capac-
ity to keep up with the growing need for services. Issues of informality further
BOX 2.5 continued
settlements do not have any waste-collection service. The storm-water and sewage network operates at 40 percent capacity, since it is blocked by sludge and debris. This increases the incidence of disease, exacerbated by the lack of affordable medical treatment for the urban poor.
In Bogota, Colombia, correlation of data on the location of properties, income-levels of households, and earthquake risk revealed that poor house-holds are located closer to fault lines and face a disproportionate burden, al-most twice the seismic risk compared to higher-income households (Lall and Deichmann 2009). Location of poor settlements on steep terrain increases erosion and landslide risk due to natural hazards and climate change (Lall and Deichmann 2009).
In Caracas, Venezuela, which is located in a high-risk seismic zone, high-rise buildings and densely packed apartment blocks are concentrated where shaking is expected to be highest during an earthquake. Lack of building codes and enforcement allowed residents to build on alluvial fans, which reac-tivated during December 1999. That month experienced over 900 millimeters of rain in a 72-hour period, triggering landslides, mudfl ows, and debris fl ows. “Barrios” or slums occupy the low-lying, rugged mountains to the east and west of the city center, where rainfall-induced debris fl ows are expected to be the greatest. The dwelling units in the barrios are constructed of unreinforced masonry, making them particularly vulnerable to earthquakes. Although vari-ous groups are working to repair and rebuild housing in safe locations, poor planning and code enforcement are allowing squatters to return to the alluvial fans and streambeds where most of the December 1999 destruction was con-centrated (Dilley et al. 2005).
Source: Author.

VULNERABILITY OF THE URBAN POOR ■ 39
exacerbate the challenges, given that many governments, nongovernmental orga-
nizations (NGOs), and the private sector are reluctant to invest where residents
lack secure tenure, as they perceive these investments as risky. Th ere is also a
perception that the urban poor are unable to pay for basic services, yet in many
cities, the urban poor pay more than the non-poor, as they have to rely on expen-
sive delivery systems.
A lack of basic services coupled with overcrowded living conditions reduces
the resilience of the urban poor. Th e absence of drainage may turn a heavy rain-
fall into a disastrous fl ood. Lack of solid-waste disposal blocks drainage channels
and compounds the risk of fl ooding. Destruction or damage to infrastructure can
lead to water scarcity, contamination, and spread of disease. Infectious diseases
can spread rapidly through slums. Lack of access roads can prevent relief eff orts
from reaching households. Lack of income and lack of access to safe housing
with good provision for water, sanitation, health care, and education aff ects the
capacity of slum residents to recover. Insecure tenure coupled with socio-spatial
exclusion also reduces their access to receive information and fi nancial assistance
to cope with disasters (Lall and Deichmann 2009) (see table 1.3).
Th ese potential impacts emphasize the urgency of providing access to clean,
safe, and reliable services. Such priorities are consistent with the Millennium
Development Goals and basic development goals for human settlements of the
past decades—ensuring adequate shelter, provision of safe water and basic sani-
tation, reliable energy, proper drainage, solid-waste collection, transport, and
protection from disease. Th e risks from disasters, climate change, and growing
exposure provide added incentive for increased investments in existing and new
infrastructure. As seen in recent disasters in Pakistan, Haiti, and elsewhere, such
catastrophes can wipe out decades of development gains in infrastructure and
service delivery. Proper investments now can protect citizens, save lives, and
minimize loss and destruction in the decades to come. Some of the key issues
related to the provision of safe shelter, water, drainage, solid-waste collection,
roads and transport, energy, and public and environmental health to the urban
poor in the context of natural hazards and climate change are discussed below.7
Shelter
Th e housing in low-income urban settlements tends to be of poor quality and
located on precarious sites. While formal housing for the urban poor does exist,
it is more common for housing to be self-constructed and made from low-quality
materials. For squatters, the threat of eviction prevents the investment in durable
materials.
New patterns in temperature and precipitation will, in some cases, alter the
habitability and stability of residences, while increased frequency and intensity of

40 ■ CLIMATE CHANGE, DISASTER RISK, AND THE URBAN POOR
natural hazards will place settlements and homes at greater risk. Although there
are wide variations in impacts, the presence of substandard housing, lack of hous-
ing standards and policy enforcement, and reliance on informal service providers
in most settlements result in increased risks as the climate changes.
From the perspective of managing the risk of disasters, the collapse of
one poorly constructed structure can trigger the collapse of multiple houses.
Th e accumulation of debris can block access to relief. For example, the col-
lapse of a building aft er an earthquake can cause a major fi re that in turn
can damage other structures that had not been originally aff ected by the
earthquake (Kunreuther and Roth 1998). Research conducted by the Archi-
tectural Institute of Japan in 1997 on the Great Hanshim-Awaji earthquake
highlighted that poorly constructed houses compounded the severity of
the impacts. Th e rubble blocked transportation networks, prevented eff ec-
tive fi re-fi ghting, and made recovery more diffi cult (Nakagawaa, Saito, and
Yamaga 2007).
Th e disasters in the Philippines listed in table 2.1 highlight how natural
hazards in informal settlements have major impacts in informal settlements.
Heavy rains, fl oods, mudfl ows, and fi re oft en decimate homes of the urban
poor.
In the wake of disasters that destroy housing in informal settlements, recon-
struction and rehabilitation are complex. Support from community organizations
and the government is oft en needed to ensure that the poor regain housing and
that the new housing is more stable than the structures it replaces. However, this
is not always available, particularly for those in informal settlements. For exam-
ple, aft er Mumbai’s devastating fl oods in 2005, the state government announced a
rehabilitation package of approximately US$5 million for the fl ood victims (Con-
cerned Citizens Commission 2005). Th e poor living in formal settlements were
able to take advantage of this support, while those living in informal settlements
were ineligible for the rehabilitation package (Concerned Citizens Commission
2005).
In the absence of offi cial support to help informal settlers cope with and
recover from disasters, some municipalities are making modest eff orts to extend
assistance. Cape Flats, for instance, is an informal settlement in Cape Town that
is located below sea level and is prone to fl oods each winter. While the city does
not provide services to this area, it has cleaned storm drains and worked with
NGOs to establish emergency shelters, ensure the availability of basic relief provi-
sions, and disseminate information so that dwellers can take their own measures,
such as raising their homes and diverting fl ood waters (Simply Green 2009). As
this example illustrates, in most instances the urban poor living in fl ood-prone
areas have little or no assistance and therefore rely on ad hoc measures to protect
their homes and well-being. A case in point is the slum of Makoko in Lagos,

VULNERABILITY OF THE URBAN POOR ■ 41
TABLE 2.1Impacts of Recent Disasters in Informal Settlements: The Philippines
Disaster Year Details
Trash slides at the Payatas solid-waste dump in Quezon City (metro Manila)
2000 Heavy rains from typhoons caused a 15-meter (50-foot) slope in the dump to collapse, burying hundreds of homes; 288 people were killed and several hundred families displaced. Subsequent fl ash fl oods affected the homes and livelihoods of many more people.
Landslide in Barangay Guinsaugon
2006 The whole barangay (district) was buried and another 80 barangays affected. A total of 154 deaths were recorded, 968 people reported missing, 3,742 displaced, and 18,862 affected.
Mount Mayor mudfl ow and fl oods
2006 Typhoons triggered huge fl oods, mudslides, and avalanches. In the Bicol region alone, at least 208 people died and another 261 were reported missing. These settlements were recovering from a previous typhoon.
Fire in the settlement of the lower Tipolo Homeowners Association in Mandaue
2007 246 structures were destroyed, leaving 913 people homeless.
Flash fl ood in Iloilo 2008 In the city of Iloilo, 152 of its 180 barangays were affected by heavy rain and fl ooding. Up to 500 people were killed, with 261,335 affected. Many houses were washed away and many households lost their documentation.
Flooding in Manila during typhoons Ondoy and Pepeng
2009 Typhoon Ondoy alone left 280 people dead and more than 700,000 people displaced to shelters or temporary stays with host families; more than 3 million people were affected in total.
Source: IFRC (2010).
Nigeria. To cope with the challenge of being located in a fl ood basin, residents
have raised their homes on stilts. Similarly, in the Alaho settlement in Accra, resi-
dents respond to fl oods by placing barriers across their doors, raising the height
of their furniture, creating elevated storage areas, and putting their homes on
higher foundations (ActionAid 2006).
Water Supply and Sanitation
Th e delivery of a sustainable water supply and sanitation is increasingly diffi cult
in urban areas due to (1) population growth and urbanization, (2) poor manage-
ment and aging infrastructure, and (3) the impacts of climate change. A deterio-
rating water supply and sanitation infrastructure with poorly maintained water
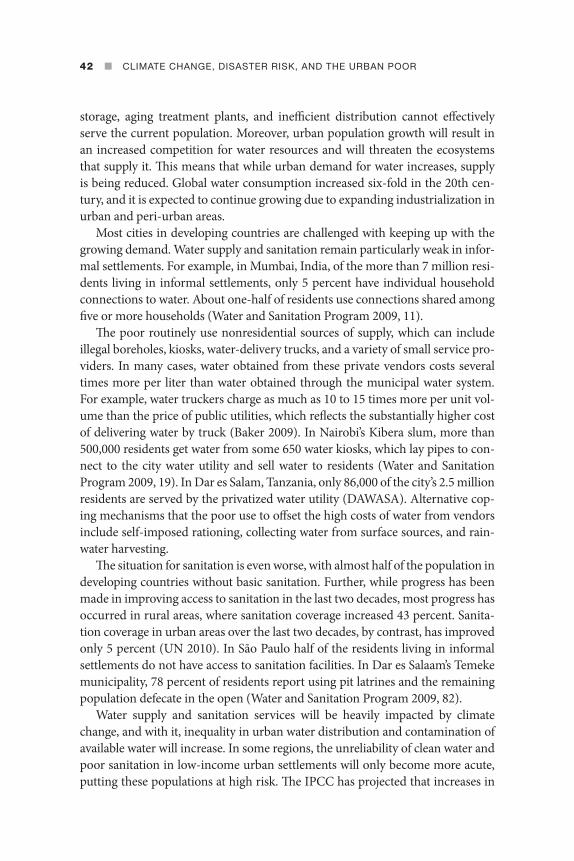
42 ■ CLIMATE CHANGE, DISASTER RISK, AND THE URBAN POOR
storage, aging treatment plants, and ineffi cient distribution cannot eff ectively
serve the current population. Moreover, urban population growth will result in
an increased competition for water resources and will threaten the ecosystems
that supply it. Th is means that while urban demand for water increases, supply
is being reduced. Global water consumption increased six-fold in the 20th cen-
tury, and it is expected to continue growing due to expanding industrialization in
urban and peri-urban areas.
Most cities in developing countries are challenged with keeping up with the
growing demand. Water supply and sanitation remain particularly weak in infor-
mal settlements. For example, in Mumbai, India, of the more than 7 million resi-
dents living in informal settlements, only 5 percent have individual household
connections to water. About one-half of residents use connections shared among
fi ve or more households (Water and Sanitation Program 2009, 11).
Th e poor routinely use nonresidential sources of supply, which can include
illegal boreholes, kiosks, water-delivery trucks, and a variety of small service pro-
viders. In many cases, water obtained from these private vendors costs several
times more per liter than water obtained through the municipal water system.
For example, water truckers charge as much as 10 to 15 times more per unit vol-
ume than the price of public utilities, which refl ects the substantially higher cost
of delivering water by truck (Baker 2009). In Nairobi’s Kibera slum, more than
500,000 residents get water from some 650 water kiosks, which lay pipes to con-
nect to the city water utility and sell water to residents (Water and Sanitation
Program 2009, 19). In Dar es Salam, Tanzania, only 86,000 of the city’s 2.5 million
residents are served by the privatized water utility (DAWASA). Alternative cop-
ing mechanisms that the poor use to off set the high costs of water from vendors
include self-imposed rationing, collecting water from surface sources, and rain-
water harvesting.
Th e situation for sanitation is even worse, with almost half of the population in
developing countries without basic sanitation. Further, while progress has been
made in improving access to sanitation in the last two decades, most progress has
occurred in rural areas, where sanitation coverage increased 43 percent. Sanita-
tion coverage in urban areas over the last two decades, by contrast, has improved
only 5 percent (UN 2010). In São Paulo half of the residents living in informal
settlements do not have access to sanitation facilities. In Dar es Salaam’s Temeke
municipality, 78 percent of residents report using pit latrines and the remaining
population defecate in the open (Water and Sanitation Program 2009, 82).
Water supply and sanitation services will be heavily impacted by climate
change, and with it, inequality in urban water distribution and contamination of
available water will increase. In some regions, the unreliability of clean water and
poor sanitation in low-income urban settlements will only become more acute,
putting these populations at high risk. Th e IPCC has projected that increases in

VULNERABILITY OF THE URBAN POOR ■ 43
average global temperatures, sea-level rise, and in some areas, more frequent and
intense fl oods and droughts will aff ect water availability for urban water-supply
systems. Higher temperatures and reduced precipitation are expected to cause
supply shortages due to the slower replenishment rates of groundwater aquifers
and reduced surface water (Danilenko et al. 2010).Combined with a lack of sani-
tation, the urban poor frequently suff er from contaminated water sources during
dry periods (Stephens 1996, 25). Drinking water is also more vulnerable to con-
tamination due to stagnant water remaining in settlements, and because fl ooding
will mobilize more pathogens and contaminants. Floods can carry contaminated
BOX 2.6
Water Supply in Dar es Salaam
Continuous, full-pressure water supply remains a dream for the urban poor in Dar es Salaam. Water quality and reliability are poor, especially in low-income areas, where the poor frequently have to purchase water at exorbitant prices from vendors, kiosks, and neighbors. In Dar es Salaam, 60 percent of the water is lost due to poor maintenance of the water-supply network, and another 13 percent through unauthorized use and illegal taps. Only 26 percent of the water is billed (Greenhill and Wekiya 2004) and only16 percent actually paid for.
Existing constraints to clean-water supply for the residents of Dar es Salaam’s unplanned settlements will become an increasingly severe issue given both increased climatic variability (with the possibility of more or longer droughts) and the projected growth of the city’s population over the com-ing decades. At present the city’s water demand already far outstrips its wa-ter-treatment capability. Existing treatment capacity is 282,000 m3 per day; water demand in 2007 was 412,000 m3 per day. Demand is projected to rise to 964,000 m3 per day by 2032 (DAWASA 2008). A study of 45 of Dar es Salaam’s wards, containing 84 percent of the city’s population, found that the percentage of informal residents without access to improved drinking water ranged from 37.8 percent to 90 percent, with a mean of 71.8 percent ( Penrose et al. 2010). Unpredictable water supply has led poorer residents to try to adapt to the situation by diversifying sources (often expensive) and reducing consumption. The considerable cost of a piped water connection continues to pose an obstacle for poorer households; only 8 percent of the city’s residents had access to piped water.
Sources: Greenhill and Wekiya (2004); and Penrose et al. (2010).

44 ■ CLIMATE CHANGE, DISASTER RISK, AND THE URBAN POOR
water containing wastes and toxic chemicals into living spaces. Th e incidence of
diarrhea may be around 10 percent higher in some countries by 2030 (McMi-
chael et al. 2006). In Kampala, Uganda, recent outbreaks of cholera, dysentery,
and diarrhea have been attributed to fl ooding.8
While short- and medium-term measures, such as water rationing or altering
of design parameters, may allow urban water utilities to cope with the eff ects of
climate change, long-term impacts of climate change are likely to surpass current
design allowances. Compounding the eff ects of climate change and urbanization,
many cities fail to properly maintain and rehabilitate water utility networks for
lack of fi nancial resources.
Drainage
Th e lack of proper drainage can lead to devastating fl ooding. Th e urban poor are
particularly vulnerable because their homes are frequently located in low-lying
areas, with little or no access to drainage. For example, in Dhaka, Bangladesh,
only 10 percent of slum dwellers had suffi cient drainage to avoid water-logging
during heavy rains (Islam 2005). In most low-income settlements, inadequately
maintained storm drains and poor waste-disposal practices prevent drainage
systems from working during heavy rains, oft en resulting in fl ooding. Stagnant
fl oodwater provides an ideal breeding ground for parasites, which may lead to
an increase in malaria and other vector-transmitted diseases. In Phnom Penh
(1.3 million inhabitants) (Heinonen 2008), some 176,000 of the urban poor live
South-East Asia
East Asia
South Asia
Sub-Saharan Africa
Developing Regions
Latin American &Caribbean
0 20 40
Percent
60 80 100
Figure 2.1 Percentage of Urban Population Using Improved Sanitation (2008)
Source: UN (2010).

VULNERABILITY OF THE URBAN POOR ■ 45
in housing that fl oods regularly due to heavy rainfall and clogged drains; this
population is highly exposed to water-borne diseases and may be increasingly
so as climate change advances (ADB 2008). In Jakarta, a city highly vulnerable
to sea-level rise, problems of public health related to poor drainage and standing
water are severe. A study in informal settlements in the northern part of the city
reported diarrheal incidence at 342 episodes per 1,000 people, and 43 percent
of children under fi ve were infected with at least one type of intestinal worms
(Harpham, Garner, and Surjadi 1990).
With increases in fl ooding due to climate change as discussed in Chapter 1,
proper drainage becomes increasingly important. Policy makers and planners can
minimize the consequences of fl ooding through structural, social, economic, and
administrative measures taken now. Storm-water drainage overlaps with other
services, such as solid-waste disposal and Integrated Urban Water Management.
Additionally, drainage can benefi t from sustainable and natural drainage systems.
Solid Waste
In many poor urban areas, solid-waste management presents huge challenges.
While the urban poor may generate less waste than their more affl uent neighbors,
BOX 2.7
Water Scarcity in Mexico City
Despite major infrastructural investments to funnel water resources toward industrial and population centers, water scarcity remains in places such as Mexico City (Mumme and Lybecker 2002, 313). In these areas, overexploita-tion of ground water has led to land subsidence, salinization, and pollution of ground water (Peritore,1999). Uneven subsidence changes the gradients of water delivery, drainage, and sewage networks, which further contaminates ground and surface water (Peritore, 147). Leaky and insuffi cient water supply and drainage infrastructure are complicated by the subsidence of Mexico City at a rate of 45 centimeters a year. It is estimated that 77 percent of Mexican rivers are polluted to the point that they pose a risk to human health (Mumme and Lybecker, 312). Treatment is required for most Mexican surface water be-fore it is considered potable, and fecal contamination is considered responsible for gastrointestinal illness in one-third of the Mexican population (Peritore, 147).
Source: Leon et al. 2010.

46 ■ CLIMATE CHANGE, DISASTER RISK, AND THE URBAN POOR
they are much more likely to suff er the consequences of inadequate waste man-
agement. Typically, up to two-thirds of the solid waste generated is not collected,
and most oft en municipal authorities focus their limited budget on solid-
waste collection in neighborhoods with wealth and political power (Zurbrügg
2002, 1). Even in places like Brazil, where urban waste collection is relatively high
(80 percent), waste disposal is oft en inadequate, occurring in open dumps that
contaminate soil and water and adversely aff ect the health and safety of the sur-
rounding, oft en poor, population (IBGE 2003).
Solids, whether they are the sediments from land development or the solid
waste produced by human populations, decrease the fl ow of rivers. In urban areas
with inadequate services, solid waste can block storm-water drains, impeding the
fl ow of water from the impacted area and increasing pollution. In addition, solid
waste contributes to general environmental degradation and increases disease
vectors. In the case of many cities, solid-waste disposal and drainage improve-
ments are included in general urban upgrading programs and in some cases, such
as Ouagadougou (UN-HABITAT 2008) and several communities in Liberia,
improvements in solid-waste disposal and drainage were also used as a vehicle
for job creation.
Good solid-waste management is also important for mitigating climate
change. Nearly 5 percent of global greenhouse gas (GHG) emissions (1,460
mtCO2e) in 2010 came from post-consumer waste (Hoornweg et al. 2010, 40).
Investments in solid-waste management can also be a small but catalytic
source of revenue. For instance, the Dar es Salaam City Council closed the Mtoni
solid-waste dumpsite and, in collaboration with a private company, created
mechanisms for tapping and fl aring the gases produced at the dump. Together
they invested over US$1.25 million in 2008. Th e partnership was able to sell the
13,895 tons of carbon that had been fl ared at a cost of US$15–25 per ton.
Roads and Transport
Access to roads and transport services are critical for mobility to jobs, markets,
health, education, and, during extreme weather, to safety. Oft en the quality of
roads in urban slums is very low, hampering service provision, and, during fl oods
or other disasters, preventing emergency vehicles from getting to residents.
Roads can be washed out, intense heat can warp and crack pavement, and
increased precipitation can cause subsidence. In Ethiopia, where extensive mod-
eling has been done, increased precipitation due to climate change is expected
to both decrease the lifespan of unpaved roads and increase the maintenance
needs and costs for paved roads (World Bank 2010). Th e condition of pedestrian
paths and roads in slums, which are usually unpaved, is already oft en poor and
will only further deteriorate with increased extreme weather. In Dar es Salaam,

VULNERABILITY OF THE URBAN POOR ■ 47
roads become impossible to navigate during the rainy season, when the increas-
ing number and depth of holes can completely block vehicles (Olvera et al. 2002).
Daily trips on foot also become much more diffi cult during rains, when people
are cut off from their neighborhoods and bridges or roads collapse. During the
2010 earthquake in Port au Prince, Haiti, the lack of access roads between streets
hindered relief eff orts. Relief vehicles had diffi culty entering the patchwork of
unmarked “corridors” (IFRC 2010).
Squatter settlements are surrounded by planned developments, and most
are well connected to public transportation networks. However, the interior of
large slums may be poorly connected and do not have any transportation ser-
vices (UN-HABITAT 2003a). Slums in peri-urban areas typically must rely on
public transport, which is oft en limited or unaff ordable. Slum residents in peri-
urban areas may spend a substantial portion of their income, up to 30 percent, on
transportation to jobs, markets, and social amenities; some walk as much as 3 to
4 hours a day to reach their places of employment (UN-HABITAT 2003a). Th is
limits employment opportunities and can contribute to social exclusion. Th e eco-
nomic and social costs associated with transport are particularly relevant when
assessing the tradeoff s for policy related to relocating slum residents to safer loca-
tions, which may be in peri-urban areas as is discussed in Chapter 3.
Energy
Energy services are critical to raising productivity, creating opportunities at the
household level for income generation, and contributing to improved health and
education. Th e poor’s access to safe, aff ordable, and reliable services is still rela-
tively low in many cities. Many rely on illegal connections and ineffi cient or dan-
gerous sources. Th e majority of the urban poor rely on burning biomass (wood,
charcoal, agriculture, and animal waste) for cooking.
Traditional cook stoves worsen indoor air pollution and respiratory health.
Depending on the fuel used, traditional cook stoves also contribute to climate
change and deforestation (World Bank 2011). In such cases, improved cook
stoves would decrease indoor air pollution and also contribute to mitigating
climate change. Th e use of cook stoves is common in countries across the devel-
oping world, including India and China, where projects to introduce improved
cook stoves are underway. In Dar es Salaam, the city administration has pio-
neered the production of briquettes made of recycled trash, replacing char-
coal as fuel for family cooking stoves. As a result, the use of wood and related
air pollution has been dramatically reduced.9 In India, a government subsidy
program has reduced the price of 8 million stoves by 50 percent (World Bank
2010a, 312), with impacts both on air pollution and on the health of the urban
poor (World Bank 2003).

48 ■ CLIMATE CHANGE, DISASTER RISK, AND THE URBAN POOR
Globally, a new Alliance for Clean Cook Stoves, led by the United Nations,
was established in 2010 to improve low-quality cook stoves that present environ-
mental and health risks. Th is initiative is important for climate change because
studies suggest that black carbon, such as the particulates emitted as soot from
rudimentary cook stoves, may have contributed fully 13 percent of the warming
of the Arctic since 1976.10
Much like other infrastructure, climate change and extreme weather are
anticipated to have signifi cant impacts on energy infrastructure, as the latter will
be vulnerable to fl ood and wind damage. Meanwhile, heat and cold waves are
expected to produce shift s in energy demand in response to building design and
internal temperature control. Even in high- and middle-income countries, the
increased demand for air conditioning during heat waves can cause widespread
blackouts. Th e high temperatures can prove fatal for the elderly, very young, and
urban poor—many of whom have no access to air conditioning.11 In Delhi, ris-
ing temperatures and the energy demand for cooling are being cited as signs that
the National Capital Region could become unsustainable, despite rapid economic
growth.12 Similarly, there is signifi cant overlap between the energy and water sec-
tors. In areas dependent on hydropower, droughts will aff ect energy generation.
In the other direction, cities that already use energy-intensive pumps to con-
vey their water supply over long distances may face additional challenges with
increasing drought or competing energy demands. An example would be Mexico
City, which uses pumps to carry a third of its water supply up and over 1,000-
meter peaks.13 To the extent that the urban poor rely on energy services for cook-
ing, heating, lighting, and home-based businesses, they will similarly be aff ected
by these changes.
Public and Environmental Health
Many impacts of climate change and natural hazards on the urban poor are
most notable in risks to public health. Exposure to changing weather patterns
in temperature, precipitation, sea-level rise, and more frequent earthquakes and
landslides have direct consequences for people’s health: morbidity and mortality.
Many communicable diseases are highly sensitive to changing temperatures and
precipitation. Th ese include vector-borne diseases, such as malaria and dengue,
and water-borne diseases, such as diarrhea and cholera. Th e pathogens that cause
these diseases thrive in living conditions characteristic of those typically found in
slums. Worse, their impact is also likely to be more severe in populations with a
preexisting burden of disease (IPCC 2007).
In Dar es Salaam, accessing clean water and sanitation are major problems
for the poor, contributing to widespread illness, including cholera, malaria, lym-
phatic falorisi, and diarrhea, particularly during fl oods. Since the fi rst major

VULNERABILITY OF THE URBAN POOR ■ 49
cholera epidemic was reported in southern Tanzania in 1977, cholera has spread
to most regions of the country and has remained a chronic and widespread prob-
lem in Dar es Salaam. In 2006, 14,297 cases, including 254 deaths (1.8 percent
case fatality rate), were reported from 16 of Tanzania’s 21 regions. Dar es Salaam
represented 62.7 percent of the total cases and 101 deaths (39.8 percent of total
deaths) (Penrose, Werema, and Ryan 2010; WHO 2008).
While research on the impact of climate change on vulnerable populations is
still in early stages, the link between urban poverty and ill-health is already well
established. In its Fourth Assessment Report, the IPCC has warned that chang-
ing weather patterns are altering the distribution of some infectious- disease
vectors and worsening existing health conditions. Th e report also predicts that
adverse health impacts of climate change will be greatest in low-income coun-
tries, and the urban poor in all countries will be at greater risk apart from the
elderly, children, and coastal populations (IPCC 2007). Th e urban poor are
more prone to diseases such as diarrhea, tuberculosis, dengue, malaria, pneu-
monia, cholera, and HIV/AIDS (Montgomery 2009; Harpham 2009; Mercado
et al. 2007; Cattaneo et al. 2007). In cities, the poor tend to live in low-income
settlements or slums with inadequate access to clean water and sanitation facili-
ties, drainage, and solid-waste management, which exposes them to a “double
burden” of both communicable and noncommunicable diseases14 causing dis-
ability and death (Harpham 2009). Despite their proximity to better health-care
facilities than people in rural areas, the urban poor oft en do not have access to
quality health care, as services are unaff ordable or facilities are inaccessible.
Th ey also die disproportionately of both infectious and chronic, degenerative
diseases (Montgomery et al. 2004).
Climate change is expected to expose 90 million more people in Africa to
malaria by 2030—a 14 percent increase—because of expanded mosquito breed-
ing grounds and because the disease is now spreading to higher altitudes.15
Dengue fever is expanding in its geographic range: climate change is expected
to double the proportion of the world’s population at risk, from 30 percent to
60 percent by 2070 (World Bank 2010b, 97).
Emergency Services
Emergency services include measures to respond to disasters and catastro-
phes, including both preparedness and emergency response and recovery. Th e
lack of, or limited, emergency services in developing countries oft en is crip-
pling to citizens and economies. A study of natural hazards in Mediterranean
countries noted that disasters in the Southern European countries have had
the lowest levels of fatalities, as well as the lowest livelihood and economic loss,
attributed to the presence of preventive measures and disaster-management

50 ■ CLIMATE CHANGE, DISASTER RISK, AND THE URBAN POOR
preparedness. In contrast, North Africa and Turkey had the most debilitating
impacts (Brauch 2003).
One of the core institutional indicators of emergency preparedness is the
presence of national, regional, and sector-level disaster-management plans.
Although these are important tools, the presence of plans alone does not ensure
that a country, region, or city is able to adequately respond when disaster strikes.
BOX 2.8
Incidents of Dengue in Jakarta
Changes in rainfall patterns and increasing temperatures are a signifi cant health hazard for the urban population, particularly in the area of water- and mosqui-to-borne diseases. While often nonfatal when adequately treated, dengue has a disproportionate impact on the poor, who have lower less access to medi-cal care. In Jakarta there has been a signifi cant increase in recorded cases of dengue in recent years attributed to increases in rainfall, humidity, and tem-perature. The correlation between monthly rainfall and dengue cases was the strongest, where one study has estimated that every 9.73 mm increase in monthly rainfall resulted in an additional 67 cases of dengue. The correlations with increased temperatures and humidity were positive, although less strong. Increase in cases of dengue fever is only one indicator of how global meteoro-logical changes are affecting the spread of diseases in Jakarta.
Source: World Bank (2011b).
20000
5000
1000
87297437
5750
Tahun
14071
2064023466
24932
1500
20000
Kas
us
25000
30000
2002 2004 2005 200620032001
Kasus DBD

VULNERABILITY OF THE URBAN POOR ■ 51
Mumbai, for instance, has a comprehensive disaster-management plan that
lists diff erent calamities that can aff ect the city and identifi es those areas most
at risk. It also contains provisions to reduce the impact of disasters through
infrastructure development, communication and public information, and land-
use policies and planning, as well as maps out protocols to be followed when
a disaster occurs (Concerned Citizens Commission 2005). Despite the plan,
when the 2005 fl oods hit the city, it became clear that disaster-management
strategies such as early-warning systems had not been implemented and fi rst
responders did not have the equipment or training to act (Concerned Citizens
Commission 2005).
While slums and informal settlements are not always able to obtain govern-
ment support when emergencies arise, communities, NGOs, and the private sec-
tor respond in various ways. Th e private sector has begun to engage with the
public and NGOs in providing services and warning systems. International orga-
nizations such as the Red Cross, Oxfam, and Save the Children Fund provide
shelter, food, and other forms of humanitarian aid in disasters, when govern-
ments cannot or do not act quickly enough (Beamon and Balcik 2008). At the
most basic level, social networks and social capital are critical aspects of emer-
gency response. In moments of extreme events, local community members sup-
port one another by providing information and by working together to address
impacts. For example, fl ood management is oft en handled by sand-bagging. Such
approaches are oft en eff ective in emergency scenarios, but are not substitutes for
the levels of prevention that can be achieved through infrastructure and emer-
gency services.
Other Key Issues Affecting the Vulnerability of the Urban Poor
Several factors related to the characteristics of the urban poor aff ect their sensitiv-
ity and adaptive capacity to climate change and disaster risk, impacting vulner-
ability. Among these are security of tenure, employment and fi nancial insecurity,
and social networks.
Security of Tenure
More than a quarter of the world’s urban populations experience various levels of
tenure insecurity, ranging from some level of legality to full illegality (for example,
unauthorized squatting) (UN-HABITAT 2007). Insecure tenure and protection
from forced evictions are key to obtaining public infrastructure services—
municipalities are reluctant to provide infrastructure to slum households, in

52 ■ CLIMATE CHANGE, DISASTER RISK, AND THE URBAN POOR
the absence of property rights, especially in unplanned settlements or on public
land. Security of tenure is also critical to self-investments in property and service
improvements that are critical for ad hoc adaptation of the urban poor. In Dhaka,
Bangladesh, residents, donors, NGOs, and government report lack of tenure
security as a key constraint to service delivery. With the constant threat of evic-
tions, government agencies, NGOs, and donors are reluctant to invest capital in
erecting permanent structures that residents may stand to lose if evicted (World
Bank 2005). Th is has obvious implications on vulnerability.
Forced evictions are the most extreme manifestation of tenure insecurity.
At least 2 million people, mostly those with the worst housing, are forcibly
evicted by local government authorities every year. Recent data reveals that
forced evictions worldwide have increased during the last decade, especially
in Africa and Asia (UN-HABITAT 2007). Th e most common reasons cited for
BOX 2.9
Settlements and Environmentally Sensitive Lands
Parks, gardens, natural areas, and recreational spaces are highly valued in most cities. As a result, informal settlements that encroach upon urban parks, forests, waterways, and wetlands often are seen as posing threats to natural resources. The common responses by local governments to these settlements are displacement and relocation. As a case in point is an informal settlement in Mumbai that grew over the years and ultimately encroached upon the city’s Borivali National Park, the only park in India within a metropo-lis. This national park contains two of the city’s sources of drinking water and is home to a variety of fl ora and fauna. The Bombay High Court ruled to evict and resettle the residents, because of their location (Bavadam 2003). As a further example, after the 2005 Mumbai fl ood, the local government tar-geted some informal settlements that had encroached upon a narrow point of the Mithi River and planned to evict the residents and construct a park in that area. At the same time, the encroachment of the high-income Bandra-Kurla Complex, which was constructed over the mangrove ecosystem of the Mithi River (Concerned Citizens Commission 2005) was overlooked. These examples illustrate how local government interventions based on relocation are used to protect resources, although not necessarily in an equitable way. (Bartlett et al. 2009).
Source: Carmin, Roberts, and Anguelovski (2009).

VULNERABILITY OF THE URBAN POOR ■ 53
forced evictions are infrastructure projects, international mega-events, and
urban beautifi cation.
Employment and Financial Security of the Urban Poor
While the urban economy provides many income and employment opportuni-
ties, the poor tend to be marginalized on many fronts and oft en face low incomes,
limited (mostly informal) sources of livelihood, lack of social insurance, and lim-
ited access to credit markets. For some, especially those living in peri-urban areas,
accessing jobs is diffi cult. For others, the negative stigma associated with living
in certain neighborhoods provides a barrier to entering the formal job market.
Climate change and natural hazards could signifi cantly aff ect access to liveli-
hoods for the urban poor. For example, slum entrepreneurs operate outside of
formal markets and typically do not have insurance against their assets. Hazards
such as fl oods, mudslides, hurricanes, and storms, especially if increasing in fre-
quency or severity, can easily destroy the physical assets of these businesses as
well as homes, leaving residents destitute.
Urban agriculture accounts for a substantial percentage of employment in
some cities with links to commercial food and ornamental plant production,
development of small agro-food industries, marketing of agricultural prod-
ucts, input supply, and waste-recycling enterprises. Urban agriculture could be
aff ected by climate change in obvious ways related to water shortages, fl ooding,
and heat stresses, but also has an increasing role to play for both climate-change
adaptation and mitigation with implications for job creation. Urban agriculture
can contribute to overall food security, particularly in providing emergency food
in disasters when supply chains do not function. Green rooft ops can contrib-
ute to improved air quality, and rainwater-harvesting systems can help lessen the
eff ects of fl ooding. Urban agriculture can also help to build resilience by keeping
environmentally sensitive and dangerous lands from being used for illegal resi-
dential development.
Social Networks
Traditionally, vulnerable individuals and communities have managed risk
through ad hoc coping techniques that draw on their local knowledge of haz-
ards and community resources. Th ere is substantial literature that discusses ad
hoc adaptation to illustrate the strength of social capital. In slums where social
networks and kinship ties are stronger, communities are more resilient. Older
communities have stronger social networks than newer settlements, where resi-
dents may be more transient. Active internal leadership in close-knit communi-
ties can organize relief and rehabilitation more eff ectively and effi ciently. Th is

54 ■ CLIMATE CHANGE, DISASTER RISK, AND THE URBAN POOR
is especially the case for fast-onset events that require temporary relocation; at
these times, residents rely on their existing social capital and existing networks.
A study on adaptation by the poor in Mombasa, Kenya, and Esteli, Nicaragua,
provides examples (World Bank 2010b). When slum dwellers in Esteli are forced
to leave their home in time of emergency, they take refuge in churches and with
friends and relatives in other areas. Charitable citizens provide basic needs for
those evacuated, and police protect their homes—oft en their most valuable asset
(World Bank 2010b). Th ese systems of mutual support signifi cantly enhance
community resilience to disasters and climate change.
In these two cities, community organizations are actively involved in adapting
to extreme weather. Adaptation at the household and business level is slightly
more common, but community-scale adaptation occurs in Mombasa in approxi-
mately 80 percent of extreme weather events (World Bank 2010b). Communities
that lack social capital have more limited capacity to respond to climate change
and disasters. A community’s level of social capital depends on an array of char-
acteristics, including length of tenure or settlement and pattern of occupation of
an area (Moser and Satterthwaite 2010; Moser and Felton 2007).
Extended family networks, as part of the larger social network, oft en go
beyond the urban arena to rural households. In such networks, urban relatives
are oft en called on for fi nancial support in times of drought or other diffi culty.
In addition, rural family members may move to join urban-dwelling relatives
during droughts or fl oods (Raleigh and Jordan 2010). Th is means that changing
weather patterns and extreme events in far-reaching regions also have an impact
on urban households.
Th e study also found that the asset that the poor value and tend to protect the
most during extreme events is their house. Other important assets were busi-
nesses and electrical appliances. Most households were resourceful at developing
resilience measures (for example, 91% of the households implement some kind
of adaptation action before severe weather event, 100 percent during the event
and 91 percent aft erward). Furthermore, the study revealed that the most critical
dimension of vulnerability of the poor was weak or unclear tenure rights, and
that owner occupiers tend to invest more resources in adaptation measures than
tenants, especially in reinforcing the house before heavy rains.
Notably, such social networks do vary from community to community. A
study of marginalized populations in Mumbai, India, following the 2005 fl oods
found that around 97 percent of the households that undertook reconstruction
of their damaged houses depended on their past savings (Hallegatte et al. 2010).
Only 1.7 percent of the households said they secured the money for reconstruc-
tion from family members, and the reminder relied on loans from money lenders
and other sources.

VULNERABILITY OF THE URBAN POOR ■ 55
Ad hoc Adaptation and Risk of MaladaptationSome of the coping mechanisms used by the poor also refl ect a short-term per-
spective by individuals or communities who may be accustomed to living with
risk from recurrent hazards and cannot rely on government protection (Doug-
las et al. 2008). Examples of ad hoc adaptation in Accra, Kampala, Lagos, and
Maputo following heavy fl ooding in 2006 show that individuals resorted to using
concrete blocks and furniture to raise valuables above the reach of fl ood waters,
creating small barriers to prevent the fl ood waters from entering their home, or
when this was unavoidable, creating openings to channel fl ood waters through
their homes as quickly as possible. Th ose individuals who lacked safe places for
their assets or vulnerable family members moved away from the impacted area
to stay with family or in public buildings (Douglas et al. 2008). In low-income
areas in Jakarta vulnerable to fl ooding along the coast, residents have raised their
homes on stilts to accommodate rising sea levels and land subsidence. Residents
in one close-knit neighborhood report working together to repair the govern-
ment-constructed sea wall, or fi xing boats used for fi shing. While ad hoc adapta-
tion may save lives and assets in the short term, its unregulated nature creates the
possibility for maladaptation—where a shift in vulnerability from one group to
another may deliver a short-term gain, at the cost of creating long-term, higher
vulnerability such as impacts on future generations.

56
■
C
LIM
AT
E C
HA
NG
E, D
ISA
ST
ER
RIS
K, A
ND
TH
E U
RB
AN
PO
OR
TABLE 2.2 Adaptation Strategies Applied during Heavy Rain
Mombasa
Asset holder
Strategies
Before During After
Tenants • Repair roof• Build stronger foundations• Dig trenches around houses• Clear drainage
• Seal leaking areas• Vacate fl ooding houses• Open up passage routes
• Block water passage routes• Repair houses
Owner occupied • Make water drains• Repair houses• Build concrete skirting around houses• Seal holes and leakages• Build barriers at entrance to houses• Build strong houses
• Unblock and clear drains• Move to safer houses• Remove water from house
• Rebuild and repair

VU
LN
ER
AB
ILIT
Y O
F T
HE
UR
BA
N P
OO
R
■
57
Esteli
Household asset Before/continuous During After
Plots or sites • Level the land• Build terraces• Plant local trees• Dig trenches• Build drainage channels
• Spread dry soil and gravel• Build stone dykes• Dig trenches around plots• Open up drainage passages
• Plant damp-resistant tress• Replace eroded ground with new soil
and stones• Build stone dykes• Repair fences• Replant trees and plants
Houses • Clean ditches• Replace plastic and zinc• Replace wooden planks• Build stone dykes• Reinforce foundations• Build steps with tires
• Block leaks• Collect leakages• Secure zinc roofs with stones• Spread sawdust• Dig drainage ditches
• Repair leaks• Mend roofs• Reinforce foundations• Maintain drainage ditches
Latrines/showers and washstands
• Build and maintain• Abandon and eliminate saturated latrines• Improve absorbency with tires• Tie down and secure
• Dig ditches• Channel water away from houses
• Repair structure• Replace poles and plastic• Reinforce with tires• Dig new holes
Source: World Bank (2010b).

58 ■ CLIMATE CHANGE, DISASTER RISK, AND THE URBAN POOR
Notes
1. FAR, the fl oor-area ratio, determines the total amount of fl oor space (including all
levels) that can be built on a plot of land.
2. Slum estimates are calculated by UN-HABITAT based on the defi nition of a group
of individuals living under the same roof in an urban area lacking at least one of the
following fi ve conditions: access to improved water supply; access to improved sani-
tation facilities; suffi cient living area (not more than three people sharing the same
room); structural quality and durability of dwellings; and security of tenure. If a
home has one or all fi ve of these conditions, they would be classifi ed as a slum house-
hold (UN-HABITAT 2008). While there are major defi ciencies with this approach
to measuring slums—such as a lack of the degree of deprivation experienced by a
given household or community, and inability to capture improvements of individual
defi ciencies over time—these estimates provide a basis for understanding the scope of
shelter deprivation in urban areas globally.
3. Rent control introduced in many countries during and aft er World War II freezes
rents at levels that are aff ordable to low-income families, but that do not relate to
the value or replacement cost of the accommodation, or to the economic cost of
adequately maintaining the building and its services; owners remove value from the
building by withdrawing maintenance (UN-HABITAT 2003a).
4. Occupation can be a rapid, organized invasion at one end, and incremental growth
at the other. Initially, squatting may have been the result of authorities tolerating
post-independence infl ow of migrants to cities in Asia and Africa. In many cases,
squatting eventually becomes a profi table business in connivance with politicians,
police, and land racketeers. Squatter housing is not free. An entry fee is charged by
an agent who controls land subdivision (UN-HABITAT 2003a).
5. http://siteresources.worldbank.org/WBI/Resources/213798-1278955272198/
Putting_Nairobi_Slums_on_the_Map.pdf.
6. http://www.time.com/time/asia/covers/501060619/slum.html.
7. Much has been written on basic services from a sectoral perspective; this section high-
lights key issues related to the urban poor, and provides context for the chapter that
follows on building adaptive capacity and resilience.
8. IIED (2009, 15).
9. http://wbi.worldbank.org/wbi/stories/dar-es-salaam-mayor-“some-will-be-talking-
and-some-will-be-doing”-global-video-dialogue-expl.
10. Author’s calculations from World Bank (2010a, 312). Black carbon is estimated to
have accounted for as much as 70 percent of this warming eff ect, and cook stoves
in the developing world account for 18 percent of that black carbon (18 percent of
70 percent is 13 percent).
11. As mentioned in the adaptation plans for New York City and Paris.
12. Revi (2008) as cited in Satterthwaite (2007).
13. Romero-Lankao (2007), as cited in Satterthwaite (2007).
14. Communicable diseases are caused by pathogenic microorganisms, such as bac-
teria, viruses, parasites, or fungi. Th ey can be spread, directly or indirectly, from
one person to another. Communicable diseases prevalent in developing coun-
tries include diarrhea, viral hepatitis, typhoid fever, HIV/AIDS, tuberculosis, and

VULNERABILITY OF THE URBAN POOR ■ 59
vector-borne infectious diseases, especially malaria, dengue fever, and chikungu-
nya. Noncommunicable diseases, or NCD, are not contagious. Examples of NCD
include cardiovascular diseases, cancer, diabetes, and allergies.
15. Hay et al. (2006) cited in World Bank (2009, 3).
References
ActionAid. 2006. Unjust Waters. Climate change, Flooding and the Protection of Poor Urban
Communities: Experiences from Six African Cities. Johannesburg: ActionAid Interna-
tional.
Asian Development Bank (ADB). 2008. Urban Innovations: Partnerships for a Cleaner
City: Community-based Environmental Improvements in Phnom Penh. ADB. http://
www.adb.org/Documents/Urban-Development/Environmental-Improvements.pdf.
Baker, Judy, ed. 2009. Opportunities and Challenges for Small Scale Private Service Provid-
ers in Electricity and Water Supply. Washington, DC: World Bank, PPIAF.
Bartlett, Sheridan, David Dodman, Jorgelina Hardoy, David Satterthwaite, and Cecilia
Tacoli. 2009. “Social Aspects of Climate Change in Urban Areas in Low- and Middle-
Income Nations.” Contribution to the World Bank Fift h Urban Research Symposium
Cities and Climate Change: Responding to an Urgent Agenda.
Bavadam, Lyla. 2003. “Encroaching on a Lifeline.” Frontline 20(4). http://www.hinduonnet
.com/fl ine/fl ine 2004/stories/20030228002609200.htm.
Beamon, Benita M., and Burcu Balcik. 2008. “Performance Measurement in Humanitar-
ian Supply Chains.” International Journal of Public Sector Management 1 (21): 4–25.
Brauch. 2003. “Urbanization And Natural Disasters In Th e Mediterranean: Population
Growth And Climate Change in the 21st Century.” In Building Safer Cities: Th e Future of
Disaster Risk, ed. A. Kreimer, M. Arnold, and A. Carlin. Washington, DC: World Bank.
Carmin, JoAnn. 2010. “Variations in Urban Climate Adaptation Planning: Implications
for Action.” Paper presented at the International Climate Change Adaptation Confer-
ence, Gold Coast, Australia.
———, Debra Roberts, and Isabelle Anguelovski. 2009. “Planning Climate Resilient Cit-
ies: Early Lessons from Early Adapters.” Paper presented at the Fift h Urban Research
Symposium “Cities and Climate Change: Responding to an Urgent Agenda,” Marseille,
France.
Cattaneo, M., S. Giliani, P. Gertler, S. Martinez, and R. Titiunik, 2007. “Housing, Health
and Happiness.” Policy Research Working Paper 4214, World Bank, Washington, DC.
Center for Urban Studies. 2006. Slums of Urban Bangladesh – Mapping and Census.
Concerned Citizen’s Commission. 2005. Mumbai Marooned: An Enquiry into the Mum-
bai Floods, 2005 Full Report. Mumbai: Conservation Action Trust, 115. http://cat.org
.in/index.php/site/article/concernedcitizens-commission-an-enquiry-into-mumbais-
fl oods-2005/.
Danilenko, Alexander, Eric Dickson, and Michael Jacobsen. 2010. Climate Change and
Urban Water Utilities: Challenges and Opportunities. Water Working Notes. Washing-
ton, DC: World Bank.
Dar es Salaam Water Supply and Sewerage Agency (DAWASA). 2008. “Development of
a Strategic Water Supply Plan for Dar es Salaam,Water Supply Improvement Plan.”

60 ■ CLIMATE CHANGE, DISASTER RISK, AND THE URBAN POOR
Final Report Prepared by Dr. Ahmen Abdel Warith Consulting Engineers in associa-
tion with DCL and Norplan, for DAWASA. Dar es Salaam, June.
Dharmavaran, Soumya, 2011, Courting Hazards: Where the Urban Poor Live, Processed.
Dilley, Maxx, Robert S. Chen, Uwe Deichmann, Art L. Lerner-Lam, and Margaret Arnold.
2005. Natural Disaster Hotspots: A Global Risk Analysis. Washington, DC: World Bank/
Columbia University.
Douglas, Ian, Kurshid Alam, Maryanne Maghenda, Yasmin Mcdonnell, Louise Mclean,
and Jack Campbell. 2008. “Unjust Waters: Climate Change, Flooding and the Urban
Poor in Africa.” Environment and Urbanization 20 (1): 187–205.
Greenhill, R., and Wekiya, I. 2004. Turning off the Taps: Donor Conditionality and Water
Privatization in Dar es Salaam, Tanzania. London: ActionAid.
Hallegatte, Stéphane, Nicola Ranger, Sumana Bhattacharya, Murthy Bachu, Satya Priya,
K. Dhore, Farhat Rafi que, P. Mathur, Nicolas Naville, Fanny Henriet, Anand Patward-
han, K. Narayanan, Subimal Ghosh, Subhankar Karmakar, Unmesh Patnaik, Abhijat
Abhayankar, Sanjib Pohit, Jan Corfee-Morlot, Celine Herweijer. 2010. “Flood Risks,
Climate Change Impacts and Adaptation Benefi ts in Mumbai.” OECD Environmental
Working Paper 27.
Harpham. 2009. “Urban Health in Developing Countries: What Do We Know and Where
Do We Go?” Health & Place 15 (1): 107–116.
Harpham, Trudy, Paul Garner, and Charles Surjadi. 1990. “Planning for Child Health in a
Poor Urban Environment—Th e Case of Jakarta, Indonesia,” Environment and Urban-
ization 2 (2): 80.
Hay et al. 2006. “Th e Malaria Atlas Project: Developing Global Maps of Malaria Risk.”
PLoS Med 3(12).
Heinonen, Ulla. 2008. “Millennium Development Goals and Phnom Penh: Is the City on
Track to Meet the Goals?” Water Resources Laboratory, Helsinki University of Tech-
nology, Finland.
Hoornweg, Daniel, Mila Freire, Marcus J. Lee, Perinaz Bhada-Tata, Belinda Yuen, 2010.
Cities and Climate Change, Responding to an Urgent Agenda. Washington, DC: World
Bank.
Instituto Brasileiro de Geografi a e Estatística (IBGE). 2003. “National Survey of Domicile
Samplings.” Ministry of Planning, Budget and Management, Federal Government of
Brazil.
Intergovernmental Panel on Climate Change (IPCC). 2007. IPCC Fourth Assessment
Report: Climate Change 2007.
International Federation of Red Cross and Red Crescent Societies (IFRC). 2010. World
Disasters Report: Focus on Urban Risk. Geneva: IFRC.
International Strategy for Disaster Reduction (ISDR). 2009. Global Assessment
Report on Disaster Risk Reduction. Geneva: UN International Strategy for Disaster
Reduction.
Islam, N. 2005. Dhaka Now: Contemporary Urban Development. Dhaka: Bangladesh Geo-
graphical Society.
Katich, Kristina, 2011, Th e Impacts of Climate Change and Disasters on Urban Serices,
Processed.
Kreimer, Alcira, Margaret Arnold, and Anne Carlin, eds. Building Safer Cities: Th e Future
of Disaster Risk. 2003. Washington, DC: World Bank.

VULNERABILITY OF THE URBAN POOR ■ 61
Kunreuther, Howard, and Richard J. Roth. 1998. Paying the Price: Th e Status and Role of
Insurance against Natural Disasters in the United States. Joseph Henry Press.
Lall, Somik, and Uwe Deichmann. 2009. “Density and Disasters: Economics of
Urban Hazard Risk.” Policy Research Working Paper 5161, World Bank, Wash-
ington, DC.
Leon, C., V. Magaña, B. Graizbord, R. González, A. Damian, and F. Estrada. 2010. “Pobreza
Urbana y Cambio Climático para La Ciudad de México.” Unpublished, Mayor’s Task
Force Study, Mexico City.
McMichael et al. 2006. “Climate Change and Human Health: Present and Future Risks.”
Th e Lancet 367(9513): 859–869.
Mercado S., K. Havemann, M. Sami, and H. Ueda. 2007. “Urban Poverty: An Urgent Pub-
lic Health Issue.” Urban Health 84 (1): 7–15.
Montgomery, Mark, 2009. “Urban Poverty and Health in Developing Countries.” Popula-
tion Bulletin 64 (2).
Montgomery et al. 2004. In Cities Transformed: Demographic Change and Its Implications
in the Developing World, ed. M. Montgomery, R. Stren, B. Cohen, and H. Reed. Wash-
ington, DC: National Academies Press.
Moser, Caroline, and Andrew Felton. 2007. “Intergenerational Asset Accumulation and
Poverty Reduction in Guayaquil, Ecuador, 1978-2004.” In Reducing Global Poverty: Th e
Case for Asset Accumulation, ed. Caroline Moser. Washington, DC: Brookings Institu-
tion Press.
Moser, Caroline, and David Satterthwaite. 2010. “Towards Pro-Poor Adaptation to Cli-
mate Change in the Urban Centres of Low- and Middle-Income Countries.” In Social
Dimensions of Climate Change: Equity and Vulnerability in a Warming World, ed. R.
Mearns and A. Norton, 231–258. Washington, DC: World Bank.
Mumme and Lybecker. 2002. “Environmental Capacity in Mexico: An Assessment.” In
Capacity Building in National Environmental Policy, ed. Helmut Weidner and Martin
Jänicke.
Nakagawa, Masayuki, Makoto Saito, and Hisaka Yamaga. 2007. “Earthquake Risk and
Housing Rents: Evidence from the Tokyo Metropolitan Area.” Regional Science and
Urban Economics 37: 87–99.
Olvera, L. Diaz, D. Plat, and P. Pochet. 2002. “Transportation and Access to Urban Services
in Dar es Salaam.” In Transportation.
Penrose, K., M.C. Castro, J. Werema, and E. Ryan. 2010. “Informal Urban Settlements and
Cholera Risk in Dar es Salaam, Tanzania.” PLoS Neglected Tropical Disease 4(3).
Peritore, Patrick. 1999. Th ird World Environmentalism, Case Studies from the Global South.
Gainesville, Florida: University Press of Florida.
Raleigh, Clionadh, and Lisa Jordan. 2010. “Climate Change and Migration: Emerging Pat-
terns in the Developing World.” In Social Dimensions of Climate Change: Equity and
Vulnerability in a Warming World.
Revi. 2008. “Climate Change Risk: An Adaptation and Mitigation Agenda for Indian
Cities.”Environment and Urbanization 20(1): 207-229.
Romero-Lankao, Patricia. 2007. “How Do Local Governments in Mexico City Manage
Global Warming?” Local Environment: Th e International Journal of Justice and Sustain-
ability 12: 519–535.
Satterthwaite, David. 2007. “Th e Urban Challenge Revisited.” Environment 49 (9): 6–16.

62 ■ CLIMATE CHANGE, DISASTER RISK, AND THE URBAN POOR
Simply Green. 2009. “Th e Cape Prepares for Extreme Weather and Flooding.” May 3.
http://www.simplygreen.co.za/local-stories/latest/the-cape-prepares-for-extreme-
weather-and-fl ooding.html.
Stephens, C. 1996. “Healthy Cities or Unhealthy Islands? Th e Health and Social Implica-
tions of Urban Inequality.” Environment and Urbanization.
United Nations. 2010. Th e Millennium Development Goals Report 2010. United Nations:
New York.
UN-HABITAT. 2003a. Th e Challenge of Slums: Global Report on Human Settlements.
London/Sterling, VA: Earthscan Publications Ltd.
———. 2003b. “Slums of the World: Th e Face of Urban Poverty in the New Millennium?
Monitoring the Millennium Development Goal, Target 11—World Wide Slum Dweller
Estimation,” Working Paper.
———. 2007. Enhancing Urban Security and Safety.
———. 2007. Global Report on Human Settlements.
———. 2008. Harmonious Cities: State of the World’s Cities 2008/9. London/Sterling, VA:
Earthscan Publications Ltd.
———. 2010. Cities for All, Bridging the Urban Divide: State of the World’s Cities, 2010/2011.
Water and Sanitation Program. 2009. Global Experiences on Expanding Services to the
Urban Poor.
World Bank. 2005. Dhaka Urban Poverty Assessment. Washington DC: World Bank.
———. 2009. World Development Report 2010: Development and Climate Change. Wash-
ington DC: World Bank.
———. 2010a. Ethiopia Economic of Adaptation to Climate Change. World Bank: Wash-
ington, DC.
———. 2010b. Pro-Poor Adaptation to Climate Change in Urban Centers: Case Studies of
Vulnerability and Resilience in Kenya and Nicaragua. Washington, DC: World Bank.
———. 2011a. Black Carbon and Climate Change. Washington, DC: World Bank.
———. 2011b. Jakarta: Urban Challenges in a Changing Climate. Jakarta: World Bank.
World Bank and Diagonal Ltd. 2011. Climate Change, Disaster Risk Management and the
Urban Poor: São Paulo, processed.
World Health Organization (WHO), Global Task Force on Cholera Control. 2008. Cholera
Country Profi le, United Republic of Tanzania.
Zurbrügg, Christian, 2002. “Urban Solid Waste Management in Low-Income Countries
of Asia: How to Cope with the Garbage Crisis.” Presented at the Scientifi c Committee
on Problems of the Environment (SCOPE) Urban Solid Waste Management Review
Session, Durban, South Africa, November.

■ 63
Building Resilience for the Urban Poor
Key Messages
• City governments are the drivers for addressing risks, through the provision of public infrastructure, delivery of basic services, and mainstreaming climate-change adaptation and disaster-risk reduction into urban planning and man-agement practices.
• Stakeholders will need to balance a number of diffi cult policy tradeoffs among risk reduction, urban development, and poverty reduction in decision making.
• Better policies for land-use planning and management will have the biggest impact on risk reduction.
• Investments in risk reduction will have the greatest impact when implemented in partnership with communities.
Th e challenges of improving living conditions for the urban poor through better
service delivery are not new; however, the risks from climate change and increas-
ing exposure to natural hazards accentuate the growing urgency in proactively
addressing them. Despite these existing challenges, there is much accumulated
experience in eff orts to improve living conditions for the urban poor, yet many cit-
ies have not been able to achieve these goals largely due to the pace of urbanization,
ineff ective policies, resource constraints, lack of political will, and weak capacity.
3

64 ■ CLIMATE CHANGE, DISASTER RISK, AND THE URBAN POOR
Th is chapter underscores several recommended actions based on experience
to help cities build resilience for those at greatest risk. Th ese recommendations
are rooted in the need for strong institutions for better urban planning and man-
agement, and sustainable urban policies that consider the positive and negative
outcomes of the diffi cult decisions city offi cials must make.
In implementing these actions, it is city governments that are the drivers for
addressing risks, by providing public infrastructure, delivering basic services,
and mainstreaming climate-change adaptation and disaster-risk reduction into
urban planning and management practices. Such investments will have the big-
gest impact when implemented in partnership with communities that have much
to contribute to the process.
Th e recommended actions are grouped in fi ve main areas discussed in this
chapter. Th ese include (1) assessing risk at the city and community level to
inform decision making and action planning; (2) integrating climate change and
disaster risk reduction policies for the poor into urban planning and manage-
ment; (3) balancing policy tradeoff s among risk reduction, urban development,
and poverty reduction in decision making; (4) strengthening institutional capac-
ity to deliver basic services and reduce vulnerability to climate and disaster risk;
and (5) bridging communities and local governments to work together on local
solutions.
Assessing Risk at the City and Community Levels to Inform Decision Making and Action Planning
Th e case studies carried out as part of this report have demonstrated the impor-
tance of understanding hazards, and socioeconomic and institutional risks, for
any city as an important fi rst step to developing plans in order to adapt and
reduce the risk of disaster.
Assessing Risk
A risk assessment can defi ne the nature of risks, answer questions about the
characteristics of potential hazards, and identify the vulnerabilities of communi-
ties and potential exposure to given hazards. Risk evaluation helps in prioritiz-
ing measures of risk, giving due consideration to the probability and impact of
potential events, the cost-eff ectiveness of the measures, and resource availability.
Relevant and up-to-date information can allow all stakeholders to assess risk
and make informed policy and investment decisions. Such information will aff ect
zoning, property markets, location choices, and adaptation investments. Invest-
ing in regular data collection is necessary for monitoring changes over time and

BUILDING RESILIENCE FOR THE URBAN POOR ■ 65
continually updating risk-reduction plans. All four of the cities in the Mayor’s
Task Force mentioned a lack of data for assessing risk. Th is has ranged from
information gaps related to the location of the urban poor, socioeconomic and
housing data for the poor, subsidence maps, and data on climate hazards and
measurement of risk and potential losses.
Cities are approaching risk assessments in diff erent ways, with some working
on them in a holistic fashion and others carrying out sector-level assessments one
at a time. Tools are being developed to help cities identify risks, initiate planning,
and establish adaptation priorities. One such approach is the Urban Risk Assess-
ment recently developed by the World Bank in partnership with Global Facility
for Disaster Reduction and Recovery (GFDRR), United Nations Environmental
Programme (UNEP), UN-HABITAT, and others (box 3.1). Th is is the approach
used for the case studies carried out for this report. Note that in carrying out risk
assessments, local analysis of natural hazards is not always suffi cient for assessing
risk given the ripple eff ects of network systems within cities. Impacts in one loca-
tion can lead to eff ects that go way beyond the directly aff ected area. For example,
a localized fl ood can shut down electricity in an entire city, stop all public trans-
port systems, and completely paralyze economic activity.
Mapping informal settlements can be a fi rst step to assessing risk for the urban
poor. In a growing number of communities, the poor themselves are carrying
out this work. In Cuttack, India, community-driven data gathering includes the
preparation of digital maps at the city scale for city authorities with input from
an NGO.1 Th e work begins with residents mapping their communities with a
GPS device, commenting on boundaries and characteristics (risk profi le, ser-
vices, etc.), which help the visiting NGO team understand the settlement. Points
marked with the GPS are uploaded to Google Earth and, when aggregated into a
citywide map, provide the location and boundaries of all informal settlements, as
well as their risk profi le.
Th e process of carrying out a risk assessment can be as important as the
results, particularly with regard to building coalitions among stakeholders. Th e
experiences from the Dar es Salaam, Jakarta, Mexico City, and São Paulo cases
point to a few lessons outlined in box 3.2.
Action Planning
Once a risk assessment is carried out, the critical step of identifying priorities
and action planning will follow. As with assessments, workbooks and tools have
been (or are being) developed to assist cities in initiating planning for adaptation
and risk reduction. Most of these emphasize standard planning approaches, such
as building support within government departments, building a team, conduct-
ing assessments, identifying actions, and implementing and monitoring actions.
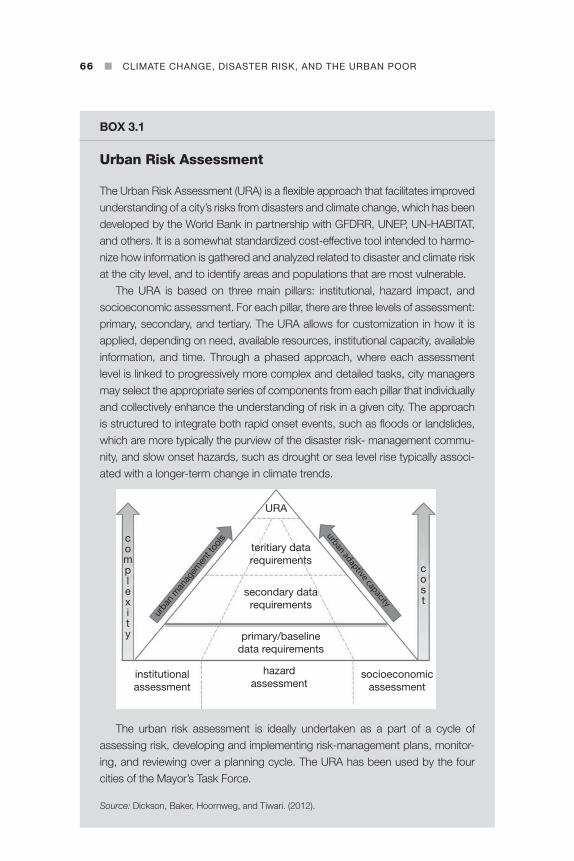
66 ■ CLIMATE CHANGE, DISASTER RISK, AND THE URBAN POOR
BOX 3.1
Urban Risk Assessment
The Urban Risk Assessment (URA) is a fl exible approach that facilitates improved understanding of a city’s risks from disasters and climate change, which has been developed by the World Bank in partnership with GFDRR, UNEP, UN-HABITAT, and others. It is a somewhat standardized cost-effective tool intended to harmo-nize how information is gathered and analyzed related to disaster and climate risk at the city level, and to identify areas and populations that are most vulnerable.
The URA is based on three main pillars: institutional, hazard impact, and socioeconomic assessment. For each pillar, there are three levels of assessment: primary, secondary, and tertiary. The URA allows for customization in how it is applied, depending on need, available resources, institutional capacity, available information, and time. Through a phased approach, where each assessment level is linked to progressively more complex and detailed tasks, city managers may select the appropriate series of components from each pillar that individually and collectively enhance the understanding of risk in a given city. The approach is structured to integrate both rapid onset events, such as fl oods or landslides, which are more typically the purview of the disaster risk- management commu-nity, and slow onset hazards, such as drought or sea level rise typically associ-ated with a longer-term change in climate trends.
primary/baselinedata requirements
socioeconomicassessment
hazardassessment
institutionalassessment
secondary datarequirements
teritiary datarequirements
URA
urba
n m
anag
emen
t too
ls
urban adaptive capacity
complexity
cost
The urban risk assessment is ideally undertaken as a part of a cycle of assessing risk, developing and implementing risk-management plans, monitor-ing, and reviewing over a planning cycle. The URA has been used by the four cities of the Mayor’s Task Force.
Source: Dickson, Baker, Hoornweg, and Tiwari. (2012).

BUILDING RESILIENCE FOR THE URBAN POOR ■ 67
BOX 3.2
Lessons Learned from Carrying out City-level Risk Assessments under the Mayor’s Task Force
1. High-level support from the mayors and heads of key agencies was essential to giving priority and support to the work. Working-level focal points were key to ensuring accountability and getting the work done.
2. In all of the cities, an interagency working group was set up to carry out the risk assessments. This included agencies working on urban development, service provision, poverty reduction, disaster management, and climate change. In some cases, this was the fi rst time these agencies worked together, which created synergies for a more integrated and comprehensive risk assessment and began the process for adaptation planning. However, it is unclear that these interagency working groups will be sustained without a more formal working arrangement.
3. In some of the cities, there was a big disconnect between knowledge at the institutional and at the community level. This was addressed by involving city offi cials in site visits to poor neighborhoods, and in two cases, involving stake-holders in the workshops. Communicating in a language that all stakeholders could understand was fundamental. In that regard, producing materials in a simple format and local language was important for communicating results. In Jakarta and Mexico City, short fi lms have been produced for broad dis-semination of key messages.
4. Across the four cities, accessing data, maps, and climate projections was problematic. Information is scattered across many different agencies, depart-ments, organizations, and research institutions, with some reluctant to share data. Enormous effort went into collecting the information made available. To benefi t from and sustain this effort, setting up a permanent institutional “home” to maintain and update this interagency information in each city would be benefi cial for any future work.
5. The risk assessments were perceived as a useful framework for understanding climate change, disaster risk, and impacts on residents. The multidimensional approach to assessing hazards, and socioeconomic and institutional risks, brought together key issues in a comprehensive way. This was found, however, to be only the fi rst step. Stakeholder workshops held in all of the cities were useful in discussing key issues, but follow-up will be needed to integrate these fi ndings into planning for adaptation and risk reduction across city agencies.
Source: Author.

68 ■ CLIMATE CHANGE, DISASTER RISK, AND THE URBAN POOR
BOX 3.3
Developing Action Plans in Vietnam, New York City, and Mexico City
One of the tools developed and currently being used in three cities in Vietnam (Hanoi, Dong Hoi, and Can Tho) is the Local Resilience Action Plan (LRAP).a The LRAP is a planning document that helps a city to assess alternative options for adaptation and risk reduction, with economic assessment of the costs and benefi ts of each. It includes an inventory of planned capital investments and policy changes to address high-risk areas, gap analysis, and multistakeholder priority-setting based on comparison of alternatives in light of limited budgets and fundraising prospects. The action plan will result in a strategic set of short-term (less than 1-year), medium-term (1- to 3-year), and long-term (more than 3-year) adaptation priorities for project investment with specifi c costs, timelines, and responsible actors. In the case of Can Tho, the outcomes of the LRAP pro-cess are currently being integrated into local urban planning.
Stakeholders work to establish priorities, highlighting those actions that are most critical to undertake in relation to the available funding and capacity for implementation. Other factors, such as fi nancial feasibility, political and technical complexity, social issues, and distributional and equity issues, are also consid-ered. Once priorities are established and an action plan is developed, detailed plans for each project (ranked by priority), including objectives, cost parameters, and a plan of implementation, are prepared. When considering implementa-tion, the city may decide to treat risks differently in different areas of the city, with the following options: (1) eliminate or avoid; (2) transfer or share (example through insurance); (3) mitigate (through structural interventions); and (4) accept and manage the risk.
New York City provides an interesting example of moving from risk assess-ment to action planning to implementation. In 2008 Mayor Michael Bloomberg tasked the New York City Climate Change Adaptation Task Force with develop-ing a plan to increase the resilience of the city’s critical infrastructure. The task force comprised 40 city, state, federal, and private sector infrastructure opera-tors and regulators with the goal of identifying climate risks to the city’s critical infrastructure and developing strategies to mitigate these risks.
Once the risk analysis was completed, an extensive process of identifying, developing, and prioritizing actions was carried out. The task force focused on improving current buildings, amending building design and other regulatory
(continued next page)

BUILDING RESILIENCE FOR THE URBAN POOR ■ 69
BOX 3.3 continued
codes, as well as the strategic placement of public facilities. It adopted a risk-based approach to climate action, and uses Flexible Adaptation Pathways to address the anticipated risks, compensating for the uncertainty of climate impacts (NYCPCC 2010). The task force was supported by a panel of technical experts, which was also convened by the mayor.
New York City is working on site-specifi c adaptation plans through a com-munity planning process with stakeholder groups. The fi rst two case studies worked with vulnerable waterfront communities and involved local universities and nongovernmental organizations to create a process for planning neighbor-hood climate adaptation. Recognizing that risk and adaptation solutions will vary based on location and resources, the goal was to produce a standardized pro-cess to use in waterfront communities throughout the city.
Mexico City’s experience is also notable as the fi rst city in Latin America to introduce a local climate action program (Mexico City’s Climate Action Pro-gram [MCCAP], 2008–2012, which is part of a 15-year green plan in which Mexico City is investing US$1 billion a year, approximately 9 percent of the yearly budget). The MCCAP aims to (1) reduce CO2 emissions by 7 million tons in the period 2008–2012 and (2) develop a Climate Change Adaptation Program for the federal district and fully begin its implementation in 2012. In implementation, the government uses various policy instruments, includ-ing regulation, economic incentives, voluntary carbon markets, education and information campaigns, and direct resources from the city budget.
The Inter-Institutional Climate Change Commission of Mexico City is in charge of coordinating and evaluating the MCCAP. This commission includes representatives from all the administrative units of the federal district. Its respon-sibilities are to design, encourage, and coordinate policies to mitigate the effects of climate change in Mexico City; to evaluate, approve, and disseminate related projects; to develop fi nancial strategies that generate revenue; and to coordinate actions and policies with other programs.
A main challenge of the MCCAP has been institutional coordination. Multiple agencies are executing a series of actions with limited communication or infor-mation exchange. Further exacerbating the open exchange of information is that each agency has its own information platform. An important step to improving coordination would be to use a common interface, which all government agen-cies could use for data storage and use. a. See World Bank, (2010b).
Source: Author.

70 ■ CLIMATE CHANGE, DISASTER RISK, AND THE URBAN POOR
Developing comprehensive plans that incorporate climate change and disaster
risk reduction can be daunting, as cities already are overburdened and struggling
to achieve existing goals. Th at being said, for those countries that have worked
on developing plans, some lessons have been learned and guidance developed.
First, assessments provide important information for establishing priorities. Sec-
ond, the orientation of the tools being developed demonstrates the importance of
assessing natural systems and hazard risk as well as institutional capacity and the
vulnerability of settlements and subpopulations. Th ird, assessments developed by
consultants are less eff ective than those developed by or in cooperation with city
departments and stakeholders (Carmin 2010).
Integrating Climate Change and Disaster Risk Reduction Policies for the Poor into Urban Planning and Management
Ideally any adaptation or risk-reduction plan will be integrated with urban plan-
ning and management. Policies to address climate and disaster risk have links
to many sectors and thus come with important synergies that are best captured
through system-wide approaches. Given the risks for the urban poor that have
been highlighted in this report, integrating climate change and policies for disas-
ter risk reduction into urban planning for upgrading or preventing slums is
imperative.
Diverse cities have incorporated disaster and climate-change risk into their
planning, with positive outcomes and important lessons. Among these are Bos-
ton, Cape Town, Ho Chi Minh City, London, Quito, Rotterdam, and Toronto
(Birkman et al. 2010). At a minimum, these cities have identifi ed risk-prone
areas and through urban planning discouraged new construction in these areas.
Similarly, Istanbul, Ho Chi Minh City, and Cape Town called for resettlement of
communities in the most risk-prone areas, in addition to improved construc-
tion and regulation of low-income and informal housing. Of the more proactive
approaches, both Boston and Rotterdam encouraged new methods of construc-
tion to cope with anticipated fl ooding, elevating buildings and creating fl oating
communities, respectively. Several cities, including Boston, Toronto, Halifax, and
Rotterdam, encouraged the use of green infrastructure to mitigate risk. Th e plans
that featured the most comprehensive urban planning to combat climate change
are the ones developed for London, New York, Quito, Halifax, and Toronto.
Examples from developing countries with a focus on improving slums are almost
nonexistent, which is not surprising given that few countries have citywide urban
plans that fully address informal settlements let alone integrating policies to
make them resilient.
BUILDING RESILIENCE FOR THE URBAN POOR ■ 71
Disaster Risk Reduction in Istanbul
Rebuilding aft er a disaster is frequently used as an opportunity to improve land
use and construction quality. Following the 1999 Marmara earthquake in Turkey,
the Istanbul Metropolitan Municipality prepared the Earthquake Master Plan
for Istanbul in cooperation with local universities (Metropolitan Municipality of
Istanbul 2003). Among many elements, the plan includes an assessment of cur-
rent vulnerabilities, guidelines on the rehabilitation of existing buildings, and an
outline of the urban planning issues necessary to mitigate seismic risk in Istan-
bul. Th e document created a Strategic Plan for Disaster Mitigation in Istanbul
(SPDMI), with the primary goal of reducing seismic impacts and the secondary
goal of improving environmental quality.
Th e SPDMI identifi ed problems associated with planning laws in the Istan-
bul area that it would seek to improve. First, it identifi ed the lack of mandatory
regional planning, which would prevent the cohesive development at the macro
level. Second, the coverage and scale of some local plans directly contradict other
laws at the metropolitan scale. Additionally, disaster risk mitigation was lacking
in available plans, as well as a general tolerance of illegal construction in vulner-
able areas. In relation to the built environment, the SPDMI identifi ed an abun-
dance of bureaucratic obstacles in construction, and a lack of a coherent building
code, which both encouraged illegal development and substandard construction.
Estimates are that 80 percent of the buildings are occupied and potentially reno-
vated without permits. Th e recommendations for these challenges encouraged
the empowerment of metropolitan authorities and the regional seismic commis-
sion to assess disaster risks and prepare strategic plans through a disaster-man-
agement lens.
In relation to the physical footprint and structures within the city, the SPDMI
categorized construction according to when the structures were built, who built
them (including the permits required), and where these structures were located
relative to infrastructure and natural hazards. Th e SPDMI then identifi ed priority
areas for intervention using three steps. First, a location quotient was calculated
for the percentage of buildings expected to be heavily damaged (BEHD) in each
district. Second, data produced by the Japan International Cooperation Agency
on hazard probability, refl ecting the density of each BEHD, was analyzed to cal-
culate the standard number of units per hectare. Th ird, the SPDMI multiplied
these values by the building and population densities to gain a clear idea of which
areas would suff er the greatest economic or human losses due to an earthquake.
Using this information, the SPDMI identifi ed the safest and most benefi -
cial areas for development and retrofi tting, and laid out three levels of plans
for action. At the macro level, the need to create a national strategy on the spa-
tial basics of social and economic growth was identifi ed, mandating the use of

72 ■ CLIMATE CHANGE, DISASTER RISK, AND THE URBAN POOR
regional plans. Within the regional framework, the environmental assets of the
metropolitan areas were identifi ed as serving a hazard-mitigation role. In addi-
tion, the national plan identifi ed peripheral areas near Istanbul for resettling
high-risk, high-density urban communities. At the mezzo and micro levels, the
SPDMI identifi es municipal planning agencies that will manage urban redevel-
opment, with a special focus on the low-risk land readjustment areas for urban
facility placement.
Climate Change Adaptation in London
Th e Greater London Authority released the draft London Climate Change Adap-
tation Strategy in 2010, with the key actions of improving management of surface
water fl ooding, developing an urban greening program, and retrofi tting 1.2 million
homes for more effi cient water and energy use by 2015 (Greater London Author-
ity 2010). To reduce fl ood risks in London, the strategy calls for mapping current
fl ood areas and using climate projections to understand how climate change could
increase the size of fl ood-prone areas in the future. In addition, the plan aims to
increase green spaces, constructing wetlands, and to use sustainable urban drain-
age systems in the city to mitigate fl ooding. To counteract the eff ect of urban heat
islands and heat waves, the strategy encourages planting trees and creating green
spaces to provide shade. Also, the vegetation will provide insulation during winter.
Th e strategy also calls for all new development to use passive-cooling rather than
mechanical-cooling systems. Spatial planning, using the projected fl ood maps,
will determine where development should not occur, and where existing struc-
tures should be removed. Th e strategy recognizes that development pressures may
necessitate the development of fl ood-prone areas; however, the Greater London
Authority and London boroughs will use planning to reduce fl ood risk.
Quito Climate Change Strategy
In Quito, Ecuador, the city has used its ecological footprint as a tool to plan
for water resources and natural-hazard risks of the city (City of Quito 2010).
Th rough population growth and decreased precipitation, the ecosystem of Quito
is already suff ering from water scarcity. Th is is expected to get worse as higher
temperatures begin to aff ect the mountain glaciers, which provide the city with
water. Currently, the city has prepared vegetation maps, climate and forest-fi re
maps, and watershed models, as well as having analyzed the socioeconomic
demographics of the city. Th e city has already begun to relocate families living
in high-risk areas and to integrate climate impacts into sustainable plans for
land use, including slope and hillside management. Upcoming activities include
analysis of vulnerability for all sectors, analysis of land use and land-use changes,

BUILDING RESILIENCE FOR THE URBAN POOR ■ 73
and creation of an information system on climate change that includes a virtual
platform on forest fi res’ risk management. In relation to green space, the city
also plans to create ecological corridors and to explore REDD+ aff orestation as a
potential adaptation mechanism with fi nancial benefi ts.
Mainstreaming Climate Change in Halifax
Th e Halifax Region Municipality (HRM) collaborated with the Canadian Sus-
tainable Environment Management Offi ce and ClimAdapt, a network of regional
private-sector companies with climate-adaptation expertise, to produce the
Climate SMART (Sustainable Mitigation and Adaptation Risk Toolkit) series.
Climate SMART includes documents aimed at mainstreaming concerns about
climate change into municipal planning and decision making. Among these doc-
uments, there is a Climate Change Risk Management Strategy for HRM, as well
as a Developer’s Risk Management Guide. Th ese two documents guide both the
public and private sector in concerns about physical development through a risk-
management approach to prevent, tolerate, and share risk in the built environ-
ment. Both reports encourage the use of natural ecosystem responses to climate
concerns. In relation to coastal and storm-related fl ooding, the Climate Change
Risk Management Strategy for HRM encourages the use of LIDAR (light detec-
tion and ranging) technology to establish precise elevation for coastal-inundation
models, improved urban-design criteria for infrastructure, and urban greening
(Halifax Regional Municipality 2007b).
Th e city has established new precipitation return periods for use in municipal
physical planning to refl ect the expected increase in storm intensity and frequency.
Th is information is being used to analyze current land use, zoning, and settlement
patterns. For the private sector, the Developer’s Risk Management Guide encour-
ages four strategies to deal with the eff ects of climate change (Halifax Regional
Municipality 2007a). First, the strategy calls for prevention, toleration, and shar-
ing of loss through the use of natural systems (in the form of green belts) and
proactive planning to mitigate precipitation and heat aff ects. Second, it calls for
the change of land use to accommodate and possibly take advantage of expected
climate changes. Th ird, the strategy calls for relocation of planned development
to areas expected to be less vulnerable to climate. Finally, the plan encourages res-
toration and retrofi tting of developments following damage or climactic change.
Toronto’s Wet Weather Flow Master Plan
Much like Halifax, Toronto offi cials expect climate change to bring heat waves and
intense precipitation. In recent years, Toronto has experienced a record number
of days with average temperatures over 30°C, leading the city to issue 18 extreme

74 ■ CLIMATE CHANGE, DISASTER RISK, AND THE URBAN POOR
heat alerts (as of 2008) (Toronto Environmental Offi ce 2008). In addition to rec-
ommending future adaptation actions, the Toronto plan listed several ongoing
programs that are currently helping the city adjust to risks and make it more
sustainable. Toronto has established a 25-year Wet Weather Flow Master Plan,
designed to reduce fl ooding and impacts on area streams due to severe precipita-
tion. Th is plan encourages the use of permeable paving and rain barrels to reduce
runoff . Th e city is currently studying the tree canopy and working to double the
urban tree cover, including by greening surface parking lots in order to increase
shade and reduce heat and runoff . In addition, the city is providing tax incentives
to encourage the greening or use of refl ective paint on area roofs. Finally, Toronto
is engaging local neighborhoods in the “Live Green Toronto” project. As in New
York, they are using feedback from local communities to inform land-use policy
and greening initiatives.
Jakarta Risk Planning
Jakarta’s plan for 2010–2030 calls for incorporating risk reduction into long-term
spatial planning for the city. Such approaches include restoring mangrove forests,
improving public facilities and mass transit, refi ning building and environmental
regulations that consider hazard risk, redesigning technology and engineering in
disaster areas, and improving provision of open space for anticipated increases
in intense rainfall. Th e city has also established a dedicated body for disaster-risk
reduction in 2010, which is intended to help with planning and mainstreaming
at the neighborhood level. A Kelurahan Empowerment Initiative is under way in
fi ve neighborhoods to develop Local Resilience Action Plans (LRAP) with local
and community leaders in Jakarta.2
Green Infrastructure and Ecological Services to Reduce Risk
In several examples above, green infrastructure and ecological services are
being used to mitigate fl ood and heat risks as part of adaptation planning. Th ere
is a growing recognition that natural drainage systems are the most eff ective at
mitigating fl ood risk, rather than passing the risk to communities downstream.
Th e United Kingdom Climate Impacts Programme has projects that aim to
improve knowledge on climate impacts, including the urban-focused Adap-
tation Strategies for Climate Change in the Urban Environment (ASCCUE).
ASCCUE explores options for climate adaptation through urban-design and
strategic planning, and the potential of urban green space in fl ood and heat
mitigation (Gill et al. 2007). Incorporating land cover, sustainable urban drain-
age techniques, and green roofs, the ASCCUE explored the potential impacts
of green installations in Manchester. Th e sheeting of water over buildings and

BUILDING RESILIENCE FOR THE URBAN POOR ■ 75
paved surfaces prevents the rain from entering the ground, thereby interrupting
the local hydrological cycle.
Th e Manchester study found that green roofs reduced the total runoff by
18 millimeters for anywhere between 0.1 and 1.0 percent, depending on the
building type covered. While this percentage may seem small, at the urban scale,
the runoff reduction could have a signifi cant impact. Aiming to counteract the
eff ects of urban heat islands, green land cover in high-density residential areas
and the town center were found to maintain maximum surface temperatures at
or below the 1961–1990 baseline for the next 70 years. Th is encouraging estimate
demonstrates the huge impact and importance of urban greening. Finally, the
Manchester study recognized that storage will be an important way to respond
to extra precipitation, and explored options such as point infi ltration, swales,
and retention ponds in order to use the water during droughts. Public parks and
the restoration of rivers are other options being practiced in various urban sites
where urban planners and water managers are recognizing that the previous
practices of encroaching upon and enclosing urban water ways are exacerbating
fl ash fl ooding downstream.
While one of the earliest recognized successes may be Curitiba, Brazil, there
are a handful of newer cases in Spain, the Philippines, Chile, and Korea. In
Barcelona, the fl ash-fl ood prone Besos River was restored to a meandering low-
fl ow channel within a wider fl oodway of constructed wetlands (Martin-Vide
2001). Intense urbanization in the 1960s had led to the encroachment of 300,000
poor residents into the original Besos fl oodplain. Planning for river restoration
began in the mid-1990s in an eff ort to improve the environmental quality of the
city, control fl oods, and provide a green recreation space for the impacted munici-
palities. Th e Marikina River in Marikina City, the Philippines, is another example;
uncontrolled encroachment and the unregulated disposal of waste had created a
festering waterway in the center of the city (Yu and Sajor 2008). Begun in 1993,
the Save the Marikina River program operated over more than a decade, remov-
ing informal settlements, reducing dumping, and establishing a recreational park
around the river for fl ood control. While complicated, the removal and relocation
of informal settlements proved justifi ed, and 10 years later, the aff ected communi-
ties were satisfi ed with their safer houses and improved service provision.
Currently under construction, Parque La Aguada in Santiago, Chile, restores
the city’s main ecological corridor in an eff ort to revitalize an abandoned and
neglected industrial area (Allard and Rojas 2010). Focused around the Zanjón
de la Aguada, a seasonable stream, the fl ood park will cover 60 hectares of river
bank, providing recreational areas during the dry season. As part of the Santiago
Inner Ring Initiative, the Aguada Flood Park will “daylight” a 4-kilometer
stretch of the stream, which is no longer able to handle the high-intensity fl ows
of the rainy season. In addition, the park aims to trigger economic and social

76 ■ CLIMATE CHANGE, DISASTER RISK, AND THE URBAN POOR
development for the adjacent communities. Similarly, the 2005 Cheonggye-
cheon Restoration Project has created a 6-kilometer public recreation space
centered on a seasonal stream in the central business district in Seoul, Korea.3
During a period of rapid economic growth, the stream was transformed into
a culvert to make space for transportation infrastructure. In a US$900 million
eff ort to improve the environmental quality of Seoul, the metropolitan govern-
ment removed concrete surfaces and elevated highways to release the historic
stream and create a park and fl oodway, thereby revitalizing the adjacent neigh-
borhoods.
Balancing Policy Tradeoffs among Risk Reduction, Urban Development, and Poverty Reduction in Decision Making
Policy decisions typically involve diffi cult decisions with both positive and nega-
tive outcomes that local decision makers and stakeholders must carefully weigh.
Urban systems have long time scales and cannot be physically changed easily,
thus decisions made now will have impacts for decades to come. Th is is due to (1)
the long life span of urban infrastructure and buildings, which can be as much as
one hundred years or more for high-value buildings, bridges, or water systems;
and (2) the location decisions of infrastructure and buildings, which typically go
well beyond their life span. For example, when railways reach their replacement
time, they are almost always replaced at the same location. In the same way, new
urban development is a somewhat irreversible choice, as it is economically and
politically diffi cult to relocate people.
Th e most instrumental policy area is land-use planning and management. As
cities in developing countries grow, they oft en expand into marginal areas such as
fl ood plains, water catchments, and steep hillsides. Poor urban-planning and man-
agement policies exacerbate this. At the city scale, there is a need for land-use plan-
ning to consider fl ood, seismic, and other hazard zones when determining where
new development should be permitted. Effi cient transport systems can increase
land supply in new areas by enabling access and mobility, thus reducing incen-
tives to develop in vulnerable locations. Preventing building and settlements in
high-risk areas can save lives and prevent destruction. A framework for regular-
izing land tenure, including partial or incremental solutions, can spawn invest-
ments and encourage improvements in infrastructure. Proactive policies aimed
at preventing new slums, which may involve changes in the legal and regulatory
framework and draw on the lessons of past experiences with sites and services
projects, can help to curtail the rapid growth of new slums on vulnerable lands. In
some cases, governments and municipalities would acquire land for block-level
infrastructure rights of way around the peripheries of rapidly growing cities.

BUILDING RESILIENCE FOR THE URBAN POOR ■ 77
Such policies are, however, controversial. Th e high demand for land and
resources, and the infl uence that private land speculators and developers oft en
have, can reduce the eff ectiveness of formal policy and planning practices (Birk-
mann et al. 2010). In megacities where land use plans do exist, they are rarely
coordinated across jurisdictions or levels of government. Even within a city,
responsibilities for land and associated services may be scattered among several
entities, hindering coordination of land management.
Policy Tradeoffs
In identifying policy choices and actions that cities can consider when address-
ing climate change, disaster risk, and the urban poor, it is important to under-
stand the positive co-benefi ts as well as possible negative consequences of each.
From an operational perspective, governments must make these policy choices
in the context of broader priorities, which include quality of life for city residents,
economic competitiveness and attractiveness for investors, other environmental
goals such as greenhouse gas emissions and protection of natural areas, public
health, and social concerns such as equity and social capital. Key policies and
actions in fi ve areas aimed at reducing risk for the urban poor are highlighted
below, with the positive co-benefi ts and possible negative consequences of each
summarized in table 3.1.
Th e fi rst policy area involves the tradeoff s between protection for many areas
against extensive risk versus protection for few areas against intensive risk. Some
investments such as basic services will have more immediate welfare and eco-
nomic gains, but this may mean delaying other investments such as drainage or
levees that will increase resilience to large shocks in the longer term. Th ere are co-
benefi ts for some policy choices, such as planning regulations for land use where
the policy outcomes will have positive impacts on reducing both extensive and
intensive risk.
Second are the complex tradeoff s between investing in upgrading at-risk
informal settlements versus relocating populations to safer areas. Studies show
that slum dwellers gain more from slum upgrading than from relocation (World
Bank 2006). It is unclear, however, whether these analyses consider natural risks,
including extreme events. In higher-risk locations, providing additional services
(energy, housing, water, drainage, and sanitation) may increase exposure through
attracting more inhabitants and increasing the value of the assets at risk. Institu-
tional changes (for example, secure land tenure) may lead inhabitants to invest
in their dwellings and related contents, increasing assets at risk and losses in case
of disaster.
In balancing these tradeoff s, a policy response is to defi ne an acceptable risk
level via a political process with as much local participation as possible. Below

78
■
C
LIM
AT
E C
HA
NG
E, D
ISA
ST
ER
RIS
K, A
ND
TH
E U
RB
AN
PO
OR
TABLE 3.1 Consequences of Risk-Reduction Policies and Actions in Urban Areas
Risk reduction policy
Actions Positive Co-benefi ts Potential negative consequences
1. Protection for many ar-eas against extensive risk (versus few areas against intensive risk)
Investments in basic services such as water, sanitation, waste, drainage, and trans-port in poor areasInvestments in early-warning systems and insuranceRegulations to mitigate increases in exposure through land-use planning, zoning, and building norms Delay large, costly invest-ments against extreme events, such as drainage, levees, embankments, urban transport, and buildings
Large quality-of-life benefi ts from im-proved basic servicesMost cost-effective, given that most risks for urban poor are extensiveImprovements in city economy from increases in productivity and competitive-nessReduction in overall risk from frequent eventsReductions in local air and water pollutionLarge health co-benefi tsImprovements in social equity from pro-poor investments
Increase in vulnerability to most extreme eventsIncrease in population and asset risk
2. In situ upgrading in at-risk informal settlements (versus relocation to safer areas)
Investments in basic services in at-risk informal settlementsAvoid more costly invest-ments in dykes and drainage systemsAvoid relocation to new areas (could be cost-neutral)
Similar benefi ts as listed in 1 Residents may benefi t from location choice close to jobs and servicesAvoid new urbanization, and reduce ur-ban sprawl and destruction of preserved areasAvoid negative social impacts of reloca-tion programs (loss of jobs, social networks, culture)
Investments may further attract people to high-risk areas and increase population and assets at riskIncrease in vulnerability to extreme eventsPoor population investments made at risk of extreme weather; risk of poverty trap if disasters are too frequent

BU
ILD
ING
RE
SIL
IEN
CE
FO
R T
HE
UR
BA
N P
OO
R
■
79
(continued next page)
3. Zoning to prevent occupation of at-risk areas
Regulations to prevent de-velopment, investments, and housing in at-risk areas
Reduction in overall risk and potential lossesDecrease in population and assets at risk (that is, smaller likelihood of large-scale disasters with signifi cant effects)Avoid negative health effects from occupying unsafe or polluted landProtect mainly poorest households, which generally occupy the most at-risk areas
Decrease in overall available land, increase in land pressure, and general increase in housing and offi ce-space prices in the cityPossible acceleration of urban sprawl; soil consump-tion and water-proofi ng; loss in natural areas and biodiversity; competition with agriculture May increase travel distances in city and commuting timesEnvironmental concerns from additional mobility needs and energy consumption Perverse incentive of attracting illegal settlements in no-building zones
4. Develop new, less risky land with effi cient transport
Invest in urban infrastructure and basic services in new areasInvest in new transportation networks that are effi cient and affordable (train, metro, dedi-cated bus line, highways)
Create new urban area with provision of basic services and high accessibilityIncrease in available land, reduction in land pressure, and general reduction in housing prices in city; development and competitiveness benefi tsReduced pressure to urbanize at-risk areas (fl ood, landslide, subsidence) in city centers; reduction in overall risk and average losses Avoid undesired development in natural areas and ecosystem lossesImprove access to adequate housing and basic services; poverty reduction benefi ts
Increased car use, energy consumption, local and noise pollution and congestion, particularly if based on individual-vehicle transportEnvironmental concerns from additional energy consumption High cost of new infrastructure (transport and other services)Accelerated urban sprawl, with higher cost to provide public services; possible higher property taxesAdditional soil water-proofi ng, increased runoff, and possible increase in fl ood risksAccelerated urban sprawl; loss in natural areas and biodiversity; competition with agriculture Risk for poor to be relocated, causing social segregation

80
■
C
LIM
AT
E C
HA
NG
E, D
ISA
ST
ER
RIS
K, A
ND
TH
E U
RB
AN
PO
OR
5. Promote dense urbanization
Containment policies that determine where growth can and cannot happen
Shift to public transport, reducing noise and traffi cLower cost of providing public services (water and sanitation, electricity, educa-tion, health)Gain in competitiveness through reduced energy expenditures and lower taxesHigher-density facilitates zoning to avoid development in at-risk areasReduce mobility needs and energy consumptionReduced urban sprawl and protected natural areas; increased competition with agricultureImproved social equity through reducing segregation
Reduced access to housing, dwelling size Reduction in available land for construction, increase in construction costs, increase in housing prices in city; possible reduction in competitivenessPotentially larger urban heat island and larger vulner-ability to heat wavesPossible increase in natural hazard risk if containment land-use plans do not control for additional density in fl ood-prone or landslide areas
Source: Adapted from Bigio and Hallegatte, 2011.
Table 3.1 continued
Risk reduction policy
Actions Positive Co-benefi ts Potential negative consequences

BUILDING RESILIENCE FOR THE URBAN POOR ■ 81
such risk level, slum upgrading is considered an appropriate approach. Beyond
this risk level, population relocation is preferable. Alternatively, higher levels of
risk can be reduced with more costly investments that protect the site against sys-
temic risks, such as dykes and drainage systems, but in this case the overall costs
of in situ upgrading may go beyond the costs of relocation.
Th ird are zoning regulations that can be used to prevent development and
housing in high-risk areas. Zoning regulations, however, also involve tradeoff s.
Depending on how large the areas in a city are at risk, such regulations will
reduce the overall land available, raising prices and thus making it most diffi cult
for low-income residents. Another potential issue is that even if zoning regula-
tions are in place, it is diffi cult to enforce them. As with other policy choices, it
is necessary to defi ne an acceptable risk level through consultation with local
participation.
Th e fourth policy area is the development of new land with effi cient and aff ord-
able transportation and local services. Th e location of transport infrastructure, its
nature (public and private), and transport pricing have enormous impacts on
city structure and characteristics, particularly on housing prices and access to
jobs and services. Th e concentration of poverty on marginal land in, or close to,
city centers is mainly driven by proximity to jobs and services, particularly in the
absence of transport systems. Investing in aff ordable transport can open up new
areas on safe land and reduce land prices, improving overall housing options.
Possible negative outcomes of such policies, if not well managed through urban
planning, can result in urban sprawl.
Fift h are policies aimed at promoting dense urbanization through contain-
ment. Such policies determine where growth can and cannot happen in a city
and can reduce environmental concerns through reduced mobility needs and
energy consumption for transportation, land consumption, and risk simi-
lar to zoning regulations. However, these policies also reduce the amount of
available land, increasing land pressure and prices, making it more diffi cult
for poor households to access housing, and increasing incentives to settle in
at-risk areas.
Incorporating Policy Tradeoffs and Uncertainty in Decision Making
Decisions and investments in public-service provision, disaster risk reduction,
and adaptation to climate change will have consequences for many decades, given
the longevity of many infrastructure investments. Yet these decisions are particu-
larly sensitive to changes in climate conditions, where there is much uncertainty.
Th is makes decision making particularly complex and has invoked some new
approaches to decision making.

82 ■ CLIMATE CHANGE, DISASTER RISK, AND THE URBAN POOR
Climate Sensitivity and UncertaintyMost buildings are supposed to last up to one hundred years and will have to cope
in 2100 with climate conditions that, according to most climate models, will be
radically diff erent from current ones. When designing a building, architects and
engineers thus have to be aware of and account for expected future changes. Tak-
ing the example of Paris, many climate models project that the climate conditions
in 2070, in the absence of ambitious mitigation policies, will be comparable to
those found today in the south of Spain. Obviously, buildings are designed dif-
ferently in Paris and in the south of Spain, and this should be taken into account.
Building norms applied today in France to reduce heating energy consumption in
winter may even become counter-productive if they do not take into account the
risk of high energy consumption from air conditioning in summer a few decades
from now. Similarly, when planning for adaptation in water, adjustments must
be made for changes in water trends (rainfall, runoff , etc.) (Milly et al. 2008).
With more than US$500 billion invested every year in this sector, a strong case
is made for incorporating the climate model to optimize strategies, policies, and
effi ciency.
With regard to risk management, Nicholls et al. (2007) demonstrate that, in
2070, up to 140 million people and US$35,000 billion of assets could depend on
fl ood protection in large port cities around the world because of the combined
eff ect of population growth, urbanization, economic growth, and rise in sea level.
Previous coastal-defense projects (for example, the Th ames River barrier) have,
however, shown that implementing coastal protection infrastructure typically has
a lead-time of 30 years or more. Also, urbanization plans are very able to infl u-
ence fl ooding risk, but they can do so only over many decades. Th is inertia sug-
gests that action must begin today to protect coastal cities and to manage fl ood
risks from impacts expected by mid-century, which may be aff ected by rise in sea
level, extreme weather, and other manifestations of climate change.
Climate change and sea-level rise are also concerns that need to be accounted
for in providing basic services. Sanitation and drainage systems need to take into
account how precipitation patterns will change in the future. Th e provision of
drinking water should be based on sources that will remain viable in the future;
thus it is important to analyze how demands from various water usages, includ-
ing irrigated agriculture, will change over time, ensuring that the proposed
investments are robust over the long term.
A particular challenge is the dramatic increase in uncertainty of future cli-
mate conditions. In the past, the climate parameters pertinent to most activities
could be observed and measured, and with specifi c objectives, statistical analyses
and optimization algorithms were able to produce “best” designs as a function of
known climate conditions (for example, dike heights as a function of the return
time of certain storm surges, or building characteristics as a function of typical

BUILDING RESILIENCE FOR THE URBAN POOR ■ 83
temperature levels). In the future, however, substantial climate uncertainty makes
such methods more diffi cult. As an illustration of this uncertainty, there is still
disagreement among climate models about whether precipitation in West Africa
will increase or decrease in response to global warming. It means that while water
management needs to take into account future changes in climate conditions, it is
not known if this change will be an increase of a decrease in rainfall. Clearly, this
uncertainty represents an important obstacle to the design of water management.
More generally, climate uncertainty can be an obstacle for all investment deci-
sions that are climate sensitive and have a long lifetime. Th is problem is par-
ticularly acute for water, land-use planning, and coastline and fl ood defenses
(Hallegatte 2009).
Decision-Making Tools
Some of the existing decision-making tools, such as cost-benefi t and cost-eff ec-
tiveness analysis, may not be viable with large uncertainty. Th ese methods require
a quantifi ed assessment of the likelihoods of the diff erent possible outcomes,
which in most cases cannot be estimated.
Robust Decision Making Given this uncertainty, new tools for decision making are emerging that are
based on the concept that, over the long term, the priority is to avoid irrevers-
ible choices that can lock in undesirable or even unacceptable situations. For
instance, developing low-lying coastal areas with the current uncertainty on
future sea-level rise is dangerous, as it can lead to a diffi cult choice between
expensive protection and retreat in the future. If such a situation is considered
TABLE 3.2Sectors for which Climate Change Should Be Incorporated Due to Time Scale or Sensitivity to Climate Conditions
Sector Time scale (years) Sensitivity
Water infrastructures (e.g., dams, reservoirs) 30–200 +++Land-use planning (e.g., in fl ood plain or coastal areas) >100 +++Coastline and fl ood defenses (e.g., dikes, sea walls) >50 +++Building and housing (e.g., insulation, windows) 30–150 ++Transportation infrastructure (e.g., port, bridges) 30–200 +Urbanism (e.g., urban density, parks) >100 +Energy production (e.g., nuclear plants) 20–70 +
Source: Hallegatte (2009).
Note: Sensitivity is estimated empirically. +++ = high sensitivity; ++ = medium sensitivity; + = low sensitivity.

84 ■ CLIMATE CHANGE, DISASTER RISK, AND THE URBAN POOR
BOX 3.4
Decision Making for Adaptation Planning in Chicago
The City of Chicago offers an example of a how a systematic process can aid in decision making. Initially the likelihood of different types of impacts affecting the city were identifi ed and then narrowed down to issues with the highest risk. In Chicago, the focus was on extreme heat, extreme precipitation, damage to infrastructure, and degradation of ecosystems. A list of options for each issue that could be pursued was then identifi ed. The initial list of 150 adaptation activi-ties was then narrowed down by evaluating the benefi ts and costs, as well as the time horizon and barriers that were anticipated to be encountered during implementation. Based on this analysis, activities that were expected to prevent impacts in a short time span and would not be inhibited by many barriers were classifi ed as “must do.” In contrast, those that would have benefi ts, but were likely to encounter numerous barriers or a long time horizon were classifi ed as “investigate further,” while others that were costly were labeled as “watch.” By analyzing options in this way, the City of Chicago was able to identify a bounded set of adaptation activities for each of the four focal areas (Coffee et al. 2010). In addition, they evaluated the priorities and capacities of individual departments so that implementation would be realistic (Parzen, 2009).
undesirable or unacceptable, and while the uncertainty is so large, it is prefer-
able to develop only the areas that are not too vulnerable in case pessimistic
scenarios in the rise of sea level are confi rmed. Th is is the basic concept of
robust decision making. While traditional decision making seeks to predict
the future and pick the best option for that particular future, robust decision
making will instead identify the choices that are robust over many alternative
views of the future.
To help with the prioritization and decision making, robust, multicriteria
decision-making tools can be useful. Th is approach can be used to ensure that any
given policy has no unacceptable consequences for stakeholders. Th e approach
helps build policy mixes that are robust in most possible future scenarios. Th e
application of robust decision-making strategies can be lengthy, requiring the
involvement of many stakeholders, including city offi cials, multiple agencies, pri-
vate developers, and community residents. Such decision making, however, can
help stakeholders assess their own choices toward higher resilience and lower
vulnerability.

BUILDING RESILIENCE FOR THE URBAN POOR ■ 85
One approach, which focuses on avoiding irreversible choices that can lead
to large regrets, bases decisions on scenario analysis (for example, Schwartz
1996). In theory this approach results in the most robust solution, that which
is most insensitive to future climate conditions (Lempert et al. 2006; Lempert
and Collins 2007). Th ese methods are consistent with those commonly used to
manage exchange-rate risks, energy-cost uncertainty, research and development
outcomes, and many other situations that cannot be forecast with certainty. Such
robust decision-making methods have already been applied in much long-term
planning, including water management in California (Groves and Lempert 2007;
BOX 3.5
Robust Decision Making for Road Design in a Flood-Prone Area
An illustration of robust decision making applies to a local government assess-ment of designing a road in a fl ood-prone area. The key challenge is a lack of information on the future intensity and frequency of fl ooding. In addition, basic data is unavailable on the future climate and patterns of fl ooding in the region, the volume for future traffi c, and future land-use patterns. All this uncertainty could threaten long-term performance of the road.
In such a scenario, robust decision making in the choice of road design could be used by the government through sequentially doing the following:
• Choosing the candidate strategy or the basic “business as usual” design, as well as the performance objective of the road.
• Identifying all the future combinations of conditions that might cause the road to fail to meet its objective (for example, X rise in sea level, Y increase in rainfall, and Z traffi c volume will cause the road’s level of service to be unacceptable).
• Identifying design options that address the unacceptable possibility of sus-pending service on the road.
• Finally, selecting the design option that performs well compared to the alternatives over a wide range of futures.
In this case, robust decision making has helped the government identify design options to reduce unacceptable vulnerability and understand tradeoffs among those options.
Source: Lempert and Kalra (2011).
86 ■ CLIMATE CHANGE, DISASTER RISK, AND THE URBAN POOR
Groves et al. 2007). For most decision makers, the novelty will be to apply these
methods to climate conditions. Th is requires users of climate information to col-
laborate more closely with climate scientists and to adapt their decision-making
methods to climate change.
Strengthening Institutional Capacity to Deliver Basic Services and Reduce Vulnerability to Climate and Disaster Risk
Cities have a range of institutional structures and capacity for dealing with ser-
vice delivery, disasters, and climate change. Th e institutions typically involved
with the response and management of disasters include departments of public
health, security, police, fi re, and those that serve vulnerable populations like the
elderly and young. Plans oft en provide a structure through which departments
communicate with one another, and many cities prepare by running simulations.
Th e institutional arrangements to cope with and plan for climate change, par-
ticularly adaptation, are somewhat less developed, as it is a relatively new fi eld
of policy and planning. Furthermore, the institutional structures for delivering
services to the urban poor have the longest history, yet in many cities they are
weak. A major constraint has been capacity as local governments struggle with
inadequate staffi ng, technical skills, or fi nancial resources. Th is is further compli-
cated in many places by the lack of legal tenure, which means that governments
are reluctant or unable to invest in services in informal areas.
In all four of the cities studied, the institutional arrangements for urban plan-
ning, climate change, disaster risk, and poverty are fairly complex. Jakarta’s city
government is highly decentralized, with 267 lurah or urban ward leaders.4 Th e
Mexico City Metropolitan Area comprises the 16 boroughs of Mexico City and
34 municipalities of the State of Mexico, for a total of 50 geopolitical and admin-
istrative units that must coordinate among themselves. In the São Paulo Metro-
politan Area there are 39 municipalities, while the City of São Paulo is divided
into 31 administrative divisions (subprefectures) and 96 districts. Dar es Salaam
probably has the simplest structure, in part refl ecting the smaller size. Th e city is
managed by the Dar es Salaam City Council (DCC) and the Municipal Coun-
cils of Temeke, Kinondoni, and Ilala, which are under the Ministry of Regional
Administration and Local Government. Each municipality has individual tech-
nical and administrative departments. Coordination across municipalities and
with national agencies is limited.
Other cities have areas that lack strong formal institutions, where informal
institutions such as NGOs and CBOs play an important role in responding to the
needs of the urban poor. In many cities these informal institutions address gaps in

BUILDING RESILIENCE FOR THE URBAN POOR ■ 87
service delivery, and at times are the fi rst responders in disaster events. In Mom-
basa, local religious organizations are recognized as key players when extreme
events occur and facilitate evacuation, emergency relief assistance, and provi-
sional shelter. Th e earthquake in Haiti in 2010 saw the emergence of volunteer
technology communities, who mobilized through the Global Earth Observation
Catastrophe Assessment Network (GEO-CAN) to develop a comprehensive and
rigorous damage analysis to assist with relief and recovery eff orts (GFDRR 2011).
Learning from Successful Examples
Th ere are numerous examples where progress has been made in addressing
risks for the poor through programs to upgrade slums, improvements to service
delivery in slums, emergency warning systems, knowledge generation, and other
initiatives. Such eff orts were implemented with strong political commitment,
community participation, and institutional support.
In Dar es Salaam, the local government has successfully implemented the
Community Infrastructure Upgrading Program, which has targeted unplanned
areas in three municipalities (World Bank 2011b). Th rough a structured pro-
cess, communities have prioritized technical improvements in roads, drains, and
public toilets. Th e new community infrastructure allows safe access to homes on
a regular and emergency basis, and improved drainage dramatically decreases
fl ooding in the aff ected areas.
A relatively well-known eff ort in Pakistan, through the Orangi Pilot Project
Research and Training Institute, supports local governments as well as slum
dwellers in building capacity for the planning, implementation, and fi nancing of
basic sanitation—at far lower costs than government-built infrastructure. Th ese
eff orts have brought major benefi ts to large sections of the urban poor in more
than 300 communities in Karachi.
In São Paulo, the “Summer Rainfall Operation” is a city plan that brings
together the Housing, Transport, Urban Infrastructure, Social Assistance, and
Sub-districts Coordination Secretariats led by the Emergency Management
Agency, which targets risk areas during the summer when heavy rainfall is com-
mon. When heavy rainfall approaches, the Emergency Management Agency
issues an alarm to the various agencies, which respond through prevention
(evacuating residents in high-risk areas), search and rescue in fl ood or landslide
zones, and restoration of aff ected areas. Water and sanitation authorities repair
water pipes, while social assistants verify housing conditions and if necessary
direct people to temporary shelters while the Housing Secretariat arranges for
“rent allowance” or allocates housing for the needy. Health authorities dissemi-
nate public information on how to avoid endemic diseases spread by water and of
symptoms requiring medical attention.

88 ■ CLIMATE CHANGE, DISASTER RISK, AND THE URBAN POOR
Mexico City has been proactive in initiating climate-change programs and is
the fi rst in Latin America to launch a local climate-change strategy. Furthermore,
the city has established the distinguished Virtual Center on Climate Change for
Mexico City to contribute to increased and improved knowledge on the impact
of climate change in the Metropolitan Area, as well as to the formulation and
implementation of public policies.
A number of institutions have developed approaches to monitor changes and
disseminate information about changes in weather patterns and the natural envi-
ronment as part of ongoing risk assessment. Th ese measures oft en are established
through monitoring stations sponsored by national governments. Early-warning
systems are critical to ensuring awareness of natural hazards and to promot-
ing timely response, including evacuation. Several approaches have been used,
involving the urban poor in the Caribbean, Africa, and Southeast Asia, such as
local courses, tone alert radio, emergency alert system, presentations and brief-
ings, and reverse 911 (Pulwarty 2007; Van Aalst, Cannon, and Burton 2008).
Low-tech measures such as brochures, public service announcements, and
direct contact with local residents also are important to fostering awareness and
response in poor communities (National Research Council 2007). For example,
heat-warning systems used to alert urban populations of extreme heat generally
include a communications component that depends on public service announce-
ments in urban areas (Health Canada 2010).
Safety nets can be critical in building resilience for the urban poor, as well as in
post-disaster recovery. Safety nets have traditionally focused on the chronic poor
through targeted cash transfers (both conditional and unconditional), workfare
programs, and in-kind transfers. In Bangladesh, under the National Disaster
Management Prevention Strategy, an early-warning system triggered safety nets
in response to Cyclone Sidr in 2007 (Pelham, Clay, and Braunholz 2011). Th e
program began distributing cash, rice, and house-building grants even before the
main impacts of the cyclone were felt.
Programs can be designed to also assist at-risk households and communities
to help people cope with hazards. For example, social funds, community-driven
development, and slum upgrading can be designed to support adaptation and
risk reduction in low-income communities by scaling up their work on actions
most relevant for creating resilience, such as improving drainage, water supply,
and sanitation, and setting up community-maintenance programs. Indonesia’s
National Community Empowerment Program (PNPM), which operates in all
urban areas of the country, fi nances investments in fl ood prevention, water reten-
tion and storage, and slope stabilization to prevent landslides as well as building
emergency evacuation routes.
Such programs have been instrumental in post-disaster recovery as well. In
Indonesia, eff orts were rapidly mobilized following the disasters in Aceh (2004

BUILDING RESILIENCE FOR THE URBAN POOR ■ 89
tsunami), Yogyakarta, and Central Java (2006 earthquake), and most recently in
Central Java (2010 Mt. Merapi eruption), via community-driven development.
On the very day the government says it is safe for residents to return to their
neighborhoods, trained facilitators already working in the communities are avail-
able to work with benefi ciaries in identifying needs, preparing community settle-
ment plans, and allocating block grants. Th e key is to have programs in place
before the onset of natural disasters, with fl exible targeting, fl exible fi nancing,
and fl exible implementation arrangements.
At the institutional level, success translates to good leadership, good gover-
nance, and good management. Th ese elements can be built through changes in
incentives to promote reform and improve performance, for example, through
better accountability, fi nancial management, and coordination across agencies,
with structured rewards. Other methods that have proven successful are profes-
sional certifi cation programs for municipal staff that elevate, professionalize, and
promote their development.
Capacity Building
Several programs are available to provide advice to decision makers such as city
technicians and city managers, as well as key actors in civil society, on topics
related to sustainable development, climate change, disaster risk, and reduction
of urban poverty. Th ese programs range in levels of engagement and develop-
ment, but all have the common goal of building capacity among decision makers
at the city level.
Universities and research centers equally provide an important vehicle for
building capacity in developing countries through training future policy makers
and practitioners, and through targeted executive training programs. Accord-
ingly, it is useful for such institutions to partner with international researchers to
ensure the transfer of current knowledge, approaches, and technologies.
Also, much capacity building can happen as cities learn from each other. Suc-
cessful experiences include city and local government networks at the country,
regional, and international level, training programs, and knowledge exchange
through twinning and other programs that allow cities to share knowledge and
information.
Bridging Communities and Local Governments to Work Together on Local Solutions
Th e urban poor are clearly on the front line in addressing the impacts of climate
change and disaster risk. Much is already happening at the household and

90 ■ CLIMATE CHANGE, DISASTER RISK, AND THE URBAN POOR
TABLE 3.3 Capacity Programs Aimed at Knowledge Sharing, Education, and Training for Urban Resilience
Agency/program Capacity building
African Centre for Cities (ACC) Interdisciplinary research and teaching program for sustainable urbanization in Africa
C-40 Establishing activity-specifi c subcommittees, which include city resilience planning and focus on unique needs of port cities
International City/County Management Administration (ICMA)
Provides knowledge-based assistance in disaster mitigation and preparedness for vulnerable com-munities, and recovery and restoration of basic municipal services
International Institute for Environment and Development (IIED)—capacity strengthening of least developing countries for adaptation to climate change network
Experts work to strengthen organizations through publications and capacity-building workshops, mostly in Africa and South Asia, and active sup-port for Conference of the Parties (COP) negotia-tions
International Strategy for Disaster Reduction (ISDR)—My City Is Getting Ready Campaign
Focuses on raising political commitment to disas-ter risk reduction and climate change adaptation among local governments, including high-profi le media and public-awareness activities, and devel-ops technical tools for capacity building
International Organization for Standardization
Development of ISO 31000—principles and guidelines for risk management
Local governments for sustainability (ICLEI)
Works with cities globally to conduct climate resil-iency studies and develop adaptation plans
Rockefeller Foundation Asian Cities Climate Change Resilience Network (ACCRN) helps cities to develop adaptation plans with civil society (10 cities in Vietnam, Indonesia, and Thailand)
United Cities and Local Governments/Metropolis
UCLG represents and defends interests of local governments on world stage. In area of cities and climate change, Metropolis is working on range of projects and knowledge products
World Bank Group • Urbanization Knowledge Partnership
(UKP) and Green Growth Knowledge Platform
• World Bank Institute
New platforms that include provisions for peer-to-peer exchange and knowledge sharing
Global capacity-building programs include: • E-Learning Safe and Resilient Cities Course,
Cities and Climate Change • Networking • Mentoring • On-Demand Knowledge and Capacity Building
Source: Author.

BUILDING RESILIENCE FOR THE URBAN POOR ■ 91
community levels that local governments can draw upon (World Bank 2010a).
Such actions include repairing roofs, building stronger foundations, digging
trenches, clearing drainage and ditches, repairing leaks, channeling water, and
planting trees. Th ese eff orts are especially important for cities that have limited
capacity and resources.
At the same time, much of what is needed to reduce risk in low-income urban
communities depends on the availability of infrastructure that residents cannot
provide themselves. Storm and surface drainage, road and path networks, links to
water networks, and health-care services require specialized skills and substantial
resources that communities may not have.
Despite the obvious benefi ts of partnerships between local governments and
communities, this does not always happen, in part due to negative perceptions
particularly around policies related to informal settlements. Th ere are, however,
good examples of partnerships between community organizations and local gov-
ernments in working in poor urban communities on risk reduction. An impor-
tant component of these partnerships is good communication.
In the Philippines, a partnership between a grass-roots organization, the
Philippines Homeless People’s Federation (PHPF), and local governments has
worked to secure land tenure, build or improve homes, and increasingly to
design and implement strategies to reduce risk (PHPF 2010). Following the dev-
astation caused by Typhoon Frank in 2008, the local government in the city of
Iloilo worked closely with PHPF in technical working groups, mapping of high-
risk areas, and identifi cation and prioritization of communities to be given post-
disaster assistance.
In one of the oldest and largest slums in Jakarta, Kampung Melayu, residents
have responded to an increase in the severity and frequency of fl ooding by devel-
oping an early-warning fl ood system. Neighborhood and village heads receive
SMS messages on their mobile phones from fl ood-gate areas upriver when the
water level is getting high. Th ey can then spread the news in the community by
broadcasting from the minaret of the local mosque, so that residents can prepare
for the coming inundation (see box 3.2).
One of the more complex but impressive examples is in Quelimane City,
Mozambique, where local communities have partnered with the City Coun-
cil and several international organizations to work on upgrading communities
particularly aff ected by cyclical fl oods (City Council of Quelimane 2006; Cities
Alliance 2008; Grimard 2006–2008). Th e city and community worked together
on developing an upgrading strategy that had a special focus on water and sani-
tation conditions. In implementing the strategy, the City Council provided an
in-kind contribution of US$100,000 by providing offi ce space, equipment, a
meeting room, technical and administrative staff , and vehicles. Th e community
provided an in-kind contribution of US$150,000 by providing subsidized labor,

92 ■ CLIMATE CHANGE, DISASTER RISK, AND THE URBAN POOR
conducting awareness campaigns, forming operational management teams, and
reducing their plot size, or, in extreme cases, moving to another area because of
improvement works. UN-HABITAT, the World Bank, the Danish International
Development Agency (DANIDA), UNICEF, and WaterAid together contributed
US$440,000 in cash and in-kind. Other in-kind contributions totaling US$30,000
were secured from a state water-supply institution, and from a private-sector fi rm
that made its trucks available during weekends in exchange for paying only for
fuel and the driver.
Community-based resources are integral to providing health services to the
urban poor, which are important for prevention and environmental health inter-
ventions to ensure a safe and clean environment for residents and to prevent the
outbreak of disease. For example, “preventive advocacy,” an approach through
which at-risk groups promote prevention-based messages within their commu-
nities and social networks, has been eff ective in decreasing risk for communi-
cable disease (Weibel 1988). Local opinion leaders, or informal leaders who are
well-connected and well-regarded in a neighborhood, oft en are able to eff ectively
diff use ideas and information more eff ectively than other interventions (Valente
and Davis 1999). Local community groups and partnerships also play integral
roles in monitoring and advocating for public health services.
With regard to environmental health interventions, some local communities
use low-tech methods of monitoring pollution in order to inform policy mak-
ers of toxic releases or establish cooperative agreements with industrial facilities
(O’Rourke 2002). NGOs such as Global Community Monitor train communities,
particularly those that are disempowered and situated next to polluting facilities,
to understand the impacts of pollution on their health and train them to monitor
and document soil and air quality. Others both work with and advocate on behalf
of these communities at the local and national levels, while still others use their
international position and ties to provide support through advocacy and media
campaigns.
Among the lessons learned from experience of partnerships between commu-
nities and local governments are that such cooperation can be facilitated through
mutually recognizing the role that each group plays; improving the dialogue to
dispel misunderstandings; and understanding and recognizing what is happen-
ing at the local level and forming partnerships with local organizations.
For the poor, understanding what the city can and cannot provide and
what its constraints are is a fi rst step. Strong community groups and detailed
community-level information systems can be extremely eff ective for initiating
engagement in such partnerships. For local governments, this means recogniz-
ing the contribution that the urban poor make to a city’s economy and society
and involving them in discussions about needs and priorities. Local participa-
tion is crucial to ensure that the approach taken suits the needs of residents,

BUILDING RESILIENCE FOR THE URBAN POOR ■ 93
BOX 3.6
Locally Organized Early-Warning System in Kampung Melayu in Jakarta
Kampung Melayu is one of the largest and oldest kampungs (villages) in Jakarta. It is situated along the banks of the Ciliwung River, which has been fl ooding with increasing intensity over the past 10 years, according to residents. The community is made up of a mix of formal and informal settlements. Some areas, notably those further from the riverbanks, comprise formal housing, while others, particularly the areas closer to the river, are less formal, characterized by more tenuous housing construction. Due to the increasing severity of the fl ooding, sometimes up to 4 meters of water, as often as ten times per month, people have adapted by moving to the second fl oor of their homes, leaving the bottom levels empty, and using the space for cottage industries and cooking only when it is dry. An early-warning fl ood system has been established in the
(continued next page)

94 ■ CLIMATE CHANGE, DISASTER RISK, AND THE URBAN POOR
and in ensuring quality standards. Many of the examples of local government-
community organization partnerships in Africa and Asia have been initiated by
federations of slum dwellers who are engaged in initiatives to upgrade slums,
secure land tenure, develop new housing that low-income households can
aff ord, and improve provision of infrastructure and services.
Notes
1. Th is is drawn from Livengood (2001) and from fi eld visits to Cuttack by David Sat-
terthwaite in June and October 2010.
2. Th e body is called Badan Penanggulangan Bencana Daerah (BPBD) (World Bank
2011a).
3. http://english.sisul.or.kr/grobal/cheonggye/eng/WebContent/index.html.
4. A lurah is the urban ward leader under the mayor of the city; there are more than
70,000 in Indonesia.
References
Allard, Pablo, and Jose Rojas. 2010. Th e Aguada Flood-Park: Recovering a Post-Industrial
Urban Stream in Santiago de Chile. http://www.holcimfoundation.org/Portals/1/docs/
F07/WK-Grn/F07-WK-Grn-.
Bigio, Anthony and Stephane Hallegatte. 2011. “Planning Policy, Synergies and Tradeoff s for
Urban Risk Management, Climate Change Adaptation and Poverty Reduction,” Mimeo.
Birkmann, Jörn, Matthias Garschagen, Frauke Kraas, and Nguyen Quang. 2010. “Adaptive
Urban Governance: New Challenges for the Second Generation of Urban Adaptation
Strategies to Climate Change.” Sustainability Science 5: 185–206.
community: the Rukun Warga and Rukun Tetangga (neighborhood and village heads) receive mobile-phone SMS messages from fl ood-gate areas upriver in Depok when the water level is getting high. They can then spread the news in the kampung, usually by broadcasting from the minaret of the local mosque, so residents can prepare for the coming inundation. This is a powerful, locally organized example of how residents in communities are connecting through their own means to more sophisticated and established water- management technology at the regional level.
Source: World Bank (2011a).
BOX 3.6 continued

BUILDING RESILIENCE FOR THE URBAN POOR ■ 95
Carmin, JoAnn. 2010. “Variations in Urban Climate Adaptation Planning: Implications
for Action.” Paper presented at the International Climate Change Adaptation Confer-
ence, Gold Coast, Australia.
Carmin, JoAnn, Sabrina McCormick, Sai Balakrishnan, and Eric Chu. 2011. Institutions
and Governance in a Changing Climate: Implications for Service Provision for the
Urban Poor, processed.
Cities Alliance. 2008. Comments on Progress Report, Improving Water and Sanitation in
Quelimane City. P101077.
City Council of Quelimane. 2006. Improving Water and Sanitation in Quelimane City,
Mozambique.
City of Quito. 2010. “Estrategia Quiteña ante el cambio climatico.” Dirreccion metropoli-
tana ambiental. Quito, Municipio del Districto Metropolitano de Quito. http://www
.quitoambiente.gov.ec.
Coff ee, Joyce E., Julia Parzen, Mark Wagstaff , and Richard S. Lewis. 2010. “Preparing for a
Changing Climate: Th e Chicago Climate Action Plan’s Adaptation Strategy.” Journal of
Great Lakes Research 36: 115–117.
Dickson, Eric, Judy Baker, and Dan Hoornweg. 2012. Urban Risk Assessments: An Approach
for Understanding Disaster and Climate Risk in Cities. Washington, DC: World Bank.
Gill, S.E., J.F. Handley, A.R. Ennos, and S. Pauleit. 2007. “Adapting Cities for Climate
Change: Th e Role of Green Infrastructure.” Built Environment 33 (1).
Global Facility for Disaster Reduction and Recovery (GFDRR). 2011. Volunteer Technol-
ogy Communities: Open Development. GFDRR: Washington DC.
Greater London Authority. 2010. Th e London Climate Change Adaptation Strategy, Draft
Report. London: Greater London Authority. http://www.london.gov.uk/climatechange/
strategy.
Grimard, Alain. 2006–2008. Grant Progress Report, Improving Water and Sanitation in
Quelimane City. P101077.
Groves, D.G., and R.J. Lempert. 2007. “A New Analytic Method for Finding Policy-
Relevant Scenarios.” Global Environmental Change 17: 73–85.
Groves, D.G., D. Knopman, R. Lempert, S. Berry, and L. Wainfan. 2007. Presenting Uncer-
tainty About Climate Change to Water Resource Managers—Summary of Workshops
with the Inland Empire Utilities Agency. RAND: Santa Monica, CA.
Halifax Regional Municipality (HRM). 2007a. Climate Change Risk Management Strategy
for HRM. HRM: Halifax. http://www.halifax.ca/climate/.
———. 2007b. HRM Climate Smart: Climate Change: Developer’s Risk Management Guide.
HRM: Halifax. http://www.halifax.ca/climate/documents/DevelopersGuidetoRisk
Managment.pdf.
Hallegatte, S. 2009. “Strategies to Adapt to an Uncertain Climate Change.” Global Environ-
mental Change 19: 240–247.
Health Canada. 2010. “Communicating the Health Risks of Extreme Heat Events: Toolkit
for Public Health and Emergency Management Offi cials.” Canada.
Katich, Kristina. 2011. Beyond Assessment, A Review of Global Best Practices Addressing
Climate Change and Disaster Management for the Urban Poor, processed.
Lempert, R.J., and M.T. Collins. 2007. “Managing the Risk of Uncertain Th resholds
Responses: Comparison of Robust, Optimum, and Precautionary Approaches.” Risk
Analysis 27: 1009–1026.

96 ■ CLIMATE CHANGE, DISASTER RISK, AND THE URBAN POOR
Lempert, R.J., D.G. Groves, S.W. Popper, and S.C. Bankes. 2006. “A General, Analytic
Method for Generating Robust Strategies and Narrative Scenarios.” Management Sci-
ence 52 (4): 514–528.
Lempert, Robert J., and Nidhi Kalra. 2011. “Managing Climate Risks in Developing Coun-
tries with Robust Decision Making.” In World Resources Report, Washington, DC:
World Resources Institute.
Livengood, Avery. 2011. “Enabling Participatory Planning with GIS: A Case Study of Set-
tlement Mapping in Cuttack, India.” Environment and Urbanization 23 (2).
Martin-Vide, J.P. 2001. “Restoration of an Urban River in Barcelona, Spain.” Environmen-
tal Engineering and Policy 2: 113–119.
Metropolitan Municipality of Istanbul Planning and Construction Directoriat
Geotechnical and Earthquake Investigation Department. 2003. Earthquake Master-
plan for Istanbul. http://www.ibb.gov.tr/en-US/SubSites/IstanbulEarthquake/Pages/
IstanbulEarthquakeMasterPlan.aspx.
Milly, P.C.D., J. Betancourt, M. Falkenmark, R.M. Hirsch, Z.W. Kundzewicz, D.P. Letten-
maier, and R.J. Stouff er. 2008. “Climate Change: Stationarity Is Dead: Whither Water
Management?” Science 319 (5863): 573.
National Research Council. 2007. Tools and Methods for Estimating Populations at Risk
from Natural Disasters and Complex Humanitarian Crises. Washington, DC: National
Academies Press.
New York City Panel on Climate Change (NYCPCC). 2010. Climate Change Adapta-
tion in New York City: Building a Risk Management Response. Ed. C. Rosenzweig and
W. Solecki. Annals of the New York Academy of Sciences, Vol. 1196. Wiley-Blackwell.
Nicholls, R.J., et al. 2007. Ranking Port Cities with High Exposure and Vulnerability to Cli-
mate Change: Exposure Estimates. Environment Working Paper 1. OECD.
O’Rourke, Dara. 2002. “Community-Driven Regulation: Toward an Improved Model of
Environmental Regulation in Vietnam.” In Livable Cities: Urban Struggles for Livelihood
and Sustainability. Ed. Peter Evans. Berkeley: University of California Press.
Parzen, Julia. 2009. Lessons Learned: Creating the Chicago Climate Action Plan. Chicago:
City of Chicago.
Pelham, L., E. Clay, and T. Braunholz. 2011. “Natural Disasters, What Is the Role of Safety
Nets?” Social Protection Discussion Paper, World Bank, Washington, D.C.
Philippines Homeless People’s Federations (PHPF). 2010. “Addressing Vulnerabilities
through Support Mechanisms: HPFPI’s Ground Experience in Enabling the Poor to
Implement Community-rooted Interventions on Disaster Response and Risk Reduc-
tion.” Background paper prepared for the 2011 Global Assessment Report on Disaster
Risk Reduction.
Pulwarty, Roger. 2007. “Communicating Agroclimatological Information, Including
Forecasts for Agricultural Decision.” In Guide to Agrometeorological Practices. World
Meterological Organization.
Satterthwaite, David. 2011. How Local Governments Work with Communities in the
Delivery of Basic Services, processed.
Schwartz, P. 1996. Th e Art of the Long View. New York: Double Day.
Shah, Fatima, and Federica Ranghieri, 2012. A Workbook for Urban Resilience in the
Face of Disasters, Adapting Experiences from Vietnam’s Cities to other Cities World
Bank, Washington, DC.
BUILDING RESILIENCE FOR THE URBAN POOR ■ 97
Toronto Environmental Offi ce. 2008. Ahead of the Storm: Preparing Toronto for Climate
Change. Toronto. http://www.toronto.ca/teo/pdf/ahead_of_the_storm.pdf.
Valente, Th omas W., and Rebecca L. Davis. 1999. “Accelerating the Diff usion of Innova-
tions Using Opinion Leaders.” Annals of the American Academy of Political and Social
Science 566: 55–67.
Van Aalst, Maarten K., Terry Cannon, and Ian Burton. 2008. “Community Level Adapta-
tion to Climate Change: Th e Potential Role of Participatory Community Risk Assess-
ment.” Global Environmental Change: Human and Policy Dimensions 1(18): 165–179.
Weibel, W. Wayne. 1988. Combining Ethnographic and Epidemiologic Methods in Targeted
AIDS Interventions: Th e Chicago Model. Rockville, MD: National Institute on Drug
Abuse.
World Bank. 2006. Morocco, Poverty and Social Impact Analysis of the National Slum
Upgrading Program. Washington, DC: World Bank.
———. 2010a. Pro-Poor Adaptation to Climate change in Urban Centers: Case Studies of
Vulnerability and Resilience in Kenya and Nicaragua. World Bank: Washington, DC.
———. 2011a. Jakarta: Urban Challenges in a Changing Climate. Jakarta: World Bank.
———. 2011b, Urban Poverty & Climate Change in Dar es Salaam, Tanzania; A Case Study,
processed.
Yu, Carlyne Z., and Edsel E. Sajor. 2008. Urban River Rehabilitation: A Case Study in
Marikina City, Philippines. http://www.wepa-db.net/pdf/0810forum/paper35.pdf.


■ 99
Opening New Finance Opportunities for Cities to Address Pro-poor
Adaptation and Risk Reduction
Th e analysis of the risks for the urban poor associated with climate change and
natural hazards point to signifi cant fi nancing needs for cities. Th e costs of adapta-
tion and risk reduction include physical investments, such as urban infrastruc-
ture and basic services in slum areas, but equally important are investments in
good information systems and tools for integrating climate change and disaster-
risk management into urban planning, safety nets, and capacity building to help
local governments better deliver services and manage risk for their residents.
4
Key Messages
• Adaptation and risk reduction costs include physical investments, such as urban infrastructure and basic services in slum areas, as well as investments in information systems, safety nets, and capacity building.
• There is no common established method for estimating the costs of adapta-tion in a broadly comparable, standardized manner at the city level.
• The available climate funds are modest compared with the needs of develop-ing countries; therefore these funds are mainly catalytic.
• A combination of public and private resources is needed in order to fi nance investments that contribute to building resilience for the poor.

100 ■ CLIMATE CHANGE, DISASTER RISK, AND THE URBAN POOR
Existing approaches to fi nancing investments that contribute to building resil-
ience are reviewed in this chapter, with an aim to identify potential opportunities
for scaling up such investments. While many of the current instruments are not
explicitly designed for adaptation, risk reduction, or to be pro-poor, with some
program modifi cations, resources can be directed to address the growing needs
in this intersection of climate change, disaster risk, and the urban poor.
Costing Adaptation and Risk Reduction
When reviewing potential fi nancing needs for climate adaptation and disaster
risk reduction in cities, it is important to consider that not all investments are
necessarily high and some can have more direct impacts on the poor than others.
Large-scale city-wide infrastructure investments such as seawalls, embankments,
or levees for fl ood protection, or measures to make roads, ports, and power-
generation facilities more resilient to extreme events, may be necessary in many
cities over time, but they are expensive and will not improve conditions for those
living with the current impacts of the more frequent less extreme events.
Smaller-scale investments in drainage and improvements in basic infrastruc-
ture need not be expensive, and are catalytic in building resilience for the urban
poor. Programs to upgrade slums take a neighborhood approach and, in addition
to local infrastructure improvements, oft en include social programs aimed at
community development. Such programs are most eff ective when coupled with
policies that tackle diffi cult issues related to land.
At the city level, there is as yet no common established method for estimating
the costs of adaptation in a broadly comparable, standardized manner. Estimat-
ing the costs of adaptation is particularly diffi cult, for several reasons. Adapta-
tion strategies rely on what scenario is chosen (for example, the rate of climate
change), the valuation approach and indirect costs, temporal variation depen-
dent on the discount rate, and uncertainty—all dependent on a specifi c location
(European Environment Agency 2007).
One approach used is to assess the cost of potential damages, and then
accordingly estimate costs of prevention. Th e recent study on Climate Risks and
Adaptation in Asian Coastal Megacities: A Synthesis Report (World Bank 2010b)
estimates that the costs from major fl ooding in Bangkok, Ho Chi Minh City, and
Manila are expected to run into billions of dollars over the next few decades,
putting the estimated costs of the additional damage from climate change in the
range of 2 percent to 6 percent of regional gross domestic product (GDP).
Another example of a subnational cost estimate is the adaptation cost
curve for Florida (see fi gure 4.1), which disaggregates adaptation measures
and helps in prioritization. Activities below the cost-eff ective line in light gray

OP
EN
ING
NE
W F
INA
NC
E O
PP
OR
TU
NIT
IES
FO
R C
ITIE
S
■
10
1Figure 4.1 Adaptation Cost Curve: Florida Test Case
Measures with netnegative benefits
Measures with netpositive benefitsCost/benefit ratio
11
11 12 13 14 15 16 17 18 19
10
10
9
Measures belowthis line have net
economic benefits
BeachNourishment(50 ft)
Roof cover,new
Levee & FloodwallSandbags
Openingprotection, new Roof shape
newTemp.floodwalls
VegetationMgmt
Elevation – new homes
Roofcover,retrofit
Targetinghardening,dist.Roof truss,retrofitSubstationBackupgenerators
Locallevees
Masonry,newOpeningprotection,retrofit
Targetedhardening,transmission
Deductibles – residential Deductibles – commercial
Engineering based FRT penetrationRoad elevation
Targeted undergrounding,distribution
Targeted under –grounding, trans.
Replacementundergrounding, dist.
Replacement under – grounding, trans.
Averted loss$b
Elevation, retrofit
Top layer risk transferElevation, prioritizedretrofit
Roof deckattachment, new
Roof truss,new
Note: Calculated in 2008 dollars for the moderate climate scenario
BeachNourishment(100 ft)
9
8
8
7
7
6
6
5
5
4
4
3
3
2
2
1
10
0
0 0 0 0 0 0 0.1 0.10.3 0.7 0.8
0.91.0
1.01.01.1 1.3 1.5
1.51.51.5
1.8 2.12.6
3.0 3.7
7.56.9
10.3
$30bnannualexpectedloss
0.1 0.1
MODERATE CLIMATE SCENARIO
Source: ECA Working Group (2010).

102 ■ CLIMATE CHANGE, DISASTER RISK, AND THE URBAN POOR
are cost-eff ective. One consideration not fully refl ected in this approach is the
social aspect or community linkages associated with many adaptation mea-
sures. Adaptation eff orts, such as early-warning systems, preservation and
protection of vulnerable lands, and adherence to land-use plans, generally
require “socialization” for eff ective implementation.
A study on climate change adaptation and disaster preparedness in coastal
cities of North Africa calculates estimated costs for infrastructure works related
to resilience and action plans for Tunis, Tunisia, and Casablanca, Morocco
(World Bank 2011). Th e economic effi ciency of investments was then captured
through a benefi t/cost ratio (B/C), comparing discounted values over time to
avoided damages against implementation costs. Figure 4.2 shows a comparison
of B/C for diff erent investments for Tunis and Casablanca. Effi ciency is overall
high in Casablanca, with early-warning systems having the highest benefi ts.
Further estimating the costs of adaptation specifi cally for the urban poor
is similarly diffi cult for many of the same reasons listed above. Costs for slum
improvements are very location specifi c, and even within cities, the unit costs
can vary substantially. However, rough estimates prepared by the UN Millen-
nium Project (2005) put the average unit cost of slum upgrading at around
US$670 per capita. Th is includes investment in land titling, access to water, san-
itation and sewage treatment, social investments in education and health, and
home improvements. Th is cost is comparable to estimates for a bundle of infra-
structure services to Africa’s medium-size cities, US$663 per capita, and for
Figure 4.2 Benefi t-Cost Ratio by Risk Category for Tunis and Casablanca
14
12
10
8
6
4
2
0Early warning
systemCoastal
managementAnti-seismicmeasures
Anti-floodparcel
measures
Anti-floodcollective
measures*
Tunis Casablanca
Source: World Bank (2011).*Anti-fl ood collective measures include urban drainage and integrated water-management planning.

OPENING NEW FINANCE OPPORTUNITIES FOR CITIES ■ 103
large cities, a lower cost of US$325 per capita, which refl ects the importance of
density in infrastructure cost (World Bank 2010a). Using these averages along
with estimated slum population, one could approximate a back-of-the-envelope
cost for slum improvements for a given city.
Sources of Financing for Adaptation and Risk Reduction
Financing for investments that contribute to building resilience for the poor
should, in theory, be covered by a combination of public and private resources.
Infrastructure investments generate benefi ts for the whole city and thus should
be fi nanced by public funds. Housing, home improvements, and land titling are
considered private goods and thus fi nanced by benefi ciaries.
Cities in developing countries currently rely on national and local tax rev-
enues, the private sector, public-private partnerships, and loans and concessional
sources through the World Bank and other multilateral development banks to
TABLE 4.1Current Sources of Financing and Instruments for Climate Change, Disaster Risk, and Slum Improvements
Source of fi nancing InstrumentsPro-poor benefi ts:
direct (D) or indirect (I)
Government revenues and expenditures
TaxesTargeted subsidiesLand-based fi nancing
IDD
Multilateral development banks and donors
Investment and policy loansGrants
DD
Risk-management instruments
InsuranceCatastrophe bond platform (MultiCat)Partial credit and partial risk guaranteesMicro-insurance
I
I
ID
Carbon markets Citywide approach City-based emissions trading systemsCarbon-linked bonds
I
II
Private sector Individual and community savings fundsPublic-Private PartnershipsMicrofi nanceResults-based fi nancing
DDDD
Source: Author.

104 ■ CLIMATE CHANGE, DISASTER RISK, AND THE URBAN POOR
fi nance infrastructure and social needs. Existing programs provide smaller grants
or technical assistance for projects and programs at the city level. In practice,
such resources are vastly insuffi cient to meet the service needs of the population,
particularly in slums.
In countries that have carried out large eff orts to upgrade slums, most of the
funding has come from central governments through transfers to local govern-
ment, and from donors. A typical package is fi nanced by about 40 percent to
50 percent from the central government in the form of grants or loans to subna-
tional localities, another 40 percent from foreign loans or grants, 5 percent from
localities, up to 10 percent from benefi ciaries and communities, and 3 percent
from cities (World Bank, Approaches to Urban Slums, 2008). Local govern-
ments typically contribute with land.
Government Revenues and Expenditures
Revenues raised by governments through taxes, fees, and charges are a basic
means of funding public expenditures, but do face constraints. Governments at
all levels are usually reluctant or unable to increase taxes or reduce existing sub-
sidies, both measures being politically unpopular. In lower-income settings, and
where the formal economy is small, revenue raising can be diffi cult or limited. In
decentralized countries, with increased functions and responsibilities for local
governments, greater revenue-raising authority should be given commensurately
to local governments. In the absence of such revenue authority, there would need
to be signifi cant transfers from higher levels of government.
Taxes, fees, and charges can be designed with specifi c policy objectives in
mind and some can be designed with climate-related or pro-poor benefi ts,
such as in the urban-land use, buildings, and transportation sectors. Taxes are
a potentially powerful tool, especially property tax. Fees and charges are ideal
for funding local services, where specifi c benefi ciaries, such as the poor, can be
targeted. Fees are particularly eff ective when they recover full costs and when
fees are paid according to individual or household use, as these give residents
incentives for more effi cient use of resources.
Land is the most important asset for generating resources in cities. Land-
based instruments include betterment levies, development land sales, value
capture, sale of development rights, developer exactions, and impact fees. Most
of the land-based instruments generate revenues upfront, reducing the need
for borrowing. Land-based revenues have been used for infrastructure proj-
ects supported by the private sector, such as the metro in São Paulo, and the
installation of public infrastructure in exchange for desert land in Cairo. When
such approaches are used for slum areas, they risk increasing land values to a
point that becomes unaff ordable for the poor, pricing them out of the market.

OPENING NEW FINANCE OPPORTUNITIES FOR CITIES ■ 105
In Bogota and Porte Alegre, approaches have been designed to ensure that the
increases in land prices generated by government interventions are used to
fi nance the housing program itself (Smolka2008).
Multilateral Development Banks and Donors
Government revenues alone cannot fund all actions related to climate and
disaster risks, particularly the new or incremental costs associated with climate
change. For this reason, and particularly in developing countries, loans and
sources of concessional fi nance have an important role. From the city perspec-
tive, access to resources at the international level is oft en complicated, not least
because of historical arrangements that primarily targeted national govern-
ments. Relevant fi nancing is available through climate change, disaster risk,
and urban development.
Climate ChangeTh ere have been proposals for substantial amounts of assistance for adaptation
activities through external assistance, though these funds have been limited and
are not explicitly targeted for cities. Th e available climate funds are modest com-
pared with the needs of developing countries. Annex 1 summarizes sources of
climate fi nance and their relevance in the urban context. An example of how
the Clean Technology Fund’s Investment Plan for Th ailand included an urban
transformation component for Bangkok is illustrated in box 4.1. More detailed
information on most of the sources can be obtained from the joint UNDP/World
Bank Climate Finance Options website.1 In using such resources, one can design
programs with a focus on the urban poor. For example, in the case of Bangkok,
in developing the bus rapid transport system, priority can be given to ensuring
access and aff ordability for those living in urban slums.
Th e progress achieved to date with climate fi nance demonstrates the poten-
tial catalytic role of public fi nance—its ability to leverage both climate and
development fi nance for climate action. Th is includes the piloting of innovative
approaches that combine resources to maximize synergies, explore new oppor-
tunities to expand the scope for market mechanisms, and strengthen capacity
to facilitate access to and eff ective use of resources (World Bank 2010c). Box 4.2
describes the example of Mexico’s Urban Transport Transformation Program,
in which fi nancial resources from diff erent sources were combined to fund the
entire program.
Th e World Bank Group off ers various concessional fi nance instruments
that national governments can channel for urban climate action, such as the
International Development Association for low-income countries, and bud-
get support in the form of Development Policy Loans (DPL). Recent climate
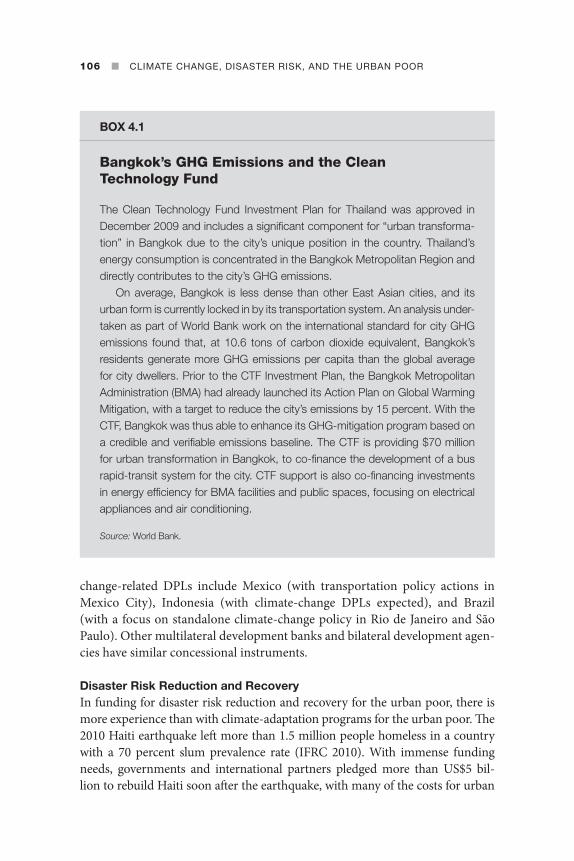
106 ■ CLIMATE CHANGE, DISASTER RISK, AND THE URBAN POOR
change-related DPLs include Mexico (with transportation policy actions in
Mexico City), Indonesia (with climate-change DPLs expected), and Brazil
(with a focus on standalone climate-change policy in Rio de Janeiro and São
Paulo). Other multilateral development banks and bilateral development agen-
cies have similar concessional instruments.
Disaster Risk Reduction and RecoveryIn funding for disaster risk reduction and recovery for the urban poor, there is
more experience than with climate-adaptation programs for the urban poor. Th e
2010 Haiti earthquake left more than 1.5 million people homeless in a country
with a 70 percent slum prevalence rate (IFRC 2010). With immense funding
needs, governments and international partners pledged more than US$5 bil-
lion to rebuild Haiti soon aft er the earthquake, with many of the costs for urban
BOX 4.1
Bangkok’s GHG Emissions and the Clean Technology Fund
The Clean Technology Fund Investment Plan for Thailand was approved in December 2009 and includes a signifi cant component for “urban transforma-tion” in Bangkok due to the city’s unique position in the country. Thailand’s energy con sumption is concentrated in the Bangkok Metropolitan Region and directly contributes to the city’s GHG emissions.
On average, Bangkok is less dense than other East Asian cities, and its urban form is currently locked in by its trans portation system. An analysis under-taken as part of World Bank work on the international standard for city GHG emissions found that, at 10.6 tons of carbon dioxide equivalent, Bangkok’s residents generate more GHG emis sions per capita than the global average for city dwellers. Prior to the CTF Investment Plan, the Bangkok Metropolitan Administration (BMA) had already launched its Action Plan on Global Warming Mitigation, with a target to reduce the city’s emissions by 15 percent. With the CTF, Bangkok was thus able to enhance its GHG-mitigation program based on a credible and verifi able emissions baseline. The CTF is providing $70 million for urban transformation in Bangkok, to co-fi nance the development of a bus rapid-transit system for the city. CTF support is also co-fi nancing investments in energy effi ciency for BMA facilities and public spaces, focus ing on electrical appliances and air conditioning.
Source: World Bank.

OPENING NEW FINANCE OPPORTUNITIES FOR CITIES ■ 107
rebuilding in Port-au-Prince.2 Th e extremity and magnitude of the Haiti earth-
quake make it an outlier, with funding not always as easily accessible for post-
disaster urban reconstruction.
Urban Development and Slum UpgradingLending for urban development is on the rise at the World Bank and other
multilateral development banks, though the amounts are still very low relative
to the need generated in cities by rapid urbanization. Overall lending by the
World Bank during the fi scal years 2000–2009 was approximately US$15 bil-
lion (World Bank 2010d). Th e proportion of that going to slum upgrading is
approximately 20 percent, or some US$2.8 billion invested during the period
through some 40 projects, with most in Sub-Saharan Africa and Latin America
and the Caribbean.
Finally, there are fi nancing and technical assistance programs designed to pro-
vide catalytic resources for cities, which one way or another relate to building
resilience for the urban poor. Some of those available through the World Bank
are listed in table 4.2.
BOX 4.2
Combining Resources to Maximize Synergies: Supporting Mexico’s Urban Low-Carbon Transformation
The objective of the Mexico Urban Transport Transformation Program is to change urban transport in Mexican cities to a lower-carbon growth path by improving its quality and sus tainability and by upgrading related elements of the urban transport system. The project is ambitious in its design and scope and, if successful, will have a transformative impact on the urban transport sector in Mexico. It builds on a World Bank loan of $200 million and an additional Clean Technology Fund concessional loan of $200 million. These resources will be channeled through the Banco Nacional de Obras, which will then provide the participating municipali ties with this loan funding. Combined with funding from the National Trust for Infrastructure, this will make up to $900 million avail-able. The private sector and the municipalities themselves are expected to contribute up to $300 million and $150 million, respectively. An estimate of the potential for carbon revenue payments could run to approximately $50 million additional funds. Urban areas that complete and propose integrated transport plans will be eligible for funds.
Source: World Bank.

108 ■ CLIMATE CHANGE, DISASTER RISK, AND THE URBAN POOR
Risk-Management Instruments
Insurance and other risk-management instruments serve an important function
for cities and countries when disaster does strike. Globally, private insurers do
provide coverage for a wide range of risks, but not all risks are fully covered for
various reasons: insurers may be willing to cover certain risks, but the potential
clients deem the premiums too expensive; or insurers may simply be unwilling to
take on risks that they view as being too great. Th ese instruments are generally for
upper- and middle-income families, large businesses, and wealthy governments,
TABLE 4.2 Summary of Catalytic Financing and Technical Assistance Programs at the World Bank
Financing program Brief description
Citywide approach to carbon fi nance
Enhancing cities’ access to carbon fi nance, by aggregating emissions reductions from multiple sectors within a city, to overcome barriers such as high transaction costs and small volumes.
Carbon market development guarantee
A proposed guarantee instrument to facilitate forward contracts between buyers of carbon credits and cities (as sellers). Buyers will provide upfront payments for future delivery of carbon credits. The Bank will provide guarantees to buyers, under-pinned by indemnity agreements with respective national governments. Provides early cash fl ow to cities given signifi cant upfront investments needed to generate carbon credits.
PPIAF Sub-National Technical Assistance (SNTA) program
Grants to cities improve their creditworthiness and access to market-based fi nancing, with a specifi c focus on publicly owned utilities. Complemented by technical assistance on private-sector potential in infrastructure.
Gobal Facility for Disaster Reduction and Recovery (GFDRR) Track II Financing for Disaster Risk Reduction Mainstreaming
Financing for national disaster risk reduction and climate change adaptation programs – this is usually channeled nationally and for GFDRR priority countries, but a window will be made available for cities (tbc).
Cities Alliance Catalytic Fund Grant support for projects that strengthen and promote the role of cities in poverty reduction and sustainable urban development.
Global Partnership on Output-Based Aid (GPOBA) technical assistance funding
Technical assistance activities that support the design, implementation, and evaluation of output-based aid (OBA) projects. Sectors relevant to cities include water and sanitation, energy, and transport.
Source: Author.

OPENING NEW FINANCE OPPORTUNITIES FOR CITIES ■ 109
but not for the urban poor. Th e urban poor oft en do not have access to insurance
products, and even if they did, the transaction costs of fi ling and verifying claims
would be very high.
Th e World Bank has developed a catastrophe bond issuance platform—the
MultiCat Program—that allows governments to use a standard framework to
buy parametric insurance on aff ordable terms. Box 4.3 describes the experience
with MultiCat in Mexico. For implementation in cities, a Global MultiCat bond
issue for cities would pool a large number of exposed areas or cities and risks,
consider ably reducing insurance costs through diversifi cation. Working with
such a pool, identifi ed donors and cities would pay the insurance premiums.
Th e unique risk-return profi le asso ciated with the pool would attract interest
from a wide variety of investors. Estimates show that a three-year $250-million
Global MultiCat placed in capital markets could provide $50 million in cover-
age against earthquakes, hurricanes, or fl oods to each member of a group of
some 40 cities.
BOX 4.3
MultiCat Mexico
Background: The Mexican government in 2006 insured its catastrophe reserve fund, the Fondo de Desastres Naturales (FONDEN), against natural disasters with a mix of reinsur ance and a catastrophe bond. The resulting contract was linked to a parametric trigger in terms of magnitude and depth of seismicity for the three-year period 2007–09. In 2008, the Mexican govern-ment spent US$1.2 billion from the reserve fund to cover rescue and rebuilding operations after Hurricanes Stan and Wilma. In collaboration with the World Bank, Mexico developed and successfully established the catastrophe bond MultiCat Mexico in 2009, with the World Bank acting as arranger.
Limitations: The coverage from FONDEN is the fraction of the coverage that is taken care of by the federal govern ment. Mexican states are also supposed to support a frac tion of the post-disaster expenses; the instrument does not give these Mexican states access to reinsurance markets. In addition, the preparation of the MultiCat Mexico was possible thanks to the technical exper-tise existing in the Mexican Ministry of Finance. Such technical expertise would need to be developed by any participating government either before or during the preparation of a MultiCat issue.
Source: World Bank.

110 ■ CLIMATE CHANGE, DISASTER RISK, AND THE URBAN POOR
MDBs can also support fi nancing in cities by off ering credit enhancements to
facilitate access to broader credit by governments. With a partial credit guarantee
(PCG), the guarantor shares the risk of debt service default with the lenders on
a predetermined basis. Th e PCG programs funded by the Global Environment
Facility (GEF) for energy effi ciency investments typically provide for a 30 percent
to 50 percent guarantee on loans made by participating fi nancial institutions.
A partial risk guarantee insures private lenders or investors/project companies
(through shareholder loans) against the risk of a government (or government-
owned entity) failing to perform its contractual obligation with respect to the
private project.
Th e World Bank off ers both partial credit and partial risk guarantee products.
Each can be structured to meet the specifi c needs of the project investors and
government and can require a counter-guarantee from the sovereign government
(see, for example, the proposed carbon market development guarantee instru-
ment in table 4.3). On the other hand, the Multilateral Investment Guarantee
Agency of the World Bank Group off ers standard cross-border risk insurance
without an explicit counter-guarantee from the government.
Microfi nance can also be used to fi nance risk reduction and recovery by
the poor. Microfi nance has been used to improve resilience through housing
improvements and livelihood assets. In low-income communities in El Salva-
dor, self-insurance includes encouraging family members to migrate to provide
remittance income, and stockpiling building materials that can be either used
or resold (World Watch Institute 2007). One study estimated that residents
spend approximately 9 percent of their income on risk-reduction measures. At
the community level, many contribute to community emergency funds or join
religious institutions that traditionally off er post-disaster help.
In Manizales, Colombia, the city has arranged for insurance coverage to
cover the urban poor through municipal tax collection. Any city resident may
purchase insurance coverage for his or her property, and once 30 percent of
the insurable buildings participate, the insurance coverage is extended to tax-
exempted properties, including properties with a value of 25 monthly sala-
ries or less (estimated at US$3,400) (Velasquez 2010). Despite the municipal
administration collecting a handling fee of 6 percent, the insurance company
has a direct contractual relationship with the individual taxpayer and bears
responsibility for all the claims.
Carbon Markets and Related Instruments
Carbon fi nance refers to the use of the fl exible mechanisms of the Kyoto Proto-
col, including the Clean Development Mechanism (CDM) and Joint Implemen-
tation, as well as voluntary programs outside of the United Nations Framework

OP
EN
ING
NE
W F
INA
NC
E O
PP
OR
TU
NIT
IES
FO
R C
ITIE
S
■
11
1
TABLE 4.3 Main Instruments for Financing Climate Action in the Urban Context
Climate-specifi c additional resources under the aegis of UNFCCC
Adaptation fundUS$300–600 million by 2012 adaptation-fund.org
A The overall goal of all adaptation projects and programs fi nanced under the fund will be to support con-crete adaptation activities that reduce the adverse effects of climate change facing communities, countries, and sectors. Can be implemented at the city level. Applications through national designated authorities and implementation through accredited multilateral or national implementing entities.
Global Environment Facility (GEF) US$1.35 billion over 2011–14 gefweb.org
M(A)
Largest source of grant-fi nanced mitigation resources. Strategic Pilot on Adaptation (SPA) is a funding allocation within the GEF Trust Fund to support pilot and demonstration projects that address local adaptation needs and generate global environmental benefi ts in all GEF focal areas. Cities can initiate new projects or be implementation partners with national agencies.
UNFCCC GEF-administered special fundsLDCF: US$223 millionSCCF: US$148 million gefweb.orgGreen Climate Fund
A
M&A
Least Developed Countries Fund (LDCF) helps to prepare and fi nance implementation of national adaptation programs of action (NAPAs) to address the most urgent adaptation needs in the least devel-oped countries.Special Climate Change Fund (SCCF) supports adaptation and mitigation projects in all developing countries, with a large emphasis on adaptation.First agreed to in the Copenhagen Accord at COP-15, with the stated goal of mobilizing $100 billion annually by 2020 to address the needs of developing countries. The details of this fund are still under discussion.
Resources from the carbon market
Size of 11 carbon funds and facilities: US$2.5billionWorld Bank Carbon Partnership Facility (CPF) US$100 million
M Cities can access CDM funds through certifi ed emission reduction (CER).CPF can support cities in preparing CDM projects.World Bank Treasury can support in monetizing CERs.
(continued next page)

11
2
■
CL
IMA
TE
CH
AN
GE
, DIS
AS
TE
R R
ISK
, AN
D T
HE
UR
BA
N P
OO
R
TABLE 4.3 continued
Dedicated concessional funding (ODA) from the DAC community
Climate investment fundsUS$6.4 billion climateinvestment funds.org/
M The Clean Technology Fund (US$4.5 billion programmed for 13 investment plans) fi nances scaled-up dem-onstration, deployment, and transfer of low-carbon technologies. Major urban mitigation (transport and energy) investments in Bangkok and Mexico City; others are possible, provided more funds are pledged for programming.
World Bank administered, implemented by MDBs
AM
The Strategic Climate Fund: (1) Pilot Program for Climate Resilience (PPCR—US$1 billion programmed for nine pilot countries and two regions) helps build climate resilience in core development; (2) Forest Investment Program (FIP—US$587 million for eight pilot countries); (3) program to Scale up Renewable Energy for Low-Income Countries (SREP—US$318 million for six pilot countries). Urban upstream planning support and city-based investments are possible to integrate into national plans now being formulated in agreed pilot countries.
Reduced Emissions from Deforestation and Forest Degradation (REDD) programsUS$4 billion in pledges as Fast Start Finance following the Copenhagen Accord
Two major REDD funds fully or partially run by the World Bank, the Forest Carbon Partnership Facility (FCPF), and the Forest Investment Program (FIP, under the Climate Investment Funds) have already received over US$700 million in pledges for pilot programs in forested developing countries, and are currently commencing implementation. Cook-stove programs can still be integrated into country strategies and implementation plans for reducing deforestation. Their impact at the urban level is in reducing greenhouse gas and black-carbon emissions in low-income areas with corresponding health co-benefi ts.
Examples of other climate funds and their volumes:US$10 billionUS$1.6 billionUS$180 million annuallyUS$580 millionUS$180 millionUS$160 millionUS$135 millionUS$100 million
M&AM&AM&AM&AM&A
A M&A
M
Cities can access these funds through cooperation in the national programming process:
Cool Earth Partnership (Japan)Environmental Transformation Fund—International Window (UK)International Climate Initiative (Germany)Climate and Forest Initiative (Norway)International Forest Carbon Initiative (Australia)Global Climate Change Alliance (European Commission) International Climate Change Adaptation Initiative (Australia)UNDP-Spain MDG Achievement Fund

OP
EN
ING
NE
W F
INA
NC
E O
PP
OR
TU
NIT
IES
FO
R C
ITIE
S
■
11
3
Examples of non-climate-specifi c support from donors and MDBs
Global Facility for Disaster Reduction and Recovery (GFDRR)
A Partnership within the UN International Strategy for Disaster Reduction (ISDR) initiative, focusing on building capacities to enhance disaster resilience and adaptive capacities in changing climate. About two-thirds of GFDRR’s assistance has primarily focused on climate change adaptation; that is more than US$27 million in nearly 90 countries worldwide. GFDRR support has leveraged an additional US$17 million of co-fi nanc-ing from development partners and greater amounts from World Bank investments. The GFDRR Technical Assistance Fund is global, established through contributions of GFDRR partners into a multi-donor trust fund. The Callable Fund is a fund-in-readiness to be activated when disaster strikes. This multi-donor trust fund provides an innovative approach in that donors enter into an agreement with the World Bank before a natural disaster to support the Callable Fund; however, actual funds are mobilized after a natural disaster through a Call for Funds.
International Development Association (IDA)World Bank core concessional loans for low-income countries
A(M)
To be developed as part of national initiatives and with national authorities:– Development policy operations to build resilience into city budgets– Adaptation at city level– Mitigation at city level
IBRD, MDB, and bilateral core funds
AM
Stand-alone or in combination with climate-specifi c funds city-based adaptation and mitigation as part of national programs and with national authorities.
Trust funds and partnerships; guarantees
MA
Grant fi nancing for knowledge products, capacity building, upstream project work/pilots; partial risk guar-antees to support development, adoption, and application of clean-energy technologies, including those not fully commercialized, in client countries.
Climate insurance productsWorld Bank Treasury, etc., fee-based or donor supported
ARisk fi nancing strategy developmentMultiCAT products with cities with parameter-based triggersCAT swaps for extreme fl ood risk, etc.Multicity insurance products for risk sharing and lower cost
(continued next page)

11
4
■
CL
IMA
TE
CH
AN
GE
, DIS
AS
TE
R R
ISK
, AN
D T
HE
UR
BA
N P
OO
R
TABLE 4.3 continued
Climate bondsWorld Bank Treasury, etc., fee-based or donor supported
MA
Bonds against city CERs or NAMAsAdvice on monetizing carbon bonds
Public-private partnerships World Bank Public-Private Infrastructure Advisory Facility (PPIAF) or similar schemes can provide technical assistance and match-making in planning and making operational urban NAMAs by improving an enabling environment and strategic public intervention conducive to long-term private-sector commitment.
Private sector IFC and other MDB private-sector arms can provide technical assistance and fi nancial support to investors in climate-resilient infrastructure or low-carbon technologies through a combination of risk management and other concessional instruments, bringing the cost to a level attractive for long-term private investment.
Source: www.climatefi nanceoptions.org.
Note: A = Adaptation; M = Mitigation; UNFCCC = United Nations Framework Convention on Climate Change.

OPENING NEW FINANCE OPPORTUNITIES FOR CITIES ■ 115
Convention on Climate Change (UNFCCC). Registered projects resulting in
GHG emission reductions located in develop ing countries or economies in
transition obtain certifi ed emission reductions (CERs) that can be traded in the
market, thereby providing a performance-based revenue stream to the project.
Th e World Bank’s Carbon Partnership Facility can support cities in improving
their overall market readiness, in developing emissions-trading projects, and in
acquiring CERs for the market CDM methodologies cover 15 sectors, includ-
ing waste, energy, and transport, which cover many typical projects in cities.
For cities with limited budgets, carbon fi nance can help justify the eff ort of
coordinating with various stakeholders (including their own departments) and
help deal with the higher cost of choosing a lower-emission technology. More-
over, carbon-fi nance revenues can be directed for pro-poor objectives, such as
investments to build resilience in poor urban areas. One illustration is the case of
São Paulo, highlighted in box 4.4.
Th e citywide approach to carbon fi nance is designed to help cities over-
come some of the barriers to CDM projects at the city level, including small
projects and high transaction costs. Typical projects in cities, except for waste-
management projects in large cities, yield small volumes of CERs. Furthermore,
repeated clearances are needed from the same city for diff erent projects—which
can be time consuming and cumbersome. Clear and standardized baselines for
GHG emis sions are a prerequisite for this citywide approach. Th e World Bank
has piloted this approach in Amman, Jordan, and endorsement from national
governments was obtained in a Decision of the Parties at COP-16 in Cancun
in December 2010. Approval by the CDM Executive Board was pending at the
time of writing.
Other market-related instruments for carbon include city-based emissions
trading systems (ETSs, see box 4.5) and carbon-linked bonds. Th e World Bank is
currently working in two middle-income countries on new carbon-linked bonds
that would contribute to fi nancing a program of emissions-reduction projects.
Such bonds could be issued through diff erent structures in which the World
Bank helps to select the best fi nancial fi rms as partners and reaches out to inves-
tors interested in emissions-reduction projects. City governments with energy-
effi ciency projects that could generate fl ows of measurable GHG abatement over
time, potentially eligible for the CDM or for future ETSs, could obtain funding on
very attractive terms through such structures. Again, these funds could be used
for building resilience for the urban poor.
The Private Sector
Private companies—ranging from small businesses selling water through kiosks
or providing road maintenance to local and international operators with solid

116 ■ CLIMATE CHANGE, DISASTER RISK, AND THE URBAN POOR
expertise and substantial fi nancial resources—can play a key role in providing
infrastructure and services in urban areas. Developing effi cient public-private
partnerships (PPPs) that recognize the strengths of both the private and public
sectors is an important part of the solution. An enabling policy environment and
strategic investments through public funds can be designed to attract private funds.
Th e experience with PPPs for improving infrastructure and services in
urban slums has mainly been through components of larger projects that
BOX 4.4
Landfi ll Gas-to-Energy Projects in São Paulo
Through a public bidding process, the City of São Paulo gave a concession to the holding company Biogas to install thermoelectric power plants to burn biogases emitted by decaying waste from the Bandeirantes and São Joao landfi lls. This generates the equivalent of 7 percent of the electricity consumed in the city. Each facility now generates more than 175,000 MW/h, enough to supply power to 600,000 residents for 10 years. It is estimated that 11 million tons of CO2-equivalent will be abated by 2012.
Both landfi lls were approved as Clean Development Mechanism (CDM). According to the concession agreement, 100 percent of the energy and 50 percent of the carbon credits produced by the landfi lls belong to Biogas Co. to be traded in the market, while the City of São Paulo has the right to sell the other half of carbon credits at public auctions. In September 2007, the city held the fi rst auction, raising about US$18 million (at US$22 per ton) from the Bandeirantes landfi ll CERs generated between December 2003 and December 2006. A second auction, held in September 2008, offered CERs from both landfi lls and collected more than US$19 million (at US$28 per ton).
In addition to mitigating climate change, São Paulo’s projects to convert landfi ll gas to energy also aim to revitalize the surrounding low-income com-munities. In 2009, two public plazas, Cuitegi and Mogeiro, near the Ban-deirantes landfi ll, were inaugurated. Cuitegi Plaza has 2,300m² of leisure area, playgrounds, and seating. Minor road works were also completed to facilitate mobility within the local community. The Mogeiro Plaza has 6,897m² of leisure area and offers a walking path, exercise equipment, playground, seating, and community space.
Source: C40 Case Study.

OPENING NEW FINANCE OPPORTUNITIES FOR CITIES ■ 117
may include an entire utility (water, sewerage, electricity, transport) within
a certain city or region. Municipal governments may hire a private company
to extend the water and sanitation network to new parts of the city includ-
ing slum communities (a service contract). Or, they may include in a conces-
sion the commitment to extend service to certain slum communities, which
obliges the private company to recover the costs of service provision and ini-
tial investment from their customers, including the slum dwellers. In Port
Vila, Vanuatu, a concession contract successfully extended free potable water
to poor areas through cross subsidies from wealthier areas. In Manila, the
concessionaires Mayniland Water Services and Manila Water Company use a
variety of internal programs and partnerships with NGOs, community orga-
nizations, and small entrepreneurs to increase water distribution to slums.3
Municipalities have discovered that involving the private sector in public utili-
ties and works is not without its problems, but as cities continue to consider
public-private partnerships as ways to improve public services, service expan-
sion to slums can be brought to the negotiating table and integrated into PPP
contracts (box 4.6).4
BOX 4.5
Tokyo’s Emissions Trading System
Emissions trading is a market-based approach for addressing air pollution problems, also known as “cap-and-trade.” Emissions-trading schemes for greenhouse gases (GHGs) include the European Union’s ETS and the Regional Greenhouse Gas Initiative in the northeastern United States. At the city-level, however, ETSs in cities such as Chicago, Los Angeles, and Santiago de Chile have the primary objective of improving air quality, where some of the air pol-lutants covered also are GHGs.
The world’s fi rst city-level carbon dioxide (CO2) cap-and-trade program, with the primary objective of mitigating climate change, was launched in Tokyo in April 2010. Tokyo’s ETS covers energy-related CO2, involving around 1,340 large installations including industrial factories, public facilities, educational institutions, and commercial buildings. With this ETS, the Tokyo Metropolitan Government aims to reduce CO2 emissions by at least 6 percent during the fi rst compliance period (2010–2014), with the ultimate goal of a 25 percent reduction below 2000 levels by 2020.
Source: World Bank.

118 ■ CLIMATE CHANGE, DISASTER RISK, AND THE URBAN POOR
BOX 4.6
Getting Private Water Utilities into Slums: Metro Manila Water Concessions
Metro Manila’s water authority was privatized in 1997 with the intention of solv-ing problems of ineffi ciency and fi nancial shortfalls. Two 25-year concession contracts were signed, one with Manila Water Company (composed of Ayala and International Water) to cover the eastern zone of the city and a second with Maynilad Water Services (Benpres and Ondeo) to cover the western zone. Both concessionaires are required to expand service coverage to between 77 percent and 87 percent by 2001 and between 95 percent and 98 percent by 2021. To achieve this, both companies have had to devise strategies to profi t-ably extend water services to slums.
Although the concession agreement allows for the installation of one public standpipe per 475 people in depressed areas, both companies have worked to establish other types of connections that bring water closer to people’s homes and ensure greater revenue for the companies. Manila Water has intro-duced group taps for two to fi ve households to share a single connection registration and water bill. The company has also introduced community-managed water connections in which a community association is responsible for a master meter and installs and manages a distribution network to blocks or individuals. Manila Water also permits private companies to buy water for resale through private distribution networks, which the contractor must take responsibility for maintaining.
Maynilad has actively sought out partnerships with NGOs to extend indi-vidual household connections, preferred by customers in all income groups, to slums. Its Bayan Tubig (Water for the Community) program waives the land-title requirement in slums and integrates payment of the connection fee into the fi rst 6, 12, or 24 monthly water bills. NGOs, such as the Swiss chapter of Médecins San Frontières and the local LINGAP Foundation in Malabon, get communities involved to support ownership of the program through information, education, and community campaigns and assistance to the poorest families through microfi nance. Maynilad additionally will con-tract with community-based associations to provide billing and collection services, which further localizes value creation in household water provision.
(continued next page)
OPENING NEW FINANCE OPPORTUNITIES FOR CITIES ■ 119
In several cities in India, capital has been mobilized for slum improvements
through credit guarantees and bonds (Baker and McClain 2009). In India, the
Ahmedabad Municipal Corporation issued the fi rst municipal bond in 1998
without a central government guarantee for the purpose of fi nancing a citywide
water and sanitation project that included many slum areas and the Slum Net-
working Project “Parivartan.” In 2005, municipal governments around Bangalore
built on Ahmedabad’s success with a bond issue called the Greater Bangalore
Water and Sanitation Pooled Facility that combined the commitments of eight
city governments. In both cases, the success of the bond sales depended on the
municipal governments’ having previously demonstrated a revenue surplus and
received a suffi ciently high credit-rating to ensure an interest rate in line with the
government’s projections of future ability to pay, among other conditions. Th e
ability of municipal governments to mobilize domestic capital greatly enhances
the scale at which municipal governments can engage in development. Ahmed-
abad’s four municipal bond issues raised $89.5 million between 1998 and 2006.
Th e Greater Bangalore Facility raised over $23 million, with the assistance of a
$780,000 partial credit guarantee from USAID, essentially mobilizing over $29 in
domestic capital for every dollar donated (Painter 2006, 19–20).
At the household level, the urban poor use microfi nance particularly for pur-
chasing and improving houses, which oft en contribute to resilience. Housing
microfi nance typically comprises small loans (from $550 to $5,000) of limited
maturing (6 months to 3 years), generally without collateral (Freire, forthcom-
ing). A number of commercial banks, fi nancial cooperatives, and NGOs special-
ize in microfi nance for low-income residents. Mibanco, for example, is one of the
BOX 4.6 continued
The companies have enhanced their image and have decreased non-rev-enue water through formalizing water provision arrangements in slums where many people had been receiving water through illegal connections and public standpipes. Through their contract with the local government and their part-nerships with NGOs and community associations, these two private water utilities are promoting access to safe, reliable potable water in the poorest areas in Metro Manila.
Sources: Baker and McClain (2009), based on Weitz and Franceys (2002). See also Franceys and Weitz (2003).

120 ■ CLIMATE CHANGE, DISASTER RISK, AND THE URBAN POOR
largest microfi nance institutions in Latin America, with 70,000 active borrowers,
and Grameen Bank in Bangladesh has delivered 600,000 housing loans since it
was established. In general, all of these institutions show performance rates above
housing loans in the banking industry (Biswas 2003). A further application of
microfi nance is the Local Development Program (PRODEL) in Nicaragua, which
lends to community groups for small infrastructure projects.
Initiatives at the community level focus on fi nance for housing and infra-
structure, which are growing in signifi cance. Th ese funds involve savings at the
community level, which are leveraged to access funds from national government
donors. For example, the Jamii Bora Trust Low Cost Housing Scheme in Kenya
raised funds through members’ savings, market fi nance, and donations to pur-
chase 293 acres of private land and to construct houses. Members then fi nance
their housing units ($3,000) with loans from the trust at about $45 per month.
Monthly fees of $7 are charged for maintenance (UN-HABITAT). Other exam-
ples exist in Cambodia, Th ailand, the Philippines, and India.
Results-based Financing
Results-based fi nancing (RBF) is an umbrella term for mechanisms that disburse
funds only aft er pre-set results have been achieved. Disbursements are normally
made on the basis of independent verifi cation of these results. Th is has the eff ect
of transferring performance risk from the subsidy provider to the service pro-
vider, thus improving the likelihood that desired results are achieved. RBF is rel-
evant at two levels: the investment level and the consumer level.
At the level of the investment, RBF can be thought of as results-based viabil-
ity gap funding. Such payments depend on there being suffi cient pre-fi nancing
capability. Pre-agreed results must be specifi c enough to be verifi able. Th is should
lead to transparent and more eff ective use of subsidy funds. Diff erent stages of
delivering the desired service—such as fi nancial closure of projects, initial works,
completion of works, and delivery of performance—can all be verifi ed and lead
to payments.
For the consumer, results-based payments focused on delivering basic services
to low-income individuals are termed output-based aid (OBA). OBA is normally
designed to support the upfront costs of delivering basic and reliable services to
the poor. Examples include electricity and water connections. Operating costs are
normally not subsidized, and are expected to be aff ordable to the consumer to
ensure sustainability of the investment. Th e level of subsidies, delivered aft er the
“output” has been verifi ed, is normally set based on unit costing from indepen-
dent experts. Th e costs could also be set using competitive bidding. Th e objective
of this costing is to determine the “effi cient” cost. Th e actual level of subsidy is
then set aft er taking into account household aff ordability.

OPENING NEW FINANCE OPPORTUNITIES FOR CITIES ■ 121
In low-income communities in western Jakarta, an arrangement developed
through the Global Partnership on Output Based Aid (GPOBA), the city gov-
ernment, and the local water utility, PALYJA, subsidizes the cost of water-supply
connections for almost 12,000 households in poor areas, including 2,200 in infor-
mal settlements where PALYJA had previously not been authorized to provide
services (Menzies and Setiono 2010). Concessionaires are given grants for the
cost of installing connections to the networks, provisional on two measureable
outputs—the provision of a working household connection, and the delivery of
acceptable service for three months. While the project has faced some diffi cult
challenges in implementation related to water availability, and problems dealing
with existing informal water suppliers, these eventually were resolved, with the
help of the NGO Mercy Corps, paving the way for further expansion to other
communities.
Bringing It All Together
Sustainable fi nancing for climate change, disaster risk, and the urban poor in cit-
ies will need to draw on all available resources, as well as maximize synergies
and complementarities. An effi cient combination of resources from the instru-
ments described above can leverage public and private sources while ensuring
signifi cant co-benefi ts. Combinations of fi nancial instruments will be needed,
with approaches customized to address specifi c needs, risks, or barriers, while
also reducing transaction costs.
Since most international funds for addressing adaptation and mitigation are
channeled through national implementing entities, cities have extensive scope
to access such funds through national processes (see annex 1), but modalities
for more direct access need to be considered. One approach to facilitating access
would be allowing cities to access such fi nancing through a more unifi ed “win-
dow,” which would reduce overhead and administrative complexity. Such an
approach could bring together many of the existing resources that are available
and draw on some innovative instruments, such as green bonds for cities and
results-based fi nancing for basic services. With regard to climate support alone,
the World Bank off ers more than 30 potential programs, including for capacity
building and technical assistance, as well as funding initiatives.
To encourage cities to achieve specifi ed targets, such a program could con-
sider a more standardized approach to benchmarking and monitoring through
metrics commonly agreed upon by the international community, such as a city-
level GHG index, urban risk assessments, or Local Resilience Action Plans. By
meeting specifi ed targets, cities would then be eligible for accessing such fi nanc-
ing through the designated window.

122 ■ CLIMATE CHANGE, DISASTER RISK, AND THE URBAN POOR
In conclusion, this study has pointed to the many challenges for cities and resi-
dents around the world as they confront the risks associated with climate change
and natural hazards. While the risks have direct and indirect impacts for all urban
residents, those at the bottom of the income distribution face the greatest chal-
lenges, oft en on a daily basis. Understanding these risks is an important fi rst step
to addressing them, as has been demonstrated in Dar es Salaam, Jakarta, Mexico
City, São Paulo, and elsewhere. Th e study has pointed to broad actions that can
respond to the risks identifi ed and help to build resilience for the urban poor.
Such actions will require strong commitments from local governments, along
with national and international partners. In implementing such actions, benefi ts
will be realized not only by the urban poor, but also by future generations.
Notes
1. http://www.climatefi nanceoptions.org.
2. http://web.worldbank.org/WBSITE/EXTERNAL/COUNTRIES/LACEXT/EXTLACP
ROJECTSRESULTS/0,,contentMDK:227 42596~pagePK:51456561~piPK:51456127~
theSitePK:3177341,00.html.
3. See Weitz and Franceys (2002), pp. 50–61, for further description of these public-
private partnerships, and the full publication for a broader selection of examples.
4. See Weitz and Franceys (2002). See Mehta (1999) for issues related to integrating ser-
vice provision to the poor into commercially viable projects.
References
Baker and McClain. 2009. “Private Sector Initiatives in Slum Upgrading.” Urban Paper
No. 8, World Bank, Washington, DC.
Biswas, Smita. 2003. “Housing Is a Productive Asset—Housing Finance for Self-Employed
Women in India.” Small Enterprise Development 14 (1): 49–55.
Economics of Climate Adaptation (ECA) Working Group. 2010. Shaping Climate-Resilient
Development: A Framework for Decision-Making.
European Environment Agency. 2007. Climate Change: Th e Cost of Inaction and the Cost
of Adaptation. Copenhagen.
Franceys, Richard, and Almud Weitz. 2003. “Public-Private Community Partnerships in
Infrastructure for the Poor.” Journal of International Development 15: 1092–94
Freire, M. Forthcoming. “Financing Urban Upgrading.” In Metropolitan Government
Finances in Developing Countries, ed. R. Bahl, J. Linn, and D. Wetzel. Lincoln Institute
of Land Policy.
Huhtala, Ari, 2010, Climate Finance for Cities, Mimeo.
International Federation of Red Cross and Red Crescent Societies (IFRC). 2010. World
Disasters Report: Focus on Urban Risk. Geneva: IFRC.

OPENING NEW FINANCE OPPORTUNITIES FOR CITIES ■ 123
Mehta, Meera. 1999. “Balancing Commercial Viability with the Needs of the Poor in
the Development of Urban Water Supply and Sewerage Projects,” Project Notes 14.
USAID Indo-U.S. Financial Institutions Reform and Expansion Project—Debt
Market Component FIRE(D), January. http://www.niua.org/indiaurbaninfo/fi re-D/
ProjectNo.14.pdf.
Menzies, I., and I. Setiono. 2010. “Output-Based Aid in Indonesia: Improved Access to
Water Services for Poor Households in Western Jakarta.” GPOBA Approaches Note.
Washington, D.C.
Painter, D. 2006, “Scaling up Slum Improvement: Engaging Slum Dwellers and the Private
Sector to Finance a Better Future.” Paper presented at the World Urban Forum III,
June.
Smolka, Martin O., and Adriana de A. Larangeira. 2008. “Informality and Poverty in
Latin American Urban Policies.” In Th e New Global Frontier: Cities, Poverty and
Environment in the 21st Century, ed. George Martine, Gordon McGranahan, Mark
Montgomery, and R. Castilla-Fernandez, 99–114. London: IIED/UNFPA and
Earthscan Publications.
Velasquez Barrero, Luz Stella. 2010. “La Gestion del Riesgo en el Contexto Ambiental
Urbano Local: Un Reto Permanente y Compartido. Caso Manizales, Colombia.”
Background paper prepared for the 2011 Global Assessment Report on Disaster Risk
Reduction.
Weitz, Almud, and Richard Franceys, eds. 2002. Beyond Boundaries: Extending Services
to the Urban Poor. Asian Development Bank, August, 50–61. http://www.adb.org/
documents/books/beyond_boundaries/beyond_ boundaries.pdf.
World Bank. 2010a. Africa’s Infrastructure—A Time for Transformation. Washington, DC:
World Bank.
———. 2010b. Climate Risks and Adaptation in Asian Coastal Megacities: A Synthesis
Report. Washington, DC: World Bank.
———. 2010c. Making the Most of Public Finance for Climate Action—Th e World Bank
Group at Work. Development, Climate, and Finance Issues Brief 3. Washington, DC:
World Bank.
———. 2010d. World Bank Urban Strategy. Washington, DC: World Bank.
———. 2011e. Climate Change Adaptation and Natural Disaster Preparedness in the Coastal
Cities of North Africa.Washington, DC: World Bank.
World Watch Institute. 2007. State of the World 2007: Our Urban Future. New York:
Norton.


■ 125
Annex 1: Literature Review
Over the past two decades, signifi cant research has been carried out on the
topics of climate change, disaster risk management, urbanization, and poverty.
Although analysis of the inter-linkages among all four of these areas is limited,
signs suggest this may be changing. Climate change and disaster risk reduction
are increasingly better linked and the impacts of climate change and disasters on
the urban poor is gaining prominence. As the frequency and intensity of disasters
related to climate change increase, the international development community
and policy makers, in particular, are recognizing the importance of identifying
the specifi c vulnerabilities of subgroups within the population to tailor interven-
tions that will help groups cope.
Across the world, the poor disproportionately bear the brunt of changing
weather patterns and natural disasters. Th ey lack adaptive capacity to cope with
climate change. Urbanization exacerbates these problems. Cities, overburdened
with rapidly expanding populations, are grappling with limited infrastructure
and funds, unable to provide decent housing and basic health and welfare ser-
vices to all residents. Th e urban poor end up more directly exposed to natural
hazards as compared to their wealthy counterparts.
Some of the essential foundation documents on the subject of climate
change and disasters with some reference to urbanization and poverty (though
not necessarily in conjunction with each other) include the Inter-Governmental
Panel on Climate Change (IPCC) Assessment Reports, the World Bank’s World
Development Report 2010: Development and Climate Change, the World Watch

126 ■ CLIMATE CHANGE, DISASTER RISK, AND THE URBAN POOR
Institute’s State of the World: Our Urban Future (2007) and Pro-Poor Adaptation
to Climate Change in Urban Centers (Moser et al. 2010).
Th e IPCC’s Fourth Assessment report is a good starting point, since it assesses
recent published literature on climate change. While the IPCC report provides
the most comprehensive data on climate change, the historic focus of the IPCC
has been around the science of climate change. In this regard the IPCC report
is an important source of established terminology and climate change defi ni-
tions, which are followed in this study, especially for confi ning the concepts of
vulnerability, exposure, sensitivity, and adaptive capacity. In its Fourth Assess-
ment Report (IPCC 2007) Working Group II, Chapter 7, titled “Industry, Settle-
ments and Society,” deals with issues related to industry, services, and fi nancial
and social concerns that raise the vulnerability of human settlements (not only
those living in cities) to climate change. Th e chapter concludes that research on
vulnerabilities and adaptation potentials of human systems has lagged behind
research on physical environmental systems, ecological impacts and mitigation,
uncertainties dominate the subject matter of this chapter. Urbanization and pov-
erty frequently come up in the discussion—as non-climate stresses that amplify
the risks that people face from the eff ect of climate change. Th e report warns that
the poor living in informal settlements such as slums, especially in developing
countries, are the most likely to be killed or harmed by extreme weather.
IPCC (2007) Chapter 8, “Human Health,” also discusses the impact of cli-
mate change on the health of the urban poor. With “high confi dence,” the IPCC
asserts that the urban poor are at greater risk of suff ering adverse health impacts
related to climate change, along with women, children, and the elderly. It also
reminds readers of the Th ird Assessment Report’s (IPCC 2001) conclusion that
“an increase in the frequency or intensity of heat waves will increase the risk of
mortality and morbidity, principally in older age groups and among the urban
poor.” Th e IPCC’s Fift h Assessment Report, due in 2011, is expected to deal more
extensively with the impact of climate change on urbanization and development.
It is unclear, however, to what extent the report will highlight these issues through
the lens of the urban poor.
Th e World Bank’s thorough World Development Report 2010: Development
and Climate Change (WDR 2010) looks at development and climate change
from a variety of aspects, including climate change and human vulnerability. Th is
includes a review of adaptation and mitigation priorities in developing coun-
tries, impacts of extreme weather, the challenge of coastal cities, and the costs
of mitigation and adaptation. Th e WDR 2010 also addresses the link between
climate change and urbanization, along with the associated vulnerability of the
urban poor. Several issues are highlighted. Well-planned urbanization can be
highly eff ective in addressing both adaptation and mitigation of climate change,
but unplanned urbanization can increase the vulnerability of the urban poor.

ANNEX 1: LITERATURE REVIEW ■ 127
Informal settlements are already particularly vulnerable to fl ooding, oft en due
to clogged drains, land subsidence, heat waves, and increased health risks. Th e
WDR includes much more detailed analysis of climate change risks, extreme
events, climate fi nance, and related issues, but not specifi cally in the context of
urban poverty.
Th e World Watch Institute’s State of the World: Our Urban Future (2007)
documents good practices on how cities build and manage their infrastructure
and service delivery mechanisms to cope with climate change. Th e report does
not focus specifi cally on the urban poor but many of its case studies on pro-
viding clean water and sanitation, transport, energy, and health narrate their
stories as well.
One topic receiving a lot of attention in climate-change literature relates to
adaptation and its impact on poverty reduction and development. Scholars
increasingly acknowledge that adaptation measures that take into account the
poor can play a role in reducing poverty and make development truly sustainable.
One of most frequently cited works on pro-poor adaptation in cities is by Moser
et al. (2008). It examines the role of assets, including “natural, physical, social,
fi nancial and human capital” (Mearns and Norton 2010), in increasing the adap-
tive capacity of the urban poor. Moser describes three reasons why household
assets are crucial to helping poor urban dwellers adapt to climate change. For one,
city authorities may not be able to provide them with infrastructure or services
due to fi nancial limitations. Conversely, many city authorities may be reluctant to
work with the poor, especially within informal settlements. And fi nally, improv-
ing the assets of the poor increases the likelihood that they could hold local gov-
ernments accountable for providing services. Moser et al. (2008) have developed
a framework to map asset vulnerability and identify interventions to address
the vulnerability of the urban poor. Th ese interventions could be at three levels:
household and neighbor hood; municipal or city; and regional and national. Th is
framework could be useful in reducing social and urban vulnerability in adapting
to climate change, but it has found few takers so far.
Other prominent works relevant for this study—which are not as comprehen-
sive as those discussed above but instead focus on more specifi c issues—include
the World Bank’s Social Dimensions of Climate Change (Mearns and Norton
2010) and Adapting to Climate Change in Eastern Europe and Central Asia (Fay
et al. 2010), and publications by the Global Facility for Disaster Risk Reduction
and Poverty (Kreimer and Arnold 2000; Kreimer et al. 2003; among others).
Also relevant to this report are the Global Assessment Report on Disaster Risk
Reduction (ISDR 2009), the United Nations Development Programme’s Human
Development Report (2007), and Poverty and Climate Change: Reducing Vul-
nerability of the Poor through Adaptation (2009), a collaborative eff ort between
the African Development Bank, Department for International Development,

128 ■ CLIMATE CHANGE, DISASTER RISK, AND THE URBAN POOR
Organisation for Economic Co-operation and Development, United Nations,
and World Bank. A compilation of papers on climate change and urban poverty
is available in Adapting Cities to Climate Change (Bicknell, Dodman, and Sat-
terthwaite, 2010) published by the International Institute for Environment and
Development, an organization that has done a great deal of macro-level work on
the intersection of urban vulnerability and climate change. Mehrotra et al. (2010),
Sanchez-Rodriguez (2009), and Juneja (2008) provide useful reviews of relevant
literature on the climate risks that cities face, adaptation, and the risk linkage
between poverty and disasters, respectively.
Linking Climate Change and DRR
Disaster risk reduction (DRR) and climate change adaptation have many overlap-
ping concerns, and are interrelated issues for cities. Th e impacts of climate change
will include increased frequency and severity of natural disasters, so the needs for
climate change adaptation in this regard correspond with those of disaster risk
reduction (Prasad et al., 2008). Climate change adaptation covers a larger scope
than DRR in also accounting for the eff ects of incremental, gradual changes in
climate. Moser et al. (2008) also highlight the need for climate change adapta-
tion to consider not only changes that fall under disaster risk reduction (fl ooding
and other natural disasters) but also important incremental and gradual changes,
such as the rise in sea level. As noted above, some authors have noted the diff er-
ences between climate change adaptation and DRR, but relatively little literature
thoroughly acknowledges the synergies of climate change adaptation and DRR. A
more careful documentation of these synergies would help maximize the effi cacy
of both climate change adaptation and DRR projects for the urban poor.
Climate change and disaster risk reduction are more divergent in terms of
mitigation. Both climate change and DRR have developed diff ering meanings
for “mitigation.” Climate change mitigation refers to reducing GHG emissions,
while in DRR literature, mitigation refers to limiting the adverse impacts of natu-
ral disasters. Other sources that discuss the diff erences and similarities between
DRR and climate change include Birkmann et al. (2009), WDR (2010), and
O’Brien et al. (2006).
Climate Change, DRR, and Urban Poverty
In existing literature, the link between climate change and urban poverty is
explored less than between disasters and urban poverty. Th is, too, is a fairly
recent development. In 2000, the World Bank’s Managing Disaster Risk in

ANNEX 1: LITERATURE REVIEW ■ 129
Emerging Economies (Kreimer and Arnold 2000) concluded that a major devel-
opment imperative was to reduce disasters in order to reduce poverty, since
“poverty plays a big role in keeping people vulnerable to disasters.” Following
this, more documents emphasizing the link between disaster and poverty have
been published (DFID’s Disaster Risk Reduction: A Development Concern, 2004;
World Bank’s Hazards of Nature, Risks to Development, 2006). Yet, analytical
literature on the exact links and nature of problems faced by the urban poor due
to climate change and disasters is scarce.
Th ere is general consensus, however, that the poor are vulnerable because
they lack basic safety and protection from physical harm. Spatial analysis tech-
niques have revealed that the poor in urban areas tend to live in low-income
settlements that are highly vulnerable to disasters (Pillai et al. 2010; Hoff man
2009; Lall and Deichmann, 2009). More crucially, the urban poor have limited
access to basic services such as drinking water, sanitation, drainage, solid-waste
management, transport, food and energy security, and health, among other
welfare services.
Service Delivery and the Urban Poor
Lack of access to basic services, such as clean water, sanitation, drainage, and
health services, makes the urban poor more vulnerable to climate change and
natural disasters. Most published research acknowledges that basic services
should be provided to improve the living conditions of the urban poor, and that
lack of access to these services increases the vulnerability of the urban poor (for
example, Baker 2008). However, there is a major gap in sector-specifi c analysis of
services such as water, drainage, sanitation, energy, roads, transport, and health
for the poor living in cities.
Of all basic services, water, sanitation, and drainage have received more atten-
tion in the context of climate change adaptation and disasters because of their
direct bearing on human health, the second most popular research subject. Ineq-
uity in access to clean drinking water, sanitation, and effi cient drainage services
are reinforced in nearly all publications. For instance, State of the World: Our
Urban Future (World Watch 2007) reported that the poor in most developing
countries are deprived of essential water services, even where there was no water
shortage per se.
Most scholars attribute this to poor governance rampant in developing
countries. In a study of African towns and cities, Douglas et al. (2008) found
that the frequency of fl ooding had increased—not because of increased rain-
fall, but inadequate and clogged drainage. Parikh and Parikh (2009) found that
most slums in Indore, India, were located along natural paths of water channels

130 ■ CLIMATE CHANGE, DISASTER RISK, AND THE URBAN POOR
and drainages neglected by local authorities. Th e World Bank’s World Develop-
ment Report 2004: Making Services Work for Poor People raised the question of
accountability of providers and policy makers in water and sanitation services
to the poor living in cities. Th e report concluded that patronage, “the compact
between the politician and provider,” renders poor citizens powerless and pro-
viders should be made more accountable for their services to the public instead
of being shielded by policy makers.
Another area of research receiving attention at the World Bank and the wider
research community focuses on providing solutions to water and related service
delivery problems in urban areas. Danilenko et al. (2010) provide analytical and
strategic guidance to the world regions for incorporating water-related adapta-
tion to climate change in their work programs. Community-driven development
interventions are also being proposed. Parkinson and Mark (2005) and Parikh
(2009) found that in India, civic authorities successfully established “slum net-
works” with residents in many informal settlements in order to build drainage
channels.
Health services are another area that adaptation planners focus on. With the
privatization of health care in many cities across developing countries, access
to emergency and basic health care is becoming more inaccessible for the poor
(Montgomery 2009). Th e IPCC (2007) warns, for example, that access to cheap,
eff ective anti-malarials, insecticide-treated bed nets, and indoor spray programs
will be important for future trends in malaria. Some major documents that link
the vulnerability of the urban poor to poor health services include: IPCC’s Fourth
Assessment Report Working Group II, Chapter 8, “Human Health” (2007); the
World Health Organization’s Protecting Health from Climate Change (2009); and
Kovats and Akhtar (2008).
Th e rest of the basic services haven’t been examined in as much detail. Th e
IPCC’s Fourth Assessment Report Working Group III, Chapter 10 (2007), is the
most widely cited on solid-waste management (along with Douglas et al. 2008;
Wilson 2007; Kebede and Dube 2004). On energy services, some key sources
include the IPCC’s Fourth Assessment Report Working Group III, Chapter 4,
2007; Fay et al. 2010; Haines et al. 2007; State of the World: Our Urban Future
(World Watch Institute 2007; World Bank 2006.)
Also, little literature addresses how limited access to roads aff ects the poor in
the context of climate change and DRR. In terms of transport and urban poverty,
the key documents include Baker et al. (2005) and the World Bank’s Cities on the
Move (2002). On the subject of climate change and urban transport, the major
reports include IPCC’s Fourth Assessment Report Working Group III, Chapter
5 (2007); World Bank’s World Development Report 2009; and the World Business
Council for Sustainable Development’s Mobility 2001 (2002) and Mobility 2030
(2004). At the Urban Research Symposium in 2009, Olvera (2009) presented

ANNEX 1: LITERATURE REVIEW ■ 131
research on the importance of urban transport for the poor in reducing vulner-
ability associated with climate change.
Signifi cantly, a lot of the services literature attributes poor service delivery to
neglect and poor urban governance (Global Assessment Report on Disaster Risk
Reduction (ISDR 2009); Sattherthwaite et al. 2007; Lewis and Mioch 2005).
Housing
In most developing countries, the urban poor tend to live in low-cost housing or
slum settlements located on the fringes of the city or in environmentally hazard-
ous areas. Th e World Bank has published major documents on the topic: Cli-
mate Risks and Adaptation in Asian Coastal Mega-Cities (Pillai et al. 2010); Safer
Homes, Stronger Communities (Jha 2010); Density and Disasters (Lall and Deich-
mann 2009); Spatial Analysis of Natural Hazard and Climate Change Risks in Peri-
urban Expansion Areas of Dakar, Senegal (Hoff man 2009); and Natural Disaster
Hotspots: A Global Risk Analysis (Dilley et al. 2005). Some other commonly cited
works include Moser et al. (2008); Bicknell, Dodman, and Satterthwaite (2009);
UN-HABITAT’S State of the World’s Cities (2008–09); World Watch Institute’s
State of the World: Our Urban Future (2007); Yusuf and Francisco (2009); Nich-
olls et al. (2007); Peduzzi, Dao, and Herold (2005); Pelling (2003); and Hardoy,
Mitlin, and Satterthwaite (2001).
Apart from location, other aspects related to housing have recently gained
attention in the context of the urban poor, climate change, and DRR in devel-
oping countries: quality (Kenny 2009; Sezen et al. 2002; Ruskulis 2002; Lewis
2003); access to credit markets (Moser et al. 2008); and tenure security (Moser
et al. 2008; Lall et al. 2004; Wamsler 2007). Th is is signifi cant, since most of
the existing research addresses developed countries (Bin et al. 2008 and 2004;
Kerry Smith et al. 2006; Nakagawa, Saito, and Yamaga 2007; Greenstone and
Gallagher 2008).
In 2005, the World Bank’s Natural Disaster Hotspots: A Global Risk Analysis
concluded that global data for assessing disaster risks for urban areas is suffi -
ciently well-developed. Indeed, social scientists have a lot of data (though most
of it focuses on coastal cities) that shows that some cities are more hazard-prone
than others (Pillai et al. 2010; Lall and Deichmann 2009; Bicknell, Dodman, and
Satterthwaite 2009World Bank 2005). UN-HABITAT’S State of the World’s Cities
(2008–09) reports a study by the Centre for Urban Studies, Bangladesh (2005)
which shows that slum settlements in Dhaka are already most vulnerable during
cyclones and heavy rainfall. Climate change and rising sea levels would make
these areas more vulnerable to fl ooding, but they would also aff ect the city’s non-
slum areas. A recent study by the World Bank (Pillai et al. 2010) is unique in that

132 ■ CLIMATE CHANGE, DISASTER RISK, AND THE URBAN POOR
it examines specifi c areas inhabited by the poor within three “hotspot” cities—
Ho Chi Minh City, Bangkok, and Manila.
Many studies have also attempted to explain why the poor continue to live in
hazard-prone areas despite knowing that they are at risk—reasons being prox-
imity to the workplace and unaff ordable local transport networks. Th e disaster-
proneness of their housing is, in turn, refl ected in its low pricing and maintenance
(Lall, Lundberg, and Shalizi 2008; Bin et al. 2004, 2008).
It would be a mistake, however, to conclude that the poor are helpless vic-
tims, unable to fend for themselves. In her study in San Salvador, Wamsler (2006,
2007) found that the slum dwellers she interviewed spent nearly 10 percent of
their income on activities, like construction, related to disaster risk reduction.
Wamsler concluded that vast diff erences exist in urban coping strategies that are
not fully understood by the development community—which, she says, has so far
focused on the rural poor. She also argues that urban coping strategies are more
focused on housing construction and land issues than rural coping strategies.
Th is needs to be explored further.
A study that raises important questions for city planners was done by Jollands
et al. (2005) in Hamilton City, New Zealand. Th e study found that the city’s infra-
structure systems were not very responsive to gradual climate change, such as
heat waves and drought. Th is was because the main potential vulnerability to
climate change of the built environment has traditionally been associated with
extreme events, such as fl oods and storms. However, as the large death toll fol-
lowing Europe’s 2003 heat wave demonstrated that gradual climate change can
be as dangerous and life-threatening as sudden disasters and deserves as much
attention.
To conclude, the linkage of housing to climate change and DRR did not
receive much attention in until very recently, especially in the context of develop-
ing countries. As a result, the published research has major gaps, even on basic
details such as how many poor people living in cities face environmental risks
as compared to the non-poor living in the same city or as compared to rural
populations. A thorough examination of housing issues faced by the urban poor
through the lens of climate change and DRR is required to gain knowledge of the
specifi c challenges faced by the poor as a result of changing climate patterns and
frequent extreme weather. Such an examination will also help lead to possible
solutions to address the development challenges posed by climate change.
Climate Change: Adaptation and Mitigation
Many reports already recognize that climate change adaptation is more
urgent and fair than mitigation for cities in developing countries. Th e poor

ANNEX 1: LITERATURE REVIEW ■ 133
contribute least to greenhouse gas emissions but face the highest risks since
they tend to live in low-cost, hazardous areas in cities with little or no access
to basic services that could make them more resilient to extreme weather and
events like earthquakes and storm surges. Th us adaptation through basic ser-
vices provided by the government and increasingly public-private partner-
ships has earned most attention in the context of the urban poor and climate
change (Sattherthwaite 2009).
In some cases, the link between adaptation and basic services for the poor
is less direct. Instead, as in the case of transport and energy, there are potential
co-benefi ts for the urban poor in mitigation work in these sectors. For example,
public transit mitigation projects that provide sustainable, low-carbon means of
urban transport (if well planned) can signifi cantly improve access for the urban
poor. Th e World Bank is currently supporting climate-friendly urban public
transit projects in Mexico, Colombia, Egypt, Morocco, Philippines, Th ailand, and
Vietnam (World Bank 2010c). For energy, one of the greatest challenges is get-
ting energy services across to all urban residents. Access is defi ned as areas in the
electricity grid extension, with statistics oft en found to be misleading (State of the
World: Our Urban Future; World Watch Institute 2007). For instance, about one-
third of Africans live in urban areas, and at least one-quarter of city dwellers on
the continent do not have access to electricity. Researchers note that renewable
energy sources that mitigate climate change can be used to provide energy to the
urban poor. Prominent examples of this kind of work include fuel-effi cient cook
stoves and solar water heaters.
Th ere is a relatively large body of climate change adaptation literature related
to the urban poor. Many studies have recognized that the poor, and especially
the urban poor, are most vulnerable to climate change yet have limited adap-
tive capacity to take up adaptation. Th is literature includes Th e Cost to Develop-
ing Countries of Adapting to Climate Change (World Bank 2010a); Climate Risks
and Adaptation in Asian Coastal Mega-Cities (Pillai et al. 2010); Shaping Climate
Resilient Development—A Framework for Decision-making (ECA 2009); Adapting
Cities to Climate Change (Bicknell, Dodman, and Satterthwaite 2009); and Social
Dimensions of Climate Change (Mearns and Norton 2010).
One counterpoint to this view is Pro-Poor Adaptation to Climate Change in
Urban Centers (World Bank 2010b), which demonstrates that the urban poor are
currently and actively adapting to changes in weather, while acknowledging that
support for more substantial and long-term protective measures remains much
needed.
While adaptation and the urban poor are relatively well researched, mitiga-
tion and the urban poor is a topic on which less is available. Most mitigation
eff orts are focused on large GHG emitters, and the urban poor are among the
smallest GHG emitters. Th ere are important issues that relate to the urban poor

134 ■ CLIMATE CHANGE, DISASTER RISK, AND THE URBAN POOR
in mitigation, such as how urban transport mitigation projects will impact and
can benefi t the poor, as well as energy-effi cient housing. (See, for example, Our
Urban Future; World Watch Institute, 2007). Low-carbon cookstoves are another
area where mitigation is particularly important for the urban poor, who oft en
face negative health impacts associated with using cookstoves that emit black
carbon. Many projects have investigated low-carbon cookstoves that can reduce
GHG emission and improve the health of users over other stoves, yet still cook
effi ciently. For foundational information on mitigation, the study relies on the
comprehensive work of the IPCC report on mitigation and WDR 2010.
Finance
Th ere are many sources of information on climate fi nance. Among the main
studies are the well-known Stern Report (2007) on climate fi nance, which explic-
itly recognizes that climate change adaptation must reduce the vulnerability of
the urban poor, and United Nations Framework Convention on Climate Change
report on needed levels of climate fi nance. Th e World Bank has also done a study
on combining fi nancial instruments for low-carbon development (World Bank
2010c) and a major study on the economics of adaptation to climate change
(World Bank 2010a). Th e latter study consists of two parts: a global overview that
estimates adaptation costs at US$75-100 billion per year to adapt to 20C of warm-
ing by 2050, and country case studies of the costs of adaptation detailed by sector.
Two of the sectors with the highest anticipated adaptation costs are infrastructure
and water, which are also key issues for the urban poor. Th e World Bank recently
launched a climate fi nance website off ering a comprehensive list of climate fund-
ing sources for both adaptation and mitigation, including carbon fi nance, the
Global Environment Fund, CIFs, Special Climate Change Fund, Least Developed
Countries Fund, and Adaptation Fund.
Gaps in Existing Literature
As suggested in the review above, there are some major gaps in existing literature
on climate change, DRR, and the urban poor. Th ese include the following:
• Lack of detailed quantitative analysis from developing countries that disag-
gregates urban versus rural and poor versus non-poor.
• Lack of explicit connections between climate change and DRR for the urban
poor.
• Limited documentation of practical examples of best practices in climate
change adaptation for the urban poor.

ANNEX 1: LITERATURE REVIEW ■ 135
• Emphasis of most studies on natural disasters, with less attention on gradual
changes in weather induced by climate change, which have a less immediate
but more drastic long-term impact on human populations.
• Most analysis on climate impact assessments and cities being focused on
coastal cities, neglecting inland cities where, for instance, a heat-island eff ect,
cold waves, and droughts may be more pronounced.
• Limited literature on housing and sector-specifi c provision of services for the
urban poor in the context of climate change and DRR.
• Limited current knowledge on basic services and how they can help reduce
the vulnerability of the urban poor, especially in operational terms. Sample
topics include how better services can be provided to the poor, given climate
change impacts; which sectors require priority interventions; how bottom-
up collaborative policy making may be blended with existing scientifi c
know-how; and what fi nancing mechanisms can be drawn on.
• As pointed out by the IPCC (2007), scholars’ lack of attention to the uncer-
tainties associated with climate change and its implications for the human
populations, let alone the urban poor.
References
African Development Bank, Asian Development Bank, U.K. Department for International
Development, DGDev, BMZ, MinBuza, Organisation for Economic Co-operation and
Development, United Nations Development Programme, United Nations Environ-
ment Programme, and World Bank. 2009. Poverty and Climate Change: Reducing the
Vulnerability of the Poor through Adaptation.
Baker, Judy. 2008. Urban Poverty: A Global View. Washington, DC: World Bank.
———, R. Basu, M. Cropper, S. Lall, and A. Takeuchi. 2005. “Urban Poverty and Trans-
port: Th e Case of Mumbai.” Policy Research Working Paper 3683, World Bank, Wash-
ington, DC.
Bicknell, Jane, David Dodman, David Satterthwaite, eds. 2009. Adapting Cities to Cli-
mate Change: Understanding and Addressing the Development Challenges. London:
Earthscan.
Bin, O., J. Brown Kruse, and C.E. Landry. 2008. “Flood Hazards, Insurance Rates, and
Amenities: Evidence from the Coastal Housing Market.” Journal of Risk and Insurance
75 (1): 63–82.
Bin, Okmyung, and Stephen Polasky. 2004. “Eff ects of Flood Hazards on Property Values:
Evidence before and aft er Hurricane.” Land Economics 80 (4): 490–500.
Birkmann, et al. 2009. Addressing the Challenge: Recommendations and Quality Criteria
for Linking Disaster Risk Reduction and Adaptation to Climate Change. DKKV Publica-
tions Series 38. Bonn: German Committee for Disaster Reduction.
Centre for Urban Studies, MEASURE Evaluation, and National Institute of Population
Research and Training. 2006. Slums of Urban Bangladesh: Mapping and Census, 2005.
Dhaka: Centre for Urban Studies.

136 ■ CLIMATE CHANGE, DISASTER RISK, AND THE URBAN POOR
Danilenko, Alexander, Eric Dickson, and Michael Jacobsen. 2010. Climate Change and
Urban Water Utilities: Challenges and Opportunities. Water Working Notes. Washing-
ton, DC: World Bank.
DFID, 2004. Disaster Risk Reduction: A Development Concern. London.
Dilley, Maxx, Robert S. Chen, Uwe Deichmann, Art L. Lerner-Lam, and Margaret Arnold.
2005. Natural Disaster Hotspots: A Global Risk Analysis. Washington, DC: World Bank/
Columbia University.
Douglas, Ian, Kurshid Alam, Maryanne Maghenda, Yasmin Mcdonnell, Louise Mclean,
and Jack Campbell. 2008. “Unjust Waters: Climate Change, Flooding and the Urban
Poor in Africa.” Environment and Urbanization 20 (1): 187–205.
Economics of Climate Adaptation (ECA) Working Group. 2010. Shaping Climate-Resilient
Development: A Framework for Decision-Making.
Fay, Marianne, Rachel Block, and Jane Ebinger, eds. 2010. Adapting to Climate Change in
Eastern Europe and Central Asia. Washington DC: World Bank.
Greenstone, M., and J. Gallagher. 2008. “Does Hazardous Waste Matter? Evidence from
the Housing Market and the Superfund Program.” Quarterly Journal of Economics 123
(3): 951–1003.
Haines, et al. 2007. “Policies for Accelerating Access to Clean Energy, Improving
Health, Advancing Development, and Mitigating Climate Change.” Th e Lancet 370
(6): 1264–1281.
Hardoy, J.G., D. Mitlin, and D. Satterthwaite. 2001. Environmental Problems in an Urban-
izing World. London: Earthscan.
Hoff man, Christian. 2009. “Spatial Analysis of Natural Hazard and Climate Change Risks
in Per-Urban Expansion Areas of Dakar, Senegal.” Presented at the World Bank Urban
Learning Week 2009.
Intergovernmental Panel on Climate Change (IPCC). 2001. IPCC Th ird Assessment Report:
Climate Change 2001.
———. 2007. IPCC Fourth Assessment Report: Climate Change 2007.
International Strategy for Disaster Reduction (ISDR). 2009. Global Assessment
Report on Disaster Risk Reduction. Geneva: UN International Strategy for Disaster
Reduction.
Jha, Abhas, with Jennifer Duyne Barenstein, Priscilla M. Phelps, Daniel Pittet, and Stephen
Sena. 2010. Safer Homes, Stronger Communities: A Handbook for Reconstructing Aft er
Natural Disasters. Washington, DC: World Bank Global Facility for Disaster Reduction
and Recovery (GFDRR).
Jollands, N., M. Ruth, C. Bernier, and N. Golubiewski. 2005. “Climate’s Long-term Impacts
on New Zealand Infrastructure—A Hamilton City Case Study.” Ecological Economics
in Action. New Zealand Centre for Ecological Economics, Palmerston North, New
Zealand.
Juneja, Shefali. 2008. Disasters and Poverty: Th e Risk Nexus. A Review of Literature.
Background Paper for the 2009 ISDR Global Assessment Report on Disaster Risk
Reduction. United Nations International Strategy for Disaster Reduction Secretar-
iat, Geneva.
Kebede, B., and I. Dube. 2004. Energy Services for the Urban Poor in Africa: Issues and
Policy Implications. London: Zed Books in Association with the African Energy Policy
Research Network.

ANNEX 1: LITERATURE REVIEW ■ 137
Kenny, Charles. 2009. “Why Do People Die in Earthquakes? Th e Costs, Benefi ts and Insti-
tutions of Disaster Risk in Developing Countries.” Policy Research Working Paper,
World Bank, Washington, DC.
Kerry Smith, V., Jared C. Carbone, Jaren C. Pope, Daniel G. Hallstrom, and Michael E.
Darden. 2006. “Adjusting to Natural Disasters.” Journal of Risk and Uncertainty 33:
37–54.
Kovats, S., and R. Akhtar. 2008. “Climate, Climate Change and Human Health in Asian
Cities.” Environment and Urbanization 20 (1): 165–175.
Kreimer, Alcira, and Arnold, Margeret. 2000. Managing Disaster Risk in Emerging Econo-
mies. Washington, DC: World Bank.
Kreimer, Alcira, et al., eds. 2003. Building Safer Cities: Th e Future of Disaster Risk. Wash-
ington, DC: World Bank.
Lall, S.V., and U. Deichmann. 2009. “Density and Disasters: Economics of Urban Hazard
Risk.” Policy Research Working Paper 5161, World Bank, Washington, DC.
Lall, Somik, Uwe Deichmann, Mattias Lundberg, and Nazmul Chaudhury. 2004. “Tenure,
Diversity, and Commitment: Community Participation for Urban Service Provision,
Journal of Development Studies 40 (3): 1–26.
Lall, Somik V., Mattias Lundberg, and Zmarak Shalizi. 2008. “Implications of alternate
policies on welfare of slum dwellers: Evidence from Pune, India.” Journal of Urban Eco-
nomics 63: 56–73.
Lewis, Dan, and Jaana Mioch. 2005. “Urban Vulnerability and Good Governance.” Journal
of Contingencies and Crisis Management 13 (2): 50–53.
Lewis, James. 2003. “Housing Construction in Earthquake-Prone Places: Perspectives,
Priorities and Projections for Development.” Th e Australian Journal of Emergency
Management 18 (2): 35–44.
Mearns, Robin, and Andrew Norton. 2010. Social Dimensions of Climate Change: Equity
and Vulnerability in a Warming World. Washington DC: World Bank.
Mehrotra, S., Claudia Natenzon, Ademola Omojola, Regina Folorunsho, Joseph Gilbride,
and Cynthia Rosenzweig. 2009. “Framework for City Climate Risk Assessment.” World
Bank Commissioned Research presented at the Fift h Urban Research Symposium,
World Bank, Washington DC.
Montgomery, Mark, 2009. “Urban Poverty and Health in Developing Countries.” Popula-
tion Bulletin 64(2).
Moser, Caroline, A. Norton, A. Stein, and S. Georgeiva. 2010. “Pro-Poor Climate Change
Adaptation in the Urban Centres of Low- and Middle-Income Countries. Case Studies
of Vulnerability and Resilience in Kenya and Nicaragua,” World Bank, Social Develop-
ment, Report Number 54947-GLB.
Nakagawa, Masayuki, Makoto Saito, and Hisaka Yamaga. 2007. “Earthquake Risk and
Housing Rents: Evidence from the Tokyo Metropolitan Area.” Regional Science and
Urban Economics 37: 87–99.
Nicholls, R.J., C. Hanson, N. Herweijer, S. Patmore, J. Hallegatte, J. Corfee-Morlot,
R. Château, and R. Muir-Wood,. 2007. Ranking Port Cities with High Exposure
and Vulnerability to Climate Change: Exposure Estimates. Environment Working
Paper 1. OECD.
O’Brien, G., Phil O’Keefe, and, Joanne Rose, Ben Wisner. 2006. “Climate Change and
Disaster Management.” Disasters 30 (1): 64–80.

138 ■ CLIMATE CHANGE, DISASTER RISK, AND THE URBAN POOR
Olvera, Lourdes Diaz. 2009. Climate Change, the Permanence of Mobility, Urban Transport,
and Poverty in Sub-Saharan Africa (Changements Climatiques, Permanence de la Mobi-
lite, Transports Urbains et Pauvrete en Afrique Subsaharienne).
Parikh, H., and P. Parikh. 2009. “Slum Networking–A Paradigm Shift to Transcend Pov-
erty with Water, Environmental Sanitation and Hidden Resources.” In Water and
Urban Development Paradigms, ed. Feyen, Shannon, and Neville. London: Taylor and
Francis.
Parkinson, J., and O. Mark. 2005. Urban Stormwater Management in Developing Countries.
UK: IWA Publishing.
Peduzzi, P., H. Dao, and C. Herold. 2005. “Mapping Disastrous Natural Hazards Using
Global Datasets.” Natural Hazards 35 (2): 265–289.
Pelling, Mark. 2003. Th e Vulnerability of Cities: Natural Disasters and Social Resilience.
London: Earthscan.
Prasad, Neeraj, Federica Ranghieri, Fatima Shah, Zoe Trohannis, Earl Kessler and Ravi
Sinha. 2009. Climate Resilient Cities. A Primer on Reducing Vulnerabilities to Disasters.
Washington, DC: World Bank.
Ruskulis, Otto. 2002. “Developing Processes for Improving Disaster Mitigation of the
Urban Poor.” Basin News (Building Advisory Service and Information Network) 23
(June). SKAT St Gallen.
Sanchez-Rodriguez, Roberto. 2009. “Learning to Adapt to Climate Change in Urban
Areas: A Review of Recent Contributions.” Current Opinion in Environmental Sustain-
ability.
Satterthwaite, David. 2009. Shaping Urban Environment: Cities Matter. London: Interna-
tional Institute for Environment and Development.
———. Saleemul Huq, Hannah Reid, Mark Pelling and Patricia Romero Lankao. 2007.
Adapting to Climate Change in Urban Areas: Th e Possibilities and Constraints in Low-
and Middle-Income Nations. London: International Institute for Environment and
Development.
Sezen, H., A. Whittaker, K. Elwood, and K. Mosalam. 2002. “Performance of Reinforced
Concrete Buildings during the August 17, Kocaeli, Turkey Earthquake, and Seismic
Design and Construction Practice in Turkey. Engineering Structures 25 (1): 103–114.
Stern, Nicholas. 2007. Th e Economics of Climate Change: Th e Stern Review. Cambridge,
UK: Cambridge University Press.
United Nations Development Programme (UNDP). 2007. Human Development Report
2007/2008: Fighting Climate Change: Human Solidarity in a Divided World. New York:
UNDP.
UN-HABITAT. 2008. Harmonious Cities: State of the World’s Cities 2008/9. London/
Sterling, VA: Earthscan Publications Ltd.
Wamsler, Christine. 2006. “Understanding Disasters from a Local Perspective:
Insights into Improving Assistance for Social Housing and Settlement Develop-
ment.” TRIALOG (Journal for Planning and Building in the Th ird World) 91(Decem-
ber), special issue on “Building on Disasters.”
———. 2007. “Bridging the Gaps: Stakeholder-Based Strategies for Risk Reduction and
Financing for the Urban Poor.” Environment and Urbanization 19 (1): 115–142.
Wilson, David C. 2007. “Development Drivers for Waste Management.” Waste Manage-
ment & Research 25 (3): 198–207

ANNEX 1: LITERATURE REVIEW ■ 139
World Bank. 2002. Cities on the Move. Urban Transport Strategy Review. Washington,
DC: World Bank. http://siteresources.worldbank.org/INTURBANTRANSPORT/
Resources/cities_on_the_move.pdf accessed 13/7/2010.
———. 2004. World Development Report 2004: Making Services Work for Poor People.
Washington, DC: World Bank.
———. 2005. Natural Disaster Hotspots: A Global Risk Analysis. Washington, DC:
World Bank.
———. 2006. Hazards of Nature, Risks to Development. Washington, DC: World Bank.
———. 2009. World Development Report 2009: Reshaping Economic Geography. Washing-
ton, DC: World Bank.
———. 2010a. Th e Cost to Developing Countries of Adapting to Climate Change. Washing-
ton, DC: World Bank.
———. 2010b. Pro-Poor Adaptation to Climate Change in Urban Centers: Case Studies of
Vulnerability and Resilience in Kenya and Nicaragua. Washington, DC: World Bank.
———. 2010c. World Development Report 2010: Climate Change and Development. Wash-
ington, DC: World Bank.
———. 2010d. Climate Risks and Adaptation in Asian Coastal Mega-Cities: A Synthesis
Report. Washington, DC: World Bank.
World Business Council for Sustainable Development (WBCSD). 2002. Mobility 2001:
World Mobility at the End of the Twentieth Century, and Its Sustainability. WBCSD.
http://www.wbcsd.org/DocRoot/EdJHZvhMSfrbALJqnQvF/english_full_report.pdf.
———. 2004a. Mobility 2030: Meeting the Challenges to Sustainability. World Bank Urban
Transport Transformation Project (UTTP) in Mexico. http://www.wbcsd.org/web/
publications/mobility/mobility-full.pdf.
World Health Organization (WHO). 2009. Protecting Health from Climate Change: Global
Research Priorities. Switzerland: WHO.
World Watch Institute. 2007. State of the World 2007: Our Urban Future. New York: Norton.
Yusuf, A.A., and H.A. Francisco. 2009. Climate Change Vulnerability Mapping for South
Asia. Singapore: EEPSEA. http://www.idrc.ca/uploads/user-S/12324196651Mapping_
Report.pdf.


■ 141
Annex 2: Efforts to Estimate Exposure in Cities
Studies have estimated the magnitude of urban exposure to natural hazards and
climate change impacts, yet none to date have integrated exposure of population
and of economic assets, as well as the impacts of natural hazards and climate
change at the urban scale. While these approaches have their own limitations
in rigorously quantifying aggregate vulnerability to climate and natural-hazard
impacts given the high degree of complexity and uncertainty, they provide a use-
ful macro-level look at risk and exposure in cities. Below is a brief discussion of
fi ve studies, along with key fi ndings, that have attempted such rankings. Each
approaches urban risk from a diff erent angle, covering diff erent sets of cities, dif-
ferent types of hazards, diff erent timeframes, and diff erent asset measurements.
Th at being said, all approaches confi rm that such risk is increasing and that with
the increasing manifestations of climate change, the risk will signifi cantly worsen
in the coming decades.
OECD Study on Ranking Port Cities with High Exposure and Vulnerability to Climate Extremes1
Th e Organization for Economic Co-operation and Development (OECD) pub-
lished an index ranking 136 port cities with populations over 1 million with high
exposure to 1-in-100-year, surge-induced fl oods. Th e index looks at the exposure

142 ■ CLIMATE CHANGE, DISASTER RISK, AND THE URBAN POOR
of population and assets in 2005 and those predicted in 2070. Future predictions
account for population growth, urbanization, ground subsidence, and climatic
changes.
Th e OECD study shows that across all cities, about 40 million people
(0.6 percent of the global population or roughly 1 in 10 of the total port city
population in the cities considered here) are exposed to a 1-in-100-year coastal
fl ooding. Th e exposure, as of 2005, is concentrated in a few cities: Mumbai,
Guangzhou, Shanghai, Miami, Ho Chi Minh City, Kolkata, Greater New York,
Osaka-Kobe, Alexandria, and New Orleans.
Th e study shows that cities in Asia overwhelmingly have the highest exposure
to surge-induced fl ooding now and in the future. Of the 20 cities with the high-
est population exposure in 2005, half are in low- and middle-income nations in
Asia. Of the total 38.5 million people currently exposed, 65 percent live in Asian
cities. Table A2.1 shows the top 20 port cities with exposed populations in 2005.
Th e index predicts that, in the 2070s, 17 out of the 20 cities with the highest
population exposure will be in present-day low- and middle-income countries,
TABLE A2.1 Port Cities with Populations over 1 Million Estimated to Have Highest Increased Exposure to Surge-Induced Floods, 2005 to 2070
City Country
Population 2005
(thousands)
Population exposed 2005 (thousands)
Population exposed 2070 (thousands)
Increase (percent)
Quingdao China 2,817 88 1,851 2,103
Luanda Angola 2,766 1 18 1,800Dhaka Bangladesh 12,430 844 11,135 1,319Mogadishu Somalia 1,320 9 115 1,278Conakry Guinea 1,425 41 496 1,210Chittagong Bangladesh 4,114 255 2,866 1,124Ningbo China 1,810 299 3,305 1,105Dar es Salaam Tanzania 2,676 36 351 975Yangon Myanmar 4,107 510 4,965 974Karachi Pakistan 11,608 49 473 965Douala Cameroon 1,761 11 101 918Lagos Nigeria 10,886 357 3,229 904Kulna Bangladesh 1,495 441 3,641 826N’ampo Rep. of Korea 1,102 22 181 823Port-au-Prince Haiti 2,129 1 8 800
Source: Nicholls et al. (2008).

ANNEX 2: EFFORTS TO ESTIMATE EXPOSURE IN CITIES ■ 143
and 14 out of the 20 will be in Asia (four in China and two in Bangladesh). Asia’s
increasing dominance in terms of population and asset exposure is a result of
increased urbanization and economic growth during the period, compared with
other regions.
When assets are considered across all cities, the current distribution becomes
more heavily weighted toward developed countries, as the wealth of the cities
becomes important. Th e total value of assets exposed in 2005 is estimated to be
US$3,000 billion, corresponding to around 5 percent of global GDP in 2005 (both
measured in U.S. dollars). Th e top 10 cities in this ranking are Miami, Greater
New York, New Orleans, Osaka-Kobe, Tokyo, Amsterdam, Rotterdam, Nagoya,
Tampa-St Petersburg, and Virginia Beach. Th ese cities contain 60 percent of the
total exposure, but are from only three (wealthy) countries: the United States,
Japan, and the Netherlands.
Munich Re’s Study on Megacities—Megacities Megarisks
Munich Re Group’s NatCat database was used to prepare a natural hazard risk
index for 50 of the world’s largest (population over 2 million) and most economi-
cally important cities (city GDP as a percentage of a country’s GDP). Th e analysis
covers 30 large cities in low- and middle-income nations and 20 large cities in
high-income nations. Th is index, which was intended as the basis for discus-
sion, was the fi rst international index for cities to take a multi-hazard perspec-
tive including earthquakes, windstorms, fl oods, volcanic eruption, bush fi res, and
winter storms.
Th e index is composed of three variables: exposure to hazards, vulnerabil-
ity of the built environment, and value of exposed property. Vulnerability is
based on an estimation of the vulnerability of the predominant form of resi-
dential construction to hazards; the standard of preparedness and safeguards
including building regulations; urban planning in respect of specifi c hazards
and fl ood protection; and building density. Th e values of exposed property are
estimated using the average values per household and the GDP for commerce
and industry.
Th e index is most heavily infl uenced by values of exposed assets and their
degree of vulnerability. Tokyo is, by far, the city at highest risk, followed by San
Francisco. Of the 20 highest-risk cities in the index, 17 are in high-income coun-
tries, which is to be expected given that the index is trying to gauge the risk for
insurers and thus the value of exposed assets. Th ese assets are greater in high-
income countries and thus become important in understanding the potential for
economic losses in a disaster.

144 ■ CLIMATE CHANGE, DISASTER RISK, AND THE URBAN POOR
GFDRR—Economics of Disaster Risk Reduction
In this study (Brecht, Deichmann, and Wang 2010), city-specifi c population pro-
jections to 2050 are combined with geographic patterns of hazards representative
of the 1975–2007 period. Th e projected number of people exposed to tropi-
cal cyclones and earthquakes in large cities in 2050 more than doubles, rising
from 310 million in 2000 to 680 million in 2050 for tropical cyclones, and from
370 million to 870 million for earthquakes. Th e growing exposure continues to
vary by region. By 2050, there will be 246 million city dwellers in cyclone-prone
areas in South Asia, but 160 million each in the OECD and East Asian countries.
Although East Asia has fewer exposed people, the urban population exposed to
cyclones is expected to grow at 2.2 percent a year, similar to South Asia’s. Sub-
Saharan Africa’s exposure growth at 3.5 percent is even higher due to the pro-
jected high urbanization rates, reaching 21 million urban dwellers by 2050.
Exposure to earthquakes will likely remain most prominent in East Asia. It is
also high in Latin America and the Caribbean, and OECD countries. Th e fast-
est growth in exposure is in South Asia (3.5 percent), followed by Sub-Saharan
Africa, linked to rapid urbanization in these regions.
Mega-Stress for Mega-Cities: A Climate Vulnerability Ranking of Major Coastal Cities in Asia
Th e World Wildlife Fund (WWF) assessed the climate change vulnerabilities of
11 large cities in Asia, most of them coastal (WWF 2009). WWF’s work focuses
on climate vulnerability and adaptive capacity in these cities. Th e study gave
each city a vulnerability score based on the combined rankings of its exposure,
sensitivity, and adaptive capacity. Each is rated by a point system; for example,
exposure is measured by assigning a point value for (1) frequency of tropical
storms, (2) frequency of extreme weather including fl ood and drought, and (3)
potential impact of a 1meter rise in sea level. Based on this point attribution,
Dhaka, Jakarta, and Manila are ranked as the most exposed of the 11 cities
studied. Th ese same cities are ranked highest on overall vulnerability as well.
WWF’s index is unique in that it focuses specifi cally on climate change in a
select number of cities predetermined to be particularly vulnerable. Th e study
uses uniform measurements across the cities to make them comparable; however,
the assigned units to rank vulnerability are not easily translatable in the fi nal anal-
ysis. It is not clear, for example, why Dhaka has a vulnerability of 9, while Jakarta
and Manila have a vulnerability of 8 (on a 10-point scale), or what a one-point
diff erence in vulnerability means. Because the study is limited to only 11 Asian
cities, it is also diffi cult to imagine how these rankings could be used to compare

ANNEX 2: EFFORTS TO ESTIMATE EXPOSURE IN CITIES ■ 145
vulnerability with other cities. A further point of interest in this comparison is
that the ranking order of the cities is very similar for each of the three factors that
are aggregated to measure vulnerability (exposure, sensitivity, adaptive capacity).
Earthquake Disaster Risk Index
Th e Earthquake Disaster Risk Index (EDRI) was developed by the John A. Blume
Earthquake Engineering Center at Stanford University (Davidson and Shah
1997). Th e index is a composite that accounts for various city characteristics
across fi ve components to assess earthquake risk: hazard, exposure, vulnerabil-
ity, external context, and emergency response, and recovery. Each of these fac-
tors uses several data inputs with diff ering weights. For example, the exposure
component is calculated using population, per capita GDP, number of housing
units, and urbanized land area. Th e overall risk formula provides a fi nal risk value
between 1 and 100 for each city. In a 10-city sample, the mean risk was 40, with a
range between 35 (for St. Louis) and 54 (for Tokyo).
Th e index increases its robustness by requiring a number of data points for
input, but some data can be diffi cult to access in some cities, such as city per cap-
ita GDP or housing vacancy rate. Additionally, while this index allows for inter-
city risk comparison and potential wise distribution of resources, indexed data
are readily available for only 10 cities (Boston, Istanbul, Jakarta, Lima, Manila,
Mexico City, San Francisco, Santiago, St. Louis, and Tokyo).
Multi-Hazard City Risk Index (MHCRI)
Th is is a pilot initiative under the Resilient Cities program in the World Bank’s
East Asia Region. An initial methodology has been developed and piloted in
three cities—Bangkok, Th ailand, in collaboration with the Bangkok Metropoli-
tan Administration; Metro Manila, Philippines, in collaboration with the Met-
ropolitan Manila Development Authority; and Ningbo, China, in collaboration
with NMBG, Ltd. (World Bank, 2011). Th e index provides the fi rst methodol-
ogy to quantify and aggregate risk across a range of 13 hydromet and seismic
hazards in a standardized way in order to compare across cities as well as areas
(for example, districts) within a city. It aims to provide an aggregate picture of
risk to national and city policy makers and planners and guidance on areas of
focus for prospective risk management. Th e index relies on a basic multiplica-
tive risk model that draws on data related to metropolitan elements (population
subclasses, building types, and infrastructure sectors); calculates hazard indi-
ces for each hazard type (based on frequency, intensity, and area aff ected); and
146 ■ CLIMATE CHANGE, DISASTER RISK, AND THE URBAN POOR
assesses vulnerabilities (based on 30 parameters related to physical susceptibil-
ity, socioeconomic fragility, and institutional and regulatory resilience). While
exposure to people and capital stock can be extracted from the model, the pri-
mary outputs are risk scores for the city. Risk can be assessed at the citywide or
submunicipal scale, for all metropolitan elements or a specifi c one, for all hazard
types or a specifi c one. Th e outputs are for two time periods—current (2010)
and future (2030), where future scenarios are generated based on high and low
hazards (accounting for climate change), and changes to population and built-
up area based on government planning and investment documents. Th e fi nal
city scores are still being fi nalized and the methodology will be further refi ned
in a follow-up phase. In addition, a website is under development that will allow
users to select the parameters of interest and generate risk maps accordingly; the
site will also allow users to simulate policy changes and resulting implications to
the risk maps.
Although the results from the studies reviewed above address urban risk from
diff erent angles, they all confi rm that such risk is increasing and that with grow-
ing climate change the risk will continue to increase signifi cantly in the com-
ing decades. Th e results provide a call for action in addressing urban risk, and
especially in those countries of the developing world that are the least prepared
to manage the risk’s implications, including fi nancial requirements and organiza-
tional challenges (see fi gure A2.1 in the color section).
Note
1. Nicholls et al. (2007). Also see Hallegatte et al. (2010, 2011).
References
Brecht, H., U. Deichmann, and H. Gun Wang. 2010. “Predicting Future Urban Natural
Hazard Exposure.” Background note for Natural Hazards, Unnatural Disasters.
Davidson, Rachel, and Haresh Shah. 1997. An Urban Earthquake Disaster Risk Index.
Stanford, California: Stanford University.
Hallegatte, Stéphane, Nicola Ranger, Sumana Bhattacharya, Murthy Bachu, Satya Priya,
K. Dhore, Farhat Rafi que, P. Mathur, Nicolas Naville, Fanny Henriet, Anand Patward-
han, K. Narayanan, Subimal Ghosh, Subhankar Karmakar, Unmesh Patnaik, Abhijat
Abhayankar, Sanjib Pohit, Jan Corfee-Morlot, and Celine Herweijer. 2010. “Flood
Risks, Climate Change Impacts and Adaptation Benefi ts in Mumbai.” OECD Environ-
mental Working Paper 27.
Hallegatte, S., N. Ranger, O. Mestre, P. Dumas, J. Corfee-Morlot, C. Herweijer, and R. Muir
Wood. 2011. “Assessing Climate Change Impacts, Sea Level Rise and Storm Surge Risk
in Port Cities: A Case Study on Copenhagen,” Climatic Change 104 (1): 113–37.

ANNEX 2: EFFORTS TO ESTIMATE EXPOSURE IN CITIES ■ 147
Munich Re. 2005. Megacities—Megarisks: Trends and Challenges for Insurance and Risk
Management. Munich Reinsurance Company.
Nicholls, R.J., et al. 2007. Ranking Port Cities with High Exposure and Vulnerability to Cli-
mate Change: Exposure Estimates. Environment Working Paper 1. OECD.
World Bank. 2011. “Resilient Cities: Multi-Hazard City Risk Index—Methodology Report,”
East Asia Infrastructure Sector Unit, World Bank, Washington, DC, September.
World Wildlife Federation (WWF). 2009. Mega-Stress for Mega-Cities: A Climate Vulnera-
bility Ranking of Major Coastal Cities in Asia. Gland, Switzerland: WWF International.


■ 149
Annex 3: Learning from Project and Program Experiences: Individuals,
Community, and Local Government Partnering to Manage Risk
Introduction
As discussed throughout this study, there are many government and commu-
nity approaches to building resilient communities. Th is annex presents some
approaches being carried out at a local level, ranging from community strate-
gies, early-warning systems, and local partnerships, to more sophisticated risk-
transferring programs.
Traditionally, vulnerable individuals and communities have managed risk
through ad hoc coping techniques that draw on their local knowledge of hazards
and community resources. Many sources available today discuss ad hoc adapta-
tion to illustrate the strength of social capital; however, many of these coping
mechanisms also refl ect short-term strategies of individuals or communities that
are accustomed to living with risk from recurrent hazards and cannot rely on
government protection (Douglas et al. 2008).
While ad hoc adaptation may save lives and assets in the short term, its unreg-
ulated nature creates the possibility for maladaptation. Maladaptation happens
also when there is a shift in vulnerability from one social group to another, or
when future generations’ vulnerability is compromised. Per the United Nations
Development Programme defi nition, maladaptation is any action taken in rela-
tion to climate change that delivers short-term gains at the cost of creating long-
term, higher vulnerability.1 An example of this can be seen in the unplanned
settlements of Dar es Salaam, where common fl ood-coping strategies include

150 ■ CLIMATE CHANGE, DISASTER RISK, AND THE URBAN POOR
elevating pit latrines and building foundations, which increases street fl ooding
(Kiunsi et al. 2009a). Maladaptation may also include planned development poli-
cies that fail to take into account the future eff ects of climate change.
Th ere are many examples of good practices in addressing the backlogs in
infrastructure and service provision for the urban poor in developing coun-
tries. For instance, an approach that has resulted in eff ective identifi cation
and mitigation of risks is where city or municipal governments work with the
inhabitants of the informal settlements and their community organizations to
ensure provision of resilient basic services. Th is approach is now evident in a
wide range of cities, although with diff erences in the balance between what
governments do and what households and community-based organizations do.
What these have in common, though, is recognition by local government offi -
cials and politicians of the areas where so much more can be achieved if local
government supports the investments and capacities that community organiza-
tions can bring. Th ere is also recognition of how community investments can
be integrated into municipal investments in ways that expand coverage and
lower unit costs.
Other examples of good practices come from local government-community
organization partnerships initiated by federations of slum/shack dwellers
or homeless people. Th is is perhaps surprising in that federations or other
forms of collective organization formed by low-income groups generally
seek to infl uence government by making demands on them, not by off ering
partnerships (Mitlin 2008). But in 33 nations, women-led grassroots savings
groups, and the larger slum/shack/homeless people’s federations they form,
are engaged in initiatives to upgrade slums and squatter settlements, secure
land tenure, develop new housing that low-income households can aff ord,
and improve provision for infrastructure and basic services. Th ese federa-
tions have demonstrated a capacity to undertake citywide surveys of informal
settlements that include detailed profi les of each settlement and maps. Th ey
have also shown their capacity to do detailed enumerations of every house-
hold in informal settlements that can then form the information needed for
upgrading and infrastructure and service provision. Th ese are both very valu-
able for any local government wishing to reduce vulnerability and improve
conditions in informal settlements.
Individual civil servants or politicians have oft en catalyzed much improved
community-local government relations that led to partnerships in service provi-
sion. Yet, the continuity of such partnership in the absence of capable institu-
tions is threatened when politicians’ terms ends or they are moved. Th ere is also
the constraint on these partnerships from the many community leaders who are
not representative or accountable to those they “lead” and who are enmeshed
ANNEX 3: LEARNING FROM PROJECT AND PROGRAM EXPERIENCES ■ 151
in patron-client relationships with local government. Another challenge is to
take a partnership that works well for a particular settlement or district to larger
scale—and shift ing from projects to citywide processes. It is also diffi cult for
bureaucratic, rule-bound systems and processes to meet the needs and priorities
of those in informal settlements working within the informal economy (Mitlin
2008). But the range of successful experiences with community-local govern-
ment partnerships coming from very diff erent economic and political contexts
suggests that the core principles of this approach have wide validity.2
In most urban contexts, what community organizations can negotiate
from their local government is as important (if not more so) for disaster risk
reduction and climate change adaptation than what they can do themselves.
So much risk reduction depends on the availability of infrastructure that the
residents of informal settlements cannot install themselves. Most urban infor-
mal settlements are embedded in a much larger built-up area, and these need
a larger system of storm and surface drains into which their own eff orts to
install, improve, and maintain drainage can fi t. Th ey need road and path net-
works beyond their settlements to allow them to evacuate if needed. Th ey need
health care services that can help in risk reduction and disaster response. Th e
willingness of individuals to invest in collective actions for risk reduction in
their settlement also depends on how secure they feel from eviction and their
tenure (for instance, tenants are usually unwilling to invest in improving the
housing they live in). But the contribution of community-level organization
and action to disaster risk reduction can also be greatly enhanced where local
governments and other key bodies (for instance, civil defense organizations)
recognize their role and support them.3
Risk management needs to be tailored to the specifi c needs and resources of
each city. Some organizations, cities, and countries are leading risk mitigation.
Figure A3.1 lists programs that have innovative elements of good practice, cat-
egorized by approach to risk management.
Educate—Good Practices in Knowledge Sharing and Training
For many cities, the fi rst step toward climate and disaster resilience is to educate
and raise awareness of natural hazards, vulnerabilities, and institutional capacity.
Several programs provide advice to decision makers, such as city technicians and
city managers. Th ese programs range in levels of engagement and development,
but all have the common goal of aiding local governments to approach the cli-
mate challenge, and they recognize that risks are not evenly distributed among

15
2
■
CL
IMA
TE
CH
AN
GE
, DIS
AS
TE
R R
ISK
, AN
D T
HE
UR
BA
N P
OO
RFigure A3.1 Examples of Current Good Practices, by Approach to Risk Management
1.Educate
ICLEIIRAPS
(Vietnam)Honduras
TanzaniaEl Salvador
Colombia
Turkey
CaribbeanIslands
CentralAmerica
Indonesia
VolunteerTechnology
Communities
Mozambique
Senegal
Pakistan
Bolivia
India
Vietnam
Liberia
Venezuela
Argentina
Philippines
India
CLACC
ACCRN
CRCP
Urban floodhandbook
ISO 31000
4.Mitigate
5.Transfer
6.Recover
3.Prepare
2.Identify
ICLEI: Local Governments for Sustainability; CLACC: Capacity Strengthening of Least Developing Countries for Adaptation to Climate Change network; ACCRN: Asian Cities Climate Change Resilience Network; CRCP: Climate Resilient Cities Primer; ISO31000: International Organization for Standardization.

ANNEX 3: LEARNING FROM PROJECT AND PROGRAM EXPERIENCES ■ 153
local populations. Several programs currently under development are mentioned
below.
ICLEI—Local Governments for Sustainability
ICLEI USA is working with several North American cities on the Climate
Resilient Communities Program. Th e adaptation program has a fi ve-milestone
methodology: (1) conduct a climate resiliency study, (2) set preparedness goals,
(3) develop a climate preparedness plan, (4) publish and implement the pre-
paredness plan, and (5) monitor and reevaluate resiliencies. Th e program is
in the early stages, but may expand to the global ICLEI network. A benefi t of
this program is that it can build on an existing network of cities that have used
ICLEI resources to work on mitigation.
Capacity Strengthening of Least Developing Countries for Adaptation to Climate Change Network
Th e International Institute for Environment and Development (IIED) has helped
develop the Capacity Strengthening of Least Developing Countries for Adapta-
tion to Climate Change (CLACC) network, which is composed of international
experts working to strengthen organizations in least-developed countries and
support their sustainable development initiatives. Th ey are currently operat-
ing in 12 African countries and three in South Asia. Th e CLACC network sup-
ports these organizations primarily through publications and capacity-building
workshops, meanwhile actively participating in the Conference of Parties (COP)
negotiations worldwide. Th e CLACC methodology focuses on ten lessons for
decision makers: engaging in detailed consultations with citizens and commu-
nity organizations; gathering information on extreme weather impacts; engaging
in disaster risk management; facilitating household coping strategies; supporting
sustainable livelihoods; ensuring that infrastructure is sensitive to the needs of
the poor; supporting slum upgrading; building resilience across sectors (health,
tenure, education, etc.); instituting appropriate building standards; and reconsid-
ering planning and zoning regulations.
Asian Cities Climate Change Resilience Network (ACCRN)
Th is is a Rockefeller Foundation initiative, implemented through the Institute
for Social and Environmental Transition (ISET); it focuses on aiding a network
of cities to develop climate adaptation plans through engagement with civil soci-
ety stakeholders. Th e primary objectives of ACCRN are to demonstrate a range
of actions for urban climate adaptation, compile replicable good practices, and

154 ■ CLIMATE CHANGE, DISASTER RISK, AND THE URBAN POOR
help cities implement climate resilient processes. ACCRN is currently working
in ten cities: three cities in Vietnam, three in India, two in Indonesia, and two
in Th ailand. Th e program is being developed through four phases that began in
2008 with city scoping and selection. Phase 2, currently under way, involves city
engagement and capacity building through the Shared Learning Dialogue (SLD)
process. SLDs engage community actors and government agencies to explore
their current and future vulnerabilities in a transparent and iterative group dis-
cussion. Th e SLD outcome focuses on creating a shared understanding of risk
and priorities for action. Phase 3, set to begin this year in Vietnam and India,
focuses on implementing urban resilience-building projects, with partial funding
from the Rockefeller Foundation. Th e fi nal ACCRN development phase focuses
on program replication in other cities, countries, and sectors. Th e primary take-
away from this activity is how the SLD process engages local civil-society groups
to evaluate and create solutions to anticipated climate hazards, enabling margin-
alized groups to participate as stakeholders.
Climate Resilient Cities Primer
At the World Bank, the East Asia Region has produced the Climate Resilient Cit-
ies (CRC) Primer, which is intended as a fi rst step to guiding local governments
through the assessment of climate change and disaster risk impacts. Th e primer
presents exercises that focus on identifying “hot spots” for hazard risk and col-
lecting the necessary information to make informed decisions regarding climate
action. Next, the primer off ers examples of “sound practices” and city profi les to
illustrate how other cities are enacting “no-regrets” policies. Th e CRC Primer has
led to Technical Assistance (TA) programs in Vietnam, Indonesia, the Philip-
pines, and China. Th e primary value of this exercise is that it presents the chal-
lenges of climate change and disaster in a format that local governments can use
to present complex issues to their constituents.
ISO 31000
In November 2009 the International Organization for Standardization devel-
oped ISO 31000—a set of principles and guidelines intended to help a wide vari-
ety of organizations in managing risk. ISO 31000 defi nes risk as the “eff ect of
uncertainty in objectives.” Some of the principles of ISO 31000 point toward risk
management becoming a value generator for the organization, an integral part of
the decision-making and other organizational processes—tailored, transparent,
inclusive, systematic, structured, timely, dynamic, iterative, and responsive. Th e
ISO 31000 is a further step in creating a framework for designing, implementing,
and maintaining an eff ective risk management program.

ANNEX 3: LEARNING FROM PROJECT AND PROGRAM EXPERIENCES ■ 155
Identify—Good Practices in Risk Identifi cation
As discussed in other chapters, many informal settlements in cities are at high
risk from disasters largely due to where they live, defi ciencies in providing for
infrastructure and services, and the poor quality of housing. For local govern-
ments, one of the most diffi cult tasks is to gather detailed information and maps
needed for identifying risk-prone areas, planning upgrading, new house develop-
ments, and infrastructure and service provision. Below are a few examples of how
much disaster risk reduction is served when low-income groups can work well
with local governments (and other actors) in identifying risk (IFRC 2010).
Local Resilience Action Plan (LRAP)—Identifying Local Adaptation Priorities
In Vietnam, the CRC activities in three cities (Dong Hoi, Can Th o, and Hanoi)
included the preparation of a workbook outlining the steps local governments
can undertake to complete a Local Resilience Action Plan (LRAP). An LRAP,
the second step in local resilience planning, comprises four primary inputs and
complementary graphic representations. Th e four inputs include (1) vulner-
ability assessment; (2) spatial analysis, which is an overlay of maps that identi-
fi es geographic “hotspots” at the city level and in specifi c target areas in the city
wider area; (3) inventory of planned capital investments and policy changes to
address the hotspots and identifi cation of the gaps that remain; and (4) multi-
stakeholder priority-setting process based on comparison of alternatives in light
of limited budgets and abilities to raise external fi nancing. Th e LRAP identifi es
short-, medium-, and long-term adaptation priorities for project investment with
specifi c costs, timelines, and responsible actors. Much like the CRC exercises,
the LRAP should be completed in a collaborative dialogue between local gov-
ernments and stakeholders. In the case of Can Th o, recommendations from the
LRAP process are currently being integrated into local urbanization planning
eff orts.
Philippines Partnership between Grass Roots Organizations and Local Governments for Documenting Risk
Identifi cation of communities at risk and documentation of informal settlements
for which there is little or no offi cial data is critical in understanding the vulnera-
bility of urban areas (PHPF 2010). Th e Philippines Homeless People’s Federation
(PHPF) is an example of how low-income community organizations can partner
with local governments to address disaster risk reduction by identifying and doc-
umenting communities at risk.4 PHPF is made up of 161 urban poor community

156 ■ CLIMATE CHANGE, DISASTER RISK, AND THE URBAN POOR
associations and savings groups with more than 70,000 members from 18 cities
and 15 municipalities. Federation members work closely with local governments
in various initiatives to secure land tenure, build or improve homes and increase
economic opportunities. PHPF works in locations impacted by disasters, building
capacity at the community level to take action to meet immediate and long-term
needs. Drawing from its experience, PHPF developed initiatives for risk manage-
ment as it identifi es at-risk communities in cities and municipalities. Based on
this, it supports the design and implementation of risk reduction strategies.
For example, PHPF in partnership with local NGOs has identifi ed and pro-
fi led at-risk communities in 12 cities and 10 municipalities located in Luzon,
Visayas, and Mindanao, the three island groups in the Philippines. Communi-
ties prioritized included informal settlements located under bridges, on cliff s and
other landslide-prone areas, along coastal shorelines and riverbanks, in public
cemeteries, near open dumpsites, and in fl ood-prone locations.
Another example of a successful partnership between local and national gov-
ernment, grassroots organizations, and the PHPF took place in the city of Iloilo
aft er the devastation caused by Typhoon Frank in 2008. Th e city government
recognized that the urban poor and their support organizations are partners
in the city’s development, and provided several opportunities for them to par-
ticipate in local decision making through representation in technical working
groups and multi-sectoral bodies. As a result, the scale and scope of housing
delivery, upgrading, post-disaster assistance, and other basic services were much
increased because of the resource-sharing from the partnership.
Furthermore, the federation as a member of the Resettlement and Monitor-
ing Task Force has assisted the local government in social preparations and other
resettlement-related activities. Th is includes an information-dissemination cam-
paign among communities living in danger zones (along riverbanks and shore-
lines, as well as those directly aff ected by the city’s infrastructure projects) who
will be transferred to government relocation sites. Th e city government, through
the Iloilo City Urban Poor Aff airs Offi ce, assisted in the federation’s social mobili-
zation, which includes mapping of high-risk/disaster-aff ected communities, and
identifi cation and prioritization of communities to be given post-disaster assis-
tance (temporary houses and material loan assistance for housing repair).
Th e eff ectiveness of partnerships between local governments and grassroots
organizations in scaling up disaster risk reduction in the Philippines is sustained
by four factors: strong community networks (that can lobby for disaster risk reduc-
tion policies that are community-driven and supported and then help implement
these); an alternative fi nancial facility (that supports community-driven action,
support for insurance for low-income households and loans for reconstruction or
rehabilitation and upgrading); technical support (to advise on site selection, land
acquisition, housing and settlement designs, zoning based on geo-hazard maps

ANNEX 3: LEARNING FROM PROJECT AND PROGRAM EXPERIENCES ■ 157
and easy-to-comply building standards); and detailed community-level informa-
tion systems (including the kinds of community mapping, enumeration, and risk
assessment described already).
India: Local Government-Community Organization Partnerships for Vulnerability Mapping and Data Gathering in Cuttack
In the city of Cuttack, India, a citywide survey is currently underway. On the one
hand, the city government has stated its commitment to a citywide program for
informal settlements. On the other hand, federation groups are developing a GIS
system that will prove particularly useful for local government.5 Th e mapping
process in Cuttack builds on more than two decades of experience in data gather-
ing by the community organizations formed by the inhabitants of informal settle-
ments and other districts—through a partnership between local Mahila Milan
groups and the local (city or state) slum dweller federations (Appadurai 2001;
Patel, D’Cruz, and Burra 2002). What makes this process in Cuttack unusual is
that the community-driven data gathering includes preparing digital maps at the
city scale for the city authorities. Th ese maps and the data gathered about each
informal settlement are being used to negotiate the support needed for upgrading
or relocation.
Th e fi rst step in this mapping is to develop an initial list of informal settle-
ments. Local governments generally have such a list but it needs checking and
is oft en incomplete. Th e next step is to work with the Mahila Milan savings
groups and federation members to check the list—which oft en ends up identify-
ing many more informal settlements. In Cuttack, 77 informal settlements were
found that were not on the offi cial list (Agarwal and Sangar 2005; Agarwal 2011).
With a list of all informal settlements, visits can be planned to each by Mahila
Milan representatives and staff from a support NGO. At this meeting with the
residents and their community leaders, a profi le of the settlement is developed
that includes details of who lives there, the nature of their tenure of the land,
the buildings, and the extent of provision for infrastructure and services. It also
includes questions about extreme weather (and its impacts on them) and other
risks they face (or faced in the past). Th en this group walks the boundaries of the
settlement, marking it with a GPS device (points are marked at every turn, and
when the boundary is a straight line, every 5–10 meters). As residents walk with
the team doing the mapping, they comment on boundaries and characteristics,
which help the visiting team understand the settlement. From this is produced a
profi le of the settlement and a map of its boundaries (that can be imported into
a digital map of Cuttack). Points marked in the GPS device are uploaded onto
Google Earth in the offi ce computer. Using the path tool in Google Earth, the
federation member connects the points to create boundaries corresponding to

158 ■ CLIMATE CHANGE, DISASTER RISK, AND THE URBAN POOR
each mapped settlement. Slum profi le data collected by Mahila Milan—usually
during mapping—is entered into an Excel spreadsheet and selected data can also
be incorporated into the map, attached to the boundary maps.
Th is process is then repeated for all informal settlements, from which comes
an accurate, detailed, disaggregated database. Th is information can be then
aggregated into a citywide map showing the boundaries of all informal settle-
ments and a link to each settlement profi le in a GIS system.
Th e city authorities have been supportive of this mapping, recognizing that
this process can help produce the information needed to get central government
funding for citywide upgrading. Th e mapping and data gathered can provide the
basis for agreement between city government and the residents of informal settle-
ments on what needs to be done.
For this kind of community-driven approach to mapping and data gathering
to be eff ective, it is important for local governments to see its utility to them. It
also depends on a local government capacity to act on this information and for
its technical staff and departments or divisions responsible for infrastructure and
service provision to be able to work with the resident groups in the informal
settlements.
Prepare—Good Practices in Risk Reduction through Early-Warning Systems
In areas where disasters are recurrent, the establishment of early-warning sys-
tems and evacuation plans are critical to safeguarding human lives in an emer-
gency. Th e main objective of early-warning systems is to empower individuals
and communities to act in a way that reduces their probability of personal
injury or damage to property and critical resources in the threat of hazards.
Th e International Strategy for Disaster Reduction (ISDR) suggests four key ele-
ments of people-centered early-warning systems: risk knowledge, monitoring
and warning service, dissemination and communication, and response capa-
bility (ISDR 2006).
In the case of sudden events, such as tsunamis, fl ash fl oods, and landslides, the
poor are frequently the last to know of impending danger, and due to a lack of
security, they are frequently reticent to abandon their possessions.
Honduras—Promoting Dialogue and Coordinating Responses
Th ere are numerous cases in Latin America where the urban poor have benefi ted
from the establishment of early-warning systems. Hurricane Mitch, which hit
Honduras in 1998, is considered the second-deadliest Atlantic hurricane in history.

ANNEX 3: LEARNING FROM PROJECT AND PROGRAM EXPERIENCES ■ 159
Th e many deaths caused by Hurricane Mitch prompted several municipalities in
Honduras to establish an inter-municipal association, with the support of GTZ, to
promote dialogue on the risks of natural hazards and to coordinate responses. Th e
association known as Mancomunidad de los Municipios del Centro de Atlantida
(MAMUCA), the municipalities of La Masica, Arizona, Esparta, San Francisco,
and El Porvenir worked together to identify risks, raise awareness, prioritize
reconstruction, encourage local decision making in a public forum, and engage
in national risk management. Th is was set up to allow the local governments to
work together in preparing for extreme events and to coordinate local response.
It included support for participatory diagnoses and participation in local decision
making through public meetings (cabildos abiertos) and helped improve evacu-
ation, during rainstorms, through community-based disaster reduction. It also
encouraged the formation of local emergency committees (CODELs) integrated
with municipal emergency committees to practice early-warning and evacuation
drills (Bollin and Mascher 2005). CODELs included representatives from health-
care services, the police, the fi re department, and the Red Cross.
Honduras has not been the only one in Central America to learn from the
experience with Hurricane Mitch. For instance, Cuba, despite being highly
exposed to tropical storms, has repeatedly averted disaster through a highly eff ec-
tive system to educate, mobilize, and protect its citizenry. In 2005, this “culture of
safety” allowed for the evacuation of 640,000 people from Havana and the path of
Hurricane Wilma while the storm surge reached 1 kilometer inland (Simms and
Reid 2006). Hurricane Wilma resulted in the loss of one life, a marked diff erence
to the nearly 20,000 Central Americans killed by fl ooding and landslides associ-
ated with Hurricane Mitch in 1998.
Argentina—From Early-Warning Systems to Improvement in Asset Security
Buenos Aires is a low-lying city, and thus faces recurrent fl ooding from three
rivers. While arguably less catastrophic than landslides, the repeated fl ooding
of this area makes it diffi cult for the urban poor to recover between disasters.
In 2004, fi lmmakers documented fl ooding in the low-income community of
El Zajon, raising awareness within both the community and the government,
prompting the installation of an early-warning system (Simms and Reid 2006).
Th e World Bank (2005) has supported several fl ood-prevention eff orts in
Argentina under the Urban Flood Prevention and Drainage Project. In its fi rst
phase, the project focused on the development of a city risk management pro-
gram for Buenos Aires, which, among many things, included fl ood forecasting
and early-warning systems. Now in its second phase, the project has expanded to
include the six provinces located between the Rio Paraguay and the Rio Parana,

160 ■ CLIMATE CHANGE, DISASTER RISK, AND THE URBAN POOR
the most fl ood-prone region in Argentina. In addition to early-warning systems,
the second phase will improve the asset security of the poor by implementing a
housing program for the lowest-income population (World Bank 2006a).
Mitigate—Good Practices in Risk Reduction through Mitigation
In addition to early response, evacuation, and sheltering, community actions may
also be more proactive, engaging citizens and governments to work together to
build resilience. Disaster mitigation, seen as activities that will reduce the impact
of a disaster is generally linked to “good urban service delivery.” Good develop-
ment is not only what governments must do but also what they allow and support
at the local level.6 Th is is especially the case where local government lacks capac-
ity and funding for needed investments. For disaster risk reduction and climate
change adaption, there is a need to look at how people on the ground are taking
care of their risks, understanding risk, and developing (household and collective)
mechanisms to address risk. It is very diffi cult to reduce disaster risk without
strong local organizations that tailor responses to the specifi cs of each location
and the needs of those most at risk. Similarly, it is diffi cult to respond eff ectively
to a disaster if the response is centralized and local organizations are not strong
and supported.
Flood Management and Urban Planning
Tanzania—Opening up the Dialogue for Larger Government Support
In Dar es Salaam, the African Urban Risk Analysis Network (AURAN) car-
ried out three case studies related to mainstreaming disaster risk management
in urban planning practices. Included among them were successes related to
the local communities requesting drainage pipes from local governments and
community-based organizations building drainage systems. Building upon
this, the AURAN project started working on the planned and unplanned
settlements of Bonde la Mpunga, where residents have organized themselves
to tackle the problem of local fl ooding (Kiunsi et al. 2009b). Th e local com-
munity established a seven-member Flood Control Committee to address the
fl ooding risk, but its lack of legal mandate made it diffi cult to solicit funding
for local improvements. While the committee did not receive support from the
higher levels of government and several of their poorly executed interventions

ANNEX 3: LEARNING FROM PROJECT AND PROGRAM EXPERIENCES ■ 161
failed to solve the fl ooding problem, the committee’s correspondence with the
media opened a dialogue with the municipal government concerning local
fl ooding.
Motivated by this dialogue and recognizing the risks of fl ooding, the Tanza-
nian government requested World Bank support in urban upgrading. Th e World
Bank is currently fi nancing loans to the central government for implementing
Community Infrastructure Upgrading Programs (CIUP) throughout Dar es
Salaam (World Bank 2004a). Targeting unplanned areas in the Ilala, Temeke, and
Kinondoni municipalities, communities have selected technical improvements,
including roads, drains, and public toilets. CIUP is an extensive program that
focuses on improving physical access, complete with the associated surface water
drainage and street lighting. Th e new community infrastructure allows safe access
to homes on a regular and emergency basis; roadside and select collector drains
dramatically decrease street fl ooding, and the street lights provide public safety
in areas that residents did not previously perceive as safe. Under the fi rst phase of
CIUP, 16 sub-wards of Dar es Salaam were upgraded. Covering 453 hectares, the
fi rst phase benefi ted approximately 170,000 residents. Under the second phase
of CIUP, which commenced in July 2010, an additional 15 sub-wards will be
upgraded. Th is phase, covering 554 hectares, will benefi t an additional 150,000
people; it is scheduled for completion by the end of 2011.7
Mozambique—Joint International and Local Effort for Urban Upgrading
In Quelimane City, local communities have partnered with the City Council and
international organizations for urban upgrading. Quelimane City has a popula-
tion of approximately 240,000 and is located in the Zambezi delta, Mozambique
(City Council of Quelimane 2006; Cities Alliance 2008; Grimard 2006–2008).
It suff ers from cyclical fl oods, due to the combination of a high water table and
heavy rain; 80 percent of its population lives in informal housing. Quelimane
City, with support from Cities Alliance, embarked on the preparation of an urban
upgrading strategy that had a special focus on water and sanitation. Th e strategy
also included interventions in drainage, road network, and waste management.
Th e Improving Water and Sanitation in Quelimane City, Mozambique, program
was designed to be the fi rst phase of an urban-upgrading program that, through
demonstration eff ects, increased local capacity, and additional outside funding,
could be scaled up across the city.
Th is program involved organizations working in partnership: UN-HABITAT
acted as the implementing agency through its local offi ces; the project was coor-
dinated with the World Bank’s Municipal Development Project, which was
already active in Quelimane; other partners included the Danish International

162 ■ CLIMATE CHANGE, DISASTER RISK, AND THE URBAN POOR
Development Agency (DANIDA), UNICEF, and WaterAid. Th e City Council of
Quelimane provided an in-kind contribution of US$100,000 (by providing offi ce
space, equipment, a meeting room, technical and administrative staff , and vehi-
cles). Th e residential community provided an in-kind contribution of $150,000
(through subsidized manpower, awareness campaigns, operational management
teams, and reduced plot size or, in extreme cases, moving to another area because
of improvement works). UN-HABITAT, the World Bank, DANIDA, UNICEF,
and WaterAid together contributed $440,000 in cash and in kind. Other in-kind
contributions totaling $30,000 were secured from a state water supply institution,
and from a private-sector fi rm that made its trucks available during weekends
in exchange for paying for only fuel and the driver. Th is novel and complicated
institutional mix presented some challenges of coordination, including between
Quelimane institutions themselves—particularly the City Council and commu-
nity committees. Coordination could not be taken for granted, and it was neces-
sary to establish rules and mechanisms for dialog between them.8
Senegal—Combining Efforts between Community Organizations, NGOs, and Local and National Government Agencies in Saint Louis
An example from the city of Saint Louis, Senegal, shows how fl ooding can
be addressed through the combined and coordinated eff orts of community-
organizations, NGOs, and local and national government agencies. Saint Louis
is Senegal’s former national capital, with 180,000 inhabitants in 2002. Th e city
is constructed around water, on three islands cut off from each other by the
branches of the Senegal River, its tributaries, and the Atlantic Ocean. Some areas
of the city are less than 2.5 meters above mean sea level. Th e city has experienced
recurrent fl ooding since 1990, from the rains and from peak fl ows in the Senegal
River. Th e rising river level is the product of many factors, including the silting
up of the river bed; the disposal of household waste into the river; the reduced
area available to fl oodwater irrigation (as unplanned urbanization means these
areas are now occupied by housing); and a shallow water table that rises to the
surface when the river swells and drains poorly during the winter season. Flood-
ing generally aff ects areas inhabited by the lowest-income groups. Many are rural
migrants who occupy sites not intended for residential use.
Stagnant rainwater in the fl ooded areas—less than 10 percent of the popu-
lation live in homes with sewer connections—combined with a lack of clean
water, inadequate drainage, and wastewater and solid-waste management—only
30 percent of households have a regular solid-waste collection service—brings
serious health impacts. To these are added the proliferation of disease vectors,
such as fl ies and mosquitoes. Poor hygiene and high levels of overcrowding
compound the risks.

ANNEX 3: LEARNING FROM PROJECT AND PROGRAM EXPERIENCES ■ 163
Th e strategy of the Senegalese NGO Enda-Tiers Monde in response to fl ooding
in Saint Louis has been based not on building infrastructure (for instance, some
areas are protected by dykes), but on strengthening local governance. Stakehold-
ers have been brought together to discuss the problems they face and exchange
views to fi nding solutions to problems that are beyond their individual skills or
capacities. An action plan has been developed and implemented by all stakehold-
ers, managed by a steering committee, which includes information, education,
and communication, raising the awareness of the local people. Plays, exhibitions,
media broadcasts, teatime “chats,” interviews, photographic exhibitions, and
open-air conferences have been used for this. Local civil-society organizations
(including women’s groups, youth associations, dahiras—religious groups) all
organize in the fl ood-prone neighborhoods to mitigate the eff ects of fl ooding
through. Mitigation includes (1) digging paths to evacuate stagnant water, (2)
regularly maintaining drainage channels, (3) disinfecting stagnant water, in asso-
ciation with the National Hygiene Department, or (4) placing sandbags to help
inhabitants get about within the neighborhood itself.
Th e authorities also use local labor for some drainage works, and women’s
groups are involved in awareness raising in order to combat diarrhea and to pre-
vent malaria and other diseases. NGOs work closely with the state’s decentralized
structures (health and sanitation departments, fi re brigade, etc.) to raise aware-
ness and change the population’s behavior (Khady 2007; ISDR 2009).
Water Supply and Sanitation
Pakistan—Local Government-Civil Society Partnerships to Provide Sanitation and Drainage in Karachi
Th ere are programs that focus on social asset-building to improve water and
sanitation services, making communities more resilient to disaster impacts.
Th e Orangi Pilot Project Research and Training Institute (OPP-RTI) of Paki-
stan supports slum dwellers and local governments in planning, implementing,
and fi nancing basic sanitation (ISDR 2009). For the residents of informal settle-
ments, OPP-RTI helps them to reduce to cost of household sanitary latrines or
neighborhood sewers through design modifi cation and the elimination of out-
side contractors. For governments, OPP-RTI supports them to plan and fi nance
transport and treatment of the sewage from neighborhood collector sewers.
Approximately 300 communities have fi nanced, managed, and constructed their
own internal sanitation systems, allowing government agencies to eff ectively
channel their resources to larger external infrastructure. Th is illustrates a par-
ticularly important aspect for local government programs—how the design and

164 ■ CLIMATE CHANGE, DISASTER RISK, AND THE URBAN POOR
implementation of piped water, sewers, and drains within informal settlements,
which is diffi cult and expensive for government agencies, can be done far quicker
and cheaper by supporting residents to manage it and fi nance it themselves.
Th ese activities have brought major benefi ts to large sections of the urban poor
in Karachi.
Wastewater Management and Energy
Bolivia—Urban Adaptation and Climate Mitigation in Santa Cruz
In addressing climate change, there can be overlap between mitigation and adap-
tation. For the urban poor, proper wastewater management is critical to reduce
contamination and the health problems exacerbated by density. Two World Bank
projects respond to the urgent sanitation challenges in Santa Cruz de la Sierra—a
city of 1.3 million people in Bolivia, growing at 6 percent each year. Sanitation
services are provided by 10 cooperatives—some of which have been recognized
as among the best in Latin America—but which give an overall level of sewerage
coverage of only 32 percent. Th is means a high risk of infi ltration into the city’s
main aquifer, which would result in irreversible damage to the city’s water supply.
Increased coverage of Santa Cruz’s sewerage system will also result in avoided
costs of developing an entirely new water supply source for the city.
Th e fi rst project—Bolivia Urban Infrastructure—aimed to improve the access
to basic services by the urban poor in Bolivia’s major cities, through targeted
infrastructure investments and the provision of technical assistance to munici-
palities in planning, expanding, and sustaining urban services. Part of this project
involves the expansion of sewerage coverage in the poor areas of Santa Cruz, by
increasing the capacity of four wastewater treatment plants. Th ese plants use a
lagoon treatment system, which uses anaerobic bacteria to break down organic
matter. Unfortunately, this process produces methane—a powerful greenhouse
gas that contributes to climate change.
Th e second project—Urban Wastewater Methane Gas Capture—involves cov-
ering all four large anaerobic treatment lagoons with high-density polyethylene
“geomembrane” sheeting, supported by a system of fl oats and tubes. Th ose tubes
are perforated and are used to capture gas from the lagoons—estimated at more
than 44,000 tons of CO2 per year—which is then transported, via interconnect-
ing pipes, to a fl are. Th e polyethylene covering also raises the temperature of the
lagoon, thus optimizing anaerobic digestion, and increasing the throughput of
the treatment plant.
Th is latter project will be funded by an emission-reduction purchase of
$2.09 million by the Community Development Carbon Fund (CDCF) and the

ANNEX 3: LEARNING FROM PROJECT AND PROGRAM EXPERIENCES ■ 165
Bio Carbon Fund. Th e CDCF allows industrialized countries to “purchase”
emissions reductions from developing countries. Th at principle is adopted
from the Clean Development Mechanism of the Kyoto Protocol, which devel-
oped a framework for emissions-reductions purchases until 2012; the CDCF
extends that principle beyond 2012. In addition, the CDCF aims to ensure
that communities are empowered to play an active role in the delivery of ser-
vices that help improve their livelihoods and reduce poverty—by identifying,
implementing, and monitoring those services. Th e local cooperative SAGUA-
PAC will receive the proceeds from this purchase, and will be responsible for
implementing the project, which is estimated to cost $1.48 million to install,
and $24,000 a year to operate and maintain.
Th e project to capture methane leverages the World Bank’s considerable expe-
rience in fi nancing projects to capture and fl are methane gas from landfi ll sites,
and in dealing with the certifi cation of emissions reductions under the Clean
Development Mechanism. It is hoped that the Bolivian government will be able
to pursue similar projects elsewhere, using the knowledge and skills it will have
accrued in Santa Cruz (World Bank 2006b, 2007).
Water Supply and Energy Effi ciency
India—Generating Carbon Revenue while Improving Access to Basic Services
Improving basic services for the urban poor can result in co-benefi ts for climate
mitigation and adaptation. In the case of Karnataka, India, emission reductions
were achieved while increasing access to water. Karnataka is a state in south-
ern India, with an urban population of approximately 18 million people.9 Th at
population has grown by 29 percent over the last decade, and continues to
grow—creating an urgent need to improve urban services. Ninety-four percent
of Karnataka’s urban population has some access to water supply, but this access
is usually less than four hours a day. Th e poor service is due mostly to ineffi cient
production and distribution of water, which create high costs and results in abso-
lute shortages.
Th e government of Karnataka is already engaging in substantial eff orts to
improve its urban water supply, through investment programs, institutional and
fi nancial reforms, and an improved water tariff framework that emphasizes cost
recovery. Indeed, the government has foreseen great room for improvement by
tackling ineffi cient energy use, given that electricity represents more than half
the operation cost of Karnataka’s water supply. Not only does this mean higher
operational costs, it also means unnecessary greenhouse gas (GHG) emissions,
166 ■ CLIMATE CHANGE, DISASTER RISK, AND THE URBAN POOR
since the municipal water pumps are powered by fossil-fuel electricity from the
national grid.
Th e Karnataka Municipal Water Energy Effi ciency Project represents an eff ort
to reduce emissions and operational costs. Th e project addresses key ineffi cien-
cies in the current system: ineffi cient and outdated pumping systems, improperly
sized pumping systems, poor maintenance, operation at suboptimal loads, and
high frictional losses through redundant pumps, pipes, and valves. Th e system
is being improved by installing new and more effi cient pumps; properly sizing
pumps and components; improving electrical effi ciency (for example, through
power factors correction and standby transformers); better metering and moni-
toring; and reducing water leakage in the main pipes into the cities. Th is project is
being implemented in six cities: Belgaum, Gulbarga, Hubli/Dharwad, Mangalore,
Bellary, and Mysore. Total energy savings are estimated at more than 16 million
KWh. Total emissions reductions are estimated at more than 13,000 tons of CO2.
Capital investments will be made by a local actor—the Karnataka Urban Infra-
structure Development and Finance Corporation (KUIDFC)—and the resulting
emissions reductions will be purchased by the Community Development Car-
bon Fund (CDCF), of which the World Bank is a trustee. Th e capital investment
cost of the project is estimated to be US$4.5 million. Th e CDCF is expected to
purchase approximately 60,000 emissions reduction (ER) units from the project
(the fi nal number is to be confi rmed aft er negotiation of an Emission Reduction
Purchase Agreement). Depending on the certifi ed emissions reductions price,
the gross revenue will amount to between US$600,000 and US$900,000, which
will be shared among participating municipalities.
Neighborhood Upgrading
Vietnam—Engaging the Community in Resilient Urban Upgrading
Since 2004, the World Bank has loaned Vietnam more than US$375 million to
support its National Urban Upgrading Programs (VUUP), and there is currently
a proposal for an additional US$395 million to expand activities to the Mekong
Delta Region.10 Th e programs aim to improve the eff ectiveness, accessibility, and
sustainability of urban services through priority investments in urban upgrad-
ing, environmental improvement, and institutional strengthening at the urban
level (World Bank 2004b). Vietnam is one of the most hazard-prone areas in Asia,
due to its tropical monsoon location and topography. Typhoons and fl ooding are
the most frequent hazards faced in Vietnam, where populations and economic
activities are concentrated along the coastline and in low-lying deltas. In low-
income urban areas, such as the Tan Hoa-Lo Gom Canal area of Ho Chi Minh,

ANNEX 3: LEARNING FROM PROJECT AND PROGRAM EXPERIENCES ■ 167
heavy rains typically inundate homes with a mix of sewage and storm water up to
a meter deep. Th e VUUP focuses on engaging local communities in the critical
stages of preparation, design, and implementation while seeking to improve the
living conditions of all residents, regardless of their registration status. Using a
multi-sector approach, the project aims to provide or rehabilitate infrastructure
and housing in low-income areas through capacity building in the local govern-
ment and through partnerships with communities.
Th e fi rst major investment, of US$222 million, supports upgrading low-
income communities in four cities: Can Th o, Hai Phong, Nam Dinh, and Ho
Chi Minh, including the Tan Hoa-Lo Gom Canal area. Th e project seeks, among
other things, to conduct an integrated upgrading of basic infrastructure at the
neighborhood level, such as drainage, waste-water collection, electricity and
lighting, street-access improvements, and water supply, as well as the provision of
social services, such as schools, pre-schools, and health centers in targeted low-
income communities.
Th e lessons learned in this fi rst stage of VUUP activities informed similar
projects in the area of Da Nang, the fourth-largest urban area in Vietnam (World
Bank 2008b). Among the lessons carried over, the need for active community
participation, minimization of relocation and resettlement, and the design of
infrastructure to an appropriate technical standard that is still aff ordable to the
communities. Th e second phase of the project supports the upgrading of ter-
tiary infrastructure, the development of three resettlement sites, microfi nance for
housing improvement, and improved drainage systems.
Th e current pipeline proposal to expand the VUUP to the Mekong Delta region
would focus on the provinces of Can Th o, My Th o, Kien Giang, Tra Vinh, Dong
Th ap, and Ca Mau (World Bank 2010). Th e expected measureable outcomes of
the project include improved environmental conditions, improved quality of life,
increased access to fi nancing for housing improvements, greater tenure security,
and improved capacity at the national level to manage urban systems.
Job Creation
Liberia—Reducing Vulnerability to Natural Disasters while Creating Job Opportunities for the Poor
In 2006, Mercy Corps initiated their Cash-for-Work program in Liberia to pro-
mote drainage maintenance. Prior to the initiation of this program, heavy rains
would frequently trigger fl ooding in both urban and rural areas. Cleaning the
drains was not a government priority, and the drainage systems had not been
properly maintained for decades due to lack of funds and civil war. Th e one-year

168 ■ CLIMATE CHANGE, DISASTER RISK, AND THE URBAN POOR
program was launched in fi ve counties, generating more than 17,800 days of
employment and greatly improving both drainage and the availability of clean
water (ISDR 2009). Since 2008, the World Bank has supported the Cash for
Work Temporary Employment Project (CfWTEP) in Liberia, through the Libe-
ria Agency for Community Empowerment (LACE). Funding in the form of a
US$3 million grant was made available through the Food Price Crisis Response
Trust Fund, to provide income support to vulnerable households. Over the
course of two years (October 2008–2010) approximately 17,000 workers have
been employed to clear drains, sweep streets, repair culverts, and perform other
public maintenance (Zampaglione 2008).
Transfer—Recent Practices in Risk Defl ection
In the developing world, disasters can suddenly wipe out decades of development
gains. Relief, recovery, and reconstruction can be extremely taxing on available
resources for both governments and individuals, despite the leveraging of inter-
national aid. In some cases, individuals and governments may spread the cost of
risk or damages across a population or time by establishing individual insurance
or catastrophic risk pools.
El Salvador—Self and Community-based Insurance
In the World Watch Institute’s State of Our World 2007, Christine Wamsler out-
lines how self-insurance is much more prevalent than formal insurance in the
slums of El Salvador, as most residents are employed in the informal sector and
therefore illegible for the national social-security system. Self-insurance coping
strategies in El Salvador include having many children, encouraging family mem-
bers to migrate to the United States to provide remittance income, and stock-
piling building materials that can be used or resold. Wamsler estimates that in
addition to free help or materials, households spend an average of 9.2 percent of
their income on risk reduction. In a more communal context, some Salvadorans
choose to contribute to community emergency funds or join religious institutions
that traditionally off er post-disaster help. Th ere are, however, cases where slum
dwellers employed in the informal sector obtain certifi cates of employment from
entrepreneurs that allow them to pay into the national social-security system.
Colombia—Innovation in Risk Management
In contrast to the preceding scenario, Manizales, Colombia, has arranged for
insurance coverage to be extended to the urban poor through municipal tax

ANNEX 3: LEARNING FROM PROJECT AND PROGRAM EXPERIENCES ■ 169
collection. Any city resident may purchase insurance for their property, and
aft er 30 percent of the insurable buildings participate, the insurance cover-
age is extended to tax-exempted properties, including properties with cadas-
tral value of 25 monthly salaries or less (estimated at US$3,400). Despite the
municipal administration collecting a handling fee of 6 percent, the insurance
company has a direct contractual relationship with the individual taxpayer
and bears responsibility for the all claims (Fay, Ghesquiere, Solo 2003).
Many of the cities with the strongest programs for reducing disaster risks
come from Latin America. Th e city of Manizales provides an example of a city
government committed to partnering with the community for disaster risk
reduction. Th is included involving the population in each district in risk map-
ping and responses, as well as discussions that brought together all key local
stakeholders. Th e risk mapping of each district identifi ed risk zones and settle-
ments particularly at risk from landslides. Th e city government then worked with
the inhabitants to relocate them to safer sites and convert the land at risk into
neighborhood parks with measures to stabilize the slopes (Velasquez 1998). A
hundred and twelve women were trained as “guardians of the slopes” to create
and maintain slope stabilization in their neighborhood and to report on prob-
lems. Environmental observatories have been created in each of the 11 comunas
into which the city is divided to support public engagement and implementation
of the city’s environmental plan. Th e comunas monitor progress on environmen-
tal conditions, with progress summarized and displayed publicly in a simple set
of indicators—the environmental traffi c lights (semaforos ambientales) (Velas-
quez Barrero 2010). Th e city also introduced collective voluntary insurance to
allow low-income groups to insure their buildings; the city government has an
agreement with an insurance company and allows any city resident to purchase
insurance through municipal taxes (Velasquez 1998).
Turkey—Liquidity for Post-Disaster Relief and Reconstruction
At the national level, countries have the opportunity to participate in public insur-
ance, such as catastrophic risk fi nancing. Established before disaster impacts, cat-
astrophic risk fi nancing can provide governments with immediate liquidity for
post-disaster relief and reconstruction. Th e World Bank and the Global Facility
for Disaster Risk Reduction (GFDRR) have been helping governments participate
in catastrophic risk fi nancing as part of larger disaster risk management (Cum-
mins and Mahul 2008). Th e World Bank Independent Evaluation Group cites the
Turkish Catastrophic Insurance Pool (TCIP) as a successful project, which has
tripled the insurance penetration for earthquake coverage in Turkey. Established
following the 2000 Marmara earthquake, the TCIP has an annual premium of
US$20, despite covering up to $1 billion in damages in a disaster (IEG 2006).

170 ■ CLIMATE CHANGE, DISASTER RISK, AND THE URBAN POOR
Caribbean Islands—Multi-country Partnership for Risk Financing
For small countries for which a natural disaster could cause damage signifi cantly
larger than their national economy, there is the option of sovereign risk fi nanc-
ing. Th e Caribbean Catastrophe Risk Insurance Facility (CCRIF), the fi rst multi-
country risk pool in the world, is a regional insurance fund designed to mitigate
the fi nancial impact of hurricanes or earthquakes by providing immediate liquid-
ity. Th ere are 16 member nations: Anguilla, Antigua & Barbuda, Bahamas, Bar-
bados, Belize, Bermuda, Cayman Islands, Dominica, Grenada, Haiti, Jamaica,
St. Kitts & Nevis, St. Lucia, St. Vincent & the Grenadines, Trinidad & Tobago,
and the Turks & Caicos Islands. During its fi rst season of operation, the 2007
hurricane season, one earthquakes triggered payouts for two countries, and the
Facility was able to make funds available within two weeks of the event (World
Bank 2008a).
Central America—Securing Flexible Funding for Disaster-induced Emergency
Recently, the International Bank for Reconstruction and Development (IBRD)
has off ered Catastrophe Risk Deferred Drawdown Option, or CAT DDO, as
a new product to middle-income country governments with disaster risk-
management programs in place. Countries can access the funds if they declare a
disaster-induced state of emergency. Th e maximum amount available is US$500
million, or 0.25 percent of a country’s gross domestic product, whichever is
smaller. Loan pricing is in line with standard IBRD terms, which include a 0.25
percentage point front-end fee. Th e funds may be drawn down over a three-
year period, which may be renewed up to four times for a total of 15 years.
Th ere are currently CAT DDOs under development in the Central American
countries of Panama, El Salvador, and Costa Rica.11
Recover—Good Practices in Building-Back-Better
Aft er a disaster in which there is widespread destruction of housing and infra-
structure, government agencies are oft en keen to rebuild. Large programs to
reconstruct houses aft er disasters mirror many of the limitations of public hous-
ing programs, including a refusal to rebuild on the sites preferred by those they
are built for (post-disaster where the survivors previously lived or close by) and
the use of distant sites far from survivors’ livelihoods. Residents may be frustrated
by inappropriate designs and unfamiliar building materials. Costs are oft en high,
as those with the greatest incentive to manage costs (that is, local residents) are

ANNEX 3: LEARNING FROM PROJECT AND PROGRAM EXPERIENCES ■ 171
not included in decision making; for the same reason, there are frequent con-
cerns with the quality of building materials and construction.12
An alternative approach to reconstruction is “owner-driven development.”
Here, external agencies work with owners to support them in rebuilding their
housing, drawing on the successful experiences with upgrading. Th is helps
speed up responsive household-led reconstruction through providing additional
resources (cash or building materials) and in some cases technical assistance
(in part to improve the ability of houses to build in resilience to local hazards).
Costs are kept down as local skilled building workers are used and families help
with unskilled labor and, where possible, the use of recovered materials. Yet this
approach may also only serve property owners and live tenants unprotected
(Lyons 2008; Lyons and Schilderman 2010).
A third approach to reconstruction is for local governments and external
agencies to engage community organizations in identifying strategies to support
construction and physical improvements. Here, there are very good possibilities
for “building-back-better” to remove or greatly reduce disaster risk. A superfi cial
community process will not successfully manage the reconstruction in a way that
prevents the benefi ts from being secured by a few. Locally managed inclusive and
representative groups have to be able to manage both fi nances and construction
if they are to be successful in addressing their members’ shelter needs. Th ey need
to be able to understand the regulatory context and identify the required amend-
ments, and to negotiate with politicians and offi cials. Here, it is also possible for
all those aff ected to be part of the building-back-better. For instance, in Mandaue,
which was destroyed by a fi re, the inhabitants were organized (and supported by
the Homeless People’s Federation of the Philippines) and they re-blocked their
settlement and provided for long-term tenants as well as owners (Rayos and
Christopher 2010).
Indonesia—Channeling Reconstruction through Community-based Institutions
Somewhat hidden from the world by the ongoing fl urry of Aceh tsunami
recovery, the 2006 Java earthquake, with a magnitude of 6.3 on the Richter
scale, was nevertheless an enormously destructive event. Over 350,000 residen-
tial units were lost and 5,760 persons were killed, most from the collapse of
non-engineered masonry structures. Using lessons learned from the tsunami
experience and resources from the Community-based Settlements Rehabili-
tation and Reconstruction project in Aceh supported by the World Bank, the
Indonesian government was able to response quickly and effi ciently. Facilitators
were recruited and villages elected boards of trustees, which later were instru-
mental in organizing community meetings and supervising implementation.

172 ■ CLIMATE CHANGE, DISASTER RISK, AND THE URBAN POOR
Key activities included (1) identifying benefi ciaries and prioritizing the most
vulnerable and poorest; (2) establishing community housing groups of 10 to
15 families, and deciding on a coordinator, secretary, and treasurer for each
group to be accountable for the use of grants; (3) developing detailed plans to
use the construction grants for each group, and preparing group grant applica-
tions; (4) opening group bank accounts; and (5) approving plans, disbursement
in tranches, and group procurement, construction, and bookkeeping. Train-
ing was provided to community members and local workers, as earthquake-
resistant construction required consistent construction techniques. Later, the
community developed plans to rebuild community infrastructure and facili-
ties, with a particular focus on disaster resilience. Communities conducted self-
surveys, prepared thematic maps, analyzed needs and disaster risks, reached
consensus on priority programs, and established procedures for operations and
maintenance. Grants for infrastructure were also disbursed in tranches through
local banks as work progressed.13
An adequate understanding of rules and a sense of ownership by the com-
munity were essential to ensuring good targeting and plans, accountability,
and social control of implementation. Th e involvement of women increased
accountability and enhanced the appropriateness of technical solutions. Th e
role of facilitators is crucial, as they ensure eff ective communication and adapt-
ability of the program to local situations, as well as compliance with program
principles. In all, 6,480 core houses were funded under UPP, and the multi-
donor Java Reconstruction Fund funded another 15,153 units using, among
other sources, a loan from the World Bank (P103457). Th is approach to recon-
struction became the model for the much larger government-fi nanced reha-
bilitation and reconstruction program, under which about 200,000 houses
were rebuilt in Java.14
Volunteer Technology Communities
In 2010 the disaster risk-management communities saw the rise of the “humani-
tarian technologist”: Regular technicians all over the world motivated to col-
laborate in post-disaster information gathering (GFDRR 2011). Volunteer
Technology Communities (VTC) uses fl attened, decentralized structures of
decision-making and confl ict and confl ict-resolution mechanisms that were
adapted from online communities like Wikipedia and open-source soft ware
development projects. For instance, aft er the Haiti earthquake the World Bank
facilitated the mobilization of hundreds of volunteers through the Global Earth
Observation—Catastrophe Assessment Network (GEO—CAN), which devel-
oped a comprehensive and rigorous damage analysis (GFDRR, 2011). Other
ANNEX 3: LEARNING FROM PROJECT AND PROGRAM EXPERIENCES ■ 173
promising examples of VTCs include Random Hacks of Kindness (RHoK)—a
partnership among Google, Microsoft , Yahoo, NASA, and the World Bank—and
Crisis Commons, an international network of professionals drawn together by
emergencies like the earthquakes in Chile and Haiti, the oil spill in Louisiana,
and the fl ooding in Pakistan.
Lessons Learned and Recommendations
As climate change and disaster are expected to exacerbate existing inequalities,
the most important takeaway from this review is that city managers should not
view climate or disaster impacts as independent actions, but rather as impetus to
improve the overall living conditions of the poor. Perceived vulnerability, widely
considered the primary driver in adaptation planning, refl ects the inability of
communities or individuals to react to the external forces on their well-being
(Satterthwaite et al. 2007). To be proactive rather than reactive, governance
practices should aim at providing the basic services, safeguards, and education
to the urban poor, supporting their adaptive capacity (Adger et al. 2003). Back-
logs in providing infrastructure and services in cities in low- and middle-income
nations can be addressed through partnerships between local governments and
community organizations. Th is section has given many examples of partnerships
between community organizations formed by the residents of informal settle-
ments and local governments in providing services. Th is meant a choice by these
community organizations to work with government and a choice by government
offi cials and agencies to stop seeing the residents of informal settlements as prob-
lems but start seeing their residents’ organizations as contributors to good solu-
tions to local and citywide problems.
A growing number of cities around the world have produced climate strate-
gies that focus on mitigation techniques, since adaptation policies are harder
to isolate, falling across agency and jurisdictional lines (Roberts 2008). Sev-
eral cities, however, that do focus on adaptation, and take vulnerability into
account, include New York (NYCPCC 2010), London (City of London 2008),
Cape Town (City of Cape Town 2006), and Durban (Katich 2009). While much
of this annex has highlighted interesting actions on the ground, these are a few
of the cities using climate adaptation and disaster risk to reassess government
activities—and gaining new perspective in relation to how planning can aff ect
the urban poor. For cities that aim to alleviate climate and disaster risks for the
urban poor, the good practices outlined here suggest that improving resilience
requires cities to improve services and allow risk to inform future investments
and development.

17
4
■
CL
IMA
TE
CH
AN
GE
, DIS
AS
TE
R R
ISK
, AN
D T
HE
UR
BA
N P
OO
R
TABLE A3.1 Matrix of Recent Practice Cases
Activity Country/ region Area of action Good practice
Information, knowledge sharing, education and training
Climate Resilient Communities Program United States Planning, assessment Builds off an existing global mitigation network Capacity Strengthening of Least Devel-oping Countries for Adaptation to Climate Change (CLACC) Program
Africa and South Asia
Planning, assess-ment
Network of international experts working to strengthen organiza-tions in least-developed countries and support their sustainable development initiatives
Asian Cities Climate Change Resilience Network (ACCRN)
Asia Planning, assess-ment
Shared Learning Dialogue (SLD) engages community actors and government agencies to explore their current and future vulner-abilities in a transparent and iterative group discussion. The SLD outcome focuses on creating a shared understanding of risk and priorities for action.
Climate Resilient Cities (CRC) Primer East Asia Planning, assess-ment
Guidance for local governments for identifying “hot spots”
ISO 31000 World Framework, stan-dards
Seeks to provide a universally recognized set of standards for organizational risk management
Risk identifi cation
Local Resilience Action Plan (LRAPs) Vietnam Planning, assess-ment
Guiding local governments through the assessment of climate change and disaster risk impacts and presenting the challenges of climate change and disaster in a format that local governments can use to present complex issues to their constituents
Philippines Homeless People’s Federation
Philippines Planning, assess-ment, data collection
Identifi cation of at-risk communities and help provide documenta-tion on informal settlements for which there is little or no offi cial data
Vulnerability mapping in Cuttack India Data collection Community-driven data collection and mapping using GIS systems

AN
NE
X 3
: LE
AR
NIN
G F
RO
M P
RO
JE
CT
AN
D P
RO
GR
AM
EX
PE
RIE
NC
ES
■
1
75
Risk reduction: preparedness
Mancomunidad de los Municipios del Centro de Atlantida (MAMUCA)
Honduras Early-warning systems
Municipalities working together to identify risks, raise awareness, prioritize reconstruction, encourage local decision making in a pub-lic forum, and engage in national risk management; establishment of local emergency committees (CODELs) to practice early-warning and evacuation drills
Caracas and Buenos Aires early-warning systems
Venezuela Early-warning systems
Establishment of early-warning systems to alert the poor living in landslide- and fl ood-prone areas
Argentina Urban Flood Prevention and Drainage Project
Argentina Early-warning, forecasting, housing programs
Development of a city risk-management program for Buenos Aires; second phase will improve the asset security of poor
Risk reduction: mitigation
Community Infrastructure Upgrading Programs (CIUP)
Tanzania Community engage-ment in disaster risk reduction (DRR)
CIUP is an extensive program that focuses on improving physical access, as prioritized by the communities themselves.
Improving water and sanitation in Quelimane City, Mozambique
Mozambique Water, sanitation, transport
Creating partnerships with a broad range of stakeholders to im-prove water, sanitation, and road networks
Local government strengthening in Senegal
Senegal Local governance, fl ood management
Preparing community-driven action plans to mitigate the effects of fl ooding
Orangi Pilot Project Research and Training Institute (OPP-RTI) of Pakistan
Pakistan Water, sanitation Reduce the cost of household sanitary latrines or neighborhood sewers through design modifi cation and the elimination of outside contractors
Bolivia Urban Infrastructure Project and Urban Wastewater Methane Gas Capture Project
Bolivia Sanitation Expansion of sewerage coverage in poor areas of Santa Cruz, by increasing the capacity of four wastewater-treatment plants, and collecting methane for CDM purposes
(continued next page)

17
6
■
CL
IMA
TE
CH
AN
GE
, DIS
AS
TE
R R
ISK
, AN
D T
HE
UR
BA
N P
OO
R
Karnataka Municipal Water Energy Ef-fi ciency Project
India Energy, water Addresses key ineffi ciencies in the current system: ineffi cient and outdated pumping systems, improperly sized pumping systems, poor maintenance, operation at suboptimal loads, and high fric-tional losses through redundant pumps, pipes, and valves
Vietnam National Urban Upgrading Programs (VUUP)
Vietnam Transportation, disaster risk, sanita-tion, water
Focuses on engaging local communities in the critical stages of preparation, design, and implementation while seeking to improve the living conditions of all residents
Cash-for-work programs Cash for Work Temporary Employment Project
Liberia Job creation, sanita-tion, water
Reducing poverty through job creation to maintain water and sanitation infrastructure
Risk transfer
Self and community-based insurance El Salvador Insurance Creation of community emergency fundsManizales insurance for the urban poor Colombia Insurance After 30 percent of the insurable buildings participate, insurance
coverage is extended to tax-exempted properties.Turkish Catastrophic Insurance Pool (TCIP)
Turkey Catastrophe risk Prior to a disaster, governments can secure a line of credit for immediate liquidity that can be used for post-disaster relief and reconstruction.
Caribbean Catastrophe Risk Insurance Facility (CCRIF); Turkish Catastrophic Insurance Pool (TCIP)
Caribbean Islands; Turkey
Catastrophe risk Provide governments with immediate liquidity for post-disaster relief and reconstruction
Catastrophe Risk Deferred Drawdown Option (CAT DDO)
Central America Catastrophe risk Countries can access the funds if they declare a disaster-induced state of emergency.
Recover
Java Reconstruction Fund Indonesia Reconstruction Community-based resettlement and reconstruction in JavaVolunteer Technology Communities (VTCs)
World Post-disaster as-sessments
Communities of software developers, engineers, and technology enthusiasts who are using innovative methods and tools to help save lives in the aftermath of natural disasters.
TABLE A3.1 continued
Activity Country/ region Area of action Good practice
ANNEX 3: LEARNING FROM PROJECT AND PROGRAM EXPERIENCES ■ 177
Notes
1. http://www.undp.org/climatechange/adapt/defi nitions.html#15
2. Th is approach has also been shown eff ective in disaster risk reduction and in post-
disaster response, as discussed in later sections of this paper.
3. Th is draws on ISDR, 2011 Global Assessment Report on Disaster Risk Reduction.
4. Th is is drawn from Rayos and Christopher (2010) and PHPF (2010).
5. Th is is drawn from Livengood (2011) and from fi eld visits to Cuttack by David Sat-
terthwaite in June and October 2010.
6. Th is paragraph draws on Archer and Boonyabancha (2010).
7. Personal communication with Barjor Mehta, 2010.
8. Unfortunately an application to the European Union for €1.5 million of funding was
not successful, and so it remains uncertain whether the second, scaled-up phase of the
program will be pursued.
9. World Bank (2009) and personal communication with Da Zhu (2009).
10. Th is includes the 2004 Vietnam Urban Upgrading Project and the 2008 Da Nang Pri-
ority Infrastructure Investment Project.
11. World Bank. Background note: Catastrophe Risk Deferred Drawdown Option (DDO),
or CAT DDO. http://go.worldbank.org/G41ZXJZO30.
12. Th is section draws heavily on Archer and Boonyabancha (2010).
13. Communication with Sri Probo Sudarmo, World Bank, Indonesia.
14. Communication with Sri Probo Sudarmo, World Bank, Indonesia.
References
Adger, N., S. Huq, K. Brown, D. Conway, and M. Hulme. 2003. “Adaptation to Climate
Change in the Developing World.” Progress in Development Studies 3 (3): 179–195.
Agarwal, Siddarth. 2011. “Health and Inequality in Urban Populations in India.” Environ-
ment and Urbanization 23 (1).
———, and K. Sangar. 2005. “Need for Dedicated Focus on Urban Health Within National
Rural Health Mission.” Indian Journal of Public Health 49 (3): 141–151.
Appadurai, Arjun. 2001. “Deep Democracy: Urban Governmentality and the Horizon of
Politics.” Environment and Urbanization 13 (2): 23–43.
Archer, Diane, and Somsook Boonyabancha. 2010. “Seeing a Disaster as an Opportunity:
Harnessing the Energy of Disaster Survivors for Change.” Background paper prepared
for the 2011 Global Assessment Report on Disaster Risk Reduction. Forthcoming in
Environment and Urbanization 23 (2).
Bollin, C., and F. Mascher. 2005. “’Honduras: Community Based Disaster Risk Manage-
ment and Inter-Municipal Cooperation,’ A Review of Experience Gathered by the Spe-
cial Inter-Municipal Cooperation.” MAMUCA. Eschborn: Deutsche Gesellschaft für
Technische Zusammenarbeit.
Cities Alliance. 2008. Comments on Progress Report, Improving Water and Sanitation in
Quelimane City. P101077.
City Council of Quelimane. 2006. Improving Water and Sanitation in Quelimane City,
Mozambique.

178 ■ CLIMATE CHANGE, DISASTER RISK, AND THE URBAN POOR
City of London. 2008. Th e London Climate Change Adaptation Strategy. London: Mayor
of London.
City of Cape Town. 2006. Framework for Adaptation to Climate Change in the City of Cape
Town (FAC4T). City of Cape Town, Environment Resource Management. Cape Town:
University of Cape Town.
Cummins, J.D., and Olivier Mahul. 2008. Catastrophic Risk Financing in Developing Coun-
tries: Principles for Public Intervention. Washington, DC: World Bank.
Diagne, Khady. 2007. “Governance and Natural Disasters: Addressing Flooding in Saint
Louis, Senegal.” Environment and Urbanization 19 (2): 552–562.
Douglas, Ian, Kurshid Alam, Maryanne Maghenda, Yasmin Mcdonnell, Louise Mclean,
and Jack Campbell. 2008. “Unjust Waters: Climate Change, Flooding and the Urban
Poor in Africa.” Environment and Urbanization 20 (1): 187–205.
Fay, Marianne, Francis Ghesquiere, and Tova Solo. 2003. “Natural Disasters and the Urban
Poor.” En Breve No. 32 (October), World Bank, Washington, DC.
Global Facility for Disaster Reduction and Recovery (GFDRR). 2011. Volunteer Technol-
ogy Communities: Open Development. GFDRR: Washington DC.
Greater London Authority. 2010. Th e London Climate Change Adaptation Strategy, Draft
Report. London: Greater London Authority. http://www.london.gov.uk/climatechange/
strategy.
Grimard, Alain. 2006–2008. Grant Progress Report, Improving Water and Sanitation in
Quelimane City. P101077.
Independent Evaluation Group (IEG). 2006. Hazards of Nature, Risks to Development: An
IEG Evaluation of World Bank Assistance for Natural Disasters. Washington, DC: World
Bank Independent Evaluation Group. http://www.worldbank.org/ieg/naturaldisasters/
docs/natural_disasters_evaluation.pdf.
International Federation of Red Cross and Red Crescent Societies (IFRC). 2010. World
Disasters Report: Focus on Urban Risk. Geneva: IFRC.
ISDR. 2006. “ISDR Secretariat Biennial Workplan: 2006–2007.” Geneva: UN International
Strategy for Disaster Reduction Secretariat.
———. 2009. Global Assessment Report on Disaster Risk Reduction. Geneva: UN Interna-
tional Strategy for Disaster Reduction. http://www.preventionweb.net/english/hyogo/
gar/report/index.php?id=9413.
Katich, K. 2009. “Urban Climate Resilience: A Global Assessment of City Adaptation
Plans.” Master’s thesis, Massachusetts Institute of Technology. http://dspace.mit.edu/
handle/1721.1/49698.
Kiunsi, Robert B., John Lupala, Manoris Meshack, and Robert Kiunsi. 2009a. “Building
Disaster-Resilient Communities: Dar es Salaam, Tanzania.” In Disaster Risk Reduction:
Cases from Urban Africa, ed. Pelling and Wisner, 127-146. London: Earthscan.
———. 2009b. Mainstreaming Disaster Risk Reduction in Urban Planning Practice in
Tanzania: AURAN Phase II Project Final Report. African Urban Risk Analysis Network.
http://www.preventionweb.net/files/13524_TANZANIAFINALREPORT27OCT09
Mainstrea.pdf.
Livengood, Avery. 2011. “Enabling Participatory Planning with GIS: A Case Study of Set-
tlement Mapping in Cuttack, India.” Environment and Urbanization 23 (2).
Lyons, Michal. 2008. “Building Back Better: Th e Large Scale Impact of Small Scale
Approaches to Reconstruction.” World Development 37 (2): 385–398.

ANNEX 3: LEARNING FROM PROJECT AND PROGRAM EXPERIENCES ■ 179
———, and Th eo Schilderman, eds. 2010. Building Back Better: Delivering People-centred
Housing Reconstruction at Scale. Practical Action Publishing, Rugby.
Mitlin, Diana. 2008. “With and Beyond the State: Co-production as a Route to Political
Infl uence, Power and Transformation for Grassroots Organizations.” Environment and
Urbanization 20 (2): 339–360.
New York City Panel on Climate Change (NYCPCC). 2010. Climate Change Adapta-
tion in New York City: Building a Risk Management Response. Ed. C. Rosenzweig and
W. Solecki. Annals of the New York Academy of Sciences, Vol. 1196. Wiley-Blackwell.
http://www.nyas.org/Publications/Annals/Detail.aspx?cid=ab9d0f9f-1cb1-4f21-b0c8-
7607daa5dfcc
Patel, Sheela, Celine D’Cruz, and Sundar Burra. 2002. “Beyond Evictions in a Global City:
People-Managed Resettlement in Mumbai.” Environment and Urbanization 14 (1):
166–171.
Philippines Homeless People’s Federations (PHPF). 2010. “Addressing Vulnerabilities
through Support Mechanisms: HPFPI’s Ground Experience in Enabling the Poor to
Implement Community-rooted Interventions on Disaster Response and Risk Reduc-
tion.” Background paper prepared for the 2011 Global Assessment Report on Disaster
Risk Reduction.
Rayos, Co, and Jason Christopher. 2010. “Community-driven Disaster Intervention: Th e
Experience of the Homeless Peoples Federation Philippines.” IIED/ACHR/SDI Work-
ing Paper, London, International Institute for Environment and Development.
Roberts, D. 2008. “Th inking Globally, Acting Locally: Institutionalizing Climate Change
at the Local Level.” Environment and Urbanization 20 (2): 521–537.
Satterthwaite, David. 2011. How Local Governments Can Work with Communities in the
Delivery of Basic Services, processed.
Satterthwaite, D., S. Huq, M. Pelling, H. Reid, and P. Romero-Lankao. 2007. Building Cli-
mate Change Resilience in Urban Areas and Among Urban Populations in Low- and
Middle-Income Nations. Building for Climate Change Resilience, Center for Sustain-
able Urban Development.
Simms, Andrew, and Hannah Reid. 2006. Up in Smoke? Latin America and the Caribbean:
Th e Th reat from Climate Change to the Environment and Human Development: Th ird
Report from the Working Group on Climate Change and Development. London: Oxfam.
Velasquez, Luz Stella. 1998. “Agenda 21: A Form of Joint Environmental Management in
Manizales, Colombia.” Environment and Urbanization 10 (2): 9–36.
Velasquez Barrero, Luz Stella. 2010. “La Gestion del Riesgo en el Contexto Ambiental
Urbano Local: Un Reto Permanente y Compartido. Caso Manizales, Colombia.”
Background paper prepared for the 2011 Global Assessment Report on Disaster Risk
Reduction.
World Bank. 2004a. “Local Government Support Project.” Project Appraisal Document
P070736, World Bank, Washington, DC.
———. 2004b. “Vietnam Urban Upgrading Project.” Project Appraisal Document
P070197, World Bank, Washington, DC.
———. 2005. “Argentina Urban Flood Prevention and Drainage Project—Adaptable Pro-
gram Loan.” Project Appraisal Document P088220, World Bank, Washington, DC.
———. 2006a. “Argentina Urban Flood Prevention and Drainage Project—Adaptable Pro-
gram Loan 2.” Project Appraisal Document P093491, World Bank, Washington, DC.

180 ■ CLIMATE CHANGE, DISASTER RISK, AND THE URBAN POOR
———. 2006b, “Bolivia Urban Infrastructure Project.” Project Information Document:
Appraisal Stage P083979, World Bank, Washington, DC.
———. 2007. “Bolivia Urban Wastewater Methane Gas Capture Project.” Project Informa-
tion Document: Appraisal Stage P104092, World Bank, Washington, DC.
———. 2008a. Th e Caribbean Catastrophe Risk Insurance Initiative: A Review of CCRIF’s
Operation
Aft er Its First Season. Washington, DC: World Bank.
———. 2008b. “Da Nang Priority Infrastructure Investment Project.” Project Appraisal
Document, World Bank, Washington, DC.
———. 2009. “Karnataka Municipal Water Energy Effi ciency Project.” Carbon Finance
Assessment Memorandum P100352, World Bank, Washington, DC.
———. 2010. “National Vietnam Urban Upgrading Program—Mekong Delta Region.”
Project Information Document: Concept Stage, World Bank, Washington, DC.
World Watch Institute. 2007. State of the World 2007: Our Urban Future. New York:
Norton.
Zampaglione, Giuseppe. 2008. “Liberia Cash for Work Temporary Employment Project.”
Powerpoint Presentation, World Bank. http://www.google.com/url?sa=t&source=
web&cd=9&ved=0CEAQFjAI&url=http%3A%2F%2Fsiteresources.worldbank.org%
2FSOCIALPROTECTION%2FResources%2F280558-1138289492561%2F2158434-
1228317850075%2F5637583-1228319671628%2FPW_Zampaglione_Liberia
.pdf&ei=EGFgTM2mNcH48AaFz_TBDQ&usg=AFQjCNFEWT5-R4n4un
DnS5GYoF0z_Ygy9w

■ 181
Annex 4: Dar es Salaam Case Study
Overview and Key Findings
More than 70 percent of Dar es Salaam’s 5 million residents live in informal,
unplanned settlements that lack adequate infrastructure and services, and over
half of them survive on roughly a dollar per day. With a population growth rate
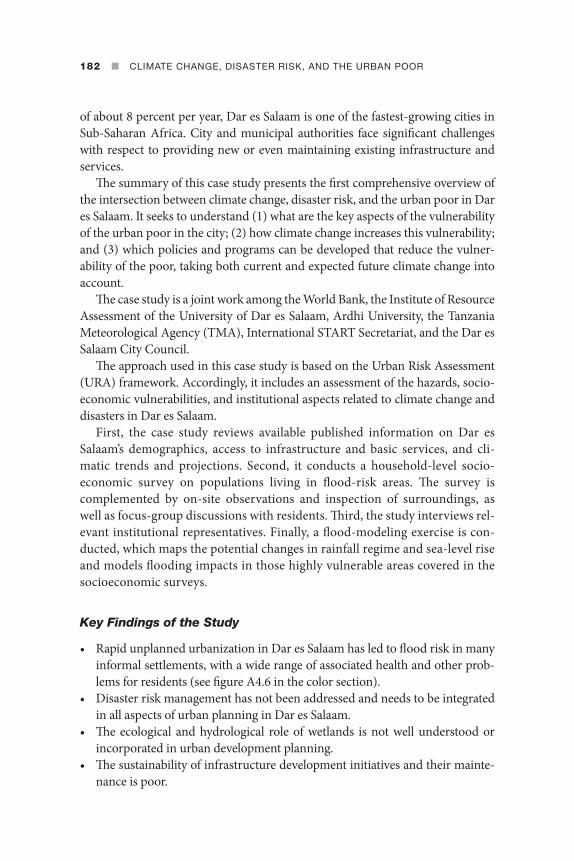
182 ■ CLIMATE CHANGE, DISASTER RISK, AND THE URBAN POOR
of about 8 percent per year, Dar es Salaam is one of the fastest-growing cities in
Sub-Saharan Africa. City and municipal authorities face signifi cant challenges
with respect to providing new or even maintaining existing infrastructure and
services.
Th e summary of this case study presents the fi rst comprehensive overview of
the intersection between climate change, disaster risk, and the urban poor in Dar
es Salaam. It seeks to understand (1) what are the key aspects of the vulnerability
of the urban poor in the city; (2) how climate change increases this vulnerability;
and (3) which policies and programs can be developed that reduce the vulner-
ability of the poor, taking both current and expected future climate change into
account.
Th e case study is a joint work among the World Bank, the Institute of Resource
Assessment of the University of Dar es Salaam, Ardhi University, the Tanzania
Meteorological Agency (TMA), International START Secretariat, and the Dar es
Salaam City Council.
Th e approach used in this case study is based on the Urban Risk Assessment
(URA) framework. Accordingly, it includes an assessment of the hazards, socio-
economic vulnerabilities, and institutional aspects related to climate change and
disasters in Dar es Salaam.
First, the case study reviews available published information on Dar es
Salaam’s demographics, access to infrastructure and basic services, and cli-
matic trends and projections. Second, it conducts a household-level socio-
economic survey on populations living in fl ood-risk areas. Th e survey is
complemented by on-site observations and inspection of surroundings, as
well as focus-group discussions with residents. Th ird, the study interviews rel-
evant institutional representatives. Finally, a fl ood-modeling exercise is con-
ducted, which maps the potential changes in rainfall regime and sea-level rise
and models fl ooding impacts in those highly vulnerable areas covered in the
socioeconomic surveys.
Key Findings of the Study
• Rapid unplanned urbanization in Dar es Salaam has led to fl ood risk in many
informal settlements, with a wide range of associated health and other prob-
lems for residents (see fi gure A4.6 in the color section).
• Disaster risk management has not been addressed and needs to be integrated
in all aspects of urban planning in Dar es Salaam.
• Th e ecological and hydrological role of wetlands is not well understood or
incorporated in urban development planning.
• Th e sustainability of infrastructure development initiatives and their mainte-
nance is poor.

ANNEX 4: DAR ES SALAAM CASE STUDY ■ 183
• Coordination among local stakeholders is needed.
• Industries need to be relocated away from residential areas and will require
access to a waste-stabilization pond.
• Awareness-raising programs are needed at the community level for improved
sanitation practices.
The Government of Dar es Salaam at WorkDespite the number of challenges that Dar es Salaam is facing, the government
has been supporting key initiatives in areas such as coastal management, slum
upgrading, and greenhouse gas mitigation. For instance, the Kinondoni Inte-
grated Coastal Area Management Project (KICAMP) formulated a comprehen-
sive plan on the management of land and water resources in coastal areas. Th is
project resulted in banning the excavation of sands in critical areas to prevent
further beach erosion along the coastal area. Households are being made aware
of the value of mangroves and are involved in their protection; combined with
heavy protection from KICAMP, this has led to increases in mangroves. Th e
government has also invested recently in sea walls on highly susceptible areas
to sea-level rise, storm surges, and coastal erosion such as Kunduchi beach and
Bahari beach.
Another example of the government at work is the Community Infrastruc-
tural Upgrading Program (CIUP), which improves physical infrastructure such

184 ■ CLIMATE CHANGE, DISASTER RISK, AND THE URBAN POOR
as storm-water drainage networks and strengthens the capacity of communities
to better help themselves, especially those living in unplanned settlements.
On the mitigation side, the Dar es Salaam City Council has shown great lead-
ership by closing the Mtoni solid-waste dumpsite and, in collaboration with a
private company, created mechanisms for tapping and fl aring the gases produced
at the dump and recovering costs through clean development.
Key ConstraintsKey constraints in dealing eff ectively with climate change, disaster risk, and the
urban poor include:
DATA—Th e lack of high-resolution digital maps is a limitation for compre-
hensive risk assessment.
INFORMATION SYSTEMS—Signifi cant increase in revenue generation is
needed to ensure both increased service coverage and quality of services, particu-
larly taking into account the additional resilience needed to reduce the risk posed
by climate change for the city. Priorities in meeting the challenges include improv-
ing information systems (databases) and updating valuation rolls; optimizing the
potential of property tax and simplifying the development levy; and developing
vigilant collection strategies and more enhanced law-enforcement capacity.
LIMITED CAPACITY—Limited capacity hinders progress in dealing with cli-
mate change, natural disasters, and urban poverty reduction. For instance, at the
community level, it is important to build capacity on the link between unsanitary
waste-disposal practices, stagnant water, unclean drinking water, and disease. At
the same time, environmental committees and community-based organizations
need to be trained about organized waste collection and its link to reduced vec-
tor/insect breeding and disease.
At the local level, research capacity needs to be built to better understand the
likely impacts of climate change in the long term for the poor of Dar es Salaam. In
the city planning departments, it is important to build a common understanding
of the long-term sectoral impacts of climate change for Dar es Salaam.
At the national level, the capacity of the Tanzania Meteorological Agency
needs to be improved in weather and climate monitoring, including in more
accurately predicting severe weather and extreme climatic events, and in analyz-
ing and interpreting data. Improvements are also needed in disseminating alerts
and early warnings.
Finally, links need to be forged and enhanced between climate experts and
journalists to ensure eff ective dissemination of information on climate change.
Main Information Gaps Identifi edTh is case study has been a fi rst step in taking stock of what has already been
done in terms of comprehensive risk assessment of informal settlements in Dar

ANNEX 4: DAR ES SALAAM CASE STUDY ■ 185
es Salaam. An important fi nding is that laws related to Urban/Town Planning and
Settlement need to be reviewed to ensure they deal adequately with vulnerability
and risk. It is also important to determine how existing environmental and pro-
poor policies and laws can be better enforced.
Th e case study recommends conducting an in-depth analysis of cost-eff ective
adaptation in light of changing socioeconomic and climatic trends in the city.
Furthermore, sectoral case studies with an emphasis on the urban poor should be
conducted in order to examine future needs, for a 20- to 30-year timeframe, on
drainage, water supply, waste management, housing, and health planning, among
others. Such case studies should involve teams of local institutions as well rel-
evant international institutions with advanced technical expertise.
Looking Forward
Th e case study suggests that the best starting point for reducing vulnerability to
climate change in the future is to reduce present vulnerability, such as by reduc-
ing threats to health by improving city drainage and environmental sanitation.
Th e case study also captures key areas for further collaborative work moving
forward:
• Support for public agencies to improve waste collection, drainage, water, and
sanitation programs. Although all municipal agencies are required to com-
ply with and implement the National Environmental Policy and the National
Environmental Act, oft en they lack the funding needed to meet the responsi-
bilities entailed, or the supervision capabilities to counter actions that contra-
vene city laws and bylaws.
• Integrate disaster risk management in urban planning. Guidelines for disaster
risk reduction should be mainstreamed in the preparation of schemes for gen-
eral planning, detailed planning, detailed urban renewal, and regularization.
• Support public health programs. Cost-eff ective mass-treatment programs
need to be implemented for Neglected Tropical Diseases (NTDs) and more
eff orts also need to be put into integrated approaches to control malaria,
rather than relying solely on the distribution of nets treated with insecticide.
Improvements to drainage systems and their regular maintenance will go a
long way toward reducing fl ooding and consequent ponding and stagnation
of water, thereby reducing breeding sites.
• Support Clean Development Mechanism (CDM) activities. Dar es Salaam
should seek further CDM support in expanding and scaling up the City
Council’s existing plans to manage solid waste.
• Support existing successful urban upgrading programs. Th ese have great
potential, as they involve communities in identifying problems and solutions

186 ■ CLIMATE CHANGE, DISASTER RISK, AND THE URBAN POOR
and cover a wide array of physical and institutional measures to improve
urban areas.
• Encourage a long-term planning horizon. Adaptation planning for Dar es
Salaam’s poor residents should address their present urgent needs and those
to come, given expected future impacts of climate change.
Case Study Summary
City Profi le
Dar es Salaam is located in the eastern part of the Tanzanian mainland at
6o51’S latitude and 39o18’E longitude (see figure A4.1, color section). With
an area of 1,350 square kilometers (km2), it occupies 0.19 percent of the
Tanzanian mainland, stretching about 100 km between the Mpiji River to
the north and beyond the Mzinga River in the south. The Indian Ocean bor-
ders it to the east. The beach and shoreline comprise sand dunes and tidal
swamps. Coastal plains composed of limestone extend 10 km to the west of
the city, 2 to 8 km to the north, and 5 to 8 km to the south. Inland, alluvial
plains comprise a series of steep-sided U-shaped valleys. The upland pla-
teau comprises the dissected Pugu Hills, 100 m to 200 m in altitude. Domi-
nated by limestones, sandy clays, coarse sands, and mixed alluvial deposits,
the soils of the Dar es Salaam region are not particularly fertile (Dongus,
2000). The city is divided into three ecological zones, namely the upland
zone consisting of hilly areas to the west and north of the city, the middle
plateau, and the lowlands, which include the Msimbazi Valley, Jangwani,
Mtoni, Africana, and Ununio areas.
Built Environment and Basic Service ProvisionAn estimated 70 percent of Dar es Salaam’s population lives in poor, unplanned
settlements (World Bank 2002). Residents are usually too poor to pay for services
or infrastructure and authorities too resource-constrained to maintain these;
thus, health and environmental conditions are generally extremely poor. About
half the residents of Dar es Salaam’s informal settlements live on an average
income of US$1 per day and in constrained circumstances. Many are migrants
from other parts of Tanzania in search of better opportunities.
Access to clean water and sanitation are major problems for Dar es Salaam’s
poor, and contribute to widespread illness, including cholera, malaria, lymphatic
fi lariasis, and diarrhea, particularly during fl oods, which could be more severe or
frequent in the future due to climate change.
Up to about 75 percent of the residents of Dar es Salaam’s informal housing
settlements are unemployed or under-employed (World Bank 2002), with the

ANNEX 4: DAR ES SALAAM CASE STUDY ■ 187
main source of income for the latter group being through informal activities
and micro-enterprise. Employment in Dar es Salaam as a whole declined from
64 percent to 42 percent between 1992 and 2000, and self-employment rose from
29 percent to 43 percent. Poverty for those in self-employment rose from 29 per-
cent to 38 percent over the same period (World Bank 2002).
Th e city’s road network totals about 1,950 km, of which 1,120 km (less than
60 percent) is paved, and is inadequate to satisfy its population density, spatial
expansion, and transportation needs. Dar es Salaam hosts about 52 percent of
Tanzania’s vehicles, and has a traffi c density growth rate of over 6.3 percent per
year (JICA 1995; Kanyama et al. 2004).
Th e city’s planning agencies have been unable to keep pace with the rapid
expansion of the city, largely fueled by migrant growth. Most of the city’s
population lives in unplanned settlements—many in abject poverty—which
are characterized by substandard infrastructure and lack of basic municipal
and other services. Th ese communities face transportation constraints, inse-
cure housing, problems accessing clean water, unhygienic sanitation, and lack
of awareness on hygienic sanitary practices. Climatic factors, such as heavy
rainfall, work in conjunction with this situation to impose additional hardship
and increase disease.
Pillar 1—Institutional Assessment
Agencies in Disaster Risk Management and Climate Change AdaptationDar es Salaam is managed by the Dar es Salaam City Council and the Municipal
Councils of Temeke, Kinondoni, and Ilala. Th e three municipal authorities are
under the Ministry of Regional Administration and local government. Each has
individual sets of technical and administrative departments.
TABLE A4.1Dar es Salaam Profi le
Total city population in 2002 2.5 millionEstimated 5 million in 2020
Population growth (% annual) 4.39 (city mayor’s statistics, 2006)8 (World Bank 2002)
Land area (km2) 1,590
Population density (per hectare) 1,500
Country’s per capita GDP (US$) 1,300 (2007)
Date of last Urban Master Plan 2010

188 ■ CLIMATE CHANGE, DISASTER RISK, AND THE URBAN POOR
Th e Dar es Salaam City Council (DCC) has a coordinating role and attends to
issues that cut across all three municipalities. Its functions are to:
• Coordinate the functions of the three municipal authorities regarding infra-
structure.
• Prepare a coherent citywide framework for enhancing sustainable develop-
ment.
• Promote cooperation between the City Council and the three municipal or
local authorities.
• Deal with all matters where there is interdependency among the city’s local
authorities.
• Support and facilitate the overall functioning and performance of the local
authorities.
• Maintain peace, provide security and emergency, fi re, and rescue services,
ambulance and police.
• Promote major functions relating to protocol and ceremonies.
Th e municipal councils are responsible for providing basic social services,
which include primary education and partly secondary education (especially
where the community is involved), primary health care, waste management
and cleanliness, district roads, water supply, and monitoring of trade and
development, especially informal sector development and management, coop-
eratives, agriculture and livestock development, forestry, fi sheries, recreational
parks, and urban planning.
Th e Tanzania Meteorological Agency (TMA) issues fl ood warnings for Dar es
Salaam. It provides warnings and advisories on extreme rainfall and fl ooding based
on daily weather monitoring. Cloud evolution is monitored through observations
and by using satellite pictures. Th e evolution and pathway of tropical cyclones along
the Western Indian Ocean are also monitored on a real-time basis. Warnings and
advisories are disseminated to the public as needed, through various stakeholders
such as the mass media and the disaster-management department at the prime
minister’s offi ce. Flood warnings and advisories are given up to a day in advance
(24-hour forecast) or at seasonal timescales (up to two months in advance).
Relevant Policies and Legislation
• At national level: National Human Settlements Development policy (2000),
National Environmental Policy (1997), Ratifi cation of the UN Framework
Convention on Climate Change (UNFCCC) (1996).
• At local level: Th e Sustainable Dar es Salaam Project and the Strategic Urban
Development Plan (SUDP) started in 1992, Community Infrastructural
Upgrading Programme (CIUP) started in 2001, and African Urban Risk
Analysis Network (AURAN) Project Phases I and II started in 2004.

ANNEX 4: DAR ES SALAAM CASE STUDY ■ 189
Ongoing Programs in Disaster Risk Management and Climate Change
• Rehabilitation of storm water drainage and sewerage system: City authorities
undertook improvements in the city center. However, a new wave of invest-
ment has led to construction of new structures in former empty spaces,
including the construction of multiple-use buildings that have increased
demands for water supply and enlarged high-capacity sewage pipes. Th e ton-
nage of solid and liquid waste generated has increased, demanding effi cient
solid- and liquid-waste management and monitoring services. On occasion,
wide and deep storm water drains are appropriated by private homeowners,
fenced in as part of their property, and sealed up, which causes waste back-up
among poorer neighbors. Laws need to be better enforced and drainage line
capacity reassessed. It is important that when this occurs, planners consider
the fact that capacity needs are likely to change over the lifetime of the drain-
age system; the system needs to plan for changing rainfall regimes over the
planning horizon, for example, up to 2050.
• Property formalization in Dar es Salaam: Th e government is implementing
a project to identify all properties in informal settlements in Dar es Salaam
and at the same time issuing land/property licenses or right of occupancy
to curb further densifi cation of those areas and to improve security of ten-
ure, which could be used as collateral for economic empowerment (URT
2004 in: Kyessi and Kyessi 2007). Th is formalization process will be a
foundation for the regularization of the slums that will ultimately allow
provision of infrastructure including drainage channels for storm water,
piped water supply, refuse collection using municipal and private vehicles,
sanitation (pit and septic tank emptying services), secure tenure (loans),
improved housing conditions, and reduced overcrowding in unplanned
settlements.
• National Adaptation Programme of Action (NAPA): Tanzania is party to the UN
Framework Convention on Climate Change (UNFCCC) and the Kyoto Pro-
tocol and has prepared a National Adaptation Programme of Action (NAPA
2007). Th e capacity for investing in adaptation activities (protecting vulner-
able populations, infrastructure, and economies) is still low due to fi nancial
constraints (NAPA 2007). However, NAPA will help in integrating adaptation
issues in the development process, guiding development to address urgent and
immediate needs for adapting to adverse impacts of climate change. Among
other objectives, NAPA aims at improving public awareness on the impacts of
climate change and on potential adaptation measures that can be adopted. In
Dar es Salaam, activities have included planting trees along the beach, road-
sides, near houses, and in open spaces.
• Management of coastal areas: Dar es Salaam is a coastal city and climate change
is expected to exacerbate vulnerability of poor coastal communities through

190 ■ CLIMATE CHANGE, DISASTER RISK, AND THE URBAN POOR
sea-level rise, possibly more intense coastal storms, and increased rainfall
variability. Coastal management projects involve beach conservation, includ-
ing conservation of mangroves and coral reefs, as well as Marine Park protec-
tion. Poverty alleviation, such as facilitation of seaweed farming, is also oft en
included. Some of the city’s coastal management projects are noted below.
In particular, the Kinondoni Integrated Coastal Area Management Project
(KICAMP) aims to formulate a comprehensive plan focused on the use of
land and water resources in coastal areas. Th e project has banned the excava-
tion of sands in Kunduchi-Mtongani as a way to prevent further beach erosion
along the coastal area. Households are being made aware of the value of man-
groves and involved in their protection, and, combined with heavy protection
from KICAMP, this has led to an increase in mangroves. Other civil-society
organizations involved in conservation, awareness raising, and environmental
management included Roots and Shoots, World Vision, URASU (Uchoraji na
Ramani na Sanaa Shirikishi Dhidi ya Ukimwi), and the International Orga-
nization on Migration, which helped to form environmental management
societies in schools, markets, and dispensaries. Schools had already planted
trees and botanical gardens in their compounds. Msasani Bonde la Mpunga
is also involved in coastal conservation through a partnership with the World
Wildlife Fund (WWF), the Wildlife Society for Nature Conservation, the pri-
vate sector (running tourist hotels and sea boats), the International Union for
Conservation of Nature (IUCN), and Tanzania Marine Park authorities.
• Sustainable coastal communities and ecosystems: Th is USAID-funded project
(implemented by Rhode Island and Hawaii-Hilo universities) builds adaptive
capacity and resilience among vulnerable coastal communities. Th e program
has introduced “raft culture” techniques, where seaweed is grown in deeper
water where it is less vulnerable to fl uctuations in temperature and salinity,
enabling benefi ciaries to earn a living throughout the year.
• Construction of adaptive structures in Dar es Salaam: A comprehensive beach
conservation program has been designed that includes the following compo-
nents: (1) sea walls have been constructed along the front of the Aga Khan
Hospital to prevent further erosion of Sea View Road; (2) sea walls and groins
have been constructed along some beaches, which benefi ts hotels by reducing
beach erosion and property damage from waves, and also helps fi shing com-
munity settlements that live near the sea; and (3) land reclamation is taking
place along coastal areas, for example, by covering quarry pits with soil and
trees and building houses on these reclaimed areas. Th e Kunduchi-Salasala
quarry area is an example.
• Other: Th e country has strengthened multilateral relations at the international
level in order to enhance the ability to cope with climate change and vari-
ability for sustainable livelihoods. For example, Tanzania and the Kingdom of

ANNEX 4: DAR ES SALAAM CASE STUDY ■ 191
Norway have agreed to partner to combat adverse impacts of climate change.
Under this program, Tanzanian scholars are trained on climate change issues
(planning and forecasting), and, as short courses on climate change tend to be
publicized through newspapers and on television, awareness is raised among
the public on climate change impacts, adaptation measures, and mitigation.
Leading AgenciesCurrently, there is not a leading agency coordinating the disaster risk manage-
ment activities at the local level. Th ere is a lack of coordination horizontally
among departments and vertically with national policies.
Pro-Poor Services and Infrastructure Local ExpenditureDar es Salaam’s municipal agencies provide infrastructure and socioeconomic
services such as health, water, education, solid-waste management, coopera-
tive and community development, roads, development of natural resources,
trade and agriculture and livestock, and information and communication
technology development. Despite eff orts to improve social services for city
dwellers, increased migration and unemployment have made services poor
and unaff ordable. Rapid urbanization in Dar es Salaam is resulting in grow-
ing numbers of the population living in unplanned, densely settled squatter
areas with little or no access to social services. Despite purported improve-
ments in fi scal position and revenue collection, improved record-keeping,
and enhanced accountability, the Dar es Salaam City Council (including its
municipalities) still faces considerable challenges in spending on pro-poor
services and on improving infrastructure in unplanned and underserved areas.
Signifi cant increase in revenue generation is needed to ensure both increased
service coverage and quality of services, particularly taking into account the
additional resilience needed to reduce the risk posed by climate change for
the city. Priorities in meeting the challenges include improving information
systems (databases) and updating valuation rolls; optimizing the potential
of property tax and simplifying the development levy; and developing vigi-
lant collection strategies and more enhanced law enforcement capacity (City
Council, undated Brief DSM V2: 6).
Pillar 2—Hazards Assessment
Past Natural DisastersDar es Salaam is already highly vulnerable to climatic variability, which is
expected to increase as climate continues to change. Th e aspect of most frequent
concern to Dar es Salaam currently is heavy rainfall. In combination with poor
drainage, illegal construction, and other infrastructure problems, heavy rainfall

192 ■ CLIMATE CHANGE, DISASTER RISK, AND THE URBAN POOR
TABLE A4.2 Natural Hazards
Yes /No Date of last major event
Earthquake NWind storm NRiver fl ow N 2010Floods, inundations, and waterlogs YTsunami NDrought Y 2006Volcano NLandslide YStorm surge NExtreme temperature Y
results in fl ooding that causes major losses and disruptions. For the multitudes
of the city’s population living in informal settlements, poor sanitation contrib-
utes to an additional threat: disease. Diseases commonly occurring in these con-
gested, unsanitary settlements during fl oods include malaria, cholera, dysentery,
and diarrhea. Some other factors that contribute to fl ooding in these settlements
include fl at topography, lack of storm-water drainage, blockage of natural drain-
age systems, building in hazardous areas, and unregulated housing and infra-
structure development. Livelihood activities are also adversely aff ected by both
heavy rainfall and drought.
Main Climate HazardsTemperature trends over the past four to fi ve decades show signifi cant increase.
Temperature is projected to increase.
As Figure A4.3 shows, mean annual rainfall has declined in Dar es Salaam
over the past fi ve decades (as recorded at the Dar es Salaam Airport station).
Figure A4.4 shows mean and absolute 24-hour maximum rainfall for the
period 1971–2009. Mean 24-hour maximum rainfall ranges from over 50 mm in
April–May to 10 mm for July–August. Th e absolute 24-hour maximum rainfall
for the time period studied was recorded within the past decade.
Both rainfall amount and intensity are concerns from the point of view of
fl ooding in Dar es Salaam. Intensity has been increasing in the last 15 years,
where rainfall intensity has been well above the 38 years’ recorded history. Th is
trend is expected to continue with climate change.
An important projected aspect of climate change is an increase in climatic
variability, which would result in more frequent and severe fl oods and droughts
in the city. Given that the city’s poor are unable to cope adequately with current
variability, their situation is likely to worsen in the future, unless steps are taken

ANNEX 4: DAR ES SALAAM CASE STUDY ■ 193
to ensure that urban development and poverty reduction specifi cally take into
account the prospect of changing climatic conditions. Infrastructure development
and urban planning, municipal services, and poverty reduction (including safety
nets and health services) need not only to better integrate disaster risk manage-
ment, but also to consider that the trends are changing.
Source: Tanzania Meteorological Agency (2010).
0
200
400
600
800
1000
1200
1400
1600
1800
1961
1964
1967
1970
1973
1976
1979
1982
1985
1988
1991
1994
1997
2000
2003
2006
2009
Years
Mea
n an
nual
rai
nfal
l (m
m)
Annual Linear trend
Figure A4.3 Timeseries of Mean Annual Rainfall in Dar es Salaam
2.0Y-warm = 0.031× –0.512
R2 = 0.4061.5
1.0
1.5
0.0
–0.5
1962
1964
1966
1968
1970
1972
1974
1976
1978
1980
1982
1984
1986
1988
1990
1992
1994
1996
1998
2000
2002
2004
2006
2008
–1.0
–1.5
DJF ano Linear (DJF ano)
Figure A4.2 Trend of Mean Maximum Temperature Anomalies during Warm est Months (December–February) at Dar es Salaam International Airport
Source: Tanzania Meteorological Agency (2010).

194 ■ CLIMATE CHANGE, DISASTER RISK, AND THE URBAN POOR
Projections of Future Climate
A summary of climate baseline data and severity of dry periods for March–
May (MAM) and October–December (OND) are presented in the case study.
Under the Special Report on Emissions Scenarios (SRES) A2 emissions sce-
narios, and data representing 14 of the Global Circulation Models used to
simulate the 20th century and future global climate, by mid-century, the
coarser-resolution global climate models project that this site will become
warmer, with more frequent heat waves. Th ey disagree on whether this site
TABLE A4.3 Effects and Losses
Hazard Effects Losses
Floods Drainage channels are blocked by refuse throughout the year as well as by structures that hinder the fl ow of wastewater, causing houses to be fl ooded by unhygienic, sewage-based wastewater in houses. Major effects are water-borne diseases.
Not available
Drought Diseases: malnutrition, trachoma, dysentery, cholera, and diarrhea
The drought of 2006 damaged agricultural production, necessitated electricity cuts (and thus drops in industrial production), and cut GDP growth by 1% (ClimateWorks Foun-dation et al. 2009)
TABLE A4.4 Signifi cant Floods in Dar es Salaam, 1983–2006
Year Months
Monthly rainfall
Long-term mean (mm) Actual (mm) % of long-term mean
1983 May 197.8 405.6 2051989 Dec. 117.8 175.6 1491995 May 197.8 374.2 1891997 Oct.
Nov.Dec.
69.3125.9117.8
250.8152231
361121196
1998 Jan.Feb.Mar.Apr.
76.354.9
138.1254.2
107.3123.7155.2319.9
141225112126
2002 Apr. 254.2 569.4 2242006 Nov.
Dec.125.9117.8
240.9230.4
191196
Source: Tanzania Meteorological Agency (2010).

ANNEX 4: DAR ES SALAAM CASE STUDY ■ 195
will become wetter or drier. By 2100, mean annual temperature for Tanzania is
expected to increase by 1.7°C over the northern coast, including areas around
Dar es Salaam. Rainfall intensity is expected to increase. Runoff (precipita-
tion minus evapo-transpiration), a measure of water availability, is projected
to increase. Th e maximum amount of rain that falls in any fi ve-day period
(a surrogate for an extreme storm) is expected to increase. Th e maximum
period between rainy days is expected to increase.
Kebede and Nicholls (2010) have analyzed Dar es Salaam’s vulnerabil-
ity to sea-level rise. Th ey estimate that at present 8 percent of the city cur-
rently lies in a low-elevation zone below the 10 m contour line, inhabited by
over 143,000 people, with associated economic assets estimated (in 2005) at
US$168 million.
Magnitude, Distribution, and Probability of Potential Losses Although future rainfall patterns are uncertain, variability is likely to increase
and intensifi cation of heavy rainfall is expected. Th us fl ooding may become
increasingly severe, particularly taken together with socioeconomic pro-
jections, unless adaptation measures are implemented. Increases in mean
temperature, combined with fewer rainy days per year, could also prolong
the length of dry seasons or intensify droughts. Recent extreme climate (for
example, the droughts of 2006 and 2008–2009, and the fl oods of 2009–2010)
severely impacted sectors such as transport, energy, and health, with adverse
socioeconomic implications. Projected changes in climate will have signifi cant
1999
1991
2005
1977
1987
1976
2003
1995
1995
1996
1996
2005
0102030405060708090
100110120130140150160
Jan Feb Mar Apr May Jun Jul Aug Sep Oct Nov DecMonths
Rai
nfal
l (m
m/d
ay)
Mean 24 hours max Absolute 24 hours max
Figure A4.4 Mean and Absolute 24 Hours Maximum Rainfall for Dar es Salaam

196 ■ CLIMATE CHANGE, DISASTER RISK, AND THE URBAN POOR
impacts on Tanzania’s rain-fed agriculture and food production, and could
thus impact urban agriculture in Dar es Salaam, a means of livelihood and
subsistence for the city’s poor. Warming will shorten the growing season and,
together with reduced rainfall, reduce water availability. Coastal degradation
and salt-water intrusion are major problems for Dar es Salaam’s coastal areas
today, and under projected climate change and possible sea-level rise, coastal
ecosystems would be highly threatened, aff ecting the livelihoods and ecosys-
tems of coastal communities. Residents of coastal wetlands that have incurred
salt-water intrusion (such as Suna, Mtoni Azimio, and Msasani Bonde la
Mpunga) informed the study team that they frequently need to repair their
houses as salt-water intrusion is corroding the foundations and cement bricks
are being eaten away.
Pillar 3—Socioeconomic Assessment
Location and Exposure of the Urban PoorAn estimated 70 percent of Dar es Salaam’s population lives in poor, unplanned
settlements. Life expectancy in Dar es Salaam’s informal settlements is low,
250
200
150
Pop
ulat
ion
exp
osed
(tho
usan
ds)
100
50
02005 2030
Time (years)2050 2070
Ilala Temeke Kinondoni Total (dares Salaam)
Figure A4.5 Exposed Population in Dar es Salaam in 2005, 2030, 2050, and 2070 to a 1-in-100-Year Flood under the A1B Mid-range Sea-Level Rise Scenario, No Adaptation
Source: Kebele and Nicholls (2010).

ANNEX 4: DAR ES SALAAM CASE STUDY ■ 197
between 44 and 46 years, and infant mortality is high at about 97 deaths per 1,000
live births.
Residents are usually too poor to pay for services or infrastructure and
authorities too resource-constrained to maintain these; thus, health and envi-
ronmental conditions are generally extremely poor. Tanzania’s policy toward
informal settlements in Dar es Salaam has varied over past decades. In the
1960s, slum clearance was the main approach; slum sites were cleared and
buildings with high construction standards were erected on cleared sites
(implemented through the National Housing Corporation). Th is proved
unsustainable, however, and was abandoned by the end of the 1960s due to
high economic and social costs, and having contributed little to the net hous-
ing stock. In the 1970s and 1980s, the government’s approach changed, and
projects to upgrade squatter areas and to provide services (supported by the
World Bank) formed the national strategy for managing the growth of infor-
mal settlements. Aft er World Bank funding for these projects ceased, how-
ever, the government of Tanzania was unable to continue fi nancing them, and
subsequent years saw the growth and emergence of new unplanned settle-
ments as well as deterioration of previously installed infrastructure, due to
lack of maintenance.
Reference
World Bank. 2011. Urban Poverty & Climate Change in Dar es Salaam, Tanzania; A Case
Study, processed.


■ 199
Annex 5: Jakarta Case Study
Overview and Key Findings
Th is case study presents the fi rst comprehensive overview of the intersec-
tion between climate change, disaster risk, and the urban poor in Jakarta. It
discusses city progress in taking stock of policies and programs, both within

200 ■ CLIMATE CHANGE, DISASTER RISK, AND THE URBAN POOR
the Provincial Government (Pemprov) of the Special Capital District (DKI)
of Jakarta and with partners. And it discusses progress in understanding the
principal hazards in the city and where they are located, as well as some under-
standing of undocumented citizens in Jakarta and how they are coping with
the changes they experience on a day-to-day basis. As part of this eff ort, there
is a longer document assessing risk and a short fi lm that provide the basis for
moving toward a comprehensive climate action plan for the city. Th e Bahasa
version of the report will be a useful awareness-raising tool to build capacity
among government agencies and other stakeholders on how climate change
and natural disasters are and will aff ect Jakarta.
Th e World Bank, in close consultation with the Pemprov DKI and other stake-
holders and partners, has prepared a case study of Jakarta. Key DKI government
agencies, such as the departments responsible for the environment (Badan Pen-
gelola Linkungan Hidup Daerah, BPLHD), planning (Badan Perencanaan Pem-
bangunan Daerah, BAPPEDA), and spatial planning (Biro Tata Ruang) discussed
existing city strategies and policies related to climate change. Pemprov DKI also
hosted a stakeholder consultation workshop in December 2010, to review and
strengthen the fi ndings of this case study through conversations with diff erent
city offi cials and NGOs.
Th e approach used in this case study is based on the Urban Risk Assessment
(URA) framework. Accordingly, it includes an assessment of the hazards, socio-
economic vulnerabilities, and institutional aspects related to climate change and
disasters in Jakarta. With a focus on the urban poor, this study considers how
poor communities are aff ected by climate change and natural hazards, examines
approaches that have been taken to address these challenges, and identifi es pri-
orities and options for further action in Jakarta. Th is study draws on other reports
and resources on disasters and climate change in Jakarta, as well as on interviews
and discussions with government offi cials, local NGOs, and community leaders.
Key Findings of the Study
• Strong and sustained growth in Jakarta’s population and economy have resulted
in a vast increase in the urbanized area, and concomitant change in land use.
• Jakarta’s rapid growth and urbanization have given rise to large-scale infra-
structure problems that are mostly well documented and understood by the
DKI government and the public.
• Jakarta is now highly vulnerable to the impacts of climate change. Th e greatest
climate- and disaster-related risk facing Jakarta is fl ooding, which imposes
very high human and economic costs on the city.
• Jakarta’s poor are productive and integral members of the city’s economy, and
are also the most vulnerable to fl ood-related risks.

ANNEX 5: JAKARTA CASE STUDY ■ 201
• Th e urban poor have important roles to play in addressing Jakarta’s vulner-
ability to climate change and disasters.
• Th e government of DKI Jakarta has started acting on climate change, but
much remains to be done to mainstream climate change across all sectors for
the long term.
The Government of Jakarta at WorkDKI is making a concerted eff ort to develop its climate change strategy and to
think more broadly and inclusively about diff erent levels of capacity building and
interventions. At the kelurahan level, government offi cials are starting to take
active roles in understanding how climate change is aff ecting them and what
steps they can prioritize in their own actions and local budgets. Th is is occurring
mainly through capacity-building programs of NGOs. Th e government is also
learning how to articulate these issues in terms of spatial interventions. Initially,
the main focus of DKI on climate change was about reducing greenhouse gas
emissions. Th e government is now thinking more broadly about adaptation mea-
sures like urban greening that address both climate change aspects.
Areas for ImprovementCurrently the approach of integrating projects and programs that increase resil-
ience, improve spatial planning, and decrease poverty in one systematized appli-
cation is new for the DKI government. Both conceptually and in terms of policy
creation and social services, the real links between climate change vulnerability
and resilience and the urban poor remain weak. Th e location and required reset-
tlement of the extremely poor communities is a delicate and complicated issue for
DKI to manage, but one that is seeing increasing urgency and pressure. Ideas for
the development of good climate change projects, ideally those that incorporate
mitigation and adaptation, are slow to emerge from inside the DKI government.
Key ConstraintsKey constraints in dealing eff ectively with climate change, disaster risk, and the
urban poor include:
DATA—Poor availability and sharing of data for decision-making, from exist-
ing studies and new data, is one of the biggest challenges. From the experience
of working through the MTF study with DKI Jakarta, data was either extremely
scarce, inconsistent, or simply very diffi cult to access as some agencies were reluc-
tant to release information. Partners of DKI, like other multi- and bilateral orga-
nizations, as well as NGOs and private-sector consultants, create their own data
sets, but much of this information is not shared or coordinated.
INFRASTRUCTURE AND INVESTMENTS—Th e macro-infrastructure
upgrades that will be required for Jakarta to be considered climate resilient are

202 ■ CLIMATE CHANGE, DISASTER RISK, AND THE URBAN POOR
certainly massive and long term. Th ese upgrades include a huge dike and polder-
system called the Jakarta Coastal Sea Defense coupled with land reclamation and
improved pumping capacity. Th is is still in the design stages. Th e Jatiluruh reser-
voir just outside of Jakarta’s boundaries is the source of much of Jakarta’s water.
Plans have been under development for some time to expand the capacity of the
pipes to increase water supply to Jakarta, and therefore ease the causes of subsid-
ence, but the plans are not yet under way.
COMMUNICATION AND COMMUNITY ENGAGEMENT—Th e shorter-
term micro-level capacity-building exercises and community-led actions are
uneven, with some communities better organized than others. Framing the
future of Jakarta using the terms “resilience” and “climate change” are new
for the government and communities. Th ere is a signifi cant learning curve in
terms of thoroughly understanding, then communicating, how climate change
aff ects Jakarta.

ANNEX 5: JAKARTA CASE STUDY ■ 203
Main Information Gaps Identifi edIn general there is a lack of data. Some of the data available (such as land tenure)
may not have been scrutinized and analyzed through the fresh lens of climate
change. Updated data gaps include: maps of poverty in the city; subsidence
maps and images; socioeconomic and housing data on the very poor; good
qualitative defi nitions of slums and urban settlements; information on land ten-
ure; up-to-date census data; census data on the very poor; immigration and
emigration rates; plans for resettlement of vulnerable areas; fi nancing and long-
term plans for sea-wall construction; and concrete action plans for working to
halt subsidence.
Looking Forward
A few basic principles can guide the way forward for addressing climate change,
disaster risk, and urban poverty in Jakarta.
• Climate change adaptation should be not so much an additional challenge
to be layered onto existing policies and planning priorities, but rather an

204 ■ CLIMATE CHANGE, DISASTER RISK, AND THE URBAN POOR
opportunity for the DKI government and key partners to gather their focus
and priorities for the future.
• Given limited resources, the initial focus should be on addressing exist-
ing shortfalls in infrastructure investment and basic services, particularly in
drainage, piped water, housing, and transportation.
• Policies and investments should be based on improved information, including
quantitative data and an understanding of community actions and adaptive
capacities.
• Enhanced collaboration—with the administrations of neighboring provinces,
as well as with the local communities as active participants and partners—is
crucial to the success of long-term action.
• Capacity building should be emphasized at every level. Th e shorter-term
micro-level capacity building and community-led actions are uneven,
some communities being better organized than others. Framing the future
of Jakarta using the terms “resilience” and “climate change” are new for
the government and communities. Th ere is a signifi cant learning curve in
terms of fi rst thoroughly understanding, and then communicating, how
climate change aff ects Jakarta.
Case Study Summary
City Profi le
Jakarta is located on the north coast of the island of Java in the Indonesian
archipelago in Southeast Asia. It is the country’s largest city and its political
and economic hub. Th e city’s built environment is characterized by numer-
ous skyscrapers, concentrated in the central business district but also built
ad hoc throughout the city, especially in the past 20 years. Th e rest of Jakarta
generally comprises low-lying, densely populated neighborhoods, which are
highly diverse in terms of income levels and uses, and many of these neigh-
borhoods are home to varied informal economic activities. Th e population
of Jakarta is considered wealthy relative to neighboring provinces and other
islands, and indeed its GDP per capita is more than four times the national
average.
Jakarta is located in a deltaic plain crisscrossed by 13 natural rivers and more
than 1,400 km of man-made waterways. About 40 percent of the city, mainly the
area farthest north near the Java Sea, is below sea level. Jakarta is prone to fl ood-
ing from water draining through the city from the hills in the south, and also
from coastal tidal fl ooding.

ANNEX 5: JAKARTA CASE STUDY ■ 205
Th e successful provision and management of services by the provincial
government is lagging in most sectors. In spite of a booming economy, much
private-sector property development, Jakarta’s spatial planning and infra-
structure, as well as service provision—transportation, green space, aff ord-
able housing, clean water, health care, and education—have not kept pace
with demand.
Traffi c congestion is a major problem facing the city, with only incremental
eff orts to relieve congestion through the development of public transportation,
most prominently, the TransJakarta Busway. Th e increasing number of vehicles
on the streets of Jakarta is outpacing the development of new roads. Total grid-
lock in the city is projected to occur as early as 2016 under the transportation
Business As Usual scenario.
Lack of piped water is driving large multi-use developments and small resi-
dential communities alike to drill wells to access groundwater. Th is extraction of
groundwater is causing areas of Jakarta to sink rapidly, particularly in the north
of the city. Along with sea-level rise, land subsidence is one of the greatest chal-
lenges facing Jakarta.
Th e provision of housing for the poor and lower-middle classes continues
to be inadequate relative to demand. With consistent in-migration of people
into the city, estimated at 250,000 annually, housing is in constant demand, but
costs are escalating. Skyrocketing land prices and rampant private-sector devel-
opment that is under-regulated has resulted in a booming real-estate market
that excludes the poor. Large informal settlements have grown over many years
along waterways, natural rivers, and reservoirs, contributing to the pollution
and clogging of these areas.
TABLE A5.1 Jakarta Profi le
Total city population in 2010 9.6 millionPopulation growth (% annual) 2.60Land area (km2) 651Population density (per km2) 14,465Country’s per capita GDP (US$) 2,329% of country’s population 4Total number of households 2,325,973 GDP (US$) 10,222% of country’s GDP 20Total budget (US$) 3.1 billionDate of last Urban Master Plan 2010
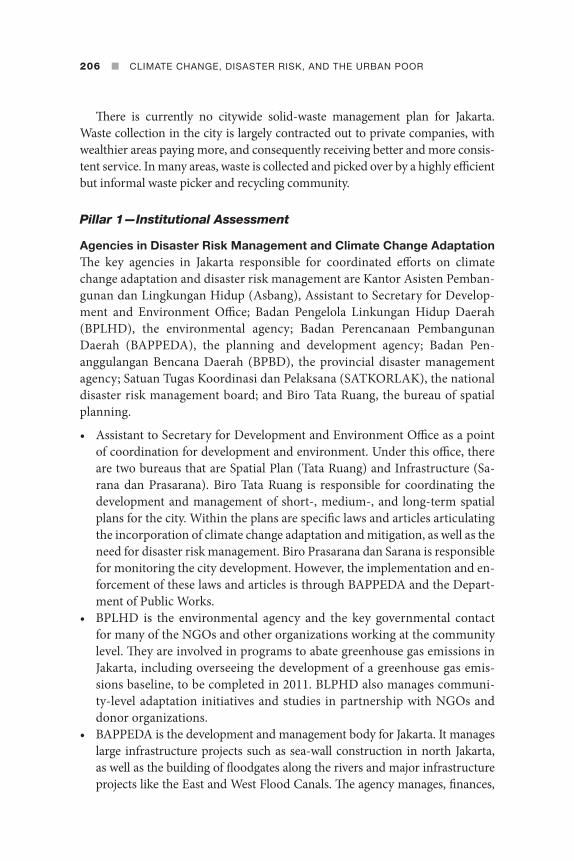
206 ■ CLIMATE CHANGE, DISASTER RISK, AND THE URBAN POOR
Th ere is currently no citywide solid-waste management plan for Jakarta.
Waste collection in the city is largely contracted out to private companies, with
wealthier areas paying more, and consequently receiving better and more consis-
tent service. In many areas, waste is collected and picked over by a highly effi cient
but informal waste picker and recycling community.
Pillar 1—Institutional Assessment
Agencies in Disaster Risk Management and Climate Change AdaptationTh e key agencies in Jakarta responsible for coordinated eff orts on climate
change adaptation and disaster risk management are Kantor Asisten Pemban-
gunan dan Lingkungan Hidup (Asbang), Assistant to Secretary for Develop-
ment and Environment Offi ce; Badan Pengelola Linkungan Hidup Daerah
(BPLHD), the environmental agency; Badan Perencanaan Pembangunan
Daerah (BAPPEDA), the planning and development agency; Badan Pen-
anggulangan Bencana Daerah (BPBD), the provincial disaster management
agency; Satuan Tugas Koordinasi dan Pelaksana (SATKORLAK), the national
disaster risk management board; and Biro Tata Ruang, the bureau of spatial
planning.
• Assistant to Secretary for Development and Environment Offi ce as a point
of coordination for development and environment. Under this offi ce, there
are two bureaus that are Spatial Plan (Tata Ruang) and Infrastructure (Sa-
rana dan Prasarana). Biro Tata Ruang is responsible for coordinating the
development and management of short-, medium-, and long-term spatial
plans for the city. Within the plans are specifi c laws and articles articulating
the incorporation of climate change adaptation and mitigation, as well as the
need for disaster risk management. Biro Prasarana dan Sarana is responsible
for monitoring the city development. However, the implementation and en-
forcement of these laws and articles is through BAPPEDA and the Depart-
ment of Public Works.
• BPLHD is the environmental agency and the key governmental contact
for many of the NGOs and other organizations working at the community
level. Th ey are involved in programs to abate greenhouse gas emissions in
Jakarta, including overseeing the development of a greenhouse gas emis-
sions baseline, to be completed in 2011. BLPHD also manages communi-
ty-level adaptation initiatives and studies in partnership with NGOs and
donor organizations.
• BAPPEDA is the development and management body for Jakarta. It manages
large infrastructure projects such as sea-wall construction in north Jakarta,
as well as the building of fl oodgates along the rivers and major infrastructure
projects like the East and West Flood Canals. Th e agency manages, fi nances,

ANNEX 5: JAKARTA CASE STUDY ■ 207
and monitors the fl ood infrastructure carried out by Dinas Pekerjaan Umum
(DPU), the public-works agency.
• BPBD was established as the citywide agency for disaster risk manage-
ment only at the end of 2010. Until then, disaster response was handled
by SATKORLAK, which is a national association based largely in the fi re
department and acted as more of a committee since it was not anchored in
a particular agency or formalized into government structure. Th e formal
empowerment and role of BPBD has yet to be fully developed, integrated,
and made widely public.
Relevant Policies and LegislationClimate change is integrated to a limited extent in the medium- and long-term city
spatial plans, but they relate for the most part to areas of the city experiencing the
greatest harm from fl ooding or other problems. Th e offi cial language in the plans
acknowledges the need for strategies related to climate change as well as plans for
disaster mitigation and response, but does not go into specifi c detail.
Adaptation plans to cope with extreme weather and sea-level rise are piece-
meal within the plans and agencies. More generally, the governor of Jakarta has
made public commitments in the international arena to reducing the city’s green-
house gas emissions.
Th e plans and policies of BPBD are not yet known, although a citywide
strategy for disaster prevention and response will most likely be developed and
managed by this agency. Th e National Action Plan for Disaster Risk Reduc-
tion (NAP-DRR) lists actions for Jakarta specifi cally, but the actions have been
developed by diff erent sectors and ministries. Th e budget numbers included
are the requests by the implementing party and have not been allocated or
approved.
Ongoing Programs in Disaster Risk Management and Climate ChangeAn important step taken by the DKI government was to establish the provincial
disaster risk management agency, BPBD. Currently, there is no comprehensive
program of disaster risk management or response plan for the city of Jakarta.
Th ere are large-scale infrastructure projects, such as the Jakarta Coastal Defense
that protects coastal neighborhoods from tidal surges, and the East and West
Flood Canals. Th e Jakarta Coastal Defense has been presented to the Jakarta
government as a feasibility study. Th e East and West Flood Canals are the larg-
est and most ambitious projects for Jakarta in terms of fl ood management, but
the intricate and smaller secondary and tertiary systems are still under-managed
and inadequate.
Many of the alert systems work at the community level and are largely self-
organized. Th ese are generally warnings from upstream fl oodgates that water is

208 ■ CLIMATE CHANGE, DISASTER RISK, AND THE URBAN POOR
getting high; the warnings are sent via SMS text message to neighborhood heads
so they can warn their communities. It is unknown how many of these small and
informal networks are actually in place. It appears that they evolved out of local
necessity. Many of the resources for the smaller, community-level projects and
programs come from local and international NGOs. Small government agencies
at the neighborhood level (RT and RW) are allocated budgets for some infra-
structural interventions, but they are not consistent across the city and in many
cases kelurahan-level budgets are not entirely spent every fi scal year due in part
to complicated and lengthy approval mechanisms by the provincial government,
or a lack of capacity at the local level to carry out physical interventions. Th is is a
national trend and not specifi c to Jakarta.
Policy ShortcomingsFormalization, publication, and awareness-raising are still sorely lacking in
the areas of climate change and disaster risk management in Jakarta, both
inside many government agencies and in the public realm. In many ways the
Jakarta government is only beginning to comprehensively measure and under-
stand the city’s key vulnerabilities—as well as its strengths and resources—to
become climate-resilient and to anticipate potential disasters. Th ere is also
a lack of coordination between the agencies described above, and very little
enforcement of well-meaning laws to create a safer and more secure built envi-
ronment. BNPB (Badan Nasional Penanggulangan Bencana) was developed as
the national coordinating and monitoring agency in 2008, with an operating
budget for disaster response of about IDR 4 trillion (US$464 million). How-
ever, more is currently needed for upgrades and implementation as reported
in the National Action Plan for Disaster Risk Reduction (NAP-DRR). (See
complete case study for list of items submitted for fi nancing by various agen-
cies for Jakarta.)
Lead Agency for Disaster Risk ManagementUntil recently, a national ad hoc agency (SATKORLAK) anchored in the fi re
department and was responsible for disaster response, but was doing little
anticipatory planning. Jakarta did not have a dedicated working group or
agency. At the end of 2010, BPBD was established for the province of Jakarta.
As it is a new agency, the role it will play in developing disaster mitigation
plans or allocating funding for the city’s kota or kelurahan remains unclear.
Mainstreaming Risk ReductionIn order to mainstream risk reduction, the government is incorporating those
activities and projects into the long-term spatial plans, the most recent of

ANNEX 5: JAKARTA CASE STUDY ■ 209
which is Jakarta’s plan for 2010–2030. NGOs and other donor organizations
are playing important roles currently to aid communities and community-
level governments to educate and prepare individual citizens, families, and
community leaders to prepare for damaging events such as fl oods from
extreme rainfall or from rises in tides. However, these actions are piecemeal
across the city and it is mostly poor communities that are targeted by these
organizations.
Expenditure on Pro-Poor Programs and Climate AdaptationTh e 2011 city budget for Jakarta is slightly more than US$3 billion. Indo-
nesia has a countrywide program to alleviate poverty (Program Nasional
Pemberdayaan Masyarakat (PNPM)—Mandiri or the National Program for
Community Empowerment1) that has had success in other urban areas, but
has not adequately reached extremely poor parts of Jakarta. Many of the
activities to reduce poverty are disbursed throughout various services and
departments, such as community empowerment, health, family planning,
and social services.
Table A5.2 shows the most relevant spending on climate change adaptation—
larger-scale initiatives related to infrastructure.
Pillar 2—Hazards Assessment
Past Natural DisastersTh e largest fl oods in Jakarta’s history took place in 2002 and 2007. Jakarta’s fl oods
are notorious, and the resulting stalling of traffi c, lost productivity, and property
TABLE A5.2 Infrastructure Investments per Year DKI
Annual budget, 2009 Annual budget, 2010
Flood controlEast fl ood canal $93,132,994 $60,350,180Drainage and river dredging $10,803,427 $11,424,314Dam, polder, and catchment area development
$620,887 $40,605,985
Pollution containmentOpen green space development $15,909,599 $77,238,296Climate change adaptation
Sea wall $2,235,192 $5,587,980

210 ■ CLIMATE CHANGE, DISASTER RISK, AND THE URBAN POOR
damage costs the city more than US$400 million per year. By 2002, more than a
quarter of Jakarta’s area was aff ected. Th e most disastrous fl ood to date, in Feb-
ruary 2007, cost 57 lives, displaced more than 422,300 people, and destroyed
1,500 homes, damaging countless others. Total losses to property and infrastruc-
ture were estimated at US$695 million.2 However, fl ooding of that magnitude is
relatively infrequent and is not necessarily the principal issue for Jakarta; fl ood-
ing occurs regularly throughout the year, stalling traffi c, damaging houses, and
gravely attenuating the fl ow of business at all levels of society. Even with just a
moderate amount of rain, vehicular mobility in the city is critically impaired,
oft en for hours.
Th e NAP-DRR cites parts of Jakarta as vulnerable to three hazards. However,
for DKI Jakarta, the analysis does not go beyond the level of the kota, so it is hard
to know how the risk aff ects diff erent areas of the municipalities and their diverse
populations.
TABLE A5.3 Institutional Mapping of Disaster Risk Management Functions
Risk assessment
Technical (planning,
management, maintenance)
Risk reduction early warning and response Public awareness
DNPIClimate change technical studies and coordination of mitigation activities
BNPDNational disaster risk reduction plans and policies and NAP-DRR (2010)
RT and RWLocalized early-warning systems for fl oods via SMS
BPLHDClimate change events and programs like car-free days
BPBDDisaster risk management and reduction plans, management, and training
BPBDLocal disaster management and response plan for Jakarta (to come)
DKI Department of Public Works (PU)Coordination of early-warning system with other provinces (water management)
DNPIConferences and publications
BAPPENASInter-agency coordination for infrastructure plans
BAPPEDAInfrastructure and planning projects; maintenance with PU and other agencies
SATKORLAKEmergency response
BIRO TATA RUANGPublication of 20-year spatial plan available to public
P2BRisk mapping for earthquakes

ANNEX 5: JAKARTA CASE STUDY ■ 211
Table A5.4Natural Hazards
Yes/No Date of last major event
Earthquake Y September 2009 and periodicWind storm NRiver fl ow Y Regularly, extreme during rainy seasonFloods, inundations, and waterlogs Y October 2010Tsunami NDrought NVolcano NLandslide NStorm surge Y January 2008 and recurringExtreme temperature Y Increasing on a yearly basis
TABLE A5.5 Jakarta’s Kota in National Ranking of Kabupaten or Regencies at High Risk for Various Disasters
Earthquake (out of 151 listed)
Drought (out of 182 listed)
Flood (out of 174 listed)
80 West Jakarta 8 North Jakarta 2 North Jakarta95 North Jakarta 9 East Jakarta 3 West Jakarta122 East Jakarta 10 Central Jakarta137 South Jakarta 11 West Jakarta
37 South Jakarta
Main Climate HazardsTh e main hazards for Jakarta relate to water management and fl ood control.
Extreme weather causes overloading of the existing drainage system, while sea-
level rise coupled with land subsidence is making Jakarta increasingly vulnerable
to tidal fl oods due to its coastal location (fi gure A5.4). Jakarta has also experi-
enced earthquakes (although minor, but as recently as 2009) and should be pre-
pared for other unprecedented geological events and tsunamis.
Areas at High Risk of Disasters and Climate ImpactsGiven the sea-level rise and subsidence that have been modeled for North Jakarta,
some industrial and residential areas and ports will be submerged in the next 100
years. Most of Jakarta’s remaining industries are located in the north, as are its
historic and active ports, which are key for Java’s fi shing economy. Th e airport

212 ■ CLIMATE CHANGE, DISASTER RISK, AND THE URBAN POOR
and other major roads, as well as Kota Tua, the 17th century remnants of the fi rst
Dutch settlement, will also be aff ected (fi gure A5.5).
Other Sources of Information on Potential Impacts of Disasters
• Jakarta Coastal Defense Strategy (JCDS): Recommendation and study by an in-
ternational consortium to build a 60 km sea defense along the coast to prevent
damage from both land subsidence and sea-level rise. Th e consortium is fund-
ed by the city of Rotterdam and is still only at the stage of a feasibility study.3
• Jakarta Urgent Flood Mitigation Project (JUFMP): A study and dredging plan
by the World Bank and DKI Jakarta, which included the “Jakarta Flood Haz-
ard Mapping Framework,” which does not include cost analysis but provides
the infrastructure framework required. Th e complete fi nancial study is avail-
able at DKI and the World Bank.4
• Th e Jakarta Building Control and Monitoring Offi ce (Penataan dan Penga-
wasan Bangunan: P2B): Th e offi ce is developing a risk map for Jakarta within
micro-zones of 150 m2 each, which analyzes buildings and soil conditions
within each. Th is initiative relates specifi cally to earthquakes and building
quality. Th e map is not yet complete.5
TABLE A5.6 Main Climate Hazards
Hazard Effects Losses
Earthquake Until now small, with very little physical damage.
Until now, no great material or life loss from earthquakes.
River fl ow Disruption of business, damage to property, power outages, groundwater pollution, and distribution of solid waste through high and fast water fl ow.
Property damage, business dam-age, tainting of ground water, loss of life, and spread of disease and refuse.
Floods, inundations
Depending on severity can affect traffi c circulation, business activity, damage to property, power outages, displacement, and spread of disease.
Loss of property and businesses, spread of illness and loss of life, and loss of access to clean water.
Storm surge Locally known as rob, extreme tidal fl oods from the sea have become more serious in the past few years in the coastal areas of the city. Sea water intrusion into aquifers.
Seawater intrusion into drinking water, damage to property includ-ing boats, and halt of industry and mobility.
Extreme temperature
As a result of both urbanization and loss of green space, increases in ground temperature and resulting instances of dengue.
Loss of life due to dengue, usually within very poor communities.

ANNEX 5: JAKARTA CASE STUDY ■ 213
Pillar 3—Socioeconomic Assessment
All of Jakarta is considered at high risk to disaster, since very few areas of the
city are immune to recurrent fl oods. However, the most vulnerable areas of the
city are along the coast, since they are susceptible to the eff ects not only of tidal
fl ooding from the sea, but also of fl oods from the rivers and canals that are dis-
charged into the Jakarta Bay (see fi gure A5.3 in the color section). Th ese com-
munities in the northern areas are also experiencing the greatest land subsidence.
Th e poorest people in Jakarta are generally those squatting on empty land along
riverbanks and canals. It is estimated that they comprise about 3.5 percent of the
urban population.
Location of the Urban PoorTh e level of exposure of very poor communities in Jakarta to both climate and
natural hazards is extremely high. Th is is due in part to many of the poorest
communities have settled illegally in areas close to sources of water: along major
drainage and water management areas and along the coast. Th is renders them
vulnerable to fl ooding from increased rain, as well as extreme hydrological events
and tidal anomalies and fl oods from the sea.
Characteristics of Informal SettlementsTh e poorest communities in Jakarta live in self-constructed settlements,
usually on land without formal legal title, and working in informal jobs. In
some instances, illegal and undocumented land leasing and landlord-tenant
contracting is practiced. Jakarta has a long history of these informal settle-
ments. In many of these areas, some individuals and families have lived in
what could be considered as “slums” for decades, so well-established social
networks and cultural identities of place in Jakarta run extremely deep. While
the numbers for Jakarta may be slightly lower, and remain hard to accurately
measure, up to 68 percent of Indonesians across the country make their living
through informal means (ILO 2010). In most areas of Jakarta, the residents
of informal settlements work as maids, janitors, security guards, and parking
attendants, and also run small local businesses such as food stalls and small
retail kiosks. In coastal settlements, the fi shermen are key to providing larger
companies with supplies of fi sh to sell across the city.
Examples of Good Practice Jakarta has yet to develop a comprehensive plan to address extreme poverty in
the city, especially in terms of involuntary relocation, housing provision, and
economic development of very poor communities. Indonesia has policies to alle-
viate poverty like conditional cash transfers and other mechanisms, but many

214 ■ CLIMATE CHANGE, DISASTER RISK, AND THE URBAN POOR
of these policies do not reach the poorest, particularly those in informal settle-
ments. Many of the very poor subsist on jobs and small businesses that are part
of Jakarta’s vast informal economy. Integrating climate change adaptation and
education into plans for social services and community awareness is new for the
Jakarta government. It has only been in 2011 that DKI Jakarta has been engaging
with local NGOs and other organizations and funders to develop and under-
stand community resilience specifi cally toward risk management related to cli-
mate change. PNPM (Program Nasional Pemberdayaan Masyarakat) is a 10-year
government program to reduce poverty funded in part by the World Bank,
a program that will incorporate disaster risk reduction activities into their estab-
lished community empowerment and capacity building; the addition US$15 mil-
lion, funded over 5 years, is through a grant from the Global Facility for Disaster
Reduction and Recovery, starting in 2011. However, only one or two of Jakarta’s
kelurahan may be eligible for this program.
Constraints and OpportunitiesVery little quantifi ed, centralized information is available about the most vulner-
able communities in Jakarta, the urban poor and informal settlements. However,
the highly visible climate-vulnerable locations of these communities allow for
easy identifi cation of specifi c locations for interventions in spatial planning and
social programming (like in North Jakarta and along many of the rivers). Th e cre-
ation and organization of data about the urban poor in Jakarta, and specifi cally
about their livelihoods and economic contribution to Jakarta, is key. Another
asset in terms of community information dissemination and preparedness is the
already-fairly decentralized local government structures of the RW and RT, with
budget and administrative allocation down to a minute level in the city. With this
TABLE A5.7 Social Assessment
City population below poverty line (%) 3.60Social inequality (Gini index) in 2002 (UN Habitat) 0.32Unemployment (% of total labor force) 11.05Areal size of informal settlements as a percent of city area
Unknown
City population living in slums (%) 5Human Development Index (2009) 77.36Predominant housing material For the very poor, assorted salvaged
materials; for self-builders, concrete blocks and brick.
ANNEX 5: JAKARTA CASE STUDY ■ 215
strong system already in place, it is relatively simple to scale up or replicate good
community-level programs across the city.
GHG Emissions InventoryA GHG emissions inventory for Jakarta is currently under development in part-
nership with BPLHD, DNPI, and the NGO group Swisscontact.
Notes
1. For more information, see www.pnpm-mandiri.org.
2. Why Are Th ere Floods In Jakarta? Flood Control by the Government of the Province of
Jakarta, PT Mirah Sakethi, 2010.
3. http://www.beritajakarta.com/2008/en/newsview.aspx?idwil=0&id=17983.
4. http://web.worldbank.org/external/projects/main?pagePK=64283627&piPK=73230&
theSitePK=40941&menuPK=228424&Projectid=P111034.
5. http://www.thejakartaglobe.com/opinion/editorial-mapping-out-path-to-a-quake-
ready-jakarta/432586.
Reference
World Bank. 2011. Jakarta: Urban Challenges in a Changing Climate. Jakarta: World Bank.


■ 217
Annex 6: Mexico City Case Study
Overview and Key Findings
Th e Mexico City case study under the Mayor’s Task Force brings together new and
existing knowledge for dealing with climate change, disaster risk, and the urban
poor. Results from this case study are contributing to the defi nition of the Mexico
City Climate Change Adaptation Program to be implemented in 2012. Th e objec-
tives of the Mexico City case study were to (1) establish the historic pattern and
trends of hydro meteorological events in the Metropolitan Area of Mexico City
(MAMC) and assess its spatial distribution and socioeconomic impacts; (2) model
climate change impacts in the MAMC; (3) develop indicators of risk and vulner-
ability; and (4) present institutional and policy recommendations to respond to
the challenges posed by climate change, natural disasters, and urban poverty.
Th e case study was prepared in collaboration between the World Bank and the
government of Mexico City. As part of this eff ort, a complete document in Span-
ish, “Pobreza Urbana y Cambio Climático para la Ciudad de Mexico,” and a short
fi lm are available for wider dissemination.
Th e approach used in this case study is based on the Urban Risk Assessment
(URA) framework. Accordingly, it includes an assessment of the hazards, socio-
economic vulnerabilities, and institutional aspects related to climate change
and disasters in Mexico City. Th is case study provides valuable geo-referenced
information regarding location of increased risk to landslides as a result of
extreme rain, and identifi es areas where increased heat-island eff ect is expected.

218 ■ CLIMATE CHANGE, DISASTER RISK, AND THE URBAN POOR
Institutionally, this case study has served to identify shortcomings in the cur-
rent operational framework for climate change and disaster risk management,
respectively.
Key Findings of the Study
In dealing with climate change, disaster risk, and the urban poor, the key chal-
lenge for Mexico City is to defi ne actions that will facilitate the streamlining of
adaptation measures within a context of limited institutional coordination and
cooperation across the 50 geopolitical and administrative units that make up the
Metropolitan Area.
The Vulnerability of the Poor to Climate Change and Natural Hazards Vulnerable groups in terms of population include about 7 million people (or
42 percent of population of the Mexico City Metropolitan Area) and about 1.5
million dwellings (see fi gure A6.5 in the color section). Most of the vulnerable
population in high-risk zones lives in locations with slopes over 15 degrees
(about 1 million people). Th is places them at risk of landslides as a result of
extreme precipitation. Th e total population that lives in high-risk zones repre-
sents about 40 percent of the vulnerable population.
The Government of Mexico City at WorkTh e government of Mexico City has taken an active role in initiating climate
change programs and the city is the fi rst in Latin America to launch a local cli-
mate change strategy. Th e Mexico City Climate Action Program (MCCAP) con-
sists of two complementary objectives: mitigation and adaptation.
Furthermore, the government has established the distinguished Virtual Cen-
ter on Climate Change for Mexico City (CVCCCM). Th e CVCCCM contributes
to increased and improved knowledge on the impact of climate change in the
metropolitan area, and contributes the formulation and implementation of public
policies. Th e CVCCCM operates in partnership with the Institute of Science and
Technology of the Federal District and in conjunction with the Centre for Atmo-
spheric Sciences of the National Autonomous University of Mexico (UNAM).
Mexico City has shown signifi cant leadership in bringing together the climate
change and disaster risk agendas, and has established the Inter-institutional Cli-
mate Change Commission of Mexico City, which is in charge of coordinating
and evaluating the Mexico City Climate Change Action Program. Although it is
premature to confi rm or refute whether the measures proposed in this program
will be mainstreamed into urban management practices, the wide participation
and the higher-level commitment suggest solid fi rst steps.

ANNEX 6: MEXICO CITY CASE STUDY ■ 219
Key ConstraintsKey constraints in dealing eff ectively with climate change, disaster risk, and the
urban poor include:
INSTITUTIONAL COORDINATION—Despite signifi cant progress in estab-
lishing an interinstitutional commission, the main challenge continues to be
coordination and cooperation. Even though the program is designed to cut
across institutional boundaries, limited ownership by the participants might hin-
der its success.
COMMON DATA PLATFORMS—Currently multiple agencies are taking
actions but with limited communication or information exchange among
concerned agencies. Furthermore, each agency has its own information plat-
form, which hinders data sharing. Th is signals a strong need to develop a
single common interface that all government agencies can use for data stor-
age and use.
LIMITED BUDGET ALLOCATION—Although the execution of the
MCCAP has an estimated cost of approximately US$5 billion, most of
which is budgeted for mitigation, there has been limited transfer of money.
The only instrument that could specifically provide resources for the action
plan is the Environmental Public Fund, while the remaining identified
actions would have to be financed through each respective agency’s annual
budgets.
Looking Forward
A few basic principles can guide the way forward for addressing climate change,
disaster risk, and urban poverty in Mexico:
• Th e consolidation of an institutional framework able to drive the medium-
and long-term challenges posed by climate change and natural disasters is in-
strumental for protecting the most vulnerable. Th is framework must specify
clearly each agency’s role while fostering synergies and collaboration.
• A common language (for example, technical terms and concepts), as well as
a common strategic direction for assessing challenges and progress toward
adaptation and resilience, is critical for mainstreaming this agenda in metro-
politan governance.
• Th e strategies for climate action plans should explicitly include reducing and
mitigating the impacts of meteorological events to the most vulnerable.
• Community-based social prevention is an important component of disaster
prevention
• Further work is necessary to unlock barriers in the development of the early-
warning system.

220 ■ CLIMATE CHANGE, DISASTER RISK, AND THE URBAN POOR
Case Study Summary
City Profi le
Th e Mexico City Metropolitan Area (MCMA) is one of the largest urban agglom-
erations in the world. Located in a closed basin of 9,600 km2, the MCMA spreads
over a surface of 4,250 km2 at 2,240 meters above sea level. Th e MCMA has a
metropolitan population estimated at 21.2 million, concentrates 18 percent of
the country’s population, and generates 35 percent of Mexico’s gross domestic
product on a surface equivalent to less than 0.3 percent of the national territory.
Approximately 8.8 million people, or 42 percent of the metropolitan popula-
tion, live in the city proper (Mexico City or the Federal District). Th e MCMA
comprises the 16 boroughs of Mexico City and 34 municipalities of the State of
Mexico, for a total of 50 geopolitical and administrative units that must coordi-
nate among themselves in terms of urban planning, public services, and overall
city management.
Th e MCMA has been growing constantly since the 1930s both physically and
demographically. Th e pace of geographic and population growth, however, has
been distinct. Physical and demographic growth reached its peak in the 1960s,
Figure A6.1 Administrative Map of Mexico City Metropolitan Area
MEXICO
MORELOS
DISTRITOFEDERAL
HIDALGO
HIDALGO
TLAX
CA
LAP
UE
BLA
Federal district
Cities of the state of Mexico
Cities of the state of Hidalgo
State borders

ANNEX 6: MEXICO CITY CASE STUDY ■ 221
and until the 1990s the physical expansion (urban sprawl) formed a continuous
urbanized area with gross population density decreasing over time, and spatially
increasing with distance from the historical city center. Since 1990 growth has
been characterized by leapfrog expansion, and urban spatial continuity was
broken. Current land use now bears limited contiguity to previously urbanized
areas. For example, in 2000 the neighboring municipalities located in the State of
Mexico represented 52 percent of the population and grew at an annual rate of
2.4 percent on average, while the 16 boroughs of Mexico City had a population
growth rate of 0.3 percent annually.
Th e MCMA is characterized by seismic risk and with no natural drainage for
runoff from the surrounding mountains; it is also vulnerable to fl ooding, par-
ticularly in the western part. Th e metropolitan area is aff ected by severe storms,
heat waves, and droughts. Th e size of the population in the MCMA complicates
the possible impacts of these events, as the infrastructure and public services
are stretched thin. As a national economic engine, Mexico City’s geophysical
characteristics and presence of risk of multiple natural hazards underscores the
need for the city to implement activities and programs that will increase its
physical and social resilience. To take a recent example, the economic impact
of the 2009 A (H1N1) infl uenza epidemic amounted to 0.4 percent of GDP
(40 billion pesos).
Figure A6.2 Urban Expansion of Mexico City Metropolitan Areas, 1950–2005
Legend1950196019701980199020002005

222 ■ CLIMATE CHANGE, DISASTER RISK, AND THE URBAN POOR
The Built Environment and Basic Service ProvisionMexico City was the fi rst city in Latin America to introduce a strategy for local
climate action that has been designed to reduce overall greenhouse gas emis-
sions by 7 million metric tons from its inception by Mayor Marcelo Ebrard in
2008–2012. Th e climate action program is part of a 15-year plan in which
Mexico City is investing US$1 billion a year (approximately 9 percent of the
yearly budget). Th e Green Plan (Plan Verde) has seven pillars: (1) land con-
servation, (2) public spaces, (3) air pollution, (4) waste management and recy-
cling, (5) water supply and sanitation, (6) transportation, and (7) mobility.
Mexico City has the largest metro system in Latin America, which currently
comprises 200 km of subway lines. It is currently being expanded with a twelft h
metro line stretching 25 km, due to be fi nished in 2012—with an investment of
US$2 billion. Th e Metro, which does not extend outside the limits of the Federal
District, is complemented by a suburban rail system and an extensive network
of bus routes. Mexico City’s fi rst Bus Rapid Transit line, the Metrobus system,
began operation in June 2005. Th e city has begun construction of a third line for
Metrobus that will run from the city’s northwest to the central-south, extending
over 16 km with 31 stations.
Water access is a complex problem for Mexico City, which has a supply net-
work of some 13,000 km of primary and secondary pipelines. Beyond issues of
expanding coverage and continuity of water services, the city rests on heavily
saturated clay that has been collapsing and causing areas of the city to sink
and subsequently endure more frequent fl ooding due to over-extraction of
groundwater. Forecasts to 2015 estimate that rates of water consumption will
increase by 20 percent compared to 2000 levels, with urban demand reaching
TABLE A6.1Mexico City Profi le
Total city population in 2010 federal districtTotal metropolitan area population in 2010
8.8 million (INEGI 2010)21.2 million
Population growth (% annual) 3.05 (CONAPO 2010)Land area, federal district (km2)Land area, metropolitan area (km2)
1,4854,250
Population density (per km2) 5,958Country’s per capita GDP (US$) 9,243 (2010 estimate)Country’s population (federal district) (%) 7.87Total number of households 2,388,534 (INEGI 2010)Dwelling density (per hectare) 23.9 (SEDESEOL)Avg. household income US$ (2008) 53,295GDP per capita US$ (2008) 14,382Country’s GDP (%) 21.8Total budget (US$) 11.7 billionDate of last Urban Master Plan n/a

ANNEX 6: MEXICO CITY CASE STUDY ■ 223
62 m3 per second. Mexico City’s climate action program therefore includes
measures to invest in water infrastructure, for example, the rehabilitation of the
city’s sewerage system as part of a program of hydraulic works.
Regarding land conservation, 59 percent of the total land area of Mexico City
is designated a conservation area, with the city’s remaining forested areas located
in the southern boroughs. Th ese areas are under threat from illegal development,
logging, and fi res, which impact regional rain patterns. At present the city’s gen-
eration of garbage is increasing at a rate of 5 percent a year and the current insuf-
fi cient rates of its collection have created “clandestine” fi elds. Bordo Poniente,
one of the world’s largest landfi ll sites, receives 12,500 tons of waste every day. In
response, Mexico City has initiated a recycling program and is encouraging its
citizens to separate trash.
Pillar 1—Institutional Assessment
Given the institutional and political complexities of the Mexico City Metro-
politan Area, the Mexico City Climate Action Program (MCCAP) 2008–2012
requires a high level of coordination among multiple agencies and civil society.
Th e MCCAP was developed as part of both the Green Plan and the Environ-
mental Agenda of Mexico City. Th e Green Plan extends to 15 years, laying out
strategies and actions of sustainable development for Mexico City. Th e Environ-
mental Agenda of Mexico City is a 5-year plan that defi nes the city’s environmen-
tal policy. At the same time, both the Green Plan and the Environmental Agenda
are part of one of the pillars of Mexico City’s Development Program.
Th e main objectives of the MCCAP are twofold: (1) reduce carbon dioxide
emissions by 7 million tons (or equivalent) in the period 2008–2012 and (2)
develop a Climate Change Adaptation Program for the Federal District and
begin its implementation by 2012. To achieve these objectives, the government
uses various policy instruments, including direct investment from Mexico City,
regulation, economic incentives, voluntary carbon markets, and education and
information campaigns.
Th e Inter-institutional Climate Change Commission of Mexico City is in
charge of coordinating and evaluating the MCCAP. Th is commission includes
representatives from all the administrative units of the Federal District. In addi-
tion, three deputies from the district’s Legislative Assembly are invited to attend
each session. Among its specifi c responsibilities are to design, encourage, and
coordinate policies to mitigate climate change eff ects in Mexico City; to evaluate,
approve, and disseminate related projects; to develop fi nancial strategies that gen-
erate revenue; and to coordinate actions and policies with other programs linked
to the MCCAP. To facilitate coordination and provide support to the MCCAP,
the Legislative Assembly of Mexico City is working on a proposal for a climate
change law (not yet entered into force as of March 2011).

224 ■ CLIMATE CHANGE, DISASTER RISK, AND THE URBAN POOR
Although the execution of the MCCAP has an estimated cost of approximately
US$5 billion, most of which is budgeted for mitigation, there has been little trans-
fer of money. Th e only instrument that could specifi cally provide resources for
the MCCAP is the Environmental Public Fund, while the remaining identifi ed
actions would have to be fi nanced through each agency’s annual budgets.
Th e main challenge of the MCCAP is the lack of institutional coordination and
cooperation. Even though the program was designed to cut across institutional
boundaries, there is lack of ownership and it is mostly considered a program of
the secretary of environment. Currently multiple agencies are taking actions but
with limited communication or information exchange among concerned agen-
cies. Further exacerbating the open exchange of data is that each agency has its
own information platform. Th is signals a strong need to develop a single com-
mon interface that all government agencies can use for data storage and use.
Climate Change Adaptation and Disaster ResponseTh e MCCAP’s program of adaptation consists of short- and long-term actions
that aim to reduce risks to the population and economy of Mexico City by taking
the potential impacts of climate change into account. Th e lines of action regard-
ing adaptation are: (1) identifying key threats and performing a vulnerability
analysis, (2) mainstreaming adaptation to enhance existing capabilities in Mexico
City’s government, and (3) implementing adaptation.
Th ere are multiple agencies involved in responding to extreme hydro-meteo-
rological events, including: Th e Water System of Mexico City, the Civil Protection
Agency, the Public Safety Agency, the Health Department, the Social Develop-
ment Agency, the Social Assistance Institute, and the Urban Development and
Housing Agency. Th eir main tasks follow.
TABLE A6.2 Institutional Responsibilities Relating to Climate and Disasters
Institution Headed by/level Major function
Water system of Mexico City
Secretary of environment
Responsible for public services related to water supply, drainage, sewerage, and water treatment. They also coordinate and operate the “Storm Unit” during high-precipitation emergencies in 90 previously identifi ed high-risk locations, with the participation of the Civil Protection Agency, the Public Safety Agency, and the Fire Department.
Civil Protection Agency
Secretary of interior
Responsible for coordinating prevention and response to natural disasters, mainly fl oods and earthquakes, using a “Risk Atlas” that has more than 100 maps de-picting multiple hazards. In terms of fl ooding, they have
(continued next page)

ANNEX 6: MEXICO CITY CASE STUDY ■ 225
Ongoing Programs and Projects Related to Disaster Risk Management or Climate Change AdaptationPrograms for climate change adaptation focus on early-warning systems and
medium-term response:
• Programs on early-warning systems and upstream prevention include the im-
plementation of a hydro-meteorological monitoring and forecasting system
for Mexico Valley, an epidemiological monitoring system, and a remote iden-
tifi cation and monitoring system for fi res. In addition, initiatives are in place
identifi ed critical locations based on past events, but these are not necessarily the same maps used by the Water System of Mexico City. Importantly, this agency has focused mainly on prevention, response, and ca-pacity building for seismic disasters. They defi ned and are implementing the Crisis and Immediate Response Action Plan.
Public Safety Agency
Operates in coordination with the water system of Mexico City and the Civil Protection Agency
Intervenes when natural disasters occur.
Health Department
In emergencies, coordinates with the Civil Protection Agency
Responsible for periodic monitoring of epidemic pre-vention and response (including AH1N1 and dengue). In addition to medical attention, it organizes vaccina-tion campaigns.
Social Development Agency
Provides support and responds to emergencies related to heat and cold waves and fl oods. In addition to operating public dining locations, the agency estab-lishes shelters with food and provides psychological assistance.
Social As-sistance Institute
Responsible for general social assistance (including psychological support) for the Federal District, but also during emergencies. Through one of its programs, it operates a hotline to support homeless people. It also supports families affected by disasters and operates 11 centers for social assistance.
Urban Development and Housing Agency
Responsible for medium- and long-term prevention of disasters through urban planning. It is involved in is-sues related to irregular terrains in high-risk locations. It has plans to develop an information system for Mexico City that will include geographic and urban develop-ment indicators.
TABLE A6.2 continued
Institution Headed by/level Major function

226 ■ CLIMATE CHANGE, DISASTER RISK, AND THE URBAN POOR
for management of hillside risk, the protection of native vegetation to reduce
erosion, and the establishment of processes to help vulnerable populations.
• Regarding medium-term response, Mexico City is running projects on
water and land conservation, land management for agricultural rural areas,
reforestation with more resilient species, and green roofi ng in urban areas.
Table A6.3 shows the goals and key results of the main projects to adapt to
climate change in the context of the Climate Action Program for Mexico City.
• For emergency response in case of landslides or fl ooding, the most relevant
agencies are the Department of Civil Protection, Fire and Health, comple-
mented by Brigades of the Ministry of Social Development, to provide shelter,
hot food, and psychological help to those aff ected, as well as the Ministry of
Public Security to control access and prevent vandalism. As a permanent ac-
tivity, there are homeless shelters and soup kitchens and attention to patients
with severe respiratory or dehydration.
TABLE A6.3 Status of Main Projects to Adapt to Climate Change
Program/responsible agency Goals Results
Urban Hillsides Program—Environmental Agency
By 2012, identify 33 hillsides and develop and disseminate their manage-ment programs
As of 2009, nine hillsides identifi ed and seven programs developed
Dengue Monitoring—Health Department
Determine mortality rate due to dengue
Annual studies made to identify the presence of the virus, risky areas mapped, and household surveys made
Monitoring and preven-tion of health effects due to extreme weather—Health Department
Avoid mortality and mitigate risks and health effects of exposure to extreme temperatures
Information campaigns con-ducted, serum kits distributed, and chlorine in water closely monitored
Epidemiological and health monitoring of climate change—Health Department
Monitor chlorine in water, water supply systems, sanitary monitoring of food production and distribu-tion, among others
In 2010, over 36,000 water samples and 125 food samples taken for analysis. Over 1,900 visits to establishments to evalu-ate sanitary conditions
Support to vulnerable populations during winter season—Social Assistance Institute
Provide support and social assistance to vulnerable people
In 2010, over 200,000 warm dinners and 15,000 blankets dis-tributed. Also, over 6,000 medical consultations provided, among other services
Risk Atlas of Mexico City—Civil Protection Agency
Develop an integrated information system shared by all administrative units
Efforts ongoing
(continued next page)

ANNEX 6: MEXICO CITY CASE STUDY ■ 227
Shortcomings in Current Disaster Risk Management or Climate Change Adaptation ManagementDisaster risk in Mexico City is handled in a reactive manner with limited pre-
ventative measures in place. Implementation of the early-warning system, envi-
sioned as one of the priority adaptation measures included in the MCCAP, has
been delayed due to administrative issues. In addition, there is an evident need
to improve the sharing of information among the relevant government agencies,
taking as an example the Risk Atlas (elaborated by the secretary of civil protec-
tion), to which not all agencies have access.
Leading Activities to Coordinate Agency Risk Management Th e secretary of civil protection is in charge of risk management in Mexico City,
although many other agencies are also involved.
Pillar 2—Hazards Assessment
Natural Disaster HistoryTh e Mexico Valley is exposed to increases in extreme temperatures, which with
expanding urbanization has contributed to a signifi cant heat-island eff ect for
Mexico City. Projections reveal that the mean temperature is expected to increase
by 2–3°C toward the end of the 21st century, and extreme precipitation is also
expected to increase. Characteristically rising temperatures are accompanied by
Preventive program for hydro-meteorological risks—Civil Protection Agency
Prevention, mitigation, and response to emergencies due to hydro-meteorologi-cal events
260 informational reports dissemi-nated, often daily during the week
Storm Unit Program—Water System of Mexico City
Response to negative ef-fects of precipitation during the rainy season
Between 2008 and 2010, over 6,000 cases were attended and resolved
Reduction of extreme precipitation impacts in “El Arenal”—Government Secretariat
Mitigate negative impact of extreme precipitation in 14 areas
Food, drinks, blankets, and clean-ing products distributed. Equip-ment installed to speed up the drainage, and sewers cleaned
Sustainable housing in the Federal District—Housing Institute of the Federal District
Incorporate green technologies into new housing
Solar water heaters, energy effi ciency lamps, and water treat-ment by re-utilization, among others, incorporated in over 5,000 new dwellings
Source: Leon et al. (2010).
TABLE A6.3 continued
Program/responsible agency Goals Results

228 ■ CLIMATE CHANGE, DISASTER RISK, AND THE URBAN POOR
an increase in extreme rain, consequently placing Mexico City at heightened risk
of fl ooding and landslides, particularly in the western part of the city.
Current Trends and ProjectionsTemperature—Th e temperature in the Mexico Valley refl ects its geography,
where warmer temperatures are concentrated in the lower elevations and cooler
temperatures in the elevated areas. Nevertheless, with time, the temperature in
the Mexico Valley has changed due to urbanization, constituting one of the clear-
est examples of a heat-island eff ect in the world. Th e highest values are observed
in the northeast, where the average maximum reaches 30°C. Th e area with main
maximum temperatures over 24°C increased considerably between 2000 and
2007, and the minimum temperature increased by 2°C and 3°C in the north and
northeast, respectively, in the same period. While temperature increase in the
western part of Mexico City has been lower, the frequency and duration of heat
waves in the area are increasing. For example, the number of heat waves of three
or more days with 30°C or higher increased from 2 in 1877–1887 to 16 in 1991–
2000 in the west of the Federal District (Jáuregui 2000). Simulation exercises
for temperature in January show that temperature in the northeast, which is
the region that has grown fastest, increased 2°C. Although this temperature rise
may in part be the eff ect of urbanization, some atmospheric conditions may also
have had an impact, and this order of magnitude is in line with those expected
this century by models simulating global warming.
To further understand temperature increases associated with urbanization,
an analysis was undertaken of temperature trends in areas with rapid urbaniza-
tion against those in regions that are close to highly vegetated areas. For Mexico
City, the trend in the minimum temperature in regions with rapid urbanization
between 1963 and 2000 is an increase of about 0.7°C per decade, while for regions
close to vegetated areas the associated increase was about 0.1°C per decade.
TABLE A6.4 Natural Hazards
Yes /No Date of last major event
Earthquake Y 1985Wind storm Y 2010River fl ow NFloods, inundations, and waterlogs Y 2010Tsunami NDrought Y 2011Volcano NLandslide YStorm surge NExtreme temperature Y

ANNEX 6: MEXICO CITY CASE STUDY ■ 229
Another way to evaluate the eff ects of extreme events is to analyze the 90th
percentile of the maximum temperature using a projection from the Earth Simu-
lator. For 2015–2039, the northeast region will have temperatures around 30°C
for at least 10 percent of the year, as shown in fi gure A6.3.
Precipitation—Precipitation projections for Mexico City seem to be consis-
tent with the general projection made by the Intergovernmental Panel on Climate
Change (IPCC) in 2007, which states that precipitation will increase in regions with
high precipitation and decrease in regions with low precipitation. Particularly, the
intensity and quantity of extreme precipitation is expected to increase in the west
of the city, and decrease in the east. In the Mexico Valley the highest precipitation
occurs between mid-May and early October, with the western region receiving the
most precipitation in August. On average, annual precipitation is between 700 and
900 mm (±30 percent). Th e highest intensity usually occurs during the aft ernoon
and early evening. Th e western region presents upward trends for daily precipita-
tion and episodes over 20 mm/hour over the past 100 years. During September
and October, more than 30 mm/hour of rain may occur, which, based on a review
of landslides, is the critical threshold for landslides of saturated land. Projected
increases in extreme precipitation in terms of the intensity and duration are shown
in fi gure A6.4. In the west of Mexico City, these increases constitute a signifi cant
hazard for vulnerable populations located on hillsides. Additionally, projected
increases in extreme precipitation add to the risk of fl ooding in the west of Mexico
City and the southern areas of the Federal District.
Water Runoff—Climate change projections indicate that with increasing
temperature, evapotranspiration increases at the expense of infi ltration and runoff .
For many urban areas, including the MCMA, changes in land use also aff ect this
ratio, whereby as urbanization increases, less water is naturally absorbed into the
ground and more runoff occurs. Assuming 100 mm of rainfall and using informa-
tion about land and vegetation types, the approximate amount of water runoff was
calculated for Mexico Valley.1 Th e fi ndings show a noticeable increase in runoff in
Figure A6.3 90th Percentile of Maximum Temperature, in Celsius, in1979–2003 (left) and 2015–2039 (right)
22 – 2323 – 2424 – 2525 – 2626 – 2727 – 2828 – 30
Source: Leon et al. (2010).

230 ■ CLIMATE CHANGE, DISASTER RISK, AND THE URBAN POOR
2000 when compared with 1980. Th e increased precipitation and resulting runoff
increases fl ood risk in the city, particularly given the existing drainage system.
Pillar 3—Socioeconomic Assessment
Location of the Urban PoorVulnerable groups were identifi ed and mapped in terms of population and hous-
ing characteristics by doing a cluster analysis with data from the 2000 offi cial
census.2 In terms of population, vulnerable groups include areas with high con-
centration of people over 18 years without secondary education, people that
moved in the past 5 years, and people with low income. As shown in table A6.5,
this group includes about 7 million people (or 42 percent of the population of the
Mexico City Metropolitan Area) and about 1.5 million dwellings.
In terms of housing, vulnerable groups are concentrated in areas characterized
by use of precarious construction materials in walls and ceilings, those without
access to basic services, and where formal property ownership and rights are lim-
ited. Th is group includes about 5 million people (or 30 percent of the popula-
tion) and about 1 million dwellings. Th e location of these groups is shown by
fi gure A6.5, in the color section. Th e most vulnerable in terms of both population
and housing represent about 27 percent of the population and are located in the
peripheral area of the MCMA, mostly to the north and east.3
Exposure of the Urban PoorTh e information on vulnerable groups was overlaid with information on
extreme precipitation and temperature, and locations with steep slopes.
Maps similar to fi gure A6.5 were created to observe the location of these
groups with respect to high-risk zones: current and future extreme precipi-
tation and vulnerable housing; vulnerable population and housing located
Figure A6.4 95th Percentile of Precipitation (mm/day) in 1979–2003 (left)and 2015–39 (right)
14–1516–1718–2021–2223–2526–2829–30
Source: Leon et al. (2010).

ANNEX 6: MEXICO CITY CASE STUDY ■ 231
in zones with high risk of extreme precipitation; vulnerable population and
housing located in zones with slopes over 15 degrees; vulnerable population
and housing located in zones with risk of heat waves; and vulnerable popu-
lation and housing located in zones with risk of extreme precipitation and
slopes over 15 degrees.
Figure A7.4, in the color section, shows the distribution of population and
housing for each event. Most of the vulnerable population in high-risk zones
lives in locations with slopes over 15 degrees (about 1 million people). Th e
total population that lives in high-risk zones represents about 40 percent of
the vulnerable population and about 41 percent of the vulnerable dwellings.
Importantly, about 60 percent of the vulnerable population and dwellings are
not located in high-risk zones.
TABLE A6.5 Vulnerability Matrix in Terms of Population and Housing
Population
Low vulnerability High vulnerability
Hou
sing
Low vulnerability 2,609 PSUs*9,516,901 people2,329,416 dwellings54.8% of population
514 PSUs2,639,058 people584,547 dwellings15.2% of population
High vulnerability 164 PSUs577,583 people128,831 dwellings3.3% of population
1,354 PSUs4,635,298 people964,144 dwellings26.7% of population
*Primary sampling units.
Source: Leon et al. (2010).
TABLE A6.6Social Assessment
City population below poverty line (%) 59.4Social inequality (Gini index) in 2002 (UN Habitat) 0.43 (2008) CIA factbookUnemployment (% of total labor force) 6.3Areal size of informal settlements as a percent of city area
n/a
City population living in slums (%) 22Children completing primary and secondary education: survival rate
57.4 (Mexico City)
Human Development Index (2009) 75Predominant housing material For the very poor, assorted salvaged
materials; for self-builders, concrete blocks and brick

232 ■ CLIMATE CHANGE, DISASTER RISK, AND THE URBAN POOR
Economic Costs of Climate Change—Another important aspect of the
socioeconomic assessment was the analysis of the economic costs of climate
change in terms of GDP for the Federal District. Th is analysis incorporated
four scenarios. Th e base scenario, named A2, does not include climate change
impacts and assumes 1.99 percent of annual GDP growth, 1.81 percent of
annual GDP per capita growth, and 18 percent of population growth for 2100.
Th e other three scenarios correspond to diff erent goals on reduction of green-
house gas emissions considered in international negotiations (that is, 550, 450,
and 350 parts per million, or ppm). Th e analysis incorporated three discount
rates (0 percent, 1 percent, and 4 percent); however, based on the literature on
the costs of climate change, the authors recommend using 0 percent to draw
conclusions. Table A6.8 shows costs for each scenario in terms of GDP reduc-
tion and additional number of poor people by 2100 for the Federal District,
using a 0 percent discount rate. Shown is the average value, as well as the 95
percent confi dence interval in parentheses.
Under the status quo scenario (A2), it is expected that the GDP will be reduced
19 times on average. Th ese results are not too diff erent from those under the 550
ppm scenario. However, if the 350 ppm scenario is realized, the benefi ts could
reach 32 times the current GDP (in terms of avoided losses). Also under the A2
scenario, the number of poor is projected to increase to over 1 million (or about
10 percent of population in 2100), although the average increase is expected to
be 450,000. Th e analysis also pointed out that economic losses are not distrib-
uted equally among administrative units. Th ose that will lose the most are those
that are currently worse off . In other terms, if the temperature increases by 2°C,
Mexico City could lose up to 7 percent of its GDP and get 150,000 additional
poor annually.
TABLE A6.7 Distribution of Vulnerable Groups Located in High-Risk Zones
Event PSUs1 % Population % Housing %
I. Extreme precipitation 48 3.55 179,019 3.86 38,909 4.06II. Slopes over 15 degrees 288 21.27 1,004,586 21.67 208,546 21.63III. Heat waves 117 8.64 367,450 7.93 76,771 7.96I + II 59 4.36 251,118 5.42 53,455 5.54I + III 1 0.07 39 0.00 10 0II + III 23 1.70 62,449 1.35 13,175 1.37I + II + III 0 0.00 0 0.00 0 0.00Vulnerable in high-risk zones 536 39.59 1,864,661 40.23 390,866 40.54Total vulnerable 1354 100 4,635,298 100 964,144 100
Source: Leon et al. (2010).
1PSU refer to primary sampling units defi ned in the context of the 2000 census.

ANNEX 6: MEXICO CITY CASE STUDY ■ 233
Notes
1. Runoff calculation was undertaken using the curve number method, developed by the
USDA Natural Resources Conservation Service.
2. Th e census data are coded, for all variables, in primary sampling units (PSUs) or ter-
ritorial units, called by the Mexican offi cial census institution basic geo-statistic areas
(AGEBs, Areas Geoestadísticas Básicas).
3. In addition to those living in low-income neighborhoods, Mexico City also has a siz-
able homeless population, which is particularly vulnerable to extreme events. Impor-
tantly, this segment of the population is not accounted for in the city’s calculations of
urban poverty, as such information relates to those who possess a dwelling.
Reference
Leon, C., V. Magaña, B. Graizbord, R. González, A. Damian, and F. Estrada. 2010. “Pobreza
Urbana y Cambio Climático para La Ciudad de México.” Unpublished, Mayor’s Task
Force Study, Mexico City.
TABLE A6.8 Costs in Terms of GDP and Additional Poor
ScenarioGDP reduction by 2100,
no. of times
Additional number of poor people by 2100,
in thousands
A2 19.10 (5.22, 45.79) 441 (98,1281)550 ppm 17.35 (4.52, 43.04) 392 (81,1176)450 ppm 10.77 (3.15, 24.38) 213 (51,560)350 ppm 6.50 (2.03, 13.70) 104 (26,249)
Source: Leon et al. (2010).


■ 235
Annex 7: São Paulo Case Study
Overview and Key Findings
In São Paulo, the largest city in Latin America, almost 11.5 million people live
in 1.5 km2. More than 40 percent of the population lives in peripheral areas that
concentrate a vast proportion of the city’s poor and socially vulnerable citizens.
São Paulo is already experiencing some consequences of a changing climate:
more frequent heavy rains, higher temperatures, and decreased air humidity. An
estimated 900,000 houses in the peripheral areas are considered at risk—some
located in slopes and fl oodable areas—and will be the most aff ected by climate
change.
In this context, this case study presents the fi rst comprehensive revision
of policies and programs at the intersection of climate change, disaster risk,
and the urban poor in São Paulo. Th e case study has been prepared by the
World Bank, in close consultation with the São Paulo Housing Secretariat
and the Green and Environment Secretariat. Th ese two secretariats have
contributed with their expertise in working with slums and informal settle-
ments, as well as working in disaster risk management and climate change
adaptation.
Th e approach used in this case study is based on the Urban Risk Assessment
(URA) framework. Accordingly, it includes an assessment of the hazards, socio-
economic vulnerabilities, and institutional aspects related to climate change and
disaster risk management in São Paulo. Extensive data collection and stakeholder

236 ■ CLIMATE CHANGE, DISASTER RISK, AND THE URBAN POOR
consultation was carried out as part of this study. In particular, two highly vul-
nerable communities in São Paulo were consulted and analyzed more in depth.
With a focus on the urban poor, this study considers how poor communities
are aff ected by climate change and natural hazards, examines approaches that
have been taken to address these challenges, and identifi es priorities and options
for further action in São Paulo. Th is study draws on other existing reports and
resources on disaster risk management and climate change, as well as on inter-
views and discussions with key stakeholders.
Key Findings of the Study
Independent studies predict that in the absence of signifi cant policy changes, by
the end of the century urban occupation in São Paulo will be twice the current
one and 11 percent of the future occupied areas could be located in areas at risk
for landslide. Th is will increase the risks of fl oods and landslides, impacting dis-
proportionally the poorest.
Although this scenario will occur only in the absence of signifi cant changes
in the spatial distribution and socioeconomic characteristics of the city, it does
highlight the importance of dealing with climate change and disaster risk with a
focus on the urban poor.
Th e Mayor’s Task Force in the city of São Paulo found that:
• Th e vulnerable groups who occupy areas at risk will have diffi culty coping
with unpredictable and extreme weather. Slum dwellers (currently more
than 890,000 households) lack the resources necessary to adapt rapidly to the
changing circumstances.
• Slums face the most hazardous conditions; more than 5 percent of slum areas
are highly or very highly exposed to landslides and are highly prone to be
aff ected by destructive events in the next 12 months.
• While the location of certain settlements in areas of fl ood plain or wetlands
does not necessarily indicate fl ood hazards, it is an indirect estimate of areas
potentially more exposed to such events. Th e incidence of precarious and
informal settlements in these areas shows how intensive their occupation
has been. About 20 percent of the slums and informal urbanized centers are
located in fl ood plains. About 13 percent of the allotments and informal settle-
ments are located in fl ood plains and fl ood hazard areas.
• In the slums, virtually all families live in poverty or extreme poverty. In addition,
a great number of the basic services that the people depend upon suff er nega-
tive impacts with the severe weather. For instance, the public transportation
system in São Paulo is not fully equipped to handle fl oods and overfl ows.
• Th e sanitation system has some defi cits (6 percent of houses do not have
proper sewage collection and 25 percent of the effl uent is not treated).

ANNEX 7: SÃO PAULO CASE STUDY ■ 237
• Energy service is irregular and the systems suff er with the storms, which lead
to electricity shortage in houses and streets, creating an unsafe feeling among
the inhabitants.
The Government of São Paulo at WorkTh e city of São Paulo has been a pioneer in monitoring greenhouse gases at the
city level. As part of the C40 group, São Paulo has committed to prepare a GHG
emissions inventory, adopt a future reduction target on GHG emissions, create a
local action plan in a participatory process, implement climate policies and mea-
sures, and monitor and verify results.
In 2005 São Paulo launched its fi rst inventory. Furthermore, in 2007, the City
Assembly passed a law that required new houses and buildings assembled with
more than four bathrooms to adopt a solar-panel heating system. In 2009 the
City Assembly approved the City Climate Law to ensure the city´s contribution
to stabilizing GHG in the atmosphere in accordance with UNFCCC principles.
Th e City Climate Law set a reduction target of 30 percent in GHG emissions
against the baseline 2005 emission levels. Additional targets should be defi ned
each two years. Th e law establishes a number of commitments for the city to follow
by sector. From 2005 to 2010, the city already has cut its emissions by 20 percent,
largely due to implementing biogas power plants on two large landfi lls.
A Special Fund for the Environment and Sustainable Development was cre-
ated in 2001 with the purpose of fi nancially supporting projects that aim to
improve the sustainable use of natural resources; control, monitor, protect, and
recuperate the environment; and initiate environmental education. Currently, the
fund does not have budget revenue from the municipal government of São Paulo,
instead its revenue coming from various resources (R$8 million) that are directed
to 15 projects from NGOs chosen through tenders; and Carbon Credits Auctions
(R$33 million + 37 million), the amount originated from CDM projects imple-
mented at the Bandeirantes Landfi ll and São João Landfi ll. Th e fund has been
used to support the creation of a database on GHG emissions, publication of an
inventory of anthropic emissions every fi ve years, and actions for climate change
mitigation, including incentives for the private sector and research institutions.
Areas for ImprovementSome of the recommended areas for work out of the Mayor’s Task Force include:
• Housing—Increase the regularization and improvement of slums and irregu-
lar allotments and relocate families from risky areas.
• Health—Increase the number of people served in health services and increase
its qualities.
• Transportation—Increase the coverage of bus, trains, and subway routes,
improve bus stops and terminals, renovate electric bus system and cars, enable
public transport, decrease traffi c rates, and increase traffi c safety.

238 ■ CLIMATE CHANGE, DISASTER RISK, AND THE URBAN POOR
• Education—Improve public system, decrease evasion rates, especially for the
medium (or secondary) education; increase the number of public nurseries
(insuffi cient to meet the growing demand).
• Water supply—Increase the water quality and protect water basins.
• Sewage—Increase system coverage and avoid illegal disposal of sewage into
water courses.
• Waste management—Increase inspection of illegal dumping places, decrease
waste generation, and increase recycling.
• Cleaning—Improve cleaning coverage for culverts and streets.
• Drainage—Clean and dredge the river bottoms, clean and increase the exist-
ing drainage underground channels, and build more “pools” (“piscinões”)
around the city.
• Looking forward—Mainstream climate change, climate variability, and disas-
ter risk reduction in planning land use. Th is should strengthen the municipal-
ity’s own medium-term planning, enabling them to prepare for (among other
things) the hosting of Global Expo in 2020.
Looking Forward
Overall, this study highlights some of the challenges a metropolis like São Paulo
is facing regarding present and future climate change and disaster risk scenarios,
especially when dealing with an ever-increasing socially vulnerable population.
Th e document also shares the lessons already learned by the city when addressing
this subject. In the short and medium term in addressing climate change, disaster
risk and urban poverty, key areas for reform include:
• Coordinate and integrate information databases among the diff erent city sec-
retariats. As of now the city faces a multiplicity of information produced and
used by diff erent agencies. Th e unifi cation of information could lead to shared
programs.
• Extend public disclosure of information and public participation in the design
and implementation of climate projects to ensure stakeholders are involved.
• Incorporate climate change policies into city administration in order to guar-
antee continuity.
• Enhance mapping capacity to better inform resilience in decision making.
• Improve inequality in adaptive capacity across the city through capacity-
building programs for stakeholders, practitioners, city managers, and deci-
sion makers. Structured learning resources and the exchange of experiences
with other cities can be applied to increase the understanding of the linkages
between climate change and disaster risk management and the urban poor in
diff erent levels.
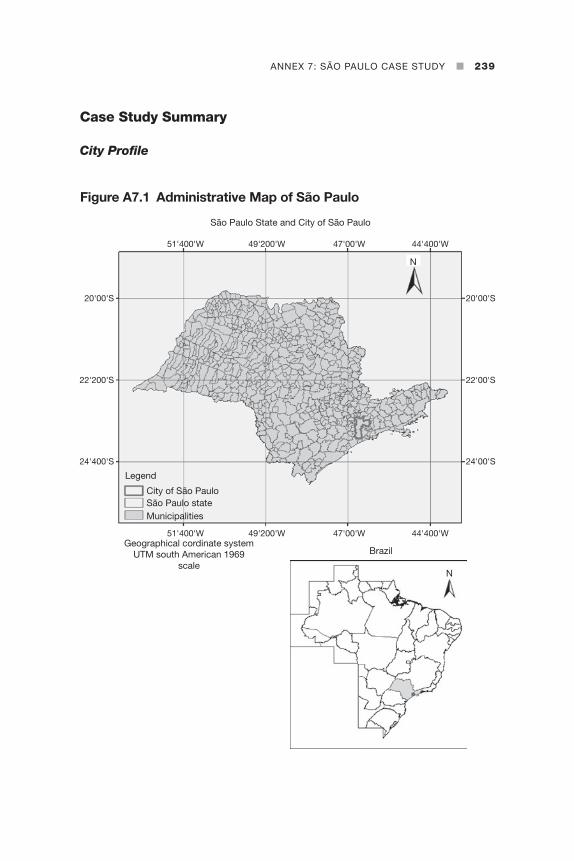
ANNEX 7: SÃO PAULO CASE STUDY ■ 239
Case Study Summary
City Profi le
Figure A7.1 Administrative Map of São Paulo
São Paulo State and City of São Paulo
20'00'S 20'00'S
22'200'S 22'00'S
24'400'S
51'400'W 49'200'W 47'00'W 44'400'W
51'400'W 49'200'W 47'00'W 44'400'W
24'00'S
Legend
City of São PauloSão Paulo stateMunicipalities
Geographical cordinate systemUTM south American 1969
scale
Brazil
N
N

240 ■ CLIMATE CHANGE, DISASTER RISK, AND THE URBAN POOR
Th e population growth rate in São Paulo is decreasing (in 2010 it was only
0.76 percent compared to 1.16 percent in 1990). Th e diff erence between the
numbers of people in the city between day and night could reach 2 million
people. Nevertheless, the population rate in the periphery is increasing (grow-
ing from 4.9 million to 5.5 million from 1991 to 2000), representing 30 percent
TABLE A7.1 São Paulo Profi le
Total city population in 2010 11.25 million (IBGE census 2010)Population growth (% annual) 0.75 (SEADE 2000/2010)Land area (km2) 1,523 (IBGE census 2010)Population density (per km2) 7,388Country’s per capita GDP (US$) 10,960 (Brazil central bank and IBGE 2010)Country’s population (%) 5.89 (IBGE Census 2010)Total number of households 3,576,864 (IBGE Census 2010) Dwelling density (SEHAB/HABISP)Slums (%) 1.6Irregular lots (%) 6.32Average household income (US$) 891.37 (IBGE Census 2008)Country’s GDP (%) 11.7 (IBGE Census 2008)Total budget (US$) 3.1 billion (city hall budget 2010)Date of last Urban Master Plan 2002
Note: IBGE: Instituto Brasileiro de Geografi a e Estatística; SEHAB: Sao Paulo Municipal Housing Secretariat; SEADE: State Data Analysis System Sao Paulo; HABISP: Information and Prioritizing Intervention System
Figure A7.2 Growth Rates for City of São Paulo, 1950–2010
1950/1960 1960/1970
5.484.91
3.67
1.16 0.88 0.76
1970/1980 1980/1991
Per
cent
1991/2000 2000/20100
1
2
3
4
5
6
Source: HABISP.

ANNEX 7: SÃO PAULO CASE STUDY ■ 241
Figure A7.3 São Paulo City Social Vulnerability Index, IPVS
R2- Very low vulnerablility
R1- No vulnerablility
R3- Low vulnerability
R5- High vulnerabilityR6- Very high vulnerability
R4- Medium vulnerability
Source: HABISP.
of the urban expansion. Th e periphery concentrates the majority of the poorer
inhabitants (the average household income is half the average for the city and
the per capita household income is up to three times lower than the city rate).
Life expectancy in São Paulo is 71 years. Th e mortality rate is 6.53 for each
thousand and the child mortality rate is 15.83 for each thousand. Th e city has
4.89 percent illiteracy among youth above 15 years old. Almost 47 percent of

242 ■ CLIMATE CHANGE, DISASTER RISK, AND THE URBAN POOR
the population above 25 has less than eight years of formal education (primary
education lasts nine years and secondary, three additional years). Th e population
is mainly made up of people ages 25 to 59.
São Paulo is located in the Atlantic Plateau, with hills between 718 and 720
m above sea level. Th ere is no registered seismic activity in São Paulo. Regional
hills climb from large fl oodplains through fl uvial terraces into interfl uvial
areas. Figures A7.4 and A7.9, in the color section, shows the city´s declivity
and main rivers.
Built Environment and Basic ServicesAdequate water supply is provided to 98.6 percent of the houses in the city (almost
65 m3 per inhabitant/year), though the increase in the number of consumers,
scarcity of new water resources, and decrease in basin water quality increases
concerns about future water supply.1
Sewage collection is reported at 87.2 percent (2006). From all the domestic
sewage collected, 81 percent receives proper treatment. However, slums and
irregular housing lots typically have improper sanitation conditions and sewage
is thrown directly into streams and rivers. Almost 48 percent of the inhabitants of
the city’s water basin wetlands live in slums and irregular settlements.
Solid waste is collected for 96.5 percent of the houses. In spite of that, there are
irregularities in site collection and inspection (more than 300 clandestine dumps),
and the city suff ers from improper waste-disposal clogging and polluting culverts
and waterways: 2.6 percent of waste is deposited in containers and removed by a
City Hall contractor; 0.64 percent is discarded in the land or in waterways; and
another 0.16 percent is burned in yards or empty lands. City Hall data shows that, in
2010, the total amount of waste generated daily by the city was 17,000 tons—10,000
tons come from residential collection and almost 100 percent of the collected waste
went to regulated landfi lls. Less than 1 percent of this waste was recycled.2
Th ere is enough energy supply to meet city demands (99.99 percent of the
houses possess energy), according to AES Eletropaulo Metropolitana S.A. (an
energy utility). It is not unusual for the city to have localized blackouts, espe-
cially during heavy rains. Electricity theft is common in poor regions of the city.
Th e industrial, residential, and commercial sectors are more or less equal in their
energy consumption (17 percent of the national consumption is equivalent to
35.3 million megawatt/hours).
Th e city’s traffi c is extremely heavy, with more than 7 million vehicles. Th e
subway system (managed by the state) is connected to the rail system (also
managed by the state), through a CPTM (Train Management Agency). An aver-
age of 2.1 million passengers a day are transported through 89 stations, 260.8 km,
and 63.5 km of subway tracks. Approximately 15,000 buses circulate through
1,335 routes and 28 terminals. Every three years it is estimated that the number
of bus trips increases by 1 million (CPTM, Metro and SPTrans 2010). Th e design

ANNEX 7: SÃO PAULO CASE STUDY ■ 243
Figure A7.5 Greenhouse Gas Emissions from Electric Energy Use by Sector in São Paulo
29%
11%
11%
28%
Others
Commercial
ResidentialIndustrial
Source: São Paulo GHG´s inventory.
Figure A7.6 Transport Use in São Paulo
2%
CarsTrain
BicycleWalking
Buses
Others
Subway
9%2.40%0.60%
29%
29%
28%
Source: Research Origin and Destination 2007.

244 ■ CLIMATE CHANGE, DISASTER RISK, AND THE URBAN POOR
and number of routes is considered insuffi cient to adequately serve the entire
population. Th e situation is even worse for the poor, since a great number of
them live in the periphery areas and work in more centralized neighborhoods
where the job opportunities and wages are better. As a result, they spend hours in
public transport commuting.
In 2005, the city had 34 city parks (15 million m3), which increased substan-
tially in 2008 to 48 parks (24 million m3) and 17 linear parks.3 Th e SVMA plans
for 100 parks by 2012 (50 million m3), 20 linear parks, and 5 natural parks. São
Paulo had, in 2009, only 21 percent of its original forest coverage.4
Th e “Agenda 2012” program was enacted into law in 2008 and prescribes the
transparency of actions and priorities managed by the city. Each region of the city
has its targets, which range among health, education, traffi c, water quality, sewage
piping, quality of parks, leisure areas, safety, and transportation.5
Pillar 1—Institutional Assessment
Agencies in Disaster Risk Management and Climate Change AdaptationTh e Emergency Management Agency acts on the federal, state, and municipal
levels. Its goal is to plan actions to prevent and minimize eff ects of disasters,
either natural or human caused, assist people aff ected by them, and rehabili-
tate or recover the places destroyed by those events. In the city this responsibil-
ity rests with the City Public Safety Secretariat, through the City Emergency
Management Agency (COMDEC). Nonetheless, its personnel are allocated to the
31 decentralized units or “subdistricts.”
Th e City Emergency Management Agency acts on prevention and recovery,
assistance and aid, and on search and rescue, and is assisted by the Firefi ghter
Department. At the communities located in areas of risk, there should be a
Local Emergency Management Group, or NUDEC. Th ey should be made up
of volunteers trained by the National Emergency Management Agency to help
during emergencies and risky situations.
Th e Emergency Management Center (CGE) is responsible for observing mete-
orological data (there are 180 monitoring stations) and for informing COMDEC.
Th en COMDEC alerts the subdistricts, which monitor the volume of rainfall
using pluviometers installed at 31 points in the city.
Th e Summer Rainfall Operation is a city plan that brings together the Hous-
ing, Transport, Urban Infrastructure, Social Assistance, and Subdistricts Coor-
dination Secretariats, led by the Emergency Management Agency, and targets
disasters that occur during the summer (when heavy rainfall is common). When-
ever necessary or from November through April, the city organizes initiatives to
prevent disasters or to assist in emergencies, recovering the area aft er the fl ood or
landslide and providing shelter for those in need.

ANNEX 7: SÃO PAULO CASE STUDY ■ 245
When a heavy rainfall approaches, CGE issues an alarm to COMDEC, as well
as to the traffi c authorities (CET), the Health Secretariat (SMS), Green and Envi-
ronment Secretariat (SVMA), and Housing Secretariat (SEHAB). Each subdis-
trict must then activate the process using the Emergency Management Agency
agents allocated to the region, following a standard operational procedure. Th e
initiatives include prevention (evacuating houses in at-risk areas), search and res-
cue of people in fl oods or landslides, and restoration of aff ected areas.
Aft er the fl ood or landslide, the fi refi ghters rescue possible victims. Water
and sanitation authorities fi x broken water pipes and energy agents check the
electricity posts. Social assistants verify housing conditions and, if necessary, direct
people to temporary shelters while SEHAB arranges for “rent allowance” or allocate
housing for the needy. Th e City Health Secretariat, through its Health Vigilance
Coordination (COVISA), trains its environmental agents to inform—both before
and aft er the heavy rains—the vulnerable communities about endemic diseases
spread by water (such as leptospirosis), their symptoms, and the need for medical
treatment. Th e basic health units (UBS) receive folders and posters to distribute to
the population on how to avoid leptospirosis and the proper treatment. COVISA
also alerts each region of the city about its specifi c risk of leptospirosis, aiming to
prepare the health professionals for the emergence and spread of the disease.
Examples of Disaster-Related Program or Relevant DecreesTh e Summer Rainfall Operation is an existing plan from the city that brings
together the Housing, Transport, Urban Infrastructure, Social Assistance, and Sub-
districts Coordination Secretariats, led by the Emergency Management Agency.
Decree 47.534/2006 reorganizes the city system of the Emergency Manage-
ment Agency. Th ere are other laws at administrative levels that regulate the
Emergency Management Agency and the operation procedures.6
Th ere is no information on the maintenance and testing of the procedures.
From an ordinary citizen’s point of view, those alarms are neither timely nor
effi cient, since they require constant monitoring through the CGE´s website. In
at-risk areas, this is even less likely to occur, since the rate of viewing the Inter-
net in general in the city in 2003 was 25 percent. Th ere is no data available on
expenditures on disaster risk management or adaptation programs.
Shortcomings in Disaster Risk Management and Climate Change Adapta-tion ManagementTh e interviews and research indicate that the Emergency Management Agency
has a shortage of agents in the at-risk communities, for distributing and teach-
ing the use of the plastic pluviometers (PET) and water-level rulers. CGE also
needs resources to train emergency management local agents about informing
the population of the risks of heavy rain. Th e Health Secretariat has a shortage

246 ■ CLIMATE CHANGE, DISASTER RISK, AND THE URBAN POOR
of medical personnel and adequate facilities to assist citizens with lepstospirosis
or climate-related diseases. A direct and effi cient channel with the community in
at-risk areas must be created to alert people in emergencies. Th e same needs to
be done for the general population. Overall, prevention measures in at-risk com-
munities should be strengthened.
Estimated Levels of Spending on Pro-Poor Services and Infrastructure Th e City Emergency Management Agency works on disaster management activ-
ities. Interviewees noted that the agency lacks resources to carry out its proj-
ects, develop new initiatives, train and support communities based on units or
groups, properly service the population in emergencies, and develop means of
preventive maintenance.
At the beginning of 2011, the mayor of São Paulo and the governor of São
Paulo jointly launched a US$5 million initiative to fi ght fl oods in the city. It
included cleaning the Tietê River; acquisition of pumps to move water from
the Pinheiros River to the Billings water reservoir; a system of underground
channels to dredge the Tietê River; and the creation of the Varzeas Tietê River
Linear Park (with plans to remove 5,000 families that should not be living at
the edges of the river).
Pillar 2—Hazards Assessment
Past Natural DisastersTh ere is no publicly available systematization of climate hazards or measurement
of potential impacts and losses. Th is is a substantial gap in information that the
city needs to address.
A prominent city newspaper provides information on recent rainfall events:
• November 2009–March2010. Heavy rainfall accounted for 78 deaths and
20.000 homeless. Jardim Romano (a poor neighborhood) was fl ooded for
more than two months.
• October 2009. Tietê and Pinheiros´s rivers overfl owed and there were 86
fl ooding points in the city.
• February 2008. In the neighborhood of Mooca in the east of the city, the water
height reached 2 meters. Firefi ghters were called 53 times to rescue stranded
people. Train passengers were trapped in the railway cars for more than six
hours (due to lack of power caused by the rain).
• November 2006. Th e city experienced 230 fl ooding points (doubling the
number for the same month the previous year).
• May 2004. Th e heaviest rainfall in years (140 mm in a single day) caused
120 fl ooding points in the city; small rivers fl ooded. One person disappeared
in a fl ooded area.
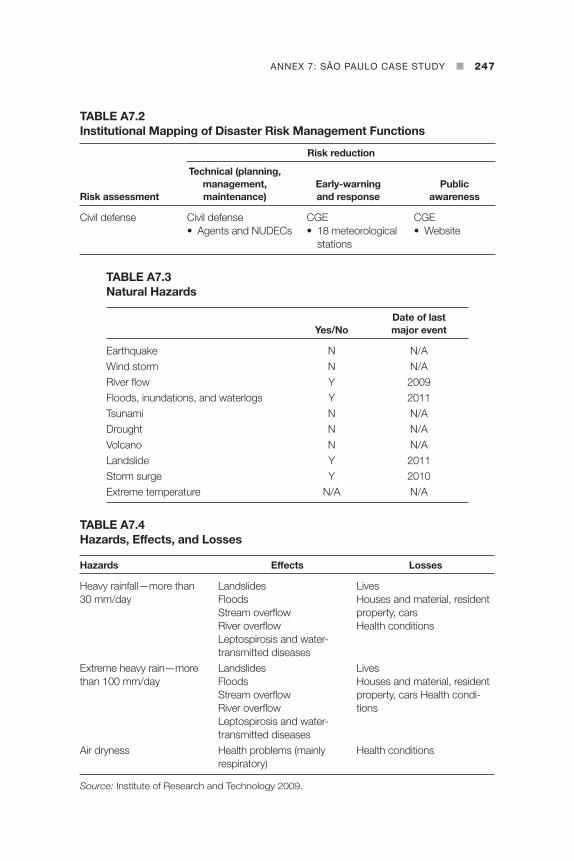
ANNEX 7: SÃO PAULO CASE STUDY ■ 247
TABLE A7.2 Institutional Mapping of Disaster Risk Management Functions
Risk assessment
Risk reduction
Technical (planning, management, maintenance)
Early-warning and response
Public awareness
Civil defense Civil defense• Agents and NUDECs
CGE• 18 meteorological
stations
CGE• Website
TABLE A7.3 Natural Hazards
Yes/NoDate of last major event
Earthquake N N/AWind storm N N/ARiver fl ow Y 2009Floods, inundations, and waterlogs Y 2011Tsunami N N/ADrought N N/AVolcano N N/ALandslide Y 2011Storm surge Y 2010Extreme temperature N/A N/A
TABLE A7.4 Hazards, Effects, and Losses
Hazards Effects Losses
Heavy rainfall—more than 30 mm/day
LandslidesFloodsStream overfl owRiver overfl owLeptospirosis and water-transmitted diseases
LivesHouses and material, resident property, carsHealth conditions
Extreme heavy rain—more than 100 mm/day
LandslidesFloodsStream overfl owRiver overfl owLeptospirosis and water-transmitted diseases
LivesHouses and material, resident property, cars Health condi-tions
Air dryness Health problems (mainly respiratory)
Health conditions
Source: Institute of Research and Technology 2009.

248 ■ CLIMATE CHANGE, DISASTER RISK, AND THE URBAN POOR
Main Climate HazardsAccording to the Institute of Research and Technology (Instituto Nacional de
Pesquisas Espaciais, or INPE 2009), São Paulo is composed of a variety of sur-
faces with diff erent temperatures, forming a mosaic of urban climate. Th ere are
heat islands, thermal inversion areas, pollution bubbles, and local diff erences in
the wind patterns. Th erefore, it is impossible to plan a single initiative or defi ne
Figure A7.7 Days with Intense Rainfall per Decade
Decade2000
Decade1990
Decade1980
Decade1970
Decade1960
Decade1950
Decade1940
Decade1930
0
20
40
60
80
100
120
140
30 mm/day 50 mm/day 100 mm/day 100 mm2/days
Source: IAG/USP, Analysis by INPE 2010.
Figure A7.8 Number of Flooding Points Registered by CGE in São Paulo per Year, 2004–2011
02005 2006 2007 2008 2009 2010 20112004
200
400
600
800
1000
1200
1400
1600
Source: CGE and Mauricio Maia blog, 2011, http://alagamentos.topical.com.br/pontos.

ANNEX 7: SÃO PAULO CASE STUDY ■ 249
a precise quantity of rain or degree of heat that could cause tragedies. Each area
has its specifi c soil, drainage, occupation, and permeability conditions and, as a
result, a diff erent threshold to be met.
Th at said, INPE produced table A7.5, which shows the amount of heavy rain-
fall in São Paulo per decade, from 1933 to 2000, indicating an increase in the
number of days of heavy rainfall—with more than 100 mm of precipitation in
just one or two days.
INPE confi rms that rainfall above 10 mm per day is considered heavy, but is
not potentially dangerous. More than 30 mm per day of rainfall can cause serious
fl oods, and more than 50 mm can be even riskier for the city (before the 1950s,
rainfall above to 50 mm per day was nonexistent, but currently this occurs two to
fi ve times every year).
Summary of Climate Projections from the Regional Eta-CPTEC (Centro de Previsão de Tempo e Estudos Climáticos) Model for São Paulo For INPE, the main climate risk scenarios for São Paulo are:
• Floods—Th is risk scenario is characterized by the overfl ow of river water onto
the adjacent lowlands, when the plains along the main watercourses of the
Alto Tietê Basin become fl ooded. Despite investments to increase fl ow capac-
ity of the main waterways, fl oods continue to occur due to urban growth and
the natural dynamics of fl oods and existing interventions in waterways.
• Heavy fl oods—Rugged conditions allow for heavy fl oods, that is, high water
volume and speed. Flooding of this nature may destroy buildings and other
urban infrastructure, cause other material damage, and endanger the lives of
residents living near rivers.
• Flash fl oods, with high potential for drag—Public policies for channeling
streams and constructing roads in valleys cause fl ash fl ooding along the streets,
where surface water concentrates (which also occurs in suburban areas, with-
out paving). Th is process is characterized by the power of accumulated sur-
face water and the high destructive power of drag. Th ese conditions expose
people and housing to high risk. Th e greatest probability of loss of life is found
in the periphery regions, and loss of goods in consolidated central neighbor-
hoods. Rainwater runoff concentrated along watercourses or on public roads is
responsible for most deaths in fl oods, when people are dragged by the water.
• Occasional fl ooding—Occasional fl ooding (accumulations of shallow water
that rarely penetrate the interior of the buildings and aff ect most public
roads) occur widely in various parts of the city, primarily because of defi -
ciencies in the drainage system. Occasional fl oods are temporary inconve-
niences for pedestrians and vehicles.
• Trash thrown into water courses—Some 6,000 households throw waste
directly into waterways in the metropolitan region of São Paulo. Th e garbage

25
0
■
CL
IMA
TE
CH
AN
GE
, DIS
AS
TE
R R
ISK
, AN
D T
HE
UR
BA
N P
OO
R
TABLE A7.5 Climate Projection for Metropolitan São Paulo
Present observed
Present simulated 2030–2040 Conf. 2050–2060 Conf. 2080–2090 Conf.
Temperature High High High
Warm nights High High High
Cold nights High High High
Warm days High High High
Cold days Average High High
Heat waves Unobserved Average Average High
Total rain High High High
Intense precipitation Average Average High
Precipitation > 95th Average Average High
Precipitation days > 10 mm Average Average High
Precipitation days > 20 mm Average Average Average
Consecutives dry days Average Average High
Increase Decrease Source: INPE/CEPTEC.
ANNEX 7: SÃO PAULO CASE STUDY ■ 251
contributes to siltation and clogging of these waterways, and can be carried
by runoff , captured by the river, and taken to lower slopes, where the waste is
deposited. Th e detention reservoirs of Tietê River are located in these lower
slopes and can be damaged by the debris.
• Landslides on slopes—Th e slope regions are generally subject to informal
settlements and prone to landslides, which can cause serious accidents and
deaths of residents.
• More severe rainfall—Th ere is a clear correlation between more severe rain-
fall (greater than 100 mm) and more rugged terrains. Th e climate analysis
by INPE indicates that severe rainfall will occur more in areas of the city
that are at risk of landslides and fl ooding, increasing the vulnerability of the
inhabitants.
Exposure to HazardsTh e Technological Research Institute (Instituto de Pesquisas Tecnológicas,
or IPT) was commissioned by the city to map the geotechnical hazardous
areas in São Paulo in order to identify sector vulnerabilities to landslides and
stream washouts in areas of precarious urban settlements. In this study, a
hazardous area is defi ned as one likely to be hit by natural or human-induced
conditions that cause adverse eff ects. People living in such zones are exposed
to physical harm and are prone to material losses. Typically, in Brazilian cit-
ies, these areas correspond to low-income housing units (precarious infor-
mal settlements).
Th e factors found essential for analyzing hazards include the type of process
expected, the likelihood of the process occurring, the vulnerability of the urban
settlements, and the potential for damage.
Th e analysis included morphological and morphometric features of the ter-
rain; geological materials and profi le of the alteration; geological structures; evi-
dence of geological movements; ground coverage; and conditions associated with
wastewater, rainwater, and subsurface water. As a result, a hazard zone for land-
slides and stream washouts has been defi ned for vulnerable urban settlements.
Th e methodology used to map the zone included the following activities:
• Oblique low-height helicopter aerial photography.
• Field work to examine the features and limits of hazardous terrains in previ-
ously identifi ed hazards zones.
• Assessment of the likelihood of destructive processes.
• Assessment of potential consequences due to dwelling vulnerability.
• Estimate of hazard level per sector.
• Recommendations for hazard-control initiatives.
• Data input into a geo-referenced database, integrated with the Housing Secre-
tariat’s (SEHAB) HABISP System.

252 ■ CLIMATE CHANGE, DISASTER RISK, AND THE URBAN POOR
Displayed below are the hazardous areas mapped in the informal, vulner-
able settlements. Slums have the highest rate of landslides and washouts. About
20 percent of the land where slums are settled is subject to geotechnical hazards.
Slums in São Paulo represent roughly 76,000 households exposed to hazards.
Th ere are 407 highly hazardous areas located in 26 subdistricts.
Figure A7.9, in the color section, shows geotechnical hazard areas overlap-
ping data on steepness. As expected, critical areas are closely associated with high
steepness. Such areas are more likely in the peripheral zone of the city (northern,
eastern, and southern suburbs). Th e most critical areas are precisely where the
most precarious settlements are located. Lack of access to a formal land market by
the poorest families generates the conditions for these combined factors of social
and environmental vulnerability.
In addition to identifying hazardous areas, the IPT also ranked them in four
levels of criticality. A qualitative hazard analysis has been made on the data
obtained from fi eld observation, integrating the analysis parameters into a hazard
assessment record card, with the support of aerial imagery. Th e degrees of hazard
are displayed in table A7.7.
A cross analysis of hazardous areas ranked by their critical level and infor-
mal settlements, as shown in table A7.8, concludes that slums face the most
hazardous conditions. In total, more than 5 percent of slum areas are highly or
very highly exposed; these areas are highly vulnerable to destructive events in
the next 12 months.
Th is conclusion stresses the urgency of taking preventative measures. Further-
more, such hazards can be leveraged by prospective climate conditions, poten-
tially increasing the degree of hazard level in areas currently ranked as low or
medium risk.
It is worth stressing that IPT’s map does not take into account fl oods and
water logging. While fl oods are not as lethal as mudslides and landslides, they
represent the most frequent hazards to which the population is exposed. Th ese
events result in great material damage and may have secondary eff ects on health
by increasing the likelihood of spreading waterborne diseases such as lepto-
spirosis. People living near streams or rivers—especially children and the elderly,
Table A7.6Incidence of Hazardous Areas in Informal Settlements in São Paulo
Urbanized centers Settlements/allotments Slums
Landslide risk (%) (IPT 2010) 10.43 3.90 14.79Washout risk (%) (IPT 2010) 2.44 0.68 5.38
Source: HABISP–SEHAB; IPT 2010.

ANNEX 7: SÃO PAULO CASE STUDY ■ 253
TABLE A7.7 Degrees of Landslide Hazard
Class of hazard Description of hazard
R1—low Potentially low degree of geological and geotechnical predis-posing factors (steepness, type of terrain, etc.) and of interven-tion in the sector for developing landslides and washouts. There is no evidence of instability in slopes and drainage banks. It is the least critical condition. If the status remains unchanged, no destructive events are expected over one year.
R2—medium Potentially medium degree of geological and geotechnical pre-disposing factors (steepness, type of terrain, etc.) and of intervention in the sector for developing landslides and wash-outs. There is some evidence of instability (yet incipient) in slopes and drainage banks. If the status remains unchanged, there is little probability of destructive events during long, strong episodes of rain over one year.
R3—high Potentially high degree of geological and geotechnical predis-posing factors (steepness, type of terrain, etc.) and of inter-vention in the sector for developing landslides and washouts. There is signifi cant evidence of instability (ground cracks, sag of embankments, etc.). If the status remains unchanged, destruc-tive events may be expected during long, strong episodes of rain over one year.
R4—very high Potentially very high degree of geological and geotechnical predisposing factors (steepness, type of terrain, etc.) and of in-tervention in the sector for developing landslides and washouts. There is strong evidence of instability, supported by numerous accounts of hazardous conditions (ground cracks, sag of em-bankments, , walls cracking in houses or retaining walls, tilted trees or poles, slide scars, erosion features, dwellings built near stream banks, etc.). It is the most critical condition. If the status remains unchanged, destructive events are highly probable dur-ing long, strong episodes of rain over one year.
TABLE A7.8 Cross-Referencing Data: Areas Ranked by Their Critical Level and Types of Settlements in São Paulo
Low hazardMedium hazard High hazard
Very high hazard
Slums (%) 2.92 11.90 4.11 1.40Settlements/allotments (%) 0.65 2.93 0.97 0.43Urbanized centers (%) 4.59 7.62 0.56 0.09
Source: HABISP–SEHAB; IPT 2010.
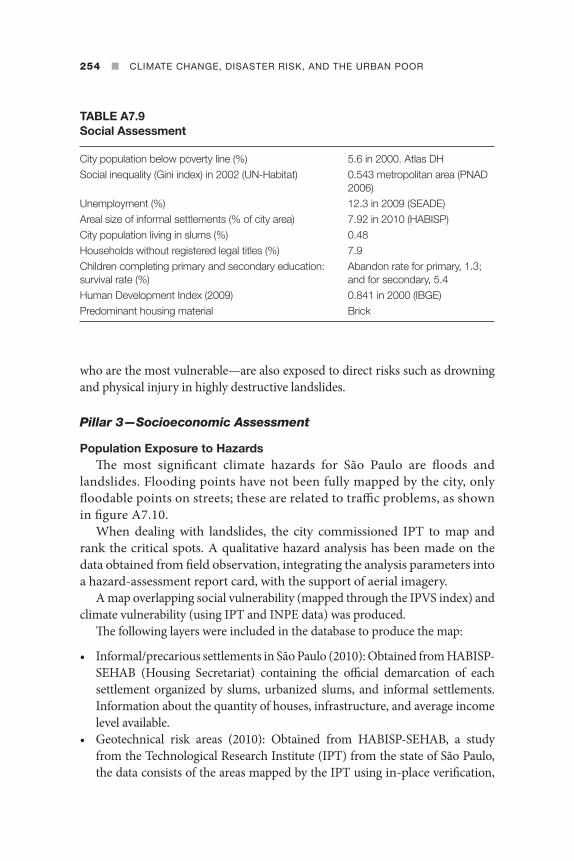
254 ■ CLIMATE CHANGE, DISASTER RISK, AND THE URBAN POOR
who are the most vulnerable—are also exposed to direct risks such as drowning
and physical injury in highly destructive landslides.
Pillar 3—Socioeconomic Assessment
Population Exposure to HazardsTh e most signifi cant climate hazards for São Paulo are fl oods and
landslides. Flooding points have not been fully mapped by the city, only
fl oodable points on streets; these are related to traffi c problems, as shown
in fi gure A7.10.
When dealing with landslides, the city commissioned IPT to map and
rank the critical spots. A qualitative hazard analysis has been made on the
data obtained from fi eld observation, integrating the analysis parameters into
a hazard-assessment report card, with the support of aerial imagery.
A map overlapping social vulnerability (mapped through the IPVS index) and
climate vulnerability (using IPT and INPE data) was produced.
Th e following layers were included in the database to produce the map:
• Informal/precarious settlements in São Paulo (2010): Obtained from HABISP-
SEHAB (Housing Secretariat) containing the offi cial demarcation of each
settlement organized by slums, urbanized slums, and informal settlements.
Information about the quantity of houses, infrastructure, and average income
level available.
• Geotechnical risk areas (2010): Obtained from HABISP-SEHAB, a study
from the Technological Research Institute (IPT) from the state of São Paulo,
the data consists of the areas mapped by the IPT using in-place verifi cation,
TABLE A7.9 Social Assessment
City population below poverty line (%) 5.6 in 2000. Atlas DHSocial inequality (Gini index) in 2002 (UN-Habitat) 0.543 metropolitan area (PNAD
2006)Unemployment (%) 12.3 in 2009 (SEADE)Areal size of informal settlements (% of city area) 7.92 in 2010 (HABISP)City population living in slums (%) 0.48Households without registered legal titles (%) 7.9Children completing primary and secondary education: survival rate (%)
Abandon rate for primary, 1.3; and for secondary, 5.4
Human Development Index (2009) 0.841 in 2000 (IBGE)Predominant housing material Brick

ANNEX 7: SÃO PAULO CASE STUDY ■ 255
Figure A7.10 Main Flooding Points of Streets
City of São Paulo
State of São Paulo
Flood plains
Crystalline complex
Tertiary sediment
Hydrography, dams and coastal
Lakes, reservoirs
Overflow points, 1990
Overflow points, 2000
Main road system
Drainage2000
City limits
Metropolitan region
Source: SVMA, Environmental Atlas, 2000.

256 ■ CLIMATE CHANGE, DISASTER RISK, AND THE URBAN POOR
which presents geotechnical risk for landslides and undermining among water
streams. Th e areas were characterized by four degrees of hazard level, varying
from low risk to very high risk.
• Geotechnical chart (1999): Th is chart was elaborated in analogical format and
contains the main geomorphologic areas of the city (see fi gure A7.9 in the
color section). Th e Planning Secretariat digitalized the map and the data could
be integrated in the geo-referenced dataset.
• Index of social vulnerability (IPVS), per the census (2000). São Paulo State was
divided into six groups of social vulnerability. Based on multivariate statistical
analysis, the IPVS uses the data from the last population census, conducted in
2000. Th e calculation of the IPVS uses two types of information: demographic
characteristics and socioeconomic condition of the families;
• Declivity map: Based on the topographic chart of the city developed by
EMPLASA (Empresa Paulista de Planejamento Metropolitano), the declivity
map is a raster dataset containing classes of declivity for each pixel. Th is data-
set reveals the topography of the city, indicating those areas with high declivity
and thus more inclined to landslides (see fi gure A7.4 in the color section).
• Transportation infrastructure and public infrastructure: Th is data con-
tains the localization of the public infrastructure of the city, such as schools
and health clinics. Obtained from the HABISP-SEHAB and SEMPLA (São
Paulo Secretaria Municipal de Planejamento), this dataset was used to infer
the existence of public infrastructure under geotechnical risk as well as ana-
lyze the proximity of this equipment to the vulnerable areas.
• HAND model: Th is dataset, produced by the National Spatial Research Insti-
tute, supports the work on Brazilian megacities and climate-change vulner-
abilities. Th e data was calculated from the topographic chart of the city using
spatial analysis. Based on a raster representation obtained from the declivity
map, the dataset informs those areas with highest vulnerability to landslides
and fl oods.
• Water reservoir locations (piscinões, or big pools): Th is data, collected from
SEMPLA, corresponds to the locations of the 16 water reservoirs constructed
in the city to control fl oods.
• Hydrograph and drainage system: Th is system corresponds to the water-
courses of the city and the natural drainage system.
• Flooding: Th is layer—mapped by the Traffi c Engineering Company (CET),
which is responsible for traffi c control in the city—contains the points where
fl oods occurred.
Th e analytical approach used for the mapping task was based on spatial
analysis techniques in the Geographical Information System (GIS). All the lay-
ers were compiled in an integrated geo-referenced database. Th e calculations

ANNEX 7: SÃO PAULO CASE STUDY ■ 257
were based on overlays applied over the reference layers of informal settle-
ments, slums, and urbanized slums. It was then possible to calculate the relative
incidence in terms of area of geotechnical risk of fl ooding. It was also possible
to calculate the relative incidence of the Social Vulnerability Index in each of
the reference layers.
Calculating both incidences, social vulnerability and geotechnical risk, led to
comparisons between all the informal, precarious settlements in the city. Th e
results of the geographical analysis operation were tabulated and organized by
themes of vulnerability and hazards. Th e most vulnerable settlements were those
that present the higher percentage of areas within highest geotechnical risk and
social vulnerability. Finally, thematic maps were generated showing the lay-
ers included in the database, allowing visualization of the critical areas all over
the city.
Location of the Urban PoorMost precarious settlements are located in more peripheral areas of the city. Such
areas concentrate environmentally vulnerable situations and are the most poorly
served by basic services and urban infrastructure. Th e analysis indicates that
there is a strong overlap between the locations of high-risk areas and the informal
settlements throughout the city. Shown in fi gure A7.11 is the location of precari-
ous housing (slums, irregular lots, and urbanized slums).
Slum CharacteristicsTh e distribution of the census in the city by groups of social vulnerability clearly
discloses the socioeconomic macro-segregation pattern that places the central
area. In particular, the distribution shows the southwest quarter of the city as the
region with the lowest levels of social vulnerability, as opposed to the peripheral
zone, where the highest levels of social vulnerability are recorded. Th ese more
critical situations can be found in the southern, northern, and eastern periphery
of the city. Not by accident, most of São Paulo’s precarious settlements are set up
in these peripheral areas.
According to the city, in 2010 approximately 890,000 precarious dwell-
ings were in the city. Over 85 percent of these households are located in slums
and irregular settlements, spread across all regions of the city. Displayed in
table A7.10 is the distribution of households per type and location in the large
administrative regions of the city.
Slums record the highest proportion of children and youth up to 19 years old
(41.7 percent), which is consistent with the presence of younger heads for house-
holds and a greater number of children. As for household income, most families
earn less than three times the minimum wage.7 Although many of the heads of

258 ■ CLIMATE CHANGE, DISASTER RISK, AND THE URBAN POOR
household are employed in the formal labor market, low levels of education hin-
der access to better work opportunities. About two-thirds of the heads of house-
hold have not completed primary education (SEADE Foundation 2008).
Th ese areas still lack access to urban infrastructure and services supply, as
shown in table A7.11. Th ere are signifi cant defi cits in public lighting, paving,
Figure A7.11 Spatial Distribution of Precarious Settlements in City
Informal settlements
Slums
Wellsprings
Preservation areas
Legend
Rivers
Source: HABISP 2010.

ANNEX 7: SÃO PAULO CASE STUDY ■ 259
TABLE A7.10 Houses by Type of Precarious Settlements and Administrative Regions of City Housing Secretariat
Wellsprings1 North1 South1 Southeast1 East1 Center1 Diffuse2 Total
Slum1 54,886 65,696 117,793 64,980 67,072 10,724 0 381,151Informal settlement (1) 100,031 60,769 44,953 22,739 154,552 0 0 383,044Urbanized center (1) 11,193 1,973 1,051 2,640 262 0 24,522Tenement (cortiços) (2) (3) 11,086 69,303 80,389Irregular housing complex (1) 669 7,403 4,657 2,533 3,056 1,659 0 20,702Total 166,779 141,996 169,376 91,303 227,320 23,731 69,303 889,808
Source: (1) HABISP, February 2010; (2) obtained from SEADE Foundation survey; (3) the total amount of tenement houses is an estimation by the SEADE Foundation.
TABLE A7.11 Access to Urban Services and Infrastructure in Precarious Settlements in São Paulo
Urban Infrastructure Waste Collection Sanitation
Access to public lighting Paving
Walkways and
culverts
Door-to-door
collection
Curb container collection Other
No access
With access
Households in slums (%) 68.30 67.10 55.70 64.90 20.70 14.40 52.30 47.70Households in residence centers (%) 86.30 91.10 80.80 67.90 13.50 18.60 8.20 91.80Households in allotments (%) 92.30 81.50 81.20 91.50 3.40 5.10 20.20 79.80Total (%) 81.90 75.70 70.40 79.50 11.10 9.50 33.30 66.70
Source: Fundação Seade; Secretaria Municipal de Habitação, SEHAB; Pesquisa Socioeconômica em Favelas e Loteamentos no Município de São Paulo, 2007.
and urban drainage in slums, urbanized centers, and allotments. Waste dis-
posal and collection are not available to all households, oft en because collect-
ing vehicles have no space to circulate. Th e most critical problem, however,
concerns the sanitation network. Th e severity of this situation is mostly evi-
dent within the slums, where more than half of the households have no access

260 ■ CLIMATE CHANGE, DISASTER RISK, AND THE URBAN POOR
to sewerage facilities, thus greatly exacerbating environmental problems and
exposing inhabitants to disease and health hazards.
A poverty ranking based on the World Bank’s poverty threshold criteria
reveals the gravity of the situation for the families living in those settlements, as
shown in table A7.12.8 In the slums and urbanized centers, virtually all families
live in poverty or extreme poverty. Th ere is a slight improvement in housing set-
tlements with regard to this indicator; yet about 80 percent of the families in that
setting live in poverty or extreme poverty. Th is fi nding reinforces the importance
of public services supply and policies for those whose ability to fulfi ll basic needs
is extremely low, exposing them to even more critical levels of social vulnerability.
Th e situations of social vulnerability disclosed by the data are oft en associ-
ated with exposure to geotechnical and fl ooding resulting from occupying land
unsuitable for housing. Moreover, in most cases the dwellings are self-built over
long periods. Th us, low technical quality of dwellings associated with occupying
areas unsuitable for housing brings about hazards, oft en involving imminent risk.
Characteristic of these areas are steep slopes and unstable land and fl ood zones
during rainfall periods.
Climate Smart PracticesTh e Várzeas do Tietê Park, a project of the state government, in partnership with
São Paulo, will be 75 km, the largest linear park in the world. Th ere are about
7,000 households that will have to be removed. Th e resettlement will be done
in the same region, with the construction of new housing units in a partner-
ship between the City Housing Secretariat (SEHAB), Housing and Urban Devel-
opment Agency (CDHU), and Metropolitan Housing Company of São Paulo
(COHAB). Th e park will cover São Paulo and seven other cities, benefi ting an
estimated 2 million people. In addition to the 7,000 households removed in São
Paulo, 2,000 more will be removed in other cities. Th e Várzeas do Tietê Park will
have a total area of approximately 10,000 hectares, with signifi cant environmental
TABLE A7.12 Number of Precarious Inhabitants per Level of Poverty
Poverty
Indigent Poor
Families in slums (%) 31.90 66.60 98.50Families in residence centers (%) 33.60 66.40 100.00Families in settlements (%) 26.10 53.30 79.40Total (%) 28.90 59.40 88.30
Source: SEADE Foundation; SEHAB/HABISP (São Paulo City Housing Information System) São Paulo Slum and Allotments Socioeconomic Research, 2007.

ANNEX 7: SÃO PAULO CASE STUDY ■ 261
gains, because it is considered essential for preserving the river and sanitizing
the areas that aff ect the margins. Th e project should be completed in 2016. Th e
project will restore and preserve the environmental function of wetlands, pro-
vide fl ood control, and create options for leisure, tourism, and culture. In the
project, Via Parque will be built, a track with a 23 km extension with car and
bike paths and a lot of space for walking. Th e Tietê River, including its tributar-
ies, lakes, and ponds, will be restored, as well as riparian and native vegetation.
Special areas for leisure, courts, arenas, cafeterias, and administrative spaces
will also be built.
Key Lessons in Addressing Poverty in a Climate-Smart WayTh e study points to recommended actions, which are listed below:
• Allocate personnel from the Emergency Management Agency to each vul-
nerable community, working as the Local Emergency Management Group,
or NUDEC. Th e personnel should be made up of volunteers, trained by the
National Emergency Management Agency, to help in emergencies and risky
situations. Th is would allow preparation for emergencies and quicker and
more eff ective response. Th e same would apply to health agents.
• Extend mapping and systematization of the city’s entire fl ooding areas—
including all housing regions—and use this data to prioritize initiatives.
• Improve measures to enable public transportation and the use of cleaner fuels.
• Implement an emergency transport plan for heavy rainfall, using buses with
bi-articulated engines and special corridors for those vehicles to transit.
• Implement an effi cient alert system for the entire population when there is
heavy rainfall, with all government entities working rapidly with a direct
channel of communication to the communities in the areas impacted by the
heavy rain.
• Extend studies to analyze and enable change in the city’s growth pattern and
land-use patterns to concentrate housing and job opportunities in speci-
fi ed regions. Providing adequate facilities, such as hospitals, schools, places
for leisure and sports, and other facilities, would avoid long daily commutes
and decrease the traffi c and greenhouse gas emissions (such as São Francisco
Global, described in “Opportunities”). Another approach is to promote the
occupation of other degraded places downtown (such as Nova Luz), which
already have infrastructure but which are undervalued and contain dilapi-
dated buildings.
• Promote an integrated policy to manage waste issues in the city. Not only
should the policy take care of public cleaning, but also deal with waste reduc-
tion, inform the population about sustainable consumption, and enable recy-
cling.
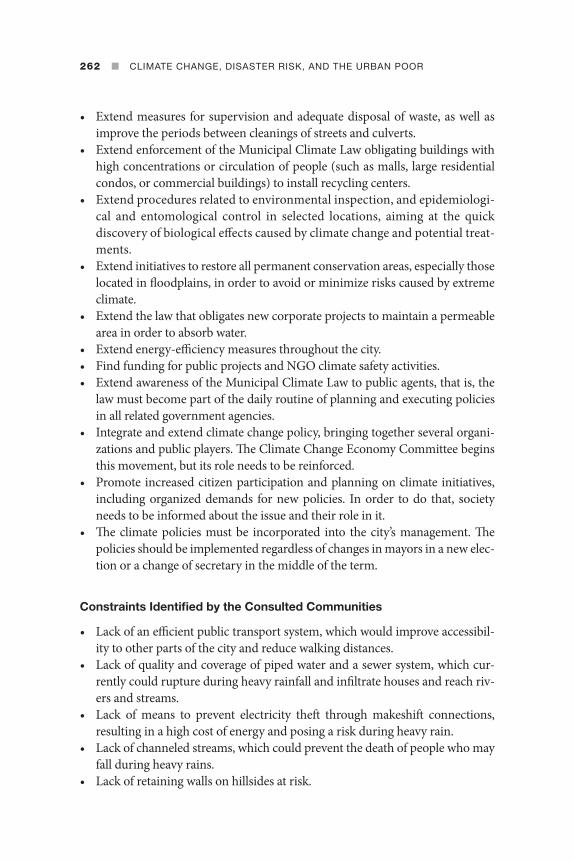
262 ■ CLIMATE CHANGE, DISASTER RISK, AND THE URBAN POOR
• Extend measures for supervision and adequate disposal of waste, as well as
improve the periods between cleanings of streets and culverts.
• Extend enforcement of the Municipal Climate Law obligating buildings with
high concentrations or circulation of people (such as malls, large residential
condos, or commercial buildings) to install recycling centers.
• Extend procedures related to environmental inspection, and epidemiologi-
cal and entomological control in selected locations, aiming at the quick
discovery of biological eff ects caused by climate change and potential treat-
ments.
• Extend initiatives to restore all permanent conservation areas, especially those
located in fl oodplains, in order to avoid or minimize risks caused by extreme
climate.
• Extend the law that obligates new corporate projects to maintain a permeable
area in order to absorb water.
• Extend energy-effi ciency measures throughout the city.
• Find funding for public projects and NGO climate safety activities.
• Extend awareness of the Municipal Climate Law to public agents, that is, the
law must become part of the daily routine of planning and executing policies
in all related government agencies.
• Integrate and extend climate change policy, bringing together several organi-
zations and public players. Th e Climate Change Economy Committee begins
this movement, but its role needs to be reinforced.
• Promote increased citizen participation and planning on climate initiatives,
including organized demands for new policies. In order to do that, society
needs to be informed about the issue and their role in it.
• Th e climate policies must be incorporated into the city’s management. Th e
policies should be implemented regardless of changes in mayors in a new elec-
tion or a change of secretary in the middle of the term.
Constraints Identifi ed by the Consulted Communities
• Lack of an effi cient public transport system, which would improve accessibil-
ity to other parts of the city and reduce walking distances.
• Lack of quality and coverage of piped water and a sewer system, which cur-
rently could rupture during heavy rainfall and infi ltrate houses and reach riv-
ers and streams.
• Lack of means to prevent electricity theft through makeshift connections,
resulting in a high cost of energy and posing a risk during heavy rain.
• Lack of channeled streams, which could prevent the death of people who may
fall during heavy rains.
• Lack of retaining walls on hillsides at risk.

ANNEX 7: SÃO PAULO CASE STUDY ■ 263
• Lack of quality of garbage collection and inspection of illegal dumps.
• Lack of adequate cleaning of streams and culverts.
OpportunitiesTh e City Housing Secretariat—SEHAB—provides the Housing Information
System—HABISP:
Th is information provides a comprehensive overview and update of plan-
ning and environmental conditions in the settlements of the city. Th e infor-
mation allows people to defi ne priorities for intervention, as well as assist
in developing city policies and integrated plans with other agencies. Th ese
include: SABESP, São Paulo State Sanitation Utility; SVMA, City Green and
Environment Secretariat; SME, City Education Secretariat; CDHU, Housing
and Urban Development Agency; and Caixa Econômica Federal (the Federal
Bank). Th e HABISP information system is a tool that is easy to use, as well as
being interactive and readily accessible via the Internet (www.habisp.inf.br).
HABISP promotes increased citizen participation—it provides an opportunity
for data disclosure and is an important resource for the population, providing
information about policies and plans under development.
Opportunities to promote adaptation strategies:
Existence of a comprehensive legal framework: Th e legal framework for
the city to deal with the impact of climate change already exists. Th e Municipal
Climate Law sets the foundation for the necessary measures related to energy,
transport, land use, health, construction, and waste management to be performed
by the city, other government entities, and private players. A reduction target was
established and public disclosure of the results is expected. Nevertheless, future
regulation is needed on some issues, such as payment for environmental services
and subnational cooperation.
Mapping of areas where landslides occur: Th e areas at risk for landslides
are already identifi ed and geo-referenced by the municipality, allowing the pri-
oritization of prevention. Th e same is needed for all fl ooding areas beyond
the locations already mapped. Th is data would be most useful if shared among
secretaries for planning. If strong preventive projects are implemented, the risks
will be lower and less will need to be spent on emergency action.
Existence of the beginning of a unifi ed approach to climate issues and poli-
cies: Th e EcoEconomy and Climate Committee were created to unite the city
entities around the subject, and also bring together state and national players, citi-
zen organizations, and government agencies. Th e 2009 Decree 50.866/2009 inau-
gurated the committee’s works. Th e forum aims to propose, stimulate, and follow
the adoption of plans, programs, and actions that help satisfy the city policy. It
also intends to support actions to mitigate greenhouse gas emissions, promote
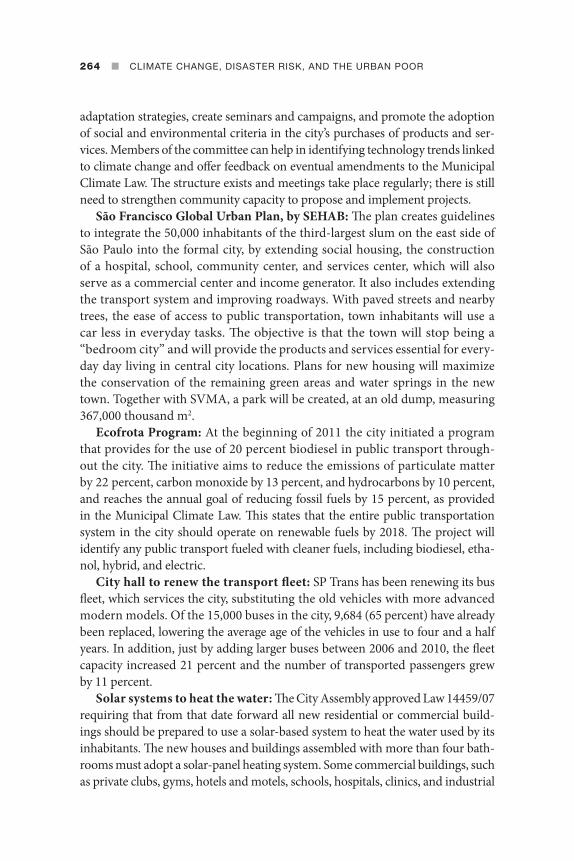
264 ■ CLIMATE CHANGE, DISASTER RISK, AND THE URBAN POOR
adaptation strategies, create seminars and campaigns, and promote the adoption
of social and environmental criteria in the city’s purchases of products and ser-
vices. Members of the committee can help in identifying technology trends linked
to climate change and off er feedback on eventual amendments to the Municipal
Climate Law. Th e structure exists and meetings take place regularly; there is still
need to strengthen community capacity to propose and implement projects.
São Francisco Global Urban Plan, by SEHAB: Th e plan creates guidelines
to integrate the 50,000 inhabitants of the third-largest slum on the east side of
São Paulo into the formal city, by extending social housing, the construction
of a hospital, school, community center, and services center, which will also
serve as a commercial center and income generator. It also includes extending
the transport system and improving roadways. With paved streets and nearby
trees, the ease of access to public transportation, town inhabitants will use a
car less in everyday tasks. Th e objective is that the town will stop being a
“bedroom city” and will provide the products and services essential for every-
day day living in central city locations. Plans for new housing will maximize
the conservation of the remaining green areas and water springs in the new
town. Together with SVMA, a park will be created, at an old dump, measuring
367,000 thousand m2.
Ecofrota Program: At the beginning of 2011 the city initiated a program
that provides for the use of 20 percent biodiesel in public transport through-
out the city. Th e initiative aims to reduce the emissions of particulate matter
by 22 percent, carbon monoxide by 13 percent, and hydrocarbons by 10 percent,
and reaches the annual goal of reducing fossil fuels by 15 percent, as provided
in the Municipal Climate Law. Th is states that the entire public transportation
system in the city should operate on renewable fuels by 2018. Th e project will
identify any public transport fueled with cleaner fuels, including biodiesel, etha-
nol, hybrid, and electric.
City hall to renew the transport fl eet: SP Trans has been renewing its bus
fl eet, which services the city, substituting the old vehicles with more advanced
modern models. Of the 15,000 buses in the city, 9,684 (65 percent) have already
been replaced, lowering the average age of the vehicles in use to four and a half
years. In addition, just by adding larger buses between 2006 and 2010, the fl eet
capacity increased 21 percent and the number of transported passengers grew
by 11 percent.
Solar systems to heat the water: Th e City Assembly approved Law 14459/07
requiring that from that date forward all new residential or commercial build-
ings should be prepared to use a solar-based system to heat the water used by its
inhabitants. Th e new houses and buildings assembled with more than four bath-
rooms must adopt a solar-panel heating system. Some commercial buildings, such
as private clubs, gyms, hotels and motels, schools, hospitals, clinics, and industrial

ANNEX 7: SÃO PAULO CASE STUDY ■ 265
laundromats also must install the solar panels. Th e system should meet at least
40 percent of the annual energy needs of the toilet water and water for pools that
the building may require.
Sustainable Building Project: Developed by PMSP/SEHAB, this project
has been initiated in a part of Heliópolis, a large slum in the southeast of the city
with almost 130,000 residents. Over the last few years this area has been under-
going urbanization and improvement: houses are now made mainly of bricks
instead of scarce wood.
Carbon credits: Carbon credits are being used to develop social and envi-
ronmental projects in areas near the plants, such as linear parks, public squares,
eco-points installation, and a center being built to hold wild animals and to
house birds. For example, the Bamburral slum (570 families living next to the
Bandeirante waste site) is the fi rst slum to be urbanized with funds from carbon
credits. Th e community urbanization provides infrastructure, stream channeling,
and construction of four clusters of houses that will receive 260 families that live
in at-risk areas. Th e construction of a deck over the creek is also planned in
order to facilitate the movement of residents, as well as a linear park with areas
for sports and leisure.
Linear parks: Th e Várzeas do Tietê Park, at 75 km, will be the largest linear
park in the world. Th ere are about 7,000 households that will have to be removed.
Th e resettlement will be done in the same region, with the construction of new
housing units in a partnership between the City Housing Secretariat (SEHAB),
Housing and Urban Development Agency (CDHU), and Metropolitan Housing
Company of São Paulo (COHAB). Várzeas do Tietê Park will have signifi cant
environmental gains, because it is considered essential for preserving the river
and the sanitation of the areas that aff ect the margins, restoring and conserving
the environmental function of wetlands, and providing fl ood control. Riparian
and native vegetation will also be restored.
Operation Clean Stream: Th is operation is a joint initiative with the state
government of São Paulo to recover and treat streams throughout the city. Th e
fi rst phase was initiated in 2007 and ended in 2009. More than 800,000 people
benefi ted from cleaning 42 streams and piping 500 liters per second of sewage.
Th e program deals with the remediation of the water and improvement of the
sanitation in informal homes, benefi ting 1,637 inhabitants. Th e program will
continue with the cleanup of 40 more streams up to 2012. During operations,
the city is responsible for maintaining stream margins and layers, and removing
houses that may prevent the passage of the sanitation piping system.
Headwaters Program, by SEHAB: Th e program aims to service all vul-
nerable settlements located in protection areas such as Guarapiranga and Bill-
ings dams in order to restore drinkable water quality. Th e program partners
among the three parts of the government and focuses on using the sub-basin

266 ■ CLIMATE CHANGE, DISASTER RISK, AND THE URBAN POOR
as an integrated planning unit of government initiatives. Th e city’s master plan
allows the construction of new vertical housing projects for 4,000 people at the
margins of the drinking water reservoirs of Guarapiranga and Billings (the
fi rst supplies water to 1.2 million inhabitants, and the second to 3.8 million). Bill-
ings currently has 12 km2 of its water mirror occupied by informal settlements
and receives 400 tons of waste every day. Guarapiranga has 1.3 million illegal
residents in its margins.
Social Partnership Program: Th e City Housing, Social Welfare and Social
Development of Public Policies in São Paulo has the objective of providing
access for low-income people to the formal rental allowance market. Th ey are
subsidized by the fi xed monthly amount of $300.00, with no adjustments for
30 months. Eligibility into the program requires income of 1 to 3 minimum
wages, enabling access by vulnerable groups, including: the homeless in spe-
cial social protection networks; families from areas expropriated by São Paulo,
displaced due to fl oods or fi res; and residents in at-risk areas. Th e social
work is based on a development program that systematically monitors eligi-
ble families, providing social and economic development initiatives to restore
social rights, especially decent housing.
Urban Carbon FootprintAccording to a 2005 study,9 the city’s main source of emission comes from energy
use, especially from transport (11,986 tons of carbon dioxide equivalent CO2e).
Solid-waste disposal is the second-most important source (2,696 tons of
CO2e). Liquid effl uents (7 tons of CO
2e), Land Use Change and Forestry (51 tons
of CO2e ), and agricultural activities (1 ton of CO
2e ) are not relevant sources in
terms of city emissions.
In terms of energy, the use of fossil fuels in transport is the most critical
issue for the city, since the fl eet is made up of more than 7 million vehicles
(growing each year) and the traffi c is heavy (the average peak in traffi c varies
between 80 and 111 km in 2010, and the medium speed rate was of 16 km per
hour in 2008).10
Although most recent models of cars are “fl ex”—using both ethanol and gas-
oline—most private and public fl eets run on fossil fuel, especially gasoline and
diesel (52 percent of the fossil fuel emissions come from gasoline, 45 percent
from diesel, and 3 percent from natural gas). Th e law prescribed reducing the
city´s greenhouse gas emissions by 30 percent, compared with 2005 emissions.
Additional targets should be defi ned every two years.
Initiatives such as the use of more energy-effi cient street and traffi c lighting
and the establishment of infrastructure and incentives to promote the use of low-
carbon vehicles are being off ered, but specialists agree that the city needs to face

ANNEX 7: SÃO PAULO CASE STUDY ■ 267
the problem of planning land use in order to promote shorter commutes between
home and work.
Notes
1. IBGE Census 2000 and City Hall website 2006.
2. City Hall website 2006.
3. Linear park is an area around an important reservoir or drinking water basin, where a
structure is implemented to protect the environment and at the same time provide the
nearby population with leisure or sports activities.
4. City Hall site/environment section.
5. http://www.agenda2012.com.br/oprograma.
6. http://www.prefeitura.sp.gov.br/cidade/secretarias/seguranca_urbana/defesa_civil/
legislacao/pops__2009/index.php?p=7929.
7. Th e minimum wage established by 2011 is around US$325.00 per month.
8. As the threshold for indigency and poverty, the value of R$280.40 (updated in
September 2007) was used, based on the POF (Family Budget Study) undertaken
by IBGE in 1987. Indigents are considered those with total family income per capita
below R$140.20 and, poverty stricken, those who earn up to R$280.40.
9. São Paulo´s GHG´s inventory, http://ww2.prefeitura.sp.gov.br/arquivos/secretarias/
meio_ambiente/Sintesedoinventario.pdf.
10. São Paulo´s GHG´s inventory, http://ww2.prefeitura.sp.gov.br/arquivos/secretarias/
meio_ambiente/Sintesedoinventario.pdf
Reference
World Bank and Diagonal Ltd. 2011. Climate Change, Disaster Risk Management and the
Urban Poor: São Paulo, processed.


CO
LO
R S
EC
TIO
N
■
26
9Figure A1.1 Population and Megacities in Low-Elevation Coastal Zone (LECZ) Threatened by Sea-Level Rise and Storm Surges
Source: United Nations (2008), as reported in the World Development Report 2010, World Bank.

27
0
■
CO
LO
R S
EC
TIO
N
International boundaries
Other population:
add 2050
2000
Population with earthquakes:
add 2050
2000
Population with cyclones:
add 2050
2000
Population both hazards:
add 2050
2000
Figure A2.1 Exposure in Large Cities to Cyclones and Earthquakes Rises from 680 Million in 2000 to 1.5 Billion

COLOR SECTION ■ 271
Kinondoni district
Bunde la Mpung
Tandale-MkundugoUbungo-Kisiwani
Ubungo-KibangaMandela
Makuti A
Tandale-Mtago
4 40 0
Guna
Msiratazi
Terneke Kizinga
Terneke Mbuyuni
Ilala District
Temeke District
Bundeni
KiangoBaghdad
MlewajuniMapipa
Figure A4.1 Administrative Map of Dar es Salaam
Blue = inundation due to sea level rise at 1cm/yr
(ITB 2007)
Figure A5.3 Impact of Sea-level Rise on North Jakarta with Business as Usual

272 ■ COLOR SECTION
Source: Ardhi University (2010).
Bagamoyo road
Morogora road
Pugu roadKilwa road
Legend
Main road
Scale 1:350,000
N
Moderately flooded area
Non flooded area
Unplanned settlement
Highly flooded area
Figure A4.6 Map of Flood Hazard Zone Overlaid on Urban Poor Settlements, Dar es Salaam

CO
LO
R S
EC
TIO
N
■
27
3
Kronjo
Kresek
Mauk
Rajeg Seratan
TelukNaga Kosambi
Balaraja
PasarKemis
Cikupa
Tigakarsa Curug
Legok
TANGERANG
Serpong
ParungPanjang
Jasinga
Cibungbulang
Leuwiliang
Ciempea
Semplak
BOGOR
Parung
Cibinong
Citeureup
DEPOK
BEKASI
BantarGebang
Cileungsi
Setu
Cibarusa
Jonggol
LemahAbang
CikarangTambun
BabelanTambelang
TanumJaya
Cabang Bungin
Muara Gembong
PuloGadung
Ciphang
Mookevan
JAKARTA
630'
600'
630'
600'
10700'10630'
10700'10630'
J a v a S e a
Lontar
Cis
adan
e
Cisadane R.
Banjir Canal
Cili
wun
g R.
Gike
as
Gileungsi
Beka
si R.
Cikarang
Ci
pammgki
s
Ket
apan
g R.
Cak
ung
R.
Sunt
er R
.Ka
li
Kali
Kali
Kali Angke R.
Kali
Pasanggrahan
R.
Kali
Ciputat R.
Kali
Cisadane
R.
Cidangdeur
R.
Cibeureum R.
Ciberang R.
Cipayacun R.
Cimanceuri
R.
Cidurian
R.
Ciuj
ung
R.
Cip
ekay
onR.
Silu
man
R.
Kali
Cik
aran
g
R.
Citarum
R.
CitarumR.
Kali M
auk R.
Cip
amun
gkis
R.
Cib
eaR.
Cig
entis
R.
Jatiluhur Res.
I
II
II
I
III
IIIIII
IV
IV
IV
V
V
V
INDONESIA
THIRD JABOTABEKURBAN DEVELOPMENT
PROJECT (JUDP II I)
NATURAL FEATURES: FISH PONDS FLOOD-PRONE AREAS IRRIGATED RICE FIELDS UPLAND CONSERVATION ZONES OTHER AGRICULTURE
WATER SUPPLY AND SEWERAGE: SERIOUSLY POLLUTED RIVERS AND CANALS DRAINAGE OUTFALLS HIGHLY POLLUTED WATER
SELECTED TOWNS ANDBUILT-UP AREASKABUPATEN (REGENCY)HEADQUARTERSKOTA ADMINISTRASI(ADMINISTRATIVE CITY) ORKOTAMADYA (CITY) BOUNDARIESKABUPATEN BOUNDARIESD.K.I. JAKARTA BOUNDARYJABOTABEK BOUNDARY
PHYSICAL ZONES:LOW LYING COASTAL: FLOODING, SALINEGROUNDWATER, UNSUITABLE FORURBAN DEVELOPMENT
LOW LYING PLAINS: FLOODING, MARGINALURBAN DEVELOPMENT
HIGHLANDS: GOOD DRAINAGE, SUITABLEFOR URBAN DEVELOPMENT
STEEP SLOPING
MOUNTAINS
I
I I
I I I
IVV
The boundaries, colors, denominations and any other informationshown on this map do not imply, on the part of The World BankGroup, any judgment on the legal status of any territory, or anyendorsement or acceptance of such boundaries.
0 5 10 15
KILOMETERS
20 25
IBRD 30971
JULY 2000
Figure A5.1 Administrative Map of Jakarta

274 ■ COLOR SECTION
Source: BPS, 2009/2010Source: Department of Land and Mapping.
DKI Jakarta Province, 2000
0
W E
N
S
W E
N
S
1,25 2,5 7,5km
5km
10 0 1,25 2,5 7,5km
5km
10
Legend:Elevation (m) :
Legend:
Population Density(Person/Ha):<0
< 150150–300300–450450–600
>600
0–55–10
10–1515–2020–2525–3030–3535–40
>40
RiverCoastlineProvincial BoundaryMunicipality BoundarySubdistrict BoundaryUrban Village Boundary
RiverCoastlineProvincial BoundaryMunicipality BoundarySubdistrict BoundaryUrban Village Boundary
Figure A5.4 Population Exposure to Hazards, Jakarta
Figure A5.5 Slum Areas, Flooding and Unregistered Land, Jakarta

COLOR SECTION ■ 275
Not vulnerable pop and housing - bluevulnerable population - greenvulnerable housing - yellowvulnerable pop and housing - red
Legend
Figure A6.5 Vulnerable Areas in Terms of Population and Housing, Mexico City
Figure A7.4 São Paulo´s Topography and Main Waterways
LegendSlope levels
0–5%5–25%
25–60%>60%
Source: PMSP—São Paulo Environmental Atlas.

276 ■ COLOR SECTION
Legend
Geotechnical Risk Areas
05–25%
25–60%
> 60%
0–05%
Slope
Figure A7.9 Geotechnical Hazard Areas, São Paulo

■ 277
Index
Boxes, fi gures, notes, and tables are indicated by b, f, n, and t following the page number.
A
absentee landlords, 29–30
ACCRN (Asian Cities Climate Change
Resilience Network), 153–54
Aceh (Indonesia), reconstruction in, 171–72
action planning, 65, 68–69b, 68–70
Action Plan on Global Warming
Mitigation, 106b
Adaptation Fund, 134
Adaptation Strategies for Climate
Change in the Urban Environment
(ASCCUE), 74–75
adaptation to climate change. See also
mitigation of climate change
costing of, 100–103
disaster response and, 224–25
disaster risk management and, 187–91,
244–46
lessons learned from, 173
literature review on, 132–34
planning for, 186
poverty reduction and, 127
Adapting Cities to Climate Change
(Bicknell et al.), 128, 133
Adapting to Climate Change in
Eastern Europe and Central Asia
(Fay et al.), 127
AES Eletropaulo Metropolitana S.A.
(energy utility), 242
Africa. See also specifi c countries and regions
community organization partnerships
in, 94
cyclone exposure in, 144
forced evictions in, 52
malaria in, 49
precipitation in, 83
slums in, 28
urban populations in, 12
African Development Bank, 127–28
African Urban Risk Analysis Network
(AURAN), 160–61, 188
Aga Khan Hospital (Dar es Salaam), 190
“Agenda 2012” program (São Paulo), 244
agriculture, urban, 53
Aguada Flood Park (Santiago), 75–76
Ahmedabad (India), bonds in, 119
air conditioning, 48
air pollution, indoor, 47
Aishaman slum (Ghana), 32
Akhtar, R., 130
Alaho settlement (Accra), 41
Alexandria (Egypt), fl oods in, 142
Alliance for Clean Cook Stoves, 48
Amman (Jordan), carbon fi nance in, 115
Amsterdam (Netherlands), fl oods in, 143
Anguilla, risk fi nancing in, 170
Antigua & Barbuda, risk fi nancing in, 170
Architectural Institute of Japan, 40
Arctic, warming of, 48
Ardhi University, 182
Argentina, early-warning systems in, 159–60
ASCCUE (Adaptation Strategies for
Climate Change in the Urban
Environment), 74–75
278 ■ INDEX
Asia. See also specifi c countries and regions
coastal cities in, 144–45
community organization partnerships
in, 94
cyclone exposure in, 144
earthquakes in, 19
fl ood exposure in, 142–43
forced evictions in, 52
landslides in, 19
urban populations in, 12, 15
Asian Cities Climate Change Resilience
Network (ACCRN), 153–54
AURAN (African Urban Risk Analysis
Network), 160–61, 188
B
Badan Nasional Penanggulangan Bencana
(BNPB, Indonesian monitoring
agency), 208
Badan Penanggulangan Bencana Daerah
(BPBD, Indonesian disaster
management agency), 206–7, 208
Badan Pengelola Linkungan Hidup Daerah
(BPLHD, Indonesian environmental
agency), 206, 215
Badan Perencanaan Pembangunan Daerah
(BAPPEDA, Indonesian planning
agency), 206–7
Bahamas, risk fi nancing in, 170
Baker, Judy, 130
Banco Nacional de Obras, 107b
Bandeirantes Landfi ll (São Paulo), 116b, 237
Bandra-Kurla Complex (Mumbai), 52b
Bangalore (India), bonds in, 119
Bangkok (Th ailand)
clean technology fund for, 105, 106b
fl ooding costs in, 100
as “hotspot” city, 132
Multi-Hazard City Risk Index for, 145
Bangkok Metropolitan Administration
(BMA), 106b
Bangladesh
early-warning system in, 88
housing loans in, 120
slums in, 37b
BAPPEDA (Badan Perencanaan
Pembangunan Daerah, Indonesian
planning agency), 206–7
Barbados, risk fi nancing in, 170
Barcelona (Spain), fl ood management in, 75
barrios, 38b
basic health units (UBS), 245
basic services. See service delivery
Bayan Tubig (Water for the Community)
program, 118b
Bay of Bengal, cyclones in, 17
B/Cs (benefi t/cost ratios), 102, 102f
bed nets, 130
BEHD (buildings expected to be heavily
damaged), 71
Belgaum (India), water effi ciency project
in, 166
Belize, risk fi nancing in, 170
Bellary (India), water effi ciency project in, 166
benefi t/cost ratios (B/Cs), 102, 102f
Bermuda, risk fi nancing in, 170
Bicknell, Jane, 131
Billings dam (São Paulo), 265–66
Bio Carbon Fund, 165
Biogas (company), 116b
biomass, burning of, 47
Birkmann, Jörn, 128
black carbon, 48, 58n10
Bloomberg, Michael, 68b
BMA (Bangkok Metropolitan
Administration), 106b
BNPB (Badan Nasional Penanggulangan
Bencana, Indonesian monitoring
agency), 208
Bogota (Colombia)
housing program in, 105
slums in, 38b
Bolivia, climate mitigation in, 164–65
Bolivia Urban Infrastructure, 164
Bombay High Court, 52b
Bonde la Mpunga (Dar es Salaam), fl ooding
in, 160
bonds
carbon-linked, 115
green, 121
for slum improvements, 119
Bordo Poniente (Mexican landfi ll), 223
Borivali National Park (Mumbai), 52b
Boston, urban planning in, 70
BPBD (Badan Penanggulangan Bencana
Daerah, Indonesian disaster
management agency), 206–7, 208
BPLHD (Badan Pengelola Linkungan Hidup
Daerah, Indonesian environmental
agency), 206, 215

INDEX ■ 279
Brazil. See also São Paulo
Development Policy Loan for, 106
fl ooding in, 8
urban waste collection in, 46
Brigades of the Ministry of Social
Development (Mexico City), 226
Buenos Aires (Argentina), fl ooding in, 159
building-back-better, good practices for,
170–73
building codes, 71
building designs, climate projections and, 82
buildings expected to be heavily damaged
(BEHD), 71
Bus Rapid Transit line (Mexico City), 222
C
Cairo (Egypt)
“newtowns” in, 30
public infrastructure in, 104
Caixa Econômica Federal (Federal Bank,
Brazil), 263
California, water management in, 85
Ca Mau (Vietnam), urban upgrading in, 167
Cambodia, housing fi nance in, 120
Canadian Sustainable Environment
Management Offi ce, 73
Can Th o (Vietnam)
Local Resilience Action Plan in, 155
urban upgrading in, 167
capacity building, 89, 90t, 121, 153, 184,
202, 204
Capacity Strengthening of Least Developing
Countries for Adaptation to Climate
Change (CLACC), 153
cap-and-trade programs, 117b
Cape Flats informal settlement
(Cape Town), 40
Cape Town (South Africa), urban planning
in, 70
Caracas (Venezuela), slums in, 38b
carbon credits, 265
Carbon Credits Auctions, 237
carbon footprints, 266–67
carbon markets, 110, 115
Carbon Partnership Facility, 115
carbon revenue, 165–66
Caribbean. See also specifi c countries
cyclones in, 17
earthquake exposure in, 144
risk fi nancing in, 170
Caribbean Catastrophe Risk Insurance
Facility (CCRIF), 170
Casablanca (Morocco), action plans
for, 102
Cash-for-Work program, 167
Cash for Work Temporary Employment
Project (CfWTEP), 168
Catastrophe Risk Deferred Drawdown
Option (CAT DDO), 170
Cayman Islands, risk fi nancing in, 170
CBOs. See community-based organizations
CCRIF (Caribbean Catastrophe Risk
Insurance Facility), 170
CDCF (Community Development Carbon
Fund), 164–65, 166
CDHU. See Housing and Urban
Development Agency
CDM. See Clean Development Mechanism
Central America. See also specifi c countries
cyclones in, 17
disaster-induced emergency
funding in, 170
volcanoes in, 20
Centre for Atmospheric Sciences, 218
Centre for Urban Studies (Bangladesh), 131
Centro de Previsão de Tempo e Estudos
Climáticos (Eta-CPTEC) Model,
249, 251
certifi ed emission reductions (CERs),
115, 116b
CET (Traffi c Engineering Company), 255
C40 group, 237
CfWTEP (Cash for Work Temporary
Employment Project), 168
CGE (Emergency Management Center, São
Paulo), 244–45
Cheonggyecheon Restoration Project, 76
Chicago
adaptation planning in, 84b
emissions trading systems in, 117b
children
health impacts of climate change
on, 126
public health and, 49
self-insurance and, 168
in slums, 257
as vulnerable population, 86
Chile
earthquakes in, 8, 173
fl ood management in, 75
280 ■ INDEX
China, People’s Republic of
cook stoves in, 47
cyclones in, 17
earthquakes in, 8, 19
fl oods in, 8
technical assistance programs in, 154
cholera, 48–49, 192
CIFs (Climate Investment Funds), 134
Cities Alliance, 161
Cities on the Move (World Bank), 130
City Assembly (São Paulo), 237
City Climate Law (São Paulo), 237
City Education Secretariat (SME,
São Paulo), 263
City Emergency Management Agency
(COMDEC, São Paulo), 244–45, 246
City Health Secretariat (São Paulo), 245
City Housing, Social Welfare and Social
Development of Public Policies (São
Paulo), 266
City Housing Secretariat (SEHAB,
São Paulo), 245, 251, 254–55, 260,
263, 264–65
City Public Safety Secretariat
(São Paulo), 244
Ciudad Kenedy slum (Bogota), 30
CIUP (Community Infrastructure
Upgrading Program), 161, 183–84
Civil Protection Agency (Mexico City),
224, 226
CLACC (Capacity Strengthening of Least
Developing Countries for Adaptation
to Climate Change), 153
“clandestine” fi elds, 223
Clean Development Mechanism (CDM),
110, 115, 116b, 165, 185, 237
Clean Technology Fund, 105, 106b, 107b
ClimAdapt, 73
climate change
Dar es Salaam and, 181–97. See also Dar
es Salaam
disaster risk assessment and, 7–25.
See also disasters and disaster risk
assessment
exposure in cities and, 141–47. See also
exposure in cities
fi nance opportunities and, 99–123. See also
fi nance opportunities
Jakarta and, 199–215. See also Jakarta
literature review, 125–39. See also literature
review
Mexico City and, 217–33. See also Mexico
City
project and program experiences and,
149–80. See also project and program
experiences
São Paulo and, 235–68. See also São Paulo
urban poor, building resilience for, 63–97.
See also urban poor, building
resilience for
urban poor, vulnerability of, 27–62. See also
urban poor, vulnerability of
Climate Change Adaptation Program
(Mexico City), 69b, 223
Climate Change Economy Committee (São
Paulo), 262
Climate Change Risk Management Strategy
for HRM (Halifax Region
Municipality), 73
Climate Committee (São Paulo), 263
Climate Investment Funds (CIFs), 134
Climate Resilient Cities (CRC) Primer, 154
Climate Resilient Communities
Program, 153
Climate Risks and Adaptation in Asian
Coastal Megacities: A Synthesis Report
(World Bank), 100, 131, 133
climate sensitivity, 82–83, 83t
Climate SMART (Sustainable Mitigation
and Adaptation Risk Toolkit), 73
Climate Summit for Mayors (2009), 9
coastal areas and cities, 17–18, 49, 144–45,
189–90. See also port cities
coastal-defense projects, 82
CODELs (local emergency committees), 159
COHAB (Metropolitan Housing
Company of São Paulo), 260, 265
cold waves, 135
Colombia
public transport projects in, 133
risk management in, 168–69
COMDEC (City Emergency Management
Agency, São Paulo), 244–45, 246
communicable diseases, 48–49, 58–59n14, 92.
See also specifi c diseases
community-based organizations (CBOs),
86, 150–51, 162–63, 171–72
Community-based Settlements
Rehabilitation and Reconstruction,
171–72
Community Development Carbon Fund
(CDCF), 164–65, 166

INDEX ■ 281
Community Infrastructure Upgrading
Program (CIUP), 87, 161,
183–84, 188
concession contracts, 117, 118b
cookstoves, 47–48, 58n10, 134
Costa Rica, drawdown options in, 170
Th e Cost to Developing Countries of Adapting
to Climate Change (World Bank), 133
COVISA (Health Vigilance Coordination,
São Paulo), 245
CPTM (Train Management Agency, São
Paulo), 242
CRC (Climate Resilient Cities Primer), 154
credit guarantees, 119
Crisis Commons, 173
Cuba, early-warning systems in, 159
Cuitegi Plaza (São Paulo), 116b
Curitiba (Brazil), fl ood management
in, 75
Cuttack (India)
mapping and data gathering in, 157–58
risk assessment in, 65
CVCCCM (Virtual Center on Climate
Change for Mexico City), 88, 218
cyclones, 2f, 12–19, 144
Cyclone Sidr (2007), 88
D
Da Nang (Vietnam), urban upgrading
in, 167
DANIDA (Danish International Development
Agency), 92, 161–62
Danilenko, Alexander, 130
Danish International Development Agency
(DANIDA), 92, 161–62
Dao, H., 131
Dar es Salaam (Tanzania), 181–97
administrative units in, 3f, 86
case study summary for, 11, 186–97
built environment and service
provision, 186–87
city profi le, 186, 187t
climate hazards, 192–95, 193f,
194t, 195f
climate hazards assessment,
191–96, 192t
disaster risk management, 187–91
future climate projections, 194–95
institutional assessment, 187–91
leading agencies, 191
natural disasters, 191–92
policies and legislation, 188
potential losses, 195–96
pro-poor services and local
expenditure, 191
socioeconomic assessment, 196–97
urban poor, location and exposure of,
196–97, 196f
City Council, 86, 182, 184, 187–88, 191
Climate Summit for Mayors and, 9
cook stoves in, 47
diseases in, 48–49
fl oods in, 19
infrastructure upgrading in, 87
maladaptation to climate change
in, 149–50
malaria in, 20
overview and key fi ndings, 181–86
government at work, 183–84
information gaps and, 184–85
key constraints, 184
looking forward, 185–86
risk assessment in, 65, 122, 191–96, 192t
roads in, 46–47
sanitation in, 42
solid-waste disposal in, 46
urban planning in, 160–61
water supply in, 42, 43b
Dar es Salaam City Council (DCC), 86, 182,
184, 187–88, 191
data collection
Jakarata case study and, 201
Mexico City case study and, 219
for risk assessment, 64–65
for vulnerability, 157–58
DCC. See Dar es Salaam City Council
decision-making tools, 83–86, 85b
Decision of the Parties (Cancun, 2010), 115
Decree 50.866/2009 on climate change (São
Paulo), 263–64
Delhi (India), temperatures in, 48
dengue, 18, 20, 48, 49, 50b
Density and Disasters (Lall and
Deichmann), 131
Deutsche Gesellschaft für Technische
Zusammenarbeit (GTZ), 159
Developer’s Risk Management Guide
(Halifax Region Municipality), 73
developing countries
fi nancing sources for, 105
greenhouse gas emissions in, 115
Development Policy Loans (DPLs), 105–6

282 ■ INDEX
Dhaka (Bangladesh)
climate change vulnerability of, 144
drainage in, 44
security of tenure in, 52
slums in, 131
Dharavi slum (Mumbai), 32
diarrhea, 44–45, 48, 163, 192
Dinas Pekerjaan Umum (DPU, Indonesian
public works agency), 207
disaster-management plans, 50–51
disaster risk reduction (DRR), 106–7, 128–29,
130, 132, 134–35, 144
disasters and disaster risk assessment, 7–25.
See also specifi c disasters
(e.g., earthquakes)
background, analytical framework, and
approach, 9–12, 11–14t
decision making and, 64–65, 66–67b
early-warning systems. See early-warning
systems
emergency services and, 49–51
exposure, estimation of, 22–23, 22–23t
hazard risk and, 6f, 12–22, 15–16t, 18t
drought, 20
earthquakes, volcanoes, and landslides,
2f, 19–20
fl oods and cyclones, 2f, 12–19
heat waves, 20–22, 21b
key messages, 7
objectives of study, 7–9
service delivery and, 38–51, 64, 86–89
shelters and, 40
diseases. See communicable diseases;
noncommunicable diseases; specifi c
diseases
DKI. See Special Capital District
Dodman, David, 131
Dominica, risk fi nancing in, 170
Dong Th ap (Vietnam), urban upgrading
in, 167
Douglas, Ian, 129
DPLs (Development Policy Loans), 105–6
DPU (Dinas Pekerjaan Umum, Indonesian
public works agency), 207
drainage. See also sanitation
disaster risk and, 44–45, 189
job creation and, 167–68
partnerships to supply, 163–64
service delivery and, 129
solid-waste disposal and, 46
drawdown options, 170
droughts, 20
drowning, 18
dysentery, 192
E
early-warning systems, 51, 88, 93–94b, 102,
158–60, 225–26, 227
Earthquake Disaster Risk Index (EDRI), 145
Earthquake Master Plan for Istanbul, 71
earthquakes
disaster risk and, 19–20, 71–72, 145
exposure to, 2f, 144
shelters and, 40
slums and, 29, 38b
East Asia, earthquakes in, 19
Ebrard, Marcelo, 222
EcoEconomy Committee (São Paulo), 263
Ecofrota Program (São Paulo), 264
ecological services, green infrastructure
and, 74–76
EDRI (Earthquake Disaster Risk Index), 145
Egypt, public transport projects
in, 133
elderly
health impacts of climate change on, 126
heat waves and, 20
public health and, 49
as vulnerable population, 86
El Salvador
drawdown options in, 170
self-insurance in, 110, 168
Emergency Management Agency
(São Paulo), 87, 244, 245, 261
Emergency Management Center (CGE,
São Paulo), 244–45
emissions reduction (ER) units, 166
emissions trading systems (ETSs),
115, 117b
Empresa Paulista de Planejamento
Metropolitano (EMPLASA), 255
Enda-Tiers Monde, 163
energy services, 49–51, 133, 164–66
Environmental Agenda of Mexico City, 223
environmental health interventions, 92
environmentally sensitive lands, 52b
Environmental Public Fund (Mexico City),
219, 224
environmental traffi c lights (semaforos
ambientales), 169
ER (emissions reduction) units, 166
Esteli (Nicaragua), social networks in, 54

INDEX ■ 283
Eta-CPTEC (Centro de Previsão de Tempo e
Estudos Climáticos) Model, 249, 251
Ethiopia, roads in, 46
ETSs (emissions trading systems), 115, 117b
European Union, emissions-trading
schemes in, 117b
evictions, forced, 51–53
Excel spreadsheets, 158
“excess deaths,” 21
exposure in cities, 141–47
coastal cities and, 144–45
disaster risk reduction economics, 144
Earthquake Disaster Risk Index (EDRI)
and, 145
megacities and, 143
Multi-Hazard City Risk Index (MHCRI),
145–46
port cities and, 141–43, 142t
F
family networks, extended, 54
FAR (fl oor-area ratio), 28, 58n1
Fay, Marianne, 130
fees as government revenue source, 104
fi nance opportunities, 8, 99–123
adaptation and risk reduction, sources for,
103–21, 103t, 108t
carbon markets and related
instruments, 110, 115
climate change and, 105–6
disaster risk reduction and
recovery, 106–7
government revenues and
expenditures, 104–5
multilateral development banks and
donors, 105–8
private sector and, 115–20
results-based fi nancing (RBF)
and, 120–21
risk-management instruments, 108–10,
111–14t
urban development and slum
upgrading, 107
adaptation costing and risk reduction,
100–103
key messages, 99
literature review of, 134
summarizing concepts, 121–22
Fire and Health Department (Mexico
City), 226
Flexible Adaptation Pathways, 69b
Flood Control Committee (Dar es
Salaam), 160–61
fl oods
ad hoc adaptation and, 55
coastal-defense projects and, 82
community organizations and, 162–63
costs from, 100
decision making and, 85b
drainage and, 44–45
early-warning systems for, 91, 93–94b,
159–60, 188
frequency of, 129
hazards risks and, 17–18
maladaptation to, 149–50
patterns of, 36b
planning for, 74
port cities and, 141–43, 142t
rainwater-harvesting systems and, 53
risk management for, 12–19, 72,
75–76, 87
sand-bagging and, 51
shelters and, 40–41
urban planning and, 160–63
urban poor and, 4f
urban upgrading and, 166–67
water supply and, 43–44
fl oor-area ratio (FAR), 28, 58n1
Florida, adaptation cost curve for, 100,
101f, 102
Fondo de Desastres Naturales
(FONDEN), 109b
Food Price Crisis Response Trust Fund, 168
forced evictions, 51–53
forest fi res, 73
France, heat waves in, 20
Francisco, H. A., 131
G
GDP. See gross domestic product
GEF (Global Environment Facility), 110
GEO-CAN (Global Earth Observation—
Catastrophe Assessment Network),
87, 172
Geographical Information System (GIS),
157–58, 255
geotechnical charts, 255
GFDRR. See Global Facility for Disaster
Reduction and Recovery
GHG emissions. See greenhouse gas
GIS (Geographical Information System),
157–58, 255

284 ■ INDEX
Global Assessment Report on Disaster Risk
Reduction (ISDR), 9, 127
Global Circulation Models, 194
Global Community Monitor, 92
Global Earth Observation—Catastrophe
Assessment Network (GEO—CAN),
87, 172
Global Environment Facility (GEF), 110
Global Environment Fund, 134
Global Facility for Disaster Reduction
and Recovery (GFDRR), 65, 66b, 144,
169, 214
Global Facility for Disaster Risk Reduction
and Poverty, 127
Global MultiCat, 109
Global Partnership on Output Based Aid
(GPOBA), 121
Google, volunteer technology community
participation of, 173
Google Earth, 65, 157–58
government revenues, 104–5
GPOBA (Global Partnership on Output
Based Aid), 121
GPS devices, 65, 157
Grameen Bank, 120
grass roots organizations, 155–57
Greater Bangalore Water and Sanitation
Pooled Facility, 119
Greater London Authority, 72
Great Hanshim-Awaji earthquake (1995), 40
Green and Environment Secretariat (SVMA,
São Paulo), 235, 244, 245, 263, 264
green bonds, 121
greenhouse gas (GHG) emissions
city-level indexes for, 121
clean technology funds and, 106b
climate change mitigation and adaptation
and, 133–34
emissions inventory, 15, 215, 237
emissions-trading schemes for, 117b
post-consumer waste and, 46
reductions in, 115, 128, 222, 237, 266
water supply and, 165–66
greening initiatives, 74
Green Plan (Plan Verde), 222, 223
green rooft ops, 53, 75
Grenada, risk fi nancing in, 170
gross domestic product (GDP), 100, 143,
145, 204, 221, 232–33, 232t
GTZ (Deutsche Gesellschaft für Technische
Zusammenarbeit), 159
Guangzhou (China), fl oods in, 142
Guarapiranga dam (São Paulo), 265–66
Gujarat (India) earthquake (2001), 37
Gulbarga (India), water effi ciency project
in, 166
H
HABISP. See Housing Information System
Haines, Andy, 130
Hai Phong (Vietnam), urban upgrading
in, 167
Haiti
basic service delivery in, 39
earthquakes in, 8, 87, 106–7, 173
risk fi nancing in, 170
Halifax (Canada)
climate change mainstreaming in, 73
urban planning in, 70
Halifax Region Municipality (HRM), 73
Hamilton City (New Zealand), infrastructure
systems in, 132
HAND model, 255
Hardoy, J.G., 131
hazardous sites
declivity, 35b
geotechnical, 8f, 34, 35b
Headwaters Program (São Paulo), 265–66
Health Department (Mexico City), 224
Health Secretariat (São Paulo), 245–46
health services, 92, 130
Health Vigilance Coordination
(COVISA, São Paulo), 245
heat-island eff ects, 21, 227
heat-warning systems, 88
heat waves, 20–22, 21b, 48, 72, 73–74, 132
Herold, C., 131
Ho Chi Minh City (Vietnam)
fl oods in, 100, 142, 166–67
as “hotspot” city, 132
urban planning in, 70
homeless people, 150, 233n3
Honduras, early-warning systems
in, 158–59
“hotspots,” 132, 154, 155
housing
building-back-better options for, 170–71
gaps in literature on, 135
literature review of, 131–32
in Mexico City case study, 230–31
urban poor and, 131–32
vulnerable areas and, 7f

INDEX ■ 285
Housing and Urban Development Agency
(CDHU, São Paulo), 260, 263, 265
Housing Information System (HABISP,
São Paulo), 251, 254, 255, 263
HRM (Halifax Region Municipality), 73
Hubli/Dharwad (India), water effi ciency
project in, 166
Human Development Report (UNDP), 127
“Human Health” (IPCC), 126, 130
“humanitarian technologists,” 172
Hurricane Mitch (1998), 158–59
Hurricane Wilma (2005), 159
I
IBRD (International Bank for Reconstruction
and Development), 170
ICLEI USA, 153
IIED (International Institute for
Environment and Development),
128, 153
Iloilo (Philippines)
City Urban Poor Aff airs Offi ce, 156
grassroots organizations in, 156
local partnerships in, 91
Improving Water and Sanitation in
Quelimane City, Mozambique
program, 161
Independent Evaluation Group
(World Bank), 169
index of social vulnerability (IPVS), 255
India
Asian Cities Climate Change Resilience
Network in, 154
carbon revenue in, 165–66
cook stoves in, 47
earthquakes in, 19
housing fi nance in, 120
parks in, 52b
slums in, 119, 130
Indonesia. See also Jakarta
Asian Cities Climate Change Resilience
Network in, 154
community programs in, 88–89, 171–72
Development Policy Loan for, 106
earthquakes in, 19
technical assistance programs in, 154
Indore (India), slums in, 129–30
“Industry, Settlements and Society”
(IPCC), 126
infectious diseases. See communicable
diseases
infl uenza epidemics, 221
informal settlements. See also slums;
squatter settlements
environmentally sensitive lands and, 52b
Jakarta case study and, 213
policy tradeoff s and, 77
information systems, 184
infrastructure. See also transportation sector
costs for, 102–3
green, 70, 74–76
investments in, 100
Jakarta case study and, 201–2
security of tenure and, 51–52
upgrading of, 87
INPE (Instituto Nacional de Pesquisas
Espaciais), 248–49, 251
Institute for Social and Environmental
Transition (ISET), 153
Institute of Research and Technology
(São Paulo), 248–49, 251
Institute of Resource Assessment, 182
Institute of Science and Technology of the
Federal District (Mexico City), 218
Instituto Nacional de Pesquisas Espaciais
(INPE), 248–49, 251
insurance, 53, 108–9, 110, 168–69
Integrated Urban Water Management, 45
Inter-Governmental Panel on Climate
Change (IPCC)
analytical framework of, 10
Assessment Reports, 10, 49, 125, 126, 130
climate change literature and, 9
on climate change mitigation, 134
on gaps in literature, 135
on health services, 130
on heat waves, 20
on sea levels, 17
on water availability, 42–43
Inter-institutional Climate Change
Commission of Mexico City,
69b, 218, 223
International Bank for Reconstruction and
Development (IBRD), 170
International Development Association, 105
International Institute for Environment
and Development (IIED), 128, 153
International Organization for
Standardization, 154
International Organization on
Migration, 190
International START Secretariat, 182

286 ■ INDEX
International Strategy for Disaster
Reduction (ISDR), 158
International Union for Conservation of
Nature (IUCN), 190
Internet
HABISP information system on, 263
rate of viewing, 245
intestinal worms, 45
Investment Plan for Th ailand, 105, 106b
IPCC. See Inter-Governmental Panel on
Climate Change
IPT. See Technological Research Institute
IPVS (Index of social vulnerability), 255
ISDR (International Strategy for Disaster
Reduction), 158
ISET (Institute for Social and
Environmental Transition), 153
ISO 31000, 154
Istanbul (Turkey)
disaster risk reduction in, 71–72
urban planning in, 70
IUCN (International Union for
Conservation of Nature), 190
J
Jakarta (Indonesia), 199–215
administrative map of, 5f
case study summary, 11, 204–15
city profi le, 204–6, 205t
climate hazards, 211, 212t
constraints and opportunities, 214–15
disaster impacts, 212
disaster risk management, 206–8, 210t
good practice examples, 213–14
greenhouse gas emissions, 215
hazards assessment, 209–12
high-risk disaster areas, 211–12
informal settlements, characteristics
of, 213
institutional assessment, 206–9
natural disasters, 209–11, 211t
policies and legislation, 207
policy shortcomings, 208
pro-poor programs and climate
adaptation, 209, 209t
risk reduction, 208–9
socioeconomic assessment, 213–15, 214t
urban poor, location of, 213
climate change vulnerability of, 144
Climate Summit for Mayors and, 9
decentralization in, 86
dengue in, 50b
drainage in, 45
early-warning systems in, 91, 93–94b
fl ooding in, 36b, 55
overview and key fi ndings, 199–204
areas for improvement, 201
government at work, 201
information gaps, 203
key constraints, 201–2
looking forward, 203–4
risk assessment in, 65, 67b, 122
risk planning in, 74
sea-level rise in, 3f
water supply in, 121
Jakarta Building Control and Monitoring
Offi ce (Penataan dan Pengawasan
Bangunan), 212
Jakarta Coastal Defense Strategy (JCDS), 212
Jakarta Coastal Sea Defense, 202, 207
“Jakarta Flood Hazard Mapping
Framework,” 212
Jakarta Urgent Flood Mitigation Project
(JUFMP), 212
Jamaica, risk fi nancing in, 170
Jamii Bora Trust Low Cost Housing
Scheme, 120
Japan
earthquakes in, 8
fl ood exposure in, 143
Japan International Cooperation Agency, 71
Jardim Ana Maria slum (São Paulo), 33–34b
Jardim Romano neighborhood (São
Paulo), 246
Jatiluruh reservoir (Indonesia), 202
Java earthquake (2006), 171
Java Reconstruction Fund, 172
JCDS (Jakarta Coastal Defense Strategy), 212
job creation programs, 167–68
John A. Blume Earthquake Engineering
Center, 145
Joint Implementation (Kyoto Protocol), 110
Jollands, N., 132
JUFMP (Jakarta Urgent Flood Mitigation
Project), 212
Juneja, Shefali, 128
K
Kamal Muara neighborhood (Jakarta), 19
Kampala (Uganda), fl ooding in, 44
Kampung Melayu slum (Jakarta),
91, 93–94b

INDEX ■ 287
Kantor Asisten Pembangunan dan
Lingkungan Hidup (Asbang,
Jakarta), 206
Karachi (Pakistan)
capacity building in, 87
water supply and sanitation in, 163–64
Karnataka (India), carbon revenue
in, 165–66
Karnataka Municipal Water Energy
Effi ciency Project, 166
Karnataka Urban Infrastructure
Development and Finance
Corporation (KUIDFC), 166
Kathmandu (Nepal), slums in, 37b
Kebede, Abiy S., 195
Kelurahan Empowerment Initiative, 74
Kenya, housing fi nance in, 120
Kibera slum (Nairobi), 30, 32, 42
KICAMP (Kinondoni Integrated Coastal
Area Management Project), 183, 190
Kien Giang (Vietnam), urban upgrading
in, 167
Kinondoni Integrated Coastal Area
Management Project (KICAMP),
183, 190
knowledge sharing and training, 151–54
Asian Cities Climate Change Resilience
Network (ACCRN), 153–54
Climate Resilient Cities Primer, 154
ICLEI and, 153
ISO 31000, 154
least developing countries, capacity
strengthening of, 153
Kolkata (India), fl oods in, 142
Korea, fl ood management in, 75
Kota Tua (Indonesia), 212
Kovats, S., 130
KUIDFC (Karnataka Urban Infrastructure
Development and Finance
Corporation), 166
Kyoto Protocol (2005), 110, 165, 188
L
LACE (Liberia Agency for Community
Empowerment), 168
land-based revenues, 104–5
landfi lls, 116b
landslides, 19–20, 29, 263
Land Use Change and Forestry
(São Paulo), 266
land-use planning, policy tradeoff s in, 76–77
Latin America. See also specifi c countries
drowning in, 18
earthquake exposure in, 144
slums in, 37–38b
Law 14459/07 on solar water systems (São
Paulo), 264–65
Least Developed Countries Fund, 134
LECZ (Low Elevation Coastal Zones), 1f, 15
Legislative Assembly (Mexico City), 223
leptospirosis, 245
Liberia
natural disasters in, 167–68
solid-waste disposal in, 46
Liberia Agency for Community
Empowerment (LACE), 168
LIDAR (light detection and ranging)
technology, 73
LINGAP Foundation, 118b
literature review, 125–39
adaptation and mitigation of climate
change, 132–34
climate change and disaster risk reduction
(DRR), 128–29
fi nance and, 134
gaps in existing literature, 134–35
housing, 131–32
service delivery, 129–31
urban poverty, 128–31
“Live Green Toronto” project, 74
Local Development Program (PRODEL), 120
Local Emergency Management Group
(NUDEC, São Paulo), 244, 261
Local Resilience Action Plan (LRAP), 68b, 74,
121, 155
London
climate change adaptation in, 72
urban planning in, 70
Los Angeles, emissions trading systems
in, 117b
Louisiana, oil spill in, 173
Low Elevation Coastal Zones (LECZ), 1f, 15
LRAP. See Local Resilience Action Plan
lurah (urban ward leader), 86, 94n4
Luzon (Philippines), risk identifi cation
in, 156
M
Mahila Milan groups, 157–58
Makoko slum (Lagos), 40–41
maladaptation to climate change, 55–57,
149–50

288 ■ INDEX
malaria
climate change and, 49
drought and, 20
fl oods and, 44, 192
health services for, 130
public health and, 48
in slums, 18
MAMC (Metropolitan Area of
Mexico City), 217
Managing Disaster Risk in Emerging
Economies (World Bank), 128–29
Manchester study, 75
Mancomunidad de los Municipios del
Centro de Atlantida (MAMUCA),
159
Mandaue (Philippines), building-back-
better in, 171
Mangalore (India), water effi ciency
project in, 166
Manila (Philippines)
climate change vulnerability of, 144
fl ooding costs in, 100
as “hotspot” city, 132
Multi-Hazard City Risk Index for, 145
water distribution in, 117, 118–19b
Manila Water Company, 117, 118b
Manizales (Colombia)
insurance in, 110
risk management in, 168–69
mapping
of fl ood risks, 72
of hazards exposure, 254–55
of landslides, 263
for risk assessment, 65, 169, 184
for vulnerability, 157–58
Marikina City (Philippines), fl ood
management in, 75
Mark, O., 130
Marmara earthquake (1999), 71
Mayniland Water Services, 117, 118b
Mayor’s Task Force (Mexico City), 217
Mayor’s Task Force (São Paulo), 236, 237
Mayor’s Task Force on Climate Change,
Disaster Risk and the Urban Poor,
9, 65, 66–67b
MCCAP. See Mexico City Climate
Action Program
MCMA. See Mexico City Metropolitan Area
MDBs (multilateral development banks),
105–8, 110
MDGs (Millennium Development Goals), 39
Médecins San Frontières, 118b
megacities, 1f, 77, 143
Mehrotra, S., 128
meningitis, 20
Mercy Corps, 121, 167
methane gas capture projects, 164–65
Metrobus system (Mexico City), 222
Metropolitan Area of Mexico City
(MAMC), 217
Metropolitan Housing Company of São
Paulo (COHAB), 260, 265
Mexico. See also Mexico City
climate change fi nancing in, 105, 107b
Development Policy Loan for, 106
MultiCat Program in, 109, 109b
public transport projects in, 133
Urban Transport Transformation
Program, 105, 107b
Mexico City, 217–33. See also Mexico City
Metropolitan Area
action plans in, 68–69b
administrative units in, 86
case study summary, 11, 220–33
agency risk management, 227
built environment and service
provision, 222–23
city profi le, 220–21f, 220–22, 222t
climate change adaptation, 224–27
disaster risk management, 225–27,
226–27t
economic costs of climate change,
232–33, 232t
hazards assessment, 15, 227–30
institutional assessment, 223–27,
224–25t
natural disaster history, 227–28, 228t
precipitation, 229, 230f
socioeconomic assessment, 230–33, 231t
temperature, 228–29, 229f
trends and projections, 228–30
urban poor, exposure of, 231–33, 232t
urban poor, location of, 230–31, 230t
water runoff , 229–30
climate-change strategy in, 88
Climate Summit for Mayors and, 9
overview and key fi ndings, 217–19
government at work, 218
key constraints, 219
looking forward, 219
natural hazards, vulnerability
to, 218

INDEX ■ 289
risk assessment in, 65, 67b, 122
vulnerable households in, 31–32b
water supply in, 45b, 48
Mexico City Climate Action Program
(MCCAP), 69b, 218, 219, 223–24,
226–27
Mexico City Climate Change Adaptation
Program, 217
Mexico City Metropolitan Area (MCMA),
21b, 220–21, 221f, 223, 229, 231
Mexico Urban Transport Transformation
Program, 107b
MHCRI (Multi-Hazard City Risk Index),
145–46
Miami, fl oods in, 142, 143
Mibanco, 119–20
microfi nance, 110, 119–20
Microsoft , volunteer technology community
participation of, 173
Millennium Development Goals
(MDGs), 39
Millennium Project (2005), UN, 102
Mindanao (Philippines), risk identifi cation
in, 156
mitigation of climate change, 128, 132–34,
160–68, 173. See also adaptation to
climate change
Mitlin, D., 131
Mobility 2001 (World Business Council for
Sustainable Development), 130
Mobility 2030 (World Business Council for
Sustainable Development), 130
Mogeiro Plaza (São Paulo), 116b
Mombasa (Kenya)
religious organizations in, 87
sea level and, 19
social networks in, 54
Mooca neighborhood (São Paulo), 246
Morocco, public transport in, 133
Moser, Caroline, 9, 127, 128, 131
Mozambique, urban upgrading in, 161–62
MTF study, 201
Mtoni solid-waste dumpsite (Dar es
Salaam), 46, 184
MultiCat Program, 109
Multi-Hazard City Risk Index (MHCRI),
145–46
multilateral development banks (MDBs),
105–8, 110
Multilateral Investment Guarantee
Agency, 110
Mumbai (India)
“chawls” in, 30
disaster-management plan in, 51
fl oods in, 40, 142
houses in, 54
informal settlements in, 52b
slums in, 28, 32, 34
water supply in, 42
Munich Re Group, 143
Municipal Climate Law (Brazil), 262, 263–64
Municipal Development Project
(World Bank), 161
Mysore (India), water effi ciency
project in, 166
My Th o (Vietnam), urban upgrading in, 167
N
Nagoya (Japan), fl oods in, 143
Nam Dinh (Vietnam), urban upgrading
in, 167
NAPA (National Adaptation Programme of
Action, Tanzania), 189
NAP-DRR. See National Action Plan for
Disaster Risk Reduction
NASA, volunteer technology community
participation of, 173
NatCat database, 143
National Action Plan for Disaster Risk
Reduction (NAP-DRR, Indonesia),
207, 208, 210
National Adaptation Programme of Action
(NAPA, Tanzania), 189
National Autonomous University of Mexico
(UNAM), 218
National Capital Region (Delhi), 48
National Community Empowerment
Program (PNPM, Indonesia), 88, 214
National Disaster Management Prevention
Strategy (Bangladesh), 88
National Emergency Management Agency
(Brazil), 244, 261
National Environmental Act (Tanzania), 185
National Environmental Policy (Tanzania),
185, 188
National Human Settlements Development
policy (Tanzania), 188
National Hygiene Department (Senegal), 163
National Spatial Research Institute
(Brazil), 255
National Trust for Infrastructure
(Mexico), 107b

290 ■ INDEX
National Urban Upgrading Programs
(VUUP, Vietnam), 166–67
Natural Disaster Hotspots: A Global Risk
Analysis (Dilley et al.), 131
Natural Hazards, UnNatural Disasters
(World Bank and UN), 9
Neglected Tropical Diseases (NTDs), 185
Netherlands, fl ood exposure in, 143
New Orleans, fl oods in, 142, 143
New York City
action plans in, 68–69b
Climate Change Adaptation Task Force,
68–69b
fl oods in, 142, 143
urban planning in, 70
NGOs. See nongovernmental organizations
Nicaragua, microfi nance in, 120
Nicholls, R. J., 82, 131, 195
Nigeria, slums in, 40–41
Ningbo (China), Multi-Hazard City Risk
Index for, 145
NMBG, Ltd., 145
noncommunicable diseases, 49, 59n14
nongovernmental organizations (NGOs)
basic services delivery and, 39, 40
community organizations and, 162–63
disaster response and, 51
environmental health interventions
and, 92
Jakarta case study and, 200–201, 209, 214
mapping and data gathering and, 157
microfi nance and, 119
risk assessment and, 65
risk identifi cation and, 156
São Paulo case study and, 237, 262
security of tenure and, 52
urban poor and, 86
water distribution and, 117,
118–19b, 121
North Africa
climate change adaptation in, 102
disaster management in, 50
Norway, climate change and, 190–91
NTDs (Neglected Tropical Diseases), 185
NUDEC (Local Emergency Management
Group, São Paulo), 244, 261
O
O’Brien, G., 128
Olvera, Lourdes Diaz, 130–31
Operation Clean Stream (São Paulo), 265
Orangi Pilot Project Research and Training
Institute (OPP-RTI), 163–64
Organisation for Economic Co-operation
and Development (OECD), 128,
141–43, 144
Osaka-Kobe (Japan), fl oods in, 142, 143
Ouagadougou (Burkina Faso), solid-waste
disposal in, 46
output-based aid (OBA), 120
“owner-driven development,” 171
Oxfam, 51
P
Pakistan
basic service delivery in, 39
capacity building in, 87
fl ooding in, 8, 173
water supply and sanitation in, 163–64
PALYJA (water utility), 121
Panama, drawdown options in, 170
Parikh, H., 129–30
Parikh, P., 129–30
Paris
climate model projections for, 82
heat waves in, 20
Parkinson, J., 130
Parque La Aguada (Santiago), 75–76
partial credit guarantee (PCG), 110
Peduzzi, P., 131
Pelling, Mark, 131
Pemprov (Provincial Government,
Jakarta), 200
Penataan dan Pengawasan Bangunan
(Jakarta Building Control and
Monitoring Offi ce), 212
PET (plastic pluviometers), 245
Philippines
cyclones in, 17
fl ood management in, 75
grass roots organizations in, 155–57
housing fi nance in, 120
informal settlements in, 40, 41t
local partnerships in, 91
public transport in, 133
technical assistance programs in, 154
Philippines Homeless People’s Federation
(PHPF), 91, 155–56
Phnom Penh (Cambodia), fl oods in, 44–45
Pilot Project Research and Training
Institute, 87
Planning Secretariat (São Paulo), 255

INDEX ■ 291
Plan Verde (Green Plan), 222, 223
plastic pluviometers (PET), 245
PNPM (Program Nasional Pemberdayaan
Masyarakat, Indonesia), 88, 214
“Pobreza Urbana y Cambio Climático
para la Ciudad de Mexico” (Mexico
City case study document), 217
Port-au-Prince (Haiti)
rebuilding in, 107
roads in, 47
port cities, 141–43, 142t. See also coastal
areas and cities
Porte Alegre (Brazil), housing program
in, 105
Port Vila (Vanuatu), potable water in, 117
Poverty and Climate Change: Reducing
Vulnerability of the Poor through
Adaptation (World Bank et al.),
127–28
poverty and poverty reduction. See also
pro-poor programs
disaster reduction and, 128–29
literature review of, 128–31
pro-poor adaptation and, 127
PPPs (public-private partnerships), 116–17
“preventive advocacy” approach to health
services, 92
private sector fi nancing, 115–20
PRODEL (Local Development
Program), 120
program experiences. See project and
program experiences
Program Nasional Pemberdayaan
Masyarakat (PNPM), 214
project and program experiences, 149–80
building-back-better, 170–73
community-based institutions
and, 171–72
Volunteer Technology Communities
and, 172–73
early-warning systems, 158–60
asset security improvement, 159–60
dialogue promotion and response
coordination, 158–59
knowledge sharing and training, 151–54
Asian Cities Climate Change
Resilience Network (ACCRN),
153–54
Climate Resilient Cities Primer, 154
ICLEI and, 153
ISO 31000, 154
least developing countries, capacity
strengthening of, 153
lessons learned and recommendations
from, 173–76, 174–76t
mitigation, 160–68
carbon revenues and, 165–66
community organizations, NGOs, and
government agencies, 162–63
fl ood management and urban planning,
160–63
government–civil society partnerships
and, 163–64
government support and, 160–61
job creation and, 167–68
natural disasters, reducing vulnerability
to, 167–68
neighborhood upgrading and, 166–67
urban adaptation and climate mitigation,
164–65
urban upgrading and, 161–62
wastewater management and energy,
164–65
water supply and energy effi ciency,
165–66
water supply and sanitation, 163–64
risk defl ection, 168–70
disaster-induced emergency
funding, 170
insurance, self and community-based, 168
post-disaster relief and reconstruction,
169
risk fi nancing, 170
risk management innovation,
168–69
risk identifi cation, 155–58
grass roots organizations and, 155–57
Local Resilience Action Plan
(LRAP), 155
mapping and data gathering, 157–58
risk management, 151, 152f, 168–69
property formalization, 189
Pro-Poor Adaptation to Climate Change in
Urban Centers (World Bank),
125–26, 133
pro-poor programs, 127, 191, 209, 209t,
246. See also poverty and poverty
reduction
Protecting Health from Climate Change
(World Health Organization), 130
Provincial Government (Pemprov,
Jakarta), 200

292 ■ INDEX
public-private partnerships (PPPs),
116–17, 133
Public Safety Agency (Mexico City), 224
Public Security Ministry (Mexico City), 226
Q
Quelimane City (Mozambique)
local partnerships in, 91–92
urban upgrading in, 161–62
Quelimane City Council (Mozambique), 162
Quito (Ecuador)
climate change strategy in, 72–73
urban planning in, 70
R
“raft culture” techniques, 190
rainwater-harvesting systems, 53
Random Hacks of Kindness (RHoK), 173
RBF (results-based fi nancing), 120–21
reconstruction projects, 170–73
Red Cross, 51, 159
REDD+ aff orestation, 73
Regional Administration and Local
Government Ministry (Tanzania), 86
Regional Greenhouse Gas Initiative
(US), 117b
“rent allowance,” 87
rent control, 29, 58n3
research centers and universities, 89
Resettlement and Monitoring Task
Force, 156
resilience for urban poor. See urban poor,
building resilience for
Resilient Cities program (World Bank), 145
results-based fi nancing (RBF), 120–21
reverse 911, 88
RHoK (Random Hacks of Kindness), 173
Rio de Janeiro (Brazil), landslides in, 19
risk assessment. See disasters and disaster
risk assessment
Risk Atlas, 227
risk defl ection, 168–70. See also disaster
risk reduction
risk identifi cation, 155–58. See also disasters
and disaster risk assessment
risk-management instruments, 108–10,
111–14t
roads, 46–47. See also transportation sector
robust decision making, 83–86, 85b
Rockefeller Foundation, 153
Roots and Shoots (organization), 190
Rotterdam (Netherlands)
fl oods in, 143
sea defense strategy and, 212
urban planning in, 70
runoff reduction, 75
S
SABESP (São Paulo State Sanitation
Utility), 263
Safer Homes, Stronger Communities (Jha), 131
safety nets, 88
SAGUA-PAC (Bolivian cooperative), 165
St. Kitts & Nevis, risk fi nancing in, 170
Saint Louis (Senegal), community
organizations and NGOs in, 162–63
St. Lucia, risk fi nancing in, 170
St. Vincent & the Grenadines, risk
fi nancing in, 170
salt-water intrusion, 19
Sanchez-Rodriguez, Roberto, 128
sand-bagging, 51
San Francisco, natural hazard risk in, 143
sanitation. See also drainage
climate mitigation and, 164–65
disaster risk and, 41–44, 43b, 44f
service delivery and, 129–30
water supply and, 163–64
San Salvador (El Salvador), slums in, 132
Santa Cruz de la Sierra (Bolivia), climate
mitigation in, 164–65
Santiago de Chile
emissions trading systems in, 117b
fl ood management in, 75
Santiago Inner Ring Initiative, 75
São Francisco Global Urban Plan, 264
São João Landfi ll (São Paulo), 237
São Paulo (Brazil), 235–68
administrative units in, 86
carbon-fi nance revenues in, 115, 116b
case study summary, 11, 239–67
built environment and basic services,
242–44
carbon credits, 265
carbon footprint, 266–67
city profi le, 239–40f, 239–42, 240t
climate hazards, 248–49, 248f
climate issues and policy approach,
263–64
climate projections, 249–51, 250t
climate smart practices, 260–62
constraints, 262–63

INDEX ■ 293
disaster-related programs or
decrees, 245
disaster risk management, 244–46
Ecofrota Program, 264
greenhouse gas emissions, 237,
243f, 267f
hazards assessment, 246–54, 252–53t
hazards exposure, 251–57, 256f
Headwaters Program, 265–66
institutional assessment, 244–46
legal framework, 263
linear parks, 244, 246, 260–61, 265
natural disasters, 246–47, 247t
Operation Clean Stream, 265
opportunities, 263–66
poverty, addressing, 261–62
pro-poor services, 246
São Francisco Global Urban Plan, 264
slum characteristics, 257–60
Social Partnership Program, 266
social vulnerability index, 241f, 257
socioeconomic assessment,
254–67, 254t
solar water systems, 264–65
sustainable building projects, 265
transport fl eet, 264
transport use, 242, 243f, 244
urban poor, location of, 257, 258f,
259t, 260t
Climate Summit for Mayors and, 9
geotechnical hazard areas in, 35b
landslides in, 19
metro in, 104
overview and key fi ndings, 235–38
areas for improvement, 237–38
government at work, 237
looking forward, 238
risk assessment and management in,
65, 87, 122
sanitation in, 42
slums in, 33–34b, 34
topography and waterways of, 7f
São Paulo Housing Secretariat, 235
São Paulo Secretaria Municipal de
Planejamento (SEMPLA), 255
São Paulo State Sanitation Utility
(SABESP), 263
Satterthwaite, David, 131
Satuan Tugas Koordinasi dan Pelaksana
(SATKORLAK, Indonesian disaster
risk management board), 206–7, 208
Save the Children Fund, 51
Save the Marikina River program, 75
sea-level rise, 1f, 3f, 17, 19, 82, 83–84
security of tenure
basic services delivery and, 39
slums and, 28
urban poor, vulnerability of, 51–53
SEHAB. See City Housing Secretariat
semaforos ambientales (environmental
traffi c lights), 169
SEMPLA (São Paulo Secretaria Municipal
de Planejamento), 255
Senegal, community organizations and
NGOs in, 162–63
Seoul (Korea), fl ood management
in, 76
service delivery
carbon revenue and, 165–66
disaster risk and, 38–51, 64, 86–89
literature review and, 129–31
policy tradeoff s of, 77
public-private partnerships and, 133
results-based fi nancing for, 121
urban poor and, 129–31
sewage. See sanitation
Shanghai (China), fl oods in, 142
Shaping Climate Resilient Development—
A Framework for Decision-making
(ECA), 133
Shared Learning Dialogue (SLD), 154
shelter. See housing
SLD (Shared Learning Dialogue), 154
Slum Networking Project “Parivartan,” 119
slums. See also informal settlements;
squatter settlements
community organization partnerships
in, 94
disasters and, 51
formation of, 29–30, 58n2
inner-city, 29
peri-urban, 30, 47
policy tradeoff s and, 77, 81
prevention of new, 76
public-private partnerships and, 117
public transportation and, 47
risk assessment for, 87
scattered pockets, 29–30
social networks in, 53–54
upgrading of, 100, 102–3, 104, 107, 119
urban planning and, 70
water supply to, 33, 118–19b

294 ■ INDEX
SME (City Education Secretariat, São
Paulo), 263
SMS messages, 91, 94b, 208
Social Assistance Institute (Mexico City), 224
Social Development Agency (Mexico
City), 224
Social Dimensions of Climate Change
(Mearns & Norton), 127, 133
social networks, 51, 53–54
Social Partnership Program (São Paulo), 266
Social Vulnerability Index, 257
solar water systems, 264–65
solid-waste disposal, 33, 45–46. See also
sanitation
South Asia
cyclones in, 17
drowning in, 18
safe water in, 8
slums in, 37–38b
urban populations in, 12
volcanoes in, 20
Spain
building design in, 82
fl ood management in, 75
Spatial Analysis of Natural Hazard and
Climate Change Risks in Periurban
Expansion Areas of Dakar, Senegal
(Hoff man), 131
SPDMI (Strategic Plan for Disaster Mitigation
in Istanbul), 71–72
Special Capital District (DKI, Jakarta),
200–201, 204, 207, 210, 212, 214
Special Climate Change Fund, 134
Special Fund for the Environment and
Sustainable Development, 237
Special Interest Areas, 34b
Special Report on Emissions Scenarios
(SRES), 194
SP Trans (São Paulo), 264
squatter settlements. See also informal
settlements; slums
eviction and, 39
fl ooding of, 37b
public transportation and, 47
slums and, 29–30, 58n4
solid-waste disposal in, 37–38b
SRES (Special Report on Emissions
Scenarios), 194
stakeholders
action plans and, 68–69b
risk assessment and, 64, 65, 67b
Stanford University, 145
State of the World: Our Urban Future
(World Watch Institute), 9, 125–26,
127, 129, 131, 168
State of the World’s Cities (UN-HABITAT), 131
Stern Report (2007), 134
Strategic Plan for Disaster Mitigation in
Istanbul (SPDMI), 71–72
Strategic Urban Development Plan
(SUDP), 188
Sub-Saharan Africa
drought in, 20
safe water in, 8
SUDP (Strategic Urban Development
Plan), 188
Summer Rainfall Operation (São Paulo),
87, 244, 245
Sustainable Building Project (São Paulo), 265
Sustainable Dar es Salaam Project, 188
SVMA. See Green and Environment
Secretariat
Swisscontact, 215
T
Tampa-St Petersburg (Florida), fl oods
in, 143
Tan Hoa-Lo Gom Canal (Vietnam), 167
Tanzania. See also Dar es Salaam
cholera in, 48–49
urban planning in, 160–61
Tanzania Marine Park authorities, 190
Tanzania Meteorological Agency (TMA),
182, 184, 188
taxes
government revenues through, 104
insurance and, 168–69
TCIP (Turkish Catastrophic Insurance
Pool), 169
technical assistance programs, 107, 108t,
121, 154
Technological Research Institute (IPT),
251, 252, 254–55
Temeke municipality (Dar es Salaam), 42
tenure, security of. See security of tenure
text messages. See SMS messages
Th ailand
Asian Cities Climate Change Resilience
Network in, 154
housing fi nance in, 120
public transport in, 133
TMA. See Tanzania Meteorological Agency

INDEX ■ 295
Tokyo (Japan)
emissions trading systems in, 117b
fl oods in, 143
natural hazard risk in, 143
Toronto (Canada)
urban planning in, 70
wet weather fl ow master plan in,
73–74
Traffi c Engineering Company (CET), 255
Train Management Agency (CPTM, São
Paulo), 242
TransJakarta Busway, 205
transportation sector
climate change mitigation and, 133
disaster risk and, 46–47
low-carbon urban programs in, 107b
policy tradeoff s and, 81
urban poor and, 130–31
Tra Vinh (Vietnam), urban upgrading in, 167
Trinidad & Tobago, risk fi nancing in, 170
Tunis (Tunisia), action plans for, 102
Turkey
disaster management in, 50
post-disaster relief and reconstruction
in, 169
Turkish Catastrophic Insurance Pool
(TCIP), 169
Turks & Caicos Islands, risk fi nancing
in, 170
Typhoon Frank (2008), 91, 156
U
UBS (basic health units), 245
Uchoraji na Ramani na Sanaa Shirikishi
Dhidi ya Ukimwi (URASU), 190
UNAM (National Autonomous University
of Mexico), 218
uncertainty in risk reduction, 81–84
UNEP. See United Nations Environmental
Programme
UNFCCC. See United Nations Framework
Convention on Climate Change
UN-HABITAT
on housing, 131
local partnerships and, 92
risk assessment and, 65, 66b
slum estimates by, 58n2
urban upgrading and, 161–62
UNICEF, 92, 162
United Kingdom Climate Impacts
Programme, 74
United Nations
on climate change, 128
cook stoves and, 48
United Nations Environmental Programme
(UNEP), 65, 66b, 105, 127, 149
United Nations Framework Convention on
Climate Change (UNFCCC), 110,
115, 134, 188, 189, 237
United States
emissions-trading schemes in, 117b
fl ood exposure in, 143
migration to, 168
universities and research centers, 89
University of Dar es Salaam, 182
URA. See Urban Risk Assessment
URASU (Uchoraji na Ramani na Sanaa
Shirikishi Dhidi ya Ukimwi), 190
Urban Development and Housing Agency
(Mexico City), 224
Urban Flood Prevention and Drainage
Project (Argentina), 159
urbanization
cities. See urbanization; urban poor,
building resilience for; urban poor,
vulnerability of
climate change and, 125–27
earthquake exposure and, 144
exposure and, 141–47
policy tradeoff s and, 81
urban poor, building resilience for, 8, 63–97.
See also urban poor, vulnerability of
basic services delivery and disaster risk
reduction and, 64, 86–89
capacity building and, 89, 90t
successful examples of, 87–89
decision making and action planning,
64–70
action planning and, 65, 68–69b, 68–70
risk assessment and, 64–65, 66–67b
key messages, 63
local solutions, cooperation for, 64,
89–94
risk reduction and poverty reduction,
64, 76–86
climate sensitivity and, 82–83, 83t
decision making and, 81, 83–86,
84–85b
policy tradeoff s and, 77–81, 78–80t
uncertainty and, 81–84
urban planning and management and,
64, 70–76

296 ■ INDEX
urban poor (continued)
climate change adaptation in
London, 72
climate change mainstreaming in
Halifax, 73
climate change strategy in Quito, 72–73
disaster risk reduction in Istanbul, 71–72
green infrastructure and ecological
services and, 74–76
risk planning in Jakarta, 74
wet weather fl ow master plan in
Toronto, 73–74
urban poor, vulnerability of, 8, 27–62. See also
urban poor, building resilience for
ad hoc adaptation and risk of
maladaptation, 53, 55–57, 56–57t
disaster risk and basic services delivery,
38–51, 41t
drainage, 44–45
emergency services, 49–51
energy, 47–48
public and environmental health, 48–49
roads and transport, 46–47
shelter, 39–41
solid waste, 45–46
water supply and sanitation, 41–44,
43b, 44f
employment and fi nancial security, 53
key messages, 27
location and settlement patterns
and, 28–38
density and morphology, 34–37
inner-city slums, 29
peri-urban slums, 30, 47
scattered slum pockets, 29–30
site conditions and, 34–38
slum formation, 29–30, 58n2
spatial contiguity and size and,
30–34
security of tenure, 51–53
social networks, 53–54
Urban Research Symposium (2009), 130
Urban Risk Assessment (URA), 65, 66b, 182,
200, 217, 235
Urban/Town Planning and Settlement laws
(Tanzania), 185
Urban Transport Transformation Program
(Mexico), 105, 107b
Urban Wastewater Methane Gas Capture,
164–65
USAID, 119, 190
V
Varzeas Tietê River Linear Park (São Paulo),
246, 260–61, 265
Via Parque (São Paulo), 261
Vietnam
action plans in, 68–69b
Asian Cities Climate Change Resilience
Network in, 154
Climate Resilient Cities Primer
in, 154, 155
public transport in, 133
urban upgrading in, 166–67
Virginia Beach, fl oods in, 143
Virtual Center on Climate Change for
Mexico City (CVCCCM), 88, 218
Visayas (Philippines), risk identifi cation
in, 156
volcanoes, 19–20
Volunteer Technology Communities
(VTCs), 87, 172–73
VUUP (National Urban Upgrading
Programs, Vietnam), 166–67
W
Wamsler, Christine, 132, 168
wastewater management, 164–65.
See also sanitation
WaterAid, 92, 162
waterfront communities, 69b. See also
coastal areas and cities
water supply and distribution
disaster risk and, 41–44, 43b, 44f
energy effi ciency and, 165–66
Mexico City case study and, 222–23
public-private partnerships and, 117
results-based fi nancing and, 121
sanitation and, 163–64
service delivery and, 129–30
slums and, 33, 118–19b
solar, 264–65
water truckers, 42
Water System of Mexico City, 224
water truckers, 42
West Africa, precipitation in, 83
West Nile Virus, 20
Wet Weather Flow Master Plan, 74
Wikipedia, 172
Wildlife Society for Nature Conservation, 190
women
awareness raising and, 163
grassroots groups and, 150

INDEX ■ 297
health impacts of climate change
on, 126
heat waves and, 20
reconstruction projects and, 172
risk management and, 169
working groups for risk assessment, 67b
World Bank
carbon fi nance and, 115
Carbon Partnership Facility, 115
catastrophe bond programs from, 109, 109b
on climate change, 125, 126–28
Climate Resilient Cities Primer, 154
Community Development Carbon Fund
and, 166
cook stoves and, 58n10
Dar es Salaam case study and, 182
on fi nance instruments, 134
fi nancing from, 103, 107, 107b, 108t,
121, 197
greenhouse emissions analysis
by, 106b
on “hotspot” cities, 131–32
on housing, 131
Jakarta case study and, 200, 212
job creation programs and, 168
local partnerships and, 92
methane gas capture projects and, 165
Mexico City case study and, 217
partial credit products from, 110
poverty ranking by, 259
poverty reduction and, 214
reconstruction projects, 171, 172
Resilient Cities program, 145
risk assessment and, 65, 66b
risk fi nancing and, 169
sanitation and, 130, 164
São Paulo case study and, 235
on transportation sector, 130, 133
urban development and, 107
Urban Flood Prevention and Drainage
Project, 159
on urban poverty, 128–29
urban upgrading and, 161–62, 166
Volunteer Technology Communities and,
172–73
World Bank Climate Finance Options, 105
World Bank Group, 9, 105
World Business Council for Sustainable
Development, 130
World Development Report (World Bank)
2004: Making Services Work for Poor
People, 130
2009: Reshaping Economic Geography, 130
2010: Development and Climate Change,
9, 125, 126–27, 128
World Disasters Report: Focus on Urban Risk
(IFPC), 9
World Health Organization, 130
World Vision, 190
World Watch Institute, 9, 125–26,
127, 131, 168
World Wildlife Fund (WWF), 144, 190
Y
Yahoo, volunteer technology community
participation of, 173
Yusuf, A.A., 131
Z
zoning regulations, 81


Climate Change, Disaster Risk, and the Urban Poor analyzes the key challenges facing the urban poor, given the risks associated with climate change and disasters.
Through evidence and case studies from a number of cities—such as Dar es Salaam, Jakarta, Mexico City, and São Paulo—the book identifi es key strategies that cities can pursue to build resilience for their vulnerable populations. These strategies are based on diffi cult policy decisions that must balance tradeoffs among risk reduction, urban development, and poverty reduction.
Policy makers, researchers, practitioners, and students will fi nd the book’s analysis robust and comprehensive, and abundant with global examples of policies and programs that have been implemented at the city level—including a review of fi nancing options for local governments.
“Cities are highly vulnerable to the impact of climate change. As a result, mayors and other urban leaders around the world are identifying risks, exchanging best practices, and developing action plans to address the challenges we face. This includes studying and exploring ways to protect our urban poor populations, who are at particular risk. The World Bank’s study Climate Change, Disaster Risk, and the Urban Poor is an important resource for cities such as Mexico City as we make and implement decisions to counter the impact of our changing climate”
Marcelo Ebrard Casaubon, Mayor of Mexico CityChair, World Mayors Council on Climate
“For the fi rst time in history, the majority of the world’s population lives in cities. This study makes a critical contribution for mayors, international organizations, and national governments as we work together to overcome climate change and build resilient cities in a way that directly addresses the needs of the urban poor. By having the right strategies, we can ensure that we not only solve the world’s environmental problems, but we also build a society that works for all.”
David Miller, Mayor of Toronto (2003–2010)Chair of C40 (2008–2010) Counsel, International Business and Sustainability, Aird&Berlis LLP
ISBN 978-0-8213-8845-7
SKU 18845