E756 - World Bank Documents
19
DRAFT ENVIRONMENTAL ASSESSMENT REPORT (EXECUTIVE SUMMARY) E756 Volume 1 ~~. . - Prepared by Naresh Tankhiwale, JVR Murty, PPMU and GSDA April 15, 2003 FILE COPY JAL SWARAJYA MAHARASHTRA RURAL WATER SUPPLY AND ENVIRONMENTAL SANITATION PROJECT MAHARASHTRA RURAL WATER SUPPLY AND ENVIRONMENTAL SANITATION PROJECT Public Disclosure Authorized Public Disclosure Authorized Public Disclosure Authorized Public Disclosure Authorized Public Disclosure Authorized Public Disclosure Authorized Public Disclosure Authorized Public Disclosure Authorized
-
Upload
khangminh22 -
Category
Documents
-
view
0 -
download
0
Transcript of E756 - World Bank Documents
DRAFT
ENVIRONMENTAL ASSESSMENT REPORT(EXECUTIVE SUMMARY)
E756Volume 1
~~. . -
Prepared by
Naresh Tankhiwale, JVR Murty, PPMU and GSDA
April 15, 2003 FILE COPYJAL SWARAJYA
MAHARASHTRA RURAL WATER SUPPLY ANDENVIRONMENTAL SANITATION PROJECT
MAHARASHTRA RURAL WATER SUPPLY AND ENVIRONMENTALSANITATION PROJECT
Pub
lic D
iscl
osur
e A
utho
rized
Pub
lic D
iscl
osur
e A
utho
rized
Pub
lic D
iscl
osur
e A
utho
rized
Pub
lic D
iscl
osur
e A
utho
rized
Pub
lic D
iscl
osur
e A
utho
rized
Pub
lic D
iscl
osur
e A
utho
rized
Pub
lic D
iscl
osur
e A
utho
rized
Pub
lic D
iscl
osur
e A
utho
rized
ENVIRONMENTAL ASSESSMENT
EXECUTIVE SUMMARY
1.0 PreambleMaharashtra is located in the Western India and has a total population of about 96.7 mn asper the 2001 census data. Out of this 55.7mn (58%) people,reside in rural areas and 41 mn(42%) reside in urban areas. The State is sub-divided into 35 districts and 353 talukas.Two of the districts are urban districts and the remaining 33 are rural districts. The ruralpopulation resides in 40,785 villages and 45,528 habitations.Despite implementing various programmes at a cost of Rs 166, 000 mn (USD 3,320 mn)till date for providing potable water supply to the rural communities, more than 26% of thehabitations do not have assured supply of adequate potable water. Besides many morehabitations face scarcity during summer months and depend of tanker supplies. The mainreasons for this situation are:
* Non-involvement of communities in planning and management* No focus on capacity building of communities to own and manage infrastructure* Use of standard engineering designs and lack of technology options for varying
needs* No focus on source protection and augmentation* Focus on physical infrastructure building rather than delivering water in a
sustainable manner
Based on these lessons learnt, the Government of Maharashtra (GOM) has adopted a'reform policy' across the state in the rural water and sanitation sector in the year 2000 andis the only State in India to do so. The reform policy is based on the pnnciples advised bythe Government of India's (GOI) Sector Reform Programme. The key principles of theGOM's reform policy are (i)community ownership and management of water supplyfacilities (ii) strengthening of decentralized service delivery and management through thePanchayati Raj Institutions (PRI) and (iii) long term sustainability of the services throughappropriate technical and management options that involve,local communities. This policyearmarks a radical departure from the past policies and programmes that were centralizedand supply led and did not involve communities in any manner.
2.0 Project Setting:2.1 Rationale for the projectOut of the 33 rural districts four are supported by Government of India's (GOI) SectorReforms Programme (SRP) and three are supported by KfW for water supply only. TheGOI is supporting the GOM for implementation of Total Sanitation Campaign (TSC) in allthe districts. However, these programmes are for a limited period (3-4 years) and do notcover the water and sanitation issues in an integrated manner. Secondly, these programmesdo not incorporate provisions for state wide sector strengthening and experiment withother related initiatives (like over all PRI capacity building etc). Thus, GOM lacksadequate resources to implement water supply programmes in remaining 26 rural districts,strengthen the intuitional capacity across the state and pilot innovative approaches likeintegrated water resource management by communities. Therefore, GOM approached theWorld Bank to support the statewide implementation of the reform policy in a holisticmanner.

2.2 Project Objectives and ScopeThe objectives of the project are:(i) Increase rural community's access to improved and sustained drinking water
and sanitation services, and(ii) Decentralise RWSS service delivery to Panchayati Raj Institutions (PRIs).
The project is designed to cover about 3730 GPs (out of 20,753 GPs in these 26 districts),selected on a composite set of criteria based on poverty level, water scarcity andpreparedness of the GPs in 26 districts over a 6-year period. Selection of water supplysource would be demand driven guided by water quantity, quality as well as capital andO&M costs. However, considering the cost effectiveness and easy accessibility, theproject envisages more demand for groundwater source than distant surface water sourceexcept where adequate and acceptable quality water is not available. A total investment ofapproximately Rs.15,000 mn (USD 300 mn) is estimated of which 10% of the hardwarecost of approximately Rs. 1200 mn(USD 240 mn) would be contributed by thebeneficiaries. In addition, 100 % O&M cost would be contributed by the beneficiaries.Activities taken up under the pilot project from May 2002 onward till signing of theProject would be eligible for retroactive finance. As agreed with the World Bank mission,the proposed project is proposed to be one in a series of dovetailed RWSS projects.
2.3 Project ComponentsThe following are the key project components.
2.3.1. Community Development and Infrastructure: This component has the followingsub-components.2. 3.1.1 Community Development: The capacity of the community would be built forundertaking participatory planning, project execution and taking care of the O&M of theservices Support Oragnisations and District Facilitation team would provide necessarycapacity building to members of GP, VWSC and other para-professionals in the village.2.3.1.2 Women Empowerment Fund: This aims at skill development of poor women asidentified in the gender strategy and providing access to credit, through an empowermentfund, to improve their livelihoods.2.3.1.3 Community Water Supply Infrastructure: The project aims to financeimproved drinking water supply facilities in about 3730 GPs. The community wouldshare 10% of the capital cost and 100% of the O&M cost, based on the option chosen bythem.2.3.1.4 Personal Hygiene, Household and Environmental Sanitation: The projectwould support the GOM's new strategy aimed at encouraging the communities toeliminate the practice of open defecation and adopt safe sanitation and hygiene practices.Besides, school sanitation, lane improvements, drains, soak pits, garbage and compost pits,and IEC for hygiene behaviour would be promoted.
2.3.2 Institutional Strengthening: The following are the sub-components.2.3..2.1 PRI and State Agencies Capacity Building: In order to experiment with theconcept of empowering the PRls to address development needs beyond WSS, pilotswould be undertaken to build the overall management capacity of about 150 GPs andthree ZPs which will demonstrate outstanding performance in the implementation of the
water supply and sanitation component of the project.2.3.2.2 IEC: The Development Communication strategy would focus on institutional aswell as behaviour change relating to sanitation and hygiene, practices.
2
2.3.2.3 Monitoring and learning: The M&L system would enable the management teamto regularly monitor the progress of the project, capture the key lessons and disseminatethe learning to all the stake holders2.3.3 RWS Sector Strengthening: This component would support GOM to strengthen itscapacity for implementing sector reforms across the state and improve the overallmanagement of the sector. The sub-components are: knowledge management system,piloting of integrated ground water aquifer management in six identified watersheds andwater quality monitoring.
2.4 Project period and phasing: The project is designed to be implemented over a periodof 6 years during 2003-2009. All physical activities would be implemented during the firstfive years and the last year would focus on sustainability issues. The project intends tocover 450 GPs in three districts during the first year, 900 GPs in 6 districts in 2ndyear, 900GPs in 6 districts in the third year, 900 GPs in 6 districts in fourth year and 580 GPs in 5districts during the 5th year of the project thus totalling 3730 GPs .
3.0. Baseline Environmental Status3.1. Water Quantity issues3.1.lGroundwater Potential and Extraction: The Groundwater Survey andDevelopment Agency (GSDA), a nodal agency for groundwater planning anddevelopment in the State, has classified the State into 1505 watersheds and 2415 sub unitsbased on irrigated and non-irrigated areas and estimated the groundwater potential.
Based on the stage of ground water development and pre and post monsoon water leveltrends, out of 1766 watershed subunits in the project area 1428 (81%) subunits are safe.Out of the remaining, 69 (4%) sub units are over exploited, 40 (2%) sub units are critical,170 (10%) sub units are semi-critical and in 59 (3%)sub units (3%) quality of groundwateris saline and unsuitable for drinking and irrigation .
The current availability of total water resources in the state is estimated as 154137MCM/year (70% surface water and 30% ground water). The total utilisation by all thesectors in the state is estimated as 39484 MCM/year, being 26% of the total waterresources available. Out of this rural drinking water consumes only 1062 MCMIyear. It isestimated that by year 2030 the total water demand would go up to 103704 MCMIyear,being 67% of the available resources. However out of this, the demand for rural drinkingwater is estimated at 1943 MCM/year 2.
Secondly, the total groundwater availability in the state is 46454 MCM/year out of whichavailability in the project area is estimated at 28751 MCM/year. The total current annualextraction of groundwater in the project area is estimated at 7768.91 MCM/year,being27% of the utilizable recharge. Out of this 7095.87 (91%) MCMIyear is for irrigation andonly 673.04 MCM/year (9%) is for drinking purpose3 . The demand for drinking water inthe project areas in the year 2030 is projected to be 1373 MCM/year (as against 673MCM/year in 2002).
' Provisional revised groundwater assessment by GSDA and CGWB, 2002.2 Analysis carried out by GSDA using the data from the Second Maharashtra Water and Irrigation Commission,1999 and the Provisional revised groundwater assessment by GSDA and CGWB, 20023 Provisional revised groundwater assessment by GSDA and CGWB, 2002
3

However, the GSDA's trend analysis in the project area indicates that water tables aredeclining in over 68 talukas located in 19 districts over the last ten years4. If the currenttrend of over-extraction of groundwater, especially for irrigation purposes, continueswithout any control there could be a possibility that out of the total demand of 1373
MCM/year in 2030 only about 1263 MCM water per year could be available for drinking
purposes in these districts5. The GOM would educate the community about betterirrigation practices, balanced use of groundwater resources for competing demands and
also conservation of groundwater through IEC. While the irrigation related IEC does notform part of this project, the WSSD would liaison with the irrigation and agriculturedepartments for necessary coordination. Secondly, the project plans to address this very
issue of holistic water resources management by the communities on a pilot basis in sixselect watersheds. The lessons learnt during these pilots would be useful in scaling up the
approach to all the watersheds in the state.
Thus, it can be concluded that through scientific planning and judicious use of available
water resources by different sectors, availability of water for human consumption in rural
Maharashtra would not be a constraint.
3.1.2. Impact of Sugarcane Irrigation: About 18.8% (6,99,200 ha) of the total irrigatedarea (37,19,149 ha) in the State is under sugarcane and is over irrigated. About 50% of this
(349, 600 ha) falls under project area, mainly concentrated in Kolhapur, Sangli, Satara,
Nashik, Latur, Beed, Osmanabad and Solapur districts. Excessive irrigation and use of
chemical fertilisers for sugarcane has led to progressive decline of groundwater tables andcontamination of groundwater at shallow depths with Nitrates, thus deteriorating the
groundwater quality. The GOM would educate the farming community about the use of
appropriate irrigation measures (such as drip irrigation, sprinklers etc) and also use oforganic fertilisers through IEC. However, this IEC is beyond the scope of the project and
WSSD would liaison with the Irrigation and Agriculture departments for the same.
3.1.3. Surface water: Total surface water availability in five major river basins covering
the project area is estimated at 107683 MCM/year of which present utilization is 30635.67MCM/year (28.5%). Per capita availability of surface water is lowest in Tapi river basin
(477 cubic meters/year) and highest in Konkan sub basin (3497 cubic meters per year).
3.2. Water Quality issues: Ground water Quality in the State particularly in shallowacquifer is generally good and potable. However, in certain areas concentration ofFluoride, Nitrate, Iron, and salinity due to exposure to rocks is higher than permissiblelimit.
3.2.1.Fluoride: Chemical analysis of water samples from wells and bore wells by GSDA,
CGWB, PHD and NEERI shows that in project area, ground water in parts of 52 talukas in17 districts has higher concentration of fluoride than permissible limits and most of the
affected areas are in Yavatmal, Chandrapur, Satara, Beed, and Solapur districts.
Based on data of water table monitoring by GSDA and CGWB between 1992-2002 and the also the Hydrologyproject data5 Provisional revised groundwater assessment by GSDA and CGWB, 2002 This analysis indicates a 'worstcase' scenario for some parts of the 68 talukas in the 19 districts, if the current irrigation practices continue Insuch a scenario, the GOM would allocate an additional I 10 MCM/year (the projected shortage) for drinkingwater purposes, curtailing other uses, as drinking water has the first priority for water usc in both the nationaland state policies
4

Concentration of fluoride is more in deeper aquifers tapped by bore wells than at shallowdepths. GOM is in the process of developing a strategy to address fluoride related issues,with assistance from Water and sanitation Programme-South Asia (WSP-SA). The WSP-SA consultants have reviewed the prevailing field situation in four districts: Yavatmal,Chandrapur, Nagpur and Nanded (excepting Nanded all the three are project areas) and arein the process of formulating their recommendations. A brainstorming session would beorganised to discuss the recommendations and agree upon on the broad strategycomponents during May/ June 2003. These components would then be detailed toformulate the state wide strategy by July 2003. After that the strategy would beimplemented through out the state, including the project area.
3.2.2.Nitrate: High concentration of Nitrate in groundwater is reported mainly in Sangli,Solapur, Satara, Nagpur, Yavatmal, Bhandara, Beed, Osmanabad, Thane and Parbhanidistricts due to excess application of chemical fertilizer in large areas irrigated underpaddy, sugarcane, banana, cotton, orange and grape. The excess use of chemical fertilisersleads to concentration of nitrate in groundwater at shallow depths. Secondly, compostingof solid waste and cow dung close to the water sources also leads to concentration ofnitrates in shallow water tables. Despite high concentration of nitrates, no case of bluebaby syndrome is yet reported in any part of the state. As explained in 3.1.2 above, theWSSD would liaise with the irrigation and agriculture departments to educate the farmersabout using organic fertilisers. Secondly the project EC' would educate the communityabout safe methods (including site selection) of composting solid waste.
3.2.3. Salinity: Salinity in groundwater is observed in 3 different areas of the State (i) Tapi-Puma river alluvium (ii) Water logged areas in the canal command , and (iii) Coastal areasGroundwater in the areas covering southern parts of Puma alluvium in Amravati (Daryapur,parts of Achalpur and Anjangaon talukas) Akola (parts of Akot, Akola, Murtizapur andTelhara taluka), Buldhana (Nandura, Khamgaon and Mehkar talukas) have high salinity,making it unfit for drinking purpose. The villages in this zone are supplied drinking waterfrom safe surface water sources. Intervention through rainwater harvesting would also beundertaken.
3.2.4.Iron: High concentration of iron is present in groundwater in Ratnagiri, Chandrapur,Sindhudurg, Gadchiroli, Bhandara, Solapur, Nagpur, and Kolhapur districts due to highiron mineral in the geological formations. In areas where iron content is high ingroundwater, storing water before use and allowing it to settle has reduced its impact. Theiron contamination has no severe health impact except for some occasional stomachdisorders.
3.2.5. Bacteriological Contamination: Sampling of drinking water sources by PHDacross the State indicates contamination of about 32% sources over last three years i.e.2000-2002. As per PHD reports an average 1.2 million (1.2%) people are affected everyyear and about 350 people die due to bacteriological contamination of drinking water.However, the trend analysis of attacks and deaths due to water borne diseases between1997 and 2002 indicate a progressive decline, due to intensive IEC undertaken under theSant Gadge Baba Campaign. The IEC covered safe sanitation practices and protection ofdrinking water sources from contamination and chlorination of water.The prevailing unsafe sanitation practices of open defecation and not washing hands is amajor cause for the bacteriological contamination and diseases. The project wouldundertake intense IEC to encourage communities to shift over from the practice of open
5
defecation to safe sanitation and adopt safe sanitation practices such as hand washing.Other environmental sanitation intervention like drains, solid waste management wouldalso contribute to the reduction of diseases. Further, the community would be trained toregularly check the water quality, either directly or through PHC (using field test kits) andregularly chlorinate the water as per need.
3.3.Sanitation and Hygiene: Presently out of 1 lmn rural families about 2.46 mn havebeen provided latrines by GOM under different programs. However, while about 22.5% ofrural families have access to latrines only about 11.5% use the latrines and others continuethe practice of open defecation. Therefore the project aims at achieving zero opendefecation instead of focusing on 'latrine building'. Out of 53171 primary schools 27%have sanitary facilifies.
4.0.Policy and Legal FrameworkThe GOM adheres to the National Water Policy laid down by the government of India andgives first priority to drinking water supply over other water uses. Besides, Government ofMaharashtra has passed following Acts dealing with protection of Environment andnatural resources.* Maharashtra Act XVI of 1970 viz. Maharashtra Prevention of Water Pollution Act 1969* Maharashtra Act XLVIII of 1976 viz. Maharashtra Water Supply and Sewerage BoardAct 1976 (as amended twice).* Maharashtra Ground water (Regulation) Act 1993 for protecting drinking water wells.* Employment of Manual Scavengers and Construction of Dry Latrines (Prohibition) Act1993 prohibition to employ manual scavengers* Maharashtra Electricity Regulatory Commission Actl998 recommending lowerelectricity tariff charges for RWS Schemes* Bombay Police Act (punishment for spoiling environmental sanitation)
5.0.Public Consultations and issues identified: Public consultations were held in fourvillages in each of the five districts selected for the study. The issues emerging from thepublic consultations are as follows:
5.1.Water quantity and quality issues:* Adequate drinking water supply is not available in summer* Surface water supply also depletes during lean period.* In many places, drinking water sources are polluted and contaminated.* Lack of awareness about residual chlorine in water and use of chlorine tablets.* Quality of water is not regularly monitored.* During water scarcity period, beneficiaries are willing for dual water supply system
5.2.Household and environmental sanitation issues:* There was lack of individual latrines and practice of open defecation causesinconvenience, particularly to women.* Disposal of organic waste close to water supply source causes contamination.* Scarcity of water is cited as main reason for non-use of latrines.* Lack of sullage and storm water drains and soak pits causes environmental problems.
6

5.3.Personal health and hygiene:* Using polluted/contaminated water causes frequent attacks of diarrhoea, malaria,jaundice and other gastrointestinal problems.
6.0.Hot Spots and IssuesThe following is an analysis of hotspot areas.
6.1 Sanitation hotspots: Only 22 4% households have access to latrines. Only 27% ofprimary schools have sanitary facilities. In most of the villages disposal of sullage,wastewater, and cattle dung is improper. Thus, all the 26 districts in the project area fallunder hot spots category.
6.2 Water hotspots: For identifying water related hotspot areas the declining water tablesand presence of excess fluoride and TDS has been considered (TDS includes salinity also)as primary indicators. As presence of nitrates and iron in the drinking water did not haveany recorded health impact in the state they have not been considered as indicators forwater hotspot areas.
The taluka wise information has been plotted for the above three parameters, in Table Ibelow. The districts that have presence of any two parameters and more than 5 affectedtalukas have been prioritised a hot spot areas. Accordingly, the following 12 districts fallunder the category of hotspots: Akola, Beed, Buldhana, Clhandrapur, Jalgaon, Nagpur,Nashik, Sangli, Satara, Sinzdhdurg, Solapur, and Yavatmal. There are a total of 102affected talukas in these 12 clistricts.
A second level of analysis reveals that there are about 35 talukas in 15 districts (11 out ofthe above 12 (excepting Buldhana) and additional districts of Hingoli, Osmanabad,Ratnagiri and Thane) that have more than 2 indicators and thus qualify to be considered ashotspot talukas. However, it may be noted that not all the villages in these talukas/ districtsare affected.
A tertiary level of analysis would be required to identify exact hot spot villages. Specificcriteria would be identified and detailed information collected to identify exact hotspotvillages during the initial project period. PPMU would contract experienced consultantsfor this exercise.
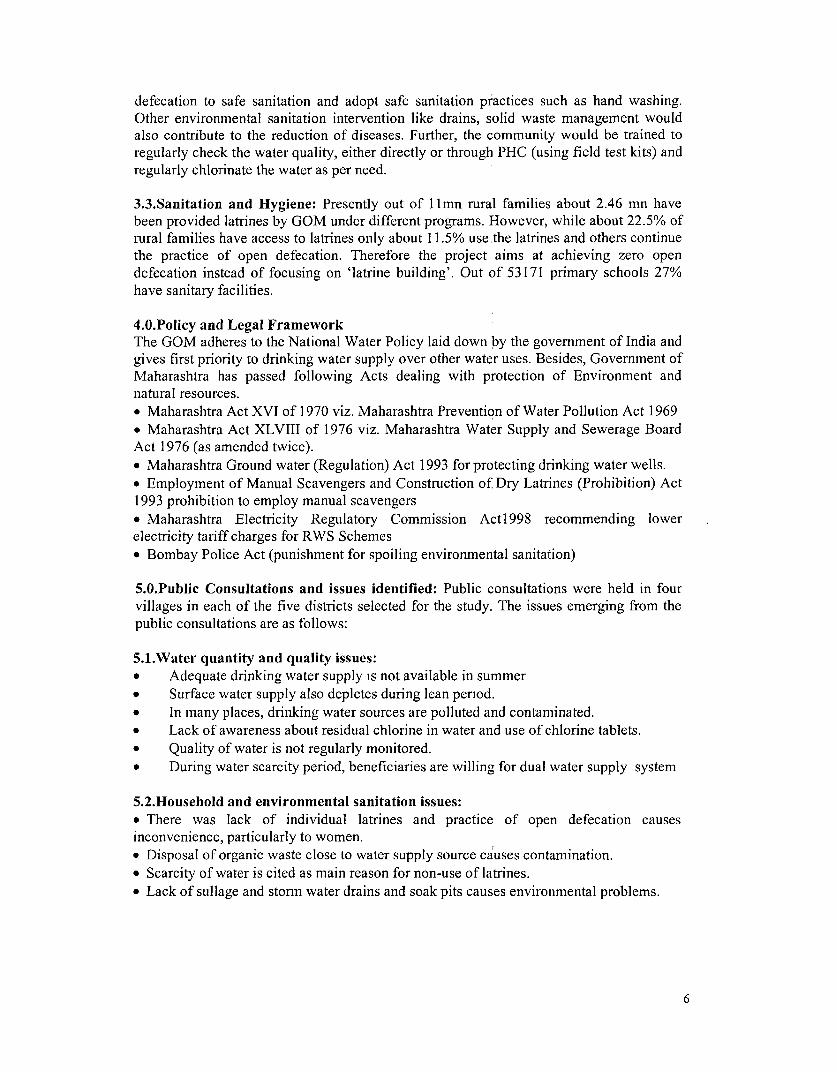
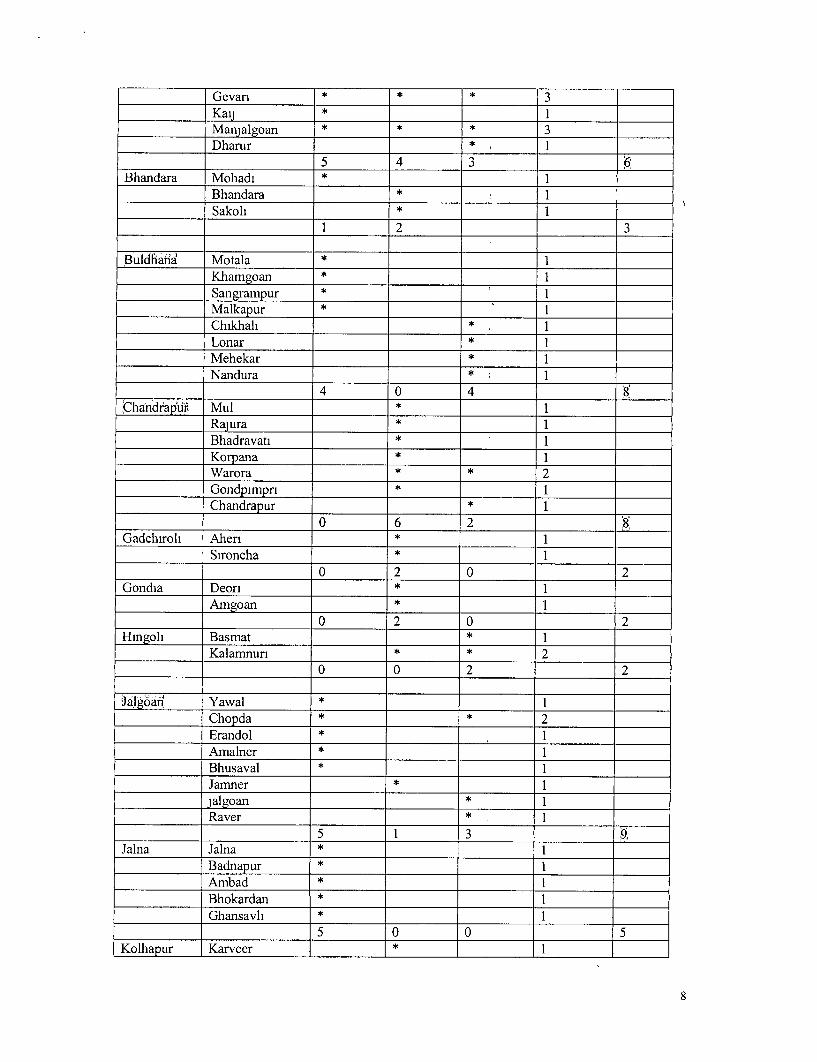
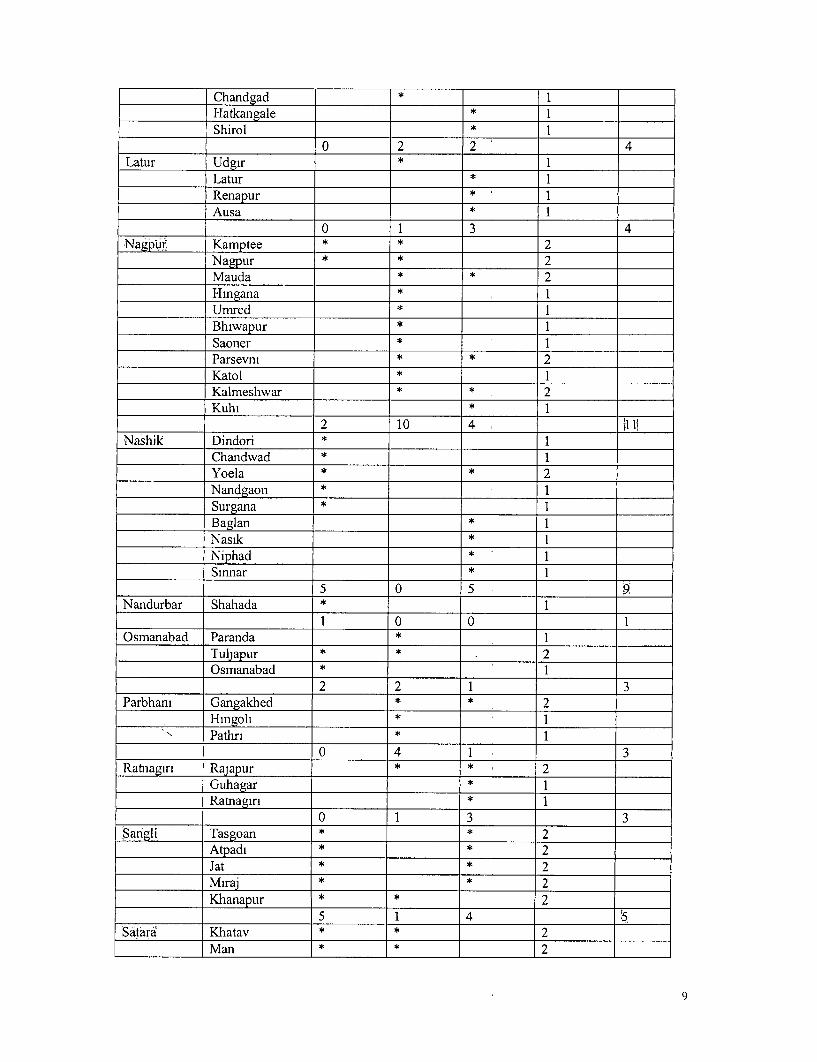
Table-1: Analysis of Water Quantity and Quality Hot Spots Districts:
Distnct Talukas Declining Fluonde TDS No of TotalWT (including parameters talukas
salinity
Akola Akola * * 2Akot * 1Telhara * 1Takali 1Balapur * IMurtizapur * 1Patur I
need _ eH4 0 4 .7BAeed Beed * 2
L __ ___ ___ ___ A shti **2 _ _ _ _
7
Gevari * 3Kaij * 1Manjalgoan 3Dharur * I
5 4 3Bhandara Mohadi * 1
Bhandara * 1Sakoh * I
1 2 3
Buldhaina Motala * 1Khamgoan ISangrampur * IMalkapur * 1Chikhali * 1
Lonar * 1Mehekar * 1Nandura * 1
4 0 4 SChandrap5ur Mul * 1
Rajura * 1Bhadravati * 1KorpanaWarora 2Gondpimpri * 1Chandrapur * 1
O 6 2 8Gadchiroh Aher * 1
Sironcha * 1O 2 0 2
Gondia Deori * 1Amngoan * I
O 2 0 2Hingoli Basmat * 1
Kalamnuri * * 2o 0 2 2
J n Yawal 1Chopda 2Erandol * 1Amalhner * 1Bhusaval * 1Jamnerjalgoan * 1Raver * 1
5 1 3Jalna Jalna * 1
Badnapur * 1Ambad *
Bhokardan * 1Ghansavh * 1
5 0 0 5Kolhapur Karveer * 1
8
Chandgad 1Hatkangale * 1Shirol I .
0 2 2 4Latur Udgir * I
Latur * 1Renapur * 1Ausa * 1
0 1 3 4Nagpur Kamptee 2
Nagpur * * 2Mauda * * 2Hingana * IUlmred * 1Bhiwapur 1Saoner * 1Parsevni * * 2Katol * 1Kalmeshwar * * 2Kuhi * 1
2 10 4lNashik Dindori * 1
Chandwad * 1Yoela * * 2Nandgaon * 1Surgana * 1Baglan * 1Nasik * 1Niphad * 1Sinnar * 1
5 0 5 9Nandurbar Shahada * 1
I 0 0Osmanabad Paranda I
Tuljapur * * 2Osmanabad * 1
2 2 1 3Parbhani Gangakhed * * 2
Hingol * I.N Pathri * 1
0 4 1. 3Ratnagin Rajapur * * 2
Guhagar * IRatnagiri * 1
_ _ _ _ _ _ _ _ _ _ _ __ 0 1 3 3Sangli Tasgoan 2
Atpadi * * 2Jat *2Miraj * * 2Khanapur * * 2
5 1 4 '5Satara Khatav * * 2
Man * * 2
9
Khandala 1Patan * 1Phaltan * * 2
3 4 1 SiindlidLurg Kudal 4 1 5
Vengurla * ISawantwadi * 2Malwan * * 2Kankavali 1
0 5 2 6Solapuir Barshi * * 2
Kannala * IMaishiras * IPandharpur 2N. Solapur * * 2Mangalwedha * * 2Madha * 1Sangole I* S. Solapur * 1
4 4 5 9;Thane Vasai 1
Dahanu *
Palghar *
Thane *
0 1 3 4Washim Balapur * 1
Manora * 1Risod * 1
1 0 2 3Wardha Ashti * 1
Karanja * 1Seloo * 1
3 0 0 3IYavatidnal Ner * * 2
Pusad * 1Umarkhed * 1Maregoan * * 2Digras * * 2Wani * 1Pandharkawada * 1Maregoan * * 2Darva *
Kelapur *
5 4 5 r0
Total 54 52 59 133Source: A synthesis of data from GSDA, CGWB, WSSD, NEERI, PHD, and 2000 to 2002.
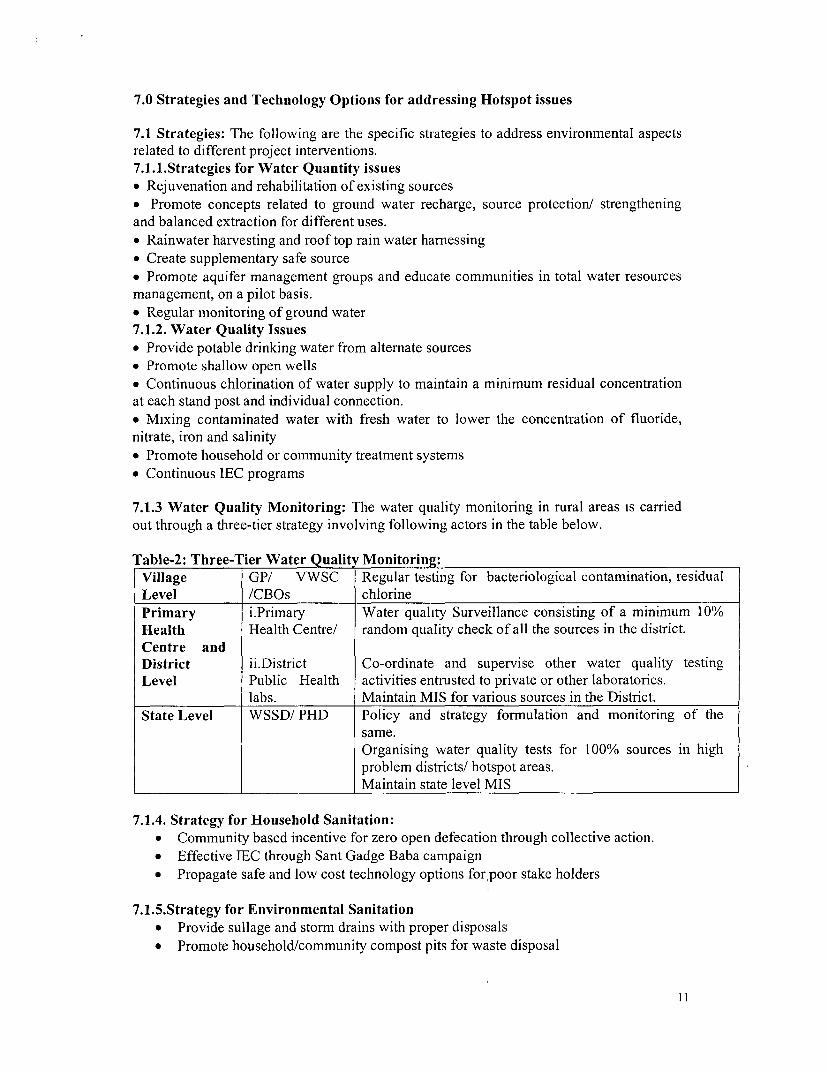
7.0 Strategies and Technology Options for addressing Hotspot issues
7.1 Strategies: The following are the specific strategies to address environmental aspectsrelated to different project interventions.7.1.1.Strategies for Water Quantity issues* Rejuvenation and rehabilitation of existing sources* Promote concepts related to ground water recharge, source protection/ strengtheningand balanced extraction for different uses.* Rainwater harvesting and roof top rain water harnessing* Create supplementary safe source* Promote aquifer management groups and educate communities in total water resourcesmanagement, on a pilot basis.* Regular monitoring of ground water7.1.2. Water Quality Issues* Provide potable drinking water from alternate sources* Promote shallow open wells* Continuous chlorination of water supply to maintain a minimum residual concentrationat each stand post and individual connection.* Mixing contaminated water with fresh water to lower the concentration of fluoride,nitrate, iron and salinity* Promote household or community treatment systems* Continuous IEC programs
7.1.3 Water Quality Monitoring: The water quality monitoring in rural areas is carriedout through a three-tier strategy involving following actors in the table below.
Table-2: Three-Tier Water Quality Monitoring:Village GP/ VWSC Regular testing for bacteriological contamination, residualLevel /CBOs chlorinePrimary i.Primary Water quality Surveillance consisting of a minimum 10%Health Health Centre/ random quality check of all the sources in the district.Centre andDistrict ii.District Co-ordinate and supervise other water quality testingLevel Public Health activities entrusted to private or other laboratories.
labs. Maintain MIS for various sources in the District.State Level WSSD/ PHD Policy and strategy formulation and monitoring of the
same.Organising water quality tests for 100% sources in highproblem districts/ hotspot areas.Maintain state level MIS
7.1.4. Strategy for Household Sanitation:* Community based incentive for zero open defecation through collective action.* Effective TEC through Sant Gadge Baba campaign* Propagate safe and low cost technology options for,poor stake holders
7.1.5.Strategy for Environmental Sanitation* Provide sullage and storm drains with proper disposals* Promote household/community compost pits for waste disposal

* Identify suitable sites away from drinking water source for disposal of excretavillage garbage and cattle dung
* Construct internal lanes and pavements* Effective IEC campaign for peoples participation and attitudinal change
7.2 Technology Options: Considering the nature, type and severity of the problems in theproject area, a menu of environmentally safe technology options for various quantity,quality, hygiene and environmental sanitation issues have been provided (refer Annexure-VII, VIII, IX and X in the main report for details). Further, appropriate 'TechnicalGuideline Manuals' are prepared to guide the process of selection, implementation andO&M for all the suggested technical interventions. The communities would select anappropriate option based on the technical need, capital cost, O&M cost, preference, andavailability of technology and skills in a demand driven approach.7.2.1 Technologies for Water Quality: The generic preferred technology options wheredrinking water in the existing sources is contaminated are: alternate safe source, use oflimited safe water for drinking and cooking and use of contaminated water for otherpurposes, dilution by adding low/ nil contamination water, domestic filter treatment andcommunity level treatment through appropriate technology. Besides these, the followingspecific technology treatment options are also available for specific contamination.
Fluoride:* Nalgonda Model (Complexion Method) and fill and draw defluoridation plant
technology* Dilution with low fluoride water* Roof Rain water harvesting structures to provide for drinking and cooking waterIron:
* Aeration of water and settling of the iron oxide sludge.Bacteriological:* Chlorination of water at source/ household as the case may be.
7.2.2 Groundwater Recharge: Various conventional and non-conventional measuressuch as check-dams, deepening/ de-silting of tanks in the former category and jacket wells,bore blast technique and fracture seal cementation in the later category. Selection of one ora combination of more than one technology depends on the local hydro-geologicalconditions.
7.2.3 Household Sanitation: A range of safe pit latrines varying from VIP to single pitpour flush to twin pit pour flush latrines shall be propagated. The household would choosea desired option based on local soil conditions, their preference, cost and ease ofavailability of materials and construction skills.
7.2.4 Environmental Sanitation: The technology options for solid and liquid waste are:Sullage drains, soak pits leach pits, open drains, household and community compostingpits, disposal of biodegradable wastes through Vermiculture for various regions.
8.0 Environmental Management Plan (EMP):Critical analysis of the baseline environmental data, feed back from the publicconsultations, information gathered through MIS for the, current schemes as well as theissues emerged during discussions with various functionaries and organizationsparticipating in the rural water supply program has brought out key environmental issuesthat need to be addressed along with mitigated measures while designing and
12
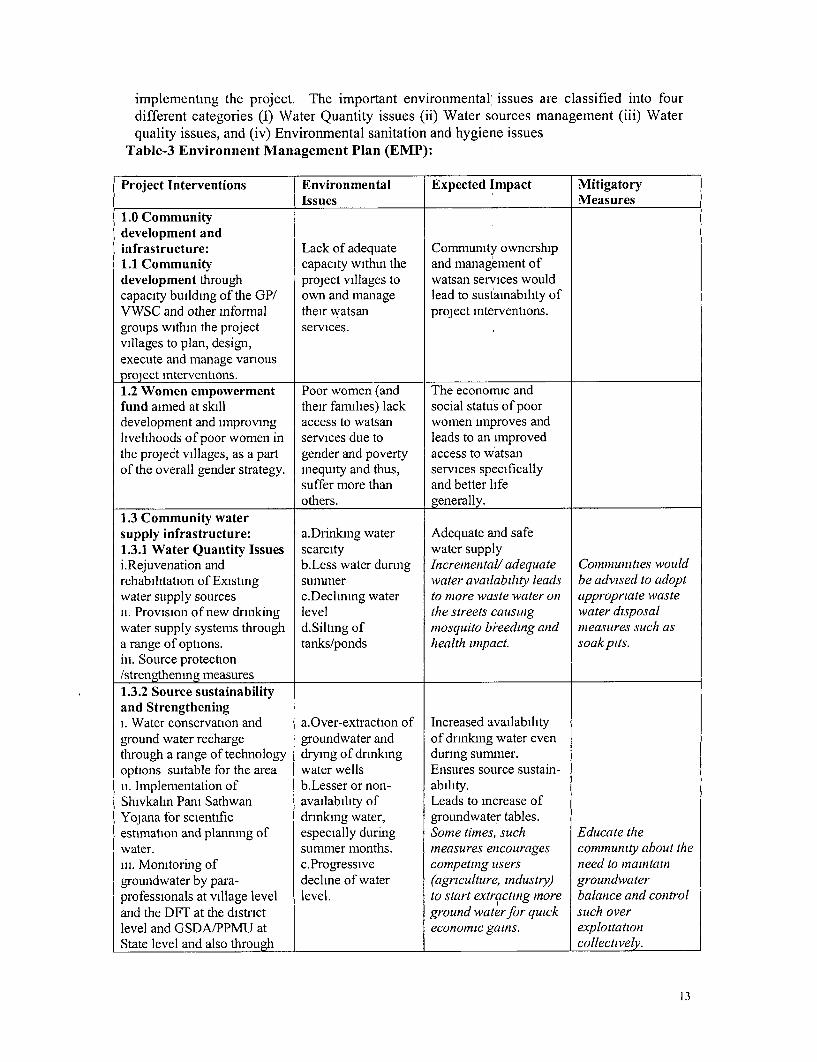
implementing the project. The important environmental issues are classified into fourdifferent categories (I) Water Quantity issues (ii) Water sources management (iii) Waterquality issues, and (iv) Environmental sanitation and hygiene issues
Table-3 Environnent Management Plan (EMP):
Project Interventions Environmental Expected Impact MitigatoryIssues Measures
1.0 Communitydevelopment andinfrastructure: Lack of adequate Con-inunity ownership1.1 Community capacity withm the and management ofdevelopment through project villages to watsan services wouldcapacity building of the GP/ own and manage lead to sustamability ofVWSC and other informal their watsan project interventions.groups within the project services.villages to plan, design,execute and manage variousproject interventions.1.2 Women empowerment Poor women (and The economic andfund aimed at skill their farmlies) lack social status of poordevelopment and improving access to watsan women improves andlivelihoods of poor women in services due to leads to an improvedthe project villages, as a part gender and poverty access to watsanof the overall gender strategy. inequity and thus, services specifically
suffer more than and better lifeothers. generally.
1.3 Community watersupply infrastructure: a.Drinking water Adequate and safe1.3.1 Water Quantity Issues scarcity water supplyi.Rejuvenation and b.Less water during Incremnentall adequate Communities wouldrehabilitation of Existing summer water availability leads be advised to adoptwater supply sources c.Dechning water to more waste water ont appropriate wasten. Provision of new drinkig level the streets causing water disposalwater supply systems through d.Silting of mosquito breeding and measures such asa range of options. tanks/ponds health impact. soak pits.iii. Source protection/strengthening measures1.3.2 Source sustainabilityand Strengtheningi. Water conservation and a.Over-extraction of Increased availabilityground water recharge groundwater and of drinking water eventhrough a range of technology drying of drinking during summer.options suitable for the area water wells Ensures source sustain-ii. Implementation of b.Lesser or non- ability.Shivkalin Pani Sathwan availability of Leads to increase ofYojana for scientific drinking water, groundwater tables.estimation and plannig of especially during Some times, such Educate thewater. summer months. measures encourages community about theni. Monitoring of c.Progressive competing users need to maintaingroundwater by para- decline of water (agriculture, industry) groundwaterprofessionals at village level level. to start extracting more balance and controland the DFT at the district ground water for quick such overlevel and GSDA/PPMU at economic gains. exploitationState level and also through collectively.
13
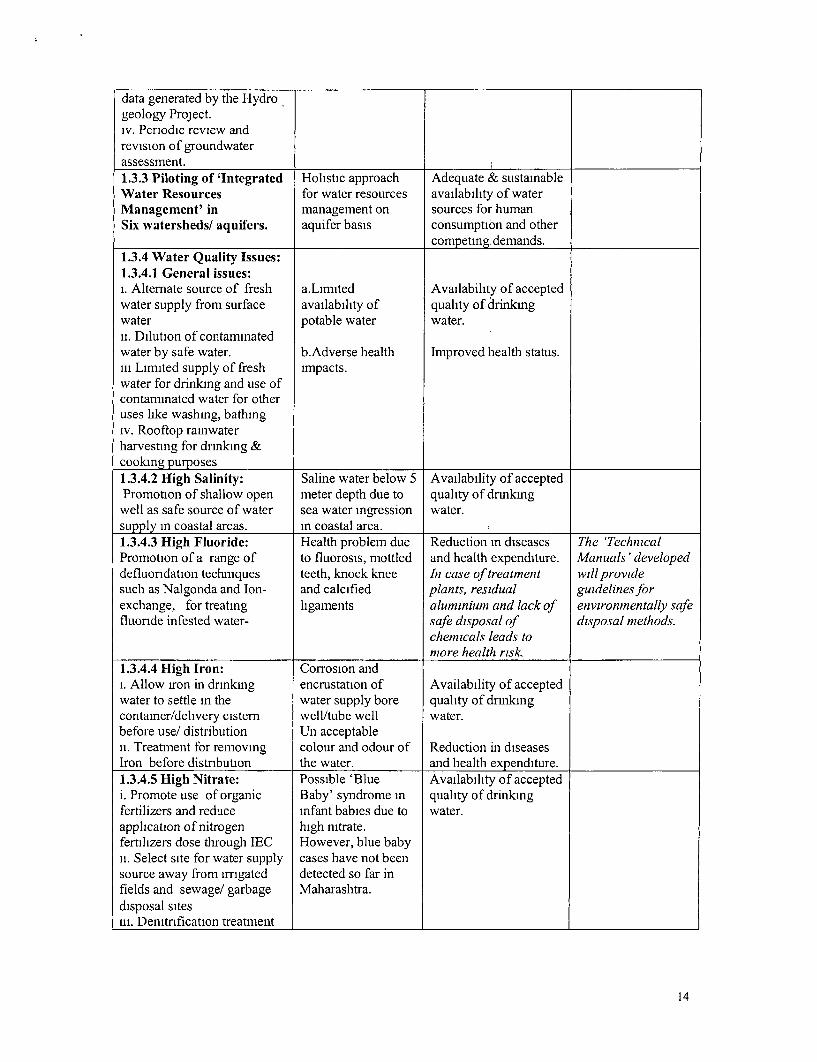
data generated by the Hydrogeology Project.iv. Periodic review andrevision of groundwaterassessment.1.3.3 Piloting of 'Integrated Holistic approach Adequate & sustainableWater Resources for water resources availability of waterManagement' in management on sources for humanSix watersheds/ aquifers. aquifer basis consumption and other
competig demands.1.3.4 Water Quality Issues:1.3.4.1 General issues:i. Alternate source of fresh a.Limited Availability of acceptedwater supply from surface availability of quality of drinkmgwater potable water water.ii. Dilution of contaminatedwater by safe water. b.Adverse health Improved health status.in Limited supply of fresh impacts.water for drinking and use ofcontammated water for otheruses like washing, bathingiv. Rooftop rainwaterharvesting for drinking &cooking purposes1.3.4.2 High Salinity: Saline water below 5 Availability of acceptedPromotion of shallow open meter depth due to quality of dnnking
well as safe source of water sea water ingression water.supply in coastal areas. in coastal area.1.3.4.3 High Fluoride: Health problem due Reduction in diseases The 'TechnicalPromotion of a range of to fluorosis, mottled and health expenditure. Manuals 'developeddefluoridation techlilques teeth, knock knee In case of treatnent will providesuch as Nalgonda and Ion- and calcified plants, resiclual guidelines forexchange, for treating ligaments aluminium and lack of environmentally safefluonde infested water- safe disposal of disposal methods.
chemicals leads tomore health risk.
1.3.4.4 High Iron: Corrosion andi. Allow iron in drinkmg encrustation of Availability of acceptedwater to settle in the water supply bore quality of drmkingcontamer/delivery cistern well/tube well water.before use/ distribution Un acceptableii. Treatment for removing colour and odour of Reduction in diseasesIron before distribution the water. and health expenditure.1.3.4.5 High Nitrate: Possible 'Blue Availability of acceptedi. Promote use of organic Baby' syndrome in quality of drinkingfertilizers and reduce infant babies due to water.application of nitrogen high nitrate.fertilizers dose through IEC However, blue babyii. Select site for water supply cases have not beensource away from irrigated detected so far infields and sewage/ garbage Maharashtra.disposal sitesiii. Denitrification treatment
14

1.3.6 BacteriologicalContamination:i. Continuous chionnation of High incidences of Availability of acceptedwater supply to maintain attack of diarrhoea, quality of drinkingminimum residual chlorine hepatitis, cholera, water.ii. IEC for locating various gastro and typhoidliquid and solid waste due to contaminated Reduction m diseasesdisposal/ treatment systems water and health expenditure.away from water sources.iii. Promotion of waterquality monitoring byconiniunity, especiallywomen, children and youth.
1.4 Personal hygiene,Household Sanitation andenvironmental sanitation:1.4.1 HH sanitation:i. Intense IEC for attitudinal a.Large scale Creates clean sanitationchanges practice of open and hygiene conditionsii. 100% stopping of open defecation. in the habitation.
defecation and adopting othersafe sanitation practices.iii. Community latrines for b.Contammation of Reduction mwomen/ men to be water sources due to contamnuation ofconstructed as a last option in open defecation drinking water sourcesthe process of elimination of causes health and disease burden.open defecation hazards.1.4.2 School water supplyand sanitationi. Safe Sanitation complexes Lack of water Instil good hygiene andwould be provided in all the supply and toilets in sanitation habits amongschools as per need along school leads to un- children.with assured water supply. hygienic leaming Lack ofproper Build the capacity ofii. Impart hygiene education atmosphere. maintenance of newly the community!to school children for created sanitary school to properlybehavioural changes facilities exposes maintain facilities
childrent to greater providedhealth risk.
1.4.3 Env. sanitation1.4.3.1 Waste Wateri. Promote safe and Lack of sullage a.Brings cleanliness inappropriate sullage drains, drams leads to village.soak pits, kitchen gardens and problem of ponding b.Protects dnnkinglane improvements as of water and piling water source.appropriate. of sullage become c.Reduces incidence of
breeding places for vector diseases.mosquitoes
1.4.3..2 Solid Wastei. Promote waste disposal inpits away from water supply Unhygienic and in- Creates sanitary andsource. sanitary conditions hygienic livingii. Promote composting cattle Contamination of enviromnent in thedung/ household solid waste surface and habitation. _
15
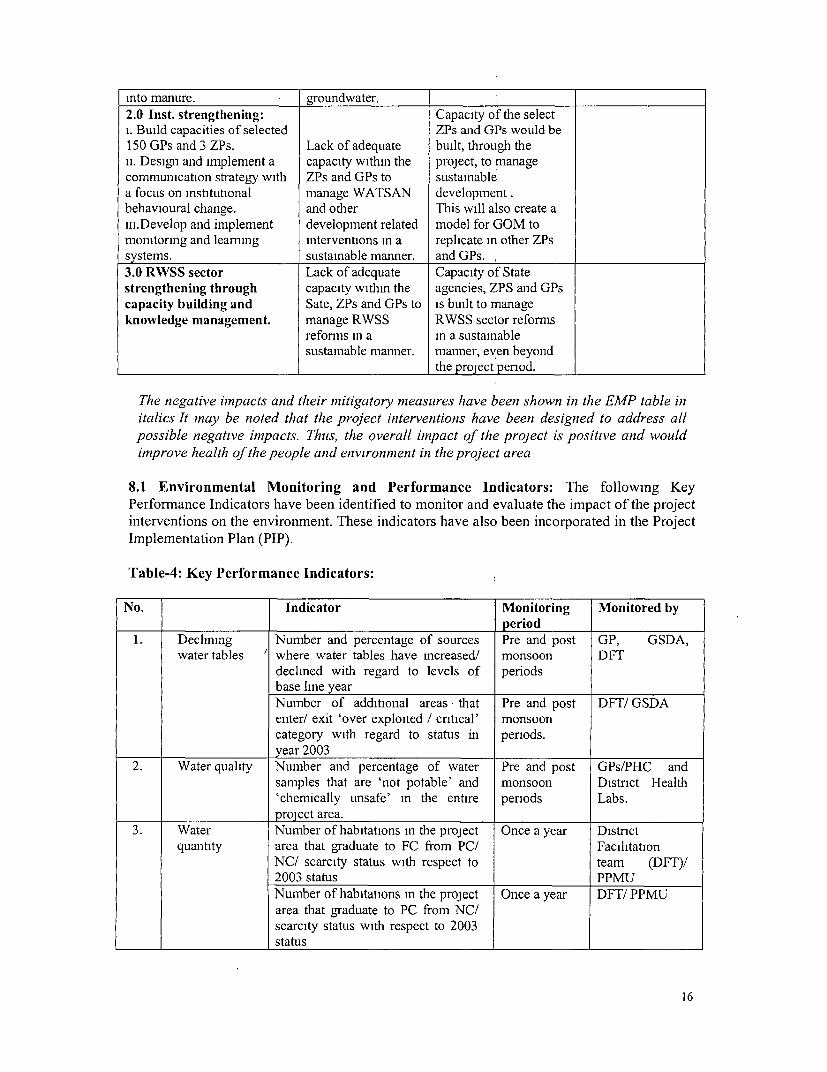
into manure. groundwater.2.0 Inst. strengthening: Capacity of the selecti. Build capacities of selected ZPs and GPs would be150 GPs and 3 ZPs. Lack of adequate built, through theii. Design and implement a capacity within the project, to managecommunication strategy with ZPs and GPs to sustainablea focus on institutional manage WATSAN development .behavioural change. and other This will also create ani.Develop and implement development related model for GOM tomonitoring and leammg interventions in a replicate in other ZPssystems. sustainable manner. and GPs. ,3.0 RWSS sector Lack of adequate Capacity of Statestrengthening through capacity within the agencies, ZPS and GPscapacity building and Sate, ZPs and GPs to is built to manageknowledge management. manage RWSS RWSS sector reforms
reforms m a in a sustainablesustainable manner. manner, even beyond
the project period.
The negative impacts anid their mzitigatory measures have beeni shown in the EMP table initalics It may be noted that the project interventions have been designed to adldress allpossible negative impacts. Thus, the overall inmpact of the project is positive and wouldimlprove health of the people anid environment in the project area
8.1 Environmental Monitoring and Performance Indicators: The following KeyPerformance Indicators have been identified to monitor and evaluate the impact of the project
interventions on the environment. These indicators have also been incorporated in the Project
Implementation Plan (PIP).
Table-4: Key Performance Indicators:
No. Indicator Monitoring Monitored byperiod
1. Declining Number and percentage of sources Pre an1d post GP, GSDA,water tables ' where water tables have Increased/ monsoon DFT
declined with regard to levels of periodsbase line yearNumber of additional areas that Pre and post DFT/ GSDAenter/ exit 'over exploited / critical' monsooncategory with regard to status in penods.year 2003
2. Water quality Number and percentage of water Pre and post GPs/PHC andsamples that are 'not potable' and monsoon District Health'chemically unsafe' in the entire penods Labs.project area.
3. Water Number of habitations in the project Once a year Districtquantity area that graduate to FC from PC/ Facilitation
NC/ scarcity status with respect to team (DFT)/2003 status PPMUNumber of habitations In the project Once a year DFT/ PPMUarea that graduate to PC from NC/scarcity status with respect to 2003status
16
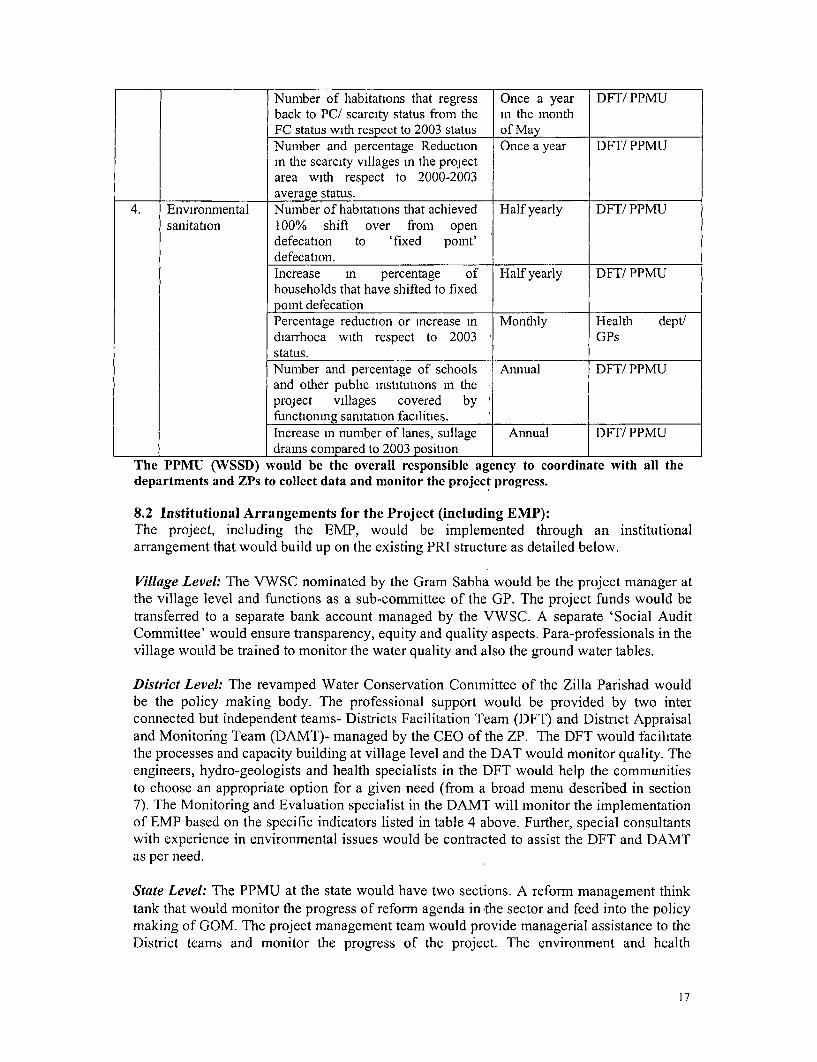
Number of habitations that regress Once a year DFT/ PPMUback to PC/ scarcity status from the in the monthFC status with respect to 2003 status of MayNumber and percentage Reduction Once a year DFT/ PPMUin the scarcity villages in the projectarea witd respect to 2000-2003average status.
4. Environmental Number of habitations that achieved Half yearly DFT/ PPMUsanitation 100% shift over from open
defecation to 'fixed point'defecation.Increase m percentage of Half yearly DFT/ PPMUhouseholds that have shifted to fixedpoint defecationPercentage reduction or mcrease m Monthly Health depttdiarrhoea with respect to 2003 GPsstatus.Number and percentage of schools Annual DFT/ PPMUand other public institutions in theproject villages covered byfunctionig sanitation facilities.Increase in number of lanes, sullage Anlual DFT/ PPMUdrains compared to 2003 position
The PPMU (WSSD) would be the overall responsible agency to coordinate with all thedepartments and ZPs to collect data and monitor the project progress.
8.2 Institutional Arrangements for the Project (including EMP):The project, including the EMP, would be implemented through an institutionalarrangement that would build up on the existing PRI structure as detailed below.
Village Level: The VWSC nominated by the Gram Sabha would be the project manager atthe village level and functions as a sub-committee of the GP. The project funds would betransferred to a separate bank account managed by the VWSC. A separate 'Social AuditCommittee' would ensure transparency, equity and quality aspects. Para-professionals in thevillage would be trained to monitor the water quality and also the ground water tables.
District Level: The revamped Water Conservation Committee of the Zilla Parishad wouldbe the policy making body. The professional support would be provided by two interconnected but independent teams- Districts Facilitation Team (DFT) and District Appraisaland Monitoring Team (DAMT)- managed by the CEO of the ZP. The DFT would facilitatethe processes and capacity building at village level and the DAT would monitor quality. Theengineers, hydro-geologists and health specialists in the DFT would help the communitiesto choose an appropriate option for a given need (from a broad menu described in section7). The Monitoring and Evaluation specialist in the DAMT will monitor the implementationof EMP based on the specific indicators listed in table 4 above. Further, special consultantswith experience in environmental issues would be contracted to assist the DFT and DAMTas per need.
State Level: The PPMU at the state would have two sections. A reform management thinktank that would monitor the progress of reform agenda in the sector and feed into the policymaking of GOM. The project management team would provide managerial assistance to theDistrict teams and monitor the progress of the project. The environment and health
17
specialists along with M&E specialist in the team would be responsible for monitoring theimplementation of the environment management plan.
Other Line Agencies: The GSDA would be responsible for tracking the ground watertrends through existing monitoring systems (state wide observation wells under the geo-hydrology project). The Public Health Department would continue to monitor the 'waterquality' on a sample basis through its existing laboratoriesland PHC structures. Besides, thePPMU would contract other agencies for special purpose works like testing of 100% watersamples in the districts, developing criterion for identifying hotspot villages, impactevaluations etc. Support Organisations (SOs) would also be contracted to work closely withthe villages and build their capacity and also help them in the project processes.
The DFT/ DAMT at the district level and the PPMU at the state level would be responsiblefor coordinating with these agencies, collect regular data/ information and utilise it in theproject implementation.
9.0 Budget for EMP:
All the project intervention components (community water supply infrastructure andpersonal hygiene, household and environmental sanitation) and staff positions at thedistrict level and environmental training related budgets for state, district and villages havebeen incorporated in the Project Implementation Plan (PIP). In addition the followingaspects are budgeted as supplementary environment budget in the EA.
* A new position of an 'Environment Specialist' at Project Planning andMonitoring Unit (PPMU) level.
* Specialist consultant for developing hot spot village selection criteria* Specialist consultants to help DFT and DAMT on a need basis.
28th April 2003
18