40521 - World Bank Documents
564
DIRECTIONS IN DEVELOPMENT Environment and Sustainable Development Environmental Priorities and Poverty Reduction A Country Environmental Analysis for Colombia Ernesto Sánchez-Triana, Kulsum Ahmed, and Yewande Awe, Editors 40521 Public Disclosure Authorized Public Disclosure Authorized Public Disclosure Authorized ublic Disclosure Authorized Public Disclosure Authorized Public Disclosure Authorized Public Disclosure Authorized ublic Disclosure Authorized
-
Upload
khangminh22 -
Category
Documents
-
view
0 -
download
0
Transcript of 40521 - World Bank Documents

D I R E C T I O N S I N D E V E L O P M E N T
Environment and Sustainable Development
Environmental Priorities andPoverty Reduction
A Country Environmental Analysis for Colombia
Ernesto Sánchez-Triana, Kulsum Ahmed, and Yewande Awe, Editors
40521
Pub
lic D
iscl
osur
e A
utho
rized
Pub
lic D
iscl
osur
e A
utho
rized
Pub
lic D
iscl
osur
e A
utho
rized
Pub
lic D
iscl
osur
e A
utho
rized
Pub
lic D
iscl
osur
e A
utho
rized
Pub
lic D
iscl
osur
e A
utho
rized
Pub
lic D
iscl
osur
e A
utho
rized
Pub
lic D
iscl
osur
e A
utho
rized


Environmental Priorities and Poverty Reduction


Environmental Priorities and Poverty ReductionA Country EnvironmentalAnalysis for Colombia
Ernesto Sánchez-Triana
Kulsum Ahmed
Yewande Awe
Editors

© 2007 The International Bank for Reconstruction and Development / The World Bank
1818 H Street, NWWashington, DC 20433Telephone: 202-473-1000Internet: www.worldbank.orgE-mail: [email protected]
All rights reserved.
1 2 3 4 10 09 08 07
This volume is a product of the staff of the International Bank for Reconstruction andDevelopment / The World Bank. The findings, interpretations, and conclusions expressed in thisvolume do not necessarily reflect the views of the Executive Directors of The World Bank or thegovernments they represent.
The World Bank does not guarantee the accuracy of the data included in this work.The boundaries,colors, denominations, and other information shown on any map in this work do not imply anyjudgement on the part of The World Bank concerning the legal status of any territory or theendorsement or acceptance of such boundaries.
Rights and Permissions
The material in this publication is copyrighted. Copying and/or transmitting portions or all of thiswork without permission may be a violation of applicable law. The International Bank forReconstruction and Development / The World Bank encourages dissemination of its work and willnormally grant permission to reproduce portions of the work promptly.
For permission to photocopy or reprint any part of this work, please send a request with completeinformation to the Copyright Clearance Center Inc., 222 Rosewood Drive, Danvers, MA 01923,USA; telephone: 978-750-8400; fax: 978-750-4470; Internet: www.copyright.com.
All other queries on rights and licenses, including subsidiary rights, should be addressed to theOffice of the Publisher, The World Bank, 1818 H Street, NW, Washington, DC 20433, USA;fax: 202-522-2422; e-mail: [email protected].
DOI: 10.1596/978-0-8213-6888-6
Cover photo: Courtesy of the World Bank Photo Library Cover: Naylor Design, Washington, DC
Library of Congress Cataloging-in-Publication DataSánchez-Triana, Ernesto.
Environmental priorities and poverty reduction: a country environmental analysis forColombia/Ernesto Sánchez-Triana, Kulsum Ahmed, and Yewande Awe.
p. cm.ISBN-13: 978-0-8213-6888-6ISBN-10: 0-8213-6888-5ISBN-10: 0-8213-6889-3 (electronic)
1. Colombia—Environmental conditions. 2. Environmental health—Colombia 3. Poverty—Colombia. 4. Industries—Environmental aspects—Colombia 5. Pollution—Colombia. 6. Indoorair pollution—Colombia. 7. Fuel—Health aspects—Colombia. I. Ahmed, Kulsum, 1964– II. Awe,Yewande. III. World Bank. IV. Title.
GE160.C7S36 2007363.7009861—dc22 2006036973

Foreword xixPreface xxiAcknowledgments xxiiiAbbreviations xxvLocal and Regional Environmental Authorities xxxiiiExecutive Summary xxxvii
Chapter 1 Overview 1Objectives of the Country Environmental Analysis 2CEA Process and Summary 3References 7
Chapter 2 A Unique Model for Environmental Management 9Institutional and Legal Foundations: 1952–74 10Expansion of Roles and Legal Frameworks:
1975–93 14The 1991 Constitution and Law 99 of 1993 17Consolidating Institutions, Regulations, and
Planning: 1994–2005 23Conclusions 27Notes 29References 31
Contents
v

Chapter 3 Actors and Institutions 33Environmental Information Systems 34SINA’s Finances 37The Ministry of Environment 39National Environmental Council and
National Technical Advisory Council 48National Planning Department 48Investigational Institutes 50National Parks System 52Public Participation 53Control Organizations 54Judiciary 55Conclusions and Recommendations 56Notes 61References 63
Chapter 4 Decentralization: A Balancing Act 67Overall Performance of CARs 68Allocation of CAR Resources and Priority Setting 71Sources of CARs’ Financial Resources 86Adequacy of Human and Technical Resources 91Sanitation Infrastructure 93Relationships between CARs and other
SINA Entities 95Conclusions and Recommendations 99Notes 105References 106
Chapter 5 Setting Environmental Priorities: Top Down and Bottom Up 109Annual Cost of Environmental Damage 110Costs by Environmental Category 111Water, Sanitation, and Hygiene 114Urban Air Pollution 125Indoor Air Pollution 129Agricultural Land Degradation 139Natural Disasters 144Perceptions of the Priority of Environmental
Problems 149Conclusions 152
vi Contents

Notes 153References 155
Chapter 6 Waterborne Diseases Remain Widespread 159Assessment of Policy Design, Efficiency, and
Effectiveness 161Analysis of Policy Implementation 170Analysis of Alternative Interventions 172Conclusions and Recommendations 194Notes 196References 197
Chapter 7 Improving Air Quality 201Air Quality Management 203Performance of the Air Quality Management
System 214Potential Interventions to Control Air Pollution 225Conclusions and Recommendations 241Notes 247References 249
Chapter 8 A Silent Killer: Indoor Air Pollution 251Acute Respiratory Illness in Colombia 253Health Effects of Indoor Air Pollution 255A Benefit-Cost Analysis Framework 255Stove Efficiency 261Fuelwood Consumption 263Cost of Interventions 264Benefit-Cost Analysis 265Sensitivity Analysis 271Effectiveness of Indoor Air Pollution
Control Programs 273Conclusions and Recommendations 276Notes 276References 277
Chapter 9 The Environmental Cost of Accelerated Urban Growth 279Urban Growth and Environment in Colombia 281Housing Policy: Main Environmental Difficulties
and the Government’s Response 284
Contents vii

viii Contents
Conclusions and Recommendations—Housing and Urban Development 291
Waste Management 295Background and Brief History 296Effectiveness of the Waste Management System 302Conclusions and Recommendations—Waste
Management and Urban Development 313Notes 317References 318
Chapter 10 Living with Natural Disasters 321Natural Disasters in Colombia: Occurrence
and Impacts 322Effectiveness of Policy Design 324Conclusions and Recommendations 347Notes 354References 355
Chapter 11 Water Management in a Water-Rich Country 357Water Quantity 359Degradation of Water Bodies 370Water Pollution Control 373Conclusions 382Recommendations 385Notes 387References 389
Chapter 12 Land Degradation and Deforestation 393Soil Erosion and Salinization: Magnitude and
Dimensions of the Problem 394Forests 413Conclusions and Recommendations 425Notes 427References 428
Chapter 13 Biodiversity Loss and Other Global Environmental Problems 433Biodiversity 434The National Protected Areas System 437The Policy for Social Participation in Conservation 441

Climate Change 453Ozone Depletion 456Conclusions and Recommendations 458Notes 462References 464
Chapter 14 Conclusions and Recommendations 469Tackling Environmental Priorities 478Conclusions 482Note 483References 483
Boxes2.1 Colombia’s National Environmental System 2011.1 Case Study of the Allocation of Water Resources in
the Bogotá Savanna 364
Figures2.1 Public Environmental Expenditure as a Percentage
of GDP in Argentina, Brazil, Chile, Costa Rica, Mexico,and Colombia 25
2.2 Expenditures of SINA Agencies, 1995–2003 265.1 Annual Cost of Environmental Damage 1105.2 Estimated Annual Urban Costs 1115.3 Estimated Annual Rural Costs 1125.4 Costs by Category 1125.5 Costs of Environmental Degradation (Health and
Quality of Life) 1125.6 Physical Costs by Category 1135.7 Number of Deaths by Category 1135.8 Deaths among Children, by Category 1135.9 Annual Costs of Insufficient Water, Sanitation,
and Hygiene 1145.10 Annual Costs by Category 1145.11 Annual Costs of Urban Air Pollution 1255.12 Annual Costs of Indoor Air Pollution 1305.13 Annual Costs of Agricultural Land Degradation 1395.14 Costs of Environmental Degradation
(Erosion and Salinity) 139
Contents ix

5.15 Estimated Annual Costs of Natural Disasters 1445.16 Top Priorities for Colombia According to Lowest
and Highest Income Groups 1515.17 Top Priorities for Households According to Lowest
and Highest Income Groups 1526.1 Proportion of DALYs Attributable to Unsafe Water Ranges 1626.2 Child Mortality and Water Network Coverage,
by Department, 2002 1646.3 Child Mortality and Urbanization, by Department, 2002 1656.4 Benefit-Cost Ratios of Rural Water Sanitation, Low Case 1836.5 Estimated Benefit-Cost Ratios for Handwashing,
by Degree of Program Effectiveness 1896.6 Benefit-Cost Ratios over Time for Handwashing for
Children under Age 5 (20 Percent Effectiveness Target) 1906.7 Benefit-Cost Ratios for Drinking Water Disinfection
Program, by Degree of Program Effectiveness 1926.8 Benefit-Cost Ratios over Time for Drinking Water
Disinfection Program (20 Percent Effectiveness Target) 1937.1 Mean Annual Concentration of PM10 in Cities 2027.2 Annual Health Cost of Urban Air Pollution 2287.3 Annual Cost of Damage by Emission Source,
Low Cost Estimate 2347.4 Annual Cost of Damage by Emission Source,
High Cost Estimate 2347.5 Damage Cost per Ton of PM10, Low Cost Estimate 2357.6 Damage Cost per Ton of PM10, High Cost Estimate 2358.1 Annual Costs of Indoor Air Pollution 2528.2 Proportion of DALYs Attributable to Indoor Smoke
from Solid Fuels 2538.3 ARI Prevalence in Children by Mother’s Education Level 2548.4 Stove Efficiency and Capital Costs 2618.5 Stove Efficiency from a Study in Colombia 2628.6 Solid Fuels as Main Cooking Fuel in Latin America
and the Caribbean 2738.7 Solid Fuels as Main Cooking Fuel in Rural Latin America
and the Caribbean 2749.1 Annual Gap between Formal Housing Construction
and Creation of New Households 2839.2 Solid Waste Generation in Latin American Cities 3049.3 Composition of Waste 304
x Contents

10.1 Geographical Distribution of Natural Disaster Threats in Colombia 324
10.2 Cumulative Monthly Occurrence of Flooding,Landslides, and Other Disasters 325
11.1 Internal Freshwater Resources Per Capita 35812.1 Fertilizer Consumption 40412.2 CAR Investment in Land Issues 41013.1 National Protected Areas 43813.2 Total CO2 Emissions in Colombia Compared with
Other Countries, 1990 453
Tables2.1 Characteristics of Corporations Established
during 1954 to 1971 122.2 Creation of Selected National Environmental
Organizations in Latin America 222.3 Annual Environmental Expenditure of CARs, MAVDT,
and IDEAM as Percentage of GDP, 1995–2003 252.4 Environmental Investments by CARs, 1995–2003 273.1 Ministry of Environment Staffing and Salaries, 2002 403.2 Ministry of Environment Investment Budget by
Issue, 2002 433.3 Recommendations 604.1 ASOCAR Data Variables with Direct Measures of
Performance 704.2 Categorization of CAR Investment Projects 724.3A Severity of Risk versus Percentage of 2001 Total
Investment by CAR: Soil Degradation 754.3B Severity of Risk versus Percentage of 2001 Total
Investment by CAR: Flora and Fauna Degradation 764.3C Severity of Risk versus Percentage of 2001 Total
Investment by CAR: Natural Disaster Prevention 774.3D Severity of Risk versus Percentage of 2001 Total
Investment by CAR: Water Pollution 784.3E Relative Severity of Risk versus Relative Intensity
of 2001 Investment by CAR: Air Pollution 794.3F Relative Severity of Risk versus Relative Intensity
of 2001 Investment by CAR: Solid Waste 804.4A Investment Spending: Planned (PAT) versus Actual
for CAR Cundinamarca, 2001 82
Contents xi

4.4B Investment Spending: Planned (PAT) versus Actual for CORANTIOQUIA, 2001 83
4.4C Investment Spending: Planned (PAT) versus Actual for CRA, 2001 84
4.4D Investment Spending: Planned (PAT) versus Actual for CARDIQUE, 2001 85
4.5 CAR Resources, 2003 874.6 Recommendations 1005.1 Annual Costs of Environmental Damage, Low and
High Estimates 1115.2 Baseline Data for Estimating Health Impacts 1165.3 Estimated Annual Impacts on Health from Insufficient
Water, Sanitation, and Hygiene 1185.4 Estimated DALYs Lost to Diarrheal Mortality
and Morbidity 1185.5 Estimated Annual Cost of Diarrheal Illness 1195.6 Estimated Annual Cost of Illness (Morbidity) by Category 1195.7 Baseline Data for Cost Estimation 1205.8 Annual Cases of Hepatitis A and Typhoid and Paratyphoid,
2000–03 1215.9 Estimated Annual Cost of Hepatitis A, Typhoid,
and Paratyphoid 1215.10 Baseline Data for Cost Estimation of Hepatitis A,
Typhoid, and Paratyphoid 1225.11 Estimated Annual Cost of Boiling Drinking Water 1235.12 Baseline Data for Cost Estimation for Boiling
Drinking Water 1245.13 Unit Costs of Water Purification 1245.14 Estimated Total Annual Household Costs of
Avertive Expenditures 1255.15 Baseline Data for Cities with PM Monitoring Data 1265.16 Baseline Data for Cities without PM Monitoring Data 1265.17 Estimated Impacts on Health from Urban Air Pollution 1275.18 Estimated Health Impact by City 1285.19 Estimated Annual Costs of Health Impacts 1285.20 Estimated Annual Costs of Morbidity from Urban
Air Pollution 1295.21 Fuels Used for Cooking in Colombia 1315.22 Household Fuelwood Use 1315.23 Health Risks of Indoor Air Pollution 132
xii Contents

5.24 Baseline Data for Estimating Health Impacts 1335.25 Estimated Annual Impacts on Health from
Indoor Air Pollution 1355.26 Estimated DALYs Lost to Indoor Air Pollution 1365.27 Estimated Annual Cost of Indoor Air Pollution 1365.28 Estimated Cost of Illness by Category for
ARI and COPD Morbidity 1375.29 Baseline Data for Cost Estimation of Morbidity 1385.30 Indicators of Land Degradation 1415.31 Estimated Regression Coefficients for Land Degradation 1425.32 Simulated Relative Yields 1425.33 Estimated Annual Cost of Land Degradation 1435.34 Number of People and Units Affected
by Natural Disasters 1455.35 Annual Average Impacts of Natural Disasters for
Three Periods 1455.36 Disaster Impacts by Type of Disaster, 1999–2003 1455.37 Annual Average Number of People Affected, 1997–2003 1465.38 Estimated Annual Cost of Natural Disasters
(Except Major Earthquakes) 1475.39 Estimated Annual Cost of Major Earthquakes 1485.40 Unit Costs Applied to Frequently Occurring Disasters 1495.41 Environmental Concerns 1506.1 Diarrhea in Children under Age 5 1606.2 Summary of Meta-Analysis by Fewtrell and Colford (2004) 1636.3 Tariff Increases for Failure to Achieve Water
Quality Targets 1696.4 Urban Sewerage System Coverage, 2001 1716.5 Selected Exposure Scenarios 1736.6 Rates of Reduction in Diarrheal Illness Used in
Pruss and Others (2002) 1746.7 Exposure Scenario Application to Colombia 1766.8 Water Supply and Sanitation in Colombia 1776.9 Scenario Allocation Rules 1786.10 Rural Water Supply and Sanitation in Colombia 1796.11 Urban Water Supply and Sanitation in Colombia 1796.12 Estimated Annual Cases of Diarrheal Illness in
Colombia, 2000 1806.13 Estimated Annual Cases of Diarrheal Illness
per Person in Rural Colombia, High Estimate 180
Contents xiii

6.14 Benefits and Costs of Improved Rural Water and Sanitation, Low Case 181
6.15 Benefits and Costs of Improved Rural Water and Sanitation, High Case 182
6.16 Household Time Savings from Improved Water Supply 1826.17 Key Parameters and Outcomes in a Benefit-Cost
Analysis of Handwashing 1846.18 Review of Costs and Effectiveness of Handwashing
Programs 1856.19 Benefits and Costs of a National Handwashing Program
in Colombia 1866.20 Benefits and Costs of a National Handwashing Program
(Behavioral Change Lasting Two Years) 1896.21 Benefits and Costs of a Drinking Water Disinfection
Program 1916.22 Benefits of Intervention Alternatives in Colombia,
Morbidity 1936.23 Benefits of Interventions in Colombia, Child Mortality 1936.24 Summary of Recommendations for Reducing
Waterborne Diseases in Colombia 1957.1 Estimated Health Impact of Urban Air Pollution
in Colombia 2037.2 Development of National Norms on Air Pollutant
Emissions, 1995–2002 2057.3 Air Quality Standards: Decree 02 of 1982 2097.4 Standards for Air Quality in Bogotá, DAMA
Resolution 1208 of 2003 2097.5 Regulation of Sulfur Content in Gasoline and Diesel Fuels 2127.6 Emissions Reductions with Mass Transportation
Systems, 2004–20 2137.7 Annual Ambient PM10 Levels in Selected Cities 2177.8 VAT Exemptions for Environmental
Investments, 1997–2003 2207.9 PM10 Concentrations on “Day Without My Car”
versus Daily Average 2217.10 Emission Inspections of Motor Vehicles in Cali,
1997–2003 2217.11 Revenues from Vehicle Inspection Program in
Cali, 1997–2003 222
xiv Contents

7.12 Vehicles Converted to CNG as of July 2004 2257.13 Hectares of Sugarcane in CVC with Green Cuts,
1997–2003 2267.14 Estimated PM10 Emissions in Bogotá, 2002 2297.15 Emission Source Ratios of PM2.5 and PM10 2307.16 Nitrates and Sulfates in PM2 2307.17 Model Results for Annual Emissions Inventory in
Bogotá 2317.18 Estimated Cost of Damage Caused by PM10 in Bogotá 2327.19 Estimates of Vehicles and Fuel Consumption in Bogotá 2367.20 PM10 Emissions Factors 2377.21 Estimated PM10 Damage Cost per Vehicle in Bogotá 2387.22 Benefits of Diesel Vehicle Retrofit Technology 2407.23 Benefits of Conversion to CNG 2417.24 Benefits of Converting to Low-Sulfur Diesel 2427.25 Summary of Recommendations for Improving
Urban Air Quality in Colombia 2438.1 Acute Respiratory Illness Prevalence Rates in Children 2548.2 Child Health, ARI Treatment, and Maternal Education 2548.3 Relative Risks for Strong and Moderate Health
Outcomes 2568.4 Fuels, Stove Technology, and Pollution Scenarios 2578.5 Base Case Estimation of Scenario-Specific Relative Risks 2588.6 PM Concentrations from Cooking Stoves 2598.7 Odds Ratios for ARI 2608.8 Estimated Annual Household Consumption of Fuelwood 2648.9 Annual Recurrent Cost of Complete Fuel Substitution 2658.10 Baseline Parameters for Estimating the Cost of
Fuel Substitution 2668.11 Cost Estimates of Improved Wood Stoves and
LPG Stoves 2668.12 Interventions 2678.13 Estimated Annual Benefits of Interventions 2688.14 Estimated Annual Costs of Interventions 2708.15 Benefit-Cost Ratios of Interventions 2718.16 Households Using Solid Fuels 2738.17 Change in Share of Households Using Solid Fuels 2748.18 Summary of Recommendations for Addressing
Indoor Air Pollution in Colombia 275
Contents xv

9.1 Total and Per Capita Waste Generated, 1998–2001 3039.2 Population Density and Waste Generation in Colombia,
1988–2001 3039.3 Composition of Waste 3049.4 Final Disposal of Waste 3059.5 Solid Wastes Recycled, by Material 3069.6 Disposal of Solid Waste in CARs 3079.7 Characteristics of Waste Programs in Selected Areas 3089.8 Summary of Recommendations for Addressing
Problems Associated with Accelerated Urban Growth 31510.1 Disaster Exposure Indicators in Central and South
America, 1970–99 32310.2 Percentage of Disaster Impacts by Type of
Disaster, 1999–2003 32510.3 Impacts of Natural Disasters, 1999–2003 32610.4 Annual Average Impacts of Natural Disasters, 1999–2003 32610.5 Number of People Affected by Landslides, Floods,
and Storms, 2003 32710.6 Projected Economic Loss from Disasters and
Government Financing Needs 33910.7 Expected Annualized Loss from 20-Year to 100-Year
Natural Disasters 33910.8 Disaster Funding by Source and Year 34010.9 Initial, Additional, and Total Budget Allocation to FNC 34110.10 Implementation of PLECs, 1998–2004 34310.11 Implementation of PLECs by CAR and
Municipality, 2002 34410.12 Summary of Recommendations for Strengthening
Prevention of Natural Disasters 35211.1 New Water Concessions by Sector, 1998–2002 37011.2 Daily BOD Production by Sector 37511.3 Efficiency of Organic Load Removal in Municipal
Wastewater Treatment Plants 37911.4 Estimated Costs of Required Aqueducts and Sewers in
Urban Areas, 2001–10 38011.5 Investment in Wastewater Treatment Systems, 1998–2001 38011.6 Recommendations to Improve Water Resources
Management 38612.1 High or Very High Soil Erosion, by Department 39612.2 Soil Erosion in Colombia by Level of Severity, 1988 Study 397
xvi Contents

12.3 Principal Regions Affected by High and Very High Erosion 397
12.4 Soil Erosion in Colombia by Level of Severity,2000 Study 398
12.5 Change in High and Very High Erosion, 1988–2004 39812.6 High or Moderate Soil Salinity, by Department 40012.7 High or Moderate Soil Salinity, by Region 40112.8 Salinization in Three Key Geographic Areas 40112.9 Salinization in the Cauca Valley 40112.10 Salinization in Selected Areas of the Bogotá Savanna 40212.11 Estimated Erosion Costs for Three Departments 40212.12 Most Suitable Land Use and Actual Land Use 40212.13 Suitable Land Use and Land Use Conflicts 40312.14 Land Use and Irrigated Areas in Colombia, 1980–2001 40312.15 Causes of Deforestation in Colombia 40412.16 CAR Investments in Land Quality by CAR, 1995–2003 40812.17 CAR Investment in Land Quality, by Type of Project 41012.18 Soil Degradation Risk Compared with CAR
Investment in Soil Conservation 41212.19 Land-Use Planning and Soil Zoning by CAR 41312.20 Forest Cover 41512.21 Regression Analysis of Forest Cover 41612.22 Changes in Green Cover in Colombia, 1986–94 and
1994–2001 42312.23 Protective Reforestation in Colombia, 1991–2002 42312.24 Recommendations 42613.1 The National Protected Areas System 43813.2 Colombia’s GHG Emissions by Gas and Sector, 1994 45313.3 Recommendations to Control Biodiversity Loss and
Other Global Environmental Problems 46114.1 Main Policy Options of the Report 471
Contents xvii


Colombia’s constitution, known as the “Green Constitution,” strives tointegrate economic, social, and environmental considerations intonational plans and policies. Colombia has achieved a number of mile-stones in sound environmental policy, including the enactment of theCode of Natural Resources in 1974—the first Code in Latin America—and the Law of the Environment in 1993, and the establishment of aunique and highly decentralized National Environmental System(Sistema Nacional Ambiental).
The government of Colombia recognizes the World Bank’s commit-ment to achieve equitable and sustainable development. EnvironmentalPriorities and Poverty Reduction: A Country Environmental Analysis forColombia is an important testament to the Bank’s commitment. Thereport, which was prepared in response to a request by the government,includes many issues that were brought up during extensive discussionamong the World Bank, various national and local agencies, private sec-tor stakeholders, nongovernmental agencies, and other civil societyorganizations in Colombia.
Environmental Priorities for Poverty Reduction: A Country EnvironmentalAnalysis for Colombia is a valuable resource for policy and decision makers.It identifies the environmental issues that are a priority in the national
Foreword
xix

agenda as well as the most cost-effective ways to deal with them. Thisreport was used as a basis in the formulation of Colombia’s Vision 2019,which aims at achieving an economy in which all citizens enjoy greaterwelfare, a more egalitarian and united society, a society with free andresponsible citizens, and efficient services.
In addition, some of the studies presented in the report have been thebasis for discussions among various stakeholders during the preparation ofthe 2006–10 National Development Plan, Estado Comunitario: Desarollopara Todos, which has the key objectives of promoting the following:
• increased and sustained economic growth • poverty reduction and equity • policies for defense and democratic security • environmental and risk management to promote sustainable development • an improved national government at the citizen’s service.
Furthermore, the Congress, constituencies, and mass media have ini-tiated a public debate based on the findings of technical studies on theenvironment. Such discussions have had considerable success in raisingpublic awareness of Colombia’s primary environmental issues—such asoutdoor and indoor air pollution and natural disasters induced by cli-mate change—and the economic burdens that they impose.
Juan Lozano RamirezMinistro de Ambiente, Vivienda y Desarrollo Territorial(Minister of Environment, Housing, and Territorial Development)
xx Foreword

The Colombia Country Environmental Analysis, Environmental Prioritiesand Poverty Reduction, is the product of joint work between the WorldBank and the government of Colombia.The report highlights the country’sprincipal environmental challenges with a view to facilitate a dialoguethat will drive the search for efficient and equitable public policyoptions. The analysis presented in this document is the first of its kindundertaken by the World Bank in the area of sustainable developmentand environmental protection in Colombia. The analytical approachserves as an element of a learning process that relates environmentalprotection and poverty alleviation within a framework that will help thegovernment of Colombia to achieve the Millennium Development Goals,particularly the goal to integrate sustainable development principles innational policies and programs and reverse environmental degradation.
Consistent with the analysis, Colombia’s vast wealth of naturalresources has not only contributed to economic and social growth, but alsoto improvements in the quality of life of the population. In the past 50years, the country has restructured its environmental legal and regulatoryframework, undertaking various policy initiatives and broadening andstrengthening its institutional capacity to protect and manage naturalresources and environmental quality, vital aspects for sustainable growth
Preface
xxi

and poverty reduction. The legal framework has permitted the successfulestablishment of a decentralized and innovative framework for environ-mental management that assigns specific responsibilities to the multiplestakeholders involved in environmental management.
Despite significant advances, such as the creation of a system ofnational parks and forestry reserves that covers almost a quarter of thenational territory, as well as the gradual phase-out of leaded gasoline,Colombia must address the great challenge of mitigating and reversingenvironmental degradation and at the same time strengthen environ-mental planning and management processes that have been initiated. It isestimated that the cost associated with the principal causes of environ-mental degradation is equivalent to more than 3.7 percent of Colombia’sgross domestic product, due mainly to increased mortality and morbidityand decreased productivity.
The World Bank foresees a continued program of assistance toColombia in the area of environmental planning and management, mak-ing it a central theme in the process of building an equitable, competi-tive, and sustainable country. Based on the priorities identified by thegovernment of Colombia, the Bank will continue to support, throughtechnical assistance and financing, the design and implementation of sus-tainable development policies, and thereby strengthen the joint work ofthe Colombian governmental authorities in the various sectors to bene-fit the country’s most vulnerable groups. We hope that this report servesas a useful instrument for contributing to the achievement of povertyreduction, environmental protection, and sustainable development goalsin Colombia.
Makhtar DiopCountry Director for Colombia and Mexico (Acting)The World Bank
xxii Preface

This report was prepared by a team led by Ernesto Sánchez-Triana andKulsum Ahmed. The core team included Yewande Awe, Allen Blackman,Angela Armstrong, Bjorn Larsen, Carolina Urrutia Vásquez, David LeBlanc, Michelle Falck, Peter M. Brandriss, and Richard Morgenstern. Theprincipal editors were Diane Stamm, Janice Molina, and Peter Brandriss.The extended team included Abel Mejía, Alberto Brugman, AlejandroDeeb, Ana María Ibañez, Andrea Semaan, Angel Sterling, CarlosLemoine, Charles Di Leva, David Rosenblatt, Eduardo Uribe, ElissonWright, Elizabeth Topping, Ethel Sennhauser, Enrique Peñalosa,Francisco Canal, Gloria DeHaven, Jaime Salamanca, Javier Cuervo, JuanBenavides, Juan David Quintero, Juan Pablo Ruiz, Laura Kullenberg,Leonard Ortolano, Masami Kojima, Maureen L. Cropper, MenahemLibhaber, Monica Lemoine, Rachel Kaufmann, Rick Gelting, SandraHoffmann, Santiago Enríquez, and Santiago Sandoval. The peer reviewersfor the study include Anil Markandya, Juan Carlos Belausteguigoitia,Kseniya Lvosvky, and Magda Lovei.
The government of Colombia, mainly through the Ministry of Environ-ment, Housing and Territorial Development (MAVDT), the Ministry ofSocial Protection (MPS), and the National Planning Department (DNP),provided key feedback during the preparation of the study. The following
Acknowledgments
xxiii

government officials were particularly helpful in providing comments andinsights to the task team: Juan Lozano Ramirez (MAVDT); Eduardo JoséAlvarado (MPS); Alejandro Gaviria (DNP); Astrid Alvarez, Oscar DarioAmaya, Juan P. Bonilla, Pedro Chavarro, Diana Gaviria, Simona Herrera,Lina Patricia Muñoz, Leonardo Muñoz, and Gerardo Viña (MAVDT);Oscar Alvarez (CORNARE); Francisco Zapata (CORANTIOQUIA);Gloria Alvarez (Cundinamarca); Vilma Fabiola Izquierdo (National HealthInstitute); and Carlos Costa, Gonzalo Arango, Nelsy Verdugo, and GloriaZapata. Important feedback was also received from members of theColombian Congress during the workshops in Bogotá. The team is particu-larly grateful to the Japanese government for its support of some of thestudies that underpin this report through Policy and Human ResourcesDevelopment funds.
This work was supervised by Pamela Cox (Vice President, Latin Americaand Caribbean Regional Development of the World Bank), Isabel Guerrero(Country Director, Mexico and Colombia’s Country Management Unit,Latin America and Caribbean Regional Department of the World Bank),John Redwood (Sector Director, Environmentally and Socially SustainableDevelopment, Latin America and Caribbean Regional Department of theWorld Bank), Laura Tuck (Sector Director, Sustainable DevelopmentDepartment, Latin America and Caribbean Regional Department of theWorld Bank), and Abel Mejia (Environment Sector Manager, Latin Americaand Caribbean Regional Development Department of the World Bank).
xxiv Acknowledgments

AAU Urban Environmental AuthorityAutoridad Ambiental Urbana
ARI acute respiratory illness
ASOCAR Colombian Association of Environmental AuthoritiesAsociación Colombiana de Autoridades Ambientales
BAMA Environmental Administration Department of BarranquillaDepartamento Administrativo de Medio Ambiente deBarranquilla
BOD biochemical oxygen demand
CAR Autonomous Regional Corporation (note that CAR isused both generically for all CARs and specifically forthe CAR Cundinamarca)Corporación Autónoma Regional
CDAV Centro de Diagnóstico Automotor del ValleCDM Clean Development Mechanism
CDS Sustainable Development CorporationCorporación de Desarrollo Sostenible
CEA country environmental analysis
Abbreviations
xxv

CEPAL Economic Commission for Latin America and theCaribbeanComisión Económica para América Latina y el Caribe
CER Certified Emission ReductionCFC chlorofluorocarbonCGSM Great Swamp of Santa Marta
Ciénaga Grande de Santa MartaCH4 methaneCNE National Emergencies Committee
Comité Nacional de EmergenciasCNG compressed natural gasCNPAD National Disaster Preparedness and Response Committee
Comité Nacional para la Prevención Renovables y Atenciónde Desastres
CNRN National Code for Renewable Natural Resources and Environmental ProtectionCódigo Nacional de Recursos Naturales Renovables y de Protección al Medio Ambiente
CO carbon monoxideCOI cost of illnessCOLPAD Local Disaster Preparedness and Response Committee
Comité Local para la Prevención y Atención de DesastresCONAIRE National Intersectoral Technical Commission for
Prevention and Control of Air PollutionComisión Técnica Nacional Intersectorial para laPrevención y el Control de la Contaminación del Aire
CONPES National Council on Economic and Social PolicyConsejo Nacional de Política Económica y Social
COPD chronic obstructive pulmonary disease
CO2 carbon dioxide
CREPAD Regional Disaster Preparedness and Response CommitteeComité Regional para la Prevención y Atención de Desastres
DALY disability-adjusted life year
DANE National Statistical Administration DepartmentDepartamento Administrativo Nacional de Estadísticas
xxvi Abbreviations

DARNAR Administrative Department of Renewable Natural ResourcesDepartamento Administrativo de Recursos NaturalesRenovables
DGPAD General Directorate for Disaster Relief and PreventionDirección General para la Prevención y Atención de Desastres
DHS Demographic and Health Survey
DNP National Planning DepartmentDepartamento Nacional de Planeación
dS/m deciSiemens per meter
EAAB Bogotá Water and Sewer CompanyEmpresa de Acueducto y Alcantarillado de Bogotá
EIA Environmental Impact Assessment
EMGESA Bogotá Energy UtilityEmpresa de Energía de Bogotá
ESP Medellín Public UtilitiesEmpresas Públicas de Medellín
FAO Food and Agriculture Organization
FNC National Disaster FundFondo Nacional de Calamidades
FNR National Royalty Fund
Fondo Nacional de RegalíasFONAM National Environmental Fund
Fondo Nacional AmbientalGcf giga cubic feet
GDP gross domestic product
GEF Global Environment Facility
GHG greenhouse gas
ha/yr hectares per year
HC hydrocarbon
HCA human capital approach
H2SO4 sulfuric acid
IDB Inter-American Development Bank
IDEAM Institute of Hydrology, Meteorology and EnvironmentalStudiesInstituto de Hidrología, Meteorología y Estudios Ambientales
Abbreviations xxvii

IGAC Agustín Codazzi Geographic InstituteInstituto Geográfico Agustín Codazzi
INDERENA National Institute of Renewable Natural ResourcesInstituto Nacional de los Recursos Naturales Renovables
INGEOMINAS Colombian Institute of Geology and Mines
Instituto Colombiano de Geología y MineríaINS National Institute of Health
Instituto Nacional de SaludINVEMAR Institute of Marine and Coastal Research
Instituto de Investigaciones Marinas y CosterasIUCN World Conservation Union
JICA Japan International Cooperation Agency
LPG liquefied petroleum gas
l/s/km2 liters per second per square kilometer
MAVDT Ministry of Environment, Housing and RegionalDevelopmentMinisterio de Ambiente, Vivienda y Desarrollo Territorial
MDGs Millennium Development Goals
µg/m3 micrograms per cubic meter
MHCP Ministry of Finance and Public CreditMinisterio de Hacienda y Crédito Público
MMA Ministry of EnvironmentMinisterio del Medio Ambiente
MMcfd million cubic feet per day
MME Ministry of Mines and EnergyMinisterio de Minas y Energía
m3/s cubic meters per second
MW megawatt
NGO nongovernmental organization
NNPS National Natural Parks System
N2O nitrous oxide
NO2 nitrogen dioxide
NOX nitrogen oxide
NPA National Parks Authority
NPAS National Protected Areas System
xxviii Abbreviations

O3 ozone
OAD obstructive airways disease
ODS ozone-depleting substance
OECD Organisation for Economic Co-operation and Development
ONPAD National Disaster Preparedness and Response OfficeOficina Nacional para la Prevención y Atención de Desastres
ORT oral rehydration therapy
PAT Three-Year Action PlanPlan de Acción Trienal
PCB polychlorinated biphenyl
PDM Municipal Development PlanPrograma de Desarrollo Municipal
PGAR Regional Environmental Management PlanPlan de Gestión Ambiental Regional
PGIR Municipal Integrated Solid Waste Management PlanPlan de Gestión Integral de Residuos Sólidos
PLEC Local Emergency and Contingency PlanPlan Local de Emergencia y Contingencia
PM particulate matter
PM2.5 particulate matter less than 2.5 microns in diameter
PM10 particulate matter less than 10 microns in diameter
PNPAD National Disaster Preparedness and Response PlanPlan Nacional para la Prevención y Atención de Desastres
POIA Annual Investment Operating Plan
POMCA Watershed Administration and Management PlanPlan de Ordenamiento y Manejo de Cuenca Hidrográfica
POP persistent organic pollutant
POT Land Use PlanPlan de Ordenamiento Territorial
ppm parts per million
Ramsar The Ramsar Convention on Wetlands
RFF Resources for the Future
RR relative risk ratio
SIAC Colombian Environmental Information SystemSistema de Información Ambiental de Colombia
Abbreviations xxix

SINA National Environmental SystemSistema Nacional Ambiental
SINCHI Amazonian Institute for Scientific ResearchInstituto Amazónico de Investigaciones Científicas
SISAIRE Air Quality Information SystemSistema de Información sobre Calidad del Aire
SITM Integrated System for Mass TransportationSistema Integrado de Transporte Masivo
SNPAD National Disaster Preparedness and Response SystemSistema Nacional de Prevención y Atención de Desastres
SO2 sulfur dioxide
TSP total suspended particles
TSS total suspended solids
TVA Tennessee Valley Authority
UAESPNN Special Administrative Unit for the National NaturalParks SystemUnidad Administrativa Especial del Sistema de ParquesNacionales Naturales
UESP Unidad Ejecutiva de Servicios Públicos del Distrito Capitalde Bogotá
UNESCO United Nations Educational, Scientific and CulturalOrganization
UNFCCC United Nations Framework Convention on ClimateChange
UPME Mining and Energy Planning UnitUnidad de Planeación Minero Energética
USAID United States Agency for International Development
UTO Ozone Technical Unit Unidad Técnica de Ozono
VAT value-added tax
VIS Social Interest HousingVivienda de Interés Social
VOC volatile organic compound
xxx Abbreviations

VSL value of statistical life
WHO World Health Organization
Note:Currency Unit = Col$ (Colombian peso)
Fiscal Year = January 1 to December 31
Abbreviations xxxi


Autonomous Regional CorporationsCAM Corporación Autónoma Regional del Alto
Magdalena
CAR Cundinamarca Corporación Autónoma Regional de Cundinamarca
CARDER Corporación Autónoma Regional deRisaralda
CARDIQUE Corporación Autónoma Regional del Dique
CARSUCRE Corporación Autónoma Regional de Sucre
CAS Corporación Autónoma Regional deSantander
CDMB Corporación Autónoma Regional deDefensa de la Meseta de Bucaramanga
CORANTIOQUIA Corporación Autónoma Regional delCentro de Antioquía
CORNARE Corporación Autónoma Regional de lasCuencas de los Ríos Negro y Nare
Local and Regional Environmental
Authorities
xxxiii

CORPAMAG Corporación Autónoma Regional delMagdalena
CORPOBOYACA Corporación Autónoma Regional de Boyacá
CORPOCALDAS Corporación Autónoma Regional de Caldas
CORPOCESAR Corporación Autónoma Regional del Cesar
CORPOCHIVOR Corporación Autónoma Regional de Chivor
CORPOGUAJIRA Corporación Autónoma Regional de LaGuajira
CORPOGUAVIO Corporación Autónoma Regional delGuavio
CORPONARIÑO Corporación Autónoma Regional de Nariño
CORPONOR Corporación Autónoma Regional de laFrontera Nororiental
CORPORINOQUIA Corporación Autónoma Regional de laOrinoquía
CORTOLIMA Corporación Autónoma Regional delTolima
CRA Corporación Autónoma Regional delAtlántico
CRC Corporación Autónoma Regional del Cauca
CRQ Corporación Autónoma Regional delQuindío
CSB Corporación Autónoma Regional del Sur de Bolívar
CVC Corporación Autónoma Regional del Valle del Cauca
CVS Corporación Autónoma Regional de losValles del Sinú y San Jorge
Sustainable Development CorporationsCDA Corporación para el Desarrollo Sostenible
del Norte y Oriente Amazónico
CODECHOCO Corporación para el Desarrollo Sostenible del Chocó
CORALINA Corporación para el Desarrollo Sostenible del Archipiélago de San Andrés,Providencia y Santa Catalina
xxxiv Local and Regional Environmental Authorities

CORMACARENA Corporación para el Desarrollo Sostenible de la Macarena
CORPOAMAZONIA Corporación para el Desarrollo Sostenible delSur de la Amazonía
CORPOMOJANA Corporación para el Desarrollo Sostenible deLa Mojana y San Jorge
CORPOURABA Corporación para el Desarrollo Sostenibledel Urabá
Urban Environmental AuthoritiesAMVA Autoridad Ambiental Urbana del Área
Metropolitana del Valle de Aburrá
DADMA Departamento Administrativo de MedioAmbiente Santamarta
DAGMA Departamento Administrativo para laGestión del Medio Ambiente, Cali
DAMA Departamento Administrativo del MedioAmbiente, Bogotá
DAMAB Departamento Técnico Administrativo delMedio Ambiente de Barranquilla
EPA Establecimiento Público Ambiental deCartagena
Local and Regional Environmental Authorities xxxv


Over the past five decades, Colombia has made substantial progress inprotecting its environment. Its actions include restructuring its legal andregulatory landscape, undertaking policy initiatives, strengthening itscapacity for protecting and managing its natural resources and environ-mental quality, and establishing a system of national parks and forestryreserves that covers more than a quarter of the country. Colombia’senvironmental management framework has focused on three mainenvironmental priorities: (a) river basin management and conservationof water resources, (b) reforestation, and (c) conservation of biodiversity.During 1994 to 2005 the total value of investments by AutonomousRegional Corporations (Corporaciones Autónomas Regionales, CARs)amounted to about US$2 billion. Approximately 60 percent of thoseinvestments were directed mainly at water and forestry interventions.
The analysis of the cost of environmental degradation conducted aspart of the country environmental analysis (CEA) shows that the mostcostly problems associated with environmental degradation are urbanand indoor air pollution; inadequate water supply, sanitation, andhygiene; natural disasters (such as flooding and landslides); and landdegradation (figure 1). The burden of these costs falls most heavily onvulnerable segments of the population, especially poor children under
Executive Summary
xxxvii

age five. The effects of environmental degradation associated with theseprincipal causes are estimated to total more than 3.7 percent of grossdomestic product (GDP), mainly because of increased mortality andmorbidity and decreased productivity.1 To identify alternatives aimed atabating the cost of environmental degradation, this CEA examines insti-tutional and policy issues in the functioning of the country’s environmentalmanagement system and suggests some cost-effective interventions.
The analysis of environmental expenditures shows that currentexpenditures can be better aligned with the priorities of lower-incomegroups or with the most pressing problems associated with the cost ofenvironmental degradation (Canal 2004).2 In 2001, CARs allocated28 percent of their investment funds to projects involving protection offlora and fauna and only 5 percent to pollution control projects otherthan wastewater treatment plants (Canal 2004). Although data arelimited and must be interpreted cautiously, they suggest that the highestproportion of CAR investments have focused on the construction ofwastewater treatment plants, water basin management, reforestation,and conservation (Blackman and others 2005).
The results of a 2004 survey of public perceptions about environmen-tal problems in Colombia, which included a sample of 2,600 individualsfrom a wide range of regions, sectors, government agencies, civil societyorganizations, and ethnic groups (CNC 2004), complemented the analysisof the cost of environmental degradation. Approximately 80 percentof respondents identified air pollution as the top environmental problem,but there were significant differences in the perception of prioritiesamong income groups. Whereas low-income groups identified air pollu-tion, noise, and natural disasters as major problems, upper-income groupstended to perceive global environmental impacts (such as global warmingand loss of biodiversity) and inappropriate land use in urban areas ashigh priorities.
00.20.40.60.81.01.21.41.6
water, sanitation,hygiene
per
cen
tag
e o
f G
DP
naturaldisasters
urban airpollution
landdegradation
indoor airpollution
Figure 1 Annual Cost of Environmental Degradation
xxxviii Executive Summary
Source: Larsen 2004.
Note: GDP = gross domestic product.
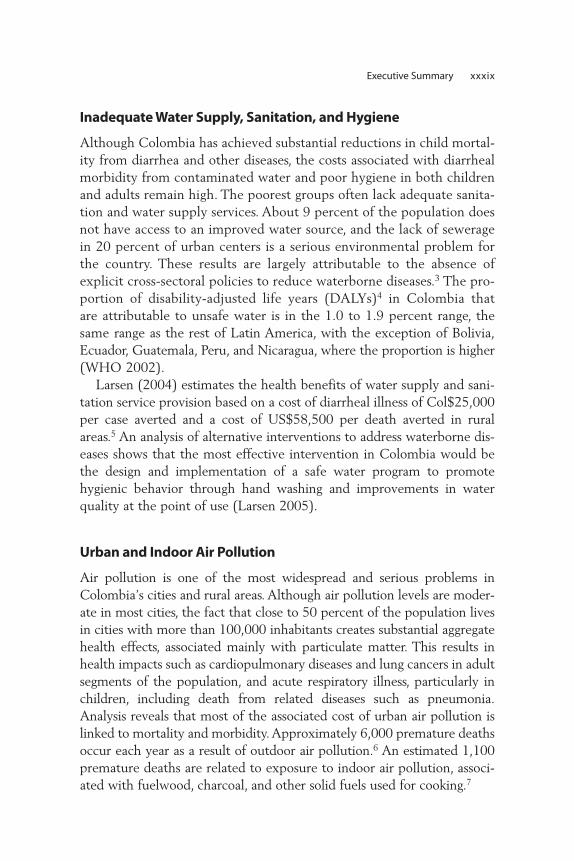
Inadequate Water Supply, Sanitation, and Hygiene
Although Colombia has achieved substantial reductions in child mortal-ity from diarrhea and other diseases, the costs associated with diarrhealmorbidity from contaminated water and poor hygiene in both childrenand adults remain high. The poorest groups often lack adequate sanita-tion and water supply services. About 9 percent of the population doesnot have access to an improved water source, and the lack of seweragein 20 percent of urban centers is a serious environmental problem forthe country. These results are largely attributable to the absence ofexplicit cross-sectoral policies to reduce waterborne diseases.3 The pro-portion of disability-adjusted life years (DALYs)4 in Colombia thatare attributable to unsafe water is in the 1.0 to 1.9 percent range, thesame range as the rest of Latin America, with the exception of Bolivia,Ecuador, Guatemala, Peru, and Nicaragua, where the proportion is higher(WHO 2002).
Larsen (2004) estimates the health benefits of water supply and sani-tation service provision based on a cost of diarrheal illness of Col$25,000per case averted and a cost of US$58,500 per death averted in ruralareas.5 An analysis of alternative interventions to address waterborne dis-eases shows that the most effective intervention in Colombia would bethe design and implementation of a safe water program to promotehygienic behavior through hand washing and improvements in waterquality at the point of use (Larsen 2005).
Urban and Indoor Air Pollution
Air pollution is one of the most widespread and serious problems inColombia’s cities and rural areas. Although air pollution levels are moder-ate in most cities, the fact that close to 50 percent of the population livesin cities with more than 100,000 inhabitants creates substantial aggregatehealth effects, associated mainly with particulate matter. This results inhealth impacts such as cardiopulmonary diseases and lung cancers in adultsegments of the population, and acute respiratory illness, particularly inchildren, including death from related diseases such as pneumonia.Analysis reveals that most of the associated cost of urban air pollution islinked to mortality and morbidity.Approximately 6,000 premature deathsoccur each year as a result of outdoor air pollution.6 An estimated 1,100premature deaths are related to exposure to indoor air pollution, associ-ated with fuelwood, charcoal, and other solid fuels used for cooking.7
Executive Summary xxxix

Urban air pollution resulting from transportation and industry hasworsened and is most critical in the country’s industrial corridors, such asBogotá-Soacha, Cali-Yumbo, Medellín-Valle de Aburrá, Sogamoso, andBarranquilla. According to MAVDT (2006, p. 2), “particulate matter con-centrations affecting public health present the greatest problem in thePuente Aranda, Kennedy, and Fontibón areas of Bogotá.” With respect toindoor air pollution, there are no reliable time series data. Nonetheless,indoor air pollution and the health problems associated with it continueto pose challenges. Comparisons between the annual mean concentra-tions of particulate matter less than 10 microns in diameter (PM10) inColombia’s main cities and those of other urban centers must be madewith caution, because of the complexities and challenges associated withthe measurement of these pollutants. In many cases, the cities have amonitoring network in which concentrations vary widely from onestation to another or from one time period to the next; thus, the meanvalue may not accurately reflect the severity of air pollution. Yet, a firstapproximation suggests that PM10 concentrations in Bogotá are similar tothose of other Latin American cities with severe air pollution, includingMexico City and Santiago (World Bank 2005). The differences in meanPM10 concentrations are much more obvious when compared with thoseof cities outside the region. Cities with larger industrial production andtransportation sectors, such as Los Angeles, Tokyo, or Rome, have success-fully reduced their ambient concentrations to levels that are lower thanthose of Medellín and Bucaramanga (figure 2).
The analysis indicates the need to update regulations and issue stan-dards and economic instruments that minimize the concentration of fineparticulate matter in the air. Some of the most promising options includereduction in the sulfur content of fuels and control of emissions fromstationary and nonpoint sources, including the burning of agriculturalresidues. Possible options for the reduction of indoor air pollutioninclude the use of cleaner fuels, technical mitigation such as improvedcooking stoves, and policies that promote improved housing design.Furthermore, allocations of financial resources need to be increased toeffectively address air pollution issues.
Natural Disasters
Colombia is vulnerable to natural disasters such as floods, droughts, andearthquakes, averaging 2.97 natural disasters per year, the third-highestrate among the 19 countries in the Latin American region. The largest
xl Executive Summary

number of natural disasters is related to floods and landslides. Insufficientdrainage and the disposal of garbage in natural channels in most urbanareas are important factors contributing to urban flooding. In the pastquarter century, the country experienced six major earthquakes, threevolcanic eruptions, three landslides, and three avalanches, with significanthuman and physical capital costs. It is estimated that more than 4 millionColombians were affected by natural disasters during 1993 to 2000, at anannual cost of approximately US$453 million (Echeverry 2002). In addi-tion, an estimated 30,000 deaths were caused by these natural disasters,the third-largest figure for Latin America. The occurrence of these eventshas resulted in losses of more than US$4.5 billion, or 11.5 percent of thecountry’s 1995 GDP. The poorest and most susceptible populations havepaid the highest costs for these disasters in damages, deaths, and lost assets.To address this problem, comprehensive actions are needed, including theadoption of nonstructural measures to prevent human settlement in areasof high vulnerability to natural disasters.
Urban Environmental Management
Urban environmental issues include problems associated with housing andurban planning and with waste management. The three main actions sug-gested by the CEA to mainstream environmental considerations in urban
0
10
20
µg/m
3
30
40
50
60
70
80
Santia
go
Mex
ico C
ity
Bogot
á
Med
ellín
Bucar
aman
ga
Sao P
aolo
Toky
o
Rio de
Jane
iro
Los A
ngele
s
Mad
rid
Rome
New Yo
rkPar
is
Figure 2 PM10
Average Annual Concentrations in Selected Cities
Source: World Bank 2005.
Note: μg/m3 = micrograms per cubic meter.
Executive Summary xli
planning and housing policies include (a) streamlining environmental issuesin Land Use Plans (Planes de Ordenamiento Territorial); (b) preventinginformal settlement in areas prone to floods, landslides, and other naturaldisasters; and (c) designing housing subsidy programs to reduce indoor airpollution and other forms of environmental degradation.
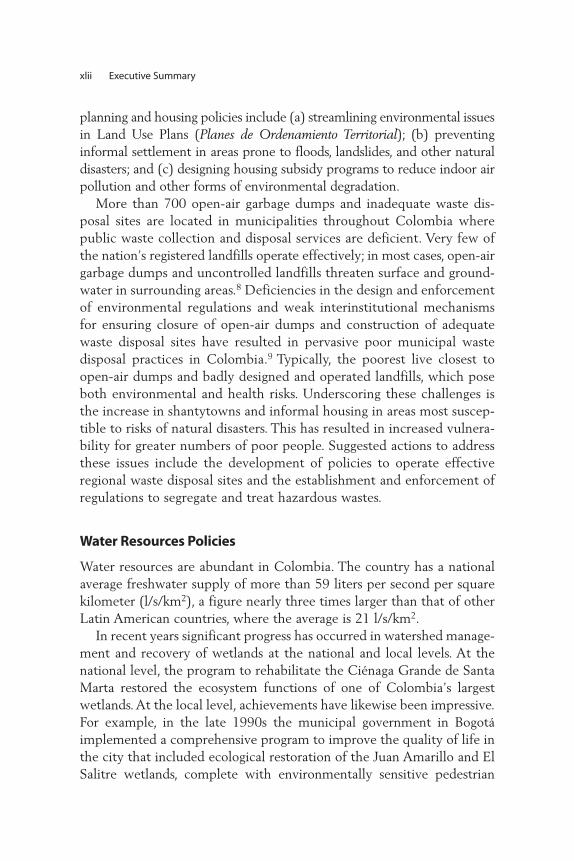
More than 700 open-air garbage dumps and inadequate waste dis-posal sites are located in municipalities throughout Colombia wherepublic waste collection and disposal services are deficient. Very few ofthe nation’s registered landfills operate effectively; in most cases, open-airgarbage dumps and uncontrolled landfills threaten surface and ground-water in surrounding areas.8 Deficiencies in the design and enforcementof environmental regulations and weak interinstitutional mechanismsfor ensuring closure of open-air dumps and construction of adequatewaste disposal sites have resulted in pervasive poor municipal wastedisposal practices in Colombia.9 Typically, the poorest live closest toopen-air dumps and badly designed and operated landfills, which poseboth environmental and health risks. Underscoring these challenges isthe increase in shantytowns and informal housing in areas most suscep-tible to risks of natural disasters. This has resulted in increased vulnera-bility for greater numbers of poor people. Suggested actions to addressthese issues include the development of policies to operate effectiveregional waste disposal sites and the establishment and enforcement ofregulations to segregate and treat hazardous wastes.
Water Resources Policies
Water resources are abundant in Colombia. The country has a nationalaverage freshwater supply of more than 59 liters per second per squarekilometer (l/s/km2), a figure nearly three times larger than that of otherLatin American countries, where the average is 21 l/s/km2.
In recent years significant progress has occurred in watershed manage-ment and recovery of wetlands at the national and local levels. At thenational level, the program to rehabilitate the Ciénaga Grande de SantaMarta restored the ecosystem functions of one of Colombia’s largestwetlands. At the local level, achievements have likewise been impressive.For example, in the late 1990s the municipal government in Bogotáimplemented a comprehensive program to improve the quality of life inthe city that included ecological restoration of the Juan Amarillo and ElSalitre wetlands, complete with environmentally sensitive pedestrian
xlii Executive Summary

walkways and bicycle paths, and the building or rebuilding of 1,243parks that are visited by more than 1.5 million people annually.
Achievements in wastewater treatment include construction of newtreatment plants in the cities of Medellín and Bucaramanga. In Medellín,the total cost of the program was about US$440 million, including con-struction of wastewater treatment plants in San Fernando and Bello. TheCorporación Autónoma Regional de Defensa de la Meseta de Bucaramangadeveloped an upflow anaerobic sludge bed treatment plant that removesmore than 50 percent of biochemical oxygen demand and total suspendedsolids. In addition, in the Bogotá Savanna, the Cundinamarca CAR hasspent around US$50 million to build wastewater treatment plants for21 municipalities in the upper Bogotá River watershed.
Recommendations to further strengthen the water sector’s performanceinclude (a) improving the existing regulations to control water pollution,including water pollution fees; (b) restructuring economic instruments toimprove efficiency and equity; and (c) improving water quality standardsfor human consumption, recreational uses, and irrigation.10 Likewise, strate-gies are advisable for the formulation, socialization, and implementation ofprograms for accountability, transparency, and governance to promote com-pliance with water quality standards.
Soil Degradation and Deforestation
Although problems associated with land degradation, particularly soilerosion, have worsened over time, they are comparable to those of othercountries for which similar analysis has been performed (figure 3).The two most salient components of land degradation in Colombia are(a) erosion and salinization, and (b) deforestation. The need to improveinterinstitutional coordination to address the problems of land degrada-tion is evident.
Colombia has evolved rapidly over the past 50 years from being acountry with a largely rural economy to one that is highly urbanizedand more economically diverse. With a strong tradition of developmentplanning, environmental priorities have focused on conservation of bio-diversity and renewable natural resources, with impressive results. Forinstance, the system of national parks and forestry reserves encompassesnearly one-quarter of the national territory. In addition, deforestationrates, which stood at about 600,000 hectares per year in the 1970s andearly 1980s, were reduced to an average of 145,000 hectares per year
Executive Summary xliii

during 1986 to 96 (IDEAM 1998, p. 295). Combined with an increase insecondary forests of nearly 3.5 million hectares, there was actually a netgain in forest cover of 3.3 million hectares in 10 years (IDEAM 1998,p. 295). By 2004, the Institute of Hydrology, Meteorology and Envi-ronmental Studies (Instituto de Hidrología, Meteorología y EstudiosAmbientales) estimated a deforestation rate of 91,932 hectares per year(0.18 percent), which is similar to Peru but significantly lower than theaverage for Latin America and the Caribbean (0.5 percent), and signifi-cantly lower than countries such as Ecuador, El Salvador, Panama, andMexico IDEAM 2004; SIAC 2002; World Bank 2005).
The analysis suggests that reforestation investments by departments,municipalities, environmental authorities, and CARs have minor impactson erosion control or regulation of water streams.11 Congress is currentlydiscussing a national forestry law. Several stakeholders have recommendedincorporating into the bill provisions to secure the rights of indigenouspeoples and small farmers.
Global Environmental Problems
Some of the most salient global environmental problems in Colombiaare biodiversity loss, climate change, and ozone depletion. The area cov-ered by the national parks represents close to 10 percent of the nationalterritory. In comparison with four other highly diverse Latin Americancountries, and countries in other latitudes, the percentage of protectedland is considerable (figure 4).
Figure 3 Economic Cost of Soil Degradation in Selected Countries
0
0.2
0.4
0.6
0.8
1.0
1.2
per
cen
tag
e o
f G
DP
Egypt
, Ara
b
Rep. o
f Syrian
Arab
Rep.
Colom
bia
Algeria
Jord
an
Tunis
ia
Leba
non
Mor
occo
Sources: Algeria: Ministère de l’Aménagement du Territoire et de l’Environnement 2002; Egypt: World Bank 2002;
Jordan: METAP 2000; Morocco: World Bank 2003; Syria: Sarraf, Bolt, and Larsen 2004; Tunisia and Lebanon: Sarraf,
Larsen, and Owaygen 2004.
xliv Executive Summary

While progress has been achieved in the creation of national parks,there is a need to further their success and guarantee their sustainability.To that end, legislation could be improved by increasing the importanceof local economic, cultural, and social realities and expectations to ensurethat the rights of local stakeholders are not harmed. Protected areaslegislation has in some cases limited the use of traditional productionsystems and natural resources by local inhabitants. To overcome this thegovernment is considering putting in place institutional mechanisms toprevent and resolve conflicts between conservation interests and othersocial priorities, such as regional, social, and economic development.
Regarding biodiversity, climate change, and ozone-depleting substances,Colombia has taken advantage of financial mechanisms such as the GlobalEnvironment Facility, the Prototype Carbon Fund, and the MontrealProtocol to finance private investments aimed at reducing emissions ofgreenhouse gas and ozone-depleting substances.
Institutional Strengthening
The Constitution of 1991 and Law 99 of 1993, which created the NationalEnvironmental System (Sistema Nacional Ambiental, SINA), reinforced therights of every citizen to a clean and healthy environment. The SINAdefines the roles of multiple stakeholders, including a central-level ministryresponsible for overall policy formulation and coordination, CARS, andUrban Environmental Authorities (Autoridades Ambientales Urbanas)
0
2
4
6
8
10
12
14
16
18
20
Ecuad
or
per
cen
tag
e o
f la
nd
Colom
bia
Mex
ico
Kenya Ita
ly
China
Japa
nBra
zilPer
u
Mala
ysia
Philipp
ines
India
Figure 4 Nationally Protected Areas in Selected Countries
Source: World Bank 2005.
Executive Summary xlv

responsible for environmental enforcement and water resources develop-ment, and research centers responsible for collecting and disseminatingenvironmental data (figure 5).
The SINA provides for a strong structure of multiple stakeholderinvolvement, decentralized management, and financial independence.Coordinating such a decentralized system poses significant challenges,including technical capacity, efficient regulations, enforcement, suffi-cient data, and mechanisms for public participation. The development ofa system to identify environmental priorities and a mechanism toincrease accountability of CARs are key steps to improving the SINA’seffectiveness and efficiency.
The government has begun to address these challenges through aresults-based framework to hold CARs accountable for their three-yearaction plans. Presidential Decree 1200 of 2004 established a system ofindicators to measure the impacts and results of environmental invest-ments at the regional level that links the Ten-Year Regional EnvironmentalManagement Plans (Planes de Gestión Ambiental Regional, PGARs) andThree-Year Action Plans (Planes de Acción Trienal, PATs) that each CAR isrequired to submit to the SINA. The PGARs provide a description of theprincipal challenges (for example, social, economic, cultural, and physical)facing the region, the CAR’s strategy for managing environmentalresources, financial requirements and potential sources of financing, andtools for monitoring and evaluating the program.
Conclusions
The highest costs imposed by environmental degradation in Colombiaare from, in decreasing order of magnitude, waterborne diseases, urbanair pollution, natural disasters, land degradation, and indoor air pollu-tion. Combined, these environmental problems cost Col$7 trillion(US$3 billion), or 3.7 percent of Colombia’s GDP (Larsen 2004).12
The poor and vulnerable populations bear a disproportionately highamount of this cost. To address these problems, this report identifies anumber of cost-effective policy interventions that could be adopted inthe short and medium terms to support sustainable development goals.
In recent decades, considerable progress has been made in addressingthe water and the forestry environmental agendas. The impact of envi-ronmental degradation on the most vulnerable groups suggests the needto increase emphasis on environmental health issues.13 However, theenvironmental management agenda has yet to catch up with this shift in
xlvi Executive Summary

National environmental council
Comptroller generalof the republic
Ecofondo
Territorial entities
Ministry ofenvironment
National planningdepartment
Procuraduría Generalfor environmental
issues
Financingfunds
Technical advisory council
CARs establishedbefore 1993
CARDERCORPONARIÑO
CORTOLIMACORPONOR
CDMBCRQ
CORNARECVS
CORPAMAGCORPOGUAJIRACORPOCALDASCORPOCESAR
CRCCVC
CundinamarcaCAR
CARs establishedby law 99, 1993
CORPORINOQUIACARSUCRECARDIQUE
CAMCORANTIOQUIA
CSBCRACAS
CORPOBOYACACORPOCHIVORCORPOGUAVIO
Urbanenvironmental
agencies
BogotáMedellín
CaliBarranquillaCartagena
Santa Marta
Sustainabledevelopment
CARs
CDACORPOAMAZONIA
CORALINACORMACARENACORPOMOJANACORPOURABACODECHOCO
Researchcenters
IDEAMINVEMAR
SINCHIVon Humbolt
InstituteVon Neumann
InstituteNationalroyalties
fund
Amazonenvironmental
fund
Nationalfund for theenvironment
Environmentalcompensation
fund
Figure 5 Organizations of Colombia’s SINAExecu
tive Sum
mary
xlvii

Table 1 Main Policy Options of the Report
Key issue Main policy options
Need for strategic Design and implement a policy (through laws and regulations) to set
and systematic environmental priorities at the national, regional, and local levels
tools for priority based tools for priority on learning mechanisms to periodically
setting review and learn from the experiences of implementing
environmental policies
Install and implement systems to monitor and evaluate environ-
mental management and the extent to which the objectives of
environmental priorities are efficiently met
Periodically evaluate progress on the implementation of policies to
tackle environmental priorities with the support of the accumula-
tion of data, results, and experiences achieved through intersectoral
coordination and learning
Need for Mainstream environmental considerations in policy formulation by
strengthening strengthening SINA institutions’capacity in priority areas through,
institutions’capacity for example, strategic environmental assessments in (a) environ-
to address environ- mental health, (b) vulnerability to natural disasters, and (c) sustain-
mental priorities, able urban development
particularly in environ-
mental health
High cost of environ- Design and implement a safe-water program that includes compo-
mental degradation nents dealing with hand washing and point-of-use disinfection
associated with of drinking water
waterborne diseases Facilitate private sector participation in water supply and sanitation
Modify water pollution fee system (tasas retributivas) to promote
the construction of sewerage collection systems
Formulate and implement actions to promote compliance with
drinking water quality standards
Modify laws and regulations on parameters of effluent standards
so that pathogens and toxic and hazardous substances are regulated
High cost of Revise and establish national standards for PM2.5
and PM10
in priority
environmental deg- urban areas and update major emission standards for mobile
radation associated and nonpoint sources to reflect new scientific and technological
with air pollution advances
Implement air pollution control interventions, such as promoting the
improvement of fuel quality in transport and industry sectors;
expanding the use of natural gas to replace coal and oil; and
establishing emissions control from stationary, mobile, and non-
point sources
Implement an air quality monitoring program to monitor PM2.5
and
PM10
in priority urban areas
Implement and enforce regulations (including Resolution 0532 of
2005) to control air pollution emissions and appropriate monitoring
methods for “green cut”of sugarcane (green cut refers to using
xlviii Executive Summary

(continued )
Table 1 Main Policy Options of the Report (continued)
Key issue Main policy options
manual or mechanical methods to remove sugarcane instead of
burning out the fields for planting)
Reform compliance and enforcement systems to include the
adoption of a more severe penalty system
Introduce more rigorous approaches to vehicle emissions testing
Morbidity and Promote the use of cleaner fuels in areas that predominantly use
premature deaths fuelwood in an accessible, safe, and cost-effective manner
associated with Implement a program to promote improved stoves
indoor air pollution Extend the coverage of rural electrification programs
In subsidy programs for rural low-income housing, include require-
ments for building codes and housing design in poor communities
to allow for improved ventilation and optimal chimney design
Vulnerability to Increase efforts to prevent natural disasters, especially floods and
natural disasters landslides, through activities that focus on incorporating disaster
prevention in land use plans, drainage improvements, warning
systems, and regulations prohibiting informal settlement in areas
prone to risks of natural disasters
Develop a permanent system of performance indicators for reduction
of vulnerability to natural disasters
Define the specific roles of each national- and regional-level member
of the National Disaster Preparedness and Response System and
the SINA, particularly CARs
Create stronger incentives for inclusion of disaster considerations in
environmental impact assessments and environmental licensing
Periodically conduct national, regional, and local risk assessments
Require all levels of government to use comparative risk assessment
to guide allocations of financial, human, and technical resources
Establish priorities for disaster monitoring and alert systems based
on comparative risk assessment
Requirements for Devise concrete ways to integrate environmental conditions into
improved urban urban planning and management tools after reviewing the legal
environmental and regulatory framework of environmental and urban legislation
conditions Define and include environmental criteria in the eligibility criteria of
Social Interest Housing projects
Address structural land supply problems and reduce costs of formality
Strengthen upstream enforcement of existing regulations and
planning documents to prevent occupation of hazardous sites
Enforce land use plans so that decisions on siting of landfills are
consistent with zoning regulations contained in those plans
Need for improved Reexamine the roles of government bodies and create more efficient
water resource cooperative mechanisms
management Find an economically efficient approach to wastewater treatment,
and control discharges of pathogens and hazardous wastes
Executive Summary xlix

Table 1 Main Policy Options of the Report (continued)
Key issue Main policy options
Ensure the collection and public disclosure of information related to
water availability and water demands
Ensure that the economic value of water is adequately reflected in
water fees
Land degradation Identify the costs and benefits of alternative interventions to control
and deforestation soil erosion and soil salinization
Generate alternatives to diversify nontimber forest products and
improve the livelihoods of forest-dwelling communities
Establish the analytical mechanisms to foster the capacity for both
indigenous communities and the rural poor to profit from the
sustainable and productive uses of forest areas and the implemen-
tation of payments for environmental services
Note: PM2.5
= Particulate matter less than 2.5 microns in diameter.
priorities from watershed and forestry to environmental health problemsbecause mechanisms in the current institutional structure to signal thesechanges are not yet in place.14 Improved monitoring and disseminationof information on environmental outcomes, assignment of accountabilityfor environmental actions and outcomes, and involvement of a broadrange of stakeholders are three important mechanisms to allow these sig-nals to be picked up.
The main policy options of the report are summarized in table 1.
Notes
1. Estimates of social and economic costs of environmental damage in Colombiaare based on the national estimates presented in Larsen (2004). Although theanalysis of the cost of environmental degradation relied extensively on largesets of statistics and data from various ministerial departments, institutions,and institutes in Colombia, the analysis was restricted by data limitations(Larsen 2004). Costs of deforestation and water pollution are only partiallyand indirectly estimated because of data limitations. Some of the cost ofdeforestation is captured in the cost of natural disasters (flooding, landslides)and agricultural land degradation insofar as deforestation contributes to natu-ral disasters and soil erosion. Other costs of deforestation, such as impacts onwater resources and recreational value, are not estimated. The cost of waterpollution is captured only in terms of waterborne (diarrheal) illnesses. Othercosts, such as potential impacts of heavy metals and chemicals on health andrecreational value, or biodiversity loss are not estimated.
2. Estimates of public environmental expenditure in Colombia are based on apublic environmental expenditure review prepared by Canal (2004).
l Executive Summary

3. According to government information (CONPES 3343 2005, p. 10), “28 per-cent of municipalities lack potable water services and 40 percent do not pos-sess sewerage connections. Sewerage coverage levels increased between 1980and 2005.” Analysis conducted by the government (MAVDT 2006, p. 2) indi-cates that “although national budgetary resources have been directed towardaddressing these coverage deficiencies, there have been problems in theefficiency and execution of resource expenditures, which is not to say thatpolicies aimed at addressing the problem of basic sanitation in Colombia donot exist.”
4. DALYs are a standard measure of the burden of disease. DALYs combine lifeyears lost as a result of illness and disability, with one DALY being equal tothe loss of one healthy life year (Murray and López 1996).
5. Data series published by the National Statistical Administration Department(Departamento Administrativo Nacional de Estadísticas, DANE) indicate thatabout 7.3 percent of child mortality is from diarrheal illness. For diarrhealmorbidity, however, it is very difficult or practically impossible to identify allcases of diarrhea. The main reason is that many cases are not treated or do notrequire treatment at health facilities, and are therefore never recorded. A sec-ond reason is that cases treated by private doctors or clinics are most often notreported to public health authorities. Therefore, household surveys oftenprovide the most reliable indicator of total cases of diarrheal illness. However,most household surveys contain only information on diarrheal illness in chil-dren. Moreover, the surveys only reflect diarrheal prevalence at the time ofthe survey. Because there is often high variation in diarrheal prevalence acrossseasons of the year, extrapolation to an annual average will result in either anover- or underestimate of total annual cases. It is often difficult to correct thisbias without knowledge of seasonal variations.
6. Morbidity and mortality estimates are based on the risk ratio, or dose responsecoefficients by Pope and others (2002). Pope and others (2002) found a statis-tically significant relationship between levels of particulate matter less than2.5 microns in diameter (PM2.5) and mortality rates; all-cause mortality increasedby 4 to 6 percent for every 10 micrograms per cubic meter increase in PM2.5.
7. Smith (2000) provides a review of research studies around the world thathave assessed the magnitude of health effects of indoor air pollution from useof solid fuels. The odds ratios for acute respiratory illness and chronic obstruc-tive pulmonary disease used for estimating health risks associated with indoorair pollution in Colombia are based on Smith (2000).
8. According to government information (CONPES 3343 2005, p. 10), themajority of Colombia’s municipalities “dispose of their solid waste by dis-charging wastes in open garbage dumps or in surface waters, or by burying oropenly burning waste.” The government considers “the primary difficulties inthe disposal of solid wastes to include: (i) inadequate municipal planning withrespect to the useful life of landfills, the assignment of resources, and the lack
Executive Summary li
of an organized system to charge users for services; (ii) insufficient knowledgeregarding the impacts of inadequate disposal on public health and quality oflife (harmful gases, increased illnesses, and polluted water bodies, soils, andecosystems); and (iii) technical, operating, and planning specifications in thecurrent norms that are inconsistent with the capacity of municipalities”(CONPES 3343 2005, p. 10).
9. Title F of Resolution No. 1096 (Technical Regulations for the Potable Waterand Basic Sanitation Sector) establishes technical specifications for the finaldisposal of waste in sanitary landfills. In addition, Decree 838 of 2005 deter-mines a number of criteria for the location of waste disposal sites.
10. In Colombia, diverse economic instruments have been developed for the pro-vision of potable water and sewerage services and to improve water resourcesmanagement, including “a tariff system for public water and sanitation services,charges for water usage, and pollution charges” (MAVDT 2006, p. 3). Accordingto MAVDT (2006), to address the weaknesses and needed improvements ofcurrent economic instruments aimed at controlling pollution, the proposedWater Law presented to Congress in 2005 includes structural reforms such asthe redesign of water usage charges and water pollution charges.
11. According to MAVDT (2006, p. 3), “since 1994 the Ministry, supported byInternational Bank for Reconstruction and Development and InternationalDevelopment Bank financing, has carried out reforestation programs that haverequired effective coordination among regional environmental authorities, ter-ritorial entities, and civil society. These reforestation programs have centeredon protecting watersheds and not on controlling erosion. However, environ-mental authorities from some regions (Caldas, Antioquía, Cundinamarca)have invested in controlling soil erosion for decades. Although the govern-ment has not directed national resources toward preventing erosion, whichhas been effectively managed at the regional level, this does not imply thatcoordination does not exist. It should be kept in mind that there are consid-erable investments in this area, and that budgetary restrictions and the need toattend to other priorities have limited the national government in addressingthis area.”
12. Although the analysis relied extensively on large sets of statistics and datafrom various ministerial departments, institutions, and institutes in Colombia,the analysis was restricted by data limitations (Larsen 2004).
13. The recommendation of assigning a higher priority to the environmentalmanagement actions that provide the greatest benefits to the most vulnerablesegments of the population does not imply that the areas of forestry and waterbasin management should be removed from the environmental agenda.
14. For MAVDT (2006, p. 3), “the limitations of the analysis conducted and thefact that quantitative assessments of the impact of watershed managementand reforestation actions in Colombia are not included in the analysis do not
lii Executive Summary

permit the Ministry to conclude that less priority should be placed on allocat-ing resources to these areas.”
References
CONPES (Consejo Nacional de Política Económica y Social) 3343. 2005.Lineamientos y Estrategias de Desarrollo Sostenible para los Sectores deAgua, Ambiente y Desarrollo Territorial. Departamento Nacional dePlaneación, Ministerio de Ambiente, Vivienda y Desarrollo Territorial,Ministerio de Hacienda y Crédito Público, Bogotá.
Blackman, Allen, Richard Morgenstern, Libardo Montealegre Murcia, and JuanCarlos García de Brigard. 2005. “Review of the Efficiency and Effectivenessof Colombia’s Environmental Policies. Final Report to the World Bank.”Resources for the Future, Washington, DC.
Canal, F. 2004. “Orientación del Presupuesto de las Corporaciones AutónomasRegionales—CARs—en los Planes de Acción Trianual; Periodos 1995–2003.”Prepared for the World Bank.
CNC (Centro Nacional de Consultoría). 2004. Encuesta de Percepción de PrioridadesAmbientales. Final Report. Consulting contract with World Bank, Bogotá.
Echeverry, Juan, 2002. Prevención y Atención de Desastres en Colombia. Bogotá:Departamento Nacional de Planeación.
IDEAM (Instituto de Hidrología Meteorología y Estudios Ambientales). 1998.El Medio Ambiente en Colombia. Bogotá: IDEAM.
Larsen, Bjorn. 2004. “Cost of Environmental Damage: A Socio-Economic andEnvironmental Health Risk Assessment.” Prepared for Ministerio de Ambiente,Vivienda y Desarrollo Territorial, Colombia.
———. 2005. “Cost of Environmental Damage:Analysis by Department.” Preparedfor Ministerio de Ambiente, Vivienda y Desarrollo Territorial, Colombia.
MAVDT (Ministry of Environment, Housing, and Regional Development). 2006.Comentarios Consolidados al Documento CEA. E-mail sent by LeonardoPinzon, Olga Bautista, and Pedro Chavarro to Angela Armstrong. February 17,2006.
METAP (Mediterranean Environmental Technical Assistance Program). 2000.“Cost of Environmental Degradation Jordan.” Available at www.metap.org.
Ministère de l’Aménagement du Territoire et de l’Environnement. 2002. PlanNacional d’Actions pour l’Environnement et le Développement Durable. Algeria.
Murray, Christopher J. L., and Alan D. López. 1996. Global Burden of Disease.Cambridge, MA: Harvard University Press.
Pope, C. Arden III, Richard T. Burnett, Michael J. Thun, Eugenia E. Calle, DanielKrewski, Kazuhiko Ito, and George D. Thurston. 2002. “Lung Cancer,
Executive Summary liii

Cardiopulmonary Mortality, and Long-Term Exposure to Fine Particulate AirPollution.” Journal of the American Medical Association 287 (9): 1132–41.
Sarraf, Maria, K. Bolt, and Bjorn Larsen. 2004. “Syrian Arab Republic, CostAssessment of Environmental Degradation.” World Bank and MediterraneanEnvironmental Technical Assistance Program. Washington, DC.
Sarraf, Maria, Bjorn Larsen, and Marwan Owaygen. 2004. “Costs of EnvironmentalDegradation: The Case of Lebanon and Tunisia.” Environmental EconomicSeries Paper No. 97, World Bank, Washington, DC.
SIAC (Sistema de Información Ambiental de Colombia, Colombian EnvironmentalInformation System). 2002. Concepts, Definitions and Environmental InformationInstruments in Colombia. Bogotá: Institute of Hydrology, Meteorology andEnvironmental Studies.
Smith, Kirk. 2000. “National Burden of Disease in India from Indoor AirPollution.” Proceedings of the National Academy of Sciences of the United States97 (24): 13286–13293.
WHO (World Health Organization). 2002. Global Burden of Disease 2002.Geneva: WHO.
World Bank. 2002. “Egypt Cost Assessment of Environmental Degradation.”Report No. 25175-EGT, World Bank, Washington, DC.
———. 2003. World Development Indicators 2003. Washington, DC: World Bank.
———. 2005. World Development Indicators. Washington, DC: World Bank.
liv Executive Summary

In the past 50 years, Colombia has succeeded in establishing a decen-tralized and innovative environmental management framework thatincludes roles for multiple stakeholders. The National EnvironmentalSystem (Sistema Nacional Ambiental, SINA) defines roles for differentstakeholders, including financially independent regional environmentalagencies, a central-level ministry responsible for overall policy formula-tion and coordination, and research institutes responsible for collectingand disseminating environmental data. The SINA also defines a role fornongovernmental organizations (NGOs) through their involvement onthe boards of regional agencies, and for the private sector through itssignificant involvement in a Technical Advisory Council to advise onpolicy formulation. Intersectoral coordination is promoted through theNational Environmental Council, which comprises representativesfrom 25 organizations including nine ministers (Planning; Agriculture;Health; Mines and Energy; Education; Transport; Defense; Commerce;and Environment, Housing, and Regional Development) and six rep-resentatives from business and industry associations (oil and gas, mining,export, manufacturing, forestry, and agriculture).
Environmental degradation in Colombia disproportionately affectsthe health and productivity of poor people.The impact of human activities
C H A P T E R 1
Overview
1

on the environment threatens the well-being of current and futuregenerations by creating problems such as (a) localized environmentalhealth problems associated with inadequate household water quality,sanitation, and hygiene and with indoor air pollution; (b) urban andregional air pollution, suboptimal waste management, and contamination ofrivers, lakes, and coastal areas; and (c) natural resource degradation andworsening of global environmental problems such as global warming.
In Colombia, lack of access to clean water, poor or nonexistent sani-tation services, and indoor air pollution are among the principal causesof illness and death, predominantly for children and women in poorhouseholds.The effects of these principal causes of environmental degra-dation are estimated to cost more than 3.7 percent of Colombia’s grossdomestic product (GDP), mainly because of increased mortality andmorbidity and decreased productivity associated with four causes(Larsen 2004). The first is poor ambient air quality in urban areas causedby industrial, commercial, residential, and vehicle emissions, and poorindoor air quality in rural areas caused by the use of fuelwood for cook-ing and heating. The second is insufficient water supply, sanitation, andhygiene. The third is natural disasters. The fourth is land erosion andsalinization (Larsen 2004).
Over the past five decades, Colombia has restructured its legal andregulatory landscape, undertaken numerous policy initiatives, and dra-matically expanded and strengthened its institutional capacity forprotecting and managing the natural resources and environmentalquality that are vital to sustainable growth and poverty reduction.Although the government made significant advances, such as estab-lishing a system of national parks and forestry reserves that coversnearly a quarter of the national territory and phasing out leaded gaso-line, it still faces the serious challenge of slowing and reversing envi-ronmental degradation.
Objectives of the Country Environmental Analysis
The objective of the country environmental analysis (CEA) is to pres-ent an analytical framework to support the efforts of the government ofColombia toward achieving the Millennium Development Goals(MDGs). Particular focal points are Goal 7, ensuring environmentalsustainability, and two of the targets within Goal 7—Target 9, integrat-ing the principles of sustainable development into country policies andprograms and reversing the losses of environmental resources, and
2 Sánchez-Triana, Ahmed, and Awe

Target 11, achieving a significant improvement in the lives of urbanslum dwellers.
Through its examination of urban environmental issues such as airpollution and untreated drinking water, which affect the most vulnerablepopulation groups, CEA also provides the analytical underpinnings todesign policies aimed at achieving MDG 4, which aims to reduce childmortality, by addressing the causes of respiratory illness, diarrhea, andother principal factors in morbidity and mortality for children underage five.
The findings of CEA are specifically expected to help design andimplement policies to (a) improve the effectiveness and efficiency ofColombia’s SINA and (b) integrate principles of sustainable develop-ment into key sector policies, with an emphasis on protecting the mostvulnerable groups. The main elements of CEA include analyses of (a) theinstitutional capacity for environmental management in Colombia;(b) the cost of environmental degradation; and (c) the effectiveness andefficiency of existing policy, and legislative and regulatory frameworks toaddress priority environmental concerns.
CEA Process and Summary
Preparation of CEA began in January 2004, in parallel with the prepara-tion of the Programmatic Development Policy Loan for SustainableDevelopment. The findings of the main studies conducted during CEAwere presented to national stakeholders and development partners at anAugust 2004 workshop in Bogotá. From January to September 2004, anumber of smaller workshops and meetings were held to discussmethodology, gather data, and discuss emerging results with smallerstakeholder groups. These groups included representatives from sectoralministries, Autonomous Regional Corporations (Corporaciones AutónomasRegionales, CARs), the control agencies, academia, the private sector,Congress, the National Planning Department (Departamento Nacional dePlaneación, DNP), bilateral agencies active in Colombia, and otherdevelopment partners.
The report has 14 chapters. Chapter 1 presents an overview of thereport. Chapter 2 examines the evolution of Colombia’s environmen-tal management framework over the period from 1952 to 2005,including the establishment of CARs; the development of the NationalCode for Renewable Natural Resources and Environmental Protection,which remains Colombia’s most important environmental management
Overview 3

regulation; the role of the Ministry of Health in pollution control; thepassage and implementation of the National Sanitary Code of 1979;and the establishment in 1993 of the Ministry of Environment and 33CARs as part of the newly organized SINA. Also discussed is the gov-ernment of Colombia’s 2002 decision to merge the Ministries ofEnvironment and Development and to phase out the EnvironmentalDirectorate in the National Planning Department.
Chapters 3 and 4 analyze the performance of various SINA agencies,including the Ministry of Environment, Housing and RegionalDevelopment (Ministerio de Ambiente, Vivienda y Desarrollo Territorial,MAVDT); research centers; environmental financing funds; the controlauthorities; and CARs. Chapter 4 identifies the major challenges to miti-gating environmental degradation and includes a series of suggestedactions to tackle identified institutional problems.
Chapter 5 analyzes the cost of environmental degradation in Colombia.The analysis shows that the environment-related problems with thehighest costs are urban and indoor air pollution; inadequate water supply,sanitation, and hygiene; natural disasters; and land degradation. Theburden of these costs falls most heavily on vulnerable segments of thepopulation, especially poor children under age five. Chapter 5 also presentsthe results of a 2004 survey of public perceptions about Colombia’senvironmental problems and reveals that while the vast majority ofrespondents identified air pollution as the top environmental problem,there were significant differences in priorities among income groups.Theanalysis supports the notion that the most vulnerable groups, who bearthe greatest costs of environmental degradation, traditionally have notbeen taken into account in policy making and lack an effective voice asa constituency.
Chapter 6 shows that although Colombia has achieved substantialreductions in child mortality, including mortality from diarrheal diseases,the costs of diarrheal morbidity from contaminated water and poorhygiene in both children and adults is still high.The poorest groups oftenlack adequate sanitation and water supply, largely because of the lack ofpolicies that explicitly address these problems. Alternative interventionsare analyzed to address waterborne diseases.
Chapters 7 and 8 show that air pollution is one of the most wide-spread and serious problems in Colombia’s cities and rural areas.Although air pollution levels in most cities are moderate, close to 50 per-cent of the population is concentrated in large cities (with more than
4 Sánchez-Triana, Ahmed, and Awe

100,000 inhabitants) where the pollution problems and health effectsare the worst, especially from particulate matter. The chapters concludethat there is an urgent need to update regulations and issue standardsand economic instruments aimed at reducing airborne particulate mat-ter, and to allocate sufficient financial and human resources to addressair pollution, leading to the use of cleaner fuels, improved cook stoves,and better housing design.
Chapter 9 discusses urban environmental management issues andhighlights two main sets of problems associated with housing andurban planning and with waste management and disposal. Althoughfew regulations are in place on these issues, environmental authoritieshave not made them a high priority or allocated sufficient financialresources from the Urban Environmental Authorities (AutoridadesAmbientales Urbanas, AAUs) and the national government to addressproblems such as how to adequately manage the roughly 27,500 tonsof solid waste generated daily in Colombia. The chapter addresses theimportance of developing policies to operate effective regional wastedisposal sites and establish and enforce regulations to segregate andtreat hazardous wastes.
Chapter 10 discusses problems associated with natural disasters, par-ticularly floods and landslides, the management of which falls under themandate of SINA. More than 4 million Colombians were affected bynatural disasters during 1993 to 2000, at an annual cost of approximate-ly US$453 million (Echeverry Garzón 2002). The poorest and mostvulnerable have paid the highest costs for these disasters in damages,deaths, and lost assets. A number of actions are recommended to addressthis issue, particularly nonstructural measures to prevent human settle-ments in areas that are highly vulnerable to natural disasters.
Chapter 11 discusses problems associated with water resources man-agement, and particularly allocation of water rights and degradation ofwater bodies. Existing regulations do not efficiently respond to some ofthe most urgent problems related to the allocation of water rights, suchas small farmers’ and indigenous peoples’ access to water rights. In addi-tion, national regulations often create bottlenecks in managing waterresources and processing water permits and are ineffective in controllingthe degradation of watersheds and water bodies. The chapter providesrecommendations in several areas, including water quality and hazardouspollutants, sources of pollution, water runoff and urban drainage, vulner-ability to natural disasters, conservation of important water ecosystems,
Overview 5

and clarification of the roles of government agencies involved in waterresources management. The chapter also addresses the need to reformwater pollution fees and wastewater discharge standards and to increaseaccountability, transparency, and governance to promote compliancewith water quality standards.
Chapter 12 discusses erosion, salinization, and deforestation, andillustrates the need for stronger efforts to address the problems of landdegradation. The analysis suggests that the investments made in refor-estation by states, municipalities, environmental authorities, and CARshave had little or no impact on erosion control and regulation of waterstreams. The chapter recommends incorporating provisions into the pro-posed national forestry bill that would secure the rights of indigenouspeoples and small farmers.
Chapter 13 discusses the most salient global environmental prob-lems perceived in Colombia: biodiversity loss, climate change, andozone depletion. The analysis emphasizes the challenges associatedwith the National Parks System. It suggests that the creation ofnational parks by the government could have been more sensitive tothe rights of local stakeholders. Protected areas legislation, which isstill in effect, has limited the use of traditional production systemsand natural resources by local inhabitants and has allowed parks to becreated on private lands with unclear compensation measures for landtaken. The chapter recommends that institutional mechanisms beestablished to prevent and resolve conflicts between conservationinterests and other social priorities, such as regional, social, and eco-nomic development.
Chapter 14 summarizes the main conclusions and finds that theinstitutional system might need to be strengthened to effectively sup-port government efforts to promote environmentally sustainabledevelopment, in particular by allocating human and financial resourcesto address key environmental priorities that are linked to economicdevelopment. The chapter highlights the need for policy and institu-tional changes to address these priorities and to target complementaryinvestments toward areas that impose high economic costs but thathave not been adequately tackled. In particular, increased efforts areneeded to improve the quality of life of the growing number of poorpeople living in and around urban areas in a country where more than70 percent of the population is urban. The goal of the recommenda-tions is to support the country’s efforts to move toward more equitableand sustainable economic growth.
6 Sánchez-Triana, Ahmed, and Awe

References
Echeverry Garzón, Juan Carlos. 2002. Prevención y Atención de Desastres enColombia. Bogotá: Departamento Nacional de Planeación.
Larsen, Bjorn. 2004. “Cost of Environmental Damage: A Socio-Economic andEnvironmental Health Risk Assessment.” Consulting Report. Prepared forMinisterio de Ambiente, Vivienda y Desarollo Territorial, Bogotá.
Overview 7


The evolution of Colombia’s environmental institutions over the past 50 yearshas led to a unique decentralized environmental management framework. Overthe period from 1952 to 1974, a decentralized water resources developmentsystem was established through the creation of Autonomous RegionalCorporations (CARs) and the National Institute of Renewable NaturalResources (INDERENA). In 1974, Colombia’s most important environmentalregulation, the National Code for Renewable Natural Resources andEnvironmental Protection, was developed. During 1975 to 1993, INDERENAwas very effective in establishing a system of national protected areas, andCARs were also effective in developing water resources and other infrastruc-ture projects. The 1991 Constitution and Law 99 of 1993 led to the creationof Colombia’s National Environmental System (SINA). During 1994 to2005, SINA agencies focused their efforts on implementing environmentalinvestment projects in watershed management, reforestation, and constructionof wastewater treatment plants. After 2002, the Ministries of Environment andDevelopment merged, opening opportunities for environmental mainstreaming.
This chapter examines the evolution of Colombia’s environmentalmanagement framework during three periods between 1952 and 2005.The findings of this chapter are based on secondary information andinterviews conducted in Colombia in 2004.1
C H A P T E R 2
A Unique Model for
Environmental Management
9

In 1952, Colombia created the Division of Renewable NaturalResources within the Ministry of Agriculture. Two years later the firstAutonomous Regional Corporation (Corporación Autónoma Regional,CAR), the Autonomous Regional Corporation of the Cauca Valley(Corporación Autónoma Regional del Valle del Cauca, CVC), was estab-lished to promote integrated economic development in the Cauca Valleyregion. These two organizations were the beginning of what wouldbecome an independent environmental ministry, a coordinated nationalenvironmental system, and an extensive network of financiallyautonomous regional environmental authorities.
Environmental regulations approved in the 1960s and 1970s includedthe 1969 Forestry Law, a 1977 statute creating the National ParksSystem, and a 1973 statute on flora and fauna. By far the most importantnew legislation, however, was the 1974 National Code for RenewableNatural Resources and Environmental Protection (Código Nacional deRecursos Naturales y de Protección al Medio Ambiente, CNRN), a compre-hensive statute that remains Colombia’s most important regulation forenvironmental and natural resources management. The code has 340articles covering water, air, solid and hazardous waste, soil, flora, and fauna,and it was one of the first environmental protection laws in the world toincorporate pollution fees and environmental impact assessments.
During the 1980s, Colombia designed and implemented air and waterpollution control regulations. The 1991 Constitution and Law 99 of1993 marked the formation of both the National Environmental System(Sistema Nacional Ambiental, SINA), which established 37 organizationsfor environmental management and research in the country, and theMinistry of Environment (Ministerio del Medio Ambiente, MMA). In2003, the Ministry of Environment was merged with the Ministry ofEconomic Development to form the current Ministry of Environment,Housing, and Regional Development (Ministerio de Ambiente, Vivienda yDesarrollo Territorial, MAVDT).This study reviews SINA’s evolution andpresents in chapters 3 and 4 the results of two different institutionalassessments of its current functioning.
Institutional and Legal Foundations: 1952–74
Since the early 1950s, the Colombian environmental managementframework has been evolving as a decentralized structure based onregional agencies.This section provides a brief overview of the developmentof Colombia’s environmental institutions and capacity through 1974,
10 Sánchez-Triana

when the government issued the CNRN. Modern national environmentalmanagement in Colombia began in 1952 with the creation of theDivision of Natural Resources within the Ministry of Agriculture. Thedivision’s mission was to ensure the rational development of naturalresources such as forests and fisheries. Administration was centralizedand funding was derived exclusively from the national budget, in linewith an institutional structure that was virtually universal in Colombiaat the time (MMA 2002; Sánchez-Triana 1999). Under the division’sleadership, Colombia’s first forest conservation regulations were issuedand seven sizable protected areas were created (MMA 2002).
Colombia’s first regional development corporation was the CVC,created in 1954 to promote integrated regional economic development(MMA 2002). The CVC’s geographic boundaries were defined by theCauca Valley watershed. The CVC’s design was strongly influenced bycontemporary thinking about development planning in North Americaand Latin America and was modeled after the U.S. Tennessee ValleyAuthority (Arboleda and others 1981, 1982).
From 1954 to 1993, the functions of regional development corporations,CARs, were associated with the promotion of regional economicdevelopment.2 This has allowed them to pursue a wide range of activities,including energy generation and transmission projects, road infrastruc-ture, erosion control, and telecommunications. During 1954 to 1993,CARs gave priority to infrastructure and agricultural developmentprojects whose broad mandates allowed them to carry out activities indifferent areas, including subsidizing some economic sectors throughthe transfer of financial resources (such as setting up and managingirrigation schemes).
In 1961, the National Congress established the Corporation for theMagdalena Valley and Northern Colombia (Corporación del Valle delMagdalena y Norte de Colombia, CVM) and the Corporation for theBogotá Savanna and the Ubaté and Chiquinquirá Valleys (CorporaciónAutónoma Regional de la Sabana de Bogotá y los Valles de Ubaté yChiquinquirá, CAR). The mandate of these organizations was to developwater resources and infrastructure linked with agricultural development(Arboleda and others 1981, 1982).The CVM was established to promoteeconomic development in the Magdalena River Valley, but it was soonfound that other government agencies had overlapping functions in theseareas. Therefore, the CVM specialized in natural resources conservation,establishment and management of national parks, and reforestation(Currie 1988).
A Unique Model for Environmental Management 11

In 1965, the city of Bucaramanga established a partnership with twonational government entities, the Institute for Territorial Credit and theInstitute for Municipal Development. This association was called theAutomonous Regional Corporation for the Defense of the BucaramangaPlateau (Corporación Autónoma Regional de Defensa de la Meseta deBucaramanga, CDMB) and was later converted into the sewerage utilityof Bucaramanga (Arboleda and others 1981, 1982). See table 2.1 forsome of the characteristics of CARs established during this time.
During 1955 to 1968, CARs were attached to the Ministry ofDevelopment, because they were established to promote regional eco-nomic development. In 1964, Congress established the AutonomousRegional Corporation of Quindío (Corporación Autónoma Regional delQuindío, CRQ) to promote rural electrification in a department of thecoffee-growing area, followed in 1968 by the Corporation for theSustainable Development of the Chocó (Corporación para el DesarrolloSostenible del Chocó, CODECHOCO) to promote economic develop-ment in the Pacific region and to build a canal linking the Pacific and theAtlantic oceans using the Atrato River. The Corporation for theSustainable Development of Urabá (Corporación para el DesarrolloSostenible del Urabá, CORPOURABA) was also established in 1968 to
12 Sánchez-Triana
Table 2.1 Characteristics of Corporations Established during 1954 to 1971
Name Created Principal responsibilities Area of jurisdiction
CVC 1954 Development of water resources Upper parts of the Cauca River
CVM 1960 Development of water resources Magdalena River
CAR 1961 Development of water resources, Bogotá Savanna and the
telecommunications, and valleys of Ubaté and
infrastructure Chiquinquirá
CRQ 1964 Transmission and distribution Department of Quindío
of energy
CDMB 1965 Soil erosion control and City of Bucaramanga
sewerage services
CODECHOCO 1968 Development of infrastructure Department of Chocó
CORPOURABA 1968 Rural and agricultural development Urabá zone in the
Department of Antioquía
CRAMSA 1971 Erosion control Cities of Manizales, Salamina,
and Aranzazu
Source: Sánchez-Triana 1999.
Note: CODECHOCO = Corporation for the Sustainable Development of the Chocó (Corporación para el Desarrollo
Sostenible del Chocó), CORPOURABA = Corporation for the Sustainable Development of Urabá (Corporación para el
Desarrollo Sostenible del Urabá), CRAMSA = Autonomous Regional Corporation of Manizales, Salamina, and Aranzazu
(Corporación Autónoma Regional de Manizales, Salamina, y Aranzazu), CRQ = Autonomous Regional Corporation of
Quindío (Corporación Autónoma Regional del Quindío).

promote improvement in public services, integrate road networks, andpromote agricultural activity in the banana-growing areas (Arboleda andothers 1981). In 1973, the Autonomous Regional Corporation of theSinú and San Jorge River Valleys (Corporación Autónoma Regional de losValles del Sinú y San Jorge, CVS) was established to develop waterresources projects and promote agricultural development in northeast-ern Colombia.The original mission of some corporations was to promotereconstruction in areas affected by natural disasters. For example, at thebeginning of the 1970s Congress established the CAR for Manizales,Salamina, and Aranzazu (Corporación Autónoma Regional de Manizales,Salamina, y Aranzazu, CRAMSA) to control landslides and soil erosion.
By 1961, watersheds ceased to define the geographic boundaries ofCARs, in large part because each of Colombia’s departments wanted tohave its own CAR (Rodríguez Becerra 1998). During this period,national funding accounted for approximately half of CAR budgets.The other half was generated by fees for the provision of sanitation andother services, water pollution fees, and municipal property taxes,among others.
Although the majority of CARs focused their resources on building ofinfrastructure, land development, and ranching, their functions werequite varied and included electricity generation and transmission,telecommunications, transportation, flood control, sanitation, potablewater, and cattle ranching (Sánchez-Triana 1999). Although they werefirst attached to the Ministry of Economic Development (1960–68) andthen to the Ministry of Agriculture (1968–77), they retained responsibil-ity for management of natural resources and economic development(MMA 2002; Sánchez-Triana 1999, 2001).
In 1968, Presidential Decree 2429 transformed the CVM into theNational Institute of Renewable Natural Resources (Instituto Nacionalde los Recursos Naturales Renovables, INDERENA) by fusing it with theDivision of Renewable Natural Resources in the Ministry of Agriculture.By this time, the CVM was perceived as an effective and necessaryorganization for natural resources conservation; at its conversion toINDERENA (Carrizosa y Asociados 1990; Currie 1988) its area of juris-diction was broadened to cover the entire national territory. INDERENA’sprincipal responsibilities were management of the National Parks Systemand promotion of investment projects in fisheries and reforestation(Sánchez-Triana 1999).
Under INDERENA’s leadership, Colombia made a number of impor-tant advances in environmental management, including the 1969 Forestry
A Unique Model for Environmental Management 13

Law and the 1974 National Code for Renewable Natural Resources andEnvironmental Protection (Suárez, Montenegro, and Carrasquilla 2005).3
The code’s first regulatory decrees, issued between 1974 and 1978, dealtwith a variety of topics, including management of forestry reserve areas,provision of environmental education, and protection of wild fauna andhydrobiological resources (MMA 2002).
Expansion of Roles and Legal Frameworks: 1975–93
CARs were attached to the Ministry of Agriculture until 1977, and thento the National Planning Department (Departamento Nacional dePlaneación, DNP) between 1977 and 1993. In 1987, CARs’ responsibili-ties were clarified by transferring functions such as road infrastructureand telecommunications to other specialized entities. CARs kept respon-sibility for management of natural resources and economic development(Sánchez-Triana 1999).
In the 1980s, Congress established many CARs, including CARDER,CORMAGDALENA, CORNARE, CORPOCESAR, CORPOGUAJIRA,and CORTOLIMA, and gave them responsibility for implementing pro-jects in water resources, natural resources management, environmentalsanitation, erosion control, and other infrastructure to promote regionaldevelopment. Congress also gave CARs responsibility for controllingwater pollution. Two other CARs were established in the 1980s, theCorporation of Narino-Putumayo (Corporación de Narino-Putumayo,CNP) and the Autonomous Regional Corporation of FronteraNororiental (Corporación Autónoma Regional de la Frontera Nororiental,CORPONOR). The mandate of these CARs was economic develop-ment in the border areas with Ecuador and República Bolivariana deVenezuela, respectively.
During 1954 to 1993, most of the investments made by the corporationswere directed toward energy and infrastructure. Five of these corporations(CAR, CODECHOCO, CORNARE, CRQ, and CVC) focused on elec-tricity transmission and distribution programs, and only one (CVC) focusedon electricity generation. The CVC constructed nearly 3,000 kilometersof electricity lines.
The corporations also gave priority to developing the agriculturalsector, which traditionally was very important in the portfolio of stateinvestment projects as a way for local politicians to stimulate the agricul-tural economy. The corporations’ investments in this sector includedirrigation and drainage districts, training, credit, technical assistance and
14 Sánchez-Triana

agricultural extension services, marketing, and animal vaccinations. CARsalso initiated integrated watershed management projects, which includedreforestation, land use management, erosion control, and aquaculture.
The CVC’s Salvajina project, begun in 1979, was the largest andmost important civil works project related to hydroelectric powerdevelopment, flood control, and pollution control that was ever under-taken by a CAR. This project became the source of many environmen-tal regulations enacted in Colombia, such as water pollution charges.Infrastructure projects carried out by CARs, specifically the AutonomousRegional Corporation of Cundinamarca (Corporacíon AutónomaRegional de Cundinamarca, CAR), CODECHOCO, CORPOURABA,CORTOLIMA, CRQ, and CVC, include construction of urban andrural roads, bridges, airports, transportation terminals, markets, healthcenters, schools, and housing. In the area of communications, CARCundinamarca, together with the state-owned telecommunicationscompany (Telecom), expanded the rural telephone system in 24 munici-palities in the Bogotá Savanna, including construction of 600 kilometersof new lines to create automatic connections among 41 municipalities. Atthe same time, financing, construction, and operation and maintenanceof the water and sewerage systems and the urban trash collection systemwere a major portion of CARs’ investments. The corporations carriedout more than 180 water sanitation projects, with one corporation,CDMB, serving as the sewerage utility for the city of Bucaramanga.
The CAR Cundinamarca’s 1985 Regional Master Plan forEnvironmental Quality stands out among the environmental sanitationprojects. Under this plan, the CAR Cundinamarca built and put into oper-ation wastewater treatment plants in some municipalities of the BogotáSavanna, and in 1991, it took a Col$107,500 million (US$50 million)loan from the Inter-American Development Bank for a program thatincluded the construction of 23 municipal wastewater treatment plants,25 sanitary landfills, and 9 systems for pretreatment and clean productionin municipal slaughterhouses.
While the corporations were engaged in a variety of activities, theirmain priority was building infrastructure for water resources. These pro-jects allowed resources to be transferred from their sources to supportdevelopment of other sectors such as agriculture. The corporationsfinanced their activities with funding from the national budget, the prop-erty tax (particularly CAR Cundinamarca), transfers from the electricitysector (particularly CORNARE), windfalls from mining (particularly CVS),and tariffs on electricity (particularly CVC).Total budget expenditures by
A Unique Model for Environmental Management 15

the regional corporations during 1970 to 1994 were US$2.58 billion inconstant 1975 dollars.
During this time, INDERENA faced three important challenges. First,it had a small budget relative to its responsibilities. By the end of the1980s, Colombia’s 18 CARs covered only a quarter of the national ter-ritory; INDERENA was completely responsible for environmental man-agement in the remaining territory. Julio Carrizosa, a former INDERENAdirector, pointed out that his organization had less than Col$5 pesos toprotect each hectare of national territory, whereas CVC had more thanCol$17,000 pesos (US$7.91) per hectare (MMA 2002).
Second, like the Division of Natural Resources, INDERENA was limitedby its affiliation with the Ministry of Agriculture. INDERENA worked toprotect the same natural resources that ministry offices sought to develop.Manuel Rodríguez, the last Director of INDERENA and the first Ministerof the Environment, points out that INDERENA was greatly weakened by“the secondary position that it occupied in the Ministry of Agriculture andthe conflict inherent in the fact that [the Ministry] was one of the principalusers of renewable natural resources” (Rodríguez Becerra 1994).
Third, INDERENA—and environmental management generally—wasweakened by the continued dispersion of environmental functions acrossdifferent national and regional organizations, including the Ministry ofHealth; the Ministry of Mining and Energy; the Institute of Hydrology,Meteorology, and Land Suitability; the Maritime and Ports Directorate;and the DNP. The creation of INDERENA seems to have done littleto rectify this situation. For instance, several responsibilities relating toenvironmental licensing of mines were transferred from INDERENA tothe Ministry of Mining, while fisheries management was transferred to anew National Institute of Fishing. Simultaneously, INDERENAgradually lost jurisdiction in the areas where 16 new CARs were created.According to Rodríguez Becerra, this dispersion amounted to a “slowdeath through dismemberment,” a “process that was never planned”(Rodríguez Becerra 1994).
From 1975 to 1993, the Ministry of Health was the primary governmentactor in efforts to control pollution, using the authority granted by the1979 enactment of the National Sanitary Code that covered, in particular,air pollution, waste management, and solid waste disposal. In 1993,responsibility for air pollution control and solid waste management wastransferred to the Ministry of Environment.
In the mid-1980s, Colombian environmentalists and concerned stake-holders both within and outside the fledgling environmental management
16 Sánchez-Triana

bureaucracy formed an alliance. This development was encouraged by theunprecedented international attention then being devoted to environ-mental issues in developing countries. It was also spurred by increasingevidence of a rapid deterioration of environmental quality in Colombia(Rodríguez Becerra 1994). This new alliance lobbied for a major restruc-turing of environmental management in the country. INDERENA encour-aged and participated in this effort. An important theme of the debatewas whether and how to establish a national environmental authority,which at the time was a trend throughout Latin America (Dillinger andWebb 1999). A 1985 study of environmental management in Colombia,contracted by INDERENA, concluded that such an initiative was in order(MMA 2002) and that administration and management of renewable nat-ural resources could be performed better with the creation of a nationaladministrative department (Rodríguez Becerra 1994).
These currents culminated in INDERENA’s proposal to create an inde-pendent Administrative Department of Renewable Natural Resources(Departamento Administrativo de Recursos Naturales Renovables, DARNAR)that would raise the status of environmental management. However, theproposal was controversial and failed because it threatened the CARs’autonomy (MMA 2002). Yet, the alliance of environmentalists continuedto call for the creation of a national entity responsible for coordinating envi-ronmental management.
In November 1990, Congress considered a bill to create a new nationalenvironmental system, including a national ministry that would coordinatethe decentralized management. This coincided with the 1991 constitu-tional reform, which significantly changed the structure of governance inall sectors (see the next section). The design of the proposed environ-mental system was adjusted in response to the ratification of the newConstitution. The first important government documents on environ-mental policy reform—issued by the National Council on Economic andSocial Policy (Consejo Nacional de Política Económica y Social,CONPES)—were approved in 1991 and paved the way for the creationof SINA in 1993.
The 1991 Constitution and Law 99 of 1993
The two legislative pillars of Colombia’s current environmental manage-ment system are the Constitution of 1991 and Law 99 of 1993. One ofthe key purposes of the 1991 constitutional reform was to establish amore decentralized and participatory government. To that end, the
A Unique Model for Environmental Management 17

Constitution gives departments, municipalities, and CARs autonomy toplan and administer local policy (in coordination with national planning),pass local decrees and ordinances, and impose taxes that are not transfer-able to the national level. The Constitution did not abolish a unitarygovernment, but departments, municipalities, and CARs are all part ofthe executive branch of the national government. Furthermore, governorsand mayors are elected by the public, but are agents of the presidentwho can remove them from office.
The governance structure of CARs and their relationship to thenational government are similar to that of departments and municipalities.The Constitution gives Congress the power to create and regulate thefunctioning of CARs, and specifically requires that they be autonomous.The Constitution created one CAR, the CAR del Río Grande de laMagdalena, with the specific purpose of developing and managing waterresources in the Magdalena River basin.
The 1991 Constitution envisions a government with extensiveplanning responsibilities, including those related to environmentalprotection. It creates a National System of Planning and requires thepresident to draft a National Development Plan and to present theplan to Congress within six months of taking office. This plan, whichtypically includes environmental provisions, must include long-termgoals, medium-term priorities for action, and short-term strategies forimplementation. The territorial governments are required to developplans in consultation with the national government under the adviceof territorial planning councils. Law 99 adopted the same generalplanning structure for CARs.
The Constitution creates a dedicated revenue base for the government’senvironmental protection activities. Municipalities must transfer apercentage of municipal property taxes to CARs for environmentalmanagement. The Constitution also creates a National Royalty Fundfrom the proceeds of a severance tax on the exploitation of nonrenewableresources. The fund targets investment projects in infrastructure, mining,and ecological preservation. The 1991 Constitution envisions a centralrole for individual citizens and nongovernmental organizations (NGOs)in formulating and implementing environmental policy. In addition tohaving a collective right to a clean environment, citizens have the dutyto protect natural resources and the environment.
The Constitution creates three causes of action through which citizenscan intervene in the Colombian courts to protect the environment. First,any citizen or group of citizens can bring a popular action (acción popular)
18 Sánchez-Triana

to protect their collective right to a clean environment, even if theycannot demonstrate direct, personal damage. Second, any person canbring a compliance action (acción de cumplimiento) to ensure that laws—including environmental laws—are upheld. Finally, the Constitutionallows the law to establish cases in which an action requesting injunctiverelief (acción de tutela) can be brought to prevent violation of fundamentalrights. The Constitution also requires that the law establish those casesin which an acción de tutela can be brought to protect “the collectiveinterest.” The Constitutional Court of Colombia has interpreted theConstitution to allow an acción de tutela to protect the right to a cleanenvironment where environmental deterioration threatens humanhealth (Iguarán 2001). This has proved to be an important tool inenvironmental protection because it provides virtually immediateinjunctive relief—courts must issue a decision within 10 days.
Aside from these mechanisms of participation that depend on accessto courts, the 1991 Constitution guarantees the communities’ participationin decisions that may affect them, and states that an essential purpose ofgovernment is to facilitate such participation. It deals specifically withimplications of these provisions for the environmental sector. It stipu-lates that the state has a duty to provide citizens with sufficient under-standing about environmental protection to enable them to fulfill theirduty to protect the environment. In addition, it specifically requiresadoption of statutes that guarantee community participation in decisionsthat affect the environment.
The Constitution creates several general mechanisms for publicparticipation, including the right to petition public authorities andpublic hearings, open meetings, referendums, and standard participationin elections. For the most part, the Constitution does not specify preciselyhow these mechanisms will be implemented. However, in the case of theContraloría General de la República,4 the Constitution does requireadoption of laws that create systems to allow citizens to monitor publicfiscal management at all levels of government.
Law 99 creates Colombia’s National Environmental System (SistemaNacional Ambiental, SINA), a “set of orientations, norms, activities,resources, programs, and institutions that allow the implementation ofgeneral environmental principles.” Consistent with the 1991 Constitution,this management system was to be decentralized, democratic, and partici-patory (box 2.1).As discussed in detail in Blackman and others (2004), forheuristic purposes, the SINA may be thought of as a management systemmade up of institutional actors, coordination and planning mechanisms,
A Unique Model for Environmental Management 19

20 Sánchez-Triana
Box 2.1
Colombia’s National Environmental System
Law 99 of 1993 created both the National Environmental System (SINA) and
Colombia’s Ministry of Environment (now the Ministry of Environment, Housing
and Regional Development, MAVDT). The ministry was intended to consolidate
key environmental management functions dispersed throughout the national
government and serve as the cornerstone of SINA, which would help coordinate
environmental management among a range of public and private stakeholders. In
keeping with the 1991 Constitution, SINA was to be decentralized, democratic,
and participatory. Law 99 defines SINA as a “set of orientations, norms, activities,
resources, programs, and institutions that allow the implementation of general
environmental principles”around a model of sustainable development. The princi-
pal institutional elements of SINA include the following:
Key government environmental Other national government institutions
authorities with environmental responsibilities
• MAVDT • National Planning Department
• National Parks System • Government oversight institutions
• CARs and Urban Environmental � Contraloría
Authorities (Autoridades Ambientales � Procuraduría
Urbanas, AAUs) • Ministries other than MAVTD
Territorial authorities• Research institutes
• Departments and municipalities• National Environmental Council
• Territories of Indigenous Peoples • Technical Advisory Council
Civil society
• Environmental NGOs
• Universities and private research
institutions
• Commercial firms and farms
The guiding principles of SINA are that (a) economic and social development
will be guided by the goal of sustainable development laid out in the 1992 Rio
Conference; (b) biodiversity must be protected and should be exploited only in
a sustainable manner; (c) human consumption is the highest priority for water
use; (d) environmental policy will be based on the best available scientific
evidence, and action should be taken to prevent possible serious irreversible

A Unique Model for Environmental Management 21
damage even if that evidence is incomplete; (e) environmental costs will be
incorporated into policies and markets to help conserve the environment and
renewable natural resources; (f ) environmental protection is a coordinated task
among the state, communities, NGOs, and the private sector, and to promote
this vision, the state will support the development of environmental NGOs and
may delegate some government functions to them; and (g) environmental
impact studies will be the basic instrument for deciding whether to engage in
activities that might significantly affect the environment.
SINA instruments for governance and management include legal norms
such as environmental laws, presidential decrees, enforcement actions, environ-
mental licensing, command-and-control regulations, voluntary agreements, and
economic instruments such as effluent fees.
Under Law 99, the MAVDT is responsible for planning national environmental
policy. The regional authorities, including the CARs and AAUs, are responsible for
implementing it. In addition, requirements and regulations adopted by lower
levels of government cannot be weaker than, nor weaken, norms established by
higher levels of government. However, the CARs are largely autonomous entities
that define their own priorities and investment programs.
Source: Adapted from Blackman and others (2004).
public participation mechanisms, legal norms, policy implementation andenforcement mechanisms, and financial resources.
Law 99 created the Ministry of the Environment (Ministerio del MedioAmbiente, MMA) to consolidate many of the principal environmentalmanagement functions dispersed throughout various branches of thenational government, and to provide a means of coordinating environmen-tal management in both the public and the private sectors. The MMA’sprincipal roles in SINA are to establish national policy, develop regula-tions, control important fiscal resources, and generally plan and coordinateenvironmental management (Law 99 Art. 2). With these institutionalreforms, Colombia became one of the first Latin American countries toestablish an independent environmental agency at the ministerial level. Inaddition, with the creation of the new ministry, INDERENA was subse-quently phased out.
Similar efforts were carried out throughout the region during the1990s, when most countries responded to growing domestic and inter-national concerns about environmental degradation by developing the

national agencies that continue to govern their respective environmentalsector to this day (table 2.2). Chile’s and Peru’s environmental agenciesnever had ministerial status, while Argentina’s and Cuba’s were clusteredinto larger ministries. Colombia, Mexico, and Argentina have introducedmore recent institutional reforms that have significantly modified thestructures of these organizations. In the case of Colombia, the ministrywas recently grouped with the housing and regional development sectors,as detailed later.
To fulfill its mandate to develop regulations, the MMA sets nationalenvironmental quality standards and criteria to be incorporated intosectoral policies established by agencies and subordinate governments. Itis specifically charged with developing regulations to manage endangeredspecies, conservation, trade of genetic material, marine resources, environ-mental contamination, native forests, the national forest reserves system,and the National Parks System. As coordinator of the SINA system, theMMA is responsible for approving legal rules adopted by CARs and UrbanEnvironmental Authorities (Autoridades Ambientales Urbanas, AAUs).
In addition to coordinating government activity, the MMA helps toalign the environmental activities of nongovernmental actors withnational management goals. For example, the MMA establishes linkswith the private sector and maintains a registry of environmental NGOs(Law 99 Art. 5).
Law 99 also redefined the roles, functions, and jurisdictions of CARs.Although CARs retained some of their economic development functions,
22 Sánchez-Triana
Table 2.2 Creation of Selected National Environmental Organizations
in Latin America
Year Country and institution
1978 Venezuela: Ministry of Environment and Natural Resources
1991 Brazil: Ministry of Environment
1992 Argentina: Secretariat of Natural Resources and Human Environment
1993 Colombia: Ministry of Environment
1994 Chile: National Commission for the Environment
Cuba: Ministry of Science, Technology and Environment
Mexico: Ministry of Environment, Natural Resources and Fisheries
Peru: National Council for the Environment
1996 Costa Rica: Ministry of Environment
1998 Panama: National Environmental Authority
Source: Venezuela: http://www.marn.gov.ve; Brazil: http://www.mma.gov.br; Argentina: Decree 2419/91; Cuba:
CIGEA (2001); Mexico: SEMARNAP (2000); Chile: ECLAC (2005); Peru: CONAM (2001); Costa Rica and Panama:
ANAM (2004).

they were essentially recast as environmental management authorities.Law 99 also established additional CARs, as well as AutonomousSustainable Development Corporations (Corporaciónes Autónomas deDesarrollo Sostenible, CDSs), a similar regional authority in territoriesreserved for indigenous peoples, and AAUs in cities with more than 1 million inhabitants.5 Law 768 of 2002 added two more AAUs, forSanta Marta and Cartagena. This proliferation of regional environmentalauthorities ensured that the entire national territory was under the juris-diction of a regional environmental authority.
Consolidating Institutions, Regulations, and Planning: 1994–2005
During the period from 1994 to 2005, the government focused onstrengthening the environmental agencies within the SINA. This sectiondiscusses the salient activities that took place in that period.
Ministry of EnvironmentThe MMA was created in 1993, and from 1994 to 2005 Colombia hashad seven ministers of environment and four administrations, eachwith different priorities. A National Development Plan was adopted in1995, and during 1994 to 1998 priorities included increasing invest-ments in environmental projects and strengthening the environmentalagencies established under SINA. The plan defined seven programs aspriority actions for improving environmental management: strategicecosystem protection, better water, clean seas and coasts, more forests,better cities and villages, viable population policy, and clean production(MMA 2002).
Over the period from 1998 to 2002, the MMA gave special attentionto biodiversity, biosafety, and rural environmental issues such as forestry,and to international discussions associated with global environmentalproblems. The major achievement from this period was the strengtheningof Colombia’s National Parks System, for which local communities wererecruited to help build in selected locations (MMA 2002).
From 2002 to 2005, two of the administration’s main actions were tomerge most of the functions of the Ministry of Economic Developmentwith the Ministry of Environment to create the new MAVDT, and tophase out, in January 2004, the Environmental Directorate of theNational Planning Department.
A Unique Model for Environmental Management 23

The National Development Plans cover the environmental sector(among others), and although plans do exist for subsectors within theenvironmental sector (such as forestry and environmental research), nosystematic periodic planning exercise exists to establish prioritiesacross environmental programs and subsectors such as forestry, air pol-lution, water resources, and water sanitation.6 This gap has been high-lighted in past evaluations of planning in the SINA (Galán 1998; MMA2002). Planning is generally done sector by sector and, as yet, efforts tobreak out of sectoral boxes to consider prioritization across programsor sectors have not been successful. Galán (1998) noted that withinMMA, efforts had been made to discuss policy documents among sub-directorates, but that, as of five years ago, it had not been possible toarrive at shared concepts that would allow discussion of prioritiesacross program areas.7 As discussed in chapter 3, a review of the Uribeadministration’s 2002–06 National Development Plan reveals littlediscussion of environmental priorities across sectors (Blackman andothers 2004).
According to the U.S. Department of Commerce’s ColombiaEnvironmental Export Market Plan (1999),8 the industrial associationsinfluenced the design and have had notable influence in opposing thedevelopment of strict environmental regulations.9 The U.S. Departmentof Commerce document states that these associations have been success-ful in restricting the development of environmental legislation and theenforcement of pollution prevention and control regulations.10 Accordingto the Contraloría (2004, p. 159), with respect to environmental manage-ment within the business sector “criteria have not been defined to ensurethat, in planning processes, common environmental interests take priorityover the particular economic interests of businesses.”
Environmental Expenditure ReviewThe total budget during 1995–2003 for operation and investments byMAVDT, CARs, the Special Administrative Unit for National NaturalParks (Unidad Administrativa Especial del Sistema de Parques NacionalesNaturales, UAESPNN), research institutions, and the Institute ofHydrology, Meteorology and Environmental Studies (Instituto deHidrología, Meteorología y Estudios Ambientales, IDEAM) is estimated atUS$1.98 billion (the equivalent of Col$5,700 billion, in constant 2003pesos), or an average of US$220 million per year (Col$473,000 million).The average annual environmental expenditure of these organizations(AAUs’ expenditures are not included) is estimated at 0.3 percent of
24 Sánchez-Triana

A Unique Model for Environmental Management 25
Table 2.3 Annual Environmental Expenditure of CARs,
MAVDT, and IDEAM as Percentage of GDP, 1995–2003
Year Percentage of real GDP
1995 0.25
1996 0.31
1997 0.28
1998 0.27
1999 0.34
2000 0.34
2001 0.32
2002 0.30
2003 0.29
Total 0.30
Source: Canal 2004.
19900
0.1
0.2
0.3
0.4
0.5
0.6
0.7
0.8
per
cen
t
year1995 2000 2005
ArgentinaBrazilChileCosta RicaMexicoColombia
Figure 2.1 Public Environmental Expenditure as a Percentage of GDP in Argentina,
Brazil, Chile, Costa Rica, Mexico, and Colombia
Source: Canal 2004.
GDP (equal to Col$688 billion, US$320 million per year) during 1995to 2003 (table 2.3 and figure 2.1). From 1995 to 2003, nearly 35 per-cent of the public environmental expenditures (particularly by CARs)was directed to river basin management, conservation of water bodies,water supply, and wastewater treatment, while another 18 percent wentto biodiversity and green markets, global environmental problems, andreforestation.11 Expenditures on institutional strengthening and enforce-ment account for the other 40 percent of total expenditures.12
CARs account for 81 percent of total estimated environmental expen-ditures, the MAVDT 10 percent (including some allocations to CARs),IDEAM 5 percent, and the UAESPNN 2 percent. Four research institutions

jointly account for the remaining 2 percent of expenditures: the Instituteof Marine and Coastal Research, the Institute of Research on BiologicalResources, the Amazon Institute for Scientific Research, and the Environ-mental Research Institute of the Pacific (figure 2.2).
During 1995 to 2003, 71 percent of SINA funding for operationalexpenditures and 85 percent of its funding for investments was allocat-ed to CARs. Some 78 percent of funding for operational expendituresand 86 percent of funding for investments was self-generated; thebalance came from national budget allocations. CARs raise revenuethrough property taxes, electricity taxes, effluent fees, compensatoryfees, water use fees, licenses and permits, fines and sanctions, the sale ofgoods and services, profits on investments, and interinstitutional agree-ments. Property taxes account for 35 percent of their total revenues,profits on investments 34 percent, electricity taxes 10 percent, interin-stitutional agreements and the sale of goods and services combined 10percent, and effluent fees less than 2 percent. Revenue generated byCARs grew by 89 percent during 1995 to 2003. These figures masksignificant differences among CARs; 82 percent of resources are con-centrated in only 8 of the 33 CARs.13 Total revenues of CARs vary froma low of US$1.35 million (CSB) to a high of US$67.8 million (CVC).Likewise, CAR spending per inhabitant varies greatly, from a low ofUS$1.50 (CORPOCESAR) to a high of US$42.40 (CORPOGUAVIO).Over 1995 to 2003, the expenditures of CARs were distributed amongfour main categories: operational expenses, investments in environmentalprojects, institutional strengthening, and enforcement of environmentalregulations. On average, 60 percent of CARs’ expenditures, not including
26 Sánchez-Triana
0
100
200
300
400
500
600
700
1995 1996 1997 1998 1999year
2000 2001 2002 2003
CARs MAVDTUAESPNNInstitutesIDEAM
con
stan
t 20
03 p
eso
s, m
illio
ns
Figure 2.2 Expenditures of SINA Agencies, 1995–2003
Source: Canal 2004.

operational expenses, were allocated to preinvestment and investment inenvironmental projects, 26 percent to institutional strengthening, and 14percent to enforcement of environmental regulations.
The expenditures of the SINA on investment and preinvestmentactivities are clustered into 10 programs and indicate that priority activ-ities and subprograms for CARs during 1995 to 2003 were investmentsin the management of river basins and conservation of water bodies,wastewater treatment plants and water supply, reforestation and conser-vation of forests, biodiversity and green markets, and global and urbanenvironmental issues (table 2.4).
Conclusions
Colombia’s environmental management framework evolved gradually.One of the significant milestones reached between 1952 and 1974 wasthe establishment of CARs, which were intended to promote regionaleconomic development through investments in water resources infra-structure, energy infrastructure, agriculture, and roads. The first of these,the CVC in the Cauca Valley, was created in 1954 on the basis of the U.S.Tennessee Valley Authority model. In addition, in 1961 a CAR was estab-lished for the Magdalena River and later transformed into the INDERE-NA. In 1974, the National Code for Renewable Natural Resources andEnvironmental Protection was developed.This code is still the most impor-tant regulation for environmental management in the country.
A Unique Model for Environmental Management 27
Table 2.4 Environmental Investments by CARs, 1995–2003
Expenditures
Activity or subprogram Pesos (millions) Share (%)
River basin management and conservation of water bodies 619.2 31.3
Wastewater treatment and water supply 518.5 26.1
Forests and reforestation 272.2 13.8
Biodiversity and green markets 184.9 9.3
Global and urban environmental problems 158.3 8.0
Prevention of natural disasters 86.5 4.4
Solid and hazardous waste management 77.5 3.9
Promotion of clean production 56.3 2.8
Land 4.9 0.3
Air quality management 1.3 0.1
Source: Canal 2004.
Note: Col$2,100 = US$1.

Between 1975 and 1993, CARs began to assume their role as envi-ronmental regulatory agencies. By 1988 Congress had established 18CARs. INDERENA was successful in promoting the conservationagenda, as evidenced by advances such as titling of lands belonging toindigenous peoples and establishment of national parks. Furthermore,historical events were influential in focusing the attention of INDER-ENA and CARs on three main environmental priority areas: riverbasin management and conservation of water bodies, reforestation,and conservation of biodiversity. The Ministry of Health was the keyplayer in efforts to control pollution, in accordance with Congress’spassage in 1979 of the National Sanitary Code, which covers air pol-lution control, waste management, waste disposal, water quality, andwater pollution control.
By 1991, a new constitution was created, leading to passage of Law99 in 1993, which established the Ministry of Environment and 33CARs as part of Colombia’s National Environmental System, aimed attackling problems associated with effective environmental manage-ment. These problems included degradation of water bodies and thelack of organizations and funds to address environmental priority areas.The area of jurisdiction of these CARs was driven by the interests ofseveral members of Congress. Law 99 also made provisions for revenuegeneration by CARs so that they could address environmental prioritiesthrough investments in environmental projects. By 2002, the govern-ment of Colombia decided to merge the Ministries of Environment andDevelopment and to phase out the Environmental Directorate in theNational Planning Department.
During 1995 to 2003, the total budget for operation and investmentsby the MAVDT, CARs, the UAESPNN, research institutions, andIDEAM is estimated to have been US$1.98 billion (the equivalent of Col$5,700 billion, in constant 2003 pesos), or an average of US$220 million per year (Col$473,000 million). The average annualenvironmental expenditure of these organizations (AAU expendituresare not included) is estimated at 0.3 percent of GDP (Col$688,000million, US$320 million per year) for the period from 1995 to 2003.Nearly 35 percent of these expenditures were directed at river basinmanagement, conservation of water bodies, water supply, and wastewatertreatment, and another 18 percent went to biodiversity and greenmarkets, global environmental problems, and reforestation. Expenditureson institutional strengthening and enforcement account for the other 40percent of total expenditures.
28 Sánchez-Triana

Notes
1. Ernesto Sánchez-Triana is the author of this chapter, which draws on back-ground documents prepared for this study by Blackman, Morgenstern, andTopping (2004), Universidad de Los Andes (2004), and Canal (2004).
2. Beginning in 1976, the corporations were also responsible for managingrenewable natural resources and environmental protection (Arboleda andothers 1981).
3. According to MAVDT (2006, p. 4), INDERENA “initiated the process ofstructuring environmental licenses with important advances in the definitionof criteria for evaluating (Environmental Impact Assessment) and the defini-tion of terms of reference for various sectors. Advances were also achieved inthe definition of instruments for administering and managing renewablenatural resources (water, forest), activities were begun related to environmentaleducation processes for different levels, and activities were initiated relatedto integrated watershed management and reforestation with communityparticipation. In addition, advances were achieved in the orientation anddefinition of environmental research.”
4. The Contraloría is the ranking public entity in charge of oversight of all fiscalmatters. It guarantees the correct management of public funds and contributesto the modernization of the state through collaboration with public institutions.
5. At the end of 2005, Colombia had 33 CARs and CDSs. In addition, there areAAUs in six cities: Bogotá (DAMA), Cali (DAGMA), Medellín (AMVA),Barranquilla (DAMAB, formerly DADIMA), Cartegena (EPA), and SantaMarta (DADMA).
6. According to MAVDT (2006, p. 5), “in defining the environment as part ofthe National Development Plan a joint exercise was carried out among theNational Planning Department and technical departments of the Ministry sothat policy frameworks prioritize those items included in the Plan.Subsequently, in accordance with Law 152 of 1994 (the Development PlanLaw), the Ministry developed the Indicative Sectoral Plan, in which goals forthose items included in the National Development Plan are defined.”
7. According to MAVDT (2006, p. 5), “a prioritization exercise of the areaslinked to the National Development Plan does exist, which is detailed evenmore at the territorial level in the development of corresponding planninginstruments.”
8. The plan is accessible online at http://web.ita.doc.gov/ete/eteinfo.nsf/Approved/?Search View&Query=(Colombia)%5D.
9. As MAVDT (2006, p. 5) states, “the development of norms and instrumentsfor policy implementation is carried out through an open, participatoryprocess among the entities involved and the regulated sectors. This is not tosay that the development of norms is influenced by business associations.”
A Unique Model for Environmental Management 29

10. According to the minister of finance and public credit, the director of theNational Planning Department, and the minister of environment, housing,and territorial development, “in order to ensure that there is more effectiveparticipation of the most vulnerable segments (those affected by environmentaldegradation), the national government issued a Decree to optimize theTechnical Advisory Council for Environmental Policies and Norms of theMinistry of Environment (CTA) to serve as a forum for cross-sectoral coordi-nation and to ensure the participation of the most vulnerable segments (thoseaffected by environmental degradation). The CTA of MAVDT was estab-lished under Article 11 of Law 99 (1993) to serve as principal advisor to theMinister of Environment, Housing and Territorial Development in the formu-lation of policies and the issuance of the country’s environmental rulings. TheCouncil comprises five (5) members, including two (2) representatives frompublic and private universities, and three (3) representatives from industry,agricultural, and mining and hydrocarbon councils (one representative fromeach sector). MAVDT has detected a visible imbalance in the level of discus-sions and recommendations from the Technical Advisory Council forEnvironmental Policies and Norms of the Ministry of Environment (CTA),given that representation from other key stakeholders who should also beconsulted is lacking (in particular those who are most affected by priorityenvironmental problems that are targeted within the rulings issued byMAVDT). For this reason, one of the primary objectives that this new Decreeaims to achieve is to guarantee the active participation, at the level ofTechnical Committees, of representatives of civil society who could be affectedby and/or have a valid interest in addressing environmental problems relatedto the policies and regulations that are submitted to the Council for consid-eration. In this way, it is intended that the Council will generate a morebalanced discussion that considers different stakeholders affected or benefitedby the environmental policies and norms that MAVDT issues” (Suárez,Montenegro, and Carrasquilla 2005, p. 73).
11. The review of public environmental expenditures that is summarized in thissection was conducted by Francisco Canal of the Association of CARs. Thedata used in this analysis of public environmental expenditures were takenfrom publications of the Contraloría and of the CARs. MAVDT (2006, p. 5)considers “that it is difficult to make a combined analysis from two differentsources of information, in which that of MAVDT is official (public) and thatof the CARs has not been validated by the Ministry.”
12. Environmental expenditure, measured as a percentage of GDP, varies signif-icantly from one country to another in the Latin America and the Caribbeanregion. Whereas countries such as Argentina, Brazil, and Peru have tendedto spend a significantly smaller share of GDP to address their environmentalchallenges, others, including Costa Rica and Mexico, have steadily increasedtheir public environmental expenditure to more than 0.6 percent oftheir GDP.
30 Sánchez-Triana

13. According to MAVDT (2006, p. 6), the “largest amount of resources areconcentrated in a few CARs due to circumstances of a structural nature,related to the development potential of the jurisdictional areas of each one.”
References
ANAM (Autoridad Nacional del Ambiente). 2004. http://www.anam.gob.pa.
Arboleda, Henry, Willy Guaqueta, Diego Pineda, Ernesto Sánchez-Triana, andGloria Vela. 1981. “Corporaciones Regionales de Desarrollo: Instrumentosde Descentralización.” Documento de Trabajo DECR-035, DepartamentoNacional de Planeación––División Especial de Corporaciones Regionales deDesarrollo, Bogotá.
Arboleda, Henry, Willy Guaqueta, Ernesto Sánchez-Triana, and Gloria Vela.1982. “Bases para la Creación de Corporaciones Regionales de Desarrollo.”Documento de Trabajo DECR-043, Departamento Nacional de Planeación––División Especial de Corporaciones Regionales de Desarrollo, Bogotá.
Blackman, Allen, Richard Morgenstern, Elizabeth Topping, and Sandra Hoffman.2004. “Assessment of Colombia’s National Environmental System (SINA).”Resources for the Future, Washington, DC.
Blackman,Allen, Richard Morgenstern, and Elizabeth Topping. 2004. “InstitutionalAnalysis of Colombia’s Autonomous Regional Corporations (CARs).”Consultant Report. Resources for the Future, Washington, DC.
Canal, Francisco. 2004. “Orientación del Presupuesto de las CorporacionesAutónomas Regionales–CARs–en los Planes de Acción Trianual; Periodos1995–2003.” Consultant Report prepared for the World Bank, Washington, DC.
Carrizosa y Asociados. 1990. Estudio de Impacto Ambiental Proyecto Desviación delRío Cauca. Consultores Civiles e Hidráulicos. Consultant Report, Cali:Corporación Autónoma Regional del Cauca–CVC.
CIGEA (Centro de Información, Gestión y Educación Ambiental). 2001.“Panorama Ambiental de Cuba.” PALACIEN, La Habana, Cuba.
CONAM (Consejo Nacional del Ambiente). 2001. Informe Nacional sobre elMedio Ambiente. Geo Peru 2000. CONAM PNUMA, Lima.
Contraloría (Contraloría General de la República). 2004. Estado de los RecursosNaturales y del Ambiente. 2003–2004. Bogotá: Contraloría.
Currie, Lauchlin.1988. La Administración Pública en Colombia. Bogotá: ContraloríaGeneral de la República.
Dillinger, William, and Steven B. Webb. 1999. “Decentralization and FiscalManagement in Colombia.” Policy Research Working Paper 2122, WorldBank, Washington, DC.
ECLAC (Economic Commission for Latin America and the Caribbean). 2005.Environmental Performance Review––Chile. Paris: OECD Publishing.
A Unique Model for Environmental Management 31

Galán, Francisco Alberto. 1998. “Rationalization of Spending in SINA:Institutional Firming towards Decentralization.” Contract DNP-075-98, FinalReport, Executive Summary, Bogotá.
Iguarán, M. 2001. “La Acción de Tutela como Mecanismo de Protección delDerecho a un Ambiente Sano.” In Justicia Ambiental. Universidad Externadode Colombia; Instituto de Estudios del Ministerio Público, CAR. Bogotá:
MAVDT (Ministerio de Ambiente, Vivienda y Desarrollo Territorial). 2006.Comentarios Consolidados al Documento CEA. E-mail sent by LeonardoPinzon, Olga Bautista, and Pedro Chavarro to Angela Armstrong. February17, 2006.
MMA (Ministerio del Medio Ambiente). 2002. Las Voces del SINA. Editado porAngela Ines Sanchez. Bogotá, MMA.
Rodríguez Becerra, Manuel. 1994. Memorias del Primer Ministro de Ambiente.February 7–August 6. Bogotá: MAVDT.
———. 1998. La Reforma Ambiental en Colombia—Anotaciones para la Historiade la Gestión Pública Ambiental. Fundación FES and TM, eds. Bogotá.
Sánchez-Triana, Ernesto. 1999. “Autonomous Corporations: From EconomicDevelopment to Environmental Conservation.” Instituto de EstudiosAmbientales, Universidad Nacional de Colombia Documento de Trabajo,Bogotá.
———. 2001. “La Nueva Comisión de Regalías: Instrumento del Cambio paraConstruir la Paz.” Regalías Volume 1, January–March 2000, Bogotá. ColombiaRegalías.
SEMARNAT (Secretaría de Medio Ambiente y Recursos Naturales). 2000.Conozca la Semarnat. http://www.semarnat.gob.mx.
Suarez, Sandra, Santiago Montenegro, and Alberto Carrasquilla. 2005. “Letter ofDevelopment Policy.” Appendix 1 to “Program Document for a ProposedProgrammatic Development Policy Loan for Sustainable Development in theAmount of $150 Million to the Republic of Colombia.” Report No. 32360-CO, World Bank, Washington, DC.
Universidad de los Andes, CEDE. 2004. “Application of the World Bank’s WDRFramework 2003.” 4th version. Final Report, World Bank, Washington, DC.
32 Sánchez-Triana

Colombia’s National Environmental System includes the Ministry ofEnvironment, the National Environmental Council, regional environmentalauthorities, urban environmental authorities, research institutes, and controlagencies. Challenges that emerge in trying to assess the NationalEnvironmental System are the adequacy of data and the lack of indicatorson environmental quality and institutional performance; the need to betterdefine sectoral priorities; the efficiency of public sector spending on theenvironment; management capacity in key agencies; coordination betweennational and regional agencies and between research institutes and programagencies; suboptimal regulatory instruments and compliance agreements;and low legal and fiscal oversight and auditing capacity.
This chapter examines (a) the distribution of responsibilities amongnational, regional, and local environmental authorities, (b) checks andbalances within and between environmental agencies at various levels,(c) cross-sectoral and interinstitutional coordination mechanisms,(d) monitoring capacity, and (e) ways in which stakeholder interests arebalanced in decision making.1 The effectiveness of an institution isdefined as the extent to which it contributes to improved environmentalquality by performing the functions assigned to it under Colombia’s 1991Constitution, Law 99 of 1993, and related decrees. As elaborated in the
C H A P T E R 3
Actors and Institutions
33

chapter, however, this is difficult to measure because of the lack of avail-able data on environmental quality.
Environmental Information Systems
Law 99 gave the Ministry of Environment (Ministerio del Medio Ambiente,MMA) the task of establishing a Colombian Environmental InformationSystem (Sistema de Información Ambiental de Colombia, SIAC). SIAC hastwo main functions: to provide governmental entities in the NationalEnvironmental System (Sistema Nacional Ambiental, SINA) the informa-tion they need for effective environmental management, and to informColombians about the state of their environment and thereby facilitatepublic participation in environmental management. Decrees issued in1994 gave the Institute of Hydrology, Meteorology and EnvironmentalStudies (Instituto de Hidrología, Meteorología y Estudios Ambientales,IDEAM) responsibility for directing, coordinating, and operating SIAC.The 2003 decree that created the new Ministry of Environment,Housing and Regional Development (Ministerio de Ambiente, Vivienday Desarrollo Territorial, MAVDT) assigned coordination of SIAC tothe new ministry’s General Bureau of Regional Information, Planningand Coordination.
There is wide agreement in Colombia that indicators are indispensa-ble for the formulation of new policies and for overall environmentalmanagement. There is also widespread recognition that regulatoryauthorities still have not developed an adequate system of indicators(Contraloría 2003a; Interinstitutional Committee on Indicators 2002).Efforts to develop environmental indicators have arisen separately at thenational and regional levels, and in public and private arenas. Theseefforts have been mostly independent and uncoordinated. The first con-certed national effort was led by the National Planning Department(Departamento Nacional de Planeación, DNP), which, in 1994, obtained aloan from the Inter-American Development Bank to design and imple-ment the SIAC. In 1996, the DNP also proposed the creation of anEnvironmental Management and Planning Indicators System that wouldinclude 256 indicators. However, because of the difficulties in the designof this system and the large number and complexity of indicators (detailedmethodological standards were developed for 177 of them), the propos-als eventually were abandoned (Contraloría 2003b).
In 2001, the MMA, with technical assistance from the EconomicCommission for Latin America and the Caribbean (Comisión Económica
34 Blackman, Morgenstern, Topping, Hoffman, and Sánchez-Triana

para América Latina y el Caribe, CEPAL), undertook a new effort to createenvironmental sustainability indicators in coordination with national andregional entities and research institutes. In July 2002, these groups pub-lished a document describing 32 indicators. At about the same time,IDEAM, MMA, and various research institutes worked together todevelop and publish Colombia’s first environmental baseline, whichincluded 149 indicators. According to the Contraloría General de laRepública2 (2003b), however, this effort had a number of weaknessesmainly related to the fact that participating institutes were not well inte-grated and the baseline indicators lacked a unified conceptual framework.Information from the diverse entities was based on different scales, cov-erage, and collection methodologies, making integration of data difficult(Peña 2003). Furthermore, resources had not been assigned to maintainthe information flow and acquire the technology needed to continue col-lecting information for this program.
Efforts are under way to develop indicators at the level of theAutonomous Regional Corporations (Corporaciones Autónomas Regionales,CARs). According to Decree 1300 of 2002, CARs must establish—inagreement with MAVDT—basic indicators for monitoring and evaluatingnatural resources and the environment. Some CARs have proposeddevelopment baselines in their areas with indicators of both the currentstate of the environment and the pressures exerted on natural resourcesand the environment.
To evaluate management performance, most CARs have either devel-oped their own indicators or use those formulated by the ministry. Mostof the indicators CARs currently use measure administrative processes(such as expenditures on reforestation) rather than environmentalimpacts (such as deforestation rates). Unfortunately, the data and modelsdesigned by IDEAM are not applicable for CARs (Contraloría Generalde la República 2003b). MAVDT plans to develop three national indica-tor systems: (a) environmental sustainability indicators to measure the stateof the environment and natural resources, (b) environmental managementindicators related to the impact of interventions by environmental manage-ment authorities, and (c) sustainable development indicators that allowinternational comparison.
Although Colombia has tried to develop environmental indicators, itstill is a long way from having an integrated system. This is due in part toinsufficient data collection infrastructure at the national, regional, andlocal levels, such as environmental monitoring networks, measurementstations, documentation centers, and basic cartography. Some 40 percent
Actors and Institutions 35

of the country’s CARs either have no environmental laboratories or havea data collection and analysis infrastructure that does not work. Some CARsthat do have laboratories invest very little in their operation and mainte-nance and do not operate them effectively. In 2002, less than Col$7 billion(US$3.2 million), or 1.4 percent of total CAR investments, were dedicatedto laboratory facilities. The absence and poor quality of basic cartographypresent another serious challenge. Many CARs either lack basic maps oftheir jurisdictions or have not updated their cartographic information inmore than a decade (Contraloría General de la República 2003b).
The lack of monitoring stations is a problem. For instance, only 20CARs have any type of monitoring station. Ten of these stations have notregistered their networks in the National Catalog of Monitoring Stations,and only four routinely send information to IDEAM. Most stations donot have the budget necessary for proper maintenance, even though97 percent of the stations have been in service for more than 20 years andhave significant maintenance backlogs. Of the activities that the measure-ment stations are required to perform, only a fraction are actually carriedout—25 percent of hydrological measurements and 45 percent of clima-tological measurements (Contraloría General de la República 2003b).
A review of the SIAC by the Contraloría General de la República(2003b) found that what little data actually were being collected at theCAR level were principally on forestry and had been collected under anagreement with the International Tropical Timber Organization in themid-1990s. According to the Contraloría General de la República (2003b),the administrative structure of the system lacks clarity. The ContraloríaGeneral de la República (2003b, p.75) reported that, overall, Colombia“does not have a satisfactory environmental information system” andidentified seven factors that limit the development of SIAC:
• IDEAM performs analyses on a national scale, where as CARs performanalyses on a regional or local scale. As a result, the data and modelsdesigned by IDEAM are not applicable for CARs.
• Limited integration among SINA entities and lack of a systematicprocess for data transfer among institutions prevents the flow of informa-tion. Thus, information captured by regional agencies is not generallyused to help refine IDEAM’s data.
• CARs have limited incentives to develop environmental information,which is reflected in their limited participation at interinstitutionalmeetings on environmental information planning.
• IDEAM’s process of developing an environmental information systemhas lacked continuity.
36 Blackman, Morgenstern, Topping, Hoffman, and Sánchez-Triana

• IDEAM and CARs often use incompatible computer platforms.IDEAM should develop network applications that use free software sothat CARs and other public and private agencies and stakeholders canuse them at low cost.
• SIAC lacks methodological standards or protocols for data collection.Likewise, few advances have been made in generating standards thatwould allow validation of environmental information.
• Informational planning instruments are not used. The MAVDT,IDEAM, and most CARs lack plans to integrate information.
SINA’s Finances
Nearly three-fourths of SINA’s self-generated revenue accrues to justeight of Colombia’s 33 CARs.3 As elaborated in chapter 2, most revenueis generated through the mechanisms established under Law 99, principallyproperty taxes, transfers from the sale of electricity, and national contri-butions. CARs’ ability to generate revenue from taxes and fees is criticallydependent on the size of their populations, degree of economic activity,and electricity generation. Not surprisingly, CARs in regions with thelargest levels of economic activity and the highest population densitiesgenerate the most revenue, while those without such resources have his-torically been more dependent on national funding and have thereforebeen hardest hit by adjustments in the federal government budget. Inaddition, 90 percent of environmental investments are originated by the18 CARs established before Law 99 and only 10 percent by the 15 CARscreated by the law itself.
Despite their large budgets, some of the CARs with the largestself-generated income still receive contributions from the nationalgovernment. Criteria for assigning funds to CARs by the national gov-ernment are unclear. Mechanisms do exist to even out disparities in CARrevenues. The Environmental Compensation Fund was created in 1996to redistribute self-generated CAR revenue from the wealthier CARs tothe 15 poorest CARs. All CARs, except the Autonomous SustainableDevelopment Corporations (Corporaciones Autónomas de DesarrolloSostenible, CDSs), must contribute 20 percent of their electricitysector transfers and 10 percent of certain other self-generated resourcesto the fund. The National Environmental Fund (Fondo NacionalAmbiental, FONAM) was also meant to finance investments in poorCARs. Finally, national authorities can direct funds to departments andmunicipalities through the National Royalty Fund established under the1991 Constitution.4
Actors and Institutions 37

However, the funds have not been effective. FONAM has not beenable to meet its objectives because of poor funding. Among other reasons,Gómez Torres (2003) attributes this failure to the MAVDT’s lack of successin obtaining funds for FONAM from outside sources, and demonstratesthat FONAM mainly supports older, better-endowed CARs. TheNational Royalty Fund is subject to wide cyclical swings in availabilityand has been characterized by excessive partitioning of funds amongdifferent local, regional, and departmental projects and by poor overallquality of proposals (Sánchez-Triana 2001).
From 1996 to 1998, the Urban Environmental Authorities(Autoridades Ambientales Urbanas, AAUs) received funding from threemain sources: revenue generated through the mechanisms establishedunder Law 99 (principally property taxes); transfers from municipalitiesfor environmental management support; and national contributions,which were divided between US$20 million in credits from the WorldBank for capacity building and ordinary funds from the MAVDT budget.Property tax revenues and World Bank credits were the largest fundingsources. After 1998, however, these sources of funding were substantiallyreduced. The Constitutional Court declared that Article 9 of Decree1339 of 1994, which had granted AAUs half of the property taxes raisedby municipalities, was unconstitutional.5 From 1995 to 1998, the AAUs’self-generated resources were nearly US$87.8 million, of which 86 percentwas generated by the AAU for Bogotá (Departamento Administrativo delMedio Ambiente, Bogotá [DAMA]), 11 percent by Cali (DepartamentoAdministrativo de Gestión del Medio Ambiente, Cali [DAGMA]), 2 percentby Barranquilla (Departamento Técnico Administrativo del Medio Ambientede Barranquilla [DAMAB]), and 1 percent by the Aburrá Valley (AburráValley Urban Environmental Authority—Área Metropolitana del Valle deAburrá [AMVA]). All of DAMA’s funds from property taxes are dedicat-ed exclusively to the Bogotá River decontamination project. DAMAB’sand AMVA’s low revenues are mainly the result of a recent decision bythe cities of Barranquilla and Medellín not to transfer property taxes tothe AAUs. After 2000, by decision of the MMA and the DNP, the AAUsstopped receiving environmental fees.
During 1995 to 2002, 13 percent of SINA expenditures for opera-tions and 3 percent for investments were assigned to research institutes.National appropriations provided 100 percent of the funding for opera-tions and 82 percent of funding for investments. Of the national fundsallocated to the research institutes, fully three-quarters go to IDEAM.Some of the research institutes have managed to insulate themselves
38 Blackman, Morgenstern, Topping, Hoffman, and Sánchez-Triana

from the fiscal adjustment by seeking outside funding, mainly frominternational organizations such as the Global Environment Facility. Overthe period from 1995 to 1998, national funding financed 83 percent of theresearch institutes’ new investments. However, during 1998 to 2002, as theinstitutes diversified their funding bases, this contribution dropped to49 percent. Collectively, research institutes’ investments actually grew by86 percent during 1998 to 2001. Despite this success, the research insti-tutes have considerable difficulty financing operational expenses becauseinternational funding sources often place severe restrictions on using finan-cial resources for that purpose.
During 1995 to 2002, 100 percent of the funding for operations and99 percent of the funding for investments by the National Parks Systemwas provided by national appropriations. Although the National ParksSystem has some ability to generate its own revenues from ecotourismfees and concessions, these resources are small and are highly sensitive tothe impact of public safety issues on the tourism sector. The NationalParks System is trying to develop revenue streams to pay the system forthe environmental services it provides, including carbon sequestration,biodiversity conservation, and watershed protection. It hopes to generaterevenues from carbon sequestration by participating in the CleanDevelopment Mechanism of the Kyoto Protocol. The current law allowsparks to charge a tax for water use, but this mechanism requires furtherlegal clarification before it can be implemented. The Parks System hasbeen able to raise significant international funds, primarily for biodiver-sity conservation. For example, during 1996 to 2000, the Parks Systemreceived US$4.1 million (Col$8.8 million) in Dutch donations aimed atdeveloping protection, conservation, and management actions in eightparks in the Pacific region (MMA 2002).
The Ministry of Environment
The Contraloría General de la República (2003a) found that the MAVDTlacks procedures and documentation to clearly define the activities of itsstaff. In 2002, before the merger of the Ministries of Environment andEconomic Development, the MMA had 290 staff members. Table 3.1presents the staff composition and average salaries. In 1997, three yearsafter the creation of the Ministry of Environment, a study by the consultingfirm, Booz Allen Hamilton, recommended better-trained and more techni-cally qualified civil servants (Booz Allen Hamilton 1997b). Seven yearslater, Blackman, Morgenstern, and Topping (2004) found that despite the
Actors and Institutions 39

efforts carried out, there were still serious concerns that the MAVDT’senvironmental management needed strengthening.
The decentralized design of Law 99 affected the MAVDT and CARs.While Law 99 gave CARs a great deal of administrative and fiscal auton-omy, it also gave the MMA responsibility for leading the SINA and, inparticular, for overseeing and coordinating the activities of CARs. Theministry’s coordinating function, however, is not optimal. In 1997, threeyears after the establishment of the MMA, a study described how “eachcomponent of the system conceived of in Law 99 of 1993 is working inan independent and divergent manner—each executes its own ActionPlan based on its subjective interpretation of the National EnvironmentalPlan, adapting it according to its own regional needs” (Booz AllenHamilton 1997b, p. 4). The MAVDT believes there has been significantprogress “in the process of articulating actions through planning instru-ments: PGAR [Plan de Gestión Ambiental Regional, Regional EnvironmentalManagement Plan] and PAT [Plan de Acción Trienal, Three-Year ActionPlan]” (MAVDT 2006, p. 6).
Other major evaluations of the SINA generally concur that coordinationbetween the MMA and CARs needs strengthening. One analysis cited that“erratic relations” (particularly in priority setting and resource allocation)between the MMA and CARs had impaired the operation of SINA (Galán1998). One recommended reform is to increase integration of CARs intothe planning and policy formulation carried out by the MAVDT.
Colombia has developed a strong legal framework for decentraliza-tion and institutional coordination. However, lack of resources and of
40 Blackman, Morgenstern, Topping, Hoffman, and Sánchez-Triana
Table 3.1 Ministry of Environment Staffing and Salaries, 2002
No. of Average annual salary per
Position Educational requirements positions position (Colombian pesos)
Director College degree; graduate
degree or 2 years’
work experience 11 58,741,902
Adviser College degree; graduate
degree or 2 years’
work experience 48 42,080,013
Professional College degree 120 19,937,296
Technical administrative High school 33 11,722,495
Administrative n.a. 78 8,902,171
Total n.a. 290 21,171,340
Source: MAVDT 2004.
Note: n.a. = not applicable. US$1.00 equivalent to Col$2,100.00.

information has led to poor implementation. National authorities have avariety of mechanisms at their disposal to ensure that CARs act in accor-dance with national policies. First, CARs are required to submit 10-year,3-year, and 1-year action plans that are tied to the National DevelopmentPlans drafted by the executive branch. The Contraloría can set in motionprocedures to remove CAR general directors from office for failure tocomply with these requirements or failure to carry out their plans. Inaddition, CARs can be sued in court for developing plans that are not inaccordance with the National Development Plan. Second, DNP mustapprove national budget allocations for CAR investment projects.6 Third,CAR boards of directors include a representative of the MAVDT and arepresentative of the president’s office. Fourth, Colombia’s control organ-izations (Procuraduría Delegada para Asuntos Ambientales, ContraloríaGeneral de la República, Fiscalia, and Veeduria) can discipline CARs forfailure to implement plans or for abuse of office. Fifth, national authoritieshave some control over the salaries of CAR staff members. Finally, in thepast the MMA and other national institutions have contributed investmentfunds—or have allocated funds contributed by multilateral institutions—and this power of the purse strings has given them some sway over CARinvestment projects. Chapter 4 analyzes CARs’ performance, their degreeof decentralization, their governance structure, and their subordinaterelationships with departmental and municipal governments.
Several factors limit the effectiveness of these mechanisms. First, theministry has poor information about the investment, policy implementa-tion, and regulatory enforcement activities of CARs. The performanceindicators that CARs currently use typically reflect regulatory processesrather than impacts. For example, CARs often report on the amounts ofmoney spent rather than on how these investments affected environmentalquality. The MAVDT’s information about environmental quality at theregional level is limited. Effective coordination is not possible without suchbasic information. Second, staffing levels in the Procuraduría Delegada paraAsuntos Ambientales7 do not allow CARs’ performance to be monitored orevaluated, and the Contraloría General de la República is severely ham-pered by lack of data. As for regulations that mandate intensive planning atthe regional level, previous evaluations have concluded that even whenCARs do fulfill their planning requirements, they often do so simply tofulfill the letter of the law rather than to actually guide resource manage-ment. New planning requirements established in 2004 may mitigate thisproblem somewhat. Finally, current fiscal policy constrains the MAVDT’sability to cofinance investments.
Actors and Institutions 41

The merger of the Ministries of Environment and EconomicDevelopment in 2003 is one outcome of the decision to reduce thenational bureaucracy.8 It is too early to gauge the overall impact of themerger, but it is likely to have both advantages and disadvantages.
One of the perceived disadvantages of the merger is the sense that itlowers the profile, and potentially the influence, of the Ministry ofEnvironment, because Colombia no longer has a Minister of Environmentbut rather a Vice Minister. Moreover, some issues formerly handled by theMinistry of Economic Development, such as providing housing and watersupply infrastructure for the poor, are more urgent than issues associatedwith environmental pollution control and management of renewable nat-ural resources. There are also concerns that because the Ministry ofEconomic Development addressed short-term problems, while theMinistry of Environment addressed medium- and long-term problems,attention to environmental issues is likely to be postponed.Another concernis that the merger of the Ministries of Environment and EconomicDevelopment is likely to create conflicts of interest, because the MAVDTwill be responsible both for investing in infrastructure and for ensuringthat the environmental impacts from these investments are minimized.
Conversely, the merger of the ministries may generate a number ofbenefits. First, it may facilitate better administrative coordination ofinvestments in infrastructure, particularly for water supply and sanitation,which historically have been low. More specifically, large investments inwater, and to a lesser degree sanitation, often require environmentalimpact assessments and permits from authorities at the national level.Second, the merger may help in efforts to integrate or mainstreamenvironmental concerns into planning and decision making in both theinfrastructure and the housing sectors. For example, it may help makeland use planning an integral component of decisions on housing projects.Third, the merger may help correct two long-standing biases at MMA:the tendencies to focus on the benefits of environmental regulation whileignoring costs, and to pay too little attention to urban issues. Because theMAVDT will be responsible for promoting economic development andenvironmental regulation, it might be more aware of trade-offs betweenthe benefits and costs of regulation. Similarly, the MAVDT’s involvementin housing and infrastructure investments in urban areas may force it tofocus more on urban environmental issues.
Evidence shows that the priority of both CARs and the MAVDT is oninvestments in water basin management, reforestation, and biodiversityconservation. However, because over 70 percent of Colombia’s populationlives in urban areas, CARs and the MAVDT should also focus on urban
42 Blackman, Morgenstern, Topping, Hoffman, and Sánchez-Triana

environmental issues such as air quality, natural disasters, sanitation andhygiene, and solid and hazardous waste management. The MMA’s invest-ment spending for 2002 in urban environmental management accountedfor less than a quarter of the ministry’s investment budget (table 3.2).
Regulatory IssuesAlthough Colombia has extensive environmental regulations, there aremany challenges to their effectiveness. For example, the Contraloría hasrepeatedly documented major regulatory gaps (Contraloría General dela República 2003a), and a recent programmatic audit of the MAVDTfound that the ministry still has not established maximum permissiblelimits of pesticides in foods, formulated economic instruments to moti-vate reduction in use and management of pesticides, or developed imple-menting regulations for the Estatuto Único Forestal (Statute on Use andClassification of Soils), a critical instrument in land use planning(Contraloría General de la República 2003b).
Some regulations are too general or are subject to a gradual weakening.For example, the Contraloría General de la República (2003a) notes thatthe lack of regulations regarding the scope and applicability of publichearings has made the use of such hearings ineffective.With respect to theefficiency of the environmental licensing system, the Contraloría Generalde la República (2004, p. 23) considers that this “area has been subject toa gradual weakening that would lead in the very short term to its elimin-ation. . . . Efficiency in this area cannot reduce the time taken to authorizelicenses or eliminate the key requirements to guarantee that licensedactions consider all the environmental impacts that they generate.”
Actors and Institutions 43
Table 3.2 Ministry of Environment Investment Budget by Issue, 2002
Budget Share
Issue (thousand pesos) (percent)
Natural resources management
Strategic ecoregions 357,300 1
Forests 15,299,700 60
Biodiversity 3,652,000 15
Green markets 368,100 1
Urban quality of life 227,000 1
Endogenous production processes 371,500 1
Cleaner production (voluntary agreements
with industry) 4,941,600 19
Water 644,200 2
Total 25,861,400 100
Source: Contraloría General de la República 2003a.

Some regulations are prescriptive and of limited applicability for thelocal economic and social context. For example, command-and-controlemissions standards sometimes have been adopted, with little modification,from more developed countries. According to stakeholders interviewed forthe report by Blackman, Morgenstern, and Topping (2004), such standardsare unrealistic for most firms because they lack the technical informationor other resources needed to adopt and operate the abatement technology.
These issues in Colombia’s regulations lead to other problems. Theycontribute to poor coordination between the MAVDT and CARs bymaking it difficult for CARs to carry out one of their basic functions—implementing national regulations. They also make it difficult for otherinstitutions in the SINA to perform their assigned roles. Incompletelicensing and permitting regulations may lead to inconsistent requirementsand enforcement across CARs and may create fertile ground for arbitrarydecisions. Amorphous laws and regulations also burden Colombia’s judicialsystem by contributing to the proliferation of acciónes de tutela (actionsfor injunctive relief) brought to protect the environment.
Voluntary RegulationSince the passage of Law 99 of 1993, both the MMA and some CARshave often used a strategy of developing and enacting regulatory standardsand guidelines that are not mandatory. These programs have followedinternational practices in this area from European countries such as theNetherlands. The international practices are rooted in strong enforce-ment of command-and-control regulations. In Colombia, however, twotypes of voluntary regulations are commonly applied. The first is tonegotiate with polluters for clean production agreements (convenios deproducción limpia) that target either specific sectors (for example, trans-portation or agriculture) or specific regions (Blackman, Morgenstern,and Topping 2004). They typically involve a quid pro quo: polluterspledge to improve environmental performance over a specified period;in exchange, the regulator provides a grace period to allow the polluterto achieve compliance. The purpose of such agreements is to mitigatethe problem of chronic noncompliance in certain sectors and regions by“building consensus” among polluters on the need for compliance andgiving them guidance on how to comply (Blackman, Morgenstern, andTopping 2004).9 Many clean production agreements were signed in themid-1990s. Self-reported data collected by the Colombian Associationof Environmental Authorities (Asociación Colombiana de AutoridadesAmbientales, ASOCAR) indicate that by 2002 CARs had signed a totalof 101 clean production agreements (ASOCAR 2002).
44 Blackman, Morgenstern, Topping, Hoffman, and Sánchez-Triana

The second type of voluntary regulation popular in Colombia is theissuance of environmental guides—manuals that detail options forimproving environmental performance in specific sectors. These guides,which typically focus on pollution prevention rather than end-of-pipeabatement strategies, stemmed from the national Cleaner ProductionPolicy issued by the National Environmental Council. The council haspublished 57 environmental guides that cover approximately 60 percentof all productive sectors. The guides have been written for sectors wherelicensing is mandatory, and for ones where licensing is not required, suchas livestock production. Clean production agreements and environmentalguides have both strengths and weaknesses.
The purported strength of clean production agreements is that theybuild consensus for improved environmental performance in sectors orregions where compliance is a chronic problem. Clean production agree-ments can have an impact, at least at the regional level, and successesinclude several agreements negotiated and administered by DAMA inBogotá.10 However, voluntary agreements will work only in sectors andregions where environmental regulatory institutions are strong, and onlyas a complement to conventional command-and-control regulations.
The Colombian environmental guides also have a number of strengths.First, industrial sectors have input into the guides, which therefore mightlead to improved environmental performance. Second, the guides fill asignificant gap in Colombian regulation: the lack of technical guidance onhow emissions standards are to be met. Such gaps imply that emissionsstandards are unrealistic for most firms, which lack the technical information(or other types of resources) needed to purchase and operate abatementdevices or adopt clean technologies. Third, they clarify how polluters canobtain licenses and thereby facilitate consistent and transparent licensing.As discussed later, licensing requirements and processes differ markedlyacross CARs, and ad hoc licensing is a concern for several firms and farms.In sectors where licensing is required, the guidelines constitute de factobinding (vinculante) regulations, and efforts are underway to give themthe legal status of regulation—that is, to make them legally binding.Fourth, by improving polluters’ technical capacity and establishing uniformstandards, environmental guides reduce the transaction costs of permittingfor firms, CARs, and the MAVDT. Fifth, in sectors where permits are notrequired, the guides may help firms improve their environmental per-formance by lowering the informational costs of pollution prevention andabatement investments. Finally, environmental guides may help firms meetgrowing demands for cleaner production in the international marketplace.Several sectors require some type of certification that firms are producing
Actors and Institutions 45

in an environmentally friendly manner.The environmental guides facilitatethis certification.
Notwithstanding these potential benefits, data suggest that cleanproduction agreements, in general, have not succeeded in improvingenvironmental performance. During the grace period specified in theagreement, polluters do not make any significant new investments. In anycase, regulators have no means of assessing environmental performancebecause the clean production agreements do not include indicators orestablish a baseline. Thus, the agreements simply end up legitimizinginaction on the part of both polluters and regulators. Unfortunately, thishas been the pattern for most national-level sectoral clean productionagreements (Blackman, Morgenstern, and Topping 2004).
An analysis prepared by Esterling Lara Sánchez (2003) of a sample of13 voluntary clean production agreements, including both single-sector andmultisector agreements and agreements at the national and regional levels,found that many of the agreements suffered from weaknesses that renderedthem ineffective. For example, commitments made by the signatories to theagreements were typically vague and ill-defined. In addition, the agree-ments did not identify sources of financing for costly pollution abatementand prevention investments, and the legal status of the agreements wasunclear. These conditions created incentives for stakeholders to sign theseagreements even if they had no real intention of meeting their commit-ments, and the resulting compliance with the agreements was quite low.According to Esterling Lara Sánchez (2003), for example, the coal sector’scompliance with its voluntary clean production agreement was ranked zero(on a scale of zero to 100) on all components that concerned “incentivesand financial resources” and “follow-up and evaluation.” Similarly, in evalu-ating electricity sector agreements, eight of the nine components of theagreement on “clean production promotions strategies,” three of the foursections on “legal and technical environmental norms,” and three of the fivesections on “incentives and financial resources” were ranked as zero(Esterling Lara Sánchez 2003).
Blackman, Morgenstern, and Topping (2004) have also identified anumber of weaknesses in Colombia’s 57 environmental guides. Forexample, they are being used for a purpose other than originally envi-sioned, and as a result they do not serve that new function very well. Theguides were conceived as a way of implementing the national CleanerProduction Policy. Specifically, they were to enable facilities to movebeyond compliance with existing command-and-control regulations byadopting clean (pollution prevention) technologies. In sectors where
46 Blackman, Morgenstern, Topping, Hoffman, and Sánchez-Triana

licenses are required, however, they have evolved into guides for achievingcompliance with existing regulations. Unfortunately, there is often noclear link between existing command-and-control regulations and theinformation in the environmental guides.Thus, there is no guarantee thata firm that follows the guide’s advice will actually meet existing regulatorystandards. Moreover, the environmental guides typically provide a limitedrange of technological alternatives for pollution prevention and pollutioncontrol.These alternatives are not always the most appropriate for all scalesand types of firms in the sector. For example, they may be appropriatefor large firms, but not for the small and medium firms that dominatemany sectors.
By law, the MAVDT is responsible for granting environmental licensesand permits to large facilities and those in specified sectors, such as oiland gas exploration and development of energy generation. CARs areresponsible for the rest.As a result, CARs grant approximately 70 percentof all environmental licenses and permits. According to Blackman,Morgenstern, and Topping (2004), licensing and permitting present severalproblems. Both licensing and permitting involve copious red tape anddelays that create bottlenecks in the pipeline for urgently needed invest-ments and economic development. Licensing and permitting requirementsare not consistent across environmental agencies. For example, in MAVDTand in some CARs, companies building roads are required to reforestcleared areas, but in others there is no such requirement. Moreover,licensing and permitting in some environmental agencies is subject toarbitrary decisions.A root cause of all of these problems is that Colombianenvironmental licensing regulations are often ambiguous.
Evidence shows that enforcement of a wide variety of environmentalregulations in Colombia varies markedly among CARs, sectors, and sizesand types of firms. Contributing factors include several of the problemsdiscussed earlier: behaviors that protect the interests of polluters, lowlevels of human and technical capacity, poor information systems,reliance on voluntary regulation, and amorphous regulations (Blackman,Morgenstern, and Topping 2004).
Examples illustrating the problems with enforcement abound: inspec-tions are not made, fees are not collected, and institutional deficienciesinhibit enforcement. Other factors exacerbating the problem include thelimited quantity and reliability of information, lack of indicators tomeasure concrete results, lack of adequate systems for the final disposalof waste and limited oversight of compliance with waste disposal norms,and poor-quality laboratories to verify that the values declared or estimated
Actors and Institutions 47

for billing of environmental fees correspond to the real contaminationvalues (Contraloría General de la República 2003a).
National Environmental Council and National Technical Advisory Council
The National Environmental Council is a consultative group attached toMAVDT. Its permanent members are drawn from a wide array of institu-tions, including MAVDT, the Ministry of Education, DNP, universities,the private sector, nongovernmental organizations (NGOs), and indigenousand Afro-Colombian communities.As envisioned in Law 99, the council’srole was to provide a forum to give both public sector and private sectorstakeholders a voice in the design of important national environmentalpolicies. It was meant to produce documents that would have an impor-tant impact on policy. The council does not have a permanent staff orinstitutional support and meets on an ad hoc basis.
The National Environmental Council does not appear to be playingits intended role. Council meetings now attract upward of 100 people,often second- or third-tier assistants, and have become simply a formality.The council has produced more than 30 policy documents, all of whichwere approved with little debate (Blackman, Morgenstern, and Topping2004). Despite its shortcomings, the council plays the beneficial role ofencouraging MAVDT leaders to interact with various stakeholders,including their counterparts in other ministries.
Law 99 created the National Technical Advisory Council to adviseMMA on scientific and technical issues related to environmental policy.Unlike the National Environmental Council, it gives advice on decreesthat establish regulations subject to approval by the president. This ischaired by the vice minister for environment and has five to eight per-manent members, mainly from the private sector. The council includesrepresentatives from universities and the private sector, but seems to bedominated by the private sector (Blackman, Morgenstern, and Topping2004). The university representatives seldom participate in the councilmeetings. Historically, all council meetings include elected representa-tives of industry, agriculture, mining, and the petroleum industry.
National Planning Department
The DNP reviews and approves Colombia’s national investment budgetand evaluates the impacts of spending. All ministries must submit their
48 Blackman, Morgenstern, Topping, Hoffman, and Sánchez-Triana

budget requests to the DNP for approval. In addition, the DNP coordinatesthe writing of the multisectoral National Development Plan (Plan Nacionalde Desarrollo) required of each presidential administration, and serves astechnical secretary of the National Council of Economic and SocialPolicy (Consejo Nacional de Política Económica y Social, CONPES).Chaired by the president, CONPES is a high-level multisectoral gover-nance body that includes ministers and private sector representatives. Itcoordinates economic and social policy, approves loans, and issues policydocuments. The DNP also wields power by providing technical supportto the president on a wide array of matters, by distributing national fundsto municipalities, and by having the authority to negotiate and approveinternational loans to all Colombian public sector agencies.
The DNP’s internal organization virtually mirrors that of theColombian national government: its designated offices deal with each ofthe government’s various ministries and institutions. Until February 2004,the agency dedicated to the environmental sector was the EnvironmentalPolicy Office. This office had two key functions: it helped mainstreamenvironmental functions in a wide array of government institutions andpractices by working through the budgeting and planning process andthrough CONPES, and it monitored and evaluated the impact of invest-ments in the environmental sector. The Environmental Policy Office wasalso responsible for coordination between the DNP and the MAVDT.In February 2004, the government phased out this office and scatteredits functions among other DNP offices (Blackman, Morgenstern, andTopping 2004).
Until February 2004, the principal concern in the DNP’s relationshipwith CARs was monitoring their environmental investments and assess-ing the impacts of those investments. The DNP’s responsibility was toensure that CARs were spending their funds effectively. However, theDNP had considerable difficulty performing this function because CARslack adequate indicators of environmental quality. After 2004, the absenceof an Environmental Policy Office at the DNP led it to minimize itsmonitoring of CARs’ performance. This has widened the gap in environ-mental planning (Blackman, Morgenstern, and Topping 2004).
Although plans exist for subsectors within the environmental sector(such as forestry and environmental research), no systematic periodicplanning exercise establishes priorities across environmental programsand subsectors such as forestry, biodiversity, air pollution, waste manage-ment, water resources, and water sanitation. Planning is generally donesector by sector and, as yet, efforts to break out of sectoral boxes and
Actors and Institutions 49

prioritize across programs or sectors have not been successful. During1994 to 1998, efforts were made within the MAVDT to discuss policydocuments among subdirectorates, but it was not possible to arrive atshared concepts that would allow discussion of priorities across programareas. According to Blackman, Morgenstern, and Topping (2004), this situ-ation has not substantially changed. Sector-by-sector planning is still thenorm, and there appears to be little discussion of priority setting acrosssectors at a national level in the SINA. A review of the most recentNational Development Plans reveals little discussion of consideration ofpriorities across environmental sectors (DNP 2003; Galán 1998).
Investigational Institutes
Law 99 recognizes the critical role that information plays in environmentalmanagement. The drafters of Law 99 established investigational institutesto conduct research and collect data needed for public environmental man-agement.Two types of institutes were created by Law 99: (a) those that pri-marily have research responsibilities (von Humboldt Institute, the Instituteof Marine and Coastal Research, the Amazonian Institute for ScientificResearch, and the Environmental Research Institute of the Pacific); and(b) one that primarily has data collection responsibilities (IDEAM).
Various reports have found that coordination among the investigationalinstitutes and other SINA entities (particularly the MAVDT and IDEAM)is limited (Contraloría General de la República 2003b; IDEAM 2001).Theprimary function of IDEAM is to organize and direct environmental datacollection in Colombia (Law 99 of 1993, Decrees 1277 and 1600 of 1994).The 2003 annual report of the Contraloría de la República found that theresearch institutes’ work has not supported this function. A key character-istic of the poor coordination between the investigational institutes andother SINA entities is that the former tend to specialize in research that isacademic and not especially relevant to policy making.A number of factorscontribute to this problem (Blackman, Morgenstern, and Topping 2004).
For example, the MAVDT needs to strengthen its capacity to articu-late the SINA’s research priorities and to inform agendas of the investiga-tional institutes. However, no provision has been made in recent budgetsto provide staff time to consider research priorities or to communicatethose priorities to the institutes or other researchers (Contraloría Generalde la República 2003a). Furthermore, evidence suggests that the MAVDThas not yet created a plan to make effective use of high-quality, policy-relevant research when it is produced. Illustrating this are the five “red list”
50 Blackman, Morgenstern, Topping, Hoffman, and Sánchez-Triana

books that the Humboldt Institute has prepared on threatened species.11
MAVDT staff and local environmental authorities need the informationin these high-quality reports to develop land use plans and issue environ-mental licenses. These books provide so much information, however, thatneither the MAVDT nor local environmental authorities have the time—or sometimes the background—to use them effectively. The SINA needsto develop a mechanism to translate scientific research findings intoinformation that is usable by regulatory staff members with varying levelsof professional preparation (Blackman, Morgenstern, and Topping 2004).
Coordination efforts between the research institutes and the SINAcan be improved. Apparently IDEAM often is not responsive to requestsfor specific data, partly because it has no resources dedicated to facilitat-ing coordination and is seen as placing a higher priority on research thanon data collection (Blackman, Morgenstern, and Topping 2004).
CARs also contribute to poor coordination between the researchinstitutes and other SINA entities. CARs have critical responsibilities forcollecting environmental monitoring data. Facilities are obligated to self-monitor their discharges and then report them to CARs, which in turnare responsible for verifying the data and passing them on to IDEAM.IDEAM is responsible for certifying that CARs’ data are accurate and forcreating a database. However, IDEAM does not have the human andtechnical capacity needed to perform these functions. As of late 2003,pilot projects to develop CARs’ technical capacity to collect and trans-mit data to IDEAM have had limited success. This is undoubtedly due inpart to the slow progress in developing a consistent set of environmen-tal indicators. For their part, CARs do not see the research institutes assupporting their efforts (Contraloría General de la República 2003a).
Finally, the poor coordination between the researchers at the investiga-tional institutes and policy makers is partly a result of the different timehorizons of each group. Scientific researchers tend to focus on long-termproblems such as biodiversity loss. Policy makers, by contrast, tend to focuson shorter-term issues, the importance of which changes with each admin-istration (Blackman, Morgenstern, and Topping 2004). National funding forresearch institutes has declined over the past decade. As a result, some ofthe institutes have turned to other sources for financing. This reconfigura-tion is partly responsible for the disconnect between the research agenda ofthe investigational institutes and the needs of the MAVDT and otherentities in the SINA (Gómez Torres 2003). The situation of the HumboldtInstitute illustrates how the funding situation contributes to poor coordina-tion between regulators and the research institutes.
Actors and Institutions 51

Under Law 99, the Humboldt Institute is responsible for conductingresearch on Colombia’s flora and fauna and developing a national biodiver-sity inventory. The institute is organized around four themes: biodiversityinventory, conservation biology, valuation, and biodiversity policy andlegislation. According to its 2004 personnel list, about 70 percent of theinstitute’s 150 staff members are scientists, and the remaining are managersand administrative personnel. The MAVDT contributes 8 percent of theinstitute’s budget as an outright grant, and another 8 percent in the formof contracts for specific services. CARs, NGOs, and international donorssuch as the German bilateral foreign aid agency GTZ and the GlobalEnvironment Facility contribute the remainder of the budget.12 To sup-port itself financially, the institute must pursue topics deemed importantby international funding sources. As a result, even though the institute’sboard of directors comprises representatives of nearly all the major SINAinstitutions, the research topics it pursues are not necessarily of centralinterest to policy makers in the SINA. Although the institute has beenthe most financially successful of Colombia’s research institutes, it stillhas considerable difficulty generating sufficient funds.13
Self-financing of the investigational institutes can affect coordinationin more subtle ways. For example, unlike the other four research institutes,IDEAM depends largely on public sector financing. Recent national fiscalpolicy has led to requirements that IDEAM charge for the data it collects.This may limit IDEAM’s ability to influence the direction of nongovern-mental research in the SINA. This cost-recovery policy is a problembecause IDEAM data have become too expensive for a significant numberof researchers to use (Blackman, Morgenstern, and Topping 2004).
It is important that Colombia’s research system develop capacity toaddress ecosystem health and urban environmental issues. None of thefour research-oriented institutes focuses primarily on industrial pollutioncontrol and human health. The issue of the coverage of research topicsaside, an open question is whether the current configuration of fourresearch institutes and one data collection institute is optimal, givenchronic funding constraints and Colombia’s environmental priorityproblems (Blackman, Morgenstern, and Topping 2004).
National Parks System
Colombia’s National Parks System (Sistema de Parques Nacionales)comprises 51 protected areas that fall into four categories: (a) nationalnatural parks, (b) flora and fauna sanctuaries, (c) unique natural areas, and
52 Blackman, Morgenstern, Topping, Hoffman, and Sánchez-Triana

(d) forestry reserves. These protected areas encompass approximately10 percent of Colombia’s territory and include 30 percent of its head-waters (UAESPNN 2002). Until 1993, a National Institute of RenewableNatural Resources office administered protected areas. Law 99 placedthe system under the control of an independent office attached to theMMA. In 2002, the National Parks System employed 364 staff membersand 132 contractors.
The greatest challenge facing the National Parks System is lack of ruleof law, making it very difficult to enforce regulations that restrict cer-tain land uses in the parks, particularly in areas of social unrest. About79 percent of the area of the National Parks System is occupied or affectedby this unrest.
Most deforestation in the national parks is attributable to land tenureand shifting agriculture. A related problem is that park boundaries oftenoverlap with other legally designated areas. These areas either explicitlyor implicitly allow land uses that are inappropriate for protected areas.
Funds for the National Parks System are generated by threesources: fees charged for ecotourism within the parks, the nationalbudget, and international sources, all of which have decreased inrecent years. Ecotourism and international aid have decreased as aresult of continued social unrest.
The National Parks System is a semiautonomous unit under theMAVDT, but better integration with the MAVDT would enable theministry to promote the policies of the National Parks System moreeffectively. Currently, the park system must rely on the MAVDT toenforce land use restrictions, and this process is often inefficient.Conversely, the parks system needs more autonomy so it can raise itsown funds and have more control over administration of its more distantparks. In 2005, the government was incorporating nongovernmental andprivate sector organizations in the management of national parks, and theparks system contracted a large travel agency for the operation andmaintenance of two national parks.
Public Participation
The 1991 Constitution envisions a central role for individual citizens andNGOs in formulating and implementing environmental policy. In additionto having a right to a healthy environment, citizens have an express dutyto protect natural resources and the environment. The Constitutionenables them to do so in three ways: (a) by filing a popular action (acción
Actors and Institutions 53

popular) to protect the collective right to a clean environment; (b) by filinga compliance action (acción de cumplimiento) to assure that laws—includingenvironmental laws—are upheld; and (c) by filing an action requestinginjunctive relief (acción de tutela) to prevent violation of fundamentalrights, including the right to a clean environment where environmentaldeterioration threatens human health (Iguarán 2001). The 1991 Consti-tution also specifically requires adoption of statutes that guarantee com-munity participation in decisions that affect the environment throughthe right to petition public authorities, public hearings, open meetings,referendums, and standard participation in elections, and, in the case ofthe Contraloría, requires adoption of laws that create systems to allowcitizens to monitor public fiscal management at all levels of government.
Control Organizations
Within the Procuraduría General, la Procuraduría Delegada para AsuntosAmbientales (Procuraduría Delegada) is responsible for oversight of allenvironmental authorities in Colombia. Nine lawyers and three technicalpeople staff the office, a level insufficient to carry out its functions. TheProcuraduría General hopes that this deficiency can be corrected, in part,by an agreement among the Fiscalía,14 the Contraloría General de laRepública (Contraloría) and the Procuraduría Delegada to share evidence.The Procuraduría General views its central function as preventing abuse ofoffice and failure to implement policy. To be more effective, each year theProcuraduría Delegada chooses a specific area on which to focus. In 2003,for example, it focused on solid waste and wastewater treatment plants.
Environmental staff members within the Contraloría flagged a number ofperformance-related concerns. For instance, their capacity to carry out over-sight has been constrained by the absence of environmental indicators.This has impeded program evaluation. The Contraloría also has difficultyreconciling heterogeneous data from the various agencies involved inenvironmental policy, including the DNP, the MAVDT, the NationalStatistical Administration Department (Departamento AdministrativoNacional de Estadísticas, DANE), and the Contraloría itself.
As a result of the absence of these indicators, the national controloffices use administrative indicators of performance, rather than indicatorsbased on environmental quality. Several persons interviewed for theBlackman, Morgenstern, and Topping report (2004) argued that CARsare at least partly responsible for the slow progress in developing indicators.Under current law, the control organizations can set in motion procedures
54 Blackman, Morgenstern, Topping, Hoffman, and Sánchez-Triana

to remove CAR general directors for failure to comply with CAR actionplans. This creates a strong incentive for CARs to block implementationof effective indicators. The government issued Decree 1200 of 2004 toestablish the framework for environmental indicators.
Judiciary
The Constitution of 1991 and Law 99 of 1993 assign to the judiciary acentral role in the SINA. Under the 1991 Constitution, every citizen hasthe right to file public actions in defense of the Constitution and the lawand to petition authorities. As discussed, the Constitution and implement-ing laws and decrees create three causes of action that citizens can use todemand protection of constitutional rights to a healthy environment andimplementation of environmental law.15 These formal provisions foraccess to justice to enforce environmental rights are extraordinary.
There is mixed evidence regarding the effectiveness of this access.Based on criteria developed by the Access Initiative, a major internationaleffort to promote public participation in environmental management, anational legal system needs: “(i) constitutional guarantees for access tojustice; (ii) impartial administrative, judicial, and alternative venues forresolution of conflicts and remedy; (iii) affordable and timely legal services;and (iv) active education by government on the participation and envi-ronmental rights of the public and how they can use the legal system toprotect those rights” (Access Initiative 2004). A number of these require-ments are still absent in Colombia.
For example, although the 1991 Constitution guarantees access tojustice, relatively few Colombians are aware of this right (Seligson2001). Fewer than 30 percent of respondents to a recent survey knew ofacciónes de tutela16 even though this particular action was by far thebest known, and less than 1 percent of respondents were aware of theavailability of public hearings or other causes of action before the courts.
Notwithstanding these problems, most evaluations of acciónes detutela are positive. Survey research has indicated that acciónes de tutelaare the most widely used causes of action and are viewed as the mosteffective means of citizen control over government actions (Saez 2003).The Constitutional Court, which hears acciónes de tutela, has proved tobe a very attractive forum. Through 2001, the number of claims broughtas acciónes de tutela in all areas grew at a rate of 130 percent per year.More than 400,000 such actions were brought in 2000 (Saez 2003).Furthermore, petitioners were opting to bring acciónes de tutela in the
Actors and Institutions 55

Constitutional Court instead of through normal jurisdictional channelsbecause decisions there are perceived to be faster and more principled, andwith good reason. Between 1992 and 1995, the Constitutional Courtgranted almost 40 percent of the acciónes de tutela brought before it,while the highest court in the conventional civil court system held forpetitioners in less than 7 percent of cases (Seligson 2001).
Conclusions and Recommendations
Principal problems within the SINA include the following: (a) insufficientdata on environmental quality and institutional performance; (b) subop-timal priority setting across environmental subsectors and programs;(c) inefficient public environmental spending on the SINA; (d) limitedenvironmental management capacity at the MAVDT; (e) reliance onvoluntary regulations and voluntary clean production agreements thatperpetuate noncompliance with existing regulations; (f) suboptimalregulations—for example, command-and-control emissions standardsadopted from more developed countries with little or no modification;(g) poor coordination among the MAVDT, CARs, and SINA entities; (h)potential adverse impact from the merger of environment and economicdevelopment, and weak regulations and control agencies; (i) limitedtechnical capacity in some CARs; and (j) weak enforcement—for example,of the effluent fees that CARs charge to polluters, only one-third areactually collected (Blackman, Morgenstern, and Topping 2004).
One of the main conclusions is that the SINA might benefit fromestablishing a systematic mechanism for priority setting across environ-mental programs and subsectors. Planning is generally done sector bysector, and efforts to break out of sectoral boxes and consider prioritizationacross programs or sectors have not been successful. This is a commonproblem in environmental regulatory systems around the world and ispartly attributable to the fact that, in most environmental regulatorysystems, day-to-day work is organized by environmental media or prob-lem areas, such as forestry, water, or air. Lack of cross-sectoral planningcontributes to imbalances in budgetary priorities.17 For example, a recentaudit of the MMA found that biodiversity conservation, reforestation,watershed management, and other rural environmental issues accountedfor three-quarters of the ministry’s investment budget, but over 70 percentof the population lives in urban areas and is exposed to significant healthrisks. Priority setting across subsectors and programs would be greatlyenhanced by improvements in data collection and environmental indicators.
56 Blackman, Morgenstern, Topping, Hoffman, and Sánchez-Triana

However, even with current information sources, greater attention to set-ting priorities across environmental subsectors would help improve theeffectiveness of environmental management in Colombia. The SINA hasspent approximately Col$5 billion without measurable impact indica-tors to promote linkages between national and regional priorities, or toincrease understanding of the impacts of key sectors on the environ-ment. Despite high levels of expenditures, there is no direct correlationbetween CAR investments and national environmental priorities.18 Thelevel of funding for the environment in Colombia may be a less impor-tant consideration than the efficiency with which funds are spent.
Establish a Mechanism for Setting Priorities Across Environmental SubsectorsAnalysis reveals that expenditures on environmental management focuson investments in water basin management, wastewater treatment, andforestry and biodiversity conservation, with much less attention to urbanand rural environmental issues affecting the poor, such as air quality,waterborne diseases, and natural disasters. To better align resources withthe environmental problems that need to be addressed, coordination andan agreed agenda among the SINA, the DNP, and the MAVDT is necessary,as is a plan to strengthen the design, monitoring, and execution ofenvironmental policies. The areas of SINA that could be strengthenedinclude (a) promotion of environmental health; (b) sustainable urbandevelopment; and (c) planning, control, and monitoring of environmentalmanagement. Specific actions include: control of air pollution; promo-tion of hygienic practices; management of hazardous waste; strategicplanning; improvement of urban life quality; strengthening of urbandevelopment management; and development of instruments for plan-ning, monitoring, and evaluation of environmental management.
Colombia’s regional diversity implies that CARs may set very differentgoals and may use very different strategies to achieve them.19 Nevertheless,a regular priority-setting mechanism that accommodates this diversity—and the consequent need for policy flexibility—is likely to generate con-siderable benefits by helping to rationalize and coordinate environmentalprotection activities across subsectors, regions, administrative levels, andinstitutions. In the setting of environmental priorities, it would be advisableto promote legitimacy and “buy-in” through participatory processes.
One option is for the MAVDT to require that each CAR periodicallyperform an assessment of the relative importance of various risks tohuman health and the environment in the CAR’s territory. Furthermore,
Actors and Institutions 57

the MAVDT can require that CARs use this comparative risk assessmentto guide the allocation of financial, human, and technical resources(see chapter 4).
Initiate a Long-Term Program to Review and Rationalize RegulationsIn the short term, it would be advisable to commission an independentstudy, or use existing studies, to identify and prioritize challenges posed byregulations for implementation of environmental statutes, including gaps,inconsistencies, and inappropriate levels of specificity, and technicalrequirements that are not appropriate to current local conditions inColombia.The results of this analytical effort might help to initiate a long-term program of rationalizing and reforming environmental regulations.Todesign and implement policies to tackle environmental problems thatrepresent the largest share of the cost of environmental degradation, itwould be advisable to undertake strategic environmental assessmentsrelating to environmental health, vulnerability to natural disasters, andurban environmental management.
Evaluate and Rationalize Voluntary RegulationA paucity of evidence supports the contention that national-level voluntaryclean production agreements have been reasonably successful at promotingcompliance with existing regulations—or even at furthering improved envi-ronmental performance. This conclusion is in line with international experi-ences in voluntary regulatory compacts, in both industrial and developingcountries. Thus, further efforts to promote clean production agreements inlieu of mandatory regulation should be undertaken cautiously, if at all. At aminimum, any future voluntary agreements should shift the burdenof proof of intent to comply onto polluting firms by establishing clearperiodic performance milestones (focusing on easily monitored activities)that would need to be met for the agreement to continue in force.
The argument for continued reliance on voluntary environmentalguides is stronger.These guides appear to fill a need for user-friendly offi-cial guidance information on how firms and farms can improve theirenvironmental performance and how they can comply with regulationsthat, as discussed above, are often incomplete and unclear. Nevertheless,as discussed, the guides themselves have created confusion. For this reason,efforts might be considered to modify them and to clarify the role theyplay within the SINA. In general, the guides could be revised to ensurethey are consistent with existing command-and-control regulations.
58 Blackman, Morgenstern, Topping, Hoffman, and Sánchez-Triana

Improve the Collection, Management, Dissemination, and Use of Environmental DataBecause information is the cornerstone of improved environmental man-agement within the SINA, the MAVDT could consider improving datacollection and management at the CAR level and to collate and integratethese data nationally.Toward this end, the MAVDT might establish a sys-tem of indicators of both environmental quality and of CAR performance.The indicators could be sufficiently limited in number and sufficientlysimple so that it is possible to implement the system despite the modestdata collection and management capacity expected to prevail in CARs inthe medium term. It is also very important that the system be consistentacross CARs to ensure that data from different CARs can be comparedand aggregated at the national level.20
Strengthen Advance Notice of Significant Environmental Policy Actions and Provide Opportunities for Public InputPublic participation in environmental policy making in Colombia couldbe strengthened by establishing formal procedures to facilitate informingthe public when new policies are being considered, providing opportunitiesto comment on proposed new policies, and having comments taken intoconsideration, at all levels of government.This would entail (a) establishingclear procedures for national and regional regulatory agencies to provideearly notification of the government’s intent to draft new regulations ormake major changes in policy (for example, requiring drafts of proposedregulations to be published in the Diario Legal and on publicly accessibleWeb sites) and for enabling the public to comment on these notices;(b) building into environmental assessment regulations (Decree 1220 of2005) the opportunity for public comment on investment projects andgovernment programs, plans, and policies; and (c) developing the agencies’internal capacity to consider comments in writing regulations and makingpolicy, and to report back to the public on how public comments weretaken into consideration.
Improve Coordination between the MAVDT and CARs and Build Management Capacity in CARsThe MAVDT might explore new strategies for improving coordinationbetween the MAVDT and CARs and building management capacity inCARs.A necessary condition is to establish a system for collecting credibledata on the institutional performance of CARs. These data are neededfor planning coordinated activities, monitoring compliance with such
Actors and Institutions 59

plans, and monitoring overall institutional performance. Actively dissem-inating such data—or even publicly disclosing it—can create strongincentives for compliance with coordinated plans and for improved insti-tutional performance. Other potentially complementary mechanismsinclude strengthening the capacity and authority of the SINA’s controlorganizations, which, in theory, are responsible for ensuring that CARs’activities are in line with the law.
Appoint an Independent Commission to Evaluate the Impacts of the Merger of the Ministries of Environment and Economic Development The government might consider appointing an independent, nonpartisancommission to evaluate the impacts of the merger on the MAVDT’sability to play its role as the SINA’s rector and to regulate the provisionof national-scale infrastructure. (For a definition of such projects, seeLaw 99 of 1993, Art. 52.) The commission’s report could be disclosed tothe public. Ideally, the commission would serve a dual function: it wouldprovide the data that policy makers need to assess the impacts of themerger of the ministries, and to take any remedial action; and it wouldcreate incentives for national policy makers to be proactive in ensuringthat potential damages from the merger are minimized.
See table 3.3 for a summary of these recommendations.
60 Blackman, Morgenstern, Topping, Hoffman, and Sánchez-Triana
Table 3.3 Recommendations
Priority: short (S),
medium (M),
Recommendation and long term (L) Participating organizations
Establish a mechanism for setting S Congress, MHCP, DNP,
priorities across environmental MAVDT, CARs
subsectors
Initiate a long-term program to review S DNP, MAVDT
and rationalize regulations through
strategic environmental assessments
relating to (a) environmental health,
(b) vulnerability to natural disasters, and
(c) urban environmental management
Evaluate and rationalize voluntary S–M MAVDT
regulation
Improve the collection, management, S MAVDT, IDEAM, CARs
dissemination, and use of
environmental data

Notes
1. Allen Blackman, Richard Morgenstern, Elizabeth Topping, Sandra Hoffman,and Ernesto Sánchez-Triana are the authors of this chapter, which drawsheavily from a background document prepared for this study by Blackman,Morgenstern, Topping, and Hoffman (2004).
2. The Contraloría is responsible for fiscal oversight including financial auditingand broader evaluation of the cost-effectiveness of government programs.Each year the Contraloría must present Congress with a report on the stateof the environment and natural resources in Colombia (Const. Art. 268).
3. These eight CARs are CAR Cundinamarca, CDMB, CORANTIOQUIA,CORNARE, CORTOLIMA, CRA, CRC, and CVC.
4. In Colombia, royalty payments to departments and municipal governments cor-respond to a percentage of the production of nonrenewable natural resources,mainly oil and gas, coal, and nickel. Laws 141 of 1994 and 756 of 2002 estab-lish the royalties to be paid for the production of oil and gas and minerals. Theroyalty law established a system of variable royalty payments of 8 to 25 percentfor the oil and gas sector, based on the level of production. Royalties for min-erals except petroleum range from 1 to 12 percent. For coal, the royalty rate is10 percent for mining companies that produce more than 3 million metric tonsper year and 5 percent for those that produce below that level. The highestlevels of royalties are for nickel and salt (12 percent). Most of this compen-sation is distributed directly to producing departments and municipalities. Asmaller portion is distributed to all departments and municipalities through theNational Royalties Fund (Fondo Nacional de Regalías). Revenues accrued fromroyalties amounted to 1 percent of Colombia’s gross domestic product in 2002.
Actors and Institutions 61
Table 3.3 Recommendations (continued)
Priority: short (S),
medium (M),
Recommendation and long term (L) Participating organizations
Strengthen advance notice of significant S MAVDT
environmental policy actions and provide
opportunities for public input
Improve coordination between the S MAVDT, CARs, FNR, FONAM
MAVDT and CARs and build management
capacity in CARs
Appoint an independent commission to M DNP, MAVDT, IDEAM
evaluate the impacts of the merger of the
Environment and Economic Development
Ministries
Source: Authors.
Note: FNR = Fondo Nacional de Regalías; MHCP = Ministerio de Hacienda y Crédito Público.

62 Blackman, Morgenstern, Topping, Hoffman, and Sánchez-Triana
5. The decision held that these resources must be invested in the urban perimeter,but the CARs—not the AAUs—are responsible for this investment.
6. According to the MAVDT, “in the process of assigning resources to CARprojects, DNP is only responsible for approving resources for projectsfinanced with national budget resources, which are assigned to those CARsthat have less potential to collect resources” (MAVDT 2006, p. 6).
7. The Procuraduría Delegada para Asuntos Ambientales is an autonomous entityin charge of upholding universal human rights and the correct functioning ofpublic institutions protecting citizens’ interests.
8. The 2002–06 administration initially planned to merge the Ministries ofEnvironment and Agriculture. However, this plan was ultimately changedbecause of the belief that merging the Ministries of Environment andEconomic Development could help improve the administration of infrastruc-ture investments (primarily in sanitation and water), because responsibilityfor such investments had historically been split between these two ministries.
9. According to the MAVDT (2006, p. 6), under “clean production agreementsit has never been agreed that the Environmental Authority stops exercising itscommand and control functions in order to promote compliance with normsand standards.”
10. One such program focused on small and medium enterprises in Bogotá. Asecond successful voluntary program called Programa Excelencia is not a con-ventional clean production agreement. It involves rating the environmentalperformance of polluting facilities, and then publicizing the ratings.
11. The red list and red data books are products of a World Conservation Unionprogram designed to list and develop data needed for management to protectthreatened and endangered species.
12. The Humboldt Institute has 27 permanent staff members whose salaries arepaid by national government contributions; salaries for researchers and all otherproject-specific staff members are covered by other sources.
13. The Humboldt Institute does have a very direct tie to MAVDT policy makers.The MAVDT contracts out several specific functions to the institute, includingimplementation of the National Biodiversity Policy. Some 27 members of theinstitute’s staff are currently on contract with the MAVDT.
14. The Fiscalía is an entity of the judicial branch with broad administrative andbudgetary autonomy, the function of which is to provide citizens with dueand efficient administration of justice.
15. See Constitutional Articles 77, 86, 87, 88; Law 393/97; Law 472/98; Law99/93 Art. 77; Decree 306/92; Decree 2591/92.
16. Acciónes de tutela are actions requesting injunctive relief—legal procedures forthe immediate protection of fundamental rights from threats by authorities or

individuals. Tutelas protect citizens from arbitrary acts of authority and fromactions by individuals in cases in which a subordinating relation exists.
17. According to the MAVDT (2006, p. 6), “the resource potential of Corporationsdoes not depend on whether the Corporation operated prior to Law 99 of1993 or if it was created by the law, but rather on the development conditionsof its jurisdiction. Taking into account that the most important sources arethe percentage of municipal property taxes transferred for environmentalmanagement and electricity sector transfers, it is clear that in less developedterritories collection of the first source is limited and that electricity generationprojects do not benefit all Corporations.”
18. According to the MAVDT (2006, p. 6), regional and national priorities coincide,given that “in the National Development Plan general areas are identified thatshould be defined at the regional level in accordance with their importance atthat level.”
19. According to the MAVDT (2006, p. 6), the “objectives of the Corporationsand their functions are defined under Law 99 of 1993. What adjusts to theircharacteristics is the development of actions within the framework of nation-al policies. In developing the planning instruments of the Corporations,advances are being made in the definition of regional action priorities thatoriginate from participatory processes.”
20. According to the MAVDT (2006, p. 6), it “should be recognized that an effortis being made to consolidate an information system and an indicators system.The document poses a recommendation that is already underway with theapplication of Decree 1200 of 2004 and Resolution 643.”
References
Access Initiative. 2004. The Access Initiative. http://www.accessinitiative.org.
ASOCAR (Colombian Association of Environmental Authorities). 2002.Spreadsheet containing self-reported performance data provided by CARs for2002. Bogotá.
Blackman, Allen, Richard Morgenstern, Elizabeth Topping, and SandraHoffman. 2004. “Assessment of Colombia’s National Environmental System(SINA).” Consulting Report for the World Bank, Resources for the Future,Washington, DC.
Blackman, Allen, Richard Morgenstern, and Elizabeth Topping. 2004.“Institutional Analysis of Colombia’s Autonomous Regional Corporations(CARs).” Consulting Report for the World Bank, Resources for the Future,Washington, DC.
Booz Allen Hamilton. 1997a. “Institutional Strengthening of the Ministry ofEnvironment. Implantation Plan.” Consulting Report, Bogotá.
Actors and Institutions 63
———. 1997b. “Institutional Strengthening of the Ministry of Environment.Project of Decree Law and Exposition of Motives.” Consulting Report. Bogotá.
Contraloría General de la República. 2003a. Estado de los Recursos Naturales y delAmbiente. 2002–2003. Bogotá: Contraloría.
———. 2003b. Informe de Auditoría al MAVDT. Bogotá.
———. 2004. Estado de los Recursos Naturales y del Ambiente. 2003–2004. Bogotá:IDEAM-MAVDT.
DNP (Departamento Nacional de Planeación). 2003. “Hacia un EstadoComunitario.” Plan Nacional de Desarrollo 2002–2006, DNP, Bogotá.
Esterling Lara Sánchez,Angel. 2003.“Evaluation and Perspectives on the ConsensusAgreements for Cleaner Production in Colombia.” Consultant Report,MAVDT, Bogotá.
Galán, Francisco Alberto. 1998. “Rationalization of Spending in SINA:Institutional Firming towards Decentralization.” Contract DNP-075-98, FinalReport, Executive Summary, Bogotá.
Garay, Jorge Luis, ed. 2002. Colombia: Entre la Exclusión y el Desarrollo (Colombia:Between Exclusion and Development). Bogotá: Contraloría General de laRepública.
Gómez Torres, M. 2003. “Fiscal Policy for Environmental Management inColombia.” XV Regional Seminar on Fiscal Policy, Economic Commission forLatin America and the Caribbean, Santiago, January 27–30.
IDEAM (Institute of Hydrology, Meteorology, and Environmental Studies). 2001.“First National Communication to the United Nations FrameworkConvention on Climate Change.” Report, Bogotá.
Iguarán, M. 2001. “La Acción de Tutela como Mecanismo de Protección delDerecho a un Ambiente Sano.” In Justicia Ambiental. Universidad Externadode Colombia; Instituto de Estudios del Ministerio Público; CAR, Bogotá.
Interinstitutional Committee on Indicators. 2002. “Advance in SustainableDevelopment Indicators in Colombia.” http://www.medioambiente.gov.ar/documentos/novedades/seminario_indicadores_desarrollo/J_Canal.pdf.
MAVDT (Ministerio de Ambiente, Vivienda y Desarrollo Territorial). 2004.“Planes Nacionales de Desarrollo 1994-2003.” Bogotá.
———. 2006. Comentarios Consolidados al Documento CEA. E-mail sent byLeonardo Pinzon, Olga Bautista, and Pedro Chavarro to Angela Armstrong.February 17, 2006.
MMA (Ministerio del Medio Ambiente). 2002. Las Voces del SINA. Editado porAngela Ines Sanchez, Bogotá: MMA.
Peña Villamil, Fany. 2003. “Compendium of Information on SustainableDevelopment Indicators in Colombia.” Consulting Report for the WorldBank, Bogotá.
64 Blackman, Morgenstern, Topping, Hoffman, and Sánchez-Triana

Saez, Felipe. 2003. “Corruption, Institutional Performance, and Governance:Developing an Anticorruption Strategy for Colombia.” In Colombia: TheEconomic Foundation of Peace, ed. Marcelo Giugale, Olivier Laforcade, andConnie Luff, 931–55. Washington, DC: World Bank.
Sánchez-Triana, Ernesto. 2001. “La Nueva Comisión de Regalías: Instrumento delCambio para Construir la Paz.” Regalías, Volume 1 January–March 2000.
Seligson, Mitchell. 2001. “Transparency and Anti-Corruption Activities inColombia: A Survey of Citizen Experiences.” Unpublished Paper. Universityof Pittsburgh, Pittsburgh, PA.
UAESPNN (Unidad Administrativa Especial del Sistema de ParquesNacionales Naturales). 2002. Analysis of the Technical-Mission SupportProcesses. Bogotá: UAESPNN.
Actors and Institutions 65


Environmental management in Colombia has been decentralized to theAutonomous Regional Corporations (CARs). This unique feature of Colombia’senvironmental management system has several strengths, including financialautonomy and involvement of local stakeholders in environmental governance.The 33 CARs display marked heterogeneity. Analysis of their performance indi-cates that they do not always adequately prioritize environmental issues. Otherconcerns are financial and jurisdictional conflicts among CARs, and suboptimalcoordination between the Ministry of Environment, Housing and RegionalDevelopment and CARs. There are also challenges to improving CARs’ trans-parency and accountability mechanisms, and to improving guidance from thenational government. Solutions include (a) improving priority setting by CARs,(b) reconstructing CARs’ governance structure, (c) resolving conflicts betweenCARs and Urban Environmental Authorities, and (d) eliminating those CARsthat chronically perform poorly.
Although Law 99 assigns the Ministry of Environment (Ministerio delMedio Ambiente, MMA) the role of leading and coordinating environmen-tal management in Colombia, arguably one group of the most importantinstitutional actors of the National Environmental System (SistemaNacional Ambiental, SINA) is the Autonomous Regional Corporations
C H A P T E R 4
Decentralization: A Balancing Act
67

(Corporaciones Autónomas Regionales, CARs), which are assigned the roleof implementing environmental policy.1 This chapter looks at theperformance of CARs by examining (a) the sources of CARs’ financialresources, (b) the allocation of CAR resources and priority setting, (c)proposed reforms to CAR governance, (d) conflicts of interest related tosanitation infrastructure, and (e) the relationships between CARs andother SINA agencies.
Colombia’s 33 CARs display marked heterogeneity across a wide varietyof institutional characteristics including performance, priorities, resourceallocation, finances, and human and technical resources. CARs’ basic geo-graphical, historical, and socioeconomic characteristics also vary widely. Insize, CARs range from 51 square kilometers (CORALINA) to 226,000square kilometers (CORPOAMAZONIA), and in number of municipali-ties from 2 (CORALINA) to 87 (CORPOBOYACA). Eight CARs borderon five Urban Environmental Authorities (Autoridades AmbientalesUrbanas, AAUs). Sixteen CARs were established before enactment of Law99 of 1993. Population varies from 81,000 (CORALINA) to over 4 million(CVC), and urbanization from 22 percent (CORPOGUAVIO) to 94 per-cent (CRA). Gross domestic product (GDP) varies from Col$100 billion(US$46.5 million) (CORPOGUAVIO) to Col$21,509 billion (US$10 bil-lion) (CVC). Literacy varies from just 68 percent (CODECHOCO) to 95percent (CORALINA). Perhaps most striking of all, poverty, measured asthe percentage of municipalities where basic needs are not met for morethan 53 percent of the population, varies from 0 percent (CVC and CRQ)to 100 percent (CDA). Many of these socioeconomic characteristics (forexample, poverty and literacy) are highly correlated (annex 4.1).
Overall Performance of CARs
Since 1993, CARs’ principal responsibility has been environmental pro-tection. Therefore, the ideal means of measuring how well individualCARs are carrying out this responsibility is to assess their impact onenvironmental quality over time using data on, for example, hectaresreforested and water pollution reduced by year. Unfortunately, the qualityof environmental data in Colombia is poor—although some credibleenvironmental quality data exist for selected natural resources and geo-graphical subregions, very little complete and reliable data exist at theCAR level. A recurring finding of research on CARs is a paucity of dataon environmental quality and institutional performance at the CARlevel. The importance of this deficiency is impossible to overstate. It
68 Blackman, Morgenstern, Topping, and Sánchez-Triana

hamstrings environmental decision making at the regional, national, andeven at the international levels. A more immediate implication is that ithas placed important limitations on the present analysis of CARs.
Because of this problem, past studies of CARs’ performance have sup-plemented existing CAR-level data on environmental quality withprocess-related proxy data, that is, information about whether and towhat extent CARs carry out functions associated with environmentalprotection.Although clearly second best, such data do provide some usefulinformation about performance. More specifically, they provide an indi-cation of whether necessary (but insufficient) conditions exist for a CARto have a positive impact on environmental quality. Therefore, proxy datahelp to identify CARs that are unlikely to have a positive impact on theenvironment, as opposed to CARs that actually do have a positive impact.
The only repository of extensive CAR-level performance data ismaintained by the Colombian Association of Environmental Authorities(Asociación Colombiana de Autoridades Ambientales, ASOCAR). Most ofthe data are self-reported by CARs in response to an annual ASOCARsurvey. The ASOCAR data set comprises hundreds of variables, but muchof it is only tangentially related to performance, or is incomplete. Of thecomplete and consistent variables in the ASOCAR data, there are 14 thatbest measure performance. These variables are presented in table 4.1.Four of the 14 performance variables are direct measures of performance.The remaining 10 performance variables are measures of processes relatedto environmental management.
The dependent variable was constructed with two indexes: GRADE1 and GRADE 2. GRADE 1 is based on all 14 variables, including directmeasures of performance and process-related proxies, and GRADE 2 isbased only on the four direct measures of performance. The two indexeswere constructed as follows: First, to be able to compare and aggregatevariables measured in different units (for example, RAIDS, the numberof raids per hectare per year, with REDUCE_H20_PLN, the reduction inbasic oxygen demand per year), each of the 14 variables was scaled usingthe following formula:
Scorei = (Xi � minimum value of X) � 100/ (maximum value of X� minimum value of X)
where i indexes each of the 33 CARs, and X is the performance variablein question. This formula produces a score on a scale of 1 to 100 where1 corresponds to the minimum value of the performance variable and
Decentralization: A Balancing Act 69

100 corresponds to the maximum value. After the variables were scaled,they were summed. GRADE 1 is the sum of all 14 scores, and GRADE2 is the sum of four scores derived from the direct-measures variables.Finally, GRADE 1 and GRADE 2 were used to rank CARs.
Results from the econometric analysis of these variables by Blackman,Morgenstern, and Topping (2004) indicate that three socioeconomiccharacteristics are correlated with overall performance: (a) whether theCAR was established before Law 99 of 19932; (b) the percentage ofmunicipalities in the CAR where the basic needs of more than 50 per-cent of the population are not met (poverty); and (c) the natural log ofgeographic area in square kilometers. CARs established before Law 99are considered to be more effective because they have stronger institu-tions and more political and popular support. At least two factors mayexplain the poverty result. First, considerable research suggests a linkbetween poverty and environmental degradation (Duraiappah 1998).Therefore, CARs with higher rates of poverty may face more significantchallenges in mitigating environmental problems. Second, poorer CARsmay generate lower tax revenues and have a limited supply of environmen-tal professionals in both the public and the private sectors. As a result,
70 Blackman, Morgenstern, Topping, and Sánchez-Triana
Table 4.1 ASOCAR Data Variables with Direct Measures of Performance
Variable Indicator
Variables with direct measures of performance
REFOREST Percentage of hectares reforested out of total susceptible land
SOLID WASTE Percentage of municipalities with legal solid waste disposal by 2002
REDUCE_H20_ PLN Reductions in total suspended solids + biochemical oxygen
demand per Col$ of GDP by 2002
CLEAN_PDN GOALS Percentage of clean production goals achieved by 2002
Variables with measures of processes related to environmental management
ENVIRO_PDM Percentage of municipalities with environmental section of
Municipal Development Plan
ENVIRO_POT Percentage of municipalities with environmental component
in Land Use Plan
WATER_MGMT _PLAN Percentage of CAR area under watershed management plan
RAIDS Number of raids per hectare per year
SEIZURES Seizures of logs, flora, and fauna in 2002
VALUE_FINES Value of fines by 2002
EFF_PERMIT Percentage of effluent sources permitted in 2002
DIS_PREV_PLAN Percentage of municipalities with disaster prevention plans
ENV_ED_PLAN Percentage of municipalities with environmental education plans
SOIL_ZONING Percentage of municipalities with land zoning plans
Source: Blackman, Morgenstern, and Topping 2004.

such CARs may have to make do with relatively low levels of financialand human resources. The explanation for those CARs that have geo-graphically smaller jurisdictions and that perform relatively well is fairlyobvious—such CARs presumably have more financial, managerial, andtechnical resources to devote to each hectare. The econometric analysisalso shows a very low correlation with some characteristics such as rev-enues (normalized as total spending per CAR inhabitant) and number ofstaff members, among others.
Allocation of CAR Resources and Priority Setting
Collectively, CARs invested Col$331,418,152,500 (about US$15.4 million)in 524 projects in 2001. The number of investment projects per CARranged from 4 (CVS) to 84 (CAM) while the size of the investment proj-ects ranged from Col$200,000,000 (US$65,000) to Col$93,184,000,000(US$51.4 million). The size of the average investment project wasCol$632,477,000 (US$295,175). To determine how CARs allocatedtheir investment funds across environmental subsectors, each investmentproject can be placed into one of 22 different categories, which are thenaggregated into 4 meta-categories (table 4.2).
According to Blackman, Morgenstern, and Topping (2004), an analysisof the distribution of investment funds and projects among the 4 meta-categories and 22 categories for each CAR reflects two important trends.First, CARs allocated a relatively large percentage of funds—11 percent, thethird-largest percentage outside of flora and fauna conservation and con-struction of municipal wastewater treatment plants—to projects in theoperations-related general activities category (category 20). This categoryincludes projects that, as judged by their titles, would be more accurate-ly classified as operations expenditures than investment expenditures.Examples include projects titled Legal Advice on the Defense ofInstitutional Interests, Strengthening of Monitoring and ControlActivities, and Participation in Environmental and Natural ResourcesAssociations and Events. Blackman, Morgenstern, and Topping (2004)offer a hypothesis for the classification of these as investment projects,explaining that some CARs intentionally mask operational expendituresas investment expenditures in response to legal and institutional pressuresto limit operational expenditures.3
The CARs’ aggregate investment data suggest that, like the Ministryof Environment, Housing and Regional Development (Ministerio deAmbiente, Vivienda y Desarrollo Territorial, MAVDT), their investment
Decentralization: A Balancing Act 71

allocations reflect a bias against air pollution control, control of water-borne diseases, and reduction of vulnerability to natural disasters. Thegreatest percentage of investment funds—35 percent—appears to havebeen devoted to construction of wastewater treatment plants. In fact, thelion’s share of this investment was in just one category, “wastewaterinfrastructure,” which accounted for 30 percent of total investment.Moreover, investments in wastewater infrastructure constituted asmall number of very expensive wastewater treatment plants. In 2001,all 33 CARs funded only 11 projects in this category, but the average
72 Blackman, Morgenstern, Topping, and Sánchez-Triana
Table 4.2 Categorization of CAR Investment Projects
Flora and fauna conservation
1. Forest and ecosystem conservation
2. Protected areas
3. Green markets
Pollution
4. Air pollution control
5. Solid and hazardous waste management
6. Clean technologies
7. Industrial pollution control projects covering multiple or unspecified media, particularly
construction of municipal wastewater treatment plants
8. Wastewater infrastructure
9. Water quality control other than wastewater infrastructure
Water quantity
10. Drinking water supply
11. Water quantity, general
12. Irrigation
Other
13. Water, general or unspecified
14. Soil conservation
15. Coastal and marine resources management
16. Natural disaster prevention (including flood control)
17. Mosquito control
18. Research and information gathering
19. Environmental education
20. Operations-related general activities (including planning, legal actions, monitoring and
control, and institutional strengthening where environmental media are not specified)
21. Community and territorial entity activities (including joint activities with departments,
municipalities, nongovernmental organizations, and indigenous and Afro-Colombian
communities where nature of activity is not specific)
22. Other or undetermined activity
Source: Blackman, Morgenstern, and Topping 2004.

cost of each project was Col$9,078,200,454 (about US$4 million).Municipalities and departments already make sizable investments insanitation infrastructure. Leaving aside “wastewater infrastructure,”investments in all of the remaining categories within “industrial pollutioncontrol”—including “solid and hazardous waste management,” “cleantechnologies,” “industrial pollution control other,” and “water qualityother”—accounted for only 5 percent of total funds invested by CARs,and only 12 percent of the total number of investment projects.
Therefore, the analysis suggests that CARs devote a large percentageof their investment funds to pollution control, when in actuality themajority of these funds were spent on building a small number of veryexpensive wastewater treatment plants, and relatively few funds werespent on any other pollution projects.4 By contrast, CARs devoted fully28 percent of their investment funds to projects in the “flora and faunaconservation” meta-category, including those falling under “forest andecosystem conservation” (category 1), “protected areas” (category 2), and“green markets” (category 3).
Allocation of CAR Resources to the Most Pressing Environmental ProblemsA different question is whether individual CARs allocate their investmentfunds to their most pressing environmental problems. Factors for thisdetermination include (a) the severity of different types of environmentalrisks in the area under a CAR’s jurisdiction, and (b) the extent to whichCARs focus their investment funds on these risks. If CARs are allocatinginvestment spending in a rational manner, that is, based on an assessmentof the severity of different risks, there should be a correlation between(a) and (b). For example, CARs in which deforestation rates are relativelyhigh should be spending a relatively high percentage of their investmentfunds on flora and fauna conservation.
Unfortunately, the unavailability of appropriate data limits such ananalysis. For example, data on environmental risks that exactly match thesecategories of investment spending are not available. Instead, data on envi-ronmental risks associated with some of these categories of investmentspending must be used. Some categories of spending rely on questionableand imperfect proxies for the severity of environmental risks, such as thosefor water pollution and air pollution. The proxy used for air pollution isthe percentage of deaths from respiratory illness, but it is widely knownthat a broad range of factors unrelated to outdoor or indoor air pollutionaffect the incidence of respiratory illness, including smoking. Similarly,
Decentralization: A Balancing Act 73

wastewater treatment is not correlated with gastrointestinal illness,including basic sanitation. A second data limitation is that some of theenvironmental risk data are quite imprecise. In particular, some data werecollected at the department level and converted to the CAR level usingpopulation- or land area–based weights. Moreover, as noted, the categoriza-tion of spending is imprecise. Because of these data limitations, analysis ofwhether CAR spending is allocated rationally is inexact. Nonetheless, ananalysis can shed light on the question of whether there are gross imbal-ances in the allocation of investment spending across categories.
To compare the severity of different types of environmental risks ineach CAR with the extent to which CARs focus their investment fundson these risks, the severity of the risk posed by a certain type of environ-mental risk in each CAR can be ranked as high, medium, or low, depend-ing on whether the CAR ranks in the top, middle, or bottom third of thedistribution of the appropriate measure of environmental risk across all33 CARs. For instance, the risk to flora and fauna in each CAR is rankedas high when the deforestation rate in that CAR is in the top third of thedistribution of deforestation rates across all 33 CARs. A similar methodis used for ranking the extent to which CARs focus their investmentfunds on a certain risk. The percentage of investment funds allocated toaddressing a certain risk in each CAR is ranked as high, medium, or low,depending on whether the percentage of investment funds spent on thatrisk ranks in the top, middle, or bottom third of the distribution of thesepercentages across all 33 CARs. The purpose of choosing coarse (high,medium, low) categories of risk is to match the precision of the rankingwith the precision of the data on environmental risks.
After the severity of different types of environmental risks and the extentto which CARs focus their investment funds on these risks have beenranked, these two rankings can be compared to determine whether CARshave overinvested or underinvested in certain types of risks. A CAR is saidto have underinvested in a given type of risk when the risk is ranked as eitherhigh or medium but the CAR investment spending is ranked as low.A CARis said to have overinvested in a certain type of risk when the risk is rankedas low but the CAR investment spending is ranked as medium or high. Forexample, Corporación Autónoma Regional del Magdalena (CORPAMAG)has underinvested in flora and fauna if deforestation rates in CORPAMAGare in the top or middle third of rates for all CARs, but CORPAMAG’sspending on flora and fauna preservation is in the bottom third.
The data presented in tables 4.3A through 4.3F suggest that CARs’allocations of investment spending across different risks do not align
74 Blackman, Morgenstern, Topping, and Sánchez-Triana
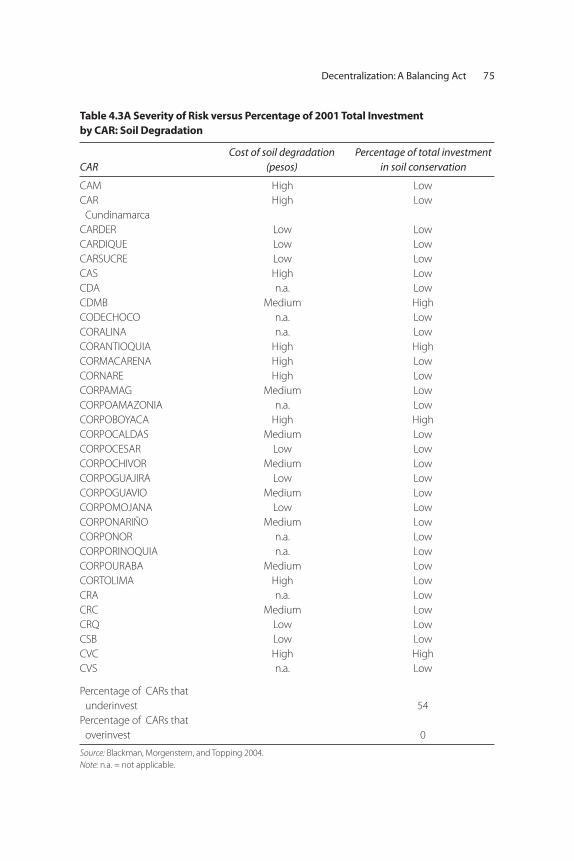
Decentralization: A Balancing Act 75
Table 4.3A Severity of Risk versus Percentage of 2001 Total Investment
by CAR: Soil Degradation
Cost of soil degradation Percentage of total investment
CAR (pesos) in soil conservation
CAM High Low
CAR High Low
Cundinamarca
CARDER Low Low
CARDIQUE Low Low
CARSUCRE Low Low
CAS High Low
CDA n.a. Low
CDMB Medium High
CODECHOCO n.a. Low
CORALINA n.a. Low
CORANTIOQUIA High High
CORMACARENA High Low
CORNARE High Low
CORPAMAG Medium Low
CORPOAMAZONIA n.a. Low
CORPOBOYACA High High
CORPOCALDAS Medium Low
CORPOCESAR Low Low
CORPOCHIVOR Medium Low
CORPOGUAJIRA Low Low
CORPOGUAVIO Medium Low
CORPOMOJANA Low Low
CORPONARIÑO Medium Low
CORPONOR n.a. Low
CORPORINOQUIA n.a. Low
CORPOURABA Medium Low
CORTOLIMA High Low
CRA n.a. Low
CRC Medium Low
CRQ Low Low
CSB Low Low
CVC High High
CVS n.a. Low
Percentage of CARs that
underinvest 54
Percentage of CARs that
overinvest 0
Source: Blackman, Morgenstern, and Topping 2004.
Note: n.a. = not applicable.

76 Blackman, Morgenstern, Topping, and Sánchez-Triana
Table 4.3B Severity of Risk versus Percentage of 2001 Total Investment
by CAR: Flora and Fauna Degradation
Annual average percentage Percentage of total investment
CAR change in forest cover, 1986–96 in flora and fauna conservation
CAM Low Medium
CAR Low Low
Cundinamarca
CARDER Low Medium
CARDIQUE High Low
CARSUCRE High Low
CAS Low Low
CDA Medium High
CDMB Low Low
CODECHOCO Medium High
CORALINA n.a. Medium
CORANTIOQUIA Low High
CORMACARENA Medium High
CORNARE Medium Low
CORPAMAG High Medium
CORPOAMAZONIA Medium Low
CORPOBOYACA Medium Low
CORPOCALDAS High High
CORPOCESAR Low Medium
CORPOCHIVOR Medium Low
CORPOGUAJIRA Medium Low
CORPOGUAVIO Low High
CORPOMOJANA High Low
CORPONARIÑO Low Medium
CORPONOR Low High
CORPORINOQUIA High Medium
CORPOURABA Medium High
CORTOLIMA High High
CRA High Medium
CRC Medium Medium
CRQ High Medium
CSB High High
CVC Low High
CVS High Medium
Percentage of CARs that
underinvest 24
Percentage of CARs that
overinvest 24
Source: Blackman, Morgenstern, and Topping 2004.
Note: n.a. = not applicable.

Decentralization: A Balancing Act 77
Table 4.3C Severity of Risk versus Percentage of 2001 Total Investment
by CAR: Natural Disaster Prevention
Average percentage of population Percentage of investment in
CAR affected by natural disasters, 1997–2003 natural disaster prevention
CAM Medium Low
CAR Low Low
Cundinamarca
CARDER Medium Low
CARDIQUE High Low
CARSUCRE High Low
CAS Low Low
CDA High Low
CDMB Low Low
CODECHOCO High Low
CORALINA Low Low
CORANTIOQUIA Low Low
CORMACARENA Medium Low
CORNARE Low Low
CORPAMAG High Low
CORPOAMAZONIA High Low
CORPOBOYACA Medium Low
CORPOCALDAS Low Low
CORPOCESAR High Low
CORPOCHIVOR Medium Low
CORPOGUAJIRA Medium Low
CORPOGUAVIO Low High
CORPOMOJANA High Low
CORPONARIÑO Medium Low
CORPONOR Low Low
CORPORINOQUIA High Low
CORPOURABA Low Low
CORTOLIMA Medium Low
CRA Low Low
CRC Medium Low
CRQ Medium Low
CSB High Low
CVC Low Low
CVS High High
Percentage of CARs that
underinvest 61
Percentage of CARs that
overinvest 3
Source: Blackman, Morgenstern, and Topping 2004.

78 Blackman, Morgenstern, Topping, and Sánchez-Triana
Table 4.3D Severity of Risk versus Percentage of 2001 Total Investment
by CAR: Water Pollution
Percentage of Percentage of
Percentage of deaths investment in water investment in water
from gastrointestinal supply and sanitation supply and sanitation
CAR disease (conservative estimate) (liberal estimate)
CAM Medium High High
CAR Medium High High
Cundinamarca
CARDER Medium Low High
CARDIQUE Medium Low Medium
CARSUCRE Medium Medium Medium
CAS High High Medium
CDA High Low Low
CDMB High High High
CODECHOCO Low High High
CORALINA High Low High
CORANTIOQUIA Medium Low Low
CORMACARENA Low High Medium
CORNARE Medium Low Low
CORPAMAG Low Medium High
CORPOAMAZONIA Low Low Low
CORPOBOYACA Low High Medium
CORPOCALDAS High Low Low
CORPOCESAR High High Medium
CORPOCHIVOR Low Low Low
CORPOGUAJIRA Low Low Low
CORPOGUAVIO High Low Medium
CORPOMOJANA Low Low Low
CORPONARIÑO Medium Low Low
CORPONOR High Low Medium
CORPORINOQUIA Medium Medium Medium
CORPOURABA Low Low Low
CORTOLIMA Medium High High
CRA High Low High
CRC Low High High
CRQ High Medium Medium
CSB High High High
CVC Medium Medium Medium
CVS Low Low Low
Percentage of CARs
that underinvest 33 15
Percentage of CARs
that overinvest 15 15
Source: Blackman, Morgenstern, and Topping 2004.

Decentralization: A Balancing Act 79
Table 4.3E Relative Severity of Risk versus Relative Intensity of 2001 Investment
by CAR: Air Pollution
Percentage of Percentage of
Percentage of investment in air investment in air
deaths from pollution management pollution management
CAR respiratory illness (conservative estimate) (liberal estimate)
CAM High Low Medium
CAR High High Medium
Cundinamarca
CARDER High Low Low
CARDIQUE Medium Low High
CARSUCRE Low Low Low
CAS Low Low Medium
CDA High Low Low
CDMB Medium High Medium
CODECHOCO Low Low Low
CORALINA Medium Low Low
CORANTIOQUIA High High High
CORMACARENA Medium Low Low
CORNARE High Low Low
CORPAMAG Medium Low Low
CORPOAMAZONIA Medium Low High
CORPOBOYACA Low High High
CORPOCALDAS Medium Low High
CORPOCESAR High Low Low
CORPOCHIVOR Low Low Low
CORPOGUAJIRA Medium Low High
CORPOGUAVIO High Low Medium
CORPOMOJANA Low Low Low
CORPONARIÑO Low Low High
CORPONOR Low Low High
CORPORINOQUIA High Low High
CORPOURABA Low Low Low
CORTOLIMA Medium Low Low
CRA Medium Low Low
CRC Medium Low Low
CRQ High Low Low
CSB Low Low High
CVC High High High
CVS Low Low Low
Percentage of CARs
that underinvest 55 33
Percentage of CARs
that overinvest 3 15
Source: Blackman, Morgenstern, and Topping 2004.

80 Blackman, Morgenstern, Topping, and Sánchez-Triana
Table 4.3F Relative Severity of Risk versus Relative Intensity of 2001 Investment
by CAR: Solid Waste
Percentage of total Percentage of total
Percentage of solid investment in solid investment in solid
waste disposed waste management waste management
CAR of legally (conservative estimate) (liberal estimate)
CAM Medium High High
CAR Low High Medium
Cundinamarca
CARDER High Low Low
CARDIQUE Low High High
CARSUCRE High Low Low
CAS Medium Low Medium
CDA Low Low Low
CDMB High High Medium
CODECHOCO Low Low Low
CORALINA Low Low Low
CORANTIOQUIA Medium Low Medium
CORMACARENA Medium Low Low
CORNARE Medium Low Low
CORPAMAG High Low Low
CORPOAMAZONIA Low Low Medium
CORPOBOYACA Medium High High
CORPOCALDAS High Low High
CORPOCESAR High Low Low
CORPOCHIVOR Low High High
CORPOGUAJIRA Medium Low High
CORPOGUAVIO Low Low Medium
CORPOMOJANA Low Low Low
CORPONARIÑO High Low Medium
CORPONOR High Low High
CORPORINOQUIA High Low High
CORPOURABA Low Low Low
CORTOLIMA Medium Low Low
CRA Low High High
CRC High Low Low
CRQ Medium High High
CSB Low High High
CVC Low High Medium
CVS Low Low Low
Percentage of CARs
that underinvest 45 24
Percentage of CARs
that overinvest 18 24
Source: Blackman, Morgenstern, and Topping 2004.

particularly well with the severity of these risks. For all but one type ofrisk—flora and fauna loss—CARs underinvested in the risk far more thanthey overinvested. For soil degradation, 54 percent of CARs underinvestedin this risk, while no CARs overinvested. For natural disasters, 61 percentof CARs underinvested, while only 3 percent overinvested. For waterpollution, up to 33 percent of CARs underinvested (depending on whatmeasure of spending is used) while up to 15 percent overinvested. Forair pollution, 33 to 55 percent of CARs underinvested. Finally, for solidwaste management, 24 to 45 percent of CARs underinvested while 18to 24 percent seem to be overinvesting.
Allocation of CAR Investment Spending to Priorities Established in Three-Year Action Plans Law 99 places considerable emphasis on planning. CARs are required todraft a 10-year Regional Environmental Management Plan (Plan deGestión Ambiental Regional, PGAR), a Three-Year Action Plan (Plan deAcción Trienal, PAT), and Annual Investment Operating Plans (PlanesOperativos de Inversíon Anual, POIAs). All of these plans are requiredto align with the National Development Plans drafted by every newlyelected president of Colombia. Presumably, then, to the extent the var-ious plans establish priorities for investment, the planning process pro-vides a possible mechanism for priority setting. Obviously, however, anecessary condition for planning to serve this end is that CARs mustactually comply with their plans. By comparing investment plans andactual investment spending for four case-study CARs (CARCundinamarca, CORANTIOQUIA, CRA, and CARDIQUE), conclu-sions can be drawn about how effectively CARs comply with their plans.The results of the analysis are presented in tables 4.4A through 4.4D.
As illustrated in table 4.4A, CAR Cundinamarca’s planned investmentspending did not align well with actual investment. Even though actualinvestment spending (Col$93,184 million,US$43 million) exceeded plannedspending (Col$70,543 million, US$32 million) by over Col$20 billion,CAR Cundinamarca does not appear to have invested in a good number of theprojects listed in its PAT for 2001, and, conversely, it appears to have invested ina good number of projects that were not listed in its 2001 PAT. For example,in the “Industrial pollution” meta-category, CAR Cundinamarca did not investin a Col$31 billion (US$14 million) water quality project that was listed inits PAT, and it did invest in a Col$70 billion (US$32 million) wastewaterinfrastructure project, and several other urban pollution control projects, that
Decentralization: A Balancing Act 81

were not listed in its PAT. In the “Water quantity” meta-category, CARCundinamarca invested only approximately one-sixth of the total amountlisted in its PAT. Finally, in the “Other” meta-category, although CAR investedaround Col$4 million less than the planned amount, the distribution ofprojects within this meta-category did not match planned spending.
82 Blackman, Morgenstern, Topping, and Sánchez-Triana
Table 4.4A Investment Spending: Planned (PAT) versus Actual for
CAR Cundinamarca, 2001
Spending Number of
(thousand pesos) Spending (%) projects
Category PAT Actual PAT Actual PAT Actual
Flora and fauna (sums 1–3) 1,369,000 5,035,000 2 5 1 6
1. Forest and ecosystem
management 0 1,133,000 0 1 0 2
2. Protected areas 1,369,000 3,902,000 2 4 1 4
3. Green markets 0 0 0 0 0 0
Industrial pollution (sums 4–9) 30,671,000 70,907,000 43 76 1 5
4. Air pollution control 0 410,000 0 0 0 1
5. Solid and hazardous waste
management 0 600,000 0 1 0 1
6. Clean technologies 0 99,000 0 0 0 1
7. Industrial pollution other,
general 0 0 0 0 0 0
8. Wastewater infrastructure 0 69,798,000 0 75 0 2
9. Water quality other 30,671,000 0 43 0 1 0
Water quantity (sums 10–12) 20,500,000 3,226,000 29 3 4 4
10. Drinking water supply 0 0 0 0 0 0
11. Water quantity 20,500,000 1,526,000 29 2 4 3
12. Irrigation 0 1,700,000 0 2 0 1
Other (sums 13–22) 17,994,088 14,016,000 26 15 8 21
13. Water other, general 0 6,030,000 0 6 0 3
14. Soil conservation 2,656,000 0 4 0 1 0
15. Coastal and marine
management 0 0 0 0 0 0
16. Natural disaster prevention 0 0 0 0 0 0
17. Mosquito control 0 0 0 0 0 0
18. Research information 88 3,734,000 0 4 0 6
19. Environmental education 978,000 964,000 1 1 1 3
20. Operations-related general
activities 7,878,000 3,088,000 11 3 2 8
21. Joint community and
territorial entity activities 6,482,000 200,000 9 0 4 1
22. Other or undetermined 0 0 0 0 0 0
Total 70,534,088 93,184,000 100 100 14 36
Source: Blackman, Morgenstern, and Topping 2004.
Note: US$1 = Col$2,150.

Compared to CAR Cundinamarca, CORANTIOQUIA’s plannedinvestment spending matches its actual spending fairly well (see table4.4B). Nevertheless, some significant discrepancies exist between actualand planned spending. Actual total investment spending (Col$33.0 billion,US$15.7 million) fell 18 percent below planned total spending
Decentralization: A Balancing Act 83
Table 4.4B Investment Spending: Planned (PAT) versus Actual
for CORANTIOQUIA, 2001
Spending Number of
(thousand pesos) Spending (%) projects
Category PAT Actual PAT Actual PAT Actual
Flora and fauna (sums 1–3) 14,307,000 10,637,600 35 32 5 10
1. Forest and ecosystem
management 11,217,000 7,457,600 28 22 4 8
2. Protected areas 3,090,000 3,090,000 8 9 1 1
3. Green markets 0 90,000 0 0 0 1
Industrial pollution (sums 4–9) 844,000 3,134,902 2 9 1 4
4. Air pollution control 0 1,939,902 0 6 0 1
5. Solid and hazardous
waste management 0 0 0 0 0 0
6. Clean technologies 0 0 0 0 0 0
7. Industrial pollution other,
general 844,000 1,195,000 2 4 1 3
8. Wastewater infrastructure 0 0 0 0 0 0
9. Water quality other 0 0 0 0 0 0
Water quantity (sums 10–12) 6,820,000 257,260 17 1 1 1
10. Drinking water supply 0 0 0 0 0 0
11. Water quantity 6,820,000 257,260 17 1 1 1
12. Irrigation 0 0 0 0 0 0
Other (sums 13–22) 18,389,000 19,219,238 46 58 14 22
13. Water other, general 0 820,000 0 2 0 1
14. Soil conservation 1,360,000 1,060,000 3 3 1 1
15. Coastal and marine
management 0 0 0 0 0 0
16. Natural disaster prevention 0 0 0 0 0 0
17. Mosquito control 0 0 0 0 0 0
18. Research information 4,520,000 4,145,806 11 12 4 10
19. Environmental education 2,260,000 810,000 6 2 1 2
20. Operations-related
general activities 1,219,000 8,533,432 3 26 4 3
21. Joint community and
territorial entity activities 9,030,000 730,000 22 2 4 3
22. Other or undetermined 0 3,120,000 0 9 0 2
Total 40,360,000 33,249,000 100 100 21 37
Source: Blackman, Morgenstern, and Topping 2004.
Note: US$1 = Col$2,150.

(Col$40 billion, US$19 million). In the “Flora and fauna” meta-category,CORANTIOQUIA spent almost Col$4.0 billion (US$1.9 million) lessthan planned on “Forest and ecosystem management” and approximatelyCol$90.0 million (US$0.04 million) more than planned on “Green markets.”In the “Industrial pollution” meta-category, CORANTIOQUIA evidently
84 Blackman, Morgenstern, Topping, and Sánchez-Triana
Table 4.4C Investment Spending: Planned (PAT) versus Actual for CRA, 2001
Spending Number of
(thousand pesos) Spending (%) projects
Category PAT Actual PAT Actual PAT Actual
Flora and fauna (sums 1–3) 1,159,867 2,162,856 17 28 2 3
1. Forest and ecosystem
management 1,159,867 2,162,856 17 28 2 3
2. Protected areas 0 0 0 0 0 0
3. Green markets 0 0 0 0 0 0
Industrial pollution (sums 4–9) 900,000 900,000 13 12 1 1
4. Air pollution control 0 0 0 0 0 0
5. Solid and hazardous waste
management 0 900,000 0 12 0 1
6. Clean technologies 0 0 0 0 0 0
7. Industrial pollution other,
general 900,000 0 13 0 1 0
8. Wastewater infrastructure 0 0 0 0 0 0
9. Water quality other 0 0 0 0 0 0
Water quantity (sums 10–12) 0 0 0 0 0 0
10. Drinking water supply 0 0 0 0 0 0
11. Water quantity 0 0 0 0 0 0
12. Irrigation 0 0 0 0 0 0
Other (sums 13–22) 4,636,144 4,636,144 69 60 4 6
13. Water other, general 2,574,000 2,574,000 38 33 1 2
14. Soil conservation 0 0 0 0 0 0
15. Coastal and marine
management 790,000 790,000 12 10 1 1
16. Natural disaster prevention 0 0 0 0 0 0
17. Mosquito control 0 0 0 0 0 0
18. Research information 272,144 0 4 0 1 0
19. Environmental education 0 272,144 0 4 0 1
20. Operations-related
general activities 1,000,000 900,000 15 12 1 1
21. Joint community and
territorial entity activities 0 100,000 0 1 0 1
22. Other or undetermined 0 0 0 0 0 0
Total 6,696,011 7,699,000 100 100 7 10
Source: Blackman, Morgenstern, and Topping 2004.
Note: US$1 = Col$2,150.

spent approximately Col$2 billion (US$1 million) more than planned inthis area. In the “Water quantity” meta-category, CORANTIOQUIA spent4 percent of the amount planned on a water quantity project. Finally, in the“Other” category, CORANTIOQUIA spent approximately the plannedamounts in each subcategory.
Decentralization: A Balancing Act 85
Table 4.4D Investment Spending: Planned (PAT) versus Actual for CARDIQUE, 2001
Spending Number of
(thousand pesos) Spending (%) projects
Category PAT Actual PAT Actual PAT Actual
Flora and fauna (sums 1–3) 761,877 761,876 13 13 4 3
1. Forest and ecosystem
management 650,000 761,876 11 13 3 3
2. Protected areas 0 0 0 0 0 0
3. Green markets 111,877 0 2 0 1 0
Industrial pollution (sums 4–9) 293,000 743,000 5 13 1 3
4. Air pollution control 0 0 0 0 0 0
5. Solid and hazardous waste
management 293,000 293,000 5 5 1 1
6. Clean technologies 0 0 0 0 0 0
7. Industrial pollution other,
general 0 450,000 0 8 0 2
8. Wastewater infrastructure 0 0 0 0 0 0
9. Water quality other 0 0 0 0 0 0
Water quantity (sums 10–12) 900,000 900,000 16 16 3 3
10. Drinking water supply 0 0 0 0 0 0
11. Water quantity 900,000 900,000 16 16 3 3
12. Irrigation 0 0 0 0 0 0
Other (sums 13–22) 3,700,000 3,250,000 65 57 15 13
13. Water other, general 550,000 550,000 10 10 2 2
14. Soil conservation 0 0 0 0 0 0
15. Coastal and marine
management 950,000 950,000 17 17 3 3
16. Natural disaster prevention 0 0 0 0 0 0
17. Mosquito control 0 0 0 0 0 0
18. Research information 600,000 300,000 11 5 2 1
19. Environmental education 200,000 200,000 4 4 1 1
20. Operations-related
general activities 600,000 600,000 11 11 2 2
21. Joint community and
territorial entity activities 550,000 400,000 10 7 4 3
22. Other or undetermined 250,000 250,000 4 4 1 1
Total 5,654,877 5,654,876 100 100 23 22
Source: Blackman, Morgenstern, and Topping 2004.
Note: US$1 = Col$2,150.

CRA’s planned investment spending matches its actual spending quitewell.Actual total investment spending (Col$7.7 billion, US$3.58 million)exceeded planned total spending (Col$6.7 billion, US$3.12 million) byCol$1 billion (US$470,000).The Col$1 billion discrepancy appears to beattributable to the fact that CRA spent Col$2.2 billion (US$1.1 million)on “Forest and ecosystem management” instead of the Col$1.2 billion(US$560,000) planned. Otherwise, actual spending more or less alignswith planned spending.
Finally, CARDIQUE’s actual investment spending also matches its plannedspending quite well. Actual total investment spending (Col$5.7 billion,US$2.71 million) and planned total investment spending (Col$5.7 billion,US$2.71 million) match almost exactly. The only significant discrepanciesbetween planned and actual spending arise from the fact that CARDIQUEappears to have cancelled a planned Col$112 million (US$52,000) projectin the “Green markets” category and to have developed an unplannedCol$450 million (US$209,000) industrial pollution project.
In sum, actual investment spending aligns well with planned investmentspending for two of the four case study CARs—CRA and CARDIQUE.The match between planned and actual spending is poorer for CORAN-TIOQUIA, and poorer still for Cundinamarca CAR. Conclusive evidenceon the extent to which CARs abide by the plans laid out in their PATswould require additional analysis of planned and actual investmentspending by several more CARs over several more years, and wouldrequire an effort to track spending on a project-by-project basis, insteadof a category-by-category basis. Nevertheless, the limited evidence suggeststhat for some CARs, there may be a significant gap between their PATsand their actual investment spending.
Sources of CARs’ Financial Resources
As the frontline environmental management institutions in Colombia,CARs generate and use the majority of the SINA’s financial resources.Nationwide, during 1995 to 2002, 71 percent of total SINA funding foroperations and 86 percent of total SINA funding for investment wasallocated to CARs. Fully 78 percent of the funding for operations and86 percent of the funding for investment is generated by CARs on thebasis of the mandates established by Law 99 of 1993 (Gómez Torres 2003).
Distribution of Financial Resources among CARs, 2003Table 4.5 displays the financial resources available to CARs in 2003.Separate entries indicate the funds available from national contributions
86 Blackman, Morgenstern, Topping, and Sánchez-Triana

87
Table 4.5 CAR Resources, 2003
million pesos
Operations Investment Debt Total
Percentage
Self- Self- Self- of resources Self-
National generated National generated generated expended on National generated Total
CAR contribution revenue Total contribution revenue Total revenue operations contribution revenue resources
CAM 1,180 1,394 2,574 0 5,152 5,152 0 33.3 1,180 6,545 7,725
CAR
Cundinamarca 0 28,312 28,312 0 46,124 46,124 7,487 34.6 0 81,924 81,924
CARDER 1,262 2,772 4,033 11 6,499 6,510 151 37.7 1,273 9,421 10,694
CARDIQUE 1,160 836 1,996 0 6,692 6,692 0 23.0 1,160 7,528 8,688
CARSUCRE 1,201 354 1,555 597 203 800 0 66.0 1,798 557 2,355
CAS 1,131 1,538 2,668 150 4,175 4,325 0 38.2 1,281 5,713 6,994
CDA 1,423 128 1,551 983 86 1,069 0 59.2 2,407 214 2,620
CDMB 0 5,738 5,738 0 43,334 43,334 1,021 11.5 0 50,093 50,093
CODECHOCO 924 1,809 2,733 367 628 996 0 73.3 1,292 2,437 3,729
CORALINA 1,301 48 1,350 434 1,401 1,835 0 42.4 1,736 1,449 3,185
CORANTIOQUIA 1,168 3,968 5,136 0 41,330 41,330 0 11.1 1,168 45,299 46,467
CORMACARENA 1,195 191 1,386 1,157 573 1,730 0 44.5 2,352 764 3,116
CORNARE 0 4,358 4,358 0 16,479 16,479 1,121 19.8 0 21,958 21,958
CORPAMAG 1,954 913 2,866 713 1,929 2,642 0 52.0 2,666 2,842 5,508
CORPOAMAZONIA 1,254 1,319 2,573 711 5,020 5,731 0 31.0 1,965 6,339 8,304
CORPOBOYACA 1,038 1,198 2,235 0 5,303 5,303 0 29.7 1,038 6,501 7,538
CORPOCALDAS 1,706 1,143 2,850 6 9,418 9,424 0 23.2 1,712 10,562 12,274
CORPOCESAR 1,531 541 2,071 0 1,027 1,027 0 66.8 1,531 1,568 3,099
CORPOCHIVOR 1,139 1,164 2,303 0 3,149 3,149 377 39.5 1,139 4,690 5,829
(continued)

88 Table 4.5 CAR Resources, 2003 (continued)
million pesos
Operations Investment Debt Total
Percentage
Self- Self- Self- of resources Self-
National generated National generated generated expended on National generated Total
CAR contribution revenue Total contribution revenue Total revenue operations contribution revenue resources
CAM 1,180 1,394 2,574 0 5,152 5,152 0 33.3 1,180 6,545 7,725
CORPOGUAJIRA 0 3,530 3,530 0 27,775 27,775 0 11.3 0 31,305 31,305
CORPOGUAVIO 0 3,064 3,064 0 4,975 4,975 0 38.1 0 8,038 8,038
CORPOMOJANA 1,277 23 1,300 664 100 764 0 63.0 1,941 123 2,064
CORPONARIÑO 959 1,817 2,777 614 2,077 2,691 0 50.8 1,573 3,894 5,468
CORPONOR 1,326 1,493 2,819 0 4,948 4,948 0 36.3 1,326 6,441 7,768
CORPORINOQUIA 1,082 2,278 3,360 200 4,265 4,465 0 42.9 1,282 6,543 7,824
CORPOURABA 1,999 436 2,435 740 2,613 3,353 0 42.1 2,739 3,049 5,788
CORTOLIMA 1,023 2,264 3,287 41 11,302 11,344 126 22.3 1,064 13,693 14,758
CRA 927 1,408 2,334 0 10,795 10,795 595 17.0 927 12,798 13,725
CRC 2,764 4,125 6,889 0 14,324 14,324 0 32.5 2,764 18,448 21,212
CRQ 2,516 970 3,486 316 4,431 4,747 0 42.3 2,831 5,401 8,232
CSB 1,347 140 1,486 1,040 191 1,231 0 54.7 2,387 331 2,717
CVC 0 28,484 28,484 0 107,265 107,265 0 21.0 0 135,749 135,749
CVS 104 2,771 2,875 0 12,537 12,537 1,089 17.4 104 16,397 16,501
Total 35,890 110,524 146,414 8,743 406,122 414,865 11,968 25.5 44,634 528,614 573,248
Source: Blackman, Morgenstern, and Topping 2004.
Note: US$1 = Col$2,150.
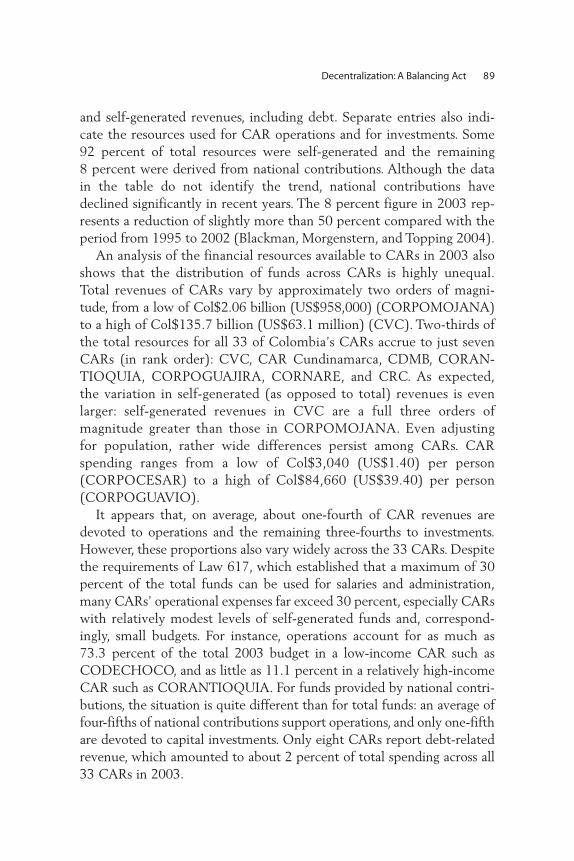
and self-generated revenues, including debt. Separate entries also indi-cate the resources used for CAR operations and for investments. Some92 percent of total resources were self-generated and the remaining 8 percent were derived from national contributions. Although the datain the table do not identify the trend, national contributions havedeclined significantly in recent years. The 8 percent figure in 2003 rep-resents a reduction of slightly more than 50 percent compared with theperiod from 1995 to 2002 (Blackman, Morgenstern, and Topping 2004).
An analysis of the financial resources available to CARs in 2003 alsoshows that the distribution of funds across CARs is highly unequal.Total revenues of CARs vary by approximately two orders of magni-tude, from a low of Col$2.06 billion (US$958,000) (CORPOMOJANA)to a high of Col$135.7 billion (US$63.1 million) (CVC). Two-thirds ofthe total resources for all 33 of Colombia’s CARs accrue to just sevenCARs (in rank order): CVC, CAR Cundinamarca, CDMB, CORAN-TIOQUIA, CORPOGUAJIRA, CORNARE, and CRC. As expected,the variation in self-generated (as opposed to total) revenues is evenlarger: self-generated revenues in CVC are a full three orders ofmagnitude greater than those in CORPOMOJANA. Even adjustingfor population, rather wide differences persist among CARs. CARspending ranges from a low of Col$3,040 (US$1.40) per person(CORPOCESAR) to a high of Col$84,660 (US$39.40) per person(CORPOGUAVIO).
It appears that, on average, about one-fourth of CAR revenues aredevoted to operations and the remaining three-fourths to investments.However, these proportions also vary widely across the 33 CARs. Despitethe requirements of Law 617, which established that a maximum of 30percent of the total funds can be used for salaries and administration,many CARs’ operational expenses far exceed 30 percent, especially CARswith relatively modest levels of self-generated funds and, correspond-ingly, small budgets. For instance, operations account for as much as73.3 percent of the total 2003 budget in a low-income CAR such asCODECHOCO, and as little as 11.1 percent in a relatively high-incomeCAR such as CORANTIOQUIA. For funds provided by national contri-butions, the situation is quite different than for total funds: an average offour-fifths of national contributions support operations, and only one-fifthare devoted to capital investments. Only eight CARs report debt-relatedrevenue, which amounted to about 2 percent of total spending across all33 CARs in 2003.
Decentralization: A Balancing Act 89

90 Blackman, Morgenstern, Topping, and Sánchez-Triana
Sources of Self-Generated Revenues by CARsSelf-generated CAR revenues consist of 12 different categories of taxes,fees, and other types of revenue that are mandated by Law 99. For example,Law 99 stipulates that 15 to 26 percent of municipal property taxes areto be used to fund CARs’ environmental management activities. Law 99also requires that electricity generators must pay a gross revenues tax(transferencia) to CARs based on their power sales.5 Other sources ofrevenue mentioned in Law 99 include monies from the National RoyaltyFund, fines, a percentage of damages awarded by courts in acciónes populares,a percentage of fines imposed by territorial authorities for violations ofenvironmental laws, appropriations from the national budgets, fees,licenses, permits, authorizations, and concessions.
The largest source of self-generated revenues is capital. However,60 percent of those revenues accrue to a single CAR, CVC.The next largestrecipients are CRC and CORANTIOQUIA, with 9.4 and 8.7 percent,respectively. Five CARs report negligible or no revenues from capital.Following revenues generated from capital, property taxes represent the nextlargest source category. These are somewhat more evenly distributed thancapital revenues, although even here a single entity, CAR Cundinamarca,accounts for 42.1 percent of total property tax revenues. Other importantsources of self-generated revenues are contributions, electricity taxes, andrevenues from the sale of goods and services.Water fees are a relatively smallsource of revenues, although as in the case of property taxes, a very largeproportion of total revenues are accounted for by CAR Cundinamarca, inthis case 76.9 percent. Other small revenue sources include redistributionfees, contractor revenues, penalties, forest fees, and licensing fees.
Changes in Financial Resources, 2002–03An additional perspective on CARs’ finances may be gleaned by exam-ining year-to-year changes in revenues. Such a perspective enables oneto gauge a number of issues, for example, whether the growth in self-generated or national contributions is more focused on rich or poorCARs. In considering the changes over the most recent two-year period(2002–03), total CAR spending for 2003 rose by 14.5 percent over2002 levels. However, the major revenue components displayed quitedifferent patterns. For example, national contributions declined by 1.3percent while self-generated revenues rose by 16 percent.
Total spending on operations declined in 2003 by 8.3 percent whileinvestment spending increased by 26.8 percent. National contributionsfor operations increased by a negligible amount, while national contributionsfor investments declined by 8.4 percent. The opposite pattern applies to

self-generated revenues, which declined by 10.9 percent for operationswhile increasing 27.8 percent for investments. Self-generated funds fromdebt declined by 13.7 percent.
What are the possible causes of these year-to-year budget changes? Ofparticular interest is whether the CARs with larger budgets are growingmore rapidly compared with the ones with smaller budgets.The findings onyear-to-year changes over 2002–03 reflect some reallocation of revenues forboth investment and operations. In general, these results can be interpretedas demonstrating a more activist reallocation of funds.While there is a small“Robin Hood” effect involving the reallocation of investment funds fromCARs with high spending levels the previous year to those with lowerspending levels, this does not extend to national contributions for opera-tions.6 Here it can be argued that richer CARs (richer based on expendituresper CAR inhabitant and per hectare) fared better in 2003 than in 2002.
Adequacy of Human and Technical Resources
This section addresses a number of issues relevant to the adequacy ofhuman and technical resources of the CARs. Some basic data on thenumbers of direct employees and contractors for each CAR are presented.Possible explanations for the large observed differences in CAR-widehiring patterns are discussed. Finally, available information on computersand other technical resources available across the CARs is presented.
Human Resources Environmental management capacity varies markedly across CARs.Shortages of human resources are partly to blame. Several studies on theinstitutions found a general scarcity of highly qualified human resources inCARs with poor governance (Booz Allen Hamilton 1997b) and a directrelationship between overall efficiency of CARs and their staff members’levels of professionalism (Vargas 2003). A key issue is the staffing patternsin CARs, including the use of contractors. Filling staff needs with contrac-tors as opposed to permanent employees is common, as is high turnoveramong staff members (and contractors), and what is generally described asfavoritism in hiring both staff and contractors. The inadequate technicalqualifications of employees and contractors is also a concern (Blackman,Morgenstern, and Topping 2004).
The average staff size across all CARs was 112.6 in 2002. Not surpri-singly, there are large differences in staff size across the CARs. Some CARsoperated with quite small staffs in 2002:26 in CRA;27 in CORPOGUAVIO;and 31 each in CARDIQUE, CORALINA, and CORPOBOYACA.
Decentralization: A Balancing Act 91

Others have much larger staffs: 817 in CAR Cundinamarca; 331 inCORANTIOQUIA; and 262 in CRC. The number of contractors alsovaried considerably across the various CARs in 2002. While the averageCAR engaged 66.9 contractors, some had as few as 7 (CORPOMOJANA,CORPONOR). At the high end, CDMB had a total of 301 contractors in2002. On average, contractors make up 37.3 percent of total staff, rangingfrom a low of 2.7 percent (CAR) to a high of 83.3 percent (CRA). On theratio of inhabitants in each CAR to the number of employees and contrac-tors, the extremes across CARs are slightly higher than the extremes intotal employees. In the case of contractors, the variation on a per capitabasis is many times greater than the variation in total employees.
Education levels also seem to vary considerably across CARs, withsome employing a high proportion of college-educated people, and othersrelying disproportionately on those with only a high school education.An average of 60.7 percent of the CAR staff members and 63.5 percentof contractors in 2002 completed four years of college (or more). Six ofthe CARs report that 100 percent of their staff members held at least acollege degree, while six others reported that less than 50 percent oftheir staff members had that status. In the case of contractors, 13 CARsreported that 100 percent held at least a college degree, while 9 othersreported that less than 50 percent had such a degree.
A first order question is how the numbers of staff members and con-tractors vary with the operating and investment budgets available to theCARs. Because a high proportion of total budgets are paid out in theform of staffing costs, it would be surprising if there was not a clear con-nection between staff size and both operating and investment budgets.For contractors, the situation is less clear, because contractors often carryout daily tasks that typically should be assigned to staff members, suchas making periodic inspections of permitted facilities to monitor compli-ance or completing those tasks focused primarily on investment projects.
To understand differences in employment and contractor levels acrossCARs, it may be argued that causality runs from budgets to staff (andcontractor) size when holding constant GDP and other income anddemographic variables. For permanent employees, operational spendingenters the equation with a positive and highly significant coefficient,indicating that the number of employees is highly dependent on the sizeof CARs’ operational budgets. However, the coefficient on investmentspending is not statistically different from zero, suggesting that suchspending is not a key factor in determining employment across CARs.Also of interest is a strong likelihood that older, more established CARs
92 Blackman, Morgenstern, Topping, and Sánchez-Triana

have relatively higher staffing levels. Overall, a high percentage of thevariation in staff size is largely explained by the operating budget.
According to analysis by Blackman, Morgenstern, and Topping (2004)for contractors, neither the operations nor the investment budgets arestatistically significant, although CARs with smaller operating budgetsmay tend to hire more contractors while CARs with large investmentbudgets may tend to hire fewer contractors.
Technical ResourcesTechnical weaknesses in the CARs have been cited as one of the leadingproblems inhibiting environmental investment projects (González,Barona, and Galindo Caballero 2002). However, the term technicalresources as applied to the operations of CARs is not very precise. Ofcourse, technical capacity shortages are not surprising given the highlyunequal distribution of financial resources across CARs, and technicaland administrative capacity varies significantly across CARs. Some CARsare excellent; others are minimally functional. One approach to analysisof CARs’ efficiency would be to compare the number of computers andcomputers per employee available in the CARs in 2002. Although theaverage is about 104 computers per CAR, the variation is considerable.On the high end, CAR Cundinamarca reports a total of 358 computers.On the low end, CARSUCRE reports a total of 16 computers, roughly5 percent the number in CAR Cundinamarca. Computers per employeealso vary considerably. Although the average is 0.9 computers peremployee, on the high end CORPOCALDAS reports 3.33 computers peremployee while CORPOGUAVIO reports 2.96 and CRA reports 2.62.On the low end, CVS reports 0.32 computers per employee and CAR-SUCRE reports 0.39 per employee, a full order of magnitude lower thanCORPOCALDAS. Even though some CARs may provide computers forcontractors or other relevant groups, it is nonetheless difficult to explainwhy the number of computers in some CARs exceeds the number ofemployees by such a wide margin. It is likely that the overall availabilityand use of computers in CARs are closely related to the social conditionsin the jurisdiction (Blackman, Morgenstern, and Topping 2004).
Sanitation Infrastructure
The original mission of CARs was to promote integrated regional devel-opment by, among other things, building sanitation infrastructure includingwastewater treatment, drinking water, and irrigation facilities. Although
Decentralization: A Balancing Act 93

Law 99 redefines CARs as regional environmental regulatory authoritiesand assigns primary responsibility for sanitation infrastructure to munici-palities, it also mandates that CARs retain certain responsibilities for devel-oping infrastructure, a dictate that clearly has the potential to createconflicts of interest. In particular, in cases where CARs finance, plan, own,or operate sanitation infrastructure, their incentives to strictly enforceenvironmental regulations governing this infrastructure are compromised.
MAVDT data on CARs’ investments in sanitation infrastructure indicatethat CARs collectively devoted 30 percent of all money spent on invest-ment to wastewater treatment plants, a higher percentage than in any ofthe other categories (or meta-categories) of investment. Superficially,this statistic suggests that sanitation infrastructure is a major focus ofCAR investment. However, further examination of the CARs-level dataindicates that this investment comprised a relatively small number ofvery expensive treatment plants. In 2001, all 33 CARs funded 11 plants,with an average cost of Col$9,078,200,454 (about US$4 million).
Several political, economic, and legal factors are driving CARs’ con-tinued investments in sanitation infrastructure. Perhaps most important,the government has explicitly mandated such investments. The 2002–06National Development Plan directs CARs to help finance sanitationinfrastructure using their self-generated revenue. According to the pres-ident of ASOCAR, the national association of regional environmentalauthorities, CARs oppose this provision of the National DevelopmentPlan on the grounds that it creates conflicts of interest. A closely relatedfactor is that, given the sources of revenues assigned to CARs by Law 99,some CARs have significant fiscal resources. Thus, in the view of somepolicy makers, given the current fiscal policy, CARs are the logical insti-tutions to finance municipal sanitation infrastructure. Presumably, thisview informed the provision of the current National Development Plancited earlier (Blackman, Morgenstern, and Topping 2004).
Local political considerations evidently provide significant incentivesfor CARs to develop sanitation infrastructure. Large municipalities typicallyprovide the bulk of CARs’ self-generated revenues through propertytaxes and also wield considerable influence over CARs’ decision making.It is felt that CARs focus on municipal sanitation infrastructure as ameans of funneling investment funds to these large municipalities(Blackman, Morgenstern, and Topping 2004).
According to Blackman, Morgenstern, and Topping (2004), to theextent that CARs’ infrastructure investments contribute to conflicts ofinterest, a number of strategies have been proposed to mitigate them. One
94 Blackman, Morgenstern, Topping, and Sánchez-Triana

option is to restrict CARs’ role in developing sanitation infrastructure toplanning and financing, that is, to prohibit CARs from owning or operat-ing such infrastructure. Presumably, given this limited role, CARs’ incen-tives for strict enforcement of environmental regulations would not becompromised, or at least not to the degree they would be if CARs playeda more important role. This strategy is problematic, however. Althoughmost CARs prefer to restrict their roles to planning and financing waste-water treatment plants, a number of practical considerations tend to pushthem into owning and operating them. Specifically, in many cases, CARsfinance or build (or both) such plants with the intention of turning overresponsibility for the plants to municipalities. However, municipalities arereluctant to assume this responsibility because the plants are not prof-itable—user fees are not sufficient to cover expenses or the plants are notadequate to meet environmental guidelines and, therefore, leave theowner liable for fines and retributive fees. One example is wastewatertreatment plants on the Bogotá River built by CAR under a loan financedby the Inter-American Development Bank. Municipalities have refused toassume ownership of these plants. A potential solution to the problem isfor CARs to require municipalities to demonstrate a clear commitmentto ownership before undertaking any infrastructure investments.CORANTIOQUIA, for example, requires municipalities to provide50 percent cofinancing before it finances infrastructure.
A second option to mitigate potential conflicts of interest inherent indeveloping infrastructure is to simply prohibit CARs from playing anyrole in infrastructure development. Given the fiscal realities describedabove, this does not seem a realistic strategy.Were this option to be pursued,CARs could be stripped of responsibility for infrastructure developmentand of a portion of the property tax revenue now used for this purpose(Blackman, Morgenstern, and Topping 2004).
A third option is for CARs to create separate internal divisions forbuilding infrastructure and for regulating that infrastructure. However,many CARs already have separate divisions for investment and regulatoryoversight, and as long as conflicts of interest exist, this institutional structuremay continue to be ineffective at mitigating them (Blackman, Morgenstern,and Topping 2004).
Relationships between CARs and Other SINA Entities
This section highlights some of the strengths and shortcomings of decen-tralized environmental management in Colombia.
Decentralization: A Balancing Act 95

96 Blackman, Morgenstern, Topping, and Sánchez-Triana
National-Regional CoordinationThe decentralized design of Law 99 creates tension between theMAVDT and CARs, because the law gave CARs a great deal of admin-istrative and fiscal autonomy. It also gave the Ministry of Environmentthe role of leading SINA, overseeing and coordinating the activities ofCARs. However, evidence suggests that national-regional coordinationhas been less than optimal. An evaluation of the SINA presents whatmay be the most frank critical assessment of this relationship:
Currently, each component of the system conceived in Law 99 of 1993 isworking in an independent and divergent manner—each executes its ownAction Plan based on its subjective interpretation of the NationalEnvironmental Plan, adapting it according to its own regional needs . . . Theproblem arises principally from the absence of leadership on the part ofthe central axis of the system, in particular, a failure to coordinate actions,assign work, process information, and evaluate results in accordance withnational intentions . . . [this failure] results in duplication of efforts and anincrease in operational costs (4) . . . with the lack of a system leader, [eachCAR] interprets its function as an individual entity, and not . . . as part ofthe system (5) . . . Management of relations between MMA and CARs, ter-ritorial entities, research institutes and urban environmental authorities aredispersed. This dispersion generates, on the one hand, inconsistency indecisions on environmental matters, and, on the other hand, ambiguousand contradictory administrative action, and what’s worse, the absence ofa unique sectoral policy (Booz Allen Hamilton 1997b).
In general, MAVDT is not able to exert sufficient control over the planningand functioning of CARs. In some cases, the general directors of certainCARs are extremely powerful, perhaps too powerful relative to theother players in the environmental management system. Many CARshave strong links to the Congress, which in turn can exert influence onthe MAVDT.
Several fundamental arguments can be made for continued decentral-ized environmental administration—presumably the same arguments thatmotivated the decentralization embodied in the 1991 Constitution and inLaw 99. They are: (a) autonomy enables CARs to operate independentlyof local political pressures at the municipality and department levels;(b) autonomy insulates CARs from bad governance at the national level;(c) decentralization encourages public participation and social control atthe regional level; and (d) given Colombia’s size and diversity, central

administration of the environment is inefficient or impractical. Perhapsdecentralization is the principal reason that Colombia’s environmental regu-latory system functions as well as it does. Before decentralization, most ofthe country lacked environmental regulation altogether. This remains thesituation in Latin American countries where environmental regulation ismore centralized (Blackman, Morgenstern, and Topping 2004).
It is perceived that the ministry has insufficient information about theinvestment, policy implementation, and regulatory enforcement activitiesof CARs. The performance indicators CARs currently use typicallyreflect regulatory processes rather than impacts. For example, CARsoften report on the amounts of money spent rather than on how theseinvestments affect environmental quality. The MAVDT’s informationabout environmental quality at the regional level is also insufficient.Effective coordination is not possible without such basic information(Blackman, Morgenstern, and Topping 2004).
To overcome the coordination problems among CARs and nationaland regional agencies, Presidential Decree 1200 of 2004 establishes sixsustainable development objectives and 15 impact indicators aimed atpromoting a better linkage between national and regional priorities andstrengthening the focus on results and impacts linked to the environ-ment, and at evaluating environmental management by CARs.7 Theseare to be addressed at the regional level through PGARs and PATs. ThePGARs outline the principal social, economic, cultural, physical, andother challenges facing the region, and CARs’ strategy for managingenvironmental resources, investment priorities, financing requirements,potential sources of financing, and tools for monitoring and evaluatingthe program. The PATs, prepared in consultation with CARs, municipal-ities, civil society representatives, and other stakeholders, detail eachCAR’s short-term strategy for achieving the goals set forth in the PGAR.Decree 1200 requires the MAVDT to review progress toward achievingthe goals set forth in the PATs and PGARs. The directors of CARs thatdo not meet the goals set forth in their own PATs are at risk of beingremoved by the CAR’s Board of Directors. By June 2005, the MAVDT,the Institute of Hydrology, Meteorology and Environmental Studies(Instituto de Hidrología, Meteorología y Estudios Ambientales, IDEAM),and CARs had not started gathering data to establish a monitoring base-line with respect to the six sustainable development objectives. Since theMAVDT has not started implementation of this decree, it is too early toevaluate the decree’s effectiveness.
Decentralization: A Balancing Act 97

CARs, AAUs, and MunicipalitiesSignificant financial and jurisdictional battles are taking place betweenCARs and Urban Environmental Authorities (Autoridades AmbientalesUrbanas,AAUs) and between CARs and municipalities, all institutions thatneed to—and by law are supposed to—cooperate to facilitate environ-mental management. Furthermore, the precise roles and jurisdictions of thedifferent agencies, particularly the AAUs and CARs, are confused and some-times in conflict. Some regulated firms report being inspected by multipleauthorities, sometimes based on different criteria. Several court cases arepending, although interim cooperative agreements have been reached pend-ing resolution of these cases (Blackman, Morgenstern, and Topping 2004).
According to Blackman, Morgenstern, and Topping (2004), actual andpotential conflicts of jurisdiction among CARs, municipalities, and theAAUs occur, such as cases in which multiple permits are mandated bydifferent agencies, sometimes with conflicting requirements. Financialconflicts among CARs, municipalities, and AAUs are particularly con-tentious. Regarding relationships between CARs and municipalities, inprincipal, CARs receive at least 15 percent of the revenues from propertytaxes collected in their jurisdictions. Administratively, these revenues arecollected by the municipalities. However, many CARs claim that they donot receive their full allocations because of artificially low valuations andbecause the mayors often retain some of the funds for investments in theirmunicipalities. Two principal mechanisms are cited by which the mayorsretain funds: (a) the use of intricate accounting procedures and (b) theuse of in-kind, rather than cash, payments to CARs. In the latter case, themayors sometimes argue that certain investment projects undertakenwithin their jurisdictions should have been financed by CARs.Therefore,the municipalities (unilaterally) net out the costs of these projects beforeallocating revenues to CARs. For a variety of reasons, the CARs’ generaldirectors tend not to fight these actions. How do the mayors exert suchinfluence? They are members of the boards of directors of the CARs, andalthough they are supposed to represent all the mayors in the CARs,they often focus on their own interests; and the mayors tend to formcoalitions with other board members (Blackman, Morgenstern, andTopping 2004).
Financial conflicts between the CARs and the AAUs can be equallycontentious. A number of CARs, including CARDIQUE and CRA, arebattling with the AAUs over the disposition of the property taxes col-lected within the jurisdictions of the AAUs in their areas (Cartagena andBarranquilla, respectively). In the case of CRA, for instance, interviews
98 Blackman, Morgenstern, Topping, and Sánchez-Triana

carried out by Resources for the Future revealed that a recent judicialdecision awarded the full 15 percent of the property taxes collected inBarranquilla to the AAU (Environmental Administration Department ofBarranquilla). While many observers believe this case will not stand upon appeal, final resolution may take many years. In the meantime, theparties have reached an agreement to split the revenues equally(Blackman, Morgenstern, and Topping 2004).
Conclusions and Recommendations
The main conclusions are these:
• detailed, albeit limited, data suggest that CARs do not prioritizeenvironmental risks adequately;
• CARs’ overall performance varies significantly and appears to becorrelated with the age of the CAR, and with levels of poverty andgeographic jurisdictions;
• although the distribution of financial resources across the CARs ishighly unequal, opportunities might exist to mitigate inequities byencouraging CARs to take advantage of unexploited prospects forrevenue generation;
• human and technical resources vary markedly across CARs, andhuman resources difficulties are exacerbated by conflicting national-level polices;
• the participation of CARs in financing, owning, and operating sanita-tion infrastructure weakens their incentives to stringently regulatethat infrastructure;
• coordination between the MAVDT and CARs is suboptimal, partly asa result of tensions inherent in the design of the SINA; and
• jurisdictional conflicts arise among CARs and AAUs.
To meet the institutional challenges discussed, Blackman, Morgenstern,and Topping (2004) propose a series of recommendations (see summaryin table 4.6).
Improve Priority Setting by Mandating CARs to Undertake Analysis of Cost of Environmental Degradation and Comparative Risk AssessmentsTo improve CAR priority setting, the MAVDT might consider (inaddition to enforcement of Decree 1200 of 2004) requesting that each
Decentralization: A Balancing Act 99

100 Blackman, Morgenstern, Topping, and Sánchez-Triana
Table 4.6 Recommendations
Priority: short (S),
medium (M), Participating
Recommendation and long term (L) institutions
Improve priority setting by mandating S Congress, MAVDT, DNP
that CARs undertake analysis of cost of
environmental degradation and
comparative risk assessments
Strengthen the participation of M Congress, MAVDT, DNP
representatives of civil society on CAR
boards of directors
Require top CARs managers and M Departamento
members of boards of directors to meet Administrativo de la
minimum professional criteria and Función Pública,
financial disclosure requirements MAVDT
Hold an annual public meeting of CAR M MAVDT, CARs
and MAVDT representatives
Improve national-regional coordination S MAVDT, DNP, MHCP
Develop guidelines to minimize conflicts S Congress, MAVDT, DNP
of interest arising from CARs’ involvement
in developing sanitation infrastructure
Take action at the national level to resolve S Congress, MAVDT, DNP
jurisdictional and financial disputes
between AAUs and CARs
Eliminate CARs that chronically perform M Congress, MAVDT, DNP
poorly
Source: Authors.
Note: DNP = Departamento Nacional de Planeación; MHCP = Ministerio Hacienda y Crédito Público.
CAR periodically assess the relative importance of various risks tohuman health and the environment in the CAR’s territory. TheMAVDT can also require that CARs use this comparative risk assessmentto guide its allocation of financial, human, and technical resources. Thespecific steps the MAVDT can take to make these requirements feasi-ble include improving data collection and management at the CARlevel; developing a standard methodology for comparative risk assess-ments that is practical, given current capacity for data collection andanalysis among CARs; providing technical assistance and training incomparative risk assessment by, among other things, developing user-friendly training manuals and holding workshops; developing means ofcertifying third parties to assist CARs in carrying out risk assessments;and developing regulations requiring CARs to link the results ofcomparative risk assessments to the resource allocations included intheir PATs.

Strengthen the Participation of Civil Society Representatives on CAR Boards of DirectorsTo balance the influence of private sector interests, the governmentmight consider strengthening the participation of the members of CARboards of directors who represent civil society, the MAVDT, departments,and the president. CARs and the MAVDT can strengthen civil societyparticipation by funding projects and programs to build capacity of non-governmental organizations (NGOs) at the local level, creating networksand associations among NGOs and between Colombian and internation-al civil society, and involving civil society in CAR activities. Measuresthat can help to strengthen civil society include continuing to promoteenvironmental education and ensuring free availability of environmentaldata. Steps can also be taken to professionalize the representatives of pub-lic sector institutions on the boards of directors, including representativesof the MAVDT, the departments, and the president.
Require Top CAR Managers and Members of Boards of Directors to Meet Minimum Professional Criteria and Financial Disclosure RequirementsA number of steps can be taken to professionalize and enhance trans-parency of CAR management and oversight. For example, in accordancewith recent reforms of the election process for general directors (Decree3345 of 2003), the government might consider establishing nationalminimum professional criteria for other top positions in CARs.Individual CARs would be allowed to establish stricter criteria, but notweaker ones. The principal aim of this effort would be to assure that keyCAR staff members and most members of boards of directors possess thetechnical qualifications and professional experience needed to performtheir jobs effectively.The professional criteria should take into account thatregional diversity implies that different qualifications may be appropri-ate in different CARs. Independent third parties such as universities andprofessional associations should be responsible for assessing the extent towhich candidates meet these criteria. Professional experience and edu-cation could substitute for each other in meeting the criteria. Even if thecriteria are not legally binding, a voluntary system of evaluation and publicdisclosure might have a positive impact, and might serve as a first steptoward a more comprehensive system.
In addition, the government might consider efforts to establish financialdisclosure requirements for CAR senior management—including generaldirectors and most public sector board members—and regulations
Decentralization: A Balancing Act 101

governing what types of conflicts of interest disqualify candidates fromservice. Financial disclosures would need to be vetted by a credible, inde-pendent, qualified party.
Hold an Annual Public Meeting of CAR and MAVDT RepresentativesAn annual meeting of MAVDT and CAR general directors that is fullyopen to the public could serve a number of purposes including improvingCAR-MAVDT coordination, disseminating best practices among CARsto raise average levels of regulatory capacity, and increasing transparencyand information sharing. In addition, such an annual meeting wouldenable CARs to publicly report on their activities, thereby creatingincentives for improved institutional performance.
Improve National-Regional CoordinationThe MAVDT could aggressively explore new strategies for improvingcoordination between the MAVDT and CARs. A number of more specificcoordination mechanisms are available that fall into two categories:“carrots”—that is, rewards for cooperative behavior; and “sticks”—sanctionsfor noncooperative behavior. Rewards are likely to be more effective forresource-poor CARs and sanctions are more likely to be effective forresource-rich CARs. First, strengthening the capacity and authority ofthe MAVDT to supervise the performance of SINA organizations wouldhelp it apply sanctions.
A second stick is to enhance MAVDT authority over CAR manage-ment and spending decisions. For example, standards and processes mightbe developed that allow the MAVDT to undertake a periodic formalevaluation of CAR general directors and to remove them for blatantviolations of MAVDT policy directives. The MAVDT might also beendowed with the authority to approve certain CAR budget or investmentdecisions on the basis of clear standards. To minimize the potential forbureaucratic sluggishness, the MAVDT would be given a limited amount oftime to approve or reject budgets. In addition, a formal dispute resolutionmechanism could be established to facilitate the overall process.
Possible coordination incentives include enhancing the MAVDT’s abil-ity to cofinance investment projects at the regional level. In countrieswith a decentralized environmental structure, cofinancing is often themost important tool national authorities have to ensure national-regionalcoordination. One disadvantage of this approach is that it would be lesseffective in CARs with relatively large amounts of self-generated funds.
102 Blackman, Morgenstern, Topping, and Sánchez-Triana

National environmental funds are likely the most efficient and trans-parent means of enhancing cofinancing. The MAVDT could rely onexisting mechanisms—the National Royalty Fund, the EnvironmentalCompensation Fund, the National Environmental Fund, and theNational Fund for Environmental Action. However, each of these fundshas significant structural characteristics that render them less than idealfor the purpose at hand: each fund alone has resources that might not besufficient to have the desired impact; several of the funds have goalsother than coordinating national-regional environmental management orthat entail legal restrictions that would leave the MAVDT with limiteddiscretion in deciding how and where to disburse funds; some of thefunds have been plagued by poor management; and some of the fundshave limited resources outside of national appropriations. Given theseconstraints, the government might consider efforts to consolidate andrestructure the existing funds.
Ideally, the fund used to improve national-regional coordination—whether a modification of an existing mechanism or a new one—wouldhave the following features: CARs would submit proposals for cofinancingto the MAVDT, and the MAVDT would evaluate and select proposalsusing clear and transparent criteria. In establishing these criteria, theMAVDT’s broad aim would be to maximize net benefits (benefits tohuman health and the environment net of total costs) but also to furthernational-regional coordination and to reduce disparities across CARs inboth regulatory capacity and access to environmental services. Thus, theproposal selection criteria would include such factors as the degree towhich the project aligns with national and regional environmental plans,the capacity of the particular CAR to implement the project, the levelof environmental infrastructure in the particular CAR relative to otherCARs, the need for capacity building in the particular CAR relative toother CARs, and the magnitude of the potential net benefits to humanhealth and the environment from the proposed projects.
Conventional mechanisms would be used to ensure that project fundsare well spent. To ensure that a CAR is fully committed to the project, itwould be required to supply a significant percentage of capital from itsown coffers. CARs would also be required to collect clear, transparent,baseline data; establish performance milestones based on specific moni-torable criteria; and provide periodic progress reports on the extent towhich these milestones have been met. Clear failure to meet milestoneswould disqualify CARs from future cofinancing. These mechanismswould help to bolster the MAVDT’s ability to monitor CAR activities.
Decentralization: A Balancing Act 103

104 Blackman, Morgenstern, Topping, and Sánchez-Triana
Finally, the annual meeting constitutes a mechanism for enhancingCAR-MAVDT coordination that involves both carrots and sticks.
Develop Guidelines to Minimize Conflicts of Interest Arising from CARs’ Involvement in Developing Sanitation InfrastructureA number of measures can be taken to minimize potential conflicts ofinterest arising from CAR involvement in developing sanitation infra-structure. The most effective means would be to simply prohibitCARs from having any involvement in developing sanitation infrastruc-ture. Although not unreasonable as a long-term policy goal, in themedium term, given the paucity of other sources of funds for sanitationinfrastructure and consequent national pressures to use CARs’ self-generated funds for this purpose, this drastic measure may not bepolitically feasible.
A more practical approach in the short term might be to prohibitCARs from operating or owning sanitation infrastructure, and tostrictly limit their role to providing cofinancing. Although unlikely tocompletely eliminate conflicts of interest, this prohibition would probablydampen them. Similarly, conflicts of interest could be dampened byrequiring CARs to create independent administrative divisions to financesanitation infrastructure.
Take Action at the National Level to Resolve Jurisdictional and Financial Disputes between AAUs and CARsContinuing jurisdictional and financial disputes between CARs andAAUs—including numerous court cases—have needlessly drained scarceresources; precluded cooperation between the two sets of institutions; andsowed uncertainty, confusion, and mistrust in the regulated community.National-level authorities, including the Congress, might consider clarifyinglines of authority and finance relationships between AAUs and CARs, andmight develop workable and efficient dispute resolution mechanisms.
Eliminate CARs that Chronically Perform Poorly
One option for improving the functioning of the regional environmentalmanagement systems in Colombia is to eliminate CARs that chronicallyperform poorly by consolidating them with contiguous, well-functioningCARs. Until information management systems are improved, however,evaluating the performance of individual CARs will remain a difficult,subjective, and extremely contentious exercise. Once indicators and

Decentralization: A Balancing Act 105
management systems are in place, rules could be established mandatingthat CARs meet minimum performance standards.
Development of these standards could be closely tied to efforts (thatare presumably underway) to require CARs to set specific quantifiablegoals in their PATs, and to systematically monitor their progress towardachieving these goals. Ideally, this performance evaluation system wouldmeasure CARs’ direct impacts on environmental quality, such as reduc-tion in waterborne diseases or in concentrations of particulate matter lessthan 2.5 microns in size (PM2.5) for outdoor or indoor environments.8 Inaddition, the new system could take stock of process-related proxies forCARs’ environmental impacts that have to do with the extent to whichthey carry out functions associated with environmental protection, suchas completing planning activities, collecting environmental quality data,and carrying out monitoring actions.
CARs that chronically fail to meet minimum performance standards,and that cannot show good cause for this failure, would be subject toelimination by consolidation. Procedures to carry out these activitieswould need to be established, possibly including some form of legislativeapproval. Even if never carried out, this threat could be a strong incen-tive to improve performance.
A performance-evaluation system involving such severe sanctionswould create strong incentives for poorly performing CARs to blockimprovements in information management systems. To prevent this, thetwo policy initiatives could be staggered—the evaluation system couldbe initiated after information systems have been upgraded. Thus, thissystem would appear to be more practical in the medium or long termthan in the short term.
Notes
1. Allen Blackman, Richard Morgenstern, Elizabeth Topping, and ErnestoSánchez-Triana are the authors of this chapter, which draws heavily from abackground document prepared for this study by a team from Resources forthe Future (Blackman, Morgenstern, and Topping 2004).
2. According to the MAVDT (2006, p. 7) the “Corporations’ resources areassociated with the structural conditions of development and not withtheir seniority. Some of the Corporations created prior to Law 99 areCORPOCESAR, CORPAMAG, and CORPONARIÑO, which are among the15 with the fewest resources, and Corporations such as CORANTIOQUIA,which was created by Law 99 and is one of those with the most resources.”

3. According to the MAVDT (2006, p. 7) it is “clear that all projects bear operatingcosts inherent to their objectives.”
4. To deal with organic discharges, wastewater treatment plant construction hasgrown significantly in recent years. In 1990, less than 1 percent of the urbanpopulation had wastewater treatment coverage (Contraloría 2002). None ofthose wastewater treatment plants removed pathogens or toxic pollutants.
5. According to the MAVDT (2006, p. 7) “electricity sector transfers are nottaxes or charges.”
6. According to the MAVDT (2006, p. 7), the “increases in the investmentbudgets of the Corporations do not follow a distribution. They originate fromthe circumstances of their own available resources given, as has been stated,their potential to collect resources. On this basis, the increases correspond toresource management and to the Environmental Compensation Fund.”
7. These indicators include deforestation rates and forest conservation efforts,development of green markets, rationalization and optimization of consump-tion of renewable natural resources, reduction in health impacts associatedwith environmental factors, and reduction in vulnerability to risks associatedwith natural disasters.
8. According to the MAVDT (2006, p. 7) “general goals cannot be deemed (inthe sense that they are for all CARs) as environmental goals (air pollution)that are not a generalized problem, as in this case it is suggested to measurethe performance in achieving PM 2.5 reductions that at the global level stilllack norms in industrialized countries.”
References
Blackman, Allen, Richard Morgenstern, and Elizabeth Topping. 2004.“Institutional Analysis of Colombia’s Autonomous Regional Corporations(CARs).” Consulting Report, Resources for the Future, Washington, DC.
Booz Allen Hamilton, Colombia. 1997a. “Institutional Strengthening of theMinistry of Environment: Implantation Plan.” Booz Allen Hamilton, Bogotá.
———. 1997b. “Institutional Strengthening of the Ministry of Environment. Projectof Decree Law and Exposition of Motives.” Booz Allen Hamilton, Bogotá.
Contraloría (Contraloría General de la República). 2002. Estado de los RecursosNaturales y del Ambiente 2001–2002. Bogotá: Contraloría.
Duraiappah, Anantha K. 1998. “Poverty and Environmental Degradation: AReview and Analysis of the Nexus.” World Development 26 (12): 2169–79.
Gómez Torres, Mary. 2003. “Fiscal Policy for Environmental Management inColombia.” XV Regional Seminar on Fiscal Policy, Economic Commission forLatin America and the Caribbean, Santiago, January 27–30.
106 Blackman, Morgenstern, Topping, and Sánchez-Triana

González, F. de G., F. Ajumada Barona, and Mauricio Galindo Caballero. 2002.“Eveluación de Proyectos de Desarrollo Institucional Ambiental. Colombia:Programa Ambiental CO-0041.” Consultant Report, Ministerio del MedioAmbiente, Bogotá.
MAVDT (Ministerio de Ambiente, Vivienda y Desarrollo Territorial). 2006.“Comentarios al Borradore del Analisis Ambiental de Pais. Colombia.” Letterto the World Bank. MAVDT, Bogotá.
Vargas, C. 2003. Ranking de Desempeño de las Corporaciones AutónomasRegionales. Tomo II: Análisis de Resultados. Informe de ConsultorÍa. Ministeriodel Medio Ambiente, Bogotá.
Decentralization: A Balancing Act 107

108 Blackman, Morgenstern, Topping, and Sánchez-Triana
Annex 4.1 Colombia: Regions Managed by Local and RegionalEnvironmental Authorities

As assessment of the social and economic costs of environmental damage inColombia shows that the highest costs of environmental degradation(representing approximately 3.7 percent of gross domestic product) are associatedwith insufficient water supply, sanitation, and hygiene; and ambient and indoorair pollution; followed by natural disasters and land degradation. Ambient andindoor air pollution account for approximately 7,000 premature deaths annually,while 1,450 to 1,820 children die each year from diarrheal illness related toinsufficient water, sanitation, and hygiene. A survey of Colombian societal per-ceptions of environmental priorities showed that the environmental problemsthat carry the highest costs of environmental degradation are also of great con-cern to the Colombian population. It also indicated that these environmentalproblems affect the poor most directly—low-income groups identified air pollu-tion as the most serious environmental concern for the country (74 percent), andenvironmental health (70 percent) as the top priority for their household.
This chapter provides estimates of social and economic costs of environ-mental damage in Colombia based on the national estimates presentedin Larsen (2004b), and describes results from a survey administered in2004 to determine perceptions of different stakeholders on priorityenvironmental concerns (CNC 2004).1 Costs are presented for five environ-mental categories: water, sanitation, and hygiene; urban air pollution;
C H A P T E R 5
Setting Environmental Priorities:
Top Down and Bottom Up
109
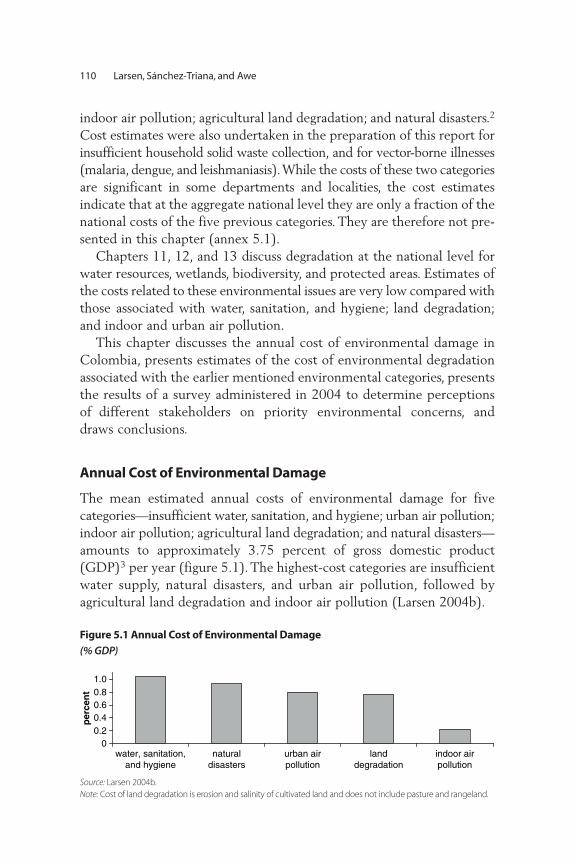
indoor air pollution; agricultural land degradation; and natural disasters.2
Cost estimates were also undertaken in the preparation of this report forinsufficient household solid waste collection, and for vector-borne illnesses(malaria, dengue, and leishmaniasis).While the costs of these two categoriesare significant in some departments and localities, the cost estimatesindicate that at the aggregate national level they are only a fraction of thenational costs of the five previous categories. They are therefore not pre-sented in this chapter (annex 5.1).
Chapters 11, 12, and 13 discuss degradation at the national level forwater resources, wetlands, biodiversity, and protected areas. Estimates ofthe costs related to these environmental issues are very low compared withthose associated with water, sanitation, and hygiene; land degradation;and indoor and urban air pollution.
This chapter discusses the annual cost of environmental damage inColombia, presents estimates of the cost of environmental degradationassociated with the earlier mentioned environmental categories, presentsthe results of a survey administered in 2004 to determine perceptionsof different stakeholders on priority environmental concerns, anddraws conclusions.
Annual Cost of Environmental Damage
The mean estimated annual costs of environmental damage for fivecategories—insufficient water, sanitation, and hygiene; urban air pollution;indoor air pollution; agricultural land degradation; and natural disasters—amounts to approximately 3.75 percent of gross domestic product(GDP)3 per year (figure 5.1). The highest-cost categories are insufficientwater supply, natural disasters, and urban air pollution, followed byagricultural land degradation and indoor air pollution (Larsen 2004b).
110 Larsen, Sánchez-Triana, and Awe
00.20.40.60.81.0
water, sanitation,and hygiene
per
cen
t
naturaldisasters
urban airpollution
landdegradation
indoor airpollution
Figure 5.1 Annual Cost of Environmental Damage
(% GDP)
Source: Larsen 2004b.
Note: Cost of land degradation is erosion and salinity of cultivated land and does not include pasture and rangeland.

Low and high estimates of annual costs are presented in table 5.1.Thelargest range is associated with urban air pollution, mainly because twovaluation techniques for estimating the social cost of mortality havebeen applied, as explained in the Urban Air Pollution section of thischapter. The large range for indoor air pollution results mainly fromuncertainty about the level of exposure to indoor smoke from the use offuelwood; thus, a range has been applied for the level of health risk.
Costs by Environmental Category
In urban areas, the cost of urban ambient air pollution is slightly higherthan the cost of inadequate water, sanitation, and hygiene (figure 5.2). Inrural areas, the cost of land degradation (not including pasture) is estimatedto be more than twice as high as the cost of inadequate water, sanitation,and hygiene (figure 5.3), while the cost of indoor air pollution is almostas high as that of water, sanitation, and hygiene.4
Physical damage, such as land degradation and damage to buildings andinfrastructure from natural disasters, has the highest share of total envi-ronmental damage costs. This is followed by an almost equal cost share
Setting Environmental Priorities: Top Down and Bottom Up 111
Table 5.1 Annual Costs of Environmental Damage, Low and High Estimates
Billion pesos per year
Environmental categories Low Mean estimate High
Water, sanitation, and hygiene 1,700 1,960 2,220
Natural disasters 1,330 1,750 2,175
Urban air pollution 720 1,500 2,285
Agricultural soil degradationa 1,310 1,440 1,570
Indoor air pollution 230 415 600
Total annual cost 5,290 7,065 8,850
Source: Larsen 2004b.
Note: US$1 = Col$2,150.
a. Cost is erosion and salinity of cultivated land (not including pasture or rangeland).
0400800
1,2001,6002,0002,400
urban air pollution
bill
ion
pes
os
water, sanitation, and hygiene
Figure 5.2 Estimated Annual Urban Costs
Source: Larsen 2004b.
Note: US$1 = Col$2,150.

for morbidity and mortality (figure 5.4). The negative health impactsassociated with environmental degradation in Colombia are higher thanin other countries with similar income levels. Studies conducted in severallower-middle-income countries and Lebanon (an upper-middle-incomecountry) in the Middle East and North Africa region show that in mostcases the monetary value of increased morbidity and mortality remains
112 Larsen, Sánchez-Triana, and Awe
0200400600800
1,0001,2001,4001,600
landdegradation
bill
ion
pes
os
water, sanitation,and hygiene
indoor airpollution
Figure 5.3 Estimated Annual Rural Costs
Figure 5.4 Costs by Category
0800
1,6002,4003,2004,0004,800
physical morbidity mortality
bill
ion
pes
os
Figure 5.5 Costs of Environmental Degradation (Health and Quality of Life)
0
0.5
1.0
1.5
2.0
2.5
3.0
3.5
per
cen
tag
e o
f G
DP
Egypt,Arab Rep. of
Colombia Jordan Lebanon Algeria SyrianArab Rep.
Morocco Tunisia
Sources: Tunisia and Lebanon: Sarraf, Larsen, and Owaygen 2004; Algeria: Ministère de l’Aménagement du
Territoire et de l’Environnement 2002; Egypt: World Bank 2002; Morocco: World Bank 2003; Syria: Sarraf, Bolt, and
Larsen 2004; Jordan: METAP 2000.
Source: Larsen 2004b.
Note: US$1 = Col$2,150.
Source: Larsen 2004b.
Note: US$1 = Col$2,150.

below 2 percent of GDP, while these costs are about 2.8 percent of GDPin Colombia (figure 5.5). Of the physical costs, the categories with thehighest cost shares are natural disasters and land degradation (figure 5.6).The costs associated with water are for expenditures on bottled water,household water purification, and boiling of drinking water associatedwith perceived health risks of water supply sources.
The estimated number of annual deaths from urban air pollution isseveral times higher than in the other categories (figure 5.7). However,the situation is different for children. Insufficient water, sanitation, andhygiene represent the largest mortality risk for children, followed byindoor air pollution (figure 5.8).
Setting Environmental Priorities: Top Down and Bottom Up 113
0200400600800
1,0001,2001,4001,6001,800
natural disasters land degradation water
bill
ion
pes
os
Figure 5.6 Physical Costs by Category
01,0002,0003,0004,0005,0006,0007,000
urban airpollution
water, sanitation,and hygiene
indoor airpollution
naturaldisasters
dea
ths
Figure 5.7 Number of Deaths by Category
0250500750
1,0001,2501,5001,750
water, sanitation,and hygiene
indoor airpollution
dea
ths
Figure 5.8 Deaths among Children, by Category
Source: Larsen 2004b.
Note: US$1 = Col$2,150.
Source: Larsen 2004b.
Source: Larsen 2004b.

Water, Sanitation, and Hygiene
The mean estimated annual cost associated with insufficient water supply,sanitation, and hygiene ranges from Col$1,700 billion to Col$2,220 billion(US$790 million to US$1 billion) per year, with a mean of Col$1,960billion (US$911 million). The cost of health impacts represents an esti-mated 70 percent of total mean cost, and avertive expenditures about30 percent (figure 5.9). Health impacts include both mortality and mor-bidity, and avertive expenditures include bottled water consumption,household water filtering, and household boiling of drinking water(figure 5.10). This section discusses the linkages among health andwater, sanitation, and hygiene; the environmental health situation inColombia; the methodologies used to estimate health impacts; and thesocioeconomic valuation of these health impacts.
Diarrheal Illness Insufficient potable water supply, sanitation facilities and practices, andhygiene conditions are associated with various illnesses in both adultsand children. Esrey and others (1991) provide a comprehensive review ofstudies documenting this relationship for diseases such as schistosomiasis
114 Larsen, Sánchez-Triana, and Awe
0200400600800
1,0001,2001,4001,600
health impacts avertive expenditures
bill
ion
pes
os
Figure 5.9 Annual Costs of Insufficient Water, Sanitation, and Hygiene
0200400600800
10001200
diarrhealmorbidity
bottled waterconsumption
diarrhealchild
mortality
householdboiling
of water
householdwater
purification
hepatitis A,typhoid, andparatyphoid
bill
ion
pes
os
Figure 5.10 Annual Costs by Category
Source: Larsen 2004b.
Note: US$1 = Col$2,150.
Source: Larsen 2004b.
Note: US$1 = Col$2,150.

(bilharzia), intestinal worms, diarrhea, and others. From a review of studies,Curtis (2002) reports a mean reduction of 44 percent in cases of severediarrhea from good handwashing practices. While diarrheal illness isgenerally not as serious as some other waterborne illnesses, it is morecommon and affects a larger number of people.
Water, sanitation, and hygiene factors also influence child mortality.Esrey and others (1991) find in their review of studies that the medianreduction in child mortality from improved water and sanitation was55 percent. Shi (1999) provides econometric estimates of the impact ofpotable water and sewerage connection on child mortality using data forabout 90 cities around the world. Literacy and education level is alsofound to be important for parental protection of child health againstenvironmental risk factors. Esrey and Habicht (1988) report from astudy in Malaysia that maternal literacy reduces child mortality by about50 percent in the absence of adequate sanitation, but only by 5 percentin the presence of good sanitation facilities. Literacy is also found toreduce child mortality by 40 percent if piped water is present, suggestingthat literate mothers take better advantage of water availability forhygiene purposes to protect child health.
Findings from the Demographic and Health Survey (DHS) seem tofurther confirm the role of literacy in child mortality reduction. Rutstein(2000) provides a multivariate regression analysis of infant and child mor-tality in developing countries using DHS data from 56 countries for theperiod from 1986 to 1998. The study finds a significant relationshipbetween infant and child mortality rates and piped water supply, flushtoilets, maternal education, access to electricity, medical services, oralrehydration therapy (ORT), vaccination, presence of a dirt floor in house-hold dwelling, fertility rates, and malnutrition. Similarly, Larsen (2003)provides a regression analysis of child mortality using national data for2000 from 84 developing countries representing 95 percent of the totalpopulation in the developing world. A statistically significant relationshipbetween child mortality and access to improved water supply, safe sani-tation, and female literacy is confirmed.
Baseline Health DataColombia has achieved substantial reductions in child mortality anddiarrheal child mortality. Child mortality is now about one-third lowerthan in the Latin America and the Caribbean region, and almost 50 percentlower than the average for lower-middle-income countries. Baselinehealth data for estimating the health impacts of insufficient water supply,
Setting Environmental Priorities: Top Down and Bottom Up 115

sanitation, and hygiene are presented in table 5.2. Data from the NationalStatistical Administration Department (Departamento AdministrativoNacional de Estadísticas, DANE) indicate that about 7.3 percent of childmortality is from diarrheal illness. The lower bound for diarrheal mortality(1,450 deaths) is based on 7.3 percent of official death records, while theupper bound (1,820 deaths) is based on 7.3 percent of total estimatedchild mortality published by DANE.5
For diarrheal morbidity, however, it is practically impossible to iden-tify all cases of diarrhea. The main reason is that a substantial share ofcases are not treated or do not require treatment at health facilities, andare therefore never recorded. A second reason is that cases treated byprivate doctors or clinics are most often not reported to public healthauthorities. Therefore, household surveys often provide the most reliableindicator of total cases of diarrheal illness. Most household surveys, how-ever, contain only information on diarrheal illness in children. Moreover, thesurveys reflect diarrheal prevalence only at the time of the survey. Because
116 Larsen, Sánchez-Triana, and Awe
Table 5.2 Baseline Data for Estimating Health Impacts
Parameters Baseline Source
Diarrheal mortality in children under age 5 7.3 Based on data from
(% of child mortality) DANE
Total annual diarrheal mortality in children 1,450–1,820 Estimated from DANE
under age 5
Diarrheal two-week prevalence in children 13.9% DHS 2000
under age 5
Estimated annual diarrheal cases per 2.9 Estimated from DHS 2000
child under age 5
Estimated annual diarrheal cases per person 0.40–0.57 Estimated from a combination
age 5 and over of INS data and DHS 2000
Hospitalization rate (% of all diarrhea cases)— 0.75 Adjusted to Colombia
under age 5 based on evidence from
Hospitalization rate (% of all diarrhea cases)— 0.5 Egypt (Larsen 2004a). No data
under age 5 available for Colombia
Percentage of diarrheal cases and hospitalizations 90 WHO 2002
attributable to water, sanitation, and hygiene
DALYs per 100,000 cases of diarrhea 30–40 Estimated from WHO tables
in children under age 5
DALYs per 100,000 cases of diarrhea 100–130 Estimated from WHO tables
in people age 5 and over
DALYs per case of diarrheal mortality 34 Estimated from WHO tables
in children under age 5
Source: Larsen 2004b.
Note: DALY = disability-adjusted life year; DANE = Departamento Administrativo Nacional de Estadísticas; INS = Instituto
Nacional de Salud.

there is often high variation in diarrheal prevalence across seasons of theyear, extrapolation to an annual average will result in either an over- oran underestimate of total annual cases. Correcting this bias is oftendifficult without knowledge of seasonal variations.
The Colombia Demographic and Health Survey 2000 (DHS 2000)provides data on diarrheal prevalence in children under age five. It reportsthat diarrheal prevalence (in the preceding two weeks) was 13.9 percent.This rate was used to estimate annual cases per child under 5, and thentotal annual cases in all children under 5 (table 5.2). The procedureapplied is to multiply the two-week prevalence rate by 52/2.5 to arrive atan approximation of the annual cases per child. The prevalence rate wasnot multiplied by 26 two-week periods (that is, 52/2), but multiplied by52/2.5 for the following reason: the average duration of diarrheal illness isassumed to be three to four days, which implies that the two-week preva-lence captures a quarter of the diarrheal prevalence in the week before anda quarter in the week after the two-week prevalence period.
The DHS household survey does not (nor does any other householdsurvey in Colombia) provide information on diarrheal illness in the popu-lation age 5 and over. However, the Colombia National Institute of Health(Instituto Nacional de Salud, INS) has a large database on cases of diarrhealillness for several years reported by each department on the basis of infor-mation from health care facilities. While this database is not complete, itprovides an indication of the annual incidence of diarrhea per child rela-tive to annual incidence for the rest of the population.6 An analysis of thedatabase suggests that diarrheal incidence in children under age 5 is up toseven times higher than the incidence in the population age 5 and over. Itshould be noted, however, that the database contains information on casesof diarrhea treated at health facilities. In general, the percentage of cases ofdiarrhea that are treated at health facilities is higher among young childrenthan among older children and adults. For instance, according to the DHS2000, the percentage of cases of diarrhea among 4-year-old children is 28percent lower than among children ages 0 to 4. Thus, the incidence ratioof 7, as suggested from the INS database, is likely an overestimate. Theannual number of cases of diarrhea per person among the populationabove age 5, presented in table 5.2, is therefore estimated at 1/7 to(1/0.72) × 1/7 of the annual cases per child under age 5.
Table 5.2 also presents disability-adjusted life years (DALYs)7 per caseof diarrheal illness, which are used to estimate the number of DALYs lostbecause of insufficient water supply, sanitation, and hygiene. While thedisability weight for diarrheal morbidity is similar for children and adults
Setting Environmental Priorities: Top Down and Bottom Up 117

(0.119 for children under age 5 and 0.086 for the rest of the popula-tion), and the duration of illness is assumed to be the same (three to fourdays), the DALYs per 100,000 cases of diarrheal illness are much higherfor adults. This is because DALY calculations involve age weighting thatattaches a low weight to young children, and a higher weight to adults,corresponding to physical and mental development stages.8 For diarrhealchild mortality, the number of DALYs lost is 34. This reflects an annualdiscount rate of 3 percent of life years lost.
Estimated Impacts on Health from Insufficient Water, Sanitation, and HygieneTable 5.3 presents the estimated impacts on health from insufficientwater, sanitation, and hygiene. The estimates are based on the data intable 5.2, taking into account the World Health Organization (WHO)estimate that 90 percent of diarrheal illness is attributable to water, sani-tation, and hygiene. DALYs lost to diarrheal illness (mortality and mor-bidity) are presented in table 5.4. More than 60 percent of the DALYsare from diarrheal child mortality.
118 Larsen, Sánchez-Triana, and Awe
Table 5.3 Estimated Annual Impacts on Health from Insufficient Water, Sanitation,
and Hygiene
Annual estimates
Parameters Low High
Cases of diarrheal illness
Children (under age 5)—increased mortality 1,305 1,635
Children (under age 5)—increased morbidity 12.4 million 12.4 million
Population age 5 and over—increased morbidity 14.5 million 20.0 million
Cases of diarrheal hospitalization
Children (under age 5) 90,000 95,000
Population age 5 and over 75,000 100,000
Total DALYs—mortality and morbidity 64,000 91,000
Source: Larsen 2004b.
Table 5.4 Estimated DALYs Lost to Diarrheal Mortality and Morbidity
Estimated annual DALYs
Parameters Low High % total DALYs
Children (under age 5)—increased mortality 44,000 55,500 62–69
Children (under age 5)—increased morbidity 4,000 5,500 6
Population age 5 and over—increased morbidity 16,000 29,000 25–32
Total DALYs 64,000 90,000
Source: Larsen 2004b.

Estimated Cost of Health ImpactsTotal annual cost of health impacts associated with insufficient water, sani-tation, and hygiene is estimated at Col$1,210 billion to Col$1,525 billion(US$563 million to US$709 million) (table 5.5). The cost of diarrhealchild mortality is based on the human capital approach. The cost ofmorbidity includes the cost of illness (medical treatment, medicines, andvalue of lost time) and DALYs from morbidity valued at GDP per capitato reflect the cost of reduced well-being associated with illness.
Total annual cost of illness is presented in table 5.6 for diarrheal mor-bidity. About 40 to 50 percent of these costs is associated with the valueof time lost to illness (including care giving), and 50 to 60 percent isfrom cost of treatment and medicines.
Baseline data for the cost estimates of morbidity in tables 5.5 and 5.6are presented in table 5.7. Percentage of diarrheal cases in the age groupolder than 5 years treated at medical facilities is estimated from percent-age of treated cases among children (DHS 2000) and the ratio of treatedcases among children under age 5 to treated cases among the population
Setting Environmental Priorities: Top Down and Bottom Up 119
Table 5.5 Estimated Annual Cost of Diarrheal Illness
Estimated annual cost (billion pesos)
Parameters Low High
Mortality
Children under age 5 178 224
Morbidity
Children under age 5 432 480
Population age 5 and over 493 704
Hospitalization—children under age 5 54 54
Hospitalization—population age 5 and over 53 53
Total annual cost 1,210 1,515
Source: Larsen 2004b.
Note: US$1 = Col$2,150.
Table 5.6 Estimated Annual Cost of Illness (Morbidity) by Category
Estimated annual cost (billion pesos)
Categories Low High
Medical treatments (doctors, hospitals, and clinics) 351 351
Medicines 232 232
Time lost to illness 361 567
Total annual cost 944 1,150
Source: Larsen 2004b.
Note: US$1 = Col$2,150.

age 5 and over. The latter ratio is from the INS database discussed in theBaseline Health Data section.
The value of time for adults is based on national average wages.Economists commonly apply a range of 50 to 100 percent of wage rates toreflect the value of time. The hourly rate of Col$2,100 (about US$1), orCol$17,000 (US$7.90) per day reflects around 75 percent of average wagesin Colombia.9 These rates for value of time have been applied to bothworking and nonworking individuals. There are two reasons for applying
120 Larsen, Sánchez-Triana, and Awe
Table 5.7 Baseline Data for Cost Estimation
Parameters Baseline Source
Percentage of diarrheal cases treated at medical 29 DHS 2000
facilities (children under age 5) and with medicines
Percentage of diarrheal cases treated with oral 36 DHS 2000
rehydration salts (children under age 5)
Percentage of diarrheal cases treated at medical 18–25 Estimated from a combination
facilities (population age 5 and over) and with of INS data and DHS 2000
medicines
Average cost of doctor visits (urban and 35,000 Based on consultations with
rural) (pesos) pharmacies, medical service
Average cost of medicines for treatment 30,000 providers, and health
of diarrhea (pesos) authorities
Average cost of ORT per diarrheal case in 3,850
children (pesos)
Average duration of diarrheal illness in days 3–4 Assumption
(children and adults)
Hours per day of care giving per case 2 Assumption
of diarrhea in children
Hours per day lost to illness per case 2 Assumption
of diarrhea in adults
Value of time for adults (care giving 2,100 Based on urban and rural
and ill adults) (pesos/hour) wages in Colombia
Hospitalization rate (% of all diarrhea 0.75 Adjusted based on evidence
cases)—under 5 years old from Egypt, Arab Rep. of
(Larsen 2004a).
Hospitalization rate (% of all diarrhea 0.50 No data available for
cases)—under 5 years old Colombia
Average length of hospitalization (days) 2 Adjusted from Egypt, Arab
Rep. of (Larsen 2004a)
Time spent on visitation (hours per day) 4 Assumption
Average cost of hospitalization (pesos per day) 280,000 Based on consultations with
hospitals
Diarrhea cases and hospitalizations caused 90 WHO 2002
by inadequate water, sanitation, and hygiene (%)
Source: Larsen 2004b.
Note: US$1 = Col$2,150.

the rates to nonworking individuals: most of those adult individuals providea household function that has a value; and there is an opportunity cost tothe time of nonworking individuals, because they could choose to join thepaid labor force.10
Hepatitis A, Typhoid, and ParatyphoidRecorded annual cases of hepatitis A and typhoid and paratyphoid inColombia for 2000–03 are presented in table 5.8. The data for 2003report cases by age. Close to 20 percent of cases of hepatitis A and closeto 10 percent of cases of typhoid and paratyphoid were among childrenunder age 5.
Estimated annual cost of these illnesses is presented in table 5.9 basedon annual average cases during 2000–03. About 55 percent of estimatedcost is from hospitalization and 40 percent is from time losses for theill individuals and their caregivers during illness. More than 70 percentof the cost of time losses is associated with ill individuals and almost30 percent with care giving.
Table 5.10 presents the baseline data for estimating the costs of hepa-titis A, typhoid, and paratyphoid. It is assumed that all people with casesof hepatitis A and typhoid and paratyphoid are hospitalized. The esti-mated cost of hospitalization in table 5.9 is therefore an upper bound.The value of time lost to illness and care giving is around 75 percent ofaverage wage rates. Average duration of illness is estimated to be 30 days,
Setting Environmental Priorities: Top Down and Bottom Up 121
Table 5.8 Annual Cases of Hepatitis A and Typhoid and Paratyphoid, 2000–03
Year Hepatitis A Typhoid and paratyphoid
2000 4,438 99
2001 6,405 373
2002 11,236 256
2003 6,513 1,503
Annual average 7,148 558
Source: National Institute of Health, Colombia 2004.
Table 5.9 Estimated Annual Cost of Hepatitis A, Typhoid, and Paratyphoid
Categories Estimated total annual cost (billion pesos)
Hospitalization 6.5
Medication 0.4
Time losses 4.9
Total annual cost 11.8
Source: Larsen 2004b.
Note: US$1 = Col$2,150.

and the cost estimate in table 5.9 assumes that 30 days are lost to illness,valued at Col$17,000 (US$7.90) per day.11 This is likely to be an upperbound because some individuals recover faster and part of the day dur-ing recovery may be of productive use. Even with baseline data thatare likely to be upper bounds, the total annual estimated cost of hepatitisA and typhoid and paratyphoid is only a small fraction of the cost ofdiarrheal illness.
Avertive ExpendituresIn the presence of perceived health risks, individuals often take avertivemeasures to avoid these risks. Economists usually consider these meas-ures a cost of health risks. If consumers perceive there is a risk of illnessfrom the municipal water supply, or from other sources of water supplythey rely on, some are likely to purchase bottled water for drinking pur-poses, or boil their water, or install water purification filters. The estimatedcost of these measures is presented in this section.
Bottled water. Approximately 775 million liters of bottled water weresold in Colombia in 2001 according to the Annual Manufacturer Survey(DANE 2003). The average factory price was about Col$275 (US$0.13)per liter. According to observations in stores in Bogotá, the average retailprice ranged from Col$200 (US$0.09) per liter for five-gallon containersto Col$1,000 (US$0.47) per liter for one-liter bottles.
To estimate the total annual retail cost of bottled water consumptionin Colombia, a retail price range of Col$480 to Col$625 (US$0.22 to
122 Larsen, Sánchez-Triana, and Awe
Table 5.10 Baseline Data for Cost Estimation of Hepatitis A, Typhoid,
and Paratyphoid
Parameters Baseline Source
Percentage of cases hospitalized 100 Assumption
Average length of hospitalization (days) 3 Estimate
Average cost of hospitalization (pesos per day) 280,000 Based on consultation with
Average cost of medication (pesos per case) 50,000 health care providers and
health care authorities
Average duration of illness (days) 30 Estimate
Value of time lost to illness and care 17,000 Based on average wages
giving (pesos per day)
Care giving at home per day of illness 3 Estimate
(hours per day)
Source: Larsen 2004b.
Note: US$1 = Col$2,150.

US$0.29) per liter was applied.The lower bound represents a 75 percentmarkup of average factory price. The upper bound represents an arith-metic average of retail prices for the most commonly sold quantities ofbottles (and containers). On this basis, the total annual cost of bottledwater consumption is estimated at Col$375 billion to Col$485 billion(US$174 million to US$226 million).
Boiling of water. According to the Quality of Life Survey 2003 (DANE2003), 48 percent of households in Colombia boil their drinking water,either all the time or sometimes. Table 5.11 presents the estimated annualcost of boiling water for those households, totaling Col$75 billion toCol$160 billion (US$35 million to US$74 million) per year.
Table 5.12 presents the data used to estimate the annual cost of boilingdrinking water. It is assumed that the average daily consumption of drink-ing water per person is 0.5 to 1.0 liters among households boiling water.The residential cost of energy is estimated based on data from the Miningand Energy Planning Unit (Unidad de Planeación Minero Energética, UPME).The average stove efficiency is for electric, natural gas, and propane stoves.
Water purification. The Quality of Life Survey 2003 (DANE 2003)reports that 4.2 percent of households have drinking water purificationfilters installed in their homes. The annual cost of household waterpurification is estimated at Col$30 billion to Col$35 billion (US$14 millionto US$16 million).This is estimated by annualizing the cost of purificationequipment and filters over their expected useful life, using a discountrate of 10 percent, an average useful life of equipment of 15 years, and
Setting Environmental Priorities: Top Down and Bottom Up 123
Table 5.11 Estimated Annual Cost of Boiling Drinking Water
Estimated annual cost (billion pesos)
Categories Low High
Cost of bringing water to boiling point
Households using electricity 35 70
Households using natural gas 10 20
Households using propane 18 35
Households using other types of energy
(mainly fuelwood) 6 24
Cost of boiling water for 10 minutes
All households boiling water 6 11
Total annual cost 75 160
Source: Larsen 2004b.
Note: US$1 = Col$2,150.

an average lifetime of filters of 0.6 to 6.0 years. These useful lives representaverages for the most common equipment and filters used in Colombia.Unit costs for equipment and filters are presented in table 5.13. Thesefigures, and the useful life of equipment and filters, were obtained fromstores in Bogotá.
Table 5.14 presents a summary of the cost of avertive expendi-tures, amounting to a total of Col$480 billion to Col$680 billion(US$223 million to US$316 million) per year. This represents 30 percentof the total estimated annual cost of insufficient water supply, sanitation,and hygiene.
124 Larsen, Sánchez-Triana, and Awe
Table 5.12 Baseline Data for Cost Estimation for Boiling Drinking Water
References and
Parameters Data measurements
Percentage of households that boil their 48 DANE 2003 survey
drinking water
Average daily consumption of drinking water 0.5–1.0 Liters per person per day
Percentage of households using electricity 14 DHS 2000 and data from
Percentage of households using natural gas 34 UPME
Percentage of households using propane 31 UPME
Percentage of households using other types 21 UPME
of energy
Energy requirement for heating of water 4,200 Joules/liter/1 degree Celsius
(100% efficiency)
Average stove efficiency for heating of water 50% Varies by type of stove
Cost of residential electricity (economic cost) 350 Pesos/kilowatt hour
Cost of residential natural gas 406 Pesos per cubic meter
Average cost of bottled propane 39,000 Pesos (per 17.7 gallons)
Source: Larsen 2004b.
Note: US$1 = Col$2,150.
Table 5.13 Unit Costs of Water Purification
Parameters Low High
Percentage of households using water purification
equipment and filters 4.2 4.2
Cost of water purification equipment
(most commonly used) (pesos) 295,000 270,000
Cost of replacement filter (pesos) 95,000 22,500
Average useful life of filters (years) 6.0 0.6
Average useful life of equipment (years) 15 15
Source: Larsen 2004b.
Note: US$1 = Col$2,150.

Urban Air Pollution
The mean estimated annual cost of urban air pollution amounts toCol$1,500 billion (US$698 million) (figure 5.11).About 65 percent of thecost is associated with mortality, and 35 percent with morbidity. Measuredin DALYs, mortality represents 50 percent and morbidity 50 percent. Thissection discusses the scientific evidence for the impacts of urban air pollu-tion on health, the methodologies used to estimate health impacts inColombian cities, and the socioeconomic valuation of these health impacts.
There is substantial research evidence that outdoor urban air pollutionhas significant negative impacts on public health and results in prematuredeaths, chronic bronchitis, and respiratory disorders (Ostro 1994).The airpollutant that has shown the strongest association with these health end-points is particulate matter (PM), and especially particulates of less than10 microns in diameter (PM10) or smaller. Pope and others (2002) pro-vide strong evidence that it is even smaller particulates, particulates of lessthan 2.5 microns in diameter (PM2.5), that have the largest health effects.The gaseous pollutants (sulfur dioxide [SO2], nitrogen oxide [NOx],carbon monoxide [CO], and ozone [O3]) are generally not thought to
Setting Environmental Priorities: Top Down and Bottom Up 125
Table 5.14 Estimated Total Annual Household Costs of Avertive Expenditures
Total annual cost (billion pesos)
Parameters Low High
Cost of bottled water consumption 375 485
Cost of household boiling of drinking water 75 160
Cost of household water purification 30 35
Total cost 480 680
Source: Larsen 2004b.
Note: US$1 = Col$2,150.
bill
ion
pes
os
0
200
400
600
800
1,000
1,200
cardiopulmonary andlung cancer mortality
respiratorymorbidity
Figure 5.11 Annual Costs of Urban Air Pollution
Source: Larsen 2004b.
Note: US$1 = Col$2,150.

be as damaging as fine particulates. However, SO2 may have importanthealth consequences because it can react with other substances in theatmosphere to form particulates (Krupnick 2005). Colombia is highlyurbanized, with 72 percent of the population living in urban areas (DANE2002). Close to 50 percent of the population live in cities with more than100,000 inhabitants, and close to 30 percent live in cities with more than1 million inhabitants. Only some cities in Colombia have PM10 monitor-ing data (tables 5.15 and 5.16). Their total population is 12.5 million.12
Based on the current status of worldwide research, the risk ratios ordose response coefficients from Pope and others (2002) are likely to be thebest available evidence for the mortality effects of ambient particulate pol-lution (PM2.5). Pope and others (2002) found a statistically significant rela-tionship between levels of PM2.5 and mortality rates; all-cause mortalityincreased by 4 to 6 percent for every 10 micrograms per cubic meter
126 Larsen, Sánchez-Triana, and Awe
Table 5.15 Baseline Data for Cities with PM Monitoring Data
Key parameters Bogotá Bucaramangaa AMVAb Cali
Population, 2002 (millions) 6.68 0.74 2.80 2.26
Adult population � 15 years (millions) 4.67 0.49 1.79 1.60
Children population � 14 years (millions) 2.01 0.25 1.01 0.66
Annual average PM10
(μg/m3)c 62 56 52 46
Annual average PM2.5
(μg/m3)d 37 34 31 27
Source: Population figures are based on estimates by DANE.
Note: μg/m3 = micrograms per cubic meter.
a. Includes Floridablanca and Girón.
b. The AMVA (Área Metropolitana del Valle de Aburrá) includes MedellÍn, Bello, Envigado, Itagui, and so on.
c. PM10
figures are population weighted by PM10
levels in four zones in each city.
d. PM2.5
is calculated based on a PM2.5
/PM10
ratio of 0.6.
Table 5.16 Baseline Data for Cities without PM Monitoring Data
City size (inhabitants)
Key parameters Over 1 milliona 500,000–1 millionb 100,000–500,000c
Total population, 2002 1.30 1.64 5.98
Adult population � 15 years 0.89 1.11 4.03
Child population � 14 years 0.41 0.53 1.95
Annual average PM10
(μg/m3)d 50 45 40
Annual average PM2.5
(μg/m3)e 30 27 24
Source: Population figures are based on city-specific estimates by DANE.
Note: μg/m3 = micrograms per cubic meter.
a. Barranquilla.
b. Cartagena (0.95 million) and Cúcuta (0.69 million).
c. Twenty-four cities with an average population of 250,000 per city.
d. PM10
figures are approximations based on population size in relation to cities with PM10
data.
e. PM2.5
is calculated based on a PM2.5
/PM10
ratio of 0.6.

(µg/m3) increase in PM2.5. The increase in cardiopulmonary mortality was6 to 9 percent, and 8 to 14 percent for lung cancer. No statistically signifi-cant relationship was found between levels of PM2.5 and all other causesof mortality. The impacts on health attributable to air pollution were con-verted to DALYs to facilitate a comparison with health effects from otherenvironmental risk factors (table 5.17).
It is estimated that urban air particulate pollution causes around 6,000premature deaths and about 7,400 new cases of chronic bronchitis annu-ally. Annual hospitalizations as a result of pollution are estimated atclose to 13,000, and emergency room visits and outpatient hospitalizationsat 255,000 per year. In terms of annual DALYs lost, mortality accountsfor an estimated 51 percent, chronic bronchitis around 18 percent, restrict-ed activity days 14 percent, and respiratory symptoms 11 percent.
More than one-third of all health effects are in Bogotá. This is signifi-cantly higher than in relation to the population of Bogotá and stemsfrom the higher PM levels in the city than in most other cities. Morethan 20 percent of estimated health effects are in the cities with popu-lations of less than half a million (table 5.18). However, their share ofestimated health effects is significantly lower than their populationshare, because of the lower pollution levels expected in these cities.
As presented in table 5.19, cost of mortality is based on both thehuman capital approach and the value of statistical life, thus the largerange in cost. A measure of the welfare cost of morbidity is often basedon the willingness to pay to avoid or reduce the risk of illness. This meas-ure is often found to be several times higher than the cost of medicaltreatment and the value of time losses (Cropper and Oates 1992), andreflects the value that individuals place on avoiding pain and discomfort.However, there are not a sufficient number of willingness-to-pay studies
Setting Environmental Priorities: Top Down and Bottom Up 127
Table 5.17 Estimated Impacts on Health from Urban Air Pollution
Health categories Total cases Total DALYs
Premature mortality 6,040 45,300
Chronic bronchitis 7,410 16,300
Hospital admissions 12,970 210
Emergency room visits and outpatient hospital visits 255,000 1,150
Restricted activity days 42,000,000 12,640
Lower respiratory illness in children 585,000 3,800
Respiratory symptoms 135,000,000 10,100
Total n.a. 89,500
Source: Larsen 2004b.
Note: n.a. = not applicable.

in Colombia. For this reason, the cost-of-illness approach (mainly medi-cal cost and value of time losses) has been supplemented in this reportby a proxy for the cost of pain and discomfort. The proxy applied isvaluation of DALYs at GDP per capita. The value-of-time losses representalmost 50 percent of total cost, and the cost of pain and discomfort(proxied by DALYs valued at GDP per capita) represents somewhatmore than one-third.
The value of time for adults is based on urban wages. Economistscommonly apply a range of 50 to 100 percent of wage rates to reflectthe value of time. The rate of Col$20,000 (US$9.30) per day is about
128 Larsen, Sánchez-Triana, and Awe
Table 5.18 Estimated Health Impact by City
Percentage of total
Parameters exposed populationa Percentage of total casesb
Cities with PM monitoring
Bogotá 31 38
Ciudad de Bucaramanga 3 4
AMVA 13 13
Cali 10 10
Cities without PM monitoring
Over 1 million inhabitants 6 7
500,000–1 million inhabitants 8 7
100,000–500,000 inhabitants 28 21
Source: Larsen 2004b.
Note: AMVA = Área Metropolitana del Valle de Aburrá.
a. Exposed population is reported in tables 5.15 and 5.16.
b. Total cases are reported in table 5.17.
Table 5.19 Estimated Annual Costs of Health Impacts
Total annual cost
Health categories Billion pesos Percent (mean)
Mortality 200–1,765 65
Morbidity
Chronic bronchitis 90 6
Hospital admissions 25 2
Emergency room visits and outpatient hospital visits 40 3
Restricted activity days (adults) 270 18
Lower respiratory illness in children 50 3
Respiratory symptoms (adults) 45 3
Total cost of morbidity 520 35
Total cost (mortality and morbidity) 720–2,285 100
Source: Larsen 2004b.
Note: Annual cost is rounded to nearest 5 billion pesos, and percentages are rounded to nearest percent.
US$1 = Col$2,150.

75 percent of average urban wages in Colombia. This rate for value oftime has been applied to both working and nonworking individuals.There are two reasons for applying the rates to nonworking individuals:most of those adult individuals provide a household function that has avalue, and there is an opportunity cost to the time of nonworking indi-viduals, because they could choose to join the paid labor force.13
Estimated lost workdays per year are based on frequency of estimatedmedical treatment plus an additional seven days for each hospitalizationand one extra day for each doctor and emergency visit. These days areadded to reflect time needed for recovery from illness. To estimate thecost of a new case of chronic bronchitis, the medical cost and value oftime losses have been discounted over a 20-year duration of illness. Anannual real increase of 2 percent in medical costs and value of time hasbeen applied to reflect an average expected increase in annual labor pro-ductivity and real wages. The costs are discounted at 3 percent per year,a rate commonly applied by the WHO for health effects (table 5.20).
Indoor Air Pollution
The mean estimated annual cost of health impacts from indoor airpollution associated with the use of traditional fuels (mainly fuelwood)is Col$415 billion (US$193 million). As presented in figure 5.12, adultfemale chronic obstructive pulmonary disease (COPD) mortality repre-sents 28 percent of this cost. Acute respiratory illness (ARI) in childrenand adult females represents 47 percent of the cost, and respiratory childmortality about 12 percent. COPD morbidity in adult females represents13 percent of the total cost.
The WHO (2002) estimates that 1.6 million people die each yearglobally from indoor smoke from the use of traditional fuels in the home.The most common of such fuels are wood, agricultural residues, animal
Setting Environmental Priorities: Top Down and Bottom Up 129
Table 5.20 Estimated Annual Costs of Morbidity from Urban Air Pollution
Annual cost
Categories Billion pesos Percentage
Cost of medical treatments (doctors, hospitals, and clinics) 80 16
Cost of time lost to illness 245 47
DALYs (valued at GDP per capita) 195 37
Total 520 100
Source: Larsen 2004b.
Note: US$1 = Col$2,150.

dung, charcoal, and, in some countries, coal. The strongest links betweenindoor smoke and health are for lower respiratory infections, COPD, andcancer of the respiratory system, with indoor smoke causing an estimated37.5 percent, 22.0 percent, and 1.5 percent, respectively, of these illnessesglobally (WHO 2002).
There are two main steps in quantifying the health effects. First, thenumber of people or households exposed to pollution from solid fuelsneeds to be calculated, and the extent of pollution, or concentration, shouldideally be measured. Second, the health impacts from this exposure shouldbe estimated on the basis of epidemiological assessments. Once the healthimpacts are quantified, the value of this damage can be estimated.
Traditional Fuel UseThe DHS in 1995 and 2000, conducted among urban and rural householdsthroughout Colombia, contain information on household use of traditionalfuels for cooking.The data from the DHSs are presented in table 5.21, indi-cating that about 60 percent of rural households and less than 3 percent ofurban households used fuelwood or charcoal or coal products in 2000.Nationally, this represents around 18 percent of all households.
Table 5.21 also indicates that liquefied petroleum gas or natural gasmade rapid inroads among both rural and urban households from 1995to 2000, replacing both traditional fuels and electricity for cooking. Thenumber of rural households using traditional fuel declined by more thana percentage point per year from 1995 to 2000. Nevertheless, the shareof rural households using traditional fuels remains substantial, and can besuspected of being associated with significant respiratory health impacts.
An estimate of the percentage of households using traditional fuelscan also be provided from the UPME energy balances. These figures arepresented in table 5.22 on the basis of total fuelwood consumption and a
130 Larsen, Sánchez-Triana, and Aweb
illio
n p
eso
s
0
50
100
150
200
250
ARI child and adult female
morbidity
COPD adult female mortality
COPD adult female morbidity
ARI child mortality
Figure 5.12 Annual Costs of Indoor Air Pollution
Source: Larsen 2004b.
Note: US$1 = Col$2,150. ARI = acute respiratory illness.
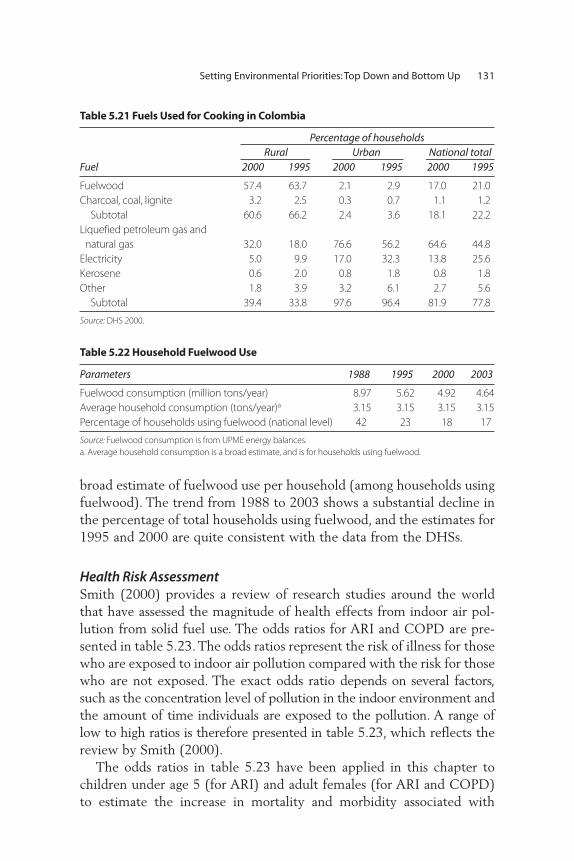
broad estimate of fuelwood use per household (among households usingfuelwood). The trend from 1988 to 2003 shows a substantial decline inthe percentage of total households using fuelwood, and the estimates for1995 and 2000 are quite consistent with the data from the DHSs.
Health Risk AssessmentSmith (2000) provides a review of research studies around the worldthat have assessed the magnitude of health effects from indoor air pol-lution from solid fuel use. The odds ratios for ARI and COPD are pre-sented in table 5.23. The odds ratios represent the risk of illness for thosewho are exposed to indoor air pollution compared with the risk for thosewho are not exposed. The exact odds ratio depends on several factors,such as the concentration level of pollution in the indoor environment andthe amount of time individuals are exposed to the pollution. A range oflow to high ratios is therefore presented in table 5.23, which reflects thereview by Smith (2000).
The odds ratios in table 5.23 have been applied in this chapter tochildren under age 5 (for ARI) and adult females (for ARI and COPD)to estimate the increase in mortality and morbidity associated with
Setting Environmental Priorities: Top Down and Bottom Up 131
Table 5.21 Fuels Used for Cooking in Colombia
Percentage of households
Rural Urban National total
Fuel 2000 1995 2000 1995 2000 1995
Fuelwood 57.4 63.7 2.1 2.9 17.0 21.0
Charcoal, coal, lignite 3.2 2.5 0.3 0.7 1.1 1.2
Subtotal 60.6 66.2 2.4 3.6 18.1 22.2
Liquefied petroleum gas and
natural gas 32.0 18.0 76.6 56.2 64.6 44.8
Electricity 5.0 9.9 17.0 32.3 13.8 25.6
Kerosene 0.6 2.0 0.8 1.8 0.8 1.8
Other 1.8 3.9 3.2 6.1 2.7 5.6
Subtotal 39.4 33.8 97.6 96.4 81.9 77.8
Source: DHS 2000.
Table 5.22 Household Fuelwood Use
Parameters 1988 1995 2000 2003
Fuelwood consumption (million tons/year) 8.97 5.62 4.92 4.64
Average household consumption (tons/year)a 3.15 3.15 3.15 3.15
Percentage of households using fuelwood (national level) 42 23 18 17
Source: Fuelwood consumption is from UPME energy balances.
a. Average household consumption is a broad estimate, and is for households using fuelwood.

indoor air pollution.14 These population groups suffer the most fromindoor air pollution because they spend much more of their time athome, and more time cooking than older children and adult males.
Dennis and others (1996) present estimates of impacts of indoor airpollution on obstructive airways disease (OAD) among a sample ofwomen in Bogotá. A sample of case subjects with OAD and controlsubjects without OAD was drawn from hospitals in the city. Informationwas collected from the subjects on their life history of fuelwood use andother variables known to be associated with OAD.The average age of thesubjects was 63 years.The study found an odds ratio of 3.9 (controlling fortobacco smoking, passive smoking, age, and socioeconomic variables),that is, the risk of developing OAD was found to be 3.9 times higheramong the women who had a life history of fuelwood use comparedwith women from households not using fuelwood. The average numberof years of fuelwood use was 33 among the subjects with OAD, and 18among the subjects without OAD.
Studies around the world have also found linkages between indoor airpollution from traditional fuels and increased prevalence of tuberculosisand asthma. It is also likely that indoor air pollution from such fuels cancause an increase in ischemic heart disease and other cardiopulmonarydisorders. As discussed in the section on urban air pollution, Pope andothers (2002) found that the largest effect of urban fine particulate pollu-tion on mortality is for the cardiopulmonary disease group. Because indoorsmoke from traditional fuels is high in fine particulates, the effect on thesediseases might be substantial. However, more research is required to drawa definite conclusion about the linkage and magnitude of effect.
Baseline Health DataTo estimate the effects on health from indoor air pollution from the oddsratios in table 5.23, one must establish baseline data for ARI and COPD.These data are presented in table 5.24, with unit figures for DALYs lost toillness and mortality. Data on COPD mortality, and especially morbidityincidence, according to international disease classification, are not readily
132 Larsen, Sánchez-Triana, and Awe
Table 5.23 Health Risks of Indoor Air Pollution
Odds ratios
Risks Low High
ARI 2 3
COPD 2 4
Source: Smith 2000.

available for Colombia. Regional estimates from WHO (2001) andShibuya, Mathers, and López (2001) have therefore been applied.
The national average two-week prevalence rate of ARI in childrenunder age 5 from the Colombia DHS 2000 is used to estimate totalannual cases of ARI in children under age 5 and annual cases per child underage 5. The procedure applied is to multiply the two-week prevalence rateby 52/3 to arrive at an approximation of the annual cases of ARI perchild. The prevalence rate was not multiplied by 26 two-week periods(that is, 52/2), but multiplied by 52/3 because the average duration ofARI is assumed to be about seven days. This implies that the two-weekprevalence captures half of the ARI prevalence in the week before andthe week after the two-week prevalence period.
The DHS household survey does not (nor does any other householdsurvey in Colombia) provide information on ARI in adults. However, theINS has a large database on cases of ARI reported for several years byeach department in Colombia on the basis of health care facilities. Whilethis database is not complete, it provides an indication of the annual inci-dence of ARI per child relative to annual incidence per adult.15 An analysis
Setting Environmental Priorities: Top Down and Bottom Up 133
Table 5.24 Baseline Data for Estimating Health Impacts
Parameters Baseline Source
Adult female COPD mortality rate (% of total 3.1 WHO (2001);
female deaths) Shibuya, Mathers, and
Adult female COPD incidence rate (per 100,000) 80 López (2001)
ARI 2-week prevalence in children under age 5 (%) 12.6 DHS 2000
Estimated annual cases of ARI per child under age 5 2.2 Estimated from
DHS 2000
Estimated annual cases of ARI per adult 0.36–0.41 Estimated from a
female (over age 15) combination of INS
data and DHS 2000
ARI mortality in children under age 5 7.5 Based on data from
(% of child mortality) DANE
ARI mortality in children under age 5 (cases per year) 1,510–1,890
DALYs per 100,000 cases of ARI in children 165 Estimated from
under age 5 WHO tables
DALYs per 100,000 cases of ARI in adult females 700
(over age 15)
DALYs per case of ARI mortality in children 34
under age 5
DALYs per case of COPD morbidity in adult females 2.25
(over age 15)
DALYs per case of COPD mortality in adult females 6
(over age 15)
Source: Larsen 2004b.

of the database suggests that ARI incidence in children under age 5 is upto six times higher than the incidence in the population age 5 and over. Itshould be noted, however, that the database contains information oncases of ARI treated at health facilities. In general, the percentage of casesof ARI that are treated at health facilities is higher among young childrenthan among older children and adults. For instance, according to theDHS 2000, the percentage of cases of ARI among 4-year-old children is10 percent lower than among children ages 0 to 4. Thus the incidenceratio of 6, as suggested from the INS database, is likely an overestimate.The annual cases of ARI per adult female (age 15 and over) presented intable 5.24 is therefore estimated at 1/6 to (1/0.9) × 1/6 of the annualcases per child under age 5.
ARI mortality in children under age 5, as presented in table 5.24, is basedon data from DANE on child mortality rates and estimated percentageof child mortality attributed to ARI. The lower bound for ARI mortality(1,510 deaths) is based on official death records, while the upper bound(1,890 deaths) is based on 7.5 percent of total estimated child mortali-ty published by DANE.16
Table 5.24 also presents DALYs per cases of ARI and COPD, whichare used to estimate the number of DALYs lost because of indoor airpollution. While the disability weight for ARI morbidity is the same forchildren and adults (0.28), and the duration of illness is assumed to bethe same (seven days), the DALYs per 100,000 cases of ARI are muchhigher for adults. This is because DALY calculations involve age weightingthat attaches a low weight to young children, and a higher weight toadults, corresponding to physical and mental development stages.17 ForARI child mortality, the number of DALYs lost is 34. This reflects anannual discount rate of 3 percent of life years lost.
DALYs lost per case of COPD morbidity and mortality are based onlife tables and age-specific incidence of onset of COPD reported byShibuya, Mathers, and López (2001). A disability weight of 0.2 has beenapplied to COPD morbidity, as published by the U.S. National Institutesof Health for the Latin American region.18 A discount rate of 3 percentis applied to COPD morbidity and mortality.
Estimated Health ImpactsAnnual new cases of ARI and COPD morbidity and mortality (Di) fromfuelwood smoke was estimated using the following equation:
Di = PAR × DiB (5.1)
134 Larsen, Sánchez-Triana, and Awe

where DiB is baseline cases of illness or mortality, i (estimated from the
baseline data in table 5.2), and PAR is given by
PAR = PP × (OR − 1)/(PP × (OR − 1) � 1) (5.2)
where PP is the percentage of population exposed to fuelwood smoke(18 percent of the population for 2000 according to table 5.22), and ORis the odds ratio (or relative risk ratio) shown in table 5.23.
The results are presented in table 5.25. Estimated cases of ARI childmortality and ARI morbidity (children and female adults) from indoorair pollution represent about 16 to 25 percent of total ARI in Colombia.Similarly, the estimated cases of COPD mortality and morbidity repre-sent about 15 to 35 percent of total estimated female COPD from allcauses. In contrast, Dennis and others (1996) found that indoor air pol-lution was the cause of 50 percent of COPD in the sample of women inBogotá. This high number is largely a result of the fact that most of thosewomen had been using fuelwood during part of their lives, and that theodds ratio estimated by Dennis and others is close to the upper boundused in this report.
Table 5.26 presents the estimated health impacts in terms of DALYs.An estimated 27,000 to 52,000 DALYs are lost each year from indoorair pollution. About 40 to 45 percent is from mortality, and about 55 to60 percent from morbidity.
Estimated Cost of Health ImpactsTotal annual cost of indoor air pollution is estimated at Col$240 billion(US$111.6 million) to Col$630 billion (US$293 million), with a meanestimate of Col$415 billion (US$193 million) (table 5.27). The cost of
Setting Environmental Priorities: Top Down and Bottom Up 135
Table 5.25 Estimated Annual Impacts on Health from Indoor Air Pollution
Estimated annual cases
Parameters Low High
ARI
Children (under age 5)—increased mortality 265 455
Children (under age 5)—increased morbidity 1,600,000 2,800,000
Adult females (age 15 and older)—increased morbidity 900,000 1,500,000
COPD
Adult females—increased mortality 455 1,040
Adult females—increased morbidity 2,800 6,400
Total DALYs—mortality and morbidity 27,000 51,700
Source: Larsen 2004b.

mortality is based on the value of statistical life for adults and on the humancapital approach for children.The cost of morbidity includes the cost of ill-ness (medical treatment, value of lost time, and so forth) and DALYs frommorbidity valued at GDP per capita to reflect the cost of reduced well-being associated with illness. About 42 percent of this cost is associatedwith COPD and 58 percent with ARI.19 COPD and ARI mortality repre-sent about 40 percent of the total cost, and morbidity about 60 percent.
Cost of illness is presented in table 5.28 for ARI and COPD morbidity.20
About 60 percent of these costs are associated with the value of time lostto illness (including care giving), and 40 percent are from cost of treatmentand medicines.
Baseline data for the cost estimates of morbidity in table 5.28 arepresented in table 5.29. The percentage of adult ARI cases treated at
136 Larsen, Sánchez-Triana, and Awe
Table 5.26 Estimated DALYs Lost to Indoor Air Pollution
Estimated annual DALYs % total DALYs from
Parameters Low High indoor air pollution
ARI
Children (under age 5)—increased mortality 9,000 15,600 30–33
Children (under age 5)—increased morbidity 2,700 4,600 9–10
Females (age 15 and older)—increased 6,300 10,900 21–23
morbidity
COPD
Adult females—increased mortality 2,700 6,200 10–12
Adult females—increased morbidity 6,300 14,400 23–28
Source: Larsen 2004b.
Table 5.27 Estimated Annual Cost of Indoor Air Pollution
Estimated annual cost (billion pesos)
Parameters Low High
ARI
Children (under age 5)—increased mortality 35 62
Children (under age 5)—increased morbidity 70 122
Adult females—increased morbidity 72 124
COPD
Adult females—increased mortality 20 218
Adult females—increased morbidity 33 74
Total cost 230 600
Source: Larsen 2004b.
Note: US$1 = Col$2,150.

medical facilities is estimated from the percentage of treated casesamong children (DHS 2000) and the ratio of treated cases among childrenunder age 5 to treated cases among the population age 5 and over. Thelatter ratio is from the INS database discussed in the Baseline HealthData section.
The value of time for adults is based on rural wages. Economists com-monly apply a range of 50 to 100 percent of wage rates to reflect thevalue of time. The hourly rate of Col$1,500 (US$0.70), or Col$12,000(US$5.58) per day, reflects around 75 percent of rural wages inColombia.21 These rates for value of time have been applied to both work-ing and nonworking individuals. The rates are applied to nonworkingindividuals because most of them provide a household function that has avalue, and there is an opportunity cost to the time of nonworking indivi-duals who could choose to join the paid labor force.22
There is very little information about the frequency of doctor visits,emergency visits, and hospitalization for COPD patients in any countryin the world. Schulman, Ronca, and Bucuvalas Inc. (2001) andNiederman and others (1999) provide some information on this fromthe United States and Europe. Figures derived from these studies havebeen applied to Colombia. Estimated lost workdays per year are basedon frequency of estimated medical treatment plus an additional sevendays for each hospitalization and one extra day for each doctor andemergency visit. These days are added to reflect time needed for recoveryfrom illness.
To estimate the cost of a new case of COPD, the medical cost andvalue of time losses have been discounted over a 20-year duration of illness.An annual real increase of 2 percent in medical costs and value of timehas been applied to reflect an average expected increase in annual laborproductivity and real wages. The costs are discounted at 3 percent peryear, a rate commonly applied by the WHO for health effects.
Setting Environmental Priorities: Top Down and Bottom Up 137
Table 5.28 Estimated Cost of Illness by Category for ARI and COPD Morbidity
Estimated annual cost (billion pesos)
Category Low High
Cost of medical treatments (doctors, hospitals, and clinics) 21 38
Cost of medicines 22 39
Cost of time lost to illness 65 113
Total 108 190
Source: Larsen 2004b.
Note: US$1 = Col$2,150.

138 Larsen, Sánchez-Triana, and Awe
Table 5.29 Baseline Data for Cost Estimation of Morbidity
Parameters Baseline Source
ARI
Percentage of ARI cases treated at medical 35 DHS 2000
facilities (children under age 5) (rural children)
Percentage of ARI cases treated at medical 32 Estimate based on
facilities (adults age 15 and over) a combination of INS
data and DHS 2000
Average cost of doctor visits in rural areas 20,000 Consultations with
(mainly primary health care centers) (pesos) pharmacies, medical
Cost of medicines for treatment of ARI (pesos) 16,000–21,000 service providers, and
health authorities
Percentage of ARI cases treated with medicines 50 DHS 2000
Average duration of ARI for children and 7 Assumption
adults (days)
Hours per day of care giving per case of 2 Assumption
ARI in children
Hours per day lost to illness per case of ARI in adults 3 Assumption
Value of time (care giving and ill adults) 1,500 Based on rural wages
(pesos/hour) in Colombia
COPD
Average duration of illness (years) 20 Based on Shibuya,
Mathers, and López
(2001)
Percentage of COPD patients hospitalized per year 1.5 From Schulman, Ronca,
Average length of hospitalization (days) 10 and Bucuvalas Inc.
Average number of doctor visits per COPD 1 (2001) and Niederman
patient per year
Percentage of COPD patients with an emergency 15 and others (1999)
doctor or hospital outpatient visit per year
Estimated lost work days (including household 2.6 Estimated on the basis
work days) per year per COPD patient of the frequency of
doctor visits,
emergency visits, and
hospitalization
Cost of hospitalization (pesos per day) 280,000 Consultations with
Cost of emergency visit, rural (pesos) 25,000 medical service
Cost of doctor visit, rural (mainly primary 20,000 providers and health
health clinic) (pesos) authorities
Value of time lost to illness (pesos per day) 12,000 Based on rural wages in
Colombia
Annual real increases in economic cost of health 2 Estimate
services and value of time (%)
Annual discount rate (%) 3 Applied by WHO for
health effects
Source: Larsen 2004b.
Note: US$1 = Col$2,150.

Agricultural Land Degradation
The mean estimated annual cost of land degradation is Col$1,440 billion(US$670 million), of which soil erosion represents about 60 percent and soilsalinity about 40 percent (figure 5.13). These costs are the value of cropyield reductions associated with salinity and erosion. Data limitations haveprecluded an estimate of the cost of pasture (rangeland) degradation. Theestimated costs of land degradation in Colombia are also higher thanthose of countries with a similar income. When compared with a groupof Middle East and North African countries, the magnitude of the damagesof increased erosion and salinity in Colombia is only lower than those of theArab Republic of Egypt and the Syrian Arab Republic (figure 5.14).
An estimated 4.25 million hectares are under cultivation in Colombia,of which 0.9 million hectares are irrigated. Permanent pasture constitutesclose to 42 million hectares, according to Food and Agriculture Organization(FAO) statistics for 2001.
There is a general perception that pasture (rangeland) is overextendedin Colombia, that crop cultivation in many instances is marginalized to
Setting Environmental Priorities: Top Down and Bottom Up 139
0
200
400
600
800
1,000
soil erosion soil salinity
bill
ion
pes
os
00.20.40.60.81.01.21.4
Egypt,Arab Rep. of
SyrianArab Rep.
Colombia Algeria Jordan Tunisia Lebanon Morocco
per
cen
tag
e o
f GD
P
Figure 5.13 Annual Costs of Agricultural Land Degradation
Figure 5.14 Costs of Environmental Degradation (Erosion and Salinity)
Sources: Tunisia and Lebanon: Sarraf, Larsen, and Owaygen 2004; Algeria: Ministére de l’Aménagement du Territoire
et de l’Environmental 2002; Egypt: World Bank 2002; Morocco: World Bank 2003; Syria: Sarraf, Bolt, and Larsen 2004;
Jordan: METAP 2000.
Source: Larsen 2004b.
Note: US$1 = Col$2,150.

erosion-prone hillsides (Heath and Binswanger 1998;World Bank 1996),and that the Atlantic Region in the northern part of Colombia suffersfrom soil salinity.
There are very few studies of the extent of land degradation inColombia, and of the effect of degradation on agricultural productivity. Nosystematic and comprehensive studies have been undertaken of soil salin-ity levels in the Atlantic Region. A recent study of salinity in the CaucaValley, however, found that about 7 percent of a study area of 192,000hectares has soil salinity exceeding 3.0 deciSiemens per meter (dS/m).About 55 percent has salinity in the range of 0.7 to 3.0 dS/m, and 38 per-cent of the area has salinity of less than 0.7 dS/m (CVC 2002). While soilsalinity levels below 3 dS/m are generally considered moderate, yields ofmany vegetables are affected by salinity exceeding 1 to 2 dS/m.
Corpoica (Baquero Haeberlin and others 2003) recently studied thecost of soil erosion in select sites in four departments—Caqueta, Meta,Santander, and Tolima. Several methodologies were employed, includinghedonic price and productivity models. The results indicate that the costof erosion, measured by impacts on agricultural yields, is substantial inerosion-prone areas.
Land Area Affected by Erosion and SalinityWhile the study by Corpoica is a very important contribution to under-standing the cost of erosion in Colombia, it is difficult to extrapolate thefindings to the national level. In the absence of nationwide studies oferosion and salinity, it is necessary to rely on data published by theInstitute of Hydrology, Meteorology and Environmental Studies(Instituto de Hidrología, Meteorología y Estudios Ambientales, IDEAM)that provide some broad perspectives on land degradation in eachdepartment in Colombia. These data are presented in table 5.30. Theyindicate that around 10 percent of the land area in the country is subjectto moderate to high levels of soil salinity, and 23 percent is subject tohigh or very high levels of erosion. The data are consistent with thegeneral view that the Northern Region of Colombia is particularlyaffected by soil salinity, with moderate to high saline conditions in 45 to85 percent of the land area in the northern departments. According totable 5.30, high or very high erosion is present in 50 percent or more ofthe land area in seven departments.
Based on the above data, a regression analysis was undertaken withthe following equation:
qi = α � βEEi � βSSi � βtti � εi (5.3)
140 Larsen, Sánchez-Triana, and Awe

Setting Environmental Priorities: Top Down and Bottom Up 141
Table 5.30 Indicators of Land Degradation
High or very high Moderate or high soil
Department Total area (km2) erosion (% total area) salinity (% total area)
Amazonas 110,213 0 0
AntioquÍa 63,307 12 10
Arauca 23,784 48 0
Atlántico 3,324 73 74
Bogotá, DC 1,642 8 0
Bolívar 26,644 17 45
Boyacá 23,076 29 5
Caldas 7,444 6 13
Caquetá 89,645 13 0
Casanare 44,435 66 0
Cauca 29,883 16 2
Cesar 22,614 50 63
Chocó 47,321 1 2
Córdoba 25,061 55 44
Cundinamarca 22,490 32 16
Guainía 70,679 1 0
Guaviare 55,080 5 0
Huila 19,240 32 20
La Guajira 20,506 81 79
Magdalena 23,076 33 84
Meta 86,047 50 0
Nariño 30,832 9 3
Norte de Santander 21,995 15 6
Putumayo 26,011 4 0
Quindío 1,948 3 0
Risaralda 3,599 7 5
Santander 30,475 20 8
Sucre 10,719 54 80
Tolima 24,061 24 32
Valle del Cauca 21,277 23 18
Vaupés 53,546 1 0
Vichada 99,874 41 0
All Colombia 23 10
Source: Based on data from IDEAM 2004.
Note: km2 = square kilometer.
where q is the index of relative crop yields, E is percentage of land areathat is eroded, S is the percentage of land area that is saline, t is farmtechnology, and i represents departments.
The data provided by DANE and the Ministry of Agriculture andRural Development were not sufficient to construct a relative yieldindex for all departments, and the econometric estimation of equation (5.3)

was therefore limited to 19 departments and an aggregate of otherdepartments, that is, 20 observations. Department-specific data on farmtechnology was limited to share of cultivated land under irrigation.However, no statistical significance was found, and the technology variablewas therefore left out of the final estimation of equation (5.3).23
The estimated coefficients for erosion and salinity are presented intable 5.31, based on the relative yield index that was constructed fromthe arithmetic average crop yields.24 The coefficients suggest that depart-ment crop yields decline by about 0.30 to 0.35 percentage points (relativeto the national average yield) for every 1 percentage point increase insaline or eroded land area.25
The coefficients in table 5.31 were then applied to equation (5.3) toprovide predicted yields for each department based on the depart-mental soil erosion and salinity data. A simulation was then undertakenwhereby the salinity and erosion variables were set at zero, to estimateexpected yields in the absence of salinity and erosion. The difference inyields is the estimated reduction in yields associated with erosion andsalinity. The national average statistics of this simulation are presentedin table 5.32.
The results of the simulation discussed were then applied to the grossoutput value in each department to estimate the cost of erosion and
142 Larsen, Sánchez-Triana, and Awe
Table 5.31 Estimated Regression Coefficients for Land Degradation
Parameter β t-statistic
Erosion (E) –0.36 –2.61
Salinity (S) –0.31 –3.64
Source: Larsen 2005.
R2 = 0.79; n = 20.
Table 5.32 Simulated Relative Yields
National average
Parameter relative yielda
Yield at current levels of soil erosion and salinity 0.82
Predicted yield if NO very high and high erosion 0.92
Predicted yield if NO high and moderate salinity 0.90
Predicted yield if NO erosion and salinity (high–very
high and moderate–high) 1.00
Source: Larsen 2005.
a. Arithmetic average of the departments in the regression analysis.

salinity. The gross output value was calculated based on producer pricesin Colombia reported by FAO.
Aggregate national estimates of land degradation costs are presented intable 5.33. The cost of erosion relative to salinity is much higher than thestatistics in table 5.33 indicate because table 5.32 is based on arithmeticaverages of percentage effects on yields of land degradation, while theestimated costs in table 5.33 are based on crop composition and totalhectares under cultivation in each department.
An alternative approach to estimating the cost of soil salinity was alsoundertaken in this study for the seven departments in the AtlanticRegion most affected by salinity. Crop-specific soil salinity thresholdsand salinity yield coefficients from the empirical international literaturewere applied to estimate the cost of soil salinity (Allen and others 1998;DeHayr, Diatloff, and Gordon 1997; Kotuby-Amacher, Koenig, and Kitchen1997). Costs were estimated for a plausible range of soil salinity levelsranging from 3 to 5 dS/m. A plausible range was used because there areno systematic salinity measurements from the Atlantic Region.26
Estimated cost of soil salinity was found to be in the same range as theestimate from the regression analysis presented in table 5.33. A salinitylevel of 4 dS/m is associated with a loss close to the mean econometricestimate in table 5.33.
The cost of pasture degradation is an important issue that was not esti-mated in this report because of lack of data. However, the Corpoica studyby Baquero Haeberlin and others (2003) includes an estimate ofCol$58,000 (US$30) per hectare per year for such degradation in Caqueta.If 25 to 50 percent of pasture in Colombia is experiencing a similar level ofdegradation, total annual cost at the national level would be Col$600 billionto Col$1,200 billion (US$279 million to US$558 million). An amount ofthis magnitude might warrant further assessment in other departments togain a better sense of the scope and cost of pasture degradation nationwide.
Setting Environmental Priorities: Top Down and Bottom Up 143
Table 5.33 Estimated Annual Cost of Land Degradation
Estimated annual cost (billion pesos)
Parameter Low High
Soil erosion 805 965
Soil salinity 505 605
Total cost 1,310 1,570
Source: Authors’calculations.
Note: US$1 = Col$2,150.

Natural Disasters
Colombia is annually afflicted by natural disasters such as floods, land-slides, avalanches, and storms; severe earthquakes occur periodically. Thetotal mean annual cost of natural disasters is estimated at Col$1,750 bil-lion (US$814 million), as presented in figure 5.15.
The Department for Disaster Prevention and Response at theMinistry of Interior and Justice maintains a large database on disasters.The database contains information on fatalities and number of individ-uals and houses affected by disasters up to 1998. For the period from1999 to 2003, the database also contains information on the numberof people injured and public buildings affected, and distinguishesbetween destroyed and damaged houses. The number of people andunits affected by natural disasters is presented in table 5.34. To facili-tate comparison from year to year, the table includes only disastersthat occur annually, and does not include the large Armenia earth-quake in 1999. The impacts of disasters were particularly high in1999, mainly as a result of severe floods.
Table 5.35 provides average annual impacts for three periods over thepast decade. There does not seem to be any detectable trend in impactsover these periods. To test for any time trends, a regression analysis wasundertaken for total number of people affected by disasters, but the timetrend was statistically insignificant.
Table 5.36 presents the distribution of disaster impacts across types ofdisasters. The distribution is based on data for the five most recent years(1999–2003). Earthquakes and landslides caused the most deaths.Storms were among the leading causes of damage to houses, but notdestruction of houses. Floods and earthquakes had the largest impact,measured by total number of people killed, injured, or affected andhouses destroyed and damaged.
144 Larsen, Sánchez-Triana, and Awe
0
200
400
600
800
1,000
1,200
annually occurring disasters major earthquakes
bill
ion
pes
os
Figure 5.15 Estimated Annual Costs of Natural Disasters
Source: Larsen 2004b.
Note: US$1 = Col$2,150.

Setting Environmental Priorities: Top Down and Bottom Up 145
Table 5.35 Annual Average Impacts of Natural Disasters for Three Periods
Impacts 2000–03 1999–2003a 1993–97
Deaths 109 142 196
Number of people affected (thousands) 363 533 372
Houses affected (thousands) 15 18 22
Source: Larsen 2004b.
a. The period does not include the Armenia earthquake.
Table 5.34 Number of People and Units Affected by Natural Disasters
Impacts 2003 2002 2001 2000 1999a
Deaths 122 142 74 96 276
Injured persons 420 39 379 111 351
Missing persons 18 52 28 15 60
Number of people affected 436,000 343,000 205,000 468,000 1,214,000
Families affected 88,000 67,000 40,000 94,000 240,000
Houses destroyed 2,100 1,300 1,600 2,500 5,500
Houses damaged 16,800 10,200 14,500 10,900 26,200
Roads damaged 31 83 66 135 375
Bridges damaged 8 13 14 61 123
Pedestrian overpasses and
bridges damaged 10 22 20 57 126
Water supply systems affected 6 119 21 91 136
Sewerage systems affected 1 1 1 5 30
Health centers affected 6 8 8 11 7
Schools and education centers affected 45 65 64 76 89
Community centers affected 31 62 40 31 62
Source: From the disaster database at Department for Disaster Prevention and Response, Ministry of Interior
and Justice.
a. Data for 1999 do not include the Armenia earthquake.
Table 5.36 Disaster Impacts by Type of Disaster, 1999–2003
(percent)
People Houses
Event Killed Injured Affected Destroyed Damaged
Landslides 18 6 3 6 5
Floods 8 3 71 21 35
Storms 0 5 7 5 25
Droughts 0 0 3 0 0
Fires/(buildings) 1 2 0 8 0
Fires/(forest) 0 0 1 0 0
Avalanches 3 1 1 4 2
Earthquakes 64 77 13 56 32
Contamination 0 4 0 0 0
Other 6 2 1 0 1
Total 100 100 100 100 100
Source: Larsen 2004b.
Note: The data include the Armenia earthquake.

Table 5.37 presents the total number of people affected by naturaldisasters in each department, reflecting an annual average for 1997–2003.The Armenia earthquake is not included to provide a perspective on thegeographic distribution of frequently or annually occurring disasters.
146 Larsen, Sánchez-Triana, and Awe
Table 5.37 Annual Average Number of People Affected, 1997–2003
People affected
Percentage of Percentage of
Department Number national total department population
Chocó 63,523 14 15
Bolívar 52,619 12 3
Cesar 42,494 10 4
Magdalena 36,393 8 3
Antioquía 29,031 7 1
Sucre 26,459 6 3
Córdoba 20,289 5 2
Nariño 19,563 4 1
Boyacá 14,327 3 1
Atlántico 13,830 3 1
Santander 13,135 3 1
Cauca 12,331 3 1
Valle del Cauca 11,196 3 0
Tolima 8,823 2 1
Huila 7,974 2 1
Amazonas 7,711 2 10
Putumayo 7,194 2 2
Risaralda 6,743 2 1
Arauca 6,158 1 2
Meta 6,125 1 1
La Guajira 4,820 1 1
Quindío 4,800 1 1
Norte de Santander 4,278 1 0
Caquetá 4,264 1 1
Cundinamarca 3,306 1 0
Caldas 3,237 1 0
Casanare 3,084 1 1
Guaviare 2,426 1 2
Guainía 2,324 1 6
Vichada 1,124 0 1
Vaupés 109 0 0
San Andrés y Prov. 19 0 0
All Colombia 439,709 100 1
Source: Larsen 2004b.
Note: The data do not include the Armenia earthquake.

About 62 percent of all people affected are concentrated in sevendepartments in the northern and northeast Pacific parts of Colombia,where only 29 percent of the population lives. In these departments, anaverage of 4 percent of the population is affected annually by disasters,in contrast to well below 1 percent in the rest of the country. As muchas 15 percent of the population was affected annually in Chocó.
There are no systematic and comprehensive estimates of the cost ofdamages from natural disasters, with the exception of the Armeniaearthquake in 1999. According to the Economic Commission for LatinAmerica and the Caribbean (Comisión Económica para América Latinay el Caribe, CEPAL), the earthquake inflicted a cost of Col$2,800 billion(US$1.8 billion at the 1999 exchange rate), of which more than 70 per-cent was housing and building damages.27
In this report, the cost categories presented by CEPAL have beenadapted and applied to provide an order of magnitude of the annual costof natural disasters.28 The cost of annually occurring disasters is based onannual averages for 1999–2003. This period was selected because moredetailed and comprehensive data were available from the Department forDisaster Prevention and Response at the Ministry of Interior and Justice.
The total estimated annual cost of natural disasters is presented intable 5.38. The cost of frequently or annually occurring disasters ispresented in table 5.40.The highest cost is associated with damages to
Setting Environmental Priorities: Top Down and Bottom Up 147
Table 5.38 Estimated Annual Cost of Natural Disasters (Except Major Earthquakes)
Estimated annual cost
(billion pesos)
Impacts Low High
Deaths 25 35
Injured persons 4 5
Missing persons 6 10
Houses destroyed 85 85
Houses damaged 265 265
Lost and damaged furniture, equipment, and other
losses per house 150 150
Roads and bridges damaged 180 360
Water supply and sewerage systems affected 55 105
Health centers affected 55 110
Schools, education centers, and community centers affected 60 120
Total cost 885 1,245
Source: Larsen 2004b.
Note: US$1 = Col$2,150.

housing, infrastructure, and public buildings. A range has been usedfor infrastructure and public buildings because of uncertainties of theexact cost of damages. Table 5.39 presents the estimated annualizedcost of major earthquakes. The cost estimates are based on the costsof the Armenia earthquake. The frequency of such an earthquake ishighly uncertain. A 5- to 10-year frequency range was applied in thisreport, and the total cost of a major earthquake is annualized. The lowestimate represents a frequency of 10 years, and the high estimate afrequency of 5 years. In total, the annual cost of frequently occurringdisasters and major earthquakes is estimated at Col$1,330 billion toCol$2,175 billion (US$619 million to US$1 billion).
Unit costs of disaster impacts are presented in table 5.40. These esti-mates are derived from the cost estimates of the Armenia earthquakepresented by the National Planning Department (Echeverry 2002), as dis-cussed earlier. However, it should be recognized that there is uncertaintyabout the accuracy of applying these unit costs to disasters such as floods,storms, and landslides. An improvement in the estimates would require acomprehensive assessment of the cost of damages across Colombia.
148 Larsen, Sánchez-Triana, and Awe
Table 5.39 Estimated Annual Cost of Major Earthquakes
Estimated annual cost
(billion pesos)
Impacts Low High
Deaths 20 60
Injured persons 10 35
Missing persons 12 33
Houses destroyed 70 140
Houses damaged 45 85
Public buildings damaged or destroyed 115 230
Lost and damaged furniture, equipment, and
other losses per house 50 100
Other losses related to housing and buildings 15 30
Roads and bridges damaged 10 20
Water supply and sewerage systems affected 5 10
Health centers affected 10 20
Schools, education centers, and community centers affected 30 60
Energy sector 5 10
Commerce, industry, and services 45 90
Miscellaneous 3 7
Total cost 445 930
Source: Larsen 2004b.
Note: US$1 = Col$2,150.

Perceptions of the Priority of Environmental Problems
To determine priority environmental concerns from the perspective ofspecific groups of stakeholders and the population in general, a survey wasadministered in 2004 to a random sample representative of Colombiansociety (including more than 2,600 citizens from the public and privatesectors, industry, academia, and civil society). The aim of the survey wasto gather data on priority environmental concerns in Colombia. TheCompañia Nacional de Consultoría administered the survey door-to-door to a random sample of 616 citizens representing the generalpublic. In addition, 2,024 individuals were interviewed, representingthe following stakeholder groups: populations living in high-risk areas,central and local government officials, environmental agency officials,environmental nongovernmental organizations, manufacturing industryexecutives, agricultural workers, livestock workers, academia, civil society,energy sector executives, water utility and water company officials, andexecutives of transportation businesses.
In the survey, respondents were asked to rank the environmental prob-lems they considered most serious for themselves and their families, inaddition to how well the government at both the national and the locallevels was addressing these problems. The environmental problemsranked included air quality both inside and outside the home, water qual-ity in the home, trash collection, sanitation services, natural disasters, lackof green areas and parks surrounding the home, neighborhood road quality,traffic accidents, and land degradation. Those surveyed were also asked torank broader environmental problems affecting their communities and thecountry, such as air pollution, loss of global resources (for example, bio-diversity loss and global warming), and deforestation. Environmental
Setting Environmental Priorities: Top Down and Bottom Up 149
Table 5.40 Unit Costs Applied to Frequently Occurring Disasters
Estimated unit cost in 2003
Impacts (million pesos)
Destruction of houses 33
Damages to houses 17
Lost/damaged furniture, equipment, and other losses per house 8
Roads and bridges damaged 1,990
Water supply and sewerage systems affected 1,300
Health centers affected 13,650
Schools, education centers, and community centers affected 1,065
Source: Larsen 2004b.
Note: US$1 = Col$2,150.

health priorities were also examined by asking respondents if there werechildren in their households, what types of illnesses the children sufferedmost from, their hygiene habits, what type of cooking fuel was used in thehome, if their homes were ventilated during cooking, and if the waterused for cooking was treated before consumption. To evaluate differencesin priorities among the country’s income groups, the survey also askedrespondents to identify their income-level range.
The survey results reflect the Colombian population’s great concernregarding the country’s environmental problems, which affect the poormost directly. The population perceived air pollution (79 percent) as themost serious environmental concern for the country. However, as shownin table 5.41, the results revealed significant differences among incomegroups: whereas low-income groups identify air pollution, noise pollu-tion, and vulnerability to natural disasters as major problems, upper-income groups perceive the loss of global environmental resources andinappropriate land use in urban areas as principal problems. Poor incomegroups tended to link national environmental concerns to their immedi-ate surroundings, indicating a direct relationship between poverty andenvironmental degradation.
With respect to the environmental problems perceived as affecting therespondents personally, the following were viewed as the most serious:lack of parks and public green spaces, poor ambient air quality, noisepollution, insufficient trash collection, neighborhood safety, and poorsanitation services. Among the general population, higher-income groupsconsidered safety and lack of public green spaces as the greatest priorities,whereas middle-income groups perceived safety, ambient air quality,noise pollution, and lack of green spaces and parks among the greatest
150 Larsen, Sánchez-Triana, and Awe
Table 5.41 Environmental Concerns
Perceived as major concern
Environmental problem (% respondents)
Low-income groups
Air pollution 74
Natural disasters 64
Noise pollution 64
High-income groups
Poor management of global resources 78
Biodiversity loss 75
Poor land management 64
Source: Centro Nacional de Consultoría 2004.

environmental priorities for themselves and their families. Lower-incomegroups indicated the same environmental concerns as middle-incomegroups with one exception—they also noted indoor air pollution as a per-sonal environmental concern.
National environmental priorities also varied among stakeholdergroups. In addition to being the top priority for the general population,air pollution was also a key environmental concern among four stake-holder groups—the manufacturing industry, energy firms, transportationfirms, and trade agencies. For three of the stakeholder groups, poor man-agement of global environmental resources and deforestation wereconsistent priorities.
Finally, respondents were asked to rank the following environmentalissues in order of importance for both the country and their household:environmental health; global environmental problems; biodiversity con-servation; and environmental quality of water, air, and other naturalresources. Of these issues, 53 percent of the general population perceivedenvironmental health to be the top priority for the country, with globalenvironmental problems a distant second (22 percent), environmentalquality third (18 percent), and biodiversity conservation fourth (7 percent).However, figures 5.16 and 5.17 indicate that these priorities variedsignificantly between the lowest and highest income segments of thepopulation. Environmental health was a key concern for low-incomesegments, particularly in relation to these respondents’ own households.
Survey responses regarding household conditions also reflected environ-mental health as an important priority for poorer families, although only51 percent of those in the lowest income group reported washing their
Setting Environmental Priorities: Top Down and Bottom Up 151
Figure 5.16 Top Priorities for Colombia According to Lowest and Highest Income Groups
0
10
20
30
40
50
60
environmental health
per
cen
t
global problems environmental quality
lowest income group
highest income group
Source: Centro Nacional de Consultoría 2004.

hands at critical times (for example, before preparing and eating dinner)compared to 100 percent in the highest income group, making the poorersegments more vulnerable to hygiene-related illnesses. Similarly, only thelowest income groups (17 percent of those surveyed in this low-incomesegment) relied on traditional fuels, such as fuelwood, for cooking andheating in their homes, whereas the higher income groups used natural gas (51 percent) and propane (49 percent). Because burning traditional fuelsproduces large amounts of smoke and other air pollutants in confinedspaces of the home, it poses a dangerous health risk to this segment of thepopulation. Also consistent with these environmental health responses wasthe survey finding that only the poorest income segments, with childrenunder age 5, reported that their children were frequently sick.
Conclusions
The mean estimated annual costs of environmental damage for five cate-gories—water, sanitation, and hygiene; urban air pollution; indoor airpollution; agricultural land degradation; and natural disasters—amountsto more than 3.7 percent of GDP per year.The highest-cost categories areinsufficient water supply and outdoor and indoor pollution, followed bynatural disasters and agricultural land degradation.
In urban areas, the cost of air pollution is significantly higher than forinadequate water, sanitation, and hygiene in contrast to the national esti-mate. In rural areas, the cost of land degradation (not including pasture)
152 Larsen, Sánchez-Triana, and Awe
Figure 5.17 Top Priorities for Households According to Lowest and Highest Income
Groups
0
10
20
30
40
50
60
70
80
environmental health global problems environmental quality
lowest income group
highest income group
per
cen
t
Source: Centro Nacional de Consultoría 2004.

is estimated at more than twice as high as the cost of insufficient water,sanitation, and hygiene. Moreover, in contrast to the national estimate,the cost of indoor air pollution in rural areas is almost as high as for inade-quate water, sanitation, and hygiene.
Results from a survey of priority environmental problems reflect thaturban air pollution (79 percent) is perceived as the most serious environ-mental concern for the country. Survey results revealed significant differ-ences between income groups: whereas low-income groups identify airpollution, noise pollution, and vulnerability to natural disasters as majorproblems, upper-income groups perceive the loss of global environmentalresources and inappropriate land use in urban areas as principal problems.Poor income groups tended to link national environmental concerns totheir immediate surroundings, indicating a direct relationship betweenpoverty and environmental degradation.
Notes
1. Bjorn Larsen, Ernesto Sánchez-Triana, and Yewande Awe authored this chapter,which draws heavily from a background document prepared by Larsen (2004b)for the Ministry of Environment, Housing and Regional Development.
2. Costs of deforestation and water pollution are only partially and indirectlyestimated because of data limitations. Some of the cost of deforestation is cap-tured in the cost of natural disasters (flooding and landslides) and agriculturalland degradation insofar as deforestation contributes to natural disasters andsoil erosion. Other costs of deforestation, such as impacts on water resourcesand recreational value, are not estimated. The cost of water pollution is cap-tured only in terms of waterborne illnesses (diarrheal illness). Other costs,such as potential impacts on health from heavy metals and chemicals, and onrecreational value, are not estimated.
3. In addition to these categories, Larsen (2004b) estimated the cost of roadaccidents as Col$2.8 billion (US$1.3 million), equivalent to 1.5 percentof GDP.
4. Rural cost of inadequate water supply, sanitation, and hygiene is based onrural-urban population share and rural-urban diarrheal incidence. No adjust-ments are made to land degradation and indoor air pollution costs, becausethese are already rural costs.
5. Official death records represent a significant understatement of actual deathsin most developing countries because of underreporting by households.DANE therefore publishes estimated mortality in addition to official records.
6. The database is not complete because not all health facilities have reporteddiarrhea-related illnesses to the public health authorities.
Setting Environmental Priorities: Top Down and Bottom Up 153

7. The DALY is a standard metric of the burden of disease that combines lifeyears lost as a result of illness and disability, with one DALY being equal tothe loss of one healthy life year (Murray and López 1996).
8. Some researchers elect not to use age weighting, or report DALYs with andwithout age weighting.
9. This corresponds to a daily national average wage rate of about Col$22,000to Col$23,000 (US$10.23 to US$10.70).
10. Some may argue that the value of time based on wage rates should be adjustedby the unemployment rate to reflect the probability of obtaining paid work.
11. The cost of time losses for children under age 5 is assumed to be zero.
12. To calculate population-weighted PM10 levels, each city or metropolitan areawas partitioned into four zones (residential, industrial, downtown, and com-mercial areas). PM10 concentrations from monitoring stations in each zonewere then weighted by the zone’s population share to obtain population-weighted PM10 levels.
13. Some may argue that the value of time based on wage rates should be adjustedby the unemployment rate to reflect the probability of obtaining paid work.
14. Although Smith (2000) presents odds ratios for lung cancer, that effect of pol-lution is not estimated in this report because the incidence of lung canceramong rural women is generally very low. The number of cases in ruralColombia associated with indoor air pollution is therefore likely to be minimal.
15. The database is not complete because not all health facilities have reportedARI to the public health authorities.
16. Official death records represent a significant understatement of actual deathsin most developing countries because of underreporting by households.DANE, therefore, publishes estimated mortality in addition to official records.
17. Some researchers elect not to use age weighting, or report DALYs with andwithout age weighting.
18. See http://www.fic.nih.gov/.
19. The cost of morbidity is based on the mean estimated annual cost.
20. These costs do not include the valuation of DALYs.
21. This corresponds to a daily rural wage rate of Col$16,000 (US$7.60). In contrast,average wages in major cities in Colombia are around Col$25,000 (US$11.60).
22. Some may argue that the value of time based on wage rates should be adjustedby the unemployment rate to reflect the probability of obtaining paid work.
23. The irrigation variable may be too outdated to reflect currently irrigated areas.
24. Equation (5.3) was also estimated using the weighted yield index.The erosionand salinity coefficients were quite similar to the estimates in table 5.31, butR2 was lower.
154 Larsen, Sánchez-Triana, and Awe

25. Equation (5.3) was estimated in levels. Log and semi-log forms provided verypoor results.
26. Salinity measurements are available for the Cauca Valley, but the total lossesare not very large because of relatively low average levels.
27. A presentation by Juan Carlos Echeverry (formerly at the National PlanningDepartment) provides a summary of these estimates.
28. Figures have also been adjusted for inflation to 2003.
References
Allen, Richard, Luis Pereira, Dirk Raes, and Martin Smith. 1998. CropEvapotranspiration: Guidelines for Computing Crop Water Requirements. FAOIrrigation and Drainage Paper 56. Rome: FAO.
Baquero Haeberlin, Irma. 2003. “Cuentas Ambientales del Suelo.” Draft paper,Corpoica, Tibaitata, Colombia.
CNC (Centro Nacional de Consultoría). 2004. “Encuesta de Percepción dePrioridades Ambientales. Final Report.” Consulting contract with World Bank,Bogotá.
Cropper, Maureen, and Wallace Oates. 1992. “Environmental Economics: ASurvey.” Journal of Economic Literature 30 (2): 675–740.
Curtis, Val. 2002. “Talking Dirty: How to Save a Million Lives without MentioningHealth.” Presentation at the 2nd IFH Conference “Home Hygiene and thePrevention of Infectious Disease in Developing Countries:A Responsibility forAll.” India Habitat Centre, New Delhi, India, April 15–16.
CVC (Corporación Autónomo Regional del Valle del Cauca). 2002. “ÁreasAfectadas por salinización del Suelo en el Departamento del Valle delCauca.” Internal working paper of the Patrimony Subdirection, CVC, Cali.
DANE (National Statistical Administration Department). 2002. “PopulationProjections Based on the 1993 Census.” DANE, Bogotá.
———. 2003. “Encuesta de Calidad de Vida.” DANE, Bogotá.
DeHayr, Rob, Nicole Diatloff, and Ian Gordon. 1997. “Irrigation Water Quality:Salinity and Soil Structure Stability.” NRM Facts, Department of NaturalResources and Mines, Queensland, Australia.
Dennis, R., D. Maldonado, S. Norman, E. Baena, H. Castana, G. Martinez, andJ. R. Velez. 1996. “Woodsmoke Exposure and Risk for Obstructive AirwayDisease Among Women.” Chest 109: 115–9.
DHS (Demographic and Health Survey). 2000. Encuesta Nacional de Hogares.Bogotá: Departamento Administrativo Nacional de Estadísticas.
Echeverry, J. Prevención y Atención de Desastres en Colombia. 2002. Bogotá:Departamento Nacional de Planeación.
Setting Environmental Priorities: Top Down and Bottom Up 155

Esrey, Steven A., and Jean-Pierre Habicht. 1988. “Maternal Literacy Modifies theEffect of Toilets and Piped Water on Infant Survival in Malaysia.” AmericanJournal of Epidemiology 127 (5): 1079–87.
Esrey, Steven A., J. B. Potash, L. Roberts, and C. Shiff. 1991. “Effects of ImprovedWater Supply and Sanitation on Ascariasis, Diarrhoea, Dracunculiasis,Hookworm Infection, Schistosomiasis, and Trachoma.” World HealthOrganization Bulletin 69 (5): 609–21.
Heath, John, and Hans Binswanger. 1998. “Policy-Induced Effects of NaturalResource Degradation: The Case of Colombia.” In Agriculture and theEnvironment—Perspectives on Sustainable Rural Development, ed. E. Lutz.Washington, DC: World Bank.
IDEAM (Institute of Hydrology, Meteorology and Environmental Studies) 2004.Annual Report on the State of the Environment and Natural RenewableResources in Colombia. Bogotá: IDEAM.
Insituto Nacional de Salud. 2004. Morbidity in Colombia. Mimeo. INS. Bogotá.
Kotuby-Amacher, Jan, Rich Koenig, and Boyd Kitchen. 1997. “Salinity and PlantTolerance.” Utah State University.
Krupnick, Alan J. 2005 “Focus on Particulates More Than Smog.” In NewApproaches on Energy and the Environment: Policy Advice for the President, ed.Richard D. Morgenstern and Paul R. Portney. Washington, DC: RFF Press.
Larsen, Bjorn. 2003. “Hygiene and Health in Developing Countries: DefiningPriorities through Cost-Benefit Assessments.” International Journal ofEnvironmental Health Research 13: S37–S46.
———. 2004a. “Cost of Environmental Degradation: A Socio-Economic andEnvironmental Health Assessment in Damietta, Egypt.” Consultant ReportPrepared for SEAM II, Cairo.———. 2004b. “Cost of Environmental Damage: A Socio-Economic and
Environmental Health Risk Assessment.” Consultant Report prepared for theMinistry of Environment, Housing and Regional Development, Colombia.
———. 2005.
METAP (Mediterranean Environmental Technical Assistance Program). 2000. “Costof Environmental Degradation Jordan.” Available at http://www.metap.org.
Ministère de l’Aménagement du Territoire et de l’Environnement. 2002. PlanNacional d’Actions pour l’Environnement et le Développement Durable.Algeria.
Murray, Christopher J. L., and Alan D. López. 1996. Global Burden of Disease.Cambridge, MA: Harvard University Press.
Niederman, Michael S., J. S. McCombs, A. N. Unger, Aparna Kumar, andR. Popovian. 1999. “Treatment Cost of Acute Exacerbations of ChronicBronchitis.” Clinical Therapy 21 (3): 576–91.
156 Larsen, Sánchez-Triana, and Awe

Ostro, Bart. 1994. “Estimating the Health Effects of Air Pollution: A Method withan Application to Jakarta.” Policy Research Working Paper No. 1301, WorldBank, Washington, DC.
Pope, C. Arden III, Richard T. Burnett, Michael J. Thun, Eugenia E. Calle, DanielKrewski, Kazuhiko Ito, and George D. Thurston. 2002. “Lung Cancer,Cardiopulmonary Mortality, and Long-Term Exposure to Fine Particulate AirPollution.” Journal of the American Medical Association 287: 1132–41.
Rutstein, Shea O. 2000. “Factors Associated with Trends in Infant and ChildMortality in Developing Countries during the 1990s.” Bulletin of the WorldHealth Organization 78 (10): 1256–70.
Sarraf, Maria, K. Bolt, and Bjorn Larsen. 2004. “Syrian Arab Republic, CostAssessment of Environmental Degradation.” World Bank and METAP, WorldBank Report, Washington, DC.
Sarraf, Maria, Bjorn Larsen, and Marwan Owaygen. 2004. “Costs of EnvironmentalDegradation: The Case of Lebanon and Tunisia.” Environmental EconomicSeries Paper No. 97, World Bank, Washington, DC.
Schulman, Ronca, and Bucuvalas Inc. 2001. “Confronting COPD in NorthAmerica and Europe: A Survey of Patients and Doctors in Eight Countries.”New York.
Shi, Aqing. 1999. “The Impact of Access to Urban Potable Water and SewerageConnection on Child Mortality: City Level Evidence, 1993.” Economists’Forum, Vol. 1, World Bank.
Shibuya, Kenji, Colin Mathers, and Alan López. 2001. Chronic Obstructive PulmonaryDisease (COPD): Consistent Estimates of Incidence, Prevalence, and Mortality byWHO Region. Global Programme on Evidence for Health Policy. Geneva:WorldHealth Organization.
Smith, Kirk. 2000. “National Burden of Disease in India from Indoor AirPollution.” Proceedings of the National Academy of Sciences of the United States97 (24): 13286–93.
WHO (World Health Organization). 2001. Global Burden of Disease 2001.Geneva: WHO.
———. 2002. The World Health Report 2002. Geneva: WHO.
World Bank. 1996. Review of Colombia’s Agriculture and Rural DevelopmentStrategy. Washington, DC: World Bank.
———. 2002. “Egypt Cost Assessment of Environmental Degradation.” ReportNo. 25175-EGT, World Bank, Washington, DC.
———. 2003. World Development Indicators 2003. Washington, DC: World Bank.
Setting Environmental Priorities: Top Down and Bottom Up 157

158 Larsen, Sánchez-Triana, and Awe
Annex 5.1

159
Waterborne bacterial diseases pose one of the highest costs of environmentaldegradation to Colombia, particularly with respect to child morbidity and mor-tality. Diarrhea, which accounts for approximately 7.3 percent of child mortality,is the most common and widespread waterborne disease and most prevalent inrural zones populated by the poorest segments of the population. AlthoughColombia has promoted increased water supply coverage over the past 10 years,with investments in water supply and sewerage valued at about 1 percent ofgross domestic product, these efforts only provide a partial response to reducingthe incidence of disease. A recent meta-analysis of water, sanitation, and hygieneinterventions highlights the importance of incorporating hygiene interventions—which can reduce diarrheal illness by up to 45 percent—into programs forreducing waterborne diseases. To address regulatory gaps pertaining to environ-mental impact assessments and wastewater discharge tariffs, which constrainthe provision of water supply and sanitation, it would be advisable to amendthe country’s regulatory framework to promote private sector investment.
One of the largest costs of environmental degradation in Colombia isassociated with morbidity and mortality from waterborne bacterial dis-eases.1 Waterborne bacteria are transmitted by means of contaminatedsurface water sources and large, poorly functioning water distributionsystems, resulting in a range of syndromes including cholera, typhoid
C H A P T E R 6
Waterborne Diseases Remain
Widespread

160 Larsen and Sánchez-Triana
fever, dysentery, and chronic diarrhea (lasting more than two weeks).While diarrheal illness is generally not as serious as some other water-borne illnesses, it is more common and affects more people.2
In Colombia, approximately 7.3 percent of child mortality is attrib-uted to diarrheal illness (1,450 to 1,820 deaths per year) according tothe Colombia National Administrative Department of Statistics(Departamento Administrativo Nacional de Estadísticas, DANE).3 Two-week diarrheal prevalence in children under age 5 is 2.9 percent.Approximately 90 percent of diarrheal cases and hospitalizations can beattributed to water, sanitation, and hygiene. Diarrheal illness is mostprevalent in rural zones populated by the poorest segments of the pop-ulation (for example, those living in the departments of Chocó, Cauca,Valle del Cauca, and Nariño). See table 6.1.
Diarrheal morbidity is more difficult to quantify than diarrheal mor-tality. Many diarrhea cases are not treated or do not require treatment athealth facilities, and therefore are not recorded. In addition, cases treatedby private doctors or clinics are usually not reported to public healthauthorities. Therefore, household surveys often provide the most reliableindicator of total cases of diarrheal illness. Most household surveys, how-ever, include information on diarrheal illness in children only, and reflectdiarrheal prevalence at the time of the survey. Because diarrheal preva-lence often varies across seasons of the year, extrapolating survey data to
Table 6.1 Diarrhea in Children under Age 5
Percentage of children under age 5 with
Department diarrhea in the preceding two weeks
Cali 10.8
Bogotá 10.9
Bolívar, Sucre, Córdoba 11.3
Altántico, Bolívar Norte 11.6
La Guajira, Cesar, Magdalena 11.9
Valle del Caucá 12.5
Tolima, Huila, Caquetá 13.5
Boyacá, Cundinamarca, Meta 14.9
Santanderes 15.2
Medellín 15.8
Antioquía 16.2
Caldas, Risaraldo, Quindío 17.6
Cauca, Nariño 18.8
Chocó 22.0
Source: DHS 2000.

create an annual average will result in either an over- or underestimateof total annual cases.
From a global perspective, lack of access to safe water continues toexert a significant burden on the health of millions of people, particularlyvulnerable groups. According to the World Health Organization (WHO)(2002a), approximately 3.1 percent of deaths (1.7 million people) and3.7 percent of disability-adjusted life years (DALYs)4 (54.2 million)worldwide are attributable to unsafe water, sanitation, and hygiene. Fully99.8 percent of deaths associated with this risk factor are in developingcountries, and 90 percent are deaths of children. In Colombia, the pro-portion of DALYs attributable to unsafe water ranges between 1.0 percentand 1.9 percent, similar to that of the rest of Latin America, with theexception of Bolivia, Ecuador, Guatemala, Peru, and Nicaragua wherethe proportion is higher (figure 6.1).
Assessment of Policy Design, Efficiency, and Effectiveness
One intervention to prevent waterborne diseases that the government ofColombia has fostered since the early 1990s aims at increasing access todrinking water and sanitation. Although the current program to increasewater and sanitation coverage will help reduce the incidence of waterbornediseases in Colombia and benefit the poorest segments within the country,it provides only a partial response to the problem of waterborne disease.
According to a meta-analysis of water, sanitation, and hygiene inter-ventions on diarrheal illness, improvements in water supply and sanita-tion provide a 30 percent expected reduction in diarrheal disease(Fewtrell and Colford 2004). In addition, this analysis indicates thatalthough multiple interventions consisting of water supply, sanitationprovision, and hygiene education reduce diarrheal illness, they are notmore effective than individual interventions (table 6.2). The reasons forthis are not clear. Furthermore, these results highlight the importance ofdetermining which package of measures combining all the main inter-vention areas will maximize health benefits to each community. Theyalso highlight the importance of incorporating hygiene interventions inprograms aimed at reducing waterborne diseases. Thus, for a strategy totarget waterborne diseases comprehensively, it should support hygieneimprovements, which significantly contribute to reducing diarrheal dis-ease, as shown later.
The main results of the 2004 study by Fewtrell and Colford are pre-sented in table 6.2 for developing countries. The relative risk ratio
Waterborne Diseases Remain Widespread 161
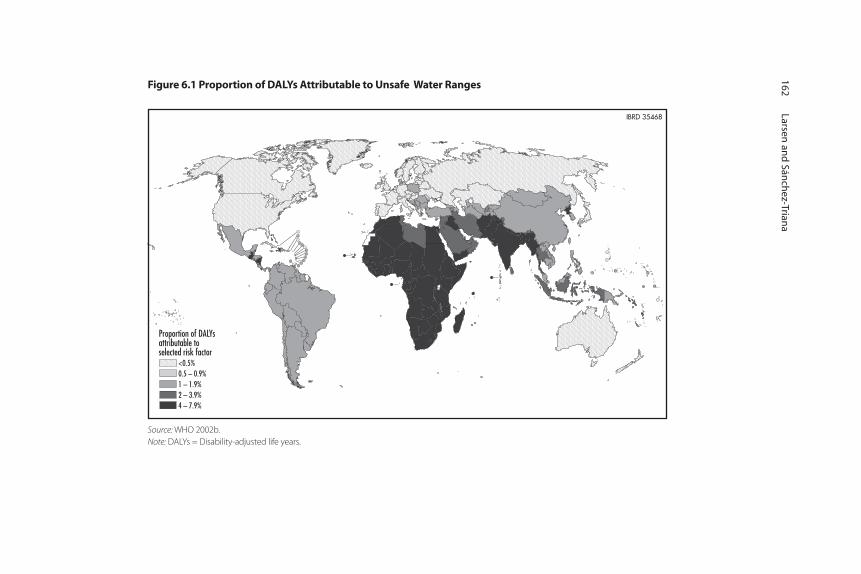
162Larsen
and
Sánch
ez-Triana
Source: WHO 2002b.
Note: DALYs = Disability-adjusted life years.
Figure 6.1 Proportion of DALYs Attributable to Unsafe Water Ranges

expresses the risk of diarrheal illness occurring as a health outcomein an intervention situation in relation to a nonintervention situation.The percentage reduction in diarrheal illness from intervention is therefore1.0 minus relative risk. The relative risk ratio for handwashing interven-tion in table 6.2 is very similar to the results from other related studies(Curtis and Cairncross 2003; Esrey and others 1991).
The most effective hygiene intervention is handwashing after defecation,before preparing meals, and before eating. Improved sanitation consists offacilities for safe and hygienic removal of excreta, such as flush toilets;pour-flush latrines; ventilated, improved pit latrines; and simple pitlatrines. Unimproved sanitation refers to open pit latrines, public latrines,service or bucket latrines, and the absence of any facilities. Improvedwater supply refers to house connection, standpipes, boreholes, protectedwells or springs, and collected rainwater. Unimproved water supplyincludes unprotected wells or springs, open-surface water and rivers, andwater provided by vendors or tanker trucks. With regard to water qualityimprovement, the studies reviewed by Fewtrell and Colford (2004) thatassessed reduction in diarrheal illness from source water treatment arenot conclusive. The pooled study results suggest a mean reduction indiarrheal incidence of 10 percent, but with no statistical significance. Incontrast, point-of-use drinking water treatment (that is, householddrinking water treatment) appears very effective in reducing diarrhealillness. Point-of-use treatment includes both nonchemical (for example,boiling of water) and chemical (for example, chlorination) treatment andappears to be most effective in rural areas.
Water Supply and Sanitation ProgramsChild mortality is clearly lower in departments with high water networkcoverage, high literacy rates, and high urban population share. Figure 6.2
Waterborne Diseases Remain Widespread 163
Table 6.2 Summary of Meta-Analysis by Fewtrell and Colford (2004)
Intervention Relative risk Confidence interval (95%)
Hygiene (hand washing) 0.556 0.334–0.925
Sanitation 0.678 0.529–0.868
Water supply 0.749 0.618–0.907
Water quality (source) 0.891 0.418–1.899
Water quality (point of use, rural) 0.534 0.392–0.727
Water quality (point of use, urban) 0.771 0.725–0.819
Water quality (point of use, chemical) 0.605 0.443–0.828
Water quality (point of use, nonchemical) 0.534 0.379–0.752
Source: Summarized from Table 22 in Fewtrell and Colford (2004).

presents child mortality rates in relation to rates of water supply networkcoverage by department.
Because the main actions undertaken by the government of Colombiato prevent waterborne diseases are aimed at increasing access to drinkingwater and sanitation, the remainder of this section discusses the watersupply and sanitation program that the government is currently imple-menting. Rural water supply and sewerage coverage is especially poor(52 percent and 15 percent, respectively, when restricting the definitionof coverage to household water and sewerage connections only), and athistoric levels of effort in service expansion, universal access goals (takinginto account demographic growth) would not be reached for another 30 years (World Bank 2004). Figure 6.3 shows a correlation betweenchild mortality and urban population share by department.
The government estimates that, in addition to current investmentsin water supply and sanitation valued at 1 percent of gross domesticproduct (GDP), US$1.2 billion is needed to meet the MillenniumDevelopment Goals of regional and urban-rural service coverage over thenext five years, and a further US$1.0 billion to address investments inmaintenance and rehabilitation of the networks and expansion of sew-erage systems and wastewater treatment. Affordability issues and defi-ciencies in the design and functionality of the current system of fiscal
164 Larsen and Sánchez-Triana
0
10
20
30
40
50
60
70
80
90
100
0 20 40 60 80 100child (under age 5) mortality rate
% o
f p
op
ula
tio
n w
ith
wat
er n
etw
ork
Source: Child mortality rate is from DANE. Water network coverage is from the Ministry of Environment, Housing
and Regional Development.
Figure 6.2 Child Mortality and Water Network Coverage, by Department, 2002

transfers from the national government to municipalities make such achallenge daunting. Although recent reforms in allocation of fiscaltransfers to support the sector through Law 715 would theoreticallyensure sector financial sustainability in the medium term, the currentpolitical and social climate and the relatively recent nature of thesereforms mean that the benefits of these changes will take some timeto materialize.
Since 2001, the government has been implementing a Water Supplyand Sanitation Reform program whose objectives include expanding thecoverage of water and sewerage services in participating municipalities,and facilitating the access of populations in low-income areas of partici-pating municipalities to water and sewerage services.5 The programattempts to overcome service deficiencies, characterized by insufficientpotable water and sanitation coverage, rationing and intermittent watersupply, noncompliance with water quality standards by most utilities,and inadequate sewerage facilities in poor areas. In rural areas, historicrates of coverage expansion are extremely low compared with require-ments to meet universal access. To achieve universal access within the2010–20 window, the average annual rate of coverage expansion in ruralareas would need to increase by 50 percent for rural water and 100 per-cent for sanitation.
Waterborne Diseases Remain Widespread 165
0
10
20
30
40
50
60
70
80
90
100
0 20 40 60 80 100child (under age 5) mortality rate per 1,000
urb
an p
op
ula
tio
n s
har
e (%
)
Source: Based on data from DANE.
Figure 6.3 Child Mortality and Urbanization, by Department, 2002

To meet urgent investment needs and ensure achievement of theMillennium Development Goals, the government is aiming to consolidatethe reforms undertaken to date and to ensure financial sustainability inthe medium term. The government’s medium-term strategy to improveaccess and the quality of services has three key elements:
• A major investment program with clear and transparent subsidies. Inaccordance with its 2002–06 National Development Plan, the govern-ment has identified a medium-term investment program to expandcoverage and improve quality of service in urban and rural areas.
• A deepened and broadened approach to improving utility performance.Private sector participation remains at the core of the government’sapproach in large and medium urban centers. The strategy also in-cludes improvements in the financial and technical performance ofpublicly run utilities in areas where private sector participation is notlikely to be adopted in the short term.
• Clear and transparent “rules of the game” for investment. The developmentof a harmonized and publicly disseminated set of procedures for themedium-term program is essential to mitigate the unstable regulatoryframework because legal uncertainties often make private investorsreluctant to enter into business ventures.
Constraints to Water Supply and Sanitation Posed by the Environmental Regulatory FrameworkDespite Colombia’s efforts since the late 1960s to develop a consistentenvironmental regulatory framework, regulatory gaps abound. The existingenvironmental regulatory and legal frameworks do not provide sufficientcomfort to potential private investors, and constitute an obstacle to theefforts to consolidate reforms in the water supply and sanitation sector.Currently, three main regulations pose serious obstacles for water supplyand sanitation coverage expansion: (a) the Environmental ImpactAssessment (EIA) requirements included in the environmental licensessystem; (b) the effluent charge system known as the tasas retributivas;and (c) the wastewater discharge standards regulations established inDecree 1594 of 1983 (World Bank 2001).
Law 99 of 1993 established the EIA system as a requisite for infra-structure works, establishment of industries, and the development of anyeconomic activity with potential significant environmental impacts. Thislaw was further developed in Presidential Decree 1220 of 2005. Theelaboration of an EIA was one of the requirements for the request of an
166 Larsen and Sánchez-Triana

environmental license; EIA regulations became a hurdle for water sup-ply and sanitation projects and added little value to the environmentalplanning and management processes. According to Challa (2003),Libhaber and Foster (2003), and the World Bank (2001), the main prob-lems with EIA regulations include the following:
• Lack of a screening procedure6 meant that an EIA was needed forany project, regardless of the intensity and magnitude of its potentialimpacts, its location, the sensitivity of the surrounding area, or publicopinion regarding the project.
• Absence of standards or guidelines resulted in discretionary applicationof requirements for the preparation and evaluation of environmentalstudies.
• Responsibility for the elaboration of the EIA fell on the project’s pro-ponent, generating conflicts of interest.
• The need for vast numbers of EIAs coupled with an absence of primaryenvironmental data resulted in mass production of EIAs of poor qualityand little value.
• Public participation was limited, and provisions to encourage it werelacking.
• Regulations delineating the procedures for public participation in theEIA process were absent.
• Environmental agencies took advantage of these deficiencies to exer-cise a seemingly boundless authority, which excluded the public fromparticipating in the EIA decision-making process.
In fact, environmental licenses often became pro forma regulations tailoredand applied arbitrarily by the environmental agencies to projects. In certaininstances, environmental agencies imposed obligations, standards, and com-pensation schemes—of their choice—with which the projects wererequired to comply.This highly discretionary application of procedures gen-erated legal uncertainty because project proponents could not adequatelyevaluate the resources and time required to comply with the environmen-tal licensing requirements (Challa 2003; Libhaber and Foster 2003).
Water Pollution ChargesWater pollution charges have been used in Colombia at least since thelate 1970s, when they were introduced in the Code of Natural Resourcesto control water pollution and were established by the Cauca ValleyCorporation. Law 99 of 1993 updated the provisions for the use of similarcharges that were further developed by Decree 901 of 1997, Decree
Waterborne Diseases Remain Widespread 167

3100 of 2003, and Resolution 372 of 1998. Application and enforce-ment of environmental regulations are the responsibility of AutonomousRegional Corporations (Corporaciones Autónomas Regionales, CARs).Thus, on the basis of methodology defined by the decrees and resolution,CARs were required to
• update their discharge registries and define a baseline for discharges oftwo parameters: biochemical oxygen demand (BOD) and total sus-pended solids
• negotiate with stakeholders a five-year discharge reduction goal foreach stretch of watershed
• charge a fee for every kilogram of the selected parameters that regis-tered point sources discharged into superficial waters within the legalstandards
• increase the fee annually until the reduction goal was reached.
According to Challa (2003), Enríquez (2004), Libhaber and Foster(2003), and the World Bank (2001), the design of the water effluentcharge, as described above, posed serious obstacles to private sector partici-pation in water supply and sanitation, principally because of the provisionfor revising environmental goals semiannually. The implication of thisscheme was that water utilities had no way of knowing how the chargewould ultimately affect their finances. Financing and developing waste-water treatment plants and sewer networks in Colombia is an admittedlydifficult task. Considerable evidence suggests that the design and introduc-tion of discharge fees may have aggravated the situation. A study conduct-ed by Colorado State University (2004) reported that municipalities arecurrently reluctant to develop treatment plants or to assume ownership ofexisting plants because the discharge fees associated with such plantswould make their operation nonremunerative. According to this report,“The fee structure for wastewater permits, while meant to be an incentiveto provide treatment, has actually created a disincentive to construct treat-ment facilities or to apply for a permit. . . . [T]he increase in fees every sixmonths . . . has resulted in many municipalities incurring fee debts that areso high, they have no hope of paying them let alone financing water treat-ment facilities” (Colorado State University 2004, p. 78).
Unfortunately, a similar rationale applies to municipalities’ incentivesto build new sewer lines. For Colombia’s many municipalities withoutadequate wastewater treatment facilities, building sewer lines that connectnew pollution sources to the system increases the system’s total pollution
168 Larsen and Sánchez-Triana

load and, therefore, increases total fees charged to the municipality.Thus, the discharge fees act as a financial disincentive to invest in newsewer networks (Blackman and others 2005).
The reasons for the inability of many municipal sewerage authoritiesto pay discharge fees or invest in treatment plants that would reducetheir discharges have generated widely publicized controversies. Theprofessed inability of the municipalities to reduce their waste loads preventsdischargers in water basins from meeting five-year total pollution loadreduction targets established by boards of directors of the CARs, inaccordance with Decree 901 of 1997 and Decree 3100 of 2003.The designof the pollution charge system has led to continual increases in fee rates.Table 6.3 shows the dramatic increase in fee rates mandated by regula-tions for a water basin that fails to comply with its targets for reducingwater pollution loads.
In addition, fees charged to municipal wastewater authorities have ledthem to increase the fees that they charge to their customers.This problemhas been especially severe in smaller cities, where the utilities are unableto spread the new costs over a large number of customers. In 1999, thecosts to customers increased by 31 percent in municipalities with fewerthan 2,500 people, and by 21 percent in municipalities with 2,500 to12,000 people. Because discharge fees have been passed on to the cus-tomers in the form of higher sewerage fees, and these fees do not varysignificantly across income groups within cities, the incidence of discharge
Waterborne Diseases Remain Widespread 169
Table 6.3 Tariff Increases for Failure to Achieve Water Quality Targets
Discharge tariff (pesos/kilogram)
Regional factor a Biochemical oxygen demand Total suspended solids
1.0 (min. tariff ) 74.24 31.75
1.5 111.36 47.62
2.0 148.48 63.50
2.5 185.60 79.37
3.0 222.72 95.25
3.5 259.84 111.12
4.0 296.96 127.00
4.5 334.08 142.87
5.0 371.20 158.75
5.5 408.32 174.62
Source: Blackman and others 2005.
Note: US$1 = Col$2,150.
a. The regional factor for each pollutant in each water body begins at 1.0. The applicable tariff for discharges into
the water body equals the minimum tariff times the regional factor. The regional factor is increased by 0.5 every six
months until reduction targets are met.

fees is in fact regressive, that is, the discharge fees consume a larger portionof the income of poorer customers than of richer ones (Enríquez 2004).Furthermore, according to Enríquez (2004), this undesirable effect hasbeen magnified by recent regulatory changes that reduce subsidies to waterutilities and allow them to charge user fees that enable them to fully recov-er costs. Challa (2003), Enríquez (2004), and Libhaber and Foster (2003),have suggested modifications to Law 99 of 1993, Decree 3100 of 2003, andResolution 372 of 1998 to rectify these problems.
One additional problem stems from the wastewater discharge stan-dards set by Decree 1594 of 1984. As discussed in chapter 11 of thisreport, these standards are designed to address ecological and aestheticbenefits and require 80 percent removal efficiency for BOD and suspendedsolids. These standards created disincentives to promoting investmentsin water supply and sewerage because compliance with them requiredmunicipal investments in secondary wastewater treatment plants thatcould be financed only with increases of over 100 percent in tariffs, whichdid not necessarily generate environmental benefits. Furthermore,Decree 1594 became a bottleneck for private investment in the sectorbecause compliance with it implied extremely high costs. To complicatematters further, this decree is incompatible with the system of watereffluent charge, thus generating uncertainty about the environmentalresponsibilities of water users.
Analysis of Policy Implementation
Despite improvements achieved to date under the 2001 Water Supplyand Sanitation Reform Program, water, sanitation, and sewerage coveragecontinues to face significant challenges. In 2001, approximately 75 percentof the population living in urban areas (31,339,130 inhabitants) hadaccess to sewerage systems, implying that 7,803,000 people lackedaccess (table 6.4). However, rural coverage was much lower (53 percentfor water and 57 percent for sanitation), shrinking to 52 percent and15 percent for water and sanitation, respectively, when the definition isrestricted to household water and sewerage connections.
The increase in coverage rates masks shortcomings in the quality ofservice. Although the overall performance indicators for the 59 largestutilities show reasonable levels of efficiency and service, water rationingand intermittent supplies are common in most water supply systems insmaller municipalities. Only slightly less than 50 percent of all drinkingwater outside the major urban centers is properly treated. As a result, the
170 Larsen and Sánchez-Triana

drinking water quality in many systems is substandard. One of the mainreasons is that almost a third of the smaller municipalities, althoughequipped with water treatment plants, do not make the necessarypurchases of chlorine for water disinfection because of their weak techni-cal capacity and cash flow problems that restrict the availability of resources
Waterborne Diseases Remain Widespread 171
Table 6.4 Urban Sewerage System Coverage, 2001
Number of municipalities by rate of
Number of sewerage system coverage Avg.
Department municipalities <70% 70–80% >80% coverage (%)
Antioquía 125 26 22 77 87.9
Atlántico 23 21 2 0 61.7
Bogotá 1 0 0 1 80.0
Bolívar 45 40 2 3 48.9
Boyacá 123 12 11 100 88.4
Caldas 27 2 2 23 90.6
Caquetá 16 7 3 6 50.7
Cauca 41 17 7 17 81.6
Cesar 25 14 7 4 71.0
Córdoba 28 25 0 3 48.0
Cundinamarca 116 58 8 50 62.1
Chocó 26 25 0 1 20.4
Huila 37 1 9 27 82.2
La Guajira 14 9 2 3 52.5
Magdalena 26 24 1 1 48.1
Meta 29 8 3 18 74.7
Nariño 63 30 12 21 76.5
Norte de Santander 40 6 4 30 78.8
Quindío 12 1 7 4 83.6
Risaralda 14 0 0 14 86.1
Santander 87 10 4 73 89.3
Sucre 24 19 3 2 50.4
Tolima 47 26 4 17 76.3
Valle del Cauca 42 6 1 35 82.3
Arauca 7 6 1 0 50.7
Casanare 19 10 0 9 76.3
Putumayo 13 12 1 0 50.1
San Andrés y Prov. 2 2 0 0 48.9
Amazonas 2 1 1 0 68.7
Guainía 1 1 0 0 25.0
Guaviare 4 2 1 1 57.1
Vaupés 3 3 0 0 35.9
Vichada 4 4 0 0 7.6
Total 1,086 428 118 540 75.1
Source: Universidad de los Andes and Ministry of Environment 2002, reported in Garay 2002.

to purchase basic production inputs. In addition, sufficient pressure in thewater supply systems is often lacking, adding to the risk of bacterial con-tamination. Added to this, sewerage collection systems do not have suffi-cient hydraulic capacity to handle wastewater flows, especially in poorneighborhoods, resulting in overflow problems with direct health and envi-ronmental impacts.
As highlighted in the earlier section, for Colombia’s sectoral policiesto target waterborne diseases efficiently and effectively, the authoritiesmight consider promoting safe water programs and hygiene interven-tions in addition to water supply and sewerage, particularly in those ruralzones where the population is at greatest risk of diarrheal disease (seetable 6.1). In addition, the policies might include efforts aimed at pro-moting increased water supply and sanitation coverage by modifyingcurrent policies and instruments (EIA framework, Decree 1594 of 1984,and wastewater effluent fees) that discourage private participation in thesector. For example, with respect to wastewater effluent fees, it would benecessary to phase out charges associated with organic and total suspendedsolid loads for which dischargers currently have to pay, and focus instead onparameters that have a more direct and significant bearing on public health.
Analysis of Alternative Interventions
For an analysis of potential alternative interventions in table 6.2, it isimportant to distinguish between those that involve changes in house-hold behavior and those that involve infrastructure or hardwareimprovements. Interventions that involve changes in household behaviorare improved hygiene and water treatment at point of use. Althoughpublic authorities can promote these behaviors, changes in behavior byindividuals and households are beyond their control. This behavioralcomponent must therefore be explicitly accounted for in a benefit-costanalysis. With respect to infrastructure or hardware (water supply andsanitation facilities), improvements are predominantly functions of pro-vision and are likely to be used by households if design and service deliv-ery reflect demand and provide convenience. Therefore, uncertaintiesregarding behavioral change in relation to water supply and sanitationtend to be less important in a benefit-cost analysis than for hygieneimprovement and point-of-use treatment of drinking water.
Pruss and others (2002) provide a framework for estimating theburden of disease from inadequate water, sanitation, and hygiene,presented in table 6.5. Although Pruss and others (2002) applied the
172 Larsen and Sánchez-Triana

framework to estimate the global burden of diarrheal disease, it can alsobe effectively applied to estimate the benefits and costs of improvedwater supply and sanitation.
The relative risks in table 6.5 can be interpreted as follows: The riskof diarrheal illness in a situation of no improved water supply and nobasic sanitation (scenario VI) is almost 60 percent ({[11.0 – 6.9]/6.9} � 100)higher than or 1.60 times as high (11.0/6.9) as in a situation withimproved water supply and basic sanitation (scenario IV). The risk ofdiarrheal illness in a situation with improved water supply and basic sani-tation (scenario IV) is 2.75 times as high (6.9/2.5) as in a situation withregulated water supply and full sanitation coverage and partial treatment
Waterborne Diseases Remain Widespread 173
Table 6.5 Selected Exposure Scenarios
Pathogen
Scenario Description load Relative risk
VI NO IMPROVED WATER SUPPLY AND NO BASIC Very high 11.0
SANITATION in a country that is not extensively
covered by those services, and where water
supply is not routinely controlled
Vb IMPROVED WATER SUPPLY but no basic Very high 8.7
sanitation in a country that is not extensively
covered by those services, and where water
supply is not routinely controlled
Va BASIC SANITATION but no improved water High 6.9
supply in a country that is not extensively
covered by those services, and where water
supply is not routinely controlled
IV IMPROVED WATER SUPPLY AND BASIC High 6.9
SANITATION in a country that is not extensively
covered by those services, and where water
supply is not routinely controlled
IIIc IV and improved access to drinking water High —
(generally piped to household)
IIIb IV and improved personal hygiene High 4.5
IIIa IV and drinking water disinfected at point of use High 3.8
II Regulated water supply and full sanitation Medium to 2.5
coverage, with partial treatment for sewerage, low
corresponding to a situation typically found in
developed countries
I Ideal situation, corresponding to the absence Low 1.0
of transmission of diarrheal disease through
water, sanitation, and hygiene
Source: Based on Pruss and others (2002).
Note: — = not available.

for sewerage (scenario II). The risk of diarrheal illness in a situation of noimproved water supply and no basic sanitation (scenario VI) is 4.4 timeshigher (11.0/2.5) than in a situation with regulated water supply and fullsanitation coverage and partial treatment for sewerage (scenario II).7
According to the WHO, diarrheal incidence (cases per person per year)in most developing regions of the world is three to five times higher thanin North America and high-income countries in Europe, and as much assix times higher in Sub-Saharan Africa (WHO 2002a).These statistics arerelatively consistent with the figures reported in table 6.5, suggestingthat most developing countries lie somewhere in the range of scenarioIV to scenario VI. These figures represent averages; larger variations existwithin specific developing countries, and some segments of their popu-lations lie closer to scenario II.
Pruss and others (2002) derived the relative risks of diarrheal illnessfrom the international literature (table 6.6). The expected reductionsin diarrheal illness from provision of improved water supply, basic sani-tation facilities, or both water supply and basic sanitation are fromEsrey (1996) and are supported by the results in Esrey and others(1991). Pruss and others (2002) identify the risk transition betweenscenarios IV and II as the most data-scarce transition among the sce-narios in table 6.5. According to Pruss and others (2002), no interven-tion studies fully describe this transition. The authors therefore rely on
174 Larsen and Sánchez-Triana
Table 6.6 Rates of Reduction in Diarrheal Illness Used in Pruss and Others (2002)
Scenario Reduction in
progression Description of improvement illness rate (%) Source
From VI to Vb Providing improved water supply 20.8 Esrey (1996)
From VI to Va Providing basic sanitation facilities 37.5 Esrey (1996)
From VI to IV Providing improved water supply 37.5 Esrey (1996)
and basic sanitation facilities
From IV to IIIb Improved personal hygiene 35.0 Huttly, Morris,
and Pisani (1997)
From IV to IIIa Disinfection of drinking water at 45.0 Quick and
point of use others (1999)
From IV to II Regulated water supply and full 65.0 Huttly, Morris, and
sanitation coverage, with partial Pisani (1997);
treatment of sewerage Quick and others
(1999)
From II to I Absence of transmission of diarrheal 60.0 Using results
disease through water, sanitation, from Mead and
and hygiene others (1999)
Source: Pruss and others 2002.

a staged approach by applying results from the international literaturethat describe selected characteristics of the difference between scenar-ios IV and II, such as improved personal hygiene (scenario IIIb) andimproved water quality (scenario IIIa). Of all personal hygieneimprovements, handwashing is often found to be the most effectiveintervention to reduce disease transmission. Pruss and others (2002)therefore apply the results from a review of studies of handwashing byHuttly, Morris, and Pisani (1997) to estimate the reduction in diarrhealillness from scenario IV to IIIb. For water quality improvements, Prussand others (2002) apply the results from Quick and others (1999),who found a 45 percent reduction in diarrheal illness from point-of-use water disinfection. The combined results of Huttly, Morris, andPisani (1997) and Quick and others (1999) were subsequently used toarrive at the expected reduction in diarrheal illness from scenario IV toscenario II.8 To assess the magnitude of the difference—in diarrhealillness that is transmitted through water, sanitation, and hygiene—between scenario II (typically found in developed countries) and sce-nario I (typically ideal situation with absence of diarrheal disease), Prussand others (2002) deduct the share of diarrheal illness that is found tobe foodborne in the United States from a likely share that might betransmitted through aerosols.9 This approach suggests that 60 percentof diarrheal illness in a scenario II situation is related to water, sanita-tion, and hygiene, and is therefore the expected reduction in diarrhealillness from scenario II to scenario I.
The percentage reductions in diarrheal illness in table 6.6 correspondto the relative risks presented in table 6.5. For instance, the differencein relative risk between scenarios IV (6.9) and II (2.5) corresponds to abouta 65 percent reduction {[(6.9 – 2.5)/6.9] � 100 percent} from scenarioIV to II.
The rest of this section discusses how the framework by Pruss andothers (2002) is applied to estimate the benefits and costs of interven-tions to reduce diarrheal illness and diarrheal mortality in Colombia.Theexposure scenarios applied for Colombia are presented in table 6.7. Twoaspects of the framework are modified to accommodate various combi-nations of the scenarios and to minimize limitations imposed by thesequence of pathogen load reductions used by Pruss and others (2002).The relative risks, or reductions in diarrheal illness, are also modified toreflect the more recent findings of relative risks in the meta-analysisstudy by Fewtrell and Colford (2004) and the meta-analysis study ofhandwashing by Curtis and Cairncross (2003).
Waterborne Diseases Remain Widespread 175

The first modification to the framework presented by Pruss and others(2002) is to distinguish between households that disinfect their drinkingwater at point of use and those households that do not do so. This distinc-tion is made for each of the scenarios III through VI. The second modifi-cation is to distinguish between households with piped water supply thatis treated at source (water treatment plant) and those with piped waterthat is not treated at source.
To allow for a comparison with table 6.5, the relative risk for scenarioVI without point-of-use disinfection is also 11.0 in table 6.7. The relativerisks in scenarios Vb and Va are derived by multiplying the relative risk inscenario VI by the relevant relative risk ratios in table 6.2. Consistent withthe findings of Pruss and others (2002), there is no difference betweenscenarios Va and IV.The difference between scenarios IV and IIIb is a rela-tive risk ratio of 0.904, reported in Fewtrell and Colford (2004) forhousehold water supply connection. The difference between scenarios IIIb and IIIc is the relative risk ratio of 0.891 presented in table 6.2.
In scenarios VI through IIIb, the ratio of the relative risk with point-of-use disinfection to the relative risk without point-of-use disinfection is0.53. This corresponds to the relative risk ratio for rural water supply intable 6.2, which may be considered more appropriate to apply than theurban relative risk ratio because scenarios IV through VI are typically foundin rural areas (see table 6.8) and water quality in scenarios IIIb through VIis on average likely to involve higher disease risk than urban treated pipedwater supply. The relative risk for scenarios IIIc and IIIb is assumed to bethe same (3.6) if drinking water is disinfected at point of use.
176 Larsen and Sánchez-Triana
Table 6.7 Exposure Scenario Application to Colombia
Relative risk,
with and without
point-of-use disinfection
Scenario Description With Without
VI No improved water supply and no basic sanitation 11.0 5.8
Vb Improved water supply but no basic sanitation 8.2 4.4
Va Basic sanitation but no improved water supply 7.5 4.0
IV Improved water supply and basic sanitation 7.5 4.0
IIIb IV and water supply piped to household
(no source treatment) 6.7 3.6
IIIc IV and water supply piped to household
(source treatment) 5.9 3.6
Source: Modified from Pruss and others (2002).
Note: Relative risk is for diarrheal disease.

Scenario II, the situation typically found in developed countries, isnot included in table 6.7. Providing this level of service (including par-tial sewerage treatment) to the entire urban and rural population indeveloping countries is likely to be very costly. The benefit-cost analy-sis in this report therefore focuses on improved water supply and basicsanitation to those segments of the population without these services.
To estimate the health benefits of water and sanitation interventions, anestimate of the share of the Colombian population in each of the scenariosis needed.Three sources of data from Colombia are used for this purpose—the 2000 Colombia DHS household survey with data on the water and san-itation situation in urban and rural areas; data from the Ministry ofEnvironment, Housing and Regional Development (Ministerio de Ambiente,Vivienda y Desarrollo Territorial, MAVDT) on piped water network andwater treatment plants; and the 2003 DANE Colombia Quality of LifeSurvey with data on household drinking water disinfection (DANE 2003).
The water supply and sanitation situation according to the 2000Colombia DHS is presented in table 6.8. As discussed in relation to table6.2, unimproved or no basic sanitation mainly refers to households withno sanitation facilities or with open-pit latrines.The Colombia DHS tablesdo not distinguish between types of pit latrines. It is therefore necessary touse high and low bounds for the population share without improved orbasic sanitation. Similarly, no improved water supply refers mainly to sur-face water, tanker trucks, and unprotected well or spring water. However,the DHS tables do not distinguish between protected and unprotectedwell water. Again, it is necessary to apply high and low bounds.
Waterborne Diseases Remain Widespread 177
Table 6.8 Water Supply and Sanitation in Colombia
% households
Water supply and sanitation situation Urban Rural
Sanitation
No sanitation facilities 1.4 28.7
Pit toilet latrine 2.4 13.0
Flush toilet 96.2 58.2
Water
Piped water supply 98.0 50.3
Well water 1.3 18.7
Surface water 0.0 24.6
Rain water 0.4 4.1
Tanker truck 0.1 1.2
Other 0.2 1.0
Source: DHS 2000.

For the data in table 6.7 to be used to estimate the population sharesin each of the scenarios in table 6.6, a set of allocation rules were applied.These rules are presented in table 6.9, and their application is presented intables 6.10 and 6.11. In the high case, well water is considered an unim-proved water supply and pit latrines are not considered to be basic sani-tation. In the low case, well water is considered an improved water sup-ply and pit latrines are considered to be basic sanitation. Because theDHS data do not provide information on treated versus untreated pipedwater supply, table 6.10 makes no distinction between treated anduntreated piped water supply.
Data from the MAVDT were used to provide an estimate of theurban population share with piped water supply that is not treated atsource. According to MAVDT data, there were 174 municipalities thatdid not have a water treatment plant in 2002, and there were 164municipalities with water treatment plants that were not in operation.While these figures represent over 30 percent of the total number ofmunicipalities in Colombia, they represent only a little over 5 percent ofthe population served by a water supply network.10
The 2003 Colombia Quality of Life Survey reports that 53 percent ofurban households and 58 percent of rural households disinfect theirdrinking water (point-of-use disinfection).11 The Quality of Life Surveydoes not provide the share of households that use disinfection in relationto their type of water supply and sanitation. The data on disinfection istherefore applied uniformly to each of the scenarios. Tables 6.10 and6.11 suggest that most health benefits from improved water supply andsanitation can be realized in rural areas. The benefit-cost analysis in thisreport therefore focuses on rural service improvements. Larsen (2005)
178 Larsen and Sánchez-Triana
Table 6.9 Scenario Allocation Rules
Scenario Allocation rule
VI The lesser of the population share without improved water supply and without
basic sanitation
Vb The difference between population share with improved water supply but
without basic sanitation, if difference is > 0
Va The difference between population share with basic sanitation but without
improved water supply, if difference is > 0
IV The lesser of the population share with improved water supply and basic
sanitation less the population share with piped water
IIId Population share with piped water supply
IIIc Population share with piped water supply
Source: Larsen 2005.

based on the Colombia DHS 2000 survey and data from INS (table 6.12)estimated the total number of annual cases of diarrheal illness at close to30 million, or equivalent to 0.7 cases per person.
Estimated cases of diarrheal illness per person per year in rural areasin Colombia are estimated for scenarios IIIc through VI from the relativerisks in table 6.7, the scenario population distribution in table 6.10, andthe average diarrheal cases per person in table 6.12. Table 6.13 indicatesthat the number of cases per person is on average 0.45 in householdswith piped water supply and basic sanitation that practice disinfection ofdrinking water, and 1.35 per year in households that do not haveimproved water supply, do not have basic sanitation, and do not practicedrinking water disinfection. This is based on the high case in table 6.10.For the low case, the range is 0.47 to 1.42 (not shown in table).
Providing piped water supply to all rural households is likely to be veryexpensive.A realistic objective might be to at least provide improved water
Waterborne Diseases Remain Widespread 179
Table 6.10 Rural Water Supply and Sanitation in Colombia
% rural population
Scenario Description High Low
VI No improved water supply and no basic sanitation 42 27
Vb Improved water supply but no basic sanitation 0 2
Va Basic sanitation but no improved water supply 4 0
IV Improved water supply and basic sanitation 4 21
IIId and IIIc IV and water supply piped to household
(no source treatment) 50 50
Source: Larsen 2005.
Note: “High” and “low” refer to population share without improved water supply, without basic sanitation, or with
neither, as described in the text.
Table 6.11 Urban Water Supply and Sanitation in Colombia
% urban population
Scenario Description High Low
VI No improved water supply and no basic sanitation 1.5 0.3
Vb Improved water supply but no basic sanitation 2.5 1.1
Va Basic sanitation but no improved water supply 0.0 0.0
IV Improved water supply and basic sanitation 0.0 0.6
IIId IV and water supply piped to household
(no source treatment) 5.0 6.0
IIIc IV and water supply piped to household
(source treatment) 91.0 92.0
Source: Larsen 2005.
Note: “High” and “low” refer to population share without improved water supply, without basic sanitation, or with
neither, as described in the text.

supply (protected well or borehole) and sanitation facilities (improved pitlatrine or pour-flush latrines). Benefits and costs are presented in tables 6.14and 6.15 for three interventions: (a) improved water supply and sanitationfacilities; (b) improved sanitation facilities only; and (c) improved watersupply only. Referencing table 6.13, these interventions are equivalent toimproving service levels to scenario IV for the entire rural population.
The population receiving improved water supply and sanitation is cal-culated from table 6.10. Diarrheal cases averted are calculated fromtable 6.13. Deaths averted are calculated on the basis of an estimated
180 Larsen and Sánchez-Triana
Table 6.12 Estimated Annual Cases of Diarrheal Illness in Colombia, 2000
Cases National Urban Rural
Children under age 5 with chronic diarrhea
(lasting two weeks) (%) 13.9 13.2 15.6
Population age 5 and over with chronic diarrhea
(lasting two weeks) (%) 2.0 1.9 2.2
Annual diarrhea cases in children under age 5
(thousands) 13,800 9,300 4,500
Annual diarrhea cases in population age 5 and
over (thousands) 16,100 10,900 5,200
Total annual diarrhea cases (thousands) 29,900 20,200 9,700
Diarrhea cases per person (all population) 0.68 0.65 0.77
Source: Larsen 2004.
Table 6.13 Estimated Annual Cases of Diarrheal Illness per Person in Rural
Colombia, High Estimate
Cases of diarrheal
illness per person
Without With
point-of-use point-of-use
Scenario Description disinfection disinfection
VI No improved water supply and no basic
sanitation 1.35 0.72
Vb Improved water supply but no basic
sanitation 1.01 0.54
Va Basic sanitation but no improved
water supply 0.92 0.49
IV Improved water supply and basic
sanitation 0.92 0.49
IIId IV and water supply piped to household
(no source treatment) 0.83 0.45
IIIc IV and water supply piped to household
(source treatment) 0.74 0.45
Source: Larsen 2005.

Waterborne Diseases Remain Widespread 181
Table 6.14 Benefits and Costs of Improved Rural Water and Sanitation, Low Case
Improvement
Water supply Sanitation Water
and sanitation only supply only
Impacts
Population receiving improved sanitation
(thousands) 3,665 3,665 n.a.
Population receiving improved water supply
(thousands) 3,413 n.a. 3,413
Diarrhea cases averted per year 1,170 1,170 900
Diarrhea cases averted per year (% reduction) 4 4 3
Deaths of children because of diarrhea averted 65 65 50
Deaths of children because of diarrhea
averted (%) 4 4 3
Value of costs and benefits (billion pesos)
Annualized cost of service provision 128 70 57
Health benefits of service provision 38 38 29
Value of time savings from improved water supply 90 n.a. 90
Value of time savings from improved sanitation 167 167 n.a.
Benefit-cost ratios
Health benefits only 0.30 0.54 0.51
Health benefits and time savings 2.31 2.91 2.08
Source: Larsen 2005.
Note: n.a. = not applicable. US$1 = Col$2,150. Low case refers to the low estimate of population without improved
water supply and sanitation in table 6.10.
case fatality rate of 0.118 per 1,000 cases in children under age 5, basedon data presented in Larsen (2004). Health benefits of service provisionare estimated on the basis of a cost of diarrheal illness of Col$25,000(US$11.63) per case averted (morbidity) and a cost of Col$136 million(US$63,255) per death averted in rural areas (Larsen 2004).12
Estimated household time savings as a result of improved water sup-ply are presented in table 6.16. Data on households with more than15 minutes to water source is from the Colombia DHS 2000. A lowerbound of 15 minutes is assumed in table 6.16 to provide a conservativeestimate of time savings. To estimate time savings for households thathave less than 15 minutes to water source, only households relying on sur-face water (DHS 2000) are assumed to save time from improved watersupply. An average time savings of five minutes to water source isassumed. To place a monetary value on time savings, economists com-monly apply a range of 50 to 100 percent of wage rates.The value of timesavings presented in tables 6.14 and 6.15 is estimated based on 75 per-cent of average wage rate. For sanitation improvements, a time savings offive minutes per day per person has been applied.

182 Larsen and Sánchez-Triana
Table 6.15 Benefits and Costs of Improved Rural Water and Sanitation, High Case
Improvement
Water supply Sanitation Water
Benefits and Costs and sanitation only supply only
Impacts
Population receiving improved sanitation
(thousands) 5,310 5,310 n.a.
Population receiving improved water supply
(thousands) 5,815 n.a. 5,815
Diarrhea cases averted per year 1,680 1,680 1,310
Diarrhea cases averted per year (% reduction) 6 6 4
Deaths of children because of diarrhea averted 90 90 70
Deaths of children because of diarrhea averted (%) 6 6 4
Value of costs and benefits (billion pesos)
Annualized cost of service provision 200 102 98
Health benefits of service provision 54 54 42
Value of time savings from improved water supply 90 n.a. 90
Value of time savings from improved sanitation 167 167 n.a.
Benefit-cost ratios
Health benefits only 0.27 0.53 0.43
Health benefits and time savings 1.56 2.18 1.36
Source: Larsen 2005.
Note: n.a. = not applicable. US$1 = Col$2,150. High case refers to the high estimate of population without
improved water supply and sanitation in table 6.10.
Table 6.16 Household Time Savings from Improved Water Supply
Rural population share with time savings > 15 minutes to water source (%) 7
Number of households with > 15 minutes to water source (thousands) 177
Assumed average number of minutes to water source 15
Trips per day to water source 2
Time savings from improved water supply (minutes per day per household) 30
Percentage of households relying on surface water 25
Number of households using surface water (thousands) 632
Number of households with < 15 minutes to water source (thousands)a 455
Assumed average number of minutes to water source 5
Trips per day to water source 2
Time savings from improved water supply (minutes per day per household) 10
Source: Larsen 2005.
a. Calculation: 632 – 177 = 455.
The annualized cost of service provision reflects an annualized per capitacost of Col$19,000 (US$8.84) for improved sanitation (improved latrines)and Col$17,000 (US$7.91) for improved water supply (protected well orbore hole). This is based on a 10 percent annual discount rate, a per capita

investment cost of Col$125,000 (US$58.14) for sanitation (plus an annual5 percent operations and maintenance cost and 5 percent promotion cost,and Col$5,000 [US$2.33] in annual sewerage cost), and a per capita invest-ment cost of Col$130,000 (US$60.47) for improved water supply (plus anannual 5 percent operations and maintenance cost and 5 percent watersource protection cost).13
As seen in tables 6.14 and 6.15 and figure 6.4, the estimated benefit-cost ratio that includes only health benefits is close to 0.5 for eitherwater supply improvements or sanitation improvements. For water sup-ply and sanitation, the health cost-benefit ratio is close to 0.3.14 Theseestimates, in the case of Colombia, suggest that the health benefits areonly one-third to one-half of the cost of water and sanitation improve-ment costs. By including time savings, however, the benefit-cost ratio isgreater than 1 in both the low and high cases.15
Analysis of Hygiene ImprovementsThe most effective hygiene intervention found in many studies is hand-washing after defecation, before preparing meals, and before eating. Curtisand Cairncross (2003) provide a meta-analysis of close to 20 handwashingstudies and report a mean reduction in diarrheal illness of about 47 percent.Fewtrell and Colford (2004), in their meta-analysis, report a mean reductionin diarrheal illness of about 45 percent from handwashing interventions(table 6.2). About two-thirds of the studies reviewed in the two meta-analysis studies assessed the effect of handwashing on diarrheal illness inchildren under age 5. The meta-analyses do not report the effect of
Waterborne Diseases Remain Widespread 183
0
0.5
1.0
1.5
2.0
2.5
3.0
3.5
sanitation water supply water supply and sanitation
ben
efit
-co
st r
atio
non-health benefits
healthbenefits
Figure 6.4 Benefit-Cost Ratios of Rural Water Sanitation, Low Case
Source: Larsen 2005.
Note: “Low case” refers to the low estimate of population without improved water supply and sanitation (Scenario
VI) in Table 6.10.

handwashing on diarrheal illness in children under age 5 compared witholder children and adults. A pooled analysis of the studies reviewed in thetwo meta-analyses was therefore undertaken in this report, but found nostatistically significant difference in diarrheal reduction in children andadults. A reduction in diarrheal illness of 45 percent is therefore applied inthe benefit-cost analysis in this report for all age groups.
A benefit-cost analysis of hygiene improvement (handwashing pro-grams) involves an assessment of several key parameters and outcomes, aslisted in table 6.17. The costs of improved handwashing practices aretwofold. First, a program to encourage behavioral change (improved hand-washing) has a cost that should be fully captured, including the cost ofprogram preparation and implementation. Second, improved handwashingpractices have a private cost that includes cost of increased water and soapconsumption. The most uncertain and critical parameter is the effective-ness of the handwashing program for changing household and individualbehavior, and the lasting effect or sustainability of changed behavior. Thisbehavioral aspect is likely dependent on several dimensions and will varyfrom country to country. It will also depend on the design, duration, andoverall magnitude of the handwashing program. The expected benefit ofthe program can be estimated from the reductions in risk of diarrhealillness reported in Curtis and Cairncross (2003) and Fewtrell and Colford(2004), and the monetized benefits (or costs avoided per case of diarrhealillness reduction) presented in Larsen (2004) for Colombia.
A review of three handwashing programs that provide program costsand behavioral change is presented in table 6.18. The program inGuatemala was national in scope and targeted households with childrenunder age 5 (Saadé, Bateman, and Bendahmane 2001). The program inThailand focused on all households in a set of rural villages and involved
184 Larsen and Sánchez-Triana
Table 6.17 Key Parameters and Outcomes in a Benefit-Cost Analysis of Handwashing
Key parameters Outcomes
Program cost Overall cost of handwashing program
Program effectiveness Behavioral change in target population (percentage of
population that improves or starts regular handwashing)
Program sustainability The lasting effect of the program
Private cost Costs of handwashing in the group with behavioral change
(increased water and soap expenditures)
Program benefits Percentage reduction in diarrheal illness from handwashing
in group with behavioral change
Monetized benefits of reduced diarrheal illness
Source: Larsen 2005.

a different level of program intervention in two subsets of the villages(Pinfold and Horan 1996). The program in Burkina Faso involved onecity and targeted households with children under age 3 (Borghi and others2002). As seen in table 6.18, the percentages of the target populationthat changed behavior (that is, started regular handwashing or improvedhandwashing practices) range from 10 percent in Guatemala to 18 per-cent in Burkina Faso. In addition, the cost per target household rangesfrom US$0.36 in Guatemala to US$5.03 in Burkina Faso. While thestudies are too few to draw a definite conclusion, the results do suggestthat program cost per unit of behavioral change (per percentage pointincrease in population with behavioral change) may increase substan-tially if the objective is to achieve behavioral change in a large share of thetarget population. This issue may, therefore, have a major impact on theoverall cost of hygiene programs that aim to achieve substantial reductionsin the overall number of cases of diarrheal illness in a country.
Program cost per target household with behavioral change is the mostrelevant unit cost in table 6.18 for a benefit-cost analysis. This cost canthen be compared to the reduction (and thereby benefits) in diarrhealillness in the target population with behavioral change.
Waterborne Diseases Remain Widespread 185
Table 6.18 Review of Costs and Effectiveness of Handwashing Programs
Thailand
Low High Burkina
Factors Guatemala intervention intervention Faso
Target area National 25 rural villages One city —
Target households With children All households With children —
under age 5 under age 3
Number of target households 1,570,000 10,000 6,550 38,600
Duration of program 1 year 3–4 months 3–4 months 3 years
implementation
Behavioral change 10 11 16 18
(% target population)
Program cost (US$) 561,400 5,960 7,715 194,000
Program cost per 0.36 0.60 1.18 5.03
household (US$)
Program cost per 3.58 5.42 7.36 27.92
target household or
primary caretaker
with behavioral
change (US$)
Sources: Derived from Borghi and others (2002); Pinfold and Horan (1996); and Saadé, Bateman, and Bendahmane
(2001).
Note: — = not available.

186 Larsen and Sánchez-Triana
Table 6.19 Benefits and Costs of a National Handwashing Program in Colombia
Under age 5 Age 5 and over
Factors Low Medium High Low High
Baseline data
Total population by age
group (DANE) 4,767,533 4,767,533 4,767,533 39,763,901 39,763,901
Diarrhea cases per person
per year 2.9 2.9 2.9 0.4 0.4
Total diarrhea cases per year 13,826,000 13,826,000 13,826,000 16,104,000 16,104,000
Deaths from diarrhea
(children under age 5) 1,634 1,634 1,634 n.a. n.a.
Diarrhea fatality rate
(per 1,000 cases) 0.118 0.118 0.118 n.a. n.a.
Program cost
Reach (% population) 100 100 100 100 100
Cost per primary target (US$) 0.40 1.20 5.00 n.a. n.a.
Total cost (million pesos) 4,577 13,730 57,210 n.a. n.a.
Program effectiveness
Individuals with behavioral
change (%) 10 15 20 5 10
Cost per person with behavioral
change (US$) 4.00 8.00 25.00 n.a. n.a.
Reduction in diarrhea incidence
among individuals with
behavioral change (%) 45 45 45 45 45
Overall reduction in diarrhea
cases (%) 4.5 6.8 9.0 2.3 4.5
A benefit-cost analysis of a national handwashing program in Colombiais presented in table 6.19.Three scenarios are provided for diarrheal reduc-tion in children under age 5, and two scenarios for the population age 5 andover. The low to high scenarios for children represent (a) a programeffectiveness of 10 to 20 percent of households (or primary caretakers ofchildren) that start regular handwashing or improve handwashing practicesfor the protection of child health; and (b) a program cost ranging fromUS$0.40 to US$5.00 (Col$10,750) per targeted household or primary care-taker (US$4.00 to US$25.00 [Col$360] per household or primary care-taker with behavioral change). These ranges of program effectiveness andcosts are based on the figures in table 6.18. The high scenario correspondsto the experience in one city in Burkina Faso. However, it is possible thata national program will benefit from economies of scale and therefore

Waterborne Diseases Remain Widespread 187
Table 6.19 Benefits and Costs of a National Handwashing Program
in Colombia (continued)
Under age 5 Age 5 and over
Factors Low Medium High Low High
Private costs for improved hygiene
Increased daily water use
(liters/person) 3 3 3 3 3
Increased annual water use
(m3/person) 1.095 1.095 1.095 1.095 1.095
Cost of water (pesos/m3) 720 720 720 720 720
Cost of water per person per year
(pesos) 788 788 788 788 788
Soap consumption per person per
year 6 6 6 3 3
Cost per unit of soap (pesos) 2,000 2,000 2,000 2,000 2,000
Cost of soap per person per year
(pesos) 12,000 12,000 12,000 6,000 6,000
Total private cost per year
(million pesos) 6,097 9,145 12,194 13,497 26,993
Program benefits
Reduction in annual cases
of diarrhea 622,170 933,255 1,244,340 362,340 724,680
Deaths averted (children
under age 5) 74 110 147 n.a. n.a.
Cost per case of diarrhea
(pesos) 35,000 35,000 35,000 30,000 30,000
Cost per death from diarrhea
(million pesos) 136 136 136 n.a. n.a.
Morbidity benefits per year
(million pesos) 21,776 32,664 43,552 n.a. n.a.
Mortality benefits per year
(million pesos) 10,000 15,000 20,000 n.a. n.a.
Total benefits per year
(million pesos) 31,776 47,664 63,552 10,870 21,740
Benefit-cost ratios
Program cost (million pesos) 4,577 13,730 57,210 0 0
Private cost per year
(million pesos) 6,097 9,145 12,194 13,497 26,993
Benefits per year
(million pesos) 31,776 47,664 63,552 10,870 21,740
Benefit-cost ratio 3.0 2.1 0.9 0.8 0.8
Source: Larsen 2005.
Note: m3 = cubic meter; n.a. = not applicable. US$1 = Col$2,150. For children under age 5, the low, medium, and high
scenarios correspond to 10, 15, and 20 percent effectiveness, respectively, in individuals whose behavior is changed.
For population age 5 and over, the low and high scenarios represent 5 and 10 percent effectiveness, respectively.

188 Larsen and Sánchez-Triana
achieve 20 percent effectiveness at a unit cost lower than US$5.00 perprimary caretaker of children under age 5. It is therefore possible that thehigh scenario represents a higher bound of program cost. It is also possible thatthe low scenario with a program effectiveness of 10 percent can be achievedat a lower cost than in Guatemala if further economies of scale areachieved, given that the population of Colombia is substantially larger thanthat of Guatemala.
The diarrheal illness baseline data and cost of illness per case of diarrheaand diarrheal mortality in table 6.19 are taken from Larsen (2004).Avoidedcost of illness is the program benefit per case of reduced or averted diar-rheal morbidity and mortality. Mortality is valued by the human capitalapproach as shown in this chapter on water and sanitation improvement.The reduction in diarrheal illness (45 percent) in children with caretakerswho start regular handwashing or improve handwashing practices is takenfrom Curtis and Cairncross (2003) and Fewtrell and Colford (2004), as pre-sented in table 6.2. The quantity of increased water and soap consumptionthat make up the private cost of handwashing reflects the findings in Borghiand others (2002). Price of water reflects an average for Colombia, and thecost of soap is based on a spot survey of soap retail prices in Colombia.
The estimated reduction in annual cases of diarrheal illness rangesfrom 0.6 million to 1.2 million in children under age 5. At a cost ofCol$35,000 (US$16.28) per averted case of illness (morbidity) andCol$136 million (US$63,256) per averted case of death (mortality), thetotal program benefit ranges from Col$31 billion (US$14.4 million) toCol$63 billion (US$29.3 million).16 Total program cost ranges from lessthan Col$5 billion (US$2.3 million) to Col$57 billion (US$26.5 million),and total private cost ranges from Col$6 billion (US$2.8 million) toCol$12 billion (US$5.6 million). The total estimated benefits and costsresult in a benefit-cost ratio that ranges from 3.0 in the low scenario to0.9 in the high scenario (see also figure 6.5).
The benefits of a handwashing program are not limited to childrenunder age 5. The population age 5 and over can also benefit, as discussedat the beginning of this section. To simplify the analysis, it is assumed intable 6.19 that changes in handwashing behavior in the population age 5and over can be achieved at no incremental program cost, but that theeffectiveness only ranges from 5 to 10 percent. It is also assumed that soapconsumption per person is only half the soap consumption required forimproved hygiene for children under age 5. In this case, the benefit-costratio is 0.8.17 This low ratio, even at zero incremental program cost, can beexplained by the fact that diarrheal incidence is on average substantiallylower in this population group than in children under age 5.

One important aspect of the benefit-cost analysis presented is that itimplicitly assumes that the benefit of the program is realized for only oneyear, or that behavioral change (handwashing) lasts only one year. While itis difficult to assess the sustainability of behavioral change, benefits lastingonly one year is clearly a very conservative assumption. If benefits were sus-tained for two years, the estimated benefit-cost ratios would increase to thelevels presented in table 6.20. For a program effectiveness target of 20 percent, the estimated ratio increases from 0.9 to 1.5 for children underage 5. The benefit-cost ratio does not change for the population age 5 andover because of the assumption that behavioral change takes place at noincremental program cost.18 Figure 6.6 presents benefit-cost ratios for
Waterborne Diseases Remain Widespread 189
0
0.5
1.0
1.5
2.0
2.5
3.0
3.5
10 15 20
program effectiveness target (percent)
ben
efit
-co
st r
atio
Figure 6.5 Estimated Benefit-Cost Ratios for Handwashing, by Degree of Program
Effectiveness
Source: Larsen 2005.
Table 6.20 Benefits and Costs of a National Handwashing Program (Behavioral
Change Lasting Two Years)
Under age 5 Age 5 and over
Costs and benefits (million pesos) Low Medium High Low High
Program cost (year 1) 4,577 13,730 57,210 0 0
Private cost per year (year 1) 6,097 9,145 12,194 13,497 26,993
Private cost per year (year 2) 5,543 8,314 11,085 12,270 24,539
Benefits per year (year 1) 31,776 47,664 63,552 10,870 21,740
Benefits per year (year 2) 28,887 43,331 57,775 9,882 19,764
Benefit-cost ratio 3.7 2.9 1.5 0.8 0.8
Source: Larsen 2005.
Note: US$1 = Col$2,150. Costs and benefits are discounted at an annual rate of 10 percent.
For children under age 5, the low, medium, and high scenarios correspond to 10, 15, and 20 percent effectiveness,
respectively, in number of individuals whose behavior is changed. For population age 5 and over, the low and high
scenarios represent 5 and 10 percent effectiveness, respectively.

children under age 5 for a target effectiveness of 20 percent for a programwith sustainability of behavioral change lasting from one to three years.
Analysis of Drinking Water DisinfectionThe 2003 Colombia Quality of Life Survey reports that about 55 percentof households disinfect their drinking water (point-of-use disinfection).According to the survey, the most common method of disinfection isboiling of water and is therefore the method of disinfection consideredin the benefit-cost analysis presented in table 6.21. Fewtrell and Colford(2004) report from their meta-analysis that disinfection of drinkingwater at point of use on average reduces diarrheal illness by 47 percentin rural areas and 23 percent in urban areas.Applying these figures to theurban and rural population shares in Colombia would suggest a weightedaverage diarrheal illness reduction of 30 percent from disinfection. Thesebaseline data are presented in table 6.21.
To estimate the reduction in the number of cases of diarrheal illness,it is necessary to estimate the diarrheal incidence in the population sharethat does not practice point-of-use disinfection of drinking water. This isgiven by the following equation:
Psd + (1 − Ps)d(1 − r) = dA (6.1)
where Ps is the population share not practicing disinfection, d is diarrhealincidence in Ps, r is reduction in diarrheal incidence from disinfection, anddA is the national average diarrheal incidence. This equation provides anestimated diarrheal incidence of 0.81 in the population not practicingdisinfection, compared to a national average of 0.68 from Larsen (2004).
190 Larsen and Sánchez-Triana
00.20.4
0.60.81.01.21.4
1.61.82.0
1 year 2 years 3 years
sustainability of behavioral change
ben
efit
-co
st r
atio
Figure 6.6 Benefit-Cost Ratios over Time for Handwashing for Children Age 5
(20 Percent Effectiveness Target)
Source: Larsen 2005.

Waterborne Diseases Remain Widespread 191
Table 6.21 Benefits and Costs of a Drinking Water Disinfection Program
Program effectiveness target
Factors Low Medium High
Baseline data
Total population (DANE) 44,531,434 44,531,434 44,531,434
Population that does not disinfect drinking water (%) 45 45 45
Target population (not practicing disinfection) 20,039,000 20,039,000 20,039,000
Target households 4,008,000 4,008,000 4,008,000
Average diarrhea cases per person per year 0.68 0.68 0.68
Reduction in diarrhea cases from disinfection (%) 30 30 30
Diarrhea incidence in target population 0.81 0.81 0.81
Total diarrhea cases per year in target population 16,289,000 16,289,000 16,289,000
Diarrhea fatality rate in children under age 5
(per 1,000 cases) 0.119 0.119 0.119
Estimated diarrheal child mortality in target
population 950 950 950
Program cost
Reach (% of target households) 100 100 100
Cost per household (US$) 0.40 1.20 5.00
Total cost (million pesos) 3,848 11,543 48,096
Program effectiveness
Individuals with behavioral change (%) 10 15 20
Cost per target household with behavioral
change (US$) 4.00 8.00 25.00
Reduction in diarrhea cases among individuals
with behavioral change (% ) 30 30 30
Reduction in diarrhea cases in target population (%) 3.0 4.5 5.9
Private costs
Cost of boiling drinking water per person per year (pesos) 5,700 5,700 5,700
Total private cost per year (million pesos) 11,422 17,133 22,844
Program benefits
Reduction in annual cases of diarrhea 484,109 726,164 968,218
Reduction in deaths from diarrhea (children under age 5) 28 42 56
Cost per case of diarrhea (pesos) 32,000 32,000 32,000
Cost per death from diarrhea (million pesos) 136 136 136
Annual benefits from reduced morbidity
(million pesos) 15,491 23,237 30,983
Annual benefits from reduced mortality
(million pesos) 3,840 5,760 7,680
Total benefits per year (million pesos) 19,331 28,997 38,663
Benefit-cost ratios
Program cost (million pesos) 3,848 11,543 48,096
Private cost per year (million pesos) 11,422 17,133 22,844
Benefits per year (million pesos) 19,331 28,997 38,663
Benefit-cost ratio 1.3 1.0 0.5
Source: Larsen 2005.
Note: US$1 = Col$2,150. The low, medium, and high scenarios correspond to 10, 15, and 20 percent effectiveness,
respectively, in number of individuals whose behavior is changed.

There are no estimates available in the literature of program costs to pro-mote drinking water disinfection at point of use in Colombia. The samecosts as for handwashing programs (and for the same three scenarios ofeffectiveness ranging from 10 to 20 percent) have therefore been applied intable 6.21.The program cost, instead of per primary caretaker of children, isexpressed per household with the assumption that one person in the house-hold is primarily responsible for boiling drinking water. Cost of boilingdrinking water is taken from Larsen (2004) with a mean estimate of aboutCol$5,700 (US$2.65) per person per year, based on an average drinkingwater consumption of 0.75 liters per person per day. The disinfection pro-gram benefits are estimated the same way as for a handwashing program.
The benefit-cost ratios range from 1.3 in the low scenario with pro-gram effectiveness of 10 percent and program cost of US$0.40(Col$860) per household to a ratio of 0.5 in the high scenario with aprogram effectiveness of 20 percent and program cost of US$5.00(Col$10,750) per household (figure 6.7).
As in the case of the handwashing program, it is implicitly assumedthat the benefit of the disinfection program is sustained for only oneyear, or that behavioral change (boiling of drinking water) lasts only oneyear. While it is difficult to assess the sustainability of behavioral change,the assumption that benefits last for only one year is clearly conservative.If benefits were sustained for three years, the estimated benefit-costratios would increase to close to 1.0 for the program, with an effective-ness target of 20 percent (figure 6.8).
Tables 6.22 and 6.23 summarize the benefits of the interventions ana-lyzed in this report. The hygiene program is estimated to have the largest
192 Larsen and Sánchez-Triana
0
0.2
0.4
0.6
0.8
1.0
1.2
1.4
10 15 20
program effectiveness target (percent)
ben
efit
-co
st r
atio
Figure 6.7 Benefit-Cost Ratios for Drinking Water Disinfection Program, by Degree of
Program Effectiveness
Source: Larsen 2005.

Waterborne Diseases Remain Widespread 193
Table 6.22 Benefits of Intervention Alternatives in Colombia, Morbidity
Effectiveness target
Diarrheal illness Low High
Baseline annual cases (Larsen 2004) (million cases per year) 30.0 30.0
Avoided annual cases (million cases per year)
Improved water supply and sanitation (rural areas) 1.2 1.7
Hygiene program (improved handwashing)a 1.0 2.0
Drinking water disinfection program (household boiling of water) 0.5 1.0
Total avoided annual cases 2.7 4.7
Total avoided cases (% baseline cases) 9 16
Source: Larsen 2005.
a. Includes approximately 0.35 million to 0.70 million cases in the population age 5 and over.
0
0.1
0.2
0.3
0.4
0.5
0.6
0.7
0.8
0.9
1.0
1 year 2 years 3 years
sustainability of behavioral change
ben
efit
-co
st r
atio
Figure 6.8 Benefit-Cost Ratios over Time for Drinking Water Disinfection Program
(20 Percent Effectiveness Target)
Source: Larsen 2005.
Table 6.23 Benefits of Interventions in Colombia, Child Mortality
Effectiveness target
Diarrheal child mortality Low High
Baseline estimated annual cases (Larsen 2004) 1,634 1,634
Avoided annual cases
Improved water supply and sanitation (rural areas) 65 90
Hygiene program (improved handwashing) 74 147
Drinking water disinfection program (household boiling of water) 28 56
Total avoided annual cases 167 293
Total avoided cases (% baseline cases) 10 18
Source: Larsen 2005.

potential health benefits, but only if at least 20 percent of the populationresponds favorably to the program and improves handwashing practices.With a 20 percent response rate to a hygiene program and a householddrinking water disinfection program, and provision of improved ruralwater supply and sanitation facilities, the estimated total avoided casesof diarrheal morbidity and diarrheal child mortality are 16 and 18 per-cent of baseline cases, respectively.19
Hygiene improvement and disinfection of drinking water at point ofuse have substantial potential to reduce diarrheal illness and mortality, asindicated in table 6.2. The challenge, however, is to develop and deliverprograms that induce sustained behavioral response on a large scale,while maintaining program costs at an affordable level.
Conclusions and Recommendations
A hygiene program that includes a handwashing component has thelargest potential health benefits. With 20 percent program effectiveness,that is, if 20 percent of the targeted population practices handwashing,and implements a household drinking water disinfection program, plusprovision of improved rural water supply and sanitation facilities, theestimated total avoided cases of diarrheal illness and diarrheal child mor-tality are 16 and 18 percent of baseline cases, respectively.
Hygiene improvement and disinfection of drinking water at point ofuse have substantial potential to reduce diarrheal illness and mortality.The challenge, however, is to develop and deliver programs that inducesustained behavioral response on a large scale, while maintaining pro-gram costs at an affordable level.
An additional element of a comprehensive approach to tackle prob-lems related to water supply and sanitation that might be considered isinterventions aimed at improving water supply and sanitation services inmedium and small municipalities. It would be advisable to apply the pol-icy developed by the government of Colombia, with the support of theWater Sector Reform Assistance Loan (World Bank Loan 7077-CO), toprovide support to such municipalities based on institutional improve-ments of those utilities accomplished through private sector participa-tion, and with provision of subsidies to the reformed utilities. Subsidiesare directed exclusively to benefiting the poor.
It would also be advisable to reform the environmental regulatoryframework, which continues to constrain private sector participation inwater supply and sanitation. Providing improved rural water supply and
194 Larsen and Sánchez-Triana

Waterborne Diseases Remain Widespread 195
Table 6.24 Summary of Recommendations for Reducing Waterborne Diseases
in Colombia
Responsible
Recommendation government agencies
Design and implement a hygiene program that includes MSPS, MAVDT, CARs, INS
components on handwashing and point-of-use disinfection
of drinking water
Reform environmental regulatory framework to remove Congress, MAVDT, DNP
constraints on private sector participation in water supply
and sanitation
Modify EIA regulations to expedite water supply and sanitation Congress, MAVDT, CARs
works including the design of new mechanisms that categorize
projects based on significance and magnitude of potential
environmental impacts, and guarantee adequate public
participation
Modify water pollution fee system to suit local conditions Congress, MAVDT, CARs
Modify law and regulations on parameters of effluent Congress, MSPS, MAVDT,
standards so that pathogens and toxic and hazardous CARs
substances are regulated
Source: Authors.
Note: DNP = Departamento Nacional de Planeación; INS = Instituto Nacional de Salud; MSPS = Ministerio de Salud y
Protección Social.
sanitation facilities would be a central pillar of a policy to preventwaterborne diseases. From the perspective of environmental protection,private sector participation in water supply and sanitation can be pro-moted through the design and implementation of efficient, clear, andtransparent “rules of the game” for investment, particularly those rulesregarding drinking water quality standards, environmental impact assess-ment, discharge standards, and effluent fees. To correct the deficienciesassociated with EIA regulations, new mechanisms might be designedthat categorize projects based on the significance and magnitude of theirpotential environmental impacts, guarantee adequate public participa-tion, and appraise environmental liabilities. Such regulations shoulddefine methodologies for preparation of EIAs and for the scope of envi-ronmental management plans. Problems with the water pollution feesystem might be addressed by designing a progressive scheme tailoredto local conditions. To overcome the obstacles posed by Decree 1594 of1984 associated with effluent standards, it is advisable to modify the reg-ulated parameter so that pathogens and toxic and hazardous substancescan be controlled.
Table 6.24 contains a summary of these recommendations.

Notes
1. Bjorn Larsen and Ernesto Sánchez-Triana are the authors of this chapter,which draws heavily from background documents prepared for this study byLarsen (2005) and Enríquez (2004).
2. Diarrhea is a symptom of infection caused by a host of bacterial, viral, andparasitic organisms, most of which can be spread by contaminated water. It ismore common when there is a shortage of clean water for drinking, cooking,and cleaning; basic hygiene is important in prevention. Diarrhea can alsospread from person to person, aggravated by poor personal hygiene. Food isanother major cause of diarrhea when it is prepared or stored in unhygienicconditions.Water can contaminate food during irrigation, and fish and seafoodfrom polluted water may also contribute to the disease.
3. The lower bound for diarrheal mortality (1,450 deaths) is based on 7.3 per-cent of official death records, while the upper bound (1,820 deaths) is basedon 7.3 percent of total estimated child mortality published by DANE. Officialdeath records represent a significant understatement of actual deaths in mostdeveloping countries because of underreporting by households. DANE there-fore publishes estimated mortality in addition to official records.
4. The DALY is a standard metric of the burden of disease that combines lifeyears lost as a result of illness and disability, with one DALY being equal tothe loss of one healthy life year (Murray and López 1996).
5. This program has been financed partially with proceeds from World BankLoan 7077-CO.
6. Screening refers to the procedure used to define whether the potential envi-ronmental impacts of the project under consideration are significant and thustrigger the preparation and define the scope of an EIA (Sánchez-Triana andMorillo 1998).
7. Scenario II corresponds to the situation typically found in developedcountries.
8. The reduction in diarrheal illness from the combined results of Huttly, Morris,and Pisani (1997) and Quick and others (1999) is calculated by 1− [(1−0.35)(1 − 0.45)] = 0.65, as applied by Pruss and others (2002).
9. Mead and others (1999) found that 35 percent of intestinal illness is food-borne in the United States.
10. The urban share of the population in scenario III in table 6.11 is lower thanthe share with piped water in the high case because some households(approximately 2 percent) do not have basic sanitation and are therefore notincluded in scenario III.
11. Most of the households boil water to disinfect it.
196 Larsen and Sánchez-Triana

12. Health benefits include the avoided cost of treatment of diarrheal illness (costof visits to medical facilities and cost of medicines) and the value of avoidedtime losses.
13. Per capita investment costs represent average costs in South America(WHO and UNICEF 2000).
14. The reason for the lower ratio for a combined delivery of improved water andsanitation is that the relative risk in scenarios Va and IV in table 6.6 is the same.
15. A benefit-cost analysis is not undertaken for urban water and sanitationimprovement because of the low population share that would benefit fromimprovements to scenario IV according to table 6.11.
16. The cost of 35,000 pesos is higher than the figure for rural areas used in thewater and sanitation section. This is because the cost of 35,000 pesos reflectshigher medical costs and value of caretakers’ time in urban areas, andbecause the medical cost of diarrheal illness in children is higher than inadults because a higher share of diarrheal illness in children is treated thanin adults.
17. Note that the ratio is 0.8 regardless of program effectiveness because of theassumption that incremental program cost is zero.
18. If incremental program cost were positive, then the benefit-cost ratio wouldbe lower than 0.8, but would be somewhat higher for a two-year behavioralchange scenario than for a one-year scenario.
19. The sum of avoided cases for the three interventions is an overestimate tothe extent that some of the same households receive improved water supplyand sanitation, improve their handwashing practices, and start disinfection oftheir drinking water. The extent of the overestimate could be 1 to 2 percent-age points.
References
Blackman, Allen, Richard Morgenstern, Libardo Montealegre Murcia, and JuanCarlos Garcia de Brigard. 2005. “Review of the Efficiency and Effectivenessof Colombia’s Environmental Policies.” Final Report to the World Bank,Resources for the Future, Washington, DC.
Borghi, Josephine, Lorna Guinness, J. Ouedraogo, and Val Curtis. 2002. “IsHygiene Promotion Cost-Effective? A Case Study in Burkina Faso.” TropicalMedicine and International Health 7(11): 960–9.
Challa, Krishna. 2003. “Enabling Sustainable Growth.” In Colombia: The EconomicFoundation of Peace, ed. Marcelo Giugale, Olivier Laforcade, and Connie Luff,59–88. Washington, DC: World Bank.
Waterborne Diseases Remain Widespread 197

Colorado State University. 2004. “Integrated Water Management and Law inColombia. Institutional Aspects of Water Management, Allocation of Uses,Control of Contamination, and Urban Drainage.” Final Report prepared byNeil S. Grigg, Larry J. MacDonnell, Darrell G. Fontane, Charles W. Howe,Marie L. Livingston, Larry A. Roesner, and Jose D. Salas, Boulder, Colorado.
Curtis, Val, and Sandy Cairncross. 2003. “Effect of Washing Hands with Soap onDiarrhea Risk in the Community: A Systematic Review.” Lancet InfectiousDiseases 3 (5): 275–81.
DANE (Departamento Administrativo Nacional de Estadísticas). 2003. EncuestaNacional de Hogares. Bogotá.
DHS (Demographic and Health Survey). 2000. Encuesta Nacional de Hogares.Bogotá: Departamento Administrativo Nacional de Estadísticas.
Enríquez, Santiago. 2004. “An Evaluation of the Colombian Water PollutionRetributive Charge.” Background paper prepared by consultant for the WorldBank, Washington, DC.
Esrey, Steven A. 1996. “Water, Waste and Well-being: A Multicountry Study.”American Journal of Epidemiology 143(6): 608–23.
Esrey, Steven A., J. B. Potash, L. Roberts, and C. Shiff. 1991. “Effects of ImprovedWater Supply and Sanitation on Ascariasis, Diarrhoea, Dracunculiasis,Hookworm Infection, Schistosomiasis, and Trachoma.” World HealthOrganization Bulletin 69(5): 609–21.
Fewtrell, Lorna, and John Colford Jr. 2004. “Water, Sanitation and Hygiene:Interventions and Diarrhoea: A Systematic Review and Meta-Analysis.” HNPDiscussion Paper, World Bank, Washington, DC.
Garay, Jorge Luis, ed. 2002. Colombia: Entre la esclusión y el desarrollo (Colombia:Between Exclusion and Development). Bogotá: Contraloría General de laRepública.
Huttly, S., S. Morris, and V. Pisani. 1997. “Prevention of Diarrhoea in YoungChildren in Developing Countries.” WHO Bulletin 75 (2): 163–74.
Larsen, Bjorn 2004. “Cost of Environmental Damage: A Socio-Economic andEnvironmental Health Risk Assessment.” Consultant Report prepared forMinistry of Environment, Housing and Regional Development, Colombia.
———. 2005. “Cost Benefit Analysis of Environmental Protection: A Socio-Economic and Environmental Health Risk Assessment.” Consultant Reportprepared for Ministry of Environment, Housing and Regional Development,Colombia.
Libhaber, Menahem, and Vivian Foster. 2003. “Urban Water and SanitationSector.” In Colombia: The Economic Foundation of Peace, ed. Marcelo Giugale,Olivier Laforcade, and Connie Luff, 433–62. Washington, DC: World Bank.
198 Larsen and Sánchez-Triana

Mead, Paul, Laurence Slutsker,Vance Dietz, Linda F. McCaig, Joseph S. Bresse, CraigShapiro, Patricia M. Griffin, and Robert V. Tauxe. 1999. “Food-Related Illnessand Death in the United States.” Emerging Infectious Diseases 5(5): 607–25.
Murray, Christopher J. L., and Alan D. López. 1996. Global Burden of Disease.Cambridge, MA: Harvard University Press.
Pinfold, J., and Nigel Horan. 1996. “Measuring the Effect of a Hygiene BehaviourIntervention by Indicators of Behaviour and Diarrhoeal Disease.” Transactionsof the Royal Society of Tropical Medicine and Hygiene 90 (4): 366–71.
Pruss, Annette, David Kay, Lorna Fewtrell, and Jaime Bartram. 2002. “Estimatingthe Burden of Disease from Water, Sanitation and Hygiene at the GlobalLevel.” Environmental Health Perspectives 110 (5): 537–42.
Quick, R. E., L. V. Venczel, E. D. Mintz, L. Soleto, J. Aparicio, M. Gironaz, L.Hutwagner, K. Greene, C. Bopp, K. Maloney, D. Chavez, M. Sobsey, and R. V.Tauxe. 1999. “Diarrhea Prevention in Bolivia through Point-of-use Treatmentand Safe Storage: A Promising New Strategy.” Epidemiology and Infection 122(1): 83–90.
Saadé, Camille, Massee Bateman, and Diane Bendahmane. 2001. The Story ofA Successful Public-Private Partnership in Central America: Handwashing forDiarrheal Disease Prevention. Arlington, VA: Basic Support for ChildSurvival Project II, the Environmental Health Project, the United NationsChildrens Fund, United States Agency for International Development, andthe World Bank.
Sánchez-Triana, Ernesto, and Juliana Morillo. 1998. “Propuesta de Reforma delSistema de Licencias Ambientales.” Consultant Report, Ministerio del MedioAmbiente, Bogotá.
WHO (World Health Organization). 2002a. Global Burden of Disease 2002.Geneva: WHO.
———. 2002b. The World Health Report 2002. Geneva: WHO.
WHO (World Health Organization) and UNICEF (United Nations ChildrensFund). 2000. World Health Report. Geneva: WHO.
World Bank. 2001. “Colombia Water Sector Reform Assistance Project.” ProjectAppraisal Document, World Bank, Washington, DC.
———. 2004. “Colombia APL1— Water & Sanitation Sector Support Project.”Project Appraisal Document, World Bank, Washington, DC.
Waterborne Diseases Remain Widespread 199

Poor air quality is a significant problem in Colombia, especially for the three-quarters of Colombians who live in urban areas. Air pollution is associated withincreased respiratory illnesses and premature mortality, damage to buildingsand vegetation, and poor visibility. Particulate matter alone is responsible for anestimated 6,000 premature deaths and 7,400 new cases of chronic bronchitisin the country every year. To tackle this problem, Colombia urgently needs tointensify its efforts to implement a broad strategy for reducing general urban airpollution, particularly fine particulate matter.
Air quality problems tend to be most severe in urban areas, where bothpopulation and pollution sources, such as automobiles and industry, aremost concentrated.1 In Colombia, more than three-fourth of the popu-lation live in urban areas, and about one-third live in cities with morethan 1 million inhabitants (World Bank 2005). Increased respiratory ill-ness and premature mortality are the principal air pollution–inducedhealth problems in the country. In addition, air pollution damages buildingsand vegetation and lowers visibility.
Comparisons between the annual mean concentrations of particulatematter less than 10 microns in diameter (PM10) in Colombia’s main citiesand those of other urban centers must be made with caution because ofthe complexities and challenges associated with the measurement of
C H A P T E R 7
Improving Air Quality
201

these pollutants. In many cases, cities have a monitoring network in whichconcentrations vary widely from one station to another or from one timeperiod to the next, and thus the mean value may not accurately reflectthe severity of air pollution. However, a first approximation suggests thatPM10 concentrations in Bogotá are similar to those in other Latin Americancities with severe air pollution, including Mexico City and Santiago, Chile.The differences in mean PM10 concentrations are much more obviouswhen compared with those of cities outside the region. Cities such as LosAngeles, Rome, and Tokyo have successfully reduced their ambient concen-trations to levels lower than in Medellín and Bucaramanga (figure 7.1).
Although several major pollutants, including ozone, cause concern inurban areas, the most serious health effects are caused by respirableparticulate matter of less than 2.5 microns (PM2.5). Pollution from particu-late matter is responsible for an estimated 6,000 premature deaths and7,400 new cases of chronic bronchitis every year (Larsen 2004). Airpollution in Colombia contributes to about 13,000 hospitalizationsand 255,000 emergency room and outpatient visits to hospitals eachyear (table 7.1).
As detailed in chapter 5, the mean estimated annual health cost ofurban air pollution from particulate matter (PM) alone is aboutCol$1.5 trillion (US$698 million), or 0.8 percent of gross domesticproduct (GDP). About 65 percent of the cost is associated with mortal-ity, and 35 percent with morbidity. Because PM has the greatest healthand economic impacts it is the main focus of this chapter.
202 Morgenstern, Larsen, and Sánchez-TrianaP
M10
ave
rag
e an
nu
al c
on
cen
trat
ion
s (µ
g/m
3 )
0
10
20
30
40
50
60
70
80
Santia
go
Mexico
City
Bogotá
Medell
ín
Bucar
aman
ga
São P
aolo
Tokyo
Rio de
Jane
iro
Los A
ngele
s
Madrid
Rome
New Y
ork
Paris
Figure 7.1 Mean Annual Concentration of PM10
in Cities
Source: World Bank 2005.
Note: μg/m3 � micrograms per cubic meter.

More than 80 percent of national costs from PM are concentrated in onlyfour departments and the Bogotá capital district. Bogotá alone accountsfor 50 percent of national costs, which is equivalent to nearly 2 percentof Bogotá’s GDP, or nearly 3 percent of GDP if the cost of mortality isbased on the value of statistical life (VSL) approach (Larsen 2005b).
The rest of this chapter will examine the existing legal and regulatoryframework for air quality management, the performance of that frame-work, the range of potential interventions to control air pollution, thecosts and benefits of interventions to control emissions from mobilesources in Bogotá, and conclusions and recommendations for improvingair quality in Colombia.2
Air Quality Management
The following sections describe the legal framework that governs airquality management in Colombia. This is followed by examination of keypollutants and monitoring systems, and controls relating to stationary,mobile, and nonpoint sources of air pollution.
Legal FrameworkThe framework for Colombia’s air quality management system originatedin Law 2811 of 1974, the National Code for Renewable NaturalResources and Environmental Protection. That code did not includespecific regulations for air pollution control, but Article 75 specified thatthe national government should approve regulations to prevent airpollution. Consequently, Law 9 of 1979 (the Sanitary Code) defined thegeneral criteria for further development of regulations related to themanagement and control of wastes, effluents, and emissions that could
Improving Air Quality 203
Table 7.1 Estimated Health Impact of Urban Air Pollution in Colombia
Annual impacts
Health categories New cases Total DALYs
Premature mortality 6,040 45,300
Chronic bronchitis 7,410 16,300
Hospital admissions 12,970 210
Emergency room visits and outpatient hospital visits 255,000 1,150
Restricted activity days 42,000,000 12,640
Lower respiratory illness in children 585,000 3,800
Respiratory symptoms 135,000,000 10,100
Total n.a. 89,500
Source: Larsen 2004.
Note: DALYs = disability-adjusted life years; n.a. = not applicable.

affect human health. The Sanitary Code was prepared by the Ministry ofHealth and led to preparation and approval of Decree 2 of 1982, whichdefined national ambient standards for five air pollutants—totalsuspended particulates (TSP), sulfur dioxide (SO2), carbon monoxide(CO), nitrogen oxides measured as nitrogen dioxide (NO2), and ozone(O3). These standards, determined by the Ministry of Health and theDepartment of National Planning, were developed without publicparticipation because participatory mechanisms were very limited at thetime (Universidad de los Andes 2004b).
Before 1993, the key authorities responsible for air quality manage-ment in Colombia were the national and local health authorities, whilein Bogotá the Department of Transportation was responsible for control-ling air pollution emissions generated by vehicles (Universidad de losAndes 2004b). Law 99 of 1993, which created both the Ministry ofEnvironment (Ministerio del Medio Ambiente, MMA) and the NationalEnvironmental System, transferred responsibility for air quality manage-ment to environmental authorities.
The Ministry of Environment, Housing and Regional Development(Ministerio de Ambiente, Vivienda y Desarrollo Territorial, MAVDT) isresponsible for issuing all environmental legislation related to air quality oremissions generated by every type of source (fixed, mobile, or nonpoint).The Autonomous Regional Corporations (Corporaciones AutónomasRegionales, CARs) or Urban Environmental Authorities (AutoridadesAmbientales Urbanas, AAUs) are in charge of implementing or complyingwith these norms. Nevertheless, the CARs and AAUs can, under the sub-sidiary principle considered in Law 99 of 1993, issue more stringentrequirements that are initially temporary (for two months), and theministry, through an evaluation presented by the CARs or AAUs, can makethose requirements permanent in accordance with the requirements andparameters established in Decree 948 of 1995 (MAVDT 2006, p. 7).
Based on Law 99 of 1993, Decree 948 of 1995 established the firststandards for fuel quality and for emissions from mobile and nonpointsources. Decree 948 was followed by a series of additional decrees andresolutions, described in table 7.2, that regulated emissions from bothmobile and stationary sources.
Key Pollutants and Monitoring SystemsKey sources of air pollution include stationary point sources such asfactories and power plants; mobile sources that consist almost entirely of
204 Morgenstern, Larsen, and Sánchez-Triana

Improving Air Quality 205
Table 7.2 Development of National Norms on Air Pollutant Emissions, 1995–2002
Decree or resolution Regulation or requirements
Decree 948 (1995) Structures the legal framework to be developed for air, not only with
respect to emission standards for mobile sources but also for fixed,
dispersed, and nonpoint sources; the development of intake emis-
sion norms and the mechanisms for their monitoring and oversight;
fuel quality guidelines for developing standards on noise and odors;
functions of environmental authorities; permits and licenses;
public participation; and penalty rulings. In general, it establishes
the policy framework for developing measures to prevent and
control atmospheric pollution and to protect air quality
(MAVDT 2006, p. 7).
Decree 2107 (1995) Relaxes some restrictions on heavy oils, controlled burning, and
the time required to adopt cleaner technologies to protect the
atmosphere (issued in Decree 948 of 1995). Establishes regulations
on diesel vehicles, emissions by mobile sources, and requirements
for emissions permits.
Res. 898 (1995) Regulates environmental criteria for quality of solid and liquid fuels
used in commercial and industrial kilns and boilers and in motor
vehicle engines;
• Regulates quality of liquid fuels, gasoline, and diesel
• Regulates quality of mineral coal used in kilns and boilers
• Establishes maximum sulfur content of 1.7 percent by weight
for industrial fuel oil
Res. 1351 (1995) Adopts Form IE-1 (Industrial Emissions), also called the “Report of
the State of Emissions,” to be filled out and presented to the com-
petent environmental authority by emissions producers or their
legal representatives.
Res. 005 (1996) Includes a glossary of technical definitions, general regulations for
emissions, procedures to measure emissions, requirements
for operation of measuring equipment, certification for
mobile emission sources, mandatory verification process, and
monitoring of diagnostic centers. Partially modified by
Resolution 909 of 1996.
Res. 378 (1997) Establishes the characteristics for emission certification tests for car
manufacturers and importers of vehicles.
Res. 619 (1997) Determines the factors for granting permits to nonmobile
emission sources.
Decree 1228 (1997) Requires importers of vehicles and vehicle assembly kits to present
an Emissions Certification by Dynamic Test that is approved by
the Ministry of Environment as complying with emissions require-
ments by vehicle weight.
Decree 1697 (1997) Loosens Decree 948 by establishing new regulations for burning
used lubricant oils and for sulfur content and other polluting sub-
stances in fuels.
(continued)

exhaust from vehicles; and nonpoint sources that include agriculture,construction, and emissions from the residential and commercial sectors.
Particulate matter is the term for airborne particles, including dust, dirt,soot, smoke, and liquid droplets. Particles can be suspended in the air forlong periods. Some particles are directly emitted into the air. They comefrom a variety of sources such as vehicle exhaust, factories, constructionsites, tilled fields, unpaved roads, stone crushing, and burning of wood.Particles also can be created by atmospheric conversion of SO2 andnitrogen oxide (NOx) into sulfates and nitrates. Most measurements ofparticulate matter in Colombia are of TSP. Only Bogotá has monitoringstations that measure PM10, which can be inhaled into the lungs and lead
206 Morgenstern, Larsen, and Sánchez-Triana
Table 7.2 Development of National Norms on Air Pollutant Emissions, 1995–2002
(continued)
Decree or resolution Regulation or requirements
Res. 0415 (1998) Relaxes Decree 948 and establishes specific requirements for oil
combustion based on source, usage, and concentrations. Establishes
procedures to issue emissions permits and requires users to keep
a log that includes information on the used oil provider, source of
the oil, volume and proportion of the oil used in the mixture, and
type of fuel used in mixture with the used oil.
Res. 0623 (1998) Modifies Resolution 898 of 1995 regarding quality of solid and liquid
fuels used in commercial and industrial kilns and boilers and estab-
lishes new parameters on coal quality and mixtures used as fuel.
Res. 1048 (1999) Establishes limits on pollutants emitted by mobile sources with
diesel and gasoline engines, based on dynamic tests, for vehicles
built after 2001.
Res. 0970 (2001) Establishes emissions limits when pesticide containers are
incinerated in kilns or cement factories.
Res. 058 (2002) Establishes requirements for maintenance and control of solid and
liquid waste incinerators and sets emission limits based on
• Average daily and half-hourly concentrations per contaminant,
• Concentrations of heavy metals,
• Concentrations of dioxins and furans.
Res. 0886 (2004) Relaxes emission time limits and maximum emission restrictions,
clarifies and distinguishes operating limits and characteristics
(particularly temperatures and chambers) for incineration plants
according to loads and for crematory ovens.
Res. 1446 (2005) Modifies Resolution 0415 of 1998, establishing conditions for the use
of untreated, used oil as fuel and the specifications and conditions
under which treated, used oil can be used, for which a specific
degree of treatment and quality standards (particularly concentra-
tions of heavy metals) should be complied with.
Source: Blackman and others 2005; Universidad de los Andes 2004b.

to respiratory illness associated with premature mortality. Despite strongscientific evidence that elevated concentrations of PM2.5 pose an evengreater health risk than PM10, no systematic monitoring information onPM2.5 is available in Colombia.3
Sulfur dioxide (SO2) is a by-product of burning fossil fuels such as crude oiland coal. Increased use of lower sulfur fuels for energy generation appearsto have reduced SO2 concentrations in Colombia over the past two decades(Universidad de Los Andes 2004). SO2 is a stinging gas that causes respira-tory ailments in humans and, as noted earlier, can be transformed in theatmosphere into sulfates that appear as fine particles. In moist environ-ments, SO2 emissions result in acidification and winter smog.4
Nitrogen oxides (NOx) also contribute to respiratory ailments in humans.They result from vehicle exhaust, combustion installations such aspower plants, and industrial and agricultural activity. NOx react withother air pollutants to form ozone and fine particulates (nitrates) in thelower atmosphere and also contribute to acidification processes. The useof catalyzers in car exhaust systems can reduce NOx emissions frommotor vehicles.
Volatile organic compounds (VOCs) encompass various contaminants,including organic compounds and solvents.These compounds are emittedfrom petroleum reservoirs, storage systems for gasoline and other volatilecompounds, industrial processes and fuel combustion, use of paints andcleaners, and agricultural activities. VOCs are the main cause of smog inthe lower atmosphere. They react with other chemicals in the atmos-phere to create harmful secondary pollutants, including ozone, and causehealth problems ranging from eye irritation to decreased lung capacityand even cancer.
Carbon monoxide (CO) is a product of incomplete combustion of fuels.CO binds to hemoglobin in the blood, preventing the transport of oxygento vital organs.
Colombia has a fairly long history of air quality monitoring. During1967 to 1975, the Pan American Health Organization and the Ministry ofHealth set up and operated systems to monitor TSP and SO2 in severalcities, including Bogotá and Medellín. These programs were taken overfully by the Ministry of Health in 1974. More monitoring stations wereset up in many locations in response to Decree 2 of 1982. In Bogotá, the
Improving Air Quality 207

208 Morgenstern, Larsen, and Sánchez-Triana
Department of Health installed and operated 12 monitoring stationsduring 1983 to 1991. During 1990 to 1993, the Japan InternationalCooperation Agency financed the installation and operation of five addi-tional monitoring stations. The data generated by these stations were usedextensively by the Ministry of Health to control air pollution in the mostimportant urban centers.
Law 99 of 1993 removed all responsibility for air pollution controlfrom the Ministry of Health and the Secretariats of Health. As a result,during 1993 to 1997 there were no air quality monitoring networks inoperation in Colombia. In 1997, the AAU for Bogotá (the DepartamentoAdministrativo del Medio Ambiente, DAMA) installed a new network of12 stations that monitored a range of pollutants, including PM2.5, PM10,the five pollutants specified in Decree 2 of 1982, and others. However,PM2.5 was only monitored until 1999, when the equipment was damagedand not replaced. The story is somewhat similar in Medellín, with theinstallation of seven stations by the Department of Health in 1983. Thesestations were replaced by a new system in the late 1990s, composed of 18stations in the Aburra Valley with the capacity to measure PM10 and thefive pollutants noted in Decree 2 of 1982. However, the operation of thisnewest network has been interrupted several times by legal issues andproblems associated with calibration of equipment, resulting in informa-tion voids (Universidad de los Andes 2004b).
Air Quality StandardsTable 7.3 shows the maximum annual, daily, and hourly ambientconcentrations for TSP, SO2, CO, NO2, and O3 established in Decree 2of 1982, which are still in effect today. Limits refer to continuous samplestaken over a specific period (1, 3, 8, or 24 hours).The annual limit allowsfor days with higher concentrations as long as the annual average con-centration does not exceed the specified levels. Similarly, concentrationscan exceed the daily or hourly limits as long as the overall concentrationfor the day or hour period specified is below the level.
In Bogotá, DAMA issued Resolution 1208 of 2003, which establishedmore stringent requirements or shorter averaging periods for a numberof pollutants and, most important, introduced a formal standard forPM10. For the purpose of measuring air quality, DAMA divided the cityinto five sectors served by a total of 14 stations with air quality monitorsthat have been in operation since 1997. Rules for monitoring and stan-dards for concentration levels are included in DAMA Resolution 391 of2001. The standards in effect in 2003, along with future requirementsfor 2006 and 2010, are shown in table 7.4.

Improving Air Quality 209
Table 7.3 Air Quality Standards: Decree 02 of 1982
Pollutant Limit Observations
Total suspended particles 100 μg/m3 Annual geometric average of all daily samples
(TSP) 400 μg/m3 Maximum daily concentration, exceeded only
once a year
Suspended particles (PM10
) No separate limit established
Sulfur dioxide (SO2) 100 μg/m3 Annual arithmetic average of all daily samples
400 μg/m3 Maximum daily concentration, exceeded only
once a year
1,500 μg/m3 Maximum 3-hour concentration, exceeded
once a year
Carbon monoxide (CO) 15 mg/m3 Maximum 8-hour concentration
50 mg/m3 Maximum 1-hour concentration
Nitrogen dioxides 100 μg/m3 Annual arithmetic average of all daily samples
(measured as NO2)
Photochemical oxidants 170 μg/m3 Maximum 1-hour concentration, exceeded
(expressed as ozone, O3) once a year
Source: Sánchez-Triana and Medina 1994.
Note: μg/m3 = micrograms per cubic meter.
Table 7.4 Standards for Air Quality in Bogotá, DAMA Resolution 1208 of 2003
Limit (μg/m3)
Pollutant Period Description 2003 2006 2010
Carbon monoxide 8 hours Average hourly concentration 12,000 11,000 10,000
(CO) for 8 hours
1 hour Average hourly concentration 40,000 40,000 40,000
Sulfur dioxide (SO2) Annual Arithmetic average of the average 80 70 60
daily concentrations for 365 days
24 hours Average hourly concentration 350 325 300
for 24 hours
3 hours Average hourly concentration 1,400 1,350 1,300
for 3 hours
Nitrogen dioxide Annual Arithmetic average of the average 100 100 100
(NO2) daily concentrations for 365 days
24 hours Average hourly concentration for 220 180 150
24 hours
1 hour Average hourly concentration 320 320 320
Ozone (O3) 8 hours Average concentration for 8 hours 130 110 100
1 hour Average hourly concentration 170 155 150
Total suspended Annual Geometric average of the average 100 85 80
particles (TSP) daily concentrations for 365 days
24 hours Average hourly concentration for 400 300 300
24 hours
Particulate matter Annual Arithmetic average of the average 80 55 50
(PM10
) daily concentrations for 365 days
24 hours Average hourly concentration for 180 155 150
24 hours
Source: Universidad de los Andes 2004b.
Note: μg/m3 = micrograms per cubic meter.

210 Morgenstern, Larsen, and Sánchez-Triana
Stationary Source ControlsEmission standards established under Decree 02 of 1982 govern thevolume and concentration of PM, SO2, and NO2 that may be emitted tothe outside air through a duct. They also establish minimum allowablestack heights. PM is classified according to the type of activity involved:
• Coal-fired boilers• Cement industry, including kilns (where clinker is produced), mills
(where clinker is crushed), and clinker coolers• Metallurgy industry because it uses induction kilns and electric arc
furnaces• Asphalt factories• Incinerators of all waste types (domestic, industrial, special, and
hazardous).
The allowable stack height for boilers depends on the location (rural orurban). The minimum height is 15 meters. The volume of allowableemissions is based on energy consumption. The standard is stated in kilo-grams of particles per million kilocalories of energy consumed per hour.The emissions standards established for boilers in Decree 02 of 1982 arestill in effect today.
Allowable emissions for clinker kilns in the cement industry dependon output. That is, the standard is stated in terms of PM per tons ofcement produced. The minimum height of the chimney is 30 meters.
There are specific controls on emissions for some activities. For exam-ple, allowable emissions from the production of sulfuric acid (H2SO4) arestated in terms of SO2, SO3, and H2SO4 per ton of output and the mini-mum stack height is set at 25 meters. Article 79 of the Decree containsspecific controls for boilers, kilns, and other combustion processes thatgenerate SO2 emissions. While Article 79 does not limit the concentrationof SO2 emissions, it does govern stack height according to the sulfur con-tent of the fuel. Similarly, Chapter VI of the Decree governs emissions ofNO2 from the production of nitric acid.
Resolution 058 of 2002 and Resolution 0886 of 2004 regulate emis-sions from incinerators that burn any of a wide range of wastes, includingwastes containing polycyclic aromatic hydrocarbons such as polychlo-rinated biphenyls, pentachlorophenol, nonexplosive liquid or solidwastes, additives for lubricant oils, wood treated with halogenatedcompounds, domestic waste, residues from petroleum refineries andnaphtha production, medical waste, and any other waste indicated bythe Ministry of Health.5

Although detailed information about compliance is not available forthese standards, it is widely believed that noncompliance is a seriousproblem. According to Blackman and others (2005), in the case of incin-erators, informal interviews with industrial experts undertaken byResources for the Future (RFF) suggest that the combination of stringenttechnical standards and siting problems may be an important deterrentto compliance. However, the MAVDT (2006, p. 8) considers that thestandards established in the country for incinerators are similar to thoseestablished by the U.S. Environmental Protection Agency and that someparameters (such as dioxins and furans) are more flexible (time limits of10 years to comply with standards that in some cases are more lax thanthose of the U.S. Environmental Protection Agency), and that compli-ance is economically and technically feasible.
Mobile Source ControlsOn the basis of studies conducted by Fedesarrollo (Perry and others1991; Perry and others 1993) and a study conducted by the ColombianPetroleum Company (Ecopetrol 1992), the National PlanningDepartment decided, in 1994, to phase out leaded gasoline.This decisionmarked the most notable advance to date in the history of air pollutioncontrol in Colombia.
Resolution 005 of 1996 regulates hydrocarbon (HC) and CO emis-sions from gasoline vehicles and the opacity of emissions from dieselvehicles, measured via static tests (idling or running). In addition, itincludes HC, CO, and NOx emission standards for dynamic testing ofvehicles imported since 1997 (modified by Resolution 1048 of 1999).These standards apply to all types of vehicles: public and private, auto-mobiles, buses, and trucks (MAVDT 2006, p. 8).
In the 1990s, Departamento Técnico Administrativo del Medio Ambiente,Bogotá (DAMA) and Departamento Administrativo de Gestión del MedioAmbiente, Cali (DAGMA) established environmental vehicle controlprograms. Requirements for periodic emissions tests of vehicles wereestablished. Emissions certificates are issued at specialized diagnostic centersto vehicles that pass the emissions test. If the vehicle does not pass the test,the owner must perform the required adjustments to the engine.The diag-nostic centers are audited periodically to determine if the proper proce-dures are being followed.
In some cities, mobile brigades have been introduced to checkvehicles for current emissions certificates. Bogotá introduced a “daywithout my car” program on a pilot basis that designated day each yearprivate vehicles (excluding buses or taxis) are banned from city streets.
Improving Air Quality 211

In addition to tailpipe emission standards, fuel quality is a majorcontributor to mobile source emissions. Table 7.5 shows standards for thesulfur content of gasoline and diesel. In Bogotá, with the advent of theTransmilenio System, a new type of fuel called diesel extra with a sulfurcontent of 1,200 parts per million (ppm) was introduced for use in buses(Resolution 068 of 2001).
Resolution 1565 of 2004, issued by MAVDT and the Ministry ofMining and Energy, postponed until July 1, 2008, the requirement thatthe sulfur content of all gasoline and diesel in Colombia be reduced to500 ppm or less. To meet this new standard, Ecopetrol plans to modern-ize its Cartagena refinery and implement a new hydro-treatment programat the Barrancabermeja refinery. If those modernization plans are notcompleted on time, fuel imports may have to be increased to meet thenew standard. Finally, efforts are under way to further increase theavailability of natural gas and encourage its use as a transportation fuel,especially in the largest urban centers.
Fuel SubsidiesHistorically, the price of fuels in Colombia has been controlled in line withdomestic production costs rather than international prices. These pricecontrols have in effect subsidized domestic fuel consumption, therebyexacerbating congestion, air pollution, and health and environmentaldamage. In the 1990s, several studies (Krupnick, McConnell, and UribeBotero 1996; Perry and others 1991; Perry and others 1993) estimated thatgasoline prices were about 30 to 35 percent below international levels.Diesel prices are reportedly even further below international levels.
The current policy is to reduce future demand for fuel in the trans-portation sector by bringing local prices of gasoline and diesel into linewith international prices by 2006 through annual adjustments of about15 percent in 2005 and 2006. One study estimated that this policywould reduce demand for transportation fuels by 8 percent relative to2002 levels (Brugman 2004). Corresponding reductions in emissions of
212 Morgenstern, Larsen, and Sánchez-Triana
Table 7.5 Regulation of Sulfur Content in Gasoline and Diesel Fuels
Sulfur content (ppm)
Resolution (Ministry of Environment) Gasoline Diesel Diesel extra
898 of 1995 1,500 6,000 n.a.
068 of 2001 1,000 4,500 1,200
Source: Blackman and others 2005; Universidad de los Andes 2004.
Note: n.a. = not applicable; ppm = parts per million.

Improving Air Quality 213
PM10, SOx, and NOx are estimated to be about 2.3 percent in 2005 and7.7 percent by 2020. In addition, a 20 percent local surtax on gasolinehas been introduced as part of the Transmilenio mass transit system, withhalf of the revenues (mostly paid by private vehicles) used to supportTransmilenio while the other half is earmarked for road maintenance andrelated activities.
Currently, about 15 percent of the 7 million daily trips by publictransportation in Bogotá are made on Transmilenio.6 Transmilenio useshigh-capacity buses that travel at an average speed of 27 kilometers(16.9 miles) per hour along 56 kilometers (35 miles) of exclusive cor-ridors. For each new bus added to the Transmilenio system, seven oldbuses are destroyed. As part of the Transmilenio system, extensivebicycle paths also have been constructed throughout the city.
One study evaluated the reduction of emissions associated with masstransportation systems in Barranquilla, Bogotá, Cali, Medellín, andPereira (Brugman 2004). According to this study, these systems areexpected to reduce emissions of PM10, SOx, and NOx caused by mobilesources by an estimated 4.2 percent, 0.9 percent, and 2.6 percent,respectively, in 2005, and by 6.5 percent, 1.6 percent, and 5.9 percent,respectively, by 2020 (table 7.6). Unfortunately, no specific data areavailable on the air quality effects of Transmilenio. However, the dieselextra used by the Transmilenio buses does have a lower sulfur content.
Nonpoint SourcesAlthough a considerable number of nonpoint sources contribute to thedegradation of air quality in Colombia, most attention has focused onthe practice of burning sugarcane fields at certain stages of the cultivation
Table 7.6 Emissions Reductions with Mass Transportation Systems, 2004–20
Pollutant (tons) Pollutant (percent)
Year PM10
SOx
NOx
Total PM10
SOx
NOx
Total
Average emissions, 36,067 108,017 237,961 382,045 100 100 100 100
2001–03
Reduction
2004 684 443 2,820 3,947 1.9 0.4 1.2 1.0
2005 1,500 1,014 6,124 8,638 4.2 0.9 2.6 2.3
2010 2,480 1,528 12,183 16,192 6.9 1.4 5.1 4.2
2015 2,296 1,643 12,550 16,488 6.4 1.5 5.3 4.3
2020 2,333 1,750 14,124 18,207 6.5 1.6 5.9 4.8
Source: Brugman 2004.
Note: The systems include those of Barranquilla, Bogotá, Cali, Medellín, and Pereira.

214 Morgenstern, Larsen, and Sánchez-Triana
cycle, which can cause serious air pollution problems. Efforts have beenmade to restrict burning and reburning in populated areas. For example,the Regional Autonomous Corporation for the Cauca Valley (CorporaciónAutónoma Regional del Valle de Cauca, CVC) has reached a voluntaryagreement with the association of sugarcane farmers under which theyuse the so-called green cut method7 for harvesting crops within 1,000meters of urban areas, 30 meters from villages, 80 meters from highways,and 30 meters around high-tension transmission lines.
According to MAVDT (2006, p. 8), the “sugarcane sector has beenworking for almost 10 years on the mechanization of crops and theirdevelopment, using scientific studies and knowledge of atmospheric con-ditions to create mechanisms that minimize the impact of the practice ofburning the sugarcane fields, which are the circumstances under whichthe Ministry issued Resolution 1565 of 2004 establishing the conditionsand measures necessary to promote this practice.While the impact of thisburning cannot be denied, medical studies by the ColombianPneumological Foundation have not found greater impacts than those ofother activities, aside from ‘the serious problems’ of air pollution.”
Performance of the Air Quality Management System
Information available on the performance of Colombia’s air quality man-agement system falls into two general categories: process measures andoutcome measures. Process measures are specific actions undertakenwith the goal of improving air quality, such as the number of vehiclesinspected or the number of hectares of sugarcane harvested throughgreen cuts. Outcome measures are more direct indicators of air quality.The most direct outcome measures are ambient concentrations of fineparticles or other major pollutants, calculated on a daily or annual basis.Despite the obvious limitations, emissions also are treated as outcomemeasures of the air quality management system.
Emissions by PollutantAir quality regulations have been in effect in some form for over twodecades in Colombia. The Institute of Hydrology, Meteorology, andEnvironmental Studies (Instituto de Hidrología, Meteorología y EstudiosAmbientales, IDEAM) has developed a number of baseline indicators.The methodology underlying these indicators has been used to developnational estimates and to assist with the management of urban air qual-ity throughout the country.

Emissions estimates are based on a standard formulation that relies onemissions factors rather than monitoring data.8 Information on economicactivity is derived from the yearly manufacturing survey of the NationalAdministrative Statistics Department (Departamento AdministrativoNacional de Estadísticas, DANE). Emissions factors are taken fromvarious sources including the Industrial Pollution Projection System, theIntergovernmental Panel on Climate Change, the U.S. EnvironmentalProtection Agency, and the European Union’s emission inventory program.Emissions estimates cover 232 municipalities included in DANE’s manu-facturing survey, but only include industries with more than 10 employeesor output valued at Col$70.5 million (US$32,800) or more per year(1999 values).Thus, brick kilns and other small firms––which may be largesources of emissions––are typically excluded.
Although the preferred approach for aggregating emissions acrosspollutants is based on the economic damage caused by the emissions, asimple aggregation based on the total tons can reveal patterns aboutemission sources. For example, Bogotá clearly tops the list for total(aggregate) tons of particulate matter emitted. However, the municipal-ity of Nobsa, with a population of less than 10,000, has higher emissionsthan many large cities (Pereira, for example) because of its relativelyhigh concentration of artisan brick kilns and cement and steel factories.The highest aggregate level of SO2 emissions is found in cities with alarge number of power plants or other industrial facilities burning bio-mass, coal, or high-sulfur fuel oil.
It is also useful to look beyond the legal boundaries of cities andexamine emissions in the broader context of urban and industrial centers.Such an examination shows that there are sometimes large differences,measured in tons of pollution, between emissions from within themunicipal boundaries and those from the larger urban and industrialcenters. For example, stationary emissions of PM in the industrial corridorof Cali-Yumbo are higher than those in the city of Cali itself.
More detailed information is available for selected areas. A study bythe Universidad de los Andes (2004b) found that in Bogotá, PM emissionsfrom stationary sources grew by 182 percent during 1989 to 1999, withindustrial kilns and furnaces––including many small and medium enter-prises––accounting for three-fourths of the emissions from these sources.According to the study, the principal fuels used in the manufacturingsector in Bogotá are diesel (44.9 percent), crude oil (24.7 percent), andcoal (7.5 percent). In Medellín and the 10 surrounding municipalitiesthat form the metropolitan area of the Aburra Valley, the main polluting
Improving Air Quality 215

industries are paper, cement, brickmaking, and steel, and the key energysources are hydroelectric (16.6 percent), diesel (12.2 percent), coal(49.1 percent), and crude oil (22.1 percent).
Unfortunately, environmental regulatory agencies generate very littleinformation about compliance by stationary sources of emissions.However, the 2004 Universidad de los Andes study shows that inBogotá, 2,372 permitted facilities self-report their emissions on an annualbasis and that DAMA audits a group of 70 randomly selected facilities.In 2003, these facilities recorded a 63 percent compliance rate withnational air emissions standards (Decree 2 of 1982) and a 41 percentcompliance rate with the local standards (Resolution 391 of 2001). InMedellín, 160 random inspections of industries were conducted in 2003,covering about 30 percent of all industrial establishments, according tothe study. In addition, 53 inspections were conducted in response topublic complaints. However, information on the degree of noncompli-ance is not available.
Ambient Monitoring for Select AreasIn contrast to emissions, which reflect the amount of pollution enteringthe atmosphere, ambient information reflects the quality of air to whichpeople are actually exposed. While CO, O3, NOx, VOCs, and TSP are allassociated either directly or indirectly with respiratory or other healtheffects, the strongest epidemiological link between air pollution and pre-mature mortality is through elevated concentrations of PM10. Given thatan estimated 6,000 premature deaths in Colombia result each year fromelevated PM10 concentrations (Larsen 2004), it is appropriate that areview of the monitoring data should focus on ambient concentrationsof this pollutant.
Bogotá and Cali are the only cities with ambient PM10 standards.Unfortunately, only limited monitoring data are available to measurecompliance. There are about 70 air quality monitoring stations inColombia (Kojima 2004). Most of them track TSP, a few monitor PM10,and none monitor PM2.5 regularly. No nationwide specifications apply tomonitoring equipment or operating procedures. Automated instrumentsare used only in Bogotá, Cali, Bucaramanga, and Barranquilla, while manualor manual-automated combinations are used in other areas. Varioustechnical problems have been reported related to the operation andmaintenance of the automated instruments, which rely on sophisticatedelectronics.9 Furthermore, the data that are collected are not analyzed ata central level. Concerns also have been raised about the location of the
216 Morgenstern, Larsen, and Sánchez-Triana

monitors, specifically, that they exclude likely “hot spots.” Reportedly,there are plans to relocate some stations.
Notwithstanding the many technical issues surrounding the quality ofdata on ambient air quality, table 7.7 displays the available monitoringresults for annual PM10 concentrations in Bogotá and other selectedurban areas from 1998 to 2004. In Bogotá, monitoring stations are dis-tributed throughout the city. In most other urban areas, monitoring ismore limited. For example, in Bucaramanga there reportedly is only onemonitoring station.
Improving Air Quality 217
Table 7.7 Annual Ambient PM10
Levels in Selected Cities
μg/m3
Region and station 1998 1999 2000 2001 2002 2003 2004 Change
Bogotá — — — 65 67 60 —
CADE 71 65 68 52 54 46 —
Sony 80 79 69 75 74 56 —
Cazuca 85 75 70 62 65 56 —
Santo Tomás 32 30 38 33 42 33 —
MAVDT 49 49 53 42 55 42 —
Escuela — — — — 50 53 —
Bosque 33 31 32 30 26 — —
Corpas 54 45 42 61 97 92 —
Carrefour — — — 59 97 89 —
Fontibón — — — 93 93 97 —
Merck — — — 96 92 101 —
Olaya 64 — — — — — — —
Bucaramanga — — — 51 56 57 —
Medellín — — — — 59 63 64
Yumbo and Palmira
Palmira — 43 — 54 — — —
Yumbo Center (Sta. Station) — — 31 — — — — —
Yumbo Center (Mob. Station) — — 68 — — — — —
Acopi — — 70 — — — — —
Barranquilla
Agrecon — — — — — — 70a —
Biblioteca — — — — — — 96b —
San Nicolás Valley
Salenca 32 27 32 26 32.8 — —
Hospital 38 61 42 22 30.6 — —
Zona Franca 30 21 24 18 23.1 — —
Source: Environmental authorities of selected regions; for Medellín: Universidad Pontifica Bolivariana, Redaire’s
operator at Aburra Valley.
Note: — = not available; μg/m3 = micrograms per cubic meter.
a. Mean of February–June 2004 reading (60, 90, 60, 60, 80).
b. Mean of February–June 2004 reading (110, 120, 50, 180, 120).
��
��
��
��
��
�
�
��
��
��

218 Morgenstern, Larsen, and Sánchez-Triana
Overall, virtually all citywide estimates (except San Nicolás Valley) andmost individual monitoring sites report annual PM10 concentrations inexcess of the 50 micrograms per cubic meter (µg/m3) standard established bythe U.S.Environmental Protection Agency.Because the standards in Colombiaare much less stringent than 50 micrograms per cubic meter (µg/m3), notall these results are counted as violations. For example, in Cali the currentannual standard is 70 µg/m3, and the PM10 standard in Bogotá will betightened to 50 µg/m3 in 2010 (see table 7.4). Four of the monitoring sta-tions located in the industrial areas of Bogotá (Corpas, Carrefour, Fontibón,and Merck) recorded annual averages well in excess of the local standard.
Among the other cities with monitoring information, Medellín andBarranquilla report annual averages above 60 µg/m3, as do two of the sta-tions in Yumbo. The Bucaramanga and Palmira sites all report annualaverages below 60 µg/m3.
Although it is difficult to make a strong statement about trends in airquality based on such a limited time series, a rough assessment of theavailable information can be made. The results are reported as up ordown arrows on the right-hand side of table 7.7. Overall, a mixed pic-ture emerges of the trends in air quality. In Bogotá, the measured trendfor the citywide average is favorable, although the reverse is true for theindustrial areas of the city already in violation of the standards. Giventhe large increase in vehicles in the city (estimated by the local TransitAuthority to have risen by one-third between 2001 and 2003), theobserved improvements in the citywide (average) air quality represent asubstantial achievement reflecting, no doubt, the restrictions on vehicleuse, improvements in mass transit, increased use of natural gas, and otherpolicies recently put in place.
In some cities, the data are more limited and trend analysis is moredifficult. In other cities, the available data are not recent enough to cap-ture the impacts on air quality of certain newly instituted policies, suchas the recently established vehicle restrictions in Medellín.
Daily PM10
Concentrations Although maximum average pollutant concentrations allowed over a24-hour period are higher than average annual limits, compliance gen-erally is more difficult. Limited information is available in Colombiaon daily PM10 concentrations, but average monthly concentrationshave increased since 1996 according to one report (Universidad de losAndes 2004).

Improving Air Quality 219
The pattern of daily PM10 concentrations in Bogotá is roughly similarto the average annual concentrations shown in table 7.7, with the high-est concentrations in the western part of the city. This is predominantlyan industrial area that includes Merck and Fontibón in southwestBogotá, Clínica Corpas and Calle 80 in northwest Bogotá, and Carrefourin the midwest section of Bogotá.
In Tolima, an air quality monitoring network began operating in 2004with stations in the municipalities of Ibagué, Payandé, Lérida, and Espinal.Because the monthly average readings are not strictly consistent with thedaily (or annual) standards, it is impossible to assess these results.The net-work is still evolving, and in future years it is expected that the informationwill be reported in a format consistent with data from other regions.
Pollution Abatement ExpendituresPollution abatement expenditures are often used as a measure of effortsto reduce emissions. In the United States and many other Organisationfor Economic Co-operation and Development nations, expenditure infor-mation is generally available on a comprehensive basis, including snapshotmeasures at different times. Unfortunately, the data available on pollutionabatement control expenditures in Colombia are quite limited. There areno consistent national data even for large industrial sectors.Available data arefrom multiple sources, often with inconsistent definitions. Time seriesinformation is virtually nonexistent. Notwithstanding these gaps, it is usefulto review the available data for the electric generation and petroleumrefining industries.
Law 99 of 1993 mandates that companies that generate electricityfrom gas, coal, and hydropower allocate 4 percent, 8 percent, and 12 per-cent of their investments, respectively, to environmental managementprograms. At the same time, the power generators transfer an estimated2 to 3 percent of their revenues to the environmental authorities in theirjurisdictions. These revenues, in turn, are used to fund reforestation andriver basin management activities in the local CARs and AAUs. If consis-tently applied to environmental management, these revenues would beconsidered large, even by international standards.
Another effort relevant to investments in pollution abatementinvolves the establishment of value-added tax (VAT) exemptions providedby Law 223 of 1995. These exemptions were established to allow acqui-sition of equipment and associated supplies, national or imported, to beused in the construction, installation, assembly, and operation of control

220 Morgenstern, Larsen, and Sánchez-Triana
Table 7.8 VAT Exemptions for Environmental Investments, 1997–2003
Year Amount (billion Colombian pesos)
1997 9.0
1998 47.9
1999 57.8
2000 16.2
2001 11.0
2002 6.6
2003 8.6
Source: Controlaría 2004.
Note: US$1 = Col$2,150.
and monitoring systems for recycling and waste processing and treat-ment of sewerage or atmospheric emissions (or both). The value ofexemptions granted during 1997 to 2003 is displayed in table 7.8. Asshown, the value of the exemptions rose dramatically during 1997 to1999 but declined in an equally dramatic manner during 2000 to 2003.It is not clear to what extent these changes reflect underlying patternsof pollution abatement investment or changes in the administration ofLaw 223 of 1995. According to MAVDT (2006, p. 9), one “of the caus-es for the decline in the amount of VAT exemptions authorized in 2001is the issuance of Decree 2532 of 2003, which established specific def-initions and criteria that more clearly delimit the granting of tax bene-fits for pollution abatement investments.”
With respect to income tax exemptions, Law 788 of 2002 specifiesthat the environmental authority should certify whether a company hasthe right to deduct from its annual income the amount of its environ-mental investments made in any given fiscal year. Unfortunately, specificinformation on the operation of this provision is not available.
Mobile Source PoliciesReflecting the large contribution of vehicle emissions to urban air quality,mobile source programs have been established in major Colombiancities. Some highlights from the program implemented by DAMA inBogotá are listed below (DAMA 2003):
• Emission certification tests. Between October 2002 and October 2003,615,200 certificates were issued to vehicles that passed emissions tests.
• Checks of motor vehicles for valid emission certificates. Some 27,411vehicles were checked in 2001, of which 40 percent had valid certifi-cates. In 2002, 30,120 checks were made, with the same percentage of

Improving Air Quality 221
valid certificates. In 2003, there were 45,320 vehicle checks and thepercentage with valid certificates increased to 60 percent.
• Audits of certified diagnostic centers. The performance of diagnosticcenters and their compliance with current regulations, procedures, andequipment specifications for issuing emission certificates increaseddramatically in recent years. The number of centers that satisfied theaudits increased from only 1.9 percent in 2001 to 52.0 percent in 2003.
• Día Sin Carro.The “Day Without My Car” program bars private vehicles(not including buses and taxis) from using city streets on a specific dayonce or twice a year.The results for 2001 to 2003 are shown in table 7.9.The reason for increases on two of the days is not clear. Although someof the increase might be explained by weather patterns, it may alsoreflect greater emissions from diesel-powered buses and taxis that wereused more extensively on the days that car use was restricted.
In Cali, beginning in 1996, DAGMA established an environmental controlprogram for motor vehicles. The results of the emission inspections inthe city during 1997 to 2003 for gasoline and diesel vehicles are displayedin table 7.10.
As shown, the number of inspections of gasoline-powered vehiclesrose during 1997 to 2000 but then declined somewhat after 2000. Therejection rate, however, has declined considerably over the entire period,
Table 7.9 PM10
Concentrations on “Day Without My Car” versus Daily Average
Time frame Percent change in PM10
2001 +17.0
2002 –6.4
February 6, 2003 +9.4
September 22, 2003 –26.0
Source: DAMA 2003.
Table 7.10 Emission Inspections of Motor Vehicles in Cali, 1997–2003
Inspections and approval rates
Fuel type, result 1997 1998 1999 2000 2001 2002 2003
Gasoline vehicles 31,291 56,638 79,057 91,474 72,831 67,351 70,102
Approved (%) 81.6 86.4 92.1 94.4 95.5 94.5 96.0
Rejected (%) 18.4 13.6 7.9 5.6 4.5 5.5 4.0
Diesel vehicles 1,040 3,594 5,349 5,793 6,164 6,763 7,851
Approved (%) 91.4 90.7 90.4 93.0 93.4 90.6 92.2
Rejected (%) 8.6 9.3 9.6 7.0 6.6 9.4 7.8
Source: DAGMA 2004.

222 Morgenstern, Larsen, and Sánchez-Triana
Table 7.11. Revenues from Vehicle Inspection Program in Cali, 1997–2003
Fee Revenue (million pesos)
Center Year (pesos) Inspections Total DAGMA (15%)
CDAV 1997 11,500 33,126 382 57
1998 14,000 61,715 836 125
1999 15,800 73,255 1,153 173
2000 17,400 97,853 1,694 254
2001 19,000 74,617 1,506 226
2002 20,600 32,443 704 132
2003 22,200 50,648 1,126 268
Other centers 2003 22,100 5,921 130 32
Total 8,363 1,475
Sources: CDAV, private centers, and DAGMA reports.
Note: CDAV = Centro de Diagnóstico Automotor del Valle; US$1 = Col$2,150. Yearly revenues may not equal the fee
times the total inspections because in the CDAV reports some inspections were registered with the prior year’s fee.
from a high of 18 percent in 1997 to about 4 percent in 2003. Theseresults were probably influenced by a series of administrative reformsundertaken in 2001 that reduced staffing levels at DAGMA and thetransit authorities. For diesel-powered vehicles, which consist mostly ofbuses and large trucks, a slightly different story emerges. Although thereare fewer such vehicles, total inspections of diesel-powered vehicles havecontinued to increase over the entire seven-year period. The rejectionrate has varied slightly from year to year, but has generally remainedwithin the range of 7 to 9 percent.
While the principal purpose of the inspection program is to reducepollution in the urban environment, DAGMA also has a financial interestin the system. As shown in table 7.11, inspection fees, which increasedconsiderably during 1997 to 2003, generate significant revenues. Theserevenues are split between the government and the participating inspec-tion centers. According to data provided by the Centro de DiagnósticoAutomotor del Valle (CDAV), the main vehicle services and emissioninspection center in Cali, there were 346,544 vehicles registered in thecity as of March 2004, of which 4,405 were official (owned by publicentities), 299,745 were private, and 42,394 were for public or commercialuse. Some vehicles, including motorcycles and vehicles used in agriculture,were exempt from emission inspection.
CORNARE, the CAR for the Rionegro-Nare region (Corporación deAutónoma Regional de las Cuencas de los Ríos Negro y Nare), has alsoimplemented a system to control emissions from mobile sources by estab-lishing an emissions certificate for vehicles. According to informationprovided by CORNARE’s monitoring unit, while only 47 percent of

Improving Air Quality 223
vehicles inspected passed the emissions test in 2001, in 2002 the approvalrate increased to 62 percent, and in 2003 the rate was 61 percent.
A vehicle inspection program has also been introduced in Medellín.During 2002, 150,000 vehicles, representing almost 40 percent of allvehicles in the area, were inspected. In the first half of 2003, there wasan increase of 6.2 percent in the number of inspections compared withthose in the same period in the previous year. Unfortunately, there is noinformation available on the failure rate of these inspections.
An examination of the testing programs in place in several Colombiancities reveals limitations of the test procedures (Kojima 2004).Specifically, the reliance on the one-speed idle test is largely ineffectual,because the CO and HC emissions from an older gasoline vehicle can bereduced by delaying the ignition timing and increasing the air-to-fuelratio. This so-called late-and-lean approach has reportedly been widelyused to pass the idle test. However, vehicles that pass the test in this fash-ion routinely fail roadside tests because emissions increase considerablyunder load conditions. The preferred approach is to test emissions underload, which requires a dynamometer. Unfortunately, no dynamometer-based testing is available in Colombia.10
Fuel QualityRefined petroleum products in Colombia are produced at refineries inCartagena and Barrancabermeja. The sulfur content of gasoline pro-duced at these refineries is about 1,000 ppm, while the sulfur content ofregular diesel is about 4,500 ppm (Brugman 2004). Ecological diesel pro-duced in Barrancabermeja has a sulfur content of 1,200 ppm. Importedgasoline has a sulfur content of 300 ppm, while imported diesel contains500 ppm of sulfur.
The maximum allowed content of sulfur for all fuels used in Colombiaoriginally was scheduled to drop to 500 ppm by 2002, but the stricterstandard was postponed until 2004, and postponed again until July 1,2008. The main reason for the postponements was that Ecopetrol neededmore time to retrofit the Barrancabermeja and Cartagena refineries.
Recent Developments in the Energy SectorIn 1999, Colombia adopted a fuel price liberalization policy aimed atequalizing the prices of regular gasoline and diesel with the prices ofimports (using prices in the Gulf of Mexico as a reference). In addition,an excise tax on gasoline was introduced to generate funds for streetpaving and maintenance in urban areas.

224 Morgenstern, Larsen, and Sánchez-Triana
Although these policies were primarily driven by economic ratherthan environmental considerations, there are some clear environmentalbenefits. Specifically, the consumption of gasoline has shown a down-ward trend, from 125,300 barrels/day in 1994 to 88,612 barrels/day in2003. This is attributable, in part, to the substitution of diesel and com-pressed natural gas (CNG) for gasoline and to the rise in gasoline prices.Consumption of diesel fuels, for which subsidies are continuing, hasincreased. In 1994, an average of 50,400 barrels/day were consumed, andin 2003, the average was 69,661 barrels/day (UPME 2005).
In 1994, national production of natural gas was 400 million cubic feetper day (MMcfd). It was delivered by four isolated systems: the AtlanticCoast, Santander, Huila, and Meta-Bogotá. The main producing fieldswere situated in the department of La Guajira (at Ballena, Chuchupa,and Riohacha), and the gas transportation infrastructure was concentratedon the Atlantic Coast with a few minor pipelines in the interior of thecountry. There were no connections between the large population cen-ters and main production areas. The amount of proved and probablereserves was estimated to be between 7,544 giga cubic feet (Gcf) and8,800 Gcf, equivalent to 50 years’ production (UPME 2005).
By the beginning of 1997, the country had a total of 11,468 Gcf of gasin proved and probable reserves, and production (and average consump-tion) reached 579 MMcfd. Transportation of gas from the coast to theinterior was expanded with implementation of the Mass Gas Plan, theconstruction of the Ballena-Barrancabermeja pipeline, and the intercon-nection of this line with the other production centers using theBarrancabermeja-Neiva and Cusiana-Apiay pipelines. By the end of 2003,the country had 4,040 Gcf of commercial reserves, equivalent to a22-year supply. With the launch of the western pipeline in August 1997and the increase in the production capacity in La Guajira following con-struction of the second platform at the Chuchupa field, the availability ofgas rose from 430 MMcfd to 700 MMcfd.
With the goal of increasing the availability of gas service to the poor,the national government, through the Ministry of Mining and Energy,established exclusive service areas for natural gas distribution in thewestern, eastern, and central zones of the country in 1997 and 1998. TheMass Gas Plan helped increase gas use in both the domestic and theindustrial sectors. In 1994, there were 790,000 gas installations, and byJune 2004, there were 3,250,000. This means that nearly 14 millionColombians now have access to natural gas.
Along with the development of natural gas distribution systemsfor domestic and industrial consumption, a new program to promote

substitution of CNG for gasoline in motor vehicles started in 1985.However, only modest progress has been made over the past 20 years.Despite the economic attractiveness of natural gas compared with gasoline,substitution has been constrained by the high cost of converting vehiclesto CNG, continuing public concerns about safety, and limited incentivesto build CNG fueling stations (table 7.12).
Nonpoint Sources (Sugarcane Burning)Information on nonpoint source control in sugarcane fields is quite limited.Table 7.13 indicates that 30,000 to 40,000 hectares per year reportedlywere harvested through green cuts over the past several years in CVC. Thisrepresents less than 23 percent of the harvested area.The practice of greencuts appears to have peaked in 2000 and then declined somewhat.
Potential Interventions to Control Air Pollution
Brugman (2004) analyzed potential interventions to control air pollution,including (a) removal of subsidies for gasoline and diesel, (b) use ofCNG-powered vehicles in cities, (c) substitution of CNG for biomassand coal in urban factories, (d) promotion of urban mass transportation
Improving Air Quality 225
Table 7.12 Vehicles Converted to CNG as of July 2004
City Department As of December 2003 January–July 2004 Total
Barranquilla Atlántico 7,673 1,246 8,919
Cartagena Bolívar 2,259 897 3,156
Santa Marta Magdalena 1,452 320 1,772
Monteria Córdoba 892 367 1,259
Sincelejo Sucre 521 143 664
Cali-Yumbo Valle 2,268 1,149 3,417
Tulua Valle 0 145 145
Palmira Valle 0 58 58
Armenia Quindío 192 320 512
Riohacha/Cerrejon Guajira 210 23 233
Bogotá Cundinamarca 8,383 3,878 12,261
Bucaramanga Santander 1,854 465 2,319
Medellín Antioquía 3,208 1,357 4,565
Dos Quebradas Risaralda 129 65 194
Villavicencio Meta 706 328 1,034
Neiva Huila 138 205 343
Ibagué Tolima 37 111 148
Total 29,922 11,077 40,999
Source: Ministry of Mining and Energy and Publigás Magazine (September 2004) as cited in Blackman and
others 2005.

226 Morgenstern, Larsen, and Sánchez-Triana
Table 7.13 Hectares of Sugarcane in CVC with Green Cuts, 1997–2003
Green cuts
Year Total crops (hectares) Hectares % total
1997 151,175 19,930 13
1998 167,399 28,462 17
1999 156,166 32,922 21
2000 176,648 40,171 23
2001 166,392 36,730 22
2002 162,152 34,070 21
2003a 79,117 14,094 18
Source: Blackman and others 2005.
a. To June 30, 2003.
systems, and (e) retrofitting of the refineries at Barrancabermeja andCartagena to lower the sulfur content in fuels.
Removing subsidies to gasoline and diesel is intended to bring domesticprices in line with international prices and eliminate the difference in taxrates for gasoline and diesel. According to Brugman (2004), removingsubsidies would reduce demand for fuel in the transportation sector by8 percent.
Retrofitting the Barrancabermeja refinery includes hydrogenation anddesulfurization of the gasoline and diesel produced there, which repre-sents about 80 percent of the nation’s domestic supply. In Cartagena, theaim of the retrofitting project is to enlarge the refinery and providehydrogenation and desulfurization of its production of gasoline anddiesel, which represents about 20 percent of the nation’s domestic supply.By 2008, emissions of PM10, SOx, and NOx would be reduced by about2 percent compared with 2002.11 The costs of the investments inCartagena are expected to be about US$806 million. These investmentscould be delayed by importing low-sulfur diesel. Brugman (2004)estimates that importing 5,600 barrels/day of low-sulfur diesel during2005 to 2007 would cost between US$33 million and US$35 million.
The campaign to promote CNG-powered vehicles seeks to substituteCNG for 30 percent of the gasoline and diesel used in the eight largesturban and industrial areas in the country. The cost of investments invehicles (without counting the net benefits of substituting importedgasoline and diesel with CNG) is estimated at between US$262 million(Col$563,300 million) and US$280 million (Col$602,000 million).
Substituting natural gas for coal in urban industries could amount to 10MMcfd additional on the northern coast and 20 MMcfd in the interior.Emissions of PM10 and SO2 would be reduced on a national basis. The

Improving Air Quality 227
costs of supply and transportation of gas are higher than the costs of coaluse by between US$136 million and US$178 million.
These proposals have been under study in the Department of NationalPlanning (Departamento Nacional de Planeación, DNP) and the MAVDT,but no final decisions have been made. On March 14, 2005, the nationalgovernment approved National Council on Economic and Social Policy(Consejo Nacional de Política Económica y Social, CONPES) Document3344, which establishes terms of reference for the design of a national pol-icy on prevention and control of air pollution, with options and programsto control atmospheric contamination in urban areas. The CONPES doc-ument proposes the establishment of a National Intersectoral TéchnicalCommission for Prevention and Control of Air Pollution (Comisión TécnicaNacional Intersectorial para la Prevención y el Control de la Contaminacióndel Aire, CONAIRE) that will be chaired by the Minister of the MAVDTand will include representatives from the Ministries of Transportation,Mining and Power, Environment, and Social Protection, as well as fromIDEAM, DNP, Ecopetrol, CARs, and AAUs. Periodically, other public orprivate institutions may be invited to participate. The commission’s mainfunction will be to design national strategies to manage air quality.CONAIRE will also promote the creation of related councils and coordina-tion at the local level. CONPES Document 3344 also proposes creation ofan Air Quality Information System (Sistema de Información Sobre Calidaddel Aire, SISAIRE), to be managed by IDEAM, to collect, update, andanalyze relevant information generated by the monitoring network and byenvironmental, sanitation, transportation, and energy authorities.
The government of Colombia is considering a series of intersectoralmeasures aimed at tackling two major sets of issues that constrain airpollution control. The first is to make the findings of past reviews of expe-rience and lessons learned more widely available and to apply those lessonsto future strategies for air pollution control. The terms of reference forCONAIRE contained in CONPES Document 3344 give the proposedcommission responsibility for disseminating information related to airquality and pollution prevention to foster greater awareness and learningand to guide research. The second relates to the potential challengesinvolved in achieving full implementation of the CONPES proposals. Thegovernment of Colombia is considering new efforts to strengthen theimplementation process and specifically to counterbalance the influence ofinterest groups by strengthening civil society participation in the design andimplementation of air pollution control policies and measures (Suárez,Montenegro, and Carasquilla 2005).

228 Morgenstern, Larsen, and Sánchez-Triana
0 100 200 300 400 500 600 700 800 900
CaquetáSucre
CaucaLa Guajira
NariñoBoyacáQuindío
MagdalenaCesarHuila
CaldasMeta
TolimaCórdoba
Norte de SantanderCundinamarca
RisaraldaBolívar
SantanderAtlántico
AntioquíaValle
S.F. de Bogotá, D.C.
billion pesos
Figure 7.2 Annual Health Cost of Urban Air Pollution
Source: Larsen 2005b.
Note: Costs are the mean of a low estimate using the human capital approach for the cost of mortality, and a high
estimate using the value of statistical life approach. US$1 = Col$2,150.
Benefit-Cost Analysis of Interventions to Control Air Pollution from Mobile Sources in BogotáMore than 80 percent of the estimated costs resulting from the healthimpacts of air pollution in Colombia are concentrated in only fourdepartments and the city of Bogotá. The costs for Bogotá alone represent50 percent of the national total and are over three times higher than inValle and Antioquía, the departments with the next-highest cost(figure 7.2). The annual cost in Bogotá is equivalent to nearly 2 percentof Bogotá’s GDP and could reach almost 3 percent of GDP if mortalitycosts are based on the value of statistical life (VSL) approach(Larsen 2005b).
For these reasons, and because of the substantial data requirements andcomplexity of estimating the benefits of pollution control measures, theanalysis of costs and benefits of urban air pollution control in this sectiondeals only with Bogotá. The analysis focuses on emissions from mobilesources, which are a significant contributor to urban air pollution in Bogotá.

Improving Air Quality 229
Health effects of air pollution are a function of ambient air quality.Anestimation of the benefits of urban air pollution control thereforerequires an emissions inventory, a relationship between the inventoryand ambient air quality, and an estimate of emissions reductions fromindividual pollution control measures.
The cost of urban air pollution in Bogotá presented in Larsen (2004)is based on a population-weighted, estimated annual average ambientPM10 concentration of 62 µg/m3. PM10 was then converted to PM2.5using a factor of 0.6 based on observed PM2.5/PM10 ratios in similar con-ditions in the United States and on spot estimates of particle size distri-bution in Bogotá undertaken by Universidad de los Andes (2004a) andBrugman (2004), shown in table 7.14.
The primary focus of the Universidad de los Andes (2004a) study wasto assess emissions from mobile sources, and the primary focus of theBrugman study was fossil fuel use in urban areas. The estimates do notinclude fugitive dust from roads, agriculture, and other sources. Nor dothe emissions reflect secondary particulate formation (nitrates and sul-fates) from gaseous emissions (nitrogen oxides and sulfur), which canrepresent a substantial share of atmospheric concentrations of PM10 andPM2.5. Ignoring these sources of PM could potentially result in an over-estimation of the costs of both damages from mobile and stationarysource emissions and health benefits of PM emission control. A sim-ple model was therefore developed in this analysis to provide a broadestimate of the contribution of fugitive dust, nitrates, and sulfates toambient concentrations of PM2.5 and PM10 in Bogotá. The derived ambi-ent PM2.5 concentration was then used to estimate annual mortality, andPM10 was used to estimate annual morbidity.
As shown in table 7.15, the PM2.5/PM10 ratios for emissions from fuelcombustion (petroleum products) from both mobile and stationary
Table 7.14 Estimated PM10
Emissions in Bogotá, 2002
tons/year
Study
Source Universidad de Los Andes Brugman
Mobile 1,560 2,400
Stationary (fuels) n.a. 2,100
Stationary (processes) n.a. 800
Stationary 2,940 n.a.
Total 4,500 5,300
Source: Universidad de los Andes 2004; Brugman 2004.
Note: n.a. = not applicable.

230 Morgenstern, Larsen, and Sánchez-Triana
Table 7.15 Emission Source Ratios of PM2.5
and PM10
Source PM2.5
/ PM10
ratio
Stationary
Fuel combustion 0.96
Industrial processes 0.55
Fugitive dust
Paved roads 0.25
Unpaved roads 0.15
Construction and demolition 0.15
Farming operations (tilling and so forth) 0.20
Miscellaneous processes
Waste burning 0.96
Agricultural residue burning 0.93–0.96
Forest fires 0.93
Mobile
Onroad 0.98
Source: Reproduced from table in Countess (2003); for rice, wheat, and corn of
agricultural residue burning: Scarborough, Clinton, and Gong (2002).
sources are well above 0.9. This is also the case from waste and residueburning and forest fires. The ratio for fugitive dust, however, is generallyvery low, and the ratio for emissions from industrial processes is usuallysomewhere between the ratios for fugitive dust and for fuel combustion,depending on the type of industry, process technology, and pollutionabatement technology. The ratio of 0.55 reported in table 7.15 repre-sents an average for various processes, and will vary significantly depend-ing on the type of process and emission abatement technology.
Recent studies from the United States indicate that nitrates and sul-fates constitute around 30 percent of ambient concentrations of PM2.5 inCalifornia, and as much as 45 to 50 percent of PM2.5 in the eastern states.However, the ratio of nitrates to sulfates is much higher in California,mainly because emissions there are mostly from mobile sources, whilethe eastern United States is more heavily affected by sulfur emissionsfrom power plants (table 7.16).
Table 7.16 Nitrates and Sulfates in PM2
Share of ambient PM2.5
(percent)
Region Nitrates Sulfates
California 20–25 5–8
Eastern states of United States 5–15 25–40
Source: Derived from “Latest Findings on National Air Quality: 2000 Status and Trends.”http://www.epa.gov/airtrends/.

Improving Air Quality 231
The share of nitrates and sulfates in ambient PM2.5 concentrationsin Bogotá is unclear. A midpoint of 15 percent for nitrates and 15 percentfor sulfates has been used to estimate an emissions inventory thatincludes both primary and secondary PM. Applying the model thatincludes estimated contributions of fugitive dust, nitrates, and sulfatesin ambient PM concentrations results in the concentration levels pre-sented in table 7.17. The model was applied by setting sulfates andnitrates to 15 percent of PM2.5, applying the PM ratios in table 7.15,using the emissions from Brugman (2004) in table 7.14, and using anaggregate PM2.5/PM10 ratio of 0.6 as in Larsen (2004).12
Two scenarios are presented in table 7.17 to account for uncertaintyin the contribution of stationary sources (mainly industrial emissions) tourban ambient concentrations of PM10 and PM2.5. This contributiondepends on industrial location, stack heights, wind direction, and otherfactors. A low assumption of 25 percent is used in scenario 1 and a high
Table 7.17 Model Results for Annual Emissions Inventory in Bogotá
PM10
Percentage
emissions that becomes Urban PM10
PM2.5
/ Urban PM2.5
Source (tons) urban PM10
(tons) PM10
(tons)
Scenario 1 (low)
Mobile 2,400 100 2,400 0.98 2,352
Stationary (fuels) 2,100 25 525 0.96 504
Stationary (industrial processes) 800 25 200 0.50 100
Sulfates (15% of PM2.5
) 850 100 850 0.95 808
Nitrates (15% of PM2.5
) 850 100 850 0.95 808
Forest fires and waste burning 0 a 0 0.93 0
Fugitive emissions 4,190 100 4,190 0.20 838
Total 11,190 n.a. 9,015 0.60 5,410
Scenario 2 (high)
Mobile 2,400 100 2,400 0.98 2,352
Stationary (fuels) 2,100 75 1,575 0.96 1,512
Stationary (industrial processes) 800 75 600 0.50 300
Sulfates (15% of PM2.5
) 1,250 100 1,250 0.95 1,188
Nitrates (15% of PM2.5
) 1,250 100 1,250 0.95 1,188
Forest fires and waste burning 200 a 200 0.93 186
Fugitive emissions 5,900 100 5,900 0.20 1,180
Total 13,900 n.a. 13,175 0.60 7,906
Source: Larsen 2005a.
Note: n.a. = not applicable.
a. The low scenario assumes that no PM10
from forest fires and waste burning end up in the urban ambient
environment, while the high scenario assumes that these sources contribute 200 tons of PM10
. No estimate is
available of total emissions from these sources or of the percentage that becomes ambient PM10
in Bogotá.

232 Morgenstern, Larsen, and Sánchez-Triana
assumption of 75 percent is used in scenario 2 to estimate the share oftotal emissions from stationary sources that actually end up in the urbanambient environment. Forest fires and waste burning are assumed tocontribute no PM10 to the urban ambient environment in the low scenarioand 200 tons in the high scenario. The fugitive emissions estimated bythe model contribute roughly 45 percent of total PM10, but only about15 percent of total PM2.5.
Cost of Damage from Mobile SourcesTable 7.18 presents the estimated total annual costs of damage caused perton and by source of PM10 emissions.13 The low estimate is based on thehuman capital approach (HCA) to valuation of mortality risk and the high
Table 7.18 Estimated Cost of Damage Caused by PM10
in Bogotá
Estimated cost per year Cost per ton of PM10
(billion pesos) (million pesos) (thousand US$)
Emission source Low High Low High Low High
Scenario 1 (low PM10
)
Mobile 85 337 35 140 14 56
Stationary (fuels) 18 72 9 34 4 14
Stationary (industrial 6 16 7 21 3 8
processes)
Sulfates (15% of PM2.5
) 30 117 35 137 14 55
Nitrates (15% of PM2.5
) 30 117 35 137 14 55
Forest fires and waste n.a. n.a n.a n.a n.a n.a
burning
Fugitive emissions 104 194 25 46 10 18
All sources 273 853 24 76 10 30
Scenario 2 (high PM10
)
Mobile 58 231 24 96 10 39
Stationary (fuels) 38 149 18 71 7 28
Stationary (industrial 12 34 15 42 6 17
processes)
Sulfates (15% of PM2.5
) 30 117 24 94 10 38
Nitrates (15% of PM2.5
) 30 117 24 94 10 38
Forest fires and waste 5 18 24 92 10 37
burning
Fugitive emissions 100 187 17 32 7 13
All sources 273 853 20 61 8 25
Source: Larsen 2005a.
Note: n.a. = not applicable. Scenario 1 uses a low estimate of ambient PM10
and scenario 2 uses a high estimate. The
columns for low and high costs are based on different methods for the valuation of mortality risk—the HCA is used for
the low estimate and the VSL approach is used for the high estimate. US$1 = Col$2,150.

Improving Air Quality 233
estimate is based on the VSL approach (Larsen 2004). The average cost ofdamage from all sources is estimated at between Col$20 million andCol$24 million (US$8,000 to US$10,000) per ton of PM10 in the low costcase, and between Col$61 million and Col$76 million (US$25,000 toUS$30,000) for the high cost case.
Figure 7.3 shows the average of the low (HCA-based) annual cost esti-mates of PM10 for the two different emission scenarios, and figure 7.4shows the average of the high cost (VSL-based) estimates for the twoscenarios.The main difference between the two figures is the relative mag-nitude of damages and costs from mobile sources and fugitive emissions.In figure 7.3, the cost from fugitive emissions is higher than from mobilesources, while the opposite is the case in figure 7.4. This is because of theapplication of the HCA for valuation of mortality in figure 7.3, whichimplies a relatively low damage cost to PM2.5 compared with PM10. Thus,the cost of fugitive emissions is more prominent, because the total quan-tity of fugitive emissions, measured by PM10, is higher than from mobilesources (table 7.17). In figure 7.4, however, the damage cost reflectsvaluation of mortality using the VSL approach, which implies a higherdamage cost of PM2.5 relative to PM10. Because emissions from mobilesources are higher in PM2.5 than are fugitive emissions, total damage costof mobile emissions is higher than of fugitive emissions.
Figures 7.5 and 7.6 present the estimated damage cost by emissionsource per ton of PM10. The figures are averages of scenarios 1 and 2.Damage cost is highest from mobile sources in both the low and the highcases, ranging from about Col$30 million to Col$120 million per ton(US$12,000 to US$48,000). The estimated damage cost per ton of sec-ondary particulates is just as high as the cost per ton of particulates frommobile sources because the PM2.5 fraction of sulfate and nitrate particu-lates is very similar to particulates from mobile sources.
Table 7.19 presents estimates of the vehicle fleet, the share of thevehicle fleet with diesel and gasoline engines, vehicle driving distance,and fuel consumption (Brugman 2004). CNG vehicles are not includedin the table; they represent only a very small fraction of vehicles. Taxisare in the public urban cars category. Many of the buses and trucks areused on interurban routes. This issue is discussed later with respect tothe damage cost of pollution for each of the vehicle classes.
Table 7.20 presents PM10 emissions factors in kilograms per giga-joule (Brugman 2004).These factors should be considered broad averages.Emissions from any given vehicle will vary substantially depending onengine condition, maintenance, and other factors. Old diesel vehicles

234 Morgenstern, Larsen, and Sánchez-Triana
0 20 40 60 80 100 120
forest fires and wasteburning
stationary sources(processes)
stationary sources(fuels)
secondary PM(sulfates)
secondary PM(nitrates)
fugitive emissions
mobile sources
billion pesos
Figure 7.4 Annual Cost of Damage by Emission Source, High Cost Estimate
0 50 100 150 200 250 300
forest fires and wasteburning
stationary sources(processes)
stationary sources(fuels)
secondary PM(sulfates)
secondary PM(nitrates)
fugitive emissions
mobile sources
billion pesos
Figure 7.3 Annual Cost of Damage by Emission Source, Low Cost Estimate
Source: Larsen 2005a.
Note: US$1 = Col$2,150.
Source: Larsen 2005a.
Note: US$1 = Col$2,150.

Improving Air Quality 235
Figure 7.5 Damage Cost per Ton of PM10
, Low Cost Estimate
Figure 7.6 Damage Cost per Ton of PM10
, High Cost Estimate
0 5 10 15 20 25 30 35
stationary sources(processes)
fugitive emissions
forest fires and wasteburning
stationary sources(fuels)
secondary PM(sulfates)
secondary PM(nitrates)
mobile sources
million pesos per ton of PM10
0 20 40 60 80 100 120 140
stationary sources(processes)
fugitive emissions
forest fires and wasteburning
stationary sources(fuels)
secondary PM(sulfates)
secondary PM(nitrates)
mobile sources
million pesos per ton of PM10
Source: Larsen 2005a.
Note: US$1 = Col$2,150.
Source: Larsen 2005a.
Note: US$1 = Col$2,150.
refers to aging fleet vehicles in Colombia and newer diesel vehiclesthat lack technology to control PM emissions. The emissions factors fornew diesel vehicles can in many instances be considered applicable toin-fleet diesel vehicles with retrofit technology such as trap oxidizer

236 Morgenstern, Larsen, and Sánchez-Triana
Table 7.19 Estimates of Vehicles and Fuel Consumption in Bogotá
Average Average fuel economy
Number Fuel type (% of fleet) usage (km/gallon)
Vehicle class of vehicles Gasoline Diesel (km/year) Gasoline Diesel
Cars
Private 359,682 96.0 3.5 12,640 31.8 31.9
Public urban 54,805 90.0 8.0 46,310 28.4 28.4
Public interurban 7,473 90.0 8.0 46,310 28.4 28.4
SUVs and vans
Private 58,602 96.0 3.5 13,850 19.5 19.7
Public urban 285 96.0 3.5 13,850 19.5 19.7
Public interurban 4,432 96.0 3.5 13,850 19.5 19.7
Trucks
C2-U 7,143 80.0 19.8 48,000 8.1 10.4
C2-I 5,702 80.0 19.8 48,000 8.1 10.4
C3-I 711 1.9 98.1 66,000 5.3 6.7
C4-I 62 1.9 98.1 66,000 5.3 6.7
C5-I 947 1.9 98.1 66,000 4.3 5.3
C5>I 454 1.9 98.1 66,000 4.3 5.3
Buses
P300 U 6,808 19.8 80.0 47,410 7.5 8.6
P600 U 13,747 19.8 80.0 50,350 6.7 8.2
MICROS U 132 80.0 19.8 64,640 19.1 19.4
P300 I 3,195 19.8 80.0 47,410 7.5 8.6
P600 I 10,927 19.8 80.0 50,350 6.7 8.2
P900 I 1,351 19.8 80.0 50,350 6.7 8.2
Source: Reproduced from Brugman (2004).
Note: km = kilometer; SUVs = sport utility vehicles.
systems and oxidation catalysts. For new diesel vehicles with advanced par-ticulate control technology running on low-sulfur diesel, emissions can beexpected to be substantially lower than reported in table 7.20. For adiscussion of emissions monitoring results from in-fleet vehicles in manycountries around the world, see Faiz, Weaver, and Walsh (1996).
Table 7.21 presents estimates of the cost of damages caused bypollution per vehicle per year. The low cost estimate is based onUS$10,000 per ton of PM10 from scenario 1 in table 7.18, which wasestimated by using the HCA for mortality valuation and the assump-tion that 75 percent of industrial emissions end up in the urban envi-ronment. The high cost estimate is based on US$56,000 per ton ofPM10 from scenario 1 in table 7.18, which used the VSL approach tomortality valuation, and the assumption that only 25 percent of indus-trial emissions end up in the urban environment. About 70 percent ofthe difference between the low and high estimates is associated with the

Improving Air Quality 237
mortality valuation procedures, and 30 percent of the difference isassociated with the assumptions about the contribution of industrialemissions to urban ambient air quality.
The estimated damage cost per vehicle is much higher for trucks andbuses than for cars and SUVs and vans. This is mainly a function of dif-ferences in annual driving distances and fuel economy. Estimated damagecost for taxis (“public urban cars”) with old diesel engines is also relativelyhigh. It should be noted that the estimated damage cost per vehicle intable 7.21 is based only on primary PM emissions and does not reflect thedamage cost of secondary particulates (sulfates and nitrates).
InterventionsInterventions to control primary and secondary particulate emissions frommobile sources can broadly be classified into the following categories:(a) market-based instruments such as fuel pricing and taxation, vehicle
Table 7.20 PM10
Emissions Factors
PM10
emissions (kg/GJ)
Vehicle class Gasoline vehicles Old diesel vehicles New diesel vehicles
Cars
Private 0.01 0.17 0.09
Public urban 0.01 0.17 0.09
Public interurban 0.01 0.17 0.09
SUVs and vans
Private 0.01 0.17 0.09
Public urban 0.01 0.17 0.09
Public interurban 0.01 0.17 0.09
Trucks
C2-U 0.01 0.18 0.10
C2-I 0.01 0.18 0.10
C3-I 0.01 0.21 0.05
C4-I 0.01 0.21 0.05
C5-I 0.01 0.21 0.05
C5>I 0.01 0.21 0.05
Buses
P300 U 0.01 0.18 0.10
P600 U 0.01 0.18 0.10
MICROS U 0.01 0.18 0.10
P300 I 0.01 0.18 0.10
P600 I 0.01 0.18 0.10
P900 I 0.01 0.18 0.10
Source: Reproduced from Brugman (2004).
Note: kg/GJ = kilogram per gigajoule; SUVs = sport utility vehicles.
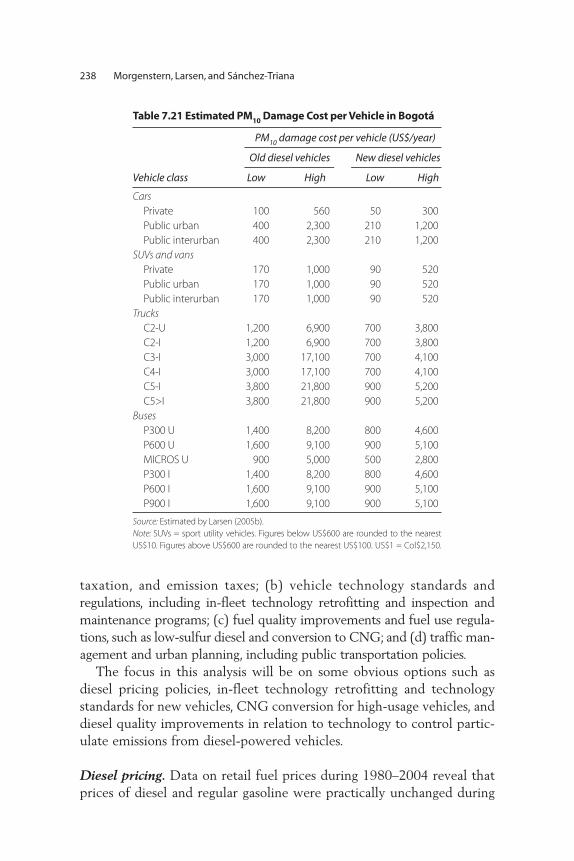
238 Morgenstern, Larsen, and Sánchez-Triana
Table 7.21 Estimated PM10
Damage Cost per Vehicle in Bogotá
PM10
damage cost per vehicle (US$/year)
Old diesel vehicles New diesel vehicles
Vehicle class Low High Low High
Cars
Private 100 560 50 300
Public urban 400 2,300 210 1,200
Public interurban 400 2,300 210 1,200
SUVs and vans
Private 170 1,000 90 520
Public urban 170 1,000 90 520
Public interurban 170 1,000 90 520
Trucks
C2-U 1,200 6,900 700 3,800
C2-I 1,200 6,900 700 3,800
C3-I 3,000 17,100 700 4,100
C4-I 3,000 17,100 700 4,100
C5-I 3,800 21,800 900 5,200
C5>I 3,800 21,800 900 5,200
Buses
P300 U 1,400 8,200 800 4,600
P600 U 1,600 9,100 900 5,100
MICROS U 900 5,000 500 2,800
P300 I 1,400 8,200 800 4,600
P600 I 1,600 9,100 900 5,100
P900 I 1,600 9,100 900 5,100
Source: Estimated by Larsen (2005b).
Note: SUVs = sport utility vehicles. Figures below US$600 are rounded to the nearest
US$10. Figures above US$600 are rounded to the nearest US$100. US$1 = Col$2,150.
taxation, and emission taxes; (b) vehicle technology standards andregulations, including in-fleet technology retrofitting and inspection andmaintenance programs; (c) fuel quality improvements and fuel use regula-tions, such as low-sulfur diesel and conversion to CNG; and (d) traffic man-agement and urban planning, including public transportation policies.
The focus in this analysis will be on some obvious options such asdiesel pricing policies, in-fleet technology retrofitting and technologystandards for new vehicles, CNG conversion for high-usage vehicles, anddiesel quality improvements in relation to technology to control partic-ulate emissions from diesel-powered vehicles.
Diesel pricing. Data on retail fuel prices during 1980–2004 reveal thatprices of diesel and regular gasoline were practically unchanged during

Improving Air Quality 239
1980 to 1998. After 1998, gasoline prices increased at a much faster ratethan diesel prices, in both nominal and real terms. By 2004, diesel priceswere 30 percent lower than regular gasoline prices, and 50 percent lowerthan high-octane gasoline. Brugman (2004) estimates that removal offuel subsidies could reduce overall transport diesel consumption (relative tobaseline demand projections) by 7 to 8 percent, based on a study inColombia of price elasticities of fuel demand. While such a reduction indiesel consumption may not appear to be substantial, much of the reduc-tion is likely to come from light-duty diesel vehicles, which gain less fromhaving a diesel engine than do heavy-duty vehicles. Fuel subsidy removalcould therefore help prevent, and in the longer run even reverse, the trendtoward using light-duty diesel vehicles. This is a desirable outcome, if it isassumed that new light-duty diesel vehicles are not equipped with modernparticulate control technology that effectively reduces PM emissions.
Particulate control technology. Buses and trucks are responsible for themajority of PM emissions from mobile sources in Bogotá. While thenew Transmilenio buses emit fewer particulates than the average bus ortruck in Bogotá, the old bus and truck fleet is still a major source ofurban air pollution. Retrofitting these buses and trucks with particulatecontrol technology is an option to reduce PM emissions. However,because retrofit control technology is not inexpensive, considerationmight be given to the expected remaining useful life of many of theaging buses and trucks. Options might be provided to bus and truckoperators either to retrofit or to remove the vehicles from the fleet withina certain time frame.
Retrofit technology, such as trap oxidizer systems or oxidization cat-alysts, could cost several thousand U.S. dollars and as much as US$7,000to US$8,000 per bus (Walsh 1998). The potential benefits of retrofittechnology are shown in table 7.22. The benefits are estimated as thedifference in emissions and damage costs in tables 7.20 and 7.21, respec-tively. For heavy trucks, the payback period in terms of environmentalhealth benefits could be less than one year if valuation of mortalityis based on VSL (high estimate). If the HCA (low estimate) is applied,the payback period ranges from 2 to 3 years. For buses and lighter trucks,the payback period could range from as little as 2 to 3 years for the highestimate to as much as 6 to 10 years for the low estimate.
These payback estimates are for buses and trucks used mainly withinBogotá. Most of the pollution from interurban buses and long-haultrucks would be emitted outside the cities, and the damage cost would

240 Morgenstern, Larsen, and Sánchez-Triana
Table 7.22 Benefits of Diesel Vehicle Retrofit Technology
Retrofit benefits
(US$/vehicle/year)
Vehicle class Low High
Trucks
C2-U 500 3,100
C2-I 500 3,100
C3-I 2,300 13,000
C4-I 2,300 13,000
C5-I 2,900 16,600
C5>I 2,900 16,600
Buses
P300 U 600 3,600
P600 U 700 4,000
MICROS U 400 2,200
P300 I 600 3,600
P600 I 700 4,000
P900 I 700 4,000
Source: Larsen 2005b.
Note: US$1 = Col$2,150.
be substantially less, if not minimal. Based on the estimates here, priorityshould be given to retrofitting buses and trucks used predominantlywithin urban areas.
CNG conversion. Conversion to CNG would practically eliminateparticulate emissions. It is often considered a viable option for taxis andother high-usage vehicles. In some countries, large buses also run onCNG. Potential benefits of conversion to CNG for diesel vehicles arepresented in table 7.23. For large diesel buses, however, CNG conversionwould need to be carefully evaluated and compared with the option ofretrofitting with particulate control technology.
Diesel quality improvement. One important aspect of diesel quality issulfur content. Low sulfur content has direct benefits in that it usuallyprovides some reduction in particulate emissions from diesel combustion.The other benefit is that low sulfur content is often a prerequisite foradvanced particulate control technology on diesel vehicles, or it at leastmakes the control technology more effective. Low sulfur content can alsoreduce secondary particulate formation (sulfates), providing an addedbenefit to health.
Sulfur content in diesel in Bogotá is 0.1 percent by weight. While thisis lower than in other cities in Colombia, to take full advantage of the

Improving Air Quality 241
advanced technology available for particulate control in new diesel vehi-cles, sulfur would have to be further reduced.
Estimated benefits from a 5 percent reduction in PM emissions byreducing the sulfur content of diesel to 0.05 percent are shown intable 7.24. In the low-benefit scenario, the PM decrease might not besufficient to justify such a reduction. In the high-benefit scenario, theestimated benefits are substantially higher than the incremental costof supplying low-sulfur diesel. Two issues should be mentioned. First,because the benefits of emission reductions are based on urban emis-sions, the estimates apply only to vehicles used predominantly inurban areas and not to interurban transport. Low-sulfur diesel shouldtherefore be prioritized for the urban market. Second, low-sulfurdiesel has important benefits other than direct PM reductions, such asallowing for adoption of advanced particulate control technology onnew diesel vehicles.
Conclusions and Recommendations
Colombia has made major efforts during the past decade to improve airquality in Bogotá and several other large urban areas. These efforts havebeen bolstered by increased awareness by experts and the public of thelinks between air pollution and public health. However, the damage tohuman health associated with current air pollution levels—particularlyelevated concentrations of fine particles—remains high. Despite severe
Table 7.23 Benefits of Conversion to CNG
CNG conversion benefits
(US$/vehicle/year)
Vehicle class Low High
Cars
Diesel taxis 400 2,300
Buses
P300 U 1,400 8,200
P600 U 1,600 9,100
MICROS U 900 5,000
P300 I 1,400 8,200
P600 I 1,600 9,100
P900 I 1,600 9,100
Source: Larsen 2005b.
Note: US$1 = Col$2,150.

242 Morgenstern, Larsen, and Sánchez-Triana
Table 7.24 Benefits of Converting to Low-Sulfur Diesel
Benefits of reducing sulfur in diesel, to 0.05 percent
by weight (US$/ton diesel)
Vehicle class Low High
Cars
Private 3.7 21
Public urban 3.7 21
Public interurban 3.7 21
SUVs and vans
Private 3.7 21
Public urban 3.7 21
Public interurban 3.7 21
Trucks
C2-U 3.9 23
C2-I 3.9 23
C3-I 4.6 26
C4-I 4.6 26
C5-I 4.6 26
C5>I 4.6 26
Buses
P300 U 3.9 23
P600 U 3.9 23
MICROS U 3.9 23
P300 I 3.9 23
P600 I 3.9 23
P900 I 3.9 23
Source: Larsen 2005b.
Note: SUVs = sport utility vehicles. Current sulfur content is 0.1 percent by weight.
data limitations, this chapter has documented a number of problems inthe areas of stationary, mobile, and nonpoint sources, and some basicmeasurement issues affecting all sources.
Notwithstanding ongoing concerns about carbon monoxide, hydro-carbons, and possibly other pollutants, overwhelming evidence points toelevated levels of fine particles as the most important cause of airpollution–related health impacts. Accordingly, it would be advisable todevelop a broad strategy to reduce exposure to elevated concentrationsof fine particles (table 7.25). Key elements of this strategy might includethe establishment of national ambient standards for PM10 and PM2.5,plus the strengthening of technology-specific emission standards for PMand its precursors (particularly sulfur and nitrogen oxides). Additionalresources are also needed to enhance monitoring and enforcement activ-ities to address the challenge posed by this pollutant.

Improving Air Quality 243
Table 7.25 Summary of Recommendations for Improving Urban Air Quality
in Colombia
Priority:
Short (S), medium (M), Government
Recommendation and long term (L) agencies
Ambient standards
Design and approve an air pollution control law. S Congress
Design and implement an environmental policy S MAVDT, MSPS,
to reduce urban air pollution, including the INS, MME, DNP,
establishment of national ambient standards AAUs, CARs
for PM10
and PM2.5
.
Review experiences and lessons learned from past M–L CONAIRE, MHCP,
attempts to improve air quality in Colombia. MAVDT, MSPS, INS,
MME, DNP, AAUs
Issue regulations to establish and implement S Congress, MAVDT,
a new air pollution control scheme to promote AAUs, CARs
behavioral change consistent with air
pollution control.
Establish standards for air quality monitoring S MAVDT, IDEAM
equipment and procedures at the national level.
Implement a national air quality monitoring S–M MAVDT, AAUs, CARs
system for PM10
and PM2.5
in priority
urban areas.
Strengthen monitoring networks in major S–M MAVDT, CARs, AAUs
municipalities throughout the country.
Revise 1982 national ambient standards S MAVDT, IDEAM,
and establish national standards for MSPS, INS
PM10
and PM2.5
.
Stationary pollution sources
Update major emissions standards for stationary S MAVDT, IDEAM
sources to reflect new scientific and technological
advances, with a focus on fine particles.
Encourage efforts to improve fuel quality in power S MME, DNP,
plants and heavy industry, including expanded use Ecopetrol
of natural gas to replace coal and low-sulfur oil.
Establish new regulatory programs for specific M MAVDT, CARs, AAUs
sectors and smaller sources not currently covered
by enforceable regulations.
Reform the compliance and enforcement systems, S Congress, MAVDT
including adoption of a rigorous penalty system.
Conduct a major audit of current tax incentives for M–L MHCP, MAVDT, DNP
procuring new pollution abatement and related
equipment.
Based on findings of audit, recommend appropriate L MHCP, MAVDT, DNP
reforms of incentives for procurement of new
pollution abatement and related equipment.
(continued)

244 Morgenstern, Larsen, and Sánchez-Triana
Table 7.25 Summary of Recommendations for Improving Urban Air Quality
in Colombia (continued)
Priority:
Short (S), medium (M), Government
Recommendation and long term (L) agencies
Mobile pollution sources
Continue efforts to raise motor fuel prices to M MME, DNP,
international levels, including gasoline and diesel. Ecopetrol
Maintain 2006 deadline.
Continue efforts to improve fuel quality by S–M MME, MAVDT,
increasing clean fuel imports. Meet the 2008 DNP, Ecopetrol
deadlines on reduction of sulfur content in
fuels, and if possible bring them forward to 2007.
Continue and expand efforts to encourage use S MME, Ministry of
of CNG in vehicles. Transport,
MAVDT, DNP
Establish regulations for upgrading urban S–M MHCP, MAVDT,
bus fleets and other forms of mass transit in CARs, IDEAM
major cities.
Establish regulations and incentives aimed at M–L Ministry of
scrapping older vehicles. Transport, DNP,
MAVDT
Reexamine methods for testing vehicle exhaust in S MAVDT, Ministry
light of international experience, and introduce of Transport,
more rigorous approaches to vehicle AAUs, CARs
emissions testing.
Nonpoint pollution sources
Implement monitoring methods for green S MAVDT, CARs,
cut programs. IDEAM
Enact national-level sanctions, including withholding S MAVDT
financial support for continued noncompliance.
Source: Authors.
Note: INS = Instituto Nacional de Salud; MHCP = Ministerio de Hacienda y Crédito Públicó; MME = Ministerio de Minas y
Energía; MSPS = Ministerio de Salud y Protección Social.
Measurement and MonitoringThe old adage that it is impossible to manage what is not measuredis particularly applicable to air quality. The importance of this pointcannot be overstated. The modest amount of actual monitored data pre-sented in this chapter reflects the limited data available. In some citiesonly single monitors are in operation. Specialized equipment, regularmaintenance, standardized protocols for reading and interpreting thedata, and training of personnel are all essential elements of viable controlpolicies. Furthermore, a centralized depository might be established to

Improving Air Quality 245
review and analyze data from across the country. Overall, a strong insti-tutional structure, combined with solid base funding and continuedoversight, is essential for achieving reliable and consistent measurementsover time. Specifically, standards for air quality monitoring equipmentand procedures to measure particulate matter, mainly PM2.5 and PM10,could be established at the national level, and monitoring networksshould be strengthened in major municipalities throughout the country.
Ambient StandardsThe national ambient standards for key air pollutants, first issued in1982, are still in effect today. Over the past two decades considerableadvances have been made in understanding the link between air pollu-tion and public health. On an international basis, most nations with largeurban populations have reflected the new scientific developments intheir standards. The fact that Bogotá and Cali have updated the 1982standards is a positive step. However, with new information available andprogress in research and technology, it is time to revise national stan-dards.Accordingly, it is advisable that the 1982 national ambient standardsbe updated to reflect the latest developments in science and policymaking. Given the demonstrated health damages associated with ele-vated concentrations of fine particles, the establishment of nationalstandards for PM10 and PM2.5 is recommended. A point of reference forsetting these standards is the 50 µg/m3 average annual limit establishedby the U.S. Environmental Protection Agency.
Stationary SourcesBased on the review of the regulatory structure, the government mightconsider a number of actions to reduce the negative impacts of station-ary sources of air pollution:
• Major emissions standards for stationary sources might be updated toreflect new scientific and technological advances, with a focus on fineparticles.
• It would be advisable to encourage efforts to improve fuel qualityused by power plants and heavy industry, including expanded use ofnatural gas to replace coal, and use of low-sulfur oil.
• The establishment of new regulatory programs for specific sectors (andsmaller sources) not currently covered by enforceable regulations is rec-ommended. As noted, brick kilns are a major source of air pollution insome areas, such as Nobsa. Innovative programs in other developingcountries, such as Mexico, can serve as models for these activities.
246 Morgenstern, Larsen, and Sánchez-Triana
• An extensive reform of compliance and enforcement systems might beconsidered. At present, the penalties for noncompliance appear to beextremely modest. A more serious penalty system could be adopted,and it might be accompanied by strong MAVDT oversight. National-level sanctions could include the withholding of financial support forcontinued failure to uphold the laws.
• A major audit of existing tax incentives for new pollution abatementand related equipment might be considered. Based on the findings ofthe audit, recommendations could be made for appropriate reforms,including possible expansion of the incentives.
Mobile SourcesBecause mobile sources represent a large and growing contribution tourban air pollution, the government might consider several actions:
• Harmonization of motor fuel, particularly diesel, prices with interna-tional levels could be considered. The 2006 deadline established bythe government is adequate and should be maintained.
• Efforts to improve fuel quality by increasing imports of clean fuels,particularly for diesel consumption in Bogotá, Cali, Medellín, Barran-quilla, and Barrancabermeja, are appropriate, and it is advisable tokeep them in place. The 2008 deadlines on sulfur content of fuels areadequate, as well, and it is suggested they be maintained.
• The continuation and expansion of the use of CNG in vehicles isadvisable.
• Additional funding could be made available for upgrading urban busfleets and other forms of mass transit in major cities.
• Additional funding for programs to scrap older vehicles is recommended.• A reexamination of the testing methods for vehicle exhaust would be
advisable in light of the experiences of other countries with similarmethods (such as Mexico and the United States). Other, more rigor-ous, approaches to testing vehicle emissions might be considered.
• Following the proposals of Brugman (2004), additional incentives toencourage use of natural gas, and economic incentives consistent withLaw 99, should be considered.
Nonpoint SourcesBurning of sugarcane residue is the sole nonpoint source examined in thischapter. The evidence presented indicates that compliance with so-called

Improving Air Quality 247
green cut procedures is inadequate to limit potentially harmful pollutionlevels at specified times of the year. Part of the resistance to the use ofgreen cuts is associated with allegiance to traditional practices.Accordingly, it would be advisable that national-level sanctions, includingthe withholding of financial support for continued noncompliance, bebuilt into the arsenal of compliance tools available to government author-ities (Blackman and others 2005).
Notes
1. Richard Morgenstern, Bjorn Larsen, and Ernesto Sánchez-Triana are theauthors of this chapter, which draws heavily from background documents pre-pared for this study by Blackman and others (2005); Brugman (2004); andLarsen (2004, 2005a, and 2005b).
2. According to MAVDT (2006, p. 7), “air quality modeling for Bogotá . . . indi-cates that . . . the air quality problems associated with particulate matter(PM10) stem from fixed sources (65%) and mobile sources (35%). Recentstudies from the Universidad de los Andes indicate that, if only the problem ofsulfur content in diesel fuel used in the country is analyzed, in the best cases50% would stem from fixed sources and 50% from mobile sources, withouttaking into account an analysis of the fuels used in the industrial sector such ascoal and fuel oil which have sulfur contents that are greater than that of vehiclediesel. It should also be taken into account that the automotive park in Bogotá ismade up of approximately 92% gasoline vehicles and only 8% diesel vehicles.”
3. Information from MAVDT (2006, p. 8) indicates that in “Bogotá all stationsoperate on the basis of PM10 equipment (there are 11 stations, 9 with PM10
and 2 with PM10 and TSP), while in Medellín they are based on TSP (of 18stations, 1 has PM10, 2 have TSP and PM10, and the remaining 15 have onlyTSP), in Cali stations are based on PM10 (8 stations), in Bucaramanga PM10
(3 stations), in Barranquilla PM10 (3 stations), in CORNARE PM10 (3 stations),in Cúcuta TSP and PM10 (of 5 stations, 4 have PM10 and 1 has TSP and PM10),in Santa Marta TSP (of 10 stations, 8 measure TSP and 2 TSP and PM10), inPereira PM10 (4), in Cundinamarca PM10 (of 11 stations, 5 have PM10 and 6have PM10 and TSP).”
4. According to data from MAVDT (2006, p. 8) “SO2 is a by-product of thecombustion of fossil fuels . . . such as motor diesel (mobile sources) and fueland crude oils and coal in the industrial sector (fixed sources); the latter withhigher sulfur contents, in the order of 1.7% in weight, compared with vehiclediesel that actually is around 0.”
5. Resolution 058 does not permit the incineration of pesticides, except in traceamounts.The resolution applies to the incineration of “liquid and solid wastes

248 Morgenstern, Larsen, and Sánchez-Triana
containing polychlorinated aromatic hydrocarbons such as polychlorinatedbiphenyls (PCBs), chlorinated hydrocarbon pesticides or pentachlorophenol(PCP) less than or equal to 50 mg/kg. Higher concentrations are prohibited.”According to MAVDT (2006, p. 8), the ministry “has not authorized thethermal treatment of these wastes in the clinker ovens of cement industrieswhich have temperatures greater than 1500ºC and residence times in theorder of 5 seconds (in addition, the incineration of containers is only author-ized on the condition that they are triple washed).” This same condition ismaintained under Resolution 0886 of 2004 which modifies Resolution 058of 2002.
6. See http://www.transmilenio.gov.co.
7. Green cut refers to using manual or mechanical methods to remove sugarcaneinstead of burning out the fields for planting.
8. The standard formulation provides
where E = atmospheric emissions; P = parameter associated with economicactivity in terms of number of employees, production volume, and produc-tion’s value or aggregated value; FE = emission factor; R = coefficient ofreduction of emissions; i = type of polluting agent measured; and j = type ofeconomic activity.
9. Lack of funds to perform annual maintenance (including dynamic gas calibra-tion systems for diluting concentrated certified gas with zero air), to purchasecalibration gases, and to pay for repair service and spare parts has resulted ininstruments not operating or collecting data of questionable quality. In somecases, such as nonoperational hydrogen generators for HC analysis, staff mem-bers reported having worked on the problem for six months without success(Kojima 2004).
10. See Kojima (2004, pp. 4–6) for more details.
11. The reduction would occur under a scenario where the refinery is still oper-ated with the current facilities.
12. For any given level of ambient PM concentrations, the estimated damage costof a ton of PM, or the benefit of a ton of PM emissions reduction, is aninverse function of total emissions. The estimate of emissions by Brugman(2004), and not the estimate by the Universidad de los Andes (2004), istherefore applied in this analysis to provide a more conservative estimate ofdamage cost.
13. The total annual cost of between Col$273 billion and Col$854 billion is fromLarsen (2004).
Ei Pj FEij Rijj
n= −
=∑ ( ) ( ){ }* * 1
1

References
Blackman, Allen, Richard Morgenstern, Libardo Montealegre Murcia, and JuanCarlos Garcia de Brigard. 2005. “Review of the Efficiency and Effectivenessof Colombia’s Environmental Policies.” Final Consultant Report to the WorldBank, Resources for the Future, Washington, DC.
Brugman, Alberto. 2004. “Design of an Economic Instruments Program forManaging and Controlling Urban Atmospheric Pollution in Colombia.”Consultant Report prepared for MAVDT, Colombia.
Cala, David, Bernardo García, and Jose Gómez. Contaminación por fuentes móviles.Technical Report. Bogotá: Ecopetrol.
Contraloría (Contraloría General de la República) 2004. Estado de los RecursosNaturales y del Ambiente 2003–2004. Bogotá: Contraloría.
Countess, Richard. 2003. “Reconciling Fugitive Dust Emission Inventories withAmbient Measurements.” Paper presented at the 12th International EmissionInventory Conference, San Diego, CA, April 29–May 1.
DAGMA (Departamento Administrativo para la Gestión del Medio Ambiente,Cali). 2004. “Management Report from the Basic Unit for EnvironmentalMonitoring, Third Quarter 2004.” DAGMA, Cali.
DAMA (Departamento Administrativo de Medio Ambiente, Bogotá). 2003.“Informe de Gestión 2001–2003.” DAMA, Bogotá.
Ecopetrol. 1992. “Control de la Contaminación Atmosférica por FuentesMóviles.” Informe Final, ICP-Departamento Técnico de Ecopterol, Bogotá.
Faiz, A., C. Weaver, and M. Walsh. 1996. Air Pollution from Motor Vehicles:Standards and Technologies for Controlling Emissions. Washington, DC: WorldBank.
Kojima, Masami. 2004. “Urban Air Quality Management.” Unpublished, WorldBank, Washington, DC.
Krupnick, Alan, Virginia McConnell, and Eduardo Uribe Botero. 1996. “MobileSources and Air Pollution Policy: International Experience andRecommendations for Bogotá, Colombia.” Resources for the Future,Washington, DC.
Larsen, Bjorn. 2004. “Cost of Environmental Damage: A Socio-Economic andEnvironmental Health Risk Assessment.” Consultant Report prepared forMinistry of Environment, Housing and Regional Development, Colombia.
———. 2005a. “Cost-Benefit Analysis of Environmental Protection in Colombia.”Consultant Report prepared for Ministry of Environment and TerritorialDevelopment and ACCI, Colombia.
———. 2005b. “Cost of Environmental Damage: Analysis by Department.”Consultant Report prepared for Ministry of Environment, Housing andRegional Development, Colombia.
Improving Air Quality 249

250 Morgenstern, Larsen, and Sánchez-Triana
MAVDT (Ministerio de Ambiente, Vivienda y Desarrollo Territorial). 2006.Comentarios Consolidados al Documento CEA. E-mail sent by LeonardoPinzon, Olga Bautista and Pedro Chavarro to Angela Armstrong. February17, 2006.
Perry, Guillermo, Alberto Brugman, Ernesto Sánchez-Triana, and Alvaro Santoyo.1991. “Hacia una Sana Política Petrolera.” Bogotá: Fedesarrollo.
Perry, Guillermo, Eduardo Lora, Pilar Medina, and Ernesto Sánchez-Triana. 1993.Diagnostico y Políticas de Control de la Contaminación por Fuentes Móviles enColombia. Bogotá: Fedesarrollo.
Sánchez-Triana, Ernesto, and Gabriel Medina. 1994. “Cumplimiento en laAplicación de la Gestión Ambiental.” In Contaminación Industrial en Colombia,ed. E. Sánchez-Triana and Uribe. Bogotá: DNP-PNUD.
Scarborough, James, Nicholas Clinton, and Peng Gong. 2002. “Creating aStatewide Spatially and Temporally Allocated Agricultural Burning EmissionsInventory Using Consistent Emission Factors.” Prepared for the Air ResourcesBoard, California Environmental Protection Agency.
Suarez, Sandra, Santiago Montenegro, and Alberto Carrasquilla. 2005. “Letter ofDevelopment Policy.” Appendix 1 to “Program Document for a ProposedProgrammatic Development Policy Loan for Sustainable Development in theAmount of $150 Million to the Republic of Colombia.” Report No. 32360-CO, World Bank, Washington, DC.
Universidad de los Andes. 2004a. Diseño e Implementación de un Modelo deCalidad de Aire para Bogotá. Informe Semestral 6. Departmaneto deIngeniería Civil y Ambiental CIIA.
Universidad de los Andes and CEDE. 2004b. “Application of the World Bank’sWDR Framework 2003.” 4th Version. Final Report, World Bank, Bogotá.
UPME (Unidad de Planeación Minero Energética). 2005. Boletín EstadísticoMinero y Energético. 1994–2004. Bogotá: Ministerio de Minas y Energía.
Walsh, M. 1998. “Pollution from Diesel Vehicles: Worldwide Experience withAftertreatment Retrofit.” Consultant Report prepared for Hong KongEnvironmental Protection Department.
World Bank. 2005. World Development Indicators. Washington, DC: World Bank.

About 60 percent of rural households and 3 percent of urban households inColombia burn solid fuels for domestic purposes. Exposure to indoor air pol-lution as a result of domestic use of solid fuels has adverse health impacts andis linked to illnesses such as acute respiratory infections and chronic obstruc-tive pulmonary disease. In rural households, especially, burning solid fuelsin poorly designed stoves or hearths exposes women and children to harmfulconcentrations of particulate matter and gaseous pollutants. Such householdstypically cannot afford cleaner fuel options or are not connected to the electricitygrid. Children under age 5 and the women who look after them and spendlarge amounts of time cooking are most vulnerable to the adverse healtheffects of indoor air pollution. The findings of this chapter underscore theurgent need to address the problem of indoor air pollution through a programof cross-sectoral interventions that include facilitating awareness of the problem,technical mitigation options, fuel substitution, behavioral change, and improvedhousing design.
Indoor air pollution is a priority environmental issue in Colombia. Thedata from Demographic Health Surveys (DHSs) indicate that around60 percent of rural households and less than 3 percent of urban householdsused fuelwood or charcoal and coal products in 2000.1 On a nationallevel, about 18 percent of households used fuelwood or charcoal and
C H A P T E R 8
A Silent Killer: Indoor
Air Pollution
251

coal products during this period. Even though rapid inroads were madewith respect to the use of liquefied petroleum gas (LPG) or natural gasin both rural and urban households during 1995 to 2000, replacing bothtraditional fuels and electricity for cooking, the share of rural householdsusing traditional fuels remains substantial (Larsen 2004).
Larsen (2004) estimated that the annual cost of health impacts fromindoor air pollution associated with the use of traditional fuels, mainlyfuelwood, is Col$415 billion (US$193 million). Taken together, thedamages associated with indoor and outdoor air pollution representalmost 1 percent of Colombia’s gross domestic product (GDP). Acuterespiratory illness (ARI) in children and adult females accounts for47 percent of this cost, adult female chronic obstructive pulmonary disease(COPD) mortality accounts for 28 percent, adult female COPD mor-bidity accounts for 13 percent, and respiratory child mortality accountsfor about 12 percent (figure 8.1).
The urgent need to address indoor air pollution is evident throughoutmost of the developing world. The World Health Organization (WHO2002) estimates that more than 75 percent of people in India, China,and other Asian countries, and 50 to 75 percent of people in parts ofSouth America and Africa, continue to rely on solid fuels such as dung,wood, agricultural residues, or coal for heating and cooking. The use ofthese fuels in simple stoves generates substantial amounts of pollutantsthat are known to cause respiratory infections, pulmonary disease, andcancer. Exposure to these pollutants is greater for children and women,who usually spend a greater share of their time indoors. As a result, anestimated 2.7 percent of disability-adjusted life years (DALYs) worldwideare attributable to indoor smoke, 2.5 percent in males and 2.8 percentin females. In most Latin American countries, including Colombia, theproportion of DALYs attributable to indoor smoke from solid fuels is0.5 percent to 0.9 percent (figure 8.2).
252 Larsen, Ahmed, and Awe
0
50
100
150
200
250
ARI morbidity
bill
ion
pes
os
COPD mortality COPD morbidity ARI child mortality
Figure 8.1 Annual Costs of Indoor Air Pollution
Source: Larsen 2005a.
Note: US$1 = Col$2,150.

Currently, under Law 99 of 1993, the Ministry of Environment(Ministerio del Medio Ambiente, MMA) is responsible for the preparationof national standards, and the Autonomous Regional Corporations(Corporaciones Autónomas Regionales, CARs) are responsible for thedevelopment and enforcement of local standards. As of August 2005,there were no policies or programs to control indoor air pollutants.
Acute Respiratory Illness in Colombia
The prevalence rate of ARI in children as reported by the 2000Colombia DHS varies substantially across departments and subregions,with a range of 7.6 percent to 24.4 percent (table 8.1).2
The ARI prevalence rate does not vary much with a mother’s education,although it is somewhat higher in children with mothers who have no edu-cation (figure 8.3). However, the percentage of ARI cases that receive medi-cal attention is more than three times higher for children with mothers whohave a university education compared with children with mothers whohave no education (table 8.2). Because lack of treatment increases the riskof ARI mortality, the figures in table 8.2 may indicate that the burden ofARI, expressed in morbidity and mortality, is higher among lower socioeco-nomic groups. These groups are also more likely to use solid fuels forcooking, increasing the risk of ARI morbidity and mortality in children.
A Silent Killer: Indoor Air Pollution 253
Figure 8.2 Proportion of DALYs Attributable to Indoor Smoke from Solid Fuels
Source: WHO 2002.
Note: DALYs = Disability-adjusted life years.

254 Larsen, Ahmed, and Awe
Table 8.1 Acute Respiratory Illness Prevalence Rates in Children
Percentage of children under age 5 with ARI
Departments (grouped by region) during the two weeks before survey
La Guajira, Cesar, Magdalena 12.7
Atlántico, Bolívar Norte 19.7
Bolívar, Sucre, Córdoba 24.4
Santanderes 9.1
Boyocá, Cundinamarca, Meta 9.4
Antioquía 11.6
Medellín 12.9
Caldas, Risaraldo, Quindío 7.6
Tolima, Huila, Caqueta 9.0
Cauca, Nariño 11.0
Bogotá 10.3
Valle del Cauca 13.8
Litoral Pacíficoa 17.5
Cali 14.3
All Colombia 12.6
Source: DHS 2000.
a. Litoral Pacífico includes Chocó.
Table 8.2 Child Health, ARI Treatment, and Maternal Education
ARI prevalence Child mortality Percentage of ARI
rate in rate (per 1,000 cases treated at
Maternal education children (%) births) health facilities
No education 16.9 44 25.7
Primary education 12.2 33 41.0
Secondary education 12.5 24 55.8
University education 13.5 15 83.8
Source: Data are from DHS (2000) for children under age 5.
Note: Diarrheal prevalence rate is for two weeks before survey date.
0
3.0
6.0
9.0
12.0
15.0
18.0
No education
per
cen
t
Primary education Secondary education University education
Figure 8.3 ARI Prevalence in Children by Mother’s Education Level
Source: DHS 2000.
Note: ARI prevalence refers to percentage of children under age 5 with ARI in the two weeks preceding the date of
the household survey.

Health Effects of Indoor Air Pollution
It is well documented from studies around the world that indoor air pol-lution from burning solid fuels for cooking and heating in the indoorenvironment has substantial respiratory health effects. Women andyoung children appear to bear the largest effects, because they tend tospend more time indoors or closer to the cooking areas, or both. Somestudies have also reported health effects in men. Smith, Mehta, and Feuz(2004) and Desai, Mehta, and Smith (2004) report results of healtheffects from biomass smoke (fuelwood and so forth) and coal smokebased on a meta-analysis of available studies. The results of the meta-analysis are presented in table 8.3. The relative risk (RR) represents therisk of health effect or illness from the use of solid fuels relative to therisk of illness from the use of clean fuels such as LPG. The RR for house-holds using LPG is therefore 1.0.
The strongest evidence of health effects is for acute lower respiratoryillness in children under age 5, COPD in adult females, and lung cancerin adult females from coal smoke. Smith, Mehta, and Feuz (2004) andDesai, Mehta, and Smith (2004) do not report an RR ratio for ARI inage groups age 5 and over because most studies have concentrated onchildren under age 5. However, Ezzati and Kammen (2002), from astudy in Kenya, find that the RR for the group age 5 to 49 is similarto the RR for children under 5 at various levels of exposure to indoorair pollution.
A Benefit-Cost Analysis Framework
A benefit-cost analysis of interventions to reduce indoor air pollutionfrom solid fuels presents a challenge for many reasons. The relativerisks reported in table 8.3 are averages from many studies and do notnecessarily reflect the pollution exposure situation in households thatuse solid fuels in Colombia. Moreover, the pollution load from solidfuels is not homogeneous across households. Some households useunimproved stoves or open fires while others use improved stoves withchimneys, and some households use a combination of solid fuels andclean fuels such as LPG. A benefit-cost analysis framework shouldtherefore be flexible enough to accommodate these differences andallow for a sensitivity analysis of parameters that will influence thebenefits and costs of interventions to reduce pollution loads or expo-sure or both.
A Silent Killer: Indoor Air Pollution 255

For the purposes of this report, five scenarios were selected that por-tray five stylized situations commonly found in most developing coun-tries (table 8.4). These stylized situations represent reasonably well thepollution loads from solid fuel use. Actual pollution exposure, however,can vary substantially in each scenario and depends on additional factorssuch as household ventilation practices, housing characteristics, andhousehold behavior. Because data on these factors are not readily avail-able at the national level, a sensitivity analysis of relative risk will needto be undertaken to assess the likely influence of these factors on thebenefit-cost ratios of interventions.
The next step is to assign population shares and relative risks to each ofthe stylized situations in table 8.4. According to the Colombia DHS 2000,about 18 percent of the population in Colombia relies on fuelwood(17 percent) and charcoal (1 percent) as the main fuels for cooking. In ruralareas, over 60 percent of the population relies on these fuels. The Miningand Energy Planning Unit (Unidad de Planeación Minero Energética, UPME)presents very similar statistics and estimates that the total annual fuelwoodconsumption is 4.5 million to 5.0 million metric tons. Furthermore, nearly1.5 million households use fuelwood and charcoal as their primary energysources for cooking and account for an average annual household consump-tion of 3.15 tons. Unfortunately, the data on fuel use are insufficient toaccurately assign the population shares that fall in each of the scenarios orstylized situations presented in table 8.4. Therefore, it is necessary to applya base case on which a sensitivity analysis should be performed.
256 Larsen, Ahmed, and Awe
Table 8.3 Relative Risks for Strong and Moderate Health Outcomes
Evidence Health outcome Group RR CI
Strong ALRI Children < 5 yrs 2.3 1.9–2.7
COPD Women > 30 yrs 3.2 2.3–4.8
Lung cancer Women > 30 yrs 1.9 1.1–3.5
(from coal smoke)
Moderate-I COPD Men > 30 yrs 1.8 1.0–3.2
Lung cancer Men > 30 yrs 1.5 1.0–2.5
(from coal smoke)
Moderate-II Lung cancer Women > 30 yrs 1.5 1.0–2.1
(from biomass smoke)
Asthma Children 5–14 yrs 1.6 1.0–2.5
Asthma All > 15 yrs 1.2 1.0–1.5
Cataracts All > 15 yrs 1.3 1.0–1.7
Tuberculosis All > 15 yrs 1.5 1.0–2.4
Source: Desai, Mehta, and Smith 2004.
Note: ALRI = Acute lower respiratory infection; CI = confidence interval; RR = relative risk.

Moreover, little information is available in Colombia that allowsassignment of relative risks to each of the stylized situations in table 8.4.While some information on assigning relative risks is available from theinternational literature, the situation-specific evidence is weak comparedwith that for water and sanitation. It is therefore necessary to apply abase case of RRs to each of the stylized situations and perform a sensi-tivity analysis. The following set of equations can be used to establish abase case of RRs:
SURRU � SIRRI � SULRRUL � SILRRIL � SSFRRSF (8.1)
RRI � 1 � (RRU � 1) (1 � r) (8.2)
RRUL � 1 � (RRU � 1) LU (8.3)
RRIL � 1 � (RRI � 1) LI (8.4)
where S is population share and RR is the relative risk of using an unim-proved stove (U), an improved stove (I), a combination of an unim-proved stove and LPG (UL), and a combination of an improved stoveand LPG (IL). SSF is the total population share using solid fuels (with orwithout LPG), and RRSF is the weighted-average relative risk of illness inthese households. In equation (8.2), r is the “excess” risk reduction fromusing improved stoves relative to unimproved stoves. L is the share of
A Silent Killer: Indoor Air Pollution 257
Table 8.4 Fuels, Stove Technology, and Pollution Scenarios
Stylized situation Stylized description RR
I. Unimproved wood stoves or Low energy efficiency; no chimney Very High
open fire or ventilation device; very high
indoor pollution load
II. Improved wood stoves Relatively low energy efficiency; High
chimney (or other ventilation
device) taking much of the smoke
outdoors; still relatively high indoor
pollution load if stove or chimney is
not well maintained
III. Unimproved wood stoves and Pollution load reduced in Medium
LPG (or other clean fuel) proportion to the use of LPG
(relative to situation I)
IV. Improved wood stoves and Pollution load reduced in Medium to Low
LPG (or other clean fuel) proportion to the use of LPG
(relative to situation I)
V. LPG or other clean fuel Absence of smoke from solid fuels Low
Source: Authors.
Note: The framework in this table is very similar to the exposure scenario framework presented in Pruss and others
(2002), which was applied in chapter 6 of this book.

energy derived from LPG in households using LPG and an unimprovedstove (U) and in households using LPG and an improved stove (I).
The base cases for different population shares and relative risks arepresented in table 8.5. Because solid fuel is used almost exclusively inrural areas in Colombia, rural population shares are applied in table 8.5.About 35 percent use LPG or other clean fuel. As previously mentioned,the DHS and UPME data do not provide the population shares for situ-ations I through IV. On the basis of data from Guatemala (Ahmed andothers 2005), it is estimated that around 20 percent of rural householdsuse a combination of solid fuels and LPG in Colombia. This share is splitevenly between unimproved and improved stoves so that the rural pop-ulation share in situations III and IV is 10 percent. Moreover, it isassumed that these households on average derive 50 percent of theircooking energy demand from LPG and 50 percent from solid fuels. Ofthe remaining rural population, 25 percent is assigned to situation I and20 percent to situation II. It should be noted that there are no readilyavailable data to substantiate this allocation. The shares are thereforesubjected to sensitivity analysis in later sections of this chapter.
Two more parameters must be assigned to solve the system of equations(8.1) through (8.4) and arrive at the RRs presented in table 8.5. One ofthem is the reduction in excess risk, r, from using improved stoves insteadof unimproved stoves. Although there is limited guidance from the inter-national literature on the size of r, there are several studies from around theworld that present measurements of particulate exposure from solid fueluse, particularly from cooking. Some results from Latin America are pre-sented in table 8.6.The 24-hour average concentration levels from open fireor traditional stoves are many times higher than urban air quality standardsin most countries.The improved stoves, such as the plancha, produce levelsof particulate matter less than 2.5 microns in diameter (PM2.5) or less than3.5 microns in diameter (PM3.5) that are often only 20 percent of those
258 Larsen, Ahmed, and Awe
Table 8.5 Base Case Estimation of Scenario-Specific Relative Risks
Rural population RR RR for COPD
Stylized situations share (%) for ARI in women
I. Unimproved wood stoves or open fire 25 3.0 4.4
II. Improved wood stoves 20 2.0 2.7
III. Unimproved wood stoves and LPG (or other clean fuel) 10 2.0 2.7
IV. Improved wood stoves and LPG (or other clean fuel) 10 1.5 1.8
V. LPG or other clean fuel 35 1.0 1.0
Weighted average risk of I to IV 2.3 3.2
Source: Larsen 2005b.

from an open fire, and are even found to be less than 10 percent of that ofan open fire in a study in Guatemala by McCracken and Smith (1998).According to the figures in table 8.6, the reduction in PM2.5 concentrationappears even larger than reductions in particulate matter less than 10 microns in diameter (PM10) (Albalak and others 2001; Naeher, Leaderer,and Smith 2000; Saatkamp, Masera, and Kammen 2000).While the indoorconcentration levels of PM can be substantially reduced by using improvedstoves, it is not clear that the health benefits are proportional. The concen-tration levels of PM, even with an improved stove, are still substantiallyhigher than those found in most outdoor urban environments.
Table 8.7 provides the results of a study by Ezzati and Kammen(2002), which presents odds ratios for ARI in relation to indoor concen-trations levels of PM10. Halving of PM10 levels from 1,000 to 2,000 micro-grams per cubic meter (µg/m3) to 500 to 1,000 µg/m3 can correspond tothe reduction in concentration levels achievable by using an improvedstove instead of an unimproved stove. This reduction in concentrationlevel is associated with a reduction in the odds ratio of about 50 percentfor children under age 5 and 25 percent for the age group 5 to 49. Thereduction in excess risk can be calculated from equation (8.2):
r � (RRU � RRI )/(RRU � 1) (8.5)
For children under age 5, r = (4.30 � 2.15)/(4.30 � 1) � 65 percent.For age group 5 to 49, r � (3.79 � 2.77)/(3.79 � 1) � 36 percent. Thesimple average for the two age groups is around 50 percent.An r of 50 per-cent has therefore been applied in the base case in table 8.5 for ARI toestablish the relative order of magnitude of the RR in situations I and II.
One additional parameter needs to be assigned a value to solve equations(8.1) through (8.4). There are two logical choices of parameters, that is,
A Silent Killer: Indoor Air Pollution 259
Table 8.6 PM Concentrations from Cooking Stoves
Concentration in μg/m3
Open fire or Improved
Measurement traditional stove stove LPG
24-hour PM3.5
1,930 330 n.a.
24-hour PM10
1,210 520 140
24-hour PM2.5
520 88 45
24-hour PM2.5
868 152 n.a.
PM10
600–1,000 300 50
Source: Compiled by Larsen (2005a).
Note: n.a. = not applicable; μg/m3 = micrograms per cubic meter; PM2.5
= particulate matter less than 2.5 microns
in diameter; PM3.5
= particulate matter less than 3.5 microns in diameter; PM10
= particulate matter less than
10 microns in diameter.

the average risk ratio RRSF or the risk ratio associated with the use of anunimproved stove (RRU). A logical candidate for the base case value ofRRSF is the central estimate of the RR from the international literature intable 8.3, while a logical value for RRU might be the upper end of theconfidence intervals.The former was selected in this report, given that thecentral estimates reflect a diverse set of situations reported in the litera-ture. Thus, RRSF is equal to 2.3 for ARI and to 3.2 for COPD in women.
Equations (8.3) and (8.4) implicitly assume that the risk of illness isproportional to the share of LPG in households that use both solid fuelsand LPG (or other clean fuels). For instance, the excess risk of illness isreduced by 50 percent if a household derives 50 percent of cookingenergy demand from LPG. While the study by Ezzati and Kammen(2002) presented in table 8.7 might suggest that excess risk is reducedby about 50 percent for a 50 percent reduction in PM10 concentrationlevels from 1,000 to 2,000 µg/m3 to 500 to 1,000 µg/m3, it is not clearthat a 50 percent reduction in solid fuel consumption translates to a50 percent reduction in PM concentration levels. Whereas Albalak andothers (2001) estimate 45 percent lower PM3.5 levels with the use of acombination of open fire and LPG compared with open fire only, thepercentage difference in solid fuel consumption is not clear.
Using the parameter values as discussed, the solution to equations(8.1) through (8.4) is the RRs presented in table 8.5. Only COPD inwomen and ARI are included. While there is moderate evidence forincreased risk of COPD in men, it is not included in this report. For ARI,however, both children under age 5 and women over age 15 are included,although ARI in adult women is not included in the meta-analysis resultspresented in Smith, Mehta, and Feuz (2004) and Desai, Mehta, andSmith (2004). The study by Ezzati and Kammen (2002) provides some
260 Larsen, Ahmed, and Awe
Table 8.7 Odds Ratios for ARI
PM10
(μg/m3) Children under age 5 Age 5 to 49
<200 1.00 1.00
200–500 2.42 3.01
500–1,000 2.15 2.77
1,000–2,000 4.30 3.79
2,000–3,500 4.72 —
2,000–4,000 — 4.49
>3,500 6.73 —
4,000–7,000 — 5.40
>7,000 — 7.93
Source: Ezzati and Kammen 2002.
Note: — = not available; μg/m3 = micrograms per cubic meter.

evidence of similar ARI risk ratios for children under age 5 and the age5 to 49 group. A sensitivity analysis is performed for ARI in women overage 15 in the benefit-cost ratio estimations later in this section.
The population shares and the relative risk ratios in table 8.5 allow a basecase estimation of the health benefits of interventions such as usingimproved stoves and switching to clean fuels (table 8.4). To estimatebenefit-cost ratios, however, the costs of interventions need to be esti-mated. In addition to costs of improved stoves and LPG stoves (or stovesfor other clean fuels), this exercise involves an assessment of householdenergy consumption for cooking to estimate the recurrent cost of LPGrequirements or other clean fuels. In addition, time savings from reducedfuelwood collection may be an important benefit for many householdsof switching to improved stoves or clean fuels. Fuelwood consumptionmust therefore be estimated for the various stylized situations or scenariosin table 8.4. Thus, the first step in estimating the costs of interventionsis to consider stove efficiencies.
Stove Efficiency
Figure 8.4 presents an energy efficiency ladder for stoves, and typicalcosts that are often cited in the research literature on fuel use and indoorair pollution (for example, Baranzini and Goldenberg 1996; Luo andHulscher 1999; and Saatkamp, Masera, and Kammen 2000). The stove
A Silent Killer: Indoor Air Pollution 261
0
10
20
30
40
50
60
70
80
tradit
ional
wood s
tove
tradit
ional
char
coal
stove
impr
oved
woo
d stov
e
impr
oved
char
coal
stove
kero
sene
wick
stov
e
kero
sene
pres
sure
stov
e
LPG st
ove
electr
ic ho
t plat
e
sto
ve e
ffic
ien
cy (
%)
and
sto
ve c
ost
(U
S$)
efficiency stove cost
Figure 8.4 Stove Efficiency and Capital Costs
Source: Larsen 2005.

efficiency ladder provides a generic perspective on potential energy savingsfrom improved wood and charcoal stoves and from kerosene, LPG, andelectric stoves compared with traditional stoves. According to figure 8.4,improved wood and charcoal stoves are about 50 percent more efficientthan traditional stoves, and LPG and electric stoves are twice as efficientas the improved wood and charcoal stoves.
A study of stove efficiency in Colombia was conducted by theDepartment of Physics of the National University of Colombia. Theresults of the study were provided by UPME for the purposes of thisreport, and are presented in figure 8.5. The study estimated the stoveefficiency for three different sizes of pots or kettles. The efficiency forelectric plates was around 80 percent for all three pot sizes. LPG andnatural gas stoves had an efficiency of 45 to 55 percent for the twosmallest pot sizes. The efficiency for the largest pot size was over 75 per-cent. For a wood firebox, an improved wood stove, the efficiency wasbelow 10 percent for the two smallest pots, but about 30 percent for thelargest pot.The efficiency of fuelwood, or a traditional open stove, was lessthan 5 percent for the smaller pots, and 20 percent for the largest pot.
For the most part, the results from this Colombian study are consis-tent with the generic efficiency ladder illustrated in figure 8.4. A studyof the plancha woodstove in Guatemala reported an efficiency of about10 percent, very similar to the efficiency of using open fire. A modifiedversion of the plancha had an efficiency of about 12 percent (Boy and
262 Larsen, Ahmed, and Awe
0
10
20
30
40
50
60
70
80
90
electric LPG natural gas wood firebox fuelwood
sto
ve e
ffic
ien
cy (
%)
2.9 liter pot 5.5 liter pot 7.2 liter pot
Figure 8.5 Stove Efficiency from a Study in Colombia
Source: Study conducted by the National University of Colombia, Department of Physics. The results of the study
were provided by UPME.

others 2000). McCracken and Smith (1998) reported an efficiency of13 to 14 percent for the plancha and open fire. Saatkamp, Masera, andKammen (2000) reported estimates of stove efficiencies in Jaracuaro,Mexico, and found that the efficiency of the lorena woodstove is notmuch different from traditional open stoves.
Many communities in Latin America have adopted the plancha andlorena woodstoves. While these stoves are often not very efficient, theyare equipped with chimneys that remove the smoke from the indoorenvironment and therefore offer important potential health and quality-of-life benefits. A simple lorena stove is made from mud-clay mixed withsand, and a metal tube chimney. The lorena and plancha stoves have alsobeen built from brick. Several versions of these stoves have also beendeveloped to improve stove efficiency.
Fuelwood Consumption
Households that use fuelwood typically fall into one of three situations.Some households use open fires or traditional woodstoves. Others useimproved woodstoves. Finally, some households use fuelwood in combi-nation with LPG or another type of cleaner fuel. On the basis of datafrom UPME, it is estimated that the average household using fuelwoodconsumes 3.15 tons per year. However, household consumption for agiven household size will vary depending on woodstove efficiency andwhether the household also uses other fuel types for cooking.
To estimate household fuelwood consumption, the following equa-tions are used:
eU HU � eI HI (8.6)
HUL � aUL HU (8.7)
HIL � aIL HI (8.8)
SUHU � SIHI � SULHUL � SILHIL � 3.15 (8.9)
where H is annual household consumption of fuelwood in tons; S is thepercentage of households using unimproved stoves (U), improved stoves(I), a mix of LPG and fuelwood with unimproved stove (UL), and a mixof LPG and fuelwood with improved stove (IL); e is stove efficiency; anda is the fuelwood consumption share in households using a mix of LPG andfuelwood. In both cases, a � 0.5, and it is measured in effective energy(product of net heating value and stove efficiency). The stove efficiencye is based on the findings illustrated in figure 8.5 and is set to 10 percent
A Silent Killer: Indoor Air Pollution 263

for unimproved stoves and 15 percent for improved stoves, in both casesrepresenting an average of the different pot sizes.
Solving the system of equations (8.6) through (8.9) provides estimatesof annual household fuelwood consumption presented in table 8.8.These estimates are based on the assumption that the groups of house-holds have, on average, the same demand for cooking energy.
Whether the fuelwood consumption in these four cases is realisticmust be assessed. Saatkamp, Masera, and Kammen (2000) estimate fuel-wood consumption in Jaracuaro, Mexico, in the range of 0.5 kilograms(kg) to 1.0 kg per meal per person for the lorena stove and open fire. Twomeals a day for an average household size of five people implies an annualfuelwood consumption of 1.8 tons to 3.6 tons per year. For three mealsa day, the annual consumption would be 2.7 tons to 5.4 tons per year.This is in the range of the estimated fuelwood consumption in table 8.8.Boy and others (2000) estimate a fuelwood consumption of 6 kg for thepreparation of 0.45 kg of beans and 1.35 kg of tortillas, using a planchastove. If this food were prepared twice a day, the annual fuelwood con-sumption would be 4.4 tons.
Cost of Interventions
The estimated annual recurrent cost of switching from fuelwood tocommercial energy, or from a combination of fuelwood and LPG to LPGonly, is presented in table 8.9. At energy prices (in 2004) in Colombia,natural gas is found to be the least-cost option, followed by LPG. Thecost of using electricity to replace fuelwood is found to be several timeshigher than using natural gas or LPG as replacements for fuelwood.Furthermore, the costs of using electricity to replace fuelwood are iden-tical for households that use unimproved wood stoves and householdsthat use improved wood stoves (with 10 percent and 15 percent efficiency,respectively). This is because of the assumption that both householdshave the same effective energy demand. While natural gas seems to bethe least-cost option, availability of natural gas to all rural households is
264 Larsen, Ahmed, and Awe
Table 8.8 Estimated Annual Household Consumption of Fuelwood
Stove technology Fuelwood consumption (tons)
Unimproved wood stoves 4.40
Improved wood stoves 2.90
Unimproved wood stoves and LPG stoves 2.20
Improved wood stoves and LPG stoves 1.45
Source: Authors.

A Silent Killer: Indoor Air Pollution 265
Table 8.9 Annual Recurrent Cost of Complete Fuel Substitution
Annual cost per household (thousand pesos)
LPG (bottles)
Stove technology 17.7 gallon 6.6 gallon Natural gas Electricity
Unimproved wood stoves 206 256 99 608
Improved wood stoves 206 256 99 608
Unimproved wood stoves and LPG stoves 103 128 n.a. n.a.
Improved wood stoves and LPG stoves 103 128 n.a. n.a.
Source: Authors.
Note: n.a. = not applicable.
unlikely in the short to medium term. LPG therefore seems to be themost viable option.
The cost values presented in table 8.9 are likely to underestimate thecosts of providing commercial energy to distant rural areas. However, over30 percent of rural households in Colombia already use LPG and othercommercial energy sources according to the Colombia DHS 2000. Thus,supplying these fuels to other rural households may not be substantiallymore expensive than to households that already use commercial fuels.
Table 8.10 presents the baseline parameters used to estimate the costof switching to commercial energy. These parameters are based on datafrom UPME and results of a study conducted by the National Universityof Colombia.
Capital costs and annualized costs of improved stoves and LPG stovesare presented in table 8.11. Capital costs are adapted from Ahmed andothers (2005) from Guatemala. Although simple improved stoves usedin many developing countries are found to be quite inexpensive, aspresented in figure 8.4, the type of improved stoves commonly used inLatin America is far more expensive, as indicated in table 8.11.Annualized costs are calculated by employing a useful life of 10 yearsand an annual discount rate of 10 percent.
Benefit-Cost Analysis
A benefit-cost analysis is conducted for the five interventions shown intable 8.12, which are based on the stylized situations in table 8.4. Theestimated benefits of these interventions are presented in table 8.13.Avoided cases of ARI and COPD are estimated from the relative riskratios in table 8.5 and baseline estimates of annual cases of ARI andCOPD. Baseline cases are presented in Larsen (2004). The monetarybenefits of avoided cases are calculated from the estimated unit costs of

266 Larsen, Ahmed, and Awe
ARI and COPD morbidity and mortality, also presented in Larsen (2004).Unit costs of morbidity include medical treatment cost, value of time losses(at 75 percent of wages), and DALYs valued at GDP per capita as a proxyfor the cost of reduced well-being.3 Child mortality is valued by using thehuman capital approach (HCA) of discounted life earnings losses.
Adult mortality is valued by the human capital approach (HCA) as alower bound and the value of statistical life (VSL) approach as an upperbound. VSL is derived from benefit transfer from the United States andother high-income countries using an income elasticity of 1.0, based on
Table 8.10 Baseline Parameters for Estimating the Cost of Fuel Substitution
Substitute fuel Parameter
Fuelwood
Average gross energy content of fuelwood (MJ/kg) 19
Average net energy content of fuelwood (MJ/kg) 11
Propane (LPG)
Average stove efficiency (propane) (%) 55
Average energy content of propane (Btu/gallon) 92,000
Cost per bottle (17.7 gallon bottles) (pesos) 39,000
Cost per bottle (6.6 gallon bottles) (pesos) 18,000
Natural gas
Average stove efficiency (gas) (%) 55
Average energy content of natural gas (Btu/m3) 35,395
Cost of natural gas (residential) (pesos/m3) 406.45
Electricity
Average stove efficiency (%) 80
Cost of electricity (pesos/kWh) 350
Sources: Energy content of LPG and natural gas, and prices of LPG, natural gas, and electricity are based on data
from UPME. Gross and net energy content of fuelwood (gross and net heating content) and stove efficiencies are
from a study by the National University of Colombia provided by UPME.
Note: Btu = British thermal unit; kWh = kilowatt hour; m3 = cubic meter; MJ/kg = megajoules per kilogram.
US$1 = Col$2,150.
Table 8.11 Cost Estimates of Improved Wood Stoves and LPG Stoves
Costa
Type of cost Low High
Capital cost
Improved wood stove 145,000 (60) 290,000 (120)
LPG stove 145,000 (60) 145,000 (60)
Annualized cost
Improved wood stove 21,000 42,000
LPG stove 21,000 21,000
Source: Larsen 2005b.
Note: US$1 = Col$2,150.
a. Values without parentheses are Colombian peso amounts.

the midpoint value from the range of US$1.5 million to US$2.5 millionas estimated by Mrozek and Taylor (2002). As seen in table 8.13, thetotal health benefits of the interventions are greatly influenced by thechoice of valuation technique for adult mortality.
An estimate of the value of time savings from reduced fuelwoodcollection is also included in table 8.13 for each intervention. As a basecase, it is assumed that a household that uses an unimproved wood stovespends on average 30 minutes per day on fuelwood collection.Intervention (2) provides a 100 percent time saving while, for instance,intervention (1) provides a 33 percent time saving. These estimates arederived from table 8.8. In table 8.13, time is valued at 75 percent ofaverage rural wages. In total, the estimated benefits of time savings areclose to the lower bound of health benefits of interventions (2) through(5). The estimated benefits in table 8.13 represent a base case. A sensi-tivity analysis is performed later in this section.
Table 8.14 presents the estimated annual costs of interventions. Thecost of LPG represents 80 to 85 percent of total cost of interventions (2)through (5), while the annualized cost of an LPG stove is less than 10percent of total cost (interventions [2] and [3]). A tentative estimate ofthe program cost of promoting and implementing improved stoves andfuel switching to LPG, and sustaining a stove inspection and mainte-nance program, is also included in table 8.14. The estimated cost is basedon an incremental local government staff requirement of one to four staffmembers in a village with 300 to 600 households.
Table 8.15 presents estimated benefit-cost ratios for the five interven-tions for which benefits and costs are provided in tables 8.13 and 8.14.Eight ratios are estimated for each intervention. Four ratios include onlythe health benefits and the remaining four ratios include both healthbenefits and benefits of time savings from reduced fuelwood collection,that is, total benefits. Each set of four ratios represents a combination oflow and high benefits and costs. As shown in table 8.13, the low benefitsreflect adult mortality valuation using the HCA, while the high benefitsreflect adult mortality valuation using a VSL benefit transfer to
A Silent Killer: Indoor Air Pollution 267
Table 8.12 Interventions
Scenarios Description
From I to II From unimproved wood stove to improved wood stove
From I to V From unimproved wood stove to LPG (or other clean fuel)
From II to V From improved wood stove to LPG (or other clean fuel)
From III to V From unimproved wood stove and LPG mix to LPG (or other clean fuel)
From IV to V From improved wood stove and LPG mix to LPG (or other clean fuel)
Source: Larsen 2005.

Table 8.13 Estimated Annual Benefits of Interventions
Intervention scenario
(1) (2) (3) (4) (5)
From From From From From
Indicator I to II I to V II to V III to V IV to V
Avoided cases of ARI 918,063 1,836,127 734,451 367,225 183,613
Avoided cases of ARI in children under age 5 589,501 1,179,002 471,601 235,800 117,900
Avoided cases of ARI in females age 15 and older 328,562 657,125 262,850 131,425 65,712
Case fatality rate in children under age 5 0.00016 0.00016 0.00016 0.00016 0.00016
Avoided child deaths 96 193 77 39 19
Cost per ARI case in children under age 5 (COI and DALY) (pesos) 44,000 44,000 44,000 44,000 44,000
Cost per ARI case in females age 15 and older (COI and DALY) (pesos) 80,000 80,000 80,000 80,000 80,000
Benefits of reduced ARI morbidity in children under age 5 (billion pesos) 25.9 51.9 20.8 10.4 5.2
Benefits of reduced ARI morbidity in females age 15 and older (billion pesos) 26.3 52.6 21.0 10.5 5.3
Cost of mortality per death (HCA) (million pesos) 136 136 136 136 136
Benefits of reduced ARI mortality in children under age 5 (billion pesos) 13.1 26.2 10.5 5.2 2.6
Total benefits of avoided ARI cases (billion pesos) 65 131 52 26 13
Avoided cases of COPD 1,480 2,960 1,184 592 296
Case fatality rate of COPD 0.186 0.186 0.186 0.186 0.186
Avoided COPD deaths 275 549 220 110 55
Cost of COPD per case (COI and DALY) (million pesos) 11.6 11.6 11.6 11.6 11.6
Cost of COPD mortality per death (HCA) (million pesos) 26.3 26.3 26.3 26.3 26.3
Cost of COPD mortality per death (VSL) (million pesos) 293 293 293 293 293
Total benefits of avoided COPD cases (HCA for mortality) (billion pesos) 24 49 20 10 5
Total benefits of avoided COPD cases (VSL for mortality) (billion pesos) 98 195 78 39 20
Total health benefits (HCA for adults) 90 180 72 36 18
Total health benefits (VSL for adults) 163 326 130 65 33
268

Number of individuals receiving intervention (thousands) 3,086 3,086 2,469 1,235 1,235
Average household size 5 5 5 5 5
Number of households receiving intervention 617,270 617,270 493,816 246,908 246,908
Household fuelwood savings (relative to situation II) (%) 33 100 67 50 33
Household time savings per day (hours) 0.17 0.50 0.33 0.25 0.17
Average rural wages (pesos per hour) 2,000 2,000 2,000 2,000 2,000
Value of time (% wages) 75 75 75 75 75
Value of time (pesos per hour) 1,500 1,500 1,500 1,500 1,500
Total value of time savings (billion pesos) 56.3 169.0 90.1 33.8 22.5
Source: Larsen 2005b.
Note: COI = cost of illness; VSL = value of statistical life; HCA = human capital approach. US$1 = Col$2,150.
269

Table 8.14 Estimated Annual Costs of Interventions
Intervention scenario
(1) (2) (3) (4) (5)
From From From From From
Indicator I to II I to V II to V III to V IV to V
Intervention program cost per household, low (US$) 5 5 5 5 5
Intervention program cost per household, high (US$) 10 10 10 10 10
Intervention program cost per household, low (pesos) 12,500 12,500 12,500 12,500 12,500
Intervention program cost per household, high (pesos) 25,000 25,000 25,000 25,000 25,000
Total cost of intervention program, low (billion pesos) 7.7 7.7 6.2 3.1 3.1
Total cost of intervention program, high (billion pesos) 15.4 15.4 12.3 6.2 6.2
Annualized cost of improved stove (pesos) US$60 per stove 21,453 n.a. n.a. n.a. n.a.
Annualized cost of improved stove (pesos) US$120 per stove 42,906 n.a. n.a. n.a. n.a.
Annualized cost of LPG stove (pesos) US$60 per stove n.a. 21,453 21,453 0 0
Total annualized stove cost, low (billion pesos) 13.2 13.2 10.6 0.0 0.0
Total annualized stove cost, high (billion pesos) 26.5 13.2 10.6 0.0 0.0
Annual cost of LPG per household, low (pesos) n.a. 206,448 206,448 103,224 103,224
Annual cost of LPG per household, high (pesos) n.a. 255,533 255,533 127,767 127,767
Total annual cost of LPG, low (billion pesos) n.a. 127.4 101.9 25.5 25.5
Total annual cost of LPG, high (billion pesos) n.a. 157.7 126.2 31.5 31.5
Total costs, low (billion pesos) 21.0 148.4 118.7 28.6 28.6
Total costs, high (billion pesos) 41.9 186.4 149.1 37.7 37.7
Source: Larsen 2005b.
Note: n.a. = not applicable. US$1 = Col$2,150.
270

Colombia. The low and high costs from table 8.14 reflect low and highcost estimates of LPG, improved stoves, and an intervention program.
The estimated benefit-cost ratios of adoption of improved stoves byfar exceed 1.0 even without the value of time savings. Even in the caseof high-cost–low-health-benefit, the ratio is slightly higher than 2, indi-cating that the estimated benefits are twice as high as the estimatedcosts. The benefit-cost ratios for intervention (2) are also generally higherthan 1.0, but no more than 1.0 in the case of high cost–low benefits. Theratios for the intervention to switch from improved stoves to LPG areonly consistently higher than 1.0 if households value their time atsomewhere close to 75 percent of average rural wages. Although this isunlikely to be the case for poorer households, households that have goodincome opportunities and thus high opportunity cost of time may valuetheir time at this rate. The benefit-cost ratios for intervention (4) arenaturally very close to the ratios for intervention (2), and the ratios forintervention (5) are close to the ratios for intervention (3).
Sensitivity Analysis
As discussed throughout this chapter, many critical parameters in thebenefit-cost analysis involve significant uncertainty. A list of the mostimportant parameters follows:
• The reduction in excess health risk of an improved wood stovecompared with an unimproved wood stove or open fire (table 8.5)
A Silent Killer: Indoor Air Pollution 271
Table 8.15 Benefit-Cost Ratios of Interventions
Health benefits Total benefits
Costs Low High Low High
Intervention 1: Unimproved to Low 4.3 7.8 7.0 10.5
improved wood stove High 2.1 3.9 3.5 5.2
Intervention 2: Unimproved wood Low 1.2 2.2 2.3 3.3
stove to LPG (or other clean fuel) High 1.0 1.7 1.9 2.7
Intervention 3: Improved wood Low 0.6 1.1 1.4 1.9
stove to LPG (or other clean fuel) High 0.5 0.9 1.1 1.5
Intervention 4: Unimproved wood Low 1.3 2.3 2.4 3.5
stove and LPG to LPG (or other clean fuel) High 1.0 1.7 1.8 2.6
Intervention 5: Improved wood stove Low 0.6 1.1 1.4 1.9
and LPG to LPG (or other clean fuel) High 0.5 0.9 1.1 1.5
Source: Larsen 2005b.

• The weighted average RR of illness (ARI and COPD) from using solidfuels (table 8.5)
• Using a relative risk ratio for ARI in adult females that is similar to therisk ratio for children under age 5
• The population shares assigned to each scenario or typical solid-fuel-usesituation (table 8.5)
• Time savings from less or no fuelwood collection valued at 75 percentof average rural wages.
Notes on Benefit-Cost Analysis Sensitivity ParametersThe following important aspects of the relevant parameters providecontext for understanding the benefit-cost sensitivity analysis conductedin this study:
• Lowering the excess risk reduction of improved stoves from 50 percentto 30 percent reduces the benefit-cost ratio to 1.2 in the high-cost–low-benefit scenario of intervention (1) without time savings benefits.
• Lowering the weighted average RR ratio for ARI and COPD by 20 percentreduces health benefits of interventions by close to 30 percent. How-ever, the benefit-cost ratios for adopting improved stoves are all stillwell above 1.0, and well above 1.0 for switching from unimprovedstoves to LPG if time benefits are included.
• Excluding ARI in adults from the benefit-cost analysis reduces thebenefit-cost ratios (health benefits only) by 15 percent (high benefits)to 30 percent (low benefits). The benefit-cost ratios for improvedstoves are still well above 1.0 even without including the time savingsbenefits, and above 1.0 in half the cases of switching from an unim-proved stove to LPG (without time savings benefits included).
• Changing the population share from 25 percent with an unimproved stoveand 20 percent with an improved stove to 20 percent with unimprovedand 25 percent with improved has only a minor impact on the benefit-cost ratios.
• Reducing the time-savings benefits from 75 percent to 50 percent ofrural wages reduces the benefit-cost ratios by about 10 percent forthe high-benefit scenario, and by 15 to 20 percent for the low-benefit scenario.
• Reducing the time savings benefits from 75 percent to 25 percent of ruralwages brings the benefit-cost ratios for intervention (3)—improvedstove to LPG—to below 1.0 for the low-benefit scenario.
272 Larsen, Ahmed, and Awe

Effectiveness of Indoor Air Pollution Control Programs
The preceding benefit-cost analysis did not consider the impact of thespeed and rate of adoption of improved stoves and switching to LPGor electricity on the potential effectiveness of an indoor air pollutioncontrol program. As seen from table 8.15, household valuation of timesavings is likely to play an important role in changing to LPG, especiallyif the household already has an improved stove. Table 8.16 presents thepercentage of urban and rural households that use solid fuel forcooking. Of the countries in Latin America and the Caribbean forwhich DHS data with fuel use are available, only the DominicanRepublic uses solid fuels less than Colombia. Figure 8.6 indicates thatthere is a high correlation between the percentage of households thatuse solid fuels as the main cooking fuel and income per capita in LatinAmerica and the Caribbean.
A Silent Killer: Indoor Air Pollution 273
Table 8.16 Households Using Solid Fuels
Percentage of households
Country Urban Rural Total GNI per capita (2001 US$)
Bolivia 2003 8 79 34 950
Colombia 2000 2 61 18 1,890
Dominican Republic 2002 3 24 10 2,230
Guatemala 1998–99 32 78 57 1,680
Haiti 2000 89 98 95 480
Nicaragua 2001 38 92 60 370
Peru 2000 11 87 39 1,980
Source: DHS data.
Note: GNI = gross national income.
0
500
1,000
1,500
2,000
2,500
20
Colombia
Dominican Republic
Bolivia
Haiti
Guatemala
Nicaragua
Peru
40 60 80 100
percentage of households
GN
I per
cap
ita
(US
$ in
200
1)
Figure 8.6 Solid Fuels as Main Cooking Fuel in Latin America and the Caribbean
Source: Solid fuel use data are from DHS 1998–99 to 2003. Gross national income is from the World Bank 2002.
Note: GNI = gross national income.

Figure 8.7 presents rural household use of solid fuels for the samecountries as in figure 8.6. The responsiveness of fuel substitution toincome in rural areas seems less pronounced than at the national level,suggesting that an active rural energy and environmental health policycan help speed up the transition to cleaner fuels. The difference betweenthe Dominican Republic (in the upper left corner of figure 8.7) and theother countries with respect to rural solid fuel use is more striking thanfor solid fuel use at the national level.
Table 8.17 presents changes in the percentage of households using solidfuels over a four to six year period. Data are available for only three LatinAmerican and Caribbean countries in the DHS database. The decline inhousehold use of these fuels is very pronounced in the DominicanRepublic, even over such a short period. In Colombia, the percentagedecline is largest in the rural areas. The change in solid fuel use in Boliviawas mixed for the two periods.
274 Larsen, Ahmed, and Awe
0
500
1,000
1,500
2,000
2,500
20 40 60 80 100
percentage of rural households
GN
I per
cap
ita
(US
$ in
200
1)
HaitiNicaragua
Bolivia
GuatemalaPeruColombia
Dominican Republic
Figure 8.7 Solid Fuels as Main Cooking Fuel in Rural Latin America and
the Caribbean
Source: Solid fuel use data are from DHS 1998–99 to 2003. Gross national income (GNI) is from the World Bank 2002.
Note: GNI = gross national income.
Table 8.17 Change in Share of Households Using Solid Fuels
Urban Rural Total
Country Period (percent) (percent) (percent)
Bolivia 1994–98 –3 0 –6
Bolivia 1998–2003 +3 –1 +2
Colombia 1995–2000 –1 –6 –4
Dominican Rep. 1991–96 –15 –33 –22
Dominican Rep. 1996–2002 –2 –18 –9
Source: DHS in respective countries, 1999, 2000, 2001, 2002, 2003.

A Silent Killer: Indoor Air Pollution 275
Table 8.18 Summary of Recommendations for Addressing Indoor Air Pollution
in Colombia
Priority: short (S),
medium (M), Responsible
Recommendation and long term (L) government agencies
Design and implement a S MSPS, MAVDT, Ministry of Energy,
cross-sectoral program to address INS, CARs
indoor air pollution that includes
the interventions recommended
in this table
Conclusions and Recommendations
It would be advisable to implement a program of cross-sectoral interven-tions to tackle indoor air pollution in Colombia in the short term. Theadverse health impacts of indoor air pollution clearly and disproportion-ately affect the poorer segments of society. Based on the experience fromcountries at similar levels of development, the associated benefitsderived from such a program are typically realized reasonably quickly.Suggested interventions might include the following:
• Evaluating existing improved stove programs and implementingmeasures to ensure improved delivery and operation of the programsand to maximize their effectiveness and efficiency in contributingto the achievement of improved health outcomes in the popula-tion groups most affected by indoor air pollution, in addition tofuel efficiency
• Establishing different mechanisms to build awareness of the healtheffects of indoor air pollution, particularly in rural communities,through existing outreach programs, such as those for rural health care
• Including in housing subsidy programs for rural low-income housing(Vivienda de Interés Social) requirements for building codes and hous-ing design in poor communities to allow for improved ventilation,including the design of chimneys
• Evaluating the availability of LPG and other cleaner fuels in areas thatpredominantly use fuelwood,and implementing actions to improve avail-ability and access to fuelwood users in a safe and cost-effective manner
• Extending the coverage of rural electrification programs
These recommendations are summarized in table 8.18.
(continued)
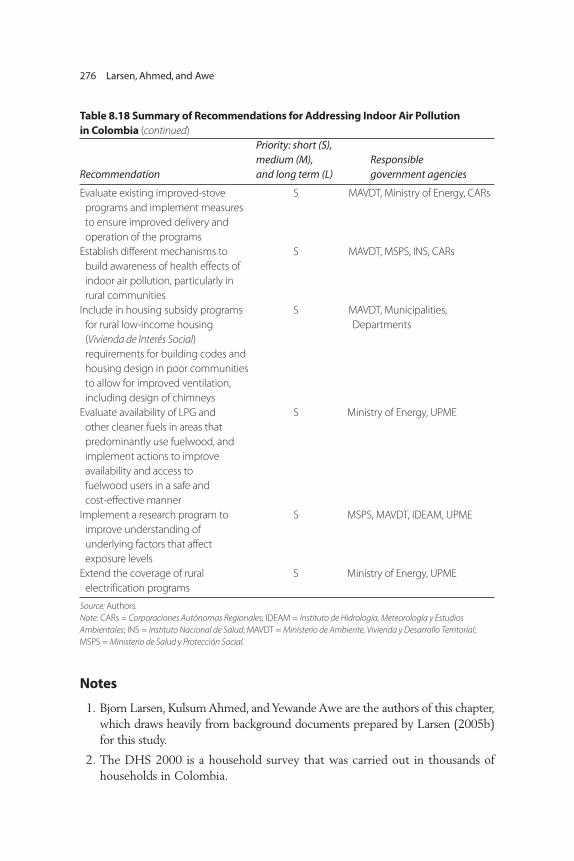
276 Larsen, Ahmed, and Awe
Table 8.18 Summary of Recommendations for Addressing Indoor Air Pollution
in Colombia (continued)
Priority: short (S),
medium (M), Responsible
Recommendation and long term (L) government agencies
Evaluate existing improved-stove S MAVDT, Ministry of Energy, CARs
programs and implement measures
to ensure improved delivery and
operation of the programs
Establish different mechanisms to S MAVDT, MSPS, INS, CARs
build awareness of health effects of
indoor air pollution, particularly in
rural communities
Include in housing subsidy programs S MAVDT, Municipalities,
for rural low-income housing Departments
(Vivienda de Interés Social)
requirements for building codes and
housing design in poor communities
to allow for improved ventilation,
including design of chimneys
Evaluate availability of LPG and S Ministry of Energy, UPME
other cleaner fuels in areas that
predominantly use fuelwood, and
implement actions to improve
availability and access to
fuelwood users in a safe and
cost-effective manner
Implement a research program to S MSPS, MAVDT, IDEAM, UPME
improve understanding of
underlying factors that affect
exposure levels
Extend the coverage of rural S Ministry of Energy, UPME
electrification programs
Source: Authors.
Note: CARs = Corporaciones Autónomas Regionales; IDEAM = Instituto de Hidrología, Meteorología y Estudios
Ambientales; INS = Instituto Nacional de Salud; MAVDT = Ministerio de Ambiente, Vivienda y Desarrollo Territorial;
MSPS = Ministerio de Salud y Protección Social.
Notes
1. Bjorn Larsen, Kulsum Ahmed, and Yewande Awe are the authors of this chapter,which draws heavily from background documents prepared by Larsen (2005b)for this study.
2. The DHS 2000 is a household survey that was carried out in thousands ofhouseholds in Colombia.

3. The monetary valuation of DALYs in relation to the cost of illness is stillsubstantially less than the difference between willingness to pay for avoidinga case of illness and cost of illness found from studies in the United States.However, there are not enough studies to rely on from Colombia. DALYs aretherefore used as a proxy for reduced well-being.
References
Ahmed, Kulsum, Yewande Awe, Douglas Barnes, Maureen Cropper, and MasamiKojima. 2005. Environmental Health and Traditional Fuels Use in Guatemala.ESMAP (Energy Sector Management Assistance Program) Directions inDevelopment Series. Washington, DC: World Bank.
Albalak, Rachel, Nigel Bruce, John McCracken, Kirk Smith, and Thelma deGallardo. 2001. “Indoor Respirable Particulate Matter Concentrations from anOpen Fire, Improved Cook Stove, and LPG/Open Fire Combination in aRural Guatemalan Community.” Environmental Sciences and Technology 35(13): 2650–55.
Baranzini, Andrea, and José Goldenberg. 1996. “Desertification, EnergyConsumption, and Liquefied Petroleum Gas Use, with an Emphasis onAfrica.” Energy for Sustainable Development 2 (5): 32–37.
Boy, Erick, Nigel Bruce, Kirk Smith, and Ruben Hernandez. 2000. “Fuel Efficiencyof an Improved Wood-Burning Stove in Rural Guatemala: Implications forHealth, Environment and Development.” Energy for Sustainable Development4 (2): 21–29.
Desai, Manish, Sumi Mehta, and Kirk Smith. 2004. Indoor Smoke from Solid Fuels:Assessing the Environmental Burden of Disease at National and Local Levels.Environmental Burden of Disease Series, No. 4. Geneva: World HealthOrganization.
DHS (Demographic and Health Survey). 2000. Encuesta Nacional de Hogares.Bogotá: Departamento Administrativo Nacional de Estadísticas.
Ezzati, Majid, and Daniel Kammen. 2002. “The Health Impacts of Exposure toIndoor Air Pollution from Solid Fuels in Developing Countries: Knowledge,Gaps, and Data Needs.” Environmental Health Perspectives 110 (11):1057–68.
Larsen, Bjorn. 2004. “Cost of Environmental Damage: A Socio-Economic andEnvironmental Health Risk Assessment.” Consultant Report prepared forMinistry of Environment, Housing and Regional Development, Colombia.
———. 2005a. “Cost of Environmental Damage: Analysis by Department.”Consultant Report prepared for Ministry of Environment, Housing andRegional Development, Colombia.
A Silent Killer: Indoor Air Pollution 277

278 Larsen, Ahmed, and Awe
———. 2005b. “Cost-Benefit Analysis of Environmental Protection in Colombia.”Report prepared for Ministry of Environment, Housing and RegionalDevelopment and ACCI, Bogotá.
Luo, Zheng, and Wim Hulscher. 1999. “Woodfuel Emissions.” Regional WoodEnergy Development Programme, Bangkok.
McCracken, John, and Kirk Smith. 1998. “Emissions and Efficiency of ImprovedWoodburning Cookstoves in Highland Guatemala.” Environment International24 (7): 739–47.
Mrozek, Janusz, and Laura Taylor. 2002. “What Determines the Value of Life?A Meta Analysis.” Journal of Policy Analysis and Management 21 (2): 253–70.
Naeher, Luke P., Brian P. Leaderer, and Kirk R. Smith. 2000. “Particulate Matterand Carbon Monoxide in Highland Guatemala: Indoor and Outdoor Levelsfrom Traditional and Improved Wood Stoves and Gas Stoves.” Indoor Air 10(3): 200–05.
Pruss, Annette, David Kay, Lorna Fewtrell, and Jaime Bartram. 2002. “Estimatingthe Burden of Disease from Water, Sanitation and Hygiene at the GlobalLevel.” Environmental Health Perspectives 110 (5): 537–42.
Saatkamp, Barbara, Omar Masera, and Daniel Kammen. 2000. “Energy and HealthTransitions in Development: Fuel Use, Stove Technology, and Morbidity inJaracuaro, Mexico.” Energy for Sustainable Development 4 (2): 7–16.
Smith, Kirk, Sumi Mehta, and Mirjam Feuz. 2004. “Indoor Air Pollution fromHousehold Use of Solid Fuels.” In Comparative Quantification of Health Risks:Global and Regional Burden of Disease Due to Selected Major Risk Factors, ed.Majid Ezzati, A. D. Rodgers, Alan D. Lopez, and Christopher J. L. Murray.Geneva: World Health Organization.
WHO (World Health Organization). 2002. The World Health Report 2002.Geneva: WHO.
World Bank. 2002. The Little Green Data Book. Washington, DC: World Bank.

In Colombia, a lack of adequate planning to accompany rapid urban growthhas contributed to increased risks to the welfare of the population. This chapterexamines two sectors in Colombia that are the primary contributors to suchrisks—housing and solid waste management—and the challenges of mitigatingthese risks. In the housing sector, the supply of formal housing has not kept pacewith rapid urban population growth. Inadequate supply, coupled with inade-quate housing policies, has resulted in the expansion of the informal housingsector. Similarly, increasing amounts of waste generated by the growing popula-tion have not been sufficiently managed. Consequently, unsafe waste disposalpractices, such as uncontrolled open-air dumping and burning of wastes, arecommon. Those unable to afford quality housing are the most affected by thesedeficiencies, often living in poorly constructed housing in informal settlements,situated in areas prone to natural disasters or close to unsafe waste disposalsites. The chapter proposes several recommendations to address these problems,including review of existing policies and programs, development of new policies,and simplification and improved enforcement of regulations.
This chapter examines the relationship between environment and housingpolicies in Colombia, and the relationship between environment andurban development more broadly.1 Linkages between the environmentand urban development can be analyzed at various levels. At a macro
C H A P T E R 9
The Environmental Cost of
Accelerated Urban Growth
279

level, urban development and housing construction in particular affectthe urban environment through congestion and air pollution, and alsojeopardize the quality of public green spaces. At a micro level, housingconstruction also affects indoor environments, through its impacts onavailable space and the quality of indoor air.
This chapter focuses on the environmental effects of Colombia’s hous-ing policies because those policies could play a role in the construction ofdwellings that are poorly ventilated and in the unauthorized constructionof dwellings in areas prone to natural disasters. The chapter specificallyexamines the regulatory features of housing policies that have environ-mental implications. In this context, the chapter’s recommendationscenter on how such policies can be amended or enhanced to minimizenegative environmental impacts associated with their implementation.
With respect to the country’s housing policies, three primary factorscontribute to environmental concerns: (a) the institutional, legal, andregulatory framework that governs urban planning; (b) informal housing;and (c) housing subsidy programs, which generally provide few incen-tives for the construction of environmentally sound housing units. Thischapter examines these three factors and provides recommendations forways in which adverse environmental effects can be reduced.
In addition, the chapter discusses issues associated with the designand implementation of waste management activities in Colombia andsummarizes key points relevant to new and existing unresolved policyissues. In the past, waste management was a relatively low priority inColombia. Over the past decade, however, a number of large cities havemade much progress in the development of formal waste disposal sites.
Although an estimated two-thirds of waste generated is disposed ofin landfills, mostly in densely populated urban areas, over half of themunicipalities in Colombia—typically representing the lower-incomeareas of the country—still do not have appropriate disposal facilities.Even in locations where landfills are in use, disposal is largely unregu-lated and standards for landfill development and operation do notexist. In areas on the outskirts of certain large cities, such as Bogotá,Medellín, and Cali, inadequate management of leachate dischargescontaining high concentrations of toxic and other hazardous sub-stances is common.
The following sections discuss the environmental effects of urbandevelopment policies in Colombia, the government’s response in address-ing these effects, and challenges to policy implementation. In addition, wastemanagement issues, challenges to adequate waste management, and the
280 Morgenstern and Sánchez-Triana

effectiveness and efficiency of policies designed to address such challengesin Colombia are examined.
Urban Growth and Environment in Colombia
Like most countries in Latin America, Colombia is highly urbanized.Around32 million people, or 72 percent of the national population, live in urbanareas. Over 20 percent of these residents live in the capital city of Bogotá,with a population of 7 million, followed by three cities with populationsbetween 1 million and 5 million, 34 medium cities with populationsbetween 100,000 and 1 million, and over a thousand urban centers withfewer than 100,000 inhabitants. Recent projections indicate that the urbanpopulation will reach 40 million in the next 10 years.This urban growth hasbeen fueled by rural-urban migration, but also by the migration of victims ofviolence, particularly in Bogotá (Persaud and Ortiz 2003).
Cities have become Colombia’s main source of growth.The most pro-ductive sectors of the economy are located in its urban centers—theseven main cities, accounting for 45 percent of the urban population,generate around 65 percent of the gross domestic product (GDP).Bogotá alone accounts for approximately 21 percent of the nationalurban population and contributes over 22 percent of GDP.
Unbalanced Growth of CitiesThe recent urban growth is perceived to have occurred largely withoutthe controls of formal planning (see, for example, National Council onEconomic and Social Policy [Consejo Nacional de Política Económica ySocial, CONPES] document 3305 of 2004). City expansion has generatedinformal and disorderly growth in urban peripheries, accompanied bydeterioration of and population loss in the older city centers.
The dynamic of suburbanization in Colombia is perceived to be char-acterized by deficient land use in areas of environmental and agriculturalimportance. In turn, low densities in the peripheries have resultedin the development of large conurbations,2 presenting challenges forplanning. Unplanned urban growth has been accompanied by a lack offormal housing supply, urban land shortages in most cities, and disorderlypublic transport.
The country’s city centers have experienced two disparate events: pop-ulation flight in some central areas, and renovation and rehabilitation ofmedium- and high-income residential zones. Population flight has resultedin progressively decaying housing stocks where marginal activities often
The Environmental Cost of Accelerated Urban Growth 281

take place. Conversely, commercial zones and offices have expanded to oldresidential districts in which newly specialized urban subcenters have beencreated. In these subcenters, highrises have been built where older homesonce stood. This process of urban renewal has generally occurred withoutformal planning, and often with undesirable effects on the urban structure,including the following (CONPES 3305, 2004):
• Inadequate infrastructure (roads, networks) and public spaces (parks),where existing infrastructure had been provided initially for popula-tions three to four times smaller
• Diminished environmental quality, such as the reduction or removalof green and open spaces
• Increased road congestion and road deterioration.
Overall, urban growth has been an unbalanced process, with significantconsequences for both the quality of life of inhabitants and the produc-tivity and sustainability of cities.
Growth of Informal HousingPrecarious, informal settlements constitute the most visible manifestationof poverty and inequality in a primarily urbanized country. The naturalgrowth of the cities, migration from the countryside, absence of formalhousing alternatives for the population, and inefficiency of administrationsand policies, among other factors, have generated a dynamic of informaland incomplete urban growth in Colombian cities (Caicedo 2002).
Informal urbanization results in economic, social, and environmentalconsequences that not only affect lower-income groups, but the urbanpopulation as a whole.The environmental impacts of informal urbanizationinclude deterioration in the quality of life, deficiencies in the provisionof public services, and the occupation of zones not suitable for urbaniza-tion. Settlements in these zones have contributed to loss of green areasand increased pollution and have led to an increased risk of natural dis-asters (such as landslides).
Recent estimates indicate that at least 1.3 million homes are in precar-ious condition. These dwellings lack basic services, are constructed withinadequate materials, or are located in zones of high natural risk (or acombination of these conditions).3 Based on information from the cadas-tre, 16 percent of urban homes in the five largest cities of Colombia areprecarious establishments. For medium cities (populations between300,000 and 1 million), the corresponding percentage is 19 percent, and
282 Morgenstern and Sánchez-Triana

24 percent of homes in cities with 100,000 to 300,000 inhabitants are inprecarious condition (CONPES 3305, 2004). Thus, informal urbaniza-tion is not limited to the main cities, but is a widespread phenomenon.
The close links between informal urbanization and sustainable develop-ment have been recognized by the international community. Objective11 of the Millennium Development Goals aims to significantly improvethe lives of at least 100 million slum dwellers by 2020. In Colombia, thepercentage of the urban population living in slums fell from 26.0 percentto 21.8 percent during 1990 to 2001.
The annual growth of the formal housing deficit, measured as thedifference between the number of new households and the number of for-mal units built at the national level, is estimated to be 91,000 units, or49 percent of the 185,000 new households formed annually (figure 9.1).In the country’s five largest cities, the growth of the formal housing deficitamounts to over 47,000 units per year, or 50 percent of annual newdemand. Those households without formal housing have two alternatives:cohabit with other households, or resort to informal housing solutions. Asimplied by the statistics on the formal housing deficit, informal settle-ments have grown at higher rates than formal housing in the largest citiesin recent years.
The Environmental Cost of Accelerated Urban Growth 283
200185.5
91.5
94.0
national 5 urban areas Bogotá
new legal housingnew homes
95.655 47.655
48.0 50.934
21.134
29.7
160
120
ho
mes
80
40
homes vs. legal housing
Figure 9.1 Annual Gap between Formal Housing Construction and Creation
of New Households
Source: DNP–DDUPRE.

In summary, rapid urbanization in Colombia has outpaced the capa-city of the government to offer adequate services and prevent the devel-opment of the informal housing sector. Tackling the issue of informalhousing and making land and housing affordable to low-income house-holds continue to be fraught with difficulties. Inadequate access tofinancing for low-income households, low institutional capacity ofmunicipal administrations, rigidity of city planning norms, and cumber-some delivery processes for land titles and building permits are all signifi-cant obstacles to tackling problems in the housing sector.
Housing Policy: Main Environmental Difficulties and the Government’s Response
It is widely accepted in Colombia that the country’s difficulties in for-mulating territorial policies, and in linking urban development with eco-nomic and social development, have been reflected in the developmentof the country’s cities (CONPES 3305, 2004). It is also acknowledgedthat in the 1990s, the performance of national government interventionsweakened on the territorial front, as evidenced by the predominance ofpoorly coordinated sectoral interventions at the local level.
Housing Policy DifficultiesAs mentioned early in this chapter, with respect to the country’s hous-ing policies, three main factors contribute to environmental concerns.These three factors are examined below.
Institutional framework governing urban planning. The interactionbetween local governments and the national government has undergoneimportant changes since the 1980s, originating in the process of decentral-ization and deepening with the Constitution of 1991, which recognizesthe autonomy of local governments as a basic principle of the nation’sorganization and adopts principles that affect urban development. Theseprinciples were developed by Law 152 of 1994, the Organic Law ofthe Development Plan, and Law 388 of 1997, the Law of TerritorialDevelopment, both of which introduced new urban planning tools at themunicipal level:
• The Development Plan includes concrete programs and projects thateach mayor commits to undertake during a three-year term.
• The Land Use Plan (Plan de Ordenamiento Territorial, POT) is aninstrument of physical planning for the medium and long term, and is
284 Morgenstern and Sánchez-Triana

valid for 12 years. The POT synthesizes land use patterns and landrights, and the planning, management, and financing instruments forurban development. It also provides an assessment of the ecologicaland economic potential of certain areas and their scope for develop-ment (Lavadenz and Deininger 2003).
Seven years after the promulgation of Law 388 of 1997, assessmentsof the POT development process, and their adoption by municipalities,highlight the following points:
• The implementation progress and quality of the resulting plans arequite varied. This observation is partly linked to the lack of incentivesprovided to municipalities to prepare adequate plans, but technicalcapacity also plays a key role (Lavadenz and Deininger 2003).4
• Only a small proportion of the municipalities that have formulatedtheir POTs have applied the management and financing instrumentsput in place by Law 388 of 1997 (Le Blanc 2005).
• In most cases, the links between the municipality’s Development Planand its POT are weak, as evidenced by inconsistencies in resource allo-cations and in development strategies and objectives.The POT tends tobe perceived by municipalities as a necessary step to comply with thelaw rather than a strategy for long-term planning (Le Blanc 2005).
One example of the POT’s limitations is found in the land reservedfor future residential use. The land set aside in these territorial plans isinsufficient to meet the needs of a growing population. In the fivelargest cities, an estimated 950 hectares each year would be required forhousing development. If one compares this number with the number ofhectares available for urbanization in the POTs (5,300 hectares), theland available for housing development in these cities will be exhaustedwithin six years (CONPES 3305, 2004). It is widely perceived that thislargely artificial scarcity of serviceable land encourages speculation inthe land market, thereby preventing the provision of housing to low-income households, and is a direct cause of the development of infor-mal settlements.
Another problem related to the POTs is their strictly municipalscope. As peripheral towns gather around large core cities, forming func-tional agglomerations, municipal frontiers decreasingly reflect the eco-nomic, social, and environmental realities of urban development. Theseurban agglomerations, or metropolitan centers, are expected to increase
The Environmental Cost of Accelerated Urban Growth 285

in both number and size in the coming decades and will require specialinstitutions and policies to effectively address common problems ofhousing, basic services, land use, solid waste, and management of naturalrisks such as flooding.
Environmental risks caused by informal housing. Informal housing facesmore environmental risks than other types of housing, ranging from themacro to the micro level:
• Informal settlements are located in areas considered unsuitable forhousing structures within official planning documents. Such zonesoften include environmentally sensitive areas such as riverbanks,mountain slopes, or wetlands. Environmentally sensitive areas aremore likely to be invaded than other types of land because their valuefor other uses may be lower; consequently, property rights may be lessclear or less strictly enforced. Informal settlements give rise to specificenvironmental impacts: settlements located in sensitive areas, such aswetlands, may severely affect the environment (for example, waterresources); and riverbanks or mountain slopes are more prone toflooding or landslides, making informal areas overall more prone tonatural disasters.
• At the neighborhood level, Colombian law and regulation prevent thegovernment from providing even the most basic of services to areaswhere settlements are not legally permitted. As a consequence, basicservices, such as water and sanitation provision, are often lacking ininformal areas.
• Because even minimum norms are not followed in the construction ofdwelling units located in these informal settlements, the structures arepoorly built. For example, these units have inadequate ventilation,which results in indoor air pollution from the use of solid fuels forcooking, and inadequate access to a safe water supply.
Informal housing is a product of costly regulations, inadequate plan-ning, and a lack of enforcement of existing regulations and plans. Costlyregulations (such as lengthy and expensive administrative processes forland titling, land subdivision, building permits, construction norms andstandards, and zoning regulations included in the POTs) create disincen-tives to suppliers and builders of formal housing units. As a result, formalconstruction becomes unaffordable to low-income groups. Lack ofenforcement results in the construction of units in areas prone to natural
286 Morgenstern and Sánchez-Triana

disasters or in areas where basic services are unavailable or very costly toprovide (for example, water supply in mountainous areas). Lack ofenforcement of building permits is of particular concern in Colombiabecause of seismic risks. Often, permits are granted for a certain numberof floors in a building, but actual construction exceeds the numberallowed by the permit, making those areas at risk of earthquakes or land-slides even more vulnerable.
Housing subsidies. In the early 1990s, Colombia adopted a system ofhousing subsidies, similar to the Chilean model, called Special InterestHousing (Vivienda de Interés Social, VIS). While this change representedan improvement over its previous subsidy system through better targetingof lower-income groups, the new system was not flawless (Bloomberg2001; CONPES 3178, 2002). In fact, the public housing subsidy programsoften encouraged the development of environmentally unsound housing:
• The bulk of the subsidies (90 percent) went to new construction.Moreover, they went to individual housing, rather than multifamilyunits. This constituted a disincentive to rehabilitate or maintain oldunits in the city centers, encouraging urban sprawl with the relatedincreases in congestion and pollution.
• VIS subsidies were made available only for households that possesseda legal title and wanted to build in zones classified as urban by thePOTs. Thus, no subsidy was available for the informal sector.However, given the characteristics of the POTs, this meant in prac-tice that the poorest households were largely not covered by thesystem, which could have helped improve hazardous conditions ininformal areas.
• A significant proportion of units financed under the VIS schemeended up without basic sanitation services or access to adequateroads. Thus, a high proportion of the VIS units were left vacantafter completion because of lack of these essential public services(CONPES 3178, 2002). Often, there was no consistency betweenthe initially approved plans for the dwellings and the units that werefinally delivered.
Responses of the Government of ColombiaSectoral programs. Faced with the challenges outlined above, the govern-ment of Colombia introduced over the years a number of sectoral
The Environmental Cost of Accelerated Urban Growth 287

programs aimed at, among other things, improving environmental outcomesin urban areas. Examples include the following:
• Integrated System for Mass Transportation (Sistema Integrado de Trans-porte Masivo, SITM) programs: The massive public transport programs,particularly in Bogotá, have succeeded in reducing air pollution caused bytransport emissions. The Bogotá program also has been accompanied byunprecedented efforts to create and rehabilitate public spaces and parks.
• Upgrading of and massive titling programs for informal settlements:Programs such as the Mejoramiento Integral de Barrios programs havebeen directed at improving living conditions in informal settlementsthrough the provision of basic services.
• Incentives for the re-densification of old centers: To stimulate therenovation process, the government passed a tax exemption for urbanrenovation projects (Law 788 of 2003, regulated through Decree 2755of 2004). It is too soon to assess the full impact of this intervention.
In parallel, some large cities have managed to achieve some coordina-tion of their urban planning actions. Medellín has made progress inconsolidating its metropolitan area through development planning andinfrastructure building. Bogotá has sought to address its problems throughan ad hoc mechanism, the metropolitan region, which is essentially aninformal planning arrangement. Through this process, Bogotá and theneighboring municipalities seek to harmonize their respective POTs andto work together to find joint solutions to their urban needs (Persaud andOrtiz 2003).
The new urban development strategy. A new urban development strate-gy was developed and presented in CONPES document 3305, issued inAugust 2004. The new strategy recognizes the need to improve livingconditions in the informal neighborhoods and to provide for the densifica-tion of cities. The main elements of the strategy, which are detailed in theCONPES document, are the following:
• Promotion of the renovation and re-densification of existing neighborhoods
• Improvement of conditions in substandard neighborhoods (continua-tion of Mejoramiento Integral de Barrios accompanied by massivetitling programs)
288 Morgenstern and Sánchez-Triana

• Promotion of mechanisms that both improve public spaces and makethem more sustainable
• Improvement of mobility within cities, by implementing SITM projectsand linking them with other modes of transport
• Prevention and mitigation of environmental risks (incorporation ofevaluation and risk mitigation in planning instruments)
• Improved quality of urban expansion through institutional, legal, andregulatory adjustments.
To optimize the urban development policy, the new strategy contem-plates both institutional and regulatory measures aimed at adapting anddeveloping relevant legislation, strengthening urban planning processes,and defining a proper scheme of interaction between the central andlocal governments.
Specific regulatory measures include the following:
• Linking of urban and environmental legislation on priority environ-mental areas such as sanitation
• The adaptation and regulation of Law 388 of 1997, to facilitate theapplication of financing, planning, and management instruments ofurban development
• Adoption of minimum national standards for the development ofhousing, equipment, and public space.
Measures related to the strengthening of environmental institutionsinclude the following:
• Devising suitable links among POTs, Development Plans, and annualmunicipal budgets
• Developing intermunicipal coordination mechanisms for theprovision of public services and equipment, or, alternatively, the inte-gration of municipalities to reinforce planning capacities at thelocal level
• Devising mechanisms to ensure that local governments adoptenvironmental and urban parameters that maximize the impactof investments made, at the local level, by the national government
• Strengthening Autonomous Regional Corporation (CorporaciónAutónoma Regional, CAR) support of urban management.
The Environmental Cost of Accelerated Urban Growth 289

Challenges to Implementation of the New Urban Strategy and Recommendations for Alternative InterventionsImplementation of the new urban strategy will face a number of chal-lenges. A plan that delineates short- and medium-term actions to imple-ment the strategy has yet to be developed. The many objectives of thestrategy are not prioritized for implementation. The following assessmentof the new strategy identifies missing areas and areas in which furtherwork is required.
Some important environmental aspects might be incorporated intothe strategy, including the ones listed as follows:
• Incorporating environmental concerns into long-term planning, par-ticularly by� adequately articulating environmental considerations within the
POTs� improving enforcement of environment-related features of existing
POTs (such as construction in risky or environmentally sensible areas)• Establishing mechanisms for identifying priorities for urban develop-
ment at the local level• Establishing an environmental monitoring system for municipal
governments.
Some topics, although mentioned in the objectives of the strategy,would require specific action plans:
• Review of the compatibility of environmental and urban laws and regu-lations. Such a review might include an overview of the main issues to beaddressed, perhaps starting from a sectoral perspective (water, sanitation,garbage collection, planning, construction, energy, and so forth).
• Adequate institutional structures to manage and coordinate urban planningand development at a supra-municipal level. The need for an adequate levelof coordination might be mentioned in the strategy, as well as the concreteinstitutional setting required to make such coordination possible.
• The definition of priorities in the programs of technical assistance to cities,in particular concerning the drafting and revision of the POT. It is appar-ent from the above that in parallel with densification, modifications ofthe POT might take future urban land needs into account. Further-more, of particular relevance to the environment, the strategy mentionsthat the Ministry of Environment, Housing and Regional Development(Ministerio de Ambiente, Vivienda y Desarrollo Territorial, MAVDT)
290 Morgenstern and Sánchez-Triana

will provide technical assistance and capacity building to municipali-ties so that they can incorporate environmental considerations intotheir planning documents, but does not make clear how this wouldbe done.
• The prevention of informal housing. While the strategy includes a sec-tion on upgrading informal housing and mentions interventions todeal with existing settlements, such as the Mejoramiento Integral deBarrios program (one component of which addresses resettlement ofhouseholds located in zones of natural risks), prevention is not treated.International experience suggests that without the adoption andimplementation of a policy aimed at facilitating the supply of accessi-ble serviced land for the poor, informal housing will continue to grow.
Conclusions and Recommendations—Housing and Urban Development
In conclusion, many challenges in the domain of urban development andthe environment lie ahead. A sustainable strategy might propose actionsto prevent construction in zones that present high natural risks, such asflooding, landslides, and seismic activity. This approach implies the pre-vention of the development of informal housing in high-risk areas. Thus,a strategy that solely addresses formal housing is only an initial step. Toensure sustainability, the causes of the development of the informal sec-tor must be directly addressed.
The three main areas covered by the following recommendations arethe institutional, legal, and regulatory framework of urban planning;prevention of informal housing; and housing subsidy programs.
Institutional, Legal, and Regulatory Framework for Urban PlanningImproving the quality of POTs. Many externalities arising from environ-mental degradation are localized and could be addressed through thePOTs at the local level, particularly if accompanied by appropriatenational policies. Experience shows that the capacity for formulation andimplementation of such plans, and a mechanism for reflecting globalexternalities, might be strengthened (Lavadenz and Deininger 2003).
Establishment of such a mechanism and provision of assistance to thelocal governments in the formulation of the POT would be advisable. Itwould also be advisable for the government to define priorities to beaddressed in technical assistance programs to cities for drafting and revis-ing POTs, based on the capacities of the municipalities.
The Environmental Cost of Accelerated Urban Growth 291

A legal and regulatory framework might be developed to ensurecompatibility among POTs, Development Plans, and assignment ofannual budgetary resources at the municipal level. The POTs could bearticulated with the municipal Development Plans, which establishlocal policy guidelines for the duration of a mayor’s term of office.These two instruments—the POTs and the municipal DevelopmentPlans—might be the basis for the formulation of annual budgets.Oversight mechanisms could be considered to ensure that such com-patibility is respected.
Coordinating planning and urban management instruments at the locallevel. Some externalities cannot be addressed at the municipal level. Inparticular, harmonization of POTs and effective management of neigh-borhood externalities between municipalities require coordination at thesupra-municipal level. For example, local planning and zoning docu-ments should be designed at the water basin level to take flooding riskinto account.
• Efficient coordination on the ground may be achieved only throughadjustment of institutional settings such as establishment of metropol-itan areas. Alternatively, formalizing modes of horizontal cooperationamong cities might be considered, on the basis of successful experi-ences in Colombian cities.
• Coordination of urban development at the aggregate level may alsorequire the creation of regional entities for the management of integralurban operations. These regional entities would be in charge of coordi-nating interventions in various sectors.
• To ensure that environmental issues with implications broader thanthe municipal or aggregate level (for example, flooding risks) arecorrectly taken into account in planning documents, functionsof support to and monitoring of urban development from theenvironmental point of view might be created and entrusted to theappropriate governmental organization. One option is to reinforcethe urban environmental management responsibilities of CARsand municipalities.
Articulating environmental and urban legislation. This task should beginwith a review of the legal and regulatory apparatus, perhaps starting froma sectoral perspective (water, sanitation, garbage collection, planning,
292 Morgenstern and Sánchez-Triana

construction, energy, and so forth). Concrete ways of integrating theenvironment into urban planning and management tools would then haveto be devised.
Prevention of Informal Housing As argued, prevention of informal housing is as important as programs toupgrade existing informal settlements and constitutes an essential ele-ment of a sustainable, long-term urban strategy.
Lowering the cost of formal housing. At the government level, recom-mended actions would include studies to improve the understanding ofhow and why informal settlements are formed and the identification ofways to discourage informal developments by addressing the structuralland supply problems, thus lowering the costs of formality. Other sug-gested actions include the following:
• Reviewing the land titling system in urban areas to achieve lower costs(administrative, financial, and time)
• Reviewing the land planning, zoning, and building regulations to pro-mote participation of private developers and low-income households(for example, provisions for minimum lot size)
• Creating incentives for informal producers to gradually turn to theformal sector.
Moving toward better enforcement of planning rules and control of infor-mal developments. Consideration might be given to better enforcement ofurban planning documents, and to concrete actions upstream in the urbandevelopment process that allow better control of the development ofinformal housing.
• Early enforcement of existing regulations and planning documentsmight in particular focus on rigid control measures to prevent occupa-tion of hazardous sites.5
• Forward-looking urban planning instruments could be designed,including channeling informal development by identifying and open-ing orderly settlements on environmentally suitable sites, minimallyserviced, on which households can build following a plan thatincludes future space for utilities and services; the settlements areregularized later.
The Environmental Cost of Accelerated Urban Growth 293

Housing Subsidies: VIS and AlternativesWhile it is too early to evaluate the environmental impacts of the newsystem of VIS subsidies, some recommendations can be made to opti-mize the system. In addition, alternative subsidy approaches could beintroduced in parallel with the VIS system.
The new system should be evaluated very early, to ensure that thenew provisions of Decree 975 of 2004 and related regulations relative tocompliance with minimal habitability standards are followed. Appropriatemonitoring of approved VIS projects should aim at ensuring that no morecases of housing units delivered without basic services occur, or at leastbecome less frequent.
It is important to define environmental criteria that should be includedin the eligibility criteria of VIS projects to (a) minimize natural risks (floods,landslides, and seismic risks); (b) ensure minimal ventilation and indoor airquality (for example, type of fuel); and (c) require basic sanitation.
Capacity building for municipalities that do not possess specializedunits, or creation of specialized units at a departmental level that will bein charge of assisting municipalities in the control and enforcement ofzoning and building regulations, could be envisioned and financedthrough increases in collection rates of local taxes (in particular, theImpuesto Predial [property tax]). In parallel, a system of financial incen-tives for local governments could be incorporated into the subregionalsubsidy distribution system to ensure that local governments properlyenforce those regulations.6
As mentioned, the VIS scheme contains implicit incentives to buildfar from city centers where land is cheapest, potentially causing spatialmismatch, congestion, and air pollution. In addition, the mix betweennew construction and improvement of existing dwellings is biasedtoward the former. Eligibility criteria should be revised to broaden thescope of the VIS to encompass rehabilitation, incentives to occupy “void”pockets of land within existing urban perimeters (for example, oldindustrial zones),7 and multifamily housing.
Experience in Colombia has shown that the VIS subsidies dependheavily on foreign (multilateral) funds, which raises an issue of long-termsustainability. Unsecured funding for the future might imply much lowersubsidies to new construction. It is thus important to consider a shiftaway from subsidies for new construction, and toward subsidies for ame-lioration and upgrading, with an emphasis on basic services and eveninfrastructure. These could include subsidies directed to improvement ofparticular services in the dwellings (sanitation, ventilation, fuel type, and
294 Morgenstern and Sánchez-Triana
so forth). A part of the budgetary cost of the subsidies could pass on tomunicipalities. Incentives could include formally stated matching sub-sidies, so that every time a collective mobilizes a certain amount offunds, the state contributes an additional specified amount.8 Thus, theproportion of state subsidies could vary according to the type of subsidyconsidered.9 From the political point of view, matching subsidies of thistype might create better incentives than larger, one-shot, upfront sub-sidies, for both municipalities and households.
Waste Management
This section examines the design and implementation of waste manage-ment activities in Colombia. Whereas a number of major studies havebeen conducted in recent years on this topic (for example, Salamanca[2004] and Sánchez-Triana and Oppaluch [1996]), the purpose of thischapter is to summarize key points relevant to new and unresolvedpolicy issues.
Waste is broadly defined as unwanted material left over from manu-facturing processes or refuse from places of human or animal habita-tion. Within this broad category are many types of waste, includingmunicipal solid waste, hazardous waste, and radioactive waste, whichhave properties that may make them dangerous or capable of having aharmful effect on human health and the environment. Wastes and con-taminated lands are particularly consequential for environmental healthbecause exposure to harmful material contained in them may result inadverse health outcomes.
Historically, the development and implementation of waste manage-ment programs have been low priorities in Colombia. Over the pastdecade, however, a number of large cities have moved from a situationin which it was not uncommon to find waste on streets, sidewalks, water-ways, parks, empty lots, and in the sewerage system, to the developmentof formal waste collection systems. At the same time, however, disposalin open pits is still common in many municipalities, particularly smallerones. Birds, insects, and domestic animals can readily spread vector-bornediseases from such sites, especially through recycling workers who live orwork near disposal sites. Open burning of waste is also common.
While an estimated two-thirds of waste generated is disposed of insanitary landfills, mostly in densely populated urban areas, over half themunicipalities in Colombia—typically representing the lower-incomeareas of the country—do not have appropriate disposal facilities. Even
The Environmental Cost of Accelerated Urban Growth 295

where landfills are in use, disposal is largely unregulated and there are nostandards for landfill development and operation. In almost all disposalsites, including those in Bogotá and Medellín, leachate discharges con-taining high concentrations of toxic and other hazardous substances aremanaged inadequately.
The 2002 Integrated Waste Management Guidelines come closest toa comprehensive national waste disposal policy. However, these guide-lines lack the necessary legal authority to make compliance with themmandatory for all municipalities. Despite some efforts to adhere to theguidelines—for example, all municipalities are required to submit formalwaste management plans by September 2005—overall management ofsuch efforts has been a major challenge, especially in the absence of well-defined monitoring mechanisms and clear management accountability(MAVDT 2005).
Colombia is party to the Basel Convention of 1989 on the controlof transboundary movements of hazardous wastes, which establishedthe right of every party to prohibit the importation and exportation ofhazardous wastes. Under the convention, parties must also agree thatillegal trafficking of hazardous wastes is a crime. The regulations gov-erning hazardous and medical wastes, however, are not widely enforcedoutside of Bogotá and Cali. In practice, hazardous and nonhazardouswastes are often mixed together and treated as municipal wastes,thus creating potentially serious consequences for public health andthe environment.
Although growing in popularity on an international basis, economicincentive measures such as charge systems for waste disposal or deposit-refund schemes for glass bottles or other materials are not widelyused in Colombia. As discussed in this report, the current approachto waste management is most aptly described as a patchwork quilt ofpolicies and practices—almost exclusively of the command-and-controlvariety—rather than as an integrated management system.
Background and Brief History
This section provides a brief history and background of the solid wastemanagement system in Colombia. The legislative background before1991 and more recent legislation are discussed. Also discussed are selectednational policies that govern waste management, waste managementgoals as established in the National Development Plan 2002–06, andbasic budget information.
296 Morgenstern and Sánchez-Triana
Legislative BackgroundPre-1991 activities. The National Code on Natural Renewable Resourcesand Environmental Protection, Decree 2811, was issued in 1974, on thebasis of Law 23 of 1973.The Sanitary Code (Law 09) was enacted in 1979.The authorities responsible for regulation and implementation of the rele-vant environmental policies, however, were not organized in a singleagency. Instead, they were dispersed among several national entities, includ-ing the Maritime General Directorate, the Health and Mining Ministries,and various local agencies—CARs and health authorities. In general, theoperations of these entities have been poorly coordinated, and they havefailed to establish clear and consistent standards for waste management.
Post 1991 activities. In 1991, with the introduction of the newConstitution, the state was assigned responsibility for advancing indivi-dual rights to enjoy a healthy environment and to participate in criticaldecisions as part of a larger set of rights that the Constitution labeled“Collective and Environmental Rights.” These rights might limit the exer-cise of certain other rights, such as those associated with the ownershipof private property.
Among the Constitutional provisions most relevant to waste man-agement are those that assign the Colombian state the followingresponsibilities:
• Preventing and controlling environmental deterioration factors• Imposing legal sanctions and requiring reparation when damage
is caused.
At the same time, the Constitution assigned municipalities the dutyof regulating the use of the soil and managing and maintaining the coun-try’s ecological resources. These responsibilities clearly carry majorimplications for economic development, especially for industrial andenergy-intensive activities.
In December 1993, Congress approved Law 99, which created theMAVDT, the National Environmental System (Sistema NacionalAmbiental, SINA), and CARs in regions of the country where they didnot exist. The law also established Urban Environmental Authorities(Autoridades Ambientales Urbanas, AAUs) in cities with more than 1 million inhabitants, five institutes of environmental research, and aspecial unit for the administration of the National Natural ParksSystem. The overall goal of these reforms was to establish a strong,
The Environmental Cost of Accelerated Urban Growth 297

coherent, internationally visible, environmental management systemthat also would be decentralized, democratic, participatory, fiscally sol-vent, and socially legitimate.
Selected National Policies for Solid Waste DisposalDecree 605 of 1996, based on Law 142 of 1994, lays out the basic proce-dures for solid waste management in Colombia, including collection, stor-age, transport, and final disposal. Unlike waste management regulations inother countries, Decree 605 of 1996 is not supported by a broad set ofagency-issued regulations, standards, and policies, backed by federal andstate enforcement procedures. Thus, Decree 605 is more of a grand designthan a specific implementing regulation for the management of solid wastes.
Law 430 of 1998 prohibits the introduction of hazardous wastes intothe national territories under the terms of the Basel Convention. Law430 also governs the management of hazardous wastes generated withinthe country, including the equipment required by customs authorities todetect the presence of wastes. The overall goals of Law 430 are to mini-mize the production of hazardous wastes, prevent their arrival in thecountry, upgrade obsolete industries that might produce them, andadvance policies for clean production processes. Law 430 establishes theduty of the waste generator to determine the physical and chemicalproperties of the wastes at properly authorized laboratories. Special pro-visions also cover wastes from hospitals, clinics, medical centers, andlaboratories that analyze or research pathogenic factors.10
The Ministries of Environment and Social Protection issued Decree1443 in 2004, which partially amended Law 2811 of 1974, Law 253 of1996, and Law 430 of 1998 with relation to the prevention and controlof environmental contamination in the management of pesticides andhazardous waste or residue coming from them. Article 7 of the decreeplaces the responsibility for the generation and handling of hazardouswastes originating from pesticides on the generator of the waste (manu-facturer, importer, or person in possession of the wastes). The responsi-bility remains until the waste has been used as an input or has been dis-posed of in a definitive manner.
The Basel Convention became effective in Colombia on March 31,1997, and establishes the obligations to reduce cross-border movementsof wastes subject to the convention and to improve the technical capac-ity of countries in the management of the wastes. According to Article81 of the Constitution, Colombia is not authorized to accept toxicwastes into its national territory.
298 Morgenstern and Sánchez-Triana

The Stockholm Convention on Persistent Organic Pollutants, whichbecame effective on May 23, 2004, is a global treaty to protect humanhealth and the environment from persistent organic pollutants (POPs),which are chemicals that remain intact in the environment for long peri-ods, becoming widely distributed geographically; accumulate in the fattytissue of living organisms; and are toxic to humans and wildlife.Examples of POPs include pesticides (including Aldrin, Chlordane,DDT, Dieldrin, Endrin, Heptaclor, Mirex, and Toxaphene) and otherchemical products (hydrochlorobenzene and polychlorinated biphenyls)or combustion by-products (dioxins and furans).11 The MAVDT isresponsible for the implementation of the Stockholm Convention, but asof June 2005 it had not developed the capacity to design policy or pro-grams to control these wastes.
Integrated solid waste management guidelines. In 2002, the Ministries ofEnvironment and Economic Development developed guidelines for theIntegrated Management of Wastes within the framework of the Quality ofUrban Life Program. The program aimed at increasing the efficiency ofproduction processes and regulating landfills for the appropriate disposalof wastes. Near-term objectives include the following:
• Minimizing waste production by helping to establish a cultural normto reduce waste generation and encourage waste separation at thesource, and by establishing clean-production programs.
• Increasing the economic value of waste such as organic and recyclablematerials. Specific goals for recycling or reuse of these materials havebeen established, with an interim target set at 30 percent of wastevolumes generated. The overall objective of the guidelines is to pro-vide the tools that allow the Environmental Authorities to supportUrban and Regional areas for integrated management of solid wastes,based on national policies established by the Ministry of Environment(MMA 2002a, 2002b, 2002c).
Although the guidelines were disseminated to all municipalities, theyare not backed by any legal authority. Nonetheless, they contain detailedtechnical data on the Integrated Solid Waste Management Guidelinesand provide a wealth of information on the procedures that territorialentities should follow to build and operate a sanitary landfill. Given thecomprehensive nature of the guidelines, there have been calls for trans-forming them into a mandatory rule on landfill management.
The Environmental Cost of Accelerated Urban Growth 299

Main elements of the guidelines include the following:
• The definition of wastes and landfills• Information on how financial institutions should characterize invest-
ment in waste management projects, and specific recommendationson the formulation of the project, selection of alternatives, identifica-tion of environmental impacts, actions to mitigate environmentalimpacts, and indicators for project management
• An environmental guide for sanitary landfills that describes the con-cept and physical structure of a landfill, lists the biological and chemicalreactions that take place when treating waste, provides guidelines on sit-ing of landfills in accordance with the Territorial Management Plan,and defines the characteristics of environmental studies required forthe environmental valuation of the project
• Technological options and design criteria according to landfill typeand the level of complexity of the system
• With respect to construction and operation, suggestions on supportinginfrastructure and on the management of landfill cells
• Instructions for control of gases and leachates—by-products of wastedecomposition in landfills
• Instructions on procedures to discontinue use of landfills.
Clean production agreements. Additional instruments for environmentalmanagement involve agreements with industry or other relevant organi-zations. In 1997, the National Environmental Council approved theNational Clean Production Policy. This consensus-based policy has anumber of broad objectives:
• Optimizing the use of natural resources and raw material• Increasing the environmental efficiency and quality of energy
resources• Preventing and minimizing the production of polluting agents• Preventing, mitigating, correcting, and compensating for the negative
environmental impacts on local populations and sensitive ecosystems• Adopting clean and practical technologies to continuously improve
environmental management• Minimizing production of waste and using already produced wastes as
a source of raw material.
Beginning in 1995, agreements for cleaner production have beensigned with a number of key sectors.
300 Morgenstern and Sánchez-Triana

National Development Plan, 2002–06. The National Development Planfor 2002–06 includes the following waste disposal objectives:
• Developing a regulation for management of solid wastes, which shouldinclude� clear definition of covered waste streams, generators, and so forth� provisions for storage� provisions for biosolids� provisions for profitable use and reuse of certain materials
• Evaluating the impact on waste disposal of the signed agreements forcleaner production, to establish a strategy for their reformulation andimplementation and a control and surveillance system
• Enforcing the strategy to extend the Clean Production Policy to theregions and to establish at least three regional hubs
• Promoting a specialized credit line to enable small and medium enter-prises to adopt newer and cleaner technologies and reconvert their pro-duction systems. Once this credit line is established, US$2.5 million(Col$5,250 million) will be devoted to implementation
• Evaluating the effectiveness of potential exemptions to the value-added tax and formulating mechanisms to support adoption of cleanertechnologies
• Developing the required measures to prevent and control contamina-tion caused by wastes or dangerous residues
• Formulating a national plan to implement the Stockholm Convention onPOPs, and supporting the management of priority chemical substances
• Conducting a strategic environmental evaluation of ports, roads, trains,mining, hydrocarbon sectors, and four strategic subsectors related toindustrial farming processes
• Formulating a plan under CONPES on Integrated Management ofSolid Wastes and completing the municipal database for the SolidWaste Information System
• Supporting territorial entities in the development of Municipal Inte-grated Solid Waste Management Plans (Planes de Gestión Integral deResiduos Sólidos, PGIRs) according to Decree 1713 of 2002
• Promoting the implementation of recycling programs in 10 large,medium, and small cities, with the cooperation of CARs and the terri-torial entities.
Integrated plans for solid waste management. By passage of Resolution1045 on September 26, 2003, the MAVDT established the obligation of
The Environmental Cost of Accelerated Urban Growth 301

each municipality to have a PGIR, an initial diagnostic, future projections,and a viable financing plan to allow continuous improvement of the serv-ice provided, including an evaluation of the results (Salamanca 2004).Resolution 1045 established a methodology for formulating PGIRs, thestructure of which must include objectives and specific goals for solidwaste management defined through programs, taking into account demo-graphic projections for each municipality in the country, waste genera-tion, urban area expansion, and soil uses. The deadline for submissions ofthe PGIRs to the MAVDT was September 2005 (MMA 2002a).
National Waste Management BudgetThe overall budget planned for the MAVDT in 2005 is Col$160,738,150(US$63,835).12 Approximately 60 percent of this budget, that is,Col$98,039,300 (US$38,935), is devoted to basic sanitation. It seemsthat the bulk of these funds will be devoted to wastewater and solidwaste management.
Effectiveness of the Waste Management System
This section reviews available information on the performance ofColombia’s waste management system from the following perspectives:information on the generation of solid waste throughout the country, themanagement of solid waste, available data on hazardous and medicalwastes, the limited evaluative information on the Clean ProductionAgreements, and selected additional topics on waste management.
Generation of Solid Waste The Institute of Hydrology, Meteorology and Environmental Studies(Instituto de Hidrología, Meteorología y Estudios Ambientales, IDEAM) hasdeveloped various indicators to track progress on environmental pro-grams. IDEAM estimates that the total volume of solid waste generatedby urban (including domestic, commercial, and institutional), industrial(manufacturing and extraction), and rural (agriculture and cattle rearing)sources was over 8 million metric tons in 2001, or about 0.71 kilograms(kg) per person per day.13
Table 9.1 shows the increasing volume of waste generated during1998 to 2001. Over this four-year period, total waste increased from7.26 million tons to 8.02 million tons, equivalent to an average increaseof about 3.3 percent per year. Growth of per capita waste generation wasconsiderably slower and averaged less than 1 percent per year.
302 Morgenstern and Sánchez-Triana

Because they are hubs for employment and trade, the urban centersattract large numbers of migrants seeking both economic opportunitiesand greater personal security. Large cities also typically have high concen-trations of populations with above-average income levels. As shown intable 9.2, affluence is generally associated with greater amounts of wastegenerated per capita. Per capita solid waste generation remains below1 kilogram per day in Colombian cities with populations over 100,000.This figure is low compared with other large Latin American cities, whereper capita waste production is 50 to 100 percent higher (figure 9.2).
A recent study identified the composition of solid waste from a cross-section of municipalities across Colombia (Salamanca 2004). Because thesample includes some of the largest cities in the country, the results maynot be representative of small municipalities. Nevertheless, the study pro-vides some indication of the composition of solid waste in the country.
As is the case in most developing countries, a major portion (60 percent)of Colombia’s waste matter is composed of organic material, includingboth domestic and agricultural waste (table 9.3). Plastics and paperaccount for 13 percent and 11 percent of waste generated, respectively,while glass, metals, textiles and leather, and other waste make up the rest.
The Environmental Cost of Accelerated Urban Growth 303
Table 9.1 Total and Per Capita Waste Generated, 1998–2001
Year Ton/year Ton/day Kg/person/day
1998 7,263,420 19,900 0.69
1999 7,844,203 21,491 0.73
2000 7,868,172 21,557 0.72
2001 8,015,854 21,961 0.71
Source: Superintendencia de Servicios Públicos 2003.
Table 9.2 Population Density and Waste Generation in Colombia, 1988–2001
Waste production (kg/inhabitant/day)
Municipal population 1998 1999 2000 2001
More than 1 million 0.82 0.82 0.82 0.81
500,000–1 million 0.73 0.84 0.73 0.65
100,000–500,000 0.66 0.70 0.66 0.67
50,000–100,000 0.59 0.68 0.59 0.66
30,000–50,000 0.69 0.70 0.69 0.62
10,000–30,000 0.68 0.68 0.68 0.71
Less than 10,000 0.62 0.61 0.62 0.68
Source: Superintendencia de Servicios Públicos 2003.

304 Morgenstern and Sánchez-Triana
Bueno
s Aire
s
São P
aulo
Mex
ico C
ity
Santia
go
Colom
bia
(citie
s >10
0,00
0)Lim
a0
0.5
1.0
1.5
2.0
kg/i
nh
abit
ant/
day
Figure 9.2 Solid Waste Generation in Latin American Cities
Sources: Buenos Aires: IMAE and PNUMA (2003); São Paulo: IPT and SVMA (2004); Mexico City: INEGI (2005); Santiago:
IEU and PNUMA (2003); Lima: CONAM (2001).
Source: Salamanca 2004.
Table 9.3 Composition of Waste
Type of waste Percentage of waste disposed
Organic material 60
Plastics 13
Paper and pasteboards 11
Glass 6
Metals 4
Textiles and leather 4
Other 2
National total 100
Source: Salamanca 2004.
plastics
paper andpasteboards
organic material
other
glass
metals
textiles andleather
Figure 9.3 Composition of Waste

Management of Solid WasteOne way to gain insight into waste management is to examine the par-ticular disposal method employed. Based on data collected by Salamanca(2004), table 9.4 illustrates the volume and disposal practices for solidwaste among Colombian municipalities. Although 65 percent of solidwaste generated in Colombia is disposed of in sanitary landfills, thisaccounts for waste from only 33 percent of the country’s municipalities.These municipalities represent more densely populated urban areas andthus account for the disproportionately large share of waste.
Conversely, 28 percent of waste generated by 575 municipalities(more than 50 percent of municipalities in Colombia) is disposed of inopen dump sites, with or without burning processes. There are 338municipalities that dispose of waste through burning and 20 that dumpwaste directly into streams and rivers, at a rate of 66 tons per day. Thesedisposal methods do not include leachate treatment or vector control. Ina recent investigation by the delegated procurador for Environmental andAgrarian Affairs of a sample of 194 locations for final disposal of solidwaste, 168 responded to the survey. Of those who responded, 121(72 percent) possessed environmental licenses, 96 (57 percent) informedthe surveyors that they did not have a defined environmental manage-ment plan, and 104 (62 percent) reported that they were situated neara body of water.
Another way to gain insight into waste management is to examine pat-terns and trends in waste recycling. Table 9.5 displays the percentages ofwastes in different categories that were recycled during 1998 to 2000. Asshown, recycling rates are relatively high for pasteboards and paper (42 to50 percent) and for metals (34 to 42 percent). For glass, 16 percent was
The Environmental Cost of Accelerated Urban Growth 305
Table 9.4 Final Disposal of Waste
Number of Waste disposed Municipalities Waste disposed
Type of disposal municipalities (tons/day) (%) (%)
Sanitary landfills 358 14,799 33 64
Dump sites with burning 338 1,946 31 9
Dump sites without burning 237 4,315 22 19
Interment 45 1,072 4 5
Water stream 20 66 2 0
Incineration 3 26 0 0
Other 56 185 5 1
Information not available 31 425 3 2
National total 1,088 22,834 100 100
Source: Salamanca 2004.
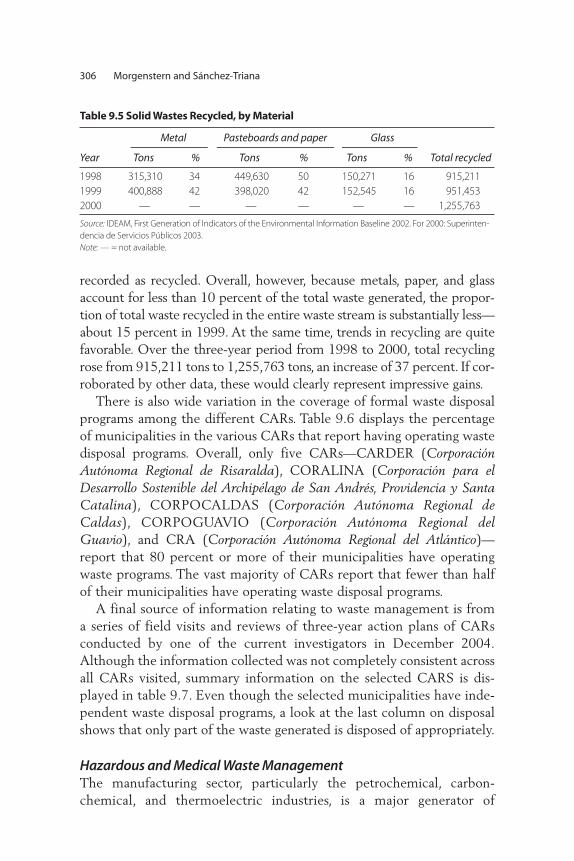
306 Morgenstern and Sánchez-Triana
recorded as recycled. Overall, however, because metals, paper, and glassaccount for less than 10 percent of the total waste generated, the propor-tion of total waste recycled in the entire waste stream is substantially less—about 15 percent in 1999. At the same time, trends in recycling are quitefavorable. Over the three-year period from 1998 to 2000, total recyclingrose from 915,211 tons to 1,255,763 tons, an increase of 37 percent. If cor-roborated by other data, these would clearly represent impressive gains.
There is also wide variation in the coverage of formal waste disposalprograms among the different CARs. Table 9.6 displays the percentageof municipalities in the various CARs that report having operating wastedisposal programs. Overall, only five CARs—CARDER (CorporaciónAutónoma Regional de Risaralda), CORALINA (Corporación para elDesarrollo Sostenible del Archipélago de San Andrés, Providencia y SantaCatalina), CORPOCALDAS (Corporación Autónoma Regional deCaldas), CORPOGUAVIO (Corporación Autónoma Regional delGuavio), and CRA (Corporación Autónoma Regional del Atlántico)—report that 80 percent or more of their municipalities have operatingwaste programs. The vast majority of CARs report that fewer than halfof their municipalities have operating waste disposal programs.
A final source of information relating to waste management is froma series of field visits and reviews of three-year action plans of CARsconducted by one of the current investigators in December 2004.Although the information collected was not completely consistent acrossall CARs visited, summary information on the selected CARS is dis-played in table 9.7. Even though the selected municipalities have inde-pendent waste disposal programs, a look at the last column on disposalshows that only part of the waste generated is disposed of appropriately.
Hazardous and Medical Waste ManagementThe manufacturing sector, particularly the petrochemical, carbon-chemical, and thermoelectric industries, is a major generator of
Table 9.5 Solid Wastes Recycled, by Material
Metal Pasteboards and paper Glass
Year Tons % Tons % Tons % Total recycled
1998 315,310 34 449,630 50 150,271 16 915,211
1999 400,888 42 398,020 42 152,545 16 951,453
2000 — — — — — — 1,255,763
Source: IDEAM, First Generation of Indicators of the Environmental Information Baseline 2002. For 2000: Superinten-
dencia de Servicios Públicos 2003.
Note: — = not available.

hazardous wastes in Colombia. Other important sources include themining, agricultural, and medical sectors, and some segments of thecommercial sector. Vargas Bejarano (1991) and Vargas Bejarano, Prieto,and Casas (1992) estimated that production of hazardous wastes rangedfrom 200 tons to 1,400 tons per day. Sánchez-Triana and Oppaluch(1996) reported that efforts to manage hazardous wastes were limited tothose made by Occidental in the petroleum production field of Caño
The Environmental Cost of Accelerated Urban Growth 307
Table 9.6 Disposal of Solid Waste in CARs
Municipalities
CAR Number in jurisdiction Percentage with waste disposal program
CAM 37 54
CAR Cundinamarca 104 57
CARDER 14 100
CARDIQUE 21 5
CARSUCRE 19 16
CAS 74 36
CDA 8 13
CDMB 13 62
CODECHOCO 31 3
CORALINA 2 100
CORANTIOQUIA 80 70
CORMACARENA 10 10
CORNARE 26 31
CORPAMAG 30 10
CORPOAMAZONIA 31 26
CORPOBOYACA 87 15
CORPOCALDAS 27 93
CORPOCESAR 25 4
CORPOCHIVOR 25 16
CORPOGUAJIRA 15 13
CORPOGUAVIO 8 88
CORPOMOJANA 7 0
CORPONARIÑO 64 44
CORPONOR 40 18
CORPORINOQUIA 64 16
CORPOURABA 19 11
CORTOLIMA 47 30
CRA 23 83
CRC 41 2
CRQ 12 58
CSB 24 4
CVC 42 45
CVS 28 14
Source: Asociación Colombiana de Corporaciones 2003.

Limón, BASF in the manufacturing plant of Medellín, and Dow Chemicalin Mamonal. Certain other private companies reportedly made limitedefforts, including building secure landfills for the disposal of fiberglassand selected toxic materials. Sánchez-Triana and Oppaluch (1996) alsoreported that only 6 percent of public and private laboratories inColombia had the capacity to analyze solid wastes and that none of theselaboratories had equipment for analyzing or sampling hazardous wastes.
In 2002, the United Nations Food and Agriculture Organizationrecorded the presence of nearly 436 tons of obsolete pesticides stored in10 departments, and approximately 4,973 tons of obsolete pesticides
308 Morgenstern and Sánchez-Triana
Table 9.7 Characteristics of Waste Programs in Selected Areas
Municipalities Area Waste Disposal
CAR in jurisdiction (sq. km.) Population (tons/day) remarks
CORANTIOQUIA 80 36,048 4,162,139 — Half of waste
disposed of
properly
CORNARE 26 8,276 598,012 182 Recycled 174,444
tons in 2003
CORTOLIMA 47 23,981 1,302,998 650 Landfills receive
10,080 tons
per month
Open-air dumps
receive 5,460 tons
per month
CVC 42 21,306 4,460,850 Domestic Sanitary landfills
waste receive
2,500 427 tons per day
CVS 28 25,045 1,348,591 — 68.7 percent of the
municipalities
use open-air
dump sites
CRA 23 3,388 2,413,803 1,902 1,496 tons are
disposed of in
Baranquilla’s
sanitary landfill
per day
Bogotá–UESP DC — 6,635,960 29,540 Doña Juana
Landfill receives
4,842 tons
per day
Source: Blackman and others 2005.
Note: — = not available. DC = Distrito Capital; UESP = Unidad Ejecutiva de Servicios Públicos del Distrito Capital de Bogotá.

buried. In one of these sites (Copey in Cesar department), 170 tons ofobsolete pesticides were found, which the MAVDT has tried unsuccess-fully to dispose of by thermal combustion.
In 2002, the National University estimated that Colombia generates500,000 tons of hazardous waste per year (Salamanca 2004). Because acomplete inventory of hazardous wastes in Colombia does not exist, thisfigure may be an underestimate. Furthermore, the figure of 500,000 tonsper year is much lower than the 8 million tons of hazardous waste gener-ated by Mexico per year. The National University estimated that the cityof Bogotá produced 73,000 tons of hazardous waste in 2002. By includingneighboring industrial municipalities like Soacha and Cota, this estimateincreases to 90,000 tons a year. The study found that the most commonform of disposal was incineration. In Bogotá, there are six incinerator kilns,each with a capacity of 200 kg per hour. Some factories specialize in treat-ing wastes such as solvents, spent oils, and PCBs (polychlorinatedbiphenyls), which are often exported to other countries for disposal.
Several developed countries dispose of hazardous wastes by incinerat-ing them in kilns used in cement production. In Colombia, MAVDT’sefforts have been limited to initial attempts at using cement-makingkilns to incinerate fungicide containers, contaminated soils, spent oils,and tires. The ashes produced from incineration are added to the cementwithout affecting cement quality. Bogotá does not have the capacity tosafely dispose of the hazardous wastes it generates. Consequently, morethan half of the hazardous wastes generated are inadequately disposed ofin open-air landfills and dumps.
More recently, Bogotá developed a master plan for integrated wastemanagement that defines various waste streams, including hazardouswaste. On the basis of data from 1999, the Office of the Mayor of Bogotáreported that 41 tons of hazardous waste were disposed of at the DoñaJuana landfill, while 9 tons of waste were reused, presumably as fuel inan unidentified facility.
The Global Environmental Fund has granted the MAVDT US$727,000(Col$1.527 million) to design and implement a program to manage POPs.In Cali, of the total amount of medical wastes and hazardous wastes gen-erated, 1 percent is sterilized and buried in the open-air dump of Navarro.The other municipalities deactivate and burn these wastes and dispose oftheir ashes in dump sites or landfills.
With respect to medical wastes, Sánchez-Triana and Oppaluch (1996)reported that pathogenic waste generated at five hospitals in Bogotávaried from 0.13 kg per bed per day to 0.18 kg per bed per day in 1992.
The Environmental Cost of Accelerated Urban Growth 309

A recent document developed by the CAR of the Sinú and San JorgeValleys (Corporación Autónoma Regional de las Valles del Sinú y San Jorge,CVS) identified nine issues associated with the management of medicalwastes (CVS 2004):
• Atmospheric pollution caused by open burning of medical waste• Technically inadequate incineration—the institutions lack the proper
permit for atmospheric emissions for stationary sources• Uncertainty about the reliability of the microbiological sterilization
procedure• Untreated medical waste• Ignorance about waste types produced by clinic laboratories• Ignorance about environmental and sanitary risks• Absence of emergency planning• Contamination through mixing of hazardous and nonhazardous
wastes, and disposal of medical wastes by burial on hospital premises• Inappropriate disposal sites and systems.
Clean Production AgreementsThe strategy of developing and promulgating regulatory standards andguidelines that are not strictly mandatory or that are voluntary has been akey focus of both the Ministry of Environment and some CARs, virtuallysince the passage of Law 99 in 1993 (see chapter 3).14 As an illustration, thelast three Ministers of the Environment, in particular, have emphasized theuse of voluntary regulations. Voluntary schemes are popular in Colombia.They come about as a result of negotiating clean production agreements(convenios de producción limpia) with polluters. The agreements targeteither specific productive sectors (for example, transportation or agricul-ture) or specific regions. Typically, they involve a two-way understanding:polluters pledge to improve environmental performance over a specifiedperiod, and in exchange, the regulator declares a certain grace period during which existing command-and-control standards are not enforced.The ostensible purpose of such agreements is to mitigate the problem ofchronic noncompliance in certain sectors and certain regions by promotingconsensus building among polluters on the need for compliance and byproviding polluters with guidance on how to achieve compliance.
Notwithstanding some potential benefits, documentary data suggestthat clean production agreements typically have not succeeded in improv-ing environmental performance. During the grace period specified in theagreement—that is, the period during which polluters have committed to
310 Morgenstern and Sánchez-Triana

investing in pollution control and prevention and during which regulatorshave promised not to enforce regulations—polluters do not actually makeany significant new investments. In any case, regulators typically have nomeans of assessing environmental performance because the clean produc-tion agreements do not include indicators or establish a baseline. Thus, theagreements end up legitimizing inaction on the part of both polluters andregulators. This seems to have been the pattern for most national-levelsectoral clean production agreements.
Esterling (2003) evaluated a sample of 13 voluntary clean productionagreements, including both single-sector and multisector agreements andagreements at the national and regional levels. The study found thatmany of the agreements suffered from weaknesses that rendered themineffective. For example, commitments made by the signatories to theagreements—and moreover, the consequences of failing to keep thesecommitments—were typically vague and ill-defined. In addition, theagreements did not identify sources of financing for costly pollutionabatement and prevention investments. Finally, the legal status of theagreements was unclear. These conditions created incentives for stake-holders to sign these agreements even if they had no real intentional ofmeeting their commitments.
Other Selected Issues Related to Waste ManagementTotal waste generation continues to rise, although only modestly, on aper capita basis. Most of the per capita waste generation growth appearsto be occurring outside the large cities. Efforts to manage solid wasteshave met with varying levels of success across the country.Although theyare not codified in formal regulations, guidelines for integrated wastemanagement have been issued and significant programs exist in largecities. In some CARs, presumably the wealthier ones, smaller municipal-ities also have programs in place. In other CARs, basic solid waste man-agement programs are nonexistent in many municipalities. Even in thosemunicipalities that have programs, little is known about the technicaland qualitative aspects of the programs. This problem is exacerbated bythe lack of enforceable regulations for waste management.
Recycling shows some promise as an element of a wider approach towaste management. For more valuable materials such as metals and sometypes of paper, recycling rates are substantial and, according to data for1998 to 1999, appear to be growing rapidly. With respect to the manage-ment of hazardous wastes, Colombia is a signatory to the Basel Convention.In this context, a few large firms and at least one large city (Bogotá) have
The Environmental Cost of Accelerated Urban Growth 311

developed modest programs. Lack of a national hazardous waste programhinders compliance with the Basel Convention. Clean production agree-ments are in place with many enterprises throughout the country. Little isknown, however, about the performance of the agreements. The limitedinformation that is available leaves doubt as to whether such agreementsencourage environmental behavior beyond business as usual.
The following observations are also pertinent:
• Salamanca (2004) highlights the absence of regulation for the man-agement of solid wastes, and lack of institutional planning and coordi-nation among governmental entities. Illustrating these deficiencies isthe fact that municipalities and governmental entities have beenunable to reach decisions on siting of landfills, despite the fact thatPOTs exist and have established environmental zoning rules.
• The current regulations do not specify the appropriate type of landfillrelative to the size and characteristics of the municipalities they serve;they do not define any technical specifications with respect to soilpermeability, collection of gases, and treatment of rainwater andleachates; and they are silent on issues relating to management andtechnical supervision of companies in charge of the operation.
• As in many other developing countries, the largely unregulated recy-cling industry—dominated by scavengers—plays an important role inwaste management in Colombia. Scavengers have worked independ-ently in landfill and dump sites from as early as 1986, eking out a livingfrom selling scrap or other waste with some resale value. In 1986, thenongovernmental organization Fundación Social was established andmade efforts to encourage scavengers to form cooperatives by providinglegal, administrative, and business assistance. The Fundación Social hasnearly 100 member cooperatives. In 1997, the foundation establisheda program that provided donations and loans, estimated at approxi-mately US$700,000 (Col$1,470 million) to the cooperatives. Theorganizational structure for the program included national, regional,and local associations of cooperatives. Through the program, affiliatedcooperatives were allowed to sell recyclables in large volume to fetchhigher incomes, but figures on the volumes of waste reused by thesecooperatives are not available.
• Inadequate financing continues to present challenges to adequate solidwaste management. Sánchez-Triana and Oppaluch (1996) report thatlarger cities are usually able to cover costs by imposing direct charges.In small and medium-sized municipalities, however, charges are often
312 Morgenstern and Sánchez-Triana

not collected. Thus, financing of waste management services in thosemunicipalities must be done through other sources such as othermunicipal income or the National Treasury.
• There is a growing emphasis on economic incentive mechanisms such astargeted charge systems or deposit-refund schemes. Sánchez-Triana andOppaluch (1996) review such schemes as applied to waste management.
Conclusions and Recommendations—Waste Management and Urban Development
Colombia has made some advances in solid waste management, especiallyin urban centers. The fact that 65 percent of waste is disposed of in sani-tary landfills is an important indication of progress. Similarly, there appearsto be some progress in the area of recycling. Notwithstanding theseadvances, it is clear that Colombia needs a more effective policy on wastemanagement. The operation and management of the limited number oflandfills that do exist is often substandard. Clear regulations for control ofleachates, groundwater pollution, and disease vectors do not exist, nor dospecific regulations for the control and regulation of landfill gases and soil-type analyses. In addition, over half of all municipalities in the countrycontinue to dispose of their waste in open-air and uncontrolled dump siteswithout any prior treatment, or directly into bodies of water. Systems forseparation and management of hazardous and special wastes, includingmedical waste, are nonexistent or grossly inadequate where they do exist.These practices present significant health risks to the public.
The government is aware of many of the problems associated withwaste management and has considered several alternatives to overcomethe problems identified. The following suggested alternatives are intend-ed to support future reforms:
• Establishment of legally binding standards for landfills in urban areas.Theobvious starting point for these standards is the 2002 Integrated WasteManagement Guidelines. Lack of a comprehensive set of standards forlandfills has resulted in wide differences in operating practices for land-fills across urban areas where they exist. Development of a commonstandard will establish a minimum requirement that landfill operatorsmust meet to mitigate risks to the environment and public health.
• Development of recommendations appropriate for smaller municipalities.Sanitary landfills are expensive to build and operate, and they involvesubstantial investments in capital and infrastructure, which smaller
The Environmental Cost of Accelerated Urban Growth 313

municipalities may not be able to afford. Thus, construction of state-of-the-art landfills in small municipalities may not be cost-effective.Nonetheless, a need remains for adequate management of wastegenerated from small and remote municipalities. Instead of applyingstandards for urban landfills to such municipalities, it is recommendedthat the government issue regulations that include the developmentof criteria and standards for waste management solutions appropriatefor smaller municipalities. Such regulations should also include incen-tives for waste disposal in regional landfills.
• Enforcement of territorial management plans that address the siting of land-fills. The territorial management plans contain some zoning regulationsregarding siting of landfills, but they are not adequately taken intoaccount in decision making on where to put landfills.
• Adoption of a decentralized approach to waste disposal. Transfer stationsshould be designed and constructed and located throughout urbanareas so that transport costs can be reduced.
• Better articulation of legal requirements for hazardous waste manage-ment. Despite the existence of regulations for hazardous waste, non-compliance continues to be a serious problem. It is recommended thatthe current regulations be evaluated with the goal of simplifying defi-nitions and requirements, and improving monitoring and enforcementof regulations, including penalties.
• Better articulation of the role of environmental authorities in the enforce-ment of waste management regulations. The inclusion of provisions inwaste management regulations that require CARs and AAUs toenforce such regulations will contribute considerably to enhancingcompliance. Implications for nonenforcement of regulations by theAAUs and CARs might be articulated, including provisions for ensur-ing accountability. In addition, such regulations might specify that theMAVDT monitor the performance of the enforcement programs con-ducted by the AAUs and CARs.
• Improved monitoring of final disposal of medical wastes. Decree 2676 of2000 regulates medical wastes and establishes stringent standards fortheir disposal by incineration. However, monitoring of this program isless than optimal. It would be advisable that a special evaluation becarried out for medical wastes with the goal of simplifying the regula-tions and improving monitoring and enforcement.
Recommendations for urban planning and waste management are sum-marized in table 9.8.
314 Morgenstern and Sánchez-Triana

The Environmental Cost of Accelerated Urban Growth 315
Table 9.8 Summary of Recommendations for Addressing Problems Associated with
Accelerated Urban Growth
Priority: Responsible
short (S), medium (M), government
Recommendation and long term (L) agencies
Institutional and regulatory framework for urban planning
Define priorities that will be addressed in technical M–L MAVDT
assistance programs to cities for drafting and revising
POTs, based on the capacities of the municipalities
Establish legal and regulatory framework and S MAVDT,
oversight mechanisms to ensure compatibility Municipalities
among POTs, development plans, and annual
budget procedures at the municipal level
Use POTs (articulated with municipal development M–L Municipalities
plans) and municipal development plans as basis for
elaboration of budgets
Coordinate planning and urban management
functions at the local level through
• adjusting institutional settings such as establishment M–L Municipalities
of metropolitan areas
• formalizing modes of horizontal cooperation M–L Municipalities
among cities
• creating regional entities for management M–L MAVDT,
of integrated urban operations in charge Municipalities
of coordinating interventions in various
sectors
• establishing and allocating to appropriate M–L MAVDT,
institutions functions of support to and monitoring Municipalities,
of urban development, for environmental issues CARs
the scope of which is broader than the municipal
or aggregate level
Articulate environmental and urban legislation through
• review of legal and regulatory framework, S–M MAVDT
starting from sector perspective
• integrating environment into urban planning S–M MAVDT, CARs,
AAUs
Prevention of informal housing
Conduct studies to improve understanding of S MAVDT, AAUs,
how and why informal settlements are formed CARs
Address structural land supply problems and S MAVDT
thus lower costs of formalization
(continued)

316 Morgenstern and Sánchez-Triana
Table 9.8 Summary of Recommendations for Addressing Problems Associated with
Accelerated Urban Growth (continued)
Priority: Responsible
short (S), medium (M), government
Recommendation and long term (L) agencies
Housing subsidies
Evaluate the actual VIS to ensure its compliance with S MAVDT
habitability standards per provisions of Decree 975
Define and include environmental criteria that minimize S MAVDT
natural risks and ensure ventilation and indoor
air quality in the eligibility criteria of VIS projects
Provide alternative subsidies
• revise eligibility criteria of VIS scheme to broaden S MAVDT
the scope of the VIS and encompass rehabilitation
incentives to locate in “void”pockets of land
within existing urban perimeters (for example,
old industrial zones), and multifamily housing
• shift from subsidies for new construction toward S MAVDT
subsidies for amelioration and upgrading, with
emphasis on basic services and infrastructure
Waste management
Establish legally binding technical standards for landfills S MAVDT, CARs
in urban areas
Develop criteria and standards for waste management M MAVDT
solutions, including incentives for waste disposal
in regional landfills
Enforce land use plans (POTs) so that decisions on S MAVDT, CARs
siting of landfills are consistent with zoning
regulations contained in POTs
Waste management regulations
• better articulate the role of environmental S Congress,
authorities in enforcement of waste MAVDT
management regulations
• include provisions in waste management S–M Congress,
regulations that require that CARs and AAUs MAVDT,
enforce such regulations Comisión de
Regulación
de Agua
• include regulations that specify that the MAVDT S Congress
monitor the performance of enforcement
programs conducted by the AAUs and CARs
Conduct evaluation of final disposal of medical S–M MAVDT
wastes with the goal of simplifying regulations
for medical waste disposal and improving
monitoring and enforcement
Source: Authors.

Notes
1. Richard Morgenstern and Ernesto Sánchez-Triana are the authors of thischapter, which draws heavily from background documents prepared for thisstudy by Le Blanc (2005) and Blackman and others (2005).
2. They are predominantly urban regions including adjacent towns and suburbs.
3. The figures from the Department of National Planning on informal or sub-standard housing include units that cannot be brought up to normal standardsand units located in zones of natural risks, and units with “qualitative deficit”(insufficiencies in construction, deficient access to utilities or services, and soforth). These two types of units do not call for the same types of intervention(dwellings pertaining to the second category are subject to upgrading,improvement of access, and so forth, which would bring them out of the slumcategory). Thus, the two categories should be distinguished.
4. However, in many smaller municipalities, the formulation of the POT consti-tuted the first process of territorial planning and contributed to the buildingof institutional capacity.
5. International experience shows that the costs of preventing informal develop-ment, in terms of servicing and bringing utilities, are far lower than the costof dealing with them after construction is completed. Moreover, the two casestranslate into a different balance between private and public costs. Earlyenforcement ensures that a larger portion of the costs is borne by the privatesector. Ex post regularization usually puts the financial burden entirely on thepublic sector.
6. The regional and departmental repartition, which is based on transparent cri-teria, should not be changed.
7. A serious obstacle to this strategy is the high price of land in central zones ofurban agglomerations.
8. This could be justified by the need for the state to contribute to welfareincreases in regions facing particular types of problems linked with housingconditions (for example, subsidies for toilets or sanitation to priority areaswhere lack of sanitation causes health problems).
9. For example, one-to-one matching subsidies could be instituted for land titlingthe first year, accompanied by a change in the law; then the following year two-to-one subsidies could be offered for sanitation in priority areas, and so forth.
10. The Ministry of Health issued Decree 1669 of 2002, which regulates med-ical and related wastes (Gestión Integral de Residuos Hospitalarios y Similares,GIRHYS). It establishes standards concerning pharmaceutical laboratories,defines a number of key terms in the field, establishes new responsibilitiesfor Health and Environmental Authorities, and determines that waste incin-eration should be done after that waste’s deactivation at incineration plantsor cement factories where an environmental license has been granted for thisparticular use.
The Environmental Cost of Accelerated Urban Growth 317

318 Morgenstern and Sánchez-Triana
11. See http://www.pops.int/.
12. Col$2,510 = US$1.
13. Office of the Superintendent of Public Services, the MAVDT, and theNational Statistical Administration Department.
14. Much of the information contained in this subsection is derived from inter-views conducted by the Resources for the Future consultants in March 2004(see Blackman, Morgenstern, and Topping [2004]).
References
Blackman, Allen, Richard Morgenstern, Libardo Montealegre Murcia, and JuanCarlos Garcia de Brigard. 2005. “Review of the Efficiency and Effectivenessof Colombia’s Environmental Policies.” Final Report to the World Bank,Resources for the Future, Washington, DC.
Blackman,Allen, Richard Morgenstern, and Elizabeth Topping. 2004. “InstitutionalAnalysis of Colombia’s Autonomous Regional Corporations (CARs).”Resources for the Future, Washington, DC.
Bloomberg, Paul. 2001. Informe Final de la consultora para la revisión y análisis delas políticas, reglamentos y procedimientos referidos a la Vivienda de InterésSocial. Consultant Report, Ministry of Environment, Housing and RegionalDevelopment, Bogotá.
Caicedo, Carlos. 2002. Formulación del Proyecto Operación de Crédito de Bogotá,D.C. Banco Mundial, para la financiación del Programa de MejoramientoIntegral de Barrios en el Marco del Crédito de Servicios Urbanos, ConsultantReport, Bogotá.
CONAM (Consejo Nacional del Ambiente). 2001. “Informe Nacional sobre el Medio Ambiente. Geo Peru 2000.” Technical Report, CONAM andPrograma de las Naciones Unidas para el Medio Ambiente, Lima.
CONPES (Consejo Nacional de Política Económica y Social). 2002. Documento3178––“Evaluación del Programa de Subsidio Familiar de Vivienda de InterésSocial.” Departamento Nacional de Planeación; Ministerio de Ambiente,Vivienda y Desarrollo Territorial, Bogotá.
———. 2004. Documento 3305––“Lineamientos para Optimizar la Política deDesarrollo Urbano.” Government of Colombia, Bogotá.
CVS (Corporación Autónoma Regional de los Valles del Sinú y San Jorge). 2004.Diagnóstico Ambiental de la Cuenca Hidrográfica del Rió Sinú. Versión 01,03/05/2004. Monteria. Córdoba, Colombia.
DNP (Departamento Nacional de Planeación)-DDUPRE. 2004. “Bases para laoptimización del programa de subsidio familiar de vivienda y lineamientospara dinamizar la oferta de crédito de vivienda de interés social.” DocumentoCONPES, DNP-DDUPRE, Bogotá.

The Environmental Cost of Accelerated Urban Growth 319
Esterling Lara Sánchez,Angel. 2003.“Evaluation and Perspectives on the ConsensusAgreements for Cleaner Production in Colombia.” Bogotá.
IDEAM (Instituto de Hidrología, Meteorología y Estudios Ambientales). 2002.“Primera Generacíon de Indicadores de Línea de la Informacion Ambiental.”Technical Report, IDEAM, Bogotá.
IEU (Instituto de Estudios Urbano) and PNUMA (Programa de las NacionesUnidas para el Medio Ambiente). 2003. Perspectivas del Medio AmbienteUrbano: GEO Santiagos. Santiago: IEU.
IMAE (Instituto del Medio Ambiente y Ecología) and PNUMA (Programa de lasNaciones Unidas para el Medio Ambiente). 2003. Perspectivas del MedioAmbiente Urbano: GEO Buenos Aires. Buenos Aires: IMAE.
INEGI (Instituto Nacional de Estadística Geografía y Informática). 2005.Esadísticas del Medio Ambiente del Distrito Federal y Zona Metropolitana2002. Aguascalientes, Mexico: INEGI.
IPT (Instituto de Pesquises Tecnologicas) and SVMA. 2004. Panorama do MeioAmbiente Urbano, GEO Cidade de Sao Paulo. São Paulo, Brazil: SVMA.
Lavadenz, Isabel, and Klaus Deininger. 2003. “Land Policies.” In Colombia: TheEconomic Foundation of Peace, ed. Marcelo Giugale, Olivier Laforcade, andConnie Luff, 559–85. Washington, DC: World Bank.
Le Blanc, David. 2005. “Assessment of Environmental and Housing Policies inColombia.” Memorandum, World Bank, Washington, DC.
MAVDT (Ministerio de Ambiente, Vivienda y Desarrollo Territorial). 2005. Plande Manejo de Residuos Solidos. Bogotá: MAVDT.
MMA (Ministerio del Medio Ambiente). 2002a. Guia Ambiental de RellenosSanitarios. Bogotá: MMA.
———. 2002b. Manual de Procedimientos para el Manejo de Residuos Médicos enColombia. Bogotá: MMA.
———. 2002c. Plan Indicativo Sectorial 2002–2006. Bogotá: MMA.
Ministerio de Hacienda y Crédito Público. 2003. Ley General de Presupuesto.Bogotá: Ministerio de Hacienda y Crédito Público.
Persaud, Thakoor, and Alexandra Ortiz. 2003. “Urban Development.” InColombia: The Economic Foundation of Peace, ed. Marcelo Giugale, OlivierLaforcade, and Connie Luff, 329–62. Washington, DC: World Bank.
Salamanca, J. 2004 “Study for Regulation on Final Disposal of Solid Wastes inColombia.” Consultant Report, Colombian Technical Cooperation AgencyACCI; Ministry of Environment, Housing and Territorial Development;Agreement of Japan Donation 051886- CO; and World Bank, Bogotá.
Sánchez-Triana, Ernesto, and J. Oppaluch. 1996. “Environmental Policies for WasteManagement and Disposal in Colombia.” Working Paper, Instituto de EstudiosAmbientales, Universidad Nacional de Colombia Documento de Trabajo, Bogotá.

Vargas Bejarano, Carlos. 1991. “Situación de la administración y control de los resid-uos sólidos peligrosos en las corporaciones regionales de desarrollo COR-POCALDAS, CORNARE y CAR.” Working Paper, Departamento Nacionalde Planeación, Programa de las Naciones Unidas para Desarrollo, Bogotá.
Vargas Bejarano, Carlos, A. Prieto, and W. Casas. 1992. “Situación de la adminis-tración y control de los residuos sólidos y peligrosos: oferta analítica nacional.”Working Paper, Departamento Nacional de Planeacion, Programa de lasNaciones Unidas para Desarrollo, Bogotá.
320 Morgenstern and Sánchez-Triana
In Colombia, natural disasters constitute a threat to the livelihood and veryexistence of a significant percentage of the population. Natural disasters, mainlyfloods and landslides, have been responsible for substantial loss of life and for dam-age and destruction of property. During 1999 to 2003, natural disasters affected anestimated 533,000 people and 18,000 houses and resulted in 142 deaths. Thegovernment of Colombia has made considerable progress in managing disasters,particularly in the creation of institutions. Efforts have focused principally ondisaster management rather than disaster prevention.This chapter identifies struc-tural deficiencies in the institutional framework, inadequate funding, scarce andpoorly articulated information on risks and vulnerability to disasters, and absenceof natural disaster prevention in planning efforts. These shortcoming must beaddressed by strengthening natural disaster prevention policy implementation atthe local and national levels, increasing involvement of regional and national envi-ronmental authorities in the reduction of vulnerability to natural disasters, andstrengthening disaster information through improved monitoring and alert systemsand comparative risk assessments. Doing so will enable Colombia to mitigate theconsequences of natural disasters in a sustainable manner. The role of theAutonomous Regional Corporations is particularly crucial in local disaster preven-tion and management because they are the principal repositories of knowledgeabout the characteristics of the areas under their jurisdiction.
C H A P T E R 1 0
Living with Natural Disasters
321

Colombia is extremely vulnerable to natural disasters for three mainreasons.1 A mountainous topography with high rainfall creates flood andlandslide risks that are greatly exacerbated by deforestation and unsus-tainable agricultural practices. Much of Colombia is located on theAndean fault line where several tectonic plates meet, which puts it in aposition of great risk of earthquakes, volcanic eruptions, and tsunamis.Finally, the country is affected by the El Niño weather system, whichperiodically causes severe drought and flooding.
This chapter discusses the issues associated with the occurrence of nat-ural disasters in Colombia and evaluates the adequacy of existing policies tomanage natural disasters. It presents background information on the nature,frequency, and geographical distribution of natural disasters in Colombia;discusses the policy and institutional alternatives for preventing and miti-gating natural disasters; and offers conclusions and recommendations.
Natural Disasters in Colombia: Occurrence and Impacts
Major natural disasters2 in recent Colombian history include earth-quakes in Cúcuta (1875), Caldas (1979), Popayán (1983), Atrato(1992), Tauramena, Pereira, and Pasto (1995), and Armenia (1999);repeated volcanic activity in the Nevado del Ruiz and Galeras volcanoes;and tsunamis in Tumaco (1906 and 1979).
Damage to property and loss of life caused by natural disasters is costly.Table 10.1 presents information on the incidence of natural disasters andtheir costs in Central and South America during 1970 to 1999. During thisperiod, Colombia experienced on average 2.97 natural disasters per year,the third-highest annual rate among the 19 countries in the two regions.In addition, an estimated 30,000 deaths were caused by these naturaldisasters, the third-largest number for the two regions. These eventsresulted in losses of more than Col$9,450 billion (US$4,500 million),or 11.5 percent of the country’s 1995 gross domestic product (GDP).The high frequency of occurrence of natural disasters, the toll theseevents have taken on human lives, and the additional constraints that theeconomic losses impose on the country’s budgetary resources underscorethe need to develop more robust institutional responses.
Figure 10.1 shows the distribution of major natural disaster threats byregion in Colombia. According to the figure, the Pacific, Andean,Amazon, Orinoquia, and Caribbean regions are threatened by floods, andthe Pacific, Andean, and Caribbean regions are threatened by landslides.
While individual earthquakes and volcanic eruptions cause the mostdramatic damage and greatest loss of life, rainfall and climatic events are
322 Blackman, Awe, Brandriss, and Urrutia

more frequent and widespread. Floods and landslides, which occur mostfrequently during the rainy months of May, June, October, andNovember, account for two-thirds of all disasters (figure 10.2).
Larsen (2004) estimates that during 1999 to 2003, 142 people per yearwere killed in natural disasters, and 533,000 people and 18,000 houses peryear were affected in some way (tables 10.2, 10.3 and 10.4). In the sameperiod, earthquakes accounted for a majority of deaths, injuries, and housesdestroyed, and floods affected the greatest number of people. Earthquakes—not including the earthquake that devastated Armenia in 1999—accountedfor 63 percent of deaths, 76 percent of injuries, 56 percent of housesdestroyed, and 13 percent of people affected by natural disasters. In com-parison, floods accounted for 8 percent of deaths, 3 percent of injuries,20 percent of houses destroyed, and 71 percent of the people affected bynatural disasters. Avalanches and landslides, mainly related to heavy rain-fall, accounted for another 4 percent of people affected by natural disasters.
Living with Natural Disasters 323
Table 10.1 Disaster Exposure Indicators in Central and South America, 1970–99
Disaster occurrence Fatalities Economic losses
1998
Per Per Per 1,000 US$ % 1995
Country Total year km2 Total inhabitants million GDP
Central America
Belize 6 0.2 0.30 5 0.02 33.8 5.4
Costa Rica 33 1.1 0.70 287 0.08 1,117.5 13.4
El Salvador 16 0.5 0.80 2,880 0.50 2,713.9 22.9
Guatemala 28 0.9 0.06 24,139 2.20 3,062.5 17.3
Honduras 28 0.9 0.30 17,347 2.90 4,239.5 82.0
Mexico 117 3.9 0.06 15,594 0.20 13,822.5 3.6
Nicaragua 26 0.9 0.20 13,067 2.90 5,780.5 338.4
Panama 15 0.5 0.20 152 0.06 170.0 1.8
South America
Argentina 48 1.60 0.02 685 0.02 11,201.0 3.8
Bolivia 31 1.03 0.03 787 0.10 4,919.9 21.0
Brazil 102 3.40 0.01 4,462 0.03 1,756.7 2.2
Chile 47 1.57 0.06 997 0.07 16,238.1 6.3
Colombia 89 2.97 0.09 29,857 0.80 4,457.8 11.5
Ecuador 46 1.53 0.20 7,091 0.61 6,824.5 42.5
Guyana 5 0.17 0.10 0 0.00 29.8 4.6
Paraguay 16 0.53 0.04 109 0.02 116.1 1.4
Peru 78 2.60 0.06 72,475 2.98 5,988.7 10.3
Uruguay 7 0.20 0.04 2 0.00 30.0 0.2
Venezuela, R. B. de 19 0.63 0.02 30,446 1.40 2,055.2 2.2
Average 40 1.32 0.17 11,599 0.78 4,450.0 31.0
Source: Charvériat 2000.
Note: GDP = gross domestic product; km2 = square kilometer.

During 1999 to 2003, nearly 2 million people were affected by floods,not including impacts caused by landslides and storms. In 2003 alone,390,977 people were affected by floods, landslides, and storms (floods328,304 people; landslides 6,279 people; and storms 55,944 people)(table 10.5).
Effectiveness of Policy Design
This section discusses and evaluates the existing policy and legal frame-work for addressing natural disasters in Colombia.
324 Blackman, Awe, Brandriss, and Urrutia
Insular RegionCoastal erosionSeismic activityLiquation
Pacific RegionEarthquakesTsunamisLandslidesCoastal erosionSubsidenceFloodingVolcanoes
Andean RegionSeismic activitySlidesAvalanchesFlooding erosionVolcanoesMass transfers
Amazon RegionFloodingHydric erosionFoothills / Piedmont slides
Orinoquia RegionFloodingHydric erosionFoothills / Piedmont slides
Caribbean RegionFloodingAvalanchesLandslidesMud diapirismCoastal erosionLiquation
Figure 10.1 Geographical Distribution of Natural Disaster Threats in Colombia
Source: Red de Desarrollo Sostenible Web Site (June 2005). http://www.rds.org.co/reducir.

Living with Natural Disasters 325
0255075
100125150175200225250275300325
1993
1994
1995
1996
1997
1998
1999
2000
2001
2002
2003
months
freq
uen
cy
Landslides Flooding Other
Figure 10.2 Cumulative Monthly Occurrence of Flooding, Landslides,
and Other Disasters
Source: INGEOMINAS 2005.
Table 10.2 Percentage of Disaster Impacts by Type of Disaster, 1999–2003
Deaths Injured Houses Houses
Event persons affected Persons destroyed damaged
Landslides 18 6 3 6 5
Floods 9 4 71 21 35
Storms 0 5 7 5 25
Droughts 0 0 3 0 0
Fires, buildings 1 2 0 8 0
Fires, forest 0 0 1 0 0
Avalanches 3 1 1 4 2
Earthquakes 63 76 13 56 32
Contamination 0 4 0 0 0
Other 6 2 1 0 1
Total 100 100 100 100 100
Source: Larsen (2004), derived from General Directorate for Disaster Relief and Prevention database.
Note: Data do not include the 1999 Armenia earthquake.
Natural Disaster LawLaw 9 of 1979 created national-, regional-, and local-level disaster manage-ment institutions known as Emergency Management Committees, andestablished disaster preparedness and management procedures. At thenational level, the National Emergencies Committee (Comité Nacional deEmergencias, CNE) is responsible for, among other functions, declaring the

326 Blackman, Awe, Brandriss, and Urrutia
Table 10.3 Impacts of Natural Disasters, 1999–2003
Impact 2003 2002 2001 2000 1999
Deaths 122 142 74 96 276
Injured persons 420 39 379 111 351
Missing persons 18 52 28 15 60
Number of people affected (thousands) 436 343 205 468 1,214
Families affected (thousands) 88 67 40 94 240
Houses destroyed (thousands) 2.1 1.3 1.6 2.5 5.5
Houses damaged (thousands) 16.8 10.2 14.5 10.9 26.2
Roads damaged 31 83 66 135 375
Bridges damaged 8 13 14 61 123
Pedestrian overpasses and bridges
damaged 10 22 20 57 126
Water supply systems affected 6 119 21 91 136
Sewerage systems affected 1 1 1 5 30
Health centers affected 6 8 8 11 7
Schools and education centers affected 45 65 64 76 89
Community centers affected 31 62 40 31 62
Source: Larsen (2004) derived from General Directorate for Disaster Relief and Prevention database.
Note: Data do not include the 1999 Armenia earthquake.
Table 10.4 Annual Average Impacts of Natural Disasters, 1999–2003
Impact 1999–2003
Deaths 142
Number of people affected (thousands) 533
Houses affected (thousands) 18
Source: Larsen (2004) derived from General Directorate for Disaster Relief and Prevention
database.
Note: Data do not include the Armenia earthquake.
beginning and end of an emergency and for coordinating disaster responseactivities. Local Emergency Management Committees are required to pre-pare a contingency plan for each of the different types of disasters thatthreaten their communities. The contingency plans are to be based on avulnerability assessment and a disaster planning exercise. The CNE isresponsible for presenting such plans to the Ministry of Health forapproval and for requesting foreign assistance for disasters. In accordancewith the law, the Ministry of Health is responsible for coordinating trainingprograms needed to facilitate the contingency plans and for providing careto injured people, managing corpses, and implementing waste disposal andother sanitary measures.
Law 46 of 1988, the country’s main national disaster regulation, cre-ated the National Disaster Preparedness and Response System (Sistema

Nacional de Prevención y Atención de Desastres, SNPAD). It gave SNPADresponsibility for defining the functions of all public and private institutionsrelated to disaster prevention and management; integrating public andprivate efforts for disaster prevention and management; and guaranteeingtimely and efficient management of the human, technical, administrative,and economic resources necessary for preventing and managing disasters.At the national level, the two most important institutions in SNPAD are
Living with Natural Disasters 327
Table 10.5 Number of People Affected by Landslides, Floods, and Storms, 2003
Department Total Landslides Floods Storms
Chocó 116,502 96 113,896 2,510
Bolívar 46,607 374 44,813 1,420
Antioquía 30,878 30 25,273 5,575
Boyacá 30,685 1,830 28,100 755
Magdalena 25,105 0 24,355 750
Córdoba 24,570 0 17,010 7,560
Sucre 18,770 0 15,369 3,401
Amazonas 9,955 0 9,955 0
Santander 9,480 530 8,950 0
Atlántico 8,376 0 346 8,030
Putumayo 6,445 0 4,935 1,510
Cauca 6,393 85 356 5,952
Cesar 6,319 0 3,516 2,803
Caquetá 6,165 95 4,040 2,030
Casanare 5,786 0 5,786 0
Tolima 5,518 573 1,410 3,535
Valle 5,505 280 4,850 375
Norte de Santander 5,421 1,762 3,213 446
Quindío 4,527 35 60 4,432
Risaralda 4,020 438 0 3,582
Caldas 3,839 390 3,106 343
Arauca 3,155 0 3,155 0
Guainía 2,000 0 2,000 0
Cundinamarca 1,409 189 1,220 0
La Guajira 1,180 0 245 935
Guaviare 1,025 0 1,025 0
Vichada 790 0 790 0
Meta 325 0 325 0
San Andrés y Prov. 105 0 105 0
Nariño 100 0 100 0
Huila 22 22 0 0
Vaupés 0 0 0 0
Total 390,977 6,729 328,304 55,944
Source: Blackman and others 2005.

the National Disaster Preparedness and Response Committee (ComitéNacional para la Prevención y Atención de Desastres, CNPAD) and theNational Disaster Preparedness and Response Office (Oficina Nacionalpara la Prevención y Atención de Desastres, ONPAD), now known as theGeneral Directorate for Disaster Relief and Prevention (Dirección Generalpara la Prevención y Atención de Desastres, DGPAD) and located in theMinistry of Interior and Justice.3 CNPAD is a high-level committee,presided over by the President; the committee heads SNPAD and coordi-nates its activities through the DGPAD.
DGPAD. The DGPAD is responsible for coordinating day-to-day disasterresponse planning and management. Funding for the DGPAD is providedby the National Disaster Fund (Fondo Nacional de Calamidades, FNC).TheDGPAD is also responsible for organizing an integrated information systemthat facilitates the identification of disaster risks. Law 46 of 1988 assigns tothe DGPAD the responsibility of promulgating (by presidential decree) aNational Disaster Preparedness and Response Plan (Plan Nacional para laPrevención y Atención de Desastres, PNPAD). By law, PNPAD is required toaddress, through national, regional, and local planning offices, a wide rangeof issues including (a) disaster prevention, immediate management, andreconstruction; (b) all relevant technical, scientific, economic, funding, com-munity, judiciary, and institutional topics; (c) educational and participatoryissues; (d) integrated information and communication systems; (e) the roleof mass media; (f) interinstitutional and intersectoral coordination; and(g) identification of needs for research or technical studies.
CREPAD and COLPAD. Law 46 of 1988 created regional- and local-level disaster prevention and management institutions: the RegionalDisaster Preparedness and Response Committee (Comité Regional parala Prevención y Atención de Desastres, CREPAD) and the Local DisasterPreparedness and Response Committee (Comité Local para la Prevencióny Atención de Desastres, COLPAD). Each department is required to havea CREPAD and each municipality a COLPAD.
Decree-Law 919 of 1989 implements the provisions of Law 46 of 1988.The decree-law identifies the members of SNPAD and defines their respon-sibilities and functions; proposes general guidelines for managing disas-ters and procedures to be followed by each institution for prevention andmanagement of potential and actual disasters; requires that the recom-mendations of PNPAD be included in any POT; mandates both theprioritization of risk mitigation activities in key economic sectors and the
328 Blackman, Awe, Brandriss, and Urrutia

creation of a National Disaster Information System—a repository of dataon risks and vulnerabilities and of guidance on disaster prevention andrisk mitigation measures—and clarifies the criteria for declaration of a stateof emergency and for its termination. When a situation does not qualifyas a state of emergency, it is to be considered a public calamity and iseligible to be upgraded to a state of emergency during the three monthsafter the event.
While Law 46 of 1988 mandated the newly created DGPAD to pre-pare a PNPAD, Decree 93 of 1988 states that the main goal of thePNPAD is to guide the actions of the government and civil society toprevent and mitigate disaster risks and to attend to and restore areas thathave suffered a disaster.
Programs. Decree 93 of 1998 stipulates that research on and the knowl-edge of risks should be the basis of the decision-making and planningprocesses. Toward that end, SNPAD develops programs in four areas:(a) identifying and characterizing sources of risk, (b) incorporating riskreduction and prevention in planning mechanisms, (c) strengthening theSNPAD’s institutions, and (d) promoting information disclosure. Thedecree describes specific activities meant to further these programs.These include installing a surveillance, detection, and alert network;developing an inventory of risks and threats; including disaster preven-tion criteria in development plans; conducting inventories of settlementslocated in high-risk areas; supporting relocation activities; defining housingstandards; preparing a communication network among SNPAD institutions;strengthening SNPAD’s agencies; preparing contingency plans for therehabilitation of utilities in case of disaster; establishing temporary man-agement facilities for social housing and infrastructure reconstructionand relocation; designing an integrated information system and a docu-mentation center network; and developing a national capacity-buildingsystem for government employees and community leaders.
Coordination between the National Environmental System andSNPAD. Decree 93 of 1998 states that the National EnvironmentalSystem (Sistema Nacional Ambiental, SINA) and SNPAD should coordi-nate their activities in areas such as (a) vulnerability, threats, and risks atthe national, regional, and local levels; (b) the inclusion of risk mitigationand disaster prevention in environmental impact assessments and envi-ronmental management plans; and (c) the inclusion of risk as a triggerfor the prohibition of certain land uses.
Living with Natural Disasters 329

The Relationship between the National Environmental System and the National Disaster Response and Prevention SystemLaw 99 of 1993 established the SINA and created the Ministry of theEnvironment (Ministerio del Medio Ambiente, MMA) to head the SINA.Several provisions of the law relate to disaster prevention and relief. Oneof the law’s basic principles is that disaster prevention and attention arematters of collective interest and, as a result, SINA is required to promotethem. In addition, among the many functions assigned to the MMA isthe evaluation, follow-up, and control of natural disaster risks. Law 99 of1993 directs the MMA to coordinate actions aimed at anticipatingand preventing emergencies, and stipulates that the Ministry of Govern-ment and the MMA must effectively coordinate the activities of SINAand SNPAD.
Law 99 of 1993 assigns Autonomous Regional Corporations(Corporaciones Autónomas Regionales, CARs)—the regional authori-ties within the SINA—principal responsibility for implementing awide range of environmental and natural resource policies, includingdisaster prevention and management. The law establishes that one ofthe functions of CARs is to organize activities for the analysis, follow-up, prevention, and control of disasters, in coordination with othercompetent authorities. It also stipulates that CARs are to provideassistance to such authorities on the environmental aspects of disasterprevention and relief. CARs are directed to work jointly with the localand regional institutions to improve the safety of urban areas locatedin high-risk zones.
Laws Relating to Funding of the National Disaster Prevention and Relief System SNPAD comprises a variety of institutions, and they are funded fromdifferent sources. As such, they allocate their funding between disasterprevention and management and their other tasks and responsibilities.TheDGPAD, located within the Ministry of Interior and Justice, is unique inthat it is allocated a budget from a single source—general revenues—andconsequently focuses solely on disaster prevention and mitigation.
Decree 1547 of 1983 created the FNC as a national account withadministrative, accounting, and statistical independence. The decreestipulates that the FNC’s funds are to be used to (a) provide financial sup-port for disaster relief; (b) control the effects of catastrophes, especiallythose involving epidemics; (c) support rehabilitation and restructuring ofbasic sanitation facilities; (d) finance information systems and other
330 Blackman, Awe, Brandriss, and Urrutia

equipment necessary to diagnose and manage catastrophic situations; and(e) take actions to prevent or attenuate the effects of disasters.
Law 60 of 1993 deals with the allocation of financial resources amongmunicipalities and states that these resources are to be used for stabiliz-ing high-risk zones, relocating households at risk, and preventing andaddressing disasters (in addition to funding education, health, housing,and utilities).
Law 715 of 2001 replaced Law 60 of 1993. It creates the GeneralParticipation System (Sistema General de Participaciones) for municipali-ties to use to promote, fund, or cofund projects of municipal interest,including those related to natural disasters. Law 715 mandates that themunicipalities, the national government, and the departments cofinanceprojects to prevent and address natural disasters within their jurisdictions,including relocation of households in high-risk zones.
Institutions and Activities Involved in the Design and Implementationof Colombia’s Natural Disaster PolicyLike SINA, SNPAD is an all-encompassing set of institutions spanningthe public and private sectors and the national and regional levels. Thedisaster prevention policies of SNPAD entail four types of activities:(a) developing information on disaster risks, (b) incorporating disasterprevention and mitigation into planning activities and constructioncodes, (c) strengthening SNPAD institutions, and (d) promoting educa-tion on disaster prevention and mitigation.
Developing information on disaster risks. The DGPAD is responsiblefor building an Integrated Disaster Information System that includesdata on risks and vulnerabilities and networks for surveillance, detection,and early warning. Many networks that are supposed to make up thesystem are run by entities that specialize in related functions. For example,the Colombian Institute of Geology and Mines (Instituto Colombiano deGeología y Minería, INGEOMINAS) is responsible for the seismologicaland vulcanological network; the Institute of Hydrology, Meteorologyand Environmental Studies (Instituto de Hidrología, Meteorología y EstudiosAmbientales, IDEAM) manages the hydrometeorology network; andmayors’ and governors’ offices are responsible for the disaster alert net-works. The DGPAD, CREPADs, and COLPADs are in charge of buildingdocumentation centers that cover their management levels—national,departmental, and municipal, respectively. Risk and threat inventories area central component of the effort to build knowledge about disaster risks.
Living with Natural Disasters 331

Law 9 of 1989 originally mandated such inventories and gave the territorialentities responsibility for carrying them out. Subsequent decrees and policiesspread responsibility for these inventories among various institutions withrelevant expertise. For example, INGEOMINAS is charged with preparingseismological and volcanic risk maps, and IDEAM is responsible forhydrometeorology risk maps.
Incorporating disaster prevention into planning and construction.According to Colombian law, disaster prevention and mitigation consid-erations are supposed to be incorporated into land use, contingency, anddevelopment planning and into construction codes.
Municipalities and CARs share responsibility for incorporating disasterconsiderations into Land Use Plans (Planes de Ordenamiento Territorial,POTs). Municipalities are responsible for including in their POTs detailedinventories of areas at high risk of natural disaster. CARs are responsiblefor verifying that high-risk areas are clearly identified in POTs. Once anarea has been classified as high risk, either the mayor’s office or the CARcan make a determination that the area is unfit for infrastructure or occu-pation. In such cases, by law households in these areas should be relocatedto alternate areas that have been identified by the municipality. Nationalsubsidies can finance some of the relocation, which falls under theresponsibility of the Ministry of Environment, Housing and RegionalDevelopment (Ministerio de Ambiente, Vivienda y Desarrollo Territorial,MAVDT). In addition to identifying areas suitable for resettlement,municipalities are also responsible for identifying locations to be used astemporary housing and shelter facilities in the event of a disaster. Whendisaster actually strikes, the mayor’s office is required to publish a requestfor the temporary (up to one year) occupation of these locations. Theselocations can be purchased or even expropriated by force if necessary. Inconsideration for this use, the municipality must compensate the (publicor private) owner.
For national-level disaster risks, contingency plans are the responsibilityof the National Technical Committee in association with the DGPAD.For regional- and local-level risks, contingency plans are to be preparedby CREPADs and COLPADs and approved by the governor’s or mayor’soffice. In addition, municipalities are responsible for ensuring that publicservices companies (utilities) conduct a vulnerability assessment of theexisting utilities and prepare contingency plans. Municipalities arerequired to request that any public service company planning to constructnew facilities carry out a risk and vulnerability assessment to prevent thebuilding of facilities in high-risk areas.
332 Blackman, Awe, Brandriss, and Urrutia

It is important to incorporate prevention and mitigation considera-tions into planning activities for economic and social development at thenational, departmental, and municipal levels. The Department ofNational Planning (Departamento Nacional de Planeación, DNP) at thenational level is uniquely positioned to incorporate disaster preventionand relief into its Development Plan.
Another planning-related mechanism to complete disaster preventionconcerns construction codes. The PNPAD assigned the responsibility fordefining housing standards to the Colombian Construction Chamber ofCommerce and to the Colombian Society of Construction Engineers,both of which are part of the Permanent Advisory Commission forSeismic Resistant Construction. Territorial entities enforce compliancewith these guidelines.
Strengthening SNPAD institutions. DGPAD and the MAVDT shareresponsibility for strengthening SNPAD institutions at the national level.Strengthening of regional and local entities is to be carried out mainly bythe DGPAD and the MAVDT together with CARs and territorial enti-ties. For assistance institutions such as the Red Cross and the army,responsibility for capacity building is shared among the Ministry ofInterior and Justice, the army, the police, and the Ministry of Health.
Providing Education. Disseminating information about disaster preven-tion and management to public and private sector officials and the publicat large is the responsibility of the National Learning Service, the Ministriesof Education and Environment, DGPAD, CREPADs, and COLPADs.
Assessment of Natural Disaster PoliciesBlackman and others (2005) examined various sources of informationincluding data from interviews and written reports that evaluated theperformance of SNPAD. These sources indicate that SNPAD’s disasterprevention efforts are not sufficient to meet the demands of disaster riskmanagement. Similarly, the generation, management, and disseminationof information on disaster risks, and financing of prevention activities,need to be strengthened.
Insufficient attention to disaster prevention. Stakeholders interviewed byBlackman and others (2005) stated that SNPAD’s design is partly toblame for weak performance in disaster prevention. They stated that, inthe spirit of the 1991 Constitution, one of SNPAD’s defining character-istics is decentralization. A related key characteristic is that many of
Living with Natural Disasters 333

SNPAD’s top institutions—including the National Technical Committee,the CREPADs, and the COLPADs—are composed of preexisting institu-tions. These characteristics have presented advantages and disadvantages.Decentralization has enabled SNPAD to rely on local and regionalresources in addition to those provided by the national government.Moreover, SNPAD’s reliance on existing institutions has enabled keyinstitutions to be constituted expeditiously. However, because most of themembers of important disaster committees work in other capacities thatdo not involve disaster prevention and management, they often havelimited time to tend to their day-to-day responsibilities within SNPAD.Stakeholders interviewed for this study recognized that key disaster com-mittees typically do not actively engage until an actual disaster strikes(Blackman and others 2005).
CONPES 3146 (2001), Freeman and others (2003), and Pollner,Codato, and García (2002) all concurred with the views of the stakehold-ers interviewed—that SNPAD had failed to devote sufficient resources todisaster prevention. The main observation given by Pollner, Codato, andGarcía (2002) to SNPAD is that it focuses disproportionately on disastermanagement instead of prevention. They note that the principal areas inneed of improvement include SNPAD’s ability to (a) assess risks and vul-nerabilities, (b) build capacity for disaster management and prevention atthe local level, and (c) generate nonemergency financing. A document ofthe National Council on Economic and Social Policy (Consejo Nacional dePolítica Económica y Social, CONPES) CONPES 3146, 2001 states thatdisaster management (versus prevention) is typically considered the mainresponsibility of the national, regional, and local disaster committeesdespite PNPAD and other norms that mandate prevention. That analysisconcurs with the assessment of stakeholders interviewed for this study thatSNPAD’s constituent members are typically not focused on participationin the system. According to the CONPES document, the majority ofnational entities in SNPAD have not incorporated this participation intotheir programs and statutes, a fact that limits their commitment to it.According to Freeman and others (2003, p. 8), “… mitigation activitiestend to relate to reconstruction rather than to risk reduction and trying toavoid the perpetuation of vulnerability has been a challenge.”
Poor information and communication. A second set of crosscuttingproblems within SNPAD includes poor information on disaster risks, poorcommunication about such risks, and poor coordination among constituentmembers of the system. As noted, Decree 919 of 1989 mandates that the
334 Blackman, Awe, Brandriss, and Urrutia

DGPAD create a National Disaster Information System. Unfortunately, thisinformation system remains incomplete and suboptimal. Several entitiespossess information that could be incorporated into the system. Forexample, the DGPAD has information on past disasters, IDEAM hashydrometeorological information, the Maritime General Directorate hasoceanographic information, and the National Institute of Health has sani-tation information. However, these information systems are not linked orintegrated. The DGPAD personnel interviewed for this study stressed theneed to gather in a single place all the disaster-related data contained inexisting information systems in Colombia, including those containingenvironmental, hydrographic, sanitation, mining, and oceanographic data.A related concern repeatedly expressed by a variety of interviewees wasthe need for an improved system to allow for effective and timely com-munications among the different members and levels of SNPAD(Blackman and others 2005).
According to Pollner, Codato, and García (2002), Colombia’s informa-tion on disaster risks and vulnerabilities needs strengthening.4 A numberof factors are suggested. For instance, funding for studies and scientificinstruments is inadequate. Many of the studies that do exist containreasonably good scientific and technical information, but do not do agood job of using it to assess risk and vulnerability. Moreover, the studiesoften use inconsistent methodologies and are not technically rigorous.Furthermore, an integrated information system containing, for example,data on costs, death tolls, injuries, damages, and risks does not exist.
CONPES 3146 (2001) supports the overall assessment of SNPAD’sinformation and systems by Pollner, Codato, and García (2002). Accordingto CONPES 3146 (2001), at the national level SNPAD has knowledgeabout disaster threats because it comprises several scientific institutions.However, SNPAD has limited knowledge about physical, social, economic,and cultural vulnerabilities to these threats. For example, SNPAD may havegood seismic maps, but poor information about what these maps imply forpopulations living in earthquake-prone areas.As a result, modeling or quan-tification of the impact of potential disaster risks is difficult. CONPES 3146(2001) also states that, for the National Disaster Information System to bedeveloped adequately, links among SNPAD, the National System of Scienceand Technology, and SINA need to be strengthened. Specifically, the newsystem would need to integrate the following existing information systemsand sources: (a) MAVDT; (b) the Sistema Nacional de InformaciónOceanográfica; (c) the Sistema de Información de Agua Potable y SaneamientoBásico; (d) the Sistema de Potencialidades y Restricciones para el Desarrollo
Living with Natural Disasters 335

Minero-Energético; (e) regional and local systems such as the Sistema deInformación para la Gestión de Riesgos y Atención de Emergencias, Alcaldía deBogotá, and INGEOMINAS; (f) information kept by CARs; and (g) theSNPAD information center.
In addition, CONPES 3146 (2001) cites SNPAD’s lack of an integratedsystem of communication among far-flung constituent institutions, andweak coordination among these members at the national, regional, andlocal levels. According to CONPES 3146, among the most urgent com-munication issues is strengthening the natural disaster monitoring andalert systems (Pollner, Codato, and García 2002). There is also a need forcoordination protocols depending on level of risk.
Both CONPES 3146 (2001) and Pollner, Codato, and García (2002)recommend that SNPAD devote sufficient attention to awareness raisingand public education on disaster risk mitigation.Although some educationefforts exist, a national public education campaign strategy is needed.
Poor coordination. The DGPAD implements policies set by SNPAD andis responsible for its day-to-day operation, including disseminating plansand actions to CREPADs and COLPADs, designing policies and present-ing draft laws and decrees, receiving and directing petitions for declara-tion of emergencies and disasters, executing agreements and contractswith entities that will respond to disasters or emergencies, budget assign-ment, and technical support for disaster prevention and relief.
Several of the stakeholders interviewed for this study by Resources forthe Future researchers at both the national and the regional levels statedthat of the many institutions that make up SNPAD, the DGPAD has thebest understanding of its role and of the procedures that are to be followedduring a disaster. Despite these positive informal evaluations, according toCONPES 3146 (2001), the DGPAD has faced a number of obstacles inrecent years. For example, it has been reformed and restructured repeatedly,generating considerable political, financial, and institutional instability; asa part of the Administrative Department of the Presidency, it had signifi-cantly greater resources and autonomy than it has today as part of theMinistry of Interior and Justice; and while the DGPAD was originallyallocated a budget from general national revenues, its budget now comesfrom the Ministry of Interior and Justice. According to CONPES 3146(2001), the reduction in the DGPAD’s budget and cuts in personnel haveaffected its performance.
The National Technical Committee comprises entities with consid-erable technical and scientific expertise. Nevertheless, according to
336 Blackman, Awe, Brandriss, and Urrutia

CONPES 3146 (2001), committee members do not always have themost appropriate expertise, and sometimes have little influence.
The National Operations Committee is composed of institutions thatfocus primarily on natural disasters, emergencies, and calamities, suchas the Civil Defense, Red Cross, Ministry of Health, and NationalFirefighting Board. According to CONPES 3146 (2001), the NationalOperations Committee has severe financial difficulties because the enti-ties assigned to it typically have minimal operating budgets.
As noted, Pollner, Codato, and García (2002) identify limited local-levelcapacity for risk prevention and mitigation as one of SNPAD’s key defi-ciencies. There is no centralized repository of information on CREPADsand COLPADs, and in fact, according to CONPES 3146 (2001), noevaluation of Colombia’s over 900 CREPADs and COLPADs has everbeen conducted. Therefore, much of the performance data in this studyare derived from interviews with stakeholders in selected areas, includingcoordinators of CREPADs in the Cauca Valley, San Andrés, and Córdoba.Following is a discussion of some of the issues that the CREPADs andCOLPADs face, thus affecting SINA’s performance.
Funding for CREPADs and COLPADS, including salaries of supportstaff members, comes directly from departments and municipalities,respectively. According to stakeholders interviewed for this report, thesefunds are almost always insufficient. Further details on funding areincluded in the next section.
As with many institutions in SNPAD, CREPADs and COLPADs arestaffed by representatives of existing institutions related to natural disasters.This staffing situation has important disadvantages, perhaps the mostimportant of which, according to stakeholders interviewed for this report,is that local disaster committee members typically focus on responsibilitiesother than disaster prevention and management. For example, theCREPAD coordinators interviewed for this study all had high-ranking posi-tions in the governors’ administration, including Department Secretariesand Department Planning Secretaries. While this ranking no doubt imbuesdisaster committee directors with more power and influence than theywould otherwise have, it also implies that their day-to-day responsibilitiestend to crowd out their natural-disaster-related responsibilities.
Interviews with CREPAD directors conducted for this study confirmedthis disadvantage. The directors did not appear to be particularly wellinformed about disaster prevention—most did not have information onprevention activities or projects under way in their departments, whichcould reflect a paucity of ongoing prevention activities. Notwithstanding
Living with Natural Disasters 337

their poor knowledge of disaster prevention activities, the CREPADdirectors interviewed for this study generally had good information onthe budgetary resources allocated for the management of actual disasters.
In principle, CARs should play a vital role in local disaster preventionand management because they are the principal repositories of knowledgeabout the natural, physical, geographical, climatological, and geologicalcharacteristics of the areas under their jurisdiction. However, the actualrole of CARs in local disaster prevention and management appears to belimited. Many of the CAR staff members interviewed for this study (fromthe Autonomous Regional Corporation of Cundinamarca [CorporaciónAutónoma Regional de Cundinamarca, CAR Cundinamarca], theCorporation for Sustainable Development of the Archipelago of SanAndrés, Providencia and Santa Catalina [Corporacíon para el DesarrolloSostenible del Archipiélago de San Andrés, Providencia y Santa Catalina,CORALINA], the Autonomous Regional Corporation of the Sinú and SanJorge Valleys [Corporación Autónoma Regional de los Valles del Sinú y SanJorge, CVC]), were unaware that Law 99 of 1993 assigns the CARsresponsibilities for disaster prevention and risk assessment.
According to stakeholders interviewed for this report, although thereis sometimes a delay in convening CREPADs and COLPADs after anactual disaster, the committees generally operate according to previouslydefined procedures. The governor of the department as head of theCREPAD, or the mayor of the municipality as head of the COLPAD,coordinate the different prevention and management activities and insti-tutions so that the emergency is managed expeditiously.
Evaluation of Funding Requirements and ArrangementsCost implications of natural disasters in Colombia are daunting.Table 10.6presents estimates from Freeman and others (2003) of economic lossesattributable to natural disasters in Colombia and three other countries inLatin America, and financing needs (assuming that countries must coverhalf of the costs of managing natural disasters). They estimate the cost toColombia of each 20-year event at US$2 billion, each 50-year event atUS$5 billion, and each 100-year event at US$8 billion. As mentioned,Colombia is exceptionally vulnerable to natural disasters, a fact thatsupports the high cost for Colombia relative to the other countriesexamined by Freeman and others.
Table 10.7 presents estimates from Freeman and others (2003) of theannualized losses from 20-year to 100-year natural disasters for thestudy countries. The annualized loss is defined as the amount of moneythat the country would need to set aside each year to cover the cost of
338 Blackman, Awe, Brandriss, and Urrutia

these disasters. For Colombia, the annualized loss represents 8 percent ofGDP, or 60 percent of annual government expenditures.
The FNC is clearly the principal domestic source of disaster managementfunding (table 10.8). Of the Col$49 million spent on disaster managementduring 1993 to 2003, 93 percent was provided by the FNC, 5 percent byCOLPADs and CREPADs, 1 percent by other entities such as municipali-ties and private foundations, and less than 1 percent by aid organizations,including the Red Cross, Civil Defense, and army. Because COLPADs andCREPADs do not have their own resources, their contributions must comefrom the entities that comprise them.
Reactive instead of proactive funding. The FNC was initially capitalizedwith direct appropriations from the national budget. The intention wasto create a reliable, stable reserve fund that could be used expeditiouslyin the event of a natural disaster. Recently, however, the FNC’s funding
Living with Natural Disasters 339
Table 10.7 Expected Annualized Loss from 20-Year to 100-Year
Natural Disasters
As % govt.
Country Million US$ As % GDP expenditures
Bolivia 10 12 40
Colombia 85 8 60
Dominican Republic 54 34 180
El Salvador 48 40 220
Source: Freeman and others 2003.
Note: US$1 = Col$2,150.
Table 10.6 Projected Economic Loss from Disasters and Government
Financing Needs
US$ million
20-year 50-year 100-year
Country event event event
Projected loss
Bolivia 200 600 1,000
Colombia 2,000 5,000 8,000
Dominican Republic 1,250 3,000 6,000
El Salvador 900 3,000 4,500
Financing needs (50% of loss)
Bolivia 100 300 500
Colombia 1,000 2,500 4,000
Dominican Republic 625 1,500 3,000
El Salvador 450 1,500 2,250
Source: Freeman and others 2003.
Note: US$1 = Col$2,150.

340 Blackman, Awe, Brandriss, and Urrutia
Table 10.8 Disaster Funding by Source and Year
million 2004 pesos
COLPADs and Aid Mixed aid (CREPAD, Other
Year FNC CREPADs organizations COLPAD, FNC) entities Total
1993 737 38 0 120 0 158
1994 1,511 825 2 14 75 916
1995 3,142 915 0 26 449 1,390
1996 2,456 471 21 149 0 641
1997 252 118 0 52 0 170
1998 6742 22 0 0 0 22
1999 14,065 0 0 23 0 23
2000 4,305 0 0 0 0 0
2001 3,179 29 0 0 0 29
2002 2,902 0 0 0 0 0
2003 6,273 0 0 0 0 0
Total 45,564 2,418 23 384 524 48,913
Percentage 93 5 0 1 1 100
of total
Source: DGPAD 2004.
Note: US$1 = Col$2,150.
arrangements have changed. Instead of a constant infusion of fundsaimed at building up a reserve, the FNC now receives major infusions offunding only after a disaster has occurred. CONPES 3146 (2001) notesthat the new mode of funding generates sudden fiscal destabilizations andslows response time during major catastrophes. Pollner, Codato, andGarcía (2003, p. 466) agree with this observation and identify “cyclicaland sometimes politically driven funding” as one of SNPAD’s majorweaknesses. Table 10.9 shows total budget allocations to the FNC. By farthe largest allocations occurred in 1995 and 1999. However, in 1995roughly 50 percent of the total allocation was additional (following anactual natural disaster).
CONPES 3146 (2001), Freeman and others (2003), and Pollner,Codato, and García (2002) all agree that one important potential sourceof funding—natural disaster insurance programs—has not been exploredin sufficient depth. The main reason is that SNPAD’s efforts have beenprimarily focused on responding to emergencies.
Inadequate funding for prevention. Allocation of SNPAD resources hasbeen disproportionately focused on disaster management instead of pre-vention. According to CONPES 3146 (2001), roughly 80 percent of thetotal budget of the FNC is devoted to disaster management and only20 percent to prevention. For the period from 2001 to 2004, resources used
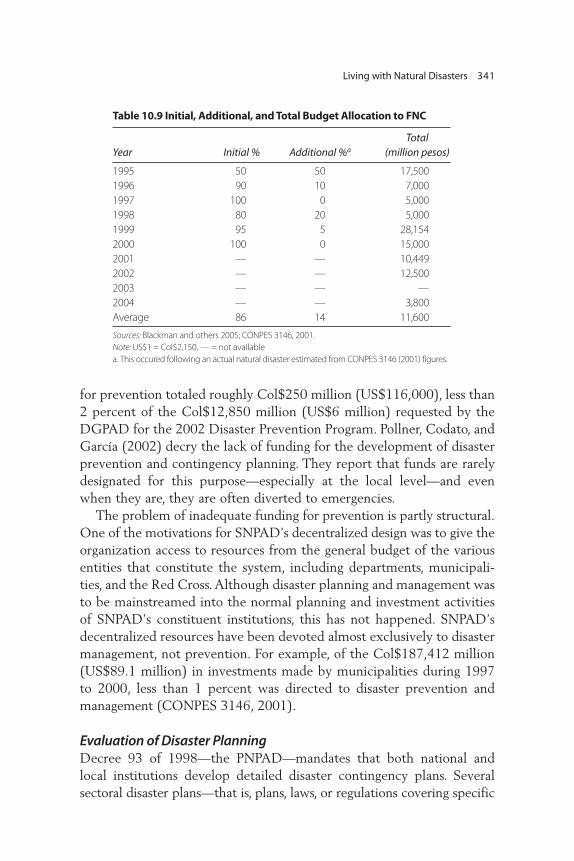
for prevention totaled roughly Col$250 million (US$116,000), less than2 percent of the Col$12,850 million (US$6 million) requested by theDGPAD for the 2002 Disaster Prevention Program. Pollner, Codato, andGarcía (2002) decry the lack of funding for the development of disasterprevention and contingency planning. They report that funds are rarelydesignated for this purpose—especially at the local level—and evenwhen they are, they are often diverted to emergencies.
The problem of inadequate funding for prevention is partly structural.One of the motivations for SNPAD’s decentralized design was to give theorganization access to resources from the general budget of the variousentities that constitute the system, including departments, municipali-ties, and the Red Cross. Although disaster planning and management wasto be mainstreamed into the normal planning and investment activitiesof SNPAD’s constituent institutions, this has not happened. SNPAD’sdecentralized resources have been devoted almost exclusively to disastermanagement, not prevention. For example, of the Col$187,412 million(US$89.1 million) in investments made by municipalities during 1997to 2000, less than 1 percent was directed to disaster prevention andmanagement (CONPES 3146, 2001).
Evaluation of Disaster PlanningDecree 93 of 1998—the PNPAD—mandates that both national andlocal institutions develop detailed disaster contingency plans. Severalsectoral disaster plans—that is, plans, laws, or regulations covering specific
Living with Natural Disasters 341
Table 10.9 Initial, Additional, and Total Budget Allocation to FNC
Total
Year Initial % Additional %a (million pesos)
1995 50 50 17,500
1996 90 10 7,000
1997 100 0 5,000
1998 80 20 5,000
1999 95 5 28,154
2000 100 0 15,000
2001 — — 10,449
2002 — — 12,500
2003 — — —
2004 — — 3,800
Average 86 14 11,600
Sources: Blackman and others 2005; CONPES 3146, 2001.
Note: US$1 = Col$2,150, — = not available
a. This occured following an actual natural disaster estimated from CONPES 3146 (2001) figures.
economic sectors—have been adopted. According to CONPES 3146(2001), however, many have been difficult to develop. For example, theplan for dealing with the impact of El Niño has not been developed ormonitored adequately; there has been considerable difficulty imple-menting the farm insurance law; the law regarding earthquake resistancemandated vulnerability studies in various sectors, but only 20 percent ofhealth care institutions have completed these studies; and the regulationof the transportation of hazardous substances is inadequate.
Development of local contingency plans has also been inadequate. By law,Territorial Development Plans are supposed to contain Local Emergencyand Contingency Plans (Planes Locales de Emergencias y Contingencias,PLECs). Table 10.10 presents data on the number of municipalities thathave been offered capacity-building services by the DGPAD to developPLECs; unfortunately, only one-fourth of all municipalities had adoptedplans, or were in the process of doing so. Table 10.11 presents datareported by the CARs on their adoption of PLECs. These data are notconsistent with those collected by the DGPAD. According to these data,30.2 percent of municipalities in the country have adopted PLECs, not25 percent. Nevertheless, both figures are quite low.
Evaluation of Land Use Plans and Construction StandardsBesides PLECs, Colombian law mandates that different municipal,regional, and national planning mechanisms incorporate disaster preven-tion and management plans. Chief among these are POTs, which mustinclude policies, directives, and regulations regarding the prevention ofnatural disasters, the location of human settlements in high-risk areas,and management strategies for zones in high-risk areas. A preliminaryanalysis conducted by the DGPAD indicated that most of the munici-palities incorporate some disaster planning in the POTs, but a high per-centage do so in a deficient way. Reasons include lack of capacity in dis-aster issues among the staff responsible for POTs.
CARs staff members are responsible for supervising municipal POTs.Among the CARs staff members interviewed for this study, there was aconsensus that disaster planning and management are not appropriatelyaddressed in POTs. Often, the POTs are guided more by political con-siderations than technical ones. Moreover, even when POTs identifyareas as high risk, households and businesses in these areas are rarelyrelocated. In some cases, the mayor’s office has relocated some of thefamilies living in high-risk areas—typically poor families that do not havethe wherewithal to buy property—but new families have moved into
342 Blackman, Awe, Brandriss, and Urrutia

Living with Natural Disasters
Table 10.10 Implementation of PLECs, 1998–2004
Year training Number of PLECs %
Department offered municipalities M I EP CR Total municipalities
Amazonas 2002 2 n.a. n.a. 1 n.a. 1 50
Antioquía 1999 125 6 n.a. 6 39 51 41
Arauca 2002 7 n.a. n.a. 1 n.a. 1 14
Atlántico 2002 23 n.a. n.a. n.a. n.a. 0 0
Bolívar 1999, 2002 45 5 n.a. 1 n.a. 6 13
Boyacá 1998, 2000, 2002 123 n.a. 15 10 n.a. 25 20
Caldas 2002 27 n.a. n.a. 10 4 14 52
Caquetá None 16 n.a. n.a. n.a 1 1 6
Casanare 2002 19 n.a. 1 1 n.a. 2 11
Cauca 2000 41 1 n.a. n.a. n.a. 1 2
Cesar 1998, 2001 25 n.a. n.a. n.a. 1 1 4
Córdoba 2001 28 n.a. n.a. n.a. n.a. 0 0
Cundinamarca 1998 117 n.a. n.a. n.a. n.a. 0 0
Chocó 2001 26 1 1 n.a. 4 6 23
La Guajira 1998, 2002 15 n.a. n.a. n.a. n.a. 0 0
Guaviare None 4 n.a. n.a. n.a. 4 4 100
Guianía 2001 1 n.a. n.a. n.a. n.a. 0 0
Huila 2001 37 n.a. n.a. n.a. n.a. 0 0
Magdalena 2002 30 17 10 n.a. n.a. 27 90
Meta 2002 29 6 n.a. 2 n.a. 8 28
Nariño 2000 63 n.a. n.a. n.a. 37 37 59
Norte de Santander 2002 40 1 n.a. 1 n.a. 2 5
Putumayo 2001 13 n.a. n.a. n.a. 2 2 15
Quindío 2002 12 n.a. 5 n.a. 6 11 92
Risaralda 2000, 2002 14 n.a. 1 n.a. 13 14 100
San Andrés 2002 2 n.a. n.a. 1 n.a. 1 50
Santander 1999 87 n.a. n.a. n.a. n.a. 0 0
Sucre 2002 25 2 n.a. 1 n.a. 3 12
Tolima None 47 1 n.a. n.a. 1 2 4
Valle del Cauca 1999 42 n.a. n.a. n.a. n.a. 0 0
Vaupés None 3 n.a. n.a. n.a. n.a. 0 0
Vichada None 4 n.a. n.a. n.a. n.a. 0 0
Total 1,092 40 33 35 112 220 25
Source: DGPAD 2003.
Note: n.a. = not applicable; M = electronic version; I = paper version; EP = in process; CR = found in CREPAD.
informal (unlicensed, substandard) dwellings in the high-risk areas.According to MAVDT staff members, a percentage of the total subsidiesbudget is allocated to people affected by disasters. This percentage issmall, however, and is only intended for people who have already beenaffected by a disaster, not for relocating those in high-risk areas.

Finally, both the Colombian Construction Chamber of Commerceand the Construction Engineering Society have already produced basicearthquake-resistant standards for housing and infrastructure. Municipaloffices that issue construction permits (Curadurías Urbanas) are chargedwith enforcing these standards. According to interviewees at DGPAD,however, little monitoring occurs after a license has been issued.
344 Blackman, Awe, Brandriss, and Urrutia
Table 10.11 Implementation of PLECs by CAR and Municipality, 2002
Number of Municipalities with PLEC
Entity municipalities Number Percent
CAM 37 0 0
CAR Cundinamarca 104 0 0
CARDER 14 12 86
CARDIQUE 21 0 0
CARSUCRE 19 3 16
CAS 74 0 0
CDA 8 8 100
CDMB 13 11 85
CODECHOCO 31 0 0
CORALINA 2 0 0
CORANTIOQUIA 80 80 100
CORMACARENA 10 0 0
CORNARE 26 0 0
CORPAMAG 30 33 110
CORPOAMAZONIA 31 5 16
CORPOBOYACA 87 0 0
CORPOCALDAS 27 27 100
CORPOCESAR 25 0 0
CORPOCHIVOR 25 0 0
CORPOGUAJIRA 15 0 0
CORPOGUAVIO 8 7 88
CORPOMOJANA 7 7 100
CORPONARIÑO 64 33 52
CORPONOR 40 40 100
CORPORINOQUIA 64 0 0
CORPOURABA 19 0 0
CORTOLIMA 47 47 100
CRA 23 0 0
CRC 41 0 0
CRQ 12 12 100
CSB 24 7 29
CVC 42 0 0
CVS 28 0 0
TOTAL 1,098 332 30.2
Source: Self-reported by CARs to the MAVDT.
Challenges to Disaster PreventionAs noted, natural disasters have significant impacts on human health, theenvironment, and the economy in Colombia. Colombian law creates awide-ranging system of institutions—the SNPAD—to manage disasters.Although this legal foundation is not without weaknesses, the most impor-tant deficiencies in Colombian natural disaster policy clearly arise morefrom poor implementation than from flaws in policy design. Withoutexception, all of the evidence reviewed for this report suggests that themost important general problem in implementing natural disaster policy isinsufficient emphasis on disaster prevention, as opposed to disaster man-agement. This problem has a number of causes and manifestations.
Structural characteristics of the SNPAD. Three basic structural char-acteristics of the SNPAD contribute to a lack of emphasis on disasterprevention. First, because SNPAD has a decentralized organizationalstructure, the regional and local disaster committees—CREPADs andCOLPADs, respectively—bear most of the burden for implementingnatural disaster policy. Inevitably, given regional disparities in overalllevels of institutional capacity within Colombia, some CREPADs andCOLPADs are performing at a lower level than others. In general, thelow-performing committees fail to give adequate attention to naturaldisaster issues except in the event of actual disasters. For example, theyare unlikely to develop disaster contingency plans, to incorporate disasterconsiderations into POTs, to relocate households in high-risk areas, toenforce construction codes mandating earthquake resistance, or to helpraise public awareness about disaster prevention.
Second, SNPAD is composed of all the institutions in Colombia atthe national, regional, and local levels that have a bearing on naturaldisasters. This characteristic, along with decentralization, implies thatcommunication and coordination among the various CREPADs andCOLPADs, and among these institutions and national-level SNPADentities, are complex and costly, contributing to inadequate attention todisaster prevention.
Third, the leading institutions in SNPAD—CNPAD, DGPAD, theNational Technical Committee, and the National Operation Committeeat the national level; CREPADs at the departmental level; and COLPADsat the local level—are composed of representatives from existing institu-tions. The main responsibility of these representatives is not disasterprevention and management, and apparently, they make their disasterresponsibilities a priority only in the event of an actual disaster. The resultis that key SNPAD institutions tend to be reactive rather than proactive.
Living with Natural Disasters 345
Funding. Historically, the FNC has provided over 90 percent of fundingfor disaster prevention and management. However, only 20 percent ofthis funding has been devoted to prevention. Although the originalintention of the framers of the FNC was to create a reserve fund with astable level of funding, in practice, this reserve has been depleted and isonly replenished in the event of an actual disaster.This mode of operationlimits resources available for disaster prevention. An alternative to suchreactive funding is to rely on insurance mechanisms. This strategy hasreceived limited attention, however.
Information. Colombian disaster law recognizes that sound, readilyavailable information on disaster risks and on vulnerabilities to these risksis essential to promoting disaster prevention. However, implementationof information-related mandates has been inadequate. By all accounts,pockets of information on various risks and vulnerabilities exist, but over-all existing data are incomplete, poorly managed and maintained, poorlyintegrated, and not readily available. In addition, the disaster alert andmonitoring system is inadequate, as are efforts to disseminate informationto key institutions (such as COLPADs and CREPADs) and to the publicat large. In sum, Colombia lacks the integrated national disaster informa-tion system mandated by law.
Planning. A key mechanism for promoting natural disaster prevention isto mandate the inclusion of natural disaster considerations into Colombia’sextensive planning process. Municipalities must incorporate disaster con-tingencies into their development plans and POTs. In addition, nationalauthorities are charged with developing disaster contingency plans for keyeconomic sectors such as health care and transportation. Implementationof this strategy has been woefully incomplete, however.
Furthermore, the new Water Resources Management Law should ensurethat the hydrography is maintained by CARs and Urban EnvironmentalAuthorities (Autoridades Ambientales Urbanas, AAUs), particularly inurban areas, and that the recurrence period of the flow rate for flood-proneareas is increased in a cost-effective manner.
Parallels between SNPAD and SINAIn many respects, SNPAD and the SINA are cut from the same cloth.Both were created within three years of the 1991 Constitution, and bothreflect an emphasis on inclusiveness, participation, and decentralization.More specifically, SNPAD and SINA each comprise a system of far-flung
346 Blackman, Awe, Brandriss, and Urrutia

institutions at the national, regional, and local levels. Each system is ledby a set of national-level institutions that set policy; coordinate and monitorinteractions of local institutions; allocate national funds; generate, manage,and disseminate scientific information; and attempt to raise publicawareness about risks of natural disasters. Furthermore, in each system,semiautonomous regional and local institutions with their own sourcesof funding are principally responsible for policy implementation. In bothsystems, decentralization was implemented in part as an effort to relieve thenational government of the financial and administrative burden associatedwith central control.
Given these common characteristics, it is not surprising that SNPADand SINA also share a number of other qualities. In both systems, capacityand performance vary markedly across autonomous regional and localinstitutions; coordination among the members of the systems needsimprovement; and generation, management, and dissemination of criticalinformation need strengthening. Finally, in both systems, the potentialstrategies for addressing these challenges are similar: collection of reliableindicators of institutional performance is necessary to improve coordinationand performance.
Conclusions and Recommendations
This section summarizes the main conclusions of this chapter and providesrecommendations to strengthen natural disaster prevention in Colombia.
Improve Implementation of Natural Disaster Prevention Policies at the Local and National LevelsSeveral of Colombia’s COLPADs and CREPADs do an insufficient job ofimplementing disaster prevention mandates, such as developing contin-gency plans and incorporating disaster considerations into POTs. Toaddress this weakness, reliable, detailed, up-to-date information on thisproblem is needed.Toward that end, the study recommends that DGPAD,supported by a research institute, consider conducting a study of the per-formance of CREPADs and COLPADs. Even more important, DGPADcould develop a permanent system of performance indicators forCREPADs and COLPADS. Local disaster committees would be requiredto annually report the data needed to make this system operational. Itwould be advisable that self-reports be subject to verification.
Once new data on performance are obtained, several measures mightbe undertaken to improve implementation of natural disaster prevention
Living with Natural Disasters 347

policies at the local level. The DGPAD can publicly disclose referenceindicators to raise public scrutiny and accountability. Allocations offunds should conform to priorities established by a risk assessment. TheDGPAD can continue to help build capacity in disaster prevention atCREPADs and COLPADs by developing instructional materials andoffering training and technical assistance. Colombia’s control organizationscharged with ensuring government entities perform their assigned func-tions can step up pressure on departments and municipalities to ensurethat CREPADs and COLPADs are fulfilling their disaster preventionmandates. The executive branch can investigate legal requirements thatmunicipalities and departments spend a certain percentage of their taxrevenue on disaster prevention, and might consider promulgating regu-lations that enable it to withhold transfers of national funds to departmentsand municipalities that are not fulfilling their obligations to implementnatural disaster prevention policies.
Implementation of natural disaster prevention policies could also beenhanced at the national level. As discussed, SNPAD comprises a largenumber of different types of institutions, a feature that makes communi-cation and coordination difficult. One means of mitigating this problemwould be to more clearly define (through new laws, decrees, regulations,or directives) the specific roles of each of the national-level members ofSNPAD. Moreover, as with CREPADs and COLPADs, efforts could bemade to develop data on how well national-level members of SNPAD areperforming their functions, to publicize these data, and to use them tocreate incentives for more effective disaster prevention.
Increase Participation of CARs and Coordination with the SNPAD in Local Disaster PreventionIn principle, CARs should play a vital role in local disaster preventionand management because they are the principal repositories of knowledgeabout the natural, physical, geographical, climatological, and geologicalcharacteristics of the areas under their jurisdiction. Furthermore, Law 99of 1993 assigns CARs the responsibilities for disaster prevention and riskassessment. To improve enforcement of natural disaster managementpolicies, coordination between the CARs that are responsible for envi-ronmental enforcement and the SNPAD needs to be strengthened. Inparticular, increased efforts should be directed at prevention of naturaldisasters, especially floods and landslides, which have been shown in thisreport to occur with highest frequency and to affect the greatest numberof people. Preventive activities might focus on incorporation of prevention
348 Blackman, Awe, Brandriss, and Urrutia

considerations in POTs, improvements in urban drainage, resettlementof populations from areas that are prone to natural disasters, strength-ening of early alert and information systems, and strengthening of regu-lations prohibiting human settlement in areas prone to the risk of naturaldisasters. In addition, synergies between key members of the SNPAD,particularly CARs and regional disaster committees, are underexploited.To mitigate the problem, the DGPAD, the MAVDT, and the controlorganizations might strengthen enforcement of mandates that CARs par-ticipate in disaster prevention and might create stronger incentives forinclusion of disaster considerations in environmental impact assessmentsand environmental licensing.
Implement an Integrated Disaster Information System Colombian lawmakers have long recognized that reliable, up-to-date,readily available data on disaster risks and vulnerabilities, strategies formitigating these risks, and strategies for managing disasters are absolutelyessential for disaster policies to be effective.Yet, despite specific mandates,Colombia still lacks a well-functioning, integrated disaster informationsystem. This gap needs to be filled as quickly as possible. The systemmight integrate oceanographic, hydrological, climatological, and seismo-graphic data systems and other systems deemed appropriate. Datasystems most relevant to areas judged to be high priority by the riskassessment described above might be integrated first. To the extent pos-sible, data in the system could be made available on the Internet.Subcomponents of the system could be made available as quickly aspossible instead of waiting for the entire system to be completed.Adequate resources and effort could be provided to ensure that the systemis well managed and maintained. Protocols might be developed to ensurethe quality and standardization of data collection. Finally, user-friendlyguidance documents on the interpretation, use, and application of thedata might be made available.
Conduct Comparative Risk AssessmentsAlthough SNPAD has developed detailed information on various disasterrisks, only limited efforts have been made to compare the human andeconomic impacts of different types of risks. Given that resourcesavailable for disaster prevention are quite scarce, such comparative riskassessments are urgently needed to ensure that investments in disasterprevention have the greatest possible impact. Risk assessments are neededat the national, regional, and local levels. The DGPAD can periodically
Living with Natural Disasters 349

perform national risk assessments, and CREPADs and COLPADs canperiodically perform similar assessments of the disaster risks in theirterritories. The DGPAD, departments, and municipalities should berequired to use such comparative risk assessments to guide their alloca-tions of financial, human, and technical resources. The DGPAD can takea number of specific steps to make these requirements feasible: it mightimprove data collection and management; it might develop a standardmethodology for comparative risk assessments that is practical, given thecapacity for data collection and analysis that will prevail amongCREPADs and COLPADs in the medium term; it might provide technicalassistance and training in comparative risk assessment by, among otherthings, developing user-friendly training manuals and holding workshops;and it might certify third parties to assist CREPADs and COLPADs incarrying out risk assessments.
Strengthen the Disaster Monitoring and Alert Systems Efforts to integrate and strengthen disaster alert and monitoring systems,including those for seismic activity, volcanoes, flooding, and tsunamis,might be expedited. The comparative risk assessment discussed earliershould be used to establish priorities for this project. Adequate resourcesand effort could be provided to ensure that the system is well managedand maintained.
Enhance Funding for Disaster Prevention Lack of funding for disaster prevention at the national and local levels isan important barrier to adequate prevention. At the national level, it iscritical that the DGPAD and other key entities be assured a reliablesource of nonemergency funding to support the DGPAD’s disaster pre-vention efforts. Options for achieving this goal include reinstating directallocations to the DGPAD from the national budget, possibly entailingrepositioning the DGPAD within the national-level bureaucracy; changingthe operating guidelines of the FNC to ensure that it provides sufficientfunding for prevention activities; mandating that the various members ofSNPAD’s national-level entities, such as ministries and national services,guarantee funding for the participation of their representatives in theSNPAD; and encouraging the DGPAD to make better use of theNational Royalty Fund (Fondo Nacional de Regalías, FNR), internationalsources, and other sources of funding. If needed, the regulations governingthe FNR’s allocation of funds could be amended to facilitate funding fordisaster prevention activities.
350 Blackman, Awe, Brandriss, and Urrutia

At the local level, CREPADs and COLPADs also must have theresources they need to meet regularly—that is, in nonemergency situa-tions—and to undertake disaster prevention. Measures that mightadvance this goal include encouraging the DGPAD, CREPADs, andCOLPADs to make better use of the FNR, international sources, andother sources of funding—the DGPAD could provide guidance toCREPADs and COLPADs on how to raise funds for prevention activi-ties—and directing or encouraging the institutions comprising CREPADsand COLPADs to guarantee funding for the participation of their repre-sentatives in disaster committees.
Investigate Better Use of Insurance to Provide Disaster Management Financing Colombia’s use of insurance and other market instruments to financedisaster management is incipient. The DGPAD might investigate thefeasibility of making better use of such instruments at both the local andthe national levels.
Develop a Prioritized Agenda for Scientific Research on Disaster Risks and Vulnerabilities and Promote Priority Research Areas The integrated disaster information system needs to be supported bysolid scientific information. To ensure that required data are generated,the DGPAD, in consultation with relevant scientific institutions, mightundertake a study to identify gaps in and priorities for scientific researchon disaster risks and vulnerabilities. The results from this study should becombined with those from the comparative risk assessments to developa prioritized agenda for research. To promote the items on this agenda,targeted funding can be made available through existing funding chan-nels or new ones if the existing ones are deemed inadequate. In addition,the National System of Science and Technology can be better integratedinto the SNPAD. Finally, lines of communication between universitiesand other SNPAD institutions can be strengthened.
Enhance Sectoral Contingency Planning The DGPAD might commission a study of progress on sectoral contingencyplanning and use the results in combination with those from the compara-tive risk assessments discussed earlier to develop a prioritized agenda fordeveloping and strengthening sectoral disaster contingency plans. It couldalso ensure that sufficient resources are made available, and sufficient incen-tives are provided, so that planning in key sectors is expedited.
Living with Natural Disasters 351

Create Stronger Incentives for Enforcing Construction Codes The DGPAD should explore ways to strengthen enforcement of disasterprevention provisions in construction codes.
Raise Public Awareness About Disaster Prevention and Management Raising public awareness of disaster prevention will not only advanceprevention directly; it can also generate the political will to pressureSNPAD to reduce vulnerability to natural disasters. Tools for achievingthis goal include mass media campaigns and ensuring that disasterprevention and management are included in educational curricula.
Table 10.12 summarizes the recommendation made in this chapter.
352 Blackman, Awe, Brandriss, and Urrutia
Table 10.12 Summary of Recommendations for Strengthening Prevention
of Natural Disasters
Priority: short (S),
medium (M), Responsible
and long government
Recommendation term (L) agencies
Improve implementation of natural disaster prevention
policies at the local and national levels
Annually report the data needed to put the system S Local disaster
of performance indicators for disaster prevention committees,
into operation DGPAD, MAVDT,
CARs, AAUs,
IDEAM
Build capacity in disaster prevention by developing S MAVDT, CREPADs,
instructional materials and offering training and COLPADs, CARs,
technical assistance AAUs, IDEAM
Increase enforcement of regulations for S Contraloría,
departments and municipalities to ensure that Procuraduría,
disaster prevention mandates are fulfilled MAVDT, DGPAD,
CARs
Establish regulatory mandates that municipalities S Congress, MHCP,
and departments spend a percentage of their MAVDT
tax revenues on disaster prevention
Promulgate regulations that allow the executive S Congress, MAVDT,
branch to withhold transfers of national funds to MHCP
departments and municipalities that are not
fulfilling their obligations to implement natural
disaster prevention policies
Clarify the specific roles of each national-level S Congress, DNP
member of the SNPAD

Living with Natural Disasters 353
(continued)
Table 10.12 Summary of Recommendations for Strengthening Prevention
of Natural Disasters (continued)
Priority: short (S),
medium (M), Responsible
and long government
Recommendation term (L) agencies
Develop data on performance of national-level S–M MAVDT
SNPAD members and make it public
Coordinate actions between CARs and SNPAD
Increase efforts in natural disaster prevention, S Congress, MAVDT,
especially floods and landslides, through DNP
activities that focus on incorporation of disaster
prevention in POTs, urban drainage
improvements, resettlement of populations
from areas prone to natural disasters,
strengthening of early warning and information
systems, and strengthening of regulations
prohibiting human settlement in areas prone
to risks of natural disasters
Strengthen the role of CARs in disaster prevention S DGPAD, MAVDT
Contraloría,
Procuraduría
Create incentives for inclusion of disaster S Congress, MAVDT
considerations in environmental impact
assessments and environmental licensing
Complete an integrated disaster information
system
Complete integrated disaster information M–L MAVDT, CARs,
system DGPAD, IDEAM
Conduct comparative risk assessments
Periodically conduct risk assessments at regional S–M MAVDT, DGPAD,
and local levels CREPAD,
COLPAD, CARs
Require the use of comparative risk assessment
to guide allocations of financial, human, and
technical resources by
• Improving data collection and management L DGPAD, MAVDT
• Developing a standard methodology for L DGPAD, MAVDT
comparative risk assessments
• Providing technical assistance and training in L DGPAD, MAVDT,
comparative risk assessment by developing CARs
user friendly training manuals and holding
workshops
• Certifying third parties to assist CREPADs and L DGPAD, MAVDT
COLPADs in conducting risk assessments

Table 10.12 Summary of Recommendations for Strengthening Prevention
of Natural Disasters (continued)
Priority: short (S),
medium (M), Responsible
and long government
Recommendation term (L) agencies
Integrate and strengthen disaster monitoring and
alert systems
Expedite integration and strengthening of disaster S MAVDT, DGPAD,
alert and monitoring systems (seismic activity, IDEAM
volcanoes, floods, and tsunamis)
Establish priorities for disaster monitoring and alert S MAVDT, DGPAD,
systems based on comparative risk IDEAM
assessment
Provide adequate funding for management and S MHCP
maintenance of system
Enhance funding for disaster prevention
Enhance funding for disaster prevention by
• Changing operating guidelines of the S Congress, MHCP,
FNC to ensure that it provides sufficient DNP, MAVDT
funding for prevention activities
• Encouraging use of FNR, international M MHCP, DNP
sources, and other sources of funding for
disaster prevention
Expedite sectoral contingency planning
Undertake comparative risk assessments to S–M MAVDT, DGPP
develop prioritized agenda for developing and
strengthening sectoral disaster contingency
plans
Source: Authors.
Note: DGPP = Dirección General del Personal Público; DNP = Departamento Nacional de Planeación;
MHCP = Ministerio de Hacienda y Crédito Público.
354 Blackman, Awe, Brandriss, and Urrutia
Notes
1. Allan Blackman, Yewande Awe, Peter Brandriss, and Carolina Urrutia are theauthors of this chapter, which draws heavily from background documents pre-pared for this study by Blackman and others (2005) and Larsen (2005), andfrom the Program Document for the Disaster Vulnerability Reduction FirstPhase Adaptable Program–Loan Number 72930-CO.
2. Colombia’s National Disaster Preparedness and Response Plan (Plan Nacionalpara la Prevención y Atención de Desastres, PNPAD) defines key terms as follows:A disaster is a situation caused by a natural, technological, or human-causedphenomenon that results in intense alteration in people, goods, services, or theenvironment. Prevention is a set of measures put in place to avoid or reduce

Living with Natural Disasters 355
an anticipated event’s impact on people, goods, services, and the environment.Mitigation consists of measures intended to reduce or diminish risk to an accept-able level when it is not possible to eliminate it.
3. ONPAD was originally located in the Administrative Department of thePresidency of the Republic. It was moved to the Ministry of Government byDecree 1680 of 1991. Decree 2035 of 1991 and Decree 372 of 1996 changedthe Ministry of Government into the Ministry of Interior, and Decree 2546 of1999 merged the Ministry of Interior with the Ministry of Justice to createthe Ministry of Interior and Justice.
4. Pollner, Codato, and García (2002) list five areas where information on disasterrisk is relatively strong:
• Detailed seismic maps and preliminary seismic vulnerability studies havebeen developed for Bogotá.
• The Normas de Diseño y Construcción Sismo Resistente (NSR-98) mandatedseismic studies aimed at identifying zones across the country where theprobability of a seismic incident is greater than 10 percent over the next50 years. Accordingly, detailed seismic maps have been developed for thecities of Armenia, Bogotá, and Pereira.
• The cities of Manizales and Tumasco have incorporated risk mitigationinto their political agendas.
• INURBE has commissioned housing condition evaluations that can beused to assess risk and vulnerability to natural disasters.
• The Ministry of Development has prepared maps of areas that are suscep-tible to floods, volcanoes, landslides, and earthquakes in 1,054 municipal-ities (with the help of IDEAM, INGEOMINAS, and Augustín CodazziGeographic Institute).
References
Blackman, Allen, Richard Morgenstern, Libardo Montealegre Murcia, and JuanCarlos Garcia de Brigard. 2005. “Review of the Efficiency and Effectivenessof Colombia’s Environmental Policies.” Final Report to the World Bank,Resources for the Future, Washington, DC.
Charvériat, C. 2000. “Natural Disasters in Latin America and the Caribbean: AnOverview of Risk.” Inter-American Development Bank Working Paper 434,Inter-American Development Bank, Washington, DC.
CONPES (Consejo Nacional de Política Económica y Social). 2001. Documento3146—“Estrategia para Consolidar la Ejecución del Plan Nacional Para laPrevención y Atención de Desastres-PNPAD En el Corto y Mediano Plazo.”
Freeman, Paul, Leslie A. Martin, Joanne Linnerooth-Bayer, Reinhard Mechler, GeorgPflug, and Koko Warner. 2003. “Disaster Risk Management.” Inter-AmericanDevelopment Bank, Sustainable Development Department, Washington, DC.

356 Blackman, Awe, Brandriss, and Urrutia
Larsen, Bjorn. 2004. “Cost of Environmental Damage: A Socio-Economic andEnvironmental Health Risk Assessment.” Consultant Report prepared forMinistry of Environment, Housing and Regional Development, Bogotá.
———. 2005. “Cost-Benefit Analysis of Environmental Protection in Colombia.”Consultant Report prepared for Ministry of Environment and TerritorialDevelopment and ACCI, Bogotá.
Pollner, John, Eleoterio Codato, and C. García. 2002. “Natural DisasterManagement: Vulnerability Reduction and Insurance.” In Colombia: TheEconomic Foundation of Peace, ed. Marcelo Giugale, Olivier Laforcade, andConnie Luff, 463–86. Washington, DC: World Bank.

Colombia is endowed with abundant water resources. Responsibilities forwater policy design and implementation are distributed between theMinistry of Environment, Housing and Regional Development (MAVDT)and local authorities, but because of the abundance of water, water alloca-tion regulations have not been modified since 1978. The current legal andinstitutional framework does not facilitate access to water by small waterusers or vulnerable groups such as indigenous peoples and Afro-Colombiancommunities. Although information on groundwater is scarce, the resourceis used inefficiently and overexploited in some areas. The most importantsources of water pollution are hazardous substances, including toxins andpathogens. The water pollution control regulations and the effluents chargesystem address only organic matter and suspended solids discharged frompoint sources to surface waters, and thus need to be broadened.
Colombia is endowed with abundant water resources.1 It has a nationalaverage freshwater supply of more than 2,100 cubic kilometers, equiva-lent to a supply of about 50,000 cubic meters per capita, a figure that isseveral times larger than that of other Latin American countries such asMexico and Argentina. Figure 11.1 compares the per capita availability offreshwater among these countries, highlighting the wealth of Colombia’s
C H A P T E R 1 1
Water Management in
a Water-Rich Country
357

water resources. Regional and seasonal flow variations and environmentalvulnerability differ considerably among river basins.
In the past two decades, the agricultural zones of a few river basins havebeen affected by water deficits. The Institute of Hydrology, Meteorologyand Environmental Studies (Instituto de Hidrología, Meteorología y EstudiosAmbientales, IDEAM) estimates that by 2030, if watersheds are misman-aged, vulnerability to surface water shortages may pose a significant prob-lem in the Andes and Caribbean regions of the country.
There are over 2.5 million hectares of wetlands and almost 2 millionhectares of floodplains in Colombia. They serve an important role inrecharging and discharging aquifers, controlling floods, retaining nutri-ents and sediments, filtering contaminants, producing biomass, maintain-ing fauna and flora, stabilizing coastlines and microclimates, facilitatingaquatic transport, and providing recreation and tourist attractions. Theyare a vital element in drinking water production, agriculture, fisheriesand other biological resources, forests, and wildlife.
These environmental benefits have diminished with time as a resultof years of poor management of the wetlands, which have been affectedby problems such as draining of marshes and contamination. In addition,construction of infrastructure and effluents from agriculture, fishing, anddomestic sources have contributed to altering important wetland ecosys-tems, including the Ciénaga Grande de Santa Marta, the Zapatosa andTeca Systems, the Ciénaga Virgen, Tota Lake, and the small lakes ofCocha and Fúquene. However, Colombia has achieved considerableprogress in restoring its wetland ecosystems, as shown in Ciénaga Grandede Santa Marta and the Juan Amarillo and Salitre wetlands.
Water pollution is another important problem that affects Colombia’swater resources and limits their use for water supply and recreation, andtheir ecological benefits. Many important rivers, such as Bogotá, Cali,
358 Sánchez-Triana, Brandriss, and Awe
Figure 11.1 Internal Freshwater Resources Per Capita
0
10,000
20,000
30,000
40,000
50,000cu
bic
met
ers
Colombia Brazil Argentina Mexico
Source: World Bank 2005.

Combeima, Otún, Pamplonita, and Pasto, are highly contaminated as aresult of direct discharge of untreated effluents, primarily from industrialcenters. To address the problem of water pollution, wastewater treatmentplants have been constructed in cities such as Medellín and Bucaramanga.
This chapter addresses the issues of allocation of water quantity andwater pollution control, discusses the effectiveness of the policy designfor water allocation and of the design and implementation of water pol-lution control policy,2 and draws a series of conclusions.
Water Quantity
There are five first-order watersheds in Colombia—Caribe, Magdalena-Cauca, Orinoco, Amazonas, and Pacífico. A recent inventory of water-sheds identified nearly 27,000 watersheds larger than 10 square kilometers(km2) and more than 700,000 smaller than 10 km2 (IDEAM 2004). Inthe past two decades, several watersheds have been affected by waterdeficits, including the Bogotá River (Cundinamarca Department), theCesar and Ariguaní Rivers (Cesar Department), the Zulia River (Nortede Santander Department), the Tapias and Rancheria Rivers (La GuajiraDepartment), the Coello-Totare River system (Tolima Department), andthe Palo-Juanchito River system (Valle del Cauca Department) (IDEAM2004; Mejía, Millan, and Perry 1985).
According to IDEAM (2004), water demand in 2003 was 7,435 mil-lion cubic meters. Of this amount, 54.5 percent was for agriculture, 28.8percent for household use, 12.7 percent for industry, 3.1 percent forlivestock, and 0.9 percent for the services sector. The municipalities withgreatest demand were those with substantial rice production: Ambalema,Espinal, and Lérida in the department of Tolima. It is estimated that 14watersheds currently have very high vulnerability to water shortages, andthat by 2030 the situation will worsen in the Andes and the Caribbeanregions because of inadequate watershed planning and management,diminished availability resulting from contamination, rising demand, andclimate change impacts (IDEAM 2004).
Over 30 percent of Colombia’s freshwater is contained in aquifers,making groundwater an important potential supply source. According tothe 2004 IDEAM report, 40 percent of municipalities rely exclusively ongroundwater for their drinking water. Although systematic informationon groundwater is lacking, in general it is used inefficiently, and in a fewareas it is overexploited, including in the Bogotá Savanna, La Guajira,and Córdoba.
Water Management in a Water-Rich Country 359

Main Actors in Water Resources Management Policy DesignThe main entities responsible for water resources management areregional authorities, including departments, municipalities, AutonomousRegional Corporations (Corporaciones Autónomas Regionales, CARs), andUrban Environmental Authorities (Autoridades Ambientales Urbanas,AAUs), which can formulate regulations that are more restrictive thanthose required under national law, but not less.3
The basic legal structure for water regulation is established in Decree-Law 2811 of 1974, which created the National Code for RenewableNatural Resources and Environmental Protection (Código Nacional deRecursos Naturales y de Protección al Medio Ambiente, CNRN), and whichremained the main environmental law for many years. Part III of theCNRN governs issues related to water. Specific regulations are definedand implemented through subsequent decrees. According to the CNRN,virtually all bodies of water belong to the public domain.Therefore, wateris considered private property only when it originates and terminates onthe same piece of private property. In this context, companies and indi-viduals can obtain rights to use surface and groundwater only by law orby concession. When ground or surface waters are in danger of depletionor pollution, pending concessions in that basin or zone can be suspendedand existing concessions can be circumscribed.
Decree 1541, approved in 1978, established regulations related toownership and use of all water resources, including some water quantityprovisions, and established the framework for the national system of waterconcessions.The decree states that all water users must hold water conces-sions issued by the National Institute of Renewable Natural Resources(Instituto Nacional de los Recursos Naturales Renovables, INDERENA).This authority was later transferred to the CARs and AAUs.
Law 99 of 1993 established the Ministry of Environment (Ministeriodel Medio Ambiente, MMA) and assigned to it some responsibilities rele-vant to water management. However, the law did not modify regulationsfor the water sector or management of water resources. Law 99 alsoincreased the number of CARs and extended and redefined their purviewby giving them principal responsibility for monitoring and enforcingwater regulations, including discharge standards and fees. It also estab-lished AAUs in cities with populations greater than 1 million and gavethem responsibilities analogous to those of the CARs.
The Ministry of Environment became the Ministry of Environment,Housing and Regional Development (Ministerio de Ambiente, Vivienda yDesarrollo Territorial, MAVDT) in 2003. The MAVDT is the supreme regu-latory authority for water resources. Its responsibilities include formulating,
360 Sánchez-Triana, Brandriss, and Awe

managing, and coordinating policies, regulations, and programs on drinkingwater, water resources management, wastewater discharges, and sanitation.In collaboration with the Ministry of Foreign Affairs, it is also responsiblefor international cooperation on water-related issues.
The CARs and AAUs are responsible for monitoring and enforcingnational water policies, granting concessions for water rights, and review-ing environmental impact assessments. Departmental and municipalgovernments help the CARs monitor and enforce water pollutionregulations and develop sanitation and wastewater treatment infrastruc-ture. As owners of wastewater treatment plants, municipalities mustcomply with the discharge criteria established by law.
Analysis of Water Resources Management Policy DesignAccording to the CNRN and Decree 1541 of 1978, water should be allo-cated according to the following order of decreasing priority: human con-sumption, preservation of fauna and flora, agriculture, animal husbandry,recreation, industry, and transportation. The CNRN does not take intoaccount that the economic value of water, social preferences, and waterallocation priorities can vary substantially from one region to another.
Decree 1541 of 1978 regulates the procedures for obtaining water per-mits and their associated rights and conditions.According to this regulation,rights to divert surface water or to draw water from aquifers are granted bythe local environmental authorities through water concessions. Obtaining awater concession can take several years, largely because of the cumbersomeprocedures established in Decree 1541 (Amado 2004). In rural areas andmost municipalities, water concessions are granted by the CARs. However,in the largest cities—Bogotá, Medellín, Cali, and Barranquilla—they aregranted by the AAUs.These can be granted for up to 10 years,4 and may betransferred to another beneficiary only if authorized by the CAR or AAU,and without changes to the original conditions of the concession.
Because the CNRN and Decree 1541 of 1978 do not spell out how toapply in practice the legally determined order of priorities for water use,government officials responsible for water allocation are left to make theirown interpretations (Amado and Niño 2004).When users in different sec-tors demand the same water resource, the allocation among them ulti-mately becomes a discretionary decision by the responsible governmentofficial. Often, the most powerful local stakeholders drive local water policyor simply use the resource as they see fit, regardless of its opportunity cost.
Decrees 2857 of 1981, 1933 of 1994, and 1729 of 2002 mandate CARsto create Watershed Administration and Management Plans (Planes deOrdenamientos y Manejos de Cuencas Hidrográficas, POMCAs). These plans
Water Management in a Water-Rich Country 361

must include provisions regarding land use zoning, development of waterresources infrastructure, allocation of water resources,water pollution control,and conservation of water bodies.
Some CARs charge fees for water use based on the legal authority ofArticle 159 of the CNRN and subsequent laws and decrees. Becausethese legal instruments do not provide specific criteria, the CARs decidewho to charge and how to set the fees, resulting in inconsistency acrossthe country. For example, since 1999 the CAR Cundinamarca chargedBogotá Water and Sewer Company (Empresa Acueducto y Alcantarilladode Bogotá, EAAB) and some small agricultural irrigation systems of theregion for using water (Amado 2004), but did not charge the beneficiariesof the La Ramada Irrigation District, which was under the administra-tion of the CAR. In 2003, the CAR Cundinamarca collected aboutCol$11,100 million (US$5.2 million) in water fees, about 83 percent ofwhich was paid by EAAB alone. EAAB sued the CAR Cundinamarca torecover all its payments related to water fees, and challenged some ofthat CAR’s decisions related to water allocation (Niño 2004).
Water fees are correlated with socioeconomic conditions and wateravailability. In the municipality of Subachoque, the water fee for irriga-tion purposes was Col$12 (US$0.006) per cubic meter, while the fee paidby EAAB varied between Col$72 (US$0.033) for water taken from theBogotá River to Col$127 (US$0.059) for water taken from the TeusacáRiver (Niño 2004), which represents between 10 and 18 percent of theprice of drinking water.
Until December 2003, based on Resolution 259 of 1997, theEnvironmental Administration Department (Departamento Administrativodel Medio Ambiente, Bogotá, DAMA) charged a fee for the use of ground-water within the Bogotá city limits. Like the water fees charged by CARCundinamarca, this fee had its legal origin in the CNRN, and variedbetween Col$148 (US$0.07) and Col$305 (US$0.14), depending on thedepth of the water table.5 Water fees collected by DAMA in 2003amounted to US$700,000.6
In 2003, the Colombian Farmers Society sued over the water fees thatsome CARs had been charging since 1984 based on Articles 159 and 160of the CNRN. In December 2003, the Constitutional Court declaredthat those articles of the CNRN had been replaced by Article 43 of Law99 of 1993, and that therefore the water fees could no longer be chargeduntil specific regulations based on Law 99 were approved.
During 2002 and 2003, the MMA held a series of meetings in whichgovernment and industry stakeholders discussed proposals for new
362 Sánchez-Triana, Brandriss, and Awe

regulations to implement Article 43 of Law 99 on water fees. The meet-ings produced feedback and proposals from representatives of the min-ing and manufacturing industries, aquaculture, water utilities,hydropower, petroleum, agriculture, CARs, and the National Parks Unit(Universidad de los Andes 2004), but did not include participation bycivil society groups, communities, and nongovernmental organizations.Based on the proposals made by the participating stakeholders, the MMAdrafted and issued new regulations through Decree 155 of 2003 andResolution 240 of 2004. Quantitative studies of the social value of waterwere not taken into account by the MMA, and the new fees were set solow that the CARs were unconvinced that it was financially justifiable toeven collect them (Alvarez 2004).
According to the new regulations, the minimum price for a cubicmeter of water in Colombia was set at Col$0.5 and the maximum pricewas set at Col$3.5, less than 3 percent of what the CAR Cundinamarcahad been charging for water from the Teusacá River and about 1.5 per-cent of what DAMA had been charging for groundwater. This new fee isless than 1 percent of the marginal value of water for the industrial sec-tor of Colombia (Cruz, Uribe, and Coronado 2003), and between 1.5 and6.5 percent of the marginal contribution of water to production of pota-toes and peas in one municipality of the Bogotá Savanna (Ersulien 2003).
Effectiveness of Policy ImplementationThe case study of the allocation of water resources in the BogotáSavanna presented in box 11.1 illustrates the effectiveness of the imple-mentation of the water resources management policy in one of the mostvulnerable watersheds in the country. Although this is by far the largestpopulation affected by limited water supply, and is not typical of most areaswhere water quantity is not an immediate concern, the same institutionaldynamics are at work throughout the country: for all water resources,small farmers do not have access to the allocation of water rights—theygo instead to the big, powerful users—and this calls for a major moderniza-tion effort.
Although the CNRN made human consumption and ecosystem con-servation the highest priorities for water allocation, neither the CNRNnor Decree 1541 of 1978 created guidelines or procedures for balancingcompeting priorities and resolving conflicts. Therefore, government offi-cials responsible for water allocation, mainly in the CAR Cundinamarca,were left to make their own interpretations and decisions (Amado andNiño 2004), with limited opportunity for administrative or legal appeal.
Water Management in a Water-Rich Country 363

364 Sánchez-Triana, Brandriss, and Awe
Box 11.1
Case Study of the Allocation of Water Resources in the Bogotá Savanna
This case study analyzes the allocation of water resources among different stake-
holders in the Bogotá Savanna, and corresponding policy and institutional im-
plications. Although the government was able to prevent water scarcity for
large users—primarily through a series of supply-side engineering solutions—
in general, current institutions and regulations do not respond to the realities
and needs of small water users such as farmers, and cannot guarantee them
equitable access to water, protection of their formal water concessions, partici-
pation in decision making, or access to mechanisms for resolving conflicts.
The watershed. The Bogotá Savanna covers 4,200 square kilometers on a
plateau 2,560 meters above sea level in the Andes. The main waterway in the
savanna is the Bogotá River, which provides water for irrigation and domestic
consumption and is used for electricity generation as it leaves the high savanna
and descends toward the lowlands of the Magdalena watershed. The savanna
is the most industrialized and densely populated region of Colombia, generating
27 percent of gross national product, including 72 percent of industrial output.
The city of Bogotá has a population of about 6.8 million (roughly 15 percent of
the national total), and is growing at more than 2 percent per year (DANE 2004).
The other 19 municipalities in the savannah have a combined population of
nearly 900,000, and their industrial production is growing at a rate of 4.4 percent
per year, compared to a rate of 2.3 percent per year for Bogotá itself.
The savanna is also an important agricultural region. It produces 2.2 million
liters of milk a day, worth US$136 million per year; accounts for 85 percent of
national flower production, with an annual value of US$600 million; and is the
country’s main producer of fresh vegetables (Asocolflores 2005; CEDE of
Universidad de los Andes 2003; DANE 2002). The average annual precipitation in
the savanna varies from as little as 700 millimeters (mm) in some areas to more
than 1,900 mm in the municipalities with the heaviest rainfall (Rodríguez 2003;
SGC 1998 ). Water yields in the Bogotá River watershed vary between 10 liters per
second per square kilometer (l/s/km2) and 25 l/s/km2. Water scarcity in rural areas
of the savanna is most severe during January, February, July, and August.
There are two main aquifers in the Bogotá savanna, the Acuífero de la Sa-
bana (Savanna Aquifer) and the Acuífero Guadalupe (Guadalupe Aquifer). The
Savanna Aquifer water table lies at about 400 meters, yields about 5 liters per

Water Management in a Water-Rich Country 365
second per well, and supplies nearly 80 percent of the region’s consumption of
groundwater. The Guadalupe Aquifer lies between 800 meters and 1,300 me-
ters and can yield 20 liters per second per well.
Historical perspective. By the late 1940s, Bogotá officials were becoming
concerned about possible water shortages and decided to build an aqueduct
and treatment plant in the upper basin of the Bogotá River (Rodríguez 2003).
The new infrastructure, brought on line in 1959, gave the EAAB the capacity
to deliver an additional 3 cubic meters per second (m3/s) of drinking water
(eventually expanded to 6 m3/s).
With the population of the Bogotá Savanna at 1.4 million and growing,
EAAB foresaw that water demand by 1970 could not be met solely with the re-
sources available from the Bogotá River watershed. To meet the anticipated
demand, EAAB built the Chingaza system to divert water to the Bogotá Savanna
from several rivers across the continental divide in the upper reaches of the
Orinoco River basin. This system began operation in 1985 and currently supplies
14 m3/s (Ingetec 2003). The two main sources of demand, besides domestic
and commercial consumption handled by EAAB, were for generation of
hydroelectric power for the Bogotá Energy Utility (Empresa de Energía de
Bogotá, EMGESA) and for agricultural use in the La Ramada irrigation district.
EMGESA generates electricity through a series of power plants on the lower
Bogotá River, downstream from the savanna. In 1967, the energy company built
the Tominé reservoir in the upper basin of the Bogotá River to regulate water
flow to the downstream power plants. The economy of the Bogotá Savanna was
critically dependent on this energy until the mid-1990s, when a national electric-
ity market was created that allowed energy to be transferred to Bogotá from the
Guavio hydroelectric complex (inaugurated in 1985) in the Orinoco watershed.
The La Ramada irrigation district covers 6,215 hectares on the west bank of the
Bogotá River opposite Bogotá, and mainly serves dairy farms and vegetable grow-
ers. It was created in 1961 and is administered by the CAR Cundinamarca, which is
responsible for allocating water among the irrigation district’s members. La
Ramada takes 0.6 m3/s from the Bogotá River upstream of the convergence with
the El Salitre River (CAR 1995). The flower industry is not included in the irrigation
district because it mainly uses water from underground sources.
Surface water balance. A complex system of water reservoirs, tunnels, gates,
canals, aqueducts, and valves in the Bogotá Savanna allocates water among
various major users. The flow of water to different parts of the system and for
different uses is controlled by releasing water from a series of reservoirs. The final
(continued)

366 Sánchez-Triana, Brandriss, and Awe
outflow from the Bogotá Savanna is used to generate electricity along the lower
watershed as the river descends toward the lower Magdalena Valley. In some
cases the water can be used more than once (for example, domestic consump-
tion and hydropower generation), but some uses exclude reuse (irrigation).
The table below summarizes information on surface and groundwater
consumption in the Bogotá Savanna provided to Universidad de Los Andes
researchers by the EAAB, the CAR Cundinamarca, and the DAMA. The table
shows that the largest water user in the region is EAAB and that there are sig-
nificant gaps in the information available about water supply and use in the
region, particularly regarding water consumption by small users. Information
on groundwater and smaller surface water resources is also incomplete. CAR
information on the hydrology of small streams and creeks is inadequate or
nonexistent, and information on the number of water permits granted and
the amount of water allocated by CAR Cundinamarca in the Bogotá Savanna
has not been consolidated.
As for groundwater, the CAR Cundinamarca estimates that there were about
3,500 wells in the Bogotá Savanna in 1990 (the most recent year for which data
Main Sources and Demands for Water in the Bogotá Savanna
Mean flow Uptake
Source (m3/s) User (m3/s)
Tunjuelito River 4.4 EAAB 1.1
(Bogotá watershed) Small usersa Unknown
Mining Unknown
Bogotá River 9 EAABb 4.5
La Ramada 0.6
Irrigation District
Small users a Up to 4.7
Guaitiquía, Chuza, and Frio 14 EAAB 11
Rivers (Orinoco watershed) Other users 0
Other tributaries of the Unknown Small users a Unknown
Bogotá River Municipalities Less than 1.5
Groundwater Unknown Large industry 0.14
in Bogotá Small industries 0.02
and services
Groundwater Unknown Flower industry 0.84
in rural areas Municipalities Unknown
Others Unknown
Sources: Information provided to Universidad de los Andes researchers by EAAB, CAR Cundinamarca
and DAMA in written materials and interviews.
a. Agriculture, livestock, fisheries.
b. The amount includes 0.6 m3 sold by the EAAB to municipalities in the Bogotá Savanna.
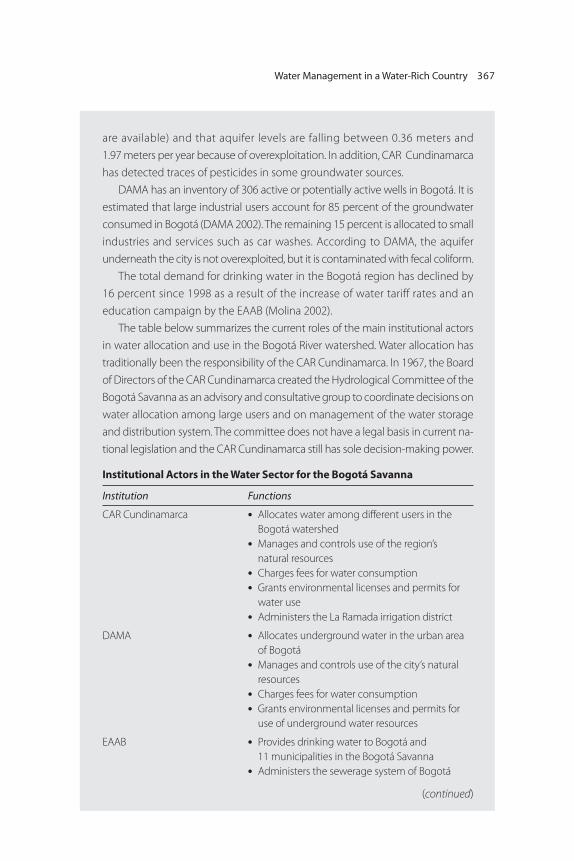
Water Management in a Water-Rich Country 367
are available) and that aquifer levels are falling between 0.36 meters and
1.97 meters per year because of overexploitation. In addition, CAR Cundinamarca
has detected traces of pesticides in some groundwater sources.
DAMA has an inventory of 306 active or potentially active wells in Bogotá. It is
estimated that large industrial users account for 85 percent of the groundwater
consumed in Bogotá (DAMA 2002). The remaining 15 percent is allocated to small
industries and services such as car washes. According to DAMA, the aquifer
underneath the city is not overexploited, but it is contaminated with fecal coliform.
The total demand for drinking water in the Bogotá region has declined by
16 percent since 1998 as a result of the increase of water tariff rates and an
education campaign by the EAAB (Molina 2002).
The table below summarizes the current roles of the main institutional actors
in water allocation and use in the Bogotá River watershed. Water allocation has
traditionally been the responsibility of the CAR Cundinamarca. In 1967, the Board
of Directors of the CAR Cundinamarca created the Hydrological Committee of the
Bogotá Savanna as an advisory and consultative group to coordinate decisions on
water allocation among large users and on management of the water storage
and distribution system. The committee does not have a legal basis in current na-
tional legislation and the CAR Cundinamarca still has sole decision-making power.
Institutional Actors in the Water Sector for the Bogotá Savanna
Institution Functions
CAR Cundinamarca • Allocates water among different users in the
Bogotá watershed
• Manages and controls use of the region’s
natural resources
• Charges fees for water consumption
• Grants environmental licenses and permits for
water use
• Administers the La Ramada irrigation district
DAMA • Allocates underground water in the urban area
of Bogotá
• Manages and controls use of the city’s natural
resources
• Charges fees for water consumption
• Grants environmental licenses and permits for
use of underground water resources
EAAB • Provides drinking water to Bogotá and
11 municipalities in the Bogotá Savanna
• Administers the sewerage system of Bogotá
(continued)

368 Sánchez-Triana, Brandriss, and Awe
• Conserves ecosystems critical for water supply
and regional hydrological functions (páramos,
wetlands, and watersheds)
• Provides flood prevention and control in the city
of Bogotá
EMGESA • Generates and buys energy, mainly for Bogotá
and its neighboring municipalities
Municipalities around Bogotá • Buy services and resources from the water and
energy utilities
La Ramada Irrigation District • Uses water from Bogotá River, mainly for dairy
production and vegetable growing
Other rural users • Use water from surface and underground
sources for aquaculture, cattle ranching, recre-
ation, and so forth
National Parks Unit and EAAB • Administer Chingaza National Park (site of Chuza
reservoir)
Source: Universidad de los Andes 2004.
The creation of the Hydrological Committee, at a time when there was not suf-
ficient water and infrastructure available to satisfy the needs of large users in the
region (Rodríguez 2003), illustrates how institutions emerge when there is a
social need for them. The solutions implemented reflect initiatives by local
institutions to develop forward-looking strategies supported by technical
information. However, the committee included only the three major water
users. Communities, municipalities, small farmers, and other stakeholders were,
and continue to be, excluded from the committee.
Source: This case study is largely drawn from a background paper prepared for this report by the of
Universidad de los Andes (CEDE of Universidad de los Andes 2003).
The Bogotá Hydrological Committee has resolved many short-termwater shortage issues, and reforms in the mid-1990s created a nationalelectricity market. Perhaps the most important remaining function of thecommittee is to coordinate reservoir and water flow management to pre-vent flooding during extreme rainfalls (Niño 2004).
The Hydrological Committee has not traditionally dealt with thewater needs of small users in rural areas of the Bogotá Savanna, whichis the responsibility of the CAR. While it is estimated that more than70 percent of small users do not hold water permits and there is noinformation on their actual water consumption, occasionally the sum ofthe permits held is greater than the available flow (Amado 2004). Thelow number of permits and the lack of links between concessions andactual water supply could be attributable to the cumbersome procedures

established by Decree 1541 of 1978, centralization of the concessionprocess, insufficient human resources in the CAR Cundinamarca, limitedenforcement and control capacity, and the fact that water fees are chargedonly to legal users (permit holders).
As a result of measures to address water supply concerns over the past25 years, the industrial sector does not consider water availability, price,or quality to be limiting factors in its development and investment plansin the Bogotá Savanna. However, small rural water users face scarcityevery year during the dry months (January, February, July, and August),particularly in the center and the far north and south of the BogotáSavanna, where annual precipitation is less than 800 millimeters (mm).Small users also lack the allocation mechanisms and access to judicialappeal enjoyed by large water users.
Finding long-term solutions to the problems of small water users hasnot been a priority for local, regional, or national environmental author-ities, and information on water supply and demand in the region’s smallerwatersheds is generally nonexistent. Obtaining a legal water concessionis a long, cumbersome, centralized, and costly process for small users atthe local level (Camargo 2004), and there is no public participation inwater allocation policy for small users. In addition, for small users, thecurrent legal and institutional framework does not provide transparent andequitable access to water, protection of rights, or resolution of disputes.Without a decentralized institution that can ensure efficient allocation,monitoring, and enforcement at the community level, water conflictsamong farmers will remain common.
Watershed Administration and ManagementAlthough CARs throughout Colombia are required by law to createPOMCAs, the degree of compliance is difficult to evaluate. Availableinformation suggests that only a few watersheds have such plans, thereis no clear rationale for which watersheds have them, and there is noeffective monitoring or enforcement of the plans. According to IDEAM,between 1998 and 2002, 21 of the 33 CARs formulated 145 newPOMCAs covering 20,000 square kilometers, or less than 2 percent ofthe national territory. Of these plans, 49 were for watersheds that supplymunicipal drinking water systems.
Of the 40,672 new water concessions reported to IDEAM for theperiod from 1998 to 2002 by 30 of the CARs, nearly 60 percent werefor human consumption, about 23 percent were for agriculture and live-stock, 2.4 percent for hydropower, 1.9 percent for industry, 1.4 percent
Water Management in a Water-Rich Country 369

370 Sánchez-Triana, Brandriss, and Awe
Table 11.1 New Water Concessions by Sector, 1998–2002
Sector Number of concessions
Domestic 24,119
Agriculture and livestock 9,333
Other sectors 4,805
Hydroelectric generation 978
Industry 777
Mining 660
Total 40,672
Source: IDEAM 2004.
for mining, and 11.0 percent for other sectors (table 11.1). The greatmajority were in Antioquía and the Cauca Valley, which together grant-ed about 60 percent of the concessions; Cundinamarca accounted foranother 12 percent. Because few parts of the country face water short-ages, this concentration likely reflects the level of economic develop-ment and institutional capacity more than the need to promote rationalwater allocation or conservation in a particular area or sector. In any case,nationwide or region-specific data that could help assess the implemen-tation and impacts of water concessions remains elusive, thwartingattempts to incorporate lessons and experience from water concessionsinto effective planning, analysis, and policy formulation.
Degradation of Water Bodies
Degradation of wetlands through poor management and lack of knowledgeabout their function and services has led to reductions in the environmentalbenefits they provide. Degradation of water bodies; draining of marshes;and contamination from industry, agriculture, fishing, and domesticsources have altered important wetland ecosystems. In the ColombianPacific, which has the country’s largest areas of land covered by man-groves, a net reduction of 5 percent (nearly 14,000 hectares) of man-grove coverage is estimated to have occurred between 1969 and 1996(INVEMAR 2002).
Yellow fin tuna accounts for an estimated 80 percent of the nationalfish capture, and for almost Col$172,000 million (US$80 million) inincome generated in 2005 (IDEAM 2005). Most fish captures originatefrom the Pacific coast. However, overfishing of other marine species suchas white, tiger, and red shrimp; lobster; and queen conch continues to bea problem and has led to declines in captures. In addition, coastal water

Water Management in a Water-Rich Country 371
ecosystem interventions contribute to the observed decline. Furthermore,degradation of water quality from the discharge of ballast and bilgewater from ships, accidental petroleum and toxic substance spills, thedumping of domestic wastewater, and sediment transport from riversand canals such as the Dique have also contributed to the observeddecline in captures. In the Ciénaga Grande de Santa Marta, fish capturesdecreased from 8,000 tons in 1972 to 1,800 tons in 1989.
During the 1960s, fish captures in the Magdalena-Cauca basin wereestimated at about 100,000 tons per year, but decreased in the 1990s toalmost 9,000 tons per year (Colorado State University 2004; Escobar2004). The decrease of fish capture in inland areas, especially theMagdalena and Cauca River basins, is attributable to a variety of reasonsincluding drainage of wetlands and marshes, use of inadequate fishingequipment, channel blockages, salinity changes in mangrove ecosystems,and water pollution. The main wetlands and rivers associated with fishproduction are located principally in the Caribbean region and in thebottoms and high plains of the Orinoquía.
Policy DesignThe main tools provided in Colombia’s policy to control degradation ofbodies of water are the POMCAs, established by Decrees 2857 of 1981,1933 of 1994, and 1729 of 2002, and the environmental licensingprocess. To obtain a license, projects that have potentially negative envi-ronmental impacts are required to conduct an environmental impactassessment and hold a public hearing. Licenses specify the manner inwhich water users will control water degradation. The licensing process,however, does not capture the degradation of bodies of water as a resultof non-project-related activities such as urban and rural runoff, urbanexpansion and encroachment, and unsustainable agricultural practicesincorporating the use of fertilizers and pesticides.
At the national level, one of the few political instruments aimed atconservation of wetlands is the Wetlands Convention (Ramsar) ratifiedby the Colombian Congress.The objective of the convention is to promotethe conservation and rational management of wetlands. To this end, thegovernment established the following Ramsar areas: 400,000 hectares ofthe Delta Estuarino of the Magdalena River, Ciénaga Grande de SantaMarta in 1998; 39,000 hectares of the La Cocha lagoon in 2001; and8,888 hectares in the delta of the Baudó River in 2004. In 2001, theMMA issued the National Interior Wetlands Guideline, which establisheda framework for the management of wetland ecosystems at the national,

372 Sánchez-Triana, Brandriss, and Awe
regional, and local levels. This guideline suggests generic approaches forthe management of wetlands and introduces concepts such as the creationof social criteria and community participation in wetland management.
Governmental Agencies Responsible for Controlling the Degradationof Bodies of Water The MMA is responsible (under Law 99 of 1993) for defining policiesfor water resources management, including the control of wetland degra-dation. Law 99 also assigns the ministry the task of setting fishery quotasand total allowable catch from a fish stock. In addition, it assigns theCARs the function of authorizing the use (including recreational use) ofrenewable natural resources and the practice of activities that can affectthe environment; the concessions for water usage and sport fishing seasons;and the application of corresponding sanctions. According to Law 99of 1993, the entities within the National Environmental System respon-sible for implementing the policies previously defined by the nationalgovernment are the governmental environmental authorities (MAVDT2006, p 10).
Policy ImplementationSeveral CARs have established POMCAs that include wetland restora-tion and conservation activities.7 An example is the restoration of urbanwetlands in the Bogotá metropolitan area. In 1900, there were over50,000 hectares of wetlands8 in Bogotá. By 1998, wetlands had decreasedto a mere 800 hectares (Rodríguez 2003). Among those 800 hectares,the Juan Amarillo wetland alone retains 40 percent of the city’s stormwaters (Rodríguez 2003). Other environmental services provided by thesewetlands include sediment retention; aquifer replenishment; nutrient recy-cling; and habitat provision for endemic, resident, and migratory species.
Innovative approaches for the restoration of Bogotá’s wetlandswere implemented through a World Bank–funded water and sewerageproject. The objective of the project was to reestablish the ecologicaland physical corridors of the most important ecosystems of the savanna.The project covered the San Rafael ecological park; the Molinos,Córdoba, Rionegro, and Salitre canals; the Córdoba, Juan Amarillo,and Jaboque wetlands; and the riparian zone of the Bogotá River.Through the project, public space was increased by the addition ofover 400 hectares of green areas. In addition, 43 kilometers of pedestrianpaths and 37 kilometers of bike paths were constructed, and 228 hectaresof wetlands were restored (Rodríguez 2003). Two green areas stand

out: the Humedal de Juan Amarillo and the Paseo Río Salitre, whichthe Chief Executive Officer of the Bogotá Water Utility considers oneof the longest urban environmental corridors in Latin America(Alvarez 2004).
The Ciénaga Grande de Santa Marta (CGSM) is located in thedelta of the Magdalena River and is inhabited by 30,000 peoplewhose main livelihood is fishing. During 1956–95, the area of landcovered by mangrove forests fell from 511 km2 to 225 km2 (IDEAM 2002).In 1995, the government implemented a project to reestablish waterflows in the CGSM by opening the Aguas Negras, Alimentador,Almendro, Clarín, Renegado, and Torno channels with a view to con-nect the Magdalena River with the wetland. These efforts led to anincrease of almost 53 km2 in mangrove-covered areas during 1995 to 2001.Furthermore, the implementation of hydraulic works in the AguasNegras, Clarín, and Renegado channels has lessened the pace of dete-rioration of the ecosystems, evident in reduced salinity of marshes andrecovery of vegetation.
Water Pollution Control
IDEAM (2004) has recognized that information collection on and man-agement of ambient water quality in Colombia is insufficient. Althoughmonitoring stations do exist for selected rivers and aquifers, coverage islimited and data collection and management are not standardized. As aresult, assessment of the state of water quality at a national level is incom-plete.Water pollution is evident in several rivers: Bogotá, Cali, Combeima,Medellín, de Oro, Otún, Pamplonita, and Pasto. Water pollution fromtoxic substances and pathogens is deleterious for drinking water and forwater used in recreation, biodiversity, and agriculture.
Toxic and Pathogenic PollutionThe discharge of toxic substances, pathogens, and other hazardouswastes into bodies of water is the main cause of water pollution. Mosttoxic and hazardous pollutants come from agricultural and industrial dis-charges, which may have cumulative and persistent consequences.Hospital, livestock, and agroindustrial wastes contain bacteria, protozoa,and other pathogenic microorganisms that pose severe health risks toanyone consuming the water directly or through agricultural productsirrigated with it. Key causal factors in groundwater pollution includeagricultural runoff, septic tanks, and landfills.
Water Management in a Water-Rich Country 373

The agricultural sector discharges large amounts of pesticide pollutants.Even though problems of nonpoint-source water pollution are generali-zed worldwide, preliminary estimates suggest that the application of pes-ticides on the 1.2 million hectares in Colombia dedicated to agricultureare two to three times greater than the amounts recommended by themanufacturers and used in other regions, suggesting that in these areasthe problems of runoff pollution and agricultural percolation are critical(DNP 1995).
Most toxic wastewater discharges in Colombia come from the improperdisposal of solid waste and hospital waste and from runoff from fertilizers,pesticides, and industrial waste, particularly from petroleum refineries,the chemical industry, and leather tanneries. The inadequate disposal ofsolid waste results in leachates with high concentrations of toxic residuessuch as phenol, chromium, lead, and mercury. Sanitary landfills in Bogotáand Medellín are illustrative. In Bogotá’s Doña Juana landfill, for example,high concentrations of toxic compounds have been registered, such asphenol (3.91 milligrams per liter [mg/l]), chromium (1.12 mg/l), lead(0.41 mg/l), and mercury (0.004 mg/l) (DNP 1995).
The use of polluting technologies in the manufacturing industry—suchas those traditionally used in tanneries, electroplating, metal smelting, palmoil extraction, distilleries, chlorine and soda ash production, oil refineries,and petrochemical plants—or in slaughterhouses and freezers promote thewaste of prime material and high production of residual waste. The chemi-cal, electroplating, paper processing, and tannery industries also dump toxicsubstances such as cadmium, chrome, lead, mercury, nickel, and organicchloride compound wastes in uncontrolled conditions.
Crude oil spills from acts of sabotage by terrorists have becomeanother cause of water pollution in the country. The most affectedecosystems have been slow-moving bodies of water such as wetlandsand low-flowing creeks. The areas damaged by these oil spills are locatedmainly in the Araucana high plains area of the Catatumbo River basinregion, which is very steep and rich in streams, ravines, and tributaryrivers; the mid-valley and low-valley plains of the Magdalena River(primarily in the departments of Santander, Cesar, and Sucre); and inthe departments of Putumayo and Nariño, where the mountainousconditions have hindered efforts to control the oil spills effectively.
In the Catatumbo basin, as in most cases, the spills have reached largerbodies of water such as the Sardinata, Tarra, and Catatumbo rivers. Themost difficult spills to control and manage have occurred in theMagdalena plain. The expansion of crude oil has compromised as much
374 Sánchez-Triana, Brandriss, and Awe

Water Management in a Water-Rich Country 375
as 1,000 hectares of lentic (still) water, nearly 40 kilometers of lessimportant rivers (such as the Simaña River), and some 150 kilometers ofcanals and secondary or seasonal streams, in which groundwater contami-nation becomes more relevant than that of surface water.
In the cities, inadequate management and disposal of substances usedfor the operation and maintenance of vehicles also contributes to watercontamination. By 1995, the major portion of the 650 million barrels ofoil lubricants used annually for automobiles had been dumped into sew-ers and bodies of water without prior treatment or control. By 1990, theCundinamarca CAR estimated that close to 250,000 barrels of motor oilhad been dumped into the sewers of the city of Bogotá and ended up inthe Bogotá River. Organic material wastes from agricultural, livestock,and domestic and industrial sources that reduce or eliminate the dissolvedoxygen in streams negatively affect aquatic life and water aesthetics.According to the Contraloría General de la República, there is no reliableanalysis of water pollution at the national level (Garay 2002). Carrasquillaand Morillo (1994) estimated that the three largest contributors tobiochemical oxygen demand (BOD) discharged into surface waters inColombia were, in order of importance, agricultural and livestock nonpointsources, 84 percent; domestic wastewater from large urban centers such asBogotá, Medellín, Cali, Barranquilla, Manizales, and Cartagena, 10 percent;and industrial point sources, 6 percent (table 11.2).
Among point sources, urban wastewater is the major source of dis-charges with high BOD. According to IDEAM (2002), in 1999, the totalBOD discharged from point sources was 624,746 metric tons, of which74 percent came from the domestic sector and 26 percent from industry.IDEAM (2002) identifies industrial centers of Barranquilla, Bogotá,Bucaramanga, Cali, Cartagena, Manizales, and Medellín as the greatestcontributors. Among industrial activities, Carrasquilla and Morillo(1994) identified the production of alcoholic and nonalcoholic bever-ages, industrial chemicals, and the cardboard and paper industry as keycontributors of organic pollution.
Table 11.2 Daily BOD Production by Sector
Sector Tons Percent
Agriculture and livestock 7,100 84
Domestic wastewater 800 10
Industrial wastewater 520 6
Total 8,420 100
Source: Carrasquilla and Morillo 1994.

376 Sánchez-Triana, Brandriss, and Awe
Agencies Responsible for the Design and Implementation of WaterPollution Control RegulationsLaw 99 of 1993 gave responsibility for the design and implementation ofenvironmental policy to the MAVDT, CARs, and AAUs, and made theMAVDT the supreme regulatory authority for water pollution control.The MAVDT is responsible for both setting general policies and develop-ing specific programs related to water. In conjunction with the Ministryof Social Protection, it is responsible for defining the acceptable qualitystandards and uses for water and for developing a resource classificationplan that includes existing uses, projections of water use needs, qualitysimulation models, quality criteria, and discharge procedures. TheMinistry of Social Protection alone is responsible for approving water treat-ment, storage, and transportation when the water is for human consump-tion. Law 99 also assigned CARs and AAUs responsibility for enforcingthe water policies set at the national level.
Implementation of Water Pollution PolicyThe main water pollution problems in Colombia are associated withtoxic substances, pathogens, and other hazardous substances, but no poli-cies address these problems. Furthermore, Colombia’s water pollutionpolicy omits nonpoint discharges, which are significantly more damagingto the environment than point discharges of organic matter (BOD).However, a handful of regulations establish the basic structure of regu-lation of organic matter and suspended solids.
Water quality regulations for BOD and total suspended solids (TSS)have three main elements: (a) a set of quality standards for various beneficialuses, including human and domestic consumption, preservation of floraand fauna, agriculture (including irrigation), animal production, and recre-ation (including swimming); (b) a system of registration and permitting,associated with a set of discharge standards; and (c) a system of dischargefees. Decree 1594 of 1984 and Law 09 of 1979 contain the details of stan-dards and requirements regarding environmental quality, treatment ofwastewater, and compliance standards. CARs and AAUs are responsible forenforcing the discharge standards, and to do so, they can inspect discharg-ing facilities at any time to sample effluents and inspect equipment.
Water pollution charges have been used in Colombia at least sincethe late 1970s. The design of the fee system, established in the CNRNof 1974 and developed by the Autonomous Regional Corporation ofthe Cauca Valley (Corporación Autónoma Regional del Valle del Cauca,CVC) in 1978, has been changed several times by several decrees

Water Management in a Water-Rich Country 377
and laws.9 As envisioned in Law 99 of 1993, discharge fees wereapplied only to those discharges remaining after the discharge stan-dards had been met. For example, for new facilities (established afterDecree 1594 of 1984) that achieved 80 percent BOD removal, thedischarge fees applied only to the 20 percent BOD content of theirdischarges. CARs are entitled to charge-generated revenues; to provideincentives for the application of the charges, the national governmentdetermined that many of the agencies’ operational expenses, includ-ing staff compensation, could be financed only by charge revenues anda few other instruments.
In addition to the obstacles to expanding water supply and sewerageservices with participation of the private sector (explained in chapter 6),the charge design contains the following serious flaws with respect toecological improvement goals:
• The selection of BOD and TSS as charge parameters, which are associ-ated with aesthetic characteristics and not with the most significantproblems such as impacts to human health, ecosystem conservation,or beneficial uses of bodies of water, such as recreation.
• Reliance on voluntary declarations to determine discharges of pollu-tants, without a system to verify the accuracy of the declarations andpenalize false reporting.
• The possibility of revising environmental goals once they are met,which reduces the incentives to invest in pollution-abatement tech-nologies. Experiences in other countries show that polluters tend notto meet environmental goals because doing so would invite the settingof more stringent goals. Instead, polluters tend to adopt a strategy ofreluctant compliance to increase the probability of more lenient goalsin subsequent periods.10
• Absence of a quality-assurance mechanism to ensure the precision,sensitivity, and accuracy of environmental monitoring, and thereforelack of a reliable system to assess progress.
The total national generation of wastewater in urban centers is 67 cubicmeters per second (Carrasquilla and Morillo 1994), the vast majorityof which is not treated. In addition, a significant percentage of waste-water is not collected because many households are not served bymunicipal sewerage systems. Even when wastewater is collected it isgenerally not treated, and many of the existing wastewater treatmentplants operate inefficiently or not at all.

Approximately 75 percent of the population living in urban areas in2001 (31,339,130 inhabitants) had access to sewerage systems. Thismeans that 7,803,000 people lacked access to this service. As of 1999,16 percent of Colombia’s 1,089 municipalities had operating treatmentplants (Contraloría 1999). The Ministry of Development estimated thatColombia’s treatment plants treat less than 1 percent of total urbanwastewater. In the sample of 40 municipal wastewater treatment plantsin table 11.3, 60 percent were not in compliance with Decree 1594 of1984 standards for the removal of 80 percent of BOD and 65 percent ofTSS (Contraloría 1999).
Another urban wastewater treatment issue is its high cost, estimated tobe Col$5,250 billion (US$2.5 billion), or 72 percent of the total costof all water infrastructure (table 11.4). An important contributor tothe cost of treating urban wastewater is the predominance of high-cost, high-technology conventional treatment plants and the limiteduse of low-technology, low-cost solutions, including lagoons, anaerobicprocesses and filters, and seasonal stabilization reservoirs for agricul-tural reuse (Libhaber and Foster 2003). Table 11.5 presents data onactual expenditures on urban wastewater treatment plants in sevencities during 1998 to 2001.
The MMA (2002) has reported that in 66 percent of the cities studied,no industries treated wastewater as mandated by Decree 1594 of 1984.In 23 percent of the cities, fewer than 50 percent did; in 7.5 percent, 50to 100 percent did; and in only 3.1 percent did 100 percent of the indus-tries treat their wastewater.
The fact that CARs and AAUs have built municipal wastewater treat-ment plants and are still operating them also has led municipalities toavoid compliance with the regulations. For example, the CARCundinamarca built 23 municipal wastewater treatment plants duringthe 1990s and exempted municipalities from their water pollution controlresponsibilities. The CAR Cundinamarca still operates those wastewatertreatment plants, and the municipalities have been reluctant to acceptthe financing of their operation.11
Bogotá’s Wastewater Treatment PlantThe lessons from the Bogotá Wastewater Treatment Plant programs illus-trate policy changes needed in wastewater treatment. In September 1994,
378 Sánchez-Triana, Brandriss, and Awe

Water Management in a Water-Rich Country 379
Table 11.3 Efficiency of Organic Load Removal in Municipal Wastewater
Treatment Plants
Load removal (percent)
Municipality Flow (l/s) BOD5 COD TSS
Alvarado 4.8 78.1 71.8 70.1
Anapoima 8.1 72.4 88.2 90.0
Barrancas 14.0 38.2 30.0 80.0
Becerril 50.9 58.1 83.3 83.9
Cajicá 105.4 79.0 78.0 92.0
Chía 41.8 73.0 71.0 82.5
Chiriguaná 52.8 32.9 48.3 62.7
Chocontá 13.2 65.2 70.0 43.0
Concepción 26.9 55.8 85.9 46.7
Cota 9.0 81.0 77.0 91.0
El Paso 16.5 41.8 30.2 65.9
Espinal 84.1 85.0 81.0 90.0
Facatativa 86.0 77.0 82.0 80.0
Fonseca 123.2 40.9 20.4 21.5
Funza 145.0 88.0 90.0 92.0
Gachancipá 6.1 25.0 38.0 40.0
Ginebra 51.9 81.1 71.4 84.2
Guacarí 40.0 81.1 65.7 94.4
Guamal 46.4 75.0 78.0 89.0
Guatapé 7.6 85.0 80.0 88.0
Hato Nuevo 54.4 70.0 80.2 83.4
Icononzo 7.4 60.0 56.0 80.0
La Unión 20.0 83.7 81.0 98.5
Maicao 133.0 77.5 77.7 82.2
Mosquera 83.6 86.0 85.0 91.0
Roldanillo 40.0 80.5 81.3 88.7
Sesquilé 4.7 74.7 78.4 82.0
Sopó 7.9 90.0 80.1 78.4
Suesca 68.0 46.2 92.0 50.0
San Francisco 59.0 80.0 78.0 82.0
Tenjo 11.0 65.0 80.0 74.0
Tocancipá 9.7 81.3 82.3 90.0
Toro 20.0 83.0 72.8 97.8
Ubaté 3.7 78.0 94.0 85.0
Urumita 8.2 53.4 68.4 65.2
Villanueva 135.0 74.1 61.0 88.0
Zipaquirá I 44.1 97.0 83.4 20.0
Zipaquirá II 167.8 93.0 74.1 83.3
Source: Ministry of Development (1999) as reported in Contraloría (1999).
Note: l/s = liters per second; BOD = biochemical oxygen demand; COD = chemical oxygen demand.

380 Sánchez-Triana, Brandriss, and Awe
Table 11.4 Estimated Costs of Required Aqueducts and Sewers in Urban Areas,
2001–10
Type of expenditure Cost (US$ thousand)
New aqueducts 461.3
Rehabilitation of potable water plants 3.1
New potable water plants 17.2
New sewers 515.2
New wastewater treatment plants 2,568.5
Total 3,565.3
Source: MMA 2002.
Table 11.5 Investment in Wastewater Treatment Systems, 1998–2001
City Investment (million pesos)
Bogotá 229,120
Medellín 354,200
Pereira 18,330
Cartagena 21,000
Santa Marta 35,970
Manizales 8,661
Conhydraa 4,468
Total 671,749
Source: Blackman and others 2005.
Note: US$1 = Col$2,150.
a. Marinilla/Santafé de Antioquía.
the city government adopted a strategy that consisted of the constructionof three activated sludge (secondary treatment) plants along the BogotáRiver within the city limits, to be located at the confluences of the Salitre,Fucha, and Tunjuelo tributaries. The plants would dispose of their treatedeffluents into the Bogotá River. The investment cost of the three plantswas estimated at about US$1.4 billion.
The first stage of the strategy has been completed and is being imple-mented. It consists of the first primary treatment plant at Salitre, con-structed under a 30-year build-own-transfer agreement with a privateoperator. According to public information, the investment in the primarySalitre plant amounted to Col$26,250 million (US$125 million) and themonthly fee the Bogotá City paid the operator was Col$6,300 million(US$3 million). These expenditures were financed with resources ear-marked by Law 99 of 1993 to the Bogotá AAU (DAMA). As reportedby the Universidad de los Andes (2004, p. 8), “acting as a developer andas a regulator DAMA has not had a free capacity to question the benefitsof a project that was promoted by the Administration.” Libhaber and

Water Management in a Water-Rich Country 381
Foster (2003) estimated that the total amount Bogotá City would have paidduring the 30-year contract period, just for the first stage of the first plant,would amount to about Col$1,075 billion (US$500 million).
After it went into operation, the plant was found to have no detectablepositive impact on the water quality of the Bogotá River.At the time, nei-ther the national government nor the World Bank supported the adoptedstrategy on the grounds that it was too costly and that it would notachieve meaningful benefits even upon completion of the construction ofthe three secondary plants (Libhaber and Foster 2003).
As a result of the high costs associated with the primary Salitre plant,in 2003 the Bogotá Water Supply Utility questioned the adopted strategyand initiated a process of revising past decisions and searching for analternative strategy. On December 31, 2003, after the plant had been inoperation for nearly three years, the city’s mayor terminated the contractand made provisions to pay Col$157,500 million (US$75 million) tothe contractor.12 This sum included the value of the infrastructure andcompensation. The mayor’s decision to terminate the contract wassupported by a range of financial, legal, and technical studies and evalu-ations conducted during 2002 and 2003.13 In essence, those evaluationsfound that the project did not produce social benefits, that the contractwas economically disadvantageous to the city, and that the plant hadtechnical deficiencies.
CartagenaA comprehensive set of alternatives for wastewater treatment and dis-posal for Cartagena were identified and analyzed, including the areas ofCartagena Bay, the Ciénaga de la Virgen Wetland, and the CaribbeanSea, as well as alternatives for reuse and irrigation. The analysis includedfive treatment options (from preliminary to tertiary), four sites for seaoutfalls, five types of pipe materials, and nine land conveyance routes infour corridors. Overall, 15 alternatives combining different treatmentlevels and final disposal sites were considered. All alternatives were ana-lyzed according to their technical, environmental, social, economic, andfinancial merits. Effluent quality, initial investment costs, operation andmaintenance costs, and land uptake were the main comparison criteria.
Based on extensive, highly technical modeling of water quality, theanalysis concluded that the most environmentally and socially sound,and economically and financially feasible, alternative for the treatmentand disposal of wastewater in Cartagena would consist of a scheme ofpreliminary treatment and disposal into the Caribbean Sea through a

382 Sánchez-Triana, Brandriss, and Awe
long outfall with diffusers at a 20-meter depth. It was envisioned beyondany doubt that the proposed scheme in Cartagena would be one of themost cost-effective environmental investments in the country. In addi-tion to providing a cost-effective solution to the disposal of wastewaterfrom Cartagena, the sub-marine outfall will provide a minimum dilutionfactor of 1:100 and an average of 1:500 at the outlet of the diffusers.
The Cartagena case illustrates the need to reform the wastewaterregulations to allow a more rational approach to wastewater treatmentand disposal in Colombia. The costs of enforcing the current wastewaterdischarge standards are extremely high, and obviously beyond the coun-try’s reach. Such standards, established in 1984, have induced a strategyof no action, which, in turn, has caused significant environmental andhealth impacts in the country. This has led to situations in which citieswith low water and sewerage coverage insist on constructing waste-water treatment plants, or towns insist on building wastewater treatmentplants when they are located next to rivers with ample assimilationcapacity. As in the case of the Bogotá watershed, treatment plantsthat were subsidized by the national government are not being acceptedby municipalities.
Conclusions
Colombia possesses abundant water resources. However, by 2025 a few ofthe country’s basins could become vulnerable and, if left unattended, couldgenerate potential water deficits for the following decades. Despite theabundance of water, the current legal and institutional framework does notfacilitate water access to small water users such as small farmers, indigenouspeoples, and recreational users, or for ecological needs. Nor does the currentregulatory framework secure the maintenance of water rights or provideeffective mechanisms for the resolution of water disputes.
In recent decades, a variety of uncoordinated efforts, managed byvarious ministries (for example, public works, health, and economicdevelopment), have been carried out with respect to integrated waterresource management, potable water, and basic sanitation services. As aresult, departments, municipalities, and environmental authorities havemade dispersed investments in water basin management with little cor-relation to water supply needs, and significant investments have beenmade in wastewater treatment with little improvement in water quality. Inaddition, conflicts of interest arise in the allocation of water managementresponsibilities to CARs.

Current water legislation (mainly the CNRN and Decree 1541 of1978) ranks the priorities for water use but does not indicate what thepractical implications of that ranking should be in cases of water conflicts.This legal void has been at the origin of several legal disputes betweenlarge water users and needs to be addressed.
In addition, current water pollution control regulations (particularlyDecree 1594 of 1984) do not regulate the discharge of priority pollu-tants (pathogens and other hazardous wastes) or the largest polluters—nonpoint sources, such as agricultural runoff, which contribute an esti-mated nine times as much BOD as municipal wastewater (CONPES3177, 2002). Nonpoint sources also contribute the largest amount ofpesticide and fertilizer waste. Even if reducing BOD remains a priority,an amendment of Decree 1594 of 1984 to control discharges from nonpointsources is urgently needed.
The current water pollution control framework focuses solely on thequality of surface waters, ignoring groundwater issues. However, thequality of groundwater should also be protected because it supplies anestimated 25 percent of the country’s population, and the restoration ofpolluted aquifers is more difficult than of surface waters.
A CAR’s efforts to improve water quality could be undermined if itreceives polluted water from the jurisdiction of another CAR locatedupstream. However, the current water pollution control regulatoryframework does not contemplate clear mechanisms for addressing thisissue, nor are there provisions to efficiently regulate wastewater dis-charges into the sea.
The effluents charge system needs to evolve, because it addresses organicpollutants discharged from point sources to surface waters, but not theimpacts of other substances, the contributions of the largest polluters, andthe contamination of aquifers and marine waters. Nor does the currentdesign of the charge system14 address the impacts of the individual sewer-age bills of the poorest segments of the population. Implementation ofwetland restoration and conservation actions has shown positive impacts,particularly in the Juan Amarillo and CGSM wetlands, and these bestpractices, including the incorporation of incentives for wetland restorationand standards for the environmental management of urban storm waterand urban wetlands in the regulatory framework, could be exported toother locations in Colombia.
Several studies (Colorado State University 2004; Universidad de losAndes 2004) have recommended amending the water regulations tomandate institutional responsibilities among numerous governmental
Water Management in a Water-Rich Country 383

agencies (for example, the AAUs, CARs, IDEAM, MAVDT, and Ministryof Agriculture), drinking water quality standards, control of nonpointsources of water pollution, management of water runoff and urbandrainage, reduction of vulnerability to natural disasters associated withflooding and landslides, management of marine and coastal resources,and conservation of important water ecosystems. Other stakeholdersmaintain that the legal framework needs to be amended to fully incor-porate the environmental considerations of water resources management(IUCN 2005).15
Water resources management is a national priority for the governmentof Colombia. A draft law prepared by the MAVDT was presented toCongress in 2005 to reform the national legal framework for waterresources management, particularly addressing issues related to allocationof water rights; promotion of public participation in water resources man-agement; establishment of a users registry; regulations on management ofwater runoff and urban drainage; control of hazardous wastewater dis-charges; definition of the ecological flow rate; and redesign of economicinstruments, such as water pollution fees (MAVDT 2006, p. 10).
Regarding the roles and responsibilities pertaining to the allocation ofwater rights and the integrated management of water resources, the draftlaw presented to Congress “establishes in Article 11 the modes of access,use, and exploitation of water resources and establishes the proceduresfor access to water resources, and defines the responsibilities of users aswell as the appropriate environmental authority. The draft law providesincentives for public participation, allowing for each of the administra-tive procedures proposed in the law that those interested put forwardtheir observations and concerns” (MAVDT 2006, p. 10).
Concerning the recommendation of establishing a users registry, thewater law proposed by the government “establishes in Article 48 that apublic registry of national concessions should be administered byIDEAM. It also recommends that efficient and transparent proceduresbe developed to facilitate access to water resources; in particular, Article29 establishes the requirements and procedures for authorizing conces-sions as well as wastewater discharge permits” (MAVDT 2006, p. 10).
With respect to the definition of ecological flow rate, Article 21 ofLaw 365 proposed by the government defines the flow rate for surfacewaters as the minimum flow rate that each section of a waterway shouldmaintain to guarantee conservation of hydrobiological resources andassociated ecosystems. The same law “proposes that variations in flowrates over time be considered so that water availability is not exceeded.
384 Sánchez-Triana, Brandriss, and Awe

Water Management in a Water-Rich Country 385
Article 13 of the law establishes that the appropriate environmentalauthorities should determine the available water supply to avoid author-izing concessions for a larger flow than is available, after evaluating pre-vious concessions, the ecological flow rate, and ministerial uses requiredby law” (MAVDT 2006, p. 10).
On the subject of designing a system to control water pollution (giventhat regulations of Decree 3100 of 2003 consider only BOD and TSS forcharging effluent fees), Article 42 of the draft law “establishes among thefactors that comprise the formula for effluent fees, the factors of watersupply, absorption capacity, dilution, and the autopurification capacity ofreceiving bodies” (MAVDT 2006, p. 10).
Recommendations
In accordance with the draft law presented to Congress, it is appropriateto define the roles and responsibilities of the different institutions as theyrelate to allocation and enforcement of water rights. Such a law mightarticulate the handling of water rights that were allocated in the past andprovide mechanisms that allow people to give up previously awardedrights (to arrive at a more socially equitable distribution) and to ensurethat users pay arrears on water charges. The law might consider effortsto strengthen water resources and clarify the roles of agencies responsi-ble for water resources management; ensure appropriate stakeholderparticipation; and establish a registry of users and create efficient andtransparent procedures to facilitate access to water rights, includinggroundwater, by small users. Strengthening the capacity of control agen-cies such as the Attorney General’s Office and of other local agenciesand communities to ensure the enforcement of water regulations mightalso be considered for inclusion in the new legal framework.16
The water law proposed by the government reflects the economicvalue of water in water fees. Those fees might include the costs associatedwith the conservation of the natural ecosystems that regulate waterflows and the protection of the wetlands and riparian ecosystems thatcontrol floods. An amended legal framework might also include the defi-nition of a minimum ecological flow rate. It is also important that waterallocations take into account the variability of the peak flow rate and itscorresponding probability, to ensure that water allocations do not exceedwater availability.
With respect to water pollution control, the draft law presented toCongress modifies Law 99 of 1993 by establishing clear water quality

386 Sánchez-Triana, Brandriss, and Awe
Table 11.6 Recommendations to Improve Water Resources Management
Priority:
short (S), medium (M),
Recommendation and long term (L) Participating institutions
Create efficient and transparent M Congress, MAVDT
procedures to facilitate access to
water rights, including groundwater,
especially by small users
Ensure the collection and public M Congress, MAVDT
disclosure of information related to
water availability and water demands
Clearly define the roles and S Congress, MAVDT
responsibilities of different institutions
and create appropriate coordination
mechanisms
Strengthen the capacity of control M–L Congress, MAVDT
agencies such as the Attorney
General’s Office and of other local
agencies and communities
Create local mechanisms for the M–L Congress, MAVDT
enforcement of water regulations
Ensure that the economic value of water S–M MAVDT, CARs, AAUs
is adequately reflected in water fees
Create a water rights registry L MAVDT, CARs
Provide guidance on allocation of water M MAVDT
from aquifers
Define minimum ecological flow rate M–L MAVDT
and minimum flow rate required to
meet the basic needs of the
population
Issue regulations to establish water M–L MAVD, CARs, AAUs
quality standards and establish a system
of authorizations aimed at reducing
pollution
Introduce phased approaches and L MAVDT, CARs, AAUs
differentiated treatment and disposal
schemes according to regional
conditions and priorities, and reform
wastewater discharge regulations to
allow for a more rational approach to
wastewater treatment
Conduct analytical work to modernize S Congress, MAVDT
the effluent charge system in
Decree 3100 of 2004
Spread best practices for wetland L MAVDT, CARs, AAUs
restoration and conservation
Source: Authors.

Water Management in a Water-Rich Country 387
regulations. In addition, a system of authorizations aimed at reducingpollution by toxic substances, pathogens, and other dangerous residueswith potential adverse health impacts might be designed. In particular,the provision of guidelines for the development of national-level primarydischarge standards linked with health effects or impacts for regional-level secondary standards might be developed on the basis of analyticalwork. An amended regulatory framework on water resources manage-ment might clearly outline the institutions responsible for developingand enforcing such standards.
The most troubling aspects of the effluents charge system stem fromits design in Law 99 of 1993. As of 2006, the effluent fee systemaddresses only BOD and TSS discharged from point sources to surfacewaters, neglecting the impacts of other substances, the contributions ofthe largest polluters, and the contamination of aquifers and marinewaters. The current design of the charge, embodied in Decree 3100 of2004, also fails to address the disproportionate impacts of sewerage billincreases on the poorest segments of the population. The draft waterlaw presented to Congress redresses the shortcomings of Decree 3100of 2004 by including the identification of interventions that enhancesocial welfare and the development of policies that are efficient, effec-tive, and equitable.
A new regulatory framework might also introduce the concept of phasedapproaches, starting with the optimization of discharges by using the assim-ilation capacity of receiving bodies. The new framework might also allowfor differentiated treatment and disposal schemes according to regionalconditions and priorities. For coastal cities, the alternative of preliminarytreatment and disposal through ocean outfalls might be promoted.
Table 11.6 summarizes the recommendations made in this chapter.
Notes
1. Ernesto Sánchez-Triana, Peter Brandriss, and Yewande Awe are the authors ofthis chapter, which draws on reports prepared by Blackman and others(2005); Colorado State University (2004); Enríquez (2004); and Universidadde los Andes (2004).
2. Water quality for human consumption is discussed in chapter 6. This chapterdiscusses the problems of surface and groundwater pollution, which are notrelated to the water-related illnesses prevalent in Colombia.
3. According to MAVDT (2006, p. 9), “the Constitution and Law 99 of 1993establish that the definition, design, and issuance of national water resourcespolicy are the exclusive responsibility of the Ministry of Environment,Housing, and Territorial Development.”

4. In cases of public interest, such as aqueducts or public infrastructure, conces-sions could be granted for up to 50 years.
5. The fee decreased as the depth of the resource increased.This is related to theincreasing availability of groundwater with increasing depth, and with thehigher risk of groundwater pollution caused by extraction at lower depths.
6. Information provided by DAMA to Universidad de Los Andes researchers.
7. For instance, the joint effort by the Autonomous Regional Corporation ofDique (Corporación Autónoma Regional del Dique, CARDIQUE) and theAutonomous Regional Corporation of Atlántico (Corporación AutónomaRegional del Atlántico, CRA) for the “Environmental Management Plan forthe Wetlands of El Totumo, El Guajaro and El Jobo in the Canal del DiqueEcoregion,” and the “Integrated Management Plan for the Wetlands of theMompox Area and the Sinú River Watershed,” a joint effort of five regionalcorporations (the Autonomous Regional Corporation of Central Antioquía(Corporación Autónoma Regional del Centro di Antioquía, CORANTIO-QUIA), the Autonomous Regional Corporation of Magdalena (CorporaciónAutónoma Regional del Magdalena, CORPAMAG), the AutonomousRegional Corporation of the South of Bolívar (Corporación AutónomaRegional del Sur de Bolívar, CSB), the Automous Regional Corporation of theSinú and San Jorge Valleys (Corporacíon Autónoma Regional de los Valles delSinú y San Jorge, CVS), and the Sustainable Development Corporation forthe Mojana and San Jorge (Corporación para el Desarrollo Sostenible de laMojana y San Jorge, CORPOMOJANA)) in 2002. Both initiatives werefinanced by the Inter-American Development Bank.
8. The Ramsar Convention considers wetlands as “water reserves of great eco-nomic, cultural, scientific and recreational value,” and they are defined “areasof marsh, fen, peat land or water, whether natural or artificial, permanent ortemporary, with water that is static or flowing, fresh, brackish or salt, includ-ing areas of marine water the depth of which at low tide does not exceed sixmeters” (RAMSAR Information Paper No.1 at http://www.ramsar.org/about/about_infopack_1e.htm).
9. These decrees and laws include Decree 1594 of 1984, Law 99 of 1993,Decree 901 of 1997, Decree 3100 of 2003, and Decree 3440 of 2004.
10. As explained in chapter 6, private investors had no means of knowing howthe charge would ultimately affect the utility’s finances.
11. Interview by consultants of the Universidad de los Andes with Mrs. GloriaLucía Alvares, Director of CAR, July 2004.
12. See resolution 2036 of December 31, 2003, for that decision.
13. Taller de Estrategia conducted financial evaluations. The Instituto Quinaxi,Carlos Alberto Giraldo, the Water Research Center of England, and the UniónTemporal Saneamiento Río Bogotá conducted technical evaluations. The firmArodríguez-Azuero conducted the legal analysis.
388 Sánchez-Triana, Brandriss, and Awe

14. The current design is embodied in Decree 3100 of 2004.
15. The World Conservation Union (IUCN) has stated its concern about the needfor better articulation of stakeholder participation in water resources manage-ment. http://www.sur.iucn.org/wani/notdetalle.cfm?passcodnot=1009.
16. According to MAVDT (2006, p. 9), with “respect to wastewater treatment,Resolution 1433 of 2004 establishes that providers of sewerage servicesand complementary activities, such as wastewater treatment, should for-mulate sanitation and effluent management plans (PSMV) and presentthem to the appropriate environmental authority for approval. The PSMVshould be presented no later than four months after the quality objectivesare defined by means of an administrative act issued by the environmentalauthority. The PSMV contains the required programs, projects, timetables,and investments to advance basic sanitation and wastewater treatment, inwhich the municipality determines the period for constructing the treat-ment plant(s) considering, among other factors, the financial capacity ofthe municipality, the capacity of users to pay for sewerage services, and thedesired quality objectives.”
References
Alvarez, Gloria Lucía. 2004. Interview with Gloria Lucía Álvarez, Director ofCAR Cundinamarca, by Consultants from Universidad de los Andes. InUniversidad de los Andes, “The Allocation of Water Resources in the BogotáSavanna Region.” Final Report, World Bank, Bogotá.
Amado, Hernando. 2004. Interview with Consultants from Universidad delos Andes. CAR Cundinamarca Team responsible for the technical evalu-ation of water permits. In Universidad de los Andes, “The Allocation ofWater Resources in the Bogotá Savanna Region.” Final Report, WorldBank, Bogotá.
Amado, Hernando, and Hernando Niño. 2004. Interview with Consultants fromUniversidad de los Andes. CAR Cundinamarca. In Universidad de los Andes,“The Allocation of Water Resources in the Bogotá Savanna Region.” FinalReport, World Bank, Bogotá.
Asocolflores. 2005. www.asocolflores.org.
Blackman, Allen, Richard Morgenstern, Libardo Montealegre Murcia, and JuanCarlos Garcia de Brigard. 2005. “Review of the Efficiency and Effectivenessof Colombia’s Environmental Policies.” Final Report to the World Bank,Resources for the Future, Washington, DC.
Camargo, German. 2004. Interview with Germán Camargo, Subdirector of CARCundinamarca by Consultants of Universidad de los Andes. In Universidad delos Andes, “The Allocation of Water Resources in the Bogotá Savanna Region.”Final Report, World Bank, Bogotá.
Water Management in a Water-Rich Country 389

390 Sánchez-Triana, Brandriss, and Awe
CAR (Corporación Autónoma Regional de Cundinamarca). 1995. Distritos deRiego La Ramada y Bojacá—La Herrera Área Actual y Proyecto deAmpliación. Bogotá.
Carrasquilla, María Lucia, and Juliana Morillo. 1994. “Contaminación HídricaIndustrial en Colombia.” In Contaminación Industrial en Colombia, ed. ErnestoSánchez-Triana and Eduardo Uribe, 93–126. Departamento Nacional dePlaneación. Programa de las Naciones Unidas para el Desarrollo. Santafé deBogotá: Tercer Mundo Editores.
CEDE (Centro de Estudios sobre Desarrollo Económico) of Universidad de losAndes. 2003. “Evaluación del Sistema de Precios, Calidad y Funcionamientode los Mercados Lácteos en Colombia.” Evaluación, CEDE, Bogotá.
Colorado State University. 2004. “Integrated Water Management and Law inColombia: Institutional Aspects of Water Management, Allocation of Uses,Control of Contamination, and Urban Drainage.” Final report prepared byNeil S. Grigg, Larry J. MacDonnell, Darrell G. Fontane, Charles W. Howe,Marie L. Livingston, Larry A. Roesner, and Jose D. Salas, Colorado StateUniversity, Boulder, CO.
CONPES (Consejo Nacional de Política Económica y Social). 2002. Documento3177—“Acciones Prioritarias y Lineamientos para la Formulación del PlanNacional de Manejo de Aguas Residuales.” Departamento Nacional dePlaneación, Ministerio de Ambiente,Vivienda y Desarrollo Territorial, Bogotá.
Contraloría (Contraloría General de la República). 1999. Estado de los RecursosNaturales y del Ambiente 1998–1999. Bogotá: Contraloría.
Cruz, M. P., Eduardo Uribe, and Hernando Coronado. 2003. “El Valor de laProductividad Marginal del Agua en la Industria Manufacturera Colombiana.”Documento CEDE No 38, Universidad de los Andes, Bogotá.
DAMA (Departamento Administrativo del Medio Ambiente, Bogotá). 2002.“Seguimiento al Recurso Hídrico Subterránea en el Distrito Capital.” InformeEjecutivo de Actividades Realizadas entre 1999 y 2002, DAMA, Bogotá.
DANE (Departamento Administrativo Nacional de Estadísticas). 2002.Proyecciones de Población. Bogotá: DANE.
––––––.2004. Proyecciones de Población. Bogotá: DANE.
DNP (Departamento Nacional de Planeación). 1995. “El Salto Social.” PlanNacional de Desarrollo 1994–1998, DNP, Bogotá.
Enríquez, Santiago. 2004. “An Evaluation of the Colombian Water PollutionRetributive Charge.” Background paper prepared by consultant for the WorldBank, Washington, DC.
Ersulien, J. E. 2003. “Estimación de la Disposición a Pagar por el Uso de Agua enÁreas Rurales: Caso Subachoque.” Master’s Thesis, Facultad de Economía,Universidad de los Andes, Bogotá.

Water Management in a Water-Rich Country 391
Escobar Ramírez, José J. 2004. Síndromes de sostenibilidad ambiental del desarrolloen Colombia. Taller Síndromes de sostenibilidad del desarrollo en AméricaLatina. Santiago de Chile, 16 y 17 de septiembre de 2002. Serie Seminarios yConferencias. No. 41. Cepal, Naciones Unidas, Santiago.
Garay, Jorge Luis, ed. 2002. Colombia: Entre la esclusión y el desarrollo. Bogotá:Contraloría General de la República.
IDEAM (Institute of Hydrology, Meteorology and Environmental Studies). 2002.“First Generation of Indicators of the Environmental Information Baseline.”IDEAM, Bogotá.
——. 2004. “Informe Anual del Estado del Ambiente y los Recursos Naturales enColombia.” IDEAM, Bogotá.
——. 2005. “Informe Anual del Estado del Ambiente y los Recursos Naturales enColombia.” IDEAM, Bogotá.
Ingetec. 2003. “Asesoría Técnica para el Trámite de Concesión del Río Bogotá conla CAR Planta Tibitoc.” Informe de Consultoría,Acueducto de Bogotá, Bogotá.
INVEMAR (Instituto de Investigaciones de Marinas y Costeras). 2002. Biodiversidadmarina en Colombia: Estado actual del conocimiento y desafios futuros. SantaMarta, Colombia: INVEMAR.
IUCN (World Conservation Union). 2005. “Continúa el debate sobre la Leydel Agua en Colombia.” http:// www.sur.iucn.org/wani/notdetalle.cfm?passcodnot=1009 and http://www.sur. iucn.org/wani/notdetalle.cfm?passcodnot=1009.
Libhaber, Menabem, and Vivian Foster. 2003. “Urban Water and SanitationSector.” In Colombia: The Economic Foundation of Peace, ed. Marcelo Giugale,Olivier Laforcade, and Connie Luff, 433–62. Washington, DC: World Bank.
MAVDT (Ministerio de Ambiente, Vivienda y Desarrollo Territorial). 2006.Comentarios Consolidados al Documento CEA. E-mail sent by LeonardoPinzon, Olga Bautista, and Pedro Chavarro to Angela Armstrong. February17, 2006.
Mejia, Millan, and Perry. 1985. “Estudio Nacional de Aguas.” Informe deConsultoría para el Departamento Nacional de Planeación, Bogotá.
MMA (Ministerio del Medio Ambiente). 2002. Plan Indicativo Sectorial2002–2006. Bogotá: MMA.
Molina, H. 2002. “Actualización del Estudio de Población y Demanda de Agua.”Acueducto de Bogotá. Consultant Report, EAAB, Santafé de Bogotá.
Niño, Hernando. 2004. Interview with Consultants from Universidad de losAndes. CAR Cundinamarca Team responsible for the technical evaluationof water permits. In Universidad de los Andes, “The Allocation of WaterResources in the Bogotá Savanna Region.” Final Report, World Bank,Bogotá.

Rodríguez, Jaime C. 2003. “El Agua en la Historia de Bogotá. 1986–2003.”Acueducto de Bogotá. Bogotá: Empresa de Acueducto y Alcantarillado deBogotá.
Rodríguez Becerra, Manuel. 1998. La Reforma Ambiental en Colombia—Anotaciones para la Historia de la Gestión Publica Ambiental. Bogotá:Fundación FES and TM.
SGC (Sociedad Geográfica de Colombia). 1998. Cuenca Alta del Río Bogotá,Bogotá.
Universidad de los Andes/CEDE. 2004. “Application of The World Bank WDRFramework 2003.” 4th version. Final Consultant Report, World Bank,Washington, DC.
World Bank. 2005.World Development Indicators.Washington, DC:World Bank.
392 Sánchez-Triana, Brandriss, and Awe

Data on soil erosion and salinization in Colombia are limited, and discrepanciesexist among the studies that are available because of differences in methodology,terminology, and coverage. Available data suggest that both erosion and salin-ization are significant problems—between 4 percent and 23 percent of the soilis seriously eroded. The mean annual cost of soil degradation (erosion andsalinization) measured as lost crop productivity is estimated at Col$1,440 billion(US$670 million). Despite evidence of land degradation in Colombia, fewnational laws or regulations specifically target soil erosion and salinization.Given the dearth of land degradation policies, and the general lack of perform-ance indicators for environmental regulation in Colombia, assessing the extentof the problem and finding solutions is difficult. Existing data suggest that presentefforts by Autonomous Regional Corporations to prevent, control, and mitigateland degradation need to be strengthened. Forestry policy has been effective inreducing deforestation rates from 600,000 hectares per year in the 1970s and1980s to 90,000 hectares in 2004. A forestry bill currently under discussionoffers an opportunity to promote the development of income-generating activitiesand employment for forest dwellers and indigenous peoples living in bufferzones of conservation areas.
C H A P T E R 1 2
Land Degradation
and Deforestation
393

Land degradation has a variety of causes, including depletion of soilnutrients, invasion of salts (salinization), agrochemical pollution, soilerosion, and vegetative degradation as a result of overgrazing. All ofthese processes result in a decline in ecosystem services and potentialagricultural yields.1 To compensate, farmers may increase fertilizerapplication, leave land fallow, or convert land to uses that are morecompatible with lower soil quality. Reduced agricultural productivityaside, land degradation can also have negative off-site consequences,including siltation of low-lying dams and irrigation infrastructure, con-tamination of drinking water by agrochemicals, and loss of biodiversityand ecosystem health.
Recent global studies suggest that in the past 50 years, 22 percent ofthe world’s cropland, pasture, forest, and woodland has been degraded,and 4 percent of it has been degraded so severely that the damage isvirtually irreversible. Most of the degradation is caused by wind andwater erosion resulting from poor land-use practices, deforestation, andinadequate watershed management. Latin America and Africa have thehighest proportion of degraded agricultural land. Although the economicimpacts of soil erosion are hotly debated, cumulative productivity lossfrom soil degradation over the past 50 years is estimated to be about13 percent for cropland and 4 percent for pastureland (Scherr andYadav 1996).
This chapter discusses land degradation and deforestation in Colombiaand the policies designed to prevent, control, and mitigate them. The sec-tion on land degradation focuses on two specific issues: salinization and soilerosion, with soil erosion defined as “physical loss of topsoil, reduction inrooting depth, removal of plant nutrients, and loss of water” (Lal 1990,p. 77). The section on deforestation analyzes current forest cover, the mainforces driving deforestation, and costs of deforestation.
Soil Erosion and Salinization: Magnitude and Dimensions of the Problem
The main contributors to soil degradation in Colombia at the nationallevel include natural factors such as geologic erosion, earthquakes,landslides, and weather changes, and anthropogenic factors2 such asagricultural activities, urban expansion, mining, road construction, andlogging (IGAC 1988). Anthropogenic factors are particularly impor-tant from a policy perspective because they are more easily controlledby government initiatives.
394 Blackman and Sánchez-Triana

As discussed in detail as follows, salinization and different types of soilerosion are more severe in some parts of the country than in others.Salinization, which is mainly caused by irrigation, is most common in theCaribbean, Andean, and Pacific regions. Erosion from water (hydraulic)is most severe in the Andean and Caribbean regions. Erosion caused bywind (eolic) is most common in the Caribbean region.
Soil ErosionThere are few studies of soil erosion at the national level. To the authors’knowledge, in the past 25 years only three national erosion maps havebeen created, one by the Institute of Hydrology, Meteorology, andEnvironmental Studies (Instituto de Hidrologío, Meterología y EstudiosAmbientales, IDEAM) in 2004 and two by the Agustín CodazziGeographical Institute (Instituto Geográfico Agustín Codazzi, IGAC) in1988 and 2000.3 However, these maps do not use consistent methodolo-gies and criteria. For example, they do not include all the same causes oferosion—landslides and sedimentation are included in only two of themaps. According to IDEAM (2002), the two most recent erosion mapswere both generated using remote sensing techniques, but yielded signifi-cantly different results. The discrepancy was due to differences in thetype of images used, the season in which the images were obtained, andthe methodology used to interpret them. Whatever the causes, these dis-crepancies make the evolution of soil erosion over time difficult to assess.
The tables in this section present information derived from thesemaps and their corresponding studies. Table 12.1 shows the percentageof very high or high soil erosion by department. In 12 of Colombia’s32 departments, one-third or more of all land is highly eroded, includingsome of the most populated and productive areas in the country. Inseven of those departments (Atlántico, Casanare, Cesar, Córdoba, LaGuajira, Meta, and Sucre) more than half of all land is highly eroded.
The 1988 study of soil erosion by the IGAC used criteria establishedby the U.S. Department of Agriculture in 1981 that provide a qualitativedetermination of the damage inflicted by hydraulic and eolic erosion,salinization, sodification, and compaction. The study found that abouthalf of Colombia’s land area suffers from some degree of erosion andthat 23 percent had moderate to very severe erosion (table 12.2).Although moderate and mild erosion could still be controlled throughsoil and water conservation measures, the lands classified as havingsevere erosion (7.8 percent) were considered impossible or very expen-sive to restore.
Land Degradation and Deforestation 395

396 Table 12.1 High or Very High Soil Erosion, by Department
High or very high High or very high
Department Total area (km2) soil erosion (%) Department Total area (km2) soil erosion (%)
Amazonas 110,213 0 Guaviare 55,080 5
Antioquía 63,307 12 Huila 19,240 32
Arauca 23,784 48 La Guajira 20,506 81
Atlántico 3,324 73 Magdalena 23,076 33
Bogotá 1,642 8 Meta 86,047 50
Bolívar 26,644 17 Nariño 30,832 9
Boyacá 23,076 29 Norte de Santander 21,995 15
Caldas 7,444 6 Putumayo 26,011 4
Caquetá 89,645 13 Quindío 1,948 3
Casanare 44,435 66 Risaralda 3,599 7
Cauca 29,883 16 Santander 30,475 20
Cesar 22,614 50 Sucre 10,719 54
Chocó 47,321 1 Tolima 24,061 24
Córdoba 25,061 55 Valle del Cauca 21,277 23
Cundinamarca 22,490 32 Vaupés 53,546 1
Guainía 70,679 1 Vichada 99,874 41
Total land area: 1,139,848 km2 Total with high or very high soil erosion: 23 percent
Source: Larsen (2004) based on IDEAM (2004).
Note: km2 = square kilometer.

The study found that high levels of erosion mainly affect theCaribbean, Orinoquía, and the Andes regions, in areas where rains areintense and irregularly distributed. Very high erosion was found to occurin regions where there is low annual precipitation that is concentrated inonly a few months of the year. These regions include some of the mostpopulated and economically active parts of the country, particularly inthe Caribbean and the Andes (table 12.3).
The 1988 IGAC study also found moderate erosion on nearly14.7 million additional hectares, particularly in the Andes (10.4 millionhectares) and the Amazon (1.7 million hectares). Weather, topography,and human activities—particularly landslides resulting from roads,dams, and human settlements—have been key causes of this type oferosion. There was mild erosion in many colonized areas (particularly inthe Andes, the Amazon, and Orinoquía) and very mild erosion inOrinoquía and the Andes. The areas with the least erosion were theAmazon and the Pacific, which have favorable biophysical conditions,low population density, and no identified erosion in most of their terri-tory. By contrast, in the mountainous Andean region, where most of the
Land Degradation and Deforestation 397
Table 12.2 Soil Erosion in Colombia by Level of Severity, 1988 Study
Percentage of
Level Hectares affected country affected
Severe 8,875,575 7.79
Moderate 14,706,795 12.90
Mild 26,337,546 23.11
Very mild 5,657,950 4.96
No erosion 55,508,310 48.53
Other areas 2,259,049 1.98
Total 114,174,800
Source: IGAC 1988.
Table 12.3 Principal Regions Affected by High and Very High Erosion
Very high erosion High erosion Total
Region Hectares Percent Hectares Percent Hectares Percent
Caribbean 625,725 6.2 844,175 8.3 1,469,900 14.5
Andean 203,850 0.6 3,206,275 9.3 3,410,125 9.9
Orinoquía n.a. n.a. 4,825,125 20.9 4,825,125 20.9
Total 829,575 8,875,575 9,705,150
Source: IGAC 1988.
Note: n.a. = not applicable. The table is based on division of Colombia into five hydrographic regions: Caribbean,
Andean, Orinoquía, Amazon, and Pacific.

Colombian population is settled, 86.5 percent of all land had somedegree of erosion.
On the basis of landscape satellite images, the 2000 IGAC study foundthat 4.4 million hectares, or about 3.8 percent of Colombia, was character-ized by severe or very severe erosion (table 12.4).This figure is much lowerthan in the 1988 IGAC study (8.5 percent) and the 2004 IDEAM study(23 percent). This discrepancy could be the result of inconsistent method-ologies and classifications between the studies or a rapid increase in seriousland degradation by the time of the 2004 IDEAM study.
Even though the 1988 and 2004 data just summarized are not neces-sarily comparable, they provide some indication of how erosion haschanged during the past 16 years, including the 1993–2003 study periodof the present report. Table 12.5 compares the findings of the two studies.
398 Blackman and Sánchez-Triana
Table 12.4 Soil Erosion in Colombia by Level of Severity, 2000 Study
Area affected
Level Hectares Percent
Without erosion 16,602,050 14.7
Not apparenta 50,863,505 44.9
Mild 22,132,483 19.5
Moderate 18,851,787 11.3
Severe 3,748,585 3.3
Very severe 615,453 0.5
Areas of active sedimentation 2,258,549 2.0
Rocky outcrops 1,405,984 1.2
Source: IGAC 2000.
a. Erosion was not apparent according to landscape satellite images, but was empirically identified in field.
Table 12.5 Change in High and Very High Erosion, 1988–2004
High and very high erosion
HectaresPercent
Total Change
area 1988 2004 1988 2004 percentage
Region (hectares) (IGAC) (IDEAM) Change (IGAC) (IDEAM) points)
Amazon 18,977,000 0 157,590 157,590 0.0 0.8 0.8
Andean 21,927,700 3,410,125 4,369,974 959,849 15.6 19.9 4.3
Caribbean 13,194,400 1,469,900 6,205,975 4,736,075 11.1 47.0 35.9
Orinoquía 46,954,400 4,825,125 13,982,990 9,157,865 10.3 29.8 19.5
Pacific 12,931,300 0 1,292,308 1,292,308 0.0 10.0 10.0
Total 113,984,800 9,705,150 26,008,837 16,303,687 8.5 22.8 14.3
Sources: IGAC 1988; IDEAM` 2004.

This exercise suggests that areas classified as having high or very higherosion in Colombia expanded significantly during 1988 to 2004. Thetotal of such areas increased by over 16 million hectares, representing14 percent of the country’s area. This statistic indicates that existing soildegradation policies are inadequate.
It would be particularly useful to devote more attention to the Caribbeanand Orinoquía regions, because they appear to have experienced thegreatest increase in affected areas. One would also be interested in con-sidering the Andean region because it is the most populated and eco-nomically active region of the country, and the Pacific region because itserves as a natural resources and biodiversity reservoir.
SalinizationSoil salinization is principally caused by irrigation. Although salinizationhas various adverse economic and ecological consequences, it has notreceived the attention from Colombian policy makers that erosion hasreceived. In fact, it is difficult to find studies, policies, plans, or activitiesthat directly mention salinization prevention or control.
A 1983 soil map produced by IGAC indicates that 9 percent ofColombia’s land is “susceptible” to salinization. These areas are mainlylocated in dry ecosystems such as the Inter-Andean valleys, the BogotáSavanna, and the Caribbean. According to IDEAM (2004), approxi-mately 10 percent of Colombia suffers from high or moderate levels ofsalinity in the soil that can affect crops and rangeland. Problem areas aremainly located in the Caribbean region (the Atlántico, Bolívar, Cesar,Córdoba, La Guajira, Magdalena, and Sucre departments). In addition,salinization is a problem in Cundinamarca, Huila, Tolima, and Valle delCauca (tables 12.6 and 12.7). Tables 12.8, 12.9, and 12.10 present theresults of regional studies done for the Atlantic Coast (2002), the CaucaValley (CVC 2002), and the Bogotá Savanna (1982, 1983), respectively.
Cost of soil degradation. Soil erosion generates significant economiccosts. Larsen (2004) estimates the mean annual cost of soil degradation(erosion and salinization) measured by lost crop productivity atCol$1,440 billion (US$670 million). He attributes 56 to 67 percent ofthese costs to erosion, and 35 to 42 percent to salinization. These estimatesare very conservative because they do not include lost productivity of pas-tures and rangeland, which represent about 88 percent of total agricul-tural land in Colombia. Even so, in Larsen’s study land degradation incursa higher cost for rural areas than does any other type of environmental
Land Degradation and Deforestation 399

400 Table 12.6 High or Moderate Soil Salinity, by Department
High or moderate High or moderate
Department Total area (km2) soil salinity (%) Department Total area (km2) soil salinity (%)
Amazonas 110,213 0 Guaviare 55,080 0
Antioquía 63,307 10 Huila 19,240 20
Arauca 23,784 0 La Guajira 20,506 79
Atlántico 3,324 74 Magdalena 23,076 84
Bogotá 1,642 0 Meta 86,047 0
Bolívar 26,644 45 Nariño 30,832 3
Boyacá 23,076 5 Norte de Santander 21,995 6
Caldas 7,444 13 Putumayo 26,011 0
Caquetá 89,645 0 Quindío 1,948 0
Casanare 44,435 0 Risaralda 3,599 5
Cauca 29,883 2 Santander 30,475 8
Cesar 22,614 63 Sucre 10,719 80
Chocó 47,321 2 Tolima 24,061 32
Córdoba 25,061 44 Valle del Cauca 21,277 18
Cundinamarca 22,490 16 Vaupés 53,546 0
Guainía 70,679 0 Vichada 99,874 0
Total land area: 1,139,848 km2 Total with high or moderate soil salinity: 10 percent
Source: Larsen (2004) based on IDEAM (2004).
Note: km2 = square kilometer.

Land Degradation and Deforestation 401
Table 12.8 Salinization in Three Key Geographic Areas
Soil salinization
Geographic area (hectares)
Atlantic Coast 2,500,000
Cauca Valley 120,000
Bogotá Savanna 5,060
Sources: Atlantic Coast: Universidad del Valle (2002); Cauca Valley: Alvaro García (2004), Universidad del Valle (2002);
Savanna of Bogotá: CAR (1982–83), as cited in Blackman and others (2005).
Table 12.9 Salinization in the Cauca Valley
Salinity and other
Study area Salinity problems
Municipality Hectares Hectares Percent Hectares Percent
Candelaria 30,000 2,027 6.7 2,832 9.4
Palmira 41,200 13,153 31.9 20,830 50.6
Cerrito 14,818 2,853 19.3 3,880 26.2
Guacari 6,048 280 4.6 610 10.1
Buga 8,303 1,022 12.3 2,159 26.0
Buga–San Pedro 9,990 1,268 12.7 2,519 25.2
San Pedro–Tulua 13,200 1,300 9.8 1,623 12.3
Roldanillo–La Unión–Toro 10,000 2,351 23.5 3,872 38.7
Tulua–Andalucía–
Bugalagrande 14,331 845 5.9 1,382 9.6
Bugalagrande–Zarzal 10,094 2,126 21.1 2,982 29.5
Zarzal–La Victoria 14,370 4,744 33.0 4,984 34.7
Obando–Cartago 25,130 8,407 33.5 8,932 35.5
Total 197,484 40,376 20.5 56,605 28.7
Source: CVC 2002.
Table 12.7 High or Moderate Soil Salinity, by Region
Total area High or moderate soil salinity
Hydrographic region (hectares) Hectares Percent
Amazon 18,977,000 0 0.0
Andean 21,927,700 2,753,579 12.6
Caribbean 13,194,400 8,388,200 63.6
Orinoquía 46,954,400 0 0.0
Pacific 12,931,300 629,890 4.9
Total 113,984,800 11,771,669 10.3
Source: Larsen (2004) based on IDEAM (2004).
problem (including water and sanitation). Baquero and others (2000)estimate the costs of soil erosion for the departments of Caquetá,Santander, and Tolima (table 12.11). The results suggest considerablevariation in the cost per hectare of eroded land.

Causes of soil degradation. As noted, the human causes of soil erosion areparticularly important from a policy perspective. Human causes typicallystem from use of land for purposes that are not appropriate to the land’snatural characteristics. Table 12.12 provides aggregate national informationbased on data from the Ministry of Environment, Housing and RegionalDevelopment (Ministerio de Ambiente, Vivienda y Desarrollo Territorial,MAVDT) on whether total land used for different purposes exceeds theamount of land naturally suited to these purposes. The table makes clearthat in certain cases the answer is yes. For example, the amount of land beingused for cattle ranching, which mainly displaced agriculture and forestry,
402 Blackman and Sánchez-Triana
Table 12.11 Estimated Erosion Costs for Three Departments
Department Average cost of erosion (pesos/hectare)
Caquetá 638,673
Santander 178,593
Tolima 978,440
Source: Baquero 2000.
Note: Costs were estimated using the hedonic pricing methods. US$1 = Col$2,150.
Table 12.12 Most Suitable Land Use and Actual Land Use
Most suitable use Actual use (hectares)
Activity (hectares) 1997 1999
Agriculture 14,363 5,318 4,445
Cattle ranching 19,251 40,083 41,223
Forest 78,301 58,854 63,052
Water and urban 2,259 1,430 3,156
Without use 8,490 2,298
Source: MAVDT 2003.
Table 12.10 Salinization in Selected Areas of the Bogotá Savanna
Area affected
Municipality Degree of soil salinity Hectares Percent
Mosquera (La Ramada Slightly saline 2,739 43.5
irrigation district) Slightly saline and slightly to moderately sodaic 464 7.3
Slightly to moderately saline and slightly sodaic 765 12.0
Moderately saline and moderately sodaic to sodaic 12 0.2
Very strongly saline and moderately sodaic to sodaic 4 0.1
Cota–Zipaquira Slightly saline 180 3.5
(zone of influence Slightly saline and slightly sodaic 554 10.9
of Bogotá River) Slightly saline and slightly to moderately sodaic 341 6.7
Source: CAR 1982, 1983.

Land Degradation and Deforestation 403
Table 12.13 Suitable Land Use and Land Use Conflicts
Area
Type of conflict Description Hectares Percent
None Current use is compatible with capacity 22,669,659 19.9
Underuse (total) 17,790,116 15.7
Mild Current use is near its productive capacity 5,192,717 4.6
Moderate Current use is below its productive capacity 7,829,533 6.9
Severe Current use is considerably below its
productive capacity 4,767,866 4.2
Overuse (total) 19,652,641 17.2
Mild Current use is near its capacity 6,303,463 5.5
Moderate Current use is above its capacity; productive
processes are unsustainable 5,635,580 4.9
Severe Current use is considerably above its
capacity; cause of accelerated soil degradation 7,713,598 6.8
Soils in Natural forests, vegetation of moors,
conservation mangroves, and so forth 65,538,892 47.2
Total national 125,651,308 100.0
Source: IGAC, Ministry of Agriculture, and Corpoica 2002.
Table 12.14 Land Use and Irrigated Areas in Colombia, 1980–2001
(thousand hectares)
Land use 1980 1990 1999 2000 2001
Arable land (1) 3,712 3,305 2,536 2,818 2,516
Permanent crops (2) 1,480 1,695 1,828 1,727 1,733
Arable land and permanent
crops (1 � 2) 5,192 5,000 4,364 4,545 4,249
Permanent pasture (3) 40,100 40,083 41,304 40,920 41,800
Total agricultural area (1 � 2 � 3) 45,292 45,083 45,668 45,465 46,049
Irrigated area 400 650 850 900 900
Source: Blackman and others (2005) using data from FAO, http://www.fao.org.
is more than twice the amount suitable for this use. Ranching is associatedwith soil compaction, erosion, and sometimes (depending on parallel landmanagement issues such as irrigation and drainage) with salinization.
Table 12.13, which is derived from IGAC, Ministry of Agriculture, andCorpoica (2002), presents similar data on land use conflicts. The tableindicates that 17 percent of the country’s land is being overused, that is,the current use is above capacity.
Table 12.14 presents the main agricultural uses that have been pres-ent since 1980. Total area devoted to agriculture has increased by about2 percent since 1980. Total irrigated area, a key contributor to saliniza-tion, has increased by over 100 percent during that time.

404 Blackman and Sánchez-Triana
Table 12.15 Causes of Deforestation in Colombia
Causes Percentage of total deforestation
Expansion of agricultural frontier and colonization 73
Lumber production 12
Firewood consumption 11
Forest fires 2
Illegal crops 2
Source: MMA 1997.
Deforestation is also a major contributor to soil degradation.Table 12.15provides data on the most common activities that result in deforestation.It shows that deforestation in Colombia is mainly due to expansion of theagricultural border (mostly for livestock production) and colonization(for cattle ranching and small-scale agricultural activities).
Fertilizer consumption in Colombia is high relative to the other coun-tries in the region. The data in figure 12.1 indicate that the use of fertilizerper hectare of arable land in Colombia is more than double that ofBrazil, Ecuador, and República Bolivariana de Venezuela, and even higherwhen compared with Mexico, Panama, and Peru. Although a furtherassessment would be necessary to identify the economic incentives andother determinants of fertilizer use in each country, Colombia’s more-intensive fertilizer consumption has evident negative environmentalimpacts, as described in chapter 11, and may also be associated with theloss of soil fertility resulting from erosion and salinization, and with
0
500
1,000
1,500
2,000
2,500
3,000
3,500
Colom
bia
Ecuad
or
Brazil
Vene
zuela
, R.B
. de
Peru
Mex
ico
Panam
a
Figure 12.1 Fertilizer Consumption
Source: World Bank 2005.

the agricultural use of soils with a natural inclination toward differenteconomic activities and ecological functions.
Soil Erosion and Salinization: Policy DesignThis section summarizes the legal and regulatory framework for policiesdesigned to prevent, control, and mitigate soil erosion and salinization.Theseproblems affect a wide variety of economic and policy sectors.Therefore,this chapter reviews laws and regulations in three areas: environment,land use planning, and forestry and agriculture. As the discussion makesclear, the relevant legal and regulatory framework is quite limited;few laws and regulations in any of these areas deal explicitly withthese problems.
Environmental regulation. Neither Law 99 of 1993 nor Decree 2811 of1974—two of the pillars of environmental law in Colombia—cover soilerosion or salinization in detail. They simply state that soil erosion andsalinization are environmental problems and that public authoritiesshould be in charge of addressing them. However, no mechanisms orspecific responsibilities are mentioned.
Decree 2811 of 1974 states that soil erosion and salinization, amongother factors, degrade the environment. It also states that public authori-ties should endeavor to mitigate these problems.
Decree 1541 of 1978 regulates the water sector. It states that waterusers who are granted concessions for agricultural water must build andmaintain a drainage system to prevent soil erosion and salinization.
Soil erosion and salinization appear in Law 99 of 1993 only in lists oftopics that various environmental regulatory authorities are charged withaddressing. The Ministry of Environment (Ministerio del Medio Ambiente,MMA) is charged with regulating the environmental matters associatedwith land use, while the Autonomous Regional Corporations (CorporaciónesAutónomas Regionales, CARs) are charged with preventing naturaldisasters by, among other things, controlling soil erosion. In urban areas,this responsibility may be carried out in concert with municipal environ-mental authorities. Finally, Law 99 establishes that IDEAM must obtain,analyze, study, and process information regarding, among other things,land degradation.
Land-use planning. Law 388 of 1997 is Colombia’s key land-use planninglaw. However, the relationships between land use and land degradation arenot clearly defined. Land use plans are supposed to ensure that land is used
Land Degradation and Deforestation 405

only for purposes compatible with the land’s natural characteristics. Hence,a good land-use plan should prevent erosion and salinization. Nevertheless,no such requirement is explicitly established either by the regulation itselfor by subsequent clarifications promulgated by different environmentalauthorities, a limitation that may be due to the fact that these regulationswere written by the development sector, not the environmental sector.
The objective of the land use plan proposed in Law 388 of 1997 is torationalize the development and exploitation of land.According to the law,municipalities must formulate Land Use Plans (Planes de OrdenamientoTerritorial, POTs) in both urban and rural areas. With regard to conser-vation and protection of land and the environment, Law 388 establishesthat all POTs should consider the territory’s characteristics and potentialwhen defining permissible land uses, and establishes that municipalitiesshould consider long-run consequences of this use, including the impactson natural resources.
Decree 879 of 1999 regulates Law 388 of 1997 and establishes specificguidelines for POTs. It mandates that all municipalities with more than30,000 inhabitants should prepare a POT that contains rural and urbancomponents. The POTs are required to ensure harmonious interactionbetween the designated land use and the environment, conserve and pro-tect the environment and natural resources, prevent natural disasters, anddesignate certain areas for conservation and protection. Although severalother issues (mostly operational) are covered by the decree, these are theonly ones relevant to soil degradation and salinization.
Forestry and agricultural legislation and policies make almost noexplicit mention of soil erosion and salinization.
Soil Erosion and Salinization: Policy ImplementationAvailability of data. Assessment of the performance of soil degradationpolicies is difficult for two reasons. First, environmental law and regulationin Colombia does not contain specific goals and objectives regarding soilerosion and salinization. Control and prevention of soil erosion is frequentlymentioned in various planning documents, including those for environ-mental, disaster control, and economic development plans. For example,the topic of soil erosion appears often in CARs’ Regional EnvironmentalManagement Plans (Planes de Gestion Ambiental Regional, PGARs) andThree-Year Action Plans (Planes de Acción Trienal, PATs). However, theseplans almost always lack specific and quantifiable goals and indicators.Second, implementing institutions typically do not generate performanceindicators. For example, in the Management Reports (Informes de Gestión)
406 Blackman and Sánchez-Triana

Land Degradation and Deforestation 407
for the years covered in the plan, performance indicators generally focuson the amount of money invested in different areas, not on the actualresults or effects of these investments.4
Investment data. Canal (2004) presents data on total investment inland quality by each CAR. Such investment by all CARs representedjust 2.8 percent of all CAR investments in environmental activities(tables 12.16 and 12.17). Environmental activities totaled 58.8 percentof all CAR expenditures during this period. Hence, investment in landquality constituted just 1.8 percent of total CAR expenditures.However, the information presented by Canal has important gaps—datafor many CARs are not available. These data also omit investments byfarmers and other public and private entities that may overshadowCARs’ investments in land quality. Notwithstanding its limitations, theCanal (2004) data indicate that land degradation is not an investmentpriority for most CARs.
Figure 12.2 presents the time trend of total CAR investment in landquality from 1995 to 2003. Total investment in land issues increasedapproximately 104 percent between 1995 and 2000, and declined 33 percent between 2000 and 2003.
Do individual CARs underinvest in soil conservation? Blackman,Morgenstern, and Topping (2004) analyzed 2001 CAR-level investmentand roughly concurrent environmental quality data to determinewhether individual CARs allocate their investment funds to the mostpressing environmental problems. Soil degradation was among the sixdifferent types of environmental risks considered in this analysis. Thissection briefly recapitulates the soil degradation component of theanalysis from Blackman, Morgenstern, and Topping (2004).
For each CAR, Blackman, Morgenstern, and Topping (2004) comparedthe severity of soil degradation risk with the extent to which the CARfocused its 2001 investment funds on this risk. If CARs were allocatinginvestment spending rationally, that is, based on an assessment of theseverity of different risks, there should be a correlation between severityof soil degradation and investment devoted to it—where soil degradationis relatively serious, CARs should be spending a relatively high percent-age of their investment funds on soil conservation, and vice versa.
This analysis is limited by the availability of appropriate data.Blackman, Morgenstern, and Topping (2004) did not have data on soildegradation risk that exactly matched their categories of investment

408 Table 12.16 CAR Investments in Land Quality by CAR, 1995–2003
thousand pesos
CAR 1995 1996 1997 1998 1999 2000 2001 2002 2003 Total
CAM 168,446 292,141 — 168,255 186,726 310,826 207,612 126,300 120,000 1,580,306
CAR Cundinamarca 54,672 48,815 47,002 3,261,005 3,097,518 3,681,623 3,197,924 1,395,615 543,000 15,327,174
CARDER — — — — — — — — — —
CARDIQUE 10,262 49,781 19,861 — — 181,063 — — — 260,967
CARSUCRE 179,406 511,929 442,144 — — — 360,859 384,583 397,510 2,276,431
CAS 18,639 43,909 50,770 — 147,170 350,056 — — — 610,544
CDA — — — — — — — — — —
CDMB 3,586,902 3,192,086 2,744,274 4,216,555 4,149,980 4,473,975 4,050,197 4,767,598 4,878,167 36,059,734
CODECHOCO — — — — — — — — — —
CORALINA — — — — — — — — — —
CORANTIOQUIA 252,006 367,338 333,691 877,893 — — 1,509,607 1,545,912 1,586,304 6,472,750
CORMACARENA 2,394 3,598 6,838 — — — 24,920 — — 37,750
CORNARE 713,119 813,587 870,408 657,256 583,590 523,073 159,100 150,858 143,334 4,614,325
CORPAMAG — — — — — — — — — —
CORPOAMAZONIA — — — — — — — — — —
CORPOBOYACA — — — — — — — — — —
CORPOCALDAS 7,588 10,989 9,845 60,670 107,740 120,709 — — — 317,541
CORPOCESAR — — — — — — — — — —
CORPOCHIVOR — — — — — — — — — —
CORPOGUAJIRA — — — — — — — — — —
CORPOGUAVIO 11,186 66,375 58,766 91,005 134,675 96,567 — — — 458,574
CORPOMOJANA — — — — — — — — — —
CORPONARIÑO — — — — — — — — — —
CORPONOR 144,330 117,410 77,280 151,675 130,723 211,241 — — — 832,659

409
CORPORINOQUIA 4,354 20,266 20,987 30,335 — — — — — 75,942
CORPOURABA — — — — — — — — — —
CORTOLIMA 376,622 472,591 1,678,147 — 363,172 362,127 178,095 105,250 100,000 3,636,004
CRA 12,000 17,782 15,556 — — — — 73,675 75,320 194,333
CRC 158,198 132,112 245,683 — — — 774,783 210,500 200,000 1,721,276
CRQ 597,053 719,408 763,701 — 1,149,528 3,118,153 901,518 — — 7,249,360
CSB — — — — — — — — — —
CVC 619,439 372,349 831,258 2,009,082 848,181 697,698 1,529,975 1,450,713 1,378,350 9,737,045
CVS — — — — — — — — — —
Total 6,916,616 7,252,466 8,216,211 11,523,730 10,899,003 14,127,109 12,894,589 10,211,003 9,421,985 91,462,714
Source: Canal 2004.
Note: US$1 = Col$2,150. — = not available.

410 Blackman and Sánchez-Triana
Table 12.17 CAR Investment in Land Quality, by Type of Project
thousand pesos
Type of project
Studies and Erosion, salinization,
Year diagnoses landslide control Others Total
1995 200,162 6,576,365 140,089 6,916,616
1996 276,311 6,766,484 209,671 7,252,466
1997 350,758 7,797,464 67,989 8,216,211
1998 91,005 11,321,420 111,306 11,523,730
1999 134,675 10,577,602 186,726 10,899,003
2000 277,631 13,538,653 310,826 14,127,109
2001 995,489 11,649,349 249,751 12,894,589
2002 435,033 9,539,158 236,812 10,211,003
2003 418,654 8,778,331 225,000 9,421,985
Total 3,179,718 86,544,826 1,738,171 91,462,714
Source: Canal 2004.
Note: US$1 = Col$2,150.
spending. The proxy used for the risk of soil degradation was the cost ofsalinization and erosion for each CAR as estimated by Larsen (2004),and the investment data included all types of soil conservation measures,not just those targeting erosion and salinization. This problem aside, thecategorization of spending was based on the names of investment projectsreported by CARs and, therefore, was somewhat imprecise.
Blackman, Morgenstern, and Topping (2004) used a simple method tocompare the severity of different soil degradation risks in each CAR withthe extent to which CARs focused their investment funds on these risks.They ranked the severity of the soil degradation risks posed in each CARas high, medium, or low, depending on whether the CAR ranked in the
investment in land issues
0
2,000,000
4,000,000
6,000,000
8,000,000
10,000,000
12,000,000
14,000,000
16,000,000
1995 1996 1997 1998 1999 2000 2001 2002 2003year
inve
stm
ent
(th
ou
san
d p
eso
s)
Figure 12.2 CAR Investment in Land Issues
Source: Canal 2004.
Note: US$1 = Col$2,150.

Land Degradation and Deforestation 411
top, middle, or bottom third of the distribution of the soil-degradationrisks measure (economic costs from Larsen [2004]) across all 33 CARs.A similar method was used for ranking the extent to which CARs focusedtheir investment funds on soil degradation. They ranked the percentageof investment funds allocated to soil conservation in each CAR as high,medium, or low, depending on whether the percentage of investmentfunds spent on that risk ranked in the top, middle, or bottom third of thedistribution of these percentages across all 33 CARs.
Having ranked the severity of soil degradation risk and the extent towhich CARs focused their investment funds on this risk, Blackman,Morgenstern, and Topping (2004) compared these two rankings todetermine whether CARs overinvested or underinvested in soil conser-vation. They determined that a CAR underinvested in soil conservationwhen the risk of degradation was ranked either high or medium but theCAR investment spending was ranked low. Similarly, they determinedthat a CAR overinvested in soil conservation when the degradation riskwas ranked low but investment spending was ranked medium or high.
Blackman, Morgenstern, and Topping’s (2004) measures of soil degra-dation risk and spending are detailed in table 12.18.The first data columnpresents a ranking of the risk of soil degradation in each CAR. The right-hand column presents a ranking of the percentage of investment fundsdevoted to this risk in 2001.The last two rows of the third column indicatethe percentage of all 33 CARs that underinvest and overinvest in thatrisk. The data presented in table 12.18 suggest that CARs’ allocations ofinvestment spending to soil conservation do not correlate particularlywell with the severity of risk: 54 percent of CARs underinvest in thisrisk, while no CARs overinvest.
Planning data. By law, POTs are one of the principal tools policy makersare supposed to use to prevent soil degradation. Such plans, however, areoften not used to promote soil conservation and other environmentalobjectives.Table 12.19 presents self-reported information on the percentageof municipalities in each CAR with POTs that contain an environmentalcomponent approved by the CAR. On average, 81 percent of the munici-palities in each CAR have approved environmental components in theirPOTs. However, the existence of these components clearly does not guar-antee that they are implemented or enforced.
Table 12.19 also presents information on the percentage of municipal-ities in each CAR that have basic soil zoning that would enable them toincorporate soil conservation considerations into their POTs. On average,only 60 percent of the municipalities in each CAR have such zoning.

412 Blackman and Sánchez-Triana
Table 12.18 Soil Degradation Risk Compared with CAR Investment
in Soil Conservation
Percentage of total investment
CAR Cost of soil degradation in soil conservation
CAM High Low
CAR Cundinamarca High Low
CARDER Low Low
CARDIQUE Low Low
CARSUCRE Low Low
CAS High Low
CDA n.a. Low
CDMB Medium High
CODECHOCO n.a. Low
CORALINA n.a. Low
CORANTIOQUIA High High
CORMACARENA High Low
CORNARE High Low
CORPAMAG Medium Low
CORPOAMAZONIA n.a. Low
CORPOBOYACA High High
CORPOCALDAS Medium Low
CORPOCESAR Low Low
CORPOCHIVOR Medium Low
CORPOGUAJIRA Low Low
CORPOGUAVIO Medium Low
CORPOMOJANA Low Low
CORPONARIÑO Medium Low
CORPONOR n.a. Low
CORPORINOQUIA n.a. Low
CORPOURABA Medium Low
CORTOLIMA High Low
CRA n.a. Low
CRC Medium Low
CRQ Low Low
CSB Low Low
CVC High High
CVS n.a. Low
Percentage of CARS that
underinvest 54
Percentage of CARS that
overinvest 0
Source: Blackman and others 2005.
Note: n.a = not available. Percentage of underinvestment or overinvestment is based on estimate of public expen-
ditures in CAR for CARs with no cost of soil degradation.

Land Degradation and Deforestation 413
Table 12.19 Land-Use Planning and Soil Zoning by CAR
(percent)
Municipalities with environmental Municipalities with soil
CAR component in POT zoning
CAM 97 97
CAR Cundinamarca 90 97
CARDER 100 100
CARDIQUE 81 48
CARSUCRE 79 72
CAS 58 0
CDA 63 0
CDMB 85 62
CODECHOCO 39 29
CORALINA 50 0
CORANTIOQUIA 86 83
CORMACARENA 100 47
CORNARE 96 96
CORPAMAG 80 97
CORPOAMAZONIA 90 58
CORPOBOYACA 79 75
CORPOCALDAS 89 81
CORPOCESAR 80 40
CORPOCHIVOR 96 72
CORPOGUAJIRA 73 27
CORPOGUAVIO 100 100
CORPOMOJANA 71 43
CORPONARIÑO 73 5
CORPONOR 85 63
CORPORINOQUIA 70 0
CORPOURABA 100 89
CORTOLIMA 53 64
CRA 91 87
CRC 56 2
CRQ 100 100
CSB 67 75
CVC 95 100
CVS 89 79
Average 81 60
Source: Blackman and others (2005), using data from ASOCAR (2002).
Forests
In 2004, Colombia’s forestry sector—dedicated primarily to furnituremanufacturing, pulp, paper, and timber production—accounted for lessthan 1 percent of gross domestic product and provided almost 30,000permanent jobs (Orozco 2004).The current deforestation rate is estimated

at 0.18 percent per year, significantly lower than that in neighboringPanama and Ecuador (IDEAM 2004; SIAC 2002, p. 290). This loss offorest cover causes a variety of environmental problems, including loss ofbiodiversity, destabilization of aquifer sources, and soil erosion. Suchconsequences notably affect the poorest population groups, including alarge percentage of the 800,000 indigenous people and other highly mar-ginalized and disproportionately poor groups that inhabit forested areas.
Forest cover in Colombia is estimated to have been 90 percent beforehuman settlement (WRI 2003). Today, forest cover is about 47 percent oftotal land area.Although this is still above the world average of 30 percent,forest cover in Colombia is distributed extremely unevenly across thecountry.5 Despite the relatively high forest cover, a significant percentageof the national territory has been drastically altered by human action,with varying impacts across regions. Relatively deforested areas extendover large sections east of the mountains and in high population densityareas, with the most affected ones found primarily along the arid peri-Caribbean belt, the Sierra Nevada, and the North Andean regions.
Of the country’s five largest watershed basins, the East Caribbeanwatershed has been almost completely transformed, with only 4 percentof forest cover remaining. The Caribbean region includes some small butimportant industrial forest plantations. The Andean and Orinoquíaregions are more heavily devoted to nonforestland uses. The Andeanregion is highly settled and has the densest population in the country.The Orinoquía region is less densely settled—and more heavily allocatedto cattle ranching. Human pressures on the forest for fuelwood and polesare important in this region.
In contrast, the Amazon and Pacific regions are the most importantforest regions. The Amazon basin is the best preserved, most of its originalcover still remains (table 12.20), and it has the largest forest coverage ofany of the five natural regions. Its forest products represent a significantshare of all wood consumed in Colombia, especially for furniture, andthe region contains the majority of Colombia’s forest plantations.Approximately 14 percent of the region’s forest is indigenous peoples’territory under the collective management of resguardos (indigenoushomelands). The Pacific region has a smaller total area of forest coverthan the Amazon region, but the Pacific contains vast areas of commercialspecies and provides the largest share of Colombia’s industrial harvestsfrom natural forest. Between 60 and 80 percent of total industrial timberharvests come from this region. The Amazon region’s population is largely
414 Blackman and Sánchez-Triana

composed of Afro-Colombian communities, which will benefit fromimproved forest land titles.
A review of the level of deforestation in each department shows two-thirds of the remaining forest area is located within those six departmentslocated in the southeastern part of Colombia, east of the mountain chains(Amazon region).6 The forest cover in these departments averages almost85 percent. Together, they represent one-third of the national territoryand have a very low population density, holding less than 2.5 percent ofthe total population.
Four departments occupy the northeast area lying east of the moun-tain chains.7 Only 3 percent of the total population lives here; despitethe low population density, the forest cover averages only 17 percent,representing 8 percent of Colombia’s total forest area. West of themountains, four coastal departments besides Bolívar and Antioquía(Choco, Valle, Cauca, and Narino) hold 18 percent of the total forestareas; these departments average 42 percent forest cover.
All the other 17 departments, including Bogotá, hold the remaining10 percent of the country’s forest area, averaging 18 percent forest cover,except for the seven departments in the East Caribbean, which have lessthan 10 percent forest cover. The entire area of these 17 departmentsharbors two-thirds of the total population and 60 percent of the agricul-tural cropped land, comprising 23 percent of the national territory. Ruralpopulation density is significantly higher than east of the mountains: 25inhabitants per square kilometer compared with 2 inhabitants persquare kilometer in the east.
The variation in forest cover across departments seems to be largelyexplained by the amount of land under cultivation and the size of ruralpopulations. It is clear, however, that other factors have contributed sub-stantially to forest losses in some specific parts of the country.
Land Degradation and Deforestation 415
Table 12.20 Forest Cover
Forest cover
Total area Percentage of region
Region Hectares Percent Hectares that is forested
Andean 29,997 23 7,727 25.8
Amazon 39,726 35 32,349 81.4
Caribbean 18,817 16 530 4.1
Orinoquía 23,405 20 7,151 30.6
Pacific 7,211 6 5,423 75.2
Source: IDEAM 2002.

416 Blackman and Sánchez-Triana
Cost of DeforestationThe cost of deforestation is difficult to assess; some of the effects ofdeforestation are included in the cost of natural disasters, becausedeforestation is believed to contribute to the increased frequency andseverity of flooding and landslides. Deforestation, however, is likelyalso contributing to agricultural land erosion and decreased quality inwater resources, two processes in which isolation of deforestation isnot possible. Anthropological processes, conversely, are easier to quantify.Following are some perspectives on the historic processes of deforestationin Colombia resulting from a statistical analysis.
To shed some light on the long-term historic processes of forest loss inColombia, a regression analysis was conducted by Larsen (2004). Theanalysis is based on department-specific data on amount of forest area(1996), total land area, land area under cultivation (1991), and estimatedrural population (2002). The results are presented in table 12.21. Asexpected, the coefficient for land area is highly significant, implying thatlarger departments in general have larger forest area (although not neces-sarily higher forest cover). The coefficient for land under cultivationindicates that for each additional hectare devoted to agriculture,4.1 hectares of forest area are lost. Similarly, the forest loss associatedwith total rural population is 1.5 hectares per capita. An interceptdummy was included to prevent bias because the five most northerndepartments east of the mountains8 had a particularly low forest cover.
The difference between actual and estimated forest areas in the north-east region totals 18 million hectares fewer than expected, based on thesize of the rural population and land under cultivation.This would indicateadditional forces of deforestation. In the northwest, Atlántico, Boyacá, LaGuajira, Magdalena, Norte de Santander, and Santander also have signifi-cantly less forested area than expected. In contrast, some departments
Table 12.21 Regression Analysis of Forest Cover
Coefficient t-statistics
Land area (km2) 87.7 18.2
Land under cultivation (hectare) –4.1 –2.6
Rural population –1.5 –2.6
Dummy –2594237.0 –6.7
Constant 214755.0 0.8
R2 0.94
Source: Larsen 2004.
Note: km2 = square kilometer.

Land Degradation and Deforestation 417
have a larger forest area than expected by rural population size and landarea under cultivation; most notably, Bolívar has close to 50 percent forestcover, compared with the 30 percent expected.
Sources of DeforestationThe most important factor contributing to deforestation is illicit crop pro-duction (coca and poppy). Other causes include agricultural expansion,lumber production, firewood consumption, ranching and settlements, andforest fires (IDEAM 2004). However, lack of reliable information anddatabase systems preclude accurate assessment of deforestation and otherindicators of forest conditions.
It is estimated that during 1980 to 1990, coca crops went from negli-gible (traditional crops by indigenous people) to 25,000 hectares. By1994, the official estimate of land used for commercial coca crops was70,000 to 83,000 hectares (Escobar Ramírez 2004). In 1999, CarlosCesar Perafán (1999, referenced in Davis and Sánchez 2003) estimatedthat 17 percent of the country’s illicit crops were being cultivated withinindigenous territories. These illicit crops have had a negative impact onthe indigenous community of Putumayo and on Afro-Colombians of thePatía River in the department of Nariño (Davis and Sánchez 2003). TheMMA indicates that during 1974 to 1998, illegal crops destroyed 850,000hectares of forests in Colombia (Contraloría 2002). Eradication of illegalcrops through fumigation is also considered to be a significant threat toforests and to biodiversity and human health.The debate over fumigationin Colombia is polemic, and has even resulted in repeated requests fromthe Defensoría del Pueblo (the public institution in charge of human rightsenforcement) to the government for the suspension of all chemical aerialfumigation in light of its potential negative effects on health and the envi-ronment (Defensoría del Pueblo 2002).
In addition to illicit crop production, both sprawl and changes in landuse have negative effects, resulting in additional settlers moving to areasadjacent to the forest to avoid the violence in other areas. In essence, thismeans local land use issues are more important to sustainable forestry thanindustrial timber harvests. It also suggests that local rights to the use ofthe forest are critical when concerns related either to deforestation or tolong-term, sustainable forest management are addressed. Under currentconditions, large areas of forest have greater value when converted toagriculture, because local stumpage values are most often derived fromfuelwood, which is a low-value product. Because most of the higher com-mercial timber values go to transportation costs, leaving little benefit to

418 Blackman and Sánchez-Triana
local populations, forests and trees that are more valuable for industrialuses are also under pressure from human settlement.
Furthermore, because the forest’s agricultural and fuelwood users aregeographically dispersed, their dominance as sources of deforestationand forest degradation cause difficulties for the CARs that have forestryresponsibility. These agencies can only hope to lead by good exampleand good reason. They can periodically review the forest condition andenforce easily managed requirements of forest use, but they can neverexpect to control all forest use by extensive populations of dispersedsubsistence users of the forest.
Policy DesignLaw 2 of 1959 declared as forest reserves a total of 58,162,950 hectares,corresponding to over 50 percent of the national territory. Most of theselands are owned by the government. In 1961, Law 35 required two-thirds of any colonized parcel to be cleared to entitle ownership, thusfostering extensive deforestation practices throughout Colombia.
As in other areas of environmental protection in Colombia, the mostimportant legislation to date is the 1974 National Code for RenewableNatural Resources and Environmental Protection (Código Nacional deRecursos Naturales Renovables y de Protección al Medio Ambiente, CNRN).As discussed in chapter 13, the CNRN regulates the conservation and useof forestry resources and sets out the objectives of a National ParksSystem. By 2005, the National Natural Parks System (NNPS) (Sistema dePargues Nacionales Naturales) comprised 46 areas with a total of about9.6 million hectares, approximately 9 percent of the country’s land area.The system is highly representative of Colombia’s different marine andinland forests ecosystems.9
The incentives for deforestation established in Law 35 of 1961 havebeen reversed since 1988 by Law 30 on land tenure and by the law onforestry incentives, aimed at controlling degradation and deforestation.Law 30 of 1988 established that proof of both occupancy and economicexploitation of two-thirds of the land were required for land titling.Conservation of protective vegetation and rational use of forests wereincluded as economic activities.
As elaborated in chapter 13, most indigenous reserves are located innatural forests containing a significant share of the country’s biodiversity.Nearly all indigenous Colombians live in collective territories legallyknown as resguardos. The 1991 Constitution allowed the country to setapart about 30 million hectares, or nearly 26 percent of its area, as

Land Degradation and Deforestation 419
indigenous reserves.According to the 1991 Constitution, these resguardosare inalienable (that is, the title to these lands cannot be acquired merelythrough uninterrupted possession of specific duration). However, theindigenous reserves overlap with the National Parks, occupying some30 percent of the NNPS area.
The 1991 Constitution and Law 70 of 1993 allocated approximately3 million hectares—about 2.5 percent of the country—to Afro-Colombiancommunities settled in the Biogeopraphical Chocó region. This areacomprises forests representative of one of the world’s most impor-tant conservation hot spots, home to great biodiversity and a high levelof endemism.10
Law 99 of 1993 contains provisions to establish Forest ProtectionReserves and Forest Protection–Production Reserves. By 2003, these provi-sions had resulted in more than 2.1 million hectares demarcated and withmanagement plans in place. Integrated Management Districts compriseanother 2.8 million hectares, and 500,000 hectares of land are officiallyprotected by municipalities and departments (Ruiz and Vergara 2003).
In 1993, Congress issued a law to create Forestry Incentive Certificates,by which forest owners who undertake reforestation or forestry planta-tions of a protective nature can receive a partial reimbursement of refor-estation costs derived from either direct investment or maintenance(70 percent of costs for native species, 50 percent for introduced species).In addition, Colombia has introduced tax deductions for investments inforestry plantations. This mechanism has been less successful than directsubsidy. The use of subsidies signifies a transfer of financial resourcesfrom taxpayers to reforesters. These subsidies have been justified by theargument that reforestation practices are beneficial to the environment,particularly for soil conservation and erosion control, and as a buffer againstclimate change.
The forestry regulations currently in place control the use and exploita-tion of forests and oil-nut palms and prohibit the destruction of oil-nutpalms when located in natural forests. Exceptions to this prohibition mustbe approved by the Ministry of Finance.The regulations also establish thatany attempt to use forest resources for private gain (in private or publicareas) is illegal. All such illegal actions are subject to a fine—betweenCol$1 (US$0.005) and Col$100 (US$0.05)—or prison.
The CNRN and forestry regulations issued in the 1970s and 1980sestablish that the National Institute of Renewable Natural Resources(Instituto Nacional de los Recursos Naturales Renovables, INDERENA—the MAVDT’s predecessor) is responsible for granting permits to exploit

420 Blackman and Sánchez-Triana
and use public forests. For areas smaller than 20,000 hectares, such permitsare assigned for a maximum of 10 years. To obtain a permit, the agentmust undertake an environmental impact assessment. For areas largerthan 20,000 hectares this right must be assigned by public bidding.
By law, all agents that exploit public forests must restore them.Regulations establish that all reforestation programs must be approvedby the responsible local authority, except for forests developed onuntilled, uncultivated, or inappropriate land by private agents who retainfull control of the forest.
Forestry regulations also provide economic incentives for the conserva-tion of water and land in the upper Magdalena River basin.11 The one-time,lump-sum economic incentive is to be given to individuals or groups offarmers who invest in agricultural improvements, including labor practices(crop rotation, intercropping, and plantation on alternate rows), refor-estation, pasture improvement, the use of natural resources such as livebarriers, and mechanical practices for erosion control and water conserva-tion. Forestry regulations also state that the incentives will be prioritizedin the following order: establishment of new farms; maintenance of newfarms; and erosion control.
In the 1990s, a Forest Conservation Certificate (Certificado deIncentivo Forestal) was established for private owners of virtually undis-turbed forest areas, in recognition of and as compensation for thecosts of protecting the forest. The National Council for Economic andSocial Policy is responsible for assigning these financial resources. Theareas eligible to receive the incentive are forests more than 2,500 metersabove sea level, those near water sources, those in natural parks, andthose in areas that provide water resources to municipalities. The localenvironmental authority is to monitor and evaluate use of the forest.The economic incentive in the first year is equivalent to seven timesannual minimum wages (as calculated annually by the national govern-ment) per hectare, and in subsequent years it will be adapted using thefollowing equation:
VA � VB � FAR
where
VA � the adjusted value every year VB � the base value established by the environmental authorityFAR � the regional factor.

Land Degradation and Deforestation 421
Furthermore,
FAR � FTP � FPT
where
FTP is an altitude factor assigned as follows:
Altitude FTP
Less than 1,000 meters 0.631,001 to 2,000 meters 0.772,001 to 2,500 meters 0.89More than 2,500 meters 1.00
FPT is an area factor assigned as follows:
Area FPT
Less than 3 hectares 2.03 to 10 hectares 1.611 to 20 hectares 1.421 to 30 hectares 1.2More than 30 hectares 1.0
Within the development plans of the 1990–98 administrations, andbased on the analysis by USAID-Colciencias (1989) and the WorldBank (1989), the government made deforestation control a priority forgovernment agencies. By 1990, the main driving forces of deforestationwere found to be human settlement, use of firewood, lumber produc-tion, furniture manufacture, and pulp and paper production.Deforestation control was made a joint responsibility of the MMA andthe CARs. The government designed the Forestry Action Plan forColombia and financed it through loans from the Inter-AmericanDevelopment Bank and the World Bank. The policies for investing inreforestation and watershed basin management have had significantfinancial support from the government since 1993.
Nevertheless, several authors (Andrade 2005; Orozco 2004; Ponce deLeón 2005; Rodríguez Becerra 2005) argue that the priorities of theforestry policy should include
• creating a reliable and publicly accessible forest information system tofacilitate planning and decision making

422 Blackman and Sánchez-Triana
• increasing employment and income-generating options for forestdwellers, reducing negative environmental impacts on water basinsand soils, and conserving biodiversity
• generating alternatives to diversify nontimber forest products andimprove the livelihood of forest communities
• promoting sustainable exploitation of forest resources• building consensus by involving the government and the public on
creation of an environmental services market, improved basin manage-ment, and decentralization of forest management.
Ruiz and Vergara (2003) argue that the valuation and capture of rev-enues from environmental services represent potential revenue for ruralcommunities. These revenues may help illegal crop eradication and indi-rectly assist with the peace process.
Effectiveness of Policy ImplementationColombia has competitive sectoral advantages stemming from its bio-geographical diversity, which provides a wide variety of species witheconomic potential. In addition, the productivity of Colombia’s forestryplantations has increased from 16 cubic meters per hectare per year in1980 to 25 cubic meters per hectare per year in 1990, which are nationallevels comparable with those in Chile.
Despite the shortcomings in primary information sources, it seemsthat the policies designed to control deforestation have been quite effective.Estimates of deforestation rates in the 1970s and 1980s amounted to600,000 hectares per year (INDERENA 1978; World Bank 1989).Currently, deforestation estimates are 91,932 hectares per year (IDEAM2004).12 Law 30 of 1988 and Laws 70 and 99 of 1993, and enforcementby INDERENA and the CARs, have contributed to decreasing the rateof deforestation. It is also probable that other causes reduced new settle-ment areas significantly throughout Colombia, to the point that accordingto IDEAM (1998, p. 295), the country “lost about 145,000 hectares offorest and recovered secondary forest cover in some 3,445,000 hectares,resulting in a net gain of 3,300,000 hectares of forest cover in 10 years,or 330,000 hectares per year.”
A 2004 report by IDEAM (table 12.22) showed the largest increasesin green cover during 1994 to 2001 were those in agroecosystems(57,873 hectares per year [ha/yr], average growth rate 0.2 percent),forestry plantations (15,777 ha/yr; average growth rate 7.7 percent), andhuman settlements (urban and artificial—3,011 ha/yr, average growth rate2.3 percent). Covers showing significant surface reduction for the same

period include forests (101,303 ha/yr) and Andean highlands (snow)(1,765 ha/yr).
Reforestation DataThe reforestation policy has been very effective. Approximately180,000 hectares were reforested during 1991 to 2002 (table 12.23).However, according to MAVDT (2003), approximately 15 millionhectares that should be used for forests and forestry activities have beendevoted to other uses. Thus, only about 1 percent of the forest deficit wasreforested during 1991 to 2002.
Land Degradation and Deforestation 423
Table 12.22 Changes in Green Cover in Colombia, 1986–94 and 1994–2001
Forest cover (thousand hectares)
1986–94 change 1994–2001 change
Annual Annual
Region 1986 1994 Total average 2001 Total average
Urban and artificial 92 125 33 4 144 19 3
Agroecosystems 33,382 34,367 985 122 34,749 381 58
Forests 56,902 56,280 –622 –77 55,613 –667 –101
Forestry plantations 107 165 58 7 269 104 16
Moors 1,725 1,614 –111 –14 1,627 13 2
Savanna 15,525 15,531 6 1 15,556 25 4
Snow 54 40 –14 –2 29 –11 –2
Wetlands 2,991 2,848 –143 –18 3,006 158 24
Scarce vegetation cover 3,124 2,958 –166 –20 2,949 –9 –1
Without natural cover 57 54 –3 0 56 2 0
Source: IDEAM 2004.
Table 12.23 Protective Reforestation in Colombia, 1991–2002
Year Area planted (hectares)
1991 1,100
1992 739
1993 105
1994 3,691
1995 17,951
1996 16,777
1997 21,277
1998 13,815
1999 7,204
2000 14,949
2001 19,109
2002 64,810
Total 181,527
Source: Blackman and others (2005), using data from IDEAM (2003).

424 Blackman and Sánchez-Triana
Bill on Forestry Resources ManagementAt the time this chapter was completed (June 2005), Colombia’sNational Congress was discussing a forestry bill. The objective of the billis to foster development of the Colombian forest sector and regulate theactivities related to the management, exploitation, and sustainable use offorest resources, and the transformation, transport, and commercializa-tion of derived goods and services. Although various stakeholders agreethat a solid legal framework is needed to unify the current statutes andlaws, the bill has been controversial. Some of the main criticisms are thatit does not clearly support the timber industry, and has little in-depthtreatment of conservation, protection, and restoration issues; it lacks away to pay for the environmental services approach; it undermines and isinconsistent with the goals of the Plan Verde and the National ForestryDevelopment Plan (2000), Law 99 of 1993, Law 70 of 1994, and theForest Policy of 1997, among others; it does not acknowledge indigenouspeoples and Afro-Colombian communities as owners of the forests intheir lands; and it does not incorporate the principles and recommendationsof international agreements and conventions that Colombia has ratified,such as the Convention on Biological Diversity, the International TimberAgreement, the Ramsar Convention, the United Nations Convention toCombat Desertification and Drought, and the Framework Convention onClimate Change (Andrade 2005; Galán 2005; Ponce de León 2005;Roldán 2005). A general criticism of the bill is that it promotes a differ-ent perspective from the one established in the current policy and insti-tutional framework. The perspective established in the existing policystems from the perception of forests as complex ecosystems that producegoods and supply multiple services and that are a basis of biological andcultural diversity. The bill, according to some of its critics, implies thatconservation is solely a tool for production, rather than an end in itself.
Several stakeholders (Andrade 2005; Ponce de León 2005; RodríguezBecerra 2005) have suggested modifications to the proposed forestry billto move it toward sustainable development in the sector, defined as theprocess to reach optimal and sustained production of forestry resourcesfor society’s benefit and to improve the quality of life, without affectingthe equilibrium and integrity of forest ecosystems.The forestry bill couldinclude provisions to
• reduce rural poverty through job creation, increased profitability of for-est activity, and implementation of payments for environmental services
• reduce adverse environmental impacts associated with the sector,including further reduction of deforestation rates, recovery of degraded

land through reforestation, and reconversion of marginal agriculturalzones for productive use
• reduce pressure on key areas of biodiversity• reduce forest fires and increase carbon dioxide collection• strengthen national security through reductions in illegal activities• promote public participation in protection and restoration programs.
Conclusions and Recommendations
Soil Erosion and SalinizationData on soil erosion and salinization in Colombia are limited, and dis-crepancies exist among the available studies as a result of differences inmethodology, terminology, and coverage. Nevertheless, existing datasuggest that both erosion and salinization are significant problems. Theyindicate that between 4 percent and 23 percent of the country’s soil isseriously eroded and that the problem appears to have worsened overthe past 15 years. Serious soil erosion is most prevalent in the Caribbean,Andean, and Orinoquía natural regions, which are among the most pop-ulated or productive regions in the country. Existing salinization studiessuggest that soils in approximately 10 percent of the country now havelevels of salinity high enough to adversely affect crop and rangelandproductivity. Problem areas are located primarily in the Caribbeannatural region.
Soil erosion and salinity generate significant economic costs. Larsen(2004) estimated the annual costs stemming solely from lost crop produc-tivity at Col$1,440 billion (US$670 million) and attributed 60 percent ofthese costs to erosion and the remaining 40 percent to salinization.Salinization is mainly a result of irrigation, while a key driver of erosion isthe expansion of agricultural activities, particularly cattle ranching.
Few national laws or regulations specifically target soil erosion andsalinization. Most of the existing legislation and regulations concernbroader problems such as land use planning and deforestation, and donot explicitly contemplate the link between these issues and soil erosionand salinization.
Given the dearth of specific policies addressing land degradation and thelack of performance indicators for environmental regulation in Colombia,assessing the extent of the problem and finding solutions is difficult.Nevertheless, existing data suggest that efforts to prevent, control, and miti-gate land degradation by CARs have been minimal. CARs’ investmentsin land quality during 1995 to 2003 were less than 2 percent of totalCAR investment. A comparison across the 33 CARs of the severity of
Land Degradation and Deforestation 425

Table 12.24 Recommendations
Priority:
short (S), medium (M),
Recommendation and long term (L) Participating institutions
Create a reliable and publicly accessible forest, soil erosion, and soil salinization L Congress, Ministry of Agriculture
information system to facilitate planning and decision making
Develop analytical work to identify the costs and benefits of alternative M– L Ministry of Agriculture
interventions to control soil erosion and soil salinization
Generate alternatives to diversify nontimber forest products and improve the L Congress, Ministry of Agriculture
livelihoods of forest-dwelling communities
Foster the capacity of forest-dwelling and indigenous communities and cooperatives M– L Congress, Ministry of Agriculture
to profit from the sustainable and productive uses of forest areas
Reduce rural poverty through job creation, increased profitability of forest activity, and M– L Congress, Ministry of Agriculture
implementation of payments for environmental services
Establish specific mechanisms for cost recovery, nontimber forest production, ecological M– L Congress, Ministry of Agriculture
services valuation, small-scale user permits, and intellectual property rights
Ensure public participation in sectoral decision making regarding soil degradation control S Congress, Ministry of Agriculture
and forestry management, especially for communities, small farms, and local civil
society organizations
Source: Authors.
426

Land Degradation and Deforestation 427
soil degradation risk with the extent to which CARs focus their invest-ment funds on this risk suggests that CARs systematically underinvest inaddressing this risk. Finally, data on land use planning suggest that thismechanism for preventing soil degradation has significant limitations.About 20 percent of municipalities have no environmental componentin their POT, and 40 percent do not have the soil zoning needed toensure that the environmental components are effective in preventingsoil degradation.
Forestry PolicyForestry policy has been effective in reducing deforestation rates from600,000 hectares annually in the 1970s and 1980s to 90,000 hectares in2004. During 1988 to 1998, recovered secondary forest amounted to3,445,000 hectares. The net gain in forest cover was thus estimated at330,000 hectares per year. In addition, reforestation activities during1991 to 2002 accounted for 180,000 hectares.
The proposed forestry bill is a chance to promote increased opportuni-ties for the development of income-generating activities and for generationof employment for forest dwellers and indigenous peoples living in bufferzones of conservation areas. The bill could provide an opportunity tostrengthen the capacity of these communities and cooperatives that so farhave been unable to take greater advantage of sustainable and productiveuses of forest areas. The forestry bill also provides an opportunity to put inplace specific mechanisms for cost recovery, nontimber forest production,ecological services valuation, small-scale user permits, and intellectualproperty rights. All these mechanisms could be effectively applied toindigenous communities and help foster accountability by ensuringstronger involvement of local communities, small farmers, and local civilsociety organizations in sectoral decision making.
Table 12.24 summarizes the recommendations made in this chapter.
Notes
1. Allen Blackman and Ernesto Sánchez-Triana are the authors of this chapter,which draws heavily from a background document prepared for this study byBlackman and others (2005).
2. They are factors of, relating to, or resulting from the influence of humanbeings on nature.
3. Future studies of soil degradation are planned. According to an employee atIGAC’s Agrology Section, IGAC is currently in the process of establishing

428 Blackman and Sánchez-Triana
an agreement with the Ministry of Environment, Housing and RegionalDevelopment to design studies evaluating the current state of erosion andsalinization in the country.
4. This is likely to change under the new PAT formulation methodology adoptedby the government and CARs in 2004.
5. The following discussion and analysis is based on forest cover data fromIDEAM (2002).
6. The southeastern departments include Amazonas, Caquetá, Guainía,Guaviare, Putumayo, and Vaupés.
7. The northeastern departments include Arauca, Casanare, Meta, and Vichada.
8. Those departments include Arauca, Casanare, Guainía, Meta, and Vichada.
9. Within the system are tropical rainforests, dry forests, and subhumid tropicalforests; xerophytic and desert scrublands; Andean and cloud forests; moors;natural savannas; alluvial forests near rivers; and mangroves, among othertypes of vegetation.
10. Endemism includes biological species found only within a physically narrowhabitat.
11. The upper Magdalena River basin includes the area surrounding theCombeima River in the departments of Huila and Tolima.
12. The Contraloría (2002, p. 7) reports that “Colombia does not have a baselinethat allows for determination of the state of, and changes in, the quality andquantity of natural resources and the environment over time; for example,reliable statistics do not exist on the state of natural resources, the pressureexerted on them and the subsequent response, which hinders follow-up andevaluation of national and state management in preserving it”.
References
Andrade, Angela. 2005. “La ley forestal y su relación con los acuerdos interna-cionales.” Foro Nacional Ambiental. http://www.fescol.org.co/, accessed June11, 2005.
ASOCAR (Asociación Colombiana de Autoridades Ambientales). 2002.Spreadsheet containing self-reported performance data provided by CARs for2002. ASOCAR, Bogotá.
Baquero, I., J. J. Rivera, H. Mendez, C. Escobar, E. Almanza, and J. R. Galindo.2000. Cuentas Ambientales del Suelo. Bogotá: Corpoica.
Blackman, Allen, Richard Morgenstern, Libardo Montealegro Murcia, and JuanCarlos Garcia de Brigard. 2005. “Review of the Efficiency and Effectivenessof Colombia’s Environmental Policies.” Final Report to the World Bank,Resources for the Future, Washington, DC.

Land Degradation and Deforestation 429
Blackman, Allen, Richard Morgenstern, and Elizabeth Topping. 2004.“Institutional Analysis of Colombia’s Autonomous Regional Corporations(CARs).” Consultant Report, Resources for the Future, Washington, DC.
Canal, Francisco. 2004. “Orientación del Presupuesto de las CorporacionesAutónomas Regionales—CARs—en los Planes de Acción Trianual: Periodos1995–2003.” ASOCAR, Consultant Report prepared for the World Bank.
Contraloría (Contraloría General de la República). 2002. Estado de los RecursosNaturales y del Ambiente 2001–2002. Contraloría, Bogotá.
Corporación Autónomas Regionales y los Valles de Upate y Chinquinquirá(CAR). 1983. Atlas CAR. Bogotá: CAR.
CVC. 2002. “Áreas Afectadas por salinización del Suelo en el Departamento delValle del Cauca.” Internal working paper of the Patrimony Subdirection,CVC, Cali, Colombia.
Davis, Shelton, and Enrique Sanchez. 2003. “Indigenous Peoples and the Afro-Colombian Community.” In Colombia: The Economic Foundation of Peace, ed.Marcelo Giugale, Olivier Laforcade, and Connie Luff , 787–823. World Bank:Washington, DC.
Defensoría del Pueblo. 2002. Resolución Defensorial Nacional No. 026 DerechosHumanos y Derecho Internacional Humanitario en el marco del conflicto armadoy de las fumigaciones de los cultivos de coca en el Departamento del Putumayo.Bogotá: Defensoría del Pueblo.
Escobar Ramírez, José J. 2004. Síndromes de sostenibilidad ambiental del desarrolloen Colombia. Taller Síndromes de sostenibilidad del desarrollo en AméricaLatina. Santiago de Chile, 16 y 17 de septiembre de 2002. Serie Seminarios yConferencias No. 41, Cepal, Naciones Unidas Santiago de Chile.
Galán, Francisco Alberto. 2005. ¿Avance o retroceso respecto de la legislación ambi-ental y de los pueblos indígenas y comunidades afro-antillanas? Foro NacionalAmbiental. http://www.fescol.org.co/
García, Alvaro. 2004. Personal commentary to Allen Blackman. In “Review of theEfficiency and Effectiveness of Colombia’s Environmental Policies,” Blackmanand others (2005). Final Consultant Report to the World Bank, Resources forthe Future, Washington, DC.
IDEAM (Instituto de Hidrología, Meteorología y Estudios Ambientales). 1998.“El Medio Ambiente en Colombia.” IDEAM, Bogotá.
———. 2002. “First Generation of Indicators of the Environmental InformationBaseline.” IDEAM, Bogotá.
———. 2003. Informe Anual del Estado del Medio Ambiente y los RecursosNaturales Renovables. IDEAM, Bogotá.
———. 2004. Annual Report on the State of the Environment and NaturalRenewable Resources in Colombia. Bogotá: IDEAM.

IGAC (Instituto Geográfico Agustín Codazzi). 1988. Suelos y Bosques deColombia. Bogotá: IGAC.
IGAC, Ministry of Agriculture, and Corpoica. 2002. Cobertura y Uso actual delSuelo. Bogotá: IGAC.
INDERENA (Instituto Nacional de los Recursos Naturales Renovables). 1978.“Memorias del Gerente de Inderena, 1972–1978.” INDERENA, Bogotá.
Lal, R. 1990. Soil Erosion in the Tropics: Principles and Management. New York:McGraw- Hill, Inc.
Larsen, Bjorn. 2004. “Cost of Environmental Damage: A Socio-Economic and Environmental Health Risk Assessment.” Prepared for the Ministry ofEnvironment, Housing and Regional Development, Colombia.
MAVDT (Ministerio de Ambiente, Vivienda y Desarrollo Territorial). 2003.Introducción. En Memorias del Día Nacional de la Desertificación y la Sequía.Bogotá: MAVDT.
Orozco, José Miguel. 2004. “Las Políticas Forestales en Colombia: Análisis deProcesos de Formulación, Contenidos y Resultados Globales.” UniversidadDistrital Francisco José de Caldas, Bogotá.
Perafán, Carlos Cesar. 1999. “The Impact of Illicit Drugs on Indigenous Peoples.”Working Paper InterAmerican Development Bank, Washington, DC.
Ponce de León, Eugenia. 2005. “Algunos comentarios al proyecto de ley generalforestal.” Foro Nacional Ambiental. http://www.fescol.org.co/, accessed June11, 2005.
Rodríguez Becerra, Manuel. 2005. “Asuntos esenciales para comunicar al señorPresidente en relación con la Ley Forestal.” Foro Nacional Ambiental. http://www.fescol.org.co/, accessed June 11, 2005.
Roldán, Roque. 2005. “Proyecto de ley forestal y derechos territoriales de indigenasy afrocolombianos.” Foro Nacional Ambiental. http://www.fescol.org.co/,accessed June 11, 2005.
Ruiz, Juan P., and Walter Vergara. 2003. “Natural Resources and GlobalCommons: Capital for Sustainable Development.” In Colombia: The EconomicFoundation of Peace, ed. Marcelo Giugale, Olivier Laforcade, and Connie Luff,131–42. Washington, DC: World Bank.
Scherr, S., and S. Yadav. 1996. “Land Degradation in Developing Countries:Implications for Food Agriculture and the Environment to 2020.” InternationalFood Policy Research Institute Discussion Paper 14, Washington, DC.
SIAC (Sistema de Información Ambiental de Colombia). 2002. Concepts,Definitions and Environmental Information Instruments in Colombia.
Universidad del Valle. 2002. Revista Universitaria de Periodismo Científico.Univalle, Cali, Colombia.
USAID (U.S. Agency for International Development)-Colciencias. 1989. PerfilAmbiental de Colombia. Bogotá: ESCALA.
430 Blackman and Sánchez-Triana

World Bank. 1989. “Colombia: Country Environmental Profile.” World Bank,Washington, DC.
———. 2005. “Colombia Sustainable Development Policy Loan.” ProgramDocument No. 32360-CO, World Bank, Washington, DC.
WRI (World Resources Institute). 2003. “Earthtrends, Country Profile,Colombia.” World Resources Institute, Washington, DC.
Land Degradation and Deforestation 431


By several measures, Colombia is among the world’s five most ecologicallydiverse countries. With an area of 1.14 million square kilometers, Colombiarepresents only 0.8 percent of the world’s surface area, yet it is home to 15 per-cent of all known terrestrial species. Although protected areas and indigenousreserves cover 34 percent of Colombia’s national territory—among the highestlevels of biodiversity in the world—the findings of this chapter suggest that themeasures to create protected areas do not accurately reflect the social concernsof inhabitants of those areas. Greater involvement of local stakeholders hasalready begun to show positive results and could significantly benefit biodiver-sity use and conservation.
Although Colombia’s contribution to global greenhouse gas (GHG) emissionsis less than 0.3 percent of the world’s total, it has taken advantage of interna-tional financial mechanisms to develop renewable energy projects aimed atreducing GHG emissions. Likewise, Colombia contributes less than 0.45 percentof the total ozone-depleting substances (ODS) emitted globally and has reducedthe amount of ODS with grants from the Montreal Protocol.
Colombia is one of the world’s five most ecologically diverse countries(IDEAM 2003).1 With an area of 1.14 million square kilometers, Colombiaoccupies only 0.8 percent of the world’s surface area, yet it houses 15 per-cent of all known terrestrial species. It has 10 percent of the world’s flora
C H A P T E R 1 3
Biodiversity Loss and Other Global
Environmental Problems
433

and fauna, 20 percent of the planet’s bird species, one-third of the primatespecies in tropical America, and more than 56,000 registered floweringplant species, including 15 percent of the world’s total orchid species. Thecountry is first in the world in the number of bird and amphibian speciesand second in vascular plants. The country possesses 18 ecological regions(IDEAM 2003), the second highest of any country in Latin America.Indeed, Colombia’s ecosystem map (IDEAM 2003) identifies 65 ecosystemtypes. Colombia encompasses 12 percent of the continent’s humid and dryhotspots and two of the world’s most important areas for biodiversity: theBiogeographical Chocó corridor and the Amazon Basin (IDEAM 2003).Protected areas and indigenous reserves account for 34 percent ofColombia’s national territory and enjoy some of the highest levels of bio-diversity in the world.
Colombia’s cultural and ethnic diversity is also exceptional.The UnitedNations Educational, Scientific and Cultural Organization (UNESCO) hasdeclared five sites in the country to be of important historical and culturalheritage to humanity. Some 84 indigenous groups recognized by the gov-ernment have a total population of 800,000 (2 percent of the nationalpopulation).These groups live in 1,500 communities and are located in 27of the country’s 33 departments. Indigenous communities generally inhabitareas rich in biodiversity (UAESPNN 1999). Local indigenous cultureshave developed ways of living based on centuries of experimenting withthe balance between the needs of human communities and the needs oflocal ecosystems.2 Their ancestral land-management practices have largelypreserved diverse ecosystems, and large regions within their territoriesremain relatively intact.
Regarding other global environmental problems, Colombia has takenadvantage of international financial mechanisms to develop renewableenergy to reduce the amount of ozone-depleting substances (ODS).Emissions of ODS in Colombia add up to less than 0.45 percent of globalemissions, and global greenhouse gas (GHG) emissions are between 0.2 and0.3 percent. Colombia emits very small amounts of carbon dioxide (CO2);1990 emissions were equivalent to about 1 percent of U.S. emissions.
This chapter discusses the problems associated with biodiversity lossand the actions implemented in Colombia to tackle the problems associatedwith climate change and ozone depletion.
Biodiversity
Although an extensive literature examines biodiversity, it displays little con-sensus on estimating the potential value of biodiversity conservation. Areas
434 Ahmed, Morgestern, and Urrutia

that could receive benefits from such conservation include ecotourism,genetic prospecting for pharmaceuticals, harvesting of renewable resources,and the intrinsic values of species. Limited work has been done on how thevalue of biodiversity conservation should be captured to give local communi-ties or national governments an incentive to conserve (Polasky and others2000). According to a study prepared by Fedesarrollo in 2002, global bene-fits associated with the biodiversity in Colombia’s National Natural ParksSystem are valued at US$3.2 million (Col$6,720 million).A study on greenmarkets will be conducted in the medium term to evaluate the contributionof biodiversity to the Colombian economy. Following is a review of theexisting empirical literature that attempts to estimate the value of variousaspects of biodiversity.
A current trend in global tourism is for travelers to select their destina-tions based on the flora and fauna of the location, also known as nature-based tourism or ecotourism. For some countries, such as Costa Rica andKenya, this type of tourism generates a significant flow of income. A studyconducted in Costa Rica places an estimated annual value of US$2 millionon income derived from the Monteverde Reserve (Echeverria, Hanrahan,and Solorzano 1995). In Madagascar, ecotourism-generated benefits wereestimated to be between US$2 million and US$3 million annually, asmeasured in 1987 dollars (Maille and Mendelsohn 1991).
These estimates are for the total value of the travel. The destinationcountry does not receive the full amount of this revenue (Polasky 1996).As an example, one study estimates that of approximately US$1,300spent by a typical tourist to the Galapagos Islands, a mere US$100 ofthat amount actually ends up in the local economy (Southgate 1996 cit-ing de Miras 1994). Other concerns regarding ecotourism stem fromquestions about its capacity to generate well-paid local jobs and serve asa catalyst for the development and growth of local economies, and thepossibility that it might cause greater environmental degradation to thehabitats visited by the ecotourists (Polasky 1996).
Adequate flora and fauna are not the only criteria for a successful eco-tourism site; it must also provide potential visitors with assurances of theirpersonal security. Colombia’s situation is a prime example of this: despite itsrichly diverse ecosystems, many North American and European travelersperceive the country to be an unsafe destination because of the regional drugtrade, guerilla activity, and metropolitan crime. If the actual and perceivedsituations do not improve, Colombia will be overlooked as a favorable des-tination, with travelers visiting Costa Rica or Belize instead (Polasky 1996).
Genetic prospecting is the systematic search for new sources of chemi-cal compounds, genes, proteins, microorganisms, and other products that
Biodiversity Loss and Other Global Environmental Problems 435

have potential economic value and that can be found in natural biologicalwealth. Therefore, promoting the conservation of animal and plant speciesprovides a strategic long-term benefit because species that do not have acurrent use may prove valuable as research technologies develop. This isknown as an option value, because the estimated value of the species can berealized only if its extinction is prevented (Polasky 1996). Experts, how-ever, have a difficult time arriving at a consensus on the monetary value thatshould be placed on land (per hectare) to estimate the genetic prospectingvalue for pharmaceutical companies. One study determined that the landheld a value of US$1 per hectare for the firm doing the actual geneticprospecting, but that the public benefit of these efforts placed the value atUS$50 per hectare, indicating that subsidies to encourage conservation andgenetic prospecting would be justified (Mendelsohn and Balick 1995).
Resource harvesting is the harvesting of biological resources for the pur-pose of subsistence or economic gain. A prominent example of this is thecommercial fish market. Advocates of resource harvesting argue that, ifdone in a sustainable manner, the harvesting of a biological resource willyield the highest current value for that resource. This argument is valid,however, only when the biological growth rate of the harvested resource isgreater than the social discount rate.When the reverse is true, the course ofaction that will yield the maximum present value of the harvest, even as theresource stock approaches zero, is to make the resource extinct (Clark1973). Obviously this is not a responsible approach for resource managers.
One study addressing tropical deforestation issues determined thatthe value of nontimber products harvested on a sustainable basis wouldyield much greater financial returns than a one-time sale of timber fromclear cutting followed by nonforestry uses of the land (Peters, Gentry,and Mendelsohn 1989). Another study, however, argues that this prem-ise is unfounded given the unique characteristics of any site, such as soiltype and access to markets (Southgate 1996).
Existence value refers to the intrinsic value of an asset, usually naturalor environmental. It is the value of the benefits derived from the asset’sexistence alone and is separate from the value accruing from any use orpotential use of the asset. Because there are no observable prices forthese values, nor perhaps any observable behavioral trail, most economicmethods for estimating value are not applicable. Perhaps the only methodby which economists can estimate existence values is contingent valuation.In general, more charismatic species (for example, large mammals) tendto have higher willingness-to-pay values than species lacking in charisma(for example, the striped shiner—a small bait fish). However, the range
436 Ahmed, Morgestern, and Urrutia

of reported values across different studies, even for studies on the samespecies, is often quite large. Economists are unable to estimate the valueof biodiversity conservation with much precision.
Along with the usual problems associated with implementing andinterpreting a contingent valuation study, several facets of the speciesconservation issue present special difficulties. For example, as in manysettings, lack of information or familiarity may make it difficult for peo-ple to accurately assess value. Conserving species is viewed as a moralimperative by a fraction of the population. Asking them about their will-ingness to pay to conserve a species may be viewed similarly to askingthem about their willingness to pay to avoid having a murder com-mitted (Polasky 1996). Even for people with less extreme views, there arevarious ethical and emotional commitments that might cause responsesto survey questions to be highly variable. In addition, analytical work ondiversity measures focuses on the relationships among species. The valueof conserving any particular species is a function of the set of species thatis conserved (Solow and Polasky 1994; Weitzman 1992). This factor istypically ignored in contingent valuation studies that focus primarily onthe value of a single species.
These factors illustrate the special challenges associated with the for-mal economic valuation of biodiversity. Nonetheless, from the livelihoodand cultural perspective of local indigenous groups coexisting in nationalparks, the value is potentially immeasurable.
The National Protected Areas System
Colombia’s significant natural endowment is conserved within the NationalProtected Areas System (NPAS), which includes public and privatelyowned lands throughout the country (table 13.1). The NPAS contains theNational Natural Parks System (NNPS) consisting of 49 National Parksspanning close to 10 million hectares. The area covered by the nationalparks occupies close to 10 percent of the national territory, which is slightlybelow the average of 11.2 percent for the Latin American region (figure13.1). Compared with the other four highly diverse Latin American coun-tries, the percentage of land that is protected is larger than that of Brazil andPeru, and similar to that of Mexico, but smaller than that of Ecuador.Colombia protects an area larger than that protected by most biodiversecountries outside the region, including China, India, Kenya, and Malaysia.Protected areas in higher income countries such as Canada, Italy, and Japancover similar or smaller shares of their territory. The NNPS constitutes the
Biodiversity Loss and Other Global Environmental Problems 437

country’s principal biodiversity conservation strategy. The NNPS encom-passes 50 of Colombia’s 108 biogeographical districts (Biocolombia 2000)and includes 12 percent of Latin America’s humid and dry wildernessrefuges and two of the most biodiverse regions in the world: the Biogeo-graphical Chocó and the Amazon Forest (IDEAM 2003).
The NPAS also includes 5 million additional hectares of land underconservation. This system contains two internationally declared wetlandsthrough the Wetlands Convention (Ramsar) and five World BiosphereReserves: the Sierra Nevada de Santa Marta, the Ciénaga Grande deSanta Marta, the San Andrés and Providencia Archipelago, the Tuparro
438 Ahmed, Morgestern, and Urrutia
0
2
4
6
8
10
per
cen
t 12
14
16
18
20
Ecuad
or
Colom
bia
Mex
ico
Kenya Ita
ly
China
Japa
nBra
zilPer
u
Mala
ysia
Philipp
ines
India
Table 13.1 The National Protected Areas System
Protection categories Hectares
National Natural Parks System: 49 areas under 5 management categories 10,320,865
Civil Society Natural Reserves: 205 reserves; approximately 324 properties,
111 of which are registered in the NPAS; 183 reserves are part of a National
Reserves Network. 40,335
Territorial Protected Areas: 247 areas in 46 management categories;
includes 79 municipal areas, 108 regional areas managed by CARs,
and 17 departmental areas 243,825
Regional Protected Areas (without forest reserves) 3,439,452
National Forest Reserves (Law 2 of 1959) 1,371,940
Indigenous Territories: 30 million hectares (protected areas to be defined) 30,000,000
Ethnic Afro-Colombian Community Territories: 3 million hectares
(protected areas to be defined) 3,000,000
Source: IDEAM 2004.
Figure 13.1 National Protected Areas
Source: World Bank 2005.

National Park, and the Colombian Massif. In addition, the UnitedNations Educational, Scientific and Cultural Organization declared theKatíos National Park a World Heritage Site because it exhibits the mostinteresting natural regeneration and recovery capabilities among all ofColombia’s national parks (Ruiz and Vergara 2003). Under Law 99 of1993, the National Parks Authority (NPA) is the environmental regulatoryagency for the areas within the NNPA.
The total area under effective conservation and protection has beenincreasing as a result of the decentralization and organizational strengthen-ing process led by the Colombian government aimed at increasing thenumber of effective management categories and conservation strategies. Law99 of 1993 assigns to Autonomous Regional Corporations (CorporacionesAutónomas Regionales, CARs) the task of establishing regional protectedareas and creating management categories for reserves promoted by civilsociety, thus promoting active public participation in conservation. CARsalso exercise authority in national park buffer zones. Over 200 natural areasare protected under municipal, departmental, and regional conservationcategories. These categories include the following:
• Private Reserves. The Civil Society Reserves Network represents land-owners who, through their own initiative, provide part or all of theirlands for conservation purposes. In 1993, Law 99 (which created theNational Environmental System) officially recognized civil societynatural reserves. According to IDEAM (2003), by 2005 over 200reserves had been created.
• Forest Protection Reserves and Forest Protection–Production Reserves.Management plans are in place for 2.1 million demarcated hectares.An additional 2.8 million hectares are considered Integrated Manage-ment Districts, created by Decree 1974 of 1989, and another 500,000hectares are officially protected by municipalities and departments(UAESPNN 1999). There are also 1.37 million hectares of ForestReserves created by Law 02 of 1959, representing about 15 percent ofnational lands.
Furthermore, territories collectively owned by Afro-Colombian andindigenous communities hold significant conservation and environmentalmanagement potential.These groups have traditionally supported conser-vation objectives through their ancestral natural resource managementpractices. Indigenous territories, known as resguardos, comprise 30 millionhectares and represent 26 percent of the national territory. Likewise, close
Biodiversity Loss and Other Global Environmental Problems 439

to 3 million hectares (2.5 percent of the country’s area) are collectivelyowned Afro-Colombian territories located primarily in the BiogeographicalChocó region (Ruiz and Vergara 2003). Generally, zones of high ethnicdiversity coincide with ecologically strategic regions endowed with highbiodiversity levels. Such is the case with the Sierra Nevada de Santa Marta,the Amazon, the Colombian Massif, and the Biogeographical Chocó.Additionally, indigenous resguardos overlap 18 protected areas within theNNPS, while Afro-Colombian communities overlap 5 such areas.
High mountain, or páramo, regions critical to the regulation ofwater resources span approximately 1.4 million hectares and represent1.3 percent of national territory (IDEAM 2003). Buffer zones surround-ing protected areas must be effectively incorporated into the NPAS.Preliminary data collected during 2004, in support of the Regional andIntegrated Silvopastoral Approaches to the Ecosystem ManagementGlobal Environment Facility (GEF) Project, underscore the importanceof the link between biodiversity and sustainable production systems.Data collected during the Silvopastoral project and the proposed GEFAndes project are expected to provide information on the rural productivelandscapes that should be included in the NPAS. Environmentallysustainable livelihoods will improve the quality of life of buffer zoneinhabitants and contribute to social and economic development in theseregions, improving protected areas’ social and economic sustainability.
Although the total land area in the parks system is fairly large, theNNPS does not adequately represent all of the important habitat types inthe country (Polasky 1996). The national parks are concentrated in theAndes region with 18 units that include 2 million hectares.The Orinoquíaregion, however, has only one park, Parque El Tuparro. The Caribbeancoast and marine areas are similarly underrepresented within the NNPS.
Despite the large number of newly created protected areas, deteriorationof existing protected areas continues. This can be attributed to large-scalepopulation displacement and colonization, illicit crop cultivation, lack ofeconomic alternatives for people inhabiting the parks’ surrounding bufferzones, lack of win-win agreements that provide incentives for the provisionof environmental services, and weak institutional presence. Inadequateland use and the expansion of the agricultural frontier have also contributedto the occupation of protected areas.
Poverty and the lack of economic alternatives generate pressures on pro-tected area conservation. Suboptimal resource use leads to soil degradation,ecosystem fragmentation, changes in ecosystem structure and functionality,
440 Ahmed, Morgestern, and Urrutia

and social and economic conflict over resource privileges.About 60 percentof the country’s territory is used for unsustainable cattle ranching, creatingdegraded pastures where lands are suited for forests or agricultural use(IGAC 1988). Lack of benefits to local populations has led individuals andlocal communities to resist conservation efforts and to perceive nationalparks in their territories as illegitimate.
Illicit crop production leads to increasing environmental impacts inthe country’s natural forests and strategic ecosystems as follows: forestclearing to establish such crops, population displacement to vulnerableecosystems because of the high expectations generated by illicit cropproduction, the arriving population’s expansion of the agricultural frontier,investment of the economic surplus generated by illicit crop productioninto unsustainable cattle ranching, and water contamination from chemi-cals used during illicit crop planting and processing.
A lack of institutional coordination and long-term financial resourcesand mechanisms to consolidate the NPAS has also affected the scope ofconservation initiatives carried out by national and regional institutions.While the NPA is the environmental regulatory agency in the areas withinthe NNPS, the CARs exercise their authority in the remaining nationalterritory, including national park buffer zones. The NPAS legal frame-work still needs to be defined and its institutional and financial capabilitiesstrengthened for it to effectively coordinate public and private conservationinitiatives. Such initiatives include those promoted by the NNPS, localand regional protected areas, ethnic territories, and other private sectorconservation and sustainable management strategies. Anthropogenicactivities and their implications for the connectivity of the country’sprotected areas pose challenges that would need to be addressed by publicand private sector groups committed to in situ conservation. Advances inthis direction are described in the next section.
The Policy for Social Participation in Conservation
As noted, Colombian law created the national parks in 1959.3 Regulationsfor the creation and administration of national parks were approved duringthe 1970s, but without public participation. In addition, these regulationsdid not include mechanisms to balance conservation interests with economicand development priorities. Under these circumstances, the implementa-tion of conservation strategies with the participation of local stakeholdersbecomes a major challenge.
Biodiversity Loss and Other Global Environmental Problems 441

Although the 1991 Constitution recognizes the right of citizens to partici-pate in decisions of environmental consequence, regulations written beforethat date remain in place. Before 2003, 47 national parks were created inareas overlapping traditional indigenous, Afro-Colombian, and peasant(campesino) communities. Although the creation of the parks affected theeconomies of those communities because the parks restricted the traditionaluses of natural resources, there was no compensation.
In 2002, after wide consultations, the national government approvedthe Policy for Social Participation in Conservation.4 This policy seeks topromote the design and implementation of conservation strategies innational parks with the broad participation of local stakeholders, includingindigenous organizations and Afro-Colombian and campesino communi-ties. This policy is not a legal instrument, however, and therefore is notlegally binding or enforceable.
Using a case study approach, the following describes the process that ledto the creation of the Corales del Rosario and Alto Fragua Indi Wasi NationalParks and the mechanisms in place to balance stakeholder interests, beforeand after approval of the Policy for Social Participation in Conservation.Thefinal section presents and analyzes the information discussed in the casestudies and draws a series of lessons and recommendations.
In 1959, the Colombian Congress approved Law 02, the main objec-tive of which was “promoting the forest economy and protecting thesoils, waters and wildlife of the Nation.” This law presented the conceptof national natural parks for the “conservation of fauna and flora” thatcould be created by the Ministry of Agriculture, with technical supportfrom the Colombian Academy of Sciences. Consistent with the thinkingat the time, Law 02 of 1959 made no reference to the rights of the tradi-tional local communities in the areas to be declared as national parks, orto their participation in the processes of creation and administration.Economic activities, other than tourism, were prohibited in those areas.
Following the enactment of Law 02 of 1959, six national parks were cre-ated between 1960 and 1968.Although all those parks were then inhabitedby indigenous, Afro-Colombian, and campesino communities, and despitethe severe restrictions imposed on the use of their natural resources, no consul-tations with local stakeholders were conducted. According to Law 02 of1959, such consultations were not required.
During the 1960s and 1970s, the National Institute of RenewableNatural Resources (Instituto Nacional de los Recursos Naturales Renovables,INDERENA), the Agustín Codazzi Geographic Institute, and the NaturalResources Institute of the Universidad Nacional published information
442 Ahmed, Morgestern, and Urrutia

on the nature of Colombia’s ecosystems and natural resources. Until1993, the information gathered by those institutions provided the basisfor the declaration of most of Colombia’s national parks.5
The creation of the NNPS in 1974 by the National Code for RenewableNatural Resources and Environmental Protection (Código Nacional deRescursos Naturales Renovables y de Protección al Medio Ambiente, CNRN)responded to the view of the director and employees of INDERENA whobelieved that national parks should not be perceived as separate units butrather as parts of a system, and that the government should administerthem under coherent and unified criteria.6
According to Decree 2811 of 1974, the objectives of the NNPS are to“conserve the outstanding natural values of fauna, flora, landscapes; and his-toric, cultural and archeological relics . . .”; to “perpetuate the wild state ofbiological communities of physiographical and biogeographical regions,genetic resources and threatened species”; and to “protect natural, cultural, andhistoric phenomena and others of international interest to contribute to thepreservation of the common patrimony of humankind.”
In accordance with Law 02 of 1959, the CNRN made no reference tothe rights of traditional local communities inhabiting areas to bedeclared national parks or to their participation in the process of theparks’ creation and administration. Nor did the CNRN include provi-sions to secure the consideration of interests such as regional economicdevelopment and social equity.
Decree 622 of 1977 regulates the administration of the NNPS ingreater detail. This decree prohibits the development of economic activi-ties inside the areas of the park, including wood extraction, fishing,agriculture, cattle ranching, industry, oil production, and mining.However, this regulation notes that “the declaration of a national park isnot incompatible with indigenous reserves . . . .” Consequently, Decree622 allows national parks to be created over the traditional territories ofindigenous communities. However, as in the case of Law 02 of 1959 andthe CNRN, Decree 622 does not include provisions to ensure the partici-pation of indigenous communities in the processes of declaration andadministration of national parks.
The 1991 Constitution includes a series of economic, ethnic, and culturalrights (in its Chapters I and II) and the right of all citizens to participate indecisions of environmental relevance. In addition, the Constitution stipulatesthat the use of natural resources in the territories of indigenous communi-ties must not harm the integrity of those cultures and that all citizens havethe right to participate in decisions of environmental relevance. Clearly,
Biodiversity Loss and Other Global Environmental Problems 443

prevailing regulations in relation to the creation and management ofnational parks are not always consistent with these constitutional precepts.
Law 99 of 1993 created the National Parks Unit within the Ministry ofEnvironment with the mandate of administering the NNPS. Law 99 didnot change prevailing regulations for the administration of national parks,namely Law 02 of 1959, the CNRN of 1974, and Decree 622 of 1977.
According to Law 02 of 1959, the CNRN, and Decree 622 of 1977,before creation of a national park the National Parks Unit must conductscientific studies. Those regulations do not include the participation orrepresentation of local communities (indigenous peoples, campesinos,fisher, miners, and so forth) during the process that leads to the creationof national parks. The content of the required studies has not beenregulated, and the criteria for the definition of a park’s boundaries havenot been established. The required scientific studies must be reviewedby the Colombian Academy for Exact Physical and Natural Sciences(Academia Colombiana de Ciencias Exactas Físicas y Naturales) before apark is formally created by a Presidential Decree. If the areas to beincluded in the NNPS overlap with indigenous reserves, the relevantstudies must be conducted jointly with the Colombian Institute forAgrarian Reform (Instituto Colombiano de la Reforma Agraria).
Colombia’s 462 indigenous reserves (resguardos indígenas) occupy30 million hectares covering approximately 26 percent of the country(Giugale 2003). Some 24 percent of the total area of indigenous reservesoverlaps national parks. Of the 49 parks within that system, 33 areinhabited by indigenous groups (Unidad de Parques Nacionales 2001).In addition, there are 23 collective Afro-Colombian territories in approxi-mately 3 million hectares of the Colombian Pacific Biogeographicalregion. They correspond to approximately 2.5 percent of the country’stotal area (Unidad de Parques Nacionales 2001). Traditional indigenous,Afro-Colombian, and campesino communities inhabit 47 of Colombia’s49 national parks.7
However, as noted, Colombian legislation does not include provisionsto secure the participation of these communities during the creation andadministration of the parks. According to several officials of the NationalParks Unit, none of the parks that created overlapping traditional terri-tories of indigenous, Afro-Colombian, and campesino peoples underwenta consultation process with local communities before 2003.8 During1960 to 1968 those decisions were made by the Ministry of Agriculture,during 1968 to 1994 by INDERENA, and during 1994 to 2002 by theNational Parks Unit and the Ministry of Environment. The areas to bedeclared national parks, and their boundaries, were autonomously
444 Ahmed, Morgestern, and Urrutia

defined by the technical staff members of those institutions, on the basisof their own judgment. In most cases, the existence of a national parkwithin traditional territories took communities by surprise. In cases suchas the Catatumbo National Park, which was created in 1989, the com-munities did not find out or understand that they were part of a parkuntil very recently.9
The regulations in place since Law 02 of 1959, which impose severerestrictions on the economic use of natural resources in the areas of thenational parks, also limit the economic activities of indigenous commu-nities. In addition, they make no reference to other poor communities(campesinos, Afro-Colombians, and so forth) that have traditionally livedin the national parks. A strict interpretation of the prevailing legislationleads to the conclusion that the economic use of natural resources bythese communities, even for subsistence purposes, is illegal.10 Consequently,they cannot benefit from government programs such as agricultural tech-nology transfers and credits. Nor does the prevailing legislation includemechanisms to compensate local communities affected by the creationof national parks.
Implementation of conservation strategies in protected areas, createdwithout taking into account the social and economic realities of the localstakeholders, seems challenging. At the heart of this challenge are thevery severe restrictions that Colombian law has imposed on the economicuse of natural resources inside the limits of national parks.
Several conflicts have arisen between the NNPS and indigenous,Afro-Colombian, and campesino communities whose territories overlapnational parks.11 Those conflicts arose from the restrictions imposed byLaw 02 of 1959, the CNRN of 1974, and Decree 622 of 1977, in rela-tion to the economic and commercial use and exploitation of naturalresources in national parks. These communities, however, have not usedthe judicial system to defend the economic use of their traditional terri-tories. The limited use of the judicial system by poor communitiesresults from their lack of familiarity with their legal rights and their lackof access to the system (Quintero and Iguarán 2001).
Some of these conflicts have occurred with fishing communities in theCorales del Rosario, Flamencos, Salamanca, and Tayrona National Parkson the Caribbean Coast, and in the Utria and Sanquianga National Parkson the Pacific Coast, the latter created with over 10,000 inhabitants oftraditional Afro-Colombian communities. Conflicts have also occurredwith agricultural communities in the Chingaza, Galeras, and Los NevadosNational Parks in the Andean Region and with miners and indigenouscommunities in the Cahuinarí National Park in the Amazon.
Biodiversity Loss and Other Global Environmental Problems 445

These conflicts have recently been documented in films and inter-views with community leaders.12 In these reports, community leadershave argued that the parks were not only created overlapping theirtraditional and sacred territories, but that measures and norms adoptedby the National Parks Unit affected them economically by restrictingtheir traditional use of and commerce in natural resources. More recently,indigenous and Afro-Colombian communities have argued that they arealso authorities, vested by law, to manage these territories, with attrib-utes similar to those of the government.13
In contrast with the national parks legislation, which predates the1991 Constitution, the Colombian legislation relative to the rights ofindigenous communities underwent important developments during the1990–2000 decade. The 1991 Constitution recognized the right of indige-nous communities to organize autonomous institutions for the adminis-tration of their traditional territories and public affairs. In 1993, theColombian government approved Convention 169 of the 76th meetingof the International Labor Organization held in 1989. This conventionprotects the ethnic rights of indigenous communities, including their terri-torial rights and traditional cultures. By Decree 1088 of 1993, the govern-ment regulated the creation of Associations of Indian Reserves and ofTraditional Indigenous Authorities.These are autonomous forms of govern-ment recognized by the Colombian government. They can undertakesocial programs with resources transferred by the national government.Currently, indigenous authorities claim the same authority as theNational Parks Unit in the overlapping territories.14
The case of the extension of the Corales del Rosario National Park is atypical example. Since the mid-1950s, the islands of the El Rosario archi-pelago in the Colombian Caribbean have been a recreation site for affluentvisitors from Barranquilla, Bogotá, Cali, Cartagena, and Medellín.15 Its sur-rounding waters have been a fishing area for traditional communities of theregion. In May 1977, the board of directors of INDERENA created theCorales del Rosario National Park. Today, there are 120 vacation homes inthe islands of the archipelago. The park has an area of 19,500 hectaresover the coral reefs and other marine ecosystems that surround the 30 smallislands of the archipelago. However, the park included only 2 of the30 islands; therefore, it is largely an underwater park.16
The San Bernando archipelago is located south of the El Rosarioarchipelago and includes seven small islands, their associated mangrovesand coral reefs, and other underwater ecosystems (Díaz 1998). The areahas been traditionally inhabited or visited by local Afro-Colombian fishing
446 Ahmed, Morgestern, and Urrutia

communities (Sierra 2002) whose main traditional economic activity hasbeen lung diving for lobsters and snails. As with the Rosario Islands, thebeauty of the San Bernardo islands also attracted the interest of affluentvacationers who, to date, have built 60 houses on those islands. The SanBernando archipelago was not originally included in the national parkcreated in 1977.
The San Bernardo islands and their associated coral reefs and marineecosystems have severely deteriorated since the beginning of the 1980s(Díaz 1998). The bleaching of coral reefs extended significantly(Ramirez, Miranda, and Viña 1994), and overfishing diminished the ratesof capture of some species (Mora 1994). By 1995, fishing communitiesof the San Bernardo islands knew that the size of the fishing stocks wasdeclining and that fishing effort had increased with time.17 They attri-buted the growing scarcity of fish to overexploitation by commercial fishingboats from Cartagena, the closest city on the mainland.
Ecological information gathered by the National Parks Unit in 1996provided evidence that the El Rosario and San Bernardo archipelagos arenot independent. According to that information, there are functional rela-tions between the two archipelagos and the conservation of both areas isimportant for the maintenance of their ecological processes. Aware of thedeterioration of the San Bernardo archipelago and of its ecological impor-tance, the Minister of the Environment decided to extend the area of theCorales del Rosario National Park to include the San Bernardo archipelago.
The new extended park was created in December 1996 during the inau-guration ceremony of the new headquarters of the Ministry ofEnvironment. As with the park’s original islands (El Rosario islands), thedecision was based solely on ecological information. No social evaluation orconsultation preceded the creation of the new extended park (establishedby Decree 1425 of 1996). The decision again negatively affected thetraditional rights of the local fishing communities. The new extended parkwas called the Corales del Rosario and San Bernardo National Park. Itsoriginal area was increased from 19,500 hectares to 120,000 hectares,including the original areas of the Corales del Rosario National Park and theassociated underwater ecosystems of the San Bernardo archipelago. It alsoincludes two of the seven emerged islands of this archipelago.18 Close tofive years passed before the traditional inhabitants of the San Bernardoarchipelago gradually became aware of the existence of a national park intheir traditional fishing areas.19
The Ministry of Environment, through its National Parks Unit, hasjurisdiction over the areas included in the Corales del Rosario and San
Biodiversity Loss and Other Global Environmental Problems 447

Bernardo National Park—that is, 4 of the 37 islands of the 2 archipela-gos and their underwater ecosystems. The National Parks Unit has noauthority over the activities that take place on the 33 remaining islands.The municipality of Cartagena has control over construction activitiesthat take place on those islands.
To this day, the presence of the National Parks Unit in the San Bernardoarchipelago has been “limited and sporadic.”20 It was not until 2000 thatthe National Parks Unit sent personnel to this archipelago. Today, fourpeople are assigned to the San Bernardo archipelago. The processes ofdeterioration that motivated the creation of the new extended park arestill in place21: overfishing, fishing with explosives by native communities,and illegal construction of houses and docks on the islands.
The prevailing tensions between the National Parks Authorities inparks such as Utría, where native Afro-Colombian communities occu-pied the park to protest their lack of participation in the park’s creationand management in 1994, led the National Parks Unit to rethink its strat-egy with communities.22 A factor that facilitated the development of anew policy for national parks was that Juan Mayer and Juan CarlosRiascos, Minister of the Environment and Director of the National ParksUnit, respectively, during 1998 to 2002, were traditional leaders of theenvironmental movement in Colombia. They had directed importantnational nongovernmental organizations (NGOs)23 and had developedcommunity work in protected areas. Their experience with local com-munities in protected areas gave them a clear vision of the role of socialparticipation in conservation.24
The Policy for Social Participation in Conservation was approved inAugust 1999 by the National Environmental Council.25 The council,headed by the Minister of the Environment, comprises representatives ofdifferent economic sectors, including minority groups, and is responsiblefor the approval of national environmental policies.26
The policies approved by the National Environmental Council do nothave legal status and are consequently not enforceable or legally binding.It is possible that the policies approved by the council are not always in har-mony with the content of existing regulations, and in some cases, the imple-mentation of those policies may require changes in regulations or approvalof new regulations. In fact, the Policy for Social Participation in Conservationvalues community participation in conservation and contains a set of good-practice principles for consultation with the local community on diverseissues related to a protected area, whereas prevailing national park regulationscompletely ignore this issue. Full implementation of this policy would requireregulatory changes to secure community participation in conservation.
448 Ahmed, Morgestern, and Urrutia

The Policy for Social Participation in Conservation was the result of awide, democratic process of consultation with government officials, NGOs,indigenous communities, members of Congress, multilateral agencies,and the national government.The active participation of indigenous com-munities in the consultation processes led to the approval of this policy(Correa 2002), which is more consistent with the 1991 Constitutionthan existing national park regulations on matters of social participation.However, the traditional national park regulations remain enforceable,while the policy has no legal status.
The Policy for Social Participation in Conservation seeks to protectNNPS areas by designing and implementing conservation strategies withthe broad participation of local stakeholders, including indigenous organ-izations and Afro-Colombian and campesino communities. “This newpolicy is based on the recognition that there is a close and inseparableinterdependence between the conservation of biological diversity andthe protection of the cultural wealth of the nation.”27
More than defining specific strategies for conservation, the Policy forSocial Participation in Conservation is an agreement on the principles tobuild and adjust these strategies at the local level (Unidad de ParquesNacionales 2001). The policy includes a mix of objectives that seek tostrengthen the capacity of social organizations and communities to partici-pate in the implementation of conservation strategies. It also aims atstrengthening the institutional capacities of the National Parks Unit andat increasing public awareness of the social value of national parks at thelocal and national levels. Coordinated implementation of the policy is theresponsibility of the National Parks Unit of the Ministry of Environment.
The Policy for Social Participation in Conservation does not includeprovisions related to the criteria for the selection of new national parks.It indicates that, in all cases, local stakeholders should participate in theselection of the areas and in their administration. Because this policy isnot legally binding, however, the right of local stakeholders to participatein the conservation of national parks is not guaranteed. Only a reform ofprevailing regulations, mainly the CNRN approved in 1974 and Decree622 of 1977, could guarantee such participation.
After the Policy of Social Participation in Conservation was approved,two new areas were added to the National Parks System through consul-tation processes and agreements with local indigenous communities. Oneof these was the Alto Fragua Indi Wasi National Park, created in 2002after a broad participation process with local indigenous communities(Zuluaga 2002). In fact, the park was created in response to an initiativeby those communities (Jiménez 2002).
Biodiversity Loss and Other Global Environmental Problems 449

Since the National Parks Unit began to implement the Policy for SocialParticipation in Conservation, almost 80 agreements have been reachedwith local communities throughout the country.28 These agreements seekto define management schemes with local and native communities, developlife plans (Planes de Vida) of indigenous communities in a simultaneousprocess with the parks’ Management Plans, create consultative boards fordifferent parks with the participation of communities and the NationalParks Unit, develop sustainable economic alternatives for communities,and, in some cases, define internal rules regarding the use of naturalresources by communities.29
Implementation of this policy has been effective in securing greatersupport from local and native communities in the conservation and sustain-able management of different parks, and for helping to solve historicconflicts with local stakeholders, including indigenous groups, and theAfro-Colombian, fishing, and campesino communities:
• In the Corales del Rosario National Park, traditional Afro-Colombianfishing communities are now working with the National Parks Unit onrestricting overexploitation of lobster and other fish stock and promot-ing the participation of local communities in ecotourism. As a result ofthis participatory management strategy, during 2001 to 2002 therewas a 70 percent reduction in the capture of undersized lobsters.30
• In the Galeras National Park, the park administrator recently recognizedthat peasant communities, which used to receive park employees withmachetes before the implementation of the policy, are now workingwith the unit in the development of sustainable agricultural systems inbuffer zones. Since 2001, no forest fires have occurred in those sectorsof the park where 1,200 families work with the unit.31 In contrast, inthose sectors of the park where the National Parks Unit is not yetworking with communities, forest fires are frequent.
• Several parks, including the Cahuinarí and the Alto Fragua Indi Wasi, inthe Amazonian region, have co-management schemes with indigenouscommunities. In the Cahuinarí National Park, where the Bora-Mirañacommunity leaders traditionally opposed the creation of a nationalpark on their territories, a consultative body currently makes jointdecisions regarding the park’s management. In this case, the indigenouscommunities have undertaken zoning processes and have constructedmaps where they have “helped the National Parks Unit to understand
450 Ahmed, Morgestern, and Urrutia

what we have always thought of our territories.”32 In this case, the tradi-tional indigenous authority oversees compliance with fishing quotasand applies sanctions when a member of the community defies theestablished rules. In 2003, the indigenous communities of this parkdrove away 23 illegal (Brazilian-Colombian) gold mining operations(dragas). This occurred in coordination with the local staff of theNational Parks Unit, and without the intervention of the armed forces.
• In 2003, in the Amacayacu National Park, located in the Amazonianflood plains, the indigenous communities that inhabit the area confiscateda shipment with 28,000 pieces of precious wood that had been illegallyextracted from the park. This was a result of coordinated and agreedactions between the National Parks Unit and local communities.33
Although in several parks the participation of local communities inconservation efforts has increased, most of these communities derivetheir livelihood from the economic use of the parks’ natural resources.As indicated, strict interpretation of Law 02 of 1959, of the CNRN, andof Decree 622 of 1977 would lead to the conclusion that, in most cases,such economic activities are illegal.34 For these regions, the Policy ofSocial Participation in Conservation has concentrated sustainable pro-duction processes and land zoning in buffer zones of the national parks.
Toward the southeastern part of Colombia, in an area where the Andesdescend rapidly from the cloud forest to the Amazonian forests, there is aregion of large biological diversity (Etter 1998). This region has tradition-ally been inhabited by various indigenous groups of the Ingano family.Thebiological and cultural values of this region are threatened by colonization,deforestation, [and] illicit crops that could “. . . lead to severe environmen-tal deterioration and to the disappearance of indigenous cultures” (Zuluaga2002 as cited in Universidad de los Andes 2004, p. 25).
The 1991 Constitution and Law 21 of 1991 recognized organizationsof indigenous communities as public authorities. As such they had todesign and undertake development plans. The Tandachiridu InganocunaAssociation of Indian Reserves of the Inganos adopted their plan in 1998. Itis called a Life Plan (Plan de Vida),35 and has three components: conserva-tion of their ancestral territory and its resources, protection of their culturalidentity and traditions, and strengthening of their traditional medicine.
Since 1983, Germán Zuluaga, a medical doctor and current directorof the Ethnobiological Institute—an organization dedicated to promotingthe conservation of traditional territories and medicinal plants—has
Biodiversity Loss and Other Global Environmental Problems 451

maintained close relations with the Ingano communities as he investigatedand published information related to their medical traditions (Zuluaga1994). He communicated the interest of the Ingano communities in secur-ing protection of their traditional territories to the director of the NationalParks Unit. This initiated conversations and a negotiation process, whichled to the creation of the Alto Fragua Indi Wasi National Park.
To conduct the technical studies required by law, the Von HumboldtInstitute, the National Parks Unit, and the Tandachiridu InganocunaAssociation conducted an evaluation of the biological resources of the LaFragua region during 2000 (Instituto Von Humboldt and others 2001).Those studies reported that there were extensive and well-preservedforests with little intervention in that region. Their indexes of biologicaldiversity were among the highest ever reported in Colombia.Threatenedspecies and potentially new species were found. Highly diverse insectsand birds and a high frequency of endemism36 were reported.The impor-tance of the biological and ecological resources of the area was related toits geographical position in the transition between the highlands of theAndean region and the low Amazonian forests. The Von HumboldtInstitute, the National Parks Unit, and the Tandachiridu InganocunaAssociation complemented their biological evaluation with a culturalsurvey of the area, and identified sacred places, traditional paths, andareas where medicinal and sacred plants are endemic (Instituto VonHumboldt and others 2001).
Through those studies, the Inganos and the national governmentfound common reasons to protect the natural and biological resources ofthe La Fragua region. In the conservation of La Fragua, the Inganos sawan opportunity to advance their Plan de Vida for the reconstruction oftheir culture. An important element of the plan is their increased controlover the traditional forest territories, where some of their medicinal andsacred plants are endemic. Neither campesinos nor other communitieswere in the territories included within the boundaries of the Alto FraguaIndi Wasi National Park, nor were permanent dwellings of the Inganocommunities within the area; the Inganos did not develop agriculture,economic, or any other productive activities in the area and were inter-ested in preventing the advance of colonization. Consequently, they hadlittle or nothing to give up with the creation of the national park. Thoseterritories, however, were visited regularly by the members of the Inganocommunities because they include sacred sites and harbor endemicplants that are part of their traditional medicine. The government hasnot granted formal property rights (resguardos) to the Ingano communitiesover those territories, but the Ingano have gained the more active
452 Ahmed, Morgestern, and Urrutia

involvement of the Colombian government in the protection of a regionthat they consider strategic for the conservation of their culture.
Climate Change
Colombia’s contribution to GHG emissions is less than 0.3 percent; itsCO2 emissions in 1990 were the equivalent to 1 percent of U.S. emis-sions and 5 percent of Japan’s, and were significantly less than otherLatin American countries such as Mexico and Argentina. For example,Colombian CO2 emissions in the transport sector are about one-fifth asmuch as the comparable emissions of Mexico and about two-thirds asmuch as those of Argentina. Figure 13.2 compares total CO2 emissions inColombia with those of selected developed and developing nations. In2002, the National Inventory of GHGs was drawn up by IDEAM, cov-ering the period from 1990 to 1994. Table 13.2 displays GHG emissionestimates by gas and by sector.
Biodiversity Loss and Other Global Environmental Problems 453
0
1
2
3
4
5
United
State
sRus
sian
Fede
ratio
n
Japa
n
Canad
a
Mex
icoSpa
in
Argen
tina
Colom
bia
Ecuad
or
bill
ion
to
ns
Figure 13.2 Total CO2
Emissions in Colombia Compared with Other Countries, 1990
Source: Colombia’s First National Communication to the United Nations Framework Convention on Climate Change.
Table 13.2 Colombia’s GHG Emissions by Gas and Sector, 1994
Emissions (gigagrams of CO2
equivalents)
Sectors CO2
CH4
N2O Total
Energy 55,351.7 5,972.4 476.6 61,800.7
Industrial processes 5,212.3 8.2 77.5 5,298.0
Agriculture n.a. 34,319.5 27,126.6 61,445.1
Land-use change and forestry 16,540.0 88.7 9.0 16,637.7
Waste n.a. 4,601.4 625.0 4,686.4
Total 77,103.9 44,450.1 28,313.7 149,867.8
Source: IDEAM referenced by Blackman and others (2005).
Note: n.a. = not applicable; CH4
= methane; N2O = nitrous oxide.

Overall, Colombia emitted 129.4 million gigagrams of GHGs (expressedas CO2 equivalents) in 1990. In 1994,emissions rose to 149.9 million gigagrams(also expressed as CO2 equivalents), an increase of about 16 percent overthe four-year period. In both 1990 and 1994, emissions from the energyand industrial process sectors accounted for almost 45 percent of totalemissions. In 1990, emissions from the agricultural sector accounted for almost43 percent of total emissions, in the form of methane (CH4) and nitrousoxide (N2O). In 1994, that proportion fell slightly to 41 percent. The land-use change and forestry sector accounted for 9.3 percent of total emissionsin 1990, almost entirely in the form of CO2. In 1994, that proportion rose to11.1 percent. The waste sector accounted for the remaining 3 percent ofemissions, in the form of CH4 and N2O. In 1994, the rate of capture(sequestration) in Colombia was almost 40 times greater than the annualemissions (Blackman and others 2005).
Colombia adopted the United Nations Framework Convention onClimate Change (UNFCCC) in 1992 and ratified it on March 2, 1995.Under the convention, Colombia agreed to conduct an inventory of itscontributions to global warming, an initial assessment of domestic vulner-abilities to climate change, and a preliminary examination of policyoptions for both adaptation and mitigation. The convention also estab-lished an ongoing process for developing and updating internationalcommitments through regular Conference of the Parties assemblies.
In December 1997, Colombia signed the Kyoto Protocol, whichestablishes national emissions targets for developed country signatoriesand contains several incentives for international cooperation to promotecost-effective GHG abatement in the developing world. Among theincentives is the Clean Development Mechanism (CDM), which isdesigned to generate both cost-effective GHG reductions and sustain-able development benefits for host developing countries.
Pursuant to its obligations under the UNFCCC, Colombia prepared itsFirst National Communication (March 2002). The First NationalCommunication identified potential vulnerabilities to climate changeacross the country, including coastal zones, water resources, high plateauzones, glaciers, and other ecosystems, soils, and land affected by deserti-fication, vegetation covers, and agricultural and health impacts. By 2005,the Second National Communication had been completed. Colombiahas also taken steps to organize a range of domestic activities to addressissues relating to both mitigation and adaptation.
The First National Communication describes economic opportunities ina number of sectors, including the evolving market for CO2 sequestration
454 Ahmed, Morgestern, and Urrutia

credits in the forestry products sector. The First National Communicationalso indicates a capacity for expansion in relatively high-value productssuch as cocoa, exotic oils, flowers, processed food, and shrimp breeding. Toassess the nation’s potential vulnerability to climate change and the opportuni-ties for adaptation, Colombia has undertaken a number of broad-rangingscientific, economic, and engineering studies. Individual analyses focused onimpacts associated with sea-level rise, desertification, vulnerability of thehydrological regime, vulnerability of high mountain ecosystems, andimpacts on agriculture and on human health.
Since 1994, Colombia has undertaken a number of actions to reduceGHG emissions, and has taken advantage of the CDM established by theKyoto Protocol.The principal goal of the CDM is to support project-basedGHG reductions in developing nations to be transformed into CertifiedEmission Reductions (CERs). In turn, these CERs become available tocountries or companies as credits that can be used as a means of meetingindividual Kyoto emission control commitments. Because many abate-ment opportunities are less expensive in developing nations, the CDM canhelp reduce the overall cost of achieving global GHG reductions.
By April 2005, a number of projects were under development inColombia: Jepirachi (wind power), Agua Fresca (small hydro/renew-ables), La Vuelta and La Herradura (large hydro), and TransMilenio(transport). In addition to the projects reported by CDM Watch, twoothers are also under development: Amoya (run-of-river hydro) andFuratena (energy efficiency).37
The Jepirachi Wind Farm project was developed by the MedellínPublic Utilities (Empresas Públicas de Medellín, ESP). ESP signed anagreement with the Prototype Carbon Fund to sell 800,000 metric tonsof GHG emission reductions from the 19.5 megawatt Jepirachi WindPower Project, in the department of La Guajira. This is the first projectto be carried out in Colombia within the CDM framework. Once com-pleted, it is expected that the 15 windmills will deliver 68.3 gigawatthours per year to the national grid. Over a 21-year period, the projectwill reduce emissions by 1.168 million tons. The Prototype Carbon Fundhas agreed to pay a premium of US$0.50 (Col$1,075) per ton of emissionreductions upon implementation of the plan. This purchase agreementcontains a clause that lays out the conditions under which the premiumwill be paid, namely upon delivery of the emission reductions and uponverification that the social plan has been implemented.
The La Vuelta and La Herradura project is designed to harness thecapacity of La Herradura River by means of two subprojects in a chain
Biodiversity Loss and Other Global Environmental Problems 455

(La Herradura and La Vuelta). With a total installed capacity of31.5 megawatts, the project will improve electricity service in westernAntioquía, contribute to regional development, improve security bymeans of distributed generation, and reduce CO2 emissions. ESP is thedeveloper. The project will generate revenues of about Col$420 million(US$200,000) per year for the municipalities in the area.
The Agua Fresca Hydroelectric Project is a small-scale, run-of-rivergenerating facility that aims to generate 420,200 CERs in the first sevenyears of operation. It is expected that 208,000 CERs will be generatedby 2012. Participants include Aguas de la Cabaña Generadora Unión SA,and Va Tech Bouvier Hydro Empresas Públicas de Medellín.
The Furatena Energy Efficiency Project will support improvementsthrough the use of improved high-efficiency burners at about 120 smallfamily-owned plants, enabling them to process panela (raw sugarcanejuice) into molasses. This improves energy efficiency and enables thecommunities to use bagasse38 as fuel instead of old tires. Total projectcost is estimated to be Col$2,100 million (US$1 million). Farmers andthe town will provide 20 percent of the equity. The balance is to besecured by the Financial Fund for Agriculture and Cattle Ranching. Acontribution from the Community Development Carbon Fund is soughtfor about Col$1,470 million (US$0.7 million) over 14 years. Expectedemission reductions are about 127,000 tons of CO2 equivalent.
In addition to these projects, the Colombia Climate Change Officereported that eight more projects for reduction and sequestration ofGHGs were being considered as of March 2004. In addition to the spe-cific project activities reported earlier, other activities are also underwayto promote GHG abatement and sequestration. For example, a reportissued by German Agency for International Technical Cooperation pro-poses a method for formulating CDM projects and preparing a genericportfolio of CDM-eligible projects for Colombia’s energy sector.
Ozone Depletion
The ozone layer shields the earth from ultraviolet radiation from thesun, serving as a shield at the stratosphere level. Chlorofluorocarbons(CFCs), chemical substances used particularly in refrigerators, freezers,air-conditioning equipment, aerosols, and plastics, are substances causingthe most depletion of the ozone layer. Although 90 percent of globalemissions are generated in industrial countries of the northern hemi-sphere, they are displaced by the wind to the southern hemisphere during
456 Ahmed, Morgestern, and Urrutia

springtime. The U.S. Environmental Protection Agency has stated thatevery 1 percent decrease in ozone could result in a 2 percent increase inskin cancer and in related health problems, particularly in countries inthe southern hemisphere close to the Antarctic.
Following the discovery of the Antarctic ozone hole in late 1985,governments recognized the need for stronger measures to reduce theproduction and consumption of ozone-depleting substances (ODS). Tothis end, the Montreal Protocol on Substances that Deplete the OzoneLayer was adopted in 1987.
The Montreal ProtocolColombia ratified the Montreal Protocol in 1989 and it was approved byCongress through Law 29 of 1992. Colombia’s participation in the protocolwas defined by a country program submitted to the Multilateral Fund onJanuary 18, 1994 (DNP 1995). The Country Program Document assessedthe consumption levels of ODS in different industrial sectors and includedthe design of an action plan to phase out the consumption of these sub-stances. Simultaneously, the government established an implementingunit, the Ozone Technical Unit (Unidad Tecnica de Ozono, UTO).
Total consumption of ODS in Colombia accounts for less than0.45 percent of global consumption. According to the country program,the most significant levels of ODS consumption resulted from domestic,commercial, and industrial refrigeration maintenance, with 43 percentof the total, followed by commercial refrigeration (16 percent), foams(12 percent), and halon consumption (11 percent each).
Implementation of the ProtocolAlthough its contribution to this global problem is minimal, Colombia hasmade significant advances and has become one of the leading countries inthe region in eliminating ODS. Colombia is committed to a gradual elimi-nation of ODS with respect to its baseline, with a scheduled reduction inODS imports of 50 percent by 2005, 85 percent by 2007, and 100 percentby 2010. To fulfill its voluntary commitments, the UTO has designed aNational Elimination Plan based on CFC substitution in the commercialrefrigeration sector, CFC reduction in the maintenance sector, and elimina-tion of halon imports.
Colombia reached a 60 percent reduction of ODS in 2005, beyondthe agreed commitment of 50 percent. Since 2001, vehicular assemblyin Colombia has not used CFCs for air conditioning, and there is noreported use of halons and aerosols. In 1998, the country implemented
Biodiversity Loss and Other Global Environmental Problems 457

a manufacturing standard for household and commercial refrigerators.Today,100 percent of household refrigeration equipment and 90 percent of commer-cial refrigeration has been reconverted. In 2003, a second phase of theNational Elimination Plan totaling Col$9,450 million (US$4.5 million) wassubmitted and approved by the Executive Committee of the MontrealProtocol to be carried out by 2010.
External assistance has been provided by the United NationsDevelopment Programme, the United Nations Environment Programme,the United Nations Industrial Development Organization, and the WorldBank. Since the creation of the UTO in 1994, 51 industry projects havebeen approved to eliminate ODS. Nearly 70 percent of the resources havebeen assigned to individual projects in large companies in the refrigerationand polyurethane foam sectors, followed by umbrella projects in small andmedium companies with similar productive processes.
Conclusions and Recommendations
BiodiversityMost national parks in Colombia were selected solely on the basis of eco-logical considerations. Other factors such as cultural diversity, traditionalproductive processes, economic expectations, and property rights ofinhabitants were not taken into account, nor were broader considerationssuch as regional and economic development.
Decisions about creating Colombia’s national parks have been madeon the basis of recommendations of the technical and scientific staffmembers of the different institutions responsible for administering theparks over the years. Other stakeholders at the local, regional, and nationallevels have not been able to express their views regarding the creation ofthese protected areas. Consequently, most of Colombia’s national parkshave not resulted from balanced and equitable agreement processes.
The creation of national parks by the government, without taking intoaccount local economic, cultural, and social realities and expectations,has been detrimental to the rights of local stakeholders. Protected areaslegislation, which is still in effect, has severely limited the use of tradi-tional production systems and natural resources by local inhabitants,allowed parks to be created without compensation, and made manytraditional economic activities illegal.
The implementation of conservation plans in protected areas thatwere created solely on the basis of ecological information, ignoring localsocial and economic realities and broader regional and national priorities,
458 Ahmed, Morgestern, and Urrutia

poses significant challenges. At the local level, those challenges derivefrom the very severe restrictions that Colombian law has imposed on theeconomic use of natural resources within the limits of the national parks.
To harmonize national park regulations with the 1991 Constitution, theUniversidad de los Andes (2004) has suggested a potential amendment toLaw 02 of 1959, the CNRN of 1974, and Decree 622 of 1977. Future reg-ulations could ensure the effective participation of all relevant actors andinterests at the local, regional, and national levels. In addition, special consid-eration might be given to the inclusion of the most vulnerable stakeholders(instead of being limited to the indigenous communities) in these processes.
Greater involvement of local stakeholders through application of thePolicy for Social Participation in Conservation has already begun to showpositive results, even though this policy has only recently been applied.Since the adoption of this policy in 1999, several agreements have beenreached between the government and traditional communities in thenational parks. These agreements include the creation of coordinatingmechanisms for the conservation and sustainable economic use of theprotected areas. The support and involvement of local communities inthe implementation of conservation strategies have increased in severalparks. This is true even in those cases where there had been conflicts inthe past between local communities and the responsible governmentalagencies (Universidad de Los Andes 2004).
Since the Policy for Social Participation in Conservation does not havelegal status and is contradictory to prevailing regulations, reform of theexisting legal framework might align current regulations and the policy.Future reform of the regulatory framework might take into considerationthe good-practice principles of that policy and fully recognize the consti-tutional rights of the local campesino, indigenous, and Afro-Colombiancommunities. A reformed regulatory framework should also ensure theequitable participation of all relevant actors, including the most vulnerableand the poor, in decisions related to the conservation and economic useof protected areas (Universidad de Los Andes 2004).
Although an Intercultural Coordination Committee was created foradministering the Alto Fragua Indi Wasi National Park, and for preventingand addressing potential conflicts between indigenous communities andthe national government, no provisions have been made to deal with thepotential conflicts that could arise with the campesino communities thatare colonizing and advancing with forest clearings toward this nationalpark in particular or national parks in general. Future regulations mightalso include provisions to prevent and to deal with those potential
Biodiversity Loss and Other Global Environmental Problems 459
conflicts, and might include development of institutional mechanisms toprevent and solve conflicts between conservation interests and other socialpriorities such as regional, social, and economic development (Universidadde Los Andes 2004).
Future regulations might consider efforts to define with greater precisionthe criteria for the selection and delimitation of national parks, the con-ditions that justify their creation, the consultation processes required, andthe coordination mechanisms for their administration. Those regulationsmight consider ensuring that in the process of creating a national park andin the definition of its boundaries, special attention is given to the potentialimplications for regional and local economies. In particular, this might bethe case when poor communities are involved. Future regulations mightalso consider ensuring that fair compensation is provided (Universidad deLos Andes 2004).
Future regulations should allow for the development of ecologicallysustainable production processes by local communities within nationalparks, and for the protection of property rights in those protected areas.For these purposes, Law 02 of 1959 and the CNRN should be reformed(Universidad de Los Andes 2004).
Climate ChangeColombia has undertaken diverse activities to address the issue of cli-mate change, and based on the information presented in this chapter,it might consider continuing current efforts on the long-term aspects ofthe problem. The main priority with respect to climate change mightinclude the design and implementation of an adaptation strategy. Byits very nature, climate change is a cross-cutting issue that involvesmany levels of government and many agencies. Additional capacitybuilding and strong management direction at the national level areneeded to ensure the most effective and cost-effective managementresponse. Suggestions include the establishment of an information clear-inghouse and the designation of one national-level entity to coordinateefforts to this end. Regarding mitigation activities, it is clear there aremany opportunities to advance the twin objectives of economic devel-opment and GHG mitigation in Colombia. The Climate ChangeMitigation Office is already promoting the CDM and providing supportto developers on specific projects. For the continuation of activities inthis area, it would be advisable that enhanced support be offered toproject developers.
460 Ahmed, Morgestern, and Urrutia

Ozone DepletionColombia has taken significant regulatory and implementation actions toreduce ODS under the Montreal Protocol and the Vienna Convention.It might also consider continuing its efforts in this area, with priorityassigned to expanding current efforts to small companies, particularly inthe refrigeration maintenance sector where controlling and eliminatingODS is most difficult, strengthening the legal framework by establishingmandatory certification for maintenance technicians; and completing thedesign and further implementation of regional strategies.
Table 13.3 provides a summary of the recommendations made inthis chapter.
Biodiversity Loss and Other Global Environmental Problems 461
Table 13.3 Recommendations to Control Biodiversity Loss and Other Global
Environmental Problems
Priority: short (S),
medium (M),
Recommendations and long term (L) Participating institutions
Develop an evaluation of the M MAVDT
NNPS that incorporates cultural,
regional, and economic considerations
and involves stakeholders through
participation processes; institute
reforms for the development of
ecologically sustainable production
processes by local communities
within national parks
Reform Law 02 of 1959, the L Congress, MAVDT
CNRN of 1974, and Decree 622 of
1977 to harmonize them with the
precepts of the 1991 Constitution
Reform the existing legal L Congress, MAVDT
framework to solve the
inconsistencies with the Policy for
Social Participation in Conservation
Conduct a valuation of current and L Donors, development
potential economic surplus partners
generated as a result of the
sustainable use of biodiversity
Continue taking advantage of M Montreal Protocol,
financing opportunities posed Private sector
by the Montreal Protocol
Source: Authors.
Note: MAVDT = Ministerio de Ambiente, Vivienda y Desarrollo Territorial.

Notes
1. Kulsum Ahmed, Richard Morgenstern, and Carolina Urrutia are the authorsof this chapter.
2. Tropical forests present a complex landscape, the product of relationships, prac-tices, techniques, fears, and preferences of the societies that inhabit them. The“reserve of biodiversity” is in part the cultural result of the daily, economic, andmaterial practices of the groups that have traditionally inhabited the region.
3. This section draws heavily from a 2004 case study prepared by the Universidadde Los Andes for this report.
4. Unidad de Parques Nacionales de Colombia–Política de Participación Social enla Conservación, 2001.
5. Information is also provided from an Universidad de los Andes case study con-sultants with Julio Carrizosa, Margarita Botero, and Manuel Rodríguez, formerINDERENA directors (March 2004, Bogotá).
6. See the interview by Universidad de los Andes case study consultants with JulioCarrizosa, INDERENA’s director during 1973 to 1978 (July 2004, Bogotá).
7. The exceptions are Gorgona National Park (an island on the Pacific coast) andthe Chiribiquete National Park in the center of the Colombian AmazonianRegion.
8. See the interview by Universidad de los Andes case study consultants withCarlos Acosta, adviser to the director of the National Parks Unit responsible forcoordinating participation processes with Afro-Colombian and indigenous com-munities (Bogotá, March 2004).
9. See the interview of Universidad de los Andes case study consultants withCarlos Acosta and Lavinia Fiori, Coordinators of the EnvironmentalComponent of the Dutch Institutional Strengthening Program of theNational Parks Unit (Bogotá, March 2004).
10. See the interview of Universidad de los Andes case study consultants withEugenia Ponce, expert on national park regulations (March 2004, Bogotá).
11. See the interview of Universidad de los Andes case study consultants withSandra Valenzuela, legal advisor to the director of the National Parks Unit; CarlosAcosta, Coordinator of Participation Processes; and Lavinia Fiori, Coordinator ofEnvironmental Education and Communication for the Dutch InstitutionalStrengthening Program of the National Parks Unit (Bogotá, March 2004).
12. See the interview of Universidad de los Andes case study consultants withLavinia Fiori, Coordinator of the Environmental Component of the DutchInstitutional Strengthening Program of the National Parks Unit, who has filmedthese testimonies (Bogotá, March 2004).
13. See the interview of Universidad de los Andes case study consultants withArregocés Conchacalá, Cabildo Gobernador and leader of the Kogui
462 Ahmed, Morgestern, and Urrutia

Indigenous group. This indigenous group inhabits the Sierra Nevada of SantaMarta, which includes two national parks (Santa Marta, April 2004).
14. See the interview with the Legal Group of the National Parks Unit (Bogotá,March 2004).
15. See the interview of Universidad de los Andes case study consultants withClara Sierra, manager of the park during 2002 to 2004 (Bogotá, April2004).
16. These two islands, El Tesoro and El Rosario, were included as a part of thenational park by INDERENA Agreement 093 of 1987.
17. See the interviews by Universidad de los Andes case study consultants withClara Sierra and Clara Osorio, managers of the park during 2002 to 2004 and1992 to 1994, respectively (Bogotá, April 2004).
18. These are the islands of Maravilla and Mangle.
19. See the interviews of Universidad de los Andes case study consultants withClara Sierra and with Clara Osorio, managers of the park during 2002 to 2004and 1992 to 1994, respectively (Bogotá, April 2004).
20. See the interviews of Universidad de los Andes case study consultants withClara Sierra and with Clara Osorio, managers of the park during 2002 to 2004and 1992 to 1994, respectively (Bogotá, April 2004).
21. See the interview of Universidad de los Andes case study consultants withClara Sierra, manager of the park during 2002 to 2004 (Bogotá, April2004).
22. See the interview of Universidad de los Andes case study consultants withJuan Carlos Riascos, director of the National Parks Unit (January 2004).
23. Mr. Mayer was director of the Prosierra Foundation, which developed activi-ties in the Sierra Nevada National Park. Mr. Riascos was director of FundaciónHerencia Verde, which developed community conservation activities in thebuffer zones of the Los Nevados National Park.
24. See the interviews of Universidad de los Andes case study consultants withJuan Mayer and Juan Carlos Riascos (Bogotá, July 2004).
25. The policy was created by Article 13 of Law 99 of 1993.
26. Council members include representatives of municipal and regional govern-ments (Gobernaciones) and of indigenous and Afro-Colombian communities;producers’ associations (agricultural, mining, forest, and manufacturing) andexporters; NGOs; universities; and the Ministries of Agriculture, Defense,Education, Foreign Trade, Mines and Energy, National Planning, SocialProtection, and Transportation.
27. See the interview of Universidad de los Andes case study consultants withJuan Carlos Riascos, director of the National Parks Unit during 1998 to 2004(Bogotá, December 2003).
Biodiversity Loss and Other Global Environmental Problems 463

28. See the interview of Universidad de los Andes case study consultants withCarlos Acosta, advisor to the director of the National Parks Unit on issuesrelated to participation of local groups (Bogotá, February 2004).
29. See the interviews of Universidad de los Andes case study consultants withCarlos Acosta, advisor to the director of the National Parks Unit on issues relatedto participation of local groups with the National Parks Unit and currentdirector of the Dutch Program for Parks in the Pacific, and with Lavinia Fiori,Coordinator of Environmental Education for the Dutch Program forInstitutional Strengthening of the National Parks System (Bogotá, April 2004).
30. See the interview of Universidad de los Andes case study consultants withLavinia Fiori who coordinated a project funded by The Nature Conservancywith native communities in the islands of the Corales del Rosario NationalPark (Cartagena, February 2004).
31. See the interview of Universidad de los Andes case study consultants withNancy Builes, director of the Galeras National Park (Bogotá, February 2004).
32. See the interview of Universidad de los Andes case study consultants withLavinia Fiori of the National Parks Unit in a documentary currently underproduction.
33. See the interview of Universidad de los Andes case study consultants withJuan Carlos Riascos, director of the National Parks Unit (Bogotá, December2003).
34. See the interview of Universidad de los Andes case study consultants withEugenia Ponce de León, expert in national parks regulations (Bogotá, March2004).
35. See the interview of Universidad de los Andes case study consultants withGermán Zuluaga (Bogotá, December 2003).
36. Endemism means biological species found only within a physically narrowhabitat.
37. The Amoya River run-of-river power generation facility involves constructionof a 78-megawatt run-of-river facility on the Amoya River to replace existinggeneration sources.The project developer is HIDROGER S.A. E.S.P., a subsidiaryof Generadora Unión S.A. E.S.P. CO2 mitigation is expected to be 1.87 milliontons by 2012 and 2.69 million tons by 2019.
38. Bagasse is biomass as a by-product of sugarcane production.
References
Blackman, Allen, Richard Morgenstern, Libardo Montealegre Murcia, and JuanCarlos Garcia de Brigard. 2005. “Review of the Efficiency and Effectivenessof Colombia’s Environmental Policies.” Final Report to the World Bank,Resources for the Future, Washington, DC.
464 Ahmed, Morgestern, and Urrutia

Biocolombia. 2000. “Diseño de Estrategias mecanismos e instrumentos requeridospar ala puesta en marcha del Sistema Nacional de Áreas Protegidas.” Informede Consultoría, MAVDT, Bogotá.
Clark, C. W. 1973. “Profit Maximization and the Extinction of Animal Species.”Journal of Political Economy 81 (4): 950–61.
Correa, H. D. 2002. “La Construcción de la Política de Participación Social en laConservación con los Pueblos Indígenas.” En Parques con la Gente II. Unidadde Parques Nacionales, Ministerio del Medio Ambiente, Bogotá.
De Miras, C. 1994. “Las Islas Galápagos: Un Reto Económico y Tres ContradiccionesBásicas.” Institute Français de Reserche Scientifique pour le Développement enCoopération, Quito.
Diaz, Guillermo. 1998. “Ecosistemas Marinos y Costeros.” En Diversidad BiologicaVol I. Bogotá: Instituto Von Humboldt.
DNP (Departamento Nacional de Planeación). 1995. “El Salto Social.” PlanNacional de Desarrollo 1994–1998, DNP, Bogotá.
Echeverria, J., M. Hanrahan, and R. Solorzano. 1995. “Valuation of Non-pricedAmenities Provided by Biological Resources within the Monteverde CloudForest Preserve, Costa Rica.” Ecological Economics 13 (1): 43–52.
Etter, Andres. 1998. “Bosque Húmedo Tropical.” En Diversidad Biológica Vol I.Bogotá: Instituto Von Humboldt.
Fedesarollo. 2002. “Medio Ambiente y Desarrollo Econúmico: Priorizaciún de laInversiún Ambiental con Criterios Econúmicos”. Informe de Consultoríapreperado por Ana María Ibaóez y Eduardo Uribe para el BancoInteramericano de Desarrollo, Bogotá.
Giugale, Marcelo. 2003. “Colombia: The Economic Foundation of Peace.” InColombia: The Economic Foundation of Peace, ed. Marcelo Giugale, OlivierLaforcade, and Connie Luff, 1–34. Washington, DC: World Bank.
IDEAM (Institute of Hydrology, Meteorology and Environmental Studies). 2003.“Environmental Conditions and Indicators in Colombia. Projections in theShort, Medium and Long Term.” Report No. 107, IDEAM, Bogotá.
———. 2004. Annual Report on the State of the Environment and NaturalRenewable Resources in Colombia. Bogotá: IDEAM.
IGAC (Instituto Geográfico Agustín Codazzi). 1988. “Suelos y Bosques deColombia.” Bogotá.
Instituto Von Humboldt, Unidad de Parques Nacionales, Comité Territorial, yAsociación Tandachiridu Inganocuna. 2001. “Caracterización Biológica delTerritorio Indígena Ingano, Municipio de San José de la Fragua, Caquetá.Informe Final.” Bogotá.
Jiménez, M. 2002. “Trascendencia Jurídica y Política de la Experiencia deConstitución del Parque Nacional Natural Alto Fragua Indi Wasi.” En
Biodiversity Loss and Other Global Environmental Problems 465

Parques con la Gente II. Unidad de Parques Nacionales, Ministerio delMedio Ambiente, Bogotá.
Maille, P., and R. Mendelsohn. 1991. “Valuing Ecotourism in Madagascar.” Journalof Environmental Management 38 (33): 213–8.
Mendelsohn, R., and M. Balick. 1995. “The Value of Undiscovered Pharma-ceuticals in Tropical Forests.” Economic Botany 49 (2): 223–28.
Mercer, E., R. Kramer, and N. Sharma. 1995. “Rain Forest Tourism: Estimating theBenefits of Tourism Development in a New National Park in Madagascar.”Journal of Forest Economics 1: 239–69.
Mora, O. 1994. “Análisis de la Pesquería del Caracol Pala (Strombus gigas L.) enColombia.” En Concha Reina Biologia, Pesquera y Maricultura, ed. R. S.Appeldoorn and B. Rodríguez. Caracas: Fundación Científica Los Roques.
Peters, C., A. Gentry, and R. Mendelsohn. 1989. “Valuation of an Amazonian RainForest.” Nature 339: 655–66.
Polasky, Stephen. 1996. “Issues in Biodiversity Conservation Policy in Colombia.”Prepared for the Seminario de Política de Recursos Naturales y de MedioAmbiente, Santa fé de Bogotá, August 26–27.
Polasky S., R. Ding, A. R. Solow, J. D. Camm, and B. Csuti. 2000. “ChoosingReserve Networks with Incomplete Species Information.” BiologicalConservation 94 (1): 1–10.
Quintero, Rodolfo, and Mario Iguarán. 2001. “Acceso a la Justicia Ambiental: UnaMirada desde la Ecología Política.” In Justicia Ambiental, Universidad Externadode Colombia, Instituto de Estudios del Ministerio Publico, CAR, Bogotá.
Ramírez, Alberto, Dario Miranda, and Gerardo Viña. 1994 “Estructura Arrecifaldel Archipiélago de San Bernardo: Estudio Línea Base.” Trianea 5: 189–219.
Ruiz, Juan P., and Walter Vergara. 2003. “Natural Resources and GlobalCommons: Capital for Sustainable Development.” In Colombia: The EconomicFoundation of Peace, ed. Marcelo Giugale, Olivier Laforcade, and Connie Luff,131–42. Washington, DC: World Bank.
Sierra, Clara L. 2002. “Corales del Rosario y San Bernardo: Un Ejercicio deParticipación Social en el Manejo de un Área Protegida. Estudio de Caso:Pescadores en el área.” En Parques con la Gente II. Unidad de ParquesNacionales, Ministerio del Medio Ambiente, Bogotá.
Solow, A., and Stephen Polasky. 1994. “Measuring Biological Diversity.”Environmental and Ecological Statistics 1: 95–107.
Southgate, Douglas. 1996. “What Roles Can Ecotourism, Non Timber Extraction,Genetic Prospecting, and Sustainable Timber Production Play in an IntegratedStrategy for Habitat Conservation and Local Development?” Draft finalreport, Inter-American Development Bank, Washington, DC.
466 Ahmed, Morgestern, and Urrutia

UAESPNN (Unidad Adminstrativa Especial del Sistema de Parques NacionalesNaturales). 1999. www.parquesnacionales.gov.co.
Unidad de Parques Nacionales. 2001. Política de Participación Social en laConservación. Bogotá: MMA.
Universidad de los Andes. 2004. Diseño e Implementación de un Modelo de Calidadde Aire para Bogotá. Informe Semestral 6, Civil Engineering and EnvironmentDepartment, CIIA, Bogotá.
Weitzman, M. L. 1992. “On Diversity.” Quarterly Journal of Economics 107 (2):363–405.
World Bank. 2005. The Little Green Data Book. Washington, DC: World Bank.
Zuluaga, Germán. 1994. El Aprendizaje de las Plantas: En la Senda de unConocimiento Olvidado. Bogotá: Seguros Bolívar.
———. 2002. “Proceso de Creación de un Área Especial de ConservaciónBiocultural.” En Parques con la Gente II. Unidad de Parques Nacionales,Ministerio del Medio Ambiente, Bogotá.
Biodiversity Loss and Other Global Environmental Problems 467


Colombia’s environmental management framework has evolved into adecentralized and innovative environmental management system.1 TheNational Environmental System (Sistema Nacional Ambiental, SINA)defines roles for different stakeholders, including financially independentregional environmental agencies, a central-level ministry responsible foroverall policy formulation and coordination, and research institutesresponsible for collecting and disseminating environmental data. TheSINA also defines a role for nongovernmental organizations throughtheir involvement on the boards of regional agencies and for the privatesector through its significant involvement in a Technical AdvisoryCouncil, which advises on policy formulation. Intersectoral coordinationis promoted through the National Environmental Council, which com-prises representatives from 25 organizations, including nine ministers(Agriculture, Commerce, Defense, Education, Environment and Housing,Health, Mines and Energy, Planning, Transport) and six business andindustry association leaders (agriculture, export, forestry, manufacturing,mining, and oil and gas).
The 1991 Constitution and Law 99 of 1993, which established theSINA, reinforced the rights of every citizen to a clean and healthy envi-ronment. The new legislation reflected the evolution of the SINA from
C H A P T E R 1 4
Conclusions and Recommendations
469

Water Basin Authorities in select watersheds to a Natural ResourceDivision as part of the Ministry of Agriculture and subsequently to aMinistry of Environment coordinating the SINA entities, which includedthe previously established Water Basin Authorities. Law 99 also addedseveral new regional authorities and incorporated urban authorities forcities with populations over 1 million, reflecting Colombia’s transitionfrom a highly rural economy to a largely urbanized economy.
This chapter summarizes the conclusions of the Country Environ-mental Analysis and provides recommendations to assist the governmentof Colombia in revising policies to address priority environmentalproblems. It also outlines a program of policy and institutional reform andcomplementary investment directed toward areas that impose a high coston the economy, but that have not yet been tackled (table 14.1).Increased focus is needed on improving the quality of life for the growingnumber of poor people living in and around urban areas in a country inwhich over 70 percent of the population is urban. The goal of the recom-mendations presented in this chapter is to support the country’s efforts tomove toward more equitable and sustainable economic growth.
Colombia’s growth from a largely rural economy to a highly urbanizedcountry occurred rapidly over the past 50 years. Despite a strong planningtradition, environmental priorities have been driven by historical factors.The creation of the Regional Autonomous Corporation of the Cauca Valley(CVC) in 1954 as a river basin agency along the model of the TennesseeValleyAuthority, the original placement of the National Institute of RenewableNatural Resources within the Ministry of Agriculture, and the large num-ber of officials with a water or natural resources background produced aprimary emphasis only on water resources management, national parks,and forestry issues. This emphasis yielded considerable dividends in thewater resources management and conservation programs. These includethe establishment of a National Natural Parks System (8.5 percent ofthe national territory) and forestry reserves (more than 15 percent of thenational territory), and a reversal in deforestation rates from 600,000hectares per year in the 1970s and early 1980s to 90,000 hectares peryear in 2004.
Given Colombia’s economic growth and development over the pastdecades and the green environmental agenda’s progress, environmentalpriorities appear to have expanded. The environmental managementagenda, however, has not caught up with this change. The analysis showsthat the greatest costs now borne by the country, amounting to morethan 3.7 percent of gross domestic product per year, are associated withthe following categories of environmental problems: waterborne diseases,
470 Sánchez-Triana and Ahmed

Conclusions and Recommendations 471
Table 14.1 Main Policy Options of the Report
Key issue Main policy options
Need for strategic and • Design and implement a policy (through laws and regulations)
systematic tools for to set environmental priorities at the national, regional, and local
priority setting levels based on learning mechanisms to periodically review and
learn from the experiences of implementing environmental
policies
• Install and implement systems to monitor and evaluate
environmental management and the extent to which the
objectives of environmental priorities are efficiently met
• Periodically evaluate progress on the implementation of policies
to tackle environmental priorities with the support of the
accumulation of data, results, and experiences achieved through
intersectoral coordination and learning
Need for strengthening • Mainstream environmental considerations in policy formulation
institutions’capacity to by strengthening SINA institutions’capacity in priority areas
address environmental through, for example, strategic environmental assessments in
priorities, particularly in (a) environmental health, (b) vulnerability to natural disasters,
environmental health and (c) sustainable urban development
High cost of • Design and implement a safe water program that includes
environmental components dealing with handwashing and point-of-use
degradation associated disinfection of drinking water
with waterborne • Facilitate private sector participation in water supply and
diseases sanitation
• Modify water pollution fee system (tasas retributivas) to promote
the construction of sewerage collection systems
• Formulate and implement actions to promote compliance with
drinking water quality standards
• Modify laws and regulations on parameters of effluent standards so
that pathogens and toxic and hazardous substances are regulated
High cost of • Revise and establish national standards for PM2.5
and PM10
in
environmental priority urban areas and update major emission standards for
degradation associated mobile and nonpoint sources to reflect new scientific and
with air pollution technological advances
• Implement air pollution control interventions, such as promot-
ing the improvement of fuel quality in transport and industry
sectors expanding the use of natural gas to replace coal and oil
and establishing emissions control for stationary, mobile, and
nonpoint sources
• Implement an air quality monitoring program to monitor PM2.5
and PM10
in priority urban areas
• Implement and enforce regulations (including Resolution
0532 of 2005) to control air pollution emissions and
appropriate monitoring methods for green cut of sugarcane,
which uses manual or mechanical methods to remove
sugarcane instead of burning out the fields for planting
(continued)

472 Sánchez-Triana and Ahmed
Table 14.1 Main Policy Options of the Report (continued )
Key issue Main policy options
• Reform compliance and enforcement systems, including the
adoption of a more severe penalty system
• Introduce more rigorous approaches to vehicle emissions testing
Morbidity and premature • Promote the use of cleaner fuels in an accessible, safe, and
deaths associated with cost-effective manner in areas that predominantly use
indoor air pollution fuelwood
• Implement a program to promote improved stoves
• Extend the coverage of rural electrification programs
• In subsidy programs for rural low-income housing, include require-
ments for building codes and housing design in poor communi-
ties to allow for improved ventilation and optimal chimney design
Vulnerability to natural • Increase efforts to prevent natural disasters, especially floods and
disasters landslides, through activities that focus on incorporating disaster
prevention in land use plans, drainage improvements, warning
systems, and regulations prohibiting informal settlement in areas
prone to risks of natural disasters
• Develop a permanent system of performance indicators for
reduction of vulnerability to natural disasters
• Define the specific roles of each national- and regional-level
member of the National Disaster Preparedness and Response
System and SINA, particularly Autonomous Regional Corporations
• Create stronger incentives for inclusion of disaster considerations
in environmental impact assessments and environmental
licensing
• Periodically conduct national, regional, and local risk assessments
• Require all levels of government to use comparative risk
assessment to guide allocations of financial, human, and
technical resources
• Establish priorities for disaster monitoring and alert systems
based on comparative risk assessment
Requirements for • Devise concrete ways of integrating environmental
improved urban considerations into urban planning and management tools after
environmental reviewing the legal and regulatory framework of environmental
conditions and urban legislation
• Define and include environmental criteria in the eligibility criteria
of Social Interest Housing projects
• Address structural land supply problems and reduce costs of
formality
• Enforce existing regulations and planning documents earlier to
prevent occupation of hazardous sites
• Enforce land use plans so that decisions on siting of landfills are
consistent with zoning regulations contained in the plans

Table 14.1 Main Policy Options of the Report (continued )
Key issue Main policy options
Need for improved water • Reexamine the roles of government bodies, and create more
resource management efficient cooperative mechanisms
• Find an economically efficient approach to wastewater
treatment, and control discharges of pathogens and
hazardous wastes
• Ensure the collection and public disclosure of information
related to water availability and water demands
• Ensure that the economic value of water is adequately reflected
in water fees
Land degradation and • Identify the costs and benefits of alternative interventions to
deforestation control soil erosion and soil salinization
• Generate alternatives to non-timber forest products and improve
the livelihoods of forest-dwelling communities
• Establish the analytical mechanisms to foster the capacity
for both indigenous communities and the rural poor to
profit from the sustainable and productive uses of forest
areas and the implementation of payments for environmental
services
Source: Authors.
Note: PM2.5
= particulate matter less than 2.5 microns in diameter; PM10
= particulate matter less than 10 microns in
diameter.
Conclusions and Recommendations 473
urban air pollution, indoor air pollution, land degradation, and naturaldisasters. This suggests SINA’s activities need to be refocused. Effortsneed to be made to build capacity to carry out related quantitativeanalyses on a periodic basis as an input to the government’s plans.
As shown in chapter 5, a number of methods in addition to quantitativeanalysis can be used to identify priorities. Consistent with the quantitativestudy, a survey of public perceptions of Colombia’s environmental prob-lems, covering more than 2,600 Colombians throughout the country,showed that air pollution was the main environmental problem identifiedby 79 percent of the people surveyed. The same survey, however, illustratedsignificant differences in perceptions of priorities among income groups.Whereas low-income groups identified air pollution, noise pollution, andvulnerability to natural disasters as major problems, upper-incomegroups perceived the loss of global environmental resources (for example,biodiversity and global warming) and inappropriate land use in urbanareas as principal problems.
Finally, drawing on the discussion of environmental expenditurespresented in chapter 2, it is evident that current expenditures are not

well aligned with the priorities of the lower-income groups or with theenvironmental problems associated with the highest costs of damage. Forexample, in chapter 4, available data suggest that Autonomous RegionalCorporations (Corporaciones Autónomas Regionales, CARs) might considerstrengthening efforts to prioritize risks and allocate investment fundsaccordingly. In 2001, CARs as a group allocated 28 percent of theirinvestment funds to projects involving the protection of flora and fauna,but only 5 percent to industrial pollution control projects other than waste-water treatment plants. Although these statistics are based on limited dataand must be interpreted cautiously, they do suggest that, given the severityof Colombia’s environmental problems, CAR investments may focusdisproportionately on constructing wastewater treatment plants. In addition,examination of individual CAR allocations of 2001 investment fundssuggests that CARs’ allocations of investment spending across differentrisks do not comport well with the severity of those risks.
The results of the analysis support the view that the segments of thepopulation that bear the heaviest burden of the costs of environmentaldegradation have not traditionally been taken into account in policydecisions, largely because they are not a vocal constituency. In particular,the poor and children often are disproportionately affected by environ-mental degradation. The discussions on air pollution, water resourcesmanagement, and biodiversity indicate that in Colombia, as in most coun-tries, stakeholders affected by environmental degradation have less of avoice to address environmental issues when priorities are set, decisionsare made, and human and financial resources are allocated. In the case ofindoor air pollution, typically children under age 5 suffer the most fromacute respiratory infections and pneumonia. Other examples include thecase study of water resources management in the Bogotá Savanna. Waterscarcity is an issue for small farmers living in the savanna, whereas thelarger stakeholders, such as the irrigation district, the regional environ-mental corporation, and the energy company, have all secured access toa sufficient quantity of water (Universidad de Los Andes 2004). Inanother case study on the creation of National Protected Areas, in which,by law, all economic activity is forbidden, some of the more susceptiblegroups are the indigenous populations living in those areas, whose prop-erty rights have been taken away, despite their close and long associationwith the land (Universidad de los Andes 2004).
Colombia has made important strides in setting up an environmentalmanagement system that includes a coordination function at the centrallevel in the ministry, and control agencies, such as the Contraloría General
474 Sánchez-Triana and Ahmed

de la República and the Delegate Procuraduría for Environmental Affairs,(Procuraduría Delegada para Asuntos Ambientales) which has responsi-bility for oversight of all environmental authorities in Colombia withinthe Procuraduría General. In addition, the legal framework gives theseagencies considerable responsibilities. For example, under current law,the control organizations can set in motion procedures to remove CARdirectors for failure to comply with CAR action plans.
Nonetheless, the absence of reliable time-series data on the state ofthe environment and natural resources, and the lack of a system ofhomogeneous, results-focused indicators of environmental quality, havehampered the efforts of these agencies to evaluate programs. Furthermore,as noted in chapter 3, the SINA’s current capacity for data collection islimited. Colombia’s data collection infrastructure—including monitoringnetworks and measuring stations, documentation centers, and basiccartography—is inadequate. The actual performance of the controlagencies and the coordinating Ministry of Environment have also fallenshort, for a multitude of reasons, including weak technical and humancapacity, and institutional reasons resulting from the autonomy ofthe CARs, their direct sources of funding, and their long history, unlikethe more recently established Ministry of Environment, Housing andRegional Development (Ministerio de Ambiente, Vivienda y DesarrolloTerritorial, MAVDT).
Environmental priorities and allocation of expenditures are poorlycorrelated. Clarity and policy guidance are also lacking with respect tocertain administrative practices, notably in the hiring of contractors byCARs. In addressing this excessive reliance on contractors, two differentpolicy objectives create clear tensions. On the one hand, the nationalgoal is to limit operational spending and staff size across all governmentagencies. On the other hand, recognition is growing of the need to limitthe CARs’ reliance on contractors.
To encourage a focus on the quality of environmental outcomes andto overcome the coordination problems among CARs and national andregional agencies, Presidential Decree 1200 of 2004 established a systemof performance indicators to measure impact and results of environmentalinvestments at the regional level by means of Ten-Year RegionalEnvironmental Management Plans. Six impact indicators are included inthe Three-Year Action Plan (Plan de Acción Trienal, PAT) to evaluateenvironmental management by the CARs. The results-based indicatorsfor environmental quality cover issues including deforestation rates andforest conservation efforts, development of green markets, rationalization
Conclusions and Recommendations 475

and optimization of renewable natural resources consumption, reductionin health impacts associated with environmental factors, and reductionin vulnerability risk associated with natural disasters. Each year, theMAVDT will review progress in achieving the goals set forth in the PATsand Regional Environmental Management Plans. The directors of CARsthat do not meet the goals set forth in their own PATs are at risk of beingremoved by the CARs’ Board of Directors. At this point, the process isso new that it cannot be evaluated.
Although Colombia has extensive environmental regulations, chal-lenges remain. In many cases, urgently needed regulations do not exist,some regulations are incomplete and lacking in critical details, and someregulations are overly prescriptive and not adjusted for local economicand social circumstances. For example, command-and-control emissionsstandards have sometimes been adopted from more developed countrieswith little modification. These inadequacies in Colombia’s regulationslead to problems. They contribute to poor coordination between theMAVDT and the CARs by making it difficult for CARs to carry out one oftheir basic functions—implementing regulations established at thenational level.They also make it difficult for other institutions in the SINAto perform their assigned roles. For example, in 2003, the ContraloríaGeneral de la República noted that lack of regulation—from constitutionalprecepts to specific information standards—made it difficult to advancethe Colombian Environmental Information System. Incomplete licens-ing and permitting regulations lead to inconsistent requirements andenforcement across CARs and therefore create opportunities for admin-istrative arbitrariness. Lack of clarity in laws and regulations also burdensColombia’s judicial system. This void may have contributed to theproliferation of acciónes de tutela (actions for injunctive relief) broughtto protect the environment.
Continuous strides forward demonstrate an organization’s ability toadjust course and improve incrementally over time. Improving over timeinvolves generating knowledge by processing information or events, thenusing that knowledge to cause behavioral change. It may not be an inten-tional process. Learning is crucial in Colombia, particularly becausethere seem to be few mechanisms that have allowed the country inrecent years to adjust course with changing contexts and to analyze andlearn from its previous experiences. Some stakeholders have shaped acontinued focus on water resources management and conservation pro-grams with great success.The government itself has few tools that allow forthe setting of priorities and the development of an institutional memory.
476 Sánchez-Triana and Ahmed

An example of difficulties in improving over time in addressingenvironmental priorities is the sporadic history of air quality monitoringnetworks in Colombia. Such networks were first established in 1967 bythe Pan American Health Organization, together with the Ministry ofHealth, in several cities, including Bogotá and Medellín, to monitor totalsuspended particles and sulfur dioxide levels. These programs lasteduntil 1974, when they were dismantled. Monitoring systems were againset up in many locations in response to Decree 2 of 1982. In Bogotá, theDepartment of Health installed and operated 12 monitoring stationsduring 1983 to 1989. During 1990 to 1991, the Japan InternationalCooperation Agency financed the installation and operation of five moremonitoring stations. None of these networks operated after 1991.Furthermore, despite the existence of these stations, there is no referenceto the use of data generated by them as an input to air pollution controlstrategies before 1991 (Universidad de los Andes 2004). During 1991 to1997, no air quality monitoring occurred in Bogotá. Then in 1997, theEnvironmental Administration Department of Bogotá installed a new net-work of 12 monitoring stations, which included the pollutant parametersin Decree 2 of 1982, plus particulate matter of diameter less than10 microns (PM10) and less than 2.5 microns (PM2.5). PM2.5 was only moni-tored until 1999, when the equipment was damaged and not replaced.The story is somewhat similar in Medellín, with the installation of sevenstations in 1983 by the Department of Health. Again, there is little evi-dence of the use of data generated by these stations as an input to airpollution control strategies, and as in Bogotá, these were superseded bya new system in the late 1990s, comprising 18 stations in the AburráValley with the capacity to measure the five pollutants noted in Decree2 of 1982, in addition to PM10. The functioning of this newest network,however, has been interrupted several times by legal problems and thecalibration of equipment resulting in information voids (Universidad delos Andes 2004).
Evaluation systems must not be static; they must be able to adjust tonew developments in science, technology, and other fields. In the 1970s,the conventional wisdom was that high ambient concentrations of totalsuspended particles posed a serious health problem. More recently, withimprovements in measurement technologies and analytical techniques,PM2.5 appears to be the real culprit. This finding, in turn, has led to signifi-cant changes in air pollution control strategies in the United States andother countries. In Colombia, the importance of PM2.5 on health impactsis increasingly recognized, and the government intends to move ahead
Conclusions and Recommendations 477

with the installation of a monitoring system for PM2.5 to obtain betterinformation for decision making on air pollution control strategies.
In contrast, developments in addressing indoor air pollution are still intheir infancy. As little as 10 years ago, indoor air pollution was not con-sidered a major health threat. Today, together with waterborne diseases,it appears on the list of the top 10 causes of illness and death in theGlobal Burden of Disease 2002 report by the World Health Organization(WHO). In developing countries with high mortality rates, indoor airpollution is the fourth leading cause of illness and death (WHO 2002).Recent WHO estimates indicate that indoor smoke from solid fuelscauses 1.6 million deaths annually. It is not that the problem did notexist 10 years ago. Rather, the generation of information, and the pro-cessing of that information, made it clear that this form of pollutionprincipally affects millions of women and children in poor rural familieswho depend on firewood for cooking and heating. Some countries arerealizing the significance of this and acting on it; many others have stillnot grasped the importance of placing this issue high on the policy agen-da. The cost-of-degradation study shows that this is also an importantissue for Colombia, affecting in particular poor women and children inrural households. It is advisable that the government consider actions toreduce the impact of indoor air pollution on these susceptible groups.
Clearly, publicly available systems for monitoring and evaluation arecrucial, not only for technical learning but also for purposes of demo-cratic legitimacy and public confidence. It is also crucial that theseimprovements over time take place on several fronts and that a numberof stakeholders participate in the process, in particular to minimize andprevent learning traps. An example is the common misconception ofthe critical factors behind the success of the CVC’s water pollutioncontrol program, which has led the CVC to emphasize cooperationwith industry, de-emphasize strict enforcement of regulations, andexperiment with effluent charges. A more thorough analysis demon-strates that important factors for the success of the program were citizenpressure, negative publicity, and policies of transnational parent compa-nies calling for the use of environmental audits to facilitate compliancewith environmental rules.
Tackling Environmental Priorities
The remainder of this chapter focuses on a program of policy and insti-tutional reform and complementary investment directed toward areas
478 Sánchez-Triana and Ahmed

that impose a high cost on the economy, but that have not yet beentackled (table 14.1), particularly the need to increase focus on improvingthe quality of life for the growing number of poor people living in andaround urban areas in a country where over 70 percent of the popula-tion is urban.
Waterborne DiseasesAlthough Colombia has achieved substantial reductions in child mortality,including from diarrheal disease, the costs associated with diarrhealmorbidity from contaminated water and inadequate hygiene in bothchildren and adults remain high. The poorest groups often lack adequatesanitation and water supply. Approximately 9 percent of the populationdoes not have access to an improved water source, and the lack of sew-erage in 20 percent of urban centers is a serious environmental problemfor the country.These poor results are largely attributable to the fact thatexplicit policies to address these problems do not exist. An analysis ofalternative interventions to address waterborne diseases shows that themost effective intervention in Colombia would be the design and imple-mentation of a safe water program that promotes hygienic behaviorthrough handwashing and water quality improvement at the point of use,accompanied by the provision of potable water and sewerage services.
Urban and Indoor Air PollutionAir pollution is one of the most widespread and serious problems inColombia’s cities and rural areas. Although air pollution levels are mod-erate in most cities, close to 50 percent of the population live in citieswith more than 100,000 inhabitants, creating substantial aggregatehealth effects associated mainly with particulate matter. This results inhealth impacts such as cardiopulmonary diseases and lung cancers inadult segments of the population, and acute respiratory illness, particu-larly in children, including death from related diseases such as pneumonia.Analysis reveals that the bulk of the cost associated with urban airpollution is linked to mortality. Approximately 6,000 premature fatalitieseach year occur as a result of outdoor air pollution, while an estimated1,100 fatalities are related to exposure to indoor air pollution from useof fuelwood, charcoal, and other solid fuels as primary sources of cook-ing fuel. Since 1993, insufficient financial and human resources havebeen allocated by the government to address air pollution. Furthermore,the urgency to update regulations and issue standards and economicinstruments that minimize the concentration of particulate matter in the
Conclusions and Recommendations 479

air is apparent. To achieve this, the most promising options includereduction of the sulfur content of fuels and the control of emissions fromstationary sources and nonpoint sources, including control of agriculturalresidue burning. With respect to indoor air pollution, possible optionsinclude interventions that promote the use of cleaner fuels, technicalmitigation options such as improved cook stoves, and policies that promoteimproved housing design.
Natural DisastersColombia faces numerous natural disasters such as floods, droughts, andearthquakes. The most numerous natural disasters are floods and land-slides, the management of which falls under SINA’s mandate. Inadequatedrainage in most urban areas is an important factor linked to urbanflooding. In the past quarter century, Colombia has experienced sixmajor earthquakes, three volcanic eruptions, three landslides, and three ava-lanches at a significant cost to the country in terms of human and physicalcapital. According to a recent study, more than 4 million Colombianswere affected by natural disasters during 1993 to 2000, at an annual costof approximately Col$950 billion (US$453 million) (Echeverry 2002).The poorest and most susceptible have borne the highest costs for thesedisasters as measured by damage, death, and lost assets. To reduce vulner-ability to natural disasters, a number of activities must be considered, par-ticularly nonstructural measures to prevent human settlement in areas ofhigh vulnerability to natural disasters.
Soil DegradationThe main components of land degradation in Colombia are erosion andsalinization of soil and the problems associated with deforestation. Thelack of interinstitutional coordination to address the problems of landdegradation is pervasive.The analysis suggests that dispersed investmentsfrom states, municipalities, environmental authorities, and CARs havebeen made in reforestation with little or no impact on erosion control orregulation of water streams. Currently, Congress is discussing a nationalforestry bill. Several stakeholders have recommended incorporatingin the bill provisions to secure the rights of indigenous peoples andsmall farmers.
Water Resources PoliciesColombia is endowed with abundant water resources, and water scarcityis a problem in a small percentage of Colombia’s watersheds. As a resultof degradation of water bodies, and unequal geographic distribution of
480 Sánchez-Triana and Ahmed

water resources, if water resources are not properly managed, by 2025 morethan 14 million inhabitants could suffer water shortages (IDEAM 2004).
Strengthening performance in the water sector requires improvingexisting regulations to control water pollution, including water pollutionfee reform and the introduction of economic instruments to improveefficiency and equity, and to improve water quality standards for humanconsumption, recreational uses, and irrigation. This will also requirestrategies to formulate, socialize, and implement programs for accounta-bility, transparency, and governance to promote compliance with waterquality standards.
Urban Environmental ManagementUrban environmental management problems include issues associatedwith housing and urban planning and with waste management. Housingand urban policies could be amended and enhanced to minimize negativeenvironmental impacts.The three main actions suggested are the stream-lining of environmental issues in the Land Use Plans, the prevention ofinformal housing, and the design of housing subsidy programs aimed atavoiding adverse environmental outcomes.
Statistics indicate that about 27,500 tons of solid wastes are generateddaily in Colombia. There are more than 700 open-air garbage dumpslocated in small and medium municipalities, where public service forwaste collection and disposal is deficient. Very few of the nation’sregistered landfills operate effectively; in the majority of cases, uncon-trolled landfills threaten surface and ground water in surrounding areas.Lack of clarity regarding minimum technical specifications and deficientinterinstitutional mechanisms for adequate closure of open-air dumpsand construction of new landfills have resulted in weak compliance andenforcement. Typically, the poorest live closest to open-air dumps andpoorly designed and operated landfills, which pose both environmentaland health risks. Underscoring these challenges is the fact that anincrease in shanty towns and informal housing in areas most susceptibleto risks of natural disasters has resulted in increased vulnerability forgreater numbers of poor people. It is advisable to design and implementpolicies to operate effective regional waste-disposal sites, and establishand enforce regulations to segregate and treat hazardous wastes.
Global Environmental ProblemsThe most salient global environmental problems evident in Colombiaare loss of biodiversity, climate change, and ozone depletion. Nationalparks cover close to 10 percent of the national territory. Compared with
Conclusions and Recommendations 481

four other mega-diverse Latin American countries, and countries inother latitudes, the percentage of land that is protected is considerable.
The government has achieved notable progress in the creation ofnational parks. To further that success and guarantee its sustainability,legislation could be improved by increasing the importance of local eco-nomic, cultural, and social realities and expectations to ensure that therights of local stakeholders are not detrimentally affected. Protectedareas legislation has in some cases limited the use of traditional produc-tion systems and natural resources by local inhabitants. To overcome thisweakness, the government is considering putting in place institutionalmechanisms to prevent and resolve conflicts between conservation interestsand other social priorities, such as regional, social, and economic devel-opment. Regarding biodiversity, climate change, and ozone-depletingsubstances, Colombia has taken advantage of financial mechanisms suchas the Global Environment Facility, the Prototype Carbon Fund, and theMontreal Protocol to finance private investments aimed at reducingemissions of greenhouse gases and ozone-depleting substances.
Conclusions
Recent decades have brought about high levels of economic growth andurbanization in Colombia. Considerable progress has also been made inaddressing the water and forestry environmental agenda.Thus, the country’smain environmental problems have shifted, with an increasing emphasison environmental health issues. However, the environmental manage-ment agenda has yet to catch up with this shift in priorities from water-shed and forestry to environmental health problems because of a lack ofmechanisms in the current institutional structure to signal these changes.Improved monitoring and dissemination of information on environmentaloutcomes, assignment of clear accountabilities for environmental actionsand outcomes, and involvement of a broad range of stakeholders arethree important mechanisms to allow these signals to be picked up asenvironmental priority issues further evolve in Colombia.
In conclusion, environmental problems associated with the highestcosts of environmental degradation in Colombia are, in decreasing orderof magnitude, waterborne diseases, urban air pollution, natural disasters,land degradation, and indoor air pollution. Combined, these environ-mental problems cost Col$7 trillion (US$3 billion) or 3.7 percent ofColombia’s gross domestic product. The poor and less powerful stake-holders in Colombia bear a disproportionately high share of this cost.
482 Sánchez-Triana and Ahmed

To combat these problems, this report identifies a number of cost-effectiveinterventions that could be adopted in the short and medium terms tosupport efforts to move toward achievement of sustainable developmentgoals (table 14.1). To this end, the government of Colombia is consideringputting in place mechanisms to identify environmental priorities basedon analytical work and broad public consultations.
Note
1. Ernesto Sánchez-Triana and Kulsum Ahmed are the authors of this chapter.
References
Echeverry, J. 2002. “Prevención y Atención de Desastres en Colombia.” WorkingPaper. Departamento Nacional de Planeación, Bogotá.
IDEAM (Institute of Hydrology, Meteorology, and Environmental Studies).2004. Annual Report on the State of the Environment and Natural RenewableResources in Colombia. Bogotá: IDEAM.
Universidad de los Andes. 2004. Application of the World Bank WDR Framework.2003. 4th version. Consultant Report, World Bank, Washington, DC.
WHO (World Health Organization). 2002. Global Burden of Disease 2002.Geneva:WHO.
Conclusions and Recommendations 483


A
AAUs. See Urban EnvironmentalAuthorities
Access Initiative, 55accíons de tutela, 19, 54, 55–56, 62–63n,
476acute respiratory illness (ARI), 252–54,
254f, 254t, 259, 260t, 474, 479costs of, 265–66
Administrative Department of RenewableNatural Resources, proposal for, 17
Afro-Colombian communities. See culturaland ethnic diversity
agriculture, 14–15conflicts with NNPS administration, 445deforestation caused by, 417–18illicit crop production and environmental
effects, 441land area devoted to, 403, 403tland degradation
cost of, 139f, 139–43, 143terosion and salinity, 140–43, 142t,
155n, 399indicators of, 141t
water pollution caused by runoff from, 374
Agua Fresca Hydroelectric Project,455, 456
Agustín Codazzi Geographical Institute(IGAC)
on ecosystems and natural resources,442–43
study of land erosion, 395, 397–98, 399,403, 427–28n
Ahmed, Kulsum, 276n, 462n, 483nair quality, 201–50
See also indoor air pollution; urban airpollution
abatement expenditures for, 219–20allocation of CAR resources for, 73,
79t, 81ambient standards, 245economic costs
health care, 228f, 228–32mobile sources, 232–37, 234–35f,
236temissions by pollutant, 214–16
See also emissions standardsenergy sector developments, 223–25
Index
485
Boxes, figures, notes, and tables are indicated by “b,” “f,” “n,” and “t.”
interventionsanalysis of, 225–41CNG conversion, 240diesel fuel pricing, 238–39fuel quality improvement, 240–41mobile sources, 228–32, 237–41particulate control, 239–40
management of, 203–14fuel subsidies, 212–13legal framework, 203–4monitoring systems, 204–8
management systemperformance of, 214–25pollution abatement expenditures,
219–20monitoring and measurement
ambient monitoring systems, 216–18recommendations for, 244–45, 477
particulate matter. See particulate matterpollution sources, 204–12
fuel quality, 223mobile, 211–12, 220–23, 246nonpoint, 213–14, 225, 246–47stationary, 210–11, 245–46
recommendations for, 241–47,243–44t
regulation of (1975-93), 16Air Quality Information System
(SISAIRE), 227Alto Fragua Indi Wasi National Park, 449,
450, 452, 459Amacayacu National Park, 451ambient air quality standards, 245Annual Investment Operating Plans
(POIAs), 81ARI. See acute respiratory illnessASOCAR. See Colombian Association of
Environmental Authoritiesasphalt factories, emission standards for,
210Associations of Indian Reserves, 446Atrato River, 12automobiles
air pollution caused by. See emissionsstandards; mobile air pollutionsources
water pollution caused by, 375Autonomous Corporation of the Río
Grande of Magdalena, 18Autonomous Regional Corporation for
Manizales, Salamina, and Aranzazu(CRMSA), 13
Autonomous Regional Corporation for theDefense of the Bucaramanga Plateau(CDMB), 12
Autonomous Regional Corporation forTionegro-Nare (CORNARE), 222–23
Autonomous Regional Corporation ofAtlántico (CRA)
investment spending by, 84t, 86waste programs, 306wetlands management by, 388n
Autonomous Regional Corporation ofCundinamarca (CAR), 15
investment spending by, 81–82, 82twater allocation by, 363, 366–67b, 369water fees charged by, 362
Autonomous Regional Corporation ofDique (CARDIQUE)
investment spending by, 85t, 86wetlands management by, 388n
Autonomous Regional Corporation of Frontera Nororiental (CORPONOR), 14
Autonomous Regional Corporation ofQuindío (CRQ), 12
Autonomous Regional Corporation of theCauca Valley (CVC)
electricity generation, 14establishment of, 10, 11, 27, 470Salvajina project, 15sugarcane cutting, 214water pollution control program and
charges, 167, 478Autonomous Regional Corporation of the
Sinú and San Jorge River Valleys(CVS), 13
Autonomous Regional Corporations(CARs)
See also specific CARsAAUs and municipalities in conflict
with, 98–99air quality compliance, 204annual public meeting of CAR directors
and MAVDT, 102boards of directors, 101, 476clean production agreements, 44conflicts of interest for, 94–95, 104Constitution of 1991, effect on, 18contractors, use of, 91–93coordination with research institutes, 51creation of, 297deforestation control by, 421demographic differences among, 68
486 Index

disaster prevention and, 330, 338,348–49
elimination of CARs that perform poorly,104–5
enforcement of national policies, 41,54–55, 96–97, 102–4, 204
environmental indicators for, 35establishment of, 3, 9–13, 12t, 27evaluation of, 104–5, 106nexpansion of roles of, 14–17, 28, 29n,
67–68, 168expenditures of, 24–27, 28, 30n
to most pressing environmentalproblems, 73–74, 81
on operations, 71, 89, 106nfinancial resource differences among, 26,
31n, 86–91, 87–88tchanges in (2002–03), 90–91cofinancing recommendations to
improve coordination, 102–4self-generated revenues, 90, 94, 102
Forest Protection Reserves and ForestProtection–Production Reserves,419, 439
human resources, adequacy of, 91–93,101–2
indoor air pollution standards and, 253information deficiencies about, 41,
68–69investments by, 27, 27t, 36, 71–73, 72t,
106n, 474land quality and issues, 407–11,
408–10t, 412tland use, management of, 405, 413t
See also Land Use Plans (POTs)Law 99, effect on, 22–23, 40, 94licensing responsibility of, 47management capacity needed for, 59–60map of regions managed by, 108fneed to coordinate with MAVDT, 44, 59
recommendations for, 99–105, 100tnumber in 2005, 29nperformance of, 68–71, 70tplanning by, 81–86
See also planningPLECs, development of, 342, 344tpriorities of, 42–43, 71–86
recommendations for, 99–100private reserves management, 439relationship with other SINA entities,
95–99sanitation infrastructure of, 93–95
socioeconomic differences among,70–71
technical resources, adequacy of, 93urban planning and, 289waste management by, 306–7, 307twater pollution control, 168,
376, 383water resources, management of,
360, 361fees for water use, 362
watershed planning. See WatershedAdministration and ManagementPlans (POMCAs)
Autonomous Sustainable DevelopmentCorporations (CDSs), 23
map of regions managed by, 108frevenues of, 37
Awe, Yewande, 153n, 276n, 354n, 387n
B
Ballena-Barrancabermeja pipeline, 224Barranquilla and ambient particulate matter
monitoring, 216, 217t, 218Basel Convention of 1989, 296, 298,
311–12Becerra, Rodríguez, 16biochemical oxygen demand (BOD),
discharge of, 375, 375t, 376–77biodiversity conservation, 39, 433–37
allocation of CAR resources for,73–74, 76t
Humboldt Institute and, 52priority of, 42recommendations for, 458–60, 461t,
481–82biomass smoke, 255, 256tBlackman, Allen, 46, 50, 61n, 70, 71, 94,
98, 99, 105n, 333, 354n, 407,410–11, 427n
BOD. See biochemical oxygen demand(BOD), discharge of
Bogotáair quality in, 202, 204, 215
health costs of, 228, 228fstandards, 208, 209t, 218
ambient particulate matter monitoringin, 216, 217, 217t, 218
emissions inventory model, 231, 231thazardous waste disposal in, 309mass transit system in, 213
Index 487

PM10 emissions in, 229, 229t, 247ncosts of damage caused by, 232, 232t,
236, 236t, 238turban development in, 288urban growth in, 281waste management in, 296
Bogotá Energy Utility (EMGESA), 365bBogotá Hydrological Commitee,
367–68b, 368Bogotá River decontamination project,
38, 95Bogotá Savanna, 11, 15
case study of allocation of waterresources, 363, 364–67b, 474
salinity of, 399, 402twetlands restoration projects, 372–73
Bogotá Wastewater Treatment Plant,378–81
Bogotá Water and Sewer Company(EAAB), 362, 365–66b
boiling of water, costs of, 123, 124tBooz Allen Hamilton on MMA staffing, 39bottled water, costs of, 122–23, 123tBrandriss, Peter, 354n, 387nBrugman, Alberto, 225–26, 239Bucaramanga, 12
air quality in, 202ambient particulate matter monitoring
in, 216, 217, 217tbudget, environmental, 24–27, 28, 36
national disaster prevention and,330–31, 336, 343, 350–51insurance to provide funding, 351
national parks and, 53research institutes and, 52waste management, 302
business sector’s influence over environ-mental regulation, 24, 29n
C
Caliambient particulate matter monitoring
in, 216, 217t, 218, 247nvehicle emission inspections in, 221,
221t, 222, 222tCanal, Francisco, 407CAR. See Autonomous Regional
Corporation of Cundinamarcacarbon dioxide (CO2) emissions, 434, 453,
453f, 453t
carbon monoxide (CO) pollution, 204, 207CARDIQUE. See Autonomous Regional
Corporation of DiqueCarrasquilla, María Lucia, 375Carrizosa, Julio, 16CARs. See Autonomous Regional
CorporationsCartagena wastewater treatment, 381–82cartography, 36Casas, W., 307Cauca Valley
See also Autonomous RegionalCorporation of the Cauca Valley(CVC)
salinization in, 399, 401tCDM. See Clean Development Mechanismcement industry and emission standards,
210Centro de Diagnóstico Automotor del
Valle (CDAV), 222CEPAL. See Economic Commission for
Latin America and the Caribbeanchild mortality
from environmental causes, 113, 113ffrom indoor air pollution, 133t, 133–37from water, sanitation, and hygiene
factors, 115–18, 116t, 160, 163,164–65fbenefits of interventions, 193t
children and air pollution, 253, 254f,254t, 474
children and diarrheal illness, 160, 160tSee also diarrheal illnesshandwashing as effective hygiene inter-
vention, 189–90, 190tchlorofluorocarbons (CFCs), 456chronic obstructive pulmonary disease
(COPD), 252costs of, 265–66
citizen suits, 18–19, 53–54civil society representatives. See nongovern-
mental organizations (NGOs)Civil Society Reserves Network, 439Clean Development Mechanism (CDM),
454, 455Cleaner Production Policy of National
Environmental Council, 45, 46clean production agreements, 44–46, 62n,
300, 310–11climate change, 453f, 453t, 453–56
recommendations for, 460, 461t, 481–82CNE. See National Emergency Committee
488 Index

CNG. See compressed natural gasCNPAD. See National Disaster
Preparedness and ResponseCommittee
CNRN. See National Code for RenewableNatural Resources and EnvironmentalProtection
coal-fired boilers, emission standards for,210
coal smoke, 255, 256tcoca crops, 417Codato, Eleoterio, 334, 335, 337, 340, 341,
355nColford, John, Jr., 161, 163, 163t, 175, 183,
184, 190collective actions. See accíons de tutelaColombia Climate Change Office, 456Colombian Academy for Exact Physical
and Natural Sciences, 444Colombian Association of Environmental
Authorities (ASOCAR), 44, 69,70t, 94
Colombia National Institute of Health ondiarrheal illness, 117
Colombian Construction Chamber ofCommerce, 333, 344
Colombian Environmental InformationSystem (SIAC), 34–37
factors limiting development of, 36–37Colombian Farmers Society, suit over water
fees, 362Colombia Quality of Life Survey (2003),
123, 178, 190Colorado State University study of water
treatment plants, 168COLPADs. See Local Disaster Preparedness
and Response CommitteesColumbian Petroleum Company, 211Compañia Nacional de Consultoría survey
on environmental problems, 149–52compliance actions brought by citizens,
19, 54See also accíons de tutela
compressed natural gas (CNG), 224, 225,225t, 226, 238, 240, 241t
CONAIRE. See National IntersectoralTéchnical Commission for Preventionand Control of Air Pollution
conflicts of interest for CARs, 94–95, 104conflicts with local communities over use
of national park territories,445–53, 459
CONPES. See National Council onEconomic and Social Policy
conservation, 11, 22See also biodiversity conservation;
forestry; soil degradationConstitution of 1991
community participation in environmental decisions, 54, 55,443–44
environmental role of, 9, 10, 17–19, 469hazardous waste provisions, 298indigenous reserves, creation of, 418–19judiciary’s role under, 55waste management provisions, 297water resources, management of, 387n
Construction Engineering Society, 333, 344construction standards for earthquakes,
333, 342, 344, 352contingency plans for disaster risks, 332, 351Contraloría
enforcement measures by, 41, 54on environmental indicators, 35, 36, 428non environmental regulation, 43, 476on research institutes, 50role of, 29n, 54, 61non water pollution, 375
control organizations, 54–55cooking fuels. See fuelwood; indoor air
pollutioncooperatives of scavengers, 312COPD. See chronic obstructive pulmonary
diseaseCorales del Rasrio National Park,
446–48, 450CORANTIOQUIA, investment spending
by, 83t, 83–85CORNARE (Corporación Autónoma
Regional de las Cuencas de los RiosNegro y Nare), 222–23
Corporación Autónoma Regional. SeeAutonomous Regional Corporations(CARs)
Corporation for the SustainableDevelopment of the Chocó(CODECHOCO), 12
Corporation for the SustainableDevelopment of Urabá(CORPOURABA), 12–13
Corporation of Nariño-Putumayo (CNP), 14Costa Rica and ecotourism, 435costs of environmental damage, 110–11, 111t
acute respiratory illness, 265–66
Index 489

air pollution. See indoor air pollution;urban air pollution
by category, 111–13, 112fchronic obstructive pulmonary disease,
265–66deaths from environmental causes, 113,
113festimated rural costs, 111, 112festimated urban costs, 111, 111fhealth and quality of life costs, 112f, 113land degradation, 139f, 139–43, 399,
401, 402tmobile sources, 232t, 232–37, 234–35f,
238tnatural disasters, 144f, 144–48, 338–41,
339tphysical costs, 113, 113fwater shortage, sanitation, and hygiene,
471tavertive expenditures, 122–25, 125tdiarrheal illness, 114f, 114–21, 116t,
118–20thepatitis A, typhoid, and paratyphoid,
121–22, 121–22tcountry environmental analysis (CEA)
objectives of, 2–3process and summary, 3–6
CRA. See Autonomous RegionalCorporation of Atlántico
CREPADs. See Regional DisasterPreparedness and ResponseCommittees
cultural and ethnic diversity, 434, 439–40,445
See also conflicts with local communitiesover use of national park territories
CVC. See Autonomous RegionalCorporation of the Cauca Valley
CVM. See Corporation for the MagdalenaValley and Northern Colombia
D
DAGMA (Departamento Administrativode Gestión del Medio Ambiente,Cali), 211, 222
DALYs. See disability-adjusted life yearsDAMA. See Environmental Administration
DepartmentDANE. See National Administrative
Statistics Department (DANE) data
data collection. See environmental information systems
Day Without My Car program, 221, 221tdeaths from environmental causes,
113, 113fchild mortality. See child mortalitydiarrheal illness and waterborne diseases,
196nSee also diarrheal illness; waterborne
diseasesindoor air pollution as cause, 253–55,
472t, 479urban air pollution as cause, 125f, 127,
127t, 129t, 201, 479decentralization, 67–108
See also Autonomous RegionalCorporations (CARs)
disaster prevention and, 333–34, 341Law 99 of 1993 and, 40relationship of CARs with other SINA
entities, 95–99Decree 02 of 1982, 204, 209t,
210, 477Decree 93 of 1998, 329, 341–42Decree 605 of 1996, 298Decree 622 of 1977, 443, 444, 449,
451, 459Decree 879 of 1999, 406Decree 901 of 1997, 167Decree 919 of 1989, 334–35Decree 948 of 1995, 204Decree 1088 of 1993, 446Decree 1200 of 2004, 55, 97, 475Decree 1220 of 2005, 166Decree 1228 of 1997, 205tDecree 1300 of 2002, 35Decree 1339 of 1994, Article 9, 39Decree 1541 of 1978, 360, 361, 363,
369, 405Decree 1547 of 1983, 330Decree 1594 of 1984, 170, 376Decree 1669 of 2002, 317nDecree 1697 of 1997, 205tDecree 1729 of 2002, 170, 371Decree 1933 of 1994, 361, 371Decree 1974 of 1989, 439Decree 2107 of 1995, 205tDecree 2429 of 1968, 13Decree 2676 of 2000, 314Decree 2811 of 1974, 360, 405, 443Decree 2857 of 1981, 361, 371Decree 3100 of 2003, 167–68, 389n
490 Index

deforestationas cause of climate change, 454as cause of soil degradation, 404, 404tcosts of, 153n, 416–17historic process of, 416, 416tin national parks, 53nontimber products, value of after, 436policy design for, 473trate of, 413–14, 422, 470sources of, 417–18, 421
Demographic and Health Survey (DHS)on acute respiratory illness, 253, 254f, 254ton child mortality, 115on diarrheal prevalence, 117on indoor fuel sources, 130, 251, 256
Departamento Administrativo de Gestióndel Medio Ambiente, Cali (DAGMA),211
Department for Disaster Prevention andResponse, 144, 147
Department of National Planning. SeeNational Planning Department(DNP)
Desai, Manish, 260DGPAD. See General Directorate for
Disaster Relief and PreventionDHS. See Demographic and Health Surveydiarrheal illness, 114f, 114–21, 116t,
118–20t, 153n, 160, 197ndescribed, 196ndisinfection of drinking water, effect of,
190, 191testimated annual cases, 180thandwashing to prevent. See handwash-
ing as effective hygiene interventionimprovements in water supply and
sanitation, effect of, 161, 163,172–94, 173t, 174t, 176t
Dia Sin Carro program, 221diesel fuel, 212, 212t, 224
pricing of, 238–39retrofit technologies for, 239, 240t
disability-adjusted life years (DALYs),154n, 196n, 252, 253f, 277n
See also specific diseasesdisasters. See natural disastersDivision of Natural Resources, creation and
mission of, 10, 11DNP. See National Planning DepartmentDominican Republic use of solid fuels, 273drinking water. See waterborne diseases;
water resources
E
earthquakes, 322See also natural disastersconstruction standards for, 333, 342,
344, 352costs of, 148, 148tsoil erosion caused by, 394
Economic Commission for Latin Americaand the Caribbean (CEPAL),34–35, 147
Ecopetrol, 211, 212, 223Ecosystem Management Global
Environment Facility (GEF) Project, 440
ecotourism. See tourismeducation
on disaster prevention, 352of parent correlated with child
health, 115EEAB. See Bogotá Water and Sewer
Companyeffectiveness, environmental
of environmental institutions, 33–34of environmental regulations, 43–44
EIA. See Environmental Impact Assessment(EIA) system
electricity sector, 12, 14See also names of specific utilitiesclean production agreement compliance
by, 46El Niño, 342Emergency Management Committees,
325–26emissions standards, 45, 208–9,
454–55Bogotá, 208, 209t, 218certification tests, 220development of, 204, 205–6tmass transist impact on, 213, 213tstationary source controls, 210–11
endangered species, 22, 51, 62nendemism, 428n, 464nenergy sector
See also fuelsair quality developments in, 223–25
enforcement of environmental policies, 41See also legal frameworkcontrol organizations, 54–55judiciary, 55–56, 62nvoluntary enforcement, 44–48,
58, 62n
Index 491

Environmental Administration Department(DAMA)
air pollution monitoring, 208, 477air pollution standards, 208–9vehicle emissions control programs, 211,
220–21water fees charged by, 362water resources, case study of allocation,
366–67bEnvironmental Compensation Fund,
37, 103environmental damage, costs of. See costs
of environmental damageenvironmental expenditure review, 24–27,
25f, 25t, 28, 30nEnvironmental Impact Assessment (EIA)
system, 166–67, 195, 371environmental information systems, 34–37,
54, 97, 216, 475See also Colombian Environmental
Information System (SIAC); NationalDisaster Information System
recommendations for, 59, 63nenvironmental laboratories, 36Environmental Management and Planning
Indicators System, 34Environmental Policy Office, 49erosion. See soil degradationEsterling Lara Sánchez, Angel, 46, 311ethnic diversity. See cultural and ethnic
diversityEzzati, Majid, 259–61
F
Fedesarrollo, 211fees and royalties to support environmental
programs, 37, 61n, 63n, 90deposit-refund schemes, 313water pollution charges, 167–70, 169t,
376–77, 383water use fees, 362, 385, 387, 388n
fertilizer use, 404, 404tFeuz, Mirjam, 260Fewtrell, Lorna, 161, 163, 163t, 175, 183,
184, 190First National Communication and sources
of climate change, 454–55fisheries
conflicts with NNPS administration,445, 446–47, 450
degradation of water bodies, effect on,370–71
management of, 16floods, 322–24, 346
See also natural disastersflora and fauna degradation
See also biodiversity conservationCAR investment in remedy, 73–74,
76t, 81FNC. See National Disaster Fundfoodborne illness, 196nforest fires, 232forestry, 413–25
See also deforestation; reforestationcomplexity of tropical forests, 462nconservation history of, 11, 470effectiveness of policy implementation
for, 422–23extent of cover, 414–15, 415t, 422, 423tindicators collected on, 36laws for, 13–14policy design for, 418–22proposed management legislation,
424–25, 427recommendations for, 426t, 427regulation under MMA, 22
Forestry Action Plan, 421Forestry Conservation Certificates, 420Forestry Incentive Certificates, 419Forestry Law (1969), 13–14fuels
See also specific type of fuel (e.g., dieselfuel)
excise tax on gasoline, 223manufacturing sector use of, 215quality improvement, 212, 212t, 240–41refineries, quality of, 223subsidies for, 212–13substitution costs for, 265–67, 266t
fuelwoodcausing indoor air pollution, 129–38,
262f, 263–64, 264t, 478See also indoor air pollution
consumption, 263–64, 264tinternational comparisons, 273–74,
273–74f, 273–74tdeforestation due to, 417–18health risks of, 256–59, 257t, 258t,
259tfugitive dust pollution, 229, 230, 231,
231tFundación Social, 312
492 Index

funding. See budget, environmental; specificagencies and programs
Furatena Energy Efficiency Project, 456
G
Galeras National Park, 450García, C., 334, 335, 337, 340, 341, 355ngasoline. See fuelsGeneral Directorate for Disaster Relief and
Prevention (DGPAD)formerly National Disaster Preparedness
and Response Office (ONPAD),328, 355n
contingency planning, 332, 351coordination challenges for, 336–38creation of, 328funding of, 330, 350–51information on disaster risks, 331need to improve, 347–48PLECs, development of, 342preparation of PNPAD by, 329role of, 328
genetic prospecting, 435–36Global Environmental Fund, 309Global Environment Facility, 39, 52global warming. See climate changegreen cuts, 225, 248ngreen markets, 435groundwater. See water resourcesGuatemala study on open fire, 259,
262, 265guides and manuals for environmental
performance, 45–48
H
handwashing as effective hygiene interven-tion, 163, 183–90, 184–87t, 189f,189t, 194
hazardous and medical waste disposal, 296,306–10, 314
history of institutional structure for,10–14
prohibitions on, 298HCA. See human capital valuation
approachhealth issues
See also waterborne diseases; specificdiseases
air pollution costs, 228, 228findoor air pollution and, 255, 256t
hepatitis A, 121t, 121–22, 122thistory of institutional structure for
environmental management1952–74, 10–14
hospital waste, water pollution from, 374housing
construction standards. See constructionstandards for earthquakes
informal. See informal housingpolicies, 279, 284–91relocation due to identification of high-
risk areas, 332, 343subsidy programs, 287, 294–95, 317n
human capital valuation approach (HCA),232–33, 236, 266
human resources of CARs, 91–93Humboldt Institute, 51, 52, 62n, 452hydrochlorobenzene, 299hydro power, 455, 456, 464nhygiene. See handwashing as effective
hygiene intervention; waterresources
I
IDEAM. See Institute of Hydrology,Meteorology and EnvironmentalStudies
IGAC. See Agustín Codazzi GeographicalInstitute
incinerators, emission standards for, 210INDERENA. See National Institute of
Renewable Natural Resourcesindicators. See environmental information
systemsindigenous territories, 439, 444–53indoor air pollution, 251–78
acute respiratory illness and, 253–54,254f, 254t
baseline health data for, 132–34,133t, 138t
benefit-cost analysis for, 255–61, 256t,257t, 258t, 259t, 260t
as cause of illness and death, 478control programs, effectiveness of, 273f,
273t, 273–74, 274tcosts of health impacts of, 129–38, 130f,
252, 252f, 472testimated costs, 135–39, 136–37t
Index 493

fuelwood consumption and, 262f,263–64, 264t
health effects of, 134–35, 135–36t,255, 256t
health risk assessment for, 131–32, 132tinterventions for, 264–65, 265t, 266t
benefit-cost analysis, 265–71, 267–71tcost of, 267, 270t, 271
recommendations for, 275–76, 275–76t,479–80
sensitivity analysis, 271–72stove efficiency and, 261f, 261–63, 262ftraditional fuel use causing, 130–31,
131tinformal housing, 282–84, 283f, 286–87,
293, 317nprevention of, 291, 293
information and data collection. See envi-ronmental information systems
infrastructure development, 12–13See also specific types of facilities (e.g.,
wastewater treatment)sanitation, 93–95
Ingano communities, 451–52INGEOMINAS. See Institute of Geology
and Minesinjunctive relief to prevent violations of
fundamental rights, 19, 54Institute of Geology and Mines
(INGEOMINAS), 331, 332Institute of Hydrology, Meteorology and
Environmental Studies (IDEAM)coordination with investigational insti-
tutes, 50–51emissions baeline indicators, 214environmental indicators, responsibility
for, 34–35hydrometerology network management
by, 331, 335monitoring baseline, participation in
establishing, 97soil erosion maps and study by, 395,
398, 405, 422solid waste generation estimates by, 302on water supply, 359
future vulnerability to water shortages,358, 359
insufficient data on water pollution,373
POMCAs, formulation of, 369water registry, proposed administra-
tion by, 384
insurance to provide disaster managementfunding, 351
Integrated System for Mass Transporation(SITM), 288, 289
Integrated Waste Management Guidelines(2002), 296, 299, 301, 313
Inter-American Development Bank, 34, 95Intercultural Coordination Committee, 459International Tropical Timber
Organization, 36investigational institutes, 50–52investments by CARs. See Autonomous
Regional Corporations (CARs)irrigation as cause of land salinization, 399IUCN. See World Conservation Union
J
Japan International Cooperation Agency,208, 477
Jepirachi Wind Farm project, 455judiciary, 55–56, 62njurisdictional conflicts with CARs, 98–99,
104
K
Kammen, Daniel, 259–61Katíos National Park, 439Kyoto Protocol, 39, 454, 455
L
land degradation. See soil degradationlandfills. See solid waste disposallandslides, 13, 323–24
See also natural disasterssoil erosion caused by, 394, 397
land titling system, 293, 317nland-use planning, 43
See also Land Use Plans (POTs)data for, 411–15, 413tmost suitable land for, 402t, 405–6
Land Use Plans (POTs), 284–85, 287,290–92, 332, 406, 411
Larsen, Bjorn, 153n, 196n, 247n, 252,276n, 399
Latin AmericaSee also specific countries
494 Index

cooking fuel and indoor air pollution in,258, 259t
deforestation rate in, 414governmental agencies involved in
environmental regulationbudgets of, 25f, 30nlist of, 22t
illness associated with unsafe water in,161
natural disasters in (1970-99), 323tcosts of, 338, 339t
protected areas in, 437, 438fwater availability in, 357–58, 358f
latrines, 163, 177–78La Vuelta and La Herradura project,
455–56Law 02 of 1959, 439, 442, 443, 444,
459, 460Law 9 of 1979, 203, 297, 325, 376Law 9 of 1989, 332Law 21 of 1991, 451Law 30 of 1988, 418Law 35 of 1961, 418Law 46 of 1988, 326, 328, 329Law 60 of 1993, 331Law 70 of 1993, 419Law 99 of 1993
air pollution control provisions, 204,208, 219
decentralized design of, 40disaster prevention and, 330, 338Environmental Impact Assessment (EIA)
system, 166–67environmental role of, 9, 10, 19–23, 20b,
28, 469–70Forest Protection Reserves and Forest
Protection–Production Reserves,419, 439
indoor air pollution standards, 253investigational institutes, establishment
of, 50national parks, administration of,
439, 444sanitation infrastructure under, 94soil degradation and, 405waste management provisions, 297, 310water resources, management of, 360,
362, 372, 387nLaw 152 of 1994, 284Law 223 of 1995, 219–20Law 388 of 1997, 284, 285, 289, 405, 406Law 430 of 1998, 298
Law 715 of 2001, 331Law 788 of 2002, 220Law 788 of 2003, 288Law 919 of 1989, 328Law 2811 of 1974, 203Law of Territorial Development, 284leachate discharges, 296legal framework, 10
from 1975 to 1993, 14–17from 1994 to 2005, 23–27air quality management, 203–4decentralization and, 40, 67–108
See also decentralizationenforcement of environmental policies
by, 41Law 99 of 1993. See Law 99 of 1993natural disasters and, 325–29reform of Constitution of 1991, 17–19
See also Constitution of 1991regulatory issues and, 43–44voluntary regulation and, 44–48, 58, 62nwaste management, 297–98
licensingCAR licensing of polluters, 45environmental impact assessment and
public hearing for, 371MAVDT responsibility for, 47of mines, 16weak administration of, 43
liquefied petroleum gas (LPG), 252,264–65
Local Disaster Preparedness and ResponseCommittees (COLPADs)
burden for implementing policy, 345contingency planning, 332creation of, 328information on disaster risks, 331insufficient funding of, 337, 351recommendations for, 347–48staffing and management of, 337–38study of performance proposed for, 347
Local Emergency and Contingency Plans(PLECs), 342, 343–44t
lorena woodstove efficiency, 263LPG. See liquefied petroleum gaslung cancer, 127, 154n, 255, 256t
M
Madagascar and ecotourism, 435Magdalena River Valley
Index 495

See also Corporation for the MagdalenaValley and Northern Colombia(CVM)
forest protection in, 420water resources, restoration of, 373
Malaysia and child mortality, 115manufacturing sector
air pollution by, 215–16water pollution by, 374
mapsmitigating environmental degradation to
foster growth and reduce inequality,158f
natural disasters, regional distribution of, 324f
regions managed by local and regionalenvironmental authorities, 108f
unsafe water ranges, 162fMaritime General Directorate, 297Mass Gas Plan, 224mass transit
emission reductions with, 213, 213tIntegrated System for Mass
Transportation, 288MAVDT. See Ministry of Environment,
Housing, and Regional DevelopmentMDGs. See Millennium Development GoalsMedellín
air quality in, 202, 215–16, 477ambient particulate matter monitoring
in, 217t, 218urban development in, 288vehicle emission inspections in, 223waste management in, 296
Medellín Public Utilities (ESP), 455medical waste. See hazardous and medical
waste disposalMehta, Sumi, 260Mejoramiento Integral de Barrios, 288, 291metallurgy industry, emission standards
for, 210meteorology. See Institute of Hydrology,
Meteorology and EnvironmentalStudies (IDEAM)
Millennium Development Goals (MDGs)informal housing, 283water supply and sanitation, 164, 166
minesSee also Ministry of Mining and Energylicensing of, 16
Mining and Energy Planning Unit (UPME), 256
Ministry of AgricultureCARs and, 13, 14INDERENA affiliation with, 16on land degradation, 141on land use conflicts, 403, 403tplanned merger of, 62n
Ministry of Development, 12Ministry of Economic Development
CARs and, 13solid waste management and, 299
Ministry of Environment, Housing, andRegional Development (MAVDT)
formerly Ministry of Environment(MMA)
air pollution control and, 16, 204,211, 212
coordination with investigational institutes, 50
creation of, 20b, 21, 28, 204deforestation control by, 421disaster prevention and, 330environmental indicators developed by, 35fuel quality standards and, 204investment budget (2002) of, 43, 43tland use, management of, 405
determining land use and landnaturally suited to, 402–3t
Law 99, effect on, 40, 96licensing responsibility of, 47merger to create MAVDT, 23, 42
evaluation by independent commission, 60
monitoring baseline, participation inestablishing, 97
need to coordinate with CARs, 44, 59recommendations for, 99–105, 100t
priorities of, 42–43relocation of homes due to identification
of high-risk areas, role in, 332role of, 10, 22, 96
from 1994 to 2005, 23–24solid waste management and, 16, 298,
299staff of, 39–40, 40turban development and, 290–91on wastewater treatment, 389nwater pollution control, 376water resources, management of,
360–61, 387nproposed law on allocation of rights
and management, 384wetlands, management of, 372
496 Index

Ministry of Health, 317nair pollution standards and, 204air quality monitoring by, 207–8natural disaster programs of, 326pollution control role of, 16, 28Sanitary Code and, 204
Ministry of Mining and Energy, 16,212, 224
Ministry of Social Protection, 298, 376MMA. See Ministry of Environmentmobile air pollution sources, 211–12,
220–23, 246costs of damage from, 232t, 232–37interventions for, 228–32, 237–41
monitoring stations, 36air quality management and, 204–8ambient systems, 216–18establishment of, 207–8
Montreal Protocol on Substances thatDeplete the Ozone Layer, 457–58
moral imperative of conserving species, 437Morgenstern, Richard, 46, 50, 61n, 70, 71,
94, 98, 99, 105n, 247n, 317n, 407,410–11, 462n
Morillo, Juliana, 375mortality. See child mortality; deaths from
environmental causesMunicipal Integrated Solid Waste
Management Plans (PGIRS), 301–2municipalities
See also headings starting with “urban” or“local”; specific cities
ambient air monitoring, 216–18growth of, 279–320
See also urban growth issuesjurisdictional conflict with CARs, 98–99Land Use Plans (POTs), 332water concessions in, 361
N
National Clean Production Policy, 300National Code for Renewable Natural
Resources and EnvironmentalProtection (CNRN, 1974), 14,203, 297
development of, 9–32forests, regulation of, 418importance of, 10, 27NNPS, creation of, 443, 459, 460water resources, management of, 260
National Council on Economic and SocialPolicy (CONPES), 17, 49
CONPES 3146 (2001) on disaster pre-paredness, 334, 335–37, 340–42
CONPES 3305 on urban growth, 281,284–85, 287, 288
CONPES 3344 on air quality, 227National Development Plan
adoption of, 23DNP coordination of, 49enforcement of, 41priorities under, 23–24, 29nsanitation infrastructure mandate of, 94scope of, 18waste management and, 296–97, 301
National Disaster Fund (FNC), 328,330–31, 339–40, 340t, 341t, 346
National Disaster Information System, 329,331–32, 335, 349
National Disaster Preparedness andResponse Committee (CNPAD), 328
National Disaster Preparedness andResponse Office (ONPAD), 328,355n. See now General Directorate forDisaster Relief and Prevention(DGPAD)
National Disaster Preparedness andResponse Plan (PNPAD), 328, 329
definitions in, 354–55nNational Disaster Preparedness and
Response System (SNPAD)assessment of performance of, 333–38coordination with SINA, 329creation of, 326–27decentralization, effect of, 334, 341, 345funding of, 330–31information deficiencies of, 334–36institutions involved with, 331–38National Environmental System,
relationship with, 330parallels with SINA, 346–47problems due to structure of, 345programs of, 329role of, 327–28
National Emergency Committee (CNE),325–26
National Environmental CouncilCleaner Production Policy of, 45, 46, 300Policy for Social Participation in
Conservation of, 448–49, 459role of, 1, 48, 469structure of, 1, 48
Index 497

National Environmental Fund (FONAM),37–38, 103
National Environmental System (SINA), 297
coordination of CARs with other SINAentities, 95–99
coordination with SNPAD, 329creation of, 9, 10, 19, 204evaluation of, 40, 96expenditures of, 26f, 26–27, 28, 30nNational Disaster Response and
Prevention System, relationship with, 330
parallels with SNPAD, 346–47problems with and recommendations to
correct, 56–61, 60–61trevenue to support, 37–39role of, 1, 9, 20–21b, 469, 471t
National Forestry Development Plan(2000), 424
National Fund for Environmental Action, 103
National Institute of Fishing, 16National Institute of Renewable Natural
Resources (INDERENA)creation of, 9, 13, 470on ecosystems and natural resources,
442–43forest permits issued by, 419–20phase out of, 21role from 1975-93, 16–17, 28, 29n, 53water concessions issued by, 360
National Interior Wetlands Guideline,371–72
National Intersectoral TéchnicalCommission for Prevention andControl of Air Pollution(CONAIRE), 227
National Operations Committee, 337National Parks System (NNPS)
biodiversity conservation in, 435, 437–41CAR responsibility for buffer zones and
private reserves, 439conflicts over use of lands with local
communities, 444–53, 459–60creation of, 11, 23, 442–43, 470financing of, 39management of, 13Policy for Social Participation in
Conservation and, 448–49recommendations for, 52–53, 458–60,
461t, 482
size of, 418urban development and, 297
National Planning Department (DNP)air pollution standards and, 204CARs and, 14, 62nfuel standards and, 211informal housing and, 317nrole of, 48–50, 333SIAC design by, 34
National Protected Areas System (NPAS),437–41, 438t, 474
National Resources Institute ofUniversidad Nacional on ecosystemsand natural resources, 442–43
National Royalty FundCAR-MAVDT coordination and, 103national disaster prevention and, 350as revenue base for environmental
initiatives, 18, 37, 38, 90National Sanitary Code (1979), 16, 28National Statistical Administration
Department (DANE) dataon child mortality, 116, 160emissions estimates, 215estimated mortality, 153n, 154non land degradation, 141
National System of Planning, creation of, 18National System of Science and
Technology, 351National Technical Advisory Council, 48National Technical Committee, 332, 334,
336–37National University of Colombia
Department of Physics study of stoveefficiency, 262, 265
on hazardous waste generation, 309National Resources Institute on ecosys-
tems and natural resources, 442–43National Waste Management Budget, 302natural disasters, 321–56
allocation of CAR resources for preven-tion, 77t, 81, 338
assessment of policies on, 333–38Colombia’s vulnerability to, 322, 472tcosts of, 144f, 144–48, 147t, 149t, 322,
338–41, 339teducation of public about, 352effectiveness of policy design, 324–47
need to improve, 347–48evaluation of planning, 341–42, 346funding of management of, 330–31,
339–41, 340t, 346, 350–51
498 Index

high-risk areas, identification of, 332impacts by type of disaster, 144, 145tinformation and communication
deficiencies on, 334–36, 345, 346information system on, 329, 331–32, 349insufficient safeguards against, 345–46insurance for financing, 351laws on, 325–29monitoring and alert systems, improve-
ment of, 350occurrence and impacts, 322–24, 326tpeople and units affected by, 144, 145t,
146, 146t, 327trecommendations for prevention,
347–54, 352–54t, 480regional distribution of, 322, 324frisk assessments, need to conduct,
349–50scientific research on risks and vulnera-
bilities, 351natural gas production, 224
See also compressed natural gas (CNG)Natural Resources, Division of, 11NGOs. See nongovernmental organizationsnitrogen dioxide (NO2) pollution, 204,
206, 207NNPS. See National Parks Systemnongovernmental organizations (NGOs)
CAR boards of directors to includerepresentatives of, 101
role of, 22, 53nonpoint air pollution sources, 213–14,
225, 226t, 246–47NPAS. See National Protected Areas System
O
objectives of country environmental analysis, 2–3
ODS. See ozone depletionoil-nut palms, 419oil spills, 374–75ONPAD. See National Disaster
Preparedness and Response OfficeOppaluch, J., 307, 308, 309option value, 436Organic Law of the Development Plan, 284Organisation for Economic Co-operation
and Development (OECD), air pollu-tion abatement expenditures, 219
oxidization catalysts, 239
ozone depletion (ODS), 434, 456–57Montreal Protocol on Substances that
Deplete the Ozone Layer, 457–58recommendations for, 461, 461t
ozone (O3) pollution, 204
P
Pan American Health Organization,207, 477
paratyphoid, 121t, 121–22, 122tparticulate matter (PM), 125–29, 126t,
154n, 477–78, 479See also PM2.5 concentrations; PM10
concentrationscontrol of, 239–40defined, 206–7health costs from, 202, 203t
PATs. See Three-Year Action PlansPCBs. See polychlorinated biphenylspentachlorophenol (PCP), 248npersistent organic pollutants (POPs),
299, 309pesticides, 43, 248n, 298, 299, 374PGARs. See Regional Environmental
Management PlansPGIRS. See Municipal Integrated Solid
Waste Management Planspipeline construction, 224plancha woodstove efficiency, 262–63Plan de Ordenamiento Territorial. See Land
Use Plans (POTs)planning
See also National Development Plan;National Planning Department(DNP)
action plans, 41Land Use Plans. See Land Use Plans
(POTs)natural disasters
contingency plans for, 332, 351evaluation of, 341–42, 346National Disaster Preparedness and
Response Plan (PNPAD), 328, 329PLECs, development of, 342,
343–44tRegional Environmental Management
Plans (PGARs), 40, 81, 97sector-by-sector approach, 24, 49–50Three-Year Action Plans. See Three-Year
Action Plans (PATs)
Index 499

Watershed Administration andManagement Plans. See WatershedAdministration and ManagementPlans (POMCAs)
PLECs. See Local Emergency andContingency Plans
PM. See particulate matterPM2.5 concentrations, 202, 207
emission source ratios of, 230, 230tnitrates and sulfates in, 230, 230t
PM10 concentrationsair quality, 218–19Bogotá, 202, 206, 229, 229t, 247ncost of damage caused by, 232–37,
234–35f, 236temission source ratios of, 230, 230turban area comparisons, 201–2, 202,
202f, 217, 217tPNPAD. See National Disaster
Preparedness and Response PlanPOIAs. See Annual Investment Operating
PlansPolicy for Social Participation in
Conservation (1999), 448–49, 459Pollner, John, 334, 335, 337, 340,
341, 355npolychlorinated biphenyls (PCBs), 248n,
299, 309POMCAs. See Watershed Administration
and Management PlansPOPs (persistent organic pollutants),
299, 309POTs. See Land Use PlansPresidential Decrees. See DecreesPrieto, A., 307priority setting, 109–58, 470, 473, 478–82
CARs’ allocation of resources by, 71–86recommendations for, 99–100
forestry, 421–22natural disaster planning and, 345–46need for systematic approach, 56–58,
471t, 475public perceptions and, 149–52, 150t,
151f, 152f, 473regional vs. national, 63n, 96–97, 102–4research priorities, 50–52urban issues, 42–43
Procuraduría Delegada para AsuntoAmbientales, 54, 62n, 475
Procuraduría General, 54, 475professionalism of CAR staff and manage-
ment, 91–93, 101–2
property taxes. See taxesPruss, Annette, 174, 174t, 175–76public hearings, regulation of, 43, 371public perception of priority of environ-
mental problems, 149–52, 150t, 151f,152f, 473
public’s participation in environmentalprotection, 18–19, 53–54
advance notice for, 59conservation and national park creation,
441–53recommendations for, 59
purification of waterSee also wastewater treatment plants;
water resourcescosts of, 123–24, 124tdrinking water disinfection, 190–94
Q
Quality of Life Survey. See ColombiaQuality of Life Survey
Quality of Urban Life Program, 299
R
Ramsar Convention, 371, 388n, 424, 438recycling programs, 305, 306t, 312Red Cross, 333, 337, 339, 341refineries and fuel quality, 223, 225–26reforestation, 11, 13
areas planted, 423, 423tpriority of, 42
Regional Disaster Preparedness andResponse Committees (CREPADs)
burden for implementing policy, 345contingency planning, 332creation of, 328information on disaster risks, 331insufficient funding of, 337, 351recommendations for, 347–48staffing and management of, 337–38study of performance proposed for, 347
Regional Environmental ManagementPlans (PGARs), 40, 81, 97, 406, 475
regulations, 43–44See also specific environmental subjects
of regulation (e.g., air quality, wastedisposal)
business sector’s influence over, 24, 29n
500 Index

EIA regulations, 166–67emissions standards. See emissions
standardsforest protection, 419–20long-term review needed, 58, 476soil degradation, 405voluntary regulation and, 44–48, 58, 62nwater pollution control, 376, 383water resources, management of, 360
relocation of homes due to identification ofhigh-risk areas, 332, 343
renewable energy, 434research priorities, 50–52
natural disasters and, 351Resolution 005 of 1996, 205tResolution 058 of 2002, 206tResolution 259 of 1997, 362Resolution 372 of 1998, 168Resolution 378 of 1997, 205tResolution 0415 of 1998, 206tResolution 619 of 1997, 205tResolution 0623 of 1998, 206tResolution 0886 of 2004, 206t, 210, 248nResolution 898 of 1995, 205tResolution 0970 of 2001, 206tResolution 1045 of 2003, 301–2Resolution 1048 of 1999, 206tResolution 1208 of 2003, 208, 209tResolution 1351 of 1995, 205tResolution 1433 of 2004, 389nResolution 1446 of 2005, 206tResolution 1565 of 2004, 212, 214resource harvesting, 436Resources for the Future (RFF), 99,
211, 336respiratory illness. See acute respiratory
illness (ARI)retrofit technologies, 239, 240trevenue base for environmental support,
18, 26, 37–39See also taxesCARs
differences among, 86–89, 87–88tself-generated revenues, 90, 94, 102
from forest reserves, 422RFF. See Resources for the Futurerisk assessment
CAR resource allocation by, 73–74,75–80t, 81
indoor air pollution and, 255–56, 256tfor natural disasters, 349–50recommendations, 99–100
road accidents, cost of, 153nroyalties. See fees and royalties to support
environmental programsrural water supply and sanitation,
177–80, 179tbenefits and costs of improvements in,
180–81, 182t, 183festimated annual cases of diarrheal
illness, 179–80, 180twater scarcity, 369
S
Salamanca, J., 312salinization. See soil degradationSan Bernardo islands, 446–48Sánchez-Triana, Ernesto, 29n, 61n, 105n,
153n, 196n, 247n, 307, 308, 309,317n, 387n, 427n, 483n
Sanitary Code, 203–4, 297sanitation. See waste management;
wastewater treatment plants; waterresources
scavengers, 312sector guides and manuals for environ-
mental performance, 45–48sewerage utilities, 12, 168–69, 171t, 378
See also wastewater treatment plantsSIAC. See Colombian Environmental
Information SystemSINA. See National Environmental SystemSinú and San Jorge River Valleys, 13SISAIRE. See Air Quality Information
SystemSistema Nacional Ambiental (SINA). See
National Environmental SystemSITM. See Integrated System for Mass
TransporationSmith, Kirk, 260smoke, indoor, 252, 253f, 255SNPAD. See National Disaster
Preparedness and Response SystemSO2. See sulfur dioxide pollutionsocioeconomic characteristics of CARs,
70–71soil degradation, 13
agricultural land. See agricultureCAR investment in remedy, 74, 75t, 81causes of, 402–5cost of, 399, 401, 402tdata availability on, 406–7
Index 501

environmental regulation for, 405erosion, 140–43, 142t, 155n, 394–99
by department, 395, 396tby level of severity, 397t,
397–98, 398trecommendations for, 425, 426t,
427, 480regions affected by high and very
high erosion, 397, 397timplementation of policy for, 406–11investment data on land quality, 407–11,
408–10t, 412tpolicy design for, 405–6, 473tsalinization, 140–43, 142t, 155n, 395,
399–405in Bogotá Savanna, 399, 402tin Cauca Valley, 401tby department, 399, 400tby geographic region, 399, 401trecommendations for, 425, 426t,
427, 480by region, 399, 401t
solid waste disposal, 305–6See also waste managementallocation of CAR resources for,
80t, 81composition of, 303, 304f, 304tdisposal of, 305, 305tgeneration of, 302–4, 303t, 304tguidelines for, 299–300priority of problem, 481recycling of, 305, 306tregulation of (1975-93), 16siting of landfills, 314water pollution from, 374
Solid Waste Information System, 301Special Interest Housing (VIS), 287,
294–95stationary air pollution sources, 210–11,
245–46Stockholm Convention on Persistent
Organic Pollutants, 299, 301stove efficiency
cost of improvements to, 265, 266thealth risks of, 256–57, 257tindoor air pollution and, 258–59t,
261–62f, 261–63subsidies
fuels, 212–13housing, 287, 294–95, 317n
sugarcane fields, burning of, 213–14, 225,226t, 246–47
sulfur dioxide (SO2) pollution, 204, 206–7,215, 247n
sulfuric acid (H2SO4) emissions, 210
T
Tandachiridu Inganocuna Association ofIndian Reserves, 451, 452
taxesforestry plantations, deductions for
investment in, 419gasoline excise tax, 223, 226jurisdictional conflicts with CARs,
98–99, 104municipal taxes, 294as revenue base for environmental
expenditures, 18, 26, 37, 38, 63n, 90value-added tax (VAT) exemptions and
pollution abatement, 219–20, 220tTechnical Advisory Council for
Environmental Policies and Norms(CTA), 30n, 469
technical resources of CARs, 93telecommunications, 15Ten-Year Regional Environmental
Management Plans, 475See also Regional Environmental
Management Plans (PGARs)Territorial Development Plans, 342terrorism, 374threatened species. See endangered speciesThree-Year Action Plans (PATs), 40,
81–86, 97, 406, 428n, 475–76timber industry, 417–18, 436Topping, Elizabeth, 46, 50, 70, 71, 94, 98,
99, 407, 410–11total suspended particulates (TSP), 204tourism, 39, 435Traditional Indigenous Authorities, 446transit systems. See mass transitTransmilenio, 213, 239trap oxidizer systems, 239typhoid, 121–22, 121–22t
U
UNESCO historical and cultural heritagesites in Colombia, 434, 439
United Nations Food and AgricultureOrganization, 308
502 Index

United Nations Framework Convention onClimate Change (UNFCCC), 454
United StatesSee also headings starting with “U.S.”air pollution abatement expenditures, 219sulfur emissions in, 230, 230t
Universidad de los Andes study on PMemissions, 215, 229
unsafe water. See waterborne diseases;water resources
UPME. See Mining and Energy PlanningUnit
urban air pollutionSee also air qualitycosts of health impacts of, 125f, 125–29,
127–28t, 202, 471–72tdeaths caused by, 127, 127t, 129trecommendations for, 479–80
Urban Environmental Authorities (AAUs),22, 23
air pollution control, 204conflicts with CARs, 98–99, 104creation of, 297finances of, 38, 62nwaste management, 297water pollution control, 376water resources, management of,
360, 361urban environmental issues
air pollution. See air quality; urban airpollution
disaster planning, 331jurisdictional conflicts with CARs,
98–99, 104priority of, 42–43, 472t, 481water supply and sanitation, 177–78,
179t, 196n, 197nurban growth issues, 279–320
development strategy, 288–89governmental response, 287–89housing policy, 284–91
institutional framework for, 284–86subsidy programs, 287, 294–95
informal housing, 282–84, 283f,286–87, 293
legal and regulatory framework recommendations, 291–93
recommendations for, 290–91, 290–95unbalanced city growth, 281–82
Urrutia, Carolina, 354n, 462nU.S. Department of Agriculture criteria for
soil erosion, 395
U.S. Department of Commerce on industrialassociations’ influence over environ-mental regulations in Colombia, 24
U.S. Environmental Protection Agencyair pollution standards and, 211on ozone depletion, 457
V
value-added tax (VAT) exemptions andpollution abatement, 219–20, 220t
value of statistical life approach (VSL),203, 228, 233, 236, 266
Vargas Bejarano, Carlos, 307vehicle emissions. See air quality; emissions
standards; mobile air pollution sourcesVIS. See Special Interest Housingvolatile organic compounds (VOCs), 207voluntary regulation, 44–48, 58, 62nVon Humboldt Institute. See Humboldt
InstituteVSL. See value of statistical life approach
W
wages lost due to environmental conditions, 128–29, 154n
waste management, 295–313See also solid waste disposalclean production agreements. See clean
production agreementseffectiveness of current system, 302–13hazardous and medical waste, 306–10municipal programs, 306, 307t, 308tNational Development Plan, 2002–06, 301national policies on, 298–302recommendations for, 313–16, 315–16tregulation of (1975–93), 16
wastewater treatment plants, 15, 72–73,93–95, 106n, 359
Bogotá Wastewater Treatment Plant,378–81
Cartagena case, 381–82costs of, 378, 380t, 380–81fees, 169–70inefficient operation of, 377–78, 379t
waterborne diseases, 159–99See also water resourcesassessment of policy design, efficiency,
and effectiveness, 161–70, 471t
Index 503

diarrheal illness, 114f, 114–21, 116t,118–20t, 153n, 160
handwashing to prevent. See handwashingas effective hygiene intervention
hepatitis A, typhoid, and paratyphoid,121–22, 121–22t
recommendations for, 194–95, 195t, 479world map showing unsafe water ranges,
162fwater concessions, 360, 361, 369–70, 370t,
384–85water pollution, 373–82
allocation of CAR resources for, 78t, 81CARs’ role in, 14, 376, 383challenges of, 358–59charges for, 167–70, 169t, 376–77,
383, 478control regulations, 376, 383costs of, 153nimplementation of policy for, 376–78proposed law on control, 385recommendations for, 383–87, 386ttoxic and pathogenic pollution, 373–75
water resourcesboiling of water, costs of, 123, 124tbottled water, costs of, 122–23, 123tdevelopment and management of,
357–92, 473tavailability of water, 357–58, 382CARs’ role in, 11, 13, 14, 18case study of allocation of water
resources by Bogotá Savanna, 363,364–67b, 474
compared to other Latin Americancountries, 357–58, 358f
concessions. See water concessionsdegradation of water bodies, 370–73effectiveness of policy implementa-
tion for, 363, 368–69fees for water use, 362, 385, 387, 388npolicy design for, 360–63, 371–72,
382–83pollution. See water pollutionpriorities for allocation of, 42, 361, 387nproposed law on allocation of rights
and management, 384quantity of water from watersheds,
359–70recommendations for, 383–87, 386t,
480–81water registry, 384
shortage of water, sanitation, and hygiene,114–24, 159–99
See also waterborne diseasesanalysis of alternative interventions,
172–94, 173t, 174t, 176t, 177t, 193tanalysis of policy implementation,
170–72, 171tavertive expenditures, 122–25, 125tconstraints due to environmental
regulatory framework, 166–67,194–95
drinking water disinfection, 190–94,191t, 192–93f
effect of improvements, 163–66,164–65f, 180–83, 182t
handwashing to prevent disease. Seehandwashing as effective hygieneintervention
recommendations for, 194–95urban vs. rural, 177–78, 179t
water purification, costs of, 123–24, 124tWater Resources Management Law, 346Water Sector Reform Assistance Loan, 194Watershed Administration and
Management Plans (POMCAs),361–62, 369–70, 371
CAR implementation of, 372–73Water Supply and Sanitation Reform
program (2001), 165, 170wetlands, 358, 371–72, 373, 438Wetlands Convention (Ramsar), 371,
388n, 438wind power, 455World Bank
credits, 38deforestation analysis by, 421Montreal Protocol, assistance in
implementing, 458wetlands restoration projects, 372
World Biosphere Reserves, 438–39World Conservation Union (IUCN)
red list and red data books, 62non water resources management, 389n
World Health Organization (WHO), 252on deaths and disabilities due to
waterborne illnesses, 161on deaths due to indoor smoke,
129–30on diarrheal incidence in developing
countries, 174
Z
Zeluaga, Germán, 451–52
504 Index


ECO-AUDIT
Environmental Benefits Statement
The World Bank is committed to preservingendangered forests and natural resources.The Office of the Publisher has chosen toprint Environmental Priorities and Poverty Reduction on recycled paper with 30 percentpostconsumer fiber in accordance with therecommended standards for paper usage set by the Green Press Initiative, a nonprofit program supporting publishers in using fiber that is not sourced from endangered forests. For more information, visitwww.greenpressinitiative.org.
Saved:• 8 trees• 6 million BTUs of
total energy• 734 lbs. of CO2 equiva-
lent greenhouse gases• 3,045 gallons of
wastewater• 391 lbs. of solid waste


ISBN-10: 0-8213-6888-5
Environmental Priorities and Poverty Reduction: A Country Environmental Analysis for
Colombia proposes cost-effective policy and technical interventions aimed at abating
the cost of environmental degradation and supporting more equitable and sustainable
economic growth.
Environmental degradation is associated with increased morbidity and mortality and
decreased productivity. Urban and indoor air pollution; inadequate water supply, sanitation,
and hygiene; natural disasters (mainly floods and landslides); and land degradation are the
environmental problems associated with the highest social and economic costs, falling
most heavily on vulnerable people, especially poor children under five years old.
Environmental Priorities and Poverty Reduction begins by exploring institutional change
and environmental priorities in Colombia over the past 50 years, a time of substantial
progress in environmental protection and rapid transition from a largely rural to a highly
urbanized economy. Part II assesses the burden of disease rooted in inadequate water
supply, sanitation, and hygiene; poor air quality; natural disasters; and environmental man-
agement practices to reduce that burden. A discussion of the environmental costs
of rapid and unplanned urbanization is included. Part III assesses the sustainable
management of Colombia’s rich endowment of natural resources.
This book provides a wealth of information for policy decision makers, government officials,
and other professionals working in environmental policy and management, poverty reduc-
tion strategies, public health, environmental economics, and civil society issues.