Dynamic Simulation, Optimization, and Control of Flexible ...
298
University of Connecticut OpenCommons@UConn Doctoral Dissertations University of Connecticut Graduate School 2-17-2016 Dynamic Simulation, Optimization, and Control of Flexible Chemical-Looping Combustion Processes Lu Han University of Connecticut - Storrs, [email protected] Follow this and additional works at: hps://opencommons.uconn.edu/dissertations Recommended Citation Han, Lu, "Dynamic Simulation, Optimization, and Control of Flexible Chemical-Looping Combustion Processes" (2016). Doctoral Dissertations. 1039. hps://opencommons.uconn.edu/dissertations/1039
-
Upload
khangminh22 -
Category
Documents
-
view
6 -
download
0
Transcript of Dynamic Simulation, Optimization, and Control of Flexible ...
University of ConnecticutOpenCommons@UConn
Doctoral Dissertations University of Connecticut Graduate School
2-17-2016
Dynamic Simulation, Optimization, and Control ofFlexible Chemical-Looping Combustion ProcessesLu HanUniversity of Connecticut - Storrs, [email protected]
Follow this and additional works at: https://opencommons.uconn.edu/dissertations
Recommended CitationHan, Lu, "Dynamic Simulation, Optimization, and Control of Flexible Chemical-Looping Combustion Processes" (2016). DoctoralDissertations. 1039.https://opencommons.uconn.edu/dissertations/1039
Dynamic Simulation, Optimization, and Control of Flexible
Chemical-Looping Combustion Processes
Lu Han, Ph.D.
University of Connecticut, 2016
Combustion of hydrocarbon fuels using the concept of chemical-looping combustion
(CLC) is a novel approach projected to have higher energy efficiency than conventional CO2
capture technologies. For CLC technologies to become commercially relevant, it is important to
optimize the design of CLC reactor systems for high efficiencies for CO2 capture and power
generation. From an engineering point of view, CLC is a complex system with a large number of
candidate materials and reactor configurations that need to be considered for process
improvement. In this work, a model-based methodology was proposed as a formal framework to
guide in developing novel technologies, using CLC as an exemplary case study. This framework
deals with the development and validation of process models, optimization of a cyclic controls
strategy for batch systems, and elimination process bottlenecks through the intensification of
chemical reactors. As a first step, modelling and simulation was integrated with bench-scale
CLC experiments to understand the phenomenological changes inside the CLC reactor and
identify sources of model uncertainty. Optimal experimental design techniques were used to
determine statistically-rich kinetic networks and parameters, in order to obtain kinetic models
that are valid for prediction and extrapolation to large-scale systems. Optimization problems
Han, Lu - University of Connecticut, 2016
were formulated to maximize the efficiency of the CLC reactors with respect the cycle operation,
to seamlessly integrate CLC into advanced power cycles. It was found that the process efficiency
of conventional CLC reactor configurations was limited by an upper bound due to restrictions
originating from poor gas/solid contact and low bed utilization. To improve upon the existing
reactor designs, a novel reverse-flow reactor was proposed as a process intensification option for
CLC. From a theoretical analysis, the reverse-flow process is shown to be a potentially disruptive
technology, which offers the ability to reach higher plant efficiencies, while minimizing the
process footprint. The feasibility of this structured methodology is demonstrated, as a means to
enable faster deployment of novel technologies.
i
Dynamic Simulation, Optimization, and Control of Flexible
Chemical-Looping Combustion Processes
Lu Han
B.Sc., University of Connecticut, 2011
A Dissertation
Submitted in Partial Fulfillment of the
Requirements for the Degree of
Doctor of Philosophy
at the
University of Connecticut
2016

ii
APPROVAL PAGE
Doctor of Philosophy Dissertation
Dynamic Simulation, Optimization, and Control of Flexible Chemical-
Looping Combustion Processes
Presented by
Lu Han, B.Sc.
Major Advisor __________________________________________
Dr. George M. Bollas
Associate Advisor ________________________________________
Dr. Ranjan Srivastava
Associate Advisor ________________________________________
Dr. Brian Willis
Associate Advisor ________________________________________
Dr. Leslie Shor
Associate Advisor ________________________________________
Dr. Steven Suib
University of Connecticut
2016

iii
Dedicated to my family for always believing in me…
and to my beloved Fenway, for being my beacon of light …

iv
ACKNOWLEDGMENTS
This research would not be possible without the support of many people. I would like to thank my parents
for their encouragement to pursue a PhD in Chemical Engineering. I would also like thank my boyfriend,
Shayan, for his support and patience through this arduous journey. I would like to extend my sincere
gratitude to Prof. Bollas, who had the role of scientific supervision and mentorship of this work. His
contributions have profoundly enriched this thesis. I would like to extend my acknowledgement and
recognition to the distinguished thesis committee members: Prof. Brian Willis, Prof. Ranjan Srivastava,
Prof. Steven L. Suib, and Prof. Leslie Shor. Their comments and suggestions have been a great
contribution to this dissertation. I owe my sincere thanks to the past and current members of this research
group, Dr. Zhiquan Zhou, Dr. Shoucheng Du, Chen Chen, Chunxiang Zhu, Brian Baillie, Kyle Palmer,
and William Hale, as well as the undergraduate assistants whom I mentored, Clarke Palmer and Kyle
Such.
This material is based upon work supported by the National Science Foundation under Grant No.
1054718. Part of the work was supported by the National Science Foundation Graduate STEM fellowship
in K-12 Education (NSF GK-12). Part of this work was sponsored by the UTC Institute for Advanced
Systems Engineering (UTC-IASE) of the University of Connecticut and the United Technologies
Corporation. Any opinions expressed herein are those of the authors and do not represent those of the
sponsor. Support by W.R. Grace & Co. by providing the Al2O3/SiO2 matrices is gratefully acknowledged.
v
Table of Contents ACKNOWLEDGMENTS .............................................................................................................. iv
Chapter 1 INTRODUCTION ............................................................................................................... 1
1.1. Motivation for CO2 mitigation ........................................................................ 1
1.2. CO2 capture in power generation .................................................................... 3
1.3. Concept of chemical-looping combustion ....................................................... 7
Chapter 2 LITERATURE REVIEW ................................................................................................... 11
2.1. Oxygen carriers for CLC ............................................................................... 11
2.2. Reactor design and operation ........................................................................ 15
2.3. Modeling and simulation ............................................................................... 19
2.4. Process integration ........................................................................................ 23
2.5. Research objective ......................................................................................... 26
Chapter 3 BENCH-SCALE EXPERIMENTATION .............................................................................. 28
3.1. Oxygen carrier preparation ............................................................................ 28
3.2. Characterization techniques .......................................................................... 28
3.3. Thermogravimetric analyzer (TGA) method................................................. 29
3.4. Fixed bed reactor setup.................................................................................. 30
Chapter 4 HETEROGENEOUS MODELING OF CHEMICAL-LOOPING COMBUSTION: PART 1:
REACTOR MODEL .......................................................................................................................... 32
4.1. Introduction ................................................................................................... 32
4.2. Model description .......................................................................................... 34
4.3. Results and discussion ................................................................................... 43
4.4. Conclusions ................................................................................................... 62
Chapter 5 HETEROGENEOUS MODELING OF CHEMICAL-LOOPING COMBUSTION: PART 2:
PARTICLE MODEL .......................................................................................................................... 63
5.1. Introduction ................................................................................................... 63
5.2. Model description .......................................................................................... 66
5.3. Results and discussion ................................................................................... 69
5.4. Conclusions ................................................................................................... 90
Chapter 6 MODEL-BASED DESIGN OF CHEMICAL-LOOPING COMBUSTION EXPERIMENTS ..... 91
6.1. Introduction ................................................................................................... 91
6.2. Problem statement ......................................................................................... 93
6.3. Design of experiments ................................................................................. 106
6.4. Process model .............................................................................................. 119
6.5. Experimental methods ................................................................................. 120
6.6. Results and discussion ................................................................................. 120
6.7. Conclusions ................................................................................................. 143
Chapter 7 DYNAMIC OPTIMIZATION OF FIXED BED CHEMICAL-LOOPING COMBUSTION
PROCESSES .................................................................................................................................. 144
7.1. Introduction ................................................................................................. 144
7.2. Problem formulation.................................................................................... 148
7.3. Dynamic simulation of a nominal design .................................................... 152
7.4. Results and discussion ................................................................................. 159
7.5. Conclusions ................................................................................................. 169
CHAPTER 8 A NOVEL REVERSE-FLOW FIXED BED REACTOR FOR CHEMICAL-LOOPING
COMBUSTION .............................................................................................................................. 170
8.1. Introduction ................................................................................................. 170
8.2. Mathematical model .................................................................................... 176
8.3. Reactor design and operation ...................................................................... 181
8.4. Results and discussion ................................................................................. 185

vi
8.5. Conclusions ................................................................................................. 195
CHAPTER 9 OPTIMAL CONTROL OF A REVERSE-FLOW CHEMICAL-LOOPING FIXED BED
REACTOR ..................................................................................................................................... 197
9.1. Introduction ................................................................................................. 197
9.2. Basic operating principle of fixed bed CLC ................................................ 199
9.3. Novelty and scope of this work ................................................................... 201
9.4. Model Validation ......................................................................................... 204
9.5. Base case for comparative analysis of the reverse-flow reactor .................. 205
9.6. Results and discussion ................................................................................. 208
9.7. Conclusions ................................................................................................. 219
CHAPTER 10 A NOVEL SIMULATED MOVING BED PROCESS FOR CHEMICAL-LOOPING
COMBUSTION ............................................................................................................................... 220
10.1. Introduction .................................................................................... 220
10.2. Basis of comparison ....................................................................... 221
10.3. Results and discussion .................................................................... 223
10.4. Conclusions .................................................................................... 226
CHAPTER 11 CONCLUSIONS AND RECOMMENDATIONS ........................................................... 227
11.1. Concluding remarks ....................................................................... 227
11.2. Recommendations .......................................................................... 230
CHAPTER 12 APPENDIX .............................................................................................................. 234
12.1. Physical properties ......................................................................... 234
12.2. Transport through cylindrical particle ............................................ 238
CHAPTER 13 NOMENCLATURE ................................................................................................... 240
LIST OF PUBLICATIONS AND CONFERENCE PRESENTATIONS ................................................... 251
COPYRIGHT ................................................................................................................................. 255
REFERENCES ................................................................................................................................ 256
vii
List of Tables
Table 2.1: Summary of the experience time (in hours) on CLC and CLR in continuous units from Adanez
et al. [23]. Abbreviations: CLC, chemical-looping combustion, CLCs, solid-fueled chemical-
looping combustion, CLR, chemical-looping reforming. .............................................................. 12
Table 4.1: Reduction reactions using NiO oxygen carrier selected by Zhou et al. [119]. .......................... 41
Table 4.2: Summary of independent variables in the 1-D model for a spherical oxygen carrier. .............. 42
Table 4.3: Summary of independent variables in the 2-D model for a spherical oxygen carrier. .............. 43
Table 4.4: Oxygen carrier physical properties and experimental conditions of chemical-looping fixed-bed
units studied in this work. .............................................................................................................. 43
Table 4.5: Estimated kinetic rate constants for the CLC data of Iliuta et al. [58] at 900°C. ...................... 44
. Table 4.6: Estimated kinetic rate constants for the CLR data of Jin and Ishida [171] at 600°C. ............ 45
Table 4.7: Estimated kinetic rate constants for the CLC data of Rydén et al. [172] at 900°C. .................. 46
Table 4.8: Effect of particle size on 4CHX and
2HS for CLR fixed bed setup reported by Jin and Ishida
[171] at 600°C. ............................................................................................................................... 62
Table 5.1: Physical property changes of different oxygen carriers from continuous CLC operation. ....... 64
Table 5.2: Model parameters for the reduction of Ni/YSZ oxygen carriers at 600°C in TGA under H2
[47]. Particle ‘D’ was used for the evaluation of particle size effects and particle ‘E’ for the
recycle tests. The kinetic rate constant (k2) corresponds to the NiO reduction reaction by H2
according to Zhou et al. [119] and is lumped with the surface area. ............................................. 72
Table 5.3: Estimated kinetic parameters for the reduction of Ni/γ-Al2O3 and Ni/α-Al2O3 oxygen carriers at
900°C in TGA under 15% CH4, 20% H2O, and 65% N2 [72]. Rate constants (k1-k4) correspond to
NiO reduction kinetics published by Zhou et al. [119] and rate constants (k1ʹ-k3ʹ) correspond to
the NiAl2O4 reduction kinetics published by Dueso et al. [114]. fNiO = 25% and 65% for fresh and
used Ni/γ-Al2O3; fNiO = 82% and 84% for fresh and used NiO/α-Al2O3. ....................................... 80
Table 5.4: Estimated kinetic parameters for the reduction of Ni/γ-Al2O3-SiO2 oxygen carrier at 950°C in
4 vol.% H2 in Ar. Rate expressions k2 correspond to the NiO reduction with H2 kinetics published
by Zhou et al. [119] and k2ʹ correspond to the NiAl2O4 reduction with H2 kinetics published by
Dueso et al. [114]. .......................................................................................................................... 83
Table 5.5: Properties of the Ni/γ-Al2O3-SiO2 oxygen carrier after various cycles tested in TGA at 950°C.
Reduction in 4 vol.% H2 in Ar and oxidization in 100% air. ......................................................... 85
Table 6.1: Literature-proposed reaction pathways for the heterogeneous reduction of NiO by CH4 and its
partial oxidation derivatives. .......................................................................................................... 95
Table 6.2: Candidate solid-state reaction models for CLC, based on Zhou et al. (2014) [132]. ................ 96
viii
Table 6.3: Candidate catalytic reactions for CLC reduction with a Ni-based oxygen carrier and CH4 fuel
[119]. .............................................................................................................................................. 97
Table 6.4: Possible reforming schemes used in the CLC literature............................................................ 98
Table 6.5: Design of the CL fixed bed units in the literature. ................................................................... 101
Table 6.6: Time-invariant controls for the in-house CLC fixed bed experiments. .................................. 120
Table 6.7: Correlation matrix of the parameter estimates for NiO/γ-Al2O3 oxygen carrier with MIII-VI-II-II at
the calculated design that maximizes SLI. ................................................................................... 125
Table 6.8: Range of design variables for the steam methane reforming, reverse water gas shift, and
methanation experiments and results of the SLI test in terms of the minimum Nexp. The results for
the Ni/α-Al2O3 oxygen carrier are differentiated from Ni/γ-Al2O3 (in parentheses).................... 128
Table 6.9: Parameter estimates for the first T-design for model discrimination, φT(3) =[0.20 mol/mol CH4,
2.2 g, 615°C, 40s] ........................................................................................................................ 134
Table 6.10: Results of the parameter estimation with the parallel D-design strategy (Figure 6.11). The
reference t-value is 1.662. ............................................................................................................ 138
Table 6.11: Results of the parameter estimation with the sequential D-design strategy (Figure 6.12). The
reference t-value is 1.662. ............................................................................................................ 137
Table 6.12: Results of the parameter estimation with the reference experiment (Figure 6.13). The
reference t-value is 1.662. ............................................................................................................ 138
Table 6.13: Parameter estimates for the second T-optimal design to validate model selection, φT(1) =[0.30
mol/mol CH4, 0.80 g, 610°C, 34s]. .............................................................................................. 140
Table 7.1: Design variables in the dynamic operation of fixed bed CLC. ............................................... 149
Table 7.2: Properties of the oxygen carriers simulated in this work. ....................................................... 152
Table 7.3: Design and operating conditions of the studied fixed bed reactor configuration (adapted from
Spallina et al. [110] suited for reduction by syngas-fuel and methane-fuel). .............................. 154
Table 7.4: Summary of the optimal operating strategy for the fixed bed processes with the NiO and CuO
oxygen carriers over the reactor design of Table 7.3. ................................................................. 163
Table 7.5: Heat removal coefficients computed for the optimal cycle strategies of Figures 7.6-7.9 and for
the nominal operation of Figures 7.2-7.5. ................................................................................... 165
Table 8.1: Operating conditions of the current CL fixed-bed units.......................................................... 177
Table 8.2: Chemical-looping Reducer reactions with NiO and CH4 [119].. ............................................. 177
Table 8.3: Properties of the oxygen carrier studied [127]. ....................................................................... 183
Table 8.4: Design and operating parameters for the case studies examined. ........................................... 183
ix
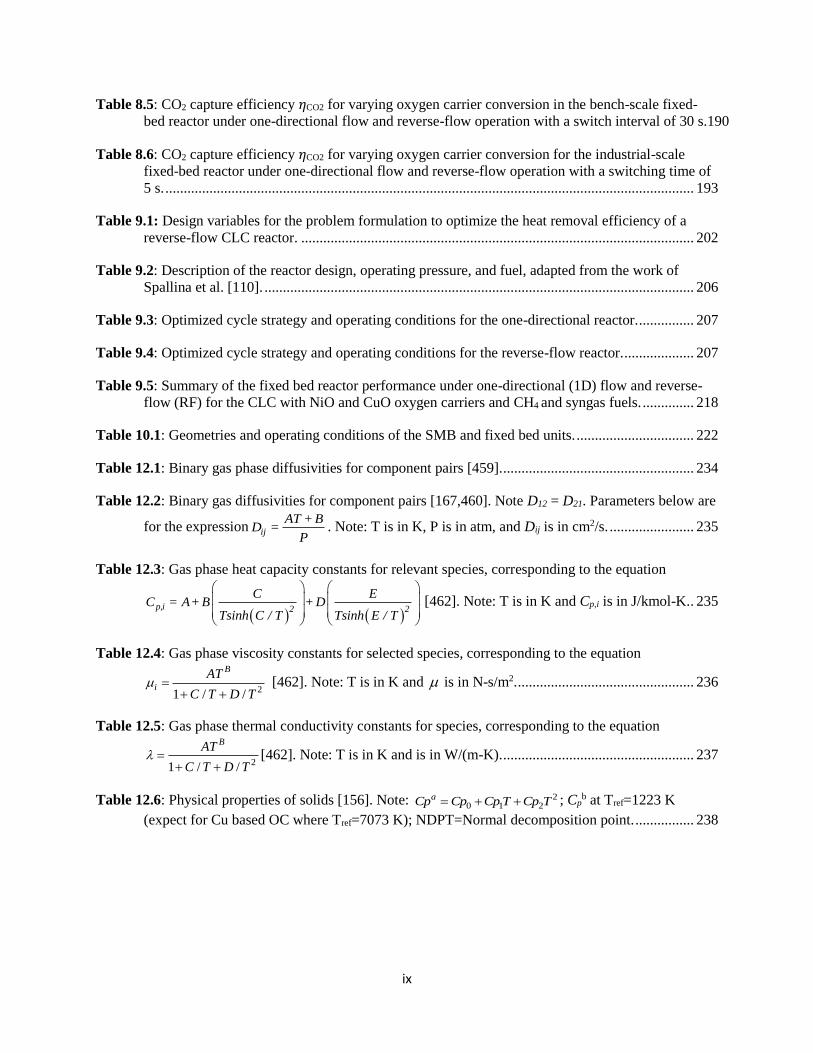
Table 8.5: CO2 capture efficiency 𝜂CO2 for varying oxygen carrier conversion in the bench-scale fixed-
bed reactor under one-directional flow and reverse-flow operation with a switch interval of 30 s.190
Table 8.6: CO2 capture efficiency 𝜂CO2 for varying oxygen carrier conversion for the industrial-scale
fixed-bed reactor under one-directional flow and reverse-flow operation with a switching time of
5 s. ................................................................................................................................................ 193
Table 9.1: Design variables for the problem formulation to optimize the heat removal efficiency of a
reverse-flow CLC reactor. ........................................................................................................... 202
Table 9.2: Description of the reactor design, operating pressure, and fuel, adapted from the work of
Spallina et al. [110]. ..................................................................................................................... 206
Table 9.3: Optimized cycle strategy and operating conditions for the one-directional reactor. ............... 207
Table 9.4: Optimized cycle strategy and operating conditions for the reverse-flow reactor. ................... 207
Table 9.5: Summary of the fixed bed reactor performance under one-directional (1D) flow and reverse-
flow (RF) for the CLC with NiO and CuO oxygen carriers and CH4 and syngas fuels. .............. 218
Table 10.1: Geometries and operating conditions of the SMB and fixed bed units. ................................ 222
Table 12.1: Binary gas phase diffusivities for component pairs [459]. .................................................... 234
Table 12.2: Binary gas diffusivities for component pairs [167,460]. Note D12 = D21. Parameters below are
for the expression ij
AT + BD =
P. Note: T is in K, P is in atm, and Dij is in cm2/s. ....................... 235
Table 12.3: Gas phase heat capacity constants for relevant species, corresponding to the equation
p,i 2 2
C EC = A+ B + D
Tsinh C / T Tsinh E / T
[462]. Note: T is in K and Cp,i is in J/kmol-K.. 235
Table 12.4: Gas phase viscosity constants for selected species, corresponding to the equation
21 / /
B
i
AT
C T D T
[462]. Note: T is in K and is in N-s/m2. ................................................ 236
Table 12.5: Gas phase thermal conductivity constants for species, corresponding to the equation
21 / /
BAT
C T D T
[462]. Note: T is in K and is in W/(m-K). .................................................... 237
Table 12.6: Physical properties of solids [156]. Note: 20 1 2
aCp Cp Cp T Cp T ; Cpb at Tref=1223 K
(expect for Cu based OC where Tref=7073 K); NDPT=Normal decomposition point. ................ 238

x
List of Figures
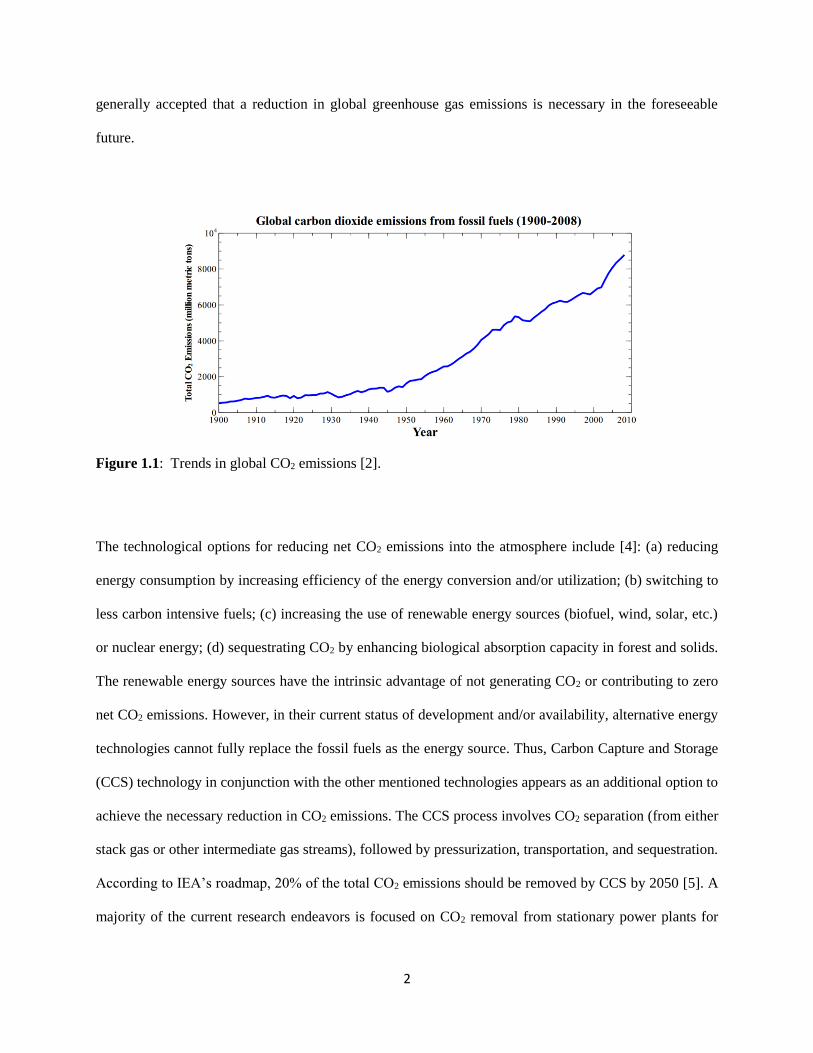
Figure 1.1: Trends in global CO2 emissions [2]. ......................................................................................... 2
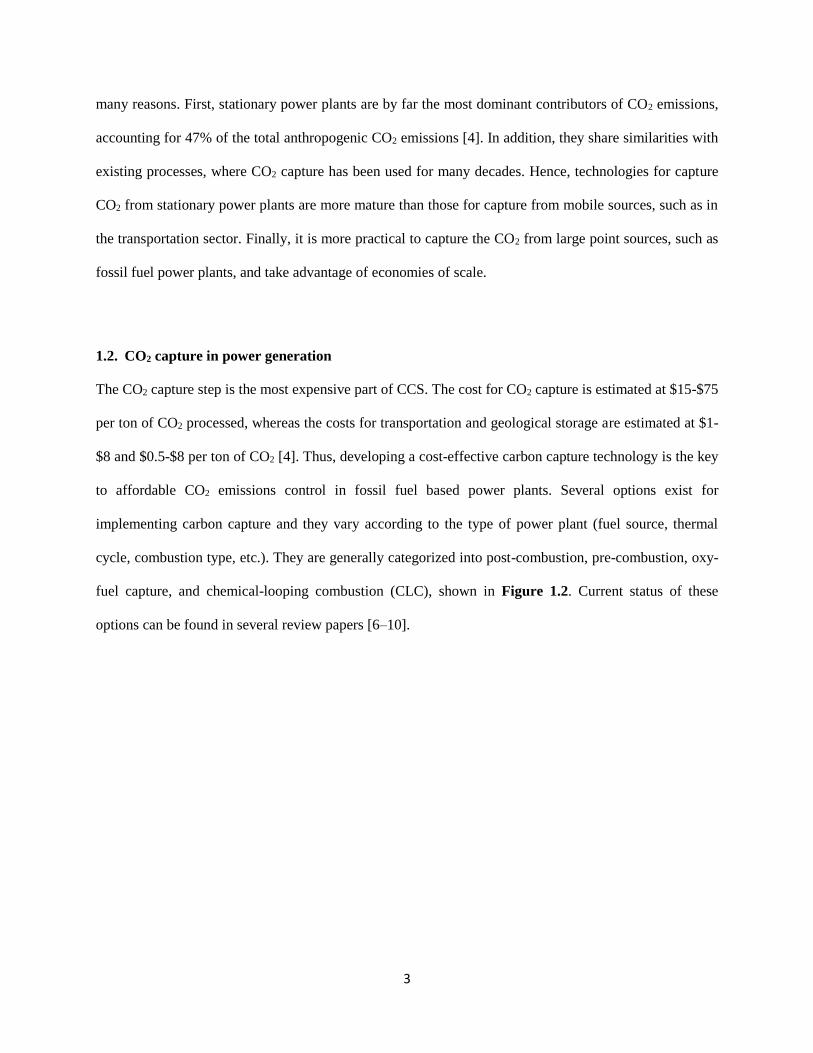
Figure 1.2: Overview of CO2 capture technologies from Zaman and Lee [6]. ............................................ 4
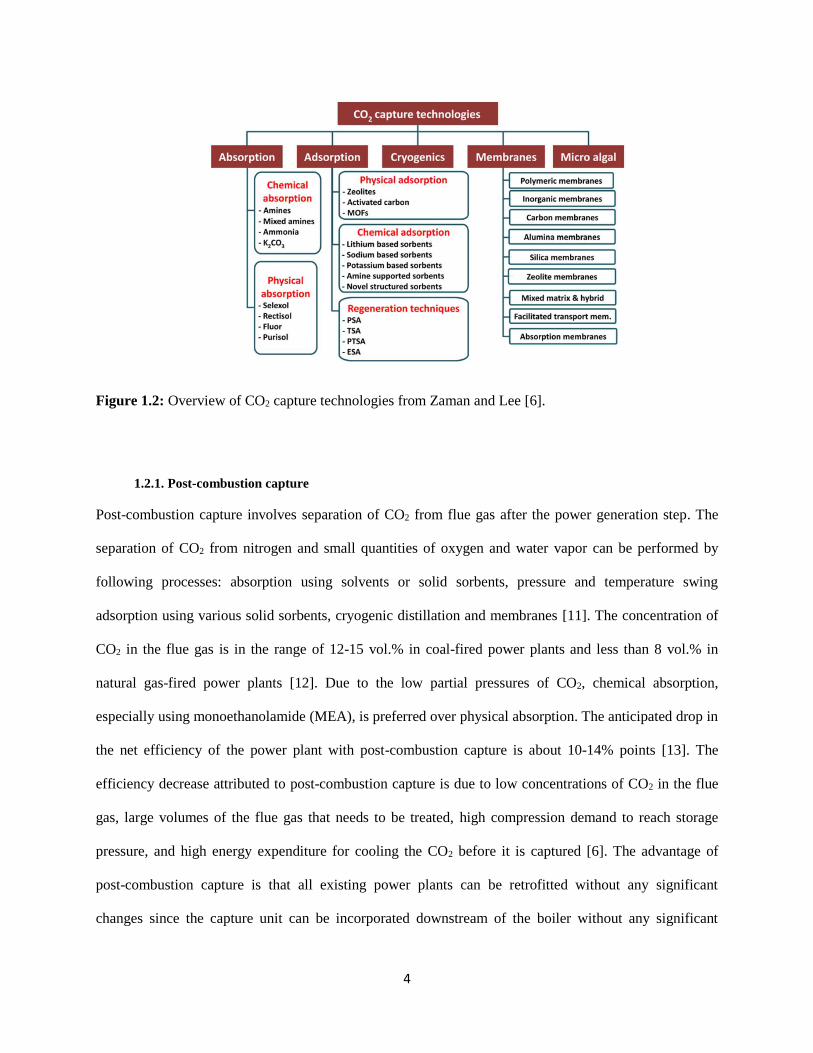
Figure 1.3: Schematic of an amine-based post-combustion CO2 capture system applied to a coal-fired or
natural gas-fired combined cycle from Folger [15]. ........................................................................ 5
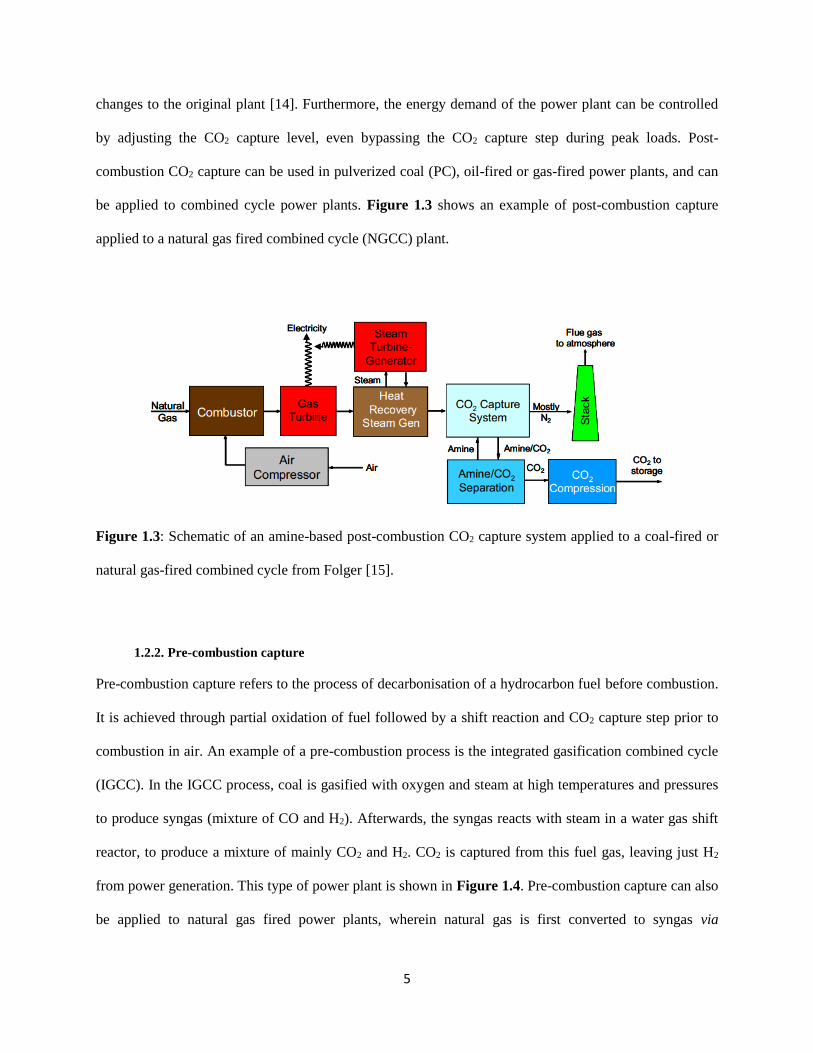
Figure 1.4: Schematic of an integrated gasification combined cycle (IGCC) coal power plant with pre-
combustion from Rubin et al. [16]. .................................................................................................. 6
Figure 1.5: Schematic of an oxy-fuel coal-fired power plant from Rubin et al. [16]. .................................. 7
Figure 1.6: U.S. DOE roadmap for current and emerging CO2 capture technologies in terms of cost
reduction potential and time to commercialization [24]. ................................................................. 8
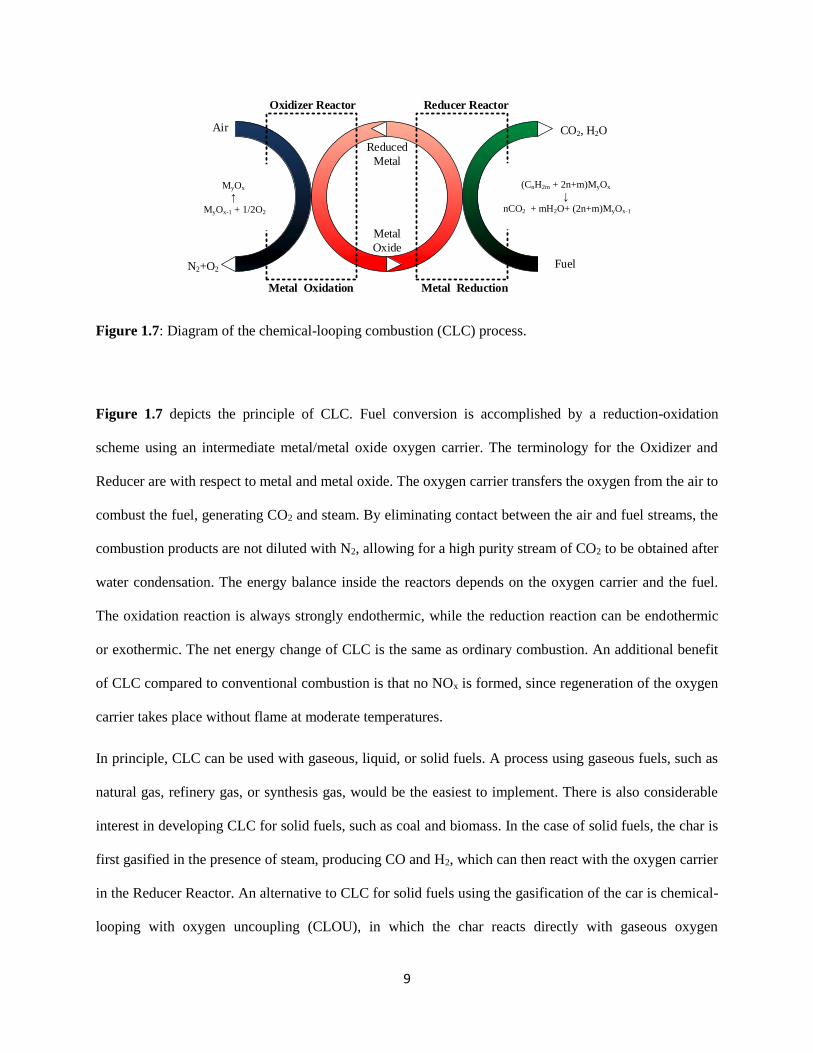
Figure 1.7: Diagram of the chemical-looping combustion (CLC) process. ................................................. 9
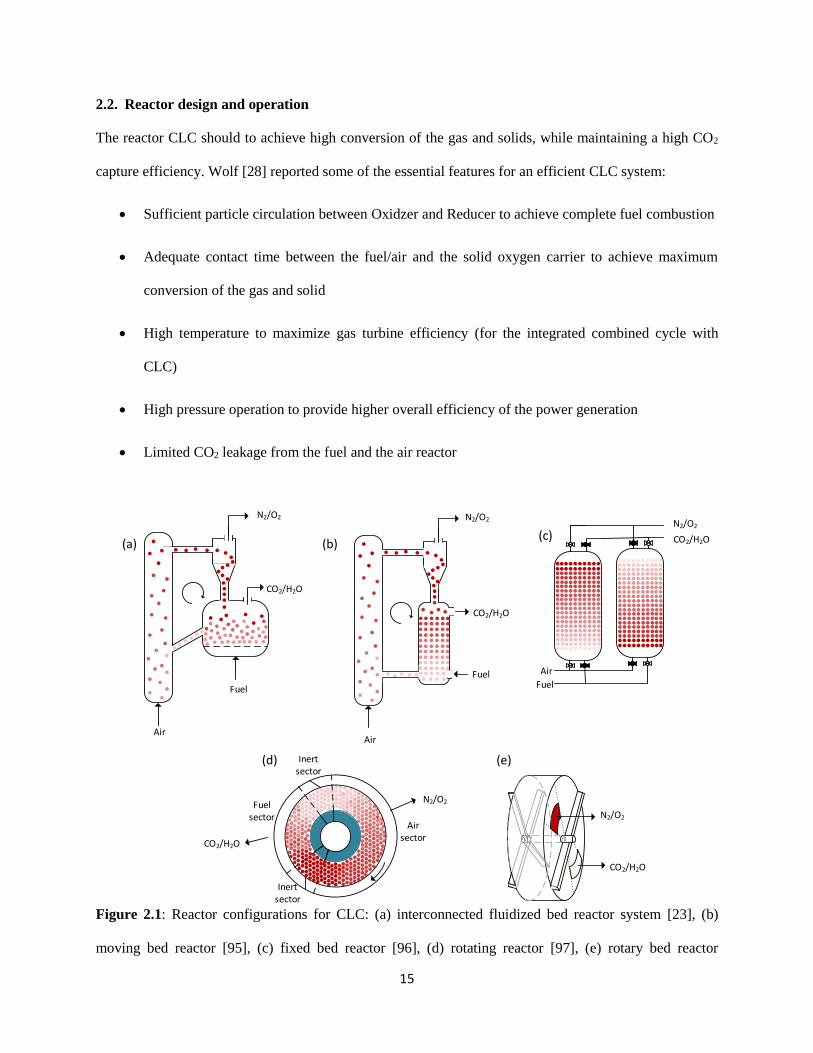
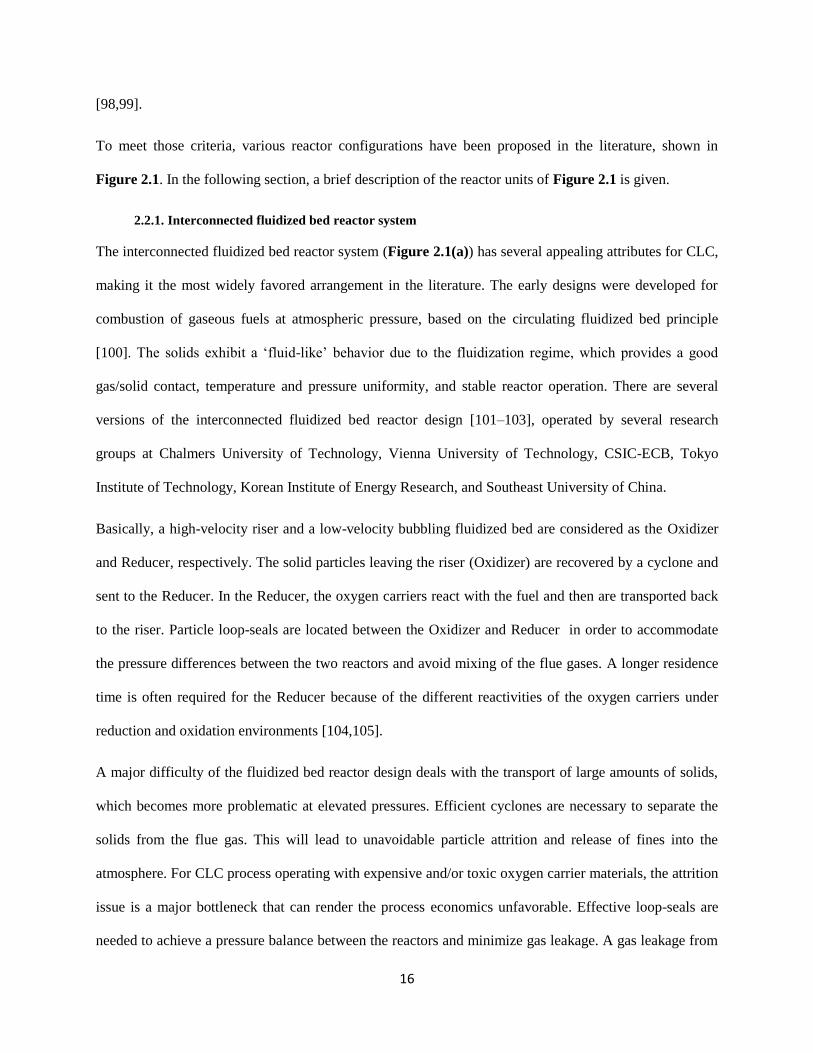
Figure 2.1: Reactor configurations for CLC: (a) interconnected fluidized bed reactor system [23], (b)
moving bed reactor [95], (c) fixed bed reactor [96], (d) rotating reactor [97], (e) rotary bed reactor
[98,99]. ........................................................................................................................................... 15
Figure 2.2: Diagram of a natural gas CLC-combined cycle (CLC-CLC) with a CO2 turbine from Naqvi
[12]. ................................................................................................................................................ 24
Figure 3.1: Fixed bed reactor experimental setup. ..................................................................................... 31
Figure 4.1: 1D model predictions of the experimental data reported by Iliuta et al. [58] at 900°C, 1 bar,
and 10% CH4 in Ar. CLC. Sum of squared errors for 1D homogeneous model is 9.7E-3 and for
1D heterogeneous model is 9.6E-3. ............................................................................................... 47
Figure 4.2: Effectiveness factors for R1-R10 from the 1D heterogeneous model for the fixed bed reactor
reported by Iliuta et al. [58]. .......................................................................................................... 48
Figure 4.3: 2D model predictions of the experimental data reported by Jin and Ishida [171] at 600°C, 1
bar, and 33% CH4 in H2O. Sum of squared errors for 2D homogeneous model is 0.4082 and for
2D heterogeneous model is 0.2784. ............................................................................................... 49
Figure 4.4: Effectiveness factor for R1-R10 from the heterogeneous model for the fixed bed reactor
reported by Jin and Ishida [171]. .................................................................................................. 50
Figure 4.5: Homogeneous model predictions of the experimental data reported by Rydén et al. [172] at
900°C, 1 bar, and 25% CH4 in Ar. Sum of squared errors for 1D homogeneous model is 0.2264
and for 2D homogeneous model is 0.2127. ................................................................................... 52
Figure 4.6: Radial fluid and solid temperature profile predicted by the 2D heterogeneous model for the
experiment conducted by Rydén et al. [172]. Fluid temperature modeled at z=L/2, and solid
temperature at z=L/2, r=R/2, t= 100 s. Chemical-looping combustion reduction at 900°C, 1 bar,
and 25% CH4 in Ar. ....................................................................................................................... 53
xi
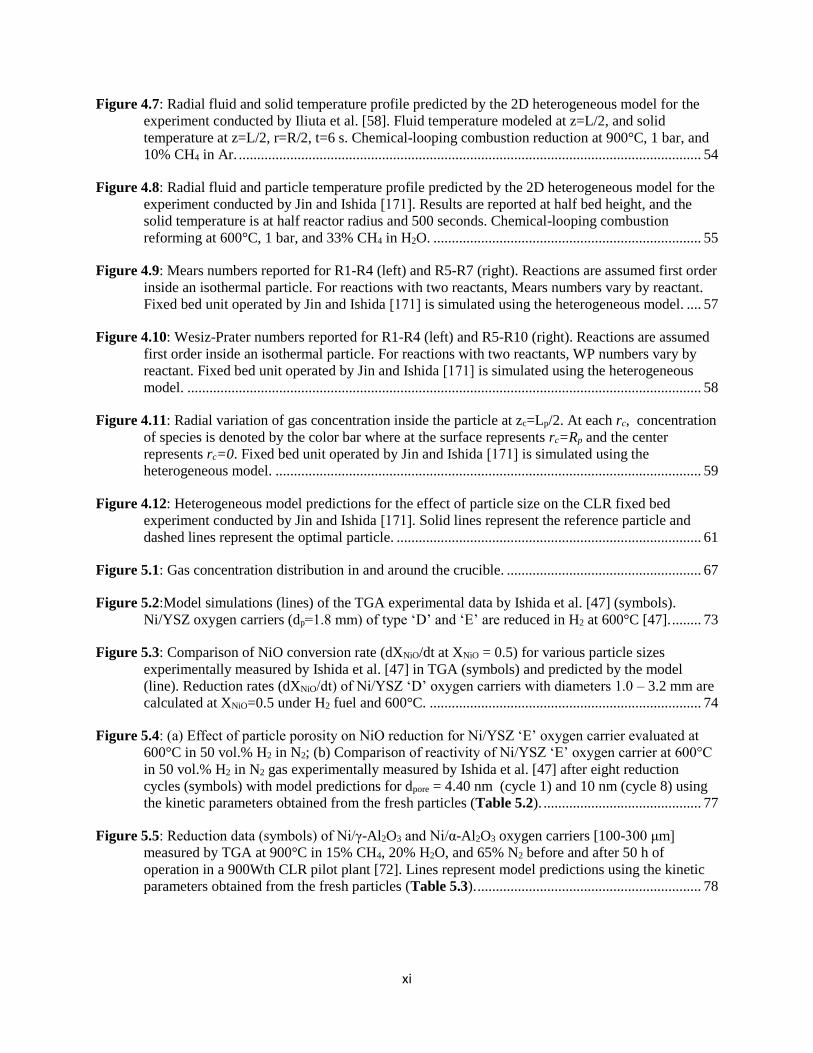
Figure 4.7: Radial fluid and solid temperature profile predicted by the 2D heterogeneous model for the
experiment conducted by Iliuta et al. [58]. Fluid temperature modeled at z=L/2, and solid
temperature at z=L/2, r=R/2, t=6 s. Chemical-looping combustion reduction at 900°C, 1 bar, and
10% CH4 in Ar. .............................................................................................................................. 54
Figure 4.8: Radial fluid and particle temperature profile predicted by the 2D heterogeneous model for the
experiment conducted by Jin and Ishida [171]. Results are reported at half bed height, and the
solid temperature is at half reactor radius and 500 seconds. Chemical-looping combustion
reforming at 600°C, 1 bar, and 33% CH4 in H2O. ......................................................................... 55
Figure 4.9: Mears numbers reported for R1-R4 (left) and R5-R7 (right). Reactions are assumed first order
inside an isothermal particle. For reactions with two reactants, Mears numbers vary by reactant.
Fixed bed unit operated by Jin and Ishida [171] is simulated using the heterogeneous model. .... 57
Figure 4.10: Wesiz-Prater numbers reported for R1-R4 (left) and R5-R10 (right). Reactions are assumed
first order inside an isothermal particle. For reactions with two reactants, WP numbers vary by
reactant. Fixed bed unit operated by Jin and Ishida [171] is simulated using the heterogeneous
model. ............................................................................................................................................ 58
Figure 4.11: Radial variation of gas concentration inside the particle at zc=Lp/2. At each rc, concentration
of species is denoted by the color bar where at the surface represents rc=Rp and the center
represents rc=0. Fixed bed unit operated by Jin and Ishida [171] is simulated using the
heterogeneous model. .................................................................................................................... 59
Figure 4.12: Heterogeneous model predictions for the effect of particle size on the CLR fixed bed
experiment conducted by Jin and Ishida [171]. Solid lines represent the reference particle and
dashed lines represent the optimal particle. ................................................................................... 61
Figure 5.1: Gas concentration distribution in and around the crucible. ..................................................... 67
Figure 5.2:Model simulations (lines) of the TGA experimental data by Ishida et al. [47] (symbols).
Ni/YSZ oxygen carriers (dp=1.8 mm) of type ‘D’ and ‘E’ are reduced in H2 at 600°C [47]. ........ 73
Figure 5.3: Comparison of NiO conversion rate (dXNiO/dt at XNiO = 0.5) for various particle sizes
experimentally measured by Ishida et al. [47] in TGA (symbols) and predicted by the model
(line). Reduction rates (dXNiO/dt) of Ni/YSZ ‘D’ oxygen carriers with diameters 1.0 – 3.2 mm are
calculated at XNiO=0.5 under H2 fuel and 600°C. .......................................................................... 74
Figure 5.4: (a) Effect of particle porosity on NiO reduction for Ni/YSZ ‘E’ oxygen carrier evaluated at
600°C in 50 vol.% H2 in N2; (b) Comparison of reactivity of Ni/YSZ ‘E’ oxygen carrier at 600°C
in 50 vol.% H2 in N2 gas experimentally measured by Ishida et al. [47] after eight reduction
cycles (symbols) with model predictions for dpore = 4.40 nm (cycle 1) and 10 nm (cycle 8) using
the kinetic parameters obtained from the fresh particles (Table 5.2). ........................................... 77
Figure 5.5: Reduction data (symbols) of Ni/γ-Al2O3 and Ni/α-Al2O3 oxygen carriers [100-300 μm]
measured by TGA at 900°C in 15% CH4, 20% H2O, and 65% N2 before and after 50 h of
operation in a 900Wth CLR pilot plant [72]. Lines represent model predictions using the kinetic
parameters obtained from the fresh particles (Table 5.3). ............................................................. 78
xii
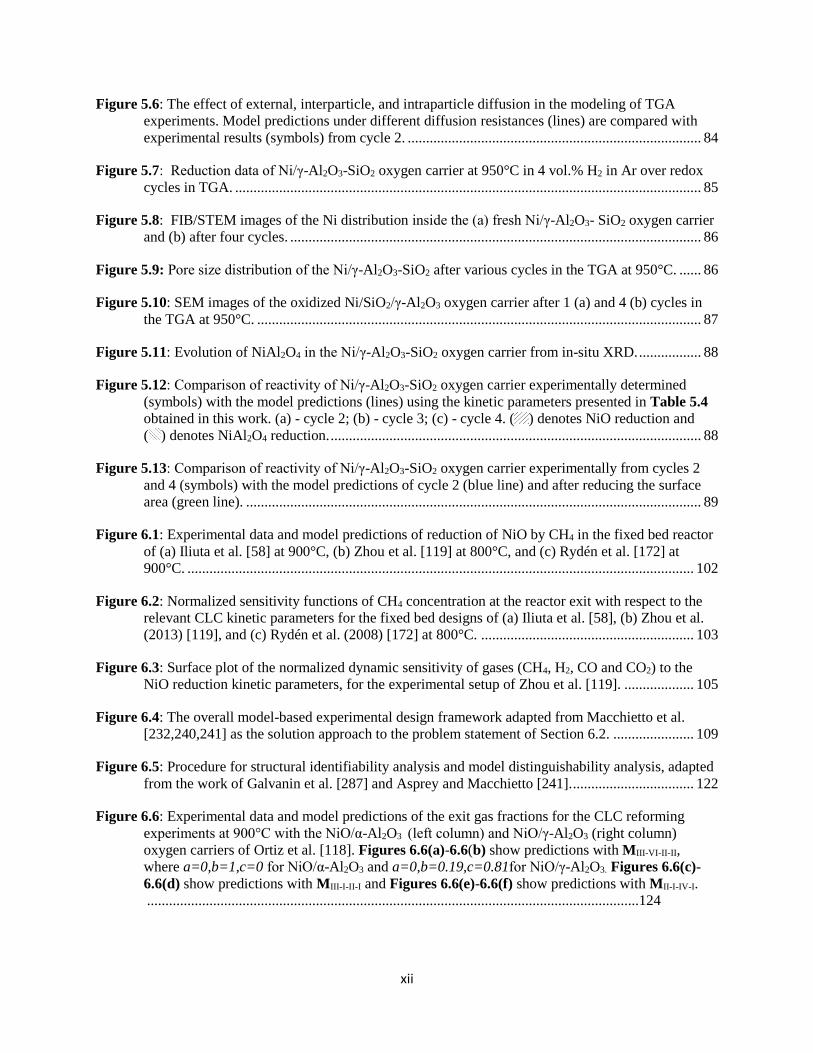
Figure 5.6: The effect of external, interparticle, and intraparticle diffusion in the modeling of TGA
experiments. Model predictions under different diffusion resistances (lines) are compared with
experimental results (symbols) from cycle 2. ................................................................................ 84
Figure 5.7: Reduction data of Ni/γ-Al2O3-SiO2 oxygen carrier at 950°C in 4 vol.% H2 in Ar over redox
cycles in TGA. ............................................................................................................................... 85
Figure 5.8: FIB/STEM images of the Ni distribution inside the (a) fresh Ni/γ-Al2O3- SiO2 oxygen carrier
and (b) after four cycles. ................................................................................................................ 86
Figure 5.9: Pore size distribution of the Ni/γ-Al2O3-SiO2 after various cycles in the TGA at 950°C. ...... 86
Figure 5.10: SEM images of the oxidized Ni/SiO2/γ-Al2O3 oxygen carrier after 1 (a) and 4 (b) cycles in
the TGA at 950°C. ......................................................................................................................... 87
Figure 5.11: Evolution of NiAl2O4 in the Ni/γ-Al2O3-SiO2 oxygen carrier from in-situ XRD. ................. 88
Figure 5.12: Comparison of reactivity of Ni/γ-Al2O3-SiO2 oxygen carrier experimentally determined
(symbols) with the model predictions (lines) using the kinetic parameters presented in Table 5.4
obtained in this work. (a) - cycle 2; (b) - cycle 3; (c) - cycle 4. ( ) denotes NiO reduction and
( ) denotes NiAl2O4 reduction. ..................................................................................................... 88
Figure 5.13: Comparison of reactivity of Ni/γ-Al2O3-SiO2 oxygen carrier experimentally from cycles 2
and 4 (symbols) with the model predictions of cycle 2 (blue line) and after reducing the surface
area (green line). ............................................................................................................................ 89
Figure 6.1: Experimental data and model predictions of reduction of NiO by CH4 in the fixed bed reactor
of (a) Iliuta et al. [58] at 900°C, (b) Zhou et al. [119] at 800°C, and (c) Rydén et al. [172] at
900°C. .......................................................................................................................................... 102
Figure 6.2: Normalized sensitivity functions of CH4 concentration at the reactor exit with respect to the
relevant CLC kinetic parameters for the fixed bed designs of (a) Iliuta et al. [58], (b) Zhou et al.
(2013) [119], and (c) Rydén et al. (2008) [172] at 800°C. .......................................................... 103
Figure 6.3: Surface plot of the normalized dynamic sensitivity of gases (CH4, H2, CO and CO2) to the
NiO reduction kinetic parameters, for the experimental setup of Zhou et al. [119]. ................... 105
Figure 6.4: The overall model-based experimental design framework adapted from Macchietto et al.
[232,240,241] as the solution approach to the problem statement of Section 6.2. ...................... 109
Figure 6.5: Procedure for structural identifiability analysis and model distinguishability analysis, adapted
from the work of Galvanin et al. [287] and Asprey and Macchietto [241]. ................................. 122
Figure 6.6: Experimental data and model predictions of the exit gas fractions for the CLC reforming
experiments at 900°C with the NiO/α-Al2O3 (left column) and NiO/γ-Al2O3 (right column)
oxygen carriers of Ortiz et al. [118]. Figures 6.6(a)-6.6(b) show predictions with MIII-VI-II-II,
where a=0,b=1,c=0 for NiO/α-Al2O3 and a=0,b=0.19,c=0.81for NiO/γ-Al2O3. Figures 6.6(c)-
6.6(d) show predictions with MIII-I-II-I and Figures 6.6(e)-6.6(f) show predictions with MII-I-IV-I.
......................................................................................................................................124
xiii
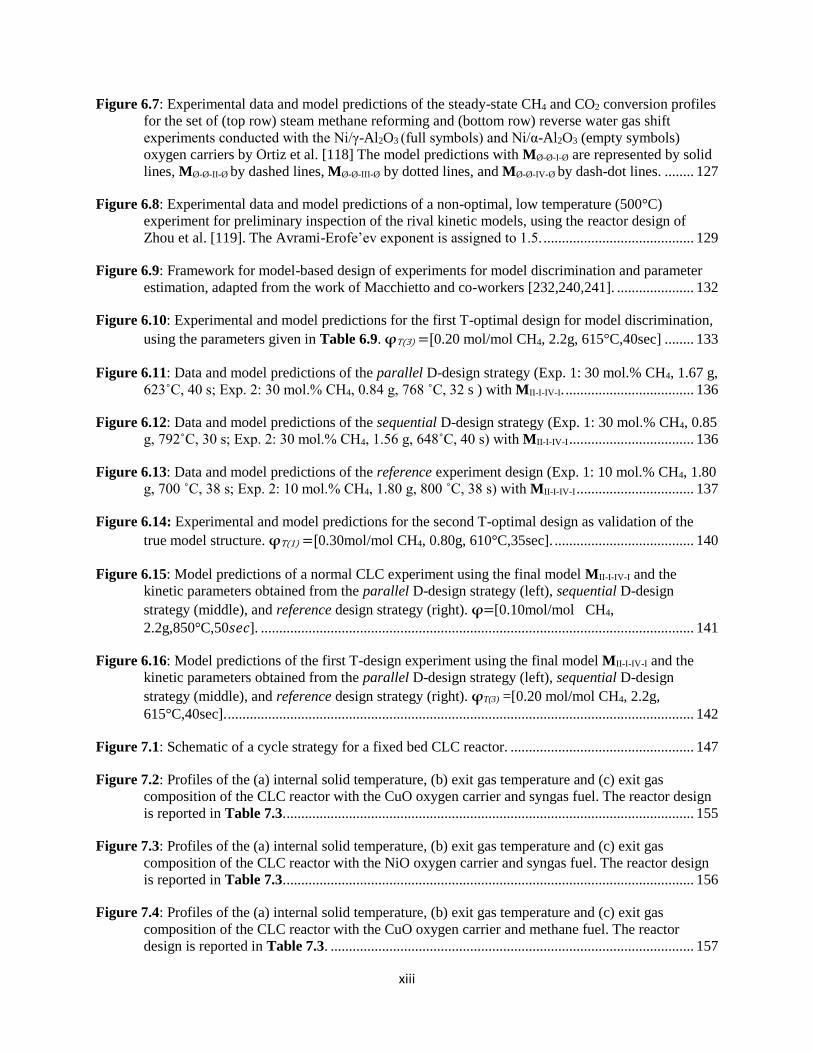
Figure 6.7: Experimental data and model predictions of the steady-state CH4 and CO2 conversion profiles
for the set of (top row) steam methane reforming and (bottom row) reverse water gas shift
experiments conducted with the Ni/γ-Al2O3 (full symbols) and Ni/α-Al2O3 (empty symbols)
oxygen carriers by Ortiz et al. [118] The model predictions with MØ-Ø-I-Ø are represented by solid
lines, MØ-Ø-II-Ø by dashed lines, MØ-Ø-III-Ø by dotted lines, and MØ-Ø-IV-Ø by dash-dot lines. ........ 127
Figure 6.8: Experimental data and model predictions of a non-optimal, low temperature (500°C)
experiment for preliminary inspection of the rival kinetic models, using the reactor design of
Zhou et al. [119]. The Avrami-Erofe’ev exponent is assigned to 1.5. ......................................... 129
Figure 6.9: Framework for model-based design of experiments for model discrimination and parameter
estimation, adapted from the work of Macchietto and co-workers [232,240,241]. ..................... 132
Figure 6.10: Experimental and model predictions for the first T-optimal design for model discrimination,
using the parameters given in Table 6.9. φT(3) =[0.20 mol/mol CH4, 2.2g, 615°C,40sec] ........ 133
Figure 6.11: Data and model predictions of the parallel D-design strategy (Exp. 1: 30 mol.% CH4, 1.67 g,
623˚C, 40 s; Exp. 2: 30 mol.% CH4, 0.84 g, 768 ˚C, 32 s ) with MII-I-IV-I. ................................... 136
Figure 6.12: Data and model predictions of the sequential D-design strategy (Exp. 1: 30 mol.% CH4, 0.85
g, 792˚C, 30 s; Exp. 2: 30 mol.% CH4, 1.56 g, 648˚C, 40 s) with MII-I-IV-I .................................. 136
Figure 6.13: Data and model predictions of the reference experiment design (Exp. 1: 10 mol.% CH4, 1.80
g, 700 ˚C, 38 s; Exp. 2: 10 mol.% CH4, 1.80 g, 800 ˚C, 38 s) with MII-I-IV-I ................................ 137
Figure 6.14: Experimental and model predictions for the second T-optimal design as validation of the
true model structure. φT(1) =[0.30mol/mol CH4, 0.80g, 610°C,35sec]. ...................................... 140
Figure 6.15: Model predictions of a normal CLC experiment using the final model MII-I-IV-I and the
kinetic parameters obtained from the parallel D-design strategy (left), sequential D-design
strategy (middle), and reference design strategy (right). φ=[0.10mol/mol CH4,
2.2g,850°C,50𝑠𝑒𝑐]. ...................................................................................................................... 141
Figure 6.16: Model predictions of the first T-design experiment using the final model MII-I-IV-I and the
kinetic parameters obtained from the parallel D-design strategy (left), sequential D-design
strategy (middle), and reference design strategy (right). φT(3) =[0.20 mol/mol CH4, 2.2g,
615°C,40sec]. ............................................................................................................................... 142
Figure 7.1: Schematic of a cycle strategy for a fixed bed CLC reactor. .................................................. 147
Figure 7.2: Profiles of the (a) internal solid temperature, (b) exit gas temperature and (c) exit gas
composition of the CLC reactor with the CuO oxygen carrier and syngas fuel. The reactor design
is reported in Table 7.3. ............................................................................................................... 155
Figure 7.3: Profiles of the (a) internal solid temperature, (b) exit gas temperature and (c) exit gas
composition of the CLC reactor with the NiO oxygen carrier and syngas fuel. The reactor design
is reported in Table 7.3. ............................................................................................................... 156
Figure 7.4: Profiles of the (a) internal solid temperature, (b) exit gas temperature and (c) exit gas
composition of the CLC reactor with the CuO oxygen carrier and methane fuel. The reactor
design is reported in Table 7.3. ................................................................................................... 157
xiv
Figure 7.5: Profiles of the (a) internal solid temperature, (b) exit gas temperature, and (c) exit gas
composition of the CLC reactor with the NiO oxygen carrier and methane fuel. The reactor
design is reported in Table 7.3. ................................................................................................... 158
Figure 7.6: Profiles of the (a) internal solid temperature, (b) exit gas temperature, and (c) exit gas
composition of the optimal operating strategy with the CuO oxygen carrier and syngas fuel, for a
turbine inlet temperature (TIT) set-point of 900°C. ..................................................................... 160
Figure 7.7: Profiles of the (a) internal solid temperature, (b) exit gas temperature, and (c) exit gas
composition of the optimal operating strategy with the CuO oxygen carrier and methane fuel, for
a turbine inlet temperature (TIT) set-point of 900°C. .................................................................. 161
Figure 7.8: Profiles of the (a) internal solid temperature, (b) exit gas temperature, and (c) exit gas
composition of the optimal operating strategy with the NiO oxygen carrier and syngas fuel, for a
turbine inlet temperature (TIT) set-point of 1000°C. ................................................................... 162
Figure 7.9: Profiles of the (a) internal solid temperature, (b) exit gas temperature, and (c) exit gas
composition of the optimal operating strategy with the NiO oxygen carrier and methane fuel, for a
turbine inlet temperature (TIT) set-point of 1000°C. ................................................................... 163
Figure 7.10: Gas temperature of the mixed gas streams leaving the system of fixed bed reactors for the
(a) CuO process with syngas fuel and (b) NiO process with methane fuel. ................................ 167
Figure 8.1: Reactor options for CLC: (a) circulating fluidized-bed; (b) rotating reactor; and (c) alternating
flow over a fixed-bed. .................................................................................................................. 171
Figure 8.2: Diagram of bench-scale reverse-flow fixed-bed reactor ........................................................ 175
Figure 8.3: Oxygen carrier conversion as a function of reduction time and dimensionless bed height for
the bench-scale reactor. Switch interval is 30 s for the reverse-flow operation........................... 186
Figure 8.4: Comparison of the CO2 selectivity and CH4 conversion for the bench-scale reactor under one-
directional flow and reverse-flow operation at different switch intervals. .................................. 187
Figure 8.5: Amount of carbon deposited (kg C/kg OC) as a function of reduction time and normalized
bed height for the bench-scale reactor. Switch interval is 30 s for the reverse-flow operation. .. 188
Figure 8.6: (a) Selectivity to solid carbon in the bed for the reverse-flow (ts=30 s) and one-directional
bench-scale reactor; (b) Maximum bed temperature drop for the reverse-flow (ts=30 s) and one-
directional bench-scale reactor. ................................................................................................... 188
Figure 8.7: Bed temperature (°C) as a function of reduction time and normalized bed height for the
bench-scale reactor. Switch interval is 30 s for the reverse-flow operation. ............................... 190
Figure 8.8: CO2 selectivity and CH4 conversion for the industrial-scale reactor under one-directional flow
and optimal reverse-flow operation (ts=5 s). ................................................................................ 191
Figure 8.9: Oxygen carrier conversion as a function of reduction time and normalized bed height for the
industrial-scale reactor. Switch interval is 5 s for the reverse-flow operation. ............................ 192
xv
Figure 8.10: Amount of carbon deposited (kg C/kg OC) as a function of reduction time and normalized
bed height for the industrial-scale reactor. Switching time is 5 s for the reverse-flow operation.193
Figure 8.11: (a) Selectivity to solid carbon in the bed for the reverse-flow (ts=5 s) and one-directional
industrial-scale reactor; (b) Maximum bed temperature drop for the reverse-flow (ts=5 s) and one-
directional industrial-scale reactor. .............................................................................................. 194
Figure 8.12: Bed temperature (°C) as a function of reduction time and normalized bed height for the
industrial-scale reactor. Switch interval is 5 s for the reverse-flow operation. ............................ 195
Figure 9.1: Schematic of a typical cyclic operation of CLC in a fixed bed reactor in terms of the
temperature, total enthalpy, and mass flow rate of the exhaust gas stream. ................................ 200
Figure 9.2: Simplified diagram of revere-flow operation in a fixed bed CLC reactor. Forward flow pass is
1-2-R-3-4 and backward flow pass is 1-2’-R-3’-4. ...................................................................... 201
Figure 9.3: Model predictions of CLC experimental data performed in TGA (a) and in fixed bed (b,c,d)
using the dusty-gas model. In Figure 9.3(a), the particle model is predicative of the effect of
intraparticle diffusion limitations over a range of particle sizes (dp=1.0-3.2 mm), measured by
Ishida et al. [47]. Figure 9.3(b) shows the validation of the model to predict fixed bed CLC in
atmospheric pressure [368]. Figure 9.3(c)-Figure 9.3(d) show the validation of the model to
describe high-pressure CLC with NiO and CuO oxygen carriers, as described in Nordness et al.
[369]. ............................................................................................................................................ 205
Figure 9.4: Profiles of the internal bed conversion, bed temperature, and solid carbon selectivity in the
one-directional (1D) and reverse-flow (RF) reactors for the syngas-fed reduction with NiO.
Conversion of 0 refers to NiO and conversion of 1 refers to Ni. ................................................. 209
Figure 9.5: Exit gas fraction of the syngas-fed fixed bed reactors with CuO and NiO oxygen carriers
under one-directional (1D) flow and reverse-flow (RF) with syngas fuel. The results are presented
for the reduction phase at the TIT set-point of 900°C for CuO and 1000°C for NiO. ................. 210
Figure 9.6: Exit gas fraction of the methane-fed fixed bed reactors with CuO and NiO oxygen carriers
under one-directional (1D) flow and reverse-flow (RF) with CH4 fuel. The results are presented
for the reduction phase at the TIT set-point of 900°C for CuO and 1000°C for NiO. ................. 211
Figure 9.7: Profiles of the internal bed conversion, bed temperature, and solid carbon selectivity in the
one-directional (1D) and reverse-flow (RF) reactors during oxidation with NiO oxygen carrier.
The reactor was previously reduced by syngas and results are shown in Figure 9.4. Conversion of
0 refers to Ni and conversion of 1 refers to NiO. ......................................................................... 213
Figure 9.8: Temperature profiles of the exhaust gas stream for the entire CLC sequence under one-
directional (1D) flow and reverse-flow (RF) with CH4 fuel. The results are presented for the CLC
sequence at the TIT set-point of 900°C for CuO and 1000°C for NiO. ....................................... 214
Figure 9.9: Temperature profiles of the exhaust gas stream for the entire CLC sequence under one-
directional (1D) flow and reverse-flow (RF) with syngas fuel. The results are presented for the
CLC sequence at the TIT set-point of 900°C for CuO and 1000°C for NiO. .............................. 215
Figure 10.1: Reactor designs for CLC: (a) simulated moving bed and (b) fixed bed. ............................. 222
xvi
Figure 10.2: (a) fuel conversion, (b) CO2 selectivity, and (c) solid carbon selectivity vs. bed NiO
conversion for the fixed bed and SMB processes at an initial bed temperature of 900°C. .......... 224
Figure 10.3: Transient temperature distributions for one CLC reduction step at an initial bed temperature
of 900°C with the fixed bed and SMB processes......................................................................... 224
Figure 10.4: Internal temperature distribution inside (a) fixed bed reactor in series; (b) fixed bed in
parallel; and (c) SMB reactor configuration. ............................................................................... 225
Figure 10.5: Exit gas concentration profiles of the (a) fixed bed reactor in series; (b) fixed bed in parallel;
and (right) SMB reactor configuration......................................................................................... 225
1
Chapter 1 INTRODUCTION
Growing global concern over unabated CO2 emissions puts demand on conventional fossil fueled power
systems to seek out new technologies that mitigate anthropogenic carbon emissions. In this context,
carbon capture and storage (CCS) technology is regarded as a feasible near-term option that permits the
continued usage of fossil fuels without emitting CO2 into the atmosphere. CCS can be implemented in
three steps of CO2 separation and compression, CO2 transportation, and CO2 storage in stable geological
reservoirs. A large portion of the total CCS cost is associated with the CO2 separation step, due to the
high energy penalties imposed by the current industrial separation technologies. Chemical-looping
combustion (CLC) is an effective and versatile process that can convert a gaseous hydrocarbon fuel into
electricity, while providing CO2 capture at a low cost. For CLC to be commericalized, its path forward is
dependent on the knowledge of the design and operation of the reactor and the optimal oxygen carrier
performance. Though considerable research on the CLC technology has been reported, most studies focus
on the oxygen carrier synthesis and development, and those related to the reactor system operation and
integrated large scale process development are scarce. This chapter provides the motivation for CO2
mitigation, description of the current CO2 capture technologies from power plants, and a brief overview
of the chemical-looping technology.
1.1. Motivation for CO2 mitigation
The accumulation of greenhouse gases in the earth atmosphere accelerates the natural greenhouse gas
effect and is the cause for global warming. Carbon dioxide (CO2) from the conversion of fossil sources
(gas, oil, and coal) accounts for 57% of the global greenhouse gas emissions [1]. As can be seen in Figure
1.1, the global carbon emissions from fossil fuels have increased by over 16 times between 1900 and
2008 and by about 1.5 times between 1900 and 2008 [2]. The global atmospheric concentration of CO2
increased from a pre-industrial value of about 280ppm to 399 ppm in 2015 [3]. To prevent significant
changes in the earth global climate, the CO2 concentration must not exceed 450 ppm. Therefore, it is
2
generally accepted that a reduction in global greenhouse gas emissions is necessary in the foreseeable
future.
Figure 1.1: Trends in global CO2 emissions [2].
The technological options for reducing net CO2 emissions into the atmosphere include [4]: (a) reducing
energy consumption by increasing efficiency of the energy conversion and/or utilization; (b) switching to
less carbon intensive fuels; (c) increasing the use of renewable energy sources (biofuel, wind, solar, etc.)
or nuclear energy; (d) sequestrating CO2 by enhancing biological absorption capacity in forest and solids.
The renewable energy sources have the intrinsic advantage of not generating CO2 or contributing to zero
net CO2 emissions. However, in their current status of development and/or availability, alternative energy
technologies cannot fully replace the fossil fuels as the energy source. Thus, Carbon Capture and Storage
(CCS) technology in conjunction with the other mentioned technologies appears as an additional option to
achieve the necessary reduction in CO2 emissions. The CCS process involves CO2 separation (from either
stack gas or other intermediate gas streams), followed by pressurization, transportation, and sequestration.
According to IEA’s roadmap, 20% of the total CO2 emissions should be removed by CCS by 2050 [5]. A
majority of the current research endeavors is focused on CO2 removal from stationary power plants for
3
many reasons. First, stationary power plants are by far the most dominant contributors of CO2 emissions,
accounting for 47% of the total anthropogenic CO2 emissions [4]. In addition, they share similarities with
existing processes, where CO2 capture has been used for many decades. Hence, technologies for capture
CO2 from stationary power plants are more mature than those for capture from mobile sources, such as in
the transportation sector. Finally, it is more practical to capture the CO2 from large point sources, such as
fossil fuel power plants, and take advantage of economies of scale.
1.2. CO2 capture in power generation
The CO2 capture step is the most expensive part of CCS. The cost for CO2 capture is estimated at $15-$75
per ton of CO2 processed, whereas the costs for transportation and geological storage are estimated at $1-
$8 and $0.5-$8 per ton of CO2 [4]. Thus, developing a cost-effective carbon capture technology is the key
to affordable CO2 emissions control in fossil fuel based power plants. Several options exist for
implementing carbon capture and they vary according to the type of power plant (fuel source, thermal
cycle, combustion type, etc.). They are generally categorized into post-combustion, pre-combustion, oxy-
fuel capture, and chemical-looping combustion (CLC), shown in Figure 1.2. Current status of these
options can be found in several review papers [6–10].
4
Figure 1.2: Overview of CO2 capture technologies from Zaman and Lee [6].
1.2.1. Post-combustion capture
Post-combustion capture involves separation of CO2 from flue gas after the power generation step. The
separation of CO2 from nitrogen and small quantities of oxygen and water vapor can be performed by
following processes: absorption using solvents or solid sorbents, pressure and temperature swing
adsorption using various solid sorbents, cryogenic distillation and membranes [11]. The concentration of
CO2 in the flue gas is in the range of 12-15 vol.% in coal-fired power plants and less than 8 vol.% in
natural gas-fired power plants [12]. Due to the low partial pressures of CO2, chemical absorption,
especially using monoethanolamide (MEA), is preferred over physical absorption. The anticipated drop in
the net efficiency of the power plant with post-combustion capture is about 10-14% points [13]. The
efficiency decrease attributed to post-combustion capture is due to low concentrations of CO2 in the flue
gas, large volumes of the flue gas that needs to be treated, high compression demand to reach storage
pressure, and high energy expenditure for cooling the CO2 before it is captured [6]. The advantage of
post-combustion capture is that all existing power plants can be retrofitted without any significant
changes since the capture unit can be incorporated downstream of the boiler without any significant
5
changes to the original plant [14]. Furthermore, the energy demand of the power plant can be controlled
by adjusting the CO2 capture level, even bypassing the CO2 capture step during peak loads. Post-
combustion CO2 capture can be used in pulverized coal (PC), oil-fired or gas-fired power plants, and can
be applied to combined cycle power plants. Figure 1.3 shows an example of post-combustion capture
applied to a natural gas fired combined cycle (NGCC) plant.
Figure 1.3: Schematic of an amine-based post-combustion CO2 capture system applied to a coal-fired or
natural gas-fired combined cycle from Folger [15].
1.2.2. Pre-combustion capture
Pre-combustion capture refers to the process of decarbonisation of a hydrocarbon fuel before combustion.
It is achieved through partial oxidation of fuel followed by a shift reaction and CO2 capture step prior to
combustion in air. An example of a pre-combustion process is the integrated gasification combined cycle
(IGCC). In the IGCC process, coal is gasified with oxygen and steam at high temperatures and pressures
to produce syngas (mixture of CO and H2). Afterwards, the syngas reacts with steam in a water gas shift
reactor, to produce a mixture of mainly CO2 and H2. CO2 is captured from this fuel gas, leaving just H2
from power generation. This type of power plant is shown in Figure 1.4. Pre-combustion capture can also
be applied to natural gas fired power plants, wherein natural gas is first converted to syngas via
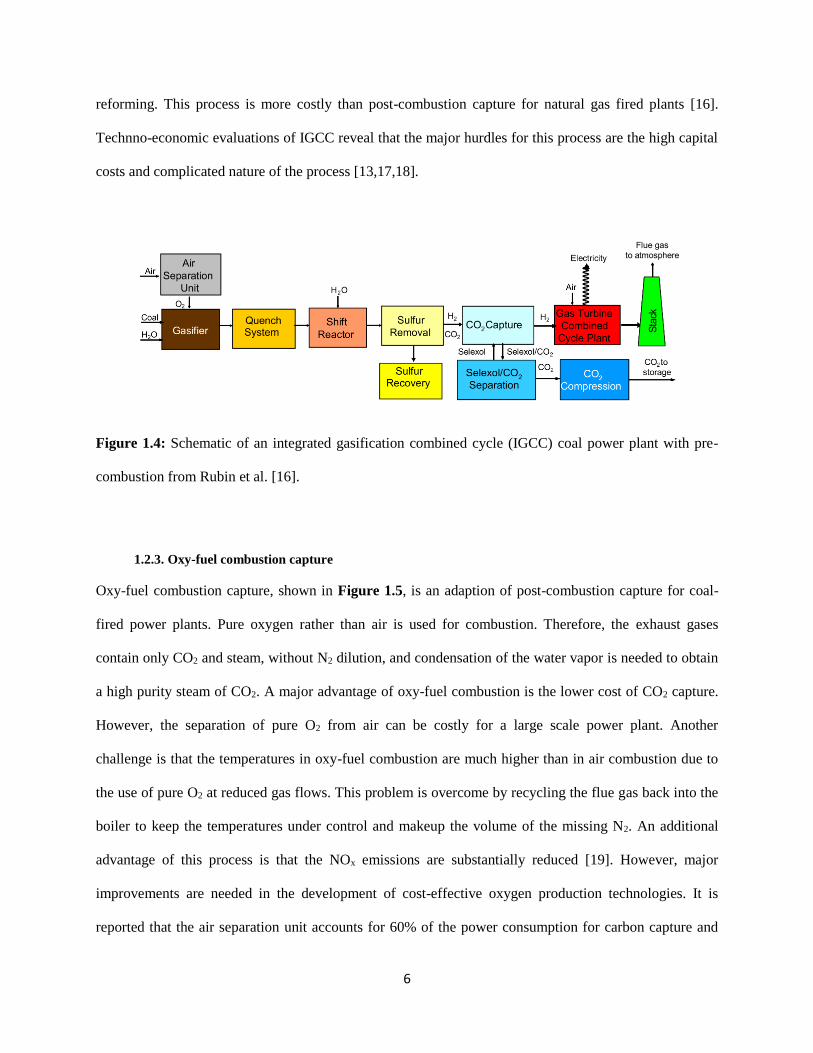
6
reforming. This process is more costly than post-combustion capture for natural gas fired plants [16].
Technno-economic evaluations of IGCC reveal that the major hurdles for this process are the high capital
costs and complicated nature of the process [13,17,18].
Figure 1.4: Schematic of an integrated gasification combined cycle (IGCC) coal power plant with pre-
combustion from Rubin et al. [16].
1.2.3. Oxy-fuel combustion capture
Oxy-fuel combustion capture, shown in Figure 1.5, is an adaption of post-combustion capture for coal-
fired power plants. Pure oxygen rather than air is used for combustion. Therefore, the exhaust gases
contain only CO2 and steam, without N2 dilution, and condensation of the water vapor is needed to obtain
a high purity steam of CO2. A major advantage of oxy-fuel combustion is the lower cost of CO2 capture.
However, the separation of pure O2 from air can be costly for a large scale power plant. Another
challenge is that the temperatures in oxy-fuel combustion are much higher than in air combustion due to
the use of pure O2 at reduced gas flows. This problem is overcome by recycling the flue gas back into the
boiler to keep the temperatures under control and makeup the volume of the missing N2. An additional
advantage of this process is that the NOx emissions are substantially reduced [19]. However, major
improvements are needed in the development of cost-effective oxygen production technologies. It is
reported that the air separation unit accounts for 60% of the power consumption for carbon capture and
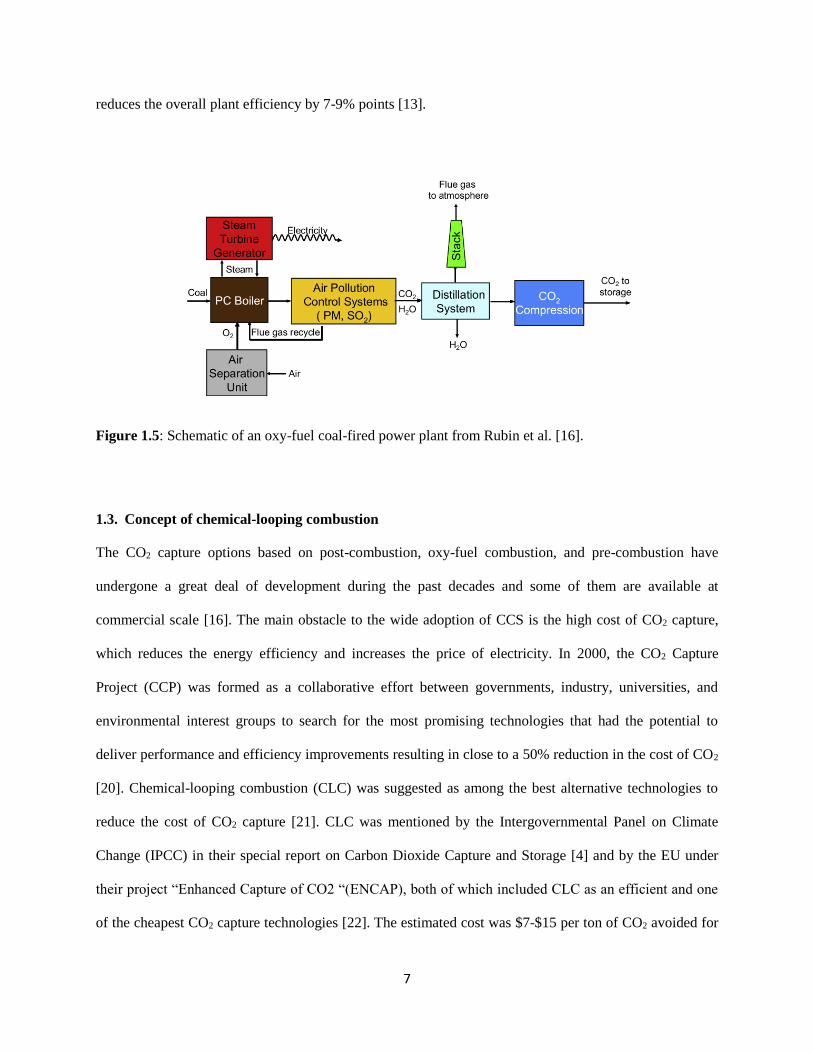
7
reduces the overall plant efficiency by 7-9% points [13].
Figure 1.5: Schematic of an oxy-fuel coal-fired power plant from Rubin et al. [16].
1.3. Concept of chemical-looping combustion
The CO2 capture options based on post-combustion, oxy-fuel combustion, and pre-combustion have
undergone a great deal of development during the past decades and some of them are available at
commercial scale [16]. The main obstacle to the wide adoption of CCS is the high cost of CO2 capture,
which reduces the energy efficiency and increases the price of electricity. In 2000, the CO2 Capture
Project (CCP) was formed as a collaborative effort between governments, industry, universities, and
environmental interest groups to search for the most promising technologies that had the potential to
deliver performance and efficiency improvements resulting in close to a 50% reduction in the cost of CO2
[20]. Chemical-looping combustion (CLC) was suggested as among the best alternative technologies to
reduce the cost of CO2 capture [21]. CLC was mentioned by the Intergovernmental Panel on Climate
Change (IPCC) in their special report on Carbon Dioxide Capture and Storage [4] and by the EU under
their project “Enhanced Capture of CO2 “(ENCAP), both of which included CLC as an efficient and one
of the cheapest CO2 capture technologies [22]. The estimated cost was $7-$15 per ton of CO2 avoided for

8
CLC, $20-$41 for pre-combustion, and $15-$33 for oxy-fuel combustion [23]. The main drawback of
CLC is the low technological readiness level, as a consequence of the lack of maturity of the technology
(Figure 1.6). At the present, CLC must be considered as an emerging technology. However in the past
decade, there has a tremendous progress in the areas of research and development, contributing to the
growing popularity of this technology.
Figure 1.6: U.S. DOE roadmap for current and emerging CO2 capture technologies in terms of cost
reduction potential and time to commercialization [24].
CLC is a novel combustion concept for the purpose of power generation with inherent CO2 capture. The
term “inherent” implies that CO2 is readily available in a concentrated form by virtue of the process itself.
Early work on the CLC dates back to 1983 by Richter and Knoche [25], who suggested a fuel oxidation
reaction scheme involving two intermediary reactions with a metal oxide as an oxygen carrier. Other
pioneers to the field include Ishida et al. [26], who termed the process “chemical-looping combustion.”
The novelty of CLC as compared to conventional combustion is that the air and fuel remain in separate
environments with no direct contact. CLC can be regarded as as un-mixed combustion.
9
Figure 1.7: Diagram of the chemical-looping combustion (CLC) process.
Figure 1.7 depicts the principle of CLC. Fuel conversion is accomplished by a reduction-oxidation
scheme using an intermediate metal/metal oxide oxygen carrier. The terminology for the Oxidizer and
Reducer are with respect to metal and metal oxide. The oxygen carrier transfers the oxygen from the air to
combust the fuel, generating CO2 and steam. By eliminating contact between the air and fuel streams, the
combustion products are not diluted with N2, allowing for a high purity stream of CO2 to be obtained after
water condensation. The energy balance inside the reactors depends on the oxygen carrier and the fuel.
The oxidation reaction is always strongly endothermic, while the reduction reaction can be endothermic
or exothermic. The net energy change of CLC is the same as ordinary combustion. An additional benefit
of CLC compared to conventional combustion is that no NOx is formed, since regeneration of the oxygen
carrier takes place without flame at moderate temperatures.
In principle, CLC can be used with gaseous, liquid, or solid fuels. A process using gaseous fuels, such as
natural gas, refinery gas, or synthesis gas, would be the easiest to implement. There is also considerable
interest in developing CLC for solid fuels, such as coal and biomass. In the case of solid fuels, the char is
first gasified in the presence of steam, producing CO and H2, which can then react with the oxygen carrier
in the Reducer Reactor. An alternative to CLC for solid fuels using the gasification of the car is chemical-
looping with oxygen uncoupling (CLOU), in which the char reacts directly with gaseous oxygen
N2+O2
Air CO2, H2O
Fuel
Metal ReductionMetal Oxidation
Metal
Oxide
Reduced
Metal
Reducer ReactorOxidizer Reactor
MyOx
↑
MyOx-1 + 1/2O2
(CnH2m + 2n+m)MyOx
↓
nCO2 + mH2O+ (2n+m)MyOx-1
10
spontaneously released from the oxygen carrier [27]. Chemical-looping can also be used for hydrogen
production, wherein the regeneration of the oxygen carrier can be done using air or steam. When air is
used for regeneration, it can be differentiated: the Steam Reforming process integrated with CLC (SR-
CLC), where CLC is used to provide the energy required for catalytic steam reforming; and the Chemical-
Looping Reforming process (CLR), where a mixture of fuel and steam is sent to the Reducer to produce
H2 and CO [23]. Other processes use the reduced form of the oxygen carriers to convert steam into
hydrogen production, also known “water-splitting.” The Syngas Chemical-Looping Process (SCL) and
the Coal Direct Chemical-Looping (CDCL) process are in this category [23]. This thesis is focused the
status of development of the Chemical-Looping Combustion processes. In the next Chapter, major topics
of research are discussed, focusing on the major progress made in material selection, reactor design and
prototype testing, and conceptual process design integrated with thermal cycles.
11
Chapter 2 LITERATURE REVIEW
This chapter provides a comprehensive literature review of the major research topics on CLC. First, the
development of suitable oxygen carrier materials for CLC is discussed. Most of these oxygen carriers are
synthetic materials, where the active metal oxides are dispersed over inert supports. Next, the various
reactor configurations for CLC are introduced. Their potential advantages and issues associated with the
design, operation, and scale-up are discussed. Third, modeling studies for CLC are reviewed, following
the sequence of reaction kinetics, reactor simulation, and process design.
2.1. Oxygen carriers for CLC
Most of the technical literature on CLC has been focused on the development of suitable oxygen carrier
materials. Some of the most active research institutes for CLC are Chalmers University of Technology,
Instituto de Carboquímica of the Spanish National Research Council (ICB-CSIC), Tokyo Institute of
Technology, and Korean Institute of Energy Research. A suitable oxygen carrier material should exhibit
the following characteristics [28,29]:
High thermal resistance
Resistance to agglomeration or attrition
High reactivity and stability during reduction and oxidation cycles
High oxygen carrying capacity
Environmentally benign and economically feasible
Most of the reported work on CLC has been accomplished using oxygen carrier particles where the active
component is combined with an inert material [29,30], while there are some studies with iron ore [31] and
ilmenite [32]. Transition metal oxides, such as nickel, cobalt, iron, and manganese are good candidates
given their favorable reductive and oxidative behavior. From thermodynamic analysis, Mattisson and
Lyngfelt [33] and Jerndal et al. [34] proposed the following metal oxides as suitable materials for gaseous
12
CLC: Mn2O3/Mn3O4, CuO/Cu2O, Fe2O3/Fe3O4, NiO/Ni. To increase their reactivity, durability, and
fluidizability, oxygen carriers are prepared by deposition the active metal oxides over an inert support,
such as SiO2, TiO2, ZrO2, Al2O3, YSZ, and bentonite. Methods for oxygen carrier preparation include
freeze-granulation [35,36], spay-drying [37–39], impregnation [40–42], co-precipitation [43–45], spin-
flash drying [46], sol-gel and dissolution [47]. In general, the resulting oxygen carrier has a porous
structure with a high surface area.
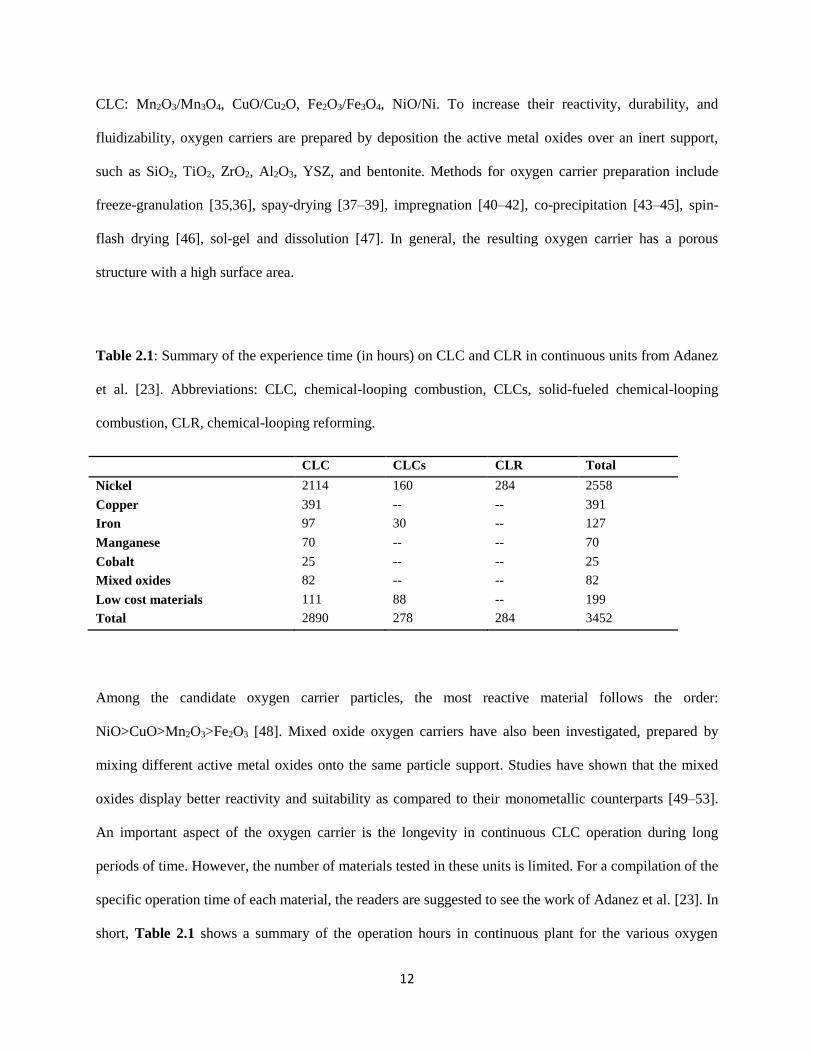
Table 2.1: Summary of the experience time (in hours) on CLC and CLR in continuous units from Adanez
et al. [23]. Abbreviations: CLC, chemical-looping combustion, CLCs, solid-fueled chemical-looping
combustion, CLR, chemical-looping reforming.
CLC CLCs CLR Total
Nickel 2114 160 284 2558
Copper 391 -- -- 391
Iron 97 30 -- 127
Manganese 70 -- -- 70
Cobalt 25 -- -- 25
Mixed oxides 82 -- -- 82
Low cost materials 111 88 -- 199
Total 2890 278 284 3452
Among the candidate oxygen carrier particles, the most reactive material follows the order:
NiO>CuO>Mn2O3>Fe2O3 [48]. Mixed oxide oxygen carriers have also been investigated, prepared by
mixing different active metal oxides onto the same particle support. Studies have shown that the mixed
oxides display better reactivity and suitability as compared to their monometallic counterparts [49–53].
An important aspect of the oxygen carrier is the longevity in continuous CLC operation during long
periods of time. However, the number of materials tested in these units is limited. For a compilation of the
specific operation time of each material, the readers are suggested to see the work of Adanez et al. [23]. In
short, Table 2.1 shows a summary of the operation hours in continuous plant for the various oxygen
13
carriers, up to the end of 2010. In this thesis, two of the most heavily investigated oxygen carriers (Table
2.1) are considered: (1) a Ni-based oxygen carrier supported on Al2O3; (2) a Cu-based oxygen carrier
supported on SiO2. In the following sections, these two oxygen carriers are further discussed on the basis
for their reactivity, chemical stability, and suitability for large-scale CLC applications.
2.1.1. Nickel-based materials
Nickel-based oxygen carriers have been extensively studied in the CLC literature. They demonstrate very
high reactivity in the reduction and oxidation environments and good stability at high working
temperatures (900-1000°C). The melting point of is metallic Ni is 1453°C and that of NiO is 1990°C.
Other nickel oxides (such as Ni2O3 and NiO2 do not exist during CLC conditions), so only NiO has to be
considered, in conjunction with Ni. Furthermore, Ni is a well-known reforming catalyst [54,55], which
allows for the process to operate at near complete CH4 conversions. However, carbon formation reactions
catalyzed by Ni are disadvantageous to the CL process, by lowering the CO2 capture efficiency [56] and
also block pores [57,58].
Among the available supports for NiO/Ni materials, Al2O3 has received considerable attention due to its
favorable fluidization properties and thermal stability [56,57,59–69]. There is possible interaction
between free NiO with the Al2O3 support to form nickel aluminate spinel (NiAl2O4) as a result of
calcination at temperatures above 1000°C [70,71]. The spinel is significantly less reactive than NiO [66],
and as a result, the reactivity of the material can depart over time from that of the fresh materials [72]. To
reduce the metal/support interaction, some authors suggested using excess nickel to compensate for the
loss of Ni to the NiAl2O4 [56,63], or use of NiAl2O4 as the support in lieu of Al2O3, which has shown to
improve oxygen carrier stability and decrease carbon deposition [60,62,65,66,73–76]. The addition of
MgO and CaO to the Al2O3 support has been shown to reduce interaction between NiO and Al2O3 and
stabilize the carrier by forming a protective layer of MgAl2O4 and CaAl2O4 spinel [70,77–80]. Also, Co
can promote the performance of Co-Ni/Al2O3 oxygen carriers by reducing metal-support interactions [81].
14
2.1.2. Copper-based materials
Copper-based oxygen carriers, like Ni, have high reactivity in both reduction and oxidation cycles and
high oxygen transfer capacity. Thermodynamic analysis shows that methane and synthesis gas fuels can
be converted almost completely to H2O and CO2 using CuO as the oxygen carrier. Unlike Ni, the
reduction and oxidation reactions with Cu-based oxygen carriers are exothermic, which reduces the
preheating demands for the Reducer. Other advantages of Cu over Ni include the cheaper cost and non-
toxicity. However, the main disadvantage of using CuO for CLC applications is its low melting point and
high tendency for agglomeration. The operating temperatures of CuO-based CLC are limited to below
1085°C, which is the melting point of Cu. Several contributions address the reactivity of CuO in CLC and
showed that at 950°C, the Cu-based oxygen carrier displayed high reactivity in the redox cycles, but after
a few cycles, the reactivity was significantly reduced due to particle agglomeration [82,83].
Supported Cu-based oxygen carriers are typically favored over pure CuO. CuO/Al2O3 is commonly used
in the literature [63,66,74,82,84–90], however the solid-solid reaction between CuO and Al2O3 starts
above 850°C. Thus, the formation of CuAl2O4 can occur in the CLC system and lower the oxygen carrier
reactivity. CuO/Al2O3 prepared by impregnation showed a high tendency for agglomeration if the CuO
loading on the oxygen carrier was above 20 wt.% and no tendency if the loading was below 10 wt.% [88].
Chuang et al. [90] analyzed the influence of different preparation methods on the CuO/Al2O3 performance
and found that oxygen carriers made by mechanical mixing and wet impregnation had a poor dispersion
of CuO throughout Al2O3, resulting in agglomeration. However, co-precipitated oxygen carriers did not
agglomerate and showed a high carrying capacity [90]. SiO2 was identified by several researchers as a
good binder for Cu [82,84,86,91–94] for its physical and chemical stability. CuO supported on SiO2
displays high reactivity, albiet lower than Ni-based oxygen carriers. Still, the CuO/SiO2 oxygen carrier is
another good candidate for CLC.
15
2.2. Reactor design and operation
The reactor CLC should to achieve high conversion of the gas and solids, while maintaining a high CO2
capture efficiency. Wolf [28] reported some of the essential features for an efficient CLC system:
Sufficient particle circulation between Oxidzer and Reducer to achieve complete fuel combustion
Adequate contact time between the fuel/air and the solid oxygen carrier to achieve maximum
conversion of the gas and solid
High temperature to maximize gas turbine efficiency (for the integrated combined cycle with
CLC)
High pressure operation to provide higher overall efficiency of the power generation
Limited CO2 leakage from the fuel and the air reactor
Air sector
Inert sector
Fuel sector
Inert sector
Air
Fuel
N2/O2
CO2/H2O
Air
Fuel
N2/O2
CO2/H2O
N2/O2
CO2/H2O
N2/O2
CO2/H2O
Fuel
CO2/H2O
Air
N2/O2
(a) (b)(c)
(d) (e)
Figure 2.1: Reactor configurations for CLC: (a) interconnected fluidized bed reactor system [23], (b)
moving bed reactor [95], (c) fixed bed reactor [96], (d) rotating reactor [97], (e) rotary bed reactor
16
[98,99].
To meet those criteria, various reactor configurations have been proposed in the literature, shown in
Figure 2.1. In the following section, a brief description of the reactor units of Figure 2.1 is given.
2.2.1. Interconnected fluidized bed reactor system
The interconnected fluidized bed reactor system (Figure 2.1(a)) has several appealing attributes for CLC,
making it the most widely favored arrangement in the literature. The early designs were developed for
combustion of gaseous fuels at atmospheric pressure, based on the circulating fluidized bed principle
[100]. The solids exhibit a ‘fluid-like’ behavior due to the fluidization regime, which provides a good
gas/solid contact, temperature and pressure uniformity, and stable reactor operation. There are several
versions of the interconnected fluidized bed reactor design [101–103], operated by several research
groups at Chalmers University of Technology, Vienna University of Technology, CSIC-ECB, Tokyo
Institute of Technology, Korean Institute of Energy Research, and Southeast University of China.
Basically, a high-velocity riser and a low-velocity bubbling fluidized bed are considered as the Oxidizer
and Reducer, respectively. The solid particles leaving the riser (Oxidizer) are recovered by a cyclone and
sent to the Reducer. In the Reducer, the oxygen carriers react with the fuel and then are transported back
to the riser. Particle loop-seals are located between the Oxidizer and Reducer in order to accommodate
the pressure differences between the two reactors and avoid mixing of the flue gases. A longer residence
time is often required for the Reducer because of the different reactivities of the oxygen carriers under
reduction and oxidation environments [104,105].
A major difficulty of the fluidized bed reactor design deals with the transport of large amounts of solids,
which becomes more problematic at elevated pressures. Efficient cyclones are necessary to separate the
solids from the flue gas. This will lead to unavoidable particle attrition and release of fines into the
atmosphere. For CLC process operating with expensive and/or toxic oxygen carrier materials, the attrition
issue is a major bottleneck that can render the process economics unfavorable. Effective loop-seals are
needed to achieve a pressure balance between the reactors and minimize gas leakage. A gas leakage from
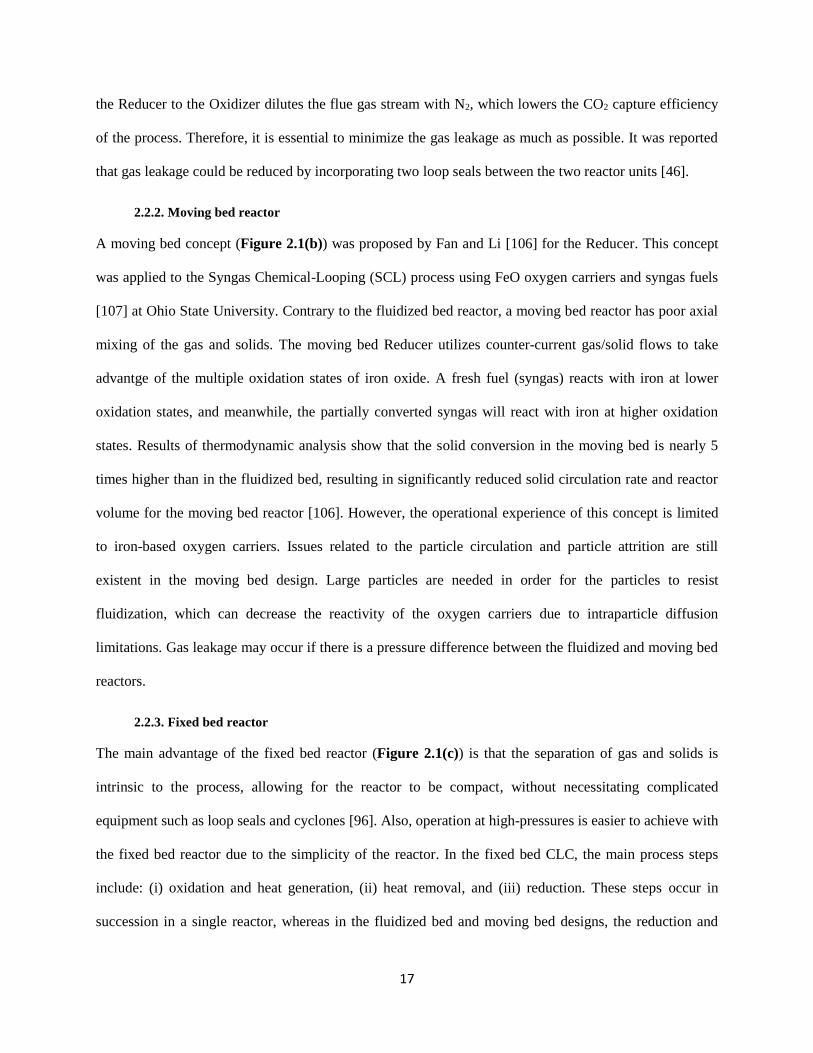
17
the Reducer to the Oxidizer dilutes the flue gas stream with N2, which lowers the CO2 capture efficiency
of the process. Therefore, it is essential to minimize the gas leakage as much as possible. It was reported
that gas leakage could be reduced by incorporating two loop seals between the two reactor units [46].
2.2.2. Moving bed reactor
A moving bed concept (Figure 2.1(b)) was proposed by Fan and Li [106] for the Reducer. This concept
was applied to the Syngas Chemical-Looping (SCL) process using FeO oxygen carriers and syngas fuels
[107] at Ohio State University. Contrary to the fluidized bed reactor, a moving bed reactor has poor axial
mixing of the gas and solids. The moving bed Reducer utilizes counter-current gas/solid flows to take
advantge of the multiple oxidation states of iron oxide. A fresh fuel (syngas) reacts with iron at lower
oxidation states, and meanwhile, the partially converted syngas will react with iron at higher oxidation
states. Results of thermodynamic analysis show that the solid conversion in the moving bed is nearly 5
times higher than in the fluidized bed, resulting in significantly reduced solid circulation rate and reactor
volume for the moving bed reactor [106]. However, the operational experience of this concept is limited
to iron-based oxygen carriers. Issues related to the particle circulation and particle attrition are still
existent in the moving bed design. Large particles are needed in order for the particles to resist
fluidization, which can decrease the reactivity of the oxygen carriers due to intraparticle diffusion
limitations. Gas leakage may occur if there is a pressure difference between the fluidized and moving bed
reactors.
2.2.3. Fixed bed reactor
The main advantage of the fixed bed reactor (Figure 2.1(c)) is that the separation of gas and solids is
intrinsic to the process, allowing for the reactor to be compact, without necessitating complicated
equipment such as loop seals and cyclones [96]. Also, operation at high-pressures is easier to achieve with
the fixed bed reactor due to the simplicity of the reactor. In the fixed bed CLC, the main process steps
include: (i) oxidation and heat generation, (ii) heat removal, and (iii) reduction. These steps occur in
succession in a single reactor, whereas in the fluidized bed and moving bed designs, the reduction and
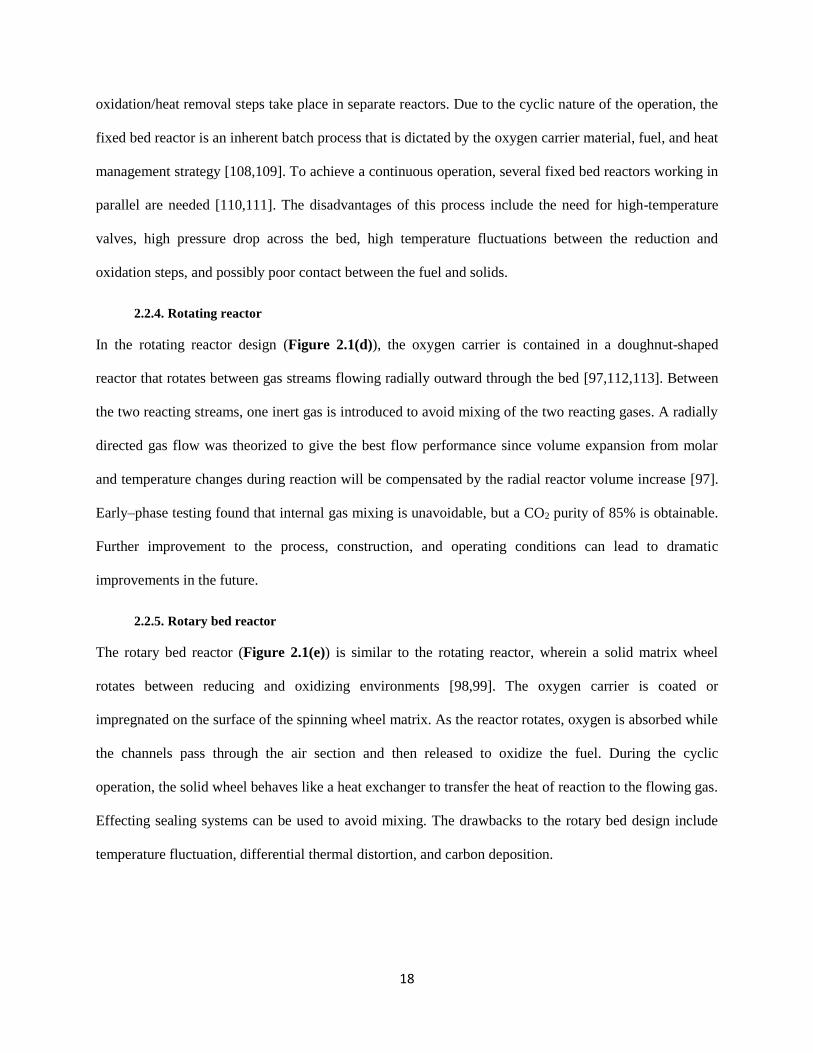
18
oxidation/heat removal steps take place in separate reactors. Due to the cyclic nature of the operation, the
fixed bed reactor is an inherent batch process that is dictated by the oxygen carrier material, fuel, and heat
management strategy [108,109]. To achieve a continuous operation, several fixed bed reactors working in
parallel are needed [110,111]. The disadvantages of this process include the need for high-temperature
valves, high pressure drop across the bed, high temperature fluctuations between the reduction and
oxidation steps, and possibly poor contact between the fuel and solids.
2.2.4. Rotating reactor
In the rotating reactor design (Figure 2.1(d)), the oxygen carrier is contained in a doughnut-shaped
reactor that rotates between gas streams flowing radially outward through the bed [97,112,113]. Between
the two reacting streams, one inert gas is introduced to avoid mixing of the two reacting gases. A radially
directed gas flow was theorized to give the best flow performance since volume expansion from molar
and temperature changes during reaction will be compensated by the radial reactor volume increase [97].
Early–phase testing found that internal gas mixing is unavoidable, but a CO2 purity of 85% is obtainable.
Further improvement to the process, construction, and operating conditions can lead to dramatic
improvements in the future.
2.2.5. Rotary bed reactor
The rotary bed reactor (Figure 2.1(e)) is similar to the rotating reactor, wherein a solid matrix wheel
rotates between reducing and oxidizing environments [98,99]. The oxygen carrier is coated or
impregnated on the surface of the spinning wheel matrix. As the reactor rotates, oxygen is absorbed while
the channels pass through the air section and then released to oxidize the fuel. During the cyclic
operation, the solid wheel behaves like a heat exchanger to transfer the heat of reaction to the flowing gas.
Effecting sealing systems can be used to avoid mixing. The drawbacks to the rotary bed design include
temperature fluctuation, differential thermal distortion, and carbon deposition.

19
2.3. Modeling and simulation
Mathematical modeling of the reduction and oxidation reactions inside CLC reactors is helpful for design,
optimization, and scale-up endeavors. A number of works can be found in the literature for the modeling
of CLC systems. This section briefly addresses three major topics of CLC modeling: heterogeneous
kinetic modeling, reactor modeling, and process simulation.
2.3.1. Chemical reactions of CLC
To develop an accurate kinetic model suitable for representation of the CLC system, the reaction kinetics
and their mechanisms need to be estimated from experimental data. Typically, thermo-gravimetric
analyzers [32,35,42,114–117] and bench-scale fixed bed reactors [58,118–120] are used to estimate
kinetic parameters and compare solid-state reaction models. In most cases, the oxidation reaction can be
represented by one reaction:
2MexOy-1 + O2→ 2MexOy (R1)
where MexOy is the oxidized form and MexOy-1 is the reduced form.
The overall reduction reactions of metal oxide with CH4, CO, and H2, which are main compounds present
in natural gas and syngas, are described by the following reactions,
4MexOy + CH4 → 4MexOy-1 + CO2 + H2O (R2)
MexOy + CH4 → 4MexOy-1 + CO + 2H2 (R3)
MexOy + CO → MexOy-1 + CO2 (R4)
MexOy + H2 → MexOy-1 + H2O (R5)
Other reactions that take place simultaneously with R2-R5 in the Reducer are gas phase reactions and
heterogeneous reactions catalyzed by the reduced metal. For Ni-based oxygen carriers, the methane
reforming reactions (R6-R8) play a significant role in the conversion of CH4 [40,73,121]. The water gas
shift reaction (R9) is also considered to take place in the presence of CO2, H2O, CO and H2 [122,123].
Carbon formation reactions can also occur, in the presence of CH4 (R10) or CO (R11). The solid carbon
20
can be removed via gasification with H2O or CO2 [124] or the lattice oxygen reaction (R13) [125]. If R11-
R13 are faster than carbon generation, then carbon deposition is not observed.
CH4 + H2O ↔ CO + 3H2 (R6)
CH4 + 2H2O ↔ CO2 + 4H2 (R7)
CH4 + CO2 ↔ 2CO + 2H2 (R8)
CO + H2O ↔ CO2 +H2 (R9)
CH4 ↔ C + 2H2 (R10)
2CO ↔ C + CO2 (R11)
C + H2O ↔ CO + H2 (R12)
MexOy + C ↔ MexOy-1 + CO (R13)
Thus, various reaction pathways exist for the reduction of the oxygen carrier by CH4 fuel, to generate a
mixture of CO2, H2O, CO, H2, and C. Most studies do not consider all of the aforementioned reduction
reactions in their analysis, by neglecting certain reactions whose products are not observed. The kinetics
of the metal oxide reduction reactions can differ widely, depending on the reducing fuel and metal oxide,
preparation method, and conditions and duration of testing [42,49,57,114,115,126–128].
Reaction schemes had been proposed to take into account the metal-support interaction. Dueso et al. [114]
proposed the following reaction scheme for the reduction of NiAl2O4 spinel:
CH4 + 4NiAl2O4 → CO2 + 2H2O+ 4Ni + 4Al2O3 (R14)
H2 + NiAl2O4 → H2O+ Ni + Al2O3 (R15)
CO + NiAl2O4 → CO2+ Ni + Al2O3 (R16)
It was postulated that the formation of NiAl2O4 spinel occurred through the oxidation of metallic Ni to
NiO, which then reacts with the Al2O3 support to form NiAl2O4:
Ni + ½O2 → NiO (R17)
NiO +Al2O3 → NiAl2O4 (R18)
Corbella et al. [86,87] proposed the following reaction scheme for the reduction and oxidation of NiTiO3:
4NiOTiO3 + 3/2 CH4 →4 Ni + 2Ti2O3 + 3/2 CO2 + 3H2O (R19)
Ni + ½ Ti2O3 + 3/2 O2 → NiTiO2 (R20)
21
The importance of the metal-support reaction rates on the overall reduction behavior depends on the
relative amounts of the spinel and free metal oxide present in the oxygen carrier. In the study of Corbella
et al. [87], the contribution by the NiTiO3 to the reduction behavior was significant, due to the minor
presence of the NiO phase. However, Dueso et al. [114] found that the effect of the NiAl2O4 phase was
minor for the α-Al2O3-supported oxygen carriers and significant for the γ-Al2O3-supported oxygen
carriers.
2.3.2. Reaction models
The solid conversion is often described as:
( ) ( ) ( )i
dXk T f X g C
dt , (2.1)
where X is the oxygen carrier conversion, f(X) represents the structural changes as a function of the solid
conversion, Ci is the gas concentration of the reacting species, g captures the effect of the gas
concentration on reactivity, and k is the kinetic rate constant represented by the Arrhenius equation, as
shown below:
/
0aE RTk k e , (2.2)
where k0 is the pre-exponential factor, T is the temperature, R is the ideal gas law constant, and Ea is the
activation energy.
There is no general consensus within the CLC literature to a single reaction mechanism that governs the
CLC reduction and oxidation reactions for all the oxygen carriers. Thus, various forms of f(X) were
developed and used to predict the conversion profiles for the studied oxygen carriers. The most frequently
used kinetic models for the non-catalytic reactions are: the reaction order model (Eq.(2.3)), the shrinking
core model (Eq.(2.4)), and the nucleation model (Eq.(2.5)):
( ) (1 )nf X X , (2.3)
2/3( ) 3(1 )f X X , (2.4)

22
( 1)/( ) (1 )[ ln(1 )] n nf X n X X , (2.5)
where n denotes the exponential terms of the respective mechanistic models. The reaction order-based
models, including the volumetric model, assume a homogeneous reaction taking place within the particle.
The shrinking core model is characterized by a clearly defined interphase of reaction in the grain [129].
The nucleation model, or also called Avrami-Erofe’ev model, assumes that the gas-solid reactions
proceed by nucleation (nuclei formation) and subsequent nuclei growth. Before nucleation, there is an
induction period for the activation of the solid phase to form nuclei [52,130,131]. The induction time
primarily depends on the gas-solid system and reaction temperature, affecting the value of the n parameter
of Eq.(2.5). As the reaction continues, nucleation growth causes overlapping of nuclei and ingestion of
nucleation sites. Detailed discussion on these mechanistic models and their applications are provided in
Adanez. et al. [23], Hossain et al. [29] and Zhou et al. [132].
2.3.3. Reactor simulation
The gas-solid reactive flows in the CLC reactor are generally complex and coupled to the reaction
kinetics, hydrodynamics, and inter-phase interaction. Models for the circulating CLC processes, such as
the fluidized bed reactor and moving bed reactor, are complex, because of the need to consider the flow
and distribution of the solid particles and the gas species in the reactor. To address the modeling
intricacies for fluidized bed reactors, computational fluid dynamics (CFD) and macroscopic fluid
dynamics approaches are commonly used. CFD models are based on the first principles of momentum,
heat and mass transfer, and can be heavily computationally expensive when tasked to simulate full-scale
fluidized bed reactors. In recent papers, CFD models were used to simulate bubbling or circulating
fluidized bed reactors, and the authors reported that the fuel conversion can be hindered by large and fast
bubbles passing through the reactor and the system is highly sensitive to the bubble phase [133–136].
Cold-flow models were developed using CFD codes to consider the fluid dynamics for the complete CLC
system [137,138]. However, there are limited works using CFD to simulate the large-scale CLC units in
the range of 10-150 kWth.
23
Macroscopic models, on the other hand, are more suitable for reactor design purposes because of their
lower computational demands, and thus are more practical for design and optimization studies. The
macroscopic models rely on empirical equations to describe the distribution of the gas flow among the
bubble and emulsion phases as well as the distribution of the solids concentration in the bed. Models
based on the two-phase theory for bubbling fluidized bed beds have been successfully used to predict
CLC experimental data [139,140]. Zhou et al. [141,142] developed a three-phase hydrodynamic model
with mass, energy, and momentum balances and showed accurate predictions against experimental data,
for various oxygen carriers and operating conditions reported in the literature. In the work of Zhou et al.
[141], the effects of bubble size, mass transfer between bubble and emulsion phases, and entrainment in
the freeboard region were all found to be significant to fuel combustion efficiency. To summarize,
macroscopic models are promising alternatives to the CFD models, to assist in the design, scale-up and
optimization of the CLC technology.
2.4. Process integration
To determine the potential efficiency of a CLC-based power plant, a number of literature studies proposed
preliminary system designs using CLC and compared its efficiencies against the conventional CO2
capture methods (described in Section 1.2). One of the most common designs is a combined cycle (CC)
power plant with CLC, wherein CLC replaces the gas combustor. A simplified layout of the CLC-CC
plant is shown in Figure 2.2. Entering air and fuel (natural gas) are pressurized to 10-20 bar and sent to
the Reducer and Oxidizer, respectively. The flue gas from the Air Reactor is used to drive the gas turbine.
The gas turbine exhaust is sent to a bottoming steam cycle for additional electrical generation. The flue
gas from the Reducer can be utilized to preheat the fuel or sent to a secondary CO2/steam gas turbine for
energy recovery. Several variations of the CC design with CLC have been investigated; for example,
some authors proposed the use the flue gas from the Reducer to drive the steam cycle [143,144] or linked
with a recuperator to preheat the compressed air [145]. Naqvi compared the theoretical net plant

24
efficiencies for several CLC combined cycles against a reference CC plant without CO2 capture and with
post-combustion [12]. From their design analyses, the CC with CO2 gas turbine and steam turbine offers
the highest efficiency, while the performance of the other two (CC with recuperation and CC with Fuel
Reactor flue gas to drive the steam cycle) are comparable. It is important to note that all the studied CLC
cycles achieved higher net efficiencies than the conventional natural-gas fired CC with post combustion
CO2 capture by means of chemical absorption [12].
Red
Me
MeO
Me/MeO
Air
Ox
AirFuel
Compressor Air turbine CO2 turbine
CO2 + H2O
CO2/H2O exhaust
To condensation and compression
Steam turbine
HRSG
To stacks
LP
HP
Steam
Condenser
Condensate pump
Cooling waterCondensate/water
G
Fuel preheater
Fuel
Figure 2.2: Diagram of a natural gas CLC-combined cycle (CLC-CLC) with a CO2 turbine from Naqvi
[12].
The efficiency of CLC-CC processes can be higher if the CLC reactor can operate at higher oxidation
temperatures, to order to increase the efficiency of the downstream gas turbine. Modern day gas turbines
can operate at turbine inlet temperatures of 1400°C or above, due to advancements in thermal barrier
coatings, cooling technologies, and design configurations. For temperatures about 1000°C, the electrical
efficiency of natural gas fired CLC plants is in the range of 47-53% [145,146]. It was estimated that for
25
every 100°C increase of the turbine inlet temperature (TIT), the net electrical efficiency increases by 2%
points [145,146]. However, higher oxidation temperatures will increase the risk of agglomeration and
reactivity loss for the oxygen carrier and also put demand on the reactor material to be stable at higher
temperatures and pressures. Continuing research on novel oxygen carriers may broaden the operational
window for CLC, and at the same time, specially designed reactors equipped with high-temperature
resistant ceramics can be a feasible solution to increase the thermal stability of the reactor.
Options to increase the plant efficiency without increasing the oxidation temperature were proposed in
several works. One alternative is to introduce reheat into the gas turbine by employing multiple CLC
reactors [145]. Naqvi et al. [145] showed that a single reheat CLC-CC cycle with an oxidation
temperature of 1000°C can achieve almost the same efficiency as the base-case CLC-CC plant with an
oxidation temperature of 1200°C. Consonni et al. [144] proposed a post-firing step, to use a
supplementary combustor placed between the exit of the Oxidizer and the gas turbine. The supplementary
combustor takes a fraction of the fuel to combust the O2 in the oxidation exhaust, in order to increase the
inlet temperature of the gas turbine. The advantage of the firing step is that it allows the gas turbine to
operate at higher efficiencies without affecting the CLC unit, but the disadvantage is the lower CO2
capture efficiency. Lozza et al. [147] proposed a three-reactor concept, to exploit an intermediate
oxidation state of FeO for H2 production. The generated H2 is used to raise the temperature of the gas
stream out of the Oxidizer to values preferred by modern gas turbine technology (~1350°C), to achieve an
electrical efficiency of 50.2-51.3%. This CLC layout was also proposed for hydrogen production in the
work of Chiesa et al. [148].
To use coal as a primary fuel, the integrated gasification combined cycle (IGCC) with CLC was studied
by Erlach et al. [149]. Their work considered pressurized reactors (20 bar) and assessed two different
configurations for CO2-rich stream cooling (expansion followed by steam generation and steam
generation only). The analysis found that the net electrical efficiency increased by 1% point after
increasing the oxidation temperature of the Oxidizer from 1200°C to 1300°C under optimized steam cycle
26
pressures. Rezvani et al. [150] proposed a dual-reactor configuration, where two CLC reactors, operated
at 20 bar and at 7 bar, were able to achieve an efficiency of 36.1%, which is 1.6-1.9% points higher than
the single reactor configuration (20 bar). Spallina et al. [151] performed a preliminary comparison of
combined cycle and ultra-supercritical steam cycle for syngas-fed CLC. Their study found that the
combined cycle plant achieves higher electrical efficiency (40% vs. 36.9%) for a maximum reactor
temperature of 1200°C. Sorgenfrei and Tsatsaronis [152] proposed an IGCC power plant with iron-based
syngas CLC and reported electrical efficiencies in the range of 39.7-44.8%. In summary, CLC has been
revealed as a promising technology to decrease the cost of CO2 capture in power generation.
2.5. Research objective
The objective of this thesis is to propose a novel process that delivers high efficiencies for CO2 capture
and power generation in a compact and scale-able reactor, utilizing highly reactive materials. Chemical-
looping combustion (CLC) technology is explored due to its high potential for CO2 remediation. Due to
the novelty of CLC and the complexity of the multi-phase interactions, there is no general approach for
reactor and/or process design from the current literature. Instead, common approaches are dictated from
experimental observations or intuition and the results of the design analyses are heavily dependent on the
oxygen carrier material and fuel. Furthermore, a lack of fundamental understanding of the intrinsic
kinetics of the oxygen carrier materials and possible sub-optimal operating conditions hinder the
deployment of CLC processes.
This thesis employs a structured methodology incorporating many facets of process systems engineering,
in an effort to accelerate the technological development process. In the first step, modelling and
simulation was integrated with bench-scale CLC experiments to understand the phenomenological
changes inside the CLC reactor and identify sources of model uncertainty. Optimal experimental design
techniques were used to determine statistically-rich kinetic networks and parameters. Large-scale CLC
systems are simulated using the augmented process models with Maxwell-Stefan diffusion equations.
27
Emphasis is placed on optimizing the CLC plant performance, with respect to the CLC operation and
reactor configuration. A dynamic optimization program was formulated to determine a set of control
parameters that maximize the thermal efficiency of a large-scale CLC unit. After identifying the process
bottlenecks, a novel reverse-flow reactor was proposed and proven theoretically and experimentally to
improve the CO2 capture-ability for any oxygen carrier and fuel-type. The reverse-flow reactor is an
innovative method to provide efficient gas-solid contact with no particle attrition or gas/solid separations
issues. A simulated moving bed reactor concept was proposed as an advanced version of the reverse-flow
reactor. The reverse-flow and simulated moving bed reactors can be disruptive to future CLC research, by
shifting attention to highly reactive oxygen carriers and more compact, scale-able reactor designs. These
novelties produced and the conclusions drawn from this thesis were the result of applying process systems
engineering principles to guide process design and optimization of CLC systems. The feasibility of this
structured methodology is demonstrated, as a means to enable faster deployment of novel technologies.

28
Chapter 3 BENCH-SCALE EXPERIMENTATION
This chapter presents the experimental methods for oxygen carrier preparation, characterization, and
reactivity studies conducted in a thermogravimetric analyzer and a bench-scale fixed bed reactor. The
experimental results are simulated using different process models described in Chapters 4-5. The bench-
scale experimental setup constitutes to the design space used to derive reduction kinetics in the model-
based design of experiments section of Chapter 5.
3.1. Oxygen carrier preparation
NiO/Al2O3-SiO2 oxygen carriers were prepared using the incipient wetness impregnation method.
Commercial γ-Al2O3/SiO2 particles (W.R. Grace & Co.) sieved to 50-150 μm in size, with a surface area
of 157.8 m2/g and mean pore size of 112.77 Å, were used as support. Aqueous Ni(NO3)2 was added to
the γ-Al2O3/SiO2 particles and the mixture was stirred at room temperature followed by drying at
120°C for 12 h and calcination in air at 800°C for 5 h. The apparent density of the particles was 1190
kg/m3. The particle porosity was measured to be 0.45. The active (non-spinel) NiO loading in the
oxygen carrier is measured to be 18 wt%, by oxidation in a thermogravimetric analyzer (TGA) after
long-period reduction in H2. The resulting oxygen carrier is then sieved to particle size of 50 – 150
μm, with BET surface area of 93 m2/g for the fresh sample and ~68 m2/g after TGA
reduction/oxidation.
3.2. Characterization techniques
Identification of crystallite chemical species and crystallite size change was performed with in-situ hot-
stage X-ray diffraction measurements, in a Bruker D8 Advance power XRD, equipped with a LynxEye-
super speed detector and a high temperature Anton Paar HTK1200 heating stage. The experiments on the
thermal evolution of the structure were carried out in the temperature range of 300 – 950 °C in air
environment with constant flow rate of 50 sccm. The heating rate between target temperatures was
29
30 °C/min. The test starts at 300 °C with a step of 50 °C and 10-min holds before recording the X-ray
patterns. The effect of calcination time was determined by taking two measurements of the same sample
calcined at 950 ˚C for 10 min and 4 h, respectively. The recorded X-ray patterns were processed with
standard background subtraction, peak match procedures and crystallite size calculation that are
incorporated in the DIFFRAC.EVA program.
The pore properties and specific surface area of the oxygen carriers were determined in a Micrometitics
ASAP 2020 Accelerated Surface Area and Porosimetry System. The pore size distribution was
determined from adsorption/desorption of N2 at 77 K with the Brunauer-Emmett-Teller (BET) method.
All the samples were degassed at 250 °C for 12 h before analysis. Focused ion beam (FIB) scanning
transmission microscopy electron microcopy (STEM) was used to identify the Ni distribution inside the
particle of the fresh and used oxygen carriers.
3.3. Thermogravimetric analyzer (TGA) method
The reactivity of the oxygen carrier was measured in a NETZSCH STA 449 F3 Jupiter TGA. The sample
(15 mg) was placed in the alumina crucible (3.8 mm in height and 5.95 mm in diameter) and heated at
10 °C/min up to the operating temperature in N2 gas at atmospheric pressure. A thermocouple was
continuously measuring the temperature of the gas phase directly adjacent to the crucible. The gas flow
rate was kept constant at 240 sccm for the oxidation, reduction, and purge cycles. The Reynolds number
of the flow across the crucible was 110. After the temperature reaches 950 °C, the flow was switched
from N2 gas to oxidizing and reducing gas. The reducing gas was composed of 4 vol.% H2 (balance Ar)
and the oxidizing gas was air. The TGA was purged with N2 in between each oxidation and reduction
cycles. In all isothermal experiments, temperature fluctuations of less than 2℃ were measured. The
degree of conversion for reduction was calculated as:
oxred
ox red
m mX
m m (3.1)

30
where m is the instantaneous mass of the sample, oxm is the mass of the fully oxidized sample, and redm
is the mass of the fully reduced sample.
3.4. Fixed bed reactor setup
Figure 3.1 shows the fixed bed experimental setup. In its designed operation, fuel (CH4 or CO/H2) and air
(O2/Ar) are sequentially fed to the reactor to simulate chemical-looping reduction and oxidation cycles.
Inert gas (Ar) is fed between the cycles to isolate reduction and oxidation steps. The reactor temperature
is controlled by a furnace and reaction products are measured with an online Agilent 5975C mass
selective detector. The fixed bed is housed in a stainless steel tube (9.9 mm ID and 250 mm length), with
a variable solid loading of 0.8-2.2 g. It is housed inside an electrical furnace capable of operating up to
1300°C, and can tolerate pressures up to 15 bars. Gas flow (Ar, CH4, air) is controlled by mass flow
controllers (MFC) and the reactor pressure is regulated by a back pressure regulator. At the start of the
experiment, Ar flows through the reactor while the furnace reaches set-point. To initiate reduction, the gas
flow is switched to a mixture of Ar and CH4 (0-30 vol.% CH4). After the reduction completes, Ar is used
to purge the reactor for 5 minutes. The purge is followed by an oxidation period of 4 minutes, where gas
flow is switched to air. After the oxidation step, the reactor is purged with Ar and the loop reinitiates. The
experiment is repeated for multiple number of cycles to analyze the stability of the oxygen carrier. The
gas flow rate is kept at 100 ml/min during the reduction, oxidation and purge periods. Typical reduction
temperatures are in the range of 700-900°C. The sequential gas flow switch (CH4/Ar → Ar → Air → Ar),
is controlled automatically by the MFCs. In this configuration, 15 cycles are performed to ensure stability
of the oxygen carrier reactivity. After stabilization, the experimental data from 3 consecutive cycles were
used to calculate experimental variances and estimate kinetic parameters. For each experiment design, at
least two independent experiments were performed, necessitating the experimental procedure to be
repeated from a batch of newly synthesized oxygen carrier. The same batch of newly synthesized oxygen
carriers was used for the reactivity tests. Thus, in summary every experimental measurement reported

31
here is the average of 6 repetitions with error bars in each plot showing the experimental standard
deviation.
Ar
O2
CH4
Filter
Mass
selective
detectorVent
Reactor
Oxygen
Carrier
F
MFC3
F
MFC2
F
MFC1
T1
T2
Vent
Pressure
Regulator
Furnace
Figure 3.1: Fixed bed reactor experimental setup.

32
Chapter 4 HETEROGENEOUS MODELING OF CHEMICAL-LOOPING COMBUSTION: PART 1:
REACTOR MODEL
Heterogeneous modeling is used to investigate the significance of intraparticle diffusion, temperature
fluctuations, and dispersion on predicting fixed bed chemical-looping combustion (CLC) reactors. The
model is validated against chemical-looping reduction experiments in the literature that utilize methane as
fuel and a Ni-based oxygen carrier. The effect of particle size on CLC reduction reactions is studied by
examination of the Weisz-Prater and Mears criteria for internal and external mass transfer limitations.
Homogeneous and heterogeneous models are applied for two particle sizes and it is shown that diffusion
limitations are significant for the larger particle. Furthermore, non-ideal flow patterns are evaluated where
superior predictions are obtained by considering the effects of dispersion and convection processes.
Radial dispersion in each experiment is analyzed in detail and the predicted temperature fluctuations
inside the reactor and particle are presented. Lastly, the heterogeneous model is applied to design a
particle that maximizes chemical-looping efficiency, measured as fuel conversion and product selectivity.
Enhancements to the overall reaction rate and temperature profile are observed for the optimal particle
size as a result of reducing the intraparticle resistance.
4.1. Introduction
Different mathematical models have been developed to simulate CLC systems. Ishida et al. [47] applied
the un-reacted shrinking core model to interpret the experimental results on kinetics of the NiO mixed
with yttria-stabilized zirconia (YSZ) particle. Comparison of model prediction with experimental results
indicated that the reduction reaction was controlled by chemical reaction, while oxidation was controlled
by both chemical reaction and ash-layer diffusion. Iliuta et al. [58] used an isothermal dynamic plug-flow
model to estimate kinetic parameters that best fit their fixed bed micro-reactor. The gas-solid reaction
parameters were then incorporated into a detailed hydrodynamic model to successfully model their
fluidized-bed reactor. Sahir et al. [153] used the law of additive reaction times to approximate the gas-
33
solid reactions for analyzing the copper oxidation process. Ortiz et al. [118] studied the catalytic kinetics
of steam methane reforming and water-gas-shift for NiO/α-Al2O3 and NiO/γ-Al2O3, and found that the
activity increased with reduction of the oxygen carrier. Recently, Zhou et al. et al. [119] conducted a
detailed kinetic analysis for the relevant oxygen carrier reduction reactions of NiO by CH4 and Ni
catalyzed reactions and validated the proposed kinetic scheme with different experimental results from
literature.
Temperature variations inside the particle and reactor have been considered in numerical models [96,154–
156]. Noorman et al. [154] proposed a detailed particle model which incorporated the effects of reaction
kinetics, internal and external mass and heat transfer to study the reduction and oxidation characteristics
of oxygen carriers. Modelling of the CuO/Cu system showed that internal mass transfer by was hindered
by Knudsen diffusion for a range of pore sizes and instances where relatively large temperature
differences can exist between the particle and the bulk gas [154]. A more accurate description of diffusion
processes was obtained by applying Maxwell-Stefan diffusion, however Fickian diffusion can be
reasonably applied in cases with simple dilute mixtures. Garcia-Labiano et al. [156] analyzed the
reduction and oxidation characteristics of the major oxygen carriers based on Cu, Co, Fe, Mn, and Ni
using a non-isothermal changing grain size particle model. The temperature changes inside the particle
during the exothermic oxidation reactions depended on the particle size, overall reaction time, and the
resistance to heat transfer in the external gas film, with the highest temperature variation corresponding to
Ni for 1 mm particles [156].
Heterogeneous modelling can be applied to CLC processes to investigate the competing effects of fluid
transport and chemical reactions occurring within a fixed-bed reactor. Oxygen carriers with particle size
ranging from 0.08 to 2 mm have been used in the literature [157]. Larger particle sizes are advantageous
in minimizing pressure drop across the reactor, but the effects of intraphase mass and heat transfer
limitations can be significant. Noorman et al. [154] found that particles larger than 0.3 mm are severely
diffusion-limited, which if neglected, models can lead to unreliable kinetic parameters. The role of

34
heterogeneous modeling can identify where the improvements to oxygen carrier performance are feasible
in the regime of kinetic control or mass transfer control, thereby aiding oxygen carrier and reactor design.
This work proposes a heterogeneous model that takes into account the effects of reaction kinetics in
association with mass and heat transport in the particle phase, and convection, dispersion, and pressure
drop in the bulk fluid phase. The effects of reaction and transport limitations on chemical-looping systems
operating in fixed-bed reactors are analyzed based on published experimental results from three bench-
scale fixed-bed reactors.
4.2. Model description
Flow in fixed bed reactors can be modelled by the motion of gaseous bulk fluid through the gaps between
and within the oxygen carriers that constitute the solid phase [158]. Heat and mass transfer resistances can
occur within the solid phase (intraparticle resistance) or between the solid and the bulk fluid (interfacial or
interparticle resistance). Intraparticle resistance is related to the pore size and can be controlled by the
dimensions of the oxygen carrier. Interfacial resistance is proportional to the thickness of the boundary
layer at the gas-solid interface. The boundary layer can exhibit pronounced temperature gradients in cases
of high heats of reaction that drive rapid changes in surface temperatures and concentrations. Though, this
boundary layer effect can be damped by introducing higher gas flow rates and smaller packing sizes to
induce mixing. According to the classification widely accepted in the chemical engineering society, the
continuum models can be categorized into: pseudo-homogeneous and heterogeneous models [159]. In
pseudo-homogeneous models, the catalyst surface is assumed to be completely exposed to the bulk fluid
conditions, such that any fluid-to-particle heat and mass transfer resistances can be neglected. In contrast,
heterogeneous models account for transport resistances of heat and mass from bulk fluid phase to the
particle phase and within the particle. In this section, one- and two-dimensional pseudo-homogeneous and
heterogeneous models are presented. The models are general and can be applied to any chemical looping
process for any oxygen carrier. In the simulations, the gas species considered are CH4, CO, CO2, H2, H2O,

35
and an inert (usually Ar) and the solid species considered are NiO, Ni, deposited carbon, and an inert
(Al2O3). Sections 4.2.1 – 4.2.2 detail the continuum models and Section 4.2.3 the momentum balance
equation. The following Sections (4.2.4-4.2.5) summarize the transport correlations, physical properties,
and kinetic scheme chosen for this work.
4.2.1. Homogeneous model design equations
4.2.1.1. One-dimensional
The one-dimensional pseudo-homogeneous model describes the axial profiles of the bulk fluid
concentration and temperature. The dynamic axially dispersed plug flow reactor model is:
, ,i i ib b ax i b i
C F CD R
t V z z
(4.1)
, , ( ) 4 ,b p f T p f T b ax b i i w
t
T T T UC C C F H R T T
t V z z d
(4.2)
with Danckwerts boundary conditions, expressing continuity of fluxes at steady state:
0
0, , ,/z
ib ax i i i feed in c
z
CD F y F A
z
(4.3)
0 ,
0
/ ,b ax z in p f T c
z
TT T C F A
z
(4.4)
0.i
z Lz L
C T
z z
(4.5)
4.2.1.2. Two-dimensional
Advancing in complexity, the two-dimensional model takes into account radial diffusion of bulk fluid and
temperature. Reaction rates along the reactor diameter can be affected by effective thermal diffusivity and
conductive heat transfer at the wall, which are determined by flow characteristics. The two-dimensional
pseudo-homogeneous model is:
, , ,i i i b ib b ax i rad i b i
C F C CD rD R
t V z z r r
(4.6)
36
, , ( ) ,b ib p f T p f T b ax rad b i i
CT T TC C C F r H R
t V z z r r
(4.7)
with boundary conditions at r = R and r = 0:
00
0 ,i i
rr r R
C CT
r r r
(4.8)
,b rad w wr Rr R
Th T T
r
(4.9)
and at z = L and z = 0 are consistent with Eqs.(4.3)-(4.5).
4.2.2. Heterogeneous model design equations
The presented pseudo-homogenous model is applicable supposing there is negligible difference between
solid and fluid conditions and mild radial temperature and concentration profiles. In the event that
interparticle differences are important, a heterogeneous model should be used in place of the pseudo-
homogenous model. Furthermore, intraparticle resistance is considered because limitations to diffusive
transport inside the pores can significantly limit the reaction rates inside large particles. The most
important assumptions made are: (i) spherical or cylindrical oxygen carrier, (ii) constant volume of the
particle, (iii) macroscopically uniform particle structure that is not affected by reaction, and (iv) uniform
Ni distribution within the particle. Local variations in structure or composition are not taken into the
account due to the absence of experimental data. The gas concentrations and temperature inside the pores
of the particle are functions of oxygen carrier radial direction, rc, and/or axial direction, zc. It is also
assumed that the gas at any position inside the particle is at the same temperature as the solid, and that the
thermal conductivity of the gas phase is negligible compared to that of the solid. Below, the conservation
equations corresponding to a spherical oxygen carrier are discussed. For cylindrical oxygen carriers, the
particle phase equations are summarized in the Appendix. Note that the transport of fluid phase is
unspecific to particle geometry.
4.2.2.1. One-dimensional
The one-dimensional heterogeneous model for the fluid phase is:
37
, , , | ,p
i i ib b ax i c i v c i R i
C F CD k a C C
t V z z
(4.10)
, , | ,pb p f T p f T b ax f v c R
T T TC C C F h a T T
t V z z
(4.11)
and for the particle phase is:
, ,2
, 2
1 ,
c i c i
c e i c s i
c c c
C CD r R
t r r r
(4.12)
2
, , , 21 ( ) .c s c
c s p s c p c T c c s i i
c c
T TC C C r H R
t r r r
(4.13)
The boundary conditions for the particle phase are:
,
0 0
0 ,
c c
c i c
c cr r
C T
r r
(4.14)
,
, , , ,c p
c p
s i
e i c i c i ir R
r R
CD k C C
r
(4.15)
,c p
c p
ss f s r R
r R
Th T T
r
(4.16)
and for the fluid phase the boundary conditions are equivalent to the one-dimensional homogeneous
model, Eqs.(4.3)-(4.5).
4.2.2.2. Two-dimensional
The two-dimensional heterogeneous model includes radial dispersion in the fluid phase. The design
equations for the fluid phase are:
, , , , | ,p
i i i b ib b ax i rad i c i v c i R i
C F C CD rD k a C C
t V z z r r
(4.17)
, , | ,p
b ib p f T p f T b ax rad f v c R
CT T TC C C F r h a T T
t V z z r r
(4.18)
and for the particle phase are:
38
, ,2
, 2
1 ,
c i c i
c e i c s i
c c c
C CD r R
t r r r
(4.19)
2
, , , 21 ( ) ,c s c
c s p s c p c T c c s i i
c c
T TC C C r H R
t r r r
(4.20)
with Eqs.(4.14)-(4.16) as boundary conditions for the solid phase and Eqs.(4.8)-(4.9) and Eqs.(4.3)-(4.5)
for the bulk phase.
4.2.3. Momentum balance
The momentum balance assumes pseudo-steady state and is dominated by the friction factor. The pressure
drop correlation using the Ergun friction factor for gas flow through a packed tubular reactor is written as
[160]:
2
0
3
1 1501.75 ,b
b p p
udP
dz D Re
(4.21)
where 𝑃 is the total pressure in the bed and 𝑅𝑒𝑝 is the particle Reynolds number, defined as:
0 .
1
p
p
b
u dRe
(4.22)
The boundary condition at the bed exit is applied to maintain the effluent stream leaving the reactor at
atmospheric conditions:
.outz L
P P (4.23)
4.2.4. Heat and mass transfer correlations
The effective axial coefficient can be estimated by [159]:
1 0.45
,7.3
1
b
a p
p
Pe Re Sc
Re Sc
(4.24)
and the effective radial dispersion coefficient can be estimated by [161]:
39
0.80
1 0.38 0.08.
11.11r i
i
Pe Re Sc
Re Sc
(4.25)
In general, for gases with 𝑅𝑒𝑝> 1, 𝑃𝑒𝑟 ≈ 10 and 𝑃𝑒𝑎 ≈ 1, and for gases with 𝑅𝑒𝑝 < 1, 𝑃𝑒𝑟 ≈ 𝑃𝑒𝑎 which
approach 0.7 [162]. Dispersion is usually more dominant in the radial direction, and consequently very
small radial variations of concentration can be expected in the reactor. However a high dependency of
reaction rates on temperature can lead to pronounced differences between the one-dimensional and two-
dimensional models.
The effective radial and axial thermal conductivity can be estimated by Eq.(4.26) and Eq.(4.27),
respectively by Yagi and Wakao [163] and Yagi et al. for metal spheres [164]. The static contribution, 𝜆𝑒0,
is assumed to be 0.01 W/m-K.
13 0.11 ,radp
m
Pr Re
(4.26)
0
0.7 .ax ep
m m
Pr Re
(4.27)
The wall heat transfer coefficient is calculated from [165]:
1/3 0.62 1.1 .pNu Pr Re (4.28)
The bed heat transfer coefficient is calculated by [166]:
4
.
2
erbedh
D
(4.29)
The resistances to the radial heat transfer in the bed and at the wall can be combined to define the overall
heat transfer coefficient to be used in the one-dimensional models:
1 1 1
.bed wU h h
(4.30)
The mass and heat transfer coefficients are estimated as [167]:
40
0359 2/3
, 0.357 ,c i
b
Gk Re Sc
(4.31)
0359 2/3
,
0.3571.37 .f p f
b
h C G Re Sc
(4.32)
The bed porosity for a spherical catalyst and surface area per unit volume are calculated by Eq.(4.33)
[168] and Eq.(4.34) [169]:
2
1.00.375 ,
/ b
t pD D (4.33)
6 1 / .v b pa D (4.34)
The pore diameter of a cylindrical pore can be calculated by [167]:
.cp
g s
rS
(4.35)
4.2.5. Kinetic scheme
The main reduction reactions in CLC of NiO with CH4 fuel are shown in
41
Table 4.1 based on the work of Zhou et al. [119]. The reducing gases that are active in the oxygen carrier
reduction reactions (R1-R4) comprise of CH4, H2, and CO. In the work by Zhou et al. [119] and Iliuta et
al. [58], non-catalytic gas solid reactions have been analyzed using the shrinking core model and a
modified volumetric model. Because the modified volumetric model has been found to improve the
model predictions, the kinetics based on the modified volumetric model is used in this work. The kinetic
expressions for the four NiO reduction reactions are shown below, where a0 is the initial oxygen carrier
surface area, X is the oxygen carrier conversion, ks1-ks4 are the Arrhenius rate constant, and C denotes the
concentration of the gas species and solid weight fraction of NiO and Ni.
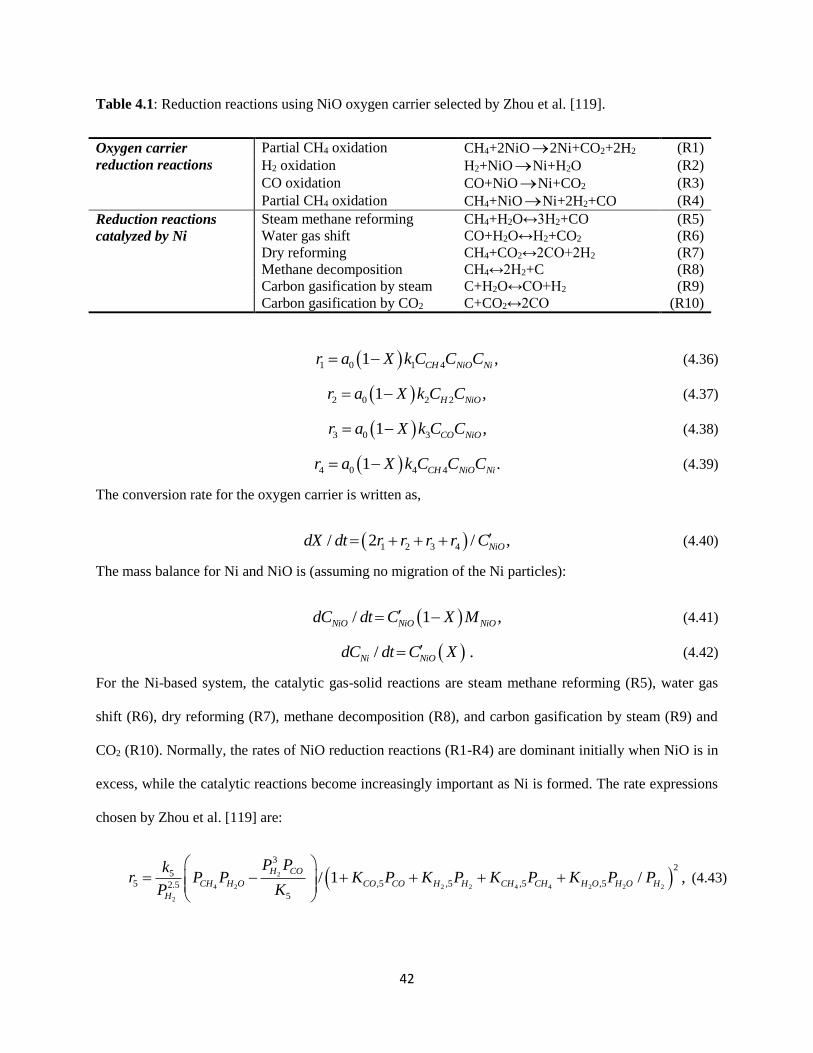
42
Table 4.1: Reduction reactions using NiO oxygen carrier selected by Zhou et al. [119].
Oxygen carrier
reduction reactions
Partial CH4 oxidation CH4+2NiO2Ni+CO2+2H2 (R1)
H2 oxidation H2+NiONi+H2O (R2)
CO oxidation CO+NiONi+CO2 (R3)
Partial CH4 oxidation CH4+NiONi+2H2+CO (R4)
Reduction reactions
catalyzed by Ni
Steam methane reforming CH4+H2O↔3H2+CO (R5)
Water gas shift CO+H2O↔H2+CO2 (R6)
Dry reforming CH4+CO2↔2CO+2H2 (R7)
Methane decomposition CH4↔2H2+C (R8)
Carbon gasification by steam C+H2O↔CO+H2 (R9)
Carbon gasification by CO2 C+CO2↔2CO (R10)
1 0 1 4 ,1 CH NiO Nir a X k C C C (4.36)
2 0 2 2 ,1 H NiOr a X k C C (4.37)
3 0 31 ,CO NiOr a X k C C (4.38)
4 0 4 4 .1 CH NiO Nir a X k C C C (4.39)
The conversion rate for the oxygen carrier is written as,
1 2 3 4/ 2 / ,NiOdX dt r r r r C (4.40)
The mass balance for Ni and NiO is (assuming no migration of the Ni particles):
/ ,1NiO NiO NiOdC dt C X M (4.41)
/ .Ni NiOdC dt C X (4.42)
For the Ni-based system, the catalytic gas-solid reactions are steam methane reforming (R5), water gas
shift (R6), dry reforming (R7), methane decomposition (R8), and carbon gasification by steam (R9) and
CO2 (R10). Normally, the rates of NiO reduction reactions (R1-R4) are dominant initially when NiO is in
excess, while the catalytic reactions become increasingly important as Ni is formed. The rate expressions
chosen by Zhou et al. [119] are:
2
4 2 2 2 4 4 2 2 2
2
32
55 ,5 ,5 ,5 ,52.5
5
/ 1 / ,H CO
CH H O CO CO H H CH CH H O H O H
H
P Pkr P P K P K P K P K P P
P K
(4.43)
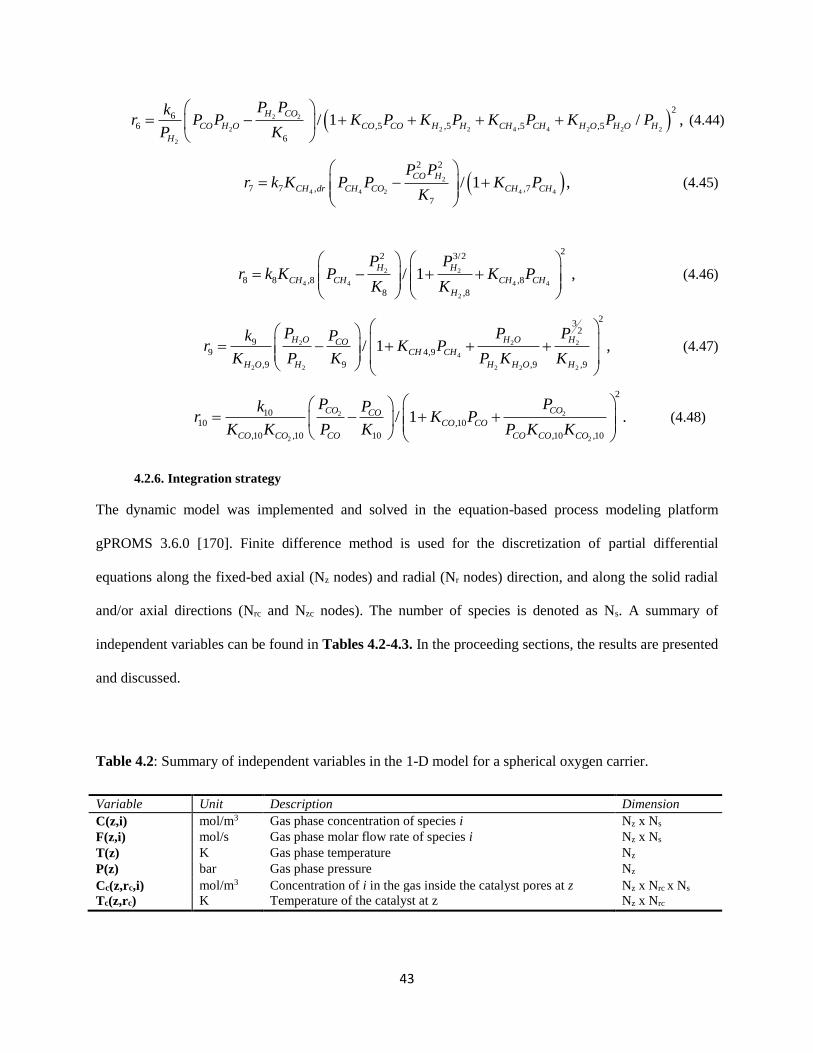
43
2 2
2 2 2 4 4 2 2 2
2
26
6 ,5 ,5 ,5 ,5
6
/ 1 / ,H CO
CO H O CO CO H H CH CH H O H O H
H
P Pkr P P K P K P K P K P P
P K
(4.44)
2
4 4 2 4 4
2 2
7 7 , ,7
7
/ 1 ,CO H
CH dr CH CO CH CH
P Pr k K P P K P
K
(4.45)
2 2
4 4 4 4
2
22 3/2
8 8 ,8 ,8
8 ,8
/ 1 ,H H
CH CH CH CH
H
P Pr k K P K P
K K
(4.46)
2 2 2
4
2 2 2 2 2
23
2
99 4,9
,9 9 ,9 ,9
,/ 1H O H O HCO
CH CH
H O H H H O H
P P Pk Pr K P
K P K P K K
(4.47)
2 2
2 2
2
1010 ,10
,10 ,10 10 ,10 ,10
/ 1 .CO COCO
CO CO
CO CO CO CO CO CO
P Pk Pr K P
K K P K P K K
(4.48)
4.2.6. Integration strategy
The dynamic model was implemented and solved in the equation-based process modeling platform
gPROMS 3.6.0 [170]. Finite difference method is used for the discretization of partial differential
equations along the fixed-bed axial (Nz nodes) and radial (Nr nodes) direction, and along the solid radial
and/or axial directions (Nrc and Nzc nodes). The number of species is denoted as Ns. A summary of
independent variables can be found in Tables 4.2-4.3. In the proceeding sections, the results are presented
and discussed.
Table 4.2: Summary of independent variables in the 1-D model for a spherical oxygen carrier.
Variable Unit Description Dimension
C(z,i) mol/m3 Gas phase concentration of species i Nz x Ns
F(z,i) mol/s Gas phase molar flow rate of species i Nz x Ns
T(z) K Gas phase temperature Nz
P(z) bar Gas phase pressure Nz
Cc(z,rc,i) mol/m3 Concentration of i in the gas inside the catalyst pores at z Nz x Nrc x Ns
Tc(z,rc) K Temperature of the catalyst at z Nz x Nrc
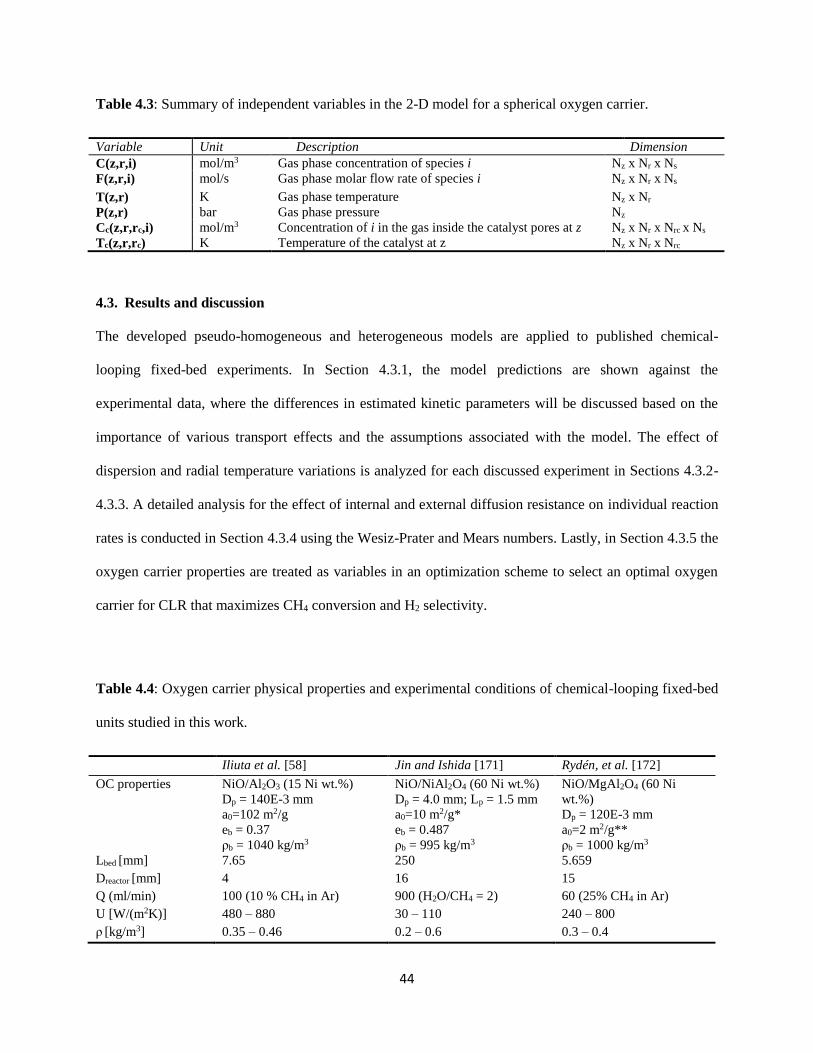
44
Table 4.3: Summary of independent variables in the 2-D model for a spherical oxygen carrier.
Variable Unit Description Dimension
C(z,r,i) mol/m3 Gas phase concentration of species i Nz x Nr x Ns
F(z,r,i) mol/s Gas phase molar flow rate of species i Nz x Nr x Ns
T(z,r) K Gas phase temperature Nz x Nr
P(z,r) bar Gas phase pressure Nz
Cc(z,r,rc,i) mol/m3 Concentration of i in the gas inside the catalyst pores at z Nz x Nr x Nrc x Ns
Tc(z,r,rc) K Temperature of the catalyst at z Nz x Nr x Nrc
4.3. Results and discussion
The developed pseudo-homogeneous and heterogeneous models are applied to published chemical-
looping fixed-bed experiments. In Section 4.3.1, the model predictions are shown against the
experimental data, where the differences in estimated kinetic parameters will be discussed based on the
importance of various transport effects and the assumptions associated with the model. The effect of
dispersion and radial temperature variations is analyzed for each discussed experiment in Sections 4.3.2-
4.3.3. A detailed analysis for the effect of internal and external diffusion resistance on individual reaction
rates is conducted in Section 4.3.4 using the Wesiz-Prater and Mears numbers. Lastly, in Section 4.3.5 the
oxygen carrier properties are treated as variables in an optimization scheme to select an optimal oxygen
carrier for CLR that maximizes CH4 conversion and H2 selectivity.
Table 4.4: Oxygen carrier physical properties and experimental conditions of chemical-looping fixed-bed
units studied in this work.
Iliuta et al. [58] Jin and Ishida [171] Rydén, et al. [172]
OC properties NiO/Al2O3 (15 Ni wt.%)
Dp = 140E-3 mm
a0=102 m2/g
eb = 0.37
ρb = 1040 kg/m3
NiO/NiAl2O4 (60 Ni wt.%)
Dp = 4.0 mm; Lp = 1.5 mm
a0=10 m2/g*
eb = 0.487
ρb = 995 kg/m3
NiO/MgAl2O4 (60 Ni
wt.%)
Dp = 120E-3 mm
a0=2 m2/g**
ρb = 1000 kg/m3
Lbed [mm] 7.65 250 5.659
Dreactor [mm] 4 16 15
Q (ml/min) 100 (10 % CH4 in Ar) 900 (H2O/CH4 = 2) 60 (25% CH4 in Ar)
U [W/(m2K)] 480 – 880 30 – 110 240 – 800
ρ [kg/m3] 0.35 – 0.46 0.2 – 0.6 0.3 – 0.4

45
μ [1e5×Pa s] 5.8 – 6.2 2.9 – 5.1 5.3 – 6.2
Cpf [J/(kg K)] 20 – 27 20 – 50 20 – 35
λm, λax, λrad
[1E2×W/(m K)]
4.9 – 9.1; 1.0 – 1.1; 63 – 118 4 – 17; 1.5 – 1.8; 52 – 200 5 – 16; 1.0; 63 – 210
Dax, Drad , De
[1E5×m2/s]
1 – 10; 8.0 – 64; 0.028 – 0.13 32 – 63; 15 – 50; 0.58 – 2.4 1.0 – 10; 3 – 20; 0.42 – 3.0
Re 0.42 – 0.52 6 – 10 0.018 – 0.021
Sc 0.17 – 1.8 0.2 – 2.3 0.2 – 3.2
Pea, Per 0.63 – 5.4; 0.38 – 2.4 3 – 5; 8 – 12 0.02 – 0.4; 0.03 – 0.2
Pr [x1E2] 1.6 – 2.7 0.74 – 0.27 0.94 – 2.65
Sh 0.35 – 0.76 1.6 – 3.8 0.41 – 1.0
* Estimated from Table 3.17 from [173]; ** Estimated from [126]
The proposed models are applied to predict experimental results from Iliuta et al. [58], Jin and Ishida
[171], and Rydén et al. [172], whose fixed-bed reactor designs and operating conditions are summarized
in Table 4.4. These experiments utilize methane as the fuel and a Ni-based oxygen carrier supported over
alumina, which is within the scope of the kinetic scheme. In general, the fixed-bed reactors are housed in
an electrical furnace and operated at atmospheric conditions, although Jin and Ishida [171] also conducted
high pressure experiments for Co-Ni/YSZ oxygen carriers. Iliuta et al. [58] and Rydén et al. [172]
operated in chemical-looping combustion conditions at 900°C, while Jin and Ishida [171] operated in
chemical-looping reforming conditions at 600°C.
Table 4.5: Estimated kinetic rate constants for the CLC data of Iliuta et al. [58] at 900°C.
Frequency factors 1D homogeneous model 1D heterogeneous model
k1 1.63E-05 8.16E-06
k2 2.29E-05 2.26E-05
k3 1.42E-05 1.32E-05
k4 2.29E-05 2.13E-05
k5 3.54E-03 5.44E-03
k6 1.64E-05 1.68E-05
k7 5.41E-05 9.37E-05
k8* 5.10E-05 6.07E-05
k9 5.40E-07 5.40E-07
k10 1.35E-04 1.07E-04
*kCH4,8 is estimated in lieu of k8.
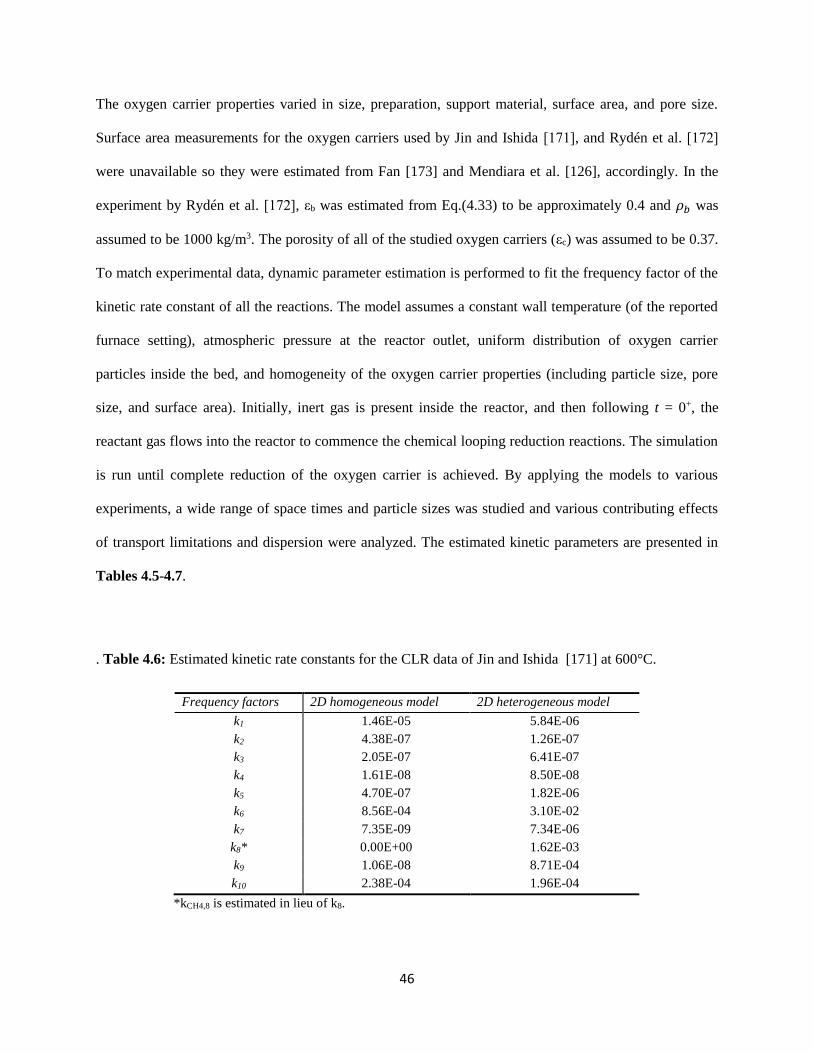
46
The oxygen carrier properties varied in size, preparation, support material, surface area, and pore size.
Surface area measurements for the oxygen carriers used by Jin and Ishida [171], and Rydén et al. [172]
were unavailable so they were estimated from Fan [173] and Mendiara et al. [126], accordingly. In the
experiment by Rydén et al. [172], εb was estimated from Eq.(4.33) to be approximately 0.4 and 𝜌𝑏 was
assumed to be 1000 kg/m3. The porosity of all of the studied oxygen carriers (εc) was assumed to be 0.37.
To match experimental data, dynamic parameter estimation is performed to fit the frequency factor of the
kinetic rate constant of all the reactions. The model assumes a constant wall temperature (of the reported
furnace setting), atmospheric pressure at the reactor outlet, uniform distribution of oxygen carrier
particles inside the bed, and homogeneity of the oxygen carrier properties (including particle size, pore
size, and surface area). Initially, inert gas is present inside the reactor, and then following t = 0+, the
reactant gas flows into the reactor to commence the chemical looping reduction reactions. The simulation
is run until complete reduction of the oxygen carrier is achieved. By applying the models to various
experiments, a wide range of space times and particle sizes was studied and various contributing effects
of transport limitations and dispersion were analyzed. The estimated kinetic parameters are presented in
Tables 4.5-4.7.
. Table 4.6: Estimated kinetic rate constants for the CLR data of Jin and Ishida [171] at 600°C.
Frequency factors 2D homogeneous model 2D heterogeneous model
k1 1.46E-05 5.84E-06
k2 4.38E-07 1.26E-07
k3 2.05E-07 6.41E-07
k4 1.61E-08 8.50E-08
k5 4.70E-07 1.82E-06
k6 8.56E-04 3.10E-02
k7 7.35E-09 7.34E-06
k8* 0.00E+00 1.62E-03
k9 1.06E-08 8.71E-04
k10 2.38E-04 1.96E-04
*kCH4,8 is estimated in lieu of k8.
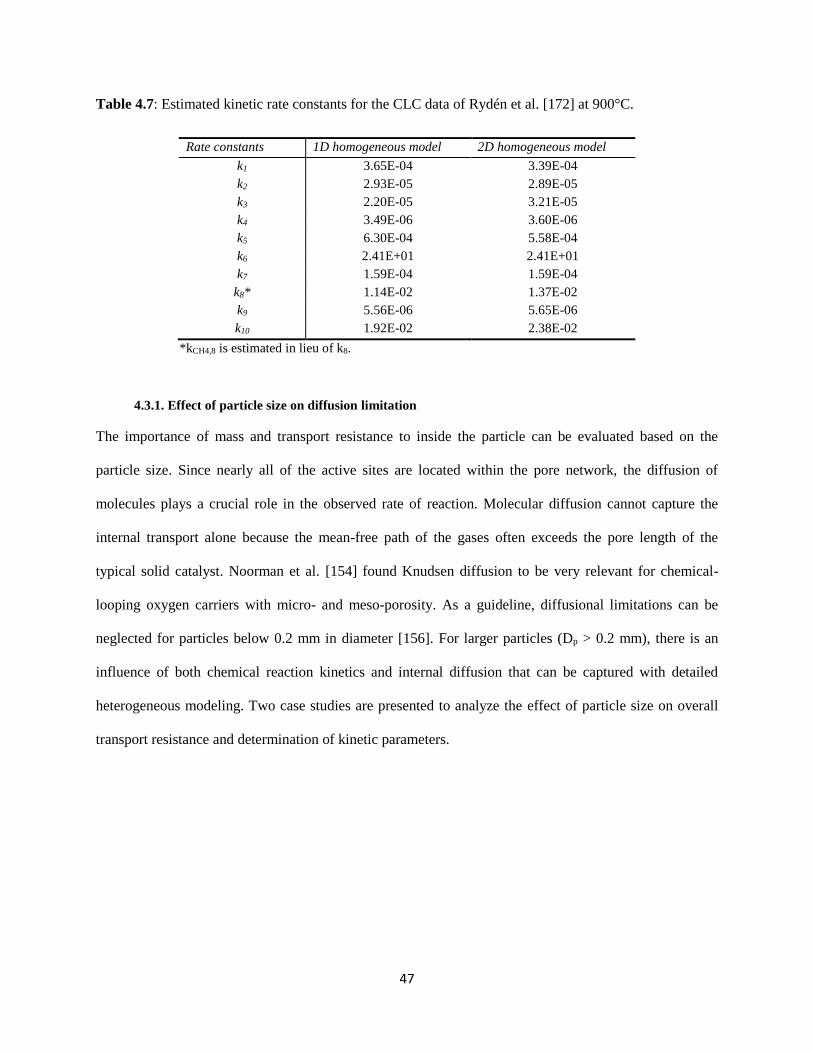
47
Table 4.7: Estimated kinetic rate constants for the CLC data of Rydén et al. [172] at 900°C.
Rate constants 1D homogeneous model 2D homogeneous model
k1 3.65E-04 3.39E-04
k2 2.93E-05 2.89E-05
k3 2.20E-05 3.21E-05
k4 3.49E-06 3.60E-06
k5 6.30E-04 5.58E-04
k6 2.41E+01 2.41E+01
k7 1.59E-04 1.59E-04
k8* 1.14E-02 1.37E-02
k9 5.56E-06 5.65E-06
k10 1.92E-02 2.38E-02
*kCH4,8 is estimated in lieu of k8.
4.3.1. Effect of particle size on diffusion limitation
The importance of mass and transport resistance to inside the particle can be evaluated based on the
particle size. Since nearly all of the active sites are located within the pore network, the diffusion of
molecules plays a crucial role in the observed rate of reaction. Molecular diffusion cannot capture the
internal transport alone because the mean-free path of the gases often exceeds the pore length of the
typical solid catalyst. Noorman et al. [154] found Knudsen diffusion to be very relevant for chemical-
looping oxygen carriers with micro- and meso-porosity. As a guideline, diffusional limitations can be
neglected for particles below 0.2 mm in diameter [156]. For larger particles (Dp > 0.2 mm), there is an
influence of both chemical reaction kinetics and internal diffusion that can be captured with detailed
heterogeneous modeling. Two case studies are presented to analyze the effect of particle size on overall
transport resistance and determination of kinetic parameters.
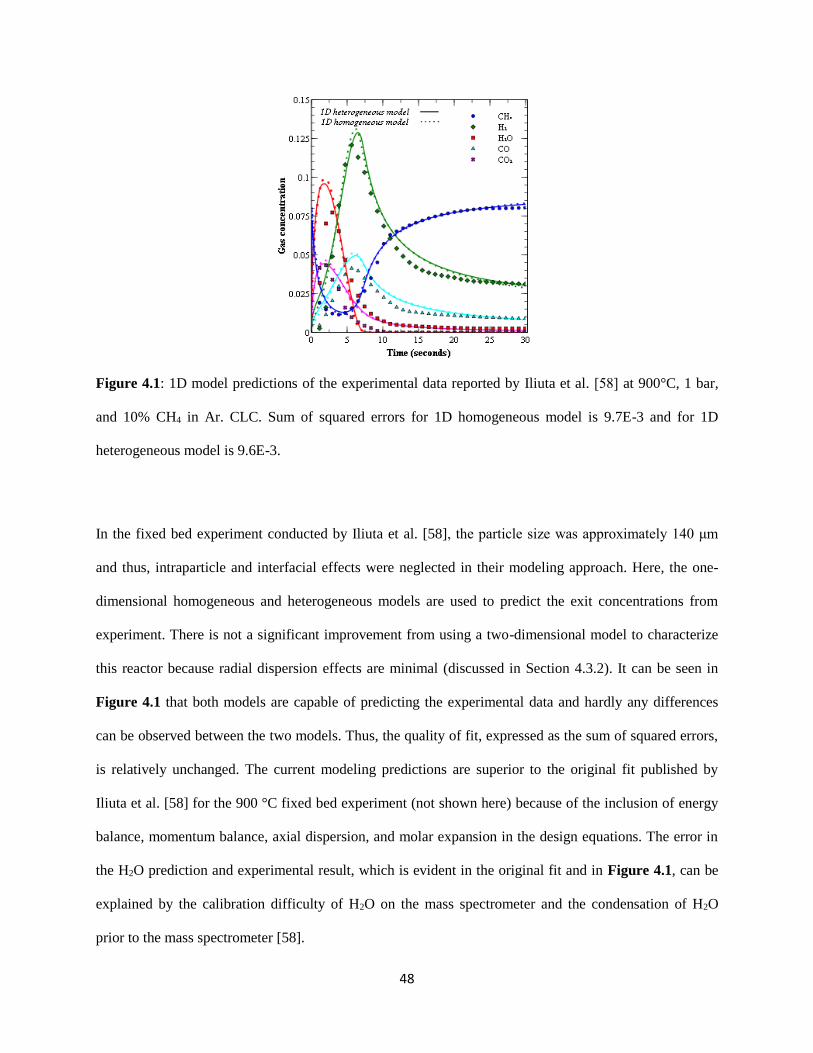
48
Figure 4.1: 1D model predictions of the experimental data reported by Iliuta et al. [58] at 900°C, 1 bar,
and 10% CH4 in Ar. CLC. Sum of squared errors for 1D homogeneous model is 9.7E-3 and for 1D
heterogeneous model is 9.6E-3.
In the fixed bed experiment conducted by Iliuta et al. [58], the particle size was approximately 140 μm
and thus, intraparticle and interfacial effects were neglected in their modeling approach. Here, the one-
dimensional homogeneous and heterogeneous models are used to predict the exit concentrations from
experiment. There is not a significant improvement from using a two-dimensional model to characterize
this reactor because radial dispersion effects are minimal (discussed in Section 4.3.2). It can be seen in
Figure 4.1 that both models are capable of predicting the experimental data and hardly any differences
can be observed between the two models. Thus, the quality of fit, expressed as the sum of squared errors,
is relatively unchanged. The current modeling predictions are superior to the original fit published by
Iliuta et al. [58] for the 900 °C fixed bed experiment (not shown here) because of the inclusion of energy
balance, momentum balance, axial dispersion, and molar expansion in the design equations. The error in
the H2O prediction and experimental result, which is evident in the original fit and in Figure 4.1, can be
explained by the calibration difficulty of H2O on the mass spectrometer and the condensation of H2O
prior to the mass spectrometer [58].
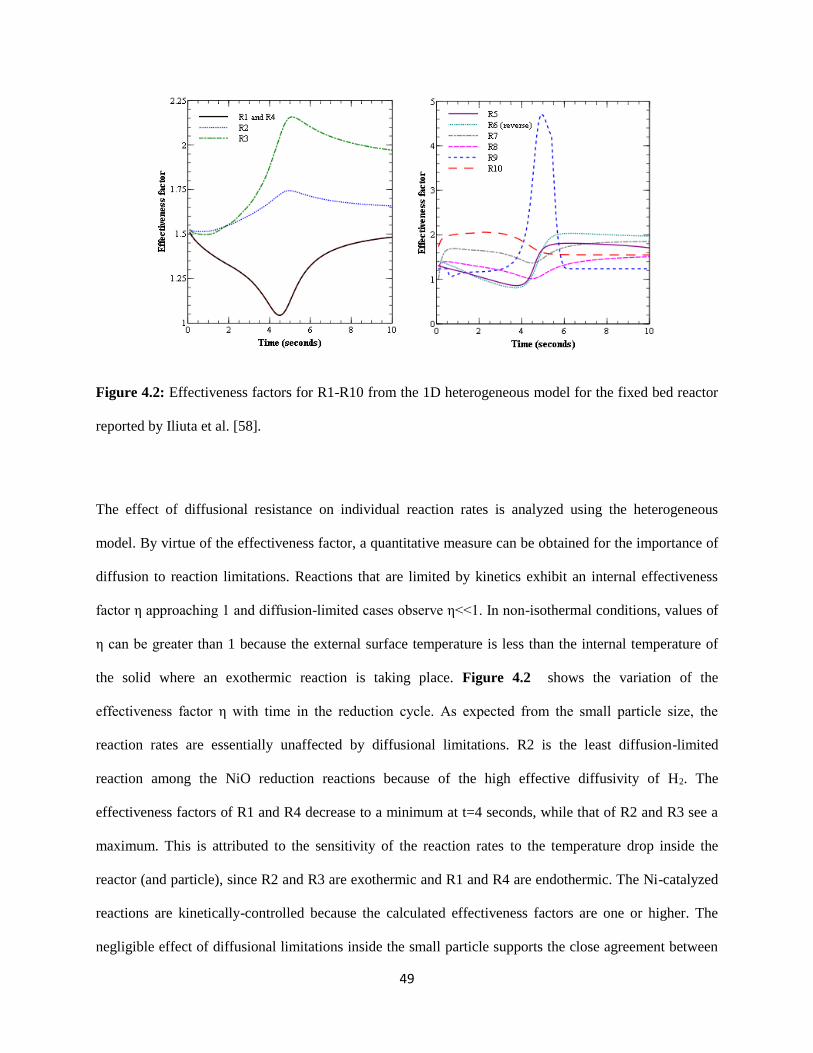
49
Figure 4.2: Effectiveness factors for R1-R10 from the 1D heterogeneous model for the fixed bed reactor
reported by Iliuta et al. [58].
The effect of diffusional resistance on individual reaction rates is analyzed using the heterogeneous
model. By virtue of the effectiveness factor, a quantitative measure can be obtained for the importance of
diffusion to reaction limitations. Reactions that are limited by kinetics exhibit an internal effectiveness
factor η approaching 1 and diffusion-limited cases observe η<<1. In non-isothermal conditions, values of
η can be greater than 1 because the external surface temperature is less than the internal temperature of
the solid where an exothermic reaction is taking place. Figure 4.2 shows the variation of the
effectiveness factor η with time in the reduction cycle. As expected from the small particle size, the
reaction rates are essentially unaffected by diffusional limitations. R2 is the least diffusion-limited
reaction among the NiO reduction reactions because of the high effective diffusivity of H2. The
effectiveness factors of R1 and R4 decrease to a minimum at t=4 seconds, while that of R2 and R3 see a
maximum. This is attributed to the sensitivity of the reaction rates to the temperature drop inside the
reactor (and particle), since R2 and R3 are exothermic and R1 and R4 are endothermic. The Ni-catalyzed
reactions are kinetically-controlled because the calculated effectiveness factors are one or higher. The
negligible effect of diffusional limitations inside the small particle supports the close agreement between
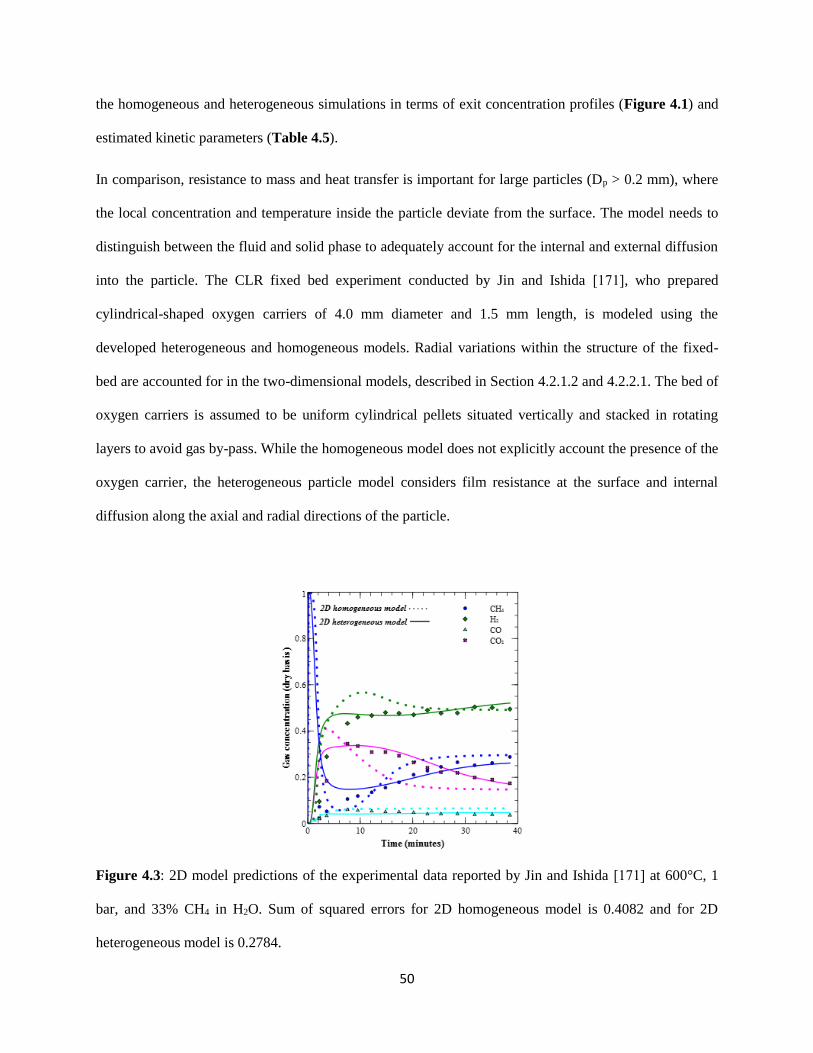
50
the homogeneous and heterogeneous simulations in terms of exit concentration profiles (Figure 4.1) and
estimated kinetic parameters (Table 4.5).
In comparison, resistance to mass and heat transfer is important for large particles (Dp > 0.2 mm), where
the local concentration and temperature inside the particle deviate from the surface. The model needs to
distinguish between the fluid and solid phase to adequately account for the internal and external diffusion
into the particle. The CLR fixed bed experiment conducted by Jin and Ishida [171], who prepared
cylindrical-shaped oxygen carriers of 4.0 mm diameter and 1.5 mm length, is modeled using the
developed heterogeneous and homogeneous models. Radial variations within the structure of the fixed-
bed are accounted for in the two-dimensional models, described in Section 4.2.1.2 and 4.2.2.1. The bed of
oxygen carriers is assumed to be uniform cylindrical pellets situated vertically and stacked in rotating
layers to avoid gas by-pass. While the homogeneous model does not explicitly account the presence of the
oxygen carrier, the heterogeneous particle model considers film resistance at the surface and internal
diffusion along the axial and radial directions of the particle.
Figure 4.3: 2D model predictions of the experimental data reported by Jin and Ishida [171] at 600°C, 1
bar, and 33% CH4 in H2O. Sum of squared errors for 2D homogeneous model is 0.4082 and for 2D
heterogeneous model is 0.2784.

51
Figure 4.3 shows the necessity of accounting for intraparticle and interfacial limitations to achieve
accurate simulations and predictions. Compared to the homogeneous model, the heterogeneous model
achieves over 30% improvement in quality of fit in terms of sum of squared errors, and noticeable
improvements are seen in the CH4, CO2, and H2 profiles. Large model-experimental deviations observed
for the first two minutes can be explained by possible dilution of the exiting gas between the reactor exit
and gas chromatographic-mass spectrometer (GC-MS), which is not included in the fixed-bed reactor
model. The homogeneous model over-predicts the oxygen carrier conversion, which leads to higher-than-
experimental H2 and CO2 concentrations.
Figure 4.4: Effectiveness factor for R1-R10 from the heterogeneous model for the fixed bed reactor
reported by Jin and Ishida [171].
The variation of effectiveness factor for all reactions with reduction time is shown in Figure 4.4. In the
first five minutes, the rates are low due to methane activation, so transport within the particle is not the
limiting factor and high effectiveness factors are observed. Beyond t=5 min, reaction rates are developed
and conversion of the oxygen carrier begins. Effectiveness factors of the NiO reduction reactions remain
relatively at one, indicating a high driving force for NiO reduction. However, diffusional limitations are

52
observed for the catalytic reactions for which effectiveness factors reach values less than one. This is
related to the conversion of the solid NiO material to metallic Ni, which initiates at the external surface of
the particle, and progresses toward the interior of the particle. Catalytic reaction rates are thus affected by
the Ni concentration and tend to be highest on the surface, decreasing progressively along the interior.
Local gas concentrations inside the particle are non-uniform and tend to approach equilibrium values
moving away from the surface. When the reactions are close to equilibrium, the rates are sensitive to
changes in local concentration gradients, and reverse reactions can be become favored. A likely cause for
the rate reversal of R6 and R7 is attributed to the accumulation of combustion and reforming products
(H2, CO, CO2) due to R1-R4 inside the particle that is re-directing the position of equilibrium reactions.
Because of the strong particle effects, estimated rate constants vary significantly depending on the model,
as shown in Table 4.6. The homogeneous model generally estimates lower kinetic rate constants because
the model compensates for internal transport resistance by lowering the rates. This demonstrates that
diffusion resistance cannot be neglected and a heterogeneous model is more realistic at predicting the
experimental results.
4.3.2. Effect of particle dispersion
The presented models are developed to describe cases of non-ideal plug flow, whereby components are
transported by bulk flow and convective diffusion (or dispersion). The CLC experiment performed by
Rydén et al. [172] is representative of a system where there is significant contribution to transport by
dispersion. The low Péclet number and even lower Reynolds number, shown in Table 4.4, point towards
a mixed reactor. The importance of axial dispersion can be analyzed by noticeable differences in
concentration profiles from the dispersive and non-dispersive models (Figure 4.5). Dispersion serves to
broaden concentration and temperature gradients and is important to characterize in the direction of bulk
flow. In addition to its strongly dispersive flow, particle effects are negligible, owing to the small particle
size (Dp = 120 μm) and large pore size. As shown in Figure 4.5, the homogeneous model has been able to
adequately predict the experimental data. The heterogeneous model predictions are also satisfactory, but
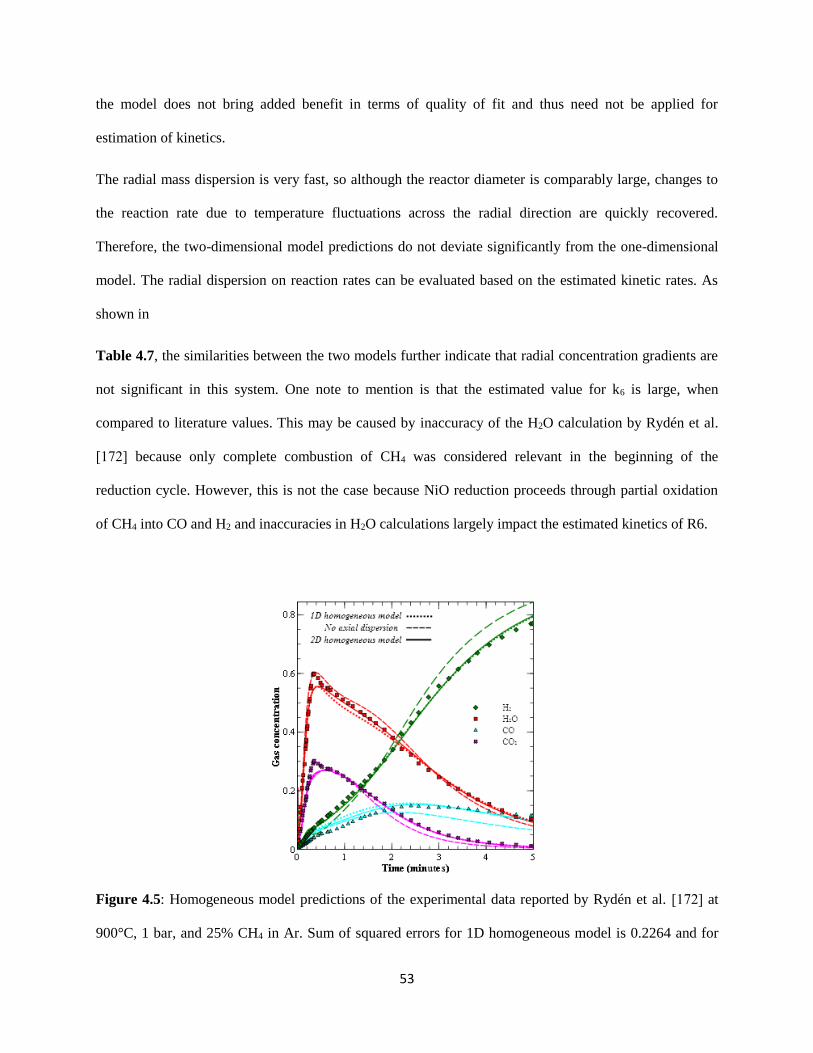
53
the model does not bring added benefit in terms of quality of fit and thus need not be applied for
estimation of kinetics.
The radial mass dispersion is very fast, so although the reactor diameter is comparably large, changes to
the reaction rate due to temperature fluctuations across the radial direction are quickly recovered.
Therefore, the two-dimensional model predictions do not deviate significantly from the one-dimensional
model. The radial dispersion on reaction rates can be evaluated based on the estimated kinetic rates. As
shown in
Table 4.7, the similarities between the two models further indicate that radial concentration gradients are
not significant in this system. One note to mention is that the estimated value for k6 is large, when
compared to literature values. This may be caused by inaccuracy of the H2O calculation by Rydén et al.
[172] because only complete combustion of CH4 was considered relevant in the beginning of the
reduction cycle. However, this is not the case because NiO reduction proceeds through partial oxidation
of CH4 into CO and H2 and inaccuracies in H2O calculations largely impact the estimated kinetics of R6.
Figure 4.5: Homogeneous model predictions of the experimental data reported by Rydén et al. [172] at
900°C, 1 bar, and 25% CH4 in Ar. Sum of squared errors for 1D homogeneous model is 0.2264 and for
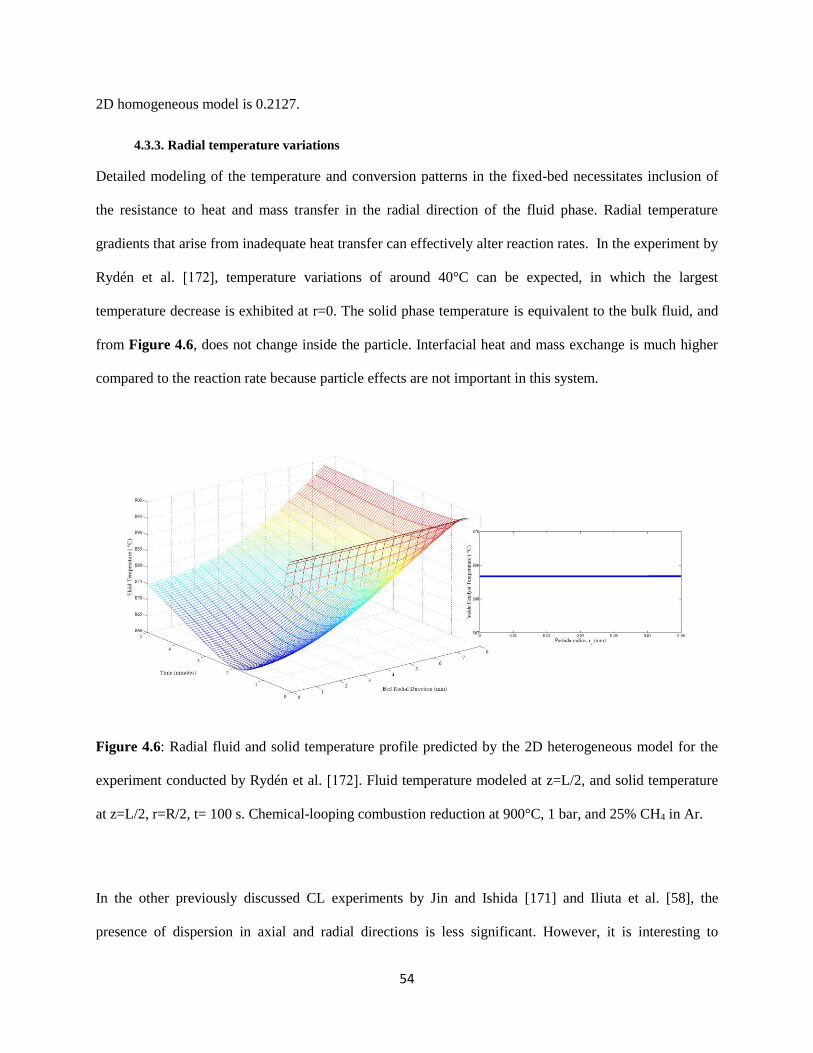
54
2D homogeneous model is 0.2127.
4.3.3. Radial temperature variations
Detailed modeling of the temperature and conversion patterns in the fixed-bed necessitates inclusion of
the resistance to heat and mass transfer in the radial direction of the fluid phase. Radial temperature
gradients that arise from inadequate heat transfer can effectively alter reaction rates. In the experiment by
Rydén et al. [172], temperature variations of around 40°C can be expected, in which the largest
temperature decrease is exhibited at r=0. The solid phase temperature is equivalent to the bulk fluid, and
from Figure 4.6, does not change inside the particle. Interfacial heat and mass exchange is much higher
compared to the reaction rate because particle effects are not important in this system.
Figure 4.6: Radial fluid and solid temperature profile predicted by the 2D heterogeneous model for the
experiment conducted by Rydén et al. [172]. Fluid temperature modeled at z=L/2, and solid temperature
at z=L/2, r=R/2, t= 100 s. Chemical-looping combustion reduction at 900°C, 1 bar, and 25% CH4 in Ar.
In the other previously discussed CL experiments by Jin and Ishida [171] and Iliuta et al. [58], the
presence of dispersion in axial and radial directions is less significant. However, it is interesting to

55
explore if radial gradients occur. Figure 4.7 shows the fluid and solid temperature profile prediction for
the experiment conducted by Iliuta et al. [58]. The temperature drop inside the reactor reaches up to 45°C,
while the radial temperature variation is at most 30°C. The reaction rates are not noticeably affected by
the thermal gradients because of the small temperature fluctuation and small reactor diameter. Therefore,
a one-dimensional model is suited to model this experiment. Figure 4.7 also shows that the temperature
inside the particle does not vary along the radius of the oxygen carrier, due to the high thermal
conductivity of the solid. The difference between the temperature in the solid phase and the bulk fluid
temperature is 3°C, which points to a negligible resistance for external heat transfer.
Figure 4.7: Radial fluid and solid temperature profile predicted by the 2D heterogeneous model for the
experiment conducted by Iliuta et al. [58]. Fluid temperature modeled at z=L/2, and solid temperature at
z=L/2, r=R/2, t=6 s. Chemical-looping combustion reduction at 900°C, 1 bar, and 10% CH4 in Ar.
The radial temperature profile for the CLR experiment conducted by Jin and Ishida [171] is shown in
Figure 4.8 and predicts a temperature drop of 58°C in the reactor and 20°C along the radial direction of
the bed due to insufficient heat transfer rate with the wall. The temperature inside the particle remains
constant; however, the particle temperature can be 15°C colder than the bulk. This temperature difference
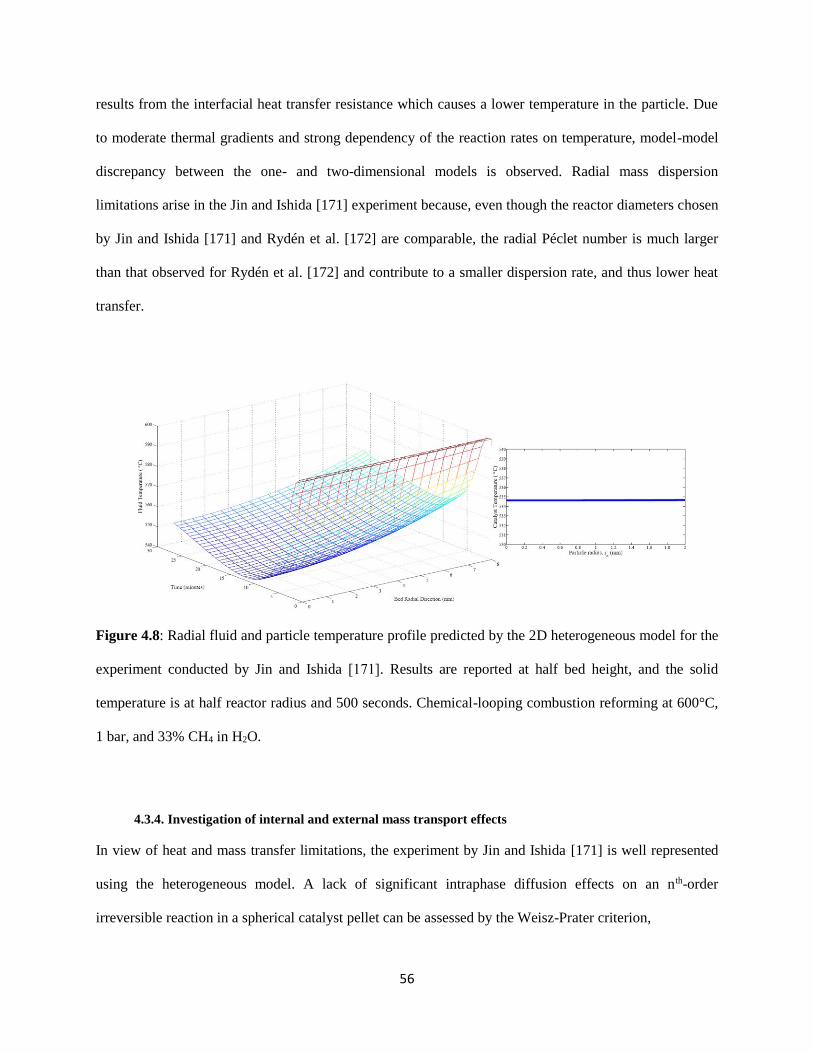
56
results from the interfacial heat transfer resistance which causes a lower temperature in the particle. Due
to moderate thermal gradients and strong dependency of the reaction rates on temperature, model-model
discrepancy between the one- and two-dimensional models is observed. Radial mass dispersion
limitations arise in the Jin and Ishida [171] experiment because, even though the reactor diameters chosen
by Jin and Ishida [171] and Rydén et al. [172] are comparable, the radial Péclet number is much larger
than that observed for Rydén et al. [172] and contribute to a smaller dispersion rate, and thus lower heat
transfer.
Figure 4.8: Radial fluid and particle temperature profile predicted by the 2D heterogeneous model for the
experiment conducted by Jin and Ishida [171]. Results are reported at half bed height, and the solid
temperature is at half reactor radius and 500 seconds. Chemical-looping combustion reforming at 600°C,
1 bar, and 33% CH4 in H2O.
4.3.4. Investigation of internal and external mass transport effects
In view of heat and mass transfer limitations, the experiment by Jin and Ishida [171] is well represented
using the heterogeneous model. A lack of significant intraphase diffusion effects on an nth-order
irreversible reaction in a spherical catalyst pellet can be assessed by the Weisz-Prater criterion,
57
2
,
1,
obs c l
S
e i i
r a
D C n
(4.49)
where the observed rate, obsr , and the concentration of the reactant at the external surface S
iC are used
[162]. This criterion has to be modified for a first-order reversible reaction and cylindrical particle,
2
e,
1,
obs c l
S EQ
i i i
r a
D C C
(4.50)
where 𝐶𝑖𝐸𝑄
is the concentration of the reactant if the reactor were at equilibrium and the coordinates for
S
iC are taken to be at the particle radius and mid-particle length.
The influence of mass transfer through the film surrounding a spherical catalyst particle can be examined
using a similar expression. Satisfaction of the Mears criterion can be used to determine if interphase mass
transfer is not significantly affecting the measured rate,
0.15
,obs b l
f i
r a
k C n
(4.51)
in which case the observed reaction rate deviates less than 5% from the reaction calculated assuming a
homogeneous mixture [169]. The Mears criterion can be modified for a reversible first-order reaction in a
likewise manner to the Weisz-Prater criterion,
0.15.( )
obs b l
EQ
f i i
r a
k C C
(4.52)
Satisfaction of the Mears and Weisz-Prater criteria are determined for each reactant and corresponding
reaction. Specifically, Eqs.(4.49) and (4.51) are used for R1-4 and Eqs.(4.50) and (4.52) for R5-R10 of
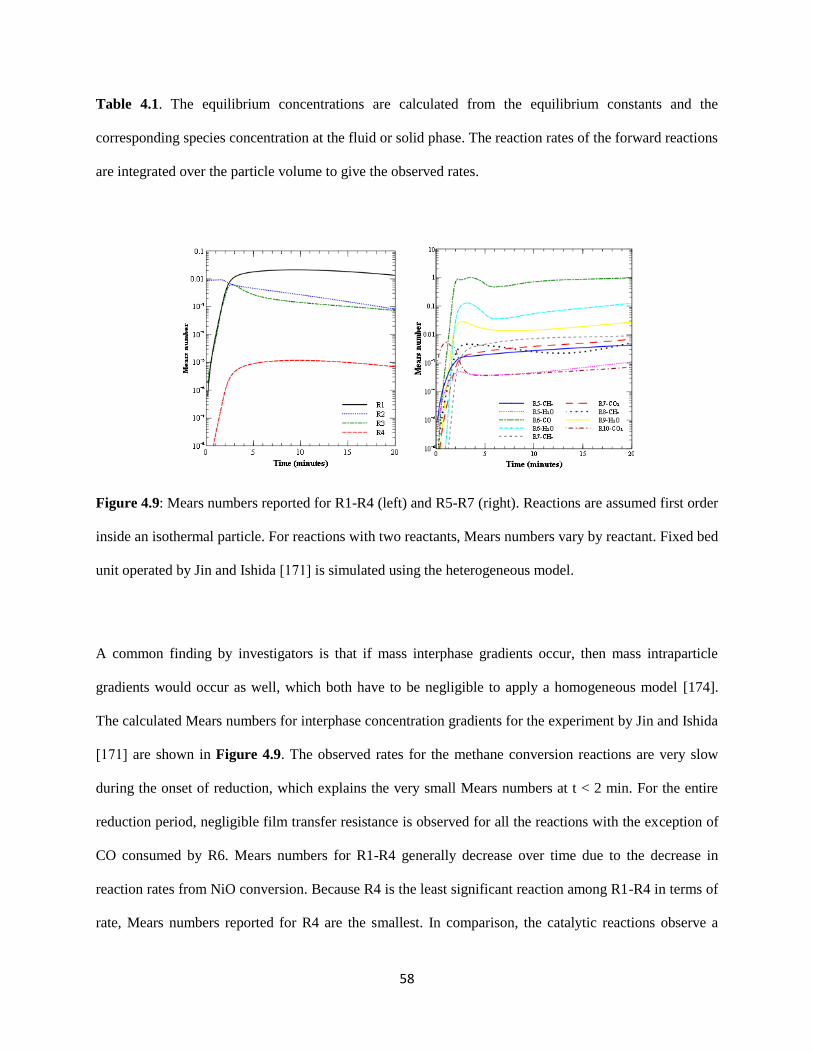
58
Table 4.1. The equilibrium concentrations are calculated from the equilibrium constants and the
corresponding species concentration at the fluid or solid phase. The reaction rates of the forward reactions
are integrated over the particle volume to give the observed rates.
Figure 4.9: Mears numbers reported for R1-R4 (left) and R5-R7 (right). Reactions are assumed first order
inside an isothermal particle. For reactions with two reactants, Mears numbers vary by reactant. Fixed bed
unit operated by Jin and Ishida [171] is simulated using the heterogeneous model.
A common finding by investigators is that if mass interphase gradients occur, then mass intraparticle
gradients would occur as well, which both have to be negligible to apply a homogeneous model [174].
The calculated Mears numbers for interphase concentration gradients for the experiment by Jin and Ishida
[171] are shown in Figure 4.9. The observed rates for the methane conversion reactions are very slow
during the onset of reduction, which explains the very small Mears numbers at t < 2 min. For the entire
reduction period, negligible film transfer resistance is observed for all the reactions with the exception of
CO consumed by R6. Mears numbers for R1-R4 generally decrease over time due to the decrease in
reaction rates from NiO conversion. Because R4 is the least significant reaction among R1-R4 in terms of
rate, Mears numbers reported for R4 are the smallest. In comparison, the catalytic reactions observe a
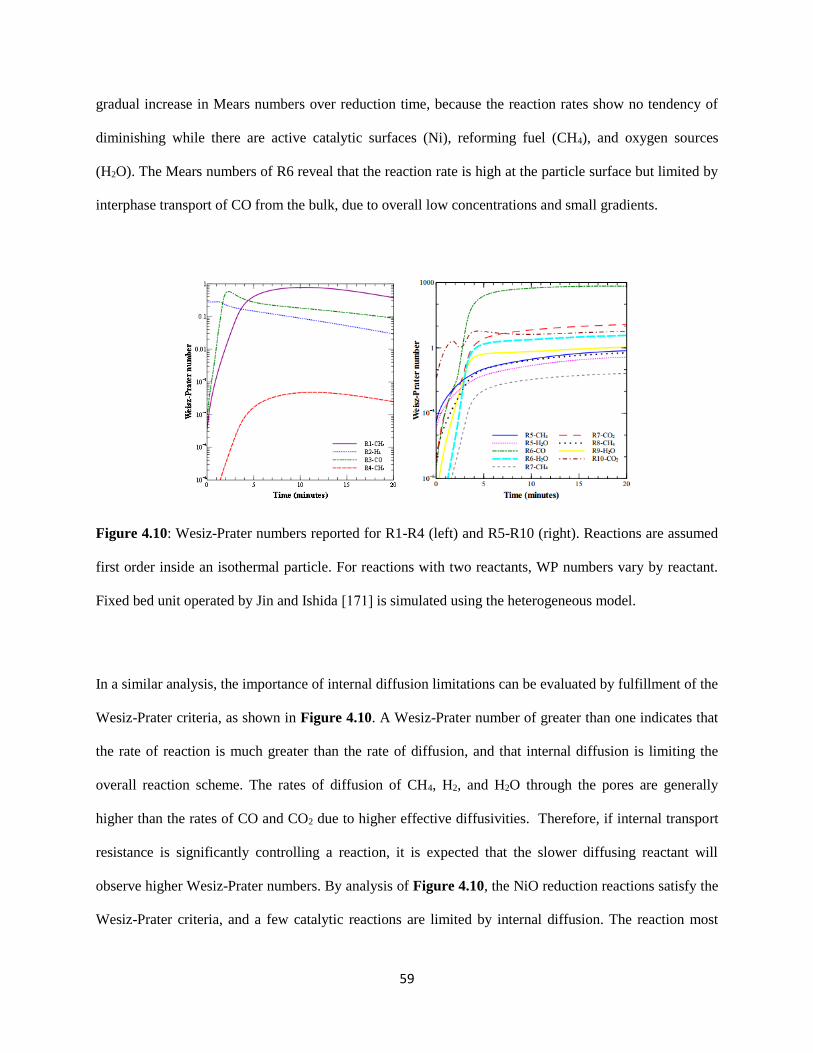
59
gradual increase in Mears numbers over reduction time, because the reaction rates show no tendency of
diminishing while there are active catalytic surfaces (Ni), reforming fuel (CH4), and oxygen sources
(H2O). The Mears numbers of R6 reveal that the reaction rate is high at the particle surface but limited by
interphase transport of CO from the bulk, due to overall low concentrations and small gradients.
Figure 4.10: Wesiz-Prater numbers reported for R1-R4 (left) and R5-R10 (right). Reactions are assumed
first order inside an isothermal particle. For reactions with two reactants, WP numbers vary by reactant.
Fixed bed unit operated by Jin and Ishida [171] is simulated using the heterogeneous model.
In a similar analysis, the importance of internal diffusion limitations can be evaluated by fulfillment of the
Wesiz-Prater criteria, as shown in Figure 4.10. A Wesiz-Prater number of greater than one indicates that
the rate of reaction is much greater than the rate of diffusion, and that internal diffusion is limiting the
overall reaction scheme. The rates of diffusion of CH4, H2, and H2O through the pores are generally
higher than the rates of CO and CO2 due to higher effective diffusivities. Therefore, if internal transport
resistance is significantly controlling a reaction, it is expected that the slower diffusing reactant will
observe higher Wesiz-Prater numbers. By analysis of Figure 4.10, the NiO reduction reactions satisfy the
Wesiz-Prater criteria, and a few catalytic reactions are limited by internal diffusion. The reaction most
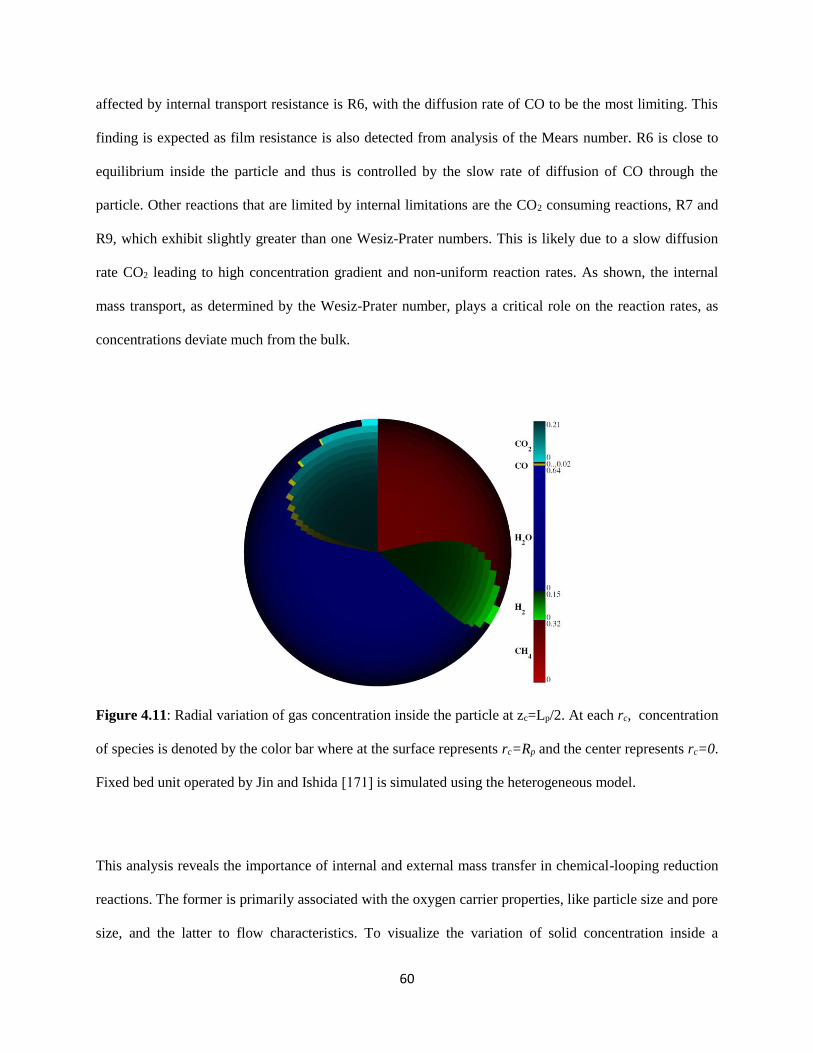
60
affected by internal transport resistance is R6, with the diffusion rate of CO to be the most limiting. This
finding is expected as film resistance is also detected from analysis of the Mears number. R6 is close to
equilibrium inside the particle and thus is controlled by the slow rate of diffusion of CO through the
particle. Other reactions that are limited by internal limitations are the CO2 consuming reactions, R7 and
R9, which exhibit slightly greater than one Wesiz-Prater numbers. This is likely due to a slow diffusion
rate CO2 leading to high concentration gradient and non-uniform reaction rates. As shown, the internal
mass transport, as determined by the Wesiz-Prater number, plays a critical role on the reaction rates, as
concentrations deviate much from the bulk.
Figure 4.11: Radial variation of gas concentration inside the particle at zc=Lp/2. At each rc, concentration
of species is denoted by the color bar where at the surface represents rc=Rp and the center represents rc=0.
Fixed bed unit operated by Jin and Ishida [171] is simulated using the heterogeneous model.
This analysis reveals the importance of internal and external mass transfer in chemical-looping reduction
reactions. The former is primarily associated with the oxygen carrier properties, like particle size and pore
size, and the latter to flow characteristics. To visualize the variation of solid concentration inside a

61
particle at any given time, the mole fraction of the gas is plotted with respect to the radius of the
cylindrical particle (Figure 4.11). The arc length at each radial coordinate represents the fraction of each
individual gas species inside the particle (excluding inert gas). For instance, at positions close to the inlet
of the reactor, the surface concentration is mainly H2O and CH4 because of the direct transfer with the
bulk fluid. Approaching rc0, the conversion of CH4 and H2O and corresponding production of H2, CO,
and CO2 is depicted by the decreasing arc length of CH4 and H2O and increasing arc length for H2, CO
and CO2. As discussed, intraparticle gradients arising large particle dimensions and slow diffusion rates
lead to non-uniform reaction rates and departure from optimum performance. In the next section, the
limits due to internal diffusion are explored through design optimization of the oxygen carrier geometry
to meet chemical-looping standards.
4.3.5. Optimization of particle size
As an effective design tool, heterogeneous modeling can be used to determine an optimal oxygen carrier
particle size for a fixed bed CLR system, in which CH4 conversion and H2 selectivity are maximized. The
dynamic optimization problem is formulated in gPROMS in which keeping the experimental conditions
used by Jin and Ishida [171], the initial particle size is set to the literature value and then bounded by +/-
10 times the initial value. The two-dimensional form of the process model outlined in Section 4.2 is used.
The objective function to be maximized is defined for methane conversion, Eq.(4.53) and overall H2
selectivity, Eq.(4.54), which are investigated separately. The diameter and length of the cylindrical pellet
are treated as time-invariant variables to be optimized.
4 4
4
4
, ,out
,
,
CH in CH
CH
CH in
F FX
F
(4.53)
2
2
4 2
,
,i ,On in
.2
H out
H
CH H
F
FS
F (4.54)
Model results reveal that the reaction rates are highly sensitive to particle diameter, and insensitive to
length. Transport resistance is mainly associated with radial diffusion within the particle due to good

62
mixing in the axial direction. Therefore, a range of particle lengths can be utilized without decreasing the
oxygen carrier performance. A smaller particle diameter should be selected to limit the effect of internal
transport resistance on reaction rates and increase CH4 conversion and H2 selectivity. A decrease from 4.0
mm to 0.8 mm in particle diameter brought significant changes, shown in Figure 4.12. The optimal
particle size produces a 12% increase in CH4 conversion and 7.7% increase in H2 selectivity (
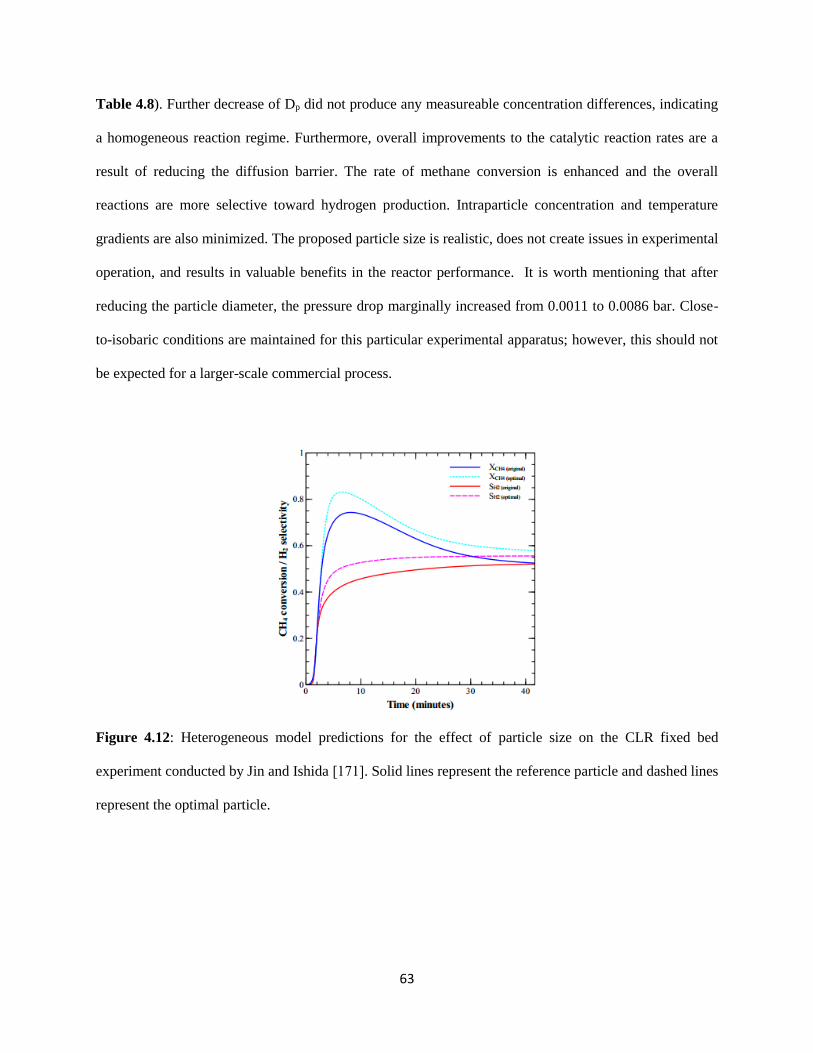
63
Table 4.8). Further decrease of Dp did not produce any measureable concentration differences, indicating
a homogeneous reaction regime. Furthermore, overall improvements to the catalytic reaction rates are a
result of reducing the diffusion barrier. The rate of methane conversion is enhanced and the overall
reactions are more selective toward hydrogen production. Intraparticle concentration and temperature
gradients are also minimized. The proposed particle size is realistic, does not create issues in experimental
operation, and results in valuable benefits in the reactor performance. It is worth mentioning that after
reducing the particle diameter, the pressure drop marginally increased from 0.0011 to 0.0086 bar. Close-
to-isobaric conditions are maintained for this particular experimental apparatus; however, this should not
be expected for a larger-scale commercial process.
Figure 4.12: Heterogeneous model predictions for the effect of particle size on the CLR fixed bed
experiment conducted by Jin and Ishida [171]. Solid lines represent the reference particle and dashed lines
represent the optimal particle.
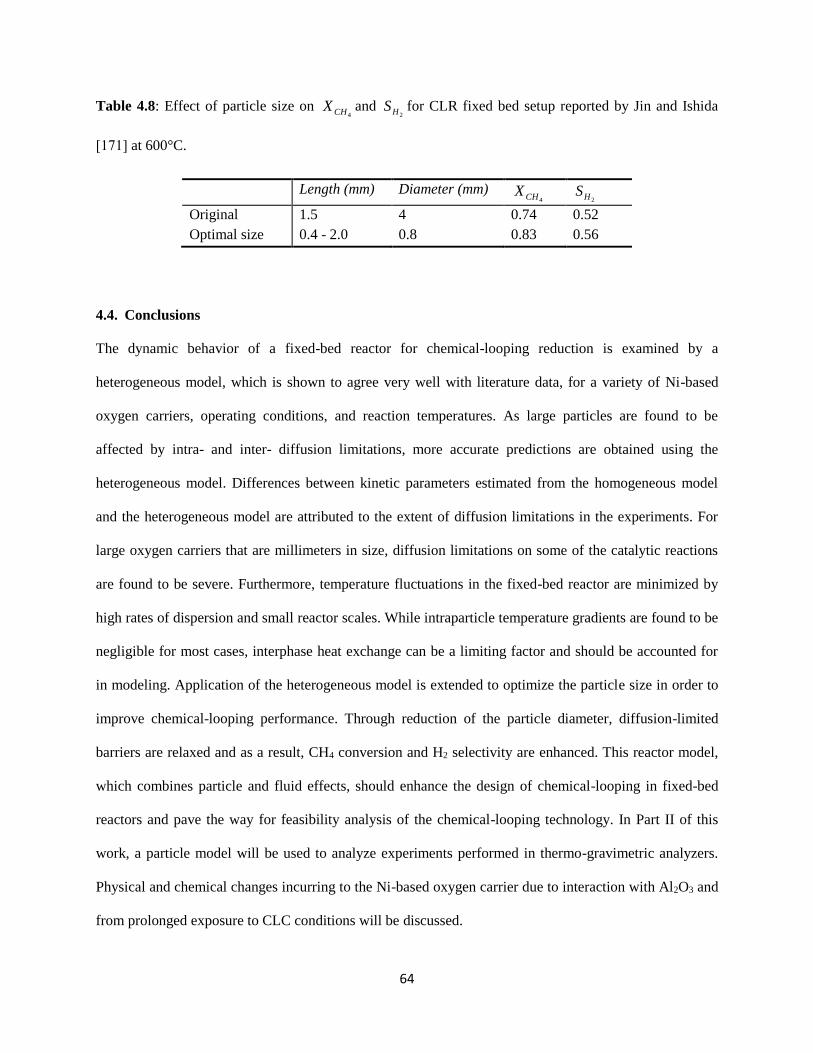
64
Table 4.8: Effect of particle size on 4CHX and
2HS for CLR fixed bed setup reported by Jin and Ishida
[171] at 600°C.
Length (mm) Diameter (mm) 4CHX
2HS
Original 1.5 4 0.74 0.52
Optimal size 0.4 - 2.0 0.8 0.83 0.56
4.4. Conclusions
The dynamic behavior of a fixed-bed reactor for chemical-looping reduction is examined by a
heterogeneous model, which is shown to agree very well with literature data, for a variety of Ni-based
oxygen carriers, operating conditions, and reaction temperatures. As large particles are found to be
affected by intra- and inter- diffusion limitations, more accurate predictions are obtained using the
heterogeneous model. Differences between kinetic parameters estimated from the homogeneous model
and the heterogeneous model are attributed to the extent of diffusion limitations in the experiments. For
large oxygen carriers that are millimeters in size, diffusion limitations on some of the catalytic reactions
are found to be severe. Furthermore, temperature fluctuations in the fixed-bed reactor are minimized by
high rates of dispersion and small reactor scales. While intraparticle temperature gradients are found to be
negligible for most cases, interphase heat exchange can be a limiting factor and should be accounted for
in modeling. Application of the heterogeneous model is extended to optimize the particle size in order to
improve chemical-looping performance. Through reduction of the particle diameter, diffusion-limited
barriers are relaxed and as a result, CH4 conversion and H2 selectivity are enhanced. This reactor model,
which combines particle and fluid effects, should enhance the design of chemical-looping in fixed-bed
reactors and pave the way for feasibility analysis of the chemical-looping technology. In Part II of this
work, a particle model will be used to analyze experiments performed in thermo-gravimetric analyzers.
Physical and chemical changes incurring to the Ni-based oxygen carrier due to interaction with Al2O3 and
from prolonged exposure to CLC conditions will be discussed.

65
Chapter 5 HETEROGENEOUS MODELING OF CHEMICAL-LOOPING COMBUSTION: PART 2:
PARTICLE MODEL
The primary objective of this chapter is to showcase the ability of a particle model to predict the influence
of varying particle properties on the reactivity of Ni-based oxygen carriers undergoing chemical-looping
combustion (CLC). The particle model, which considers the effects of internal, interparticle and external
diffusion limitations and reaction kinetics for NiO/Ni systems, is applied to reactivity investigations
performed in the TGA. The reliability of the model to predict the observed reactivity responses to
variations in particle size, microstructure, and chemical deactivation is analyzed in this work. Simulation
results for a range of particle sizes reveal that the impact of intraparticle diffusion on reaction rates is
accurately modeled. Furthermore, the effect of gradual changes in the particle microstructure due to redox
cycling is analyzed through a sensitivity analysis of these physical and chemical changes. The framework
of this analysis assumes that by incorporating these measured changes, it is possible to model the CLC
performance over the lifespan of the oxygen carrier. Experimental data from the literature and performed
in this work are utilized to demonstrate how the model can be utilized to gain a better understanding of
the experiments. Simultaneously, the model can be implemented to be predictive of the changes in
reactivity and selectivity as a function of time by manipulating the particle properties in accordance with
experimental data.
5.1. Introduction
Research in CL is very active and largely focused on the development of suitable oxygen carriers,
characterized by high rates of oxidation and reduction, high oxygen carrying capacity, high melting
temperature, low tendency for attrition and fragmentation, low toxicity, and low cost [81]. Generally,
oxygen carriers are formulated by depositing the active metal (Co, Cu, Fe, Ni, and Mn,) over an inert
support, such as Al2O3, SiO2, TiO2, yttrium-stabilized zirconia (YSZ), and bentonite [57,175]. Dispersing
the active metals offers advantages, such as improved particle stability, durability, fluidizability, and
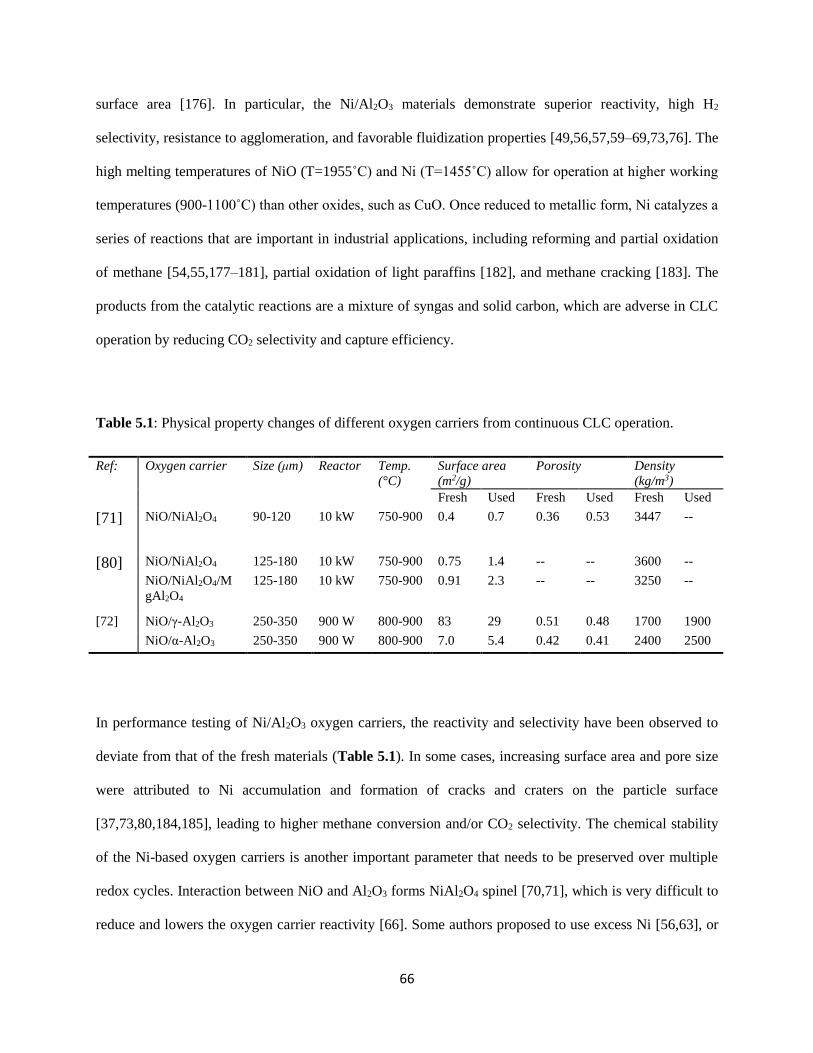
66
surface area [176]. In particular, the Ni/Al2O3 materials demonstrate superior reactivity, high H2
selectivity, resistance to agglomeration, and favorable fluidization properties [49,56,57,59–69,73,76]. The
high melting temperatures of NiO (T=1955˚C) and Ni (T=1455˚C) allow for operation at higher working
temperatures (900-1100˚C) than other oxides, such as CuO. Once reduced to metallic form, Ni catalyzes a
series of reactions that are important in industrial applications, including reforming and partial oxidation
of methane [54,55,177–181], partial oxidation of light paraffins [182], and methane cracking [183]. The
products from the catalytic reactions are a mixture of syngas and solid carbon, which are adverse in CLC
operation by reducing CO2 selectivity and capture efficiency.
Table 5.1: Physical property changes of different oxygen carriers from continuous CLC operation.
Ref: Oxygen carrier Size (μm) Reactor Temp.
(°C)
Surface area
(m2/g)
Porosity Density
(kg/m3)
Fresh Used Fresh Used Fresh Used
[71] NiO/NiAl2O4 90-120 10 kW 750-900 0.4 0.7 0.36 0.53 3447 --
[80]
NiO/NiAl2O4 125-180 10 kW 750-900 0.75 1.4 -- -- 3600 --
NiO/NiAl2O4/M
gAl2O4
125-180 10 kW 750-900 0.91 2.3 -- -- 3250 --
[72] NiO/γ-Al2O3 250-350 900 W 800-900 83 29 0.51 0.48 1700 1900
NiO/α-Al2O3 250-350 900 W 800-900 7.0 5.4 0.42 0.41 2400 2500
In performance testing of Ni/Al2O3 oxygen carriers, the reactivity and selectivity have been observed to
deviate from that of the fresh materials (Table 5.1). In some cases, increasing surface area and pore size
were attributed to Ni accumulation and formation of cracks and craters on the particle surface
[37,73,80,184,185], leading to higher methane conversion and/or CO2 selectivity. The chemical stability
of the Ni-based oxygen carriers is another important parameter that needs to be preserved over multiple
redox cycles. Interaction between NiO and Al2O3 forms NiAl2O4 spinel [70,71], which is very difficult to
reduce and lowers the oxygen carrier reactivity [66]. Some authors proposed to use excess Ni [56,63], or
67
use NiAl2O4 as the support [60,62,65,66,73–76]. However, these approaches are not practical because Ni
is highly toxic and expensive. Chemical additives, such as MgO and CaO, and thermal treatment of the
Al2O3 have been shown to reduce the NiO-Al2O3 interaction [70,72,77–80,114,186,187].
In summary, the physical and chemical properties of Ni-based oxygen carriers are liable to change
depending on the reactor and operating conditions. In this context, particle modeling can provide valuable
insights in the investigations of oxygen carrier reactivity conducted in thermogravimetric analysis (TGA).
The rate of oxygen carrier conversion is a function of the reaction scheme and the transport resistances
around and within an oxygen carrier particle. A good understanding of these phenomena at the particle-
scale is necessary for the adequate development of reactor models. The most frequently used kinetic
models for CLC are the changing grain size model, shrinking core model, volumetric model, and
nucleation and nuclei growth models [23]. García-Labiano et al. [156] applied the changing grain size
model to simulate the mass and heat transfer resistances of Cu, Co, Fe, Mn, and Ni oxygen carriers. They
observed that oxygen carriers can be considered isothermal and the intraparticle heat balance can be
ignored to model the reactions. Noorman et al. [154] investigated the effect of diffusion limitations for a
Cu-based oxygen carrier undergoing reduction by H2 and CH4. From their analysis, Knudsen diffusion is
significantly limiting the reduction rate for particles larger than 1.0 mm in diameter.
In this work, the reactivity of Ni-based oxygen carriers measured from TGA is interpreted with a model to
evaluate the effects of physical and chemical properties on observed rates. Unlike the aforementioned
modeling studies, this work is experiment-driven and the results provide practical information about the
underlying mechanisms affecting particle behavior. Section 5.3.1 introduces the experimental studies and
the modeling approaches taken to simulate TGA results. Sections 5.3.2-5.3.4 use literature data to
investigate the effects of particle size, number of redox cycles, and NiO-Al2O3 interaction in Ni-based
systems. In Section 5.3.5, in-house TGA experiments with a Ni/Al2O3-SiO2 oxygen carrier are studied.
The variation of the reduction rates over redox cycles is presented, complemented by SEM, BET, and
XRD characterization of the fresh and used particles. Modeling analysis is performed for every reduction
68
cycle, by taking into account the progressive physical and chemical changes accrued over each redox
cycle.
5.2. Model description
In a typical TGA experiment, the sample is placed inside a crucible and a reducing agent flows across the
mouth of the crucible at a fixed concentration and temperature (Figure 5.1). The fundamental mass
transfer effects limiting the chemical reactions of TGA experiments can be categorized as (1) the
transport of gas from the bulk TGA phase to the upper surface of the sample (external diffusion), (2) the
diffusion of gas through the bed of particles (interparticle diffusion), and (3) the diffusion of gas within
the pores of the particles (intraparticle diffusion) [188]. To reduce the extent of external diffusion
limitations, a short and wide crucible can be used to limit the stagnant gas volume above the bed. High
gas flows are commonly used to reduce external mass transfer resistance [114,189–191]. However,
Gómez-Barea et al. [192] stated that this method cannot eliminate all external diffusion effects because if
the sample lies partially below the crucible mouth, a stagnant gas region may still exist even at high gas
flow rates. Secondly, interparticle mass transfer is related to the diffusion through the macrovoids
surrounding the particles and is limiting for large bed heights. Lastly, interparticle mass transport effects
can be prominent for large particles [193]. At the high working temperatures of CLC, the reaction rates
are enhanced by fast kinetics but may be limited by the rate of gas diffusion through the porous particle.
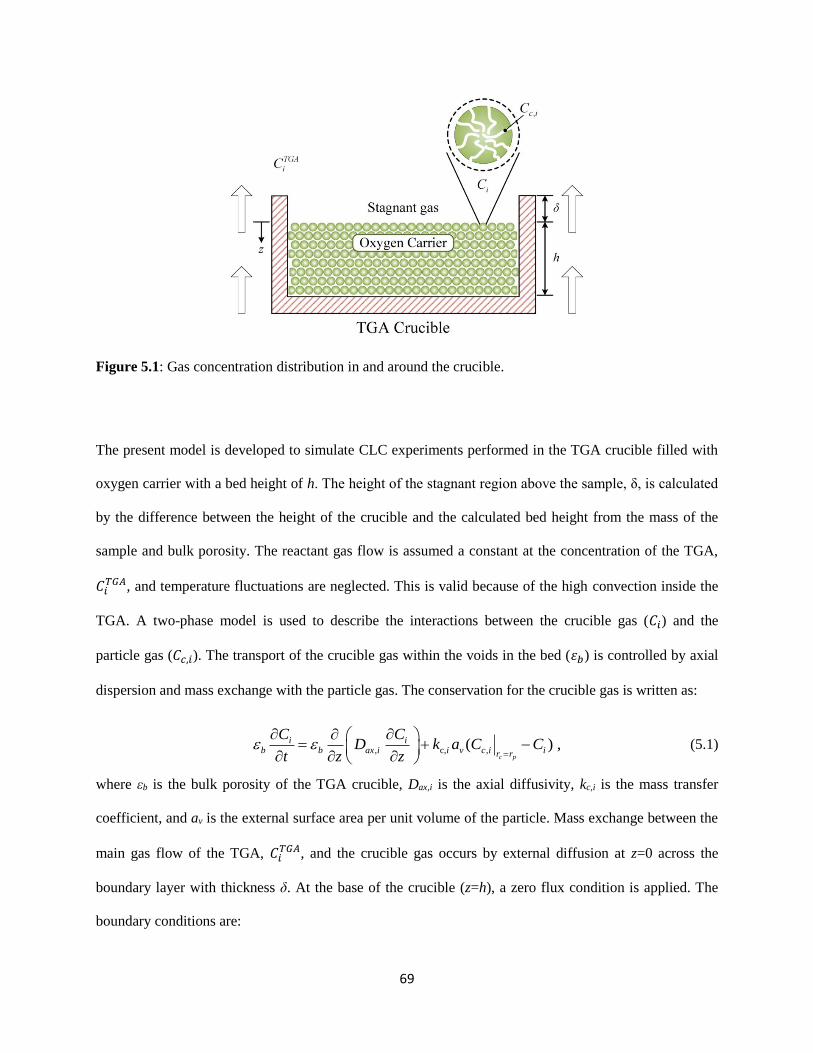
69
Figure 5.1: Gas concentration distribution in and around the crucible.
The present model is developed to simulate CLC experiments performed in the TGA crucible filled with
oxygen carrier with a bed height of h. The height of the stagnant region above the sample, δ, is calculated
by the difference between the height of the crucible and the calculated bed height from the mass of the
sample and bulk porosity. The reactant gas flow is assumed a constant at the concentration of the TGA,
𝐶𝑖𝑇𝐺𝐴, and temperature fluctuations are neglected. This is valid because of the high convection inside the
TGA. A two-phase model is used to describe the interactions between the crucible gas (𝐶𝑖) and the
particle gas (𝐶𝑐,𝑖). The transport of the crucible gas within the voids in the bed (𝜀𝑏) is controlled by axial
dispersion and mass exchange with the particle gas. The conservation for the crucible gas is written as:
, c, ,( ,)
c p
i iv r rb b ax i i c i i
C CD k a C C
t z z
(5.1)
where εb is the bulk porosity of the TGA crucible, Dax,i is the axial diffusivity, kc,i is the mass transfer
coefficient, and av is the external surface area per unit volume of the particle. Mass exchange between the
main gas flow of the TGA, 𝐶𝑖𝑇𝐺𝐴, and the crucible gas occurs by external diffusion at z=0 across the
boundary layer with thickness δ. At the base of the crucible (z=h), a zero flux condition is applied. The
boundary conditions are:
70
,
,
0
0( ),TGA
i
m iib a i zx i
z
DC
CD C
z
(5.2)
0.i
z h
C
z
(5.3)
The oxygen carrier is modeled as a homogeneous mixture of the solid phase with porosity c filled by the
gas phase. Structural changes in the particle during the course of reduction are not considered (unless
otherwise mentioned). Moreover, the particle is modeled as isothermal, which has been demonstrated to
be valid due to the high conductivity of the solid particle [193]. Viscous flow inside the particle is
negligible and isobaric conditions are assumed. Mass transfer through the particle occurs by diffusion and
convection. The diffusion flux is modeled by the Wilke-Bosanquet equation, which considers the
contribution of molecular and Knudsen diffusion. Convective transport is induced by the non-equimolar
stoichiometry of reaction which results in a net flow of gas molecules during chemical-looping reduction.
The contribution of intraparticle convective transport is relevant for CH4-NiO systems in which there is
an increase in the number of gas molecules. The mass balance for the gaseous component inside a
spherical oxygen carrier:
, 2 2
, , ,2 2
1 1 .
c i
c c c i c e i c i s
c c c c c
c jv RC
r C r D Ct r r r r r
(5.4)
The intraparticle velocity vc can be determined from the continuity equation [194],
1
1
,
.
j
j
c
c
i
i
c
vR
Cr
(5.5)
The boundary conditions at the particle–bulk interface (rc=Rp) are:
,
, , , ,( ) .c p c p
c p
c i
e i c c i c i c i ir R r R
r R
CD v C k C C
r
(5.6)
At the particle center (rc=0), the fluxes are zero:
71
0
0
,0.
c
c
c i
c
cr
r
Cv
r
(5.7)
Convection inside the particle can be neglected for H2-NiO systems because there is no molar expansion
and hence the mass balance equations can be formulated based solely on the diffusive flux:
, 2
, ,2
1 ,
c i
c c e i c i s j
c c c
Cr D C
t r r rR
(5.8)
with the following boundary conditions:
,
, c, ,( ),
c
c p
p
c i
e i i c i i
cr
R
R
r
CD k C C
r
(5.9)
0
,0.
c
c i
c r
C
r
(5.10)
Recently, the kinetics of supported Ni-based oxygen carriers undergoing CLC with CH4 as the reducing
gas has been investigated in fixed bed and fluidized bed reactors [58,119]. The reaction scheme considers
the NiO reduction by CH4, H2, and CO and a series of Ni-catalytic reactions following our previous work
[119]. The conversion rate for NiO is expressed in terms of the sum of the NiO reduction reaction rates,
∑ 𝑅𝑗:
/ / ,NiO j NiOdX dt R C (5.11)
The integral of Eq.(5.11) over the particle volume and bed height is taken to be the solid conversion
inside the TGA at any instance of time. A complete description of the mass transfer correlations, diffusion
coefficients, and relevant physical properties used here are presented in the Appendix.
5.3. Results and discussion
5.3.1. Introduction to the experiments studied
The model is applied to published TGA experimental data utilizing Ni-based oxygen carriers, analyzing
the effects of particle size (Section 5.3.2), microstructural changes (Section 5.3.3), and NiO-support

72
interaction (Section 5.3.4) on the rate of reduction. In Sections 5.3.1-5.3.2, the experimental data
published by Ishida et al. [47], are modeled. In their work, five types of Ni/YSZ oxygen carriers were
prepared using different methods and their reactivity towards H2 reduction at 600°C was investigated in
TGA. To be consistent with Ishida et al. [47] in notation, the oxygen carriers are referred to as ‘A’-‘D’.
The reactivity of ‘A’-‘D’ oxygen carriers was affected by the preparation procedure, thus different sets of
kinetics and physical properties are used in this work to characterize the behaviors of each oxygen carrier.
Their so-called ‘D’ particles is discussed and modeled in Section 5.3.2, with the objective of validating
the mass diffusion model over a range of particle sizes. Furthermore, the ‘E’ particles were subject to
performance testing and the model is used to correlate the variations in observed reactivity to possible
changes occurring within the particle microstructure in Section 5.3.3.
Ishida et al. [47] minimized the effects of external diffusional limitations in their TGA experiments
through the use of a pan crucible (5 mm-diameter) and large oxygen carriers (dp=1.0-3.2 mm). By
reducing the height of the crucible, the stagnant volume above the bed is reduced, which enhances the
mass transport across the boundary layer. Interparticle diffusion is also fast because of the large voids that
exist in between the large particles. Ishida et al. (1996) [47] observed a linear relationship between
conversion and reducing gas concentration, which confirmed that the reduction rate was kinetically
controlled (reaction rate is first order with respect to reducing gas according to Zhou et al. [119] and Iliuta
et al. [58]). Thus in the absence of external and interparticle diffusion limitations, the particle model, as
written in Eqs.(5.4)-(5.6), is sufficient to model their TGA experiments.
In Sections 5.3.4-5.3.5, the effect of NiO-support interaction on reactivity is studied for two Ni/Al2O3
systems. The model is extended to take into account NiAl2O4 which is simultaneously reduced with NiO
in the presence of reducing gases. The kinetic model is validated against the TGA data published by de
Diego et al. [72], utilizing α and γ-Al2O3 supports. Furthermore, the predictability of the model to capture
the changes in reactivity is explored in Section 5.3.4 as a function of the reported differences in particle
properties. Diffusion limitations around the crucible can be neglected in their experiments because of the
73
wire mesh sample holder (14 mm in diameter, 8 mm in height) and the high gas flow rate (25 nL/h).
Dueso et al. [114] analyzed the effect of flow rate in the same TGA and found that when the flow was 20
nL/h or higher, there was no effect on the reaction rate. Furthermore the reactivity was unaffected by
variations in the sample weight (30-70 mg) [114]. Thus, only particle equations are needed to model the
TGA experiments by de Diego et al. [72].
In Section 5.3.5, an in-depth analysis is performed using a Ni/Al2O3-SiO2 oxygen carrier over multiple
redox cycles in the TGA. Fresh and used particles after each cycle are examined with scanning electron
microscopy (SEM), powder X-ray diffraction (XRD), and Brunauer-Emmett-Teller (BET) surface area
analysis by means of N2 physisorption. With empirical evidence of the largest changes to the particle
microstructure, the model is applied to predict the observed conversion profiles for each cycle spent in the
TGA. Results from preliminary experiments using the fresh carriers revealed that the reactivity is affected
by changes in the gas flow rate and initial sample weights. Due to operational constraints of our TGA, it
is not possible to further increase the gas flow rate until no diffusion effects are observed. Thus, the
complete model is used in order to take into account the resistances due to external, interparticle, and
internal diffusion. The novelty of this work lies in the combination of experimental findings with
modeling to develop a comprehensive understanding for the causes of reactivity changes in chemical-
looping materials.
5.3.2. Effect of particle size
The effect of particle size was studied with TGA by Ishida et al. [47] under H2 reduction at 600 °C using
their ‘D’ Ni/YSZ oxygen carriers ranging in diameter from 1.0 to 3.2 mm. Ishida et al. [47] observed
significant particle size effects and found that the NiO conversion rate was inversely proportional to the
power of 1.1 of the particle diameter. The reaction rate is limited by the internal transport resistance of the
gas phase to diffuse through the porous particle. A higher rate of reaction to internal diffusion leads to
intraparticle variations in the H2 partial pressure, which makes only a fraction of the surface area available
to chemical reactions at any given time. The extent of diffusion limitations is more pronounced for larger
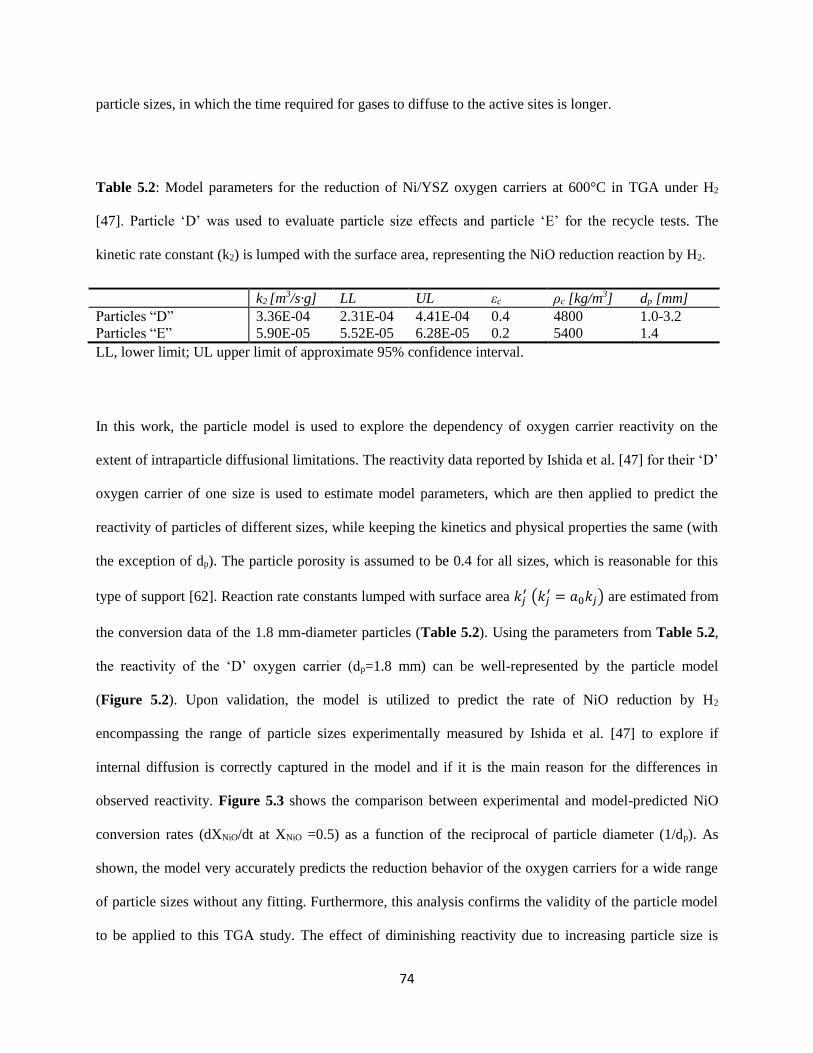
74
particle sizes, in which the time required for gases to diffuse to the active sites is longer.
Table 5.2: Model parameters for the reduction of Ni/YSZ oxygen carriers at 600°C in TGA under H2
[47]. Particle ‘D’ was used to evaluate particle size effects and particle ‘E’ for the recycle tests. The
kinetic rate constant (k2) is lumped with the surface area, representing the NiO reduction reaction by H2.
k2 [m3/s·g] LL UL εc ρc [kg/m3] dp [mm]
Particles “D” 3.36E-04 2.31E-04 4.41E-04 0.4 4800 1.0-3.2
Particles “E” 5.90E-05 5.52E-05 6.28E-05 0.2 5400 1.4
LL, lower limit; UL upper limit of approximate 95% confidence interval.
In this work, the particle model is used to explore the dependency of oxygen carrier reactivity on the
extent of intraparticle diffusional limitations. The reactivity data reported by Ishida et al. [47] for their ‘D’
oxygen carrier of one size is used to estimate model parameters, which are then applied to predict the
reactivity of particles of different sizes, while keeping the kinetics and physical properties the same (with
the exception of dp). The particle porosity is assumed to be 0.4 for all sizes, which is reasonable for this
type of support [62]. Reaction rate constants lumped with surface area 𝑘𝑗′ (𝑘𝑗
′ = 𝑎0𝑘𝑗) are estimated from
the conversion data of the 1.8 mm-diameter particles (Table 5.2). Using the parameters from Table 5.2,
the reactivity of the ‘D’ oxygen carrier (dp=1.8 mm) can be well-represented by the particle model
(Figure 5.2). Upon validation, the model is utilized to predict the rate of NiO reduction by H2
encompassing the range of particle sizes experimentally measured by Ishida et al. [47] to explore if
internal diffusion is correctly captured in the model and if it is the main reason for the differences in
observed reactivity. Figure 5.3 shows the comparison between experimental and model-predicted NiO
conversion rates (dXNiO/dt at XNiO =0.5) as a function of the reciprocal of particle diameter (1/dp). As
shown, the model very accurately predicts the reduction behavior of the oxygen carriers for a wide range
of particle sizes without any fitting. Furthermore, this analysis confirms the validity of the particle model
to be applied to this TGA study. The effect of diminishing reactivity due to increasing particle size is
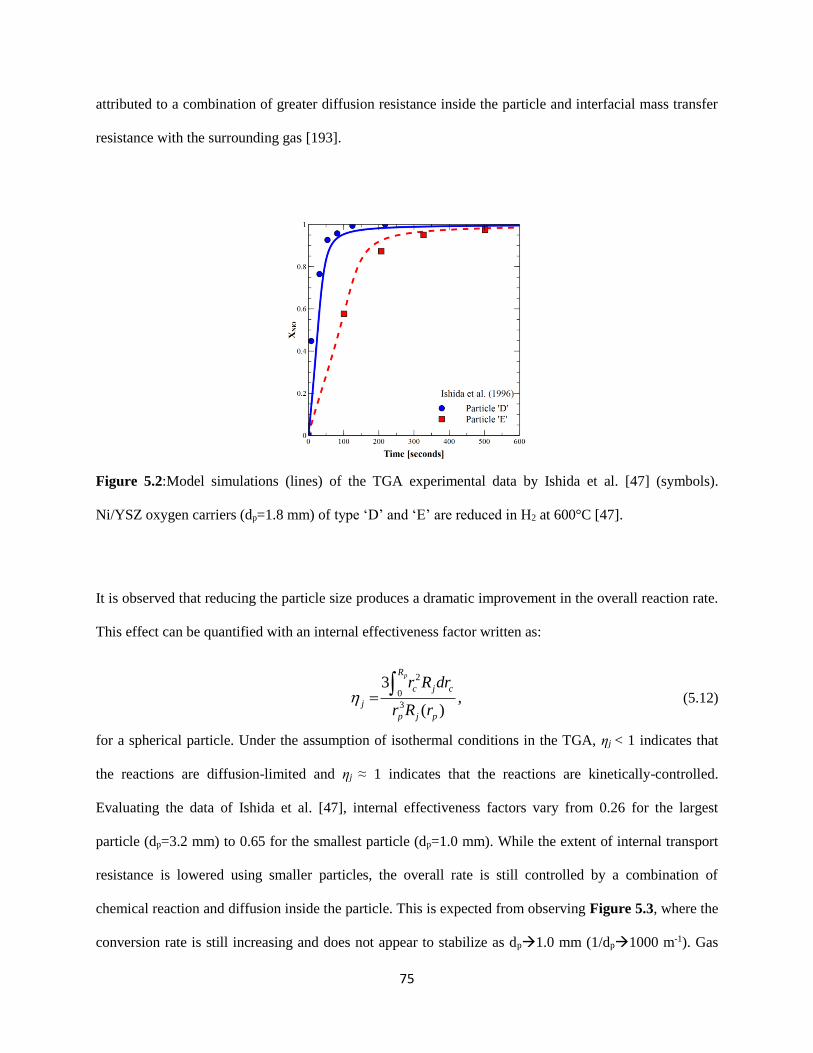
75
attributed to a combination of greater diffusion resistance inside the particle and interfacial mass transfer
resistance with the surrounding gas [193].
Figure 5.2:Model simulations (lines) of the TGA experimental data by Ishida et al. [47] (symbols).
Ni/YSZ oxygen carriers (dp=1.8 mm) of type ‘D’ and ‘E’ are reduced in H2 at 600°C [47].
It is observed that reducing the particle size produces a dramatic improvement in the overall reaction rate.
This effect can be quantified with an internal effectiveness factor written as:
2
0
3 )
3 ,
(
p
c j c
j
p j
R
p
r R dr
Rr r
(5.12)
for a spherical particle. Under the assumption of isothermal conditions in the TGA, ηj < 1 indicates that
the reactions are diffusion-limited and ηj ≈ 1 indicates that the reactions are kinetically-controlled.
Evaluating the data of Ishida et al. [47], internal effectiveness factors vary from 0.26 for the largest
particle (dp=3.2 mm) to 0.65 for the smallest particle (dp=1.0 mm). While the extent of internal transport
resistance is lowered using smaller particles, the overall rate is still controlled by a combination of
chemical reaction and diffusion inside the particle. This is expected from observing Figure 5.3, where the
conversion rate is still increasing and does not appear to stabilize as dp1.0 mm (1/dp1000 m-1). Gas
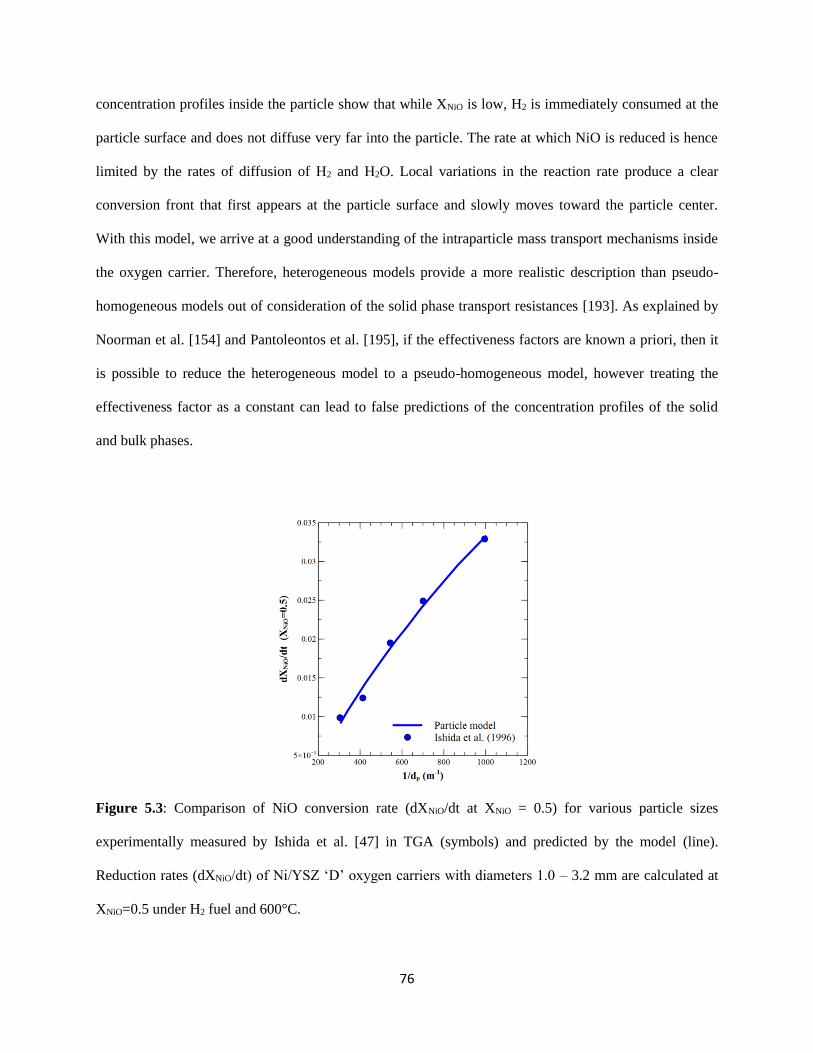
76
concentration profiles inside the particle show that while XNiO is low, H2 is immediately consumed at the
particle surface and does not diffuse very far into the particle. The rate at which NiO is reduced is hence
limited by the rates of diffusion of H2 and H2O. Local variations in the reaction rate produce a clear
conversion front that first appears at the particle surface and slowly moves toward the particle center.
With this model, we arrive at a good understanding of the intraparticle mass transport mechanisms inside
the oxygen carrier. Therefore, heterogeneous models provide a more realistic description than pseudo-
homogeneous models out of consideration of the solid phase transport resistances [193]. As explained by
Noorman et al. [154] and Pantoleontos et al. [195], if the effectiveness factors are known a priori, then it
is possible to reduce the heterogeneous model to a pseudo-homogeneous model, however treating the
effectiveness factor as a constant can lead to false predictions of the concentration profiles of the solid
and bulk phases.
Figure 5.3: Comparison of NiO conversion rate (dXNiO/dt at XNiO = 0.5) for various particle sizes
experimentally measured by Ishida et al. [47] in TGA (symbols) and predicted by the model (line).
Reduction rates (dXNiO/dt) of Ni/YSZ ‘D’ oxygen carriers with diameters 1.0 – 3.2 mm are calculated at
XNiO=0.5 under H2 fuel and 600°C.
77
5.3.3. Effect of cyclic testing
In the literature, changes in the particle microstructure have been documented for Ni-based oxygen
carriers from performance testing in TGA [47,114], batch fluidized bed reactors [37,80], and prototype
reactors [73,185]. Changes to the pore structure of the particle were commonly observed, and believed to
be caused by the oxygen carrier preparation, attrition or fragmentation, and migration of Ni [80,196]. The
increasing oxygen carrier conversion rate as a function of the reduction cycle was correlated to the
structural changes occurring within the particle. The exact mechanisms of these changes are not well-
understood, and they can vary for different oxygen carriers and operating conditions. Nonetheless,
modeling the impact of these progressive changes in the particle microstructure on the oxygen carrier
reactivity can improve our understanding of the effect of the number of cycles on CLC performance. If
these physical changes can be measured or correlated, then the reactivity behavior can be evaluated over
the lifetime of an oxygen carrier. Alternatively, the model can be used to suggest changes occurring
within the particle microstructure in the absence of BET or SEM data to account for the variations in
reactivity.
Here, the model is used to analyze the effect of redox cycles on the structural properties of the ‘E’
Ni/YSZ oxygen carrier tested by Ishida et al. [47]. TGA data showed that the conversion rate increased
over eight redox cycles at 600 ˚C. Ishida et al. [47] attributed the enhancement in reaction rate to slight
enlargements of the grain and pore sizes, which exhibited negligible change after the first seven cycles.
The reactivity stabilized after the seventh cycle, probably because a stable microstructure had been
attained. Based on their observations, we hypothesize that a gradual increase in the mean pore size over
increasing redox cycles is the reason for the observed reactivity behavior. Unlike Section 5.3.2, the
capability of the model is limited by the availability of the data because any information regarding the
pore size distribution or the variation after cycles was not reported in their work. Hence, the objective of
this section is to utilize the model to conduct a sensitivity analysis of the mean pore size on the oxygen
carrier conversion, to determine if the hypothesis can explain the experimental results.
78
The modeling approach follows establishing the kinetics from the conversion data of the fresh oxygen
carrier and evaluating the reactivity to changes in the mean pore size. The rate constant, kj’, is estimated
(Table 5.2) to match the experimental data of the fresh material (Figure 5.2). The pore size of the fresh
‘E’ particle is determined to be 4.5 nm assuming a cylindrical pore structure and uniform distribution. The
porosity is assumed 0.2 (since it is denser than the ‘D’ particles) for all cycles. A sensitivity analysis of
the pore size within a range of 4-25 nm is conducted. The model results show that the reactivity, taken as
the time to reach 95% NiO conversion, increases with increasing pore size (Figure 5.4a). The greatest
improvement occurs when the pore diameter is increased from 4 to 10 nm. As discussed in Section 5.3.2,
internal diffusion effects are important for oxygen carriers of this size, however by increasing the pore
size, diffusion limitations are reduced. At a pore diameter > 15 nm, the rates are predominately controlled
by kinetics. This finding somewhat contradicts the conclusion of Section 5.3.2 where all the particles
were found to be diffusion-limited. However, modeling the intraparticle gradients of the ‘E’ particles
provided a reasonable explanation, wherein internal transport was clearly enhanced by the increase in
pore size and reaction rates were reduced by the 50% by the dilution of the reducing gas. Observing the
agreement between model and experiment, we surmise that the pore size experienced an increase after 8
cycles (Figure 5.4b). Conclusively, on the basis of the (commonly observed) hypothesis of increasing
pore size over redox cycles, we show that transport-limited oxygen carriers can gain reactivity over time
due to surface restructuring and pore opening. In Section 5.3.5, the effect of number of cycles is analyzed
through experimentation and modeling of the fresh and used carriers, where evidence of particle
restructuring are quantified and modeled in detail.
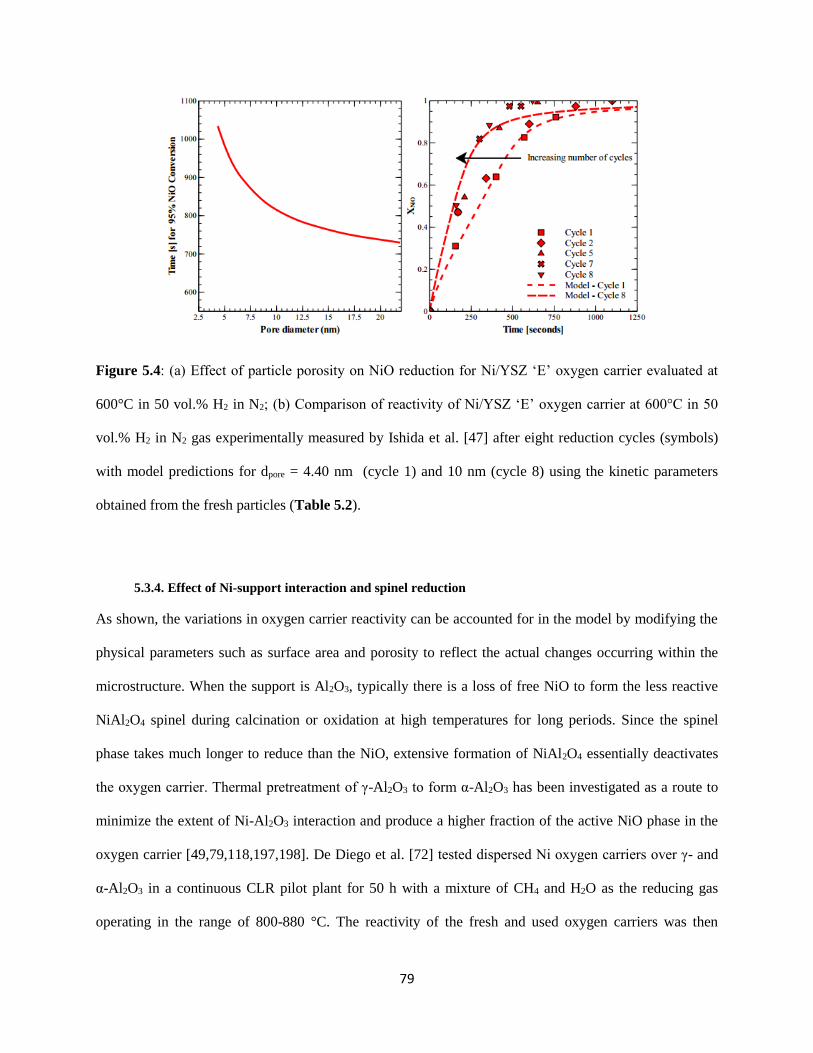
79
Figure 5.4: (a) Effect of particle porosity on NiO reduction for Ni/YSZ ‘E’ oxygen carrier evaluated at
600°C in 50 vol.% H2 in N2; (b) Comparison of reactivity of Ni/YSZ ‘E’ oxygen carrier at 600°C in 50
vol.% H2 in N2 gas experimentally measured by Ishida et al. [47] after eight reduction cycles (symbols)
with model predictions for dpore = 4.40 nm (cycle 1) and 10 nm (cycle 8) using the kinetic parameters
obtained from the fresh particles (Table 5.2).
5.3.4. Effect of Ni-support interaction and spinel reduction
As shown, the variations in oxygen carrier reactivity can be accounted for in the model by modifying the
physical parameters such as surface area and porosity to reflect the actual changes occurring within the
microstructure. When the support is Al2O3, typically there is a loss of free NiO to form the less reactive
NiAl2O4 spinel during calcination or oxidation at high temperatures for long periods. Since the spinel
phase takes much longer to reduce than the NiO, extensive formation of NiAl2O4 essentially deactivates
the oxygen carrier. Thermal pretreatment of γ-Al2O3 to form α-Al2O3 has been investigated as a route to
minimize the extent of Ni-Al2O3 interaction and produce a higher fraction of the active NiO phase in the
oxygen carrier [49,79,118,197,198]. De Diego et al. [72] tested dispersed Ni oxygen carriers over γ- and
α-Al2O3 in a continuous CLR pilot plant for 50 h with a mixture of CH4 and H2O as the reducing gas
operating in the range of 800-880 °C. The reactivity of the fresh and used oxygen carriers was then
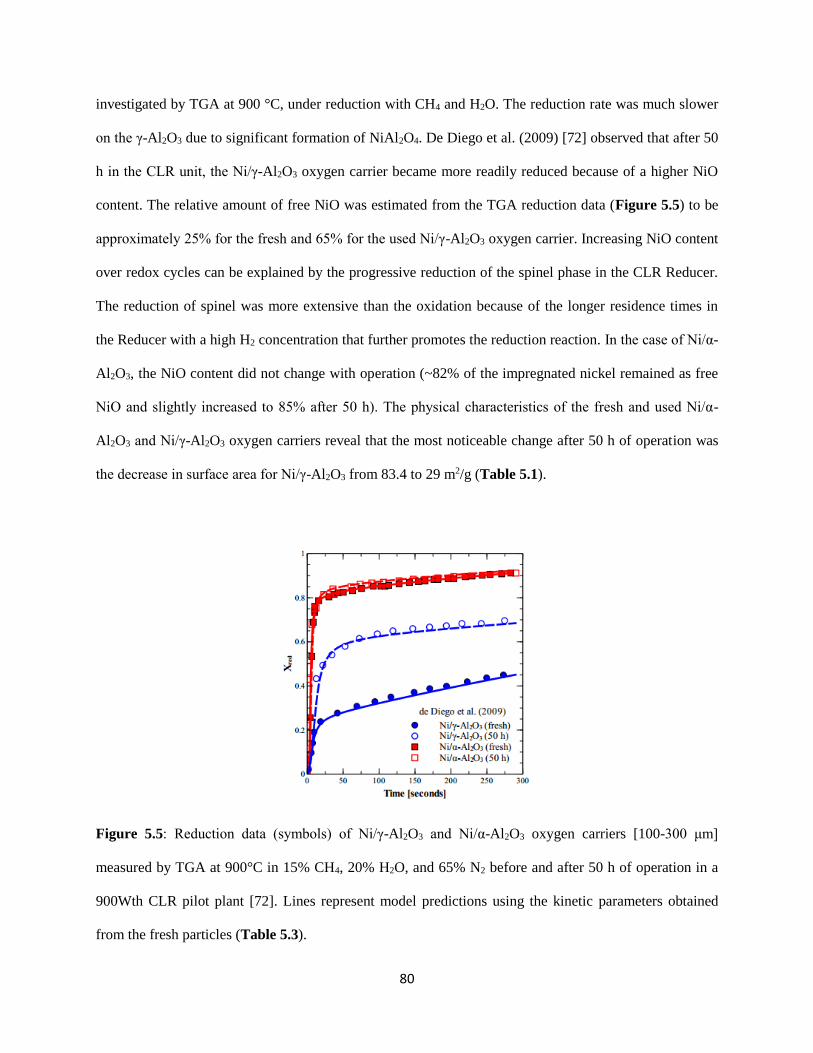
80
investigated by TGA at 900 °C, under reduction with CH4 and H2O. The reduction rate was much slower
on the γ-Al2O3 due to significant formation of NiAl2O4. De Diego et al. (2009) [72] observed that after 50
h in the CLR unit, the Ni/γ-Al2O3 oxygen carrier became more readily reduced because of a higher NiO
content. The relative amount of free NiO was estimated from the TGA reduction data (Figure 5.5) to be
approximately 25% for the fresh and 65% for the used Ni/γ-Al2O3 oxygen carrier. Increasing NiO content
over redox cycles can be explained by the progressive reduction of the spinel phase in the CLR Reducer.
The reduction of spinel was more extensive than the oxidation because of the longer residence times in
the Reducer with a high H2 concentration that further promotes the reduction reaction. In the case of Ni/α-
Al2O3, the NiO content did not change with operation (~82% of the impregnated nickel remained as free
NiO and slightly increased to 85% after 50 h). The physical characteristics of the fresh and used Ni/α-
Al2O3 and Ni/γ-Al2O3 oxygen carriers reveal that the most noticeable change after 50 h of operation was
the decrease in surface area for Ni/γ-Al2O3 from 83.4 to 29 m2/g (Table 5.1).
Figure 5.5: Reduction data (symbols) of Ni/γ-Al2O3 and Ni/α-Al2O3 oxygen carriers [100-300 μm]
measured by TGA at 900°C in 15% CH4, 20% H2O, and 65% N2 before and after 50 h of operation in a
900Wth CLR pilot plant [72]. Lines represent model predictions using the kinetic parameters obtained
from the fresh particles (Table 5.3).

81
The particle model is applied to predict the reduction behavior of the Ni/α-Al2O3 and Ni/γ-Al2O3 oxygen
carriers tested by de Diego et al. [72] before and after 50 h of operation. The overall solid conversion of
the oxygen carrier ( redX ) is a function of the NiO conversion, NiOX , and the NiAl2O4 conversion,
2 4NiAl O X :
2 4red NiO NiO NiAl O NiOX X f X 1 f , (5.13)
where NiOf denotes the nickel fraction inside the oxygen carrier in the form of free NiO. This value is
estimated from the TGA reduction data, corresponding to the inflection point in the solid conversion
where NiO reduction ends and NiAl2O4 begins [72,114]. Dueso et al. [114] proposed that the reduction
reactions of NiAl2O4 by CH4, H2, and CO can be described by the shrinking core model. The conversion
of NiAl2O4 is expressed as a function of the sum of the NiAl2O4 reduction reaction rates, '
jR :
42 2 4NiAl O
'dX / dt / .j NiAl OCR (5.14)
The simultaneous reduction of NiO and NiAl2O4 is modeled using the rate expressions from Zhou et al.
[119] and Dueso et al. [114]. The contribution of Ni-catalytic reactions is also taken into account using
the proposed kinetics by Zhou et al. [119]. In general, the NiO reactions are dominant in the beginning of
the reduction cycle because of fast kinetics. Once the NiO is converted, this is followed by a second,
much slower reduction period to convert the remaining NiAl2O4.
The reactivity of the Ni/α-Al2O3 and Ni/γ-Al2O3 oxygen carriers is simulated under the TGA reduction
conditions of de Diego et al. [72] using the physical properties from Table 5.1 and the NiOf values
estimated from the data. The objective of this case study is to utilize the particle model to examine the
effect of NiO/NiAl2O4 ratio and support (α-Al2O3, γ-Al2O3) on the overall solid reduction. Reduction rate
constants for NiO and NiAl2O4 are estimated from the data of the fresh oxygen carriers (Table 5.3). As
shown in Figure 5.5, the model predictions achieve an acceptable fit with the experimental data. Internal
diffusional resistance was not significant in their experiments because of the small particle size (100-300
μm). For both oxygen carriers, the reduction of NiO is complete within approximately 20 s of reaction.
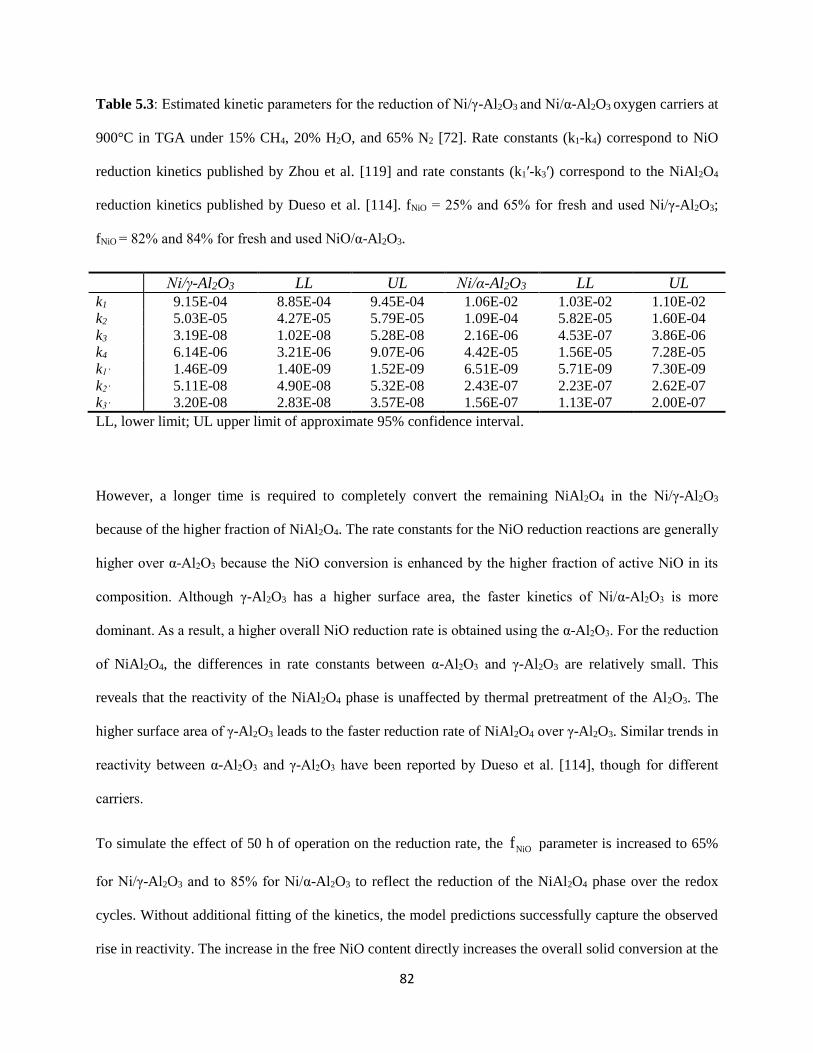
82
Table 5.3: Estimated kinetic parameters for the reduction of Ni/γ-Al2O3 and Ni/α-Al2O3 oxygen carriers at
900°C in TGA under 15% CH4, 20% H2O, and 65% N2 [72]. Rate constants (k1-k4) correspond to NiO
reduction kinetics published by Zhou et al. [119] and rate constants (k1ʹ-k3ʹ) correspond to the NiAl2O4
reduction kinetics published by Dueso et al. [114]. fNiO = 25% and 65% for fresh and used Ni/γ-Al2O3;
fNiO = 82% and 84% for fresh and used NiO/α-Al2O3.
Ni/γ-Al2O3 LL UL Ni/α-Al2O3 LL UL
k1 9.15E-04 8.85E-04 9.45E-04 1.06E-02 1.03E-02 1.10E-02
k2 5.03E-05 4.27E-05 5.79E-05 1.09E-04 5.82E-05 1.60E-04
k3 3.19E-08 1.02E-08 5.28E-08 2.16E-06 4.53E-07 3.86E-06
k4 6.14E-06 3.21E-06 9.07E-06 4.42E-05 1.56E-05 7.28E-05
k1’ 1.46E-09 1.40E-09 1.52E-09 6.51E-09 5.71E-09 7.30E-09
k2’ 5.11E-08 4.90E-08 5.32E-08 2.43E-07 2.23E-07 2.62E-07
k3’ 3.20E-08 2.83E-08 3.57E-08 1.56E-07 1.13E-07 2.00E-07
LL, lower limit; UL upper limit of approximate 95% confidence interval.
However, a longer time is required to completely convert the remaining NiAl2O4 in the Ni/γ-Al2O3
because of the higher fraction of NiAl2O4. The rate constants for the NiO reduction reactions are generally
higher over α-Al2O3 because the NiO conversion is enhanced by the higher fraction of active NiO in its
composition. Although γ-Al2O3 has a higher surface area, the faster kinetics of Ni/α-Al2O3 is more
dominant. As a result, a higher overall NiO reduction rate is obtained using the α-Al2O3. For the reduction
of NiAl2O4, the differences in rate constants between α-Al2O3 and γ-Al2O3 are relatively small. This
reveals that the reactivity of the NiAl2O4 phase is unaffected by thermal pretreatment of the Al2O3. The
higher surface area of γ-Al2O3 leads to the faster reduction rate of NiAl2O4 over γ-Al2O3. Similar trends in
reactivity between α-Al2O3 and γ-Al2O3 have been reported by Dueso et al. [114], though for different
carriers.
To simulate the effect of 50 h of operation on the reduction rate, the NiOf parameter is increased to 65%
for Ni/γ-Al2O3 and to 85% for Ni/α-Al2O3 to reflect the reduction of the NiAl2O4 phase over the redox
cycles. Without additional fitting of the kinetics, the model predictions successfully capture the observed
rise in reactivity. The increase in the free NiO content directly increases the overall solid conversion at the

83
end of reaction time, which is significant in the case of the used Ni/γ-Al2O3 oxygen carrier,
notwithstanding that reduction rates are negatively affected by the decrease in surface area reported for
both carriers. This finding validates not only the kinetic model but also the structural model of the oxygen
carrier solid matrix. Thus, the reduction behavior of oxygen carriers taken from different periods of
operation can be accurately predicted with the model by incorporating the important changes in physical
and chemical properties from the experimental analysis.
5.3.5. Experiments performed in-house
In the preceding discussion, the reactivity of Ni-based oxygen carriers is shown to increase as the internal
transport resistance is decreased, which can be achieved by decreasing particle size or increasing pore
volume. Performance testing over multiple redox cycles can reveal changes in the oxygen carrier
reactivity, caused by physical and chemical changes in the particle microstructure. The physical changes
are primarily related to the changes in surface texture and solid structure of the support, such as sintering
and agglomeration phenomena, while chemical changes can be the result of NiO interaction with the
support layer. For the Ni/YSZ particles tested by Ishida et al. [47], increasing reducibility with H2 can be
explained by the gradual enlargements of the mean pore size occurring over increasing number of redox
cycles. Chemical changes are not modeled because of the low reactivity of YSZ. In the study by de Diego
et al. [72], the reactivity of the Ni/α-Al2O3 and Ni/γ-Al2O3 oxygen carriers was enhanced over time by a
gradual conversion of the NiAl2O4 spinel phase and deteriorated by a loss of surface area due to
agglomeration and sintering of the Ni. Ni/α-Al2O3 was not affected by the duration of operation, while
Ni/γ-Al2O3, which was calcined at 950 ˚C for 1 h, significantly gained reactivity after 50 h in the CLR
unit. The observed changes in reactivity are successfully predicted by the model. The focus of this section
is to analyze the effect of redox cycling on the reactivity behavior of fresh γ-Al2O3-SiO2 supported Ni-
based oxygen carriers. The aim of this section is to present a comprehensive analysis of the important
changes in reactivity, surface texture, and solid structure of the oxygen carriers after each redox cycle in
the TGA through modeling and experimentation.
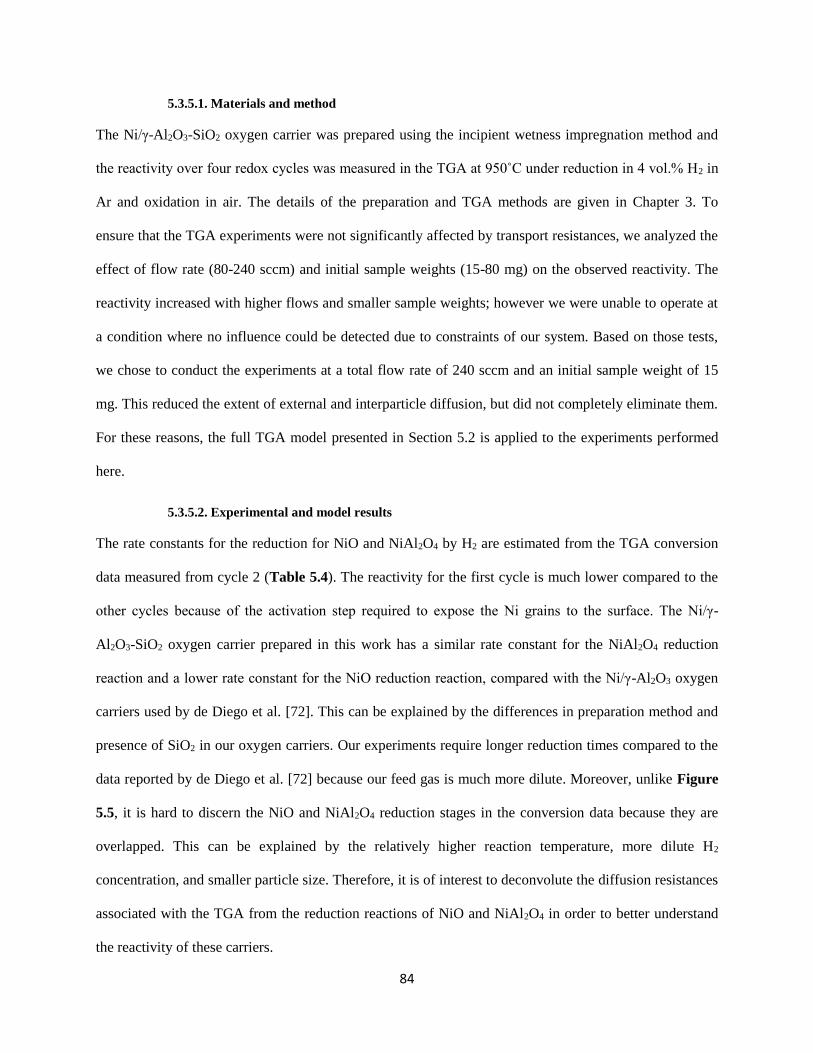
84
5.3.5.1. Materials and method
The Ni/γ-Al2O3-SiO2 oxygen carrier was prepared using the incipient wetness impregnation method and
the reactivity over four redox cycles was measured in the TGA at 950˚C under reduction in 4 vol.% H2 in
Ar and oxidation in air. The details of the preparation and TGA methods are given in Chapter 3. To
ensure that the TGA experiments were not significantly affected by transport resistances, we analyzed the
effect of flow rate (80-240 sccm) and initial sample weights (15-80 mg) on the observed reactivity. The
reactivity increased with higher flows and smaller sample weights; however we were unable to operate at
a condition where no influence could be detected due to constraints of our system. Based on those tests,
we chose to conduct the experiments at a total flow rate of 240 sccm and an initial sample weight of 15
mg. This reduced the extent of external and interparticle diffusion, but did not completely eliminate them.
For these reasons, the full TGA model presented in Section 5.2 is applied to the experiments performed
here.
5.3.5.2. Experimental and model results
The rate constants for the reduction for NiO and NiAl2O4 by H2 are estimated from the TGA conversion
data measured from cycle 2 (Table 5.4). The reactivity for the first cycle is much lower compared to the
other cycles because of the activation step required to expose the Ni grains to the surface. The Ni/γ-
Al2O3-SiO2 oxygen carrier prepared in this work has a similar rate constant for the NiAl2O4 reduction
reaction and a lower rate constant for the NiO reduction reaction, compared with the Ni/γ-Al2O3 oxygen
carriers used by de Diego et al. [72]. This can be explained by the differences in preparation method and
presence of SiO2 in our oxygen carriers. Our experiments require longer reduction times compared to the
data reported by de Diego et al. [72] because our feed gas is much more dilute. Moreover, unlike Figure
5.5, it is hard to discern the NiO and NiAl2O4 reduction stages in the conversion data because they are
overlapped. This can be explained by the relatively higher reaction temperature, more dilute H2
concentration, and smaller particle size. Therefore, it is of interest to deconvolute the diffusion resistances
associated with the TGA from the reduction reactions of NiO and NiAl2O4 in order to better understand
the reactivity of these carriers.

85
Table 5.4: Estimated kinetic parameters for the reduction of Ni/γ-Al2O3-SiO2 oxygen carrier at 950°C in
4 vol.% H2 in Ar. Rate expressions k2 correspond to the NiO reduction with H2 kinetics published by Zhou
et al. [119] and k2ʹ correspond to the NiAl2O4 reduction with H2 kinetics published by Dueso et al. [114].
NiO/γ-Al2O3 LL UL
k2 2.58E-05 2.47E-05 2.68E-05
k2’ 9.20E-08 8.76E-08 9.65E-08
LL, lower limit; UL upper limit of approximate 95% confidence interval.
The extent of diffusion limitations in the TGA is analyzed with the experimental results from cycle 2. The
effect of each diffusion resistance on the reactivity is examined for different conditions in which a single
diffusion resistance is isolated. The results modeled for reaction kinetics is determined by simulating a
monolayer bed of particles with a negligible stagnant gas boundary layer and fast internal diffusion
through the pores. The external diffusion effect is simulated using the reaction-controlled model with the
experimental stagnant boundary layer thickness δ. Similarly, the diffusion limitations through the bed
(interparticle effects) are evaluated by simulating the reaction-controlled model using the experimental
bed height h, and limitations through the particle (intraparticle effects) by simulating the reaction-
controlled model using the effective diffusion relationships. The conversion as a function of these
diffusion resistances is depicted for Xred < 0.7 in Figure 5.6, where we approximate weight loss is
primarily due to NiO reduction. This is justified later in our analysis (Figure 5.12). Comparing the three
types of diffusion control, the interparticle diffusion is the most limiting step in the reduction rate. These
results are consistent with Ollero et al. [188], who analyzed the diffusional limitations in TGA
gasification studies. The overall prediction is lower than the interparticle diffusion-limiting case,
indicating that all the diffusional effects are relatively important to model the TGA reduction behavior.
Nonetheless, the dominant contribution comes from the kinetic terms, and diffusion resistances are of
minor significance. In a separate study, an analysis of the kinetic models relevant in supported and
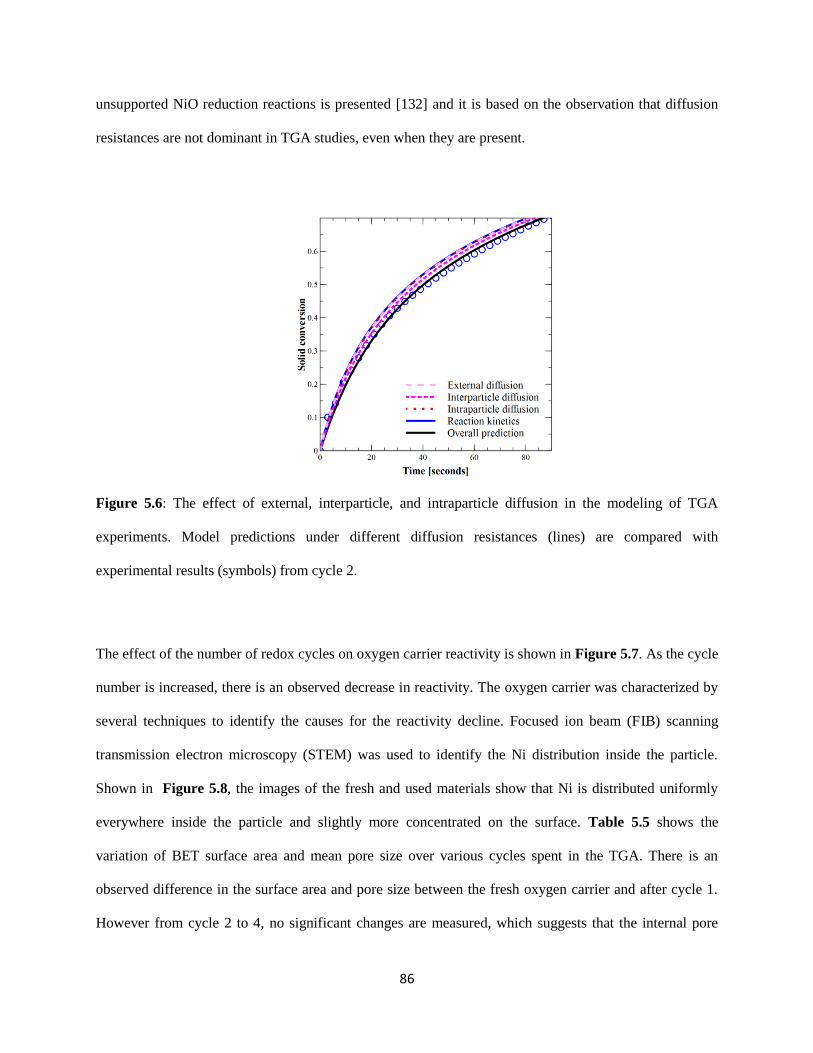
86
unsupported NiO reduction reactions is presented [132] and it is based on the observation that diffusion
resistances are not dominant in TGA studies, even when they are present.
Figure 5.6: The effect of external, interparticle, and intraparticle diffusion in the modeling of TGA
experiments. Model predictions under different diffusion resistances (lines) are compared with
experimental results (symbols) from cycle 2.
The effect of the number of redox cycles on oxygen carrier reactivity is shown in Figure 5.7. As the cycle
number is increased, there is an observed decrease in reactivity. The oxygen carrier was characterized by
several techniques to identify the causes for the reactivity decline. Focused ion beam (FIB) scanning
transmission electron microscopy (STEM) was used to identify the Ni distribution inside the particle.
Shown in Figure 5.8, the images of the fresh and used materials show that Ni is distributed uniformly
everywhere inside the particle and slightly more concentrated on the surface. Table 5.5 shows the
variation of BET surface area and mean pore size over various cycles spent in the TGA. There is an
observed difference in the surface area and pore size between the fresh oxygen carrier and after cycle 1.
However from cycle 2 to 4, no significant changes are measured, which suggests that the internal pore
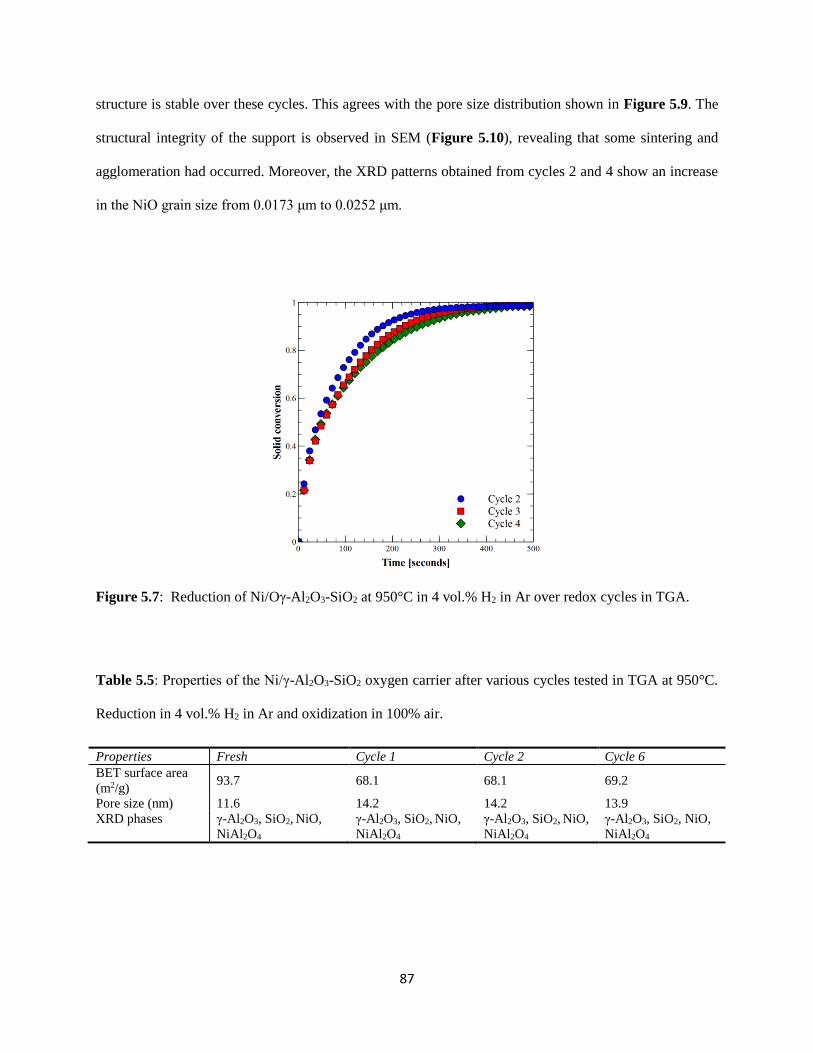
87
structure is stable over these cycles. This agrees with the pore size distribution shown in Figure 5.9. The
structural integrity of the support is observed in SEM (Figure 5.10), revealing that some sintering and
agglomeration had occurred. Moreover, the XRD patterns obtained from cycles 2 and 4 show an increase
in the NiO grain size from 0.0173 μm to 0.0252 μm.
Figure 5.7: Reduction of Ni/Oγ-Al2O3-SiO2 at 950°C in 4 vol.% H2 in Ar over redox cycles in TGA.
Table 5.5: Properties of the Ni/γ-Al2O3-SiO2 oxygen carrier after various cycles tested in TGA at 950°C.
Reduction in 4 vol.% H2 in Ar and oxidization in 100% air.
Properties Fresh Cycle 1 Cycle 2 Cycle 6
BET surface area
(m2/g) 93.7 68.1 68.1 69.2
Pore size (nm) 11.6 14.2 14.2 13.9
XRD phases γ-Al2O3, SiO2, NiO,
NiAl2O4
γ-Al2O3, SiO2, NiO,
NiAl2O4
γ-Al2O3, SiO2, NiO,
NiAl2O4
γ-Al2O3, SiO2, NiO,
NiAl2O4

88
Figure 5.8: FIB/STEM images of the Ni distribution inside the (a) fresh Ni/γ-Al2O3- SiO2 oxygen carrier
and (b) after four cycles.
Figure 5.9: Pore size distribution of the Ni/γ-Al2O3-SiO2 after various cycles in the TGA at 950°C.
Based on the materials characterization data, we postulate that the decline in oxygen carrier reactivity can
be attributed to either (1) chemical deactivation due to progressive NiAl2O4 formation during oxidation
or (2) loss of active surface area due to accumulative thermal sintering of the Ni grains. To address the
former hypothesis, in-situ XRD is performed to analyze the effect of calcination for 3 h at 950 ˚C on the
relative compositions of NiO and NiAl2O4 in the oxygen carrier. The method of this analysis is provided
in the supplementary material. The assigned peaks corresponding to NiO, Al2O3, and NiAl2O4 are clearly
(a) (b)

89
visible on the diffraction patterns presented in Figure 5.11. Comparison of the XRD patterns before and
after extended oxidation reveals an increase in the NiAl2O4 intensity, indicating the formation of larger
spinel crystals with oxidation time. Therefore, we surmise that the fraction of NiAl2O4 has increased over
each redox cycle, resulting in a progressively decreasing conversion rate. The model predictions from
cycle 2 are in good agreement with the experimental results and the subsequent cycles are simulated by
varying the NiO/NiAl2O4 ratio (Figure 5.12). The contributions of NiO and NiAl2O4 reduction to the
overall solid conversion can be observed in the X-time and dX/dt-time profiles. A similar trend in the
time derivative of the conversion (dX/dt) can be observed for all cycles in which the conversion rate is
characterized by the immediate reduction of NiO followed by the slow reduction for NiAl2O4. The
fraction of NiO over NiO plus NiAl2O4 is estimated at 67 wt.% in cycle 2, 57 wt.% in cycle 3 and 54
wt.% in cycle 4. As can be observed, the reactivity loss can be captured by the increase in NiAl2O4 over
cycles and by modeling this effect, we are able to match the experimental data very closely.
Figure 5.10: SEM images of the oxidized Ni/SiO2/γ-Al2O3 oxygen carrier after 1 (a) and 4 (b) cycles in
the TGA at 950°C.
(a) (b)
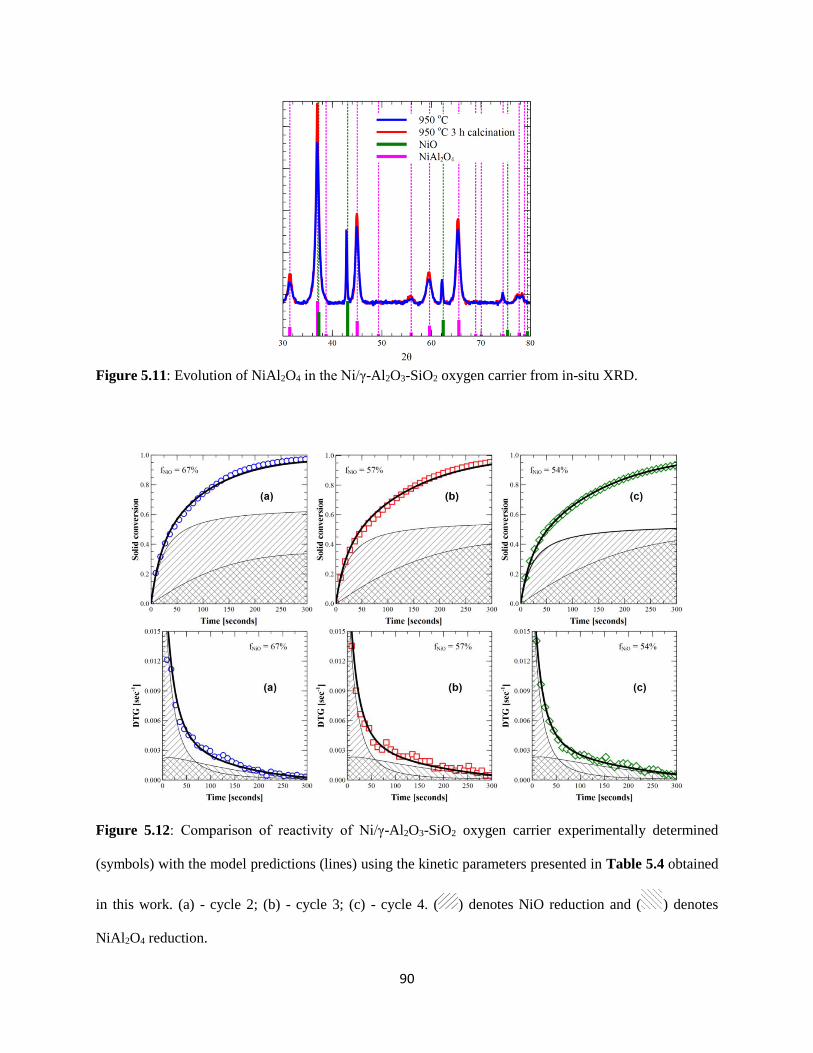
90
Figure 5.11: Evolution of NiAl2O4 in the Ni/γ-Al2O3-SiO2 oxygen carrier from in-situ XRD.
Figure 5.12: Comparison of reactivity of Ni/γ-Al2O3-SiO2 oxygen carrier experimentally determined
(symbols) with the model predictions (lines) using the kinetic parameters presented in Table 5.4 obtained
in this work. (a) - cycle 2; (b) - cycle 3; (c) - cycle 4. ( ) denotes NiO reduction and ( ) denotes
NiAl2O4 reduction.
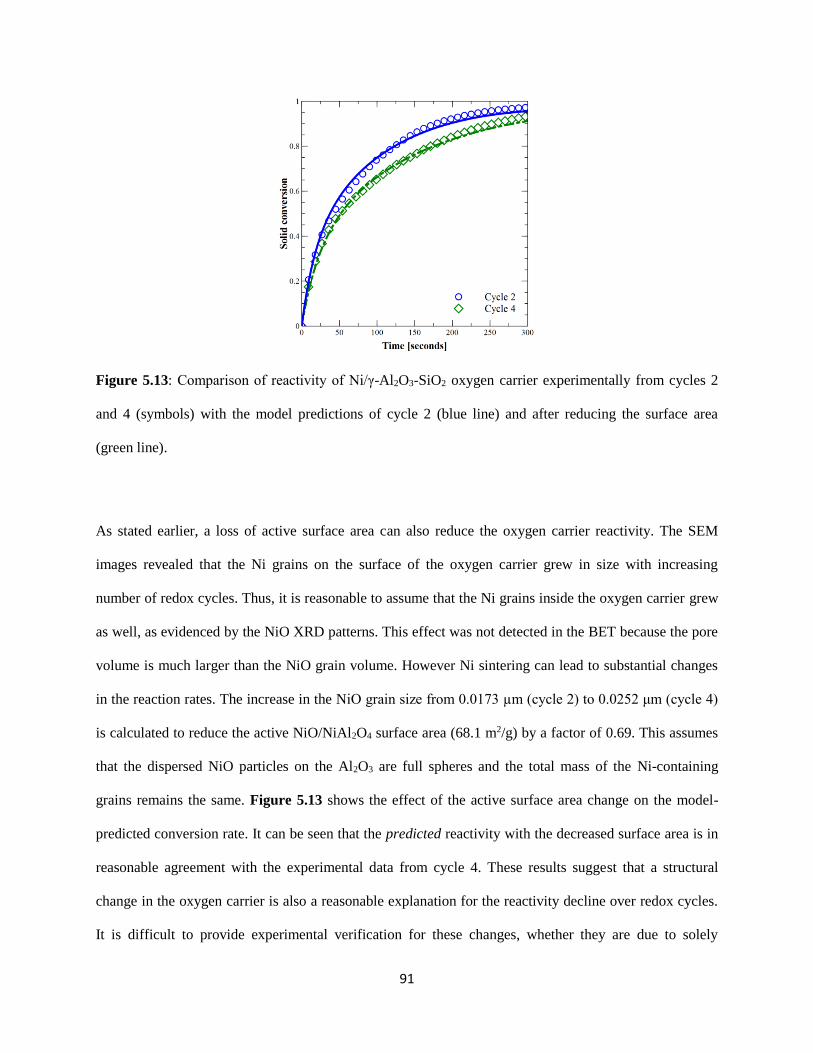
91
Figure 5.13: Comparison of reactivity of Ni/γ-Al2O3-SiO2 oxygen carrier experimentally from cycles 2
and 4 (symbols) with the model predictions of cycle 2 (blue line) and after reducing the surface area
(green line).
As stated earlier, a loss of active surface area can also reduce the oxygen carrier reactivity. The SEM
images revealed that the Ni grains on the surface of the oxygen carrier grew in size with increasing
number of redox cycles. Thus, it is reasonable to assume that the Ni grains inside the oxygen carrier grew
as well, as evidenced by the NiO XRD patterns. This effect was not detected in the BET because the pore
volume is much larger than the NiO grain volume. However Ni sintering can lead to substantial changes
in the reaction rates. The increase in the NiO grain size from 0.0173 µm (cycle 2) to 0.0252 μm (cycle 4)
is calculated to reduce the active NiO/NiAl2O4 surface area (68.1 m2/g) by a factor of 0.69. This assumes
that the dispersed NiO particles on the Al2O3 are full spheres and the total mass of the Ni-containing
grains remains the same. Figure 5.13 shows the effect of the active surface area change on the model-
predicted conversion rate. It can be seen that the predicted reactivity with the decreased surface area is in
reasonable agreement with the experimental data from cycle 4. These results suggest that a structural
change in the oxygen carrier is also a reasonable explanation for the reactivity decline over redox cycles.
It is difficult to provide experimental verification for these changes, whether they are due to solely
92
physical or chemical mechanisms or their combinations. Even so, the modeling analysis performed here
demonstrates that both accounts can be practically implemented and realistic predictions can be made. In
a future work we will employ XPS analysis to identify the extent of each phenomenon on the surface of
the oxygen carrier, as successfully performed by Cabello et al. [116].
5.4. Conclusions
A particle model was used to predict experimental data in which the particle properties, such as size,
microstructural properties, and support interaction, were subject to change. The model was proven to be
predictive of the effects of particle size on the oxygen carrier reactivity over the range of diameters
experimentally tested. The internal diffusion resistance, which was quantified with an effectiveness
factor, was found to be significant for all particles with a mean diameter greater than 1.0 mm. The effect
of redox cycling on the particle reactivity was evaluated by a sensitivity analysis of the observed changes
of the microstructural properties. Furthermore, chemical deactivation due to Ni-support interaction was
analyzed for oxygen carriers prepared on α-Al2O3 and γ-Al2O3. The observed reactivity changes due to
differences in spinel fraction and sintering effects were well-predicted by the model, proving that the
model can be used to track the performance of oxygen carriers throughout their use. Experimental tests
performed using our Ni/γ-Al2O3-SiO2 oxygen carrier revealed that the gradual reactivity decline could be
modeled, whether the effects were due to NiAl2O4 formation or Ni sintering. The results from this work
highlight the significance of dynamic modeling at the particle-scale for the interpretation of experiments
and accurate design of CLC systems. While this study focuses on Ni-based systems, the model can be
practically applied to any oxygen carrier system, by including the relevant reaction scheme and material
properties.
93
Chapter 6 MODEL-BASED DESIGN OF CHEMICAL-LOOPING COMBUSTION EXPERIMENTS
To guide the design of chemical-looping combustion (CLC) systems, the use of accurate models is
crucial. The reduction kinetics between NiO and CH4 is uncertain, in regards to the most suitable kinetic
mechanism and reaction network. A framework for structural identifiability analysis is developed and
applied to evaluate the candidate kinetic models for the NiO-CH4 reaction. The identifiability of kinetic
parameters of different model structures is analyzed and compared. Models that lack structural
identifiability of their kinetic parameters are rejected in the analysis. From a total of 160 possible
candidate models, 4 kinetic models are found to be identifiable with respect to their kinetic parameters
and distinguishable from different model structures. This structural identifiability analysis paves the way
for model-based optimal design of experiments. First, optimal experiments are designed and executed to
reject inadequate models and to determine a true model structure for the reaction kinetics of the CH4-NiO
system. Then, kinetics with statistical significance is estimated from experiments aimed at reducing
parameter uncertainty. To maximize the observability of the NiO reduction reactions, fixed bed
experiments should exhibit a peak separation of the concentration profiles, an initial high methane slip,
and low overall CO2 selectivity. Several case studies are presented to check the adequacy of the
recommended model and evaluate its predictive ability and extrapolation capabilities. The model resulting
from this work is validated and suitable for application in process design and optimization.
6.1. Introduction
Chemical-looping combustion (CLC) is a promising method for inexpensive CO2 capture, accomplished
by the sequential reduction and oxidation of a metal oxygen carrier by a hydrocarbon fuel and air,
respectively [23,81]. Common oxygen carriers for CLC include supported metals, such as Ni, Cu, Mn,
and Fe [34,44,60,62,65,66,73–77,79,93,175,176,199–203] or natural ores containing the same [32,204–
211]. The oxidation of these metals is relatively easy to understand and simulate, in terms of their reaction
kinetics, as there is typically one or a few sequential oxidation reactions occurring. The reduction kinetics
94
of these metals is, however, more complicated and less certain. During reduction, the bare metal form of
the oxygen carrier can catalyze several heterogeneous reactions (e.g., reforming, water gas shift,
methanation, etc.), as well as a series of carbon formation reactions (e.g., methane decomposition or
cracking and Boudouard reactions). The challenge therein, is that these reactions have not been studied
extensively at the very high temperatures of CLC and more importantly at the co-existence of metal
oxides. In addition to the lack of certainty of the reactions catalyzed by the metals, there exists significant
controversy in terms of understanding and determining reaction networks
[49,56,58,60,72,73,77,114,118,119,142,171,198,212,213] and kinetic mechanisms
[35,47,65,69,73,114,132,153,214,215] to describe the heterogeneous reduction of the metal oxide by
reducing agents (CH4, H2, CO). It is unclear whether complete or partial fuel oxidation pathways are
dominant, and what solid-state kinetic models can describe these reactions.
The reactivity and selectivity of the oxygen carrier are typically studied in experimental setups that
provide information diluted by the unavoidable hydrodynamic effects associated with each CLC reactor.
These setups commonly include fixed bed reactors, fluidized bed reactors and thermo-gravimetric
analyzers. In these laboratory reactors, dominant reaction networks and kinetic mechanisms are developed
and determined on the basis of experiments, designed according to common practice and experimental
intuition. Thus, the proposed models are often selected from a limited number of possibly sub-optimal
experiments. Here, experimental sub-optimality is defined as a range of experimental conditions derived
from experimentalists’ intuition or “rules of thumb,” but not necessarily optimized for the task at hand:
determination of a statistically significant, representative and accurate reaction kinetics scheme for the
reduction step of NiO-based CLC. As a result, there exists uncertainty and controversy in the conclusions
on the reaction networks, mechanisms and kinetics of the reduction step of chemical-looping combustion.
A better approach to extract information on the reactions, their network, and dominant kinetics from
experiments is to follow a model-based framework. One such methodology is developed and applied in
this work, to address the contradictions and inconsistencies in the CLC literature pertinent to the reaction
95
models governing the reduction of NiO. Namely, model-based identifiability analysis and design of
optimal experiments is used here, with the objective to address literature controversies and arrive at
statistically significant model structures and kinetic parameters for CLC reduction. For the present
exercise, the reduction of NiO by CH4 is explored, for which there exists profound controversy in the
literature, noted by the wealth of independent research studies and considerable number of different
reaction kinetics and schemes proposed. Nonetheless, the methodology proposed herein, can be applied to
any other reaction system and should be viewed as a structured model-based methodology for systems
with uncertainty, regardless of their domain, structure, specificity and particularities.
The structure of this document is as follows: first, we explain in detail the current state of understanding
of the reaction system of CH4 with NiO and the controversy governing the existing literature. The
motivation behind a model-based approach to study the CLC kinetics of NiO with CH4 is illustrated with
a dynamic sensitivity analysis of the important kinetic parameters using a previously validated CLC
model. Existing reactor designs are evaluated, in which potential issues with the estimation of kinetic
parameters are discussed. Then, we introduce the application of a structured model-based design of
experiments approach to solve the specific problem in the reaction kinetics of the NiO-CH4 system. For
each section of the methodology, the statistical theory and mathematical formulation is reviewed and
presented. In a later analysis, we demonstrate the applicability of the methodology to tackle the model
controversy with the NiO-CH4 reduction kinetics and show the systematic reduction of models by the
design and execution of highly informative experiments.
6.2. Problem statement
Existing studies of the NiO-CH4 system at CLC conditions focus mostly on the comparison between fresh
and used oxygen carriers, since the reactivity of oxygen carriers tends to depart from that of the fresh
materials with time [128]. The derived rate constants from oxygen carriers of varying metal loading,
synthesis methods, and testing conditions can exhibit differences that are magnitudes apart
96
[49,57,126,127]. For catalytically active oxygen carriers, such as NiO, the reduced metal promotes
catalytic reactions that complicate kinetic parameter estimation efforts, due to the consideration of
multiple, inter-related reactions. A generalized CLC kinetic model for NiO and CH4, typically includes a
set of heterogeneous NiO reduction reactions, reforming reactions catalyzed by the reduced metal, and
carbon formation reactions. Typically, investigators interested in CLC reactor design or reactivity
evaluations select the reaction model on the basis of a priori assumptions of the phenomenological
proceedings of the gas-solid reactions with respect to the metal oxide [42,47,114,153] or results of
parameter estimation of a few arbitrarily designed experiments [58,119]. The results from these kinetic
studies are often unreliable if any deviation in the operating conditions exists, which in turn makes them
inappropriate for reactor and process design analyses. In order to procure a reliable model, it is necessary
to a) identify the possible models that can describe the system of interest; b) utilize a statistical procedure
to identify and discriminate among candidate models; c) systematically reject the inadequate models; and
d) enhance the precision of the model parameters. Here, we first assess the current state of understanding
of the reactions of NiO with CH4 and then describe a systematic framework for improving the existing
knowledge.
6.2.1. Rival kinetic models
Previously, we reviewed reaction schemes for a CH4-fed, Ni-based CLC system, finding inconsistency in
the solid-state reaction models and reaction pathways proposed by different research groups [119]. Table
6.1 presents the various proposed pathways in which CH4, H2 and CO react with NiO during a reduction
cycle. All the reaction schemes model the reduction of NiO by H2 and CO. However, three possible
reaction pathways for the reaction between CH4 and NiO have been proposed, involving partial and/or
complete fuel oxidation pathways. Reaction Schemes (RS) II and III utilize different, single pathways for
the reaction of NiO with CH4, while RS I and IV consider different two-step pathways. A single global
reaction between NiO and CH4 has also been proposed [35,73], but is not considered in this work,
because it is known that NiO has different reactivity in the presence of different reducing gases [114].
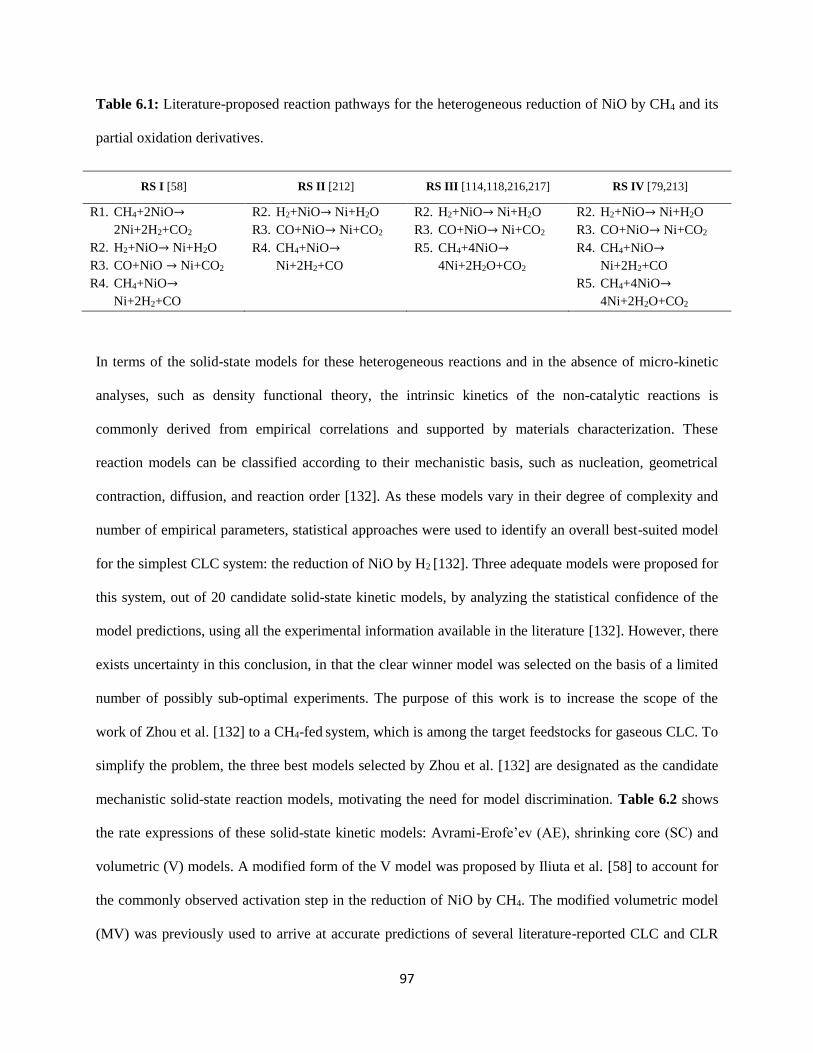
97
Table 6.1: Literature-proposed reaction pathways for the heterogeneous reduction of NiO by CH4 and its
partial oxidation derivatives.
RS I [58] RS II [212] RS III [114,118,216,217] RS IV [79,213]
R1. CH4+2NiO→
2Ni+2H2+CO2
R2. H2+NiO→ Ni+H2O
R3. CO+NiO → Ni+CO2
R4. CH4+NiO→
Ni+2H2+CO
R2. H2+NiO→ Ni+H2O
R3. CO+NiO→ Ni+CO2
R4. CH4+NiO→
Ni+2H2+CO
R2. H2+NiO→ Ni+H2O
R3. CO+NiO→ Ni+CO2
R5. CH4+4NiO→
4Ni+2H2O+CO2
R2. H2+NiO→ Ni+H2O
R3. CO+NiO→ Ni+CO2
R4. CH4+NiO→
Ni+2H2+CO
R5. CH4+4NiO→
4Ni+2H2O+CO2
In terms of the solid-state models for these heterogeneous reactions and in the absence of micro-kinetic
analyses, such as density functional theory, the intrinsic kinetics of the non-catalytic reactions is
commonly derived from empirical correlations and supported by materials characterization. These
reaction models can be classified according to their mechanistic basis, such as nucleation, geometrical
contraction, diffusion, and reaction order [132]. As these models vary in their degree of complexity and
number of empirical parameters, statistical approaches were used to identify an overall best-suited model
for the simplest CLC system: the reduction of NiO by H2 [132]. Three adequate models were proposed for
this system, out of 20 candidate solid-state kinetic models, by analyzing the statistical confidence of the
model predictions, using all the experimental information available in the literature [132]. However, there
exists uncertainty in this conclusion, in that the clear winner model was selected on the basis of a limited
number of possibly sub-optimal experiments. The purpose of this work is to increase the scope of the
work of Zhou et al. [132] to a CH4-fed system, which is among the target feedstocks for gaseous CLC. To
simplify the problem, the three best models selected by Zhou et al. [132] are designated as the candidate
mechanistic solid-state reaction models, motivating the need for model discrimination. Table 6.2 shows
the rate expressions of these solid-state kinetic models: Avrami-Erofe’ev (AE), shrinking core (SC) and
volumetric (V) models. A modified form of the V model was proposed by Iliuta et al. [58] to account for
the commonly observed activation step in the reduction of NiO by CH4. The modified volumetric model
(MV) was previously used to arrive at accurate predictions of several literature-reported CLC and CLR
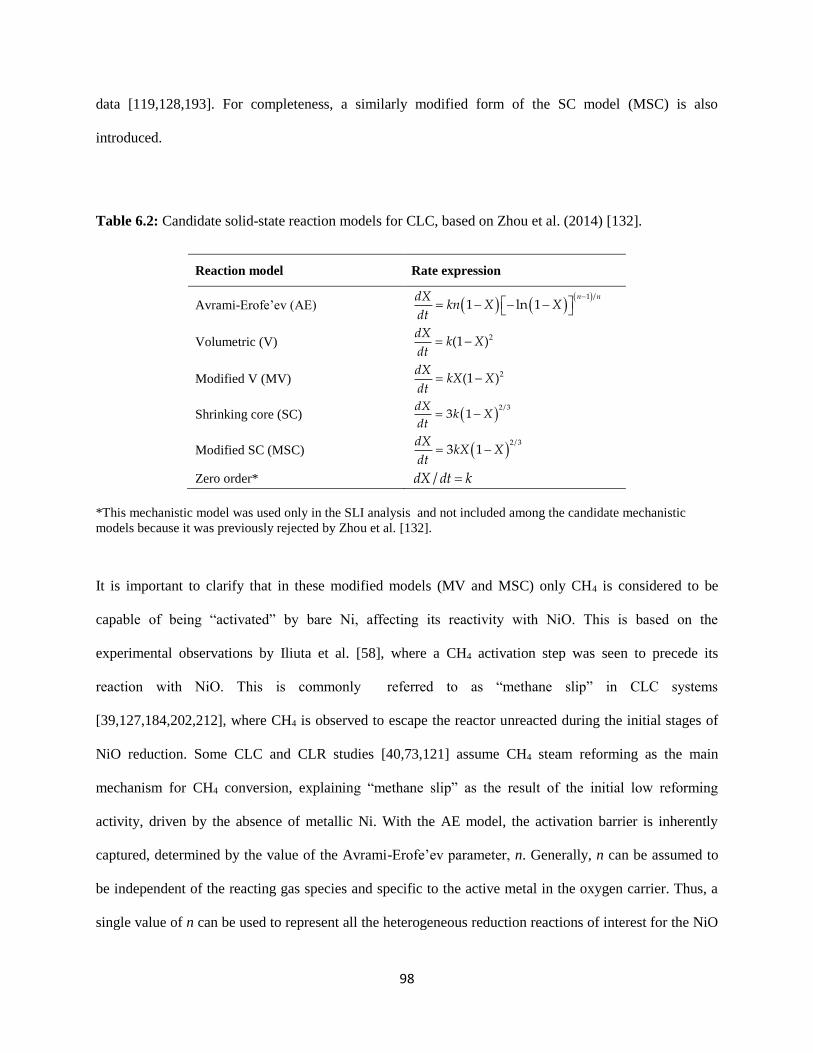
98
data [119,128,193]. For completeness, a similarly modified form of the SC model (MSC) is also
introduced.
Table 6.2: Candidate solid-state reaction models for CLC, based on Zhou et al. (2014) [132].
Reaction model Rate expression
Avrami-Erofe’ev (AE)
1 /
1 ln 1n ndX
kn X Xdt
Volumetric (V) 2(1 )dX
k Xdt
Modified V (MV) 2(1 )dX
kX Xdt
Shrinking core (SC) 2/3
3 1dX
k Xdt
Modified SC (MSC) 2/3
3 1dX
kX Xdt
Zero order* /dX dt k
*This mechanistic model was used only in the SLI analysis and not included among the candidate mechanistic
models because it was previously rejected by Zhou et al. [132].
It is important to clarify that in these modified models (MV and MSC) only CH4 is considered to be
capable of being “activated” by bare Ni, affecting its reactivity with NiO. This is based on the
experimental observations by Iliuta et al. [58], where a CH4 activation step was seen to precede its
reaction with NiO. This is commonly referred to as “methane slip” in CLC systems
[39,127,184,202,212], where CH4 is observed to escape the reactor unreacted during the initial stages of
NiO reduction. Some CLC and CLR studies [40,73,121] assume CH4 steam reforming as the main
mechanism for CH4 conversion, explaining “methane slip” as the result of the initial low reforming
activity, driven by the absence of metallic Ni. With the AE model, the activation barrier is inherently
captured, determined by the value of the Avrami-Erofe’ev parameter, n. Generally, n can be assumed to
be independent of the reacting gas species and specific to the active metal in the oxygen carrier. Thus, a
single value of n can be used to represent all the heterogeneous reduction reactions of interest for the NiO

99
system. The mechanistic models of Table 6.2 are used to describe the rate of the oxygen carrier reactions
found in Table 6.1. So far, 20 literature-reported kinetic models are possible for modeling of the NiO
reduction by CH4.
Table 6.3: Candidate catalytic reactions for CLC reduction with a Ni-based oxygen carrier and CH4 fuel
[119].
Reaction Stoichiometry
R6. Steam methane reforming (SMR) CH4 + H
2O↔CO + 3H
2
R7. Water gas shift (WGS) CO + H2O
↔CO
2 + H
2
R8. Overall SMR CH4 + 2H
2O↔ CO
2 + 4H
2
R9. Methanation CO + 3H2 → CH
4 + H
2O
R10. Dry reforming CH4 + CO
2↔ 2CO + 2H
2
R11. Methane cracking CH4 ↔ C + 2H
2
R12. C gasification by H2O C + H
2O ↔ CO + H
2
R13. C gasification by CO2 C + CO
2 ↔ 2CO
The problem is made significantly more complex by the introduction of the Ni-catalyzed reactions of CH4
and its gaseous and solid products, which cannot be neglected as Ni is the product of NiO reduction. First,
we explore the uncertainty in the relevant reaction schemes and later we discuss the issue of describing
the catalytic reactivity of Ni, when it coexists with NiO. Table 6.3 summarizes all the relevant catalytic
reactions reported to occur in the presence of Ni. It is noteworthy that most investigators do not use all of
the reactions listed in Table 6.3 in their kinetic models [119]. In particular, there are inconsistencies
between investigators on which combination of steam CH4 reforming and side reactions should be used
(R6-R13 in Table 6.3) [49,58,72,118,119,171,212,218].

100
Table 6.4: Possible reforming schemes used in the CLC literature.
RS I [171] RS II [118,218]
R6. CH4+H2O↔CO+3H2
R7. CO+H2O↔CO2 +H2
R8. CH4+2H2O↔CO2+4H2
R9. CO+3H2→CH4+H2O
R6. CH4+H2O↔CO+3H2
R7. CO+H2O↔CO2+H2
R8. CH4+2H2O↔CO2+4H2
RS III [49,58] RS IV [72,119,212]
R6. CH4+H2O↔CO+3H2
R7. CO+H2O↔ CO2+H2
R9. CO+3H2→H4+H2O
R6. CH4+H2O↔CO+3H2
R7. CO+H2O↔CO2+H2
Table 6.4 illustrates the reaction networks typically considered in steam methane reforming (SMR)
[49,58,72,118,119,171,212,218]. The most basic scheme (RS IV) consists of the SMR reaction in
conjunction with the water gas shift (WGS) reaction, usually considered at equilibrium. Additional side
reactions are the overall SMR and methanation reactions, which added to RS IV lead to RS II and III. The
most comprehensive CH4 reforming reaction network (RS I) under CLC conditions was proposed by Jin
et al [171] Nonetheless, RS II reflects the most widely used reaction network for CH4 steam reforming
over a Ni catalyst [219,220]. Xu and Froment [219] expressed the three reversible reactions, SMR, WGS,
and overall SMR, of RS II, based on a Langmuir-Hinshelwood reaction mechanism. In Zhou et al. [119],
the overall SMR and methanation reactions were omitted because those reaction rates can be obtained by
a combination of the first two reactions (SMR and WGS). However, the methanation reaction is often
postulated to occur irreversibly as a separate reaction [221], justifying RS III. If either the overall SMR or
the methanation reaction is not statistically significant to the overall CLC reaction scheme, similar
predictions can be attained by a simpler model from adjusting the kinetic rates of the SMR and WGS.
Therefore, the challenge that needs to be addressed is in the identification of the most statistically-rich
reaction scheme at the conditions relevant to CLC. Augmentation of the 20 feasible NiO reduction kinetic
models with the 4 reported reaction pathways for the catalytic reactions results in 80 possible reaction
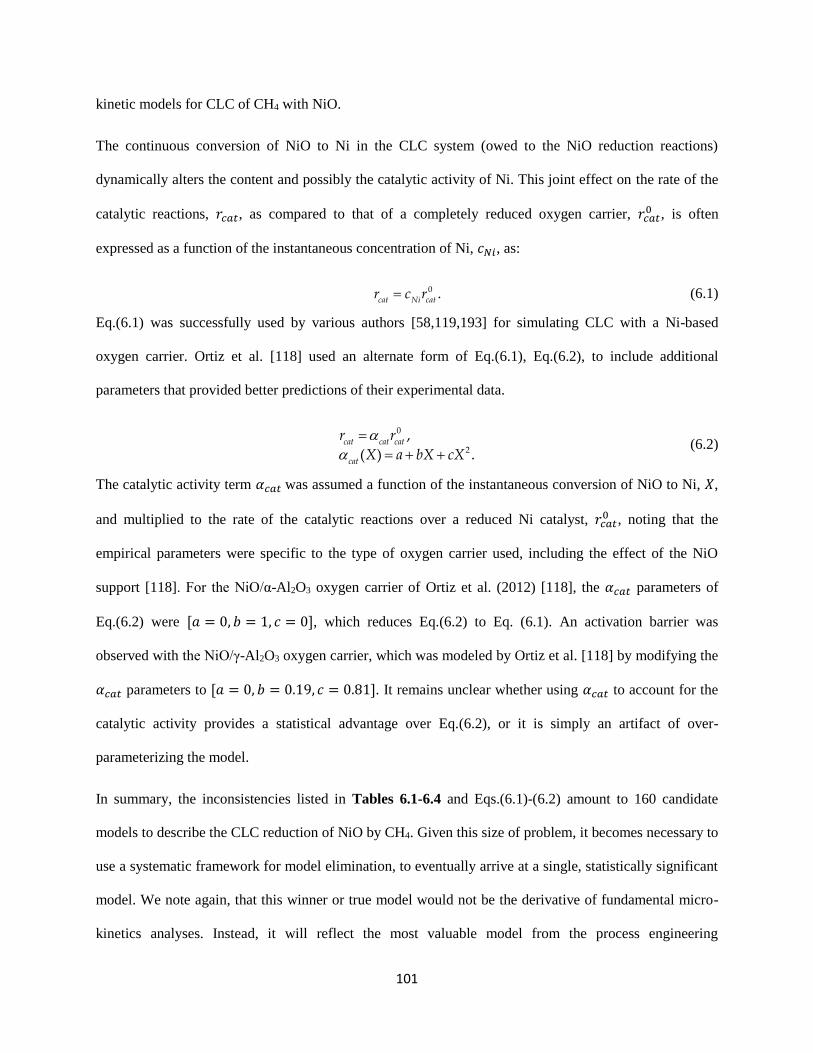
101
kinetic models for CLC of CH4 with NiO.
The continuous conversion of NiO to Ni in the CLC system (owed to the NiO reduction reactions)
dynamically alters the content and possibly the catalytic activity of Ni. This joint effect on the rate of the
catalytic reactions, 𝑟𝑐𝑎𝑡, as compared to that of a completely reduced oxygen carrier, 𝑟𝑐𝑎𝑡0 , is often
expressed as a function of the instantaneous concentration of Ni, 𝑐𝑁𝑖, as:
0 .cat Ni cat
r c r (6.1)
Eq.(6.1) was successfully used by various authors [58,119,193] for simulating CLC with a Ni-based
oxygen carrier. Ortiz et al. [118] used an alternate form of Eq.(6.1), Eq.(6.2), to include additional
parameters that provided better predictions of their experimental data.
0
2
,
( ) .cat cat cat
cat
r r
X a bX cX (6.2)
The catalytic activity term 𝛼𝑐𝑎𝑡 was assumed a function of the instantaneous conversion of NiO to Ni, 𝑋,
and multiplied to the rate of the catalytic reactions over a reduced Ni catalyst, 𝑟𝑐𝑎𝑡0 , noting that the
empirical parameters were specific to the type of oxygen carrier used, including the effect of the NiO
support [118]. For the NiO/α-Al2O3 oxygen carrier of Ortiz et al. (2012) [118], the 𝛼𝑐𝑎𝑡 parameters of
Eq.(6.2) were [𝑎 = 0, 𝑏 = 1, 𝑐 = 0], which reduces Eq.(6.2) to Eq. (6.1). An activation barrier was
observed with the NiO/γ-Al2O3 oxygen carrier, which was modeled by Ortiz et al. [118] by modifying the
𝛼𝑐𝑎𝑡 parameters to [𝑎 = 0, 𝑏 = 0.19, 𝑐 = 0.81]. It remains unclear whether using 𝛼𝑐𝑎𝑡 to account for the
catalytic activity provides a statistical advantage over Eq.(6.2), or it is simply an artifact of over-
parameterizing the model.
In summary, the inconsistencies listed in Tables 6.1-6.4 and Eqs.(6.1)-(6.2) amount to 160 candidate
models to describe the CLC reduction of NiO by CH4. Given this size of problem, it becomes necessary to
use a systematic framework for model elimination, to eventually arrive at a single, statistically significant
model. We note again, that this winner or true model would not be the derivative of fundamental micro-
kinetics analyses. Instead, it will reflect the most valuable model from the process engineering

102
perspective; the one that can be used in process and reactor design without the bottlenecks of uncertainty
and arbitrary experimental bias. For convenience, the models are referred throughout the rest of the paper
as 𝐌𝐴−𝐵−𝐶−𝐷, where A denotes the NiO reduction reaction pathway (RS I-IV) of Table 6.1, B the
reaction models (AE, SC, V, SCM, VM) of Table 6.2, C the catalytic reforming scheme (RS I-IV) of
Table 6.4, and D the function capturing the effect of Ni on the catalytic reactivity (1→ Eq.(6.1); 2→
Eq.(6.2)). Section 6.2.2 discusses the conventional CLC experiments used to extract kinetic parameters
and compares their capability to identify each reaction using a previously validated kinetic model. To
meet the target of identifying a single “true” model, the experimental investment would be large and does
not guarantee statistically significance in the model structure or parameters. Thus, an optimal way to
design experiments is needed. Section 6.3 details the proposed solution approach to address the reaction
kinetics problem, based on a model-based experiment design framework.
6.2.2. Ill-designed experiments
In this section, we motivate the design of experimental setups and conditions by analyzing the sensitivity
of the product gases in a fixed bed CLC reactor, operated with a NiO oxygen carrier and CH4 reducing
feed [128,193]. The objective is to illustrate the dynamic sensitivity of typical fixed bed CLC
measurements with respect to the kinetic parameters of a given model in various reactor designs. In
essence, we explore the impact of experimentation apparatus and its design, before entering the discussion
of how to design optimal experiments for it. Potential deficits of conventional experiment designs are
identified, on the basis of low sensitivities of the measured variables to the kinetic parameters. From these
case studies, it becomes evident that the “rules-of-thumb” of traditional experiment designs are
inadequate to derive precise estimates of model parameters, within a reasonable timeframe and effort.
6.2.2.1. Sensitivity analysis of NiO reduction by CH4 in existing reactor designs
The reduction of NiO by CH4 was previously [128,193] described by a 1-D heterogeneous reactor model
described in Chapter 5 with the kinetic model with structure 𝐌𝐼−𝐼𝐼𝐼−𝐼𝑉−𝐼 . The same model was applied to
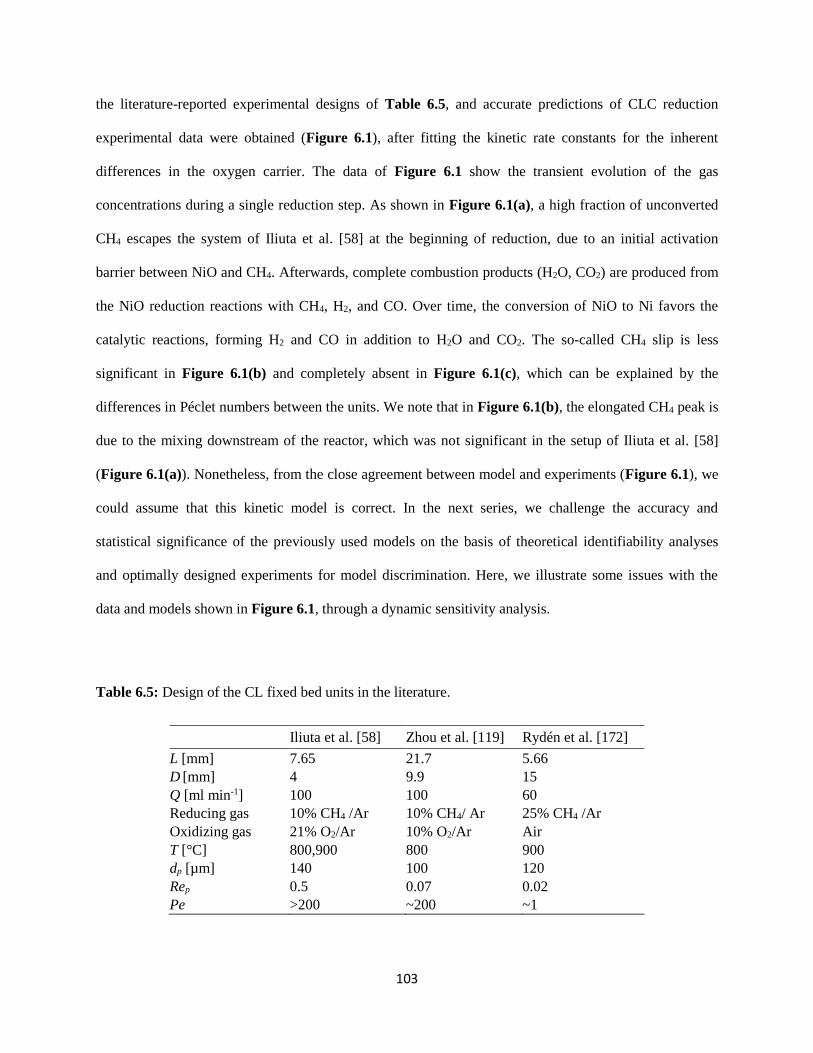
103
the literature-reported experimental designs of Table 6.5, and accurate predictions of CLC reduction
experimental data were obtained (Figure 6.1), after fitting the kinetic rate constants for the inherent
differences in the oxygen carrier. The data of Figure 6.1 show the transient evolution of the gas
concentrations during a single reduction step. As shown in Figure 6.1(a), a high fraction of unconverted
CH4 escapes the system of Iliuta et al. [58] at the beginning of reduction, due to an initial activation
barrier between NiO and CH4. Afterwards, complete combustion products (H2O, CO2) are produced from
the NiO reduction reactions with CH4, H2, and CO. Over time, the conversion of NiO to Ni favors the
catalytic reactions, forming H2 and CO in addition to H2O and CO2. The so-called CH4 slip is less
significant in Figure 6.1(b) and completely absent in Figure 6.1(c), which can be explained by the
differences in Péclet numbers between the units. We note that in Figure 6.1(b), the elongated CH4 peak is
due to the mixing downstream of the reactor, which was not significant in the setup of Iliuta et al. [58]
(Figure 6.1(a)). Nonetheless, from the close agreement between model and experiments (Figure 6.1), we
could assume that this kinetic model is correct. In the next series, we challenge the accuracy and
statistical significance of the previously used models on the basis of theoretical identifiability analyses
and optimally designed experiments for model discrimination. Here, we illustrate some issues with the
data and models shown in Figure 6.1, through a dynamic sensitivity analysis.
Table 6.5: Design of the CL fixed bed units in the literature.
Iliuta et al. [58] Zhou et al. [119] Rydén et al. [172]
L [mm] 7.65 21.7 5.66
D [mm] 4 9.9 15
Q [ml min-1] 100 100 60
Reducing gas 10% CH4 /Ar 10% CH4/ Ar 25% CH4 /Ar
Oxidizing gas 21% O2/Ar 10% O2/Ar Air
T [°C] 800,900 800 900
dp [µm] 140 100 120
Rep 0.5 0.07 0.02
Pe >200 ~200 ~1
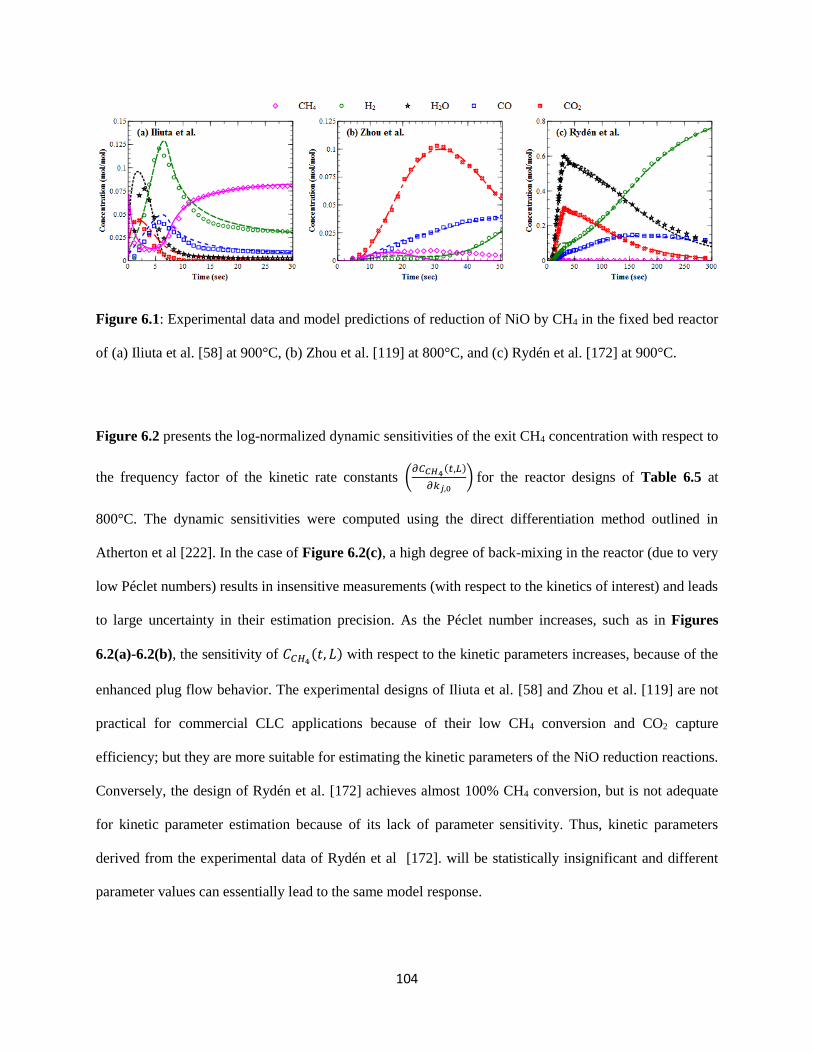
104
Figure 6.1: Experimental data and model predictions of reduction of NiO by CH4 in the fixed bed reactor
of (a) Iliuta et al. [58] at 900°C, (b) Zhou et al. [119] at 800°C, and (c) Rydén et al. [172] at 900°C.
Figure 6.2 presents the log-normalized dynamic sensitivities of the exit CH4 concentration with respect to
the frequency factor of the kinetic rate constants (𝜕𝐶𝐶𝐻4
(𝑡,𝐿)
𝜕𝑘𝑗,0) for the reactor designs of Table 6.5 at
800°C. The dynamic sensitivities were computed using the direct differentiation method outlined in
Atherton et al [222]. In the case of Figure 6.2(c), a high degree of back-mixing in the reactor (due to very
low Péclet numbers) results in insensitive measurements (with respect to the kinetics of interest) and leads
to large uncertainty in their estimation precision. As the Péclet number increases, such as in Figures
6.2(a)-6.2(b), the sensitivity of 𝐶𝐶𝐻4(𝑡, 𝐿) with respect to the kinetic parameters increases, because of the
enhanced plug flow behavior. The experimental designs of Iliuta et al. [58] and Zhou et al. [119] are not
practical for commercial CLC applications because of their low CH4 conversion and CO2 capture
efficiency; but they are more suitable for estimating the kinetic parameters of the NiO reduction reactions.
Conversely, the design of Rydén et al. [172] achieves almost 100% CH4 conversion, but is not adequate
for kinetic parameter estimation because of its lack of parameter sensitivity. Thus, kinetic parameters
derived from the experimental data of Rydén et al [172]. will be statistically insignificant and different
parameter values can essentially lead to the same model response.
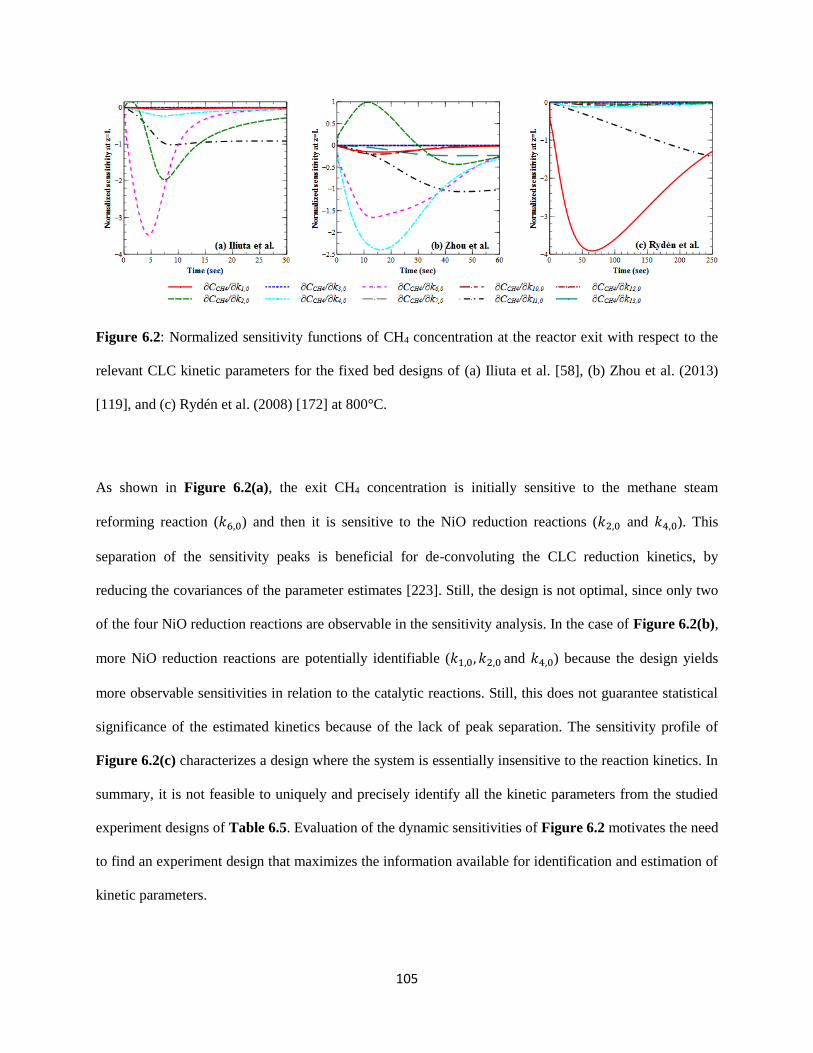
105
Figure 6.2: Normalized sensitivity functions of CH4 concentration at the reactor exit with respect to the
relevant CLC kinetic parameters for the fixed bed designs of (a) Iliuta et al. [58], (b) Zhou et al. (2013)
[119], and (c) Rydén et al. (2008) [172] at 800°C.
As shown in Figure 6.2(a), the exit CH4 concentration is initially sensitive to the methane steam
reforming reaction (𝑘6,0) and then it is sensitive to the NiO reduction reactions (𝑘2,0 and 𝑘4,0). This
separation of the sensitivity peaks is beneficial for de-convoluting the CLC reduction kinetics, by
reducing the covariances of the parameter estimates [223]. Still, the design is not optimal, since only two
of the four NiO reduction reactions are observable in the sensitivity analysis. In the case of Figure 6.2(b),
more NiO reduction reactions are potentially identifiable (𝑘1,0, 𝑘2,0 and 𝑘4,0) because the design yields
more observable sensitivities in relation to the catalytic reactions. Still, this does not guarantee statistical
significance of the estimated kinetics because of the lack of peak separation. The sensitivity profile of
Figure 6.2(c) characterizes a design where the system is essentially insensitive to the reaction kinetics. In
summary, it is not feasible to uniquely and precisely identify all the kinetic parameters from the studied
experiment designs of Table 6.5. Evaluation of the dynamic sensitivities of Figure 6.2 motivates the need
to find an experiment design that maximizes the information available for identification and estimation of
kinetic parameters.
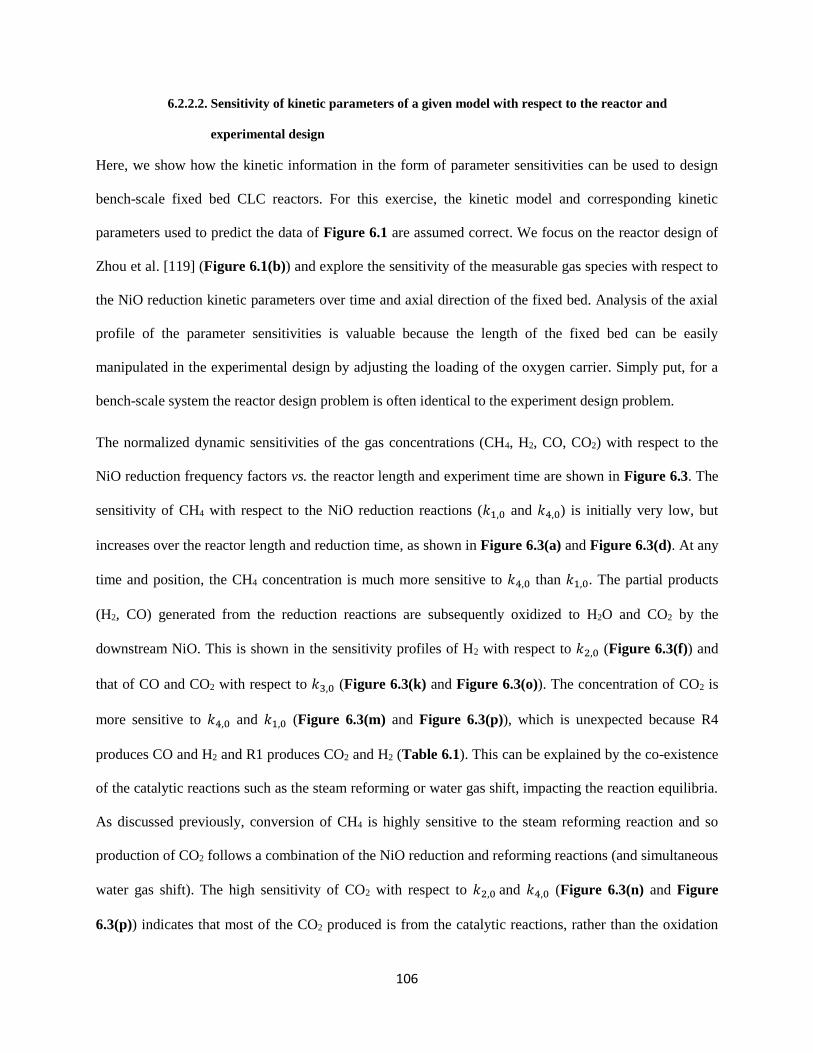
106
6.2.2.2. Sensitivity of kinetic parameters of a given model with respect to the reactor and
experimental design
Here, we show how the kinetic information in the form of parameter sensitivities can be used to design
bench-scale fixed bed CLC reactors. For this exercise, the kinetic model and corresponding kinetic
parameters used to predict the data of Figure 6.1 are assumed correct. We focus on the reactor design of
Zhou et al. [119] (Figure 6.1(b)) and explore the sensitivity of the measurable gas species with respect to
the NiO reduction kinetic parameters over time and axial direction of the fixed bed. Analysis of the axial
profile of the parameter sensitivities is valuable because the length of the fixed bed can be easily
manipulated in the experimental design by adjusting the loading of the oxygen carrier. Simply put, for a
bench-scale system the reactor design problem is often identical to the experiment design problem.
The normalized dynamic sensitivities of the gas concentrations (CH4, H2, CO, CO2) with respect to the
NiO reduction frequency factors vs. the reactor length and experiment time are shown in Figure 6.3. The
sensitivity of CH4 with respect to the NiO reduction reactions (𝑘1,0 and 𝑘4,0) is initially very low, but
increases over the reactor length and reduction time, as shown in Figure 6.3(a) and Figure 6.3(d). At any
time and position, the CH4 concentration is much more sensitive to 𝑘4,0 than 𝑘1,0. The partial products
(H2, CO) generated from the reduction reactions are subsequently oxidized to H2O and CO2 by the
downstream NiO. This is shown in the sensitivity profiles of H2 with respect to 𝑘2,0 (Figure 6.3(f)) and
that of CO and CO2 with respect to 𝑘3,0 (Figure 6.3(k) and Figure 6.3(o)). The concentration of CO2 is
more sensitive to 𝑘4,0 and 𝑘1,0 (Figure 6.3(m) and Figure 6.3(p)), which is unexpected because R4
produces CO and H2 and R1 produces CO2 and H2 (Table 6.1). This can be explained by the co-existence
of the catalytic reactions such as the steam reforming or water gas shift, impacting the reaction equilibria.
As discussed previously, conversion of CH4 is highly sensitive to the steam reforming reaction and so
production of CO2 follows a combination of the NiO reduction and reforming reactions (and simultaneous
water gas shift). The high sensitivity of CO2 with respect to 𝑘2,0 and 𝑘4,0 (Figure 6.3(n) and Figure
6.3(p)) indicates that most of the CO2 produced is from the catalytic reactions, rather than the oxidation

107
reactions with NiO.
Figure 6.3: Surface plot of the normalized dynamic sensitivity of gases (CH4, H2, CO and CO2) to the
NiO reduction kinetic parameters, for the experimental setup of Zhou et al. [119].
Based on Figure 6.3, we can design an optimal reactor length and experiment duration that maximizes the
sensitivities of the measured gases with respect to the NiO reduction kinetics in an effort to improve the
precision of the parameter estimates. The absolute maximum of the sensitivity functions is generally
located at the reactor exit for the design of Zhou et al. [119]. This is advantageous from the experimental
perspective, because the exhaust gases are measured downstream the reactor. Furthermore, it is possible
that increasing the reactor length can increase the dynamic sensitivity response of the exhaust gas with
108
respect to the NiO reduction kinetic parameters. Even so, it is challenging to identify 𝑘1,0 and 𝑘3,0
because they generally exhibit lower sensitivities as compared to 𝑘2,0 and 𝑘4,0. Thus, a different solution
approach is needed to estimate all the uncertain kinetic parameters, beyond simply examining the
sensitivity responses. In the next section, we introduce model-based experiment design methods as the
solution approach to design better experiments to study the reduction of NiO by CH4.
6.3. Design of experiments
6.3.1. State of the art of model-based methods
Methods for design of experiments (DOE) have been widely used to provide rich experimental
information at minimum effort. The objective of DOE is to minimize uncertainty and maximize the useful
information that can be extracted from the experiment. Early applications of DOE, such as factorial
methods, randomized blocks, and Latin squares, viewed experiments as a series of inputs and outputs and
selected the best combination of inputs to maximize the information about their relationship in the
presence of experimental variance [224–227]. These classical design techniques are commonly referred to
as black-box methods and are still widely used, because they are easy to implement, their results are
easily interpreted, and allow the study of interactions between factors [228–231]. However, these methods
are not well-suited for dynamic experiments and can be expensive in terms of experimental resources
[232].
Model-based DOE relies on the explicit use of a mathematical model with some uncertainty in its
parameters and/or model structure, cast as an optimization problem to predict the information content of
the next series of experiments. These model equations reflect our current state of understanding of the
process being investigated, wherein the use of unknown parameters and semi-empirical model structures
denotes incomplete knowledge. Early applications of model-based DOE in the field of chemical kinetics
were conducted for steady-state systems [233–237]. These concepts were extended to dynamic processes
by Mehra [238], Shirt et al. [239], and Macchietto et al. [240–243]. Similar problems in the field of bio-

109
kinetics were treated within the model-based DOE framework to address the lack of parameter
identifiability [244–247]. More recent work on model-based experimental design techniques is focused on
developing new objective functions [248–250], robust algorithms [251–254], and efficient methods to
handle uncertainty [255]. The model-based designs have been successfully applied to a wide range of
systems to facilitate and improve the modeling of chemical kinetics [223,256–262], biochemical networks
[263,264], and biological processes [265–267]. The potential applications are abundant across all
engineering disciplines and can be applied to any system (linear, non-linear, steady-state or dynamic). In
this work, we apply the model-based DOE to partially address the controversy of the kinetic models for
the NiO-CH4 system in order to minimize the experimental effort required to construct a sufficiently
accurate and statistically significant model. In the next section, we provide the complete mathematical
background for this analysis.
6.3.2. Mathematical formulation
The general representation of a CLC process model with structure 𝐌 is written as a set of differential and
algebraic equations (DAEs), as shown in Eq.(6.3):
, , , , 0,:
ˆ ,
t t t t
t t
f x x u θM
y h x (6.3)
where 𝐟 is the system of differential equations describing the conservation of mass, energy, and
momentum for the gas and solid phases, 𝐱(𝑡) is the vector of the time-dependent state variables, such as
concentration, temperature, and pressure, 𝐮(𝑡) is the manipulated process variables (e.g., gas flow rate
and composition), 𝛉 is the set of kinetic parameters to be estimated, and t is the time. The vector of
measured variables, ��(𝑡), is a function of the state variables, selected by 𝐡(𝐱(𝑡)) to match the sampling
times of the measurement device 𝐭𝑠𝑝. The system of equations is constrained by algebraic and differential
constraints, marked by the equation of state, flux balances, molar expansion terms, thermodynamic
calculations, etc.
Let us define a generic experiment design vector 𝛟′, containing the set of manipulated variables:
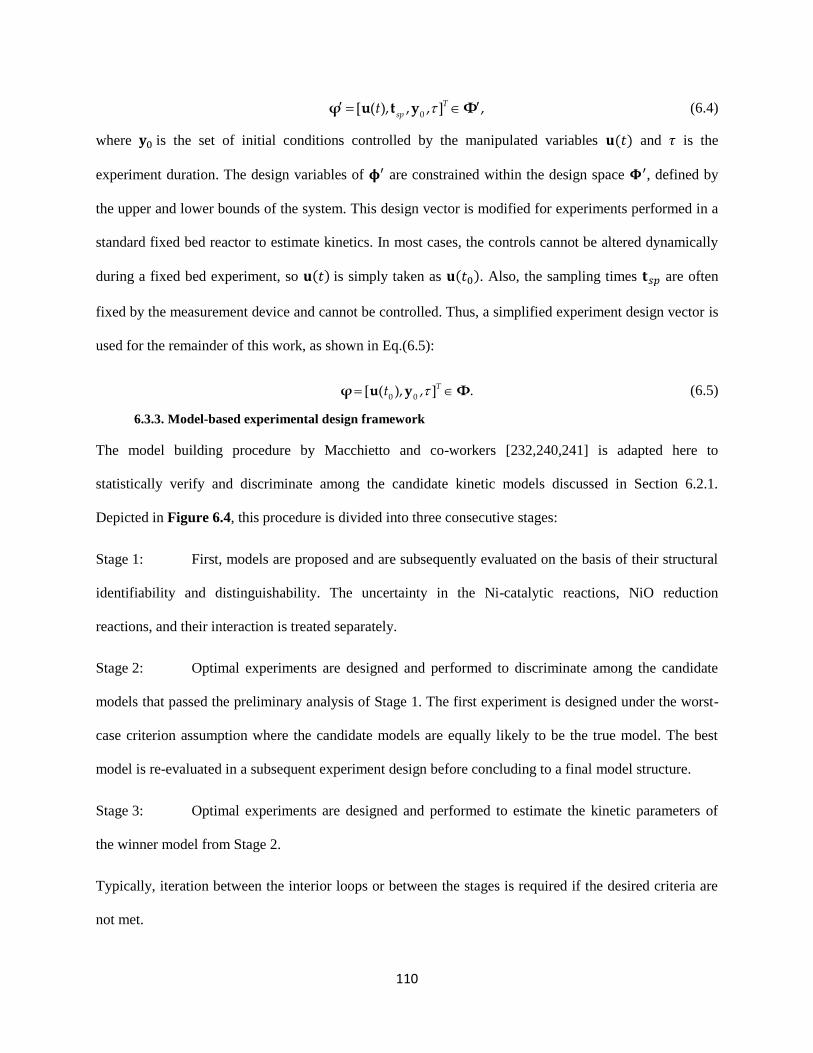
110
0
[ ( ), , ,, ]T
sptu t y Φφ (6.4)
where 𝐲0 is the set of initial conditions controlled by the manipulated variables 𝐮(𝑡) and 𝜏 is the
experiment duration. The design variables of 𝛟′ are constrained within the design space 𝚽′, defined by
the upper and lower bounds of the system. This design vector is modified for experiments performed in a
standard fixed bed reactor to estimate kinetics. In most cases, the controls cannot be altered dynamically
during a fixed bed experiment, so 𝐮(𝑡) is simply taken as 𝐮(𝑡0). Also, the sampling times 𝐭𝑠𝑝 are often
fixed by the measurement device and cannot be controlled. Thus, a simplified experiment design vector is
used for the remainder of this work, as shown in Eq.(6.5):
0 0
[ ( ), ] ., Ttφ u y Φ (6.5)
6.3.3. Model-based experimental design framework
The model building procedure by Macchietto and co-workers [232,240,241] is adapted here to
statistically verify and discriminate among the candidate kinetic models discussed in Section 6.2.1.
Depicted in Figure 6.4, this procedure is divided into three consecutive stages:
Stage 1: First, models are proposed and are subsequently evaluated on the basis of their structural
identifiability and distinguishability. The uncertainty in the Ni-catalytic reactions, NiO reduction
reactions, and their interaction is treated separately.
Stage 2: Optimal experiments are designed and performed to discriminate among the candidate
models that passed the preliminary analysis of Stage 1. The first experiment is designed under the worst-
case criterion assumption where the candidate models are equally likely to be the true model. The best
model is re-evaluated in a subsequent experiment design before concluding to a final model structure.
Stage 3: Optimal experiments are designed and performed to estimate the kinetic parameters of
the winner model from Stage 2.
Typically, iteration between the interior loops or between the stages is required if the desired criteria are
not met.

111
Figure 6.4: The overall model-based experimental design framework adapted from Macchietto et al.
[232,240,241] as the solution approach to the problem statement of Section 6.2.
6.3.3.1. Stage 1: Preliminary analysis
In the development of a model, the mechanisms of the system under investigation are not always fully
understood and experiments are needed to better understand them. Often, several plausible models can be
conceptualized to describe the physical phenomena. During the preliminary model analysis, identifiability
tests are conducted to assess the structure of the proposed model(s) [268,269]; specifically, to confirm in
principle if an experiment design exists such that the parameters can be given unique values for a certain
model structure. It is often argued that issues encountered during parameter estimation by means of data
fitting are originated from the lack of identifiability of the unknown parameters [270]. To overcome this
issue, theories of identifiability analysis have been postulated, including structural (theoretical)
identifiability, practical identifiability, and sensitivity matrix analysis [271–273]. If a lack of
identifiability is encountered from the structural analysis, it necessitates the rejection or reformulation of
the model structure [270]. Practical identifiability, on the other hand, deals with the issue of limited,
noise-corrupted data, which can be overcome via increasing the number of sampling times, measurement

112
devices, or their precision [274]. Here, structural identifiability analysis is used to check for potential non-
identifiability of the CLC kinetic parameters of the set of possible model structures. If lack of
identifiability is encountered from the structural analysis, it necessitates the rejection or reformulation of
the model structure [270]. In practice, this means that for a given model structure, if parameters cannot be
uniquely identified, then experimentation is going to be inconclusive. In this work, the structural
identifiability analysis is used to check the selection of the kinetic models and ensure that the kinetic
parameters they contain are mathematically distinct, following the steps of Stage 1 (Figure 6.4). Kinetic
models with non-identifiable parameters are rejected in this preliminary analysis, while remaining models
are then evaluated in terms of model distinguishability.
6.3.3.1.1. Structural identifiability analysis
Structural identifiability methods were reviewed in detail by Miao et al. [271]. The simplest method is the
analytical direct test [275,276], which is argued to have limited applications because of the advanced
methods needed to obtain analytical solutions [277]. More promising methods have been developed to
detect structural non-identifiability, such as the power series expansion [278], the generating power series
approach [279], the similarity transform approach [280,281], differential algebraic methods [272,282],
and a method based on the implicit function theorem [283]. An optimization-based approach was
proposed by Asprey et al. [241,284] to test for global structural identifiability. Vikhansky [258] modified
the optimization problem proposed by Asprey et al. [241,284] to reduce the computation difficulties in
finding a global minimum. Raue et al. [285] proposed a profile likelihood approach to infer parameter
uncertainties in a higher-dimensional parameter space. Unfortunately, the applicability of these methods
rapidly becomes infeasible with increasing model complexity [286].
Structural identifiability of the kinetic models is analyzed on the basis of the local and global
identifiability tests, as outlined by Galvanin et al. [287]. First, the Structural Local Identifiability (SLI) of
the parameters is checked by the correlation matrix approach [288,289]. A correlation matrix of the
parameters (��0) is calculated from the Fisher information matrix, given in Eq.(6.6):

113
0
1
0
1
ˆ ,( ) ,y yN N
T
θ rs r sr s
Q Qθ φH (6.6)
where 𝜎𝑟𝑠 represents the rs-th element of inverse of the matrix of experiment errors and 𝐐𝑟 is the 𝑁𝑠𝑝 ×
𝑁𝜃 matrix of the dynamic sensitivity evaluated around the initial values of the parameters ��0 for the 𝑟-th
response variable, as defined in Eq.(6.7):
1 1
0 0
1
0 0
1
ˆ ˆ
.
ˆ
ˆ ˆ
ˆ
ˆ
ˆ
Nsp Nsp
r r
Nt t
r
r r
Nt t
y y
y y
Q (6.7)
If the measurement errors are uncorrelated and follow a normal distribution with a zero mean, it can be
proved from the Cramèr-Rao theorem [239,290] that the inverse of 𝐇𝜃 is equal to the variance-covariance
matrix 𝐕𝜃 [271]. The correlation matrix is constructed from the elements of 𝐕𝜃, as shown in Eq.(6.8):
( , ), ,
( , ) ( , )
1, .
i j
ij
i i j j
ij
Vr i j
V V
r i j
(6.8)
If 𝜃𝑖 and 𝜃𝑗 are strongly correlated, their correlation coefficient 𝑟𝑖𝑗 is close to 1, and they are thus non-
identifiable [253,287,291,292]. For most cases, non-singularity of 𝐇𝜃 is also accepted as a criterion for
satisfying the SLI test [293].
We note that the information matrix has an important role in optimizing experiment designs for parameter
estimation, which is relevant to the question of identifiability. The SLI test performed in this work takes
advantage of the information matrix, by solving a D-optimal design problem, to seek a hypothetical
design that minimizes the correlation between the kinetic parameters [294], shown in Eq.(6.9). If the
parameters are still highly correlated under the best-case scenario of the D-optimal design, then it
warrants the rejection of the respective kinetic model from the analysis.
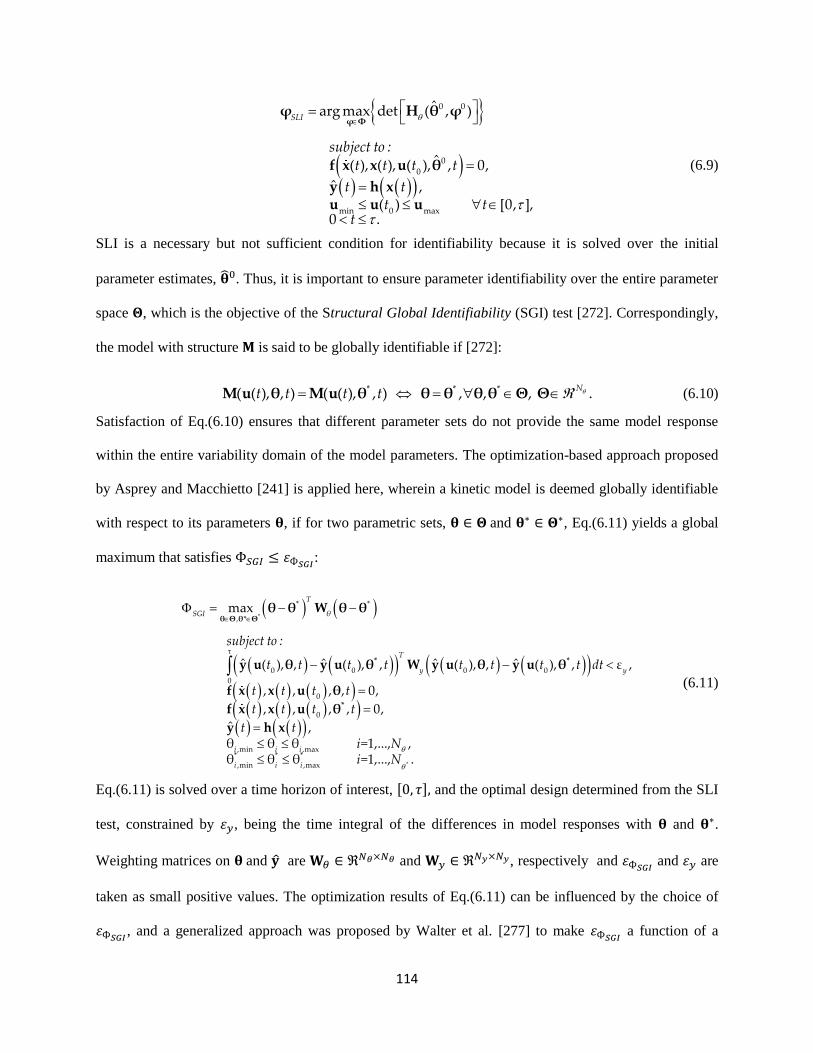
114
0 0
0
min 0 ax
0
m
arg max det
( ), ( ), (
ˆ( , )
ˆ
,( )
), ,
[0
0,
, ,0 .
ˆ]
SLI
subject to :t t tt
t tt t
t
φ ΦH θ φ
θ
y h xu u u
φ
f x x u (6.9)
SLI is a necessary but not sufficient condition for identifiability because it is solved over the initial
parameter estimates, ��0. Thus, it is important to ensure parameter identifiability over the entire parameter
space 𝚯, which is the objective of the Structural Global Identifiability (SGI) test [272]. Correspondingly,
the model with structure 𝐌 is said to be globally identifiable if [272]:
* * * ( ( ), , ) ( ( ), , ) , , . , Nt t t tM M θ θ θu θ u θ θ Θ Θ (6.10)
Satisfaction of Eq.(6.10) ensures that different parameter sets do not provide the same model response
within the entire variability domain of the model parameters. The optimization-based approach proposed
by Asprey and Macchietto [241] is applied here, wherein a kinetic model is deemed globally identifiable
with respect to its parameters 𝛉, if for two parametric sets, 𝛉 ∈ 𝚯 and 𝛉∗ ∈ 𝚯∗, Eq.(6.11) yields a global
maximum that satisfies Φ𝑆𝐺𝐼 ≤ 𝜀Ф𝑆𝐺𝐼:
*
0 0 0 0
0
* *
, *
0
,min ,max* * *
,min ,max
0
max
ˆ ˆ ˆ ˆ
, , , , 0,
, , , , 0,
,θ θ θ
( ), , ( ), , ( ), , ( ), , ε ,
=1,..., ,θ θ θ
ˆ
T
SGI θ
τ T
y y
i i i
i i i
t t t t
t t t t
t
subject to :
t t
t t t
t tN
t t dt
i
θ Θ θ Θ
* *
*
θ θ W θ θ
y u θ y u θ W y u θ y u
f x x u θ
f
θ
x x u θ
y h x
* =1,..., .i N
(6.11)
Eq.(6.11) is solved over a time horizon of interest, [0, 𝜏], and the optimal design determined from the SLI
test, constrained by 𝜀𝑦, being the time integral of the differences in model responses with 𝛉 and 𝛉∗.
Weighting matrices on 𝛉 and �� are 𝐖𝜃 ∈ ℜ𝑁𝜃×𝑁𝜃 and 𝐖𝑦 ∈ ℜ𝑁𝑦×𝑁𝑦, respectively and 𝜀Ф𝑆𝐺𝐼 and 𝜀𝑦 are
taken as small positive values. The optimization results of Eq.(6.11) can be influenced by the choice of
𝜀Ф𝑆𝐺𝐼, and a generalized approach was proposed by Walter et al. [277] to make 𝜀Ф𝑆𝐺𝐼
a function of a

115
specific weighting factor given to each parameter. No weighting function is required for �� in this study
because they are molar fractions of the exit gas stream. To treat kinetic parameters equally, 𝐖𝜃
normalizes the kinetic constants to a reference temperature.
6.3.3.1.2. Model distinguishability
Another possible scenario in the analysis of the kinetic models is that some of these models provide
practically the same responses, within the input and parameter space determined. In practice, this means
that two different models are indistinguishable if their responses overlie, for any 𝛉 ∈ 𝚯, 𝛉∗ ∈ 𝚯∗, 𝛟 ∈ 𝚽,
and the same initial conditions.[241] Therefore, the test for model distinguishability is formulated as a
semi-infinite max-min optimization problem, that maximizes (with respect to 𝛟) the minimum (with
respect to 𝛉, 𝛉∗) of the time integral of the differences between the responses of different model
structures, �� and ��∗, as shown in Eq.(6.12):
* *
*
0 0,
*
0 0
0
*
0* *
,min ,max* * *
,min ,max
*
0*
*
max min , , , ,
, , , ,
, , , , 0,
,
, , , , 0,
,θ θ θ =1,..., ,θ θ θ =1
ˆ ˆ
ˆ
ˆ
ˆ
,
ˆ
τ T
y
D
i i i
i i i
t t t
t t t
t t t t
t t
t t t t
t ti N
t
t dt
subject to :
i
φ Φ θ Θ θ Θu θ u θ
u θ u θ
f x x u θ
y h x
f x x u θ
y h
y
y
x
y
W y
*
min 0 max
..., ,( ) [0, ].
Nt tu u u
(6.12)
The two models can be deemed distinguishable if Ф𝐷 ≥ 𝜀Ф𝐷. Asprey and Macchietto[241] recommended
that 𝜀Ф𝐷 be the integral of the expected variance of the measured 𝐲.
6.3.3.2. Stage 2: Experiment design for model discrimination
With a collection of competing models with structures that have been deemed identifiable and
distinguishable, experimental evidence is necessary to extract a winner model that best represents the
physical system. In this stage, an optimal experiment is specifically designed to for the task of optimizing
the discriminability between competing models. This approach finds an optimum design which
116
maximizes the divergence of the model trajectories, whereby poorly representative models are easily
detected and thusly rejected. Assuming that the lack-of-fit of a model to the experimental data is
attributed to experimental noise, parameter uncertainty, and inadequacy of the model structure, this stage
maximizes the contribution of the latter and facilitates a comparison between rival models and selection
of a winner model [295]. Several authors have addressed the problem of constructing optimum designs
for this purpose [296–299]. This criterion was termed, T-optimality following the fundamental work by
Atkinson and Fedorov [297,298] who applied it in the discrimination between two competing regression
models. Various procedures and implementation of T-optimum designs have been considered (see for
instance Uciński and Bogacka [300], Dette and co-workers [301,302], Tommasi and López-Fidalgo [303],
and Waterhouse et al. [304] among others).
In the literature, many contributions to the design of experiments for model discrimination were
conducted via the Bayesian [305–308] and frequentist approaches [252,309–311]. Under the Bayesian
approach, the models are translated into Bayesian probability models, of which parameters are treated as
random variables with a prior distribution. A utility function, which quantifies the discriminability of the
rival models, is optimized with respect to the new decision variables. Within the Bayesian framework,
randomness in experiment outcomes and uncertainty in model parameters are considered. After the nth
experiment stage, posterior distributions for parameters and models from the proceeding n-1 stage are
taken as the new prior distributions for the nth trial.
In contrast to the Bayesian approach, model selection from the frequentist perspective is focused on
comparison of the sum of squares achieved with each model against the data. All the models are assigned
an equal probability and an optimal experiment is designed to maximize the dissimiarility of the models.
Upon execution of the frequentist designed experiments, the candidate models are assessed based on the
statistical tests, such as the classical 𝜒2 test, in the data analysis [312]. Models can be rejected if the sum
of the weighted residuals is unacceptably high, or retained if it is within statistical acceptable limits of the
process. Various authors have found that despite the inherent differences between the Bayesian and
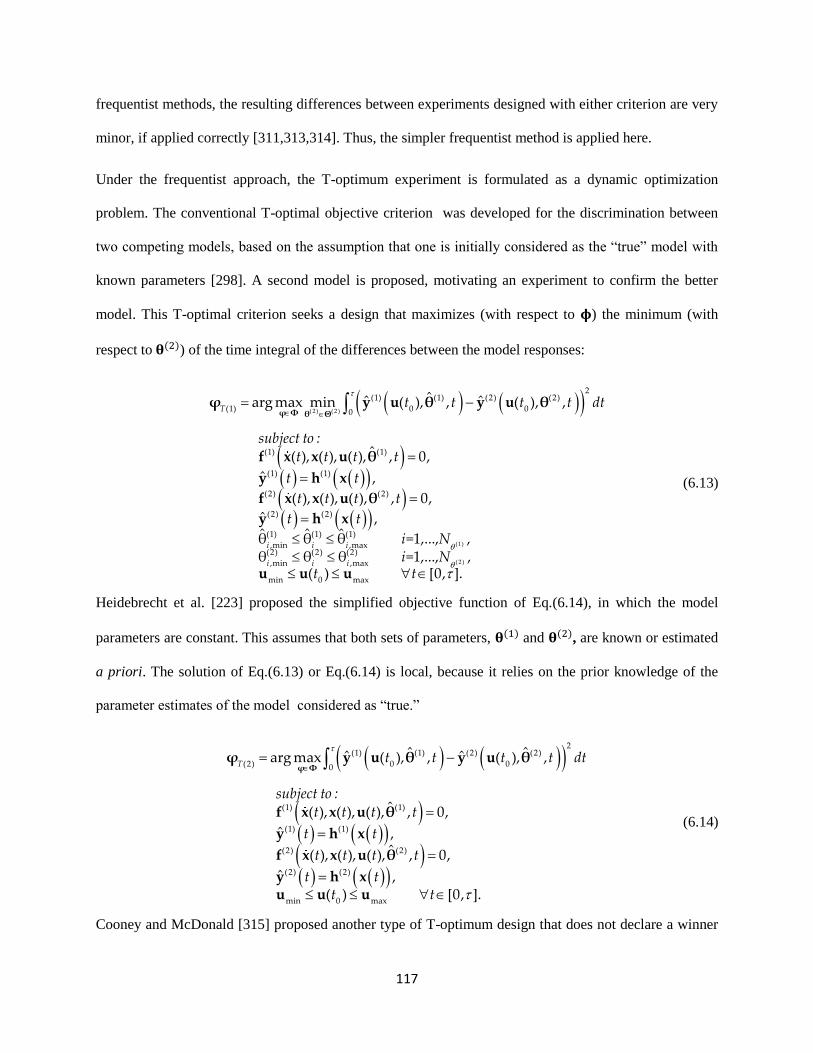
117
frequentist methods, the resulting differences between experiments designed with either criterion are very
minor, if applied correctly [311,313,314]. Thus, the simpler frequentist method is applied here.
Under the frequentist approach, the T-optimum experiment is formulated as a dynamic optimization
problem. The conventional T-optimal objective criterion was developed for the discrimination between
two competing models, based on the assumption that one is initially considered as the “true” model with
known parameters [298]. A second model is proposed, motivating an experiment to confirm the better
model. This T-optimal criterion seeks a design that maximizes (with respect to 𝛟) the minimum (with
respect to 𝛉(2)) of the time integral of the differences between the model responses:
( 2 ) ( 2 )
2(1) (1) (2) (2)
(1) 0 0
(1)
(1) (1)
(2) (2)
(1) (1) (1)
,min ,m
0
(1)
(2) (
ax
2)
ˆˆ ˆ
ˆ( ), ( ), ( ), , 0,
ˆ
( ), ( ), ( )
arg max min ( ), , ( )
, , 0,
ˆ
, ,
,
,ˆ ˆ ˆθ θ θ
T
i i i
t t t t
t t
t
dt
subject to :t t t t
t t
t
t t
φ Φ θ Θy u θ y u θ
θ
y h x
θ
φ
f x x u
f x
x
x u
y h
(1)
( 2 )
(2) (2) (2)
,min ,max
min 0 max
=1,..., ,θ θ θ =1,..., ,
( ) [0, ].i i i
i Ni N
t tu u u
(6.13)
Heidebrecht et al. [223] proposed the simplified objective function of Eq.(6.14), in which the model
parameters are constant. This assumes that both sets of parameters, 𝛉(1) and 𝛉(2), are known or estimated
a priori. The solution of Eq.(6.13) or Eq.(6.14) is local, because it relies on the prior knowledge of the
parameter estimates of the model considered as “true.”
2
(1) (1) (2) (2)
(2) 0 0
(1)
(1) (1)
(2)
0
(1)
(2
(2)
min x
(
0 ma
) 2)
arg max ( ), ,ˆ ˆˆ ˆ
ˆ( ), ( ), ( ), , 0,
ˆˆ( ), ( ), ( ), , 0,
( ), ,
,
,( ) [0
ˆ, ].
Tdt
subject to :t t
t
t t
t
t t t
t t
t tt
t t t
t
φ Φφ
f x x u
f
y u θ y u θ
θ
y h x
θ
y h xu u u
x x u
(6.14)
Cooney and McDonald [315] proposed another type of T-optimum design that does not declare a winner

118
model a priori. A max-min problem similar to Eq.(6.13) is solved, with the exception that the
minimization step is taken with respect to all the model parameters. This is referred to as the worst-case
criterion by Asprey and Macchietto [241], who extended the formulation by Cooney and McDonald [315]
to account for discrete sampling times, as given in Eq.(6.15):
( ) ( )
( ) ( )
( ) ( )
( ) (
( ) ( ) ( ) ( )
(3) 0 0,
1 1 1
( ) ( ) ( ) ( )
0)
0 0
ˆ ˆ
ˆ ˆ
arg max min ( ), ,
( ), ( ), ( )
( ), ,
( ), , ( ), ,
, , 0,
ˆ
sp M M
j j
k k
N N NT
j j k k
Ti j k
i i
i i
j
j
j j k
j
k
y
j
j
subject t
t t t t
t t t t
t
t
o :t t t
φ Φ θ Θθ Θ
y u θ y u θ
W y u θ y u
φ
f x x
y h
u
θ
θ
( )
( )
0
( ) ( ) ( )
min max( ) ( ) ( )
min max
min 0 max
,1 1m
( ) ( )
in max
, ,
( )
1
( )
( ), ( ), ( )
,
,
θ θ θ =1,..., ,θ θ θ =1,..., ,
( ) [0, ],
, 1, ,
, , 0,
ˆ
j
k
j j j
k k k
sp
sp sp i sp i sp s
k k
k k
t t t
t
t
t t
i Ni N
t tt t
t t t t i N
x
θ
y h x
u
f x x
u u
u
.p
(6.15)
A potential weakness of Eq.(6.15) is that kinetic parameters can be adjusted in a manner that the
corresponding models lose accuracy. Thus, the designed experiment does not guarantee model
discriminability for the competing kinetic models. Nonetheless, Eq.(6.15) is used in the foremost model
discrimination of Stage 2 of Figure 6.4 in an effort to not introduce bias, when selecting a true model.
Once a winner model is deduced, precise estimates of the kinetic parameters are obtained from D-optimal
designs, discussed in the following section. Then, it is necessary to return to the model discrimination
stage to confirm that the winner model is indeed the best model to fit the data. This is carried out using
Eq.(6.13), under the assumption that the previously selected model is the true model. If the model deemed
“true” by Eq.(6.15) does not provide the best fit of the experimental data from the subsequent T-design
from Eq.(6.13), it could mean that the selected model and/or parameter estimates are not adequate,
necessitating the T-optimal/D-optimal designs to be reiterated until the process converges to a “true”
winner model [316]. After completion of this model analysis step, there should exist only one winner
model out of the original 160 possible CLC kinetic models.
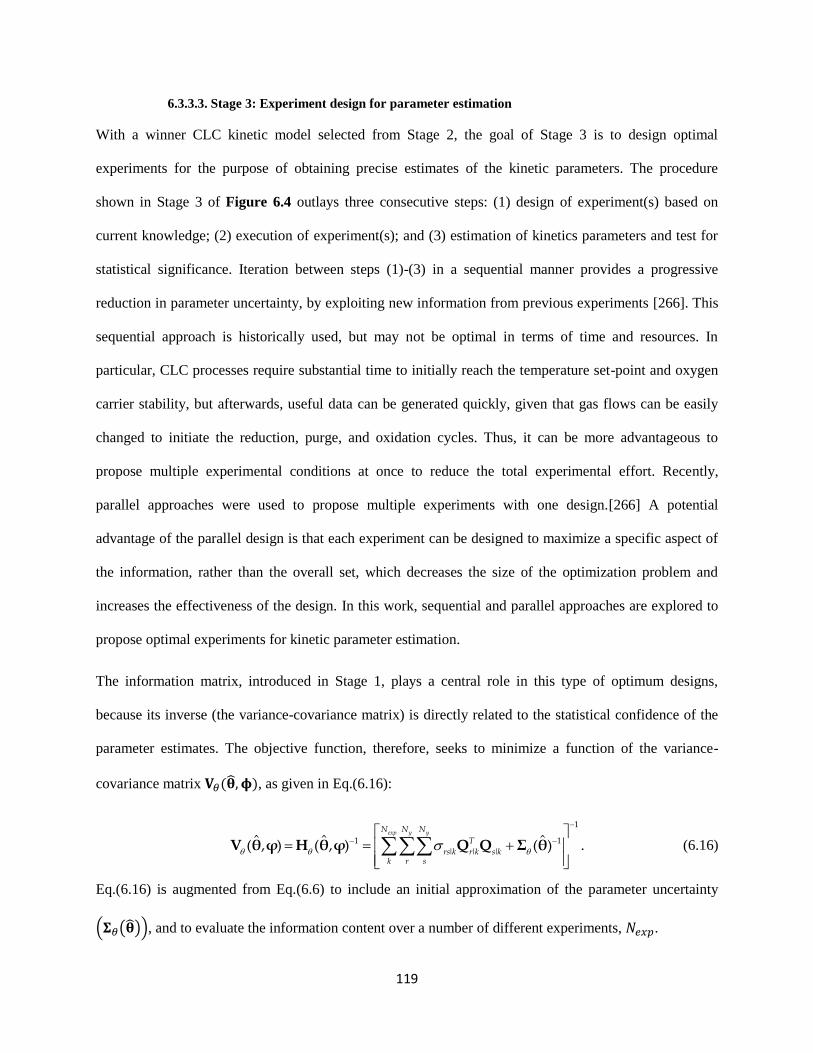
119
6.3.3.3. Stage 3: Experiment design for parameter estimation
With a winner CLC kinetic model selected from Stage 2, the goal of Stage 3 is to design optimal
experiments for the purpose of obtaining precise estimates of the kinetic parameters. The procedure
shown in Stage 3 of Figure 6.4 outlays three consecutive steps: (1) design of experiment(s) based on
current knowledge; (2) execution of experiment(s); and (3) estimation of kinetics parameters and test for
statistical significance. Iteration between steps (1)-(3) in a sequential manner provides a progressive
reduction in parameter uncertainty, by exploiting new information from previous experiments [266]. This
sequential approach is historically used, but may not be optimal in terms of time and resources. In
particular, CLC processes require substantial time to initially reach the temperature set-point and oxygen
carrier stability, but afterwards, useful data can be generated quickly, given that gas flows can be easily
changed to initiate the reduction, purge, and oxidation cycles. Thus, it can be more advantageous to
propose multiple experimental conditions at once to reduce the total experimental effort. Recently,
parallel approaches were used to propose multiple experiments with one design.[266] A potential
advantage of the parallel design is that each experiment can be designed to maximize a specific aspect of
the information, rather than the overall set, which decreases the size of the optimization problem and
increases the effectiveness of the design. In this work, sequential and parallel approaches are explored to
propose optimal experiments for kinetic parameter estimation.
The information matrix, introduced in Stage 1, plays a central role in this type of optimum designs,
because its inverse (the variance-covariance matrix) is directly related to the statistical confidence of the
parameter estimates. The objective function, therefore, seeks to minimize a function of the variance-
covariance matrix 𝐕𝜃(��, 𝛟), as given in Eq.(6.16):
1
1
| |
1
|( )ˆ ˆ ˆ( , ) ( , ) .
exp y yN N N
T
rs k r k s kk r s
V θ φ H θ φ Q Q Σ θ (6.16)
Eq.(6.16) is augmented from Eq.(6.6) to include an initial approximation of the parameter uncertainty
(𝚺𝜃(��)), and to evaluate the information content over a number of different experiments, 𝑁𝑒𝑥𝑝.
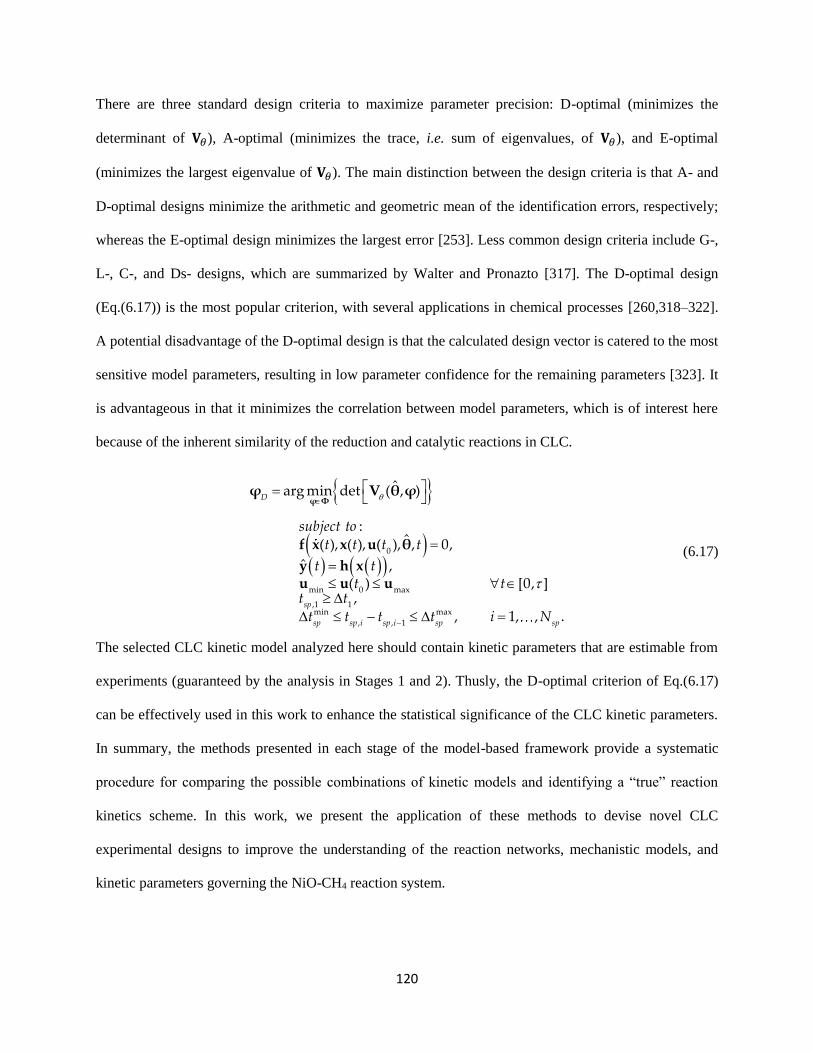
120
There are three standard design criteria to maximize parameter precision: D-optimal (minimizes the
determinant of 𝐕𝜃), A-optimal (minimizes the trace, i.e. sum of eigenvalues, of 𝐕𝜃), and E-optimal
(minimizes the largest eigenvalue of 𝐕𝜃). The main distinction between the design criteria is that A- and
D-optimal designs minimize the arithmetic and geometric mean of the identification errors, respectively;
whereas the E-optimal design minimizes the largest error [253]. Less common design criteria include G-,
L-, C-, and Ds- designs, which are summarized by Walter and Pronazto [317]. The D-optimal design
(Eq.(6.17)) is the most popular criterion, with several applications in chemical processes [260,318–322].
A potential disadvantage of the D-optimal design is that the calculated design vector is catered to the most
sensitive model parameters, resulting in low parameter confidence for the remaining parameters [323]. It
is advantageous in that it minimizes the correlation between model parameters, which is of interest here
because of the inherent similarity of the reduction and catalytic reactions in CLC.
0
min 0 max
,1 1min max
, , 1
ˆ( , )
,(
arg min det
) [0, ],
, 1, ,
:ˆ( ), ( ), ( ), ,
.
0,
ˆ
sp
sp sp i sp i sp s
D
p
subjectt
t tt t
t tt t t
to
i
t t
t N
t
φ ΦV θ φ
θ
y h xu u u
φ
f x x u (6.17)
The selected CLC kinetic model analyzed here should contain kinetic parameters that are estimable from
experiments (guaranteed by the analysis in Stages 1 and 2). Thusly, the D-optimal criterion of Eq.(6.17)
can be effectively used in this work to enhance the statistical significance of the CLC kinetic parameters.
In summary, the methods presented in each stage of the model-based framework provide a systematic
procedure for comparing the possible combinations of kinetic models and identifying a “true” reaction
kinetics scheme. In this work, we present the application of these methods to devise novel CLC
experimental designs to improve the understanding of the reaction networks, mechanistic models, and
kinetic parameters governing the NiO-CH4 reaction system.
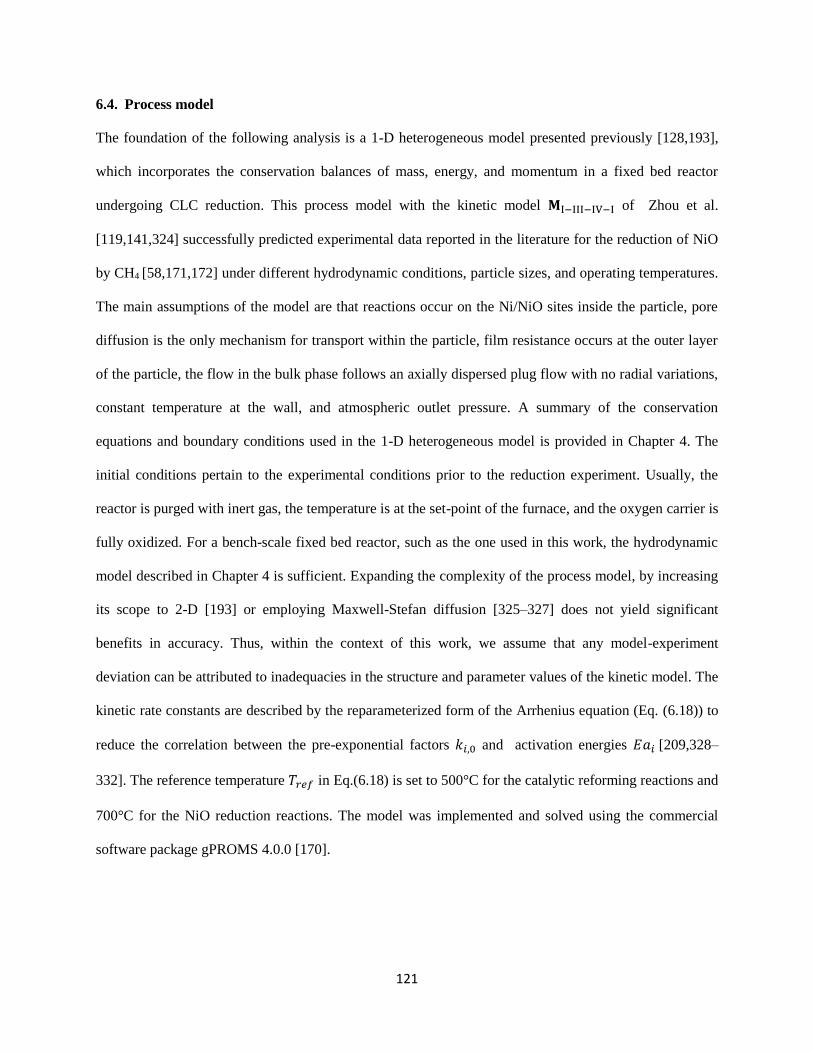
121
6.4. Process model
The foundation of the following analysis is a 1-D heterogeneous model presented previously [128,193],
which incorporates the conservation balances of mass, energy, and momentum in a fixed bed reactor
undergoing CLC reduction. This process model with the kinetic model 𝐌I−III−IV−I of Zhou et al.
[119,141,324] successfully predicted experimental data reported in the literature for the reduction of NiO
by CH4 [58,171,172] under different hydrodynamic conditions, particle sizes, and operating temperatures.
The main assumptions of the model are that reactions occur on the Ni/NiO sites inside the particle, pore
diffusion is the only mechanism for transport within the particle, film resistance occurs at the outer layer
of the particle, the flow in the bulk phase follows an axially dispersed plug flow with no radial variations,
constant temperature at the wall, and atmospheric outlet pressure. A summary of the conservation
equations and boundary conditions used in the 1-D heterogeneous model is provided in Chapter 4. The
initial conditions pertain to the experimental conditions prior to the reduction experiment. Usually, the
reactor is purged with inert gas, the temperature is at the set-point of the furnace, and the oxygen carrier is
fully oxidized. For a bench-scale fixed bed reactor, such as the one used in this work, the hydrodynamic
model described in Chapter 4 is sufficient. Expanding the complexity of the process model, by increasing
its scope to 2-D [193] or employing Maxwell-Stefan diffusion [325–327] does not yield significant
benefits in accuracy. Thus, within the context of this work, we assume that any model-experiment
deviation can be attributed to inadequacies in the structure and parameter values of the kinetic model. The
kinetic rate constants are described by the reparameterized form of the Arrhenius equation (Eq. (6.18)) to
reduce the correlation between the pre-exponential factors 𝑘𝑖,0 and activation energies 𝐸𝑎𝑖 [209,328–
332]. The reference temperature 𝑇𝑟𝑒𝑓 in Eq.(6.18) is set to 500°C for the catalytic reforming reactions and
700°C for the NiO reduction reactions. The model was implemented and solved using the commercial
software package gPROMS 4.0.0 [170].
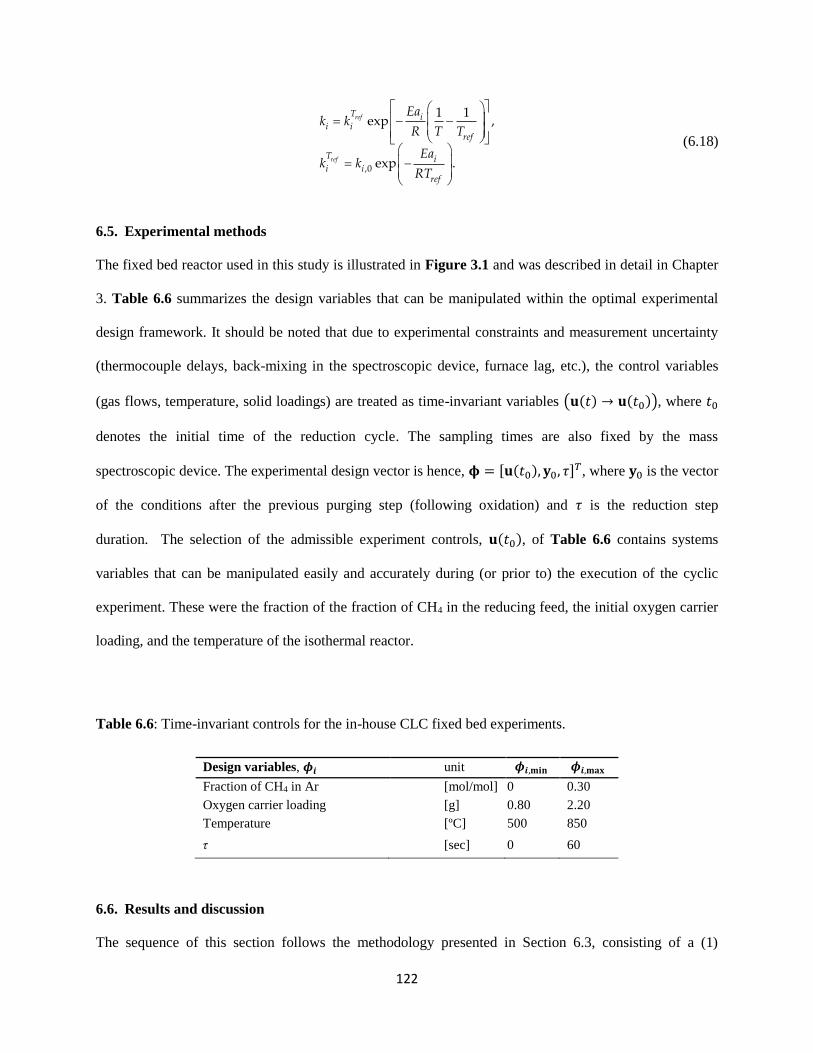
122
,0
1 1exp ,
exp .
ref
ref
T ii i
ref
T ii i
ref
Eak k
R T T
Eak k
RT
(6.18)
6.5. Experimental methods
The fixed bed reactor used in this study is illustrated in Figure 3.1 and was described in detail in Chapter
3. Table 6.6 summarizes the design variables that can be manipulated within the optimal experimental
design framework. It should be noted that due to experimental constraints and measurement uncertainty
(thermocouple delays, back-mixing in the spectroscopic device, furnace lag, etc.), the control variables
(gas flows, temperature, solid loadings) are treated as time-invariant variables (𝐮(𝑡) → 𝐮(𝑡0)), where 𝑡0
denotes the initial time of the reduction cycle. The sampling times are also fixed by the mass
spectroscopic device. The experimental design vector is hence, 𝛟 = [𝐮(𝑡0), 𝐲0, 𝜏]𝑇, where 𝐲0 is the vector
of the conditions after the previous purging step (following oxidation) and 𝜏 is the reduction step
duration. The selection of the admissible experiment controls, 𝐮(𝑡0), of Table 6.6 contains systems
variables that can be manipulated easily and accurately during (or prior to) the execution of the cyclic
experiment. These were the fraction of the fraction of CH4 in the reducing feed, the initial oxygen carrier
loading, and the temperature of the isothermal reactor.
Table 6.6: Time-invariant controls for the in-house CLC fixed bed experiments.
Design variables, 𝝓𝒊 unit 𝝓𝒊,𝐦𝐢𝐧 𝝓𝒊,𝐦𝐚𝐱
Fraction of CH4 in Ar [mol/mol] 0 0.30
Oxygen carrier loading [g] 0.80 2.20
Temperature [ºC] 500 850
τ [sec] 0 60
6.6. Results and discussion
The sequence of this section follows the methodology presented in Section 6.3, consisting of a (1)
123
preliminary analysis testing the uniqueness of the model with respect to its parameters, (2) identification
and subsequent rejection of inadequate models, and (3) maximization of the statistical significance of the
uncertain kinetic parameters [232,240,241]. In this section, we present the results of each method and
show their effectiveness in reducing the uncertainty in the candidate CLC kinetic models.
6.6.1. Preliminary analysis
With the model of a CLC process defined in Eq.(6.3) and the experiment design vector of Eq.(6.5), we
first need to confirm whether the kinetic parameters of the candidate model structures are structurally
identifiable. Specifically, we need to find if, in principle, an experiment design exists, in which the model
parameters can be uniquely identifiable, given a certain model structure. We applied the framework for
structural identifiability analysis presented in Figure 6.5, following the sequence of local and global
approaches proposed by Galvanin et al. [287] The controversies in the NiO reduction kinetics of Table
6.1-
Table 6.4 are deconstructed in Figure 6.5, whereby we evaluated independently the uncertainty
associated with the catalytic activity of Ni (Eq.(6.1) or Eq.(6.2)), the catalytic reforming kinetics, and the
NiO reduction kinetics.
First, structural local identifiability (SLI) of the model parameters of M with Eq.(6.2) was analyzed. We
used literature sources to define the design space, Φ, and get initial estimates of θ for the SLI analysis.
Secondly, we analyzed the SLI of the candidate reforming reaction networks, using initial estimates of θ
and definitions of 𝛟 and 𝚽 according to relevant literature studies. For the locally identifiable models, we
performed the F-test and AICc test, following the procedure of Zhou et al. [132] to select the most
suitable reforming network. In the third step shown in Figure 6.5, we studied the structural identifiability
of the NiO reduction kinetic models, using the models determined from previous steps for the catalytic
activity of Ni and reforming reaction network. The kinetic parameters were estimated from an in-house
NiO reduction experiment, with a defined design space, 𝚽. The locally identifiable models were then
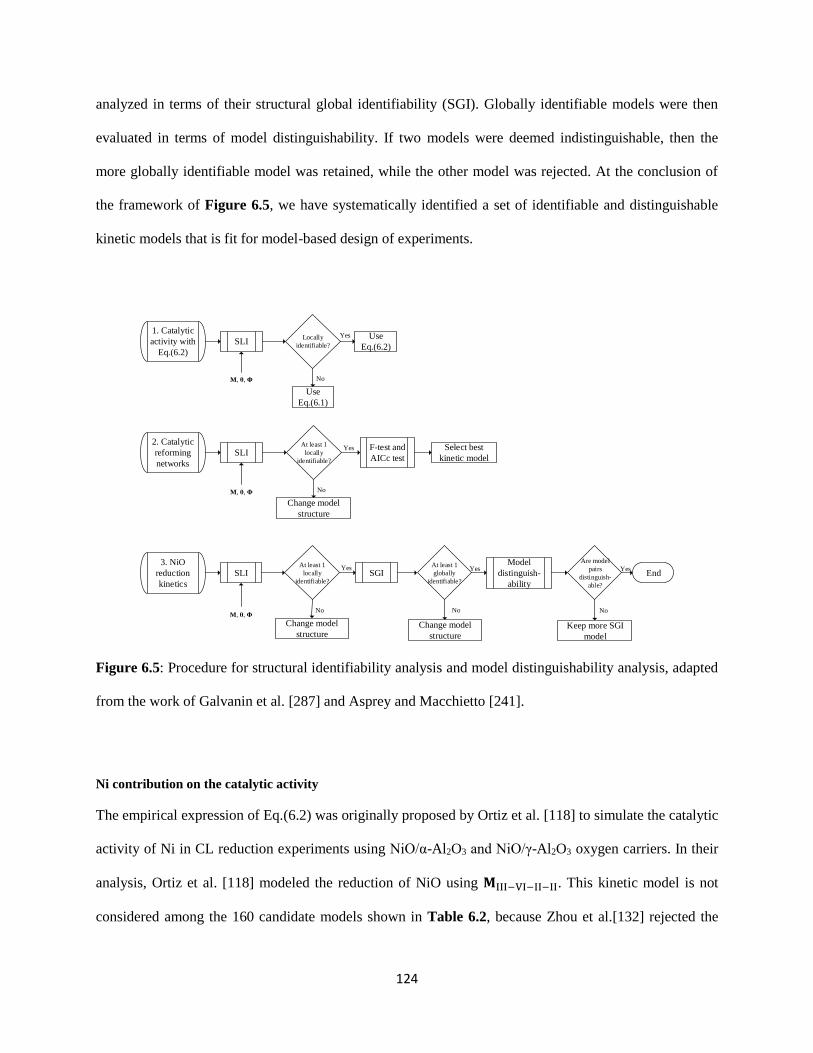
124
analyzed in terms of their structural global identifiability (SGI). Globally identifiable models were then
evaluated in terms of model distinguishability. If two models were deemed indistinguishable, then the
more globally identifiable model was retained, while the other model was rejected. At the conclusion of
the framework of Figure 6.5, we have systematically identified a set of identifiable and distinguishable
kinetic models that is fit for model-based design of experiments.
1. Catalytic
activity with
Eq.(6.2)
SLI Locally
identifiable?
Use
Eq.(6.2)
Use
Eq.(6.1)
Yes
NoM, θ, Φ
Select best
kinetic model
2. Catalytic
reforming
networks
SLI At least 1
locally
identifiable?
Change model
structure
NoM, θ, Φ
F-test and
AICc test
3. NiO
reduction
kinetics
SLI At least 1
locally
identifiable?
Change model
structure
Yes
NoM, θ, Φ
SGI At least 1
globally
identifiable?
Model
distinguish-
ability
Are model
pairs
distinguish-
able?
Keep more SGI
model
End
Change model
structure
No No
Yes
Yes YesYes
Figure 6.5: Procedure for structural identifiability analysis and model distinguishability analysis, adapted
from the work of Galvanin et al. [287] and Asprey and Macchietto [241].
Ni contribution on the catalytic activity
The empirical expression of Eq.(6.2) was originally proposed by Ortiz et al. [118] to simulate the catalytic
activity of Ni in CL reduction experiments using NiO/α-Al2O3 and NiO/γ-Al2O3 oxygen carriers. In their
analysis, Ortiz et al. [118] modeled the reduction of NiO using 𝐌III−VI−II−II. This kinetic model is not
considered among the 160 candidate models shown in Table 6.2, because Zhou et al.[132] rejected the
125
zero order mechanistic model due to poor data fitting. Nonetheless, we show in Figures 6.6(a)-6.6(b) the
validation of the reported kinetic model, 𝐌III−VI−II−II, with the reported kinetic parameters, ��0, of Ortiz
et al. [118] to accurately predict the reduction data. The design vector 𝛟 is constrained by the
experimental design space of Ortiz et al. [118], being the gas fraction of the feed (H2O/CH4/H2=3:1:1-
7:1:1), reactor temperature (500-900°C), and space time (0.1-0.4 g h/mol CH4). The experiment duration
was fixed as in Ortiz et al. (2012) [118] to 100 sec. We assumed that data was collected every 1 sec with a
variance of 0.01. Ortiz et al. [118] performed one reduction experiment for each oxygen carrier.
Using 𝐌, ��0, and 𝛟 ∈ 𝚽 from Ortiz et al. [118] we solved Eq.(6.9) to determine an optimal design that
maximizes the local identifiability of the kinetic parameters of 𝐌III−VI−II−II and the empirical parameters
of Eq.(6.2) for the NiO/γ-Al2O3 oxygen carrier. At the optimal design point, the correlations between the
parameters were computed (Table 6.7). The correlation analysis of Table 6.7 reveals that the model
structure of 𝐌III−VI−II−II is not identifiable, as the empirical parameters used to describe the catalytic
activity of Ni are perfectly correlated with the kinetic parameters of the catalytic reactions (Table 6.7).
However, it is possible that the model structure could be locally identifiable with information from
additional experiments. Thus, we extended the SLI analysis to simultaneously optimize the design of up
to 3 reduction experiments. These results also showed that this model structure is not identifiable.
Therefore, Eq.(6.1) is more appropriate (from the statistical point of view) to characterize the effect of Ni
on the catalytic activity.
Other model structures were tested to simulate the reduction behavior of the NiO/α-Al2O3 and NiO/γ-
Al2O3 oxygen carriers reported by Ortiz et al. [118]. Zhou et al. [132] showed that the best solid-state
mechanistic model for NiO reduction is the Avrami-Erofe’ev model. In Figures 6.6(c)-6.6(d),the kinetic
parameters of 𝐌III−I−II−I were tuned to match the experimental data. We found that accurate
representation of the data is feasible with Eq.(1), because the activation barrier observed in the NiO/γ-
Al2O3 experiments by Ortiz et al. [118] is inherently captured by the Avrami-Erofe’ev exponent. Finally,
the model predictions of the winner model from this analysis (𝐌II−I−IV−I) are shown in Figures 6.6(e)-
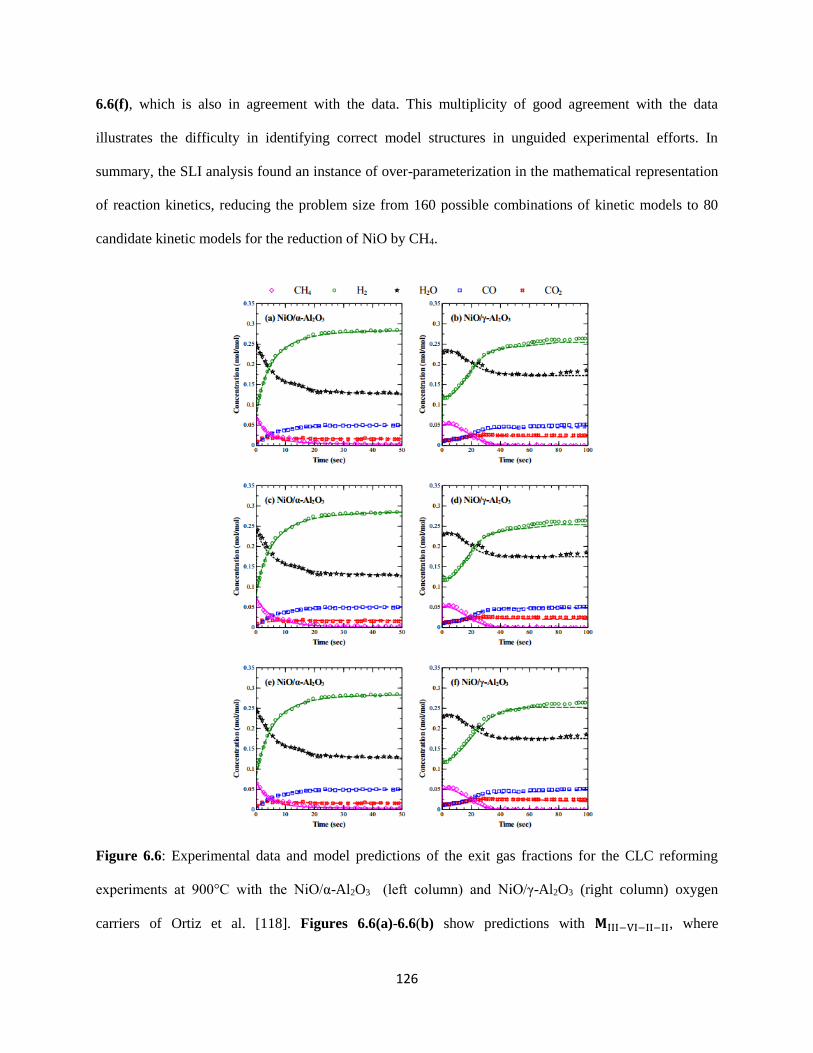
126
6.6(f), which is also in agreement with the data. This multiplicity of good agreement with the data
illustrates the difficulty in identifying correct model structures in unguided experimental efforts. In
summary, the SLI analysis found an instance of over-parameterization in the mathematical representation
of reaction kinetics, reducing the problem size from 160 possible combinations of kinetic models to 80
candidate kinetic models for the reduction of NiO by CH4.
Figure 6.6: Experimental data and model predictions of the exit gas fractions for the CLC reforming
experiments at 900°C with the NiO/α-Al2O3 (left column) and NiO/γ-Al2O3 (right column) oxygen
carriers of Ortiz et al. [118]. Figures 6.6(a)-6.6(b) show predictions with 𝐌III−VI−II−II, where
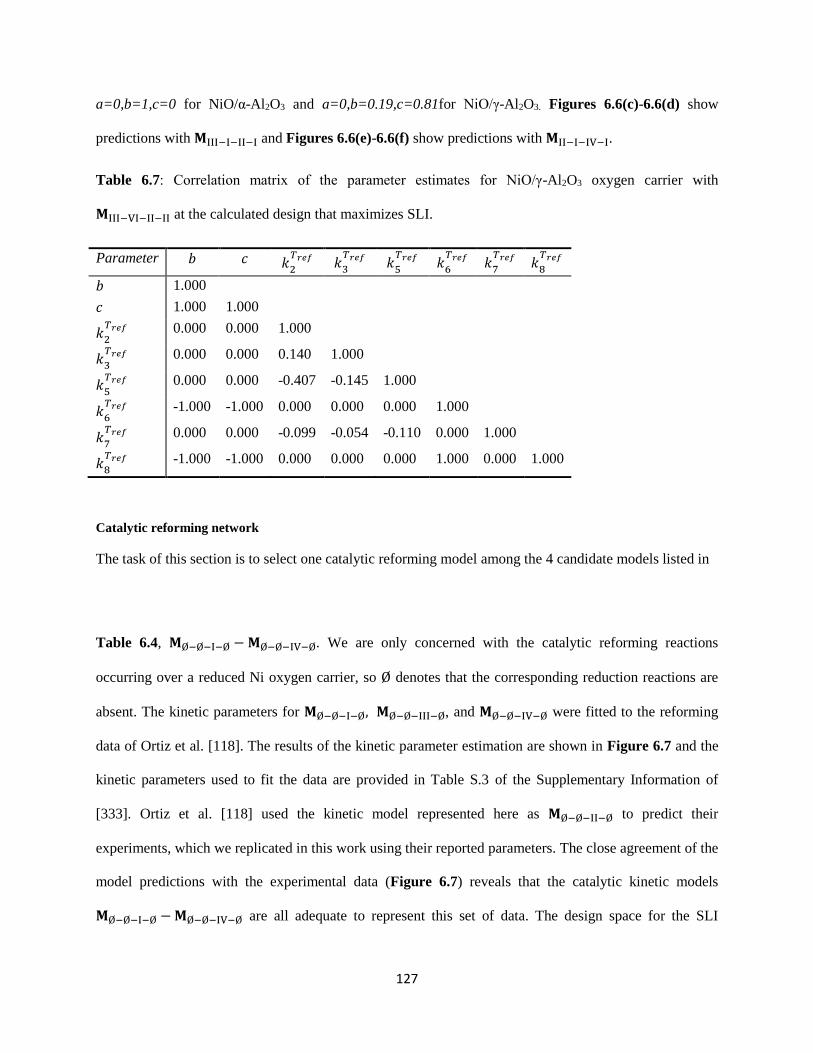
127
a=0,b=1,c=0 for NiO/α-Al2O3 and a=0,b=0.19,c=0.81for NiO/γ-Al2O3. Figures 6.6(c)-6.6(d) show
predictions with 𝐌III−I−II−I and Figures 6.6(e)-6.6(f) show predictions with 𝐌II−I−IV−I.
Table 6.7: Correlation matrix of the parameter estimates for NiO/γ-Al2O3 oxygen carrier with
𝐌III−VI−II−II at the calculated design that maximizes SLI.
Parameter 𝑏 𝑐 𝑘2
𝑇𝑟𝑒𝑓 𝑘3
𝑇𝑟𝑒𝑓 𝑘5
𝑇𝑟𝑒𝑓 𝑘6
𝑇𝑟𝑒𝑓 𝑘7
𝑇𝑟𝑒𝑓 𝑘8
𝑇𝑟𝑒𝑓
𝑏 1.000
𝑐 1.000 1.000
𝑘2
𝑇𝑟𝑒𝑓 0.000 0.000 1.000
𝑘3
𝑇𝑟𝑒𝑓 0.000 0.000 0.140 1.000
𝑘5
𝑇𝑟𝑒𝑓 0.000 0.000 -0.407 -0.145 1.000
𝑘6
𝑇𝑟𝑒𝑓 -1.000 -1.000 0.000 0.000 0.000 1.000
𝑘7
𝑇𝑟𝑒𝑓 0.000 0.000 -0.099 -0.054 -0.110 0.000 1.000
𝑘8
𝑇𝑟𝑒𝑓 -1.000 -1.000 0.000 0.000 0.000 1.000 0.000 1.000
Catalytic reforming network
The task of this section is to select one catalytic reforming model among the 4 candidate models listed in
Table 6.4, 𝐌Ø−Ø−I−Ø − 𝐌Ø−Ø−IV−Ø. We are only concerned with the catalytic reforming reactions
occurring over a reduced Ni oxygen carrier, so Ø denotes that the corresponding reduction reactions are
absent. The kinetic parameters for 𝐌Ø−Ø−I−Ø, 𝐌Ø−Ø−III−Ø, and 𝐌Ø−Ø−IV−Ø were fitted to the reforming
data of Ortiz et al. [118]. The results of the kinetic parameter estimation are shown in Figure 6.7 and the
kinetic parameters used to fit the data are provided in Table S.3 of the Supplementary Information of
[333]. Ortiz et al. [118] used the kinetic model represented here as 𝐌Ø−Ø−II−Ø to predict their
experiments, which we replicated in this work using their reported parameters. The close agreement of the
model predictions with the experimental data (Figure 6.7) reveals that the catalytic kinetic models
𝐌Ø−Ø−I−Ø − 𝐌Ø−Ø−IV−Ø are all adequate to represent this set of data. The design space for the SLI
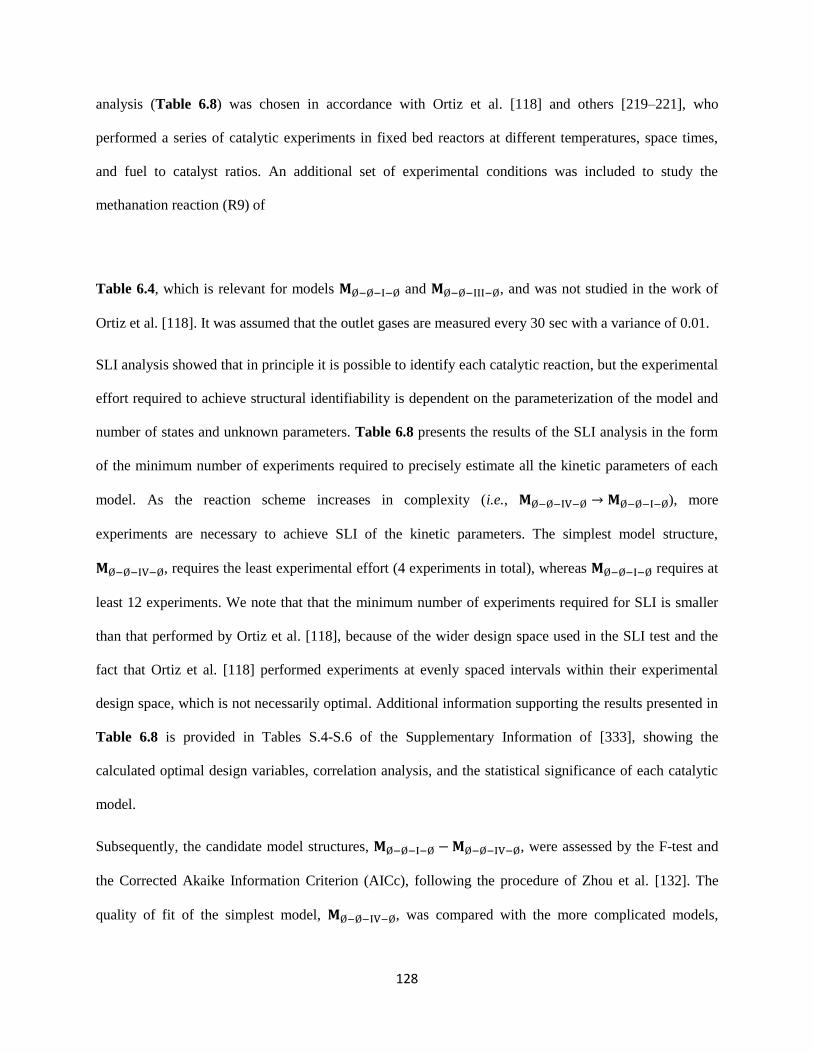
128
analysis (Table 6.8) was chosen in accordance with Ortiz et al. [118] and others [219–221], who
performed a series of catalytic experiments in fixed bed reactors at different temperatures, space times,
and fuel to catalyst ratios. An additional set of experimental conditions was included to study the
methanation reaction (R9) of
Table 6.4, which is relevant for models 𝐌Ø−Ø−I−Ø and 𝐌Ø−Ø−III−Ø, and was not studied in the work of
Ortiz et al. [118]. It was assumed that the outlet gases are measured every 30 sec with a variance of 0.01.
SLI analysis showed that in principle it is possible to identify each catalytic reaction, but the experimental
effort required to achieve structural identifiability is dependent on the parameterization of the model and
number of states and unknown parameters. Table 6.8 presents the results of the SLI analysis in the form
of the minimum number of experiments required to precisely estimate all the kinetic parameters of each
model. As the reaction scheme increases in complexity (i.e., 𝐌Ø−Ø−IV−Ø → 𝐌Ø−Ø−I−Ø), more
experiments are necessary to achieve SLI of the kinetic parameters. The simplest model structure,
𝐌Ø−Ø−IV−Ø, requires the least experimental effort (4 experiments in total), whereas 𝐌Ø−Ø−I−Ø requires at
least 12 experiments. We note that that the minimum number of experiments required for SLI is smaller
than that performed by Ortiz et al. [118], because of the wider design space used in the SLI test and the
fact that Ortiz et al. [118] performed experiments at evenly spaced intervals within their experimental
design space, which is not necessarily optimal. Additional information supporting the results presented in
Table 6.8 is provided in Tables S.4-S.6 of the Supplementary Information of [333], showing the
calculated optimal design variables, correlation analysis, and the statistical significance of each catalytic
model.
Subsequently, the candidate model structures, 𝐌Ø−Ø−I−Ø − 𝐌Ø−Ø−IV−Ø, were assessed by the F-test and
the Corrected Akaike Information Criterion (AICc), following the procedure of Zhou et al. [132]. The
quality of fit of the simplest model, 𝐌Ø−Ø−IV−Ø, was compared with the more complicated models,
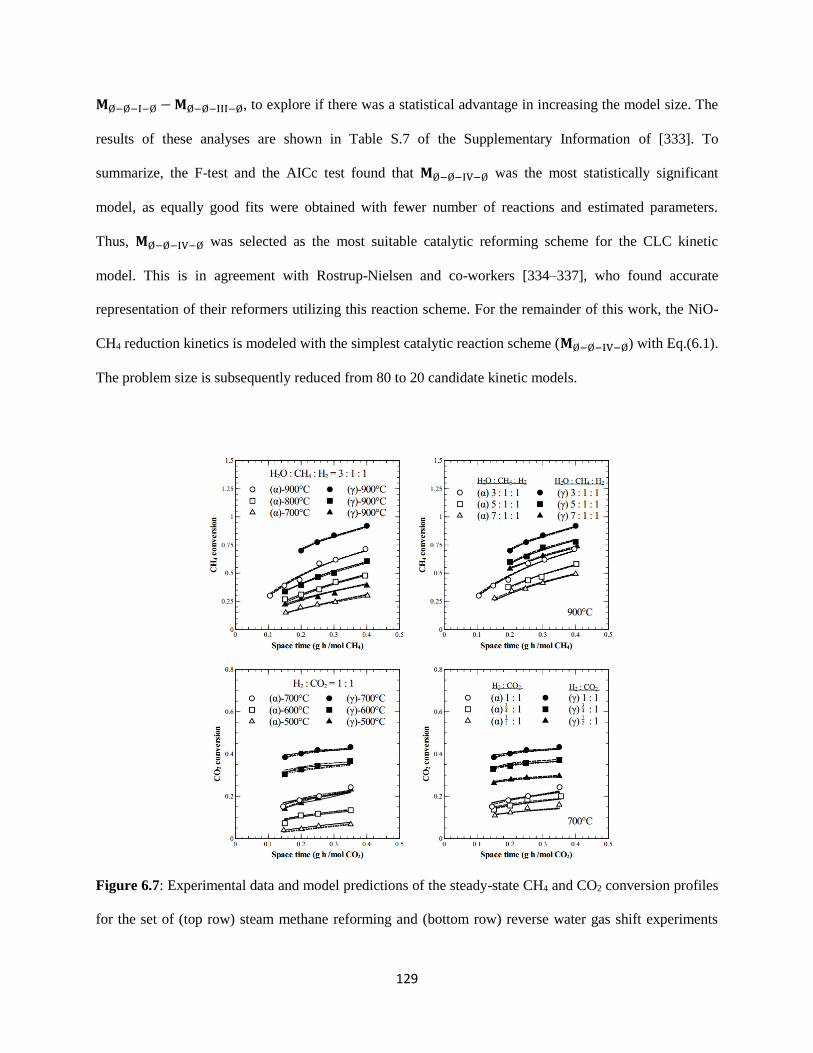
129
𝐌Ø−Ø−I−Ø − 𝐌Ø−Ø−III−Ø, to explore if there was a statistical advantage in increasing the model size. The
results of these analyses are shown in Table S.7 of the Supplementary Information of [333]. To
summarize, the F-test and the AICc test found that 𝐌Ø−Ø−IV−Ø was the most statistically significant
model, as equally good fits were obtained with fewer number of reactions and estimated parameters.
Thus, 𝐌Ø−Ø−IV−Ø was selected as the most suitable catalytic reforming scheme for the CLC kinetic
model. This is in agreement with Rostrup-Nielsen and co-workers [334–337], who found accurate
representation of their reformers utilizing this reaction scheme. For the remainder of this work, the NiO-
CH4 reduction kinetics is modeled with the simplest catalytic reaction scheme (𝐌Ø−Ø−IV−Ø) with Eq.(6.1).
The problem size is subsequently reduced from 80 to 20 candidate kinetic models.
Figure 6.7: Experimental data and model predictions of the steady-state CH4 and CO2 conversion profiles
for the set of (top row) steam methane reforming and (bottom row) reverse water gas shift experiments
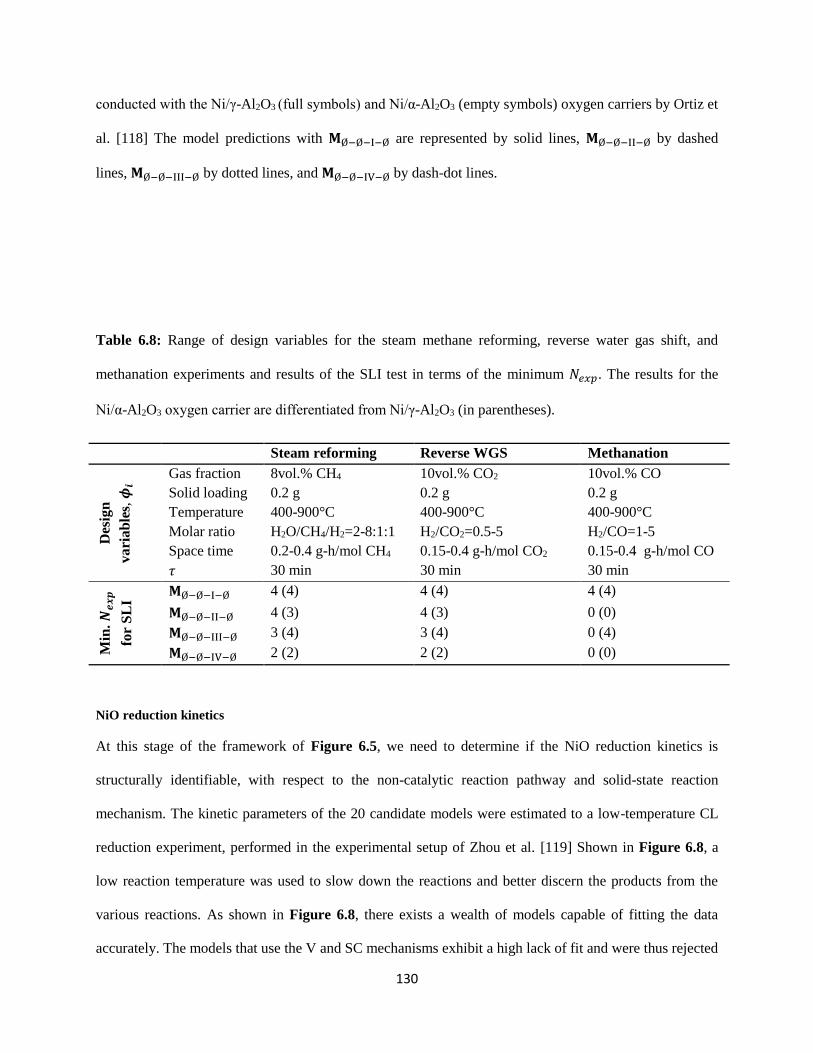
130
conducted with the Ni/γ-Al2O3 (full symbols) and Ni/α-Al2O3 (empty symbols) oxygen carriers by Ortiz et
al. [118] The model predictions with 𝐌Ø−Ø−I−Ø are represented by solid lines, 𝐌Ø−Ø−II−Ø by dashed
lines, 𝐌Ø−Ø−III−Ø by dotted lines, and 𝐌Ø−Ø−IV−Ø by dash-dot lines.
Table 6.8: Range of design variables for the steam methane reforming, reverse water gas shift, and
methanation experiments and results of the SLI test in terms of the minimum 𝑁𝑒𝑥𝑝. The results for the
Ni/α-Al2O3 oxygen carrier are differentiated from Ni/γ-Al2O3 (in parentheses).
Steam reforming Reverse WGS Methanation
Des
ign
vari
ab
les,
𝝓𝒊
Gas fraction 8vol.% CH4 10vol.% CO2 10vol.% CO
Solid loading 0.2 g 0.2 g 0.2 g
Temperature 400-900°C 400-900°C 400-900°C
Molar ratio H2O/CH4/H2=2-8:1:1 H2/CO2=0.5-5 H2/CO=1-5
Space time 0.2-0.4 g-h/mol CH4 0.15-0.4 g-h/mol CO2 0.15-0.4 g-h/mol CO
𝜏 30 min 30 min 30 min
Min
. 𝑵
𝒆𝒙
𝒑
for
SL
I
𝐌Ø−Ø−I−Ø 4 (4) 4 (4) 4 (4)
𝐌Ø−Ø−II−Ø 4 (3) 4 (3) 0 (0)
𝐌Ø−Ø−III−Ø 3 (4) 3 (4) 0 (4)
𝐌Ø−Ø−IV−Ø 2 (2) 2 (2) 0 (0)
NiO reduction kinetics
At this stage of the framework of Figure 6.5, we need to determine if the NiO reduction kinetics is
structurally identifiable, with respect to the non-catalytic reaction pathway and solid-state reaction
mechanism. The kinetic parameters of the 20 candidate models were estimated to a low-temperature CL
reduction experiment, performed in the experimental setup of Zhou et al. [119] Shown in Figure 6.8, a
low reaction temperature was used to slow down the reactions and better discern the products from the
various reactions. As shown in Figure 6.8, there exists a wealth of models capable of fitting the data
accurately. The models that use the V and SC mechanisms exhibit a high lack of fit and were thus rejected
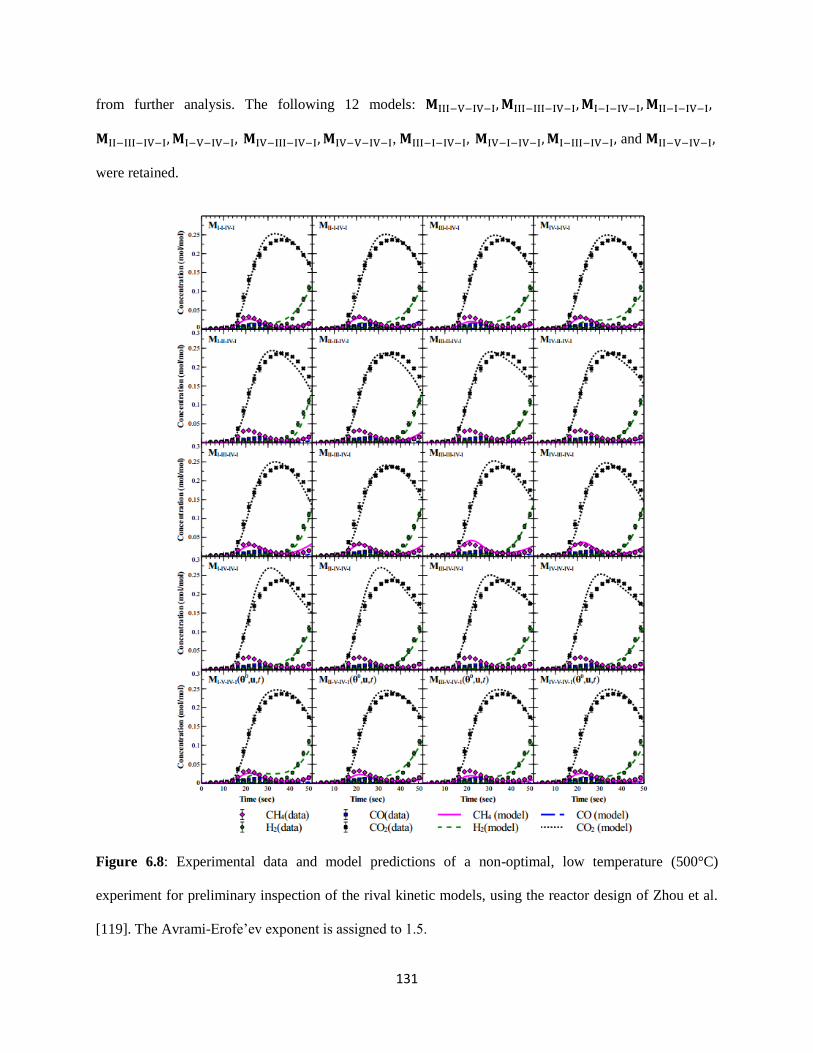
131
from further analysis. The following 12 models: 𝐌III−V−IV−I, 𝐌III−III−IV−I, 𝐌I−I−IV−I, 𝐌II−I−IV−I,
𝐌II−III−IV−I, 𝐌I−V−IV−I, 𝐌IV−III−IV−I, 𝐌IV−V−IV−I, 𝐌III−I−IV−I, 𝐌IV−I−IV−I, 𝐌I−III−IV−I, and 𝐌II−V−IV−I,
were retained.
Figure 6.8: Experimental data and model predictions of a non-optimal, low temperature (500°C)
experiment for preliminary inspection of the rival kinetic models, using the reactor design of Zhou et al.
[119]. The Avrami-Erofe’ev exponent is assigned to 1.5.
132
For the 12 candidate reduction models, we maximized the identifiability of the dependent NiO reduction
kinetics by solving Eq.(6.9), over the experimental design space of Zhou et al. [119], listed in Table 6.6.
The results are presented in Tables S.9-S.10 of the Supplementary Information of [333], in terms of the
optimized design vectors and correlation matrices. The results indicate that the estimability of the NiO
reduction kinetics is maximized at high CH4 feeds, low temperatures, and low solid loadings. In other
words, the D-optimal design of the SLI analysis wants to bring the system to a state where CH4 slip at the
start of the batch experiment is more prominent and separable from the other reactions. Furthermore,
operating at a low CH4 conversion increases the selectivity to H2 and CO, which improves the
identifiability of the kinetic parameters of the partial NiO reduction and reforming reactions. In summary,
we concluded that all of the NiO reduction kinetic model structures are satisfactory in terms of their local
parameter identifiability.
It is also necessary to confirm structural identifiability of the model structure over a range of parameter
values. Global identifiability of the candidate models was evaluated by solving Eq.(6.11) at the design
determined from the SLI test. This analysis was performed with bounds on the parameter values 𝜃𝑖, 𝜃𝑖∗ ∈
𝜃𝑖 × [0.1 ,10 ]. The optimization parameters were defined as arbitrarily small numbers: 𝜀Ф𝑆𝐺𝐼=
1 × 10⁻¹⁰ and 𝜀𝑦 = 5 × 10⁻³, respectively. The results from the SGI analysis (Table S.11 of the
Supplementary Information of of [333]) revealed that only 5 model structures were structurally globally
identifiable with respect to their parameters: 𝐌II−I−IV−I, 𝐌III−I−IV−I, 𝐌II−III−IV−I, 𝐌III−III−IV−I and
𝐌II−V−IV−I.
The final step of the framework of Figure 6.5 is to evaluate whether different model structures are
distinguishable from each other in the same input and output space. First, we analyzed the
distinguishability between model structures with different NiO and CH4 reaction pathways but the same
mechanistic model, being 𝐌II−I−IV−I − 𝐌III−I−IV−I and 𝐌II−III−IV−I − 𝐌III−III−IV−I. The results of this
analysis (Table S.12 of the Supplementary Information of [333]) revealed that it is feasible to distinguish
133
𝐌II−III−IV−I from 𝐌III−III−IV−I, but infeasible to distinguish 𝐌II−I−IV−I from 𝐌III−I−IV−I. The model
structure of 𝐌II−I−IV−I was retained, because this model structure was shown previously to have higher
SGI attributes (i.e., smaller Ф𝑆𝐺𝐼) than 𝐌III−I−IV−I. The procedure was then repeated for the remaining
combinations of kinetic models. Model distinguishability was confirmed for all the remaining models
(Table S.12 of the Supplementary Information of [333]).
In summary, 4 out of 160 candidate CLC models successfully passed through all stages of the preliminary
analysis of parameter identifiability and model distinguishability. These 4 kinetic models demonstrate
sufficient structural (local and global) identifiability and model distinguishability. In the next section, we
show how experiments can be optimally designed in order to ensure the selection of the most accurate
model and estimate kinetics with statistical precision. We conclude to an overall best kinetic model and
demonstrate the applicability of this “true” model to predict CLC reduction data.
6.6.2. Optimal design of experiments
Figure 6.9 presents the framework applied in this work to identify and statistically validate a “true”
kinetic model for the NiO-CH4 system. As shown in Figure 6.9, optimal experiments are designed and
executed to discriminate between the candidate model structures. The most accurate model structure to
represent the data is selected as the “true” model. If none of the candidate models is adequate, then the
model structure should be changed or another model should be proposed. Next, optimal experiments are
designed to enhance the statistical significance of the kinetic parameters of the winner model. It is also
important to check that the winner model with optimized kinetic parameters is the most adequate model.
This is performed in a second model discrimination experiment, in which there exists one “true” model
candidate and three alternatives. If the winner model is still the most adequate model, then we conclude to
a final model structure with precise kinetic parameters. Otherwise, we need to reiterate between the
exterior loops of Figure 6.9.
In the following, we present the numerical and experimental results of the sequence of steps outlined in

134
Figure 6.9. At the start of the framework, there are 4 candidate models, 𝐌II−I−IV−I,
𝐌II−III−IV−I, 𝐌II−V−IV−I, and 𝐌III−III−IV−I, to represent the reduction kinetics of NiO by CH4. The
reference rate constants for all the reactions, 𝑘𝑖
𝑇𝑟𝑒𝑓 of Eq.(6.18), were previously estimated from the
nominal reduction experiment presented in Figure 6.8. The activation energies for R2-R4 of Table 6.1
were fixed to the reported values of Zhou et al. [119] and for R5 to the reported value of Dueso et al.
[114]. For the catalytic reactions, 𝑘𝑖
𝑇𝑟𝑒𝑓 was estimated in Section 6.6.1, keeping 𝐸𝑎𝑖 fixed to the reported
values of Zhou et al. [119] The results of the optimal experimental designs for model discrimination and
parameter estimation are discussed. The posterior statistics of the parameter estimates are presented for
each step of the framework. The fidelity of the final model to be used for interpolation and extrapolation
is demonstrated.
1. Model
discrimination
Experiment
execution
Models
adequate?
Select best
model
Yes
No
Parameter
estimation
2. Enhance
parameter
precision
Experiment
execution
Yes
No
Parameter
estimation
3. Confirm model
selection
Experiment
execution
Is the best
model the most
accurate?
Yes
No
Parameter
estimation
End
Is precision
satisfactory?
Yes
Reject inadequate
models
At least
one model?
Change model
structure
Yes
No
Figure 6.9: Framework for model-based design of experiments for model discrimination and parameter
estimation, adapted from the work of Macchietto and co-workers [232,240,241].
Design of experiments for model discrimination
The first T-optimal design of Figure 6.9 was calculated under the worse-case criterion of Eq.(6.15), in
135
which all models deemed identifiable in Section 6.6.1 were assumed equally likely to be the true model.
Eq.(6.15) was solved over the 4 candidate models with bounds on the parameter values 𝛉(1), … , 𝛉(4) ∈ 𝚯
as [0.1, 10] times their estimated values from Section 6.6.1 and bounds on 𝛟 as detailed in Table 6.6. The
solution for the T-optimal design is shown in the caption of Figure 6.10.
Figure 6.10 presents the experimental data and model predictions of the proposed T-optimal design using
Eq.(6.15). Compared to conventional CLC reduction experiments (such as Figure 6.1(b)), the T-optimal
design of Figure 6.10 led to a higher slip of converted CH4, due to the higher CH4 composition in the
fuel, and lower CO2 selectivity, due to the lower reaction temperatures. As evidenced by the initial CH4
slip of Figure 6.10, this design separates the CH4-NiO reduction reactions from the reduction reactions
with H2 and CO and the catalytic reactions, which is critical in discerning a statistically significant
reaction mechanism. Furthermore, the dynamic profiles of CO and H2 provide insight into the NiO-CH4
reaction pathway and the conversion behavior of the oxygen carrier. For each candidate model, 𝑘𝑖
𝑇𝑟𝑒𝑓 of
the NiO reduction reactions was estimated to the data of Figure 6.10 and the results were analyzed by
statistical tests. From visual inspection of Figure 6.10, the best model structure is clearly 𝐌II−I−IV−I. The
predictions of 𝐌II−III−IV−I are also close to the experimental data, but fail to match the rise in H2 towards
the end of the experiment. This indicates that the NiO conversion rate is under-predicted, because H2
breakthrough usually occurs from the methane decomposition reaction, favorable when the NiO
conversion is high. The worst fitting model is 𝐌III−III−IV−I, with which the CO and CO2 selectivities are
severely mismatched.

136
Figure 6.10: Experimental and model predictions for the first T-optimal design for model discrimination,
using the parameters given in Table 6.9. 𝛟𝛟(3) = [0.20mol
mol CH4, 2.2g, 615°C, 40sec ]
Table 6.9: Parameter estimates for the first T-design for model discrimination, 𝛟𝛟(3) =
[0.20mol
mol CH4, 2.2g, 615°C, 40sec ].
Model Set of 𝛉 Estimates of 𝛉 Confidence
interval (95%)
95% t-value χ2-value
(95% χ2)
𝐌𝐈𝐈−𝐈−𝐈𝐕−𝐈 2
3
4
ref
ref
ref
T
T
T
k
k
kn
5
6
75.64
1.17 0
1
.83
.34 10
10
10
6
7
7
7.20
1.3
2
0
.57 10
10
100.099
5.207.80 0.089* 8.33
8.03
(68.87)
𝐌𝐈𝐈−𝐕−𝐈𝐕−𝐈 2
3
4
ref
ref
ref
T
T
T
k
k
k
4
6
62.77
4
3.02 10
.85
10
10
3
7
6
4.14
4.54
2.1 10
10
10
0.14 6.70 1.07*
81.47
(74.47)
𝐌𝐈𝐈−𝐈𝐈𝐈−𝐈𝐕−𝐈 2
3
4
ref
ref
ref
T
T
T
k
k
k
5
6
6
3.82
5.9
5
2 10
.
10
1023
5
7
6
4.38
1.4
9.37 10
10
9 10
0.63* 8.71 3.50
72.78
(74.47)
𝐌𝐈𝐈𝐈−𝐈𝐈𝐈−𝐈𝐕−𝐈 2
3
5
ref
ref
ref
T
T
T
k
k
k
4
4
4
3.08
6.1
2
2 10
.
10
1064
3
3
4
4.80
2.2
4.60 10
10
1 10
0.43* 0.064 1.19*
391.97
(74.47)
*Indicates t-values are lower than the reference t-value (95%) from the Student’s t distribution, 1.665.
The χ2 goodness of fit test was used to evaluate the adequacy of each model to represent the data. An
acceptable model fit is achieved when the obtained sum of residuals is below the χ2 value at the 5%
significance level for the corresponding degrees of freedom, calculated from the number of experimental
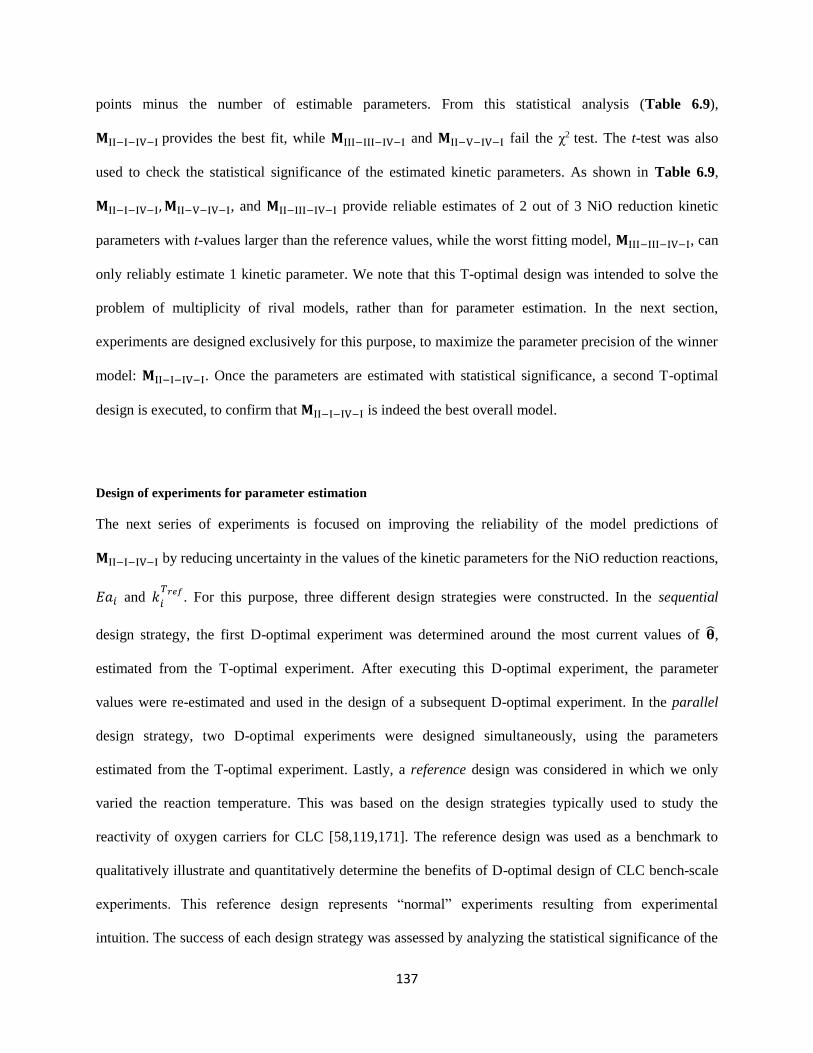
137
points minus the number of estimable parameters. From this statistical analysis (Table 6.9),
𝐌II−I−IV−I provides the best fit, while 𝐌III−III−IV−I and 𝐌II−V−IV−I fail the χ2 test. The t-test was also
used to check the statistical significance of the estimated kinetic parameters. As shown in Table 6.9,
𝐌II−I−IV−I, 𝐌II−V−IV−I, and 𝐌II−III−IV−I provide reliable estimates of 2 out of 3 NiO reduction kinetic
parameters with t-values larger than the reference values, while the worst fitting model, 𝐌III−III−IV−I, can
only reliably estimate 1 kinetic parameter. We note that this T-optimal design was intended to solve the
problem of multiplicity of rival models, rather than for parameter estimation. In the next section,
experiments are designed exclusively for this purpose, to maximize the parameter precision of the winner
model: 𝐌II−I−IV−I. Once the parameters are estimated with statistical significance, a second T-optimal
design is executed, to confirm that 𝐌II−I−IV−I is indeed the best overall model.
Design of experiments for parameter estimation
The next series of experiments is focused on improving the reliability of the model predictions of
𝐌II−I−IV−I by reducing uncertainty in the values of the kinetic parameters for the NiO reduction reactions,
𝐸𝑎𝑖 and 𝑘𝑖
𝑇𝑟𝑒𝑓. For this purpose, three different design strategies were constructed. In the sequential
design strategy, the first D-optimal experiment was determined around the most current values of ��,
estimated from the T-optimal experiment. After executing this D-optimal experiment, the parameter
values were re-estimated and used in the design of a subsequent D-optimal experiment. In the parallel
design strategy, two D-optimal experiments were designed simultaneously, using the parameters
estimated from the T-optimal experiment. Lastly, a reference design was considered in which we only
varied the reaction temperature. This was based on the design strategies typically used to study the
reactivity of oxygen carriers for CLC [58,119,171]. The reference design was used as a benchmark to
qualitatively illustrate and quantitatively determine the benefits of D-optimal design of CLC bench-scale
experiments. This reference design represents “normal” experiments resulting from experimental
intuition. The success of each design strategy was assessed by analyzing the statistical significance of the
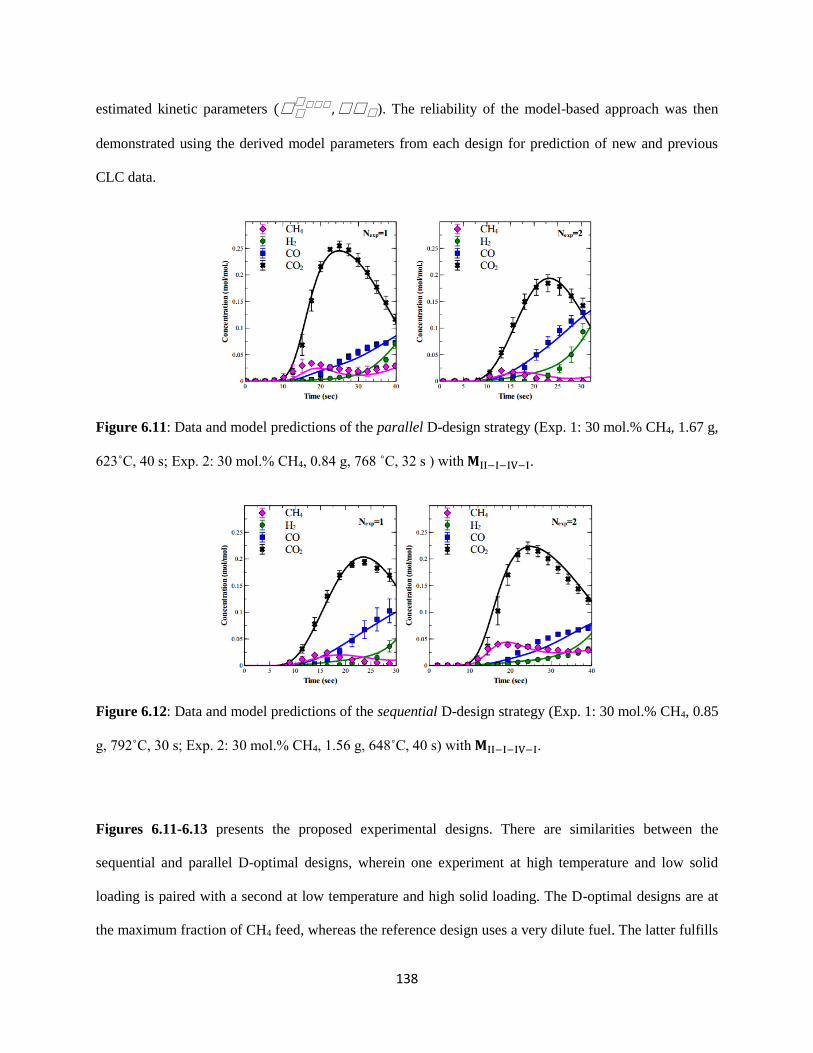
138
estimated kinetic parameters (𝛟𝛟𝛟𝛟𝛟𝛟 ,𝛟𝛟𝛟). The reliability of the model-based approach was then
demonstrated using the derived model parameters from each design for prediction of new and previous
CLC data.
Figure 6.11: Data and model predictions of the parallel D-design strategy (Exp. 1: 30 mol.% CH4, 1.67 g,
623˚C, 40 s; Exp. 2: 30 mol.% CH4, 0.84 g, 768 ˚C, 32 s ) with 𝐌II−I−IV−I.
Figure 6.12: Data and model predictions of the sequential D-design strategy (Exp. 1: 30 mol.% CH4, 0.85
g, 792˚C, 30 s; Exp. 2: 30 mol.% CH4, 1.56 g, 648˚C, 40 s) with 𝐌II−I−IV−I.
Figures 6.11-6.13 presents the proposed experimental designs. There are similarities between the
sequential and parallel D-optimal designs, wherein one experiment at high temperature and low solid
loading is paired with a second at low temperature and high solid loading. The D-optimal designs are at
the maximum fraction of CH4 feed, whereas the reference design uses a very dilute fuel. The latter fulfills

139
the objective of CLC by maintaining a high CO2 selectivity during the reduction step, while the former is
optimized for kinetic parameter estimation. The duration of the experiments was limited to 30-40 sec,
depending on the oxygen carrier loading. This is a preemptive measure to prevent excessive solid carbon
formation, as to avoid possible plugging inside the reactor and detriment to the oxygen carrier. Figures
6.11-6.13 show model predictions with 𝐌II−I−IV−I after fitting 𝑘𝑖
𝑇𝑟𝑒𝑓 and 𝐸𝑎𝑖 for the NiO reduction
reactions to the experimental data. While the model predictions of each design strategy are in good
agreement with the corresponding data, the D-optimal design experiments are more informative of the
NiO reduction reactions, as compared to the reference experiments. This is evident by the simultaneous
presence of partial and complete combustion products that evolve over the course of reduction. On the
other hand, the only information that can be extracted from the reference experiments is the high CO2
Figure 6.13: Data and model predictions of the reference experiment design (Exp. 1: 10 mol.% CH4, 1.80
g, 700 ˚C, 38 s; Exp. 2: 10 mol.% CH4, 1.80 g, 800 ˚C, 38 s) with 𝐌II−I−IV−I.
The estimated values and posterior statistics of the NiO reduction kinetic parameters (𝑘𝑖
𝑇𝑟𝑒𝑓 , 𝐸𝑎𝑖) for each
design strategy are summarized in Tables 6.10-6.12. The kinetic parameters estimated from the reference
experiments were mostly unreliable (Table 6.12). In comparison, the D-optimal experiments by
sequential and parallel approaches provided precise estimates of the kinetic parameters with statistical
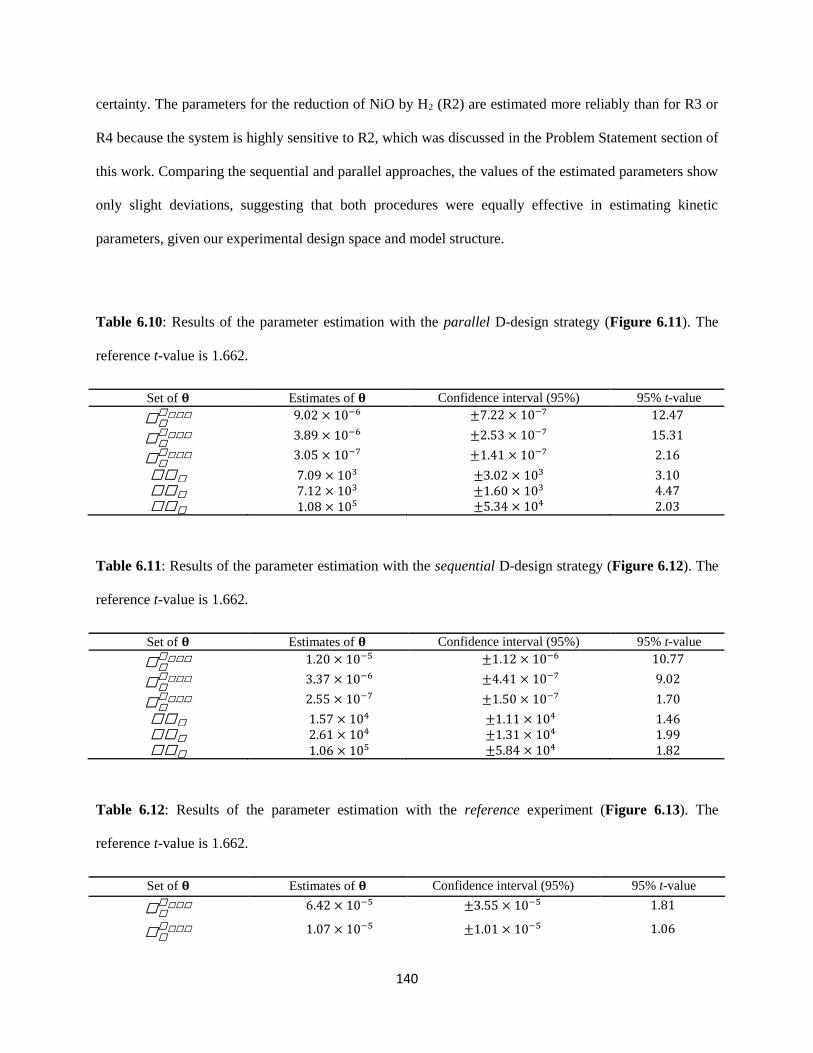
140
certainty. The parameters for the reduction of NiO by H2 (R2) are estimated more reliably than for R3 or
R4 because the system is highly sensitive to R2, which was discussed in the Problem Statement section of
this work. Comparing the sequential and parallel approaches, the values of the estimated parameters show
only slight deviations, suggesting that both procedures were equally effective in estimating kinetic
parameters, given our experimental design space and model structure.
Table 6.10: Results of the parameter estimation with the parallel D-design strategy (Figure 6.11). The
reference t-value is 1.662.
Set of 𝛉 Estimates of 𝛉 Confidence interval (95%) 95% t-value
𝛟𝛟𝛟𝛟𝛟𝛟 9.02 × 10⁻⁶ ±7.22 × 10⁻⁷ 12.47
𝛟𝛟𝛟𝛟𝛟𝛟 3.89 × 10⁻⁶ ±2.53 × 10⁻⁷ 15.31
𝛟𝛟𝛟𝛟𝛟𝛟 3.05 × 10⁻⁷ ±1.41 × 10⁻⁷ 2.16
𝛟𝛟𝛟 7.09 × 10³ ±3.02 × 10³ 3.10
𝛟𝛟𝛟 7.12 × 10³ ±1.60 × 10³ 4.47
𝛟𝛟𝛟 1.08 × 10⁵ ±5.34 × 10⁴ 2.03
Table 6.11: Results of the parameter estimation with the sequential D-design strategy (Figure 6.12). The
reference t-value is 1.662.
Set of 𝛉 Estimates of 𝛉 Confidence interval (95%) 95% t-value
𝛟𝛟𝛟𝛟𝛟𝛟 1.20 × 10⁻⁵ ±1.12 × 10⁻⁶ 10.77
𝛟𝛟𝛟𝛟𝛟𝛟 3.37 × 10⁻⁶ ±4.41 × 10⁻⁷ 9.02
𝛟𝛟𝛟𝛟𝛟𝛟 2.55 × 10⁻⁷ ±1.50 × 10⁻⁷ 1.70
𝛟𝛟𝛟 1.57 × 10⁴ ±1.11 × 10⁴ 1.46
𝛟𝛟𝛟 2.61 × 10⁴ ±1.31 × 10⁴ 1.99
𝛟𝛟𝛟 1.06 × 10⁵ ±5.84 × 10⁴ 1.82
Table 6.12: Results of the parameter estimation with the reference experiment (Figure 6.13). The
reference t-value is 1.662.
Set of 𝛉 Estimates of 𝛉 Confidence interval (95%) 95% t-value
𝛟𝛟𝛟𝛟𝛟𝛟 6.42 × 10⁻⁵ ±3.55 × 10⁻⁵ 1.81
𝛟𝛟𝛟𝛟𝛟𝛟 1.07 × 10⁻⁵ ±1.01 × 10⁻⁵ 1.06
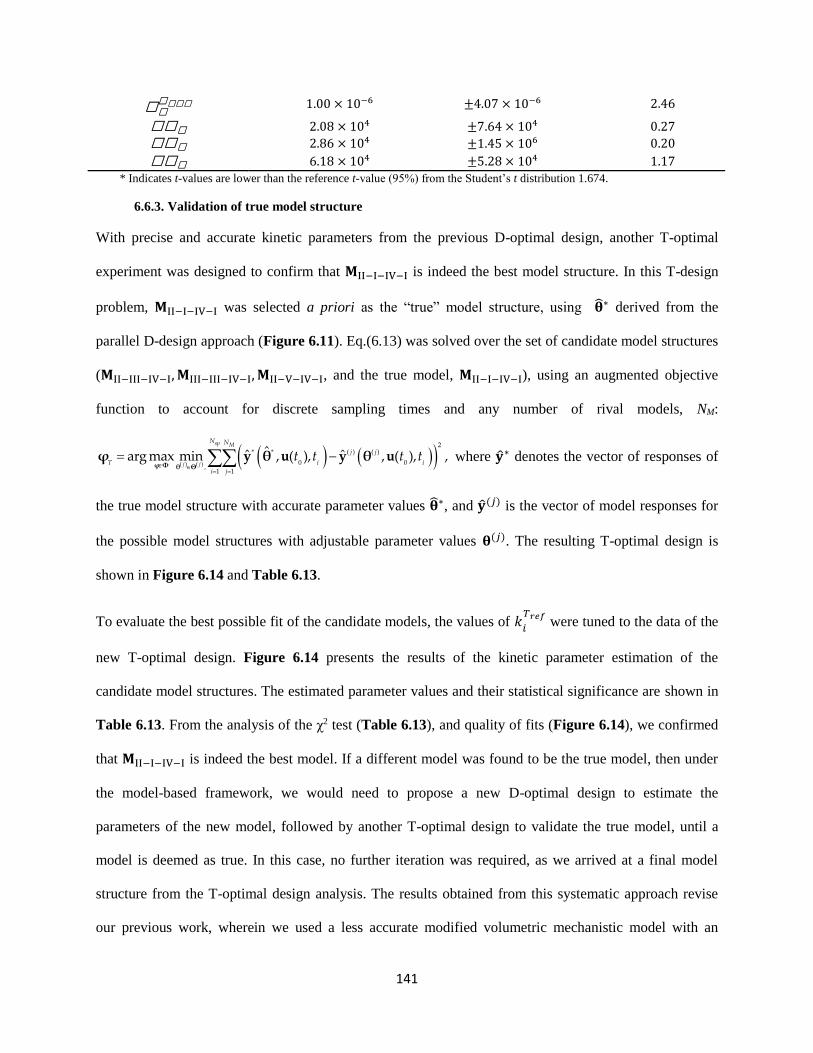
141
𝛟𝛟𝛟𝛟𝛟𝛟 1.00 × 10⁻⁶ ±4.07 × 10⁻⁶ 2.46
𝛟𝛟𝛟 2.08 × 10⁴ ±7.64 × 10⁴ 0.27
𝛟𝛟𝛟 2.86 × 10⁴ ±1.45 × 10⁶ 0.20
𝛟𝛟𝛟 6.18 × 10⁴ ±5.28 × 10⁴ 1.17
* Indicates t-values are lower than the reference t-value (95%) from the Student’s t distribution 1.674.
6.6.3. Validation of true model structure
With precise and accurate kinetic parameters from the previous D-optimal design, another T-optimal
experiment was designed to confirm that 𝐌II−I−IV−I is indeed the best model structure. In this T-design
problem, 𝐌II−I−IV−I was selected a priori as the “true” model structure, using ��∗ derived from the
parallel D-design approach (Figure 6.11). Eq.(6.13) was solved over the set of candidate model structures
(𝐌II−III−IV−I, 𝐌III−III−IV−I, 𝐌II−V−IV−I, and the true model, 𝐌II−I−IV−I), using an augmented objective
function to account for discrete sampling times and any number of rival models, NM:
( ) ( )
( ) ( )* *
0 0,
1 1
2
ˆ ˆarg max min , ( ), , ( )ˆ , ,sp M
j j i
N N
j
i j
i
j
Tt t t t
φ Φ θ Θ
y θ u y θ uφ where ��∗ denotes the vector of responses of
the true model structure with accurate parameter values ��∗, and ��(𝑗) is the vector of model responses for
the possible model structures with adjustable parameter values 𝛉(𝑗). The resulting T-optimal design is
shown in Figure 6.14 and Table 6.13.
To evaluate the best possible fit of the candidate models, the values of 𝑘𝑖
𝑇𝑟𝑒𝑓 were tuned to the data of the
new T-optimal design. Figure 6.14 presents the results of the kinetic parameter estimation of the
candidate model structures. The estimated parameter values and their statistical significance are shown in
Table 6.13. From the analysis of the χ2 test (Table 6.13), and quality of fits (Figure 6.14), we confirmed
that 𝐌II−I−IV−I is indeed the best model. If a different model was found to be the true model, then under
the model-based framework, we would need to propose a new D-optimal design to estimate the
parameters of the new model, followed by another T-optimal design to validate the true model, until a
model is deemed as true. In this case, no further iteration was required, as we arrived at a final model
structure from the T-optimal design analysis. The results obtained from this systematic approach revise
our previous work, wherein we used a less accurate modified volumetric mechanistic model with an
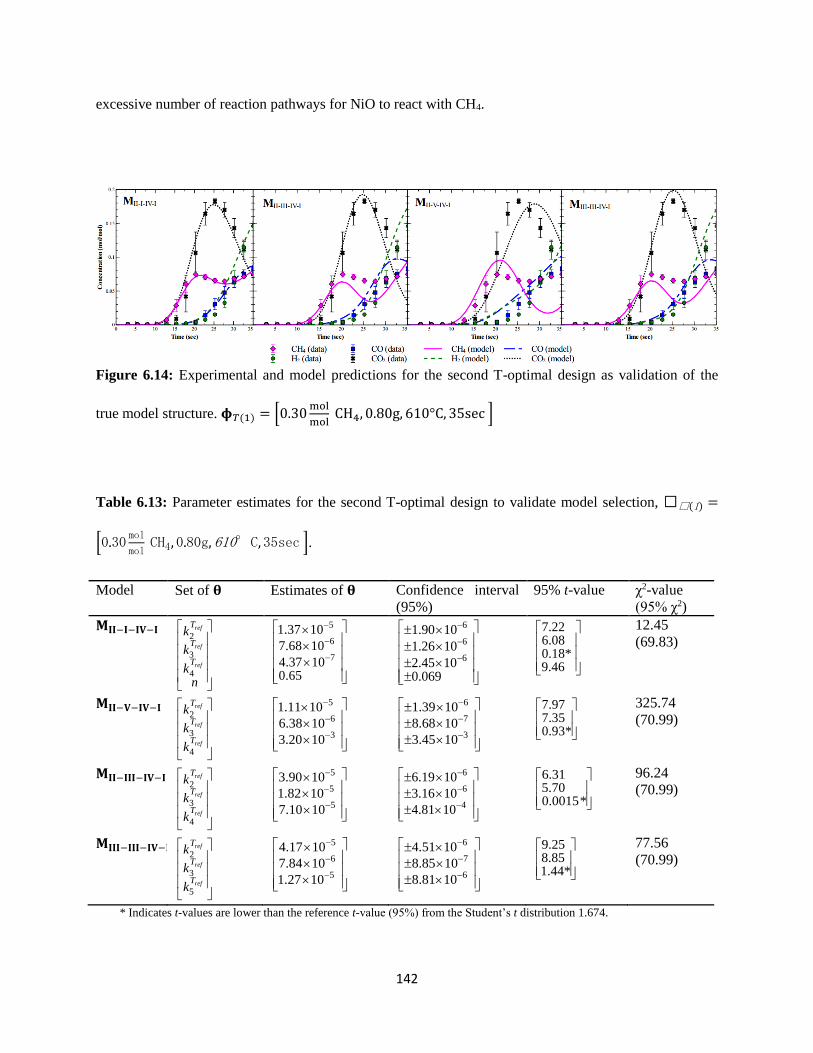
142
excessive number of reaction pathways for NiO to react with CH4.
Figure 6.14: Experimental and model predictions for the second T-optimal design as validation of the
true model structure. 𝛟𝑇(1) = [0.30mol
mol CH4, 0.80g, 610°C, 35sec ]
Table 6.13: Parameter estimates for the second T-optimal design to validate model selection, 𝛟𝛟(1) =
[0.30mol
mol CH4, 0.80g, 610°C, 35sec ].
Model Set of 𝛉 Estimates of 𝛉 Confidence interval
(95%)
95% t-value χ2-value
(95% χ2)
𝐌𝐈𝐈−𝐈−𝐈𝐕−𝐈 2
3
4
ref
ref
ref
T
T
T
k
k
kn
5
6
77.68
4.37 0
1
.65
.37 10
10
10
6
6
6
1.26
2.4
1
5
.90 10
10
100.069
7.226.08 0.18* 9.46
12.45
(69.83)
𝐌𝐈𝐈−𝐕−𝐈𝐕−𝐈 2
3
4
ref
ref
ref
T
T
T
k
k
k
5
6
36.38
3
1.11 10
.20
10
10
6
7
3
8.68
3.4
1.39 10
10
5 10
7.97 7.35 0.93*
325.74
(70.99)
𝐌𝐈𝐈−𝐈𝐈𝐈−𝐈𝐕−𝐈 2
3
4
ref
ref
ref
T
T
T
k
k
k
5
5
5
1.82
3.9
7
0 10
.
10
1010
6
6
4
6.19 10
3.16 10
4.81 10
6.31 5.70 0.0015*
96.24
(70.99)
𝐌𝐈𝐈𝐈−𝐈𝐈𝐈−𝐈𝐕−𝐈 2
3
5
ref
ref
ref
T
T
T
k
k
k
5
6
5
7.84
4.1
1
7 10
.
10
1027
6
7
6
8.85
8.8
4.51 10
10
1 10
9.25 8.85 1.44*
77.56
(70.99)
* Indicates t-values are lower than the reference t-value (95%) from the Student’s t distribution 1.674.
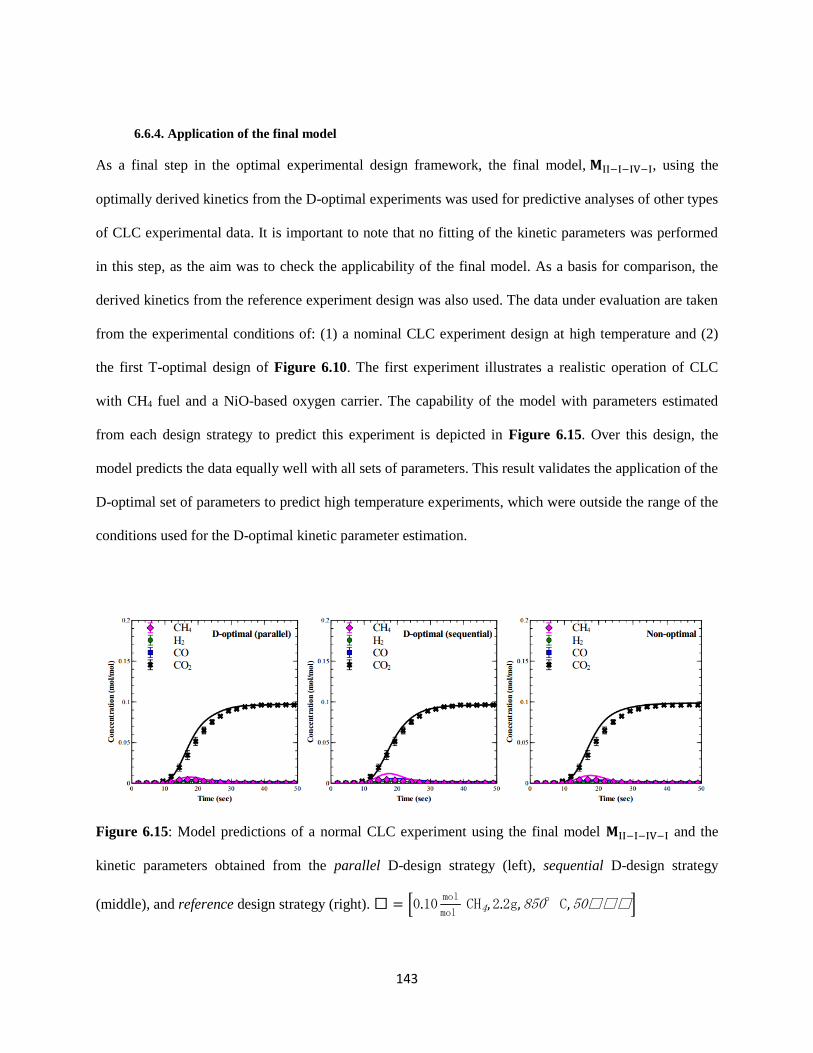
143
6.6.4. Application of the final model
As a final step in the optimal experimental design framework, the final model, 𝐌II−I−IV−I, using the
optimally derived kinetics from the D-optimal experiments was used for predictive analyses of other types
of CLC experimental data. It is important to note that no fitting of the kinetic parameters was performed
in this step, as the aim was to check the applicability of the final model. As a basis for comparison, the
derived kinetics from the reference experiment design was also used. The data under evaluation are taken
from the experimental conditions of: (1) a nominal CLC experiment design at high temperature and (2)
the first T-optimal design of Figure 6.10. The first experiment illustrates a realistic operation of CLC
with CH4 fuel and a NiO-based oxygen carrier. The capability of the model with parameters estimated
from each design strategy to predict this experiment is depicted in Figure 6.15. Over this design, the
model predicts the data equally well with all sets of parameters. This result validates the application of the
D-optimal set of parameters to predict high temperature experiments, which were outside the range of the
conditions used for the D-optimal kinetic parameter estimation.
Figure 6.15: Model predictions of a normal CLC experiment using the final model 𝐌II−I−IV−I and the
kinetic parameters obtained from the parallel D-design strategy (left), sequential D-design strategy
(middle), and reference design strategy (right). 𝛟 = [0.10mol
mol CH4, 2.2g, 850°C, 50𝛟𝛟𝛟]

144
In the second test, the kinetic parameters were used to predict the data of Figure 6.10. As shown in
Figure 6.16, an acceptable agreement between model predictions and experimental data can only be
achieved using the optimally-derived kinetics. The inadequacies of the model occurring at 𝑡 > 30 sec are
most likely not attributed to errors in the NiO reduction kinetics, rather to the catalytic reactions, which
were determined from the nominal low-temperature experiment performed in Section 6.6.1. In both cases
the CH4 fraction was under-predicted, suggesting that the catalytic methane decomposition reaction could
be ill-defined, which will be investigated in the future. These two case studies demonstrate that without a
set of precise parameters, the predictive or extrapolation ability of a model is severely limited to the
design space in which its parameters were estimated. This weakens the capacity of a model to be used for
any other purpose, especially for process scale-up or design studies. However if the parameters are
sufficiently precise and accurate, the reliability of a model is greatly increased, which is key for
successful product and process design, control, and optimization applications.
Figure 6.16: Model predictions of the first T-design experiment using the final model 𝐌II−I−IV−1 and the
kinetic parameters obtained from the parallel D-design strategy (left), sequential D-design strategy
(middle), and reference design strategy (right). 𝛟𝛟(3) = [0.20mol
mol CH4, 2.2g, 615°C, 40sec ].
145
6.7. Conclusions
The reduction of NiO by CH4 is uncertain in regards to the most suitable reaction mechanism, reaction
pathway, and contribution of the reactions catalyzed by Ni. In this series, a model-based framework for
design of experiments was applied to identify and statistically validate a high fidelity kinetic model that is
suitable for process engineering. In this work, we evaluated 160 possible kinetic models for the NiO-CH4
system and found 4 model structures that were structurally identifiable with respect to its kinetics and
distinguishable with respect to its model structure. In this paper, we optimized the design of CLC
reduction experiments to facilitate model discrimination and parameter estimation. The differences
between model structures were maximized in order to enable a clear discrimination of the most accurate
model. The NiO reduction kinetic parameters were estimated from optimal experiments designed to
minimize parameter uncertainty. The final model was shown to have predictive and extrapolation
abilities, outside of the original experiment design space. Through this model-based methodology, we
arrived at a high-fidelity kinetic model with precise parameters and at minimal experimental effort. The
uncertainty of the NiO-CH4 reduction kinetics is exemplary of the effectiveness of the presented
framework applied to a relatively large problem with complex dynamic interactions.

146
Chapter 7 DYNAMIC OPTIMIZATION OF FIXED BED CHEMICAL-LOOPING COMBUSTION
PROCESSES
The feasibility of incorporating chemical-looping combustion (CLC) into a combined cycle power plant is
explored. We propose a model-based framework to optimally design the cycle strategy for a CLC system,
composed of multiple fixed bed reactors. The CLC reactor system is optimally integrated with the
downstream gas turbine of a combined cycle power plant, by solving a dynamic program to optimize the
temperature profile of the heat removal step out of each reactor, with constraints on the system
performance during reduction and oxidation. We demonstrate the feasibility of fixed bed CLC systems to
achieve different exhaust temperatures, using synthetic Cu- and Ni-based oxygen carriers. The optimal
operating strategy is scaled-up to a system of fixed bed reactors operating in parallel. We show that
through process optimization, the batch-operation of fixed bed CLC reactors is void of significant exhaust
gas temperature fluctuations and can reach high thermal efficiencies with in-situ CO2 capture.
7.1. Introduction
The main application of chemical-looping combustion (CLC) will be in the power generation sector.
Among the most energy efficient power cycles is the combined cycle power plant (CCPP), which is an
arrangement of a gas turbine with a steam cycle. Combined cycles offer the advantage of high
efficiencies, reduction in pollutant emissions, low capital and maintenance costs, and compatibility with
natural gas and coal feedstocks [338–341]. In the natural gas fired combined cycle (NGCC), clean natural
gas is combusted with air at high temperature and pressure in a gas turbine, producing electricity. Waste
heat from the exhaust is then recovered through generation of high pressure steam, which powers steam
turbines to produce more electricity. The exhaust gas contains CO2 and steam, diluted in N2 from the
combustion air. To separate the CO2 from the N2, solvent-based absorption methods are usually preferred
and afterward, the CO2 is cooled and compressed to supercritical conditions [341,342]. Coal fired
processes use the integrated gasification combined cycle (IGCC), wherein a synthesis gas mixture is
147
produced through gasification of the coal at high pressure with oxygen. After cleaning, the syngas is
burned in the gas turbine and the exhaust gases are sent to the steam cycle. CO2 removal from IGCC
systems entails the addition of a shift converter unit (to convert the syngas into CO2 and H2) and/or a CO2
separation and compression unit. The net power efficiency of conventional combined cycles without CO2
capture is approximately 58%[338] using natural gas and 40-42% using coal [340,341]. Carbon capture
by means of chemical absorption from the flue gases of the NGCC reduces the net plant efficiency and
power output of the NGCC systems by about 10% [343]. The efficiency of IGCC with pre-combustion
decarbonisation by physical absorption decreases the efficiency of the plant to 35%.[149] To reduce the
energy expenditure of the CO2 capture step, CLC can be used in these combined cycle plants [23].
One of the challenges in the commercialization of CLC technology is the integration of the CLC reactor
with an existing power plant, from the process design perspective. The CLC unit can be integrated with a
combined cycle by replacing the combustor of the gas turbine. In conventional syngas-fed and natural
gas-fed gas turbines, the gas turbine pressure ratio is in the range of 10-20 with turbine inlet temperatures
of 1100-1300°C [343–345]. The thermal efficiency of the gas turbine increases with the inlet temperature
and pressure [346], which also benefits the steam cycle because the gas exiting the gas turbine is at higher
temperatures. Therefore, CLC needs to be operated at elevated pressures, if integrated in a combined
cycle power plant. From the efficiency perspective, the pressure drop across the CLC reactor should be
low (ΔP/P<8%) [111], in order to conserve the energy spent in gas compression. In summary, high-
pressure operation with low pressure drop is a requirement for high efficiency CLC integrated with a
combined cycle.
The high-pressure requirement imposes constraints in the design and cycling sequence of CLC reactors.
The most widely recognized design for CLC consists of interconnected fluidized bed reactors [23,81]. In
this configuration, the solid oxygen carrier is physically transported between the so-called air and fuel
reactors. This concept was successfully demonstrated in different prototypes with various oxygen carriers
at atmospheric pressure [74,100,104,105,196,347–350]. The high-pressure fluidized bed concept is still
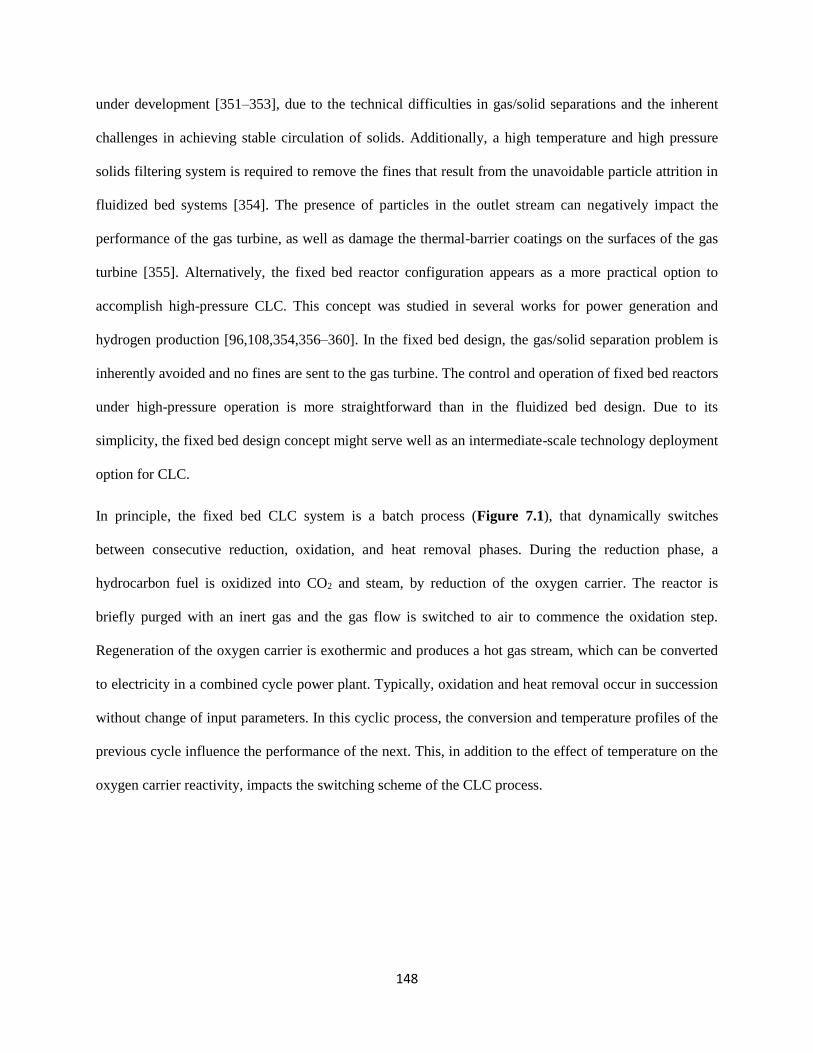
148
under development [351–353], due to the technical difficulties in gas/solid separations and the inherent
challenges in achieving stable circulation of solids. Additionally, a high temperature and high pressure
solids filtering system is required to remove the fines that result from the unavoidable particle attrition in
fluidized bed systems [354]. The presence of particles in the outlet stream can negatively impact the
performance of the gas turbine, as well as damage the thermal-barrier coatings on the surfaces of the gas
turbine [355]. Alternatively, the fixed bed reactor configuration appears as a more practical option to
accomplish high-pressure CLC. This concept was studied in several works for power generation and
hydrogen production [96,108,354,356–360]. In the fixed bed design, the gas/solid separation problem is
inherently avoided and no fines are sent to the gas turbine. The control and operation of fixed bed reactors
under high-pressure operation is more straightforward than in the fluidized bed design. Due to its
simplicity, the fixed bed design concept might serve well as an intermediate-scale technology deployment
option for CLC.
In principle, the fixed bed CLC system is a batch process (Figure 7.1), that dynamically switches
between consecutive reduction, oxidation, and heat removal phases. During the reduction phase, a
hydrocarbon fuel is oxidized into CO2 and steam, by reduction of the oxygen carrier. The reactor is
briefly purged with an inert gas and the gas flow is switched to air to commence the oxidation step.
Regeneration of the oxygen carrier is exothermic and produces a hot gas stream, which can be converted
to electricity in a combined cycle power plant. Typically, oxidation and heat removal occur in succession
without change of input parameters. In this cyclic process, the conversion and temperature profiles of the
previous cycle influence the performance of the next. This, in addition to the effect of temperature on the
oxygen carrier reactivity, impacts the switching scheme of the CLC process.
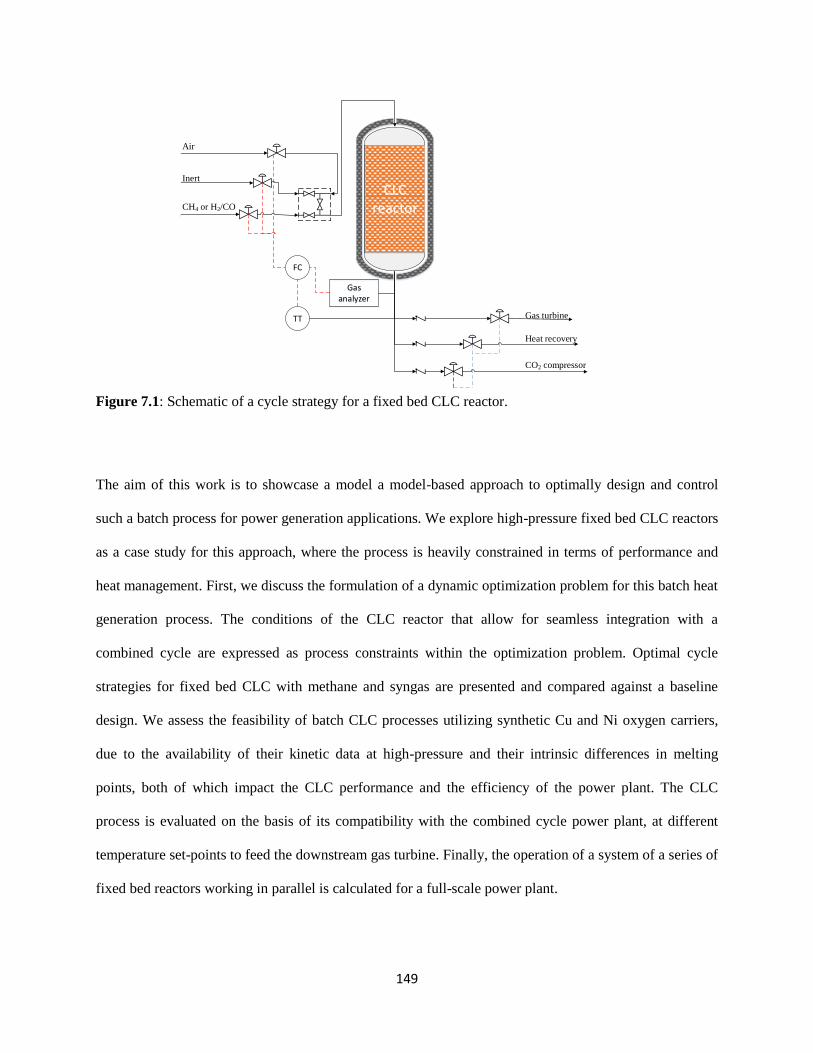
149
CLC reactor
Air
Inert
CH4 or H2/CO
Gas turbine
Heat recovery
FC
CO2 compressor
TT
Gas analyzer
Figure 7.1: Schematic of a cycle strategy for a fixed bed CLC reactor.
The aim of this work is to showcase a model a model-based approach to optimally design and control
such a batch process for power generation applications. We explore high-pressure fixed bed CLC reactors
as a case study for this approach, where the process is heavily constrained in terms of performance and
heat management. First, we discuss the formulation of a dynamic optimization problem for this batch heat
generation process. The conditions of the CLC reactor that allow for seamless integration with a
combined cycle are expressed as process constraints within the optimization problem. Optimal cycle
strategies for fixed bed CLC with methane and syngas are presented and compared against a baseline
design. We assess the feasibility of batch CLC processes utilizing synthetic Cu and Ni oxygen carriers,
due to the availability of their kinetic data at high-pressure and their intrinsic differences in melting
points, both of which impact the CLC performance and the efficiency of the power plant. The CLC
process is evaluated on the basis of its compatibility with the combined cycle power plant, at different
temperature set-points to feed the downstream gas turbine. Finally, the operation of a system of a series of
fixed bed reactors working in parallel is calculated for a full-scale power plant.
150
7.2. Problem formulation
7.2.1. Process description
The CLC cycle in a batch fixed bed reactor consists of reduction, oxidation, and heat removal steps. To
control this transient switching, a practical approach is to use the temperature and gas selectivity
measurements of the exhaust stream to decide when to alternate the gas flow [108], as shown in Figure
7.1. Figure 7.1 is not a real and complete controls diagram, but an illustration of a conceptual design
strategy. In this strategy, the reduction cycle is stopped when: (a) fuel slip is detected or (b) the CO2
capture efficiency is too low. Then the reactor switches to purging mode. After a brief purge, the
oxidation cycle is initiated by feeding air into the reactor. When the front of the heat generated by the
exothermic oxidation reaction reaches the reactor exit, the temperature of the exhaust stream rises and the
exhaust gas is sent to the gas turbine. This is the heat removal stage and proceeds until the exhaust
temperature reaches a temperature that is too low for the gas turbine. Some of the heat generated in the
oxidation step is left in the bed and produces a moderate-temperature gas that can be used for heat
recovery within the plant. After this, the reactor is purged and the cycle returns to the reduction step.
Temperature fluctuations occur in the reactor exhaust stream during the transient heat removal stage,
which can negatively impact the operation of a downstream gas turbine. In particular, changes in turbine
temperature can lead to thermal/mechanical cycling stress and differential expansion between stationary
and rotating parts [358,361]. Both phenomena cause fatigue damage and reduce the lifetime of the turbine
if they are not properly handled. Therefore, adequate heat management of the CLC reactor is needed for
the gas turbine to operate efficiently and safely. In addition, it is best to maximize the solid conversion in
the reduction and oxidation cycles to fully utilize the oxygen carrier, while maintaining high CO2 capture
efficiency. Due to these strict requirements and constraints, the design and operation of the batch CLC
reactor is complex and requires a formal methodology that ensures system safety and reliability. In the
following section, we propose a generic model-based formulation for the design and tuning of the
switching strategy, with the objective of seamlessly integrating CLC into a combined cycle power plant.
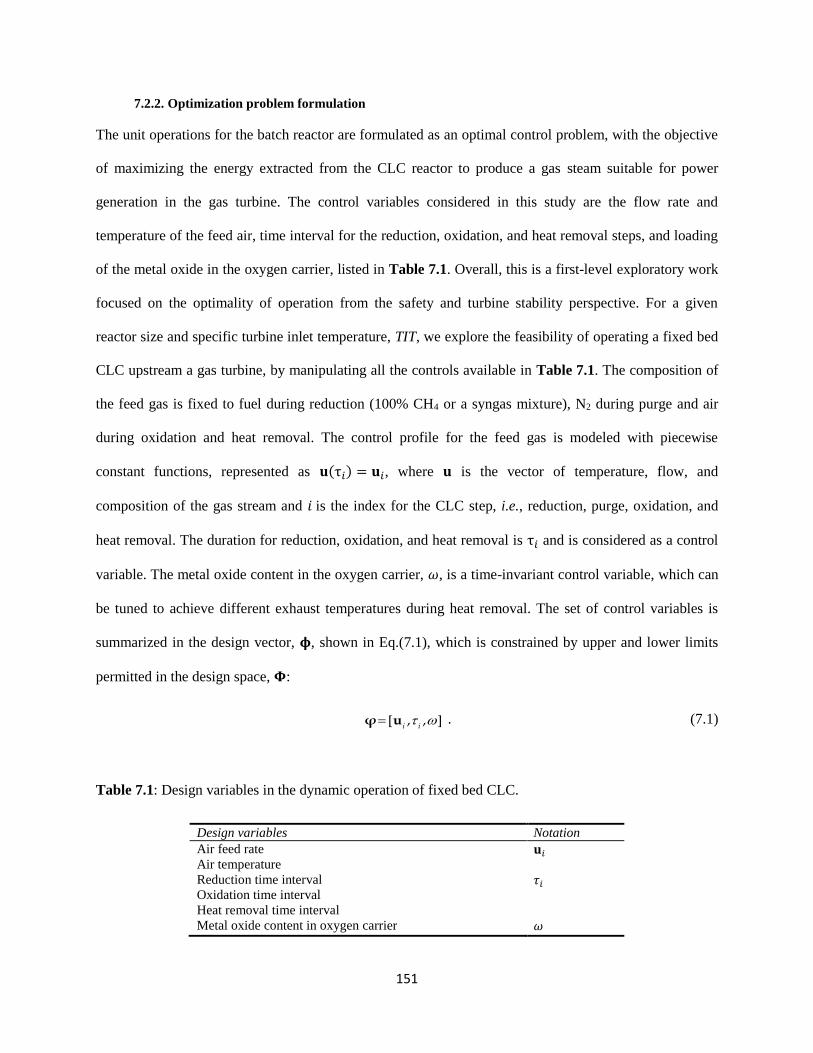
151
7.2.2. Optimization problem formulation
The unit operations for the batch reactor are formulated as an optimal control problem, with the objective
of maximizing the energy extracted from the CLC reactor to produce a gas steam suitable for power
generation in the gas turbine. The control variables considered in this study are the flow rate and
temperature of the feed air, time interval for the reduction, oxidation, and heat removal steps, and loading
of the metal oxide in the oxygen carrier, listed in Table 7.1. Overall, this is a first-level exploratory work
focused on the optimality of operation from the safety and turbine stability perspective. For a given
reactor size and specific turbine inlet temperature, TIT, we explore the feasibility of operating a fixed bed
CLC upstream a gas turbine, by manipulating all the controls available in Table 7.1. The composition of
the feed gas is fixed to fuel during reduction (100% CH4 or a syngas mixture), N2 during purge and air
during oxidation and heat removal. The control profile for the feed gas is modeled with piecewise
constant functions, represented as 𝐮(τ𝑖) = 𝐮𝑖, where 𝐮 is the vector of temperature, flow, and
composition of the gas stream and 𝑖 is the index for the CLC step, i.e., reduction, purge, oxidation, and
heat removal. The duration for reduction, oxidation, and heat removal is τ𝑖 and is considered as a control
variable. The metal oxide content in the oxygen carrier, 𝜔, is a time-invariant control variable, which can
be tuned to achieve different exhaust temperatures during heat removal. The set of control variables is
summarized in the design vector, 𝛟, shown in Eq.(7.1), which is constrained by upper and lower limits
permitted in the design space, 𝚽:
[ , , ]i i φ u . (7.1)
Table 7.1: Design variables in the dynamic operation of fixed bed CLC.
Design variables Notation
Air feed rate
Air temperature 𝐮𝑖
Reduction time interval
Oxidation time interval
Heat removal time interval
𝜏𝑖
Metal oxide content in oxygen carrier 𝜔
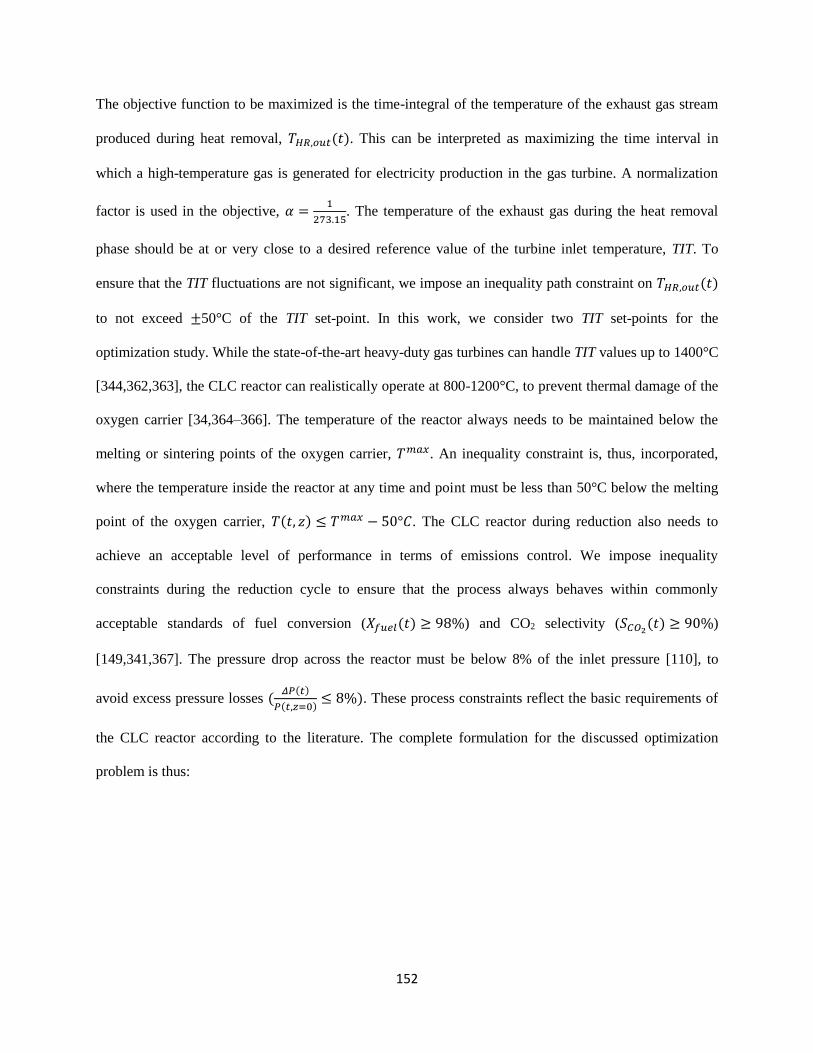
152
The objective function to be maximized is the time-integral of the temperature of the exhaust gas stream
produced during heat removal, 𝑇𝐻𝑅,𝑜𝑢𝑡(𝑡). This can be interpreted as maximizing the time interval in
which a high-temperature gas is generated for electricity production in the gas turbine. A normalization
factor is used in the objective, 𝛼 =1
273.15. The temperature of the exhaust gas during the heat removal
phase should be at or very close to a desired reference value of the turbine inlet temperature, TIT. To
ensure that the TIT fluctuations are not significant, we impose an inequality path constraint on 𝑇𝐻𝑅,𝑜𝑢𝑡(𝑡)
to not exceed ±50°C of the TIT set-point. In this work, we consider two TIT set-points for the
optimization study. While the state-of-the-art heavy-duty gas turbines can handle TIT values up to 1400°C
[344,362,363], the CLC reactor can realistically operate at 800-1200°C, to prevent thermal damage of the
oxygen carrier [34,364–366]. The temperature of the reactor always needs to be maintained below the
melting or sintering points of the oxygen carrier, 𝑇𝑚𝑎𝑥. An inequality constraint is, thus, incorporated,
where the temperature inside the reactor at any time and point must be less than 50°C below the melting
point of the oxygen carrier, 𝑇(𝑡, 𝑧) ≤ 𝑇𝑚𝑎𝑥 − 50°𝐶. The CLC reactor during reduction also needs to
achieve an acceptable level of performance in terms of emissions control. We impose inequality
constraints during the reduction cycle to ensure that the process always behaves within commonly
acceptable standards of fuel conversion (𝑋𝑓𝑢𝑒𝑙(𝑡) ≥ 98%) and CO2 selectivity (𝑆𝐶𝑂2(𝑡) ≥ 90%)
[149,341,367]. The pressure drop across the reactor must be below 8% of the inlet pressure [110], to
avoid excess pressure losses (𝛥𝑃(𝑡)
𝑃(𝑡,𝑧=0)≤ 8%). These process constraints reflect the basic requirements of
the CLC reactor according to the literature. The complete formulation for the discussed optimization
problem is thus:
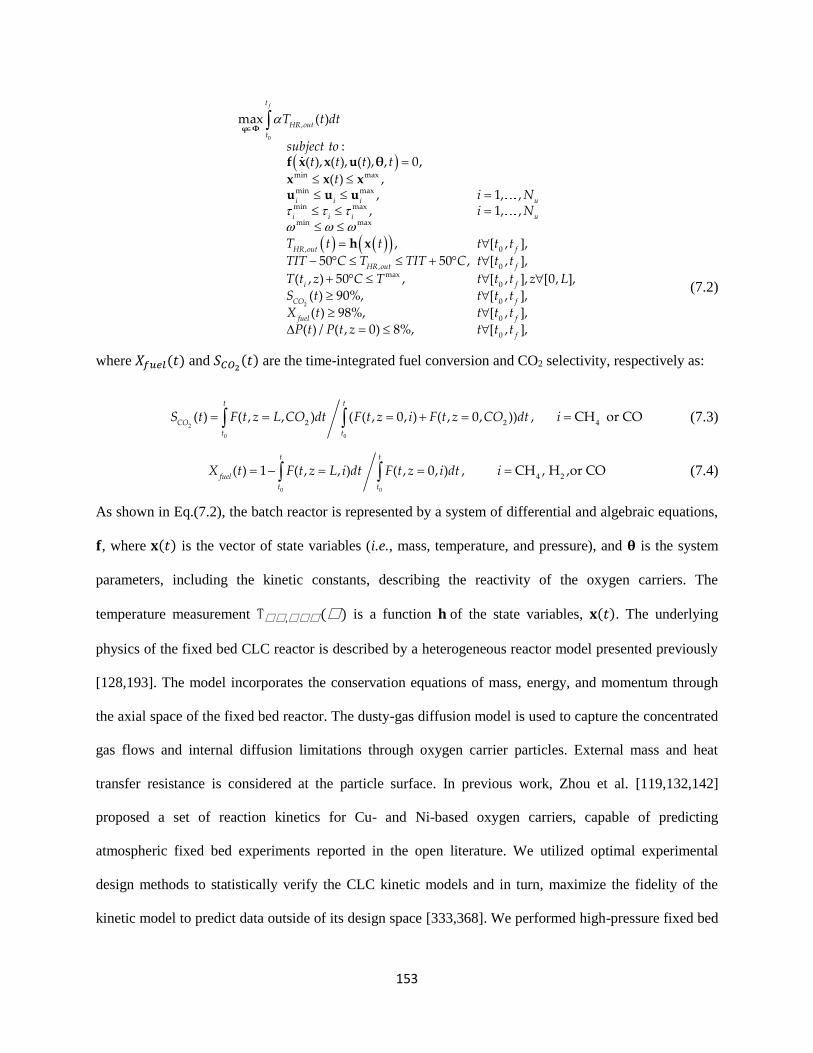
153
0
min max
min max
min max
min max
, 0
0
,
,
max (
,, 1, ,
, 1, ,
, [ , ],
[ , ],
)
:( ), ( ), ( ), , 0,
( )
50 50 ,
( , ) 5
f
i i i u
i i i
t
HR out
t
HR ou
u
HR out f
t
i
f
T t dt
subject tot t t
t
TIT C T TIT
t
i Ni N
T t t t t t
t t tC
T t z
φ Φ
θ
x xu u u
h
f x x u
x
x
2
max
0
0
0
0
, [ , ], [0, ],
( ) 90%, [ , ],
( ) 98%, [ , ],
( ) / ( , 0) 8%, [ ,
0
, ]
f
CO f
fuel f
f
t t t z L
S t t t t
X t t t t
P t P t z t t t
C T
(7.2)
where 𝑋𝑓𝑢𝑒𝑙(𝑡) and 𝑆𝐶𝑂2(𝑡) are the time-integrated fuel conversion and CO2 selectivity, respectively as:
2
0 0
2 2 4( , , ) ( ( , 0, ) ( , 0, )) , CH o( O) r C
t t
t t
COF t z L CO dt F t z i F t zS O dt it C (7.3)
0 0
4 21 ( , , )( ( , 0, ) , CH , H ) ,or CO
t
f
t
e
t
u
t
lF t z L i dt F t z it dtX i (7.4)
As shown in Eq.(7.2), the batch reactor is represented by a system of differential and algebraic equations,
𝐟, where 𝐱(𝑡) is the vector of state variables (i.e., mass, temperature, and pressure), and 𝛉 is the system
parameters, including the kinetic constants, describing the reactivity of the oxygen carriers. The
temperature measurement T𝛟𝛟,𝛟𝛟𝛟(𝛟) is a function 𝐡 of the state variables, 𝐱(𝑡). The underlying
physics of the fixed bed CLC reactor is described by a heterogeneous reactor model presented previously
[128,193]. The model incorporates the conservation equations of mass, energy, and momentum through
the axial space of the fixed bed reactor. The dusty-gas diffusion model is used to capture the concentrated
gas flows and internal diffusion limitations through oxygen carrier particles. External mass and heat
transfer resistance is considered at the particle surface. In previous work, Zhou et al. [119,132,142]
proposed a set of reaction kinetics for Cu- and Ni-based oxygen carriers, capable of predicting
atmospheric fixed bed experiments reported in the open literature. We utilized optimal experimental
design methods to statistically verify the CLC kinetic models and in turn, maximize the fidelity of the
kinetic model to predict data outside of its design space [333,368]. We performed high-pressure fixed bed
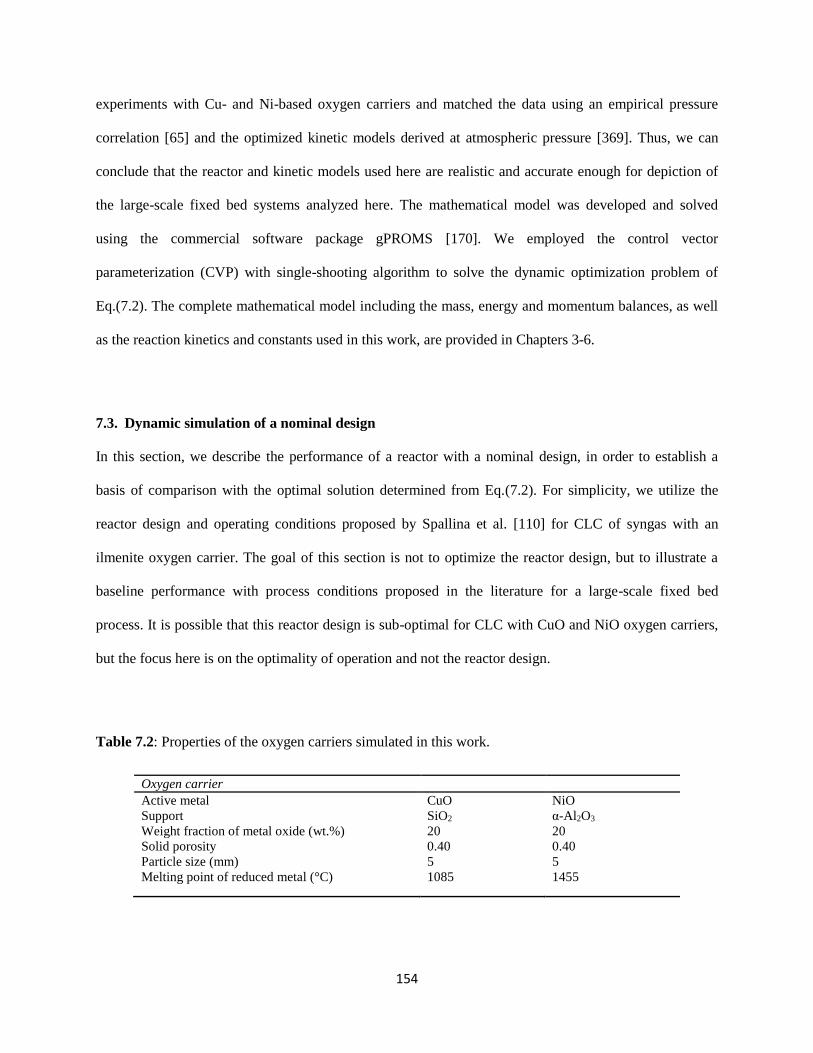
154
experiments with Cu- and Ni-based oxygen carriers and matched the data using an empirical pressure
correlation [65] and the optimized kinetic models derived at atmospheric pressure [369]. Thus, we can
conclude that the reactor and kinetic models used here are realistic and accurate enough for depiction of
the large-scale fixed bed systems analyzed here. The mathematical model was developed and solved
using the commercial software package gPROMS [170]. We employed the control vector
parameterization (CVP) with single-shooting algorithm to solve the dynamic optimization problem of
Eq.(7.2). The complete mathematical model including the mass, energy and momentum balances, as well
as the reaction kinetics and constants used in this work, are provided in Chapters 3-6.
7.3. Dynamic simulation of a nominal design
In this section, we describe the performance of a reactor with a nominal design, in order to establish a
basis of comparison with the optimal solution determined from Eq.(7.2). For simplicity, we utilize the
reactor design and operating conditions proposed by Spallina et al. [110] for CLC of syngas with an
ilmenite oxygen carrier. The goal of this section is not to optimize the reactor design, but to illustrate a
baseline performance with process conditions proposed in the literature for a large-scale fixed bed
process. It is possible that this reactor design is sub-optimal for CLC with CuO and NiO oxygen carriers,
but the focus here is on the optimality of operation and not the reactor design.
Table 7.2: Properties of the oxygen carriers simulated in this work.
Oxygen carrier
Active metal CuO NiO
Support SiO2 α-Al2O3
Weight fraction of metal oxide (wt.%) 20 20
Solid porosity 0.40 0.40
Particle size (mm) 5 5
Melting point of reduced metal (°C) 1085 1455

155
Tables 7.2-7.3 summarize the nominal design parameters and operating variables used to establish a
baseline performance of the fixed bed processes. The performance of the fixed bed reactor of Table 7.3,
with the feedback control strategy discussed in Section 7.2.1 is shown in Tables 7.2-7.3, presented in
terms of the bed temperature vs. bed height, and exhaust gas temperature and composition vs. cycle time.
The process decisions during the simulation sequence were to: (1) feed fuel (syngas or CH4) until
𝑋𝑓𝑢𝑒𝑙(𝑡) < 98% or 𝑆𝐶𝑂2(𝑡) < 90%; (2) switch to inert gas and purge the system for 300s, (3) feed air to
oxidize the solids and produce a suitable gas for power generation, and (4) switch to purging mode when
the reactor exhaust reaches the temperature set-point (Tsp=800°C for syngas-fed and Tsp=900°C for
methane-fed processes). These steps are repeated for multiple redox cycles to achieve a cyclic steady-
state, where the temperature and conversion profiles of one cycle are identical to the next. The results of
Figures 7.2-7.5 are presented for this cyclic steady-state condition, usually reached within 2-3 cycles. The
heat removal duration, feeding the gas turbine (HR-1), was selected over the time interval in which the
exhaust temperature was within 50°C of the turbine inlet temperature (TIT). For simplicity, we set the TIT
set-point to 1000°C for both oxygen carriers. In the later sections, we incorporate different TIT set-points
in the constraint of the optimization problem. As shown in Figures 7.2-7.5, the maximum temperature
reached in the fixed bed process is dependent on the oxygen carrier material and fuel type. In Figure 7.3,
the system overshoots the set-point and in Figure 7.2, Figure 7.4, and Figure 7.5, the system
undershoots. The results shown here are used to illustrate the performance of a fixed bed process under a
nominal design and operating conditions.
156
Table 7.3: Design and operating conditions of the studied fixed bed reactor configuration (adapted from
Spallina et al. [110] suited for reduction by syngas-fuel and methane-fuel).
Syngas-fuel Methane-fuel
Reactor configuration
Length (m) 11 11
Diameter (m) 5.5 5.5
Gas streams
Air (Oxidation + Heat Removal)
Mass flow (kg/s) 178 178
Pressure (bar) 17 17
Inlet Temperature (°C) 450 600
Composition (%.vol) 0.92 Ar; 0.03 CO2; 1.03 H2O; 77.28
N2; 20.73 O2
0.92 Ar; 0.03 CO2; 1.03 H2O; 77.28
N2; 20.73 O2
N2 (Purge)
Mass flow (kg/s) 577.5 577.5
Pressure (bar) 17 17
Inlet Temperature (°C) 450 450
Composition (%.vol) 1.016 Ar; 0.04 CO2; 1.31 H2O; 97.5
N2
1.016 Ar; 0.04 CO2; 1.31 H2O; 97.5
N2
Fuel (Reduction)
Mass flow (kg/s) 152 15
Pressure (bar) 17 17
Inlet Temperature (°C) 450 450
Composition (%.vol) 1 Ar; 33.6 CO; 34 CO2; 13.8 H2;
16.4 H2O; 1.3 N2
100% CH4
Figure 7.2 presents the complete CLC sequence with the CuO oxygen carrier and syngas fuel. When
oxidation is started, energy is released from the exothermic reactions and the bed temperature increases.
As air is continually fed to the reactor, the heat front travels axially through the bed and the cycle
switches to heat removal when the exhaust temperature is high enough to feed a downstream gas turbine
(Figures 7.2(a)-7.2(b)). The progression of the heat front can be seen in Figure 7.2(a), by the location of
the high temperature zones at the end of oxidation and at the end of heat removal. The exhaust
temperature during the heat removal phase is relatively constant and flat during HR-1 and then steadily
decreases during HR-2 (Figure 7.2(b)), because of the temperature profile inside the bed produced from
the oxidation phase (Figure 7.2(a)). The exit gas concentration during oxidation is predominantly
composed of N2 with some unreacted O2 (Figure 7.2(c)). The bed is completely regenerated at the end of
the oxidation cycle, as inlet feed concentrations of the air are detected at the reactor exit (Figure 7.2(c)).
After a brief purge, the cycle switches to reduction. The reduction of CuO by syngas is exothermic and
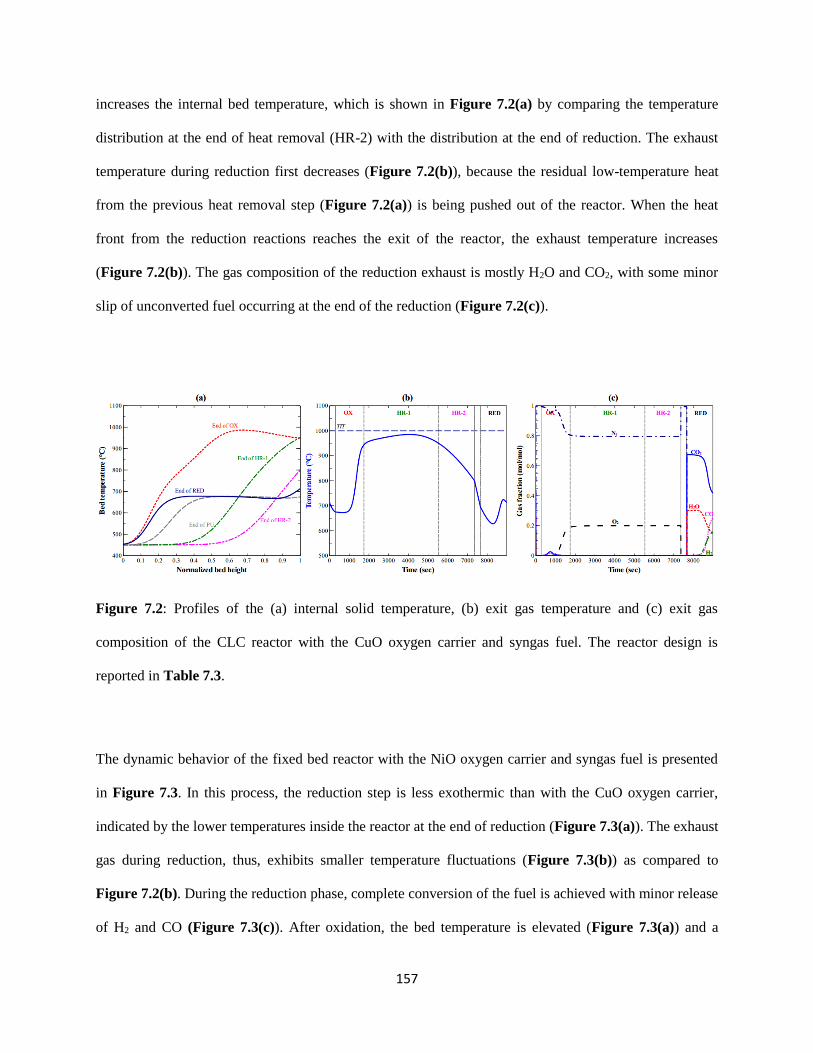
157
increases the internal bed temperature, which is shown in Figure 7.2(a) by comparing the temperature
distribution at the end of heat removal (HR-2) with the distribution at the end of reduction. The exhaust
temperature during reduction first decreases (Figure 7.2(b)), because the residual low-temperature heat
from the previous heat removal step (Figure 7.2(a)) is being pushed out of the reactor. When the heat
front from the reduction reactions reaches the exit of the reactor, the exhaust temperature increases
(Figure 7.2(b)). The gas composition of the reduction exhaust is mostly H2O and CO2, with some minor
slip of unconverted fuel occurring at the end of the reduction (Figure 7.2(c)).
Figure 7.2: Profiles of the (a) internal solid temperature, (b) exit gas temperature and (c) exit gas
composition of the CLC reactor with the CuO oxygen carrier and syngas fuel. The reactor design is
reported in Table 7.3.
The dynamic behavior of the fixed bed reactor with the NiO oxygen carrier and syngas fuel is presented
in Figure 7.3. In this process, the reduction step is less exothermic than with the CuO oxygen carrier,
indicated by the lower temperatures inside the reactor at the end of reduction (Figure 7.3(a)). The exhaust
gas during reduction, thus, exhibits smaller temperature fluctuations (Figure 7.3(b)) as compared to
Figure 7.2(b). During the reduction phase, complete conversion of the fuel is achieved with minor release
of H2 and CO (Figure 7.3(c)). After oxidation, the bed temperature is elevated (Figure 7.3(a)) and a
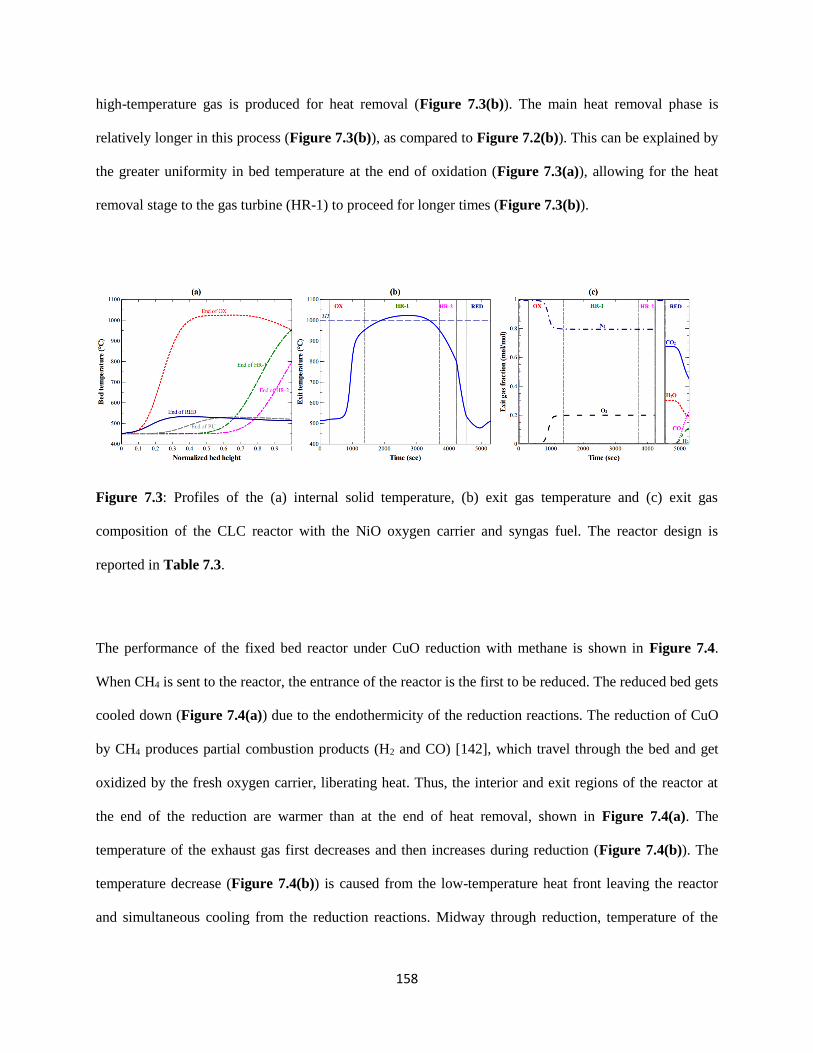
158
high-temperature gas is produced for heat removal (Figure 7.3(b)). The main heat removal phase is
relatively longer in this process (Figure 7.3(b)), as compared to Figure 7.2(b)). This can be explained by
the greater uniformity in bed temperature at the end of oxidation (Figure 7.3(a)), allowing for the heat
removal stage to the gas turbine (HR-1) to proceed for longer times (Figure 7.3(b)).
Figure 7.3: Profiles of the (a) internal solid temperature, (b) exit gas temperature and (c) exit gas
composition of the CLC reactor with the NiO oxygen carrier and syngas fuel. The reactor design is
reported in Table 7.3.
The performance of the fixed bed reactor under CuO reduction with methane is shown in Figure 7.4.
When CH4 is sent to the reactor, the entrance of the reactor is the first to be reduced. The reduced bed gets
cooled down (Figure 7.4(a)) due to the endothermicity of the reduction reactions. The reduction of CuO
by CH4 produces partial combustion products (H2 and CO) [142], which travel through the bed and get
oxidized by the fresh oxygen carrier, liberating heat. Thus, the interior and exit regions of the reactor at
the end of the reduction are warmer than at the end of heat removal, shown in Figure 7.4(a). The
temperature of the exhaust gas first decreases and then increases during reduction (Figure 7.4(b)). The
temperature decrease (Figure 7.4(b)) is caused from the low-temperature heat front leaving the reactor
and simultaneous cooling from the reduction reactions. Midway through reduction, temperature of the
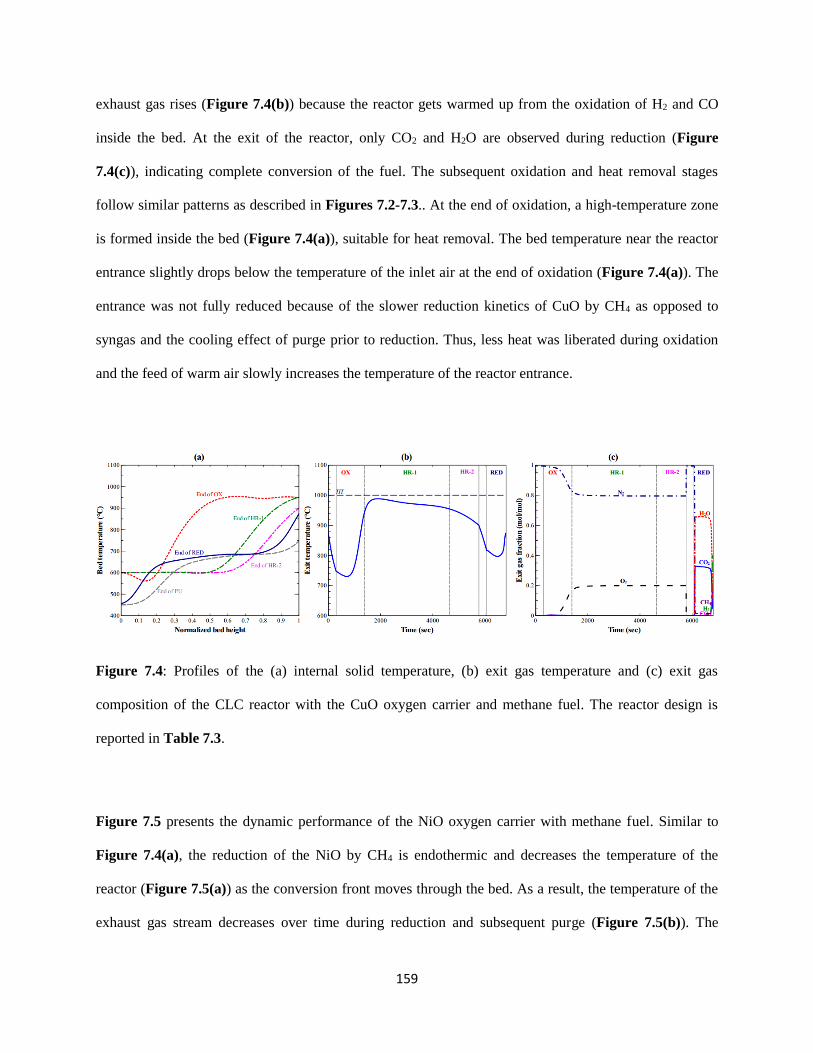
159
exhaust gas rises (Figure 7.4(b)) because the reactor gets warmed up from the oxidation of H2 and CO
inside the bed. At the exit of the reactor, only CO2 and H2O are observed during reduction (Figure
7.4(c)), indicating complete conversion of the fuel. The subsequent oxidation and heat removal stages
follow similar patterns as described in Figures 7.2-7.3.. At the end of oxidation, a high-temperature zone
is formed inside the bed (Figure 7.4(a)), suitable for heat removal. The bed temperature near the reactor
entrance slightly drops below the temperature of the inlet air at the end of oxidation (Figure 7.4(a)). The
entrance was not fully reduced because of the slower reduction kinetics of CuO by CH4 as opposed to
syngas and the cooling effect of purge prior to reduction. Thus, less heat was liberated during oxidation
and the feed of warm air slowly increases the temperature of the reactor entrance.
Figure 7.4: Profiles of the (a) internal solid temperature, (b) exit gas temperature and (c) exit gas
composition of the CLC reactor with the CuO oxygen carrier and methane fuel. The reactor design is
reported in Table 7.3.
Figure 7.5 presents the dynamic performance of the NiO oxygen carrier with methane fuel. Similar to
Figure 7.4(a), the reduction of the NiO by CH4 is endothermic and decreases the temperature of the
reactor (Figure 7.5(a)) as the conversion front moves through the bed. As a result, the temperature of the
exhaust gas stream decreases over time during reduction and subsequent purge (Figure 7.5(b)). The

160
effluents of the reduction step are mostly CO2 and H2O, with a small amount of fuel slip occurring at the
end of reduction (Figure 7.5(c)). During the oxidation cycle, heat is liberated by the exothermic reactions
and a high-temperature zone is formed inside the reactor bed (Figure 7.5(a)). At the end of oxidation, the
oxygen carrier is regenerated, indicated by the unconverted air leaving the reactor (Figure 7.5(c)), and the
temperature of the exhaust gas is within 50°C of the TIT set-point (Figure 7.5(b)). The exhaust gas during
heat removal exhibits a high temperature drop, restricting energy extraction to the gas turbine to ~50% of
the total heat removal time Figure 7.5(b)).
Figure 7.5: Profiles of the (a) internal solid temperature, (b) exit gas temperature, and (c) exit gas
composition of the CLC reactor with the NiO oxygen carrier and methane fuel. The reactor design is
reported in Table 7.3.
Figures 7.2-7.5 are representative of cycle strategies to conduct CLC in a large-scale fixed bed reactor.
The issue with these nominal designs is the exit gas temperature and its fluctuations during the heat
removal phase, which is not suitable for a downstream gas turbine. To find the optimal heat management
strategy, we solve the optimization problem of Section 7.2.2 for the reactor configurations of Table 7.3.

161
7.4. Results and discussion
7.4.1. Optimal fixed bed operation for CLC
The challenge in solving the optimization problem formulated in Section 7.2.2 is that the conversion and
temperature profiles from the previous cycle impact the performance of the next cycles and it typically
takes 2-3 cycles for the system to reach a cyclic steady-state condition after modifying the cycle strategy.
Thus, the optimization procedure needs to be carried out for several redox cycles and the optimal cycle
strategy should be extracted from the last cycle. In this analysis, we first initialize all state variables at the
end of the heat removal phase of the nominal design point (shown in Figures 7.2-7.5) and perform the
optimization procedure for 3 redox cycles. For each oxygen carrier, we consider two set-points for the
turbine inlet temperature (TIT), being: 1100°C and 1000°C for NiO and 1000°C and 900°C for CuO.
These reference values are exemplary of the existing, commercial gas turbines offered by Siemens
[370,371] and GE [144,372,373]. As mentioned, smaller TITs are required in CLC to protect the oxygen
carrier from sintering or agglomeration. The results of this optimization are presented in Figures 7.6-7.7
for the CuO oxygen carrier and in Figures 7.8-7.9 for the NiO oxygen carrier. Figures 7.6-7.9 showcase
the optimal fixed bed performance with the low TIT set-point and in Figures SI.1-4 of the Supplementary
Information of [374] we present the performance with the high TIT-set-point. For brevity, we will focus
our discussion on Figures 7.6-7.9. The optimal operating strategies are presented in Table 7.4.
Figure 7.6 presents the optimal fixed bed performance with the Cu-based oxygen carrier and syngas fuel.
With the TIT set-point of 900°C, the optimal configuration achieves a lower temperature rise during
oxidation (Figure 7.6(a)), compared to the nominal design (Figure 7.2(a)). This was accomplished by
using a reduced CuO loading. Shown in Figure 7.6(b), the temperature of the gas steam starts below the
TIT set-point at the start of heat removal to the gas turbine (HR-1), rises above the set-point, and then
drops below the set-point at the end of HR-1. On average, the exhaust temperature with the optimal
operating conditions is above the TIT set-point but within the 50°C variation allowed by Eq.(7.2). In the
nominal design, the exhaust temperature during heat removal is always below the TIT set-point (Figure
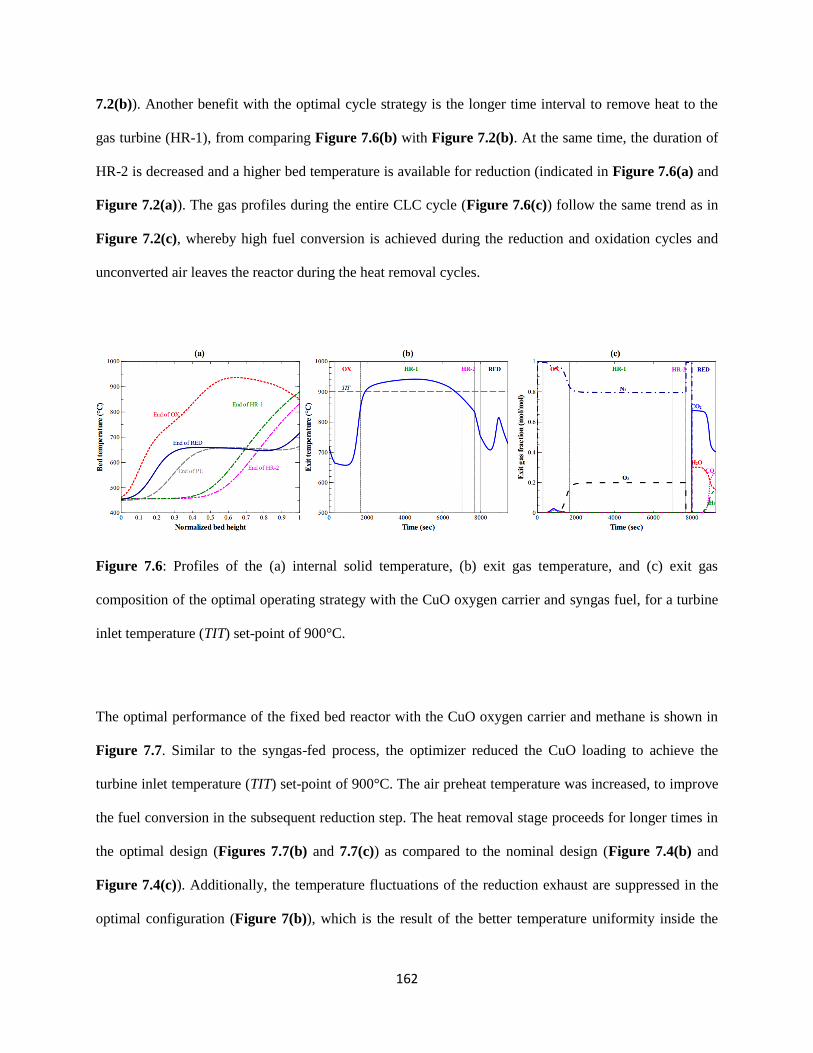
162
7.2(b)). Another benefit with the optimal cycle strategy is the longer time interval to remove heat to the
gas turbine (HR-1), from comparing Figure 7.6(b) with Figure 7.2(b). At the same time, the duration of
HR-2 is decreased and a higher bed temperature is available for reduction (indicated in Figure 7.6(a) and
Figure 7.2(a)). The gas profiles during the entire CLC cycle (Figure 7.6(c)) follow the same trend as in
Figure 7.2(c), whereby high fuel conversion is achieved during the reduction and oxidation cycles and
unconverted air leaves the reactor during the heat removal cycles.
Figure 7.6: Profiles of the (a) internal solid temperature, (b) exit gas temperature, and (c) exit gas
composition of the optimal operating strategy with the CuO oxygen carrier and syngas fuel, for a turbine
inlet temperature (TIT) set-point of 900°C.
The optimal performance of the fixed bed reactor with the CuO oxygen carrier and methane is shown in
Figure 7.7. Similar to the syngas-fed process, the optimizer reduced the CuO loading to achieve the
turbine inlet temperature (TIT) set-point of 900°C. The air preheat temperature was increased, to improve
the fuel conversion in the subsequent reduction step. The heat removal stage proceeds for longer times in
the optimal design (Figures 7.7(b) and 7.7(c)) as compared to the nominal design (Figure 7.4(b) and
Figure 7.4(c)). Additionally, the temperature fluctuations of the reduction exhaust are suppressed in the
optimal configuration (Figure 7(b)), which is the result of the better temperature uniformity inside the
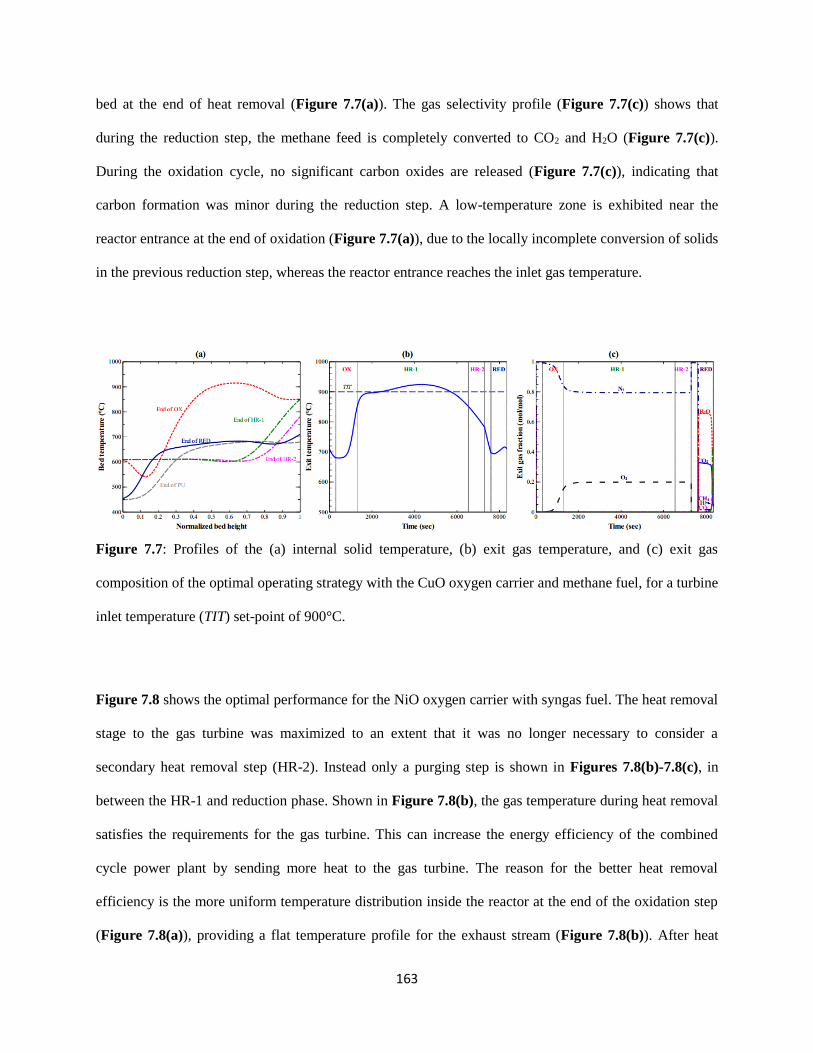
163
bed at the end of heat removal (Figure 7.7(a)). The gas selectivity profile (Figure 7.7(c)) shows that
during the reduction step, the methane feed is completely converted to CO2 and H2O (Figure 7.7(c)).
During the oxidation cycle, no significant carbon oxides are released (Figure 7.7(c)), indicating that
carbon formation was minor during the reduction step. A low-temperature zone is exhibited near the
reactor entrance at the end of oxidation (Figure 7.7(a)), due to the locally incomplete conversion of solids
in the previous reduction step, whereas the reactor entrance reaches the inlet gas temperature.
Figure 7.7: Profiles of the (a) internal solid temperature, (b) exit gas temperature, and (c) exit gas
composition of the optimal operating strategy with the CuO oxygen carrier and methane fuel, for a turbine
inlet temperature (TIT) set-point of 900°C.
Figure 7.8 shows the optimal performance for the NiO oxygen carrier with syngas fuel. The heat removal
stage to the gas turbine was maximized to an extent that it was no longer necessary to consider a
secondary heat removal step (HR-2). Instead only a purging step is shown in Figures 7.8(b)-7.8(c), in
between the HR-1 and reduction phase. Shown in Figure 7.8(b), the gas temperature during heat removal
satisfies the requirements for the gas turbine. This can increase the energy efficiency of the combined
cycle power plant by sending more heat to the gas turbine. The reason for the better heat removal
efficiency is the more uniform temperature distribution inside the reactor at the end of the oxidation step
(Figure 7.8(a)), providing a flat temperature profile for the exhaust stream (Figure 7.8(b)). After heat
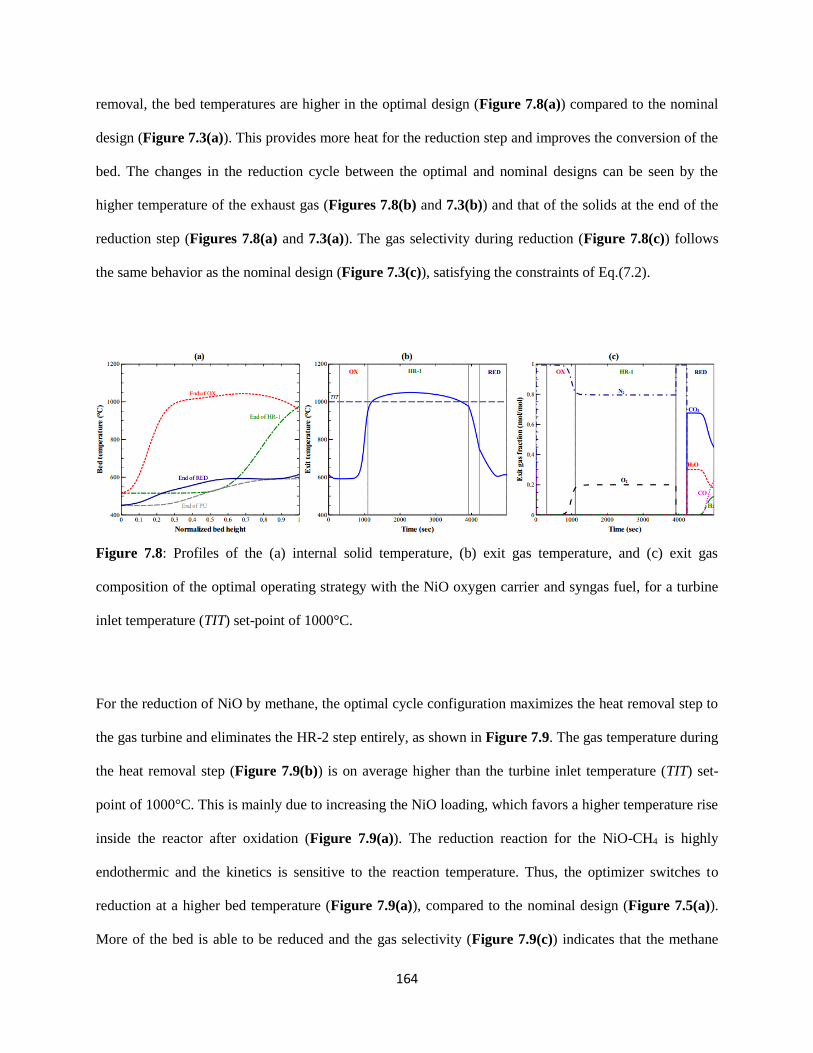
164
removal, the bed temperatures are higher in the optimal design (Figure 7.8(a)) compared to the nominal
design (Figure 7.3(a)). This provides more heat for the reduction step and improves the conversion of the
bed. The changes in the reduction cycle between the optimal and nominal designs can be seen by the
higher temperature of the exhaust gas (Figures 7.8(b) and 7.3(b)) and that of the solids at the end of the
reduction step (Figures 7.8(a) and 7.3(a)). The gas selectivity during reduction (Figure 7.8(c)) follows
the same behavior as the nominal design (Figure 7.3(c)), satisfying the constraints of Eq.(7.2).
Figure 7.8: Profiles of the (a) internal solid temperature, (b) exit gas temperature, and (c) exit gas
composition of the optimal operating strategy with the NiO oxygen carrier and syngas fuel, for a turbine
inlet temperature (TIT) set-point of 1000°C.
For the reduction of NiO by methane, the optimal cycle configuration maximizes the heat removal step to
the gas turbine and eliminates the HR-2 step entirely, as shown in Figure 7.9. The gas temperature during
the heat removal step (Figure 7.9(b)) is on average higher than the turbine inlet temperature (TIT) set-
point of 1000°C. This is mainly due to increasing the NiO loading, which favors a higher temperature rise
inside the reactor after oxidation (Figure 7.9(a)). The reduction reaction for the NiO-CH4 is highly
endothermic and the kinetics is sensitive to the reaction temperature. Thus, the optimizer switches to
reduction at a higher bed temperature (Figure 7.9(a)), compared to the nominal design (Figure 7.5(a)).
More of the bed is able to be reduced and the gas selectivity (Figure 7.9(c)) indicates that the methane
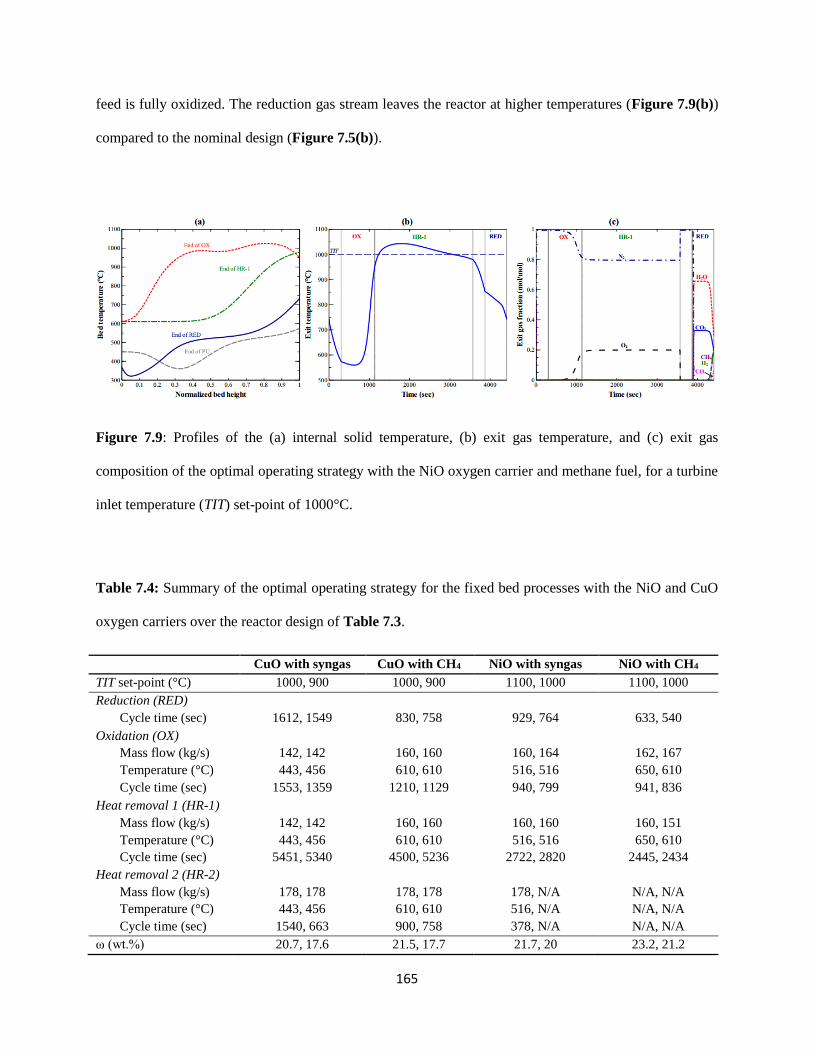
165
feed is fully oxidized. The reduction gas stream leaves the reactor at higher temperatures (Figure 7.9(b))
compared to the nominal design (Figure 7.5(b)).
Figure 7.9: Profiles of the (a) internal solid temperature, (b) exit gas temperature, and (c) exit gas
composition of the optimal operating strategy with the NiO oxygen carrier and methane fuel, for a turbine
inlet temperature (TIT) set-point of 1000°C.
Table 7.4: Summary of the optimal operating strategy for the fixed bed processes with the NiO and CuO
oxygen carriers over the reactor design of Table 7.3.
CuO with syngas CuO with CH4 NiO with syngas NiO with CH4
TIT set-point (°C) 1000, 900 1000, 900 1100, 1000 1100, 1000
Reduction (RED)
Cycle time (sec) 1612, 1549 830, 758 929, 764 633, 540
Oxidation (OX)
Mass flow (kg/s) 142, 142 160, 160 160, 164 162, 167
Temperature (°C) 443, 456 610, 610 516, 516 650, 610
Cycle time (sec) 1553, 1359 1210, 1129 940, 799 941, 836
Heat removal 1 (HR-1)
Mass flow (kg/s) 142, 142 160, 160 160, 160 160, 151
Temperature (°C) 443, 456 610, 610 516, 516 650, 610
Cycle time (sec) 5451, 5340 4500, 5236 2722, 2820 2445, 2434
Heat removal 2 (HR-2)
Mass flow (kg/s) 178, 178 178, 178 178, N/A N/A, N/A
Temperature (°C) 443, 456 610, 610 516, N/A N/A, N/A
Cycle time (sec) 1540, 663 900, 758 378, N/A N/A, N/A
ω (wt.%) 20.7, 17.6 21.5, 17.7 21.7, 20 23.2, 21.2
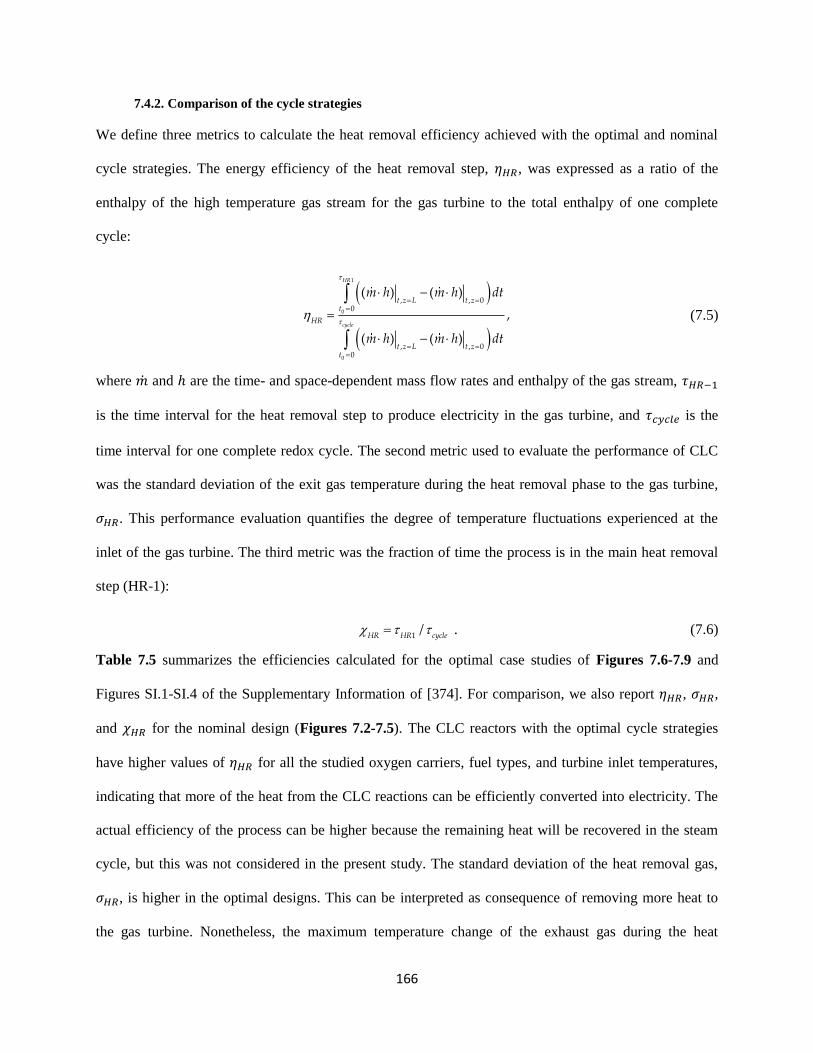
166
7.4.2. Comparison of the cycle strategies
We define three metrics to calculate the heat removal efficiency achieved with the optimal and nominal
cycle strategies. The energy efficiency of the heat removal step, 𝜂𝐻𝑅, was expressed as a ratio of the
enthalpy of the high temperature gas stream for the gas turbine to the total enthalpy of one complete
cycle:
1
0
0
, , 00
, , 00
( ) ( )
,
( ) ( )
HR
cycle
t z L t zt
HR
t z L t zt
m h m h dt
m h m h dt
(7.5)
where �� and ℎ are the time- and space-dependent mass flow rates and enthalpy of the gas stream, 𝜏𝐻𝑅−1
is the time interval for the heat removal step to produce electricity in the gas turbine, and 𝜏𝑐𝑦𝑐𝑙𝑒 is the
time interval for one complete redox cycle. The second metric used to evaluate the performance of CLC
was the standard deviation of the exit gas temperature during the heat removal phase to the gas turbine,
𝜎𝐻𝑅. This performance evaluation quantifies the degree of temperature fluctuations experienced at the
inlet of the gas turbine. The third metric was the fraction of time the process is in the main heat removal
step (HR-1):
1
/HR HR cycle
. (7.6)
Table 7.5 summarizes the efficiencies calculated for the optimal case studies of Figures 7.6-7.9 and
Figures SI.1-SI.4 of the Supplementary Information of [374]. For comparison, we also report 𝜂𝐻𝑅, 𝜎𝐻𝑅,
and 𝜒𝐻𝑅 for the nominal design (Figures 7.2-7.5). The CLC reactors with the optimal cycle strategies
have higher values of 𝜂𝐻𝑅 for all the studied oxygen carriers, fuel types, and turbine inlet temperatures,
indicating that more of the heat from the CLC reactions can be efficiently converted into electricity. The
actual efficiency of the process can be higher because the remaining heat will be recovered in the steam
cycle, but this was not considered in the present study. The standard deviation of the heat removal gas,
𝜎𝐻𝑅, is higher in the optimal designs. This can be interpreted as consequence of removing more heat to
the gas turbine. Nonetheless, the maximum temperature change of the exhaust gas during the heat
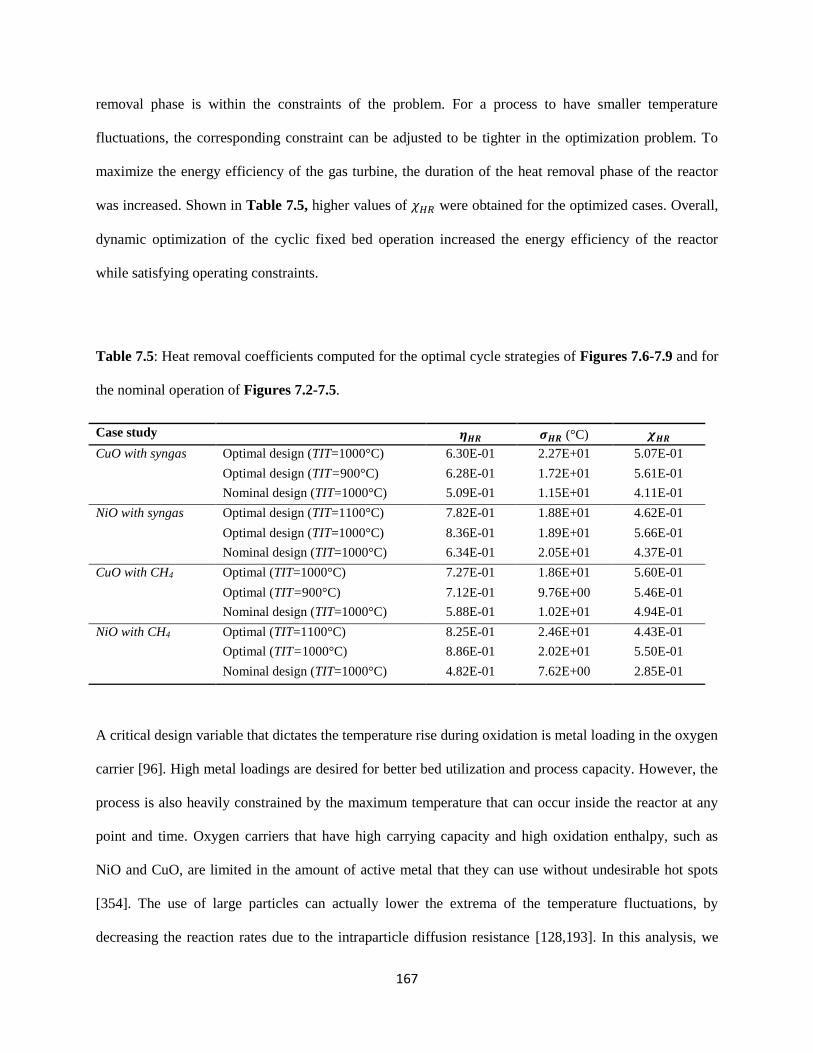
167
removal phase is within the constraints of the problem. For a process to have smaller temperature
fluctuations, the corresponding constraint can be adjusted to be tighter in the optimization problem. To
maximize the energy efficiency of the gas turbine, the duration of the heat removal phase of the reactor
was increased. Shown in Table 7.5, higher values of 𝜒𝐻𝑅 were obtained for the optimized cases. Overall,
dynamic optimization of the cyclic fixed bed operation increased the energy efficiency of the reactor
while satisfying operating constraints.
Table 7.5: Heat removal coefficients computed for the optimal cycle strategies of Figures 7.6-7.9 and for
the nominal operation of Figures 7.2-7.5.
Case study 𝜼𝑯𝑹 𝝈𝑯𝑹 (°C) 𝝌𝑯𝑹
CuO with syngas Optimal design (TIT=1000°C) 6.30E-01 2.27E+01 5.07E-01
Optimal design (TIT=900°C) 6.28E-01 1.72E+01 5.61E-01
Nominal design (TIT=1000°C) 5.09E-01 1.15E+01 4.11E-01
NiO with syngas Optimal design (TIT=1100°C) 7.82E-01 1.88E+01 4.62E-01
Optimal design (TIT=1000°C) 8.36E-01 1.89E+01 5.66E-01
Nominal design (TIT=1000°C) 6.34E-01 2.05E+01 4.37E-01
CuO with CH4 Optimal (TIT=1000°C) 7.27E-01 1.86E+01 5.60E-01
Optimal (TIT=900°C) 7.12E-01 9.76E+00 5.46E-01
Nominal design (TIT=1000°C) 5.88E-01 1.02E+01 4.94E-01
NiO with CH4 Optimal (TIT=1100°C) 8.25E-01 2.46E+01 4.43E-01
Optimal (TIT=1000°C) 8.86E-01 2.02E+01 5.50E-01
Nominal design (TIT=1000°C) 4.82E-01 7.62E+00 2.85E-01
A critical design variable that dictates the temperature rise during oxidation is metal loading in the oxygen
carrier [96]. High metal loadings are desired for better bed utilization and process capacity. However, the
process is also heavily constrained by the maximum temperature that can occur inside the reactor at any
point and time. Oxygen carriers that have high carrying capacity and high oxidation enthalpy, such as
NiO and CuO, are limited in the amount of active metal that they can use without undesirable hot spots
[354]. The use of large particles can actually lower the extrema of the temperature fluctuations, by
decreasing the reaction rates due to the intraparticle diffusion resistance [128,193]. In this analysis, we
168
found that as the TIT set-point increases, the maximum allowed metal oxide content increases (Table
7.4). To reach the same 𝑇𝐼𝑇 set-point, a higher loading of CuO was needed as compared to NiO because
of the higher heat of reaction of Ni (Table 7.4). There was also an effect of the fuel type on the optimal
metal loading, for the same TIT values and materials. We found that CLC with methane can operate at
higher loadings of CuO and NiO than CLC with syngas (Table 7.4), which can be the result of a higher
diffusion resistance associated with CH4 oxidation reactions and their slower kinetics.
In addition to optimizing the TIT value, the impact of the heat removal phase on the overall process
efficiency is also a function of cycle duration of each CLC step. During heat removal, the total enthalpy
of gas sent to the gas turbine can be increased by converting more of the oxygen carrier in the preceding
reduction cycle. Hence, the exothermic reaction rate is higher and more heat is transferred to the heat
removal gas. As discussed previously, the reduction cycle is highly constrained by the requirements in
CO2 capture efficiency and fuel conversion. If the reduction period continues for too long, solid carbon
accumulates over the oxygen carrier, as shown in the work of Zhou et al. [324] and Nordness et al. [369].
Combustion of the solid carbon in the subsequent oxidation step produces temperature gradients inside
the bed (for example, Figure 7.2(a)), resulting in unfavorable temperature fluctuations in the exhaust
stream. The optimal cycle configuration shortens the secondary heat removal phase (HR-2) and
manipulates the air temperature, so that reduction step occurs over a slightly hotter bed and a higher
conversion can be obtained. It strikes a balance between the endothermicity and exothermicity of the CLC
reactions to maximize the heat removal. By solving the dynamic optimization problem for the fixed bed
CLC operation, we can find the optimal flow conditions and cycle times that maximize temperature
uniformity, while maintaining high fuel combustion efficiency. The results show that despite the inherent
reactor dynamics, the fixed bed system is a promising option for power generation in gas turbine-based
power cycles.
7.4.3. Dynamics of the CLC reactor network
The next step of the analysis is to illustrate the scale-up of the CLC reactors for integration with a power
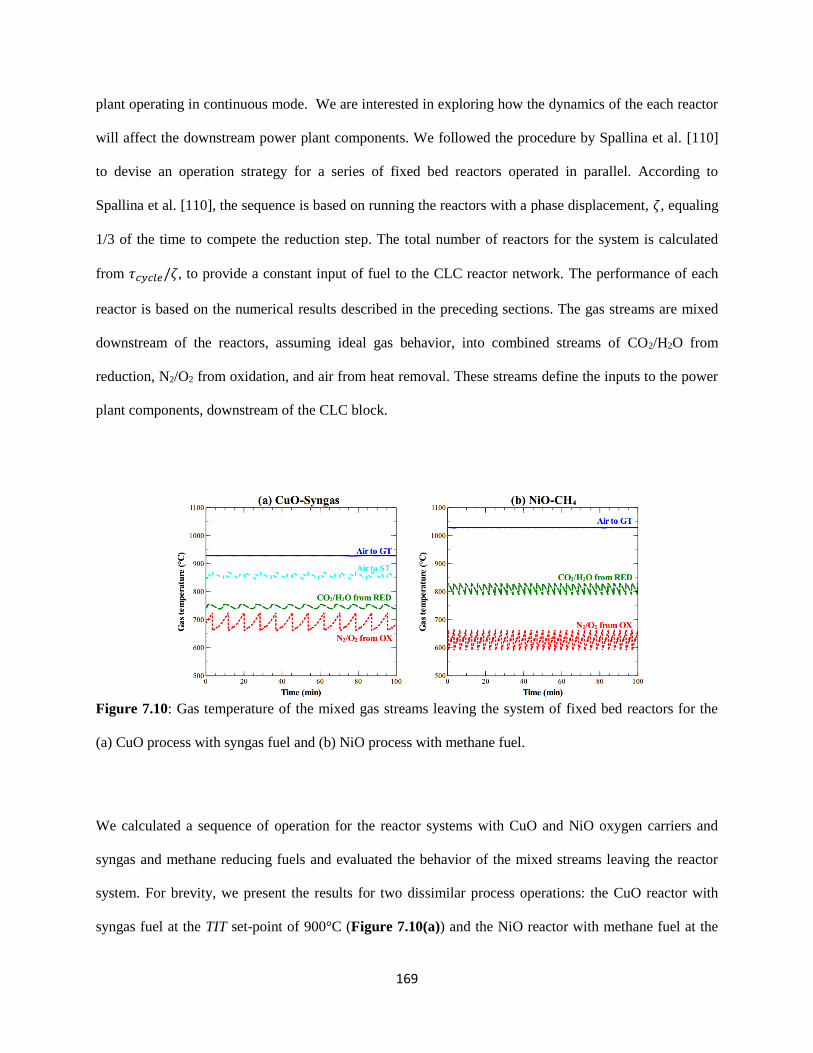
169
plant operating in continuous mode. We are interested in exploring how the dynamics of the each reactor
will affect the downstream power plant components. We followed the procedure by Spallina et al. [110]
to devise an operation strategy for a series of fixed bed reactors operated in parallel. According to
Spallina et al. [110], the sequence is based on running the reactors with a phase displacement, 𝜁, equaling
1/3 of the time to compete the reduction step. The total number of reactors for the system is calculated
from 𝜏𝑐𝑦𝑐𝑙𝑒/𝜁, to provide a constant input of fuel to the CLC reactor network. The performance of each
reactor is based on the numerical results described in the preceding sections. The gas streams are mixed
downstream of the reactors, assuming ideal gas behavior, into combined streams of CO2/H2O from
reduction, N2/O2 from oxidation, and air from heat removal. These streams define the inputs to the power
plant components, downstream of the CLC block.
Figure 7.10: Gas temperature of the mixed gas streams leaving the system of fixed bed reactors for the
(a) CuO process with syngas fuel and (b) NiO process with methane fuel.
We calculated a sequence of operation for the reactor systems with CuO and NiO oxygen carriers and
syngas and methane reducing fuels and evaluated the behavior of the mixed streams leaving the reactor
system. For brevity, we present the results for two dissimilar process operations: the CuO reactor with
syngas fuel at the TIT set-point of 900°C (Figure 7.10(a)) and the NiO reactor with methane fuel at the

170
TIT set-point of 1000°C (Figure 7.10(b)). The performance of the reactors of Figure 7.10 is evaluated
over their optimal cycle strategies. As shown, the system generates a time-varying temperature profile for
the mixed gas streams, as a result of the dynamic operation of each fixed bed reactor. The gas turbine
receives a high-temperature gas that has practically no temperature fluctuations (Figure 7.10(a) and
Figure 7.10(b)). The temperature fluctuations of the other gas streams are ~50°C or less. This illustrates
that even though the temperature change experienced in each reactor is severe (around 500°C), running
multiple reactors in parallel helps to equalize the temperature fluctuations so the power plant sees a more
stable stream input. The extent of gas temperature fluctuations to the steam turbine can be reduced by use
of an accumulator tank downstream the reactors to further mix the gases for a more uniform temperature
profile.
To assess the feasibility of the fixed bed system, we discuss possible heat recovery opportunities for the
lower-quality heat streams downstream the CLC reactors. As mentioned by Hamers et al. [356],
preheating the syngas fuel before feeding the CLC reactors can be performed by cooling the CO2/H2O
stream, which leaves the reactor at higher temperatures and mass flow rates compared to the inlet syngas.
The depleted air stream produced from oxidation can be used to supplement the air stream used for heat
removal to the gas turbine [111]. The temperature of the gas turbine exhaust is approximately 500-600°C
[144], which provides the temperature differential to preheat the air stream, leaving the compressor at
450°C [111], before feeding the CLC reactors. To meet higher preheat temperature for the air, such as
that shown in Figure 7.10(b), the process can utilize the higher temperature gas streams, such as the
reduction exhaust and a portion of the heat removal gas, noting that this would reduce the process
efficiency. Preheating the inert gas for the purging steps is not expected to be problematic, because the N2
is recycled through the system and can be used to preheat itself. From a qualitative point of view, the
fixed bed reactor system optimized in this work shows promise for integrating into a combined cycle
power plant. Future work is focused on the performance analysis of an integrated CLC-based combined
cycle power plant, including thermal integration of the plant in the process design.
171
7.5. Conclusions
This work explored the optimality in integration of high-pressure fixed bed CLC reactors with combined
cycle systems for power generation. One of most challenging aspects of the fixed bed process is the
dynamic cycling between redox reactions and the resulting temperature fluctuations. This work
formulated and solved a dynamic optimization problem to find operation strategies that enable the
integration of the batch and transient operating profiles of fixed bed CLC reactors with the requirements
for constancy and disturbance rejection of gas turbines. The results of this approach showed that fixed bed
CLC reactors can provide a stable, high-temperature and high-pressure gas that is suitable for a
downstream gas turbine, while accomplishing performance constraints in the reduction and oxidation
cycles. The study focused on two synthetic oxygen carriers, two different gaseous fuels, and two set-
points for the turbine inlet temperature. At the optimal conditions, the fixed bed reactor operates in its
heat removal stage with a relatively flat exhaust gas temperature profile consistent with the requirements
of the gas turbine of a combined cycle power plant. The oxygen carrier conversion during the reduction
cycle was maximized, in order to generate a high-temperature gas stream to feed the gas turbine for
longer periods. Optimization of the cycle strategy allowed for the fixed bed process to reach higher
energy efficiencies than a baseline design. We extended the analysis to consider a system of reactors for
an integrated large-scale power plant. The combination of multiple reactors decreased the temperature
fluctuations of the gas streams sent to the power plant units. The drawbacks of this process are the high
temperature variations inside the CLC bed between the redox cycles, the dynamic switching of reactors to
achieve continuous operation for the power plant, and the corresponding need for high-temperature
valves.
172
Chapter 8 A NOVEL REVERSE-FLOW FIXED BED REACTOR FOR CHEMICAL-LOOPING
COMBUSTION
Chemical-looping combustion (CLC) is a promising technology for power generation with in-situ CO2
capture. The most widely used process configuration for CLC is based on interconnected fluidized bed
reactors. Although successfully demonstrated at the pilot scale, the interconnected fluidized-bed design
encounters technical challenges, arising from the need for efficient gas-solid separation and the inevitable
loss of particles due to attrition. These issues are intrinsically avoided in fixed-bed reactors by the nature
of their stationary bed, which allows for compactness of design and better utilization of the oxygen
carrier. However, fixed-bed reactors do not achieve the level of performance of their fluidized-bed
counterparts, because of their lower CO2 capture efficiency, and temperature and composition non-
uniformity inside the bed. In this work, a novel fixed-bed configuration is presented, in which the fuel
flow direction is periodically switched during the CLC reduction cycle. Simulations with an
experimentally verified mathematical model demonstrate that the reverse-flow operation can significantly
improve the performance of CLC fixed-bed reactors, making them competitive with their fluidized-bed
equivalents, while addressing many of the bottlenecks in their operation. In reverse-flow mode, fixed-bed
CLC systems achieve significant advantages, such as better gas-solids mixing, better CO2 selectivity and
capture efficiency, and lower temperature fluctuations.
8.1. Introduction
Chemical-looping combustion (CLC) has emerged as one of the most promising, low-cost CCS
technologies [7,23,81], with the potential to reduce the cost of CO2 capture by 50% [20]. Although CLC
is an emerging technology, significant progress has been made over the last 10 years, with
commercialization efforts anticipated shortly [7]. Comprehensive reviews covering the development of
CLC were published by Adánez et al. [23], Hossain and de Lasa [81], and Lyngfelt et al. [375]. In CLC, a
metal/metal oxide is used as an oxygen carrier that oxidizes a gaseous fuel, usually methane or natural
gas. The looping schemes in Figure 8.1 depict this cyclic process, involving an oxygen carrier reduction
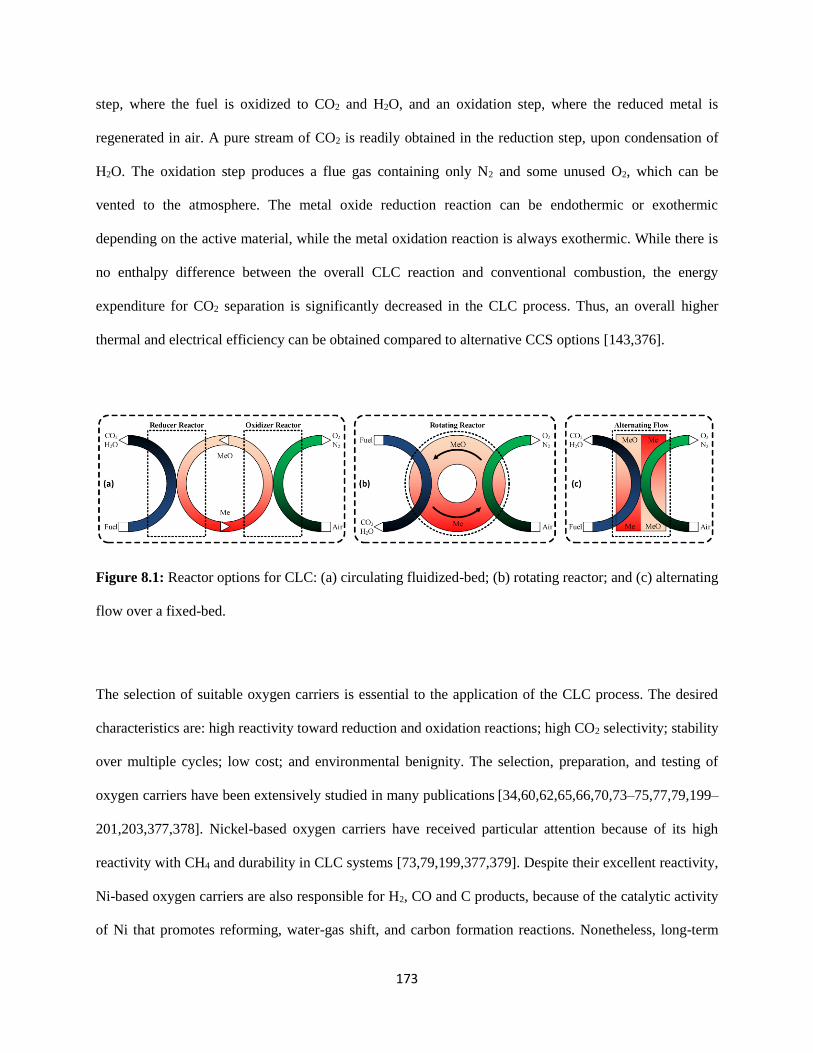
173
step, where the fuel is oxidized to CO2 and H2O, and an oxidation step, where the reduced metal is
regenerated in air. A pure stream of CO2 is readily obtained in the reduction step, upon condensation of
H2O. The oxidation step produces a flue gas containing only N2 and some unused O2, which can be
vented to the atmosphere. The metal oxide reduction reaction can be endothermic or exothermic
depending on the active material, while the metal oxidation reaction is always exothermic. While there is
no enthalpy difference between the overall CLC reaction and conventional combustion, the energy
expenditure for CO2 separation is significantly decreased in the CLC process. Thus, an overall higher
thermal and electrical efficiency can be obtained compared to alternative CCS options [143,376].
Figure 8.1: Reactor options for CLC: (a) circulating fluidized-bed; (b) rotating reactor; and (c) alternating
flow over a fixed-bed.
The selection of suitable oxygen carriers is essential to the application of the CLC process. The desired
characteristics are: high reactivity toward reduction and oxidation reactions; high CO2 selectivity; stability
over multiple cycles; low cost; and environmental benignity. The selection, preparation, and testing of
oxygen carriers have been extensively studied in many publications [34,60,62,65,66,70,73–75,77,79,199–
201,203,377,378]. Nickel-based oxygen carriers have received particular attention because of its high
reactivity with CH4 and durability in CLC systems [73,79,199,377,379]. Despite their excellent reactivity,
Ni-based oxygen carriers are also responsible for H2, CO and C products, because of the catalytic activity
of Ni that promotes reforming, water-gas shift, and carbon formation reactions. Nonetheless, long-term
174
pilot-scale testing showed that Ni-based oxygen carriers exhibit high stability and reactivity over multiple
redox cycles, while issues due to NiAl2O4 formation, sintering and agglomeration have been reported
[66,70,72,114,197,379,380]. The drawbacks of using Ni include its high cost and toxicity, which makes it
infeasible to operate at a commercial-scale, if particle attrition is significant. Ni can be potentially more
favorable in fixed-bed CLC systems, where these issues are intrinsically avoided.
The process options for CLC can be categorized as circulating reactors, rotating reactors, and alternating
flow reactors (Figure 8.1). The desired qualities of the CLC reactor system include: good mixing between
fuel and solids; uniform distribution of temperature within the reactor; continuous operation; simplicity of
scale-up; low pressure drop; limited attrition and creation of fines; and negligible leakage of fuel. The
most widely used reactor technology is based on the interconnected fluidized-bed design
[74,157,196,349,381] (Figure 8.1(a)). This CLC design has been successfully demonstrated in pilot
plants ranging 0.3 – 140 kW, with 29 oxygen carriers, utilizing natural gas, methane and syngas, with a
combined operation exceeding 4000 h [30]. Fluidization enables good contact between gas and solids,
uniform temperature profiles, small pressure drop, and continuous operation [46,382]. Thus, the
conversion of CH4 to H2O and CO2 is always high and carbon deposition is marginal. Fluidized-bed
reactors are, in general, commercially available and well-established in the petroleum refining industry.
However, the dual-reactor configuration encounters various technical and operational issues. The
circulation of solids between the two reactors requires energy-intensive cyclones and particle loop seals to
prevent gas leakage, which is more problematic at elevated pressures [96,108]. Fragmentation and
attrition of the oxygen carrier creates fines that need to be filtered, while fresh oxygen carrier needs to be
continually added to the system [378,383]. The fragmented solids, in the form of fines, can be entrained
and carried out of the fluidization vessel [157]. These issues drastically increase process operation costs,
if an expensive oxygen carrier, such as Ni, is used. Moreover, they impact the environmental benignity of
the CLC process, if harmful poisonous metals (e.g., Ni) are to be emitted to the atmosphere in the form of
fines.

175
Some of these issues are addressed in the moving bed reactor, proposed by Li and Fan [106], for the CL
reduction of Fe-based oxygen carriers with syngas. Higher conversions can be obtained in the moving bed
than in fluidized-beds thanks to the multiple oxidation states of Fe. The moving bed design reduces the
solid circulation rate and minimizes the reactor volume. The concept was demonstrated in a 2.5 kW
bench-scale unit for a combined operation of over 300 h, and was able to achieve complete conversion of
the fuel (syngas, CH4) with 100% CO2 capture [384,385]. The reactor was operated isothermally using
external heating, but this may not be feasible for a commercial process. Modelling and simulation was
performed to optimize the moving bed design [386]. Similar technical issues such as attrition and gas
leakage arise in this design due to the continuous circulation of solids between reactors. The use of large
oxygen carrier particles (dp=4 mm) is needed in the moving bed in order to resist fluidization, thereby
potentially making reaction rates diffusion-limited [128,193].
Fixed-bed reactors have several advantages over alternative designs, of which the most important is the
elimination of particle attrition and need for gas-solid separation [96,154,155]. The fixed-bed
configuration (Figure 8.1(c)) consists of a stationary bed with alternating flows between reducing and
oxidizing environments. By the simplicity of this design, fixed-beds are easier to scale-up, pressurize and
operate, and can handle a relatively large range of particle sizes. The design is also more compact than a
fluidized-bed reactor, which allows for better utilization of the oxygen carrier, lower capital cost, and
smaller process footprint. CLC performance in a fixed-bed reactor was compared to an equivalent
fluidized-bed in previous work and the results revealed a significant performance gap in terms of low CO2
selectivity, severe temperature fluctuations, and high carbon formation [324]. Also, periodic operation can
be undesirable because it requires the use of a high temperature, high gas flow switching system. Spallina
et al. [109] demonstrated that switching the gas direction between oxidation and reduction cycles can
improve the thermal management of the process. Hamers et al. [108] found that higher energy efficiency
can be achieved by feeding the fuel in the opposite direction during reduction. However, this can lead to
severe temperature fluctuations in the exhaust stream. Thus, a configuration with two fixed beds in series
176
was proposed to achieve the desired outlet temperature and improve the range of applicable oxygen
carriers.
In rotating bed reactors (Figure 8.1(b)), an annulus fixed-bed is rotating between different sectors, where
air and fuel are fed. Dahl et al. [97] designed a prototype CLC rotating reactor, which was able to achieve
90% methane conversion and over 90% CO2 capture efficiency using a CuO/Al2O3 oxygen carrier [387].
The advantages of the rotating reactor design include compactness of design, continuous operation,
limited energy for circulation, and feasibility of scale-up and commercialization, but the system is limited
by the low CO2 purity mostly due to gas leakage and mixing between fuel and air streams [23].
Simulations of the rotating reactor revealed that reducing the angular dispersion can increase the CO2
purity [112]. In the work by Zhao et al. [98,99] a rotary-bed reactor was explored as an alternative to the
rotating reactor design. The rotary-bed reactor consists of a rotary solid wheel, with micro-channels
coated with oxygen carrier that rotates through reducing and oxidizing environments. With this design,
mixing between air and fuel can be avoided with an efficient sealing system [388]. Potential drawbacks
include high temperature fluctuations, thermal distortion and carbon deposition.
Given the process options for CLC, the fixed-bed reactor is a promising candidate, but significant
improvements are needed to close the performance gap with the other higher-performing reactors. In this
work, a novel reverse-flow concept is explored for CLC reduction in fixed-bed reactors. Figure 8.2 shows
the concept of a reverse-flow fixed-bed reactor, in which the operation is controlled by two valves, set to
switch flow direction periodically. Flow reversal was originally employed in adiabatic fixed-bed reactors
for exothermic reactions [158,389–391]. The principal advantages of flow reversal include improved heat
transfer at the inlet and exit of the bed and formation of a hot zone in the middle section of the reactor
[392]. The maximum temperature rise in the bed exceeds that of steady-state fixed-beds, which permits
higher exit conversions [393,394], at lower heating demands [390]. Thus, reverse-flow operation made it
possible to provide continuous autothermal operation without external gas preheating. This idea was
extended for coupling endothermic (e.g., methane steam reforming) and exothermic reactions (e.g.,
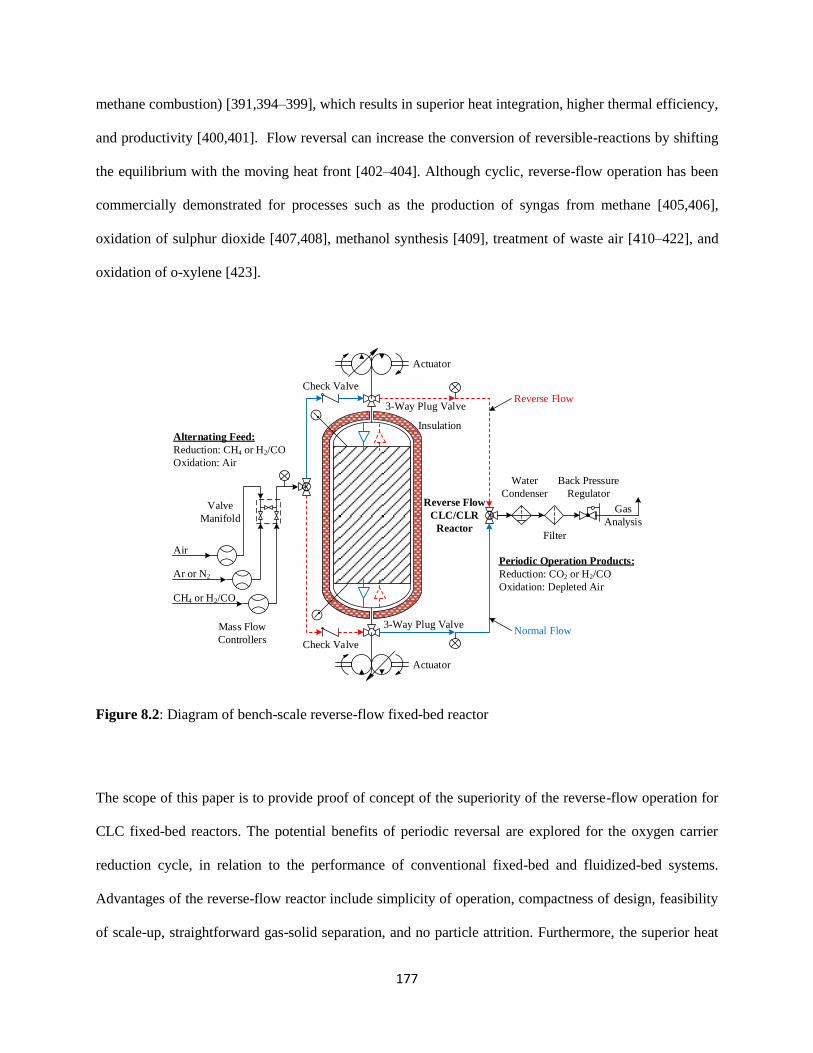
177
methane combustion) [391,394–399], which results in superior heat integration, higher thermal efficiency,
and productivity [400,401]. Flow reversal can increase the conversion of reversible-reactions by shifting
the equilibrium with the moving heat front [402–404]. Although cyclic, reverse-flow operation has been
commercially demonstrated for processes such as the production of syngas from methane [405,406],
oxidation of sulphur dioxide [407,408], methanol synthesis [409], treatment of waste air [410–422], and
oxidation of o-xylene [423].
Figure 8.2: Diagram of bench-scale reverse-flow fixed-bed reactor
The scope of this paper is to provide proof of concept of the superiority of the reverse-flow operation for
CLC fixed-bed reactors. The potential benefits of periodic reversal are explored for the oxygen carrier
reduction cycle, in relation to the performance of conventional fixed-bed and fluidized-bed systems.
Advantages of the reverse-flow reactor include simplicity of operation, compactness of design, feasibility
of scale-up, straightforward gas-solid separation, and no particle attrition. Furthermore, the superior heat
3-Way Plug Valve
3-Way Plug Valve
Reverse Flow
CLC/CLR
Reactor
Valve
Manifold
Insulation
Actuator
Mass Flow
Controllers
Water
Condenser
Filter
Actuator
Gas
Analysis
Check Valve
Check Valve
Back Pressure
Regulator
Air
Ar or N2
CH4 or H2/CO
Periodic Operation Products:
Reduction: CO2 or H2/CO
Oxidation: Depleted Air
Alternating Feed:
Reduction: CH4 or H2/CO
Oxidation: Air
Reverse Flow
Normal Flow
178
integration and better gas-solid contact in the reverse-flow process can be beneficial to the feasibility and
realizability of large-scale CLC systems.
8.2. Mathematical model
8.2.1. Background of CLC modeling
In previous work, we have investigated kinetic and reactor models for CLC applications in TGA, fixed-
bed, and fluidized-bed reactors [119,128,132,193,424]. The appropriateness of modelling assumptions
was extensively studied [193], showing the dependence of reaction rates on the extent of mass and heat
transfer dominance inside the reactor and/or the oxygen carrier. As fixed-beds commonly operate with a
range of particle sizes, accurate modelling of the diffusion limitations within and surrounding the particle
is essential. We have developed and validated a particle model that was able to predict the extent of
diffusion limitations over changing particle sizes [128,193]. The model was also predictive of the changes
in the particle microstructure due to chemical and physical degradation [128]. At the reactor level, the
heterogeneous model achieved not only superior predictions of the experimental data from various CLC
units (Table 8.1), but also more realistic estimates of the kinetic parameters [193]. Modelling of the
temperature gradients inside the fixed-bed gave valuable information about the dependence of reactions
on mixing patterns. In most cases, intraparticle heat resistance was negligible, however interfacial heat
transfer was found to limit CLC reaction rates with large particles [193]. For all simulations, mass and
energy balances, as well as momentum balance, as approximated by the Ergun equation, were included.
In summary, the models developed previously can be used with confidence for reactor analysis and
process efficiency studies.
Moreover, Ni-based oxygen carrier reduction kinetics were analyzed, in terms of the applicability of
known solid-state reaction models, such as the volumetric model, shrinking core, nuclei formation and
growth, and power law [119,132]. Analysis of the reported CLC fixed-bed experimental data showed that,
for supported NiO oxygen carriers, reduction by CH4, H2, and CO can be satisfactorily represented by a

179
previously reported, see Ref. [58], modified volumetric model [119]. A more detailed investigation was
conducted in TGA and the superiority of the nuclei formation and growth model, as well as that of the
modified volumetric model, was shown with statistical analysis over a range of flow rates, sample
weights, and temperatures [132]. A universal CLC reaction scheme was proposed (Table 8.2) for a Ni-
based oxygen carrier and CH4 reducing fuel, which was validated against data collected from fixed-bed
and fluidized-bed units in the literature [119,324,424]. The reaction scheme and kinetic parameters of
(Table 8.2) were later refined in the work of Han et al. [333,368] by employing a model-based structural
identifiability and optimal experimental design analysis.
Table 8.1: Operating conditions of the current CL fixed-bed units.
Ref. [171] Ref. [58] Ref. [119] Ref. [172]
L [mm] 250 7.65 21.7 5.66
D [mm] 16 4 9.9 15
Q [ml min-1] 900 100 100 60
Fuel 33% CH4/H2O 10% CH4 /Ar 10% CH4 /Ar 25% CH4 /Ar
T [°C] 600 900 800 900
Fr 0.34 6.3 0.055 0.0039
L/D 15.6 1.9 2.2 0.38
Rep 10 0.5 0.07 0.02
Table 8.2: Chemical-looping Reducer reactions with NiO and CH4 [119]..
NiO reduction
reactions
Partial CH4 oxidation CH4+2NiO → 2Ni+CO2+2H2
H2 oxidation H2+NiO → Ni+H2O
CO oxidation CO+NiO → Ni+CO2
Partial CH4 oxidation CH4+NiO → Ni+2H2+CO
Ni-catalyzed
reactions in CL
Reducer
Steam CH4 reforming CH4+H2O ↔ 3H2+CO
Water gas shift CO+H2O ↔ H2+CO2
Dry reforming CH4+CO2 ↔ 2CO+2H2
Methane decomposition CH4 ↔ 2H2+C
C gasification by H2O C+H2O ↔ CO+H2
C gasification by CO2 C+CO2 ↔ 2CO
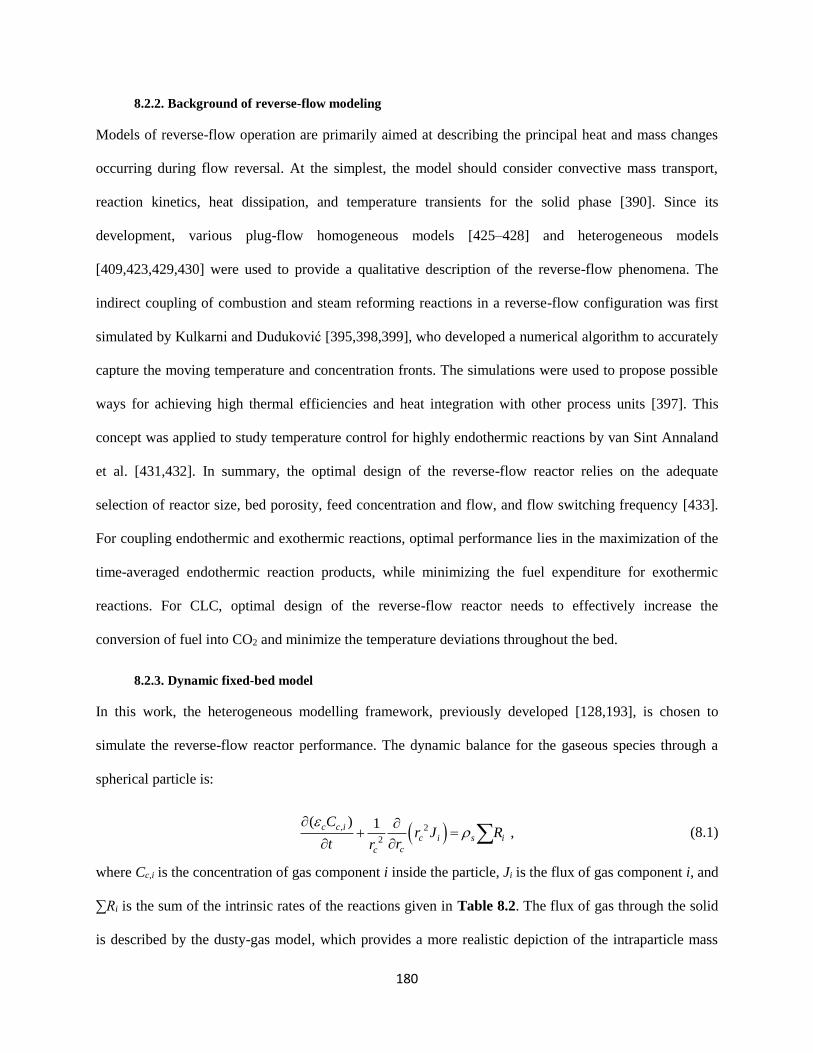
180
8.2.2. Background of reverse-flow modeling
Models of reverse-flow operation are primarily aimed at describing the principal heat and mass changes
occurring during flow reversal. At the simplest, the model should consider convective mass transport,
reaction kinetics, heat dissipation, and temperature transients for the solid phase [390]. Since its
development, various plug-flow homogeneous models [425–428] and heterogeneous models
[409,423,429,430] were used to provide a qualitative description of the reverse-flow phenomena. The
indirect coupling of combustion and steam reforming reactions in a reverse-flow configuration was first
simulated by Kulkarni and Duduković [395,398,399], who developed a numerical algorithm to accurately
capture the moving temperature and concentration fronts. The simulations were used to propose possible
ways for achieving high thermal efficiencies and heat integration with other process units [397]. This
concept was applied to study temperature control for highly endothermic reactions by van Sint Annaland
et al. [431,432]. In summary, the optimal design of the reverse-flow reactor relies on the adequate
selection of reactor size, bed porosity, feed concentration and flow, and flow switching frequency [433].
For coupling endothermic and exothermic reactions, optimal performance lies in the maximization of the
time-averaged endothermic reaction products, while minimizing the fuel expenditure for exothermic
reactions. For CLC, optimal design of the reverse-flow reactor needs to effectively increase the
conversion of fuel into CO2 and minimize the temperature deviations throughout the bed.
8.2.3. Dynamic fixed-bed model
In this work, the heterogeneous modelling framework, previously developed [128,193], is chosen to
simulate the reverse-flow reactor performance. The dynamic balance for the gaseous species through a
spherical particle is:
, 2
2
( 1
),
c c i
c s i
cc
i
Cr R
t rrJ
(8.1)
where Cc,i is the concentration of gas component i inside the particle, Ji is the flux of gas component i, and
∑Ri is the sum of the intrinsic rates of the reactions given in Table 8.2. The flux of gas through the solid
is described by the dusty-gas model, which provides a more realistic depiction of the intraparticle mass
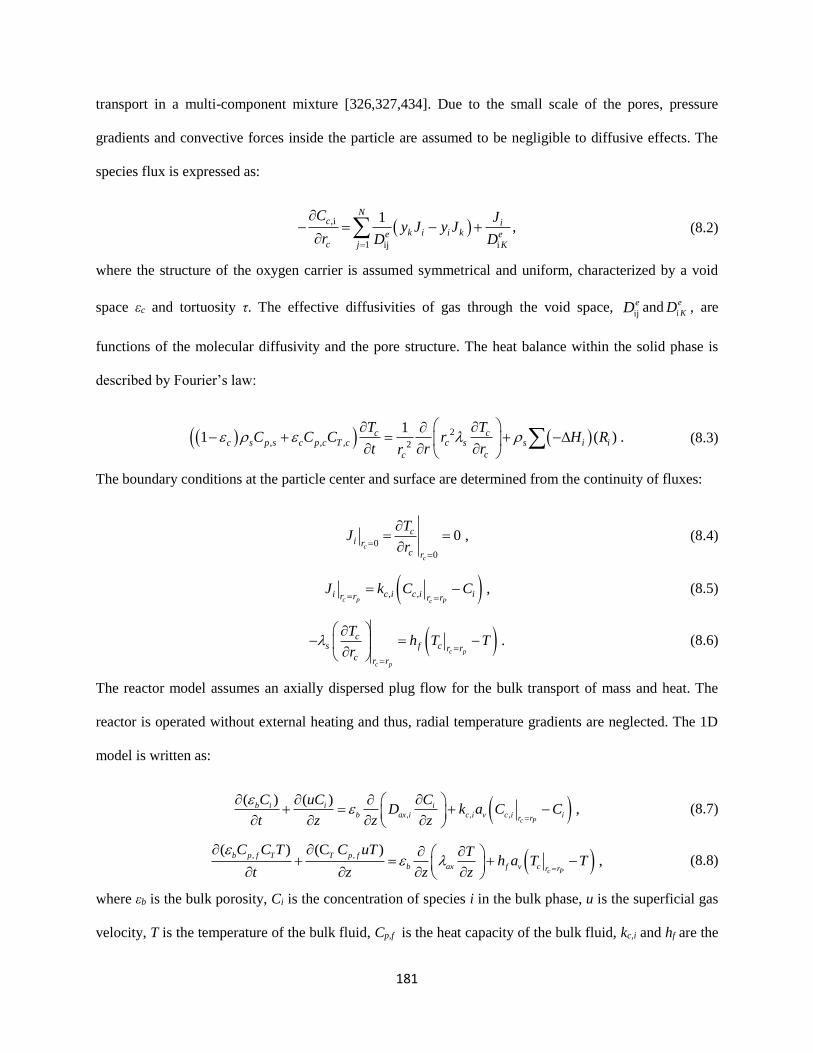
181
transport in a multi-component mixture [326,327,434]. Due to the small scale of the pores, pressure
gradients and convective forces inside the particle are assumed to be negligible to diffusive effects. The
species flux is expressed as:
,i
1 ij i
1,
Nc i
k i i ke ec j K
C Jy J y J
r D D
(8.2)
where the structure of the oxygen carrier is assumed symmetrical and uniform, characterized by a void
space εc and tortuosity τ. The effective diffusivities of gas through the void space, ij
eD andi
e
KD , are
functions of the molecular diffusivity and the pore structure. The heat balance within the solid phase is
described by Fourier’s law:
2, , , 2
11 ( ) .c c
c s p s c p c T c c s s i i
cc
T TC C C r H R
t r rr
(8.3)
The boundary conditions at the particle center and surface are determined from the continuity of fluxes:
0
0
0 ,c
c
ci r
c r
TJ
r
(8.4)
, , ,c Pc p
i c i c r ri ir rJ k C C
(8.5)
.c p
c p
cs f c r r
c r r
Th T T
r
(8.6)
The reactor model assumes an axially dispersed plug flow for the bulk transport of mass and heat. The
reactor is operated without external heating and thus, radial temperature gradients are neglected. The 1D
model is written as:
, , ,
) )( ( ,
c Pr
b i i i
b ax i c i v c iri
C uC CD k a C C
t z z z
(8.7)
, ,( ) (C )
,c P
b p f T T
c
p f
b ax v r rf
uC C T C T Th a T
t z zT
z
(8.8)
where εb is the bulk porosity, Ci is the concentration of species i in the bulk phase, u is the superficial gas
velocity, T is the temperature of the bulk fluid, Cp,f is the heat capacity of the bulk fluid, kc,i and hf are the
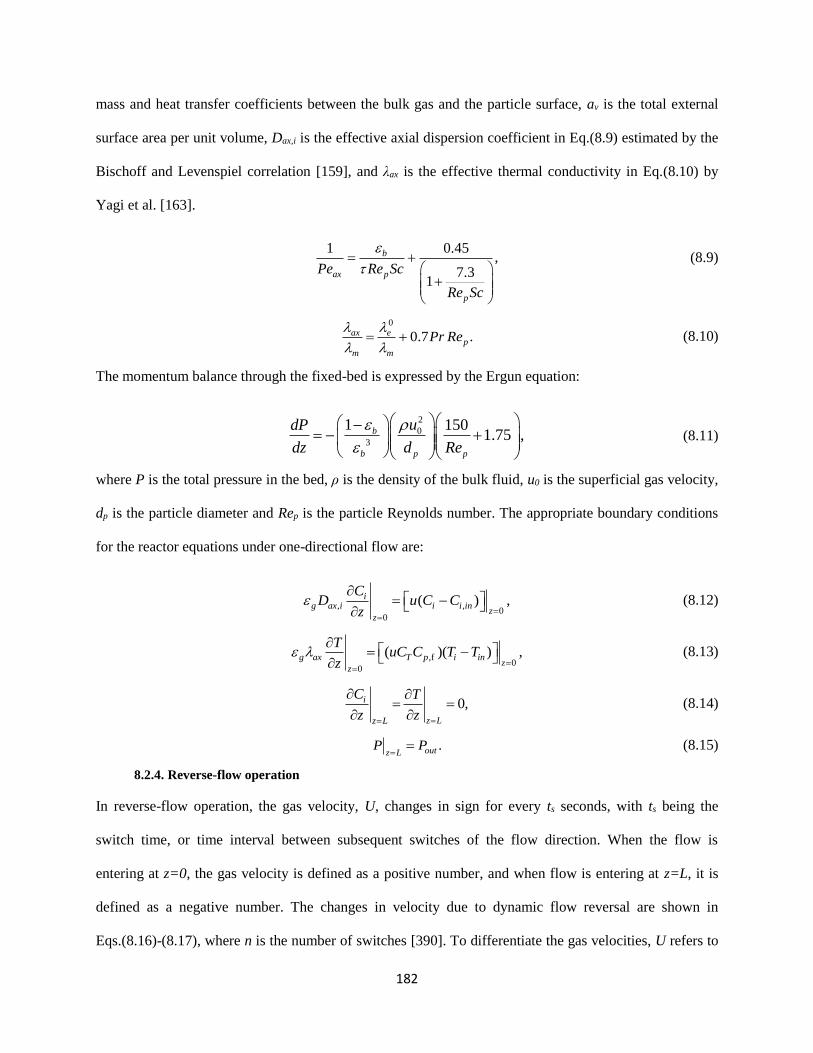
182
mass and heat transfer coefficients between the bulk gas and the particle surface, av is the total external
surface area per unit volume, Dax,i is the effective axial dispersion coefficient in Eq.(8.9) estimated by the
Bischoff and Levenspiel correlation [159], and λax is the effective thermal conductivity in Eq.(8.10) by
Yagi et al. [163].
1 0.45
,7.3
1
b
ax p
p
Pe Re Sc
Re Sc
(8.9)
0
0.7 .ax ep
m m
Pr Re
(8.10)
The momentum balance through the fixed-bed is expressed by the Ergun equation:
2
0
3
1 1501.75 ,b
b p p
udP
dz d Re
(8.11)
where P is the total pressure in the bed, ρ is the density of the bulk fluid, u0 is the superficial gas velocity,
dp is the particle diameter and Rep is the particle Reynolds number. The appropriate boundary conditions
for the reactor equations under one-directional flow are:
,0
,
0
( ) ,z
z
ig ax i i i in
CD C C
zu
(8.12)
,0
f
0
( )( ) ,ax p i ing Tz
z
TC Cu T T
z
(8.13)
0,z Lz L
iC
z z
T
(8.14)
.outz LP P
(8.15)
8.2.4. Reverse-flow operation
In reverse-flow operation, the gas velocity, U, changes in sign for every ts seconds, with ts being the
switch time, or time interval between subsequent switches of the flow direction. When the flow is
entering at z=0, the gas velocity is defined as a positive number, and when flow is entering at z=L, it is
defined as a negative number. The changes in velocity due to dynamic flow reversal are shown in
Eqs.(8.16)-(8.17), where n is the number of switches [390]. To differentiate the gas velocities, U refers to
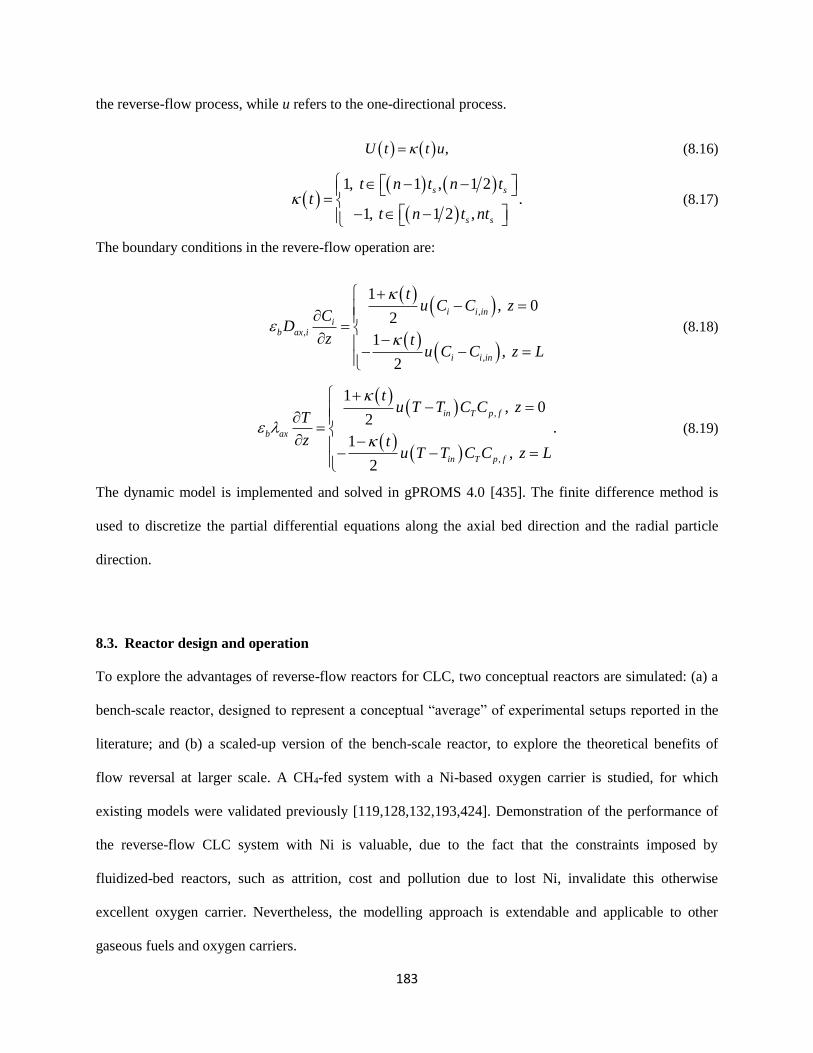
183
the reverse-flow process, while u refers to the one-directional process.
,U t t u (8.16)
1, 1 , 1 2 .
1, 1 2 ,
s s
s s
t n t n tt
t n t nt
(8.17)
The boundary conditions in the revere-flow operation are:
,
,
,
1,
2
1,
2
0i i ini
b ax i
i i in
C zt
C
u CC
Dz t
u C z L
(8.18)
,
,
, 01
2.
,1
2
in T p f
b ax
in T p f
tu T T C C
T
z tu
z
C z LT T C
(8.19)
The dynamic model is implemented and solved in gPROMS 4.0 [435]. The finite difference method is
used to discretize the partial differential equations along the axial bed direction and the radial particle
direction.
8.3. Reactor design and operation
To explore the advantages of reverse-flow reactors for CLC, two conceptual reactors are simulated: (a) a
bench-scale reactor, designed to represent a conceptual “average” of experimental setups reported in the
literature; and (b) a scaled-up version of the bench-scale reactor, to explore the theoretical benefits of
flow reversal at larger scale. A CH4-fed system with a Ni-based oxygen carrier is studied, for which
existing models were validated previously [119,128,132,193,424]. Demonstration of the performance of
the reverse-flow CLC system with Ni is valuable, due to the fact that the constraints imposed by
fluidized-bed reactors, such as attrition, cost and pollution due to lost Ni, invalidate this otherwise
excellent oxygen carrier. Nevertheless, the modelling approach is extendable and applicable to other
gaseous fuels and oxygen carriers.
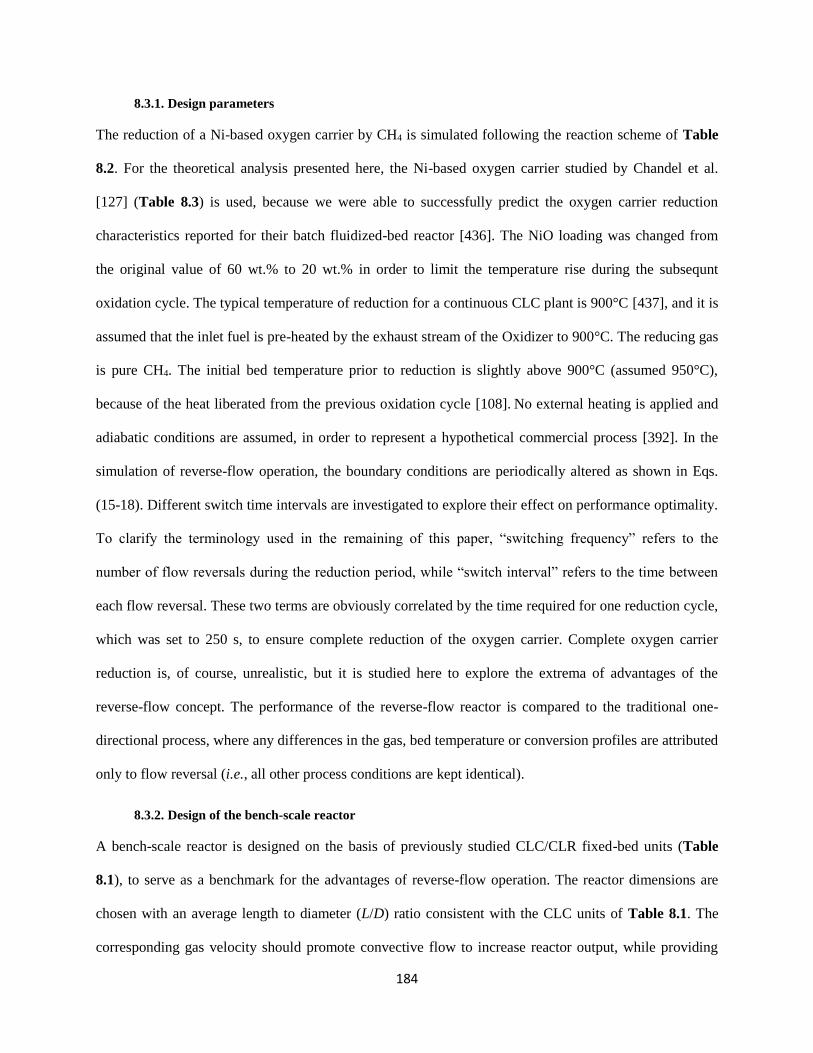
184
8.3.1. Design parameters
The reduction of a Ni-based oxygen carrier by CH4 is simulated following the reaction scheme of Table
8.2. For the theoretical analysis presented here, the Ni-based oxygen carrier studied by Chandel et al.
[127] (Table 8.3) is used, because we were able to successfully predict the oxygen carrier reduction
characteristics reported for their batch fluidized-bed reactor [436]. The NiO loading was changed from
the original value of 60 wt.% to 20 wt.% in order to limit the temperature rise during the subsequnt
oxidation cycle. The typical temperature of reduction for a continuous CLC plant is 900°C [437], and it is
assumed that the inlet fuel is pre-heated by the exhaust stream of the Oxidizer to 900°C. The reducing gas
is pure CH4. The initial bed temperature prior to reduction is slightly above 900°C (assumed 950°C),
because of the heat liberated from the previous oxidation cycle [108]. No external heating is applied and
adiabatic conditions are assumed, in order to represent a hypothetical commercial process [392]. In the
simulation of reverse-flow operation, the boundary conditions are periodically altered as shown in Eqs.
(15-18). Different switch time intervals are investigated to explore their effect on performance optimality.
To clarify the terminology used in the remaining of this paper, “switching frequency” refers to the
number of flow reversals during the reduction period, while “switch interval” refers to the time between
each flow reversal. These two terms are obviously correlated by the time required for one reduction cycle,
which was set to 250 s, to ensure complete reduction of the oxygen carrier. Complete oxygen carrier
reduction is, of course, unrealistic, but it is studied here to explore the extrema of advantages of the
reverse-flow concept. The performance of the reverse-flow reactor is compared to the traditional one-
directional process, where any differences in the gas, bed temperature or conversion profiles are attributed
only to flow reversal (i.e., all other process conditions are kept identical).
8.3.2. Design of the bench-scale reactor
A bench-scale reactor is designed on the basis of previously studied CLC/CLR fixed-bed units (Table
8.1), to serve as a benchmark for the advantages of reverse-flow operation. The reactor dimensions are
chosen with an average length to diameter (L/D) ratio consistent with the CLC units of Table 8.1. The
corresponding gas velocity should promote convective flow to increase reactor output, while providing
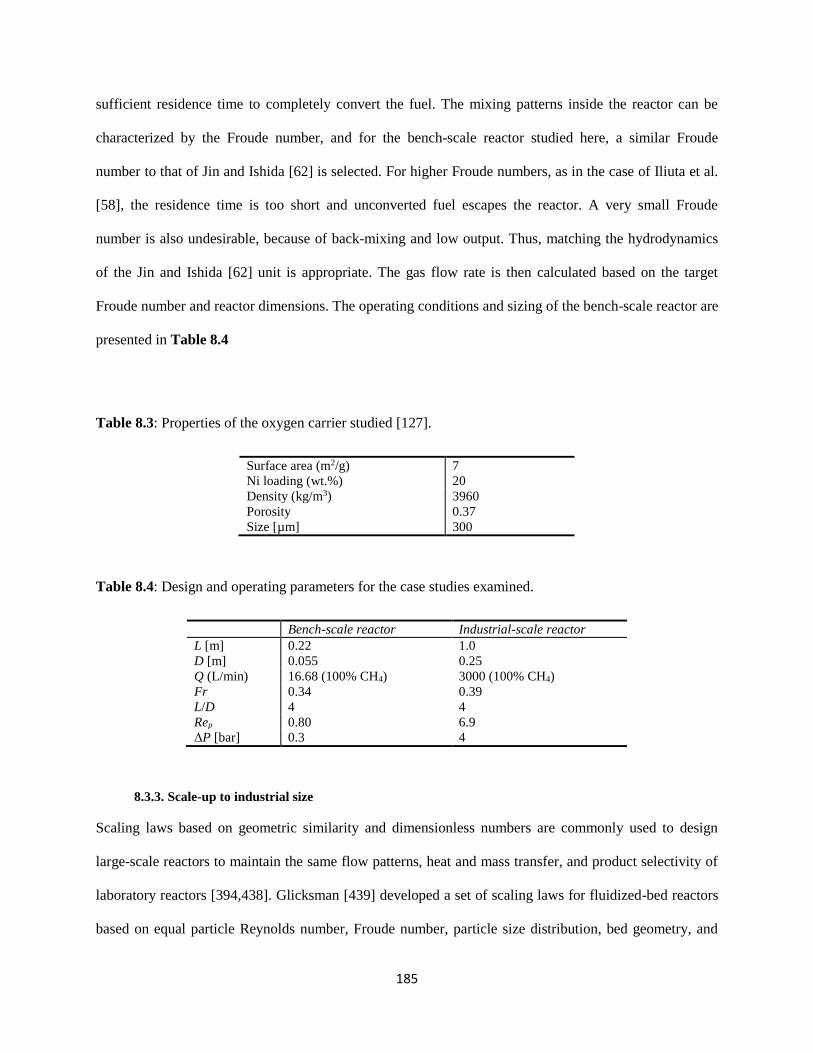
185
sufficient residence time to completely convert the fuel. The mixing patterns inside the reactor can be
characterized by the Froude number, and for the bench-scale reactor studied here, a similar Froude
number to that of Jin and Ishida [62] is selected. For higher Froude numbers, as in the case of Iliuta et al.
[58], the residence time is too short and unconverted fuel escapes the reactor. A very small Froude
number is also undesirable, because of back-mixing and low output. Thus, matching the hydrodynamics
of the Jin and Ishida [62] unit is appropriate. The gas flow rate is then calculated based on the target
Froude number and reactor dimensions. The operating conditions and sizing of the bench-scale reactor are
presented in Table 8.4
Table 8.3: Properties of the oxygen carrier studied [127].
Surface area (m2/g) 7
Ni loading (wt.%) 20
Density (kg/m3) 3960
Porosity 0.37
Size [µm] 300
Table 8.4: Design and operating parameters for the case studies examined.
Bench-scale reactor Industrial-scale reactor
L [m] 0.22 1.0
D [m] 0.055 0.25
Q (L/min) 16.68 (100% CH4) 3000 (100% CH4)
Fr 0.34 0.39
L/D 4 4
Rep 0.80 6.9
ΔP [bar] 0.3 4
8.3.3. Scale-up to industrial size
Scaling laws based on geometric similarity and dimensionless numbers are commonly used to design
large-scale reactors to maintain the same flow patterns, heat and mass transfer, and product selectivity of
laboratory reactors [394,438]. Glicksman [439] developed a set of scaling laws for fluidized-bed reactors
based on equal particle Reynolds number, Froude number, particle size distribution, bed geometry, and
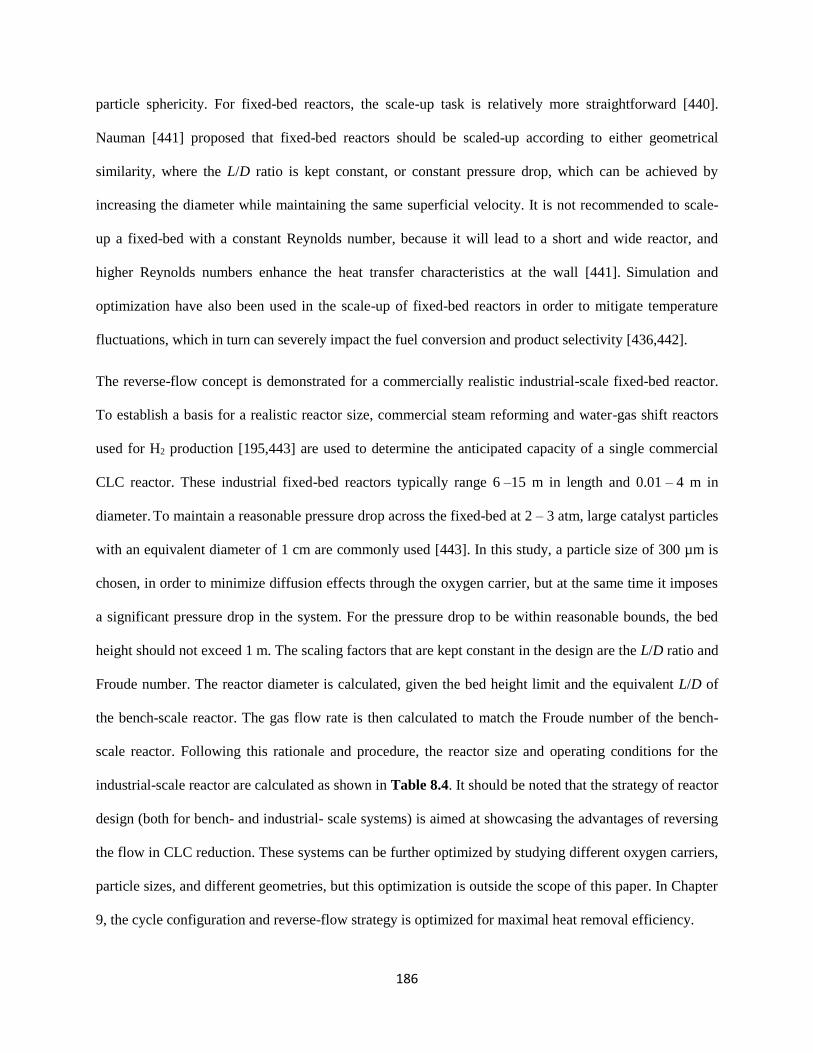
186
particle sphericity. For fixed-bed reactors, the scale-up task is relatively more straightforward [440].
Nauman [441] proposed that fixed-bed reactors should be scaled-up according to either geometrical
similarity, where the L/D ratio is kept constant, or constant pressure drop, which can be achieved by
increasing the diameter while maintaining the same superficial velocity. It is not recommended to scale-
up a fixed-bed with a constant Reynolds number, because it will lead to a short and wide reactor, and
higher Reynolds numbers enhance the heat transfer characteristics at the wall [441]. Simulation and
optimization have also been used in the scale-up of fixed-bed reactors in order to mitigate temperature
fluctuations, which in turn can severely impact the fuel conversion and product selectivity [436,442].
The reverse-flow concept is demonstrated for a commercially realistic industrial-scale fixed-bed reactor.
To establish a basis for a realistic reactor size, commercial steam reforming and water-gas shift reactors
used for H2 production [195,443] are used to determine the anticipated capacity of a single commercial
CLC reactor. These industrial fixed-bed reactors typically range 6 –15 m in length and 0.01 – 4 m in
diameter. To maintain a reasonable pressure drop across the fixed-bed at 2 – 3 atm, large catalyst particles
with an equivalent diameter of 1 cm are commonly used [443]. In this study, a particle size of 300 µm is
chosen, in order to minimize diffusion effects through the oxygen carrier, but at the same time it imposes
a significant pressure drop in the system. For the pressure drop to be within reasonable bounds, the bed
height should not exceed 1 m. The scaling factors that are kept constant in the design are the L/D ratio and
Froude number. The reactor diameter is calculated, given the bed height limit and the equivalent L/D of
the bench-scale reactor. The gas flow rate is then calculated to match the Froude number of the bench-
scale reactor. Following this rationale and procedure, the reactor size and operating conditions for the
industrial-scale reactor are calculated as shown in Table 8.4. It should be noted that the strategy of reactor
design (both for bench- and industrial- scale systems) is aimed at showcasing the advantages of reversing
the flow in CLC reduction. These systems can be further optimized by studying different oxygen carriers,
particle sizes, and different geometries, but this optimization is outside the scope of this paper. In Chapter
9, the cycle configuration and reverse-flow strategy is optimized for maximal heat removal efficiency.
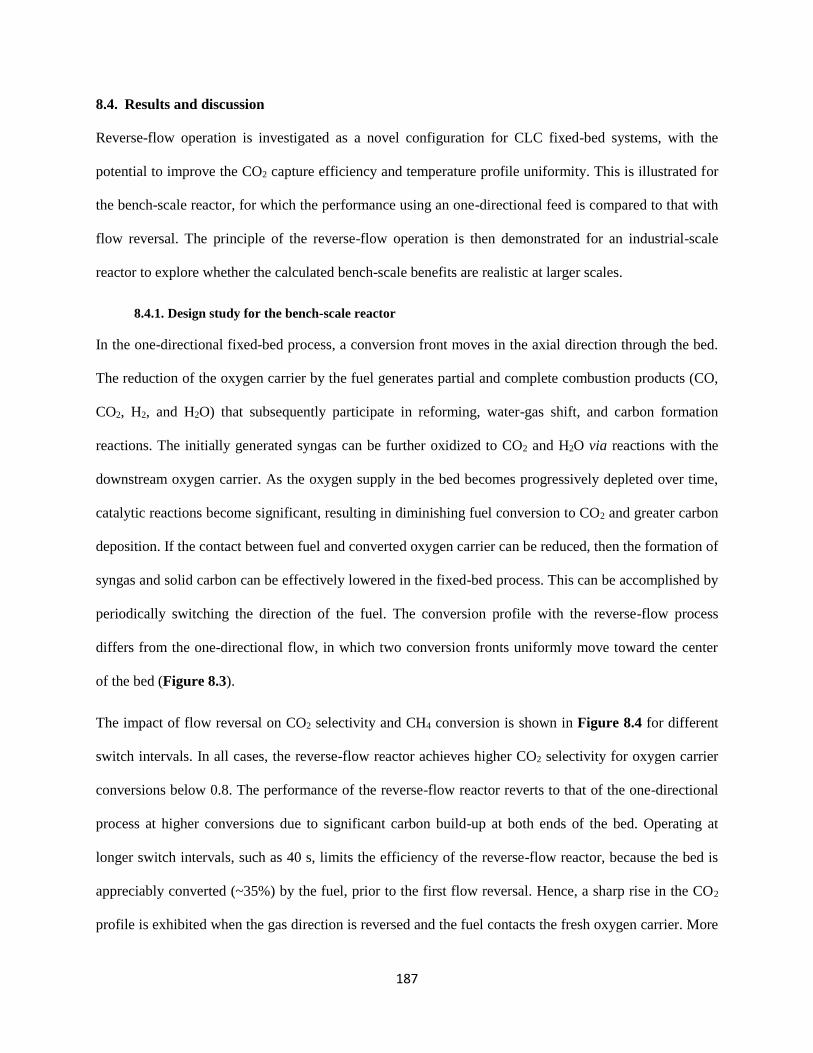
187
8.4. Results and discussion
Reverse-flow operation is investigated as a novel configuration for CLC fixed-bed systems, with the
potential to improve the CO2 capture efficiency and temperature profile uniformity. This is illustrated for
the bench-scale reactor, for which the performance using an one-directional feed is compared to that with
flow reversal. The principle of the reverse-flow operation is then demonstrated for an industrial-scale
reactor to explore whether the calculated bench-scale benefits are realistic at larger scales.
8.4.1. Design study for the bench-scale reactor
In the one-directional fixed-bed process, a conversion front moves in the axial direction through the bed.
The reduction of the oxygen carrier by the fuel generates partial and complete combustion products (CO,
CO2, H2, and H2O) that subsequently participate in reforming, water-gas shift, and carbon formation
reactions. The initially generated syngas can be further oxidized to CO2 and H2O via reactions with the
downstream oxygen carrier. As the oxygen supply in the bed becomes progressively depleted over time,
catalytic reactions become significant, resulting in diminishing fuel conversion to CO2 and greater carbon
deposition. If the contact between fuel and converted oxygen carrier can be reduced, then the formation of
syngas and solid carbon can be effectively lowered in the fixed-bed process. This can be accomplished by
periodically switching the direction of the fuel. The conversion profile with the reverse-flow process
differs from the one-directional flow, in which two conversion fronts uniformly move toward the center
of the bed (Figure 8.3).
The impact of flow reversal on CO2 selectivity and CH4 conversion is shown in Figure 8.4 for different
switch intervals. In all cases, the reverse-flow reactor achieves higher CO2 selectivity for oxygen carrier
conversions below 0.8. The performance of the reverse-flow reactor reverts to that of the one-directional
process at higher conversions due to significant carbon build-up at both ends of the bed. Operating at
longer switch intervals, such as 40 s, limits the efficiency of the reverse-flow reactor, because the bed is
appreciably converted (~35%) by the fuel, prior to the first flow reversal. Hence, a sharp rise in the CO2
profile is exhibited when the gas direction is reversed and the fuel contacts the fresh oxygen carrier. More

188
frequently reversing the flow can provide a more uniform conversion profile inside the bed and an overall
higher CO2 selectivity. In regards to CH4 conversion, both reactors exhibit a minor initial CH4 slip due to
the absence of Ni, which activates the CH4 conversion reactions [58,119]. The reverse-flow reactor
achieves higher or equally high fuel conversions. The steep drops and jumps shown in Figure 8.4 are the
result of instantly pushing the gaseous contents to the opposite direction of the reactor when the flow is
reversed. They are the least realistic aspect of the simulations preformed, as these discontinuities are
attributed to the model boundary conditions when the flow direction is periodically changed and do not
account for momentary gas compressibility and dispersion.
Figure 8.3: Oxygen carrier conversion as a function of reduction time and dimensionless bed height for
the bench-scale reactor. Switch interval is 30 s for the reverse-flow operation.
From the analysis of Figure 8.4, the optimal flow reversal scheme for the bench-scale reactor corresponds
to a switch interval of ~30 s, which can achieve CO2 selectivity >90% with the lowest switching
frequency. The utilization of the oxygen carrier is substantially increased in the reverse-flow process. For
instance, the reduction cycle using an one-directional flow must be terminated when the bed is 22%
converted to maintain 90% CO2 selectivity in the exhaust stream. To operate at the same selectivity in the
reverse-flow reactor, with a 30 s switch interval, reduction can be continued until the bed is 42%

189
converted. This is a significant improvement, addressing specifically one of the major bottlenecks of
current CLC fixed bed reactors. It also offers advantages in terms of mitigating carbon formation in the
reactor.
Figure 8.4: Comparison of the CO2 selectivity and CH4 conversion for the bench-scale reactor under one-
directional flow and reverse-flow operation at different switch intervals.
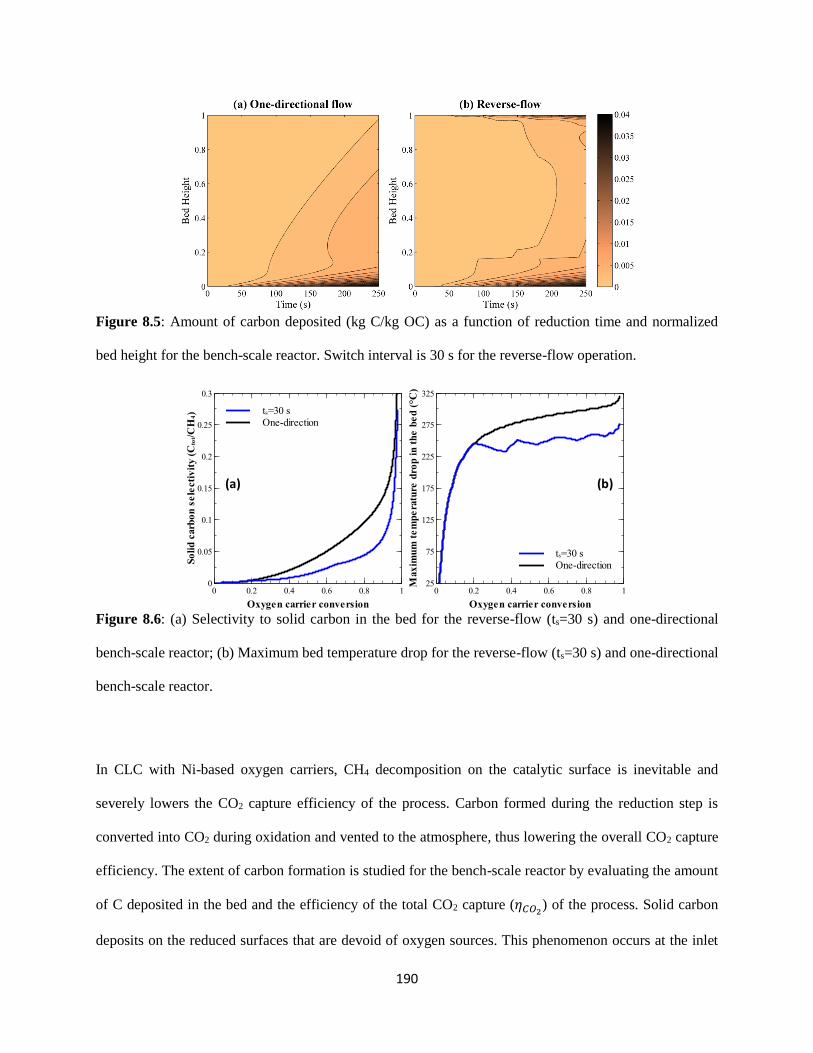
190
Figure 8.5: Amount of carbon deposited (kg C/kg OC) as a function of reduction time and normalized
bed height for the bench-scale reactor. Switch interval is 30 s for the reverse-flow operation.
Figure 8.6: (a) Selectivity to solid carbon in the bed for the reverse-flow (ts=30 s) and one-directional
bench-scale reactor; (b) Maximum bed temperature drop for the reverse-flow (ts=30 s) and one-directional
bench-scale reactor.
In CLC with Ni-based oxygen carriers, CH4 decomposition on the catalytic surface is inevitable and
severely lowers the CO2 capture efficiency of the process. Carbon formed during the reduction step is
converted into CO2 during oxidation and vented to the atmosphere, thus lowering the overall CO2 capture
efficiency. The extent of carbon formation is studied for the bench-scale reactor by evaluating the amount
of C deposited in the bed and the efficiency of the total CO2 capture (𝜂𝐶𝑂2) of the process. Solid carbon
deposits on the reduced surfaces that are devoid of oxygen sources. This phenomenon occurs at the inlet
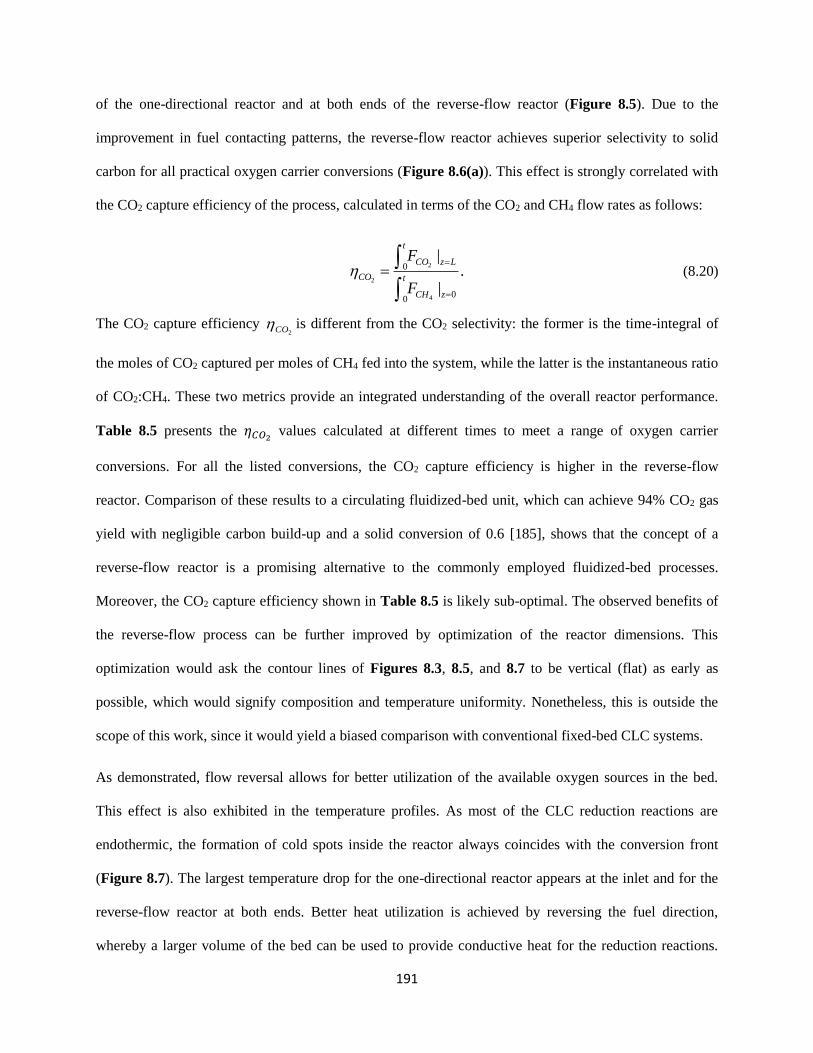
191
of the one-directional reactor and at both ends of the reverse-flow reactor (Figure 8.5). Due to the
improvement in fuel contacting patterns, the reverse-flow reactor achieves superior selectivity to solid
carbon for all practical oxygen carrier conversions (Figure 8.6(a)). This effect is strongly correlated with
the CO2 capture efficiency of the process, calculated in terms of the CO2 and CH4 flow rates as follows:
2
2
4
0
00
|.
|
t
CO z L
CO t
CH z
F
F
(8.20)
The CO2 capture efficiency 2CO is different from the CO2 selectivity: the former is the time-integral of
the moles of CO2 captured per moles of CH4 fed into the system, while the latter is the instantaneous ratio
of CO2:CH4. These two metrics provide an integrated understanding of the overall reactor performance.
Table 8.5 presents the 𝜂𝐶𝑂2 values calculated at different times to meet a range of oxygen carrier
conversions. For all the listed conversions, the CO2 capture efficiency is higher in the reverse-flow
reactor. Comparison of these results to a circulating fluidized-bed unit, which can achieve 94% CO2 gas
yield with negligible carbon build-up and a solid conversion of 0.6 [185], shows that the concept of a
reverse-flow reactor is a promising alternative to the commonly employed fluidized-bed processes.
Moreover, the CO2 capture efficiency shown in Table 8.5 is likely sub-optimal. The observed benefits of
the reverse-flow process can be further improved by optimization of the reactor dimensions. This
optimization would ask the contour lines of Figures 8.3, 8.5, and 8.7 to be vertical (flat) as early as
possible, which would signify composition and temperature uniformity. Nonetheless, this is outside the
scope of this work, since it would yield a biased comparison with conventional fixed-bed CLC systems.
As demonstrated, flow reversal allows for better utilization of the available oxygen sources in the bed.
This effect is also exhibited in the temperature profiles. As most of the CLC reduction reactions are
endothermic, the formation of cold spots inside the reactor always coincides with the conversion front
(Figure 8.7). The largest temperature drop for the one-directional reactor appears at the inlet and for the
reverse-flow reactor at both ends. Better heat utilization is achieved by reversing the fuel direction,
whereby a larger volume of the bed can be used to provide conductive heat for the reduction reactions.
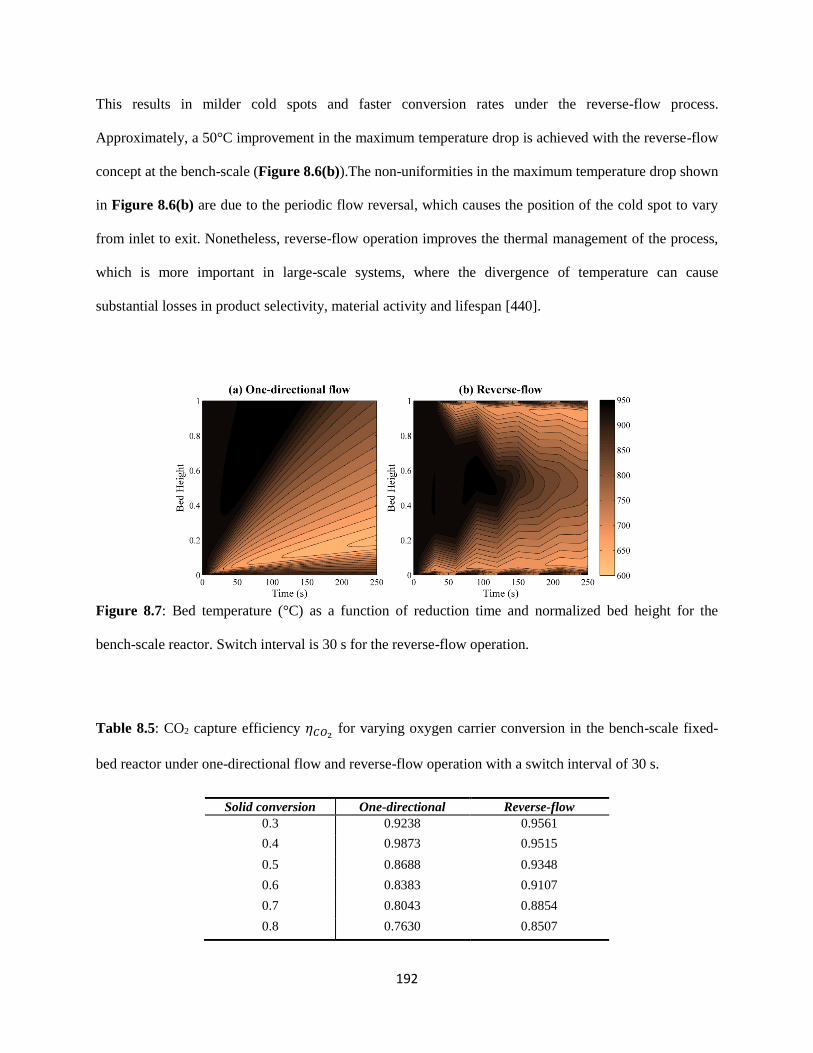
192
This results in milder cold spots and faster conversion rates under the reverse-flow process.
Approximately, a 50°C improvement in the maximum temperature drop is achieved with the reverse-flow
concept at the bench-scale (Figure 8.6(b)).The non-uniformities in the maximum temperature drop shown
in Figure 8.6(b) are due to the periodic flow reversal, which causes the position of the cold spot to vary
from inlet to exit. Nonetheless, reverse-flow operation improves the thermal management of the process,
which is more important in large-scale systems, where the divergence of temperature can cause
substantial losses in product selectivity, material activity and lifespan [440].
Figure 8.7: Bed temperature (°C) as a function of reduction time and normalized bed height for the
bench-scale reactor. Switch interval is 30 s for the reverse-flow operation.
Table 8.5: CO2 capture efficiency 𝜂𝐶𝑂2 for varying oxygen carrier conversion in the bench-scale fixed-
bed reactor under one-directional flow and reverse-flow operation with a switch interval of 30 s.
Solid conversion One-directional Reverse-flow
0.3 0.9238 0.9561
0.4 0.9873 0.9515
0.5 0.8688 0.9348
0.6 0.8383 0.9107
0.7 0.8043 0.8854
0.8 0.7630 0.8507
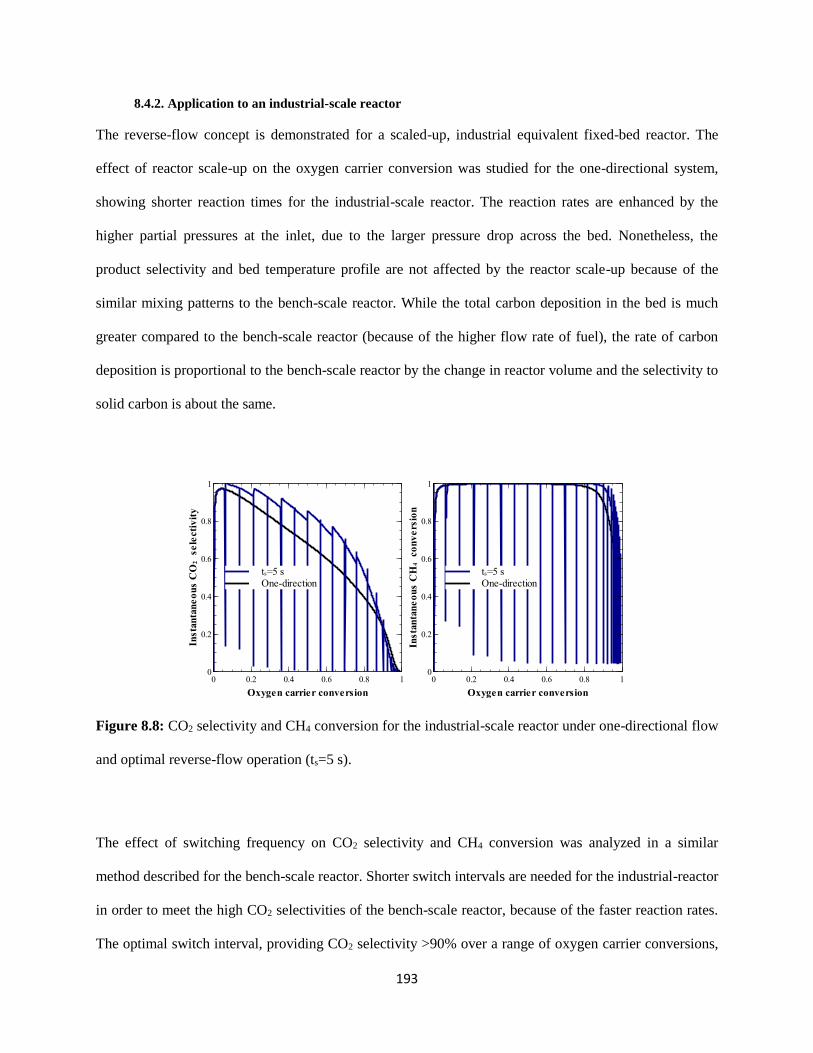
193
8.4.2. Application to an industrial-scale reactor
The reverse-flow concept is demonstrated for a scaled-up, industrial equivalent fixed-bed reactor. The
effect of reactor scale-up on the oxygen carrier conversion was studied for the one-directional system,
showing shorter reaction times for the industrial-scale reactor. The reaction rates are enhanced by the
higher partial pressures at the inlet, due to the larger pressure drop across the bed. Nonetheless, the
product selectivity and bed temperature profile are not affected by the reactor scale-up because of the
similar mixing patterns to the bench-scale reactor. While the total carbon deposition in the bed is much
greater compared to the bench-scale reactor (because of the higher flow rate of fuel), the rate of carbon
deposition is proportional to the bench-scale reactor by the change in reactor volume and the selectivity to
solid carbon is about the same.
Figure 8.8: CO2 selectivity and CH4 conversion for the industrial-scale reactor under one-directional flow
and optimal reverse-flow operation (ts=5 s).
The effect of switching frequency on CO2 selectivity and CH4 conversion was analyzed in a similar
method described for the bench-scale reactor. Shorter switch intervals are needed for the industrial-reactor
in order to meet the high CO2 selectivities of the bench-scale reactor, because of the faster reaction rates.
The optimal switch interval, providing CO2 selectivity >90% over a range of oxygen carrier conversions,
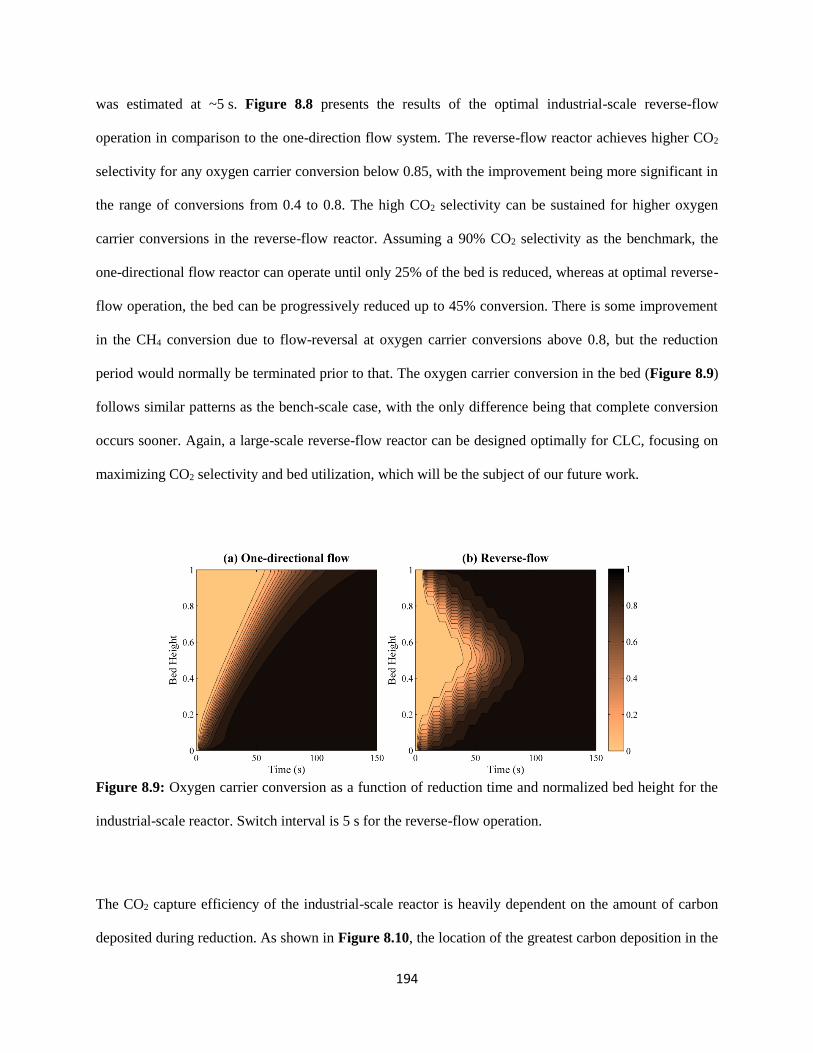
194
was estimated at ~5 s. Figure 8.8 presents the results of the optimal industrial-scale reverse-flow
operation in comparison to the one-direction flow system. The reverse-flow reactor achieves higher CO2
selectivity for any oxygen carrier conversion below 0.85, with the improvement being more significant in
the range of conversions from 0.4 to 0.8. The high CO2 selectivity can be sustained for higher oxygen
carrier conversions in the reverse-flow reactor. Assuming a 90% CO2 selectivity as the benchmark, the
one-directional flow reactor can operate until only 25% of the bed is reduced, whereas at optimal reverse-
flow operation, the bed can be progressively reduced up to 45% conversion. There is some improvement
in the CH4 conversion due to flow-reversal at oxygen carrier conversions above 0.8, but the reduction
period would normally be terminated prior to that. The oxygen carrier conversion in the bed (Figure 8.9)
follows similar patterns as the bench-scale case, with the only difference being that complete conversion
occurs sooner. Again, a large-scale reverse-flow reactor can be designed optimally for CLC, focusing on
maximizing CO2 selectivity and bed utilization, which will be the subject of our future work.
Figure 8.9: Oxygen carrier conversion as a function of reduction time and normalized bed height for the
industrial-scale reactor. Switch interval is 5 s for the reverse-flow operation.
The CO2 capture efficiency of the industrial-scale reactor is heavily dependent on the amount of carbon
deposited during reduction. As shown in Figure 8.10, the location of the greatest carbon deposition in the
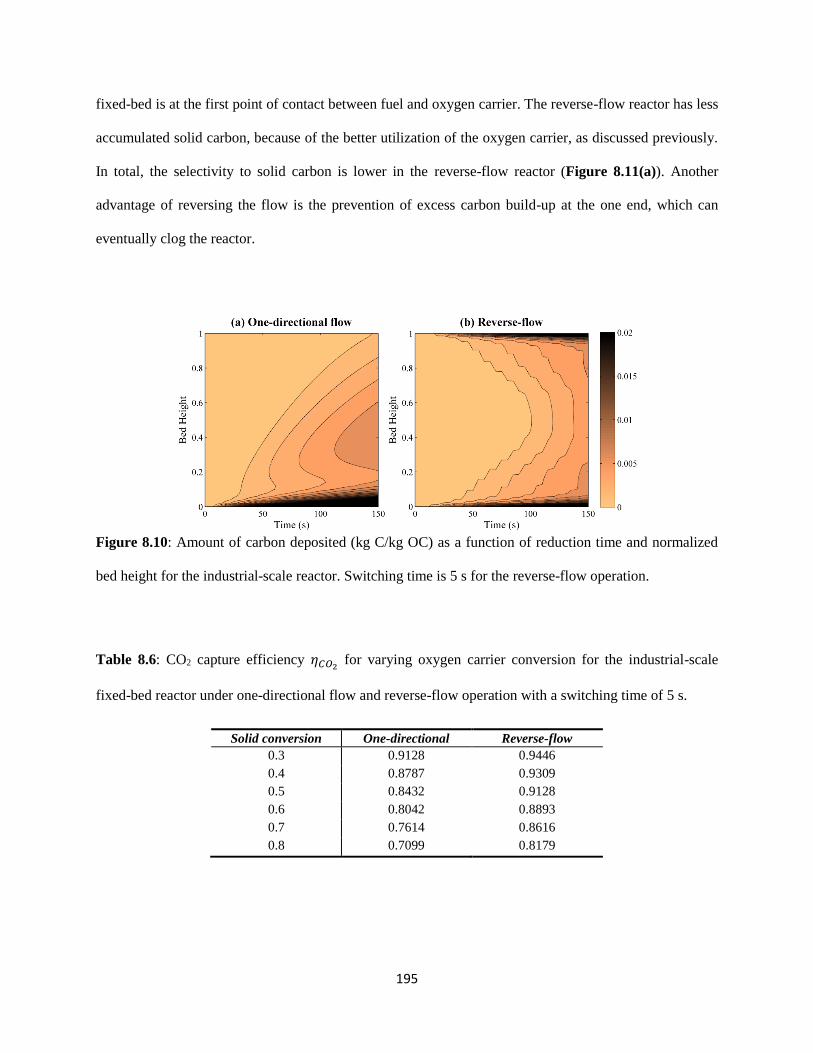
195
fixed-bed is at the first point of contact between fuel and oxygen carrier. The reverse-flow reactor has less
accumulated solid carbon, because of the better utilization of the oxygen carrier, as discussed previously.
In total, the selectivity to solid carbon is lower in the reverse-flow reactor (Figure 8.11(a)). Another
advantage of reversing the flow is the prevention of excess carbon build-up at the one end, which can
eventually clog the reactor.
Figure 8.10: Amount of carbon deposited (kg C/kg OC) as a function of reduction time and normalized
bed height for the industrial-scale reactor. Switching time is 5 s for the reverse-flow operation.
Table 8.6: CO2 capture efficiency 𝜂𝐶𝑂2 for varying oxygen carrier conversion for the industrial-scale
fixed-bed reactor under one-directional flow and reverse-flow operation with a switching time of 5 s.
Solid conversion One-directional Reverse-flow
0.3 0.9128 0.9446
0.4 0.8787 0.9309
0.5 0.8432 0.9128
0.6 0.8042 0.8893
0.7 0.7614 0.8616
0.8 0.7099 0.8179
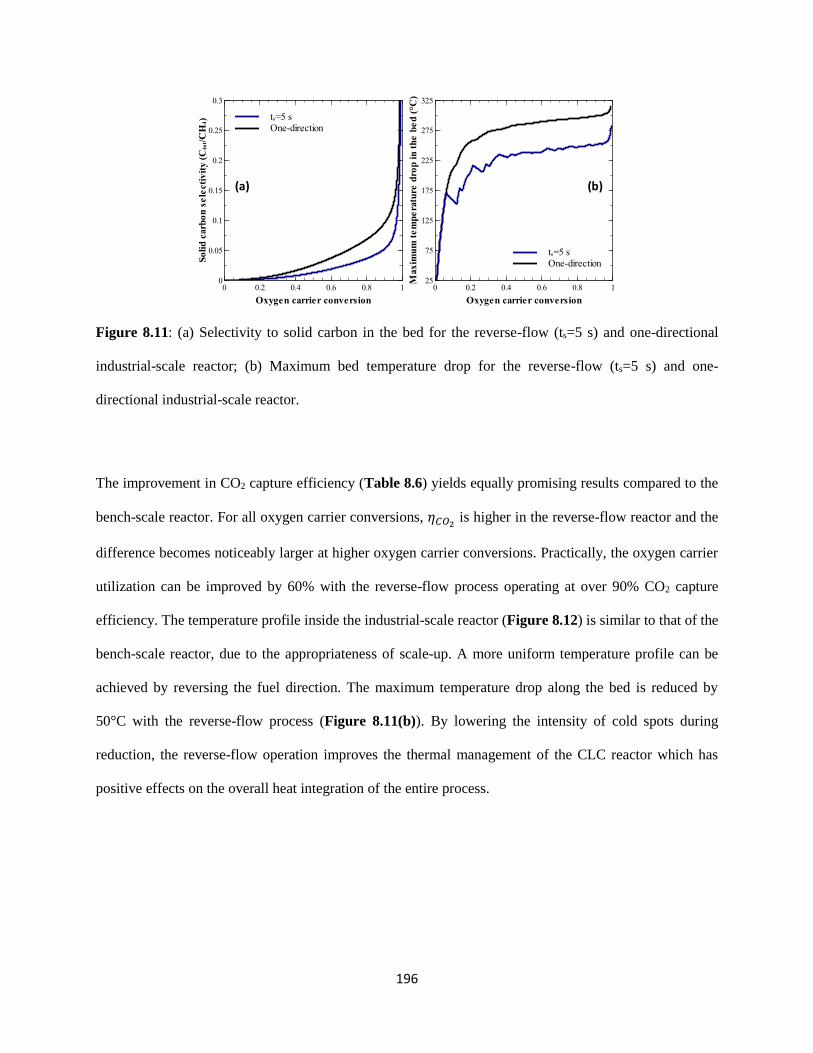
196
Figure 8.11: (a) Selectivity to solid carbon in the bed for the reverse-flow (ts=5 s) and one-directional
industrial-scale reactor; (b) Maximum bed temperature drop for the reverse-flow (ts=5 s) and one-
directional industrial-scale reactor.
The improvement in CO2 capture efficiency (Table 8.6) yields equally promising results compared to the
bench-scale reactor. For all oxygen carrier conversions, 𝜂𝐶𝑂2 is higher in the reverse-flow reactor and the
difference becomes noticeably larger at higher oxygen carrier conversions. Practically, the oxygen carrier
utilization can be improved by 60% with the reverse-flow process operating at over 90% CO2 capture
efficiency. The temperature profile inside the industrial-scale reactor (Figure 8.12) is similar to that of the
bench-scale reactor, due to the appropriateness of scale-up. A more uniform temperature profile can be
achieved by reversing the fuel direction. The maximum temperature drop along the bed is reduced by
50°C with the reverse-flow process (Figure 8.11(b)). By lowering the intensity of cold spots during
reduction, the reverse-flow operation improves the thermal management of the CLC reactor which has
positive effects on the overall heat integration of the entire process.
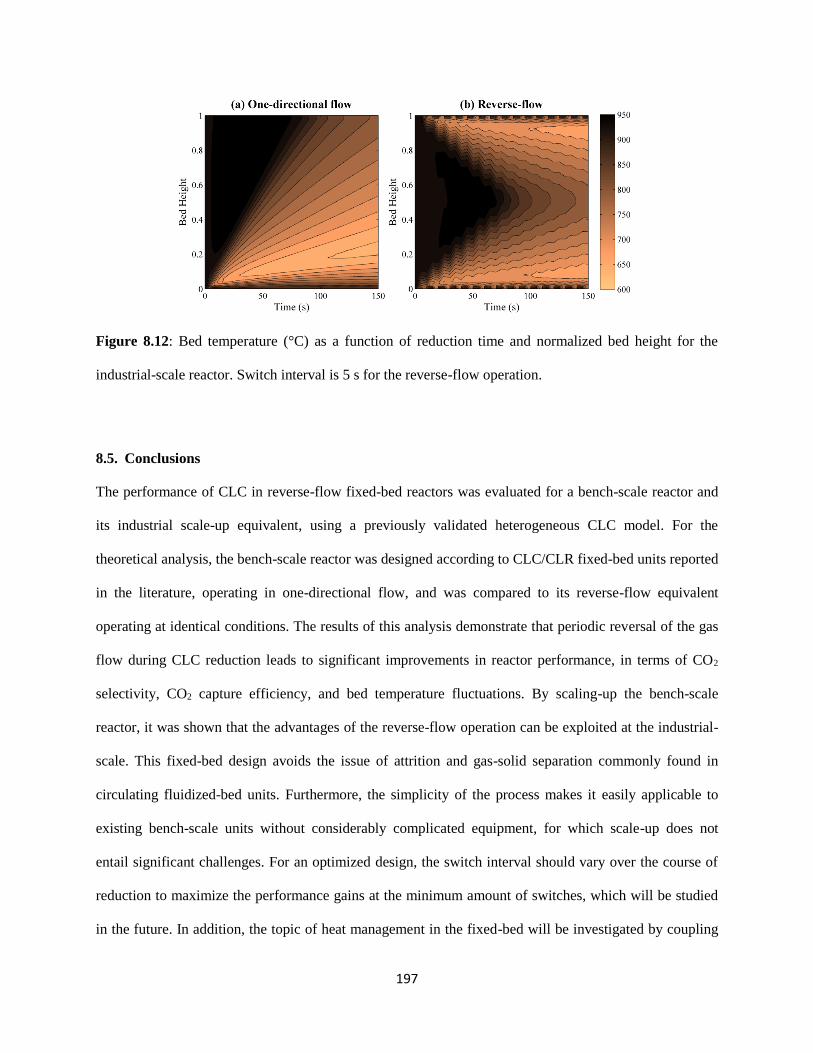
197
Figure 8.12: Bed temperature (°C) as a function of reduction time and normalized bed height for the
industrial-scale reactor. Switch interval is 5 s for the reverse-flow operation.
8.5. Conclusions
The performance of CLC in reverse-flow fixed-bed reactors was evaluated for a bench-scale reactor and
its industrial scale-up equivalent, using a previously validated heterogeneous CLC model. For the
theoretical analysis, the bench-scale reactor was designed according to CLC/CLR fixed-bed units reported
in the literature, operating in one-directional flow, and was compared to its reverse-flow equivalent
operating at identical conditions. The results of this analysis demonstrate that periodic reversal of the gas
flow during CLC reduction leads to significant improvements in reactor performance, in terms of CO2
selectivity, CO2 capture efficiency, and bed temperature fluctuations. By scaling-up the bench-scale
reactor, it was shown that the advantages of the reverse-flow operation can be exploited at the industrial-
scale. This fixed-bed design avoids the issue of attrition and gas-solid separation commonly found in
circulating fluidized-bed units. Furthermore, the simplicity of the process makes it easily applicable to
existing bench-scale units without considerably complicated equipment, for which scale-up does not
entail significant challenges. For an optimized design, the switch interval should vary over the course of
reduction to maximize the performance gains at the minimum amount of switches, which will be studied
in the future. In addition, the topic of heat management in the fixed-bed will be investigated by coupling

198
reverse-flow of the reduction and oxidation cycles. Flow reversal done at the oxidation conditions can
potentially be used to alter and manipulate the location of hot spots inside the fixed-bed. Thus, coupling
these phenomena together can reduce the energy expenditure for oxidation, while sufficiently
regenerating the fixed-bed.
199
Chapter 9 OPTIMAL CONTROL OF A REVERSE-FLOW CHEMICAL-LOOPING FIXED BED
REACTOR
A reverse-flow fixed bed reactor concept for chemical-looping combustion (CLC) is explored. The
limitations of conventional fixed bed reactors, as applied to CLC, are overcome by reversing the gas flow
direction periodically to enhance the mixing characteristics of the bed, thus improving oxygen carrier
utilization and reactor efficiency. The reverse-flow reactor is simulated by a dusty-gas model and
compared with an equivalent fixed bed reactor without flow reversal. Dynamic optimization is used to
calculate conditions at which each reactor operates at maximum efficiency. Several cases studies illustrate
the benefits of reverse-flow operation for the CLC with CuO and NiO oxygen carriers and methane and
syngas fuels. A major advantage of the proposed reactor design is the better utilization of the oxygen
carrier bed and improved uniformity of the exhaust gas temperature during heat removal. The results
show that implementing CLC in a reverse-flow reactor has the potential to achieve higher power
generation efficiency than conventional fixed bed CLC reactors.
9.1. Introduction
Chemical-looping combustion (CLC) is a promising technology for power generation with cost effective
CO2 capture. CLC is a two-step combustion process that produces a high purity stream of CO2, ready for
compression and sequestration. A solid oxygen carrier, in the form of metal oxide particles, transports the
oxygen from air to combust a gaseous fuel. Since the fuel is never mixed with air, the combustion
products (H2O/CO2) are not diluted in N2 and CO2 can be captured after condensing the water vapor. CLC
is a pre-commercialization technology, but simulation studies on its integration with power plants indicate
that it has the potential to be more efficient than all other CO2 capture technologies [26,47,444–448]. The
overall efficiency of the corresponding power plant would be higher if CLC was to be integrated with
combined cycle (CC) power plants that take advantage of the high efficiencies of the Brayton cycle.
Therefore, several process configurations have been proposed that integrate CLC reactors with CC power

200
plants utilizing natural gas and synthesis gas fuels. The thermal efficiency of natural gas-fired CC with
CLC is 52-53% [143–145], which is about 3-5% higher than that of post-, oxy-fuel, or pre-combustion
CO2 capture methods [449]. For coal feedstocks, the efficiency of CLC combined with an integrated
gasification combined cycle (IGCC) was estimated to be close to that of conventional IGCC without CO2
capture [450] and about 2% higher than IGCC with pre-combustion CO2 capture [111,149].
CLC reactors must operate at high pressures (>20 bar) and high temperatures (>1200°C) [451,452] for
their seamless integration with downstream gas turbines. A major challenge in the development of CLC
reactors, in the case of the more conventional fluidized bed configurations, is the establishment and
maintenance of stable fluidization at high-pressure and at large-scale. Therefore, the design of the main
candidate reactor configuration for commercial CLC realization, consisting of two interconnected
fluidized beds between which the oxygen carrier is circulating [23,30,46,74,157,196,349,381,382], suffers
from immaturity of its fluidization technology. The main advantages of fluidized bed implementations of
CLC are the high gas/solid heat and mass transfer rates, stable operating temperature, and continuous
operation. Most of the operational experience of fluidized bed CLC units was gained at atmospheric
pressure and research is on-going to design and operate reactors that can accomplish stable circulation
and fluidization of the oxygen carrier at the scale conceptualized for power generation [351,353,453].
An alternative to interconnected fluidized bed CLC configurations is the much simpler fixed bed design
[108,154,354,364]. In a fixed bed reactor configuration for CLC, the oxygen carrier is statically contained
and alternatively exposed to oxidizing and reducing gases. Since solid circulation (and thus gas-solid
separation) is not required, high-pressure operation can be achieved without much difficulty. The fixed
bed reactor is more compact than the fluidized bed, which offers potential for better utilization of the
oxygen carrier, lower capital cost, and smaller process footprint. The main disadvantages of the fixed bed
reactor are its dynamic operation and the necessity of high temperature valves. The main challenge of
interest to this work is the batch operating principle of a fixed bed CLC reactor configuration, in
conjunction with the requirement for stable, smooth steady state operation of power plants. This is a
201
traditional chemical engineering challenge, but relatively new to the power generation sector.
In previous work, we used dynamic models to study and compare the performance of fixed bed and
fluidized bed reactors for gaseous CLC [119,128,132,141,142,193,324,333,368,369]. We showed that the
fixed bed reactor can operate at near 100% CH4 conversion, but the reduction cycle needs to be controlled
to ensure high CO2 capture efficiency [324]. In other relevant work, Hamers et al. [108] and Spallina et al.
[358] showed that a proper heat management strategy is essential to the integration of fixed bed CLC into
a power plant. Spallina et al. [111] estimated the overall process efficiency of a CLC-based IGCC plant
using fixed bed reactors to be 40-41%, which was similar to an IGCC-CLC plant with fluidized bed
reactors [356]. Heat management in the form of CLC operating strategy was formulated as an
optimization problem by Han and Bollas [374], with the objective of maximizing energy efficiency as a
function of the CLC cycling procedure. Here, we expand upon previous work by allowing the operating
strategy of CLC to change the direction of the gas flow during each cycle.
9.2. Basic operating principle of fixed bed CLC
The fixed bed CLC reactor is a batch process, operated in successive cycles of reduction, oxidation, and
heat removal. During reduction, a gaseous fuel (such as natural gas or syngas) is fed to a fully oxidized
bed, where the oxygen carrier is reduced and the fuel is converted mainly to CO2 and H2O. The reduction
of the oxygen carrier is usually a combination of endothermic and exothermic reactions, depending on the
fuel and metal oxide. The reduction phase is stopped when either the fuel conversion or CO2 selectivity
reaches a lower bound, determined by efficiency and environmental requirements, and the reactor is
purged with inert gas for a short period. Next, air is fed to the reactor to commence the oxidation cycle
and regenerate the oxygen carrier. The reactor is heated up to high temperatures due to the exothermic
reactions and the heat from the solids is transferred to the gas phase by continually blowing air through
the reactor. This is commonly referred to as the heat removal phase. Once most of the heat is pushed out
of the reactor, the reactor is purged briefly and the cycle returns to reduction.
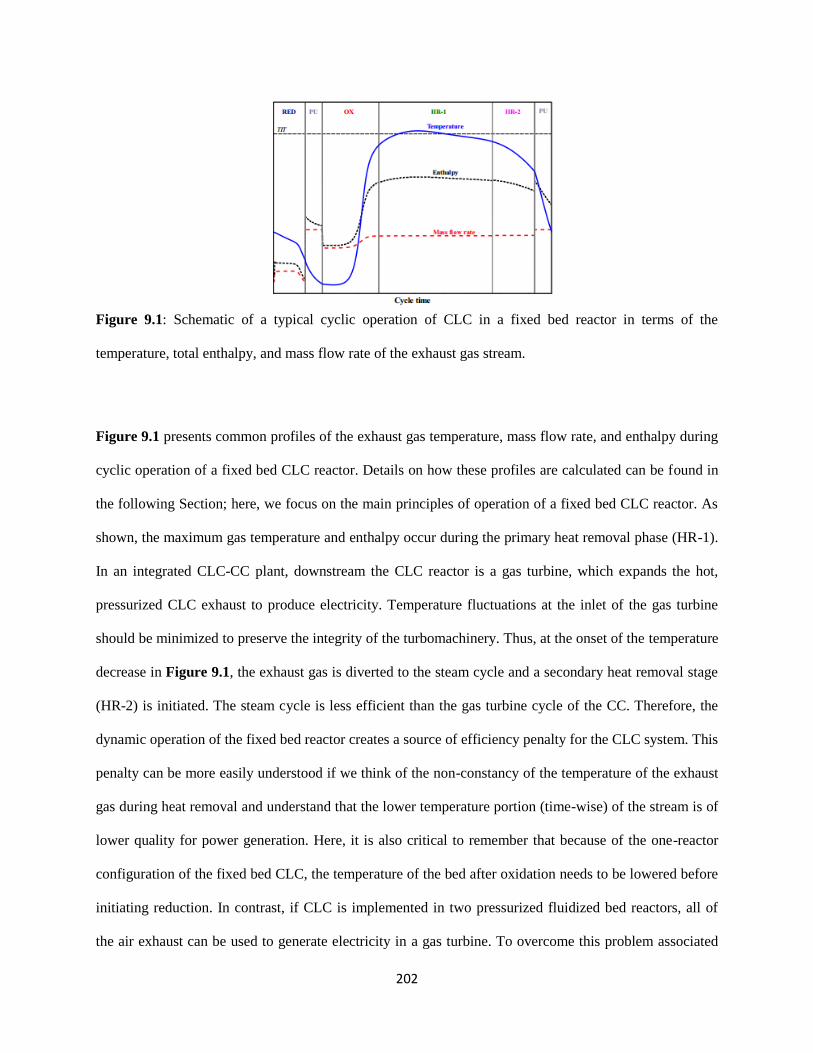
202
Figure 9.1: Schematic of a typical cyclic operation of CLC in a fixed bed reactor in terms of the
temperature, total enthalpy, and mass flow rate of the exhaust gas stream.
Figure 9.1 presents common profiles of the exhaust gas temperature, mass flow rate, and enthalpy during
cyclic operation of a fixed bed CLC reactor. Details on how these profiles are calculated can be found in
the following Section; here, we focus on the main principles of operation of a fixed bed CLC reactor. As
shown, the maximum gas temperature and enthalpy occur during the primary heat removal phase (HR-1).
In an integrated CLC-CC plant, downstream the CLC reactor is a gas turbine, which expands the hot,
pressurized CLC exhaust to produce electricity. Temperature fluctuations at the inlet of the gas turbine
should be minimized to preserve the integrity of the turbomachinery. Thus, at the onset of the temperature
decrease in Figure 9.1, the exhaust gas is diverted to the steam cycle and a secondary heat removal stage
(HR-2) is initiated. The steam cycle is less efficient than the gas turbine cycle of the CC. Therefore, the
dynamic operation of the fixed bed reactor creates a source of efficiency penalty for the CLC system. This
penalty can be more easily understood if we think of the non-constancy of the temperature of the exhaust
gas during heat removal and understand that the lower temperature portion (time-wise) of the stream is of
lower quality for power generation. Here, it is also critical to remember that because of the one-reactor
configuration of the fixed bed CLC, the temperature of the bed after oxidation needs to be lowered before
initiating reduction. In contrast, if CLC is implemented in two pressurized fluidized bed reactors, all of
the air exhaust can be used to generate electricity in a gas turbine. To overcome this problem associated

203
with the fixed bed system, we need to optimize the reactor configuration and process operation and ensure
high thermal and CO2 capture efficiencies.
9.3. Novelty and scope of this work
To summarize the scope of this work, we are interested in fixed bed reactors, because of their capability
to operate at high pressures, with gaseous fuels and we wish to explore the optimality of reactor design
and operation strategy for the maximization of process efficiency and CO2 capture. The basic process
elements that control these efficiencies are the uniformity of the bed in terms of temperature and oxygen
carrier conversion profiles. In an effort to impose uniformity to the fundamentally axially distributed
fixed bed reactor, we explore the use of reverse-flow operation. Figure 9.2 shows a simplified process
scheme of a reverse-flow CLC reactor. At normal flow conditions, the flow passes through 1-2-R-3-4 and
when the direction is switched, the gas flows through 1-2’-R-3’-4. In this investigation, we examine if
reverse-flow operation can enhance the contact between fuel and oxygen carrier during reduction. There
might exist benefits, in terms of a more uniform bed conversion and temperature distribution, which could
lead to better oxidation cycle efficiency and heat removal performance.
CO2/H2O outFuel in
1
2
2'
3'
3
4
R
Figure 9.2: Simplified diagram of revere-flow operation in a fixed bed CLC reactor. Forward flow pass is
1-2-R-3-4 and backward flow pass is 1-2’-R-3’-4.
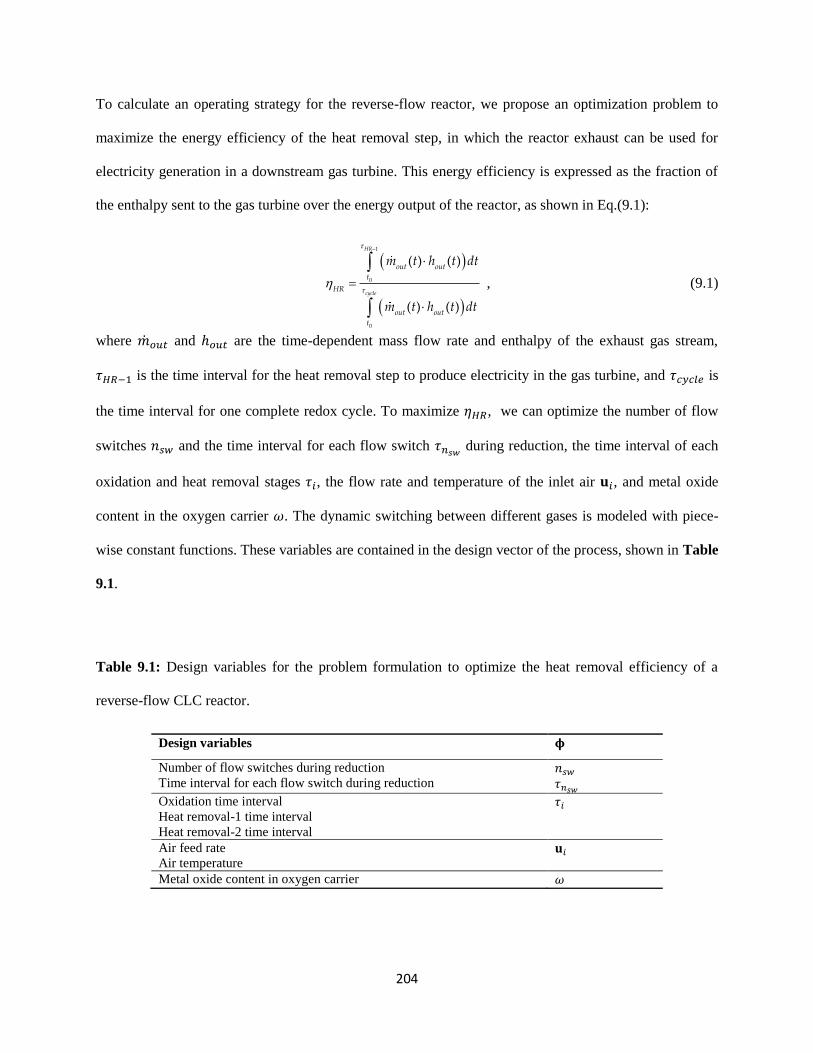
204
To calculate an operating strategy for the reverse-flow reactor, we propose an optimization problem to
maximize the energy efficiency of the heat removal step, in which the reactor exhaust can be used for
electricity generation in a downstream gas turbine. This energy efficiency is expressed as the fraction of
the enthalpy sent to the gas turbine over the energy output of the reactor, as shown in Eq.(9.1):
1
0
0
( ) ( )
( ) ( )
HR
cycle
out out
t
HR
out out
t
m t h t dt
m t h t dt
, (9.1)
where ��𝑜𝑢𝑡 and ℎ𝑜𝑢𝑡 are the time-dependent mass flow rate and enthalpy of the exhaust gas stream,
𝜏𝐻𝑅−1 is the time interval for the heat removal step to produce electricity in the gas turbine, and 𝜏𝑐𝑦𝑐𝑙𝑒 is
the time interval for one complete redox cycle. To maximize 𝜂𝐻𝑅, we can optimize the number of flow
switches 𝑛𝑠𝑤 and the time interval for each flow switch 𝜏𝑛𝑠𝑤 during reduction, the time interval of each
oxidation and heat removal stages 𝜏𝑖, the flow rate and temperature of the inlet air 𝐮𝑖, and metal oxide
content in the oxygen carrier 𝜔. The dynamic switching between different gases is modeled with piece-
wise constant functions. These variables are contained in the design vector of the process, shown in Table
9.1.
Table 9.1: Design variables for the problem formulation to optimize the heat removal efficiency of a
reverse-flow CLC reactor.
Design variables 𝛟
Number of flow switches during reduction
Time interval for each flow switch during reduction 𝑛𝑠𝑤
𝜏𝑛𝑠𝑤
Oxidation time interval
Heat removal-1 time interval
Heat removal-2 time interval
𝜏𝑖
Air feed rate
Air temperature 𝐮𝑖
Metal oxide content in oxygen carrier 𝜔
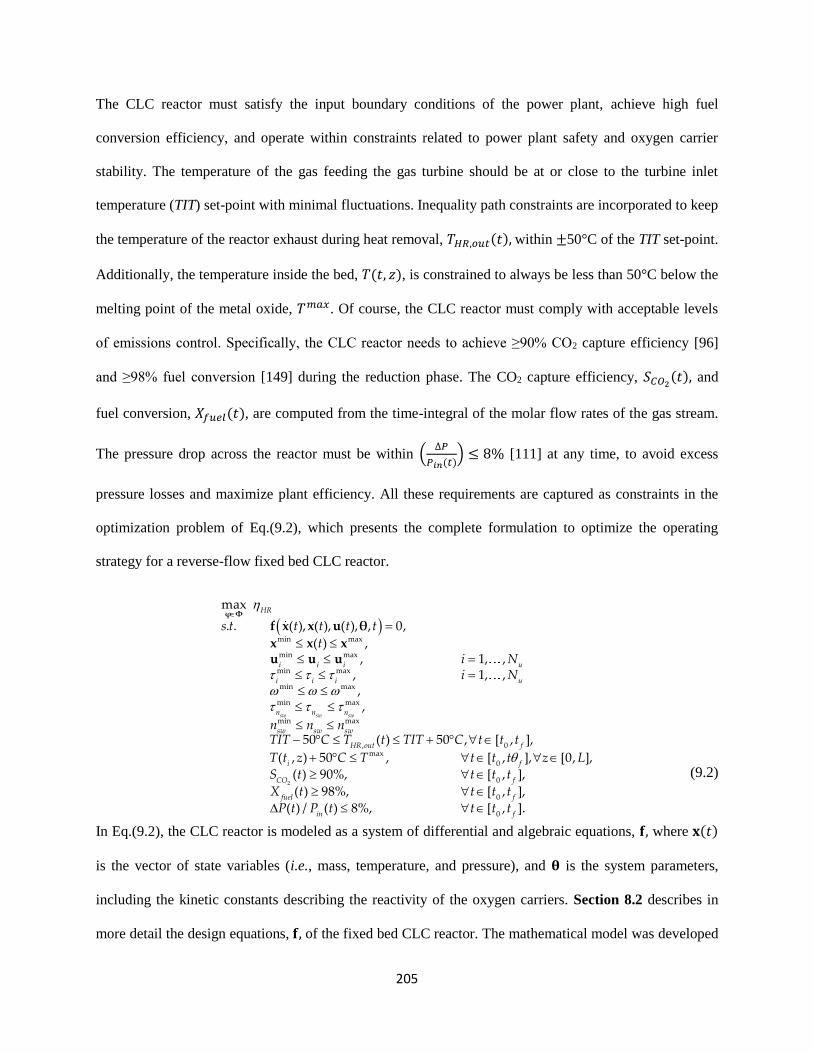
205
The CLC reactor must satisfy the input boundary conditions of the power plant, achieve high fuel
conversion efficiency, and operate within constraints related to power plant safety and oxygen carrier
stability. The temperature of the gas feeding the gas turbine should be at or close to the turbine inlet
temperature (TIT) set-point with minimal fluctuations. Inequality path constraints are incorporated to keep
the temperature of the reactor exhaust during heat removal, 𝑇𝐻𝑅,𝑜𝑢𝑡(𝑡), within ±50°C of the TIT set-point.
Additionally, the temperature inside the bed, 𝑇(𝑡, 𝑧), is constrained to always be less than 50°C below the
melting point of the metal oxide, 𝑇𝑚𝑎𝑥. Of course, the CLC reactor must comply with acceptable levels
of emissions control. Specifically, the CLC reactor needs to achieve ≥90% CO2 capture efficiency [96]
and ≥98% fuel conversion [149] during the reduction phase. The CO2 capture efficiency, 𝑆𝐶𝑂2(𝑡), and
fuel conversion, 𝑋𝑓𝑢𝑒𝑙(𝑡), are computed from the time-integral of the molar flow rates of the gas stream.
The pressure drop across the reactor must be within (∆𝑃
𝑃𝑖𝑛(𝑡)) ≤ 8% [111] at any time, to avoid excess
pressure losses and maximize plant efficiency. All these requirements are captured as constraints in the
optimization problem of Eq.(9.2), which presents the complete formulation to optimize the operating
strategy for a reverse-flow fixed bed CLC reactor.
min max
min max
min max
min max
min max
,
min max
0
,,
max
. . ( ), ( ), (
1
), , 0,
( ), ,
, 1, ,,,
[ , ]50 ( ) 50 ,
( , ) 50
,
sw sw sw
i i i u
i i i u
n n n
sw sw
HR
HR ou
w
t
s
i
f
s t t t t
t
TIT C T t TIT
t
i Ni N
n n nt
t z
t tC
T
φ Φ
θf x
u
x u
xu
x xu
2
max
0
0
0
0
, [ , ], [0, ],
( ) 90%, [ , ],
( ) 98%, [ , ],
( ) / ( ) 8%, [ , ].
f
CO f
fuel f
in f
t t t z L
S t t t t
X t t
C T
t t
P t P t t t t
(9.2)
In Eq.(9.2), the CLC reactor is modeled as a system of differential and algebraic equations, 𝐟, where 𝐱(𝑡)
is the vector of state variables (i.e., mass, temperature, and pressure), and 𝛉 is the system parameters,
including the kinetic constants describing the reactivity of the oxygen carriers. Section 8.2 describes in
more detail the design equations, 𝐟, of the fixed bed CLC reactor. The mathematical model was developed
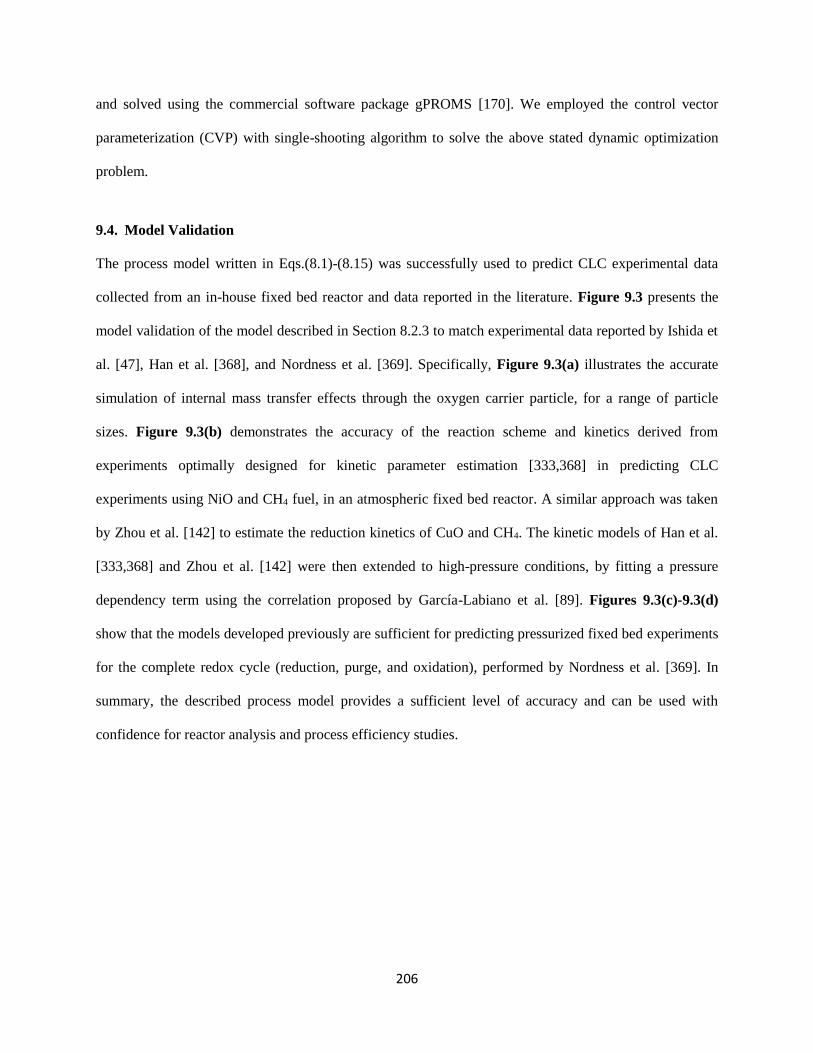
206
and solved using the commercial software package gPROMS [170]. We employed the control vector
parameterization (CVP) with single-shooting algorithm to solve the above stated dynamic optimization
problem.
9.4. Model Validation
The process model written in Eqs.(8.1)-(8.15) was successfully used to predict CLC experimental data
collected from an in-house fixed bed reactor and data reported in the literature. Figure 9.3 presents the
model validation of the model described in Section 8.2.3 to match experimental data reported by Ishida et
al. [47], Han et al. [368], and Nordness et al. [369]. Specifically, Figure 9.3(a) illustrates the accurate
simulation of internal mass transfer effects through the oxygen carrier particle, for a range of particle
sizes. Figure 9.3(b) demonstrates the accuracy of the reaction scheme and kinetics derived from
experiments optimally designed for kinetic parameter estimation [333,368] in predicting CLC
experiments using NiO and CH4 fuel, in an atmospheric fixed bed reactor. A similar approach was taken
by Zhou et al. [142] to estimate the reduction kinetics of CuO and CH4. The kinetic models of Han et al.
[333,368] and Zhou et al. [142] were then extended to high-pressure conditions, by fitting a pressure
dependency term using the correlation proposed by García-Labiano et al. [89]. Figures 9.3(c)-9.3(d)
show that the models developed previously are sufficient for predicting pressurized fixed bed experiments
for the complete redox cycle (reduction, purge, and oxidation), performed by Nordness et al. [369]. In
summary, the described process model provides a sufficient level of accuracy and can be used with
confidence for reactor analysis and process efficiency studies.

207
Figure 9.3: Model predictions of CLC experimental data performed in TGA (a) and in fixed bed (b,c,d)
using the dusty-gas model. In Figure 9.3(a), the particle model is predicative of the effect of intraparticle
diffusion limitations over a range of particle sizes (dp=1.0-3.2 mm), measured by Ishida et al. [47]. Figure
9.3(b) shows the validation of the model to predict fixed bed CLC in atmospheric pressure [368]. Figure
9.3(c)-Figure 9.3(d) show the validation of the model to describe high-pressure CLC with NiO and CuO
oxygen carriers, as described in Nordness et al. [369].
9.5. Base case for comparative analysis of the reverse-flow reactor
In this Section, the reverse-flow reactor performance is compared against an equivalent one-directional
flow fixed bed reactor. This comparison assumes a clean methane and syngas fuel source, from natural
gas or coal gasification respectively. Synthetic oxygen carriers of supported CuO and NiO were used to
improve reactivity and selectivity of the reactor and reduce its footprint. Oxygen carrier reduction and
oxidation kinetics were adapted from Nordness et al. [369], who experimentally studied high-pressure
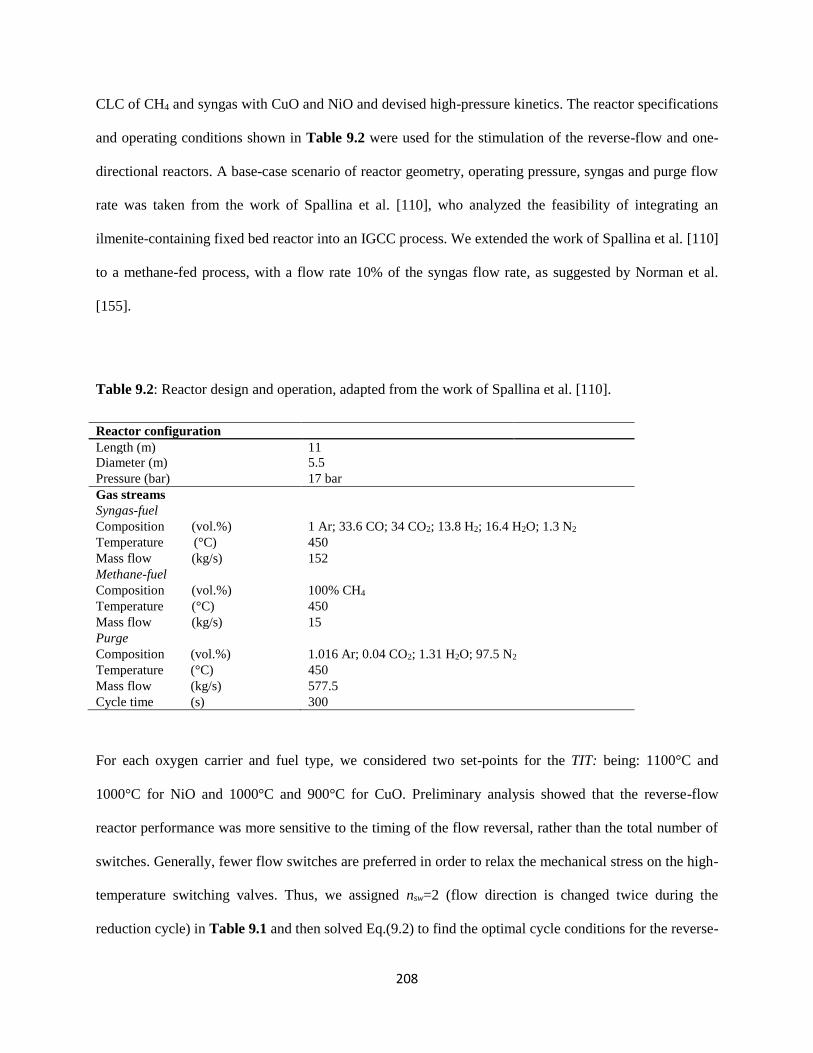
208
CLC of CH4 and syngas with CuO and NiO and devised high-pressure kinetics. The reactor specifications
and operating conditions shown in Table 9.2 were used for the stimulation of the reverse-flow and one-
directional reactors. A base-case scenario of reactor geometry, operating pressure, syngas and purge flow
rate was taken from the work of Spallina et al. [110], who analyzed the feasibility of integrating an
ilmenite-containing fixed bed reactor into an IGCC process. We extended the work of Spallina et al. [110]
to a methane-fed process, with a flow rate 10% of the syngas flow rate, as suggested by Norman et al.
[155].
Table 9.2: Reactor design and operation, adapted from the work of Spallina et al. [110].
Reactor configuration
Length (m) 11
Diameter (m) 5.5
Pressure (bar) 17 bar
Gas streams
Syngas-fuel
Composition (vol.%) 1 Ar; 33.6 CO; 34 CO2; 13.8 H2; 16.4 H2O; 1.3 N2
Temperature (°C) 450
Mass flow (kg/s) 152
Methane-fuel
Composition (vol.%) 100% CH4
Temperature (°C) 450
Mass flow (kg/s) 15
Purge
Composition (vol.%) 1.016 Ar; 0.04 CO2; 1.31 H2O; 97.5 N2
Temperature (°C) 450
Mass flow (kg/s) 577.5
Cycle time (s) 300
For each oxygen carrier and fuel type, we considered two set-points for the TIT: being: 1100°C and
1000°C for NiO and 1000°C and 900°C for CuO. Preliminary analysis showed that the reverse-flow
reactor performance was more sensitive to the timing of the flow reversal, rather than the total number of
switches. Generally, fewer flow switches are preferred in order to relax the mechanical stress on the high-
temperature switching valves. Thus, we assigned nsw=2 (flow direction is changed twice during the
reduction cycle) in Table 9.1 and then solved Eq.(9.2) to find the optimal cycle conditions for the reverse-
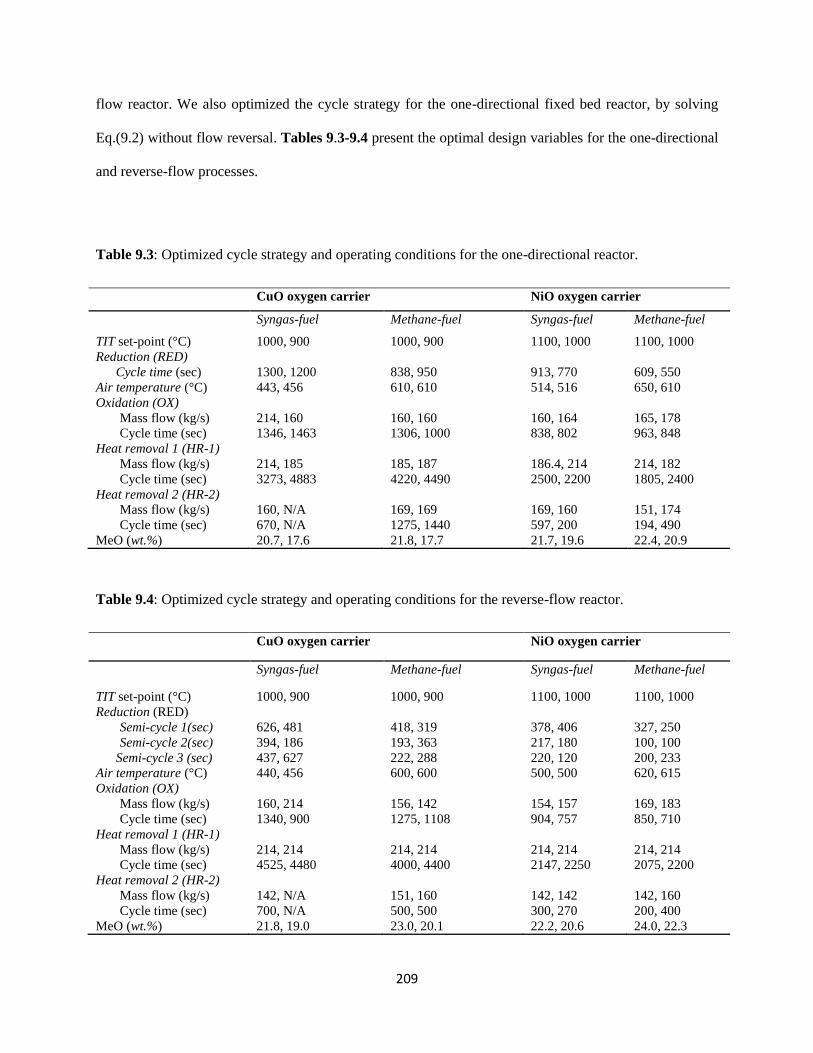
209
flow reactor. We also optimized the cycle strategy for the one-directional fixed bed reactor, by solving
Eq.(9.2) without flow reversal. Tables 9.3-9.4 present the optimal design variables for the one-directional
and reverse-flow processes.
Table 9.3: Optimized cycle strategy and operating conditions for the one-directional reactor.
CuO oxygen carrier NiO oxygen carrier
Syngas-fuel Methane-fuel Syngas-fuel Methane-fuel
TIT set-point (°C) 1000, 900 1000, 900 1100, 1000 1100, 1000
Reduction (RED)
Cycle time (sec) 1300, 1200 838, 950 913, 770 609, 550
Air temperature (°C) 443, 456 610, 610 514, 516 650, 610
Oxidation (OX)
Mass flow (kg/s) 214, 160 160, 160 160, 164 165, 178
Cycle time (sec) 1346, 1463 1306, 1000 838, 802 963, 848
Heat removal 1 (HR-1)
Mass flow (kg/s) 214, 185 185, 187 186.4, 214 214, 182
Cycle time (sec) 3273, 4883 4220, 4490 2500, 2200 1805, 2400
Heat removal 2 (HR-2)
Mass flow (kg/s) 160, N/A 169, 169 169, 160 151, 174
Cycle time (sec) 670, N/A 1275, 1440 597, 200 194, 490
MeO (wt.%) 20.7, 17.6 21.8, 17.7 21.7, 19.6 22.4, 20.9
Table 9.4: Optimized cycle strategy and operating conditions for the reverse-flow reactor.
CuO oxygen carrier NiO oxygen carrier
Syngas-fuel Methane-fuel Syngas-fuel Methane-fuel
TIT set-point (°C) 1000, 900 1000, 900 1100, 1000 1100, 1000
Reduction (RED)
Semi-cycle 1(sec) 626, 481 418, 319 378, 406 327, 250
Semi-cycle 2(sec) 394, 186 193, 363 217, 180 100, 100
Semi-cycle 3 (sec) 437, 627 222, 288 220, 120 200, 233
Air temperature (°C) 440, 456 600, 600 500, 500 620, 615
Oxidation (OX)
Mass flow (kg/s) 160, 214 156, 142 154, 157 169, 183
Cycle time (sec) 1340, 900 1275, 1108 904, 757 850, 710
Heat removal 1 (HR-1)
Mass flow (kg/s) 214, 214 214, 214 214, 214 214, 214
Cycle time (sec) 4525, 4480 4000, 4400 2147, 2250 2075, 2200
Heat removal 2 (HR-2)
Mass flow (kg/s) 142, N/A 151, 160 142, 142 142, 160
Cycle time (sec) 700, N/A 500, 500 300, 270 200, 400
MeO (wt.%) 21.8, 19.0 23.0, 20.1 22.2, 20.6 24.0, 22.3
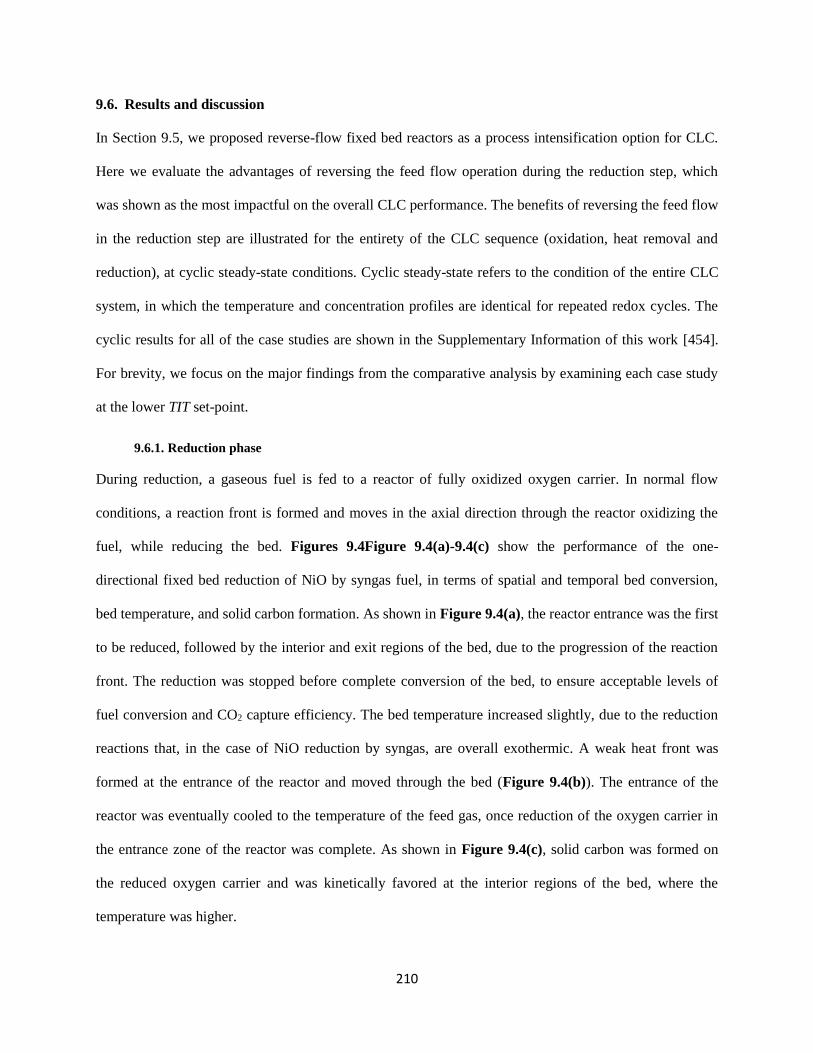
210
9.6. Results and discussion
In Section 9.5, we proposed reverse-flow fixed bed reactors as a process intensification option for CLC.
Here we evaluate the advantages of reversing the feed flow operation during the reduction step, which
was shown as the most impactful on the overall CLC performance. The benefits of reversing the feed flow
in the reduction step are illustrated for the entirety of the CLC sequence (oxidation, heat removal and
reduction), at cyclic steady-state conditions. Cyclic steady-state refers to the condition of the entire CLC
system, in which the temperature and concentration profiles are identical for repeated redox cycles. The
cyclic results for all of the case studies are shown in the Supplementary Information of this work [454].
For brevity, we focus on the major findings from the comparative analysis by examining each case study
at the lower TIT set-point.
9.6.1. Reduction phase
During reduction, a gaseous fuel is fed to a reactor of fully oxidized oxygen carrier. In normal flow
conditions, a reaction front is formed and moves in the axial direction through the reactor oxidizing the
fuel, while reducing the bed. Figures 9.4Figure 9.4(a)-9.4(c) show the performance of the one-
directional fixed bed reduction of NiO by syngas fuel, in terms of spatial and temporal bed conversion,
bed temperature, and solid carbon formation. As shown in Figure 9.4(a), the reactor entrance was the first
to be reduced, followed by the interior and exit regions of the bed, due to the progression of the reaction
front. The reduction was stopped before complete conversion of the bed, to ensure acceptable levels of
fuel conversion and CO2 capture efficiency. The bed temperature increased slightly, due to the reduction
reactions that, in the case of NiO reduction by syngas, are overall exothermic. A weak heat front was
formed at the entrance of the reactor and moved through the bed (Figure 9.4(b)). The entrance of the
reactor was eventually cooled to the temperature of the feed gas, once reduction of the oxygen carrier in
the entrance zone of the reactor was complete. As shown in Figure 9.4(c), solid carbon was formed on
the reduced oxygen carrier and was kinetically favored at the interior regions of the bed, where the
temperature was higher.
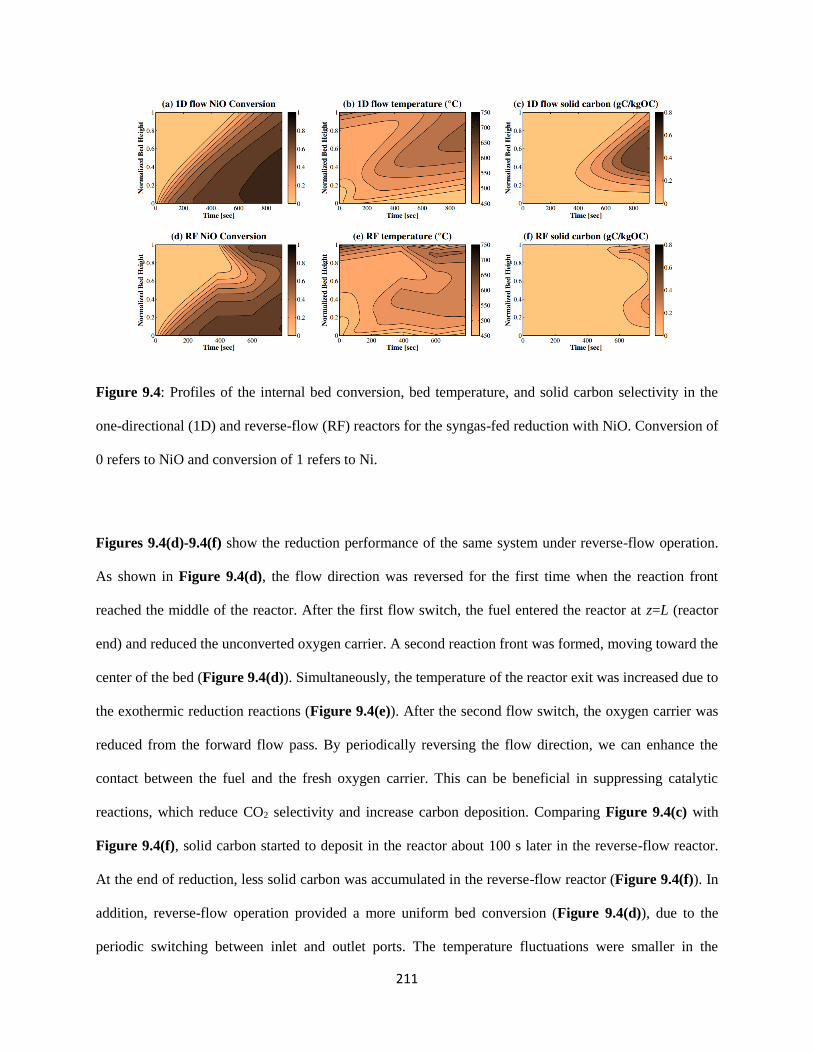
211
Figure 9.4: Profiles of the internal bed conversion, bed temperature, and solid carbon selectivity in the
one-directional (1D) and reverse-flow (RF) reactors for the syngas-fed reduction with NiO. Conversion of
0 refers to NiO and conversion of 1 refers to Ni.
Figures 9.4(d)-9.4(f) show the reduction performance of the same system under reverse-flow operation.
As shown in Figure 9.4(d), the flow direction was reversed for the first time when the reaction front
reached the middle of the reactor. After the first flow switch, the fuel entered the reactor at z=L (reactor
end) and reduced the unconverted oxygen carrier. A second reaction front was formed, moving toward the
center of the bed (Figure 9.4(d)). Simultaneously, the temperature of the reactor exit was increased due to
the exothermic reduction reactions (Figure 9.4(e)). After the second flow switch, the oxygen carrier was
reduced from the forward flow pass. By periodically reversing the flow direction, we can enhance the
contact between the fuel and the fresh oxygen carrier. This can be beneficial in suppressing catalytic
reactions, which reduce CO2 selectivity and increase carbon deposition. Comparing Figure 9.4(c) with
Figure 9.4(f), solid carbon started to deposit in the reactor about 100 s later in the reverse-flow reactor.
At the end of reduction, less solid carbon was accumulated in the reverse-flow reactor (Figure 9.4(f)). In
addition, reverse-flow operation provided a more uniform bed conversion (Figure 9.4(d)), due to the
periodic switching between inlet and outlet ports. The temperature fluctuations were smaller in the
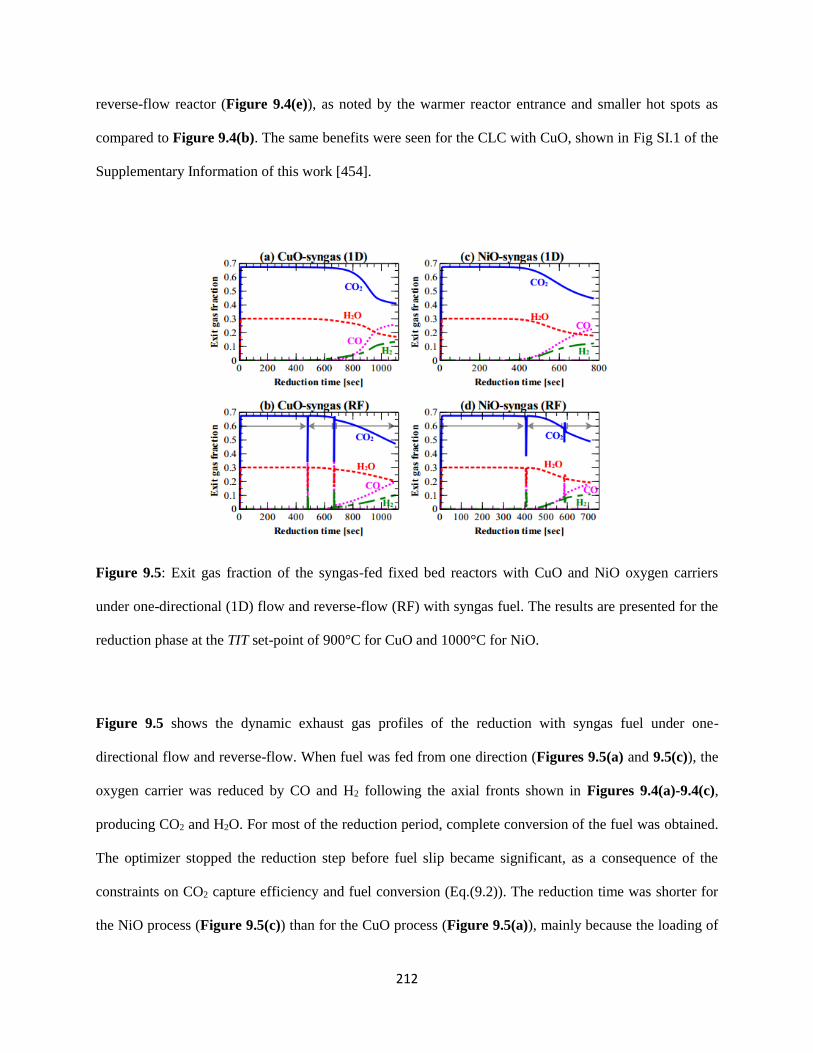
212
reverse-flow reactor (Figure 9.4(e)), as noted by the warmer reactor entrance and smaller hot spots as
compared to Figure 9.4(b). The same benefits were seen for the CLC with CuO, shown in Fig SI.1 of the
Supplementary Information of this work [454].
Figure 9.5: Exit gas fraction of the syngas-fed fixed bed reactors with CuO and NiO oxygen carriers
under one-directional (1D) flow and reverse-flow (RF) with syngas fuel. The results are presented for the
reduction phase at the TIT set-point of 900°C for CuO and 1000°C for NiO.
Figure 9.5 shows the dynamic exhaust gas profiles of the reduction with syngas fuel under one-
directional flow and reverse-flow. When fuel was fed from one direction (Figures 9.5(a) and 9.5(c)), the
oxygen carrier was reduced by CO and H2 following the axial fronts shown in Figures 9.4(a)-9.4(c),
producing CO2 and H2O. For most of the reduction period, complete conversion of the fuel was obtained.
The optimizer stopped the reduction step before fuel slip became significant, as a consequence of the
constraints on CO2 capture efficiency and fuel conversion (Eq.(9.2)). The reduction time was shorter for
the NiO process (Figure 9.5(c)) than for the CuO process (Figure 9.5(a)), mainly because the loading of
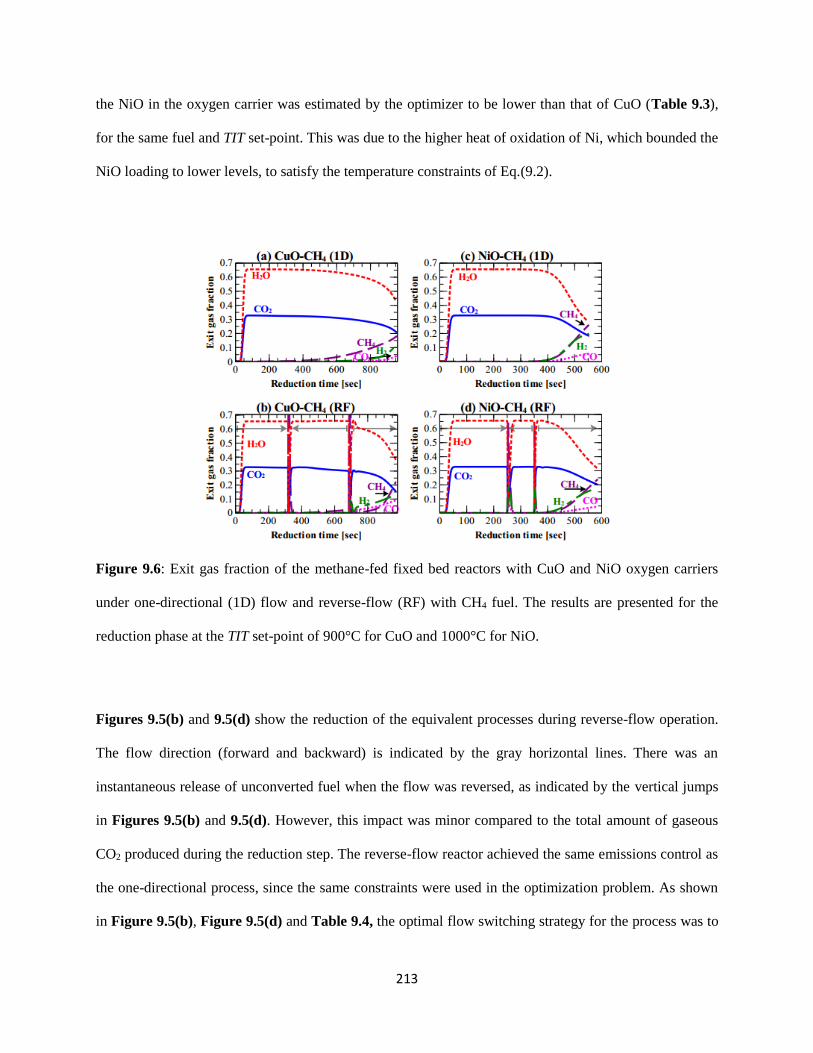
213
the NiO in the oxygen carrier was estimated by the optimizer to be lower than that of CuO (Table 9.3),
for the same fuel and TIT set-point. This was due to the higher heat of oxidation of Ni, which bounded the
NiO loading to lower levels, to satisfy the temperature constraints of Eq.(9.2).
Figure 9.6: Exit gas fraction of the methane-fed fixed bed reactors with CuO and NiO oxygen carriers
under one-directional (1D) flow and reverse-flow (RF) with CH4 fuel. The results are presented for the
reduction phase at the TIT set-point of 900°C for CuO and 1000°C for NiO.
Figures 9.5(b) and 9.5(d) show the reduction of the equivalent processes during reverse-flow operation.
The flow direction (forward and backward) is indicated by the gray horizontal lines. There was an
instantaneous release of unconverted fuel when the flow was reversed, as indicated by the vertical jumps
in Figures 9.5(b) and 9.5(d). However, this impact was minor compared to the total amount of gaseous
CO2 produced during the reduction step. The reverse-flow reactor achieved the same emissions control as
the one-directional process, since the same constraints were used in the optimization problem. As shown
in Figure 9.5(b), Figure 9.5(d) and Table 9.4, the optimal flow switching strategy for the process was to
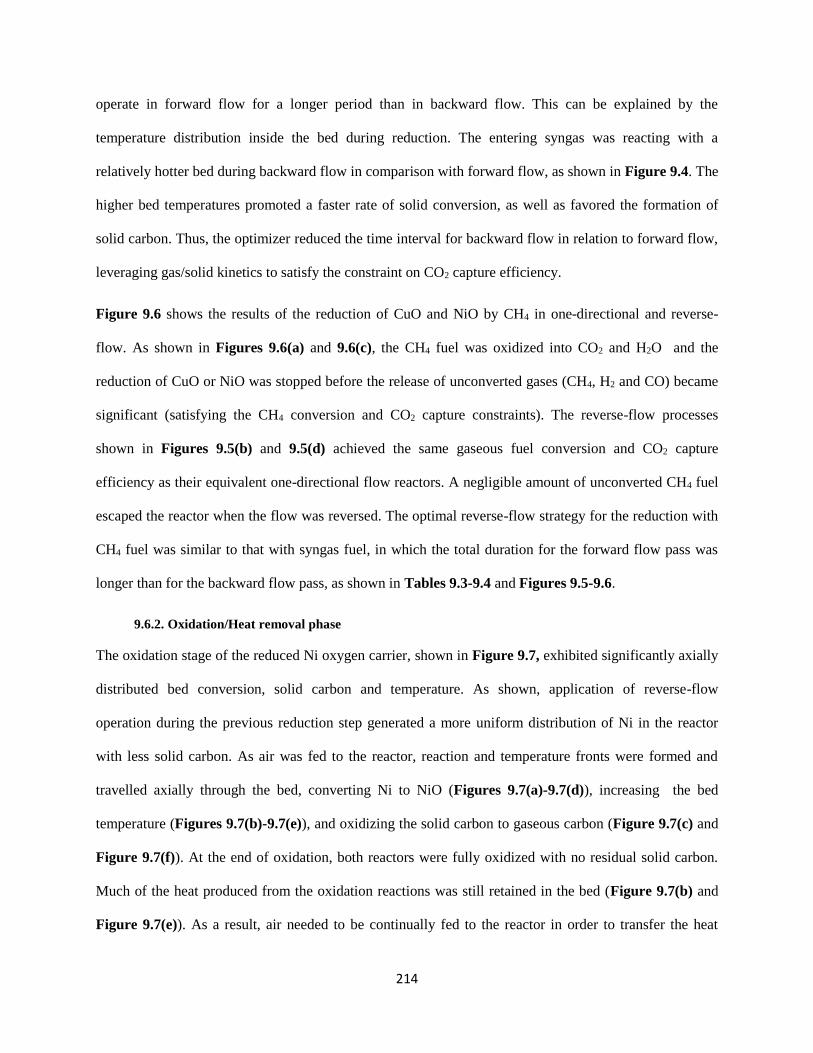
214
operate in forward flow for a longer period than in backward flow. This can be explained by the
temperature distribution inside the bed during reduction. The entering syngas was reacting with a
relatively hotter bed during backward flow in comparison with forward flow, as shown in Figure 9.4. The
higher bed temperatures promoted a faster rate of solid conversion, as well as favored the formation of
solid carbon. Thus, the optimizer reduced the time interval for backward flow in relation to forward flow,
leveraging gas/solid kinetics to satisfy the constraint on CO2 capture efficiency.
Figure 9.6 shows the results of the reduction of CuO and NiO by CH4 in one-directional and reverse-
flow. As shown in Figures 9.6(a) and 9.6(c), the CH4 fuel was oxidized into CO2 and H2O and the
reduction of CuO or NiO was stopped before the release of unconverted gases (CH4, H2 and CO) became
significant (satisfying the CH4 conversion and CO2 capture constraints). The reverse-flow processes
shown in Figures 9.5(b) and 9.5(d) achieved the same gaseous fuel conversion and CO2 capture
efficiency as their equivalent one-directional flow reactors. A negligible amount of unconverted CH4 fuel
escaped the reactor when the flow was reversed. The optimal reverse-flow strategy for the reduction with
CH4 fuel was similar to that with syngas fuel, in which the total duration for the forward flow pass was
longer than for the backward flow pass, as shown in Tables 9.3-9.4 and Figures 9.5-9.6.
9.6.2. Oxidation/Heat removal phase
The oxidation stage of the reduced Ni oxygen carrier, shown in Figure 9.7, exhibited significantly axially
distributed bed conversion, solid carbon and temperature. As shown, application of reverse-flow
operation during the previous reduction step generated a more uniform distribution of Ni in the reactor
with less solid carbon. As air was fed to the reactor, reaction and temperature fronts were formed and
travelled axially through the bed, converting Ni to NiO (Figures 9.7(a)-9.7(d)), increasing the bed
temperature (Figures 9.7(b)-9.7(e)), and oxidizing the solid carbon to gaseous carbon (Figure 9.7(c) and
Figure 9.7(f)). At the end of oxidation, both reactors were fully oxidized with no residual solid carbon.
Much of the heat produced from the oxidation reactions was still retained in the bed (Figure 9.7(b) and
Figure 9.7(e)). As a result, air needed to be continually fed to the reactor in order to transfer the heat
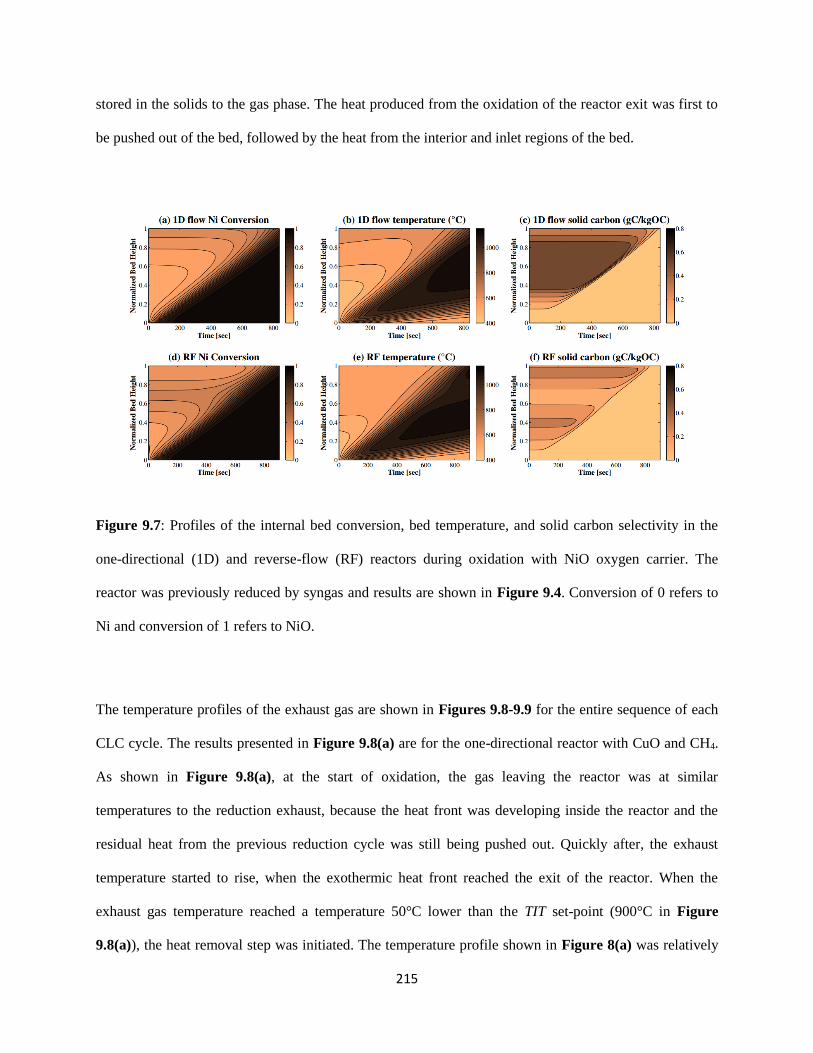
215
stored in the solids to the gas phase. The heat produced from the oxidation of the reactor exit was first to
be pushed out of the bed, followed by the heat from the interior and inlet regions of the bed.
Figure 9.7: Profiles of the internal bed conversion, bed temperature, and solid carbon selectivity in the
one-directional (1D) and reverse-flow (RF) reactors during oxidation with NiO oxygen carrier. The
reactor was previously reduced by syngas and results are shown in Figure 9.4. Conversion of 0 refers to
Ni and conversion of 1 refers to NiO.
The temperature profiles of the exhaust gas are shown in Figures 9.8-9.9 for the entire sequence of each
CLC cycle. The results presented in Figure 9.8(a) are for the one-directional reactor with CuO and CH4.
As shown in Figure 9.8(a), at the start of oxidation, the gas leaving the reactor was at similar
temperatures to the reduction exhaust, because the heat front was developing inside the reactor and the
residual heat from the previous reduction cycle was still being pushed out. Quickly after, the exhaust
temperature started to rise, when the exothermic heat front reached the exit of the reactor. When the
exhaust gas temperature reached a temperature 50°C lower than the TIT set-point (900°C in Figure
9.8(a)), the heat removal step was initiated. The temperature profile shown in Figure 8(a) was relatively
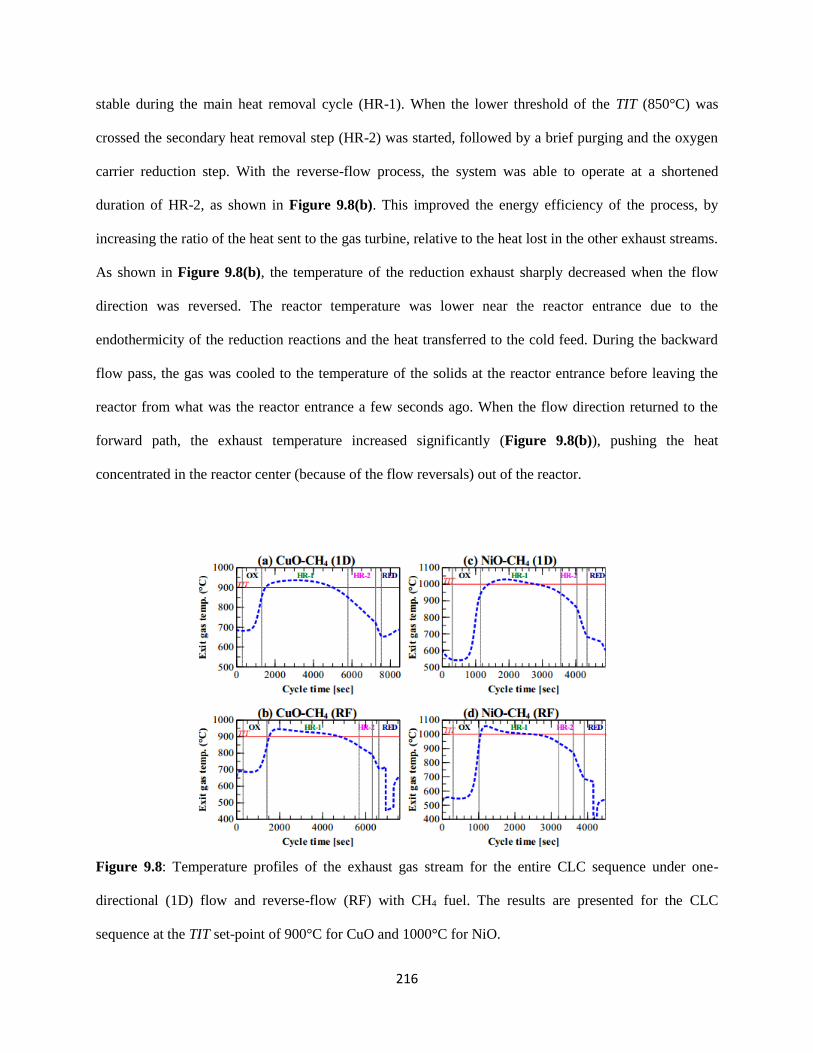
216
stable during the main heat removal cycle (HR-1). When the lower threshold of the TIT (850°C) was
crossed the secondary heat removal step (HR-2) was started, followed by a brief purging and the oxygen
carrier reduction step. With the reverse-flow process, the system was able to operate at a shortened
duration of HR-2, as shown in Figure 9.8(b). This improved the energy efficiency of the process, by
increasing the ratio of the heat sent to the gas turbine, relative to the heat lost in the other exhaust streams.
As shown in Figure 9.8(b), the temperature of the reduction exhaust sharply decreased when the flow
direction was reversed. The reactor temperature was lower near the reactor entrance due to the
endothermicity of the reduction reactions and the heat transferred to the cold feed. During the backward
flow pass, the gas was cooled to the temperature of the solids at the reactor entrance before leaving the
reactor from what was the reactor entrance a few seconds ago. When the flow direction returned to the
forward path, the exhaust temperature increased significantly (Figure 9.8(b)), pushing the heat
concentrated in the reactor center (because of the flow reversals) out of the reactor.
Figure 9.8: Temperature profiles of the exhaust gas stream for the entire CLC sequence under one-
directional (1D) flow and reverse-flow (RF) with CH4 fuel. The results are presented for the CLC
sequence at the TIT set-point of 900°C for CuO and 1000°C for NiO.

217
Figure 9.9: Temperature profiles of the exhaust gas stream for the entire CLC sequence under one-
directional (1D) flow and reverse-flow (RF) with syngas fuel. The results are presented for the CLC
sequence at the TIT set-point of 900°C for CuO and 1000°C for NiO.
Figure 9.8(c) presents the temperature profile for the case study with NiO and CH4 under one-directional
flow. The temperature swing between oxidation and reduction was larger in Figure 9.8(c) than in Figure
9.8(a), because of the higher heat of reaction of Ni/NiO as compared to Cu/CuO and the higher TIT set-
point. A noticeable difference between the one-directional process (Figure 9.8(c)) and the reverse-flow
process (Figure 9.8(d)) was the gas temperature profile at the end of oxidation. The reverse-flow process
had a sharper temperature rise and as a result, the oxidation cycle was shorter and the heat removal cycle
was longer (Figure 9.8(d)). The faster temperature rise indicated a higher rate of reaction during
oxidation, attributed to the higher Ni concentration at the reactor exit, shown previously in Figure 9.4(d).
In the one-directional process, lack of Ni at the reactor exit (shown in Figure 9.4(a)) lowered the
oxidation reaction rate and produced a more gradual temperature rise inside the bed and thus, a slower
rate of change was observed in the exhaust gas temperature of Figure 9.8(c). Furthermore, Tables 9.3-9.4
show that the time interval and air flow flowrate during HR-2 were smaller with the reverse-flow process.
218
These differences yielded higher energy efficiency for the reverse-flow process.
The one-directional CuO process with syngas fuel is shown in Figure 9.9(a). In this case, the optimizer
eliminated the HR-2 cycle completely, by finding a feasible set of cycle conditions that maximize the
temperature uniformity during oxidation. This flat temperature profile for the exhaust stream, was
described in detail in Han and Bollas [374] and is attributed to the slower and less exothermal kinetics in
Cu oxidation. For the CLC with NiO and syngas (Figure 9.9(c)), a small HR-2 step was determined by
the optimizer, to satisfy the requirements on the subsequent reduction cycle. The temperature of the
reduction exhaust of Figure 9.9(a) initially decreased, because the residual heat from oxidation was being
pushed out of the bed, and then increased, due to the exothermic reduction reactions between CuO and
syngas. This heat front produced from the reduction reactions started leaving the reactor at the end of
reduction and ultimately left the reactor after the purging step, shown in Figure 9.9(a). Smaller
temperature fluctuations are shown in Figure 9.9(c) during reduction, because of the lower bed
temperatures at the start of reduction and the low exothermicity of the NiO reduction reactions by syngas.
The performance of the syngas-fed CLC with reverse-flow is shown in Figures 9.9(b) and 9.9Figure
9.9(d). Similar to Figure 9.9(a), the reverse-flow equivalent (Figure 9.9(b)) was able to discharge all of
the heat removal gas to a downstream gas turbine. An advantage of operating in the reverse-flow mode
was the higher air flow rate during HR-1, as shown in Tables 9.3-9.4. Moreover, reverse-flow operation
of the fixed bed reactor with NiO enabled a slight increase in the duration of HR-1, with the same air flow
rate. The gas temperature during HR-1 presented in Figure 9.9(d) has smaller deviations from the TIT
set-point, as compared to the temperature profile of Figure 9.9(c). This was due to the more uniform
temperature rise during oxidation, as a consequence of reversing the gas flow during reduction. In
summary, Figures 9.8-9.9 show that the reactor performance during oxidation and heat removal was
positively influenced from reverse-flow operation during reduction and higher energy efficiency was
feasible.
219
9.6.3. Comparison of system performance between the reverse-flow and one-directional reactor
configurations
The overall system performance was quantified in terms of heat removal efficiency (defined in Eq.(9.1)),
the standard deviation of the exhaust gas temperature during HR-1, 𝜎𝐻𝑅, and the fraction of time the
process is in HR-1, 𝜒𝐻𝑅, defined by the following:
,
{ ( )},HR HR out
T t (9.3)
1
/ .HR HR cycle
(9.4)
The performance coefficients for all of the case studies investigated are summarized in Table 9.5. With
one-directional flow, the maximum 𝜂𝐻𝑅 was for the CLC with NiO oxygen carrier and CH4 fuel at the
TIT set-point of 1100°C. This was in part due to high TIT set-point, forcing the oxidation step to operate
at higher temperatures, producing a higher enthalpy gas to the gas turbine. CLC with CuO at a TIT set-
point of 1100°C is not feasible because the melting point of Cu is 1085°C. A second reason for the high
efficiency of the NiO-CH4 system is that it had a short reduction interval (Table 9.3), minimizing the
extent of lower heat utilization of the reduction exhaust. For similar reasons, CLC with CuO oxygen
carrier and syngas fuel had the lowest calculated 𝜂𝐻𝑅 among the one-directional flow reactors. As shown
in Table 9.5, 𝜒𝐻𝑅 was in the range of 0.43-0.59 for all of the one-directional flow case studies. The
standard deviation of the exhaust gas temperature during HR-1 was less than 26°C for the processes with
one-directional flow.
The energy efficiency was significantly increased when CLC was carried out in a reverse-flow process.
As shown in Table 9.5, for any oxygen carrier, fuel type, and TIT set-point, the reverse-flow process had
a higher 𝜂𝐻𝑅 than the equivalent one-directional case. The most significant improvement in 𝜂𝐻𝑅 was
reported for the CLC with the CuO oxygen carrier and syngas fuel (up to ~30%). NiO-based processes
were improved by ~10% with reverse-flow. Nonetheless, this was still a substantial change, given that the
comparison between the one-directional and reverse-flow reactors was done at their individual optimal
(maximum efficiency) operating conditions. For most of the case studies of Table 9.5, 𝜒𝐻𝑅 was higher in

220
the reverse-flow process. To maximize 𝜂𝐻𝑅, the optimizer could increase the flow rate of air during HR-1,
as well as increase 𝜏𝐻𝑅−1. A higher flow rate of air was not reflected in 𝜒𝐻𝑅 so it was possible for 𝜒𝐻𝑅 to
decrease, even though 𝜂𝐻𝑅 increased. Lastly, the standard deviation of 𝑇𝐻𝑅,𝑜𝑢𝑡(𝑡) was generally higher
with the reverse-flow process. This can be construed as the consequence of sending more heat to the gas
turbine. The maximum temperature fluctuation of the heat removal step was constrained by the dynamic
problem to not exceed 50°C of the TIT set-point, so the deviation of temperature from its set point was
not a problem. In summary, the results of Table 9.5 illustrate that the reverse-flow reactor configuration
was superior to its fixed bed reactor design equivalent. Dynamic optimization is well-suited for process
analysis and comparison of the optimal process conditions and efficiencies feasible in each reactor
configuration.
Table 9.5: Summary of the fixed bed reactor performance under one-directional (1D) flow and reverse-
flow (RF) for the CLC with NiO and CuO oxygen carriers and CH4 and syngas fuels.
NiO with CH4 CuO with CH4
Flow direction 1D RF 1D RF
TIT set-point (°C) 1100 1000 1100 1000 1000 900 1000 900
𝜼𝑯𝑹 0.729 0.703 0.782 0.774 0.668 0.683 0.767 0.780
𝝌𝑯𝑹 0.433 0.491 0.446 0.462 0.512 0.529 0.535 0.545
𝝈𝑯𝑹 (°C) 25.6 23.0 29.7 22.0 23.6 24.9 23.1 26.4
NiO with syngas CuO with syngas
Flow direction 1D RF 1D RF
TIT set-point (°C) 1100 1000 1100 1000 1000 900 1000 900
𝜼𝑯𝑹 0.640 0.685 0.729 0.761 0.555 0.695 0.727 0.736
𝝌𝑯𝑹 0.459 0.481 0.454 0.492 0.455 0.592 0.525 0.633
𝝈𝑯𝑹 (°C) 26.0 24.7 31.9 23.8 13.0 14.8 21.2 13.0

221
9.7. Conclusions
The use of a reverse-flow reactor was explored as a process intensification option to improve the energy
efficiency of chemical-looping combustion systems integrated into a combined cycle power plant.
Periodic flow reversal of the fuel was shown to enhance the contact between the fuel and oxygen carrier,
improve reactor bed temperature and conversion uniformity, and suppress carbon deposition. We
addressed the operational challenges of the batch fixed bed CLC reactor using a model-based approach,
focused on optimizing the cycle strategy for maximum process efficiency. We compared the optimal
reverse-flow process against its optimized counterpart of CLC of methane and syngas fuels with Cu- and
Ni-based oxygen carriers. This analysis showed that operating a fixed bed CLC reactor in the reverse-
flow mode can be effective in increasing the power generation efficiency of a downstream gas turbine
cycle. This fixed bed design avoids the issue of attrition and gas-solid separation typically found in
circulating fluidized bed units. Furthermore, the simplicity of this process makes it easily applicable to
existing bench-scale units without considerably complicated equipment.
222
Chapter 10 A NOVEL SIMULATED MOVING BED PROCESS FOR CHEMICAL-LOOPING
COMBUSTION
A simulated moving bed process is explored for chemical-looping combustion (CLC). Countercurrent
movement of gases and solids is simulated by continuously moving the feed point along the axial
direction of the reactor bed. Application of this novel reactor concept to CLC with NiO and CH4 fuel
shows an increase in CO2 capture efficiency, bed utilization, and temperature uniformity, compared to a
conventional fixed bed reactor.
10.1. Introduction
Simulated moving bed (SMB) chromatography has been gaining more attention since its emergence in the
1930s. Its applications include sugar, petrochemical, and pharmaceutical separations [455]. SMB
chromatography has become one of the preferred techniques for the separation of the enantiomers of a
chiral compound [456]. Several active pharmaceutical ingredients, including blockbuster drugs, are
manufactured using the SMB technology.
The basic principle of the SMB technology is the simulated counter-current movement between the solid
and the liquid phases. Due to different adsorptions affinities of the two feed components, the more
retained one moves toward the extract outlet, while the other (less retained) moves toward the raffinate
outlet. The SMB process overcomes the technical problems associated with a true moving bed, wherein it
is necessary to move both the fluid and solid phases. Circulation of the solid phase was reported to cause
technical problems, including mechanical erosion of the adsorbent (which leads to the formation of fines
and high-pressure drops), equipment abrasion, and difficulty in maintaining plug flow for the solids [457].
In the SMB, the counter-current movement is created by dynamically shifting the inlet and outlet ports in
the same direction of the fluid flow, without circulation of the solid phase.
For CLC applications, a moving bed process was proposed by Fan and Li [458] to fully convert the Fe2O3
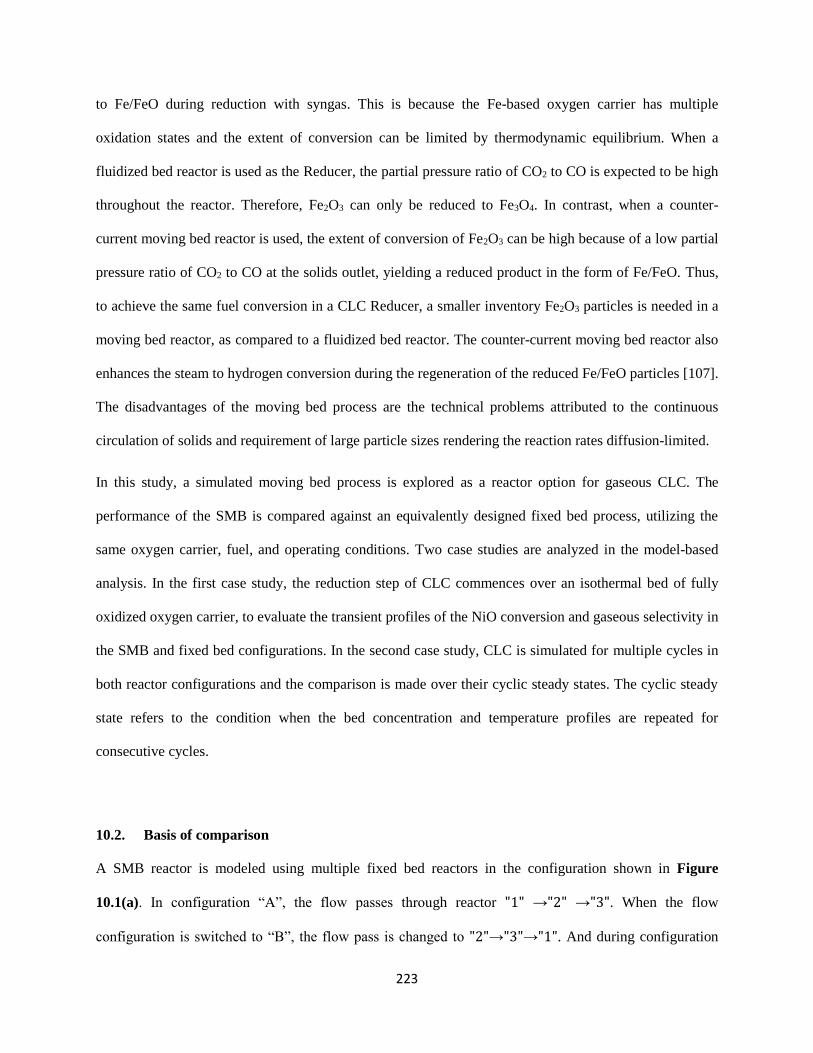
223
to Fe/FeO during reduction with syngas. This is because the Fe-based oxygen carrier has multiple
oxidation states and the extent of conversion can be limited by thermodynamic equilibrium. When a
fluidized bed reactor is used as the Reducer, the partial pressure ratio of CO2 to CO is expected to be high
throughout the reactor. Therefore, Fe2O3 can only be reduced to Fe3O4. In contrast, when a counter-
current moving bed reactor is used, the extent of conversion of Fe2O3 can be high because of a low partial
pressure ratio of CO2 to CO at the solids outlet, yielding a reduced product in the form of Fe/FeO. Thus,
to achieve the same fuel conversion in a CLC Reducer, a smaller inventory Fe2O3 particles is needed in a
moving bed reactor, as compared to a fluidized bed reactor. The counter-current moving bed reactor also
enhances the steam to hydrogen conversion during the regeneration of the reduced Fe/FeO particles [107].
The disadvantages of the moving bed process are the technical problems attributed to the continuous
circulation of solids and requirement of large particle sizes rendering the reaction rates diffusion-limited.
In this study, a simulated moving bed process is explored as a reactor option for gaseous CLC. The
performance of the SMB is compared against an equivalently designed fixed bed process, utilizing the
same oxygen carrier, fuel, and operating conditions. Two case studies are analyzed in the model-based
analysis. In the first case study, the reduction step of CLC commences over an isothermal bed of fully
oxidized oxygen carrier, to evaluate the transient profiles of the NiO conversion and gaseous selectivity in
the SMB and fixed bed configurations. In the second case study, CLC is simulated for multiple cycles in
both reactor configurations and the comparison is made over their cyclic steady states. The cyclic steady
state refers to the condition when the bed concentration and temperature profiles are repeated for
consecutive cycles.
10.2. Basis of comparison
A SMB reactor is modeled using multiple fixed bed reactors in the configuration shown in Figure
10.1(a). In configuration “A”, the flow passes through reactor "1" →"2" →"3". When the flow
configuration is switched to “B”, the flow pass is changed to "2"→"3"→"1". And during configuration
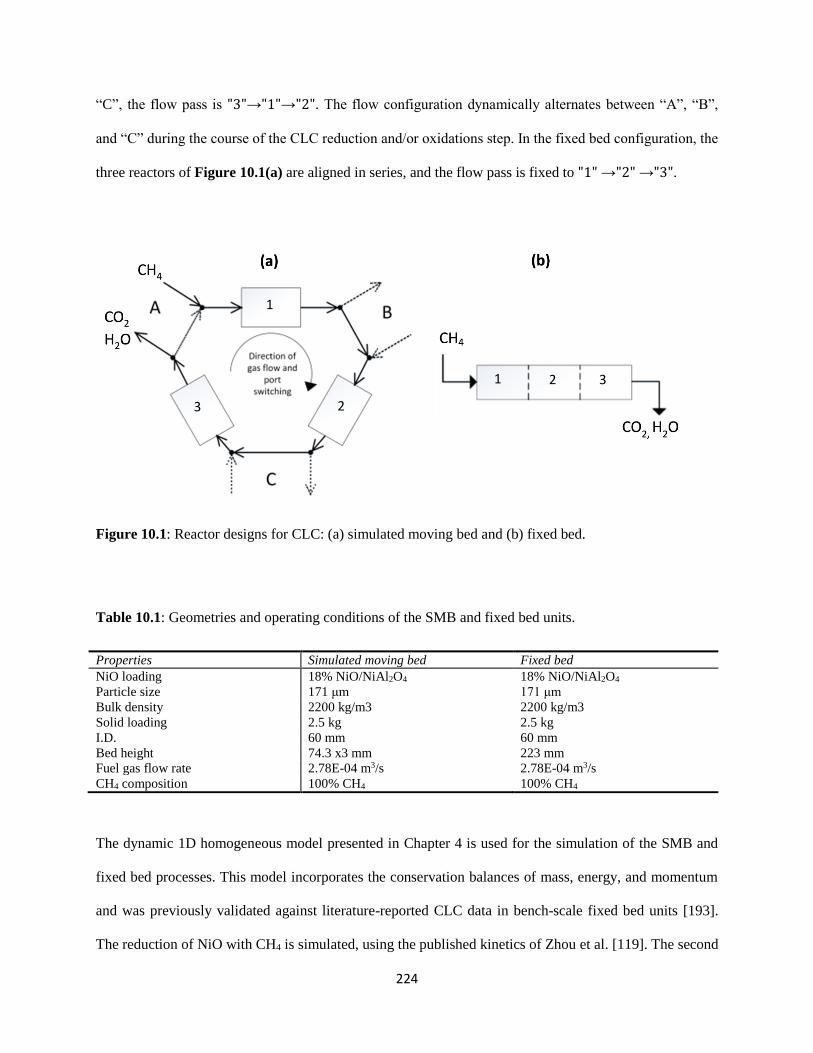
224
“C”, the flow pass is "3"→"1"→"2". The flow configuration dynamically alternates between “A”, “B”,
and “C” during the course of the CLC reduction and/or oxidations step. In the fixed bed configuration, the
three reactors of Figure 10.1(a) are aligned in series, and the flow pass is fixed to "1" →"2" →"3".
Figure 10.1: Reactor designs for CLC: (a) simulated moving bed and (b) fixed bed.
Table 10.1: Geometries and operating conditions of the SMB and fixed bed units.
Properties Simulated moving bed Fixed bed
NiO loading 18% NiO/NiAl2O4 18% NiO/NiAl2O4
Particle size 171 μm 171 μm
Bulk density 2200 kg/m3 2200 kg/m3
Solid loading 2.5 kg 2.5 kg
I.D. 60 mm 60 mm
Bed height 74.3 x3 mm 223 mm
Fuel gas flow rate 2.78E-04 m3/s 2.78E-04 m3/s
CH4 composition 100% CH4 100% CH4
The dynamic 1D homogeneous model presented in Chapter 4 is used for the simulation of the SMB and
fixed bed processes. This model incorporates the conservation balances of mass, energy, and momentum
and was previously validated against literature-reported CLC data in bench-scale fixed bed units [193].
The reduction of NiO with CH4 is simulated, using the published kinetics of Zhou et al. [119]. The second
2 3
1 2 3
1

225
column of Table 10.1 lists the design of the fixed bed reactor. To simulate a SMB that is comparable to
the fixed bed, the original fixed bed is divided into three units, by simplying shortening the bed length by
a third. Thus, the SMB reactor in total has the same solids inventory, as the original fixed bed (Table
10.1).
10.3. Results and discussion
The performance of the simulated moving bed reactor was compared to its fixed bed counterpart in terms
of CH4 conversion, CO2 capture efficiency, oxygen carrier conversion and selectivity to solid carbon. The
reactor temperature profiles were also explored to identify potential advantages in heat utilization.
10.3.1. Case study I: Isothermal conditions
Implementation of the SMB process yields numerous benefits over its comparable fixed bed design with a
negligible sacrifice to fuel conversion, shown in Figure 10.2(a). First, the SMB achieves higher CO2
selectivity at higher bed-averaged NiO conversions (Figure 10.2(b)). As the inlet and outlet ports were
switched along the length of the reactor, the inlet feed was constantly introduced to fresh oxygen carrier
particle, which promoted the conversion of CH4 to CO2 and suppressed the catalytic reactions that yielded
partial oxidation products. As a result, a second benefit is the reduction in carbon deposition during the
reduction cycle. A comparison of the SMB design to the fixed bed design is shown in Figure 10.2(c). By
recycling the combustion products (i.e., CO2 and H2O) through the NiO-depleted regions of the reactor,
any solid carbon formed previously could be gasified to CO and H2.
Another advantage of the SMB process was the mitigation of cold spots inside the reactor, as shown in
Figure 10.3. The reduction of NiO by CH4 is generally endothermic, so the temperature of the bed
decreases when fuel reacts with NiO. However in the SMB configuration, the reaction zone covers a
larger reactor area, so the extent of the temperature fluctuations was reduced and circulation of hot gases
within the reduced zones further warmed up the bed Figure 10.3.
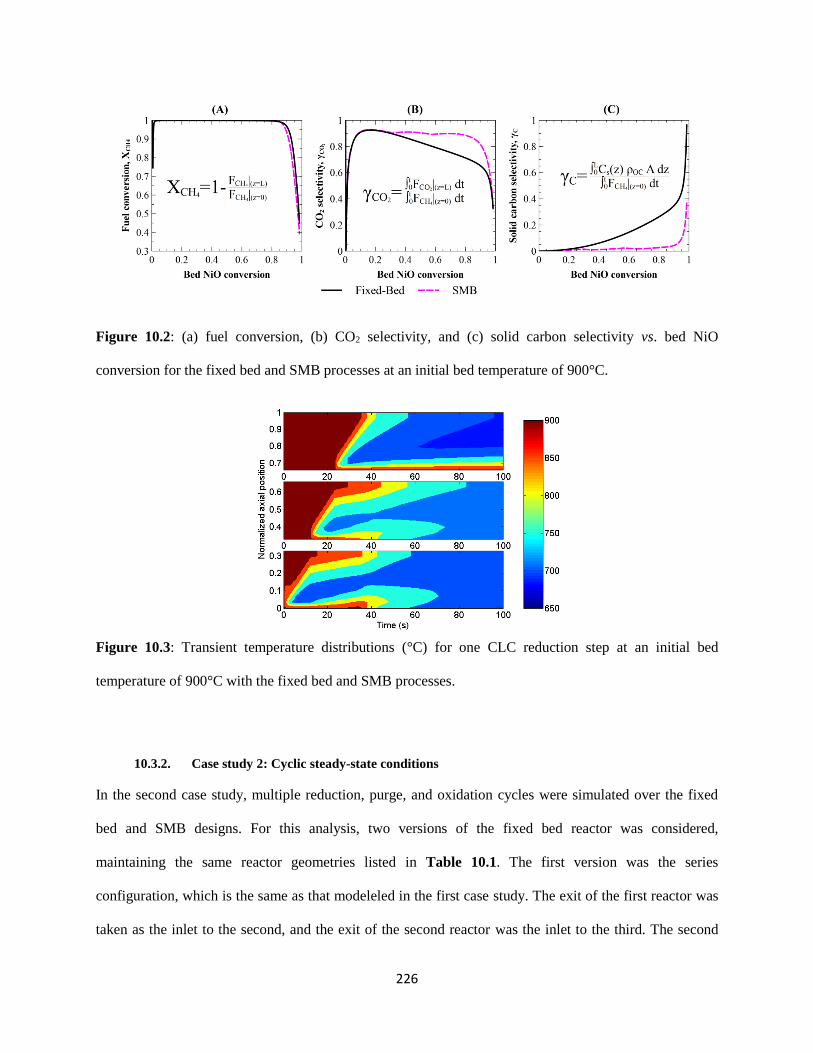
226
Figure 10.2: (a) fuel conversion, (b) CO2 selectivity, and (c) solid carbon selectivity vs. bed NiO
conversion for the fixed bed and SMB processes at an initial bed temperature of 900°C.
Figure 10.3: Transient temperature distributions (°C) for one CLC reduction step at an initial bed
temperature of 900°C with the fixed bed and SMB processes.
10.3.2. Case study 2: Cyclic steady-state conditions
In the second case study, multiple reduction, purge, and oxidation cycles were simulated over the fixed
bed and SMB designs. For this analysis, two versions of the fixed bed reactor was considered,
maintaining the same reactor geometries listed in Table 10.1. The first version was the series
configuration, which is the same as that modeleled in the first case study. The exit of the first reactor was
taken as the inlet to the second, and the exit of the second reactor was the inlet to the third. The second
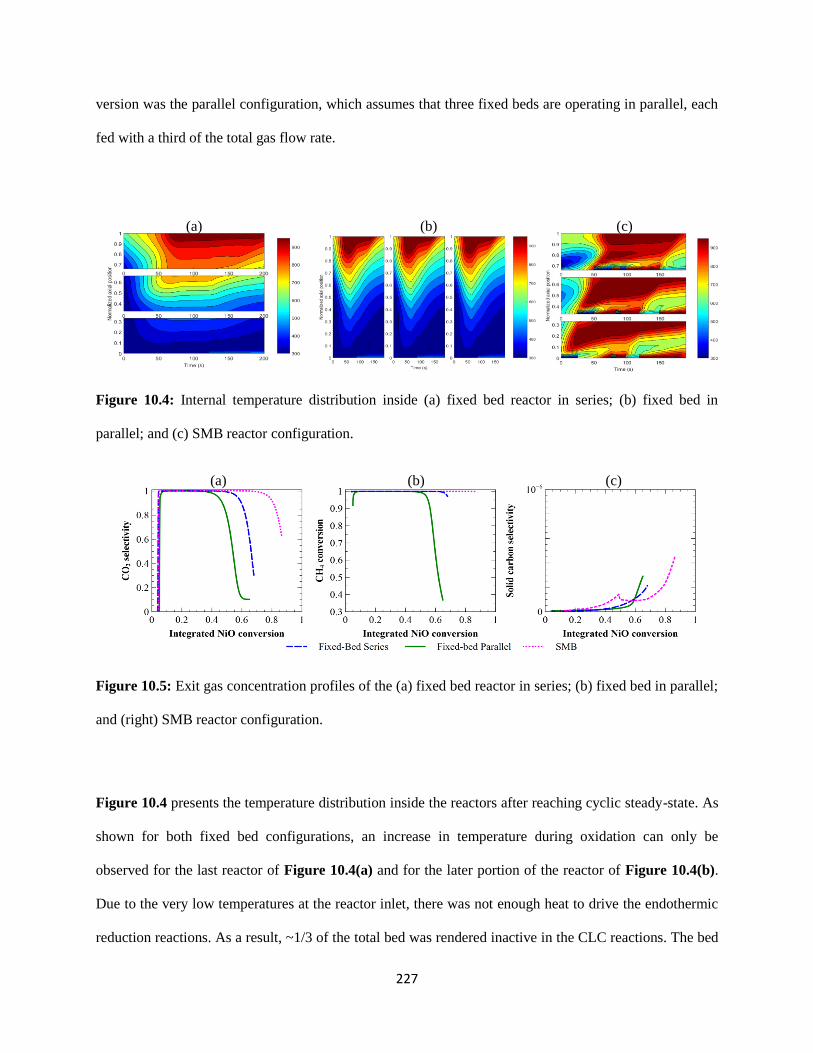
227
version was the parallel configuration, which assumes that three fixed beds are operating in parallel, each
fed with a third of the total gas flow rate.
Figure 10.4: Internal temperature distribution inside (a) fixed bed reactor in series; (b) fixed bed in
parallel; and (c) SMB reactor configuration.
Figure 10.5: Exit gas concentration profiles of the (a) fixed bed reactor in series; (b) fixed bed in parallel;
and (right) SMB reactor configuration.
Figure 10.4 presents the temperature distribution inside the reactors after reaching cyclic steady-state. As
shown for both fixed bed configurations, an increase in temperature during oxidation can only be
observed for the last reactor of Figure 10.4(a) and for the later portion of the reactor of Figure 10.4(b).
Due to the very low temperatures at the reactor inlet, there was not enough heat to drive the endothermic
reduction reactions. As a result, ~1/3 of the total bed was rendered inactive in the CLC reactions. The bed
(a) (b) (c)
(a) (b) (c)

228
utilization was significantly improved with the SMB process of Figure 10.4(c). Starting from oxidation,
the temperature rise inside the reacor prevailed over a much larger area, which indicated that reduction
was more favorable in the SMB design. By heating the bed uniformly, the reduction cycle was able to
enjoy higher kinetics and greater bed conversion.
The gas and solid selectivities for the corresponding simulation results are shown in Figure 10.5. The
fixed bed process in series has a better reduction performance than the fixed bed in parallel, indicated by
the higher CO2 selectivity and fuel conversion. This can be the result of the lack of optimality in reactor
design for the reactors in parallel. With the SMB design, a high CO2 selectivity can be sustained for
longer NiO bed conversions. This was shown previously in Section 10.3.1. The SMB process was also
able to partially gasify the deposited carbon in the reactor (Figure 10.5(c)). From the results of Figures
10.2-10.5, it is revealed that the SMB process delivers better CLC performance than the fixed bed reactor.
10.4. Conclusions
A simulated moving bed (SMB) reactor was proposed for CLC. This design avoids the issues of attrition
and gas/solid separation, can accommodate a wide range of particle sizes, and be pressurized, just like the
fixed bed design. A model-based analysis was carried out to analyze the performance of the SMB, in
comparison with an equivalently designed fixed bed reactor. The SMB reactor was shown to have higher
bed utilization and CO2 capture efficiency than the fixed bed process. Thus, the simulated moved bed
reactor design was shown to be promising option for CLC applications and future work is aimed at
process design and optimization studies of the novel reactor design.

229
Chapter 11 CONCLUSIONS AND RECOMMENDATIONS
11.1. Concluding remarks
Chemical-looping technologies offer the potential to lower the cost of CO2 capture for thermal power
plants. This purpose of this thesis was to apply process engineering methodologies to accelerate the
deployment of chemical-looping combustion (CLC) technologies. The key steps in this dissertation were:
(1) the development and validation of process models that capture the hydrodynamics and kinetics of
CLC reactors through optimal experimental design, (2) dynamic optimization of CLC reactor
configurations for seamless integration with a downstream power cycle, and (3) proposition of the
reverse-flow and simulated moving bed reactor configurations as process intensification options for
commercial CLC systems.
In Chapter 1, the motivation for Carbon Capture and Sequestration (CCS) technologies was discussed as a
necessary measure to make significant reductions in anthropogenic CO2 emissions. The conventional CO2
capture methods, including pre-combustion, oxy-fuel combustion, and post-combustion technologies, are
well-established but they are highly energy intensive and thus significantly reduce the thermal efficiency
of the power plant. Chemical-looping combustion (CLC) has emerged as one of the most promising
technologies to deliver low-cost CO2 capture. Chapter 2 surveyed the main research topics on CLC,
covering the areas of oxygen carrier development, candidate reactor designs, kinetics and reactor
modeling, and process design and integration. Based on the current literature, synthetic Ni and Cu-based
oxygen carriers are suitable for CLC due to their intrinsic fast reaction rates. However, large-scale
application of these oxygen carriers in the widely recognized fluidized bed reactor configuration is not
practical, as the plant economics would quickly become unfavorable due to particle attrition. Moreover,
the CLC reactor system needs to withstand the high temperatures and pressures of the power plant, which
is not feasible in the current fluidized bed reactor configurations. Combined cycle power plants are
preferred due to their high plant efficiencies, low-cost, high flexibility, and fast start-up. At the present,
research is on-going to design and simulate fluidized bed reactors capable of withstanding the operation
230
of combined cycles. An alternative reactor configuration is needed in the immediate future to fulfill the
gap in integrating CLC with combined cycle power plants.
To accurately design power systems integrated with CLC and estimate efficiencies, high-fidelity process
models are required. Chapters 3-6 were focused on the development of accurate process and kinetic
models that are capable of simulating CLC experimental data. Chapter 3 details the experimental
procedure to prepare oxygen carriers, test their reactivity in a bench-scale fixed bed reactor and thermo-
gravimetric analyzer, and analyze their structural and textural properties using SEM, BET, and XRD. In
Chapters 4-5, a heterogeneous reactor/particle model was developed and used to describe experimental
data reported in the literature. It was shown that in ideal cases, where the particle size was sufficiently
small and isothermal and plug flow conditions were met, a homogeneous reactor model was sufficient to
characterize the observed trends in gas profiles. However, these models are limited in terms of their scope
because they are not suitable for representing large-scale systems, which are typically non-isothermal,
limited by intraparticle diffusion limitations, and exhibit strong axial or radial dispersion forces. The
developed heterogeneous model was demonstrated to be more accurate than the homogeneous models in
representing the experimental data in cases of large particle sizes, significant dispersion, and temperature
non-uniformities. Thus, this heterogeneous model was used in later studies, to better capture the
hydrodynamics inside the CLC reactor.
In Chapter 6, a model-based framework coupling structural identifiability analysis and optimal design of
experiments was presented and applied to address the controversies and discrepancies existing in the CLC
kinetics. Specifically, the reduction kinetics between NiO and CH4 was analyzed, in which there exists
160 different combinations of kinetic models of various reaction networks, kinetic mechanisms, and
solid-state reaction models. First, structural identifiability and model distinguishability analyses were
used to reject model structures on the basis of poor statistical significance in their kinetic parameters and
lack of distinguishability from different model structures. Four suitable models were systematically
identified from the preliminary analysis, and then further evaluated by optimal experimental design
231
techniques. Optimal designs for model discrimination were proposed and executed to determine a true
model structure for the reaction kinetics of the CH4-NiO system. The kinetic parameters of the true model
were estimated with statistical significance, from experiments aimed at reducing parameter uncertainty.
The final model was demonstrated to have predictive capabilities outside of the design space from which
its parameters were derived. The kinetics resulting from this work (Chapters 3-6) was validated and
suitable for application in process design and optimization.
In Chapter 7, an optimization framework was formulated to guide the design and operation of large-scale
CLC reactors for the integration into power plants. A high-pressure fixed bed reactor was selected as a
case study of the approach, to optimally integrate batch processes for power generation applications. The
objective was to maximize the potential of the CLC reactor to produce a high quality gas stream suitable
for a downstream gas turbine, taking into account the constraints on the system performance during
reduction and oxidation and the requirements imposed by the power plant. Through several cases, it was
shown that the reactor operating with the optimal cycle configuration was able to reach higher energy
efficiencies than the baseline design. The analysis was extended to consider a system of fixed bed reactors
operated in parallel. It was found that through the combination of multiple reactors, the extent of stream
fluctuations sent to the gas turbine was further reduced. However, fluctuations of the lower quality
streams prevailed and this impact should be analyzed by dynamically simulating the power plant.
Novel reactor concepts for CLC were presented in Chapters 8-10. In Chapter 8, a reverse-flow reactor
was proposed, as a method of improving the gas/solid contact in the fixed bed reactor. For the modeling
of industrial-scale reactors, a dusty-gas model was presented, to capture the mass/heat transport
phenomena in concentrated gas/solid flows. This concept was analyzed for the CLC reduction of NiO
with CH4 in Chapter 8. The performance of the reverse-flow reactor was shown to have superior bed
conversion and temperature uniformity, higher CO2 capture efficiency, and suppressed carbon deposition,
compared to their equivalent one-directional fixed bed reactors (Chapter 8). In Chapter 9, dynamic
optimization of the cycling procedure was carried out to maximize the efficiency of the reverse-flow
232
reactor. The results from the comparative analysis showed that it was feasible to increase the energy
efficiency of the process, by implementing CLC in the reverse-flow mode. The benefits of the reverse-
flow operation were reported for several cases of CLC of NiO and CuO oxygen carriers with methane and
syngas feedstocks. In Chapter 10, a simulated moving bed reactor concept was proposed as a superior
alternative to the fixed reactor configuration. The simulated moving bed reactor has the potential to
overcome the axial conversion fronts of the fixed bed reactor, limiting the bed utilization in the CLC
cycles. The results of the model-based analysis showed that the simulated moving bed reactor was able to
deliver a superior CO2 capture efficiency and better bed utilization, compared to an equivalently designed
fixed bed reactor. Future work is needed to compare the energy efficiency of the simulated moving bed
reactor with that of the reverse-flow reactor.
11.2. Recommendations
The conclusions drawn from this work clearly illustrate that chemical-looping combustion can prove to be
a ground breaking technology for highly efficient power generation with CO2 capture. However,
alongside the promising features of CLC, there also exists a number of technological barriers that must be
overcome before a CLC-power plant can be realized. The recommendations given in this section will help
the CLC-community in optimizing the design and operation of CLC reactor systems and investigate the
real efficiency penalty of CO2 capture.
11.2.1. Optimal reactor scale-up
CLC systems should be designed to always provide a high fuel conversion to CO2 efficiency, regardless
of fluctuations in the gas feedstocks, process conditions, and oxygen carrier properties. Current methods
of scaling up bench-scale reactors involve the use of simple scaling factors and “rules-of-thumb.” Model-
based techniques are used in other fields, such as catalytic reforming, but not widely implemented in CLC
applications. As an extension of previous work on optimal experimental design (Chapter 6), the following
optimization problem is presented to minimize the sensitivity of the product conversion and selectivity to
233
changes in the process conditions. Simply, this problem seeks a reactor design that can provide high
conversions of fuel to CO2, under uncertainty in the system inputs:
0
min max
( , )
,( ) [0
arg max det
ˆ. . ( ), ( ), ( ), , 0,
ˆ, ],
s t t t t
t tt t
t
φ ΦV ζ φ
θ
φ
y h xu u u
f x x u (11.1)
where 𝐕𝜁(𝛇, 𝛟) is the inverse of the information matrix, composed of the dynamic sensitivities of the
reactor efficiencies 𝛇 with respect to the reactor design 𝛟. The objective function of Eq.(11.1) is
essentially the opposite of the D-optimal design problem, which seeks a design that maximizes the
observances of the model parameters. The solution of Eq.(11.1) is the CLC reactor design that is
suggested for process design analysis. Constraints can be incorporated in Eq.(11.1) to force the system,
for instance, to always operate at high CO2 capture efficiencies or low pressure drops.
11.2.2. Comparative analysis of reactor options for CLC
It is necessary to estimate the investment cost and the operational costs for a power plant with CLC. Thus,
an optimized CLC reactor configuration should be considered in the preliminary design of a CLC-based
power plant. This thesis discussed two main reactor candidates for CLC, (a) fluidized bed and (b) fixed
bed, and proposed two novel reactor concepts, (c) reverse-flow reactor and (d) simulated moving bed
reactor. A comparison should be made between all of the reactor options. In this work, optimization
problems were formulated and used for the comparison between the reverse-flow reactor and the
conventional fixed bed reactor. In the future, similar optimization problems should be solved to compare
the optimal process conditions and efficiencies feasible in each reactor configuration.
A generic optimization problem for the CLC reactor is written as:
max
. . ( ( ), ( ), ( ), ) 0,( ( ), ( ), ( ), ) 0,
J
s t t t tt t t
φ Φ
f x x u θg x x u θ
(11.2)
where J is the performance index to the maximized, x is the vector of state variables, u(t) is the vector of
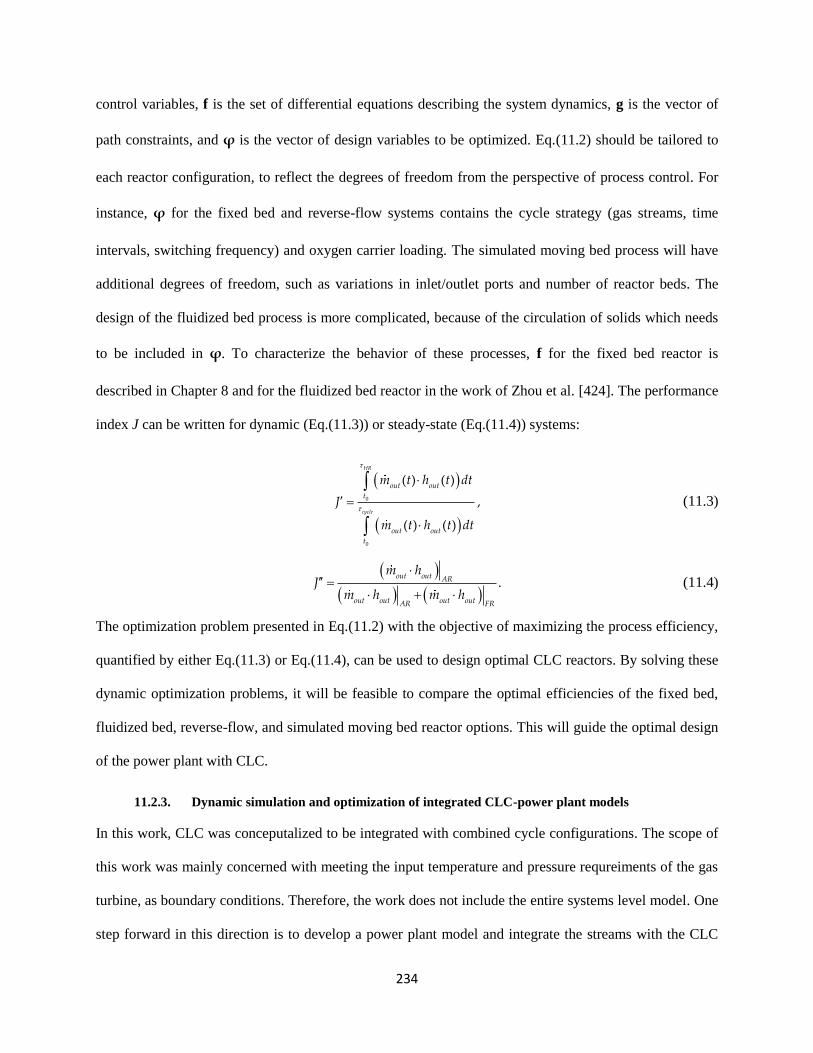
234
control variables, f is the set of differential equations describing the system dynamics, g is the vector of
path constraints, and φ is the vector of design variables to be optimized. Eq.(11.2) should be tailored to
each reactor configuration, to reflect the degrees of freedom from the perspective of process control. For
instance, φ for the fixed bed and reverse-flow systems contains the cycle strategy (gas streams, time
intervals, switching frequency) and oxygen carrier loading. The simulated moving bed process will have
additional degrees of freedom, such as variations in inlet/outlet ports and number of reactor beds. The
design of the fluidized bed process is more complicated, because of the circulation of solids which needs
to be included in φ. To characterize the behavior of these processes, f for the fixed bed reactor is
described in Chapter 8 and for the fluidized bed reactor in the work of Zhou et al. [424]. The performance
index J can be written for dynamic (Eq.(11.3)) or steady-state (Eq.(11.4)) systems:
0
0
( ) ( )
,
( ) ( )
HR
cycle
out out
t
out out
t
m t h t dt
J
m t h t dt
(11.3)
.
out out AR
out out out outAR FR
m hJ
m h m h (11.4)
The optimization problem presented in Eq.(11.2) with the objective of maximizing the process efficiency,
quantified by either Eq.(11.3) or Eq.(11.4), can be used to design optimal CLC reactors. By solving these
dynamic optimization problems, it will be feasible to compare the optimal efficiencies of the fixed bed,
fluidized bed, reverse-flow, and simulated moving bed reactor options. This will guide the optimal design
of the power plant with CLC.
11.2.3. Dynamic simulation and optimization of integrated CLC-power plant models
In this work, CLC was conceputalized to be integrated with combined cycle configurations. The scope of
this work was mainly concerned with meeting the input temperature and pressure requreiments of the gas
turbine, as boundary conditions. Therefore, the work does not include the entire systems level model. One
step forward in this direction is to develop a power plant model and integrate the streams with the CLC
235
reactor network. There is a variety of combined cycle configurations that can be assessed, with several
options for the gas turbine technology, intercooling method, steam cycle configuration, and reheat cycles.
These cycle configurations should be optimized with respect to these key parameters to order to maximize
plant efficiencies and CO2 capture.
Furthermore, the dynamic behavior of CLC should be analyzed with respect to the power plant. Dynamic
analysis for the CLC-combined cycles is necessary, as the CLC reactor system is batch-operated and the
power plant as a whole must constantly meet a time-varying electricity demand. To achieve this, it
requires a modeling plaftform that offers the ability to conduct dynamic simulations, which is provided in
software packages such as gPROMS and Modelica. It must be assured that the fluctuations of the CLC
reactor exhaust do not lead to runaway behavior and allow the power plant to operate within safety and
process limits. With a dynamically changing power plant, it becomes feasible to utilize the model for real-
time optimization, with the objective of maintaining a high electrical efficiency and high CO2 capture.
The recommended research activities will provide a framework for the quantification of the real cost for
CO2 capture, which can be later levarged to address the increasing challenges of fossil fuels use.
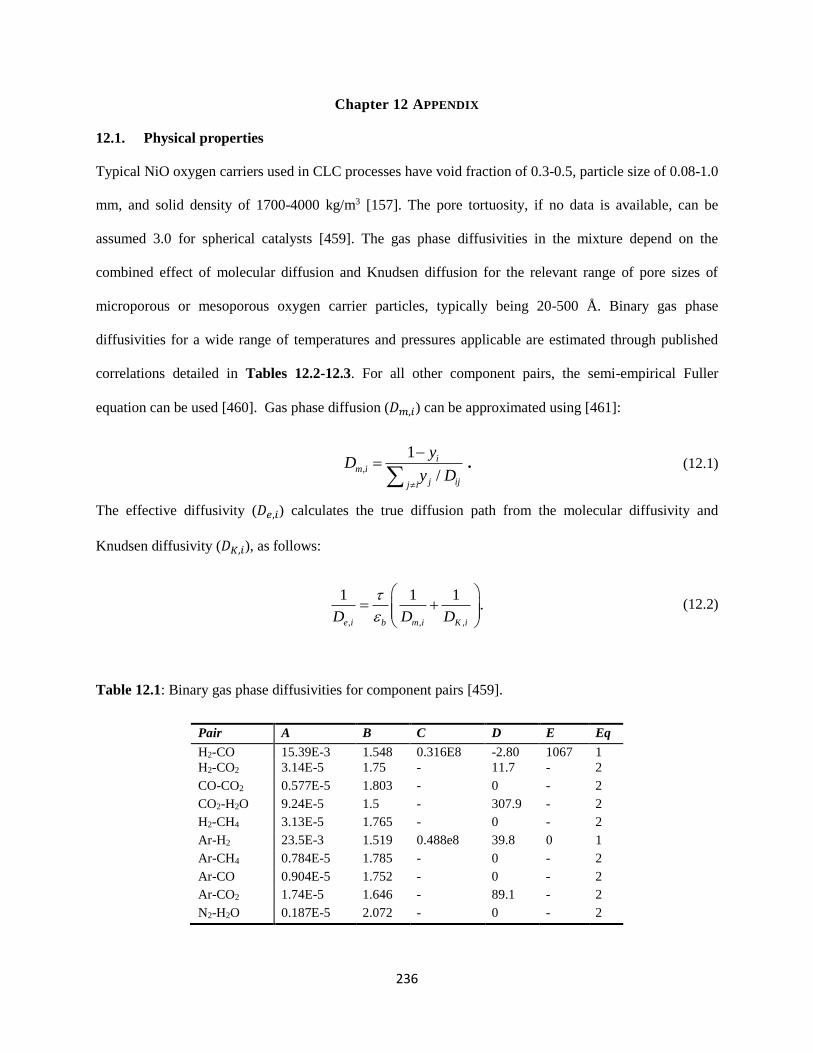
236
Chapter 12 APPENDIX
12.1. Physical properties
Typical NiO oxygen carriers used in CLC processes have void fraction of 0.3-0.5, particle size of 0.08-1.0
mm, and solid density of 1700-4000 kg/m3 [157]. The pore tortuosity, if no data is available, can be
assumed 3.0 for spherical catalysts [459]. The gas phase diffusivities in the mixture depend on the
combined effect of molecular diffusion and Knudsen diffusion for the relevant range of pore sizes of
microporous or mesoporous oxygen carrier particles, typically being 20-500 Å. Binary gas phase
diffusivities for a wide range of temperatures and pressures applicable are estimated through published
correlations detailed in Tables 12.2-12.3. For all other component pairs, the semi-empirical Fuller
equation can be used [460]. Gas phase diffusion (𝐷𝑚,𝑖) can be approximated using [461]:
,
1
/
im i
j ijj i
yD
y D
. (12.1)
The effective diffusivity (𝐷𝑒,𝑖) calculates the true diffusion path from the molecular diffusivity and
Knudsen diffusivity (𝐷𝐾,𝑖), as follows:
, , ,
1 1 1.
e i b m i K iD D D
(12.2)
Table 12.1: Binary gas phase diffusivities for component pairs [459].
Pair A B C D E Eq
H2-CO 15.39E-3 1.548 0.316E8 -2.80 1067 1
H2-CO2 3.14E-5 1.75 - 11.7 - 2
CO-CO2 0.577E-5 1.803 - 0 - 2
CO2-H2O 9.24E-5 1.5 - 307.9 - 2
H2-CH4 3.13E-5 1.765 - 0 - 2
Ar-H2 23.5E-3 1.519 0.488e8 39.8 0 1
Ar-CH4 0.784E-5 1.785 - 0 - 2
Ar-CO 0.904E-5 1.752 - 0 - 2
Ar-CO2 1.74E-5 1.646 - 89.1 - 2
N2-H2O 0.187E-5 2.072 - 0 - 2
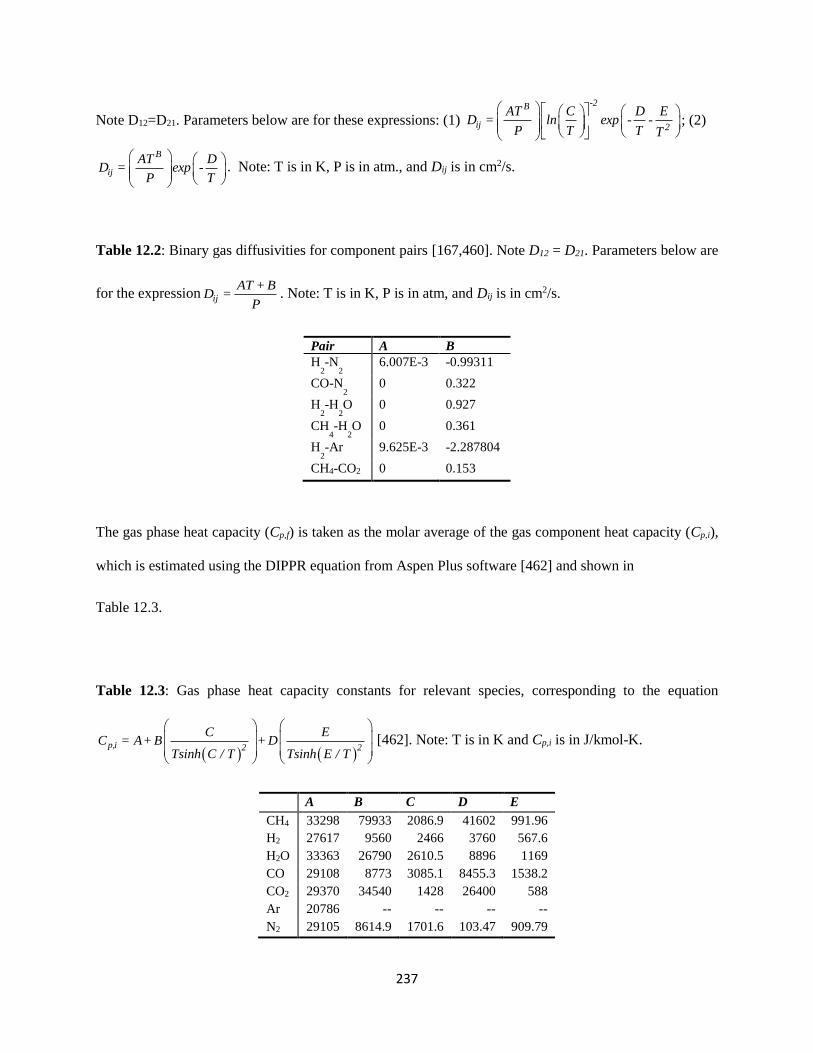
237
Note D12=D21. Parameters below are for these expressions: (1)
-2B
ij 2
AT C D ED = ln exp - -
P T T T
; (2)
B
ij
AT DD = exp -
P T
. Note: T is in K, P is in atm., and Dij is in cm2/s.
Table 12.2: Binary gas diffusivities for component pairs [167,460]. Note D12 = D21. Parameters below are
for the expression ij
AT + BD =
P. Note: T is in K, P is in atm, and Dij is in cm2/s.
Pair A B
H2-N
2 6.007E-3 -0.99311
CO-N2 0 0.322
H2-H
2O 0 0.927
CH4-H
2O 0 0.361
H2-Ar 9.625E-3 -2.287804
CH4-CO2 0 0.153
The gas phase heat capacity (Cp,f) is taken as the molar average of the gas component heat capacity (Cp,i),
which is estimated using the DIPPR equation from Aspen Plus software [462] and shown in
Table 12.3.
Table 12.3: Gas phase heat capacity constants for relevant species, corresponding to the equation
p,i 2 2
C EC = A+ B + D
Tsinh C / T Tsinh E / T
[462]. Note: T is in K and Cp,i is in J/kmol-K.
A B C D E
CH4 33298 79933 2086.9 41602 991.96
H2 27617 9560 2466 3760 567.6
H2O 33363 26790 2610.5 8896 1169
CO 29108 8773 3085.1 8455.3 1538.2
CO2 29370 34540 1428 26400 588
Ar 20786 -- -- -- --
N2 29105 8614.9 1701.6 103.47 909.79

238
The gas phase viscosity of species can be estimated from the DIPPR correlation used in Aspen Plus,
shown in Table 12.4. The viscosity of the gas mixture is estimated by the Wilke method with Herning
and Zipperer approximation [460]:
1
1
./
NoComp
i i
NoCompi j j ij
y
y M M
(12.3)
Table 12.4: Gas phase viscosity constants for selected species, corresponding to the equation
21 / /
B
i
AT
C T D T
[462]. Note: T is in K and is in N-s/m2.
A B C D
CH4 5.255E-07 0.59006 105.67 0
H2 1.797E-07 0.685 -0.59 140
H2O 1.710E-08 1.1146 0 0
CO 1.113E-06 0.5338 94.7 0
CO2 2.148E-06 0.46 290 0
Ar 9.212E-07 0.60529 83.24 0
N2 6.5592E-07 0.6081 54.714 0
The gas phase thermal conductivity of species is estimated with the DIPPR equation used in Aspen Plus
[462], shown in
. The thermal conductivity of the mixture is calculated by the Wassiljew equation [460],
1
1
.NoComp
i im NoComp
i j ijj
y
y A
(12.4)
The binary interaction parameter (Aij) can be found based on Mason and Sexena’s formulation (Eqs.(12.5)
–(12.7)), where the ratio of the translational thermal (𝜆𝑡𝑟𝑖𝜆𝑡𝑟𝑗
⁄ ) conductivities needs to be calculated from
the reduced temperatures (Tr) and reduced, inverse thermal conductivity (Γ) [460].
21/2 1/4
1/2
1 / /
,
8 1 /
i jtr tr i j
ij
i j
M M
A
M M
(12.5)
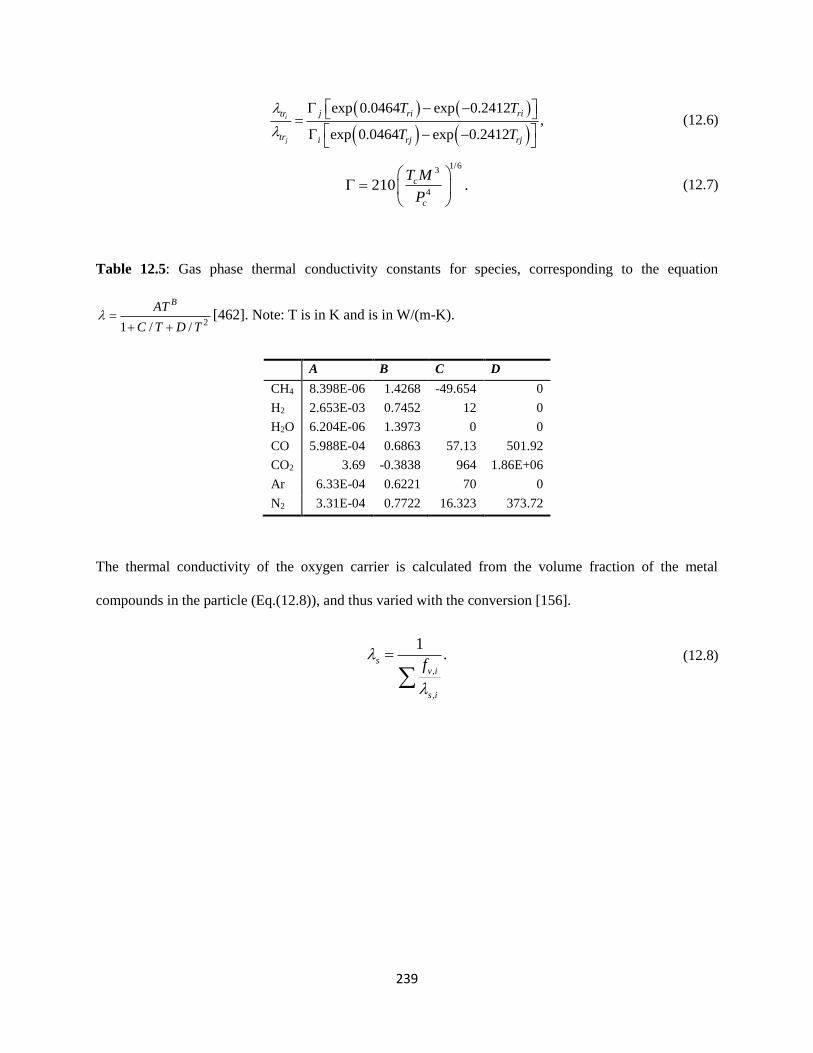
239
exp 0.0464 exp 0.2412,
exp 0.0464 exp 0.2412
i
j
j ri ritr
tr i rj rj
T T
T T
(12.6)
1/63
42 .10 c
c
T M
P
(12.7)
Table 12.5: Gas phase thermal conductivity constants for species, corresponding to the equation
21 / /
BAT
C T D T
[462]. Note: T is in K and is in W/(m-K).
A B C D
CH4 8.398E-06 1.4268 -49.654 0
H2 2.653E-03 0.7452 12 0
H2O 6.204E-06 1.3973 0 0
CO 5.988E-04 0.6863 57.13 501.92
CO2 3.69 -0.3838 964 1.86E+06
Ar 6.33E-04 0.6221 70 0
N2 3.31E-04 0.7722 16.323 373.72
The thermal conductivity of the oxygen carrier is calculated from the volume fraction of the metal
compounds in the particle (Eq.(12.8)), and thus varied with the conversion [156].
,
,
1.s
v i
s i
f
(12.8)
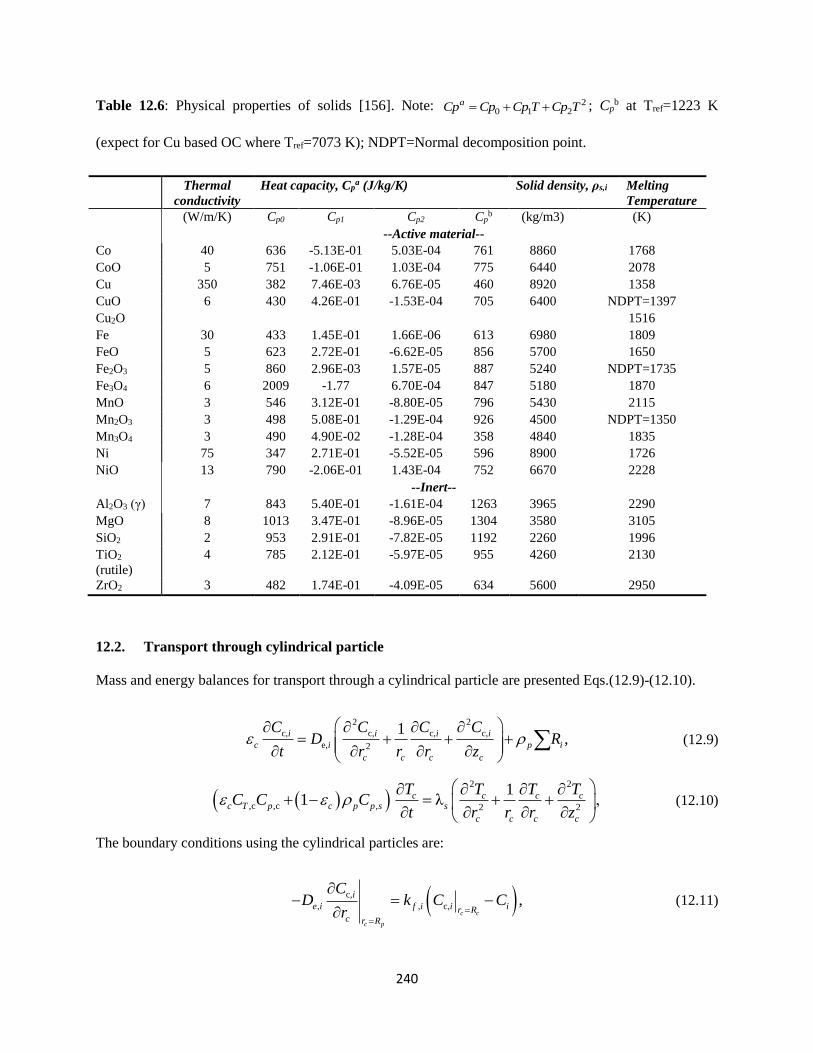
240
Table 12.6: Physical properties of solids [156]. Note: 20 1 2
aCp Cp Cp T Cp T ; Cpb at Tref=1223 K
(expect for Cu based OC where Tref=7073 K); NDPT=Normal decomposition point.
Thermal
conductivity
Heat capacity, Cpa (J/kg/K) Solid density, ρs,i Melting
Temperature
(W/m/K) Cp0 Cp1 Cp2 Cpb (kg/m3) (K)
--Active material--
Co 40 636 -5.13E-01 5.03E-04 761 8860 1768
CoO 5 751 -1.06E-01 1.03E-04 775 6440 2078
Cu 350 382 7.46E-03 6.76E-05 460 8920 1358
CuO 6 430 4.26E-01 -1.53E-04 705 6400 NDPT=1397
Cu2O 1516
Fe 30 433 1.45E-01 1.66E-06 613 6980 1809
FeO 5 623 2.72E-01 -6.62E-05 856 5700 1650
Fe2O3 5 860 2.96E-03 1.57E-05 887 5240 NDPT=1735
Fe3O4 6 2009 -1.77 6.70E-04 847 5180 1870
MnO 3 546 3.12E-01 -8.80E-05 796 5430 2115
Mn2O3 3 498 5.08E-01 -1.29E-04 926 4500 NDPT=1350
Mn3O4 3 490 4.90E-02 -1.28E-04 358 4840 1835
Ni 75 347 2.71E-01 -5.52E-05 596 8900 1726
NiO 13 790 -2.06E-01 1.43E-04 752 6670 2228
--Inert--
Al2O3 (γ) 7 843 5.40E-01 -1.61E-04 1263 3965 2290
MgO 8 1013 3.47E-01 -8.96E-05 1304 3580 3105
SiO2 2 953 2.91E-01 -7.82E-05 1192 2260 1996
TiO2
(rutile)
4 785 2.12E-01 -5.97E-05 955 4260 2130
ZrO2 3 482 1.74E-01 -4.09E-05 634 5600 2950
12.2. Transport through cylindrical particle
Mass and energy balances for transport through a cylindrical particle are presented Eqs.(12.9)-(12.10).
2 2
c, c, c, c,
e, 2,
1i i i i
c i p
c
i
c c c
C C C CD R
t r r r z
(12.9)
2 2
,c ,c , 2 2
11 λ ,c c c c
c c c c
c T p c p p s s
T T T TC C C
t r r r z
(12.10)
The boundary conditions using the cylindrical particles are:
c,
, , c, ,c c
c p
i
e i f i i ir R
r Rc
CD k C C
r
(12.11)
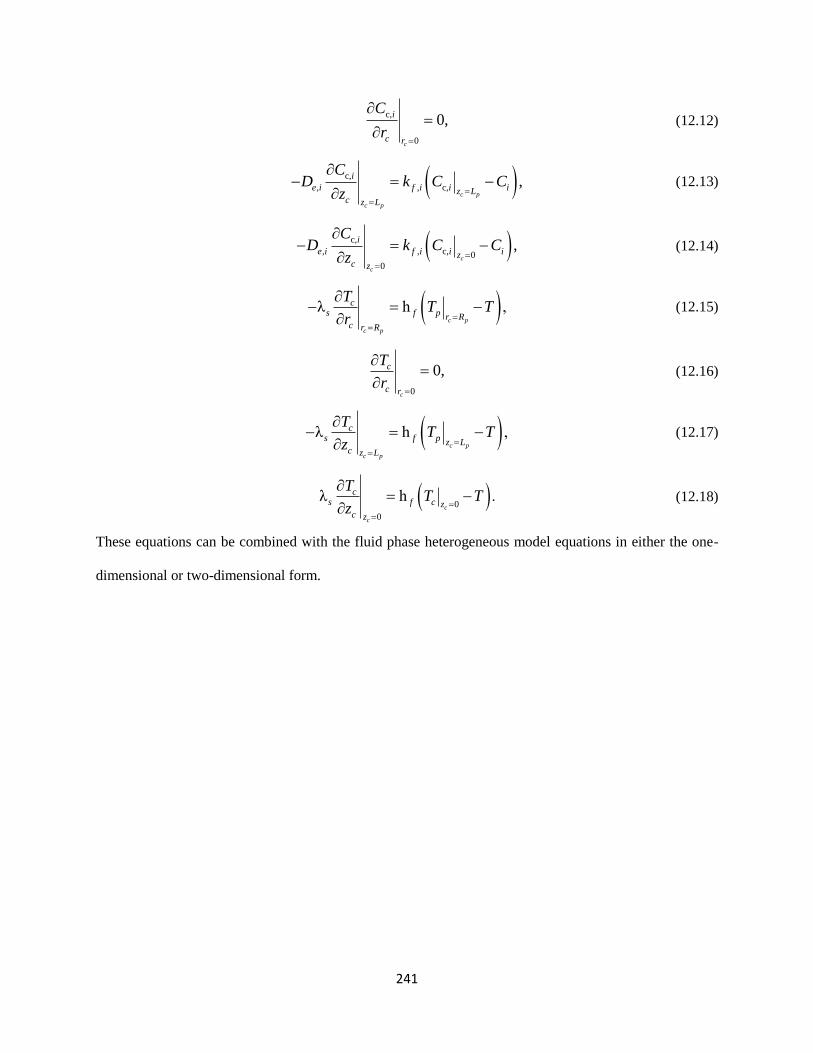
241
c,
0
0,
cc
i
r
C
r
(12.12)
c,
, , c, ,c
c
p
p
i
e i f i i iz L
z Lc
CD k C C
z
(12.13)
c,
, , c, 0
0
,c
c
i
e i f i
c
i iz
z
CD k C C
z
(12.14)
λ h ,p
p
c
c
s f p r Rr R
c
c
TT T
r
(12.15)
0
0,
cr
c
c
T
r
(12.16)
λ h ,p
p
c
c
s f p z Lz L
c
c
TT T
z
(12.17)
0
0
λ h .c
c
s f z
z
cc
c
TT T
z
(12.18)
These equations can be combined with the fluid phase heterogeneous model equations in either the one-
dimensional or two-dimensional form.
242
Chapter 13 NOMENCLATURE
Abbreviations
AE Avrami-Erofe’ev
CCPP combined cycle power plant
CCS carbon capture and storage
CC combined cycle
CL chemical-looping
CLC chemical-looping combustion
CLR chemica-looping reforming
DAEs differential and algebraic equations
GT gas turbine
HR-1 heat remoal to the gas turbine
HR-2 heat removal to the steam turbine
IGCC integrated gasification combined cycle
MSC modified shrinking core
MV modified volumetric
NGCC natural gas fired combined cycle
OC oxygen carrier
OX oxidation
PU purge
RED reduction
243
SC shrinking core
SGI structural global identifiability
SLI structural local identifiability
ST steam turbine
RS reaction scheme
TIT turbine inlet temperature
V volumetric
General Symbols
Ac cross-sectional area of the reactor tube [m2]
Aij binary interaction parameter
a empirical parameter for the αcat expression
al characteristic length of particle (Vp/Sp)
a0 initial specific surface area of the oxygen carrier [m2/kg OC]
av external particle surface area per unit reactor volume [1/m]
b empirical parameter for the αcat expression
Ci gas concentration of species i in fluid phase [mol/m3]
Cc,i concentration of gas species i in solid phase [mol/m3]
CiTGA Concentration of gas species i in the main gas flow of the TGA setting [mol/m3]
CNi Ni concentration [kg Ni/kg OC]
CNiO NiO concentration [kg Ni/kg OC]
CNiAl2O4 NiAl2O4 concentration [kg NiAl2O4/kg OC]
244
C’NiO initial NiO concentration [kg Ni/kg OC]
Cp,f heat capacity of fluid phase [J/mol/K]
Cp,i heat capacity of the gas species [J/mol-K]
Cp,c heat capacity of gas mixture in the solid phase [J/mol/K]
Cp,s heat capacity of solid phase [J/mol/K]
CT total gas concentration in fluid phase [mol/m3]
CT,c Total gas concentration in solid phase [mol/m3]
c empirical parameter for the αcat expression
Dax,i axial dispersion coefficient of species i [m2/s]
De,i effective diffusion coefficient of species i [m2/s]
Dij binary gas phase diffusivities [m2/s]
DK,i Knudsen diffusion coefficient of species i [m2/s]
Dm,i diffusion coefficient of component i in the mixture [m2/s]
Dp particle diameter [m]
Dr diameter of reactor [m]
Drad,i radial dispersion coefficient of species i [m2/s]
Eaj activation energy of reaction j [J/mol]
Fi mole flow rate of species i [mol/s]
Fi,in inlet flow rate of species i [mol/s]
fNiO weight fraction of NiO over NiO plus NiAl2O4
Fr Froude number (u2/g/D)

245
Ft total molar flow rate [mol/s]
Fv,i volume fraction of solid phase i
g acceleration of gravity [m/s2]
G mass flux of the gas phase [kg/m2/s]
h height of sample in TGA crucible [m]
h enthalpy of gas [J/Kg]
hbed packed-bed heat transfer coefficient [W/m2-K]
hf heat transfer coefficient between bulk fluid and solid phase [W/m2/K]
hw Wall heat transfer coefficient [W/m2-K]
i gas phase species (CH4, H2, H2O, CO, CO2, Ar, N2)
J Flux of gas species i through the OC [mol/s-m2]
j chemical reaction
kc,i external mass transfer coefficient of species i [m/s]
Ki,,j adsorption coefficient of gas i for reaction j [bar-1]
Kj equilibrium constant for reaction j
kj rate constant
kj,0 pre-exponential factor of rate constant for catalytic reaction j [mol/kg/s]
kj,0 pre-exponential factor of rate constant for OC reduction reaction j [m/s]
𝑘𝑗
𝑇𝑟𝑒𝑓 reference rate constant for reaction j
L length of fixed bed [m]
Lp OC particle length [m]
246
Mi molar weight of species [g/mol]
�� Mass flow rate of gas [kg/s]
Nexp number of experiments
Nsp number of samples
nsw number of flow switches
Nu number of manipulated inputs
Nx number of state variables
Ny number of measured variables
Nφ number of design variables
Nθ number of model parameters
Nu Fluid to wall Nusselt number (hwDp/λm)
n Avrami-Erofe’ev exponent
P total pressure [bar]
Pc critical pressure [bar]
Pea axial Peclet number (u0Dp/Dax)
Per radial Peclet number (u0Dp/Drad)
Pi partial pressure of species i [bar]
Pr Prandlt number (Cp,f μm/λm)
R reaction
Re Reynolds number based on superficial velocity (uDpρ/μ)
Rei Reynolds number based on interstitial velocity (uiDpρ/μ)
247
Rep particle Reynolds number
Rp radius of oxygen carrier [m]
Rg ideal gas law constant
r reactor radial element
rc oxygen carrier radial element
rcat rate of catalytic reaction [mol/g/s]
r0cat rate of catalytic reaction [mol/g/s] over a completely reduced oxygen carrier
rij correlation coefficient between parameters i and j
rj reaction rate
Sc Schmidt number (μ/ρ/Dm,i)
𝑆𝐶𝑂2 CO2 capture efficiency
Sg initial specific surface area of the oxygen carrier [cm2/g OC]
Sh Sherwood number (kc,iDp/Dm,i)
T temperature of fluid phase [˚C]
Tc critical Temperature [°C]
THR,out Temperature of exhaust gas during heat removal (HR-1)
Tin temperature in the inlet [°C]
Tmax Maximum temperature [°C]
Tr reduced temperature
Tref reference temperature (600°C for catalytic reactions, 700°C for NiO reduction reactions)
Ts solid temperature [˚C]
248
Tsp Temperature set-point [°C]
Tw wall temperature [˚C]
t time
ti i-th element of time
U overall heat transfer coefficient [J/m2/K/s]
u superficial velocity [m/s]
ui Interstitial velocity [m/s]
ui element i of the control vector
u0 superficial velocity at the inlet [m/s]
V volume element
Vp volume of particle
X oxygen carrier conversion
Xfuel fuel conversion
XNiO conversion of OC due to NiO reduction
XNiAl2O4 conversion of OC due to NiAl2O4 reduction
Xred actual solid conversion of OC
x state variable
y measured output
yi mole fraction of species i
yi,feed mole fraction of species i in the feed
�� estimated response
249
z length element
zc OC axial element (cylindrical particle)
Greek Letters
α Temperature normalization factor
αcat factor of catalytic activity
δ stagnant gas thickness [m]
Γ Reduced inverse thermal conductivity
ΔH heat of reaction [J/mol]
Δt1 earliest allowable time interval to take sample
𝛟𝛟𝛟max maximum allowable time interval between consecutive sampling points
𝛟𝛟𝛟min
minimum allowable time interval between consecutive sampling points
ε numerical constant, near unity
εb porosity of fixed bed
εc porosity of the OC
ζ Phase displacement
η efficiency
ηj effectiveness factor for reaction Rj, ηj =3 ∫ 𝑟𝑐
2𝑅𝑗𝑑𝑟𝑐𝑅𝑝
0
𝑅𝑝3𝑅𝑗
θi i-th model parameter
θi,max upper bound on i-th model parameter
θi,min lower bound on i-th model parameter
250
σij ij-th element of the inverse matrix of measurement errors, Σy
λax axial heat dispersion coefficient [W/m/K]
λe0 static contribution to effective thermal conductivity [W/m-K]
λi thermal conductivity of species i [W/m-K]
λrad radial heat dispersion coefficient [W/m-K]
λm thermal conductivity of the gas mixture [W/m-K]
λs thermal conductivity of the oxygen carrier [W/m-K]
λtr,i translational thermal conductivity for species i
μ viscosity of the gas mixture [N-s/m2]
ρ density of fluid phase [kg/m3]
ρs density of oxygen carrier [kg/m3]
𝜎𝐻𝑅 standard deviation of the exit gas temperature during HR-1
τ experiment duration
τ pore tortuosity
𝜏𝑐𝑦𝑐𝑙𝑒 time interval for one complete redox cycle
𝜏𝐻𝑅−1 time interval for the HR-1 cycle
𝜏𝑖 time intervals for the i-th CLC step
𝜏𝑖max upper bound for the time intervals for the i-th CLC step
𝜏𝑖min lower bound for the time intervals for the i-th CLC step
φi i-th element of the design vector

251
Φn Thiele modulus for n-order reaction
χ2 chi-square statistic to test goodness of fit
𝜒𝐻𝑅 fraction of time the process is in HR-1
ω weight fraction of metal oxide content
ωmax upper bound for the metal oxide content
ωmin lower bound for the metal oxide content
Vectors and Matrices
f system of differential and algebraic equations
Hθ information matrix [Nθ×Nθ]
h selection function
M model structure
Qr dynamic sensitivity matrix of the r-th response variable
tsp vector of sampling points [Nsp]
U vector of control space
u vector time varying or constant control variables [Nu]
umax upper bound on u [Nu]
umin lower bound on u [Nu]
Vθ variance-covariance matrix of model parameters [Nθ×Nθ]
Wθ weighting matrix to assess SGI [Nθ×Nθ]
Wy weighting matrix to assess SGI [Ny×Ny]
Vθ variance-covariance matrix of model parameters [Nθ×Nθ]

252
x vector of state variables [Nx]
�� vector of derivatives of state variables [Nx]
y0 vector of initial conditions [Ny]
y vector of measured variables [Ny]
�� vector of estimated responses [Ny]
Θ parameter space
θ vector of true values of model parameters [Nθ]
�� vector of estimated values of model parameters [Nθ]
θ0 vector of initial guesses of model parameters [Nθ]
Σy measurement errors variance-covariance matrix [Ny×Ny]
Σθ prior variance-covariance matrix of model parameters [Nθ×Nθ]
Φ simplified design space
Φ’ generic design space
φ simplified design vector [Nφ]
φ’ generic design vector [Nφ]
φ0 initial design vector [Nφ]
253
LIST OF PUBLICATIONS AND CONFERENCE PRESENTATIONS
PUBLICATIONS:
1. Han, L.; Bollas, G.M. Chemical-looping combustion in a reverse-flow fixed-bed reactor. Energy
(2015), in review.
2. Han, L.; Bollas, G.M. Dynamic Optimization of Fixed Bed Chemical-Looping Processes. Energy
(2015), in review.
3. Han, L.; Zhou, Z.; Bollas, G.M. Model-Based Analysis of Chemical-Looping Combustion
Experiments. Part I: Structural Identifiability of Kinetic Models. AIChE J. (2015) in review
4. Han, L.; Zhou, Z.; Bollas, G.M. Model-Based Analysis of Chemical-Looping Combustion
Experiments. Part II: Model-based Analysis of Chemical-Looping Combustion Experiments. Part II:
Optimal Design of Reduction Experiments. AIChE J.( 2015) in review
5. Han, L.; Zhou, Z.; Bollas, G.M. Heterogeneous modeling of chemical-looping combustion. Part 2:
Particle model. Chem. Eng. Sci. 113 (2014) 116-128.
6. Han, L.; Zhou, Z.; Bollas, G.M. Heterogeneous modeling of chemical-looping combustion. Part 1:
Reactor model. Chem. Eng. Sci. 104 (2013) 233–249.
7. Nordness, O.; Han, L.; Zhou, Z., Bollas, G.M. Kinetic Study of High-Pressure Chemical-Looping
Combustion (CLC) Experiments with Methane and Synthesis gas with Ni and Cu Oxygen Carriers.
Energy & Fuels (2015) accepted.
8. Zhou, Z.; Han, L.; Bollas, G.M. Model-assisted analysis of fluidized bed chemical-looping reactors.
Chem. Eng. Sci. 134 (2015) 619-631.
9. Zhou, Z.; Han, L.; Nordness, O.; Bollas, G.M. Continuous regime of chemical looping combustion
(CLC) and chemical-looping with oxygen uncoupling (CLOU) reactivity of CuO oxygen carriers.
Appl. Catal. B Environ. 166-167 (2015) 132-144.
10. Zhou, Z.; Han, L.; Bollas, G.M. Kinetics of NiO reduction by H2 and Ni oxidation at conditions
relevant to chemical-looping combustion and reforming. I. J. Hydrogen Energy. 39 (2014) 8535-
8556.
254
11. Zhou, Z.; Han, L.; Bollas, G.M. Overview of Chemical-Looping Reduction in Fixed Bed and
Fluidized Bed Reactors Focused on Oxygen Carrier Utilization and Reactor Efficiency. Aerosol and
Air Quality Res. 14 (2014) 559-571.
12. Zhou, Z.; Han, L.; Bollas, G.M. Model-based analysis of bench-scale fixed-bed units for chemical-
looping combustion. Chem. Eng. J. 233 (2013) 331–348.
CONFERENCE ORAL PRESENTATIONS:
1. Han, L.; Bollas, G.M. “A model-based framework for dynamic optimization in power generation
systems.” 11th IFAC Symposium on Dynamics and Control of Process Systems, including
Biosystems (2016) Trondheim, Norway.
2. Palmer, K.A.; Hale, W.T.; Han, L.; Jacobson, C.A.; Bollas, G.M. “Method for Fault Identifiability
through Aerospace Built-in Test Applications.” 11th IFAC Symposium on Dynamics and Control of
Process Systems, including Biosystems (2016) Trondheim, Norway.
3. Han, L.; Chen, C.; Bollas, G.M. “Optimization of Chemical-Looping Combustion Fixed-Bed
Reactors in Natural Gas-Fired Combined Cycle Power Plants.” Annual AIChE Meeting (2015) Salt
Lake City, UT.
4. Han, L.; Chen, C.; Bollas, G.M. “Dynamic Simulation of a Natural Gas-Fired Combined Cycle
Power Plant Integrated with Chemical-Looping Combustion.” Annual AIChE Meeting (2015) Salt
Lake City, UT.
5. Palmer, C.; Han, L.; Bollas, G.M. “Analysis of a Simulated Moving Bed Configuration for
Chemical-Looping Combustion.” Annual AIChE Meeting (2015) Salt Lake City, UT.
6. Magnusson, F.; Palmer, K.A.; Han, L.; Bollas, G.M. “Dynamic Parametric Sensitivity Optimization
Using Simultaneous Discretization in JModelica.org.” International Conference on Complex
Systems Engineering (2015) Storrs, CT.
255
7. Chen, C.; Han, L.; Such, K.D.; Zhou, Z.; Bollas, G.M. “Dynamic simulation of chemical-looping
systems integrated in power plants.” 40th Int. Tech. Conference on Clean Coal and Fuel Systems
(2015) Clearwater, FL.
8. Han, L.; Zhou, Z.; Bollas, G.M. “Model-Based Design of Experiments to Achieve Kinetic Validation
for Chemical-Looping Systems.” Selected by AIChE Session Chair, Dr. Joris Thybaut
(Universiteit Gent), as the “Best Presentation” in the session “Modeling and Analysis of
Chemical Reactors II” of the 2014 AIChE Annual Meeting in Atlanta, GA.
9. Zhou, Z.; Han, L.; Bollas, G.M. “Continuous Regime of CLC/CLOU Reactivity and Its Impact on
the Dynamic Performance of CuxOy/SiO2 Oxygen Carriers.” Annual AIChE Meeting (2014), Atlanta,
GA.
10. Han, L.; Zhou, Z.; Bollas, G.M. “Parameter identifiability and optimal experimental design: Theory
and application on the identification of reaction kinetics in chemical-looping combustion.” Seminar
at Lund University (2014), Lund, Sweden.
11. Han, L.; Zhou, Z.; Bollas, G.M. “Novel Reactor Concepts for Chemical-Looping Combustion.” 4th
International Conference on Chemical Looping (2014), Gothenburg, Sweden.
12. Han, L.; Zhou, Z.; Bollas, G.M. “Effect of Pore and Particle Size of Oxygen Carriers On Chemical-
Looping Combustion and Reforming.” Annual AIChE Meeting (2013), San Francisco, CA.
13. Han, L.; Zhou, Z.; Bollas, G.M. “Implementation of Optimal Experimental Design in Chemical-
Looping Experimentation.” Annual AIChE Meeting (2013), San Francisco, CA.
14. Zhou, Z.; Han, L.; Bollas, G.M. “An Overview of Chemical-Looping Reduction in Fixed-Bed and
Fluidized Bed Reactors Focused On Oxygen Carrier Utilization and Reactor Efficiency.” Annual
AIChE Meeting (2013), San Francisco, CA.
15. Han, L. “CO2 capture and chemical-looping breakthroughs.” Universitas 21 Graduate Energy
Conference (2013), Dublin, Ireland.
16. Han, L.; Zhou, Z.; Bollas, G.M. “Optimal Experimental Design of Fixed-Bed Chemical-Looping
Combustion Systems.” Annual ACS Meeting (2013), New Orleans, LA.

256
17. Han, L.; Zhou, Z.; Bollas, G.M. “Dynamic 2D Heterogeneous Model for Chemical-Looping
Combustion in Fixed-bed Reactors.” AIChE Annual Meeting (2012), Pittsburgh PA.
CONFERENCE POSTER PRESENTATIONS:
1. Such, K.D.; Chen, C.; Han, L.; Bollas, G.M. “Dynamic Simulation of a Combined Cycle Power
Plant Integrated with Chemical-looing Combustion.” Annual AIChE Meeting (2015), Salt Lake City,
UT. Recipient of the 2nd place award at the Student Poster Sessions of the 2015 AIChE Annual
Meeting.
2. Palmer, C.; Han, L.; Bollas, G.M. “Reactor Design and Analysis of a Simulated Moving Bed Reactor
for Chemical-Looping Combustion” Annual AIChE Meeting (2014), Atlanta, GA. Recipient of the
3rd place award at the Student Poster Session of the 2014 AIChE Annual Meeting.
3. Han, L.; Zhou, Z.; Bollas, G.M. “Model-based design of experiments to achieve kinetic validation
for chemical-looping systems.” PSE Advanced Modeling Forum (2014), New York, NY.
4. Han, L.; Fischer, A.; Bollas, G.M. “Optimal Experimental Design of Chemical-Looping Combustion
of Syngas in Fixed-Bed Reactors.” AIChE Annual Meeting (2012), Pittsburgh PA.
5. Han, L.; Zhou, Z.; Du. S.; Bollas, G.M. “Biomass Chemical Looping with Oxygen Uncoupling.”
Chemical Engineering Approaches to Challenges in Energy and Biomedicine (2012), organized by
New York Academy of Sciences, NY, NY.
6. Han, L.; Parnas, R.; Phelan, F. “Multi-Phase Reaction Modeling of Biodiesel Production using Cahn-
Hilliard Approach.” Universitas 21 Undergraduate Research Conference (2010), Melbourne,
Australia
257
COPYRIGHT
Chapter 4: Reprinted with permission from Heterogeneous modeling of chemical-looping combustion.
Part 1: Reactor model, Chemical Engineering Science, 2013, 104, 233-249. Copyright (2013) Elsevier.
Chapter 5: Reprinted with permission from Heterogeneous modeling of chemical-looping combustion.
Part 2: Particle model, Chemical Engineering Science, 2014, 113, 116-128. Copyright (2014) Elsevier.
258
REFERENCES
[1] B. Metz, O.R. Davidson, P.R. Bosch, R. Dave, L.A. Meyer, IPCC, 2007: Climate Change 2007:
Mitigation. Contribution of Working Group III to the Fourth Assessment Report of the
Intergovernmental Panel on Climate Change, Cambridge Univ. Press, Cambridge, U. K., 2007.
[2] T.A. Boden, G. Marland, R.J. Andres, Global, Regional, and National Fossil-Fuel CO2
Emissions, Oak Ridge, TN, 2010.
[3] P. Trans, R. Keeling, Trends in Atmospheric Carbon Dioxide, n.d.
www.esrl.noaa.gov/gmd/ccgg/trends/.
[4] IPCC, IPCC Special Report on Carbon Dioxide Capture and Storage, Cambridge University
Press, Cambridge, UK, 2005.
[5] International Energy Agency: Energy Technology Perspectives, 2012.
http://www.iea.org/etp/publications/etp2012/.
[6] M. Zaman, J.H. Lee, Carbon capture from stationary power generation sources: A review of the
current status of the technologies, Korean J. Chem. Eng. 30 (2013) 1497–1526.
[7] M.E. Boot-Handford, J.C. Abanades, E.J. Anthony, M.J. Blunt, S. Brandani, N. Mac Dowell, et
al., Carbon capture and storage update, Energy Environ. Sci. 7 (2014) 130.
[8] H.J. Herzog, What future for carbon capture and sequestration?, Environ. Sci. Technol. 35 (2001).
[9] L. Fan, L. Zeng, W. Wang, S. Luo, Chemical looping processes for CO2 capture and
carbonaceous fuel conversion – prospect and opportunity, Energy Environ. Sci. 5 (2012) 7254.
[10] P. Markewitz, W. Kuckshinrichs, W. Leitner, J. Linssen, P. Zapp, R. Bongartz, et al., Worldwide
innovations in the development of carbon capture technologies and the utilization of CO2, Energy
Environ. Sci. 5 (2012) 7281.
[11] S. Sivalingam, CO2 separation by calcium looping from full and partial fuel oxidation processes,
Technische Universität München, 2013.
[12] R. Naqvi, Analysis of Natural Gas-Fired Power Cycles with Chemical Looping Combustion for
CO2 Capture, Norwegian University of Science and Technology, 2006.
[13] M.B. Toftegaard, J. Brix, P.A. Jensen, P. Glarborg, A.D. Jensen, Oxy-fuel combustion of solid
fuels, Prog. Energy Combust. Sci. 36 (2010) 581–625.
[14] J. Davison, Performance and costs of power plants with capture and storage of CO2, Energy. 32
(2007) 1163–1176.
[15] P. Folger, Carbon Capture: A Technology Assessment, 2010.
[16] E.S. Rubin, H. Mantripragada, A. Marks, P. Versteeg, J. Kitchin, The outlook for improved
carbon capture technology, Prog. Energy Combust. Sci. 38 (2012) 630–671.
[17] K. Damen, M. Van Troost, A. Faaij, W. Turkenburg, A comparison of electricity and hydrogen
production systems with CO2 capture and storage. Part A: Review and selection of promising
conversion and capture technologies, Prog. Energy Combust. Sci. 32 (2006) 215–246.
[18] P.H.M. Feron, C. A. Hendriks, CO2 capture process principles and costs, Oil Gas Sci. Technol. 60
(2005) 451–459.
[19] B.J.P. Buhre, L.K. Elliott, C.D. Sheng, R.P. Gupta, T.F. Wall, Oxy-fuel combustion technology
for coal-fired power generation, Prog. Energy Combust. Sci. 31 (2005) 283–307.
[20] T. DC, B. SM., Carbon dioxide capture for storage in deep geologic formationse-results from the
CO2 capture project, Vol 1-2, Elsevier, Oxkford, Uk, 2005.
[21] H.R. Kerr, Capture and separation technologies gaps and priority research needs, Carbon Dioxide
Capture Storage Deep Geol. Form. - Results from CO2 Capture Proj. 1 (2005) 655–660.
[22] C. Ekström, F. Schwendig, O. Biede, F. Franco, G. Haupt, G. de Koeijer, et al., Techno-Economic
Evaluations and Benchmarking of Pre-combustion CO2 Capture and Oxy-fuel Processes
Developed in the European ENCAP Project, Energy Procedia. 1 (2009) 4233–4240.
[23] J. Adanez, A. Abad, F. Garcia-Labiano, P. Gayan, L.F. De Diego, Progress in chemical-looping
259
combustion and reforming technologies, Prog. Energy Combust. Sci. 38 (2012) 215–282.
[24] J.D. Figueroa, T. Fout, S. Plasynski, H. McIlvried, R.D. Srivastava, Advances in CO2 capture
technology-The U.S. Department of Energy’s Carbon Sequestration Program, Int. J. Greenh. Gas
Control. 2 (2008) 9–20.
[25] H.J. Richter, K.F. Knoche, Reversibility of Combustion Processes, ACS Symp. Ser. Vol. 235.
(1983) 71–85.
[26] M. Ishida, D. Zheng, T. Akehata, Evaluation of a chemical-looping-combustion power-generation
system by graphic exergy analysis, Energy. 12 (1987) 147–154.
[27] I. Adánez-Rubio, P. Gayán, A. Abad, F. García-Labiano, L.F. De Diego, J. Adánez, CO2 capture
in coal combustion by chemical-looping with oxygen uncoupling (CLOU) with a Cu-based
oxygen-carrier, Proc. 5th Int Conf Clean Coal Technol. (2011).
[28] J. Wolf, CO2 Mitigation in Advanced Power Cycles - Chemical Looping Combustion and Steam-
Based Gasification, KTH-Royal Institute of Technology, 2004.
[29] M.M. Hossain, H.I. de Lasa, Chemical-looping combustion (CLC) for inherent CO2 separations-a
review, Chem. Eng. Sci. 63 (2008) 4433–4451.
[30] A. Lyngfelt, Oxygen carriers for chemical looping combustion -4000 h of operational experience,
Oil Gas Sci. Technol. – Rev. IFP Energies Nouv. 66 (2011) 161–172.
[31] S. Nasr, K.P. Plucknett, Kinetics of Iron Ore Reduction by Methane for Chemical Looping
Combustion, Energy & Fuels. 28 (2014) 1387–1395.
[32] A. Abad, J. Adánez, A. Cuadrat, F. García-Labiano, P. Gayán, L.F. de Diego, Kinetics of redox
reactions of ilmenite for chemical-looping combustion, Chem. Eng. Sci. 66 (2011) 689–702.
[33] T. Mattisson, A. Lyngfelt, Applications of chemical-looping combustion with capture of CO2,
Second Nord. Minisymp. Carbon Dioxide Capture Storage. (2001) 46–51.
[34] E. Jerndal, T. Mattisson, A. Lyngfelt, Thermal Analysis of Chemical-Looping Combustion,
Chem. Eng. Res. Des. 84 (2006) 795–806.
[35] Q. Zafar, A. Abad, T. Mattisson, B. Gevert, Reaction kinetics of freeze-granulated NiO/MgAl2O4
oxygen carrier particles for chemical-looping combustion, Energy & Fuels. 21 (2007) 610–618.
[36] M. Rydén, M. Johansson, A. Lyngfelt, T. Mattisson, NiO supported on Mg–ZrO2 as oxygen
carrier for chemical-looping combustion and chemical-looping reforming, Energy Environ. Sci. 2
(2009) 970.
[37] E. Jerndal, T. Mattisson, I. Thijs, F. Snijkers, A. Lyngfelt, NiO particles with Ca and Mg based
additives produced by spray- drying as oxygen carriers for chemical-looping combustion, Energy
Procedia. 1 (2009) 479–486.
[38] T. Mattisson, E. Jerndal, C. Linderholm, A. Lyngfelt, Reactivity of a spray-dried NiO/NiAl2O4
oxygen carrier for chemical-looping combustion, Chem. Eng. Sci. 66 (2011) 4636–4644.
[39] E. Jerndal, T. Mattisson, I. Thijs, F. Snijkers, A. Lyngfelt, Investigation of NiO/NiAl2O4 oxygen
carriers for chemical-looping combustion produced by spray-drying, Int. J. Greenh. Gas Control. 4
(2010) 23–35.
[40] C. Dueso, A. Abad, F. García-Labiano, L.F. De Diego, P. Gayán, J. Adánez, et al., Reactivity of a
NiO/Al2O3 oxygen carrier prepared by impregnation for chemical-looping combustion, Fuel. 89
(2010) 3399–3409.
[41] P. Gayán, C. Dueso, A. Abad, J. Adanez, L.F. de Diego, F. García-Labiano, NiO/Al2O3 oxygen
carriers for chemical-looping combustion prepared by impregnation and deposition–precipitation
methods, Fuel. 88 (2009) 1016–1023.
[42] F. García-Labiano, L.F. de Diego, J. Adánez, A. Abad, P. Gayán, Reduction and Oxidation
Kinetics of a Copper-Based Oxygen Carrier Prepared by Impregnation for Chemical-Looping
Combustion, Ind. Eng. Chem. Res. 43 (2004) 8168–8177.
[43] M. Minnermann, B. Neumann, V. Zielasek, M. Bäumer, Alumina-promoted cobalt and iron
xerogels as catalyst for the Fischer–Tropsch synthesis, Catal. Sci. Technol. 3 (2013) 3256.
[44] R. Villa, C. Cristiani, G. Groppi, L. Lietti, P. Forzatti, U. Cornaro, et al., Ni based mixed oxide
materials for CH4 oxidation under redox cycle conditions, J. Mol. Catal. A Chem. 204-205 (2003)

260
637–646.
[45] P. Gayán, I. Adánez-rubio, A. Abad, L.F. De Diego, F. García-labiano, J. Adánez, et al.,
Development of Cu-based oxygen carriers for Chemical-Looping with Oxygen Uncoupling
(CLOU) process, Fuel. in press (2012) 226–238.
[46] C. Linderholm, A. Abad, T. Mattisson, A. Lyngfelt, 160h of chemical-looping combustion in a
10kW reactor system with a NiO-based oxygen carrier, Int. J. Greenh. Gas Control. 2 (2008) 520–
530.
[47] M. Ishida, H. Jin, T. Okamoto, A Fundamental Study of a New Kind of Medium Material for
Chemical-Looping Combustion, Energy & Fuels. 10 (1996) 958–963.
[48] M. Johansson, Screening of oxygen-carrier particles based on iron-, manganese-, cupper- and
nickel oxides for use in chemical looping technologies, Screen. Oxyg. Part. Based Iron-,
Manganese-, Copper-and Nickel Oxides Use Chem. Technol. (2007).
[49] J. Adánez, F. García-Labiano, L.F. de Diego, P. Gayán, J. Celaya, A. Abad, Nickel-copper
oxygen carriers to reach zero CO and H2 emissions in chemical-looping combustion, Ind. Eng.
Chem. Res. 45 (2006) 2617–2625.
[50] M. Johansson, T. Mattisson, A. Lyngfelt, Creating a synergy effect by using mixed oxides of iron-
and nickel oxides in the combustion of methane in a chemical-looping combustion reactor, Energy
& Fuels. 20 (2006) 2399–2407.
[51] H. Jin, T. Okamoto, M. Ishida, Development of a novel chemical-looping combustion: Synthesis
of a looping material with a double metal oxide of CoO-NiO, Energy & Fuels. 12 (1998) 1272–
1277.
[52] M.M. Hossain, H.I. De Lasa, Reactivity and stability of Co-Ni/Al2O3 oxygen carrier in multicycle
CLC, AIChE J. 53 (2007) 1817–1829.
[53] M.M. Hossain, K.E. Sedor, H.I. de Lasa, Co–Ni/Al2O3 oxygen carrier for fluidized bed chemical-
looping combustion: Desorption kinetics and metal-support interaction, Chem. Eng. Sci. 62 (2007)
5464–5472.
[54] Y. Matsumura, T. Nakamori, Steam reforming of methane over nickel catalysts at low reaction
temperature, Appl. Catal. A Gen. 258 (2004) 107–114.
[55] A.C.S.C. Teixeira, R. Giudici, Deactivation of steam reforming catalysts by sintering:
experiments and simulation, Chem. Eng. Sci. 54 (1999) 3609–3618.
[56] P. Cho, T. Mattisson, A. Lyngfelt, Carbon formation on nickel and iron oxide-containing oxygen
carriers for chemical-looping combustion, Ind. Eng. Chem. Res. 44 (2005) 668–676.
[57] J. Adánez, L.F. de Diego, F. García-Labiano, P. Gayán, A. Abad, J.M. Palacios, Selection of
Oxygen Carriers for Chemical-Looping Combustion, Energy & Fuels. 18 (2004) 371–377.
[58] I. Iliuta, R. Tahoces, G.S. Patience, S. Rifflart, F. Luck, Chemical-looping combustion process:
Kinetics and mathematical modeling, AIChE J. 56 (2010) 1063–1079.
[59] M. Ishida, H. Jin, A novel chemical-looping combustor without NOx formation, Ind. Eng. Chem.
Res. 5885 (1996) 2469–2472.
[60] H. Jin, T. Okamoto, M. Ishida, Development of a novel chemical-looping combustion: Synthesis
of a solid looping material of NiO/NiAl2O4, Ind. Eng. Chem. Res. 38 (1999) 126–132.
[61] H. Jin, M. Ishida, Novel gas turbine cycle with hydrogen-fueled chemical-looping combustion,
Int. J. Hydrogen Energy. 25 (2000) 1209–1215.
[62] H. Jin, M. Ishida, Reactivity study on a novel hydrogen fueled chemical-looping combustion, Int.
J. Hydrogen Energy. 26 (2001) 889–894.
[63] T. Mattisson, A. Jardnas, A. Lyngfelt, Reactivity of Some Metal Oxides Supported on Alumina
with Alternating Methane and Oxygen-Application for Chemical-Looping Combustion, Energy
Fuels. 17 (2003) 643–651.
[64] S.R. Son, S.D. Kim, Chemical-looping combustion with NiO and Fe2O3 in a thermobalance and
circulating fluidized bed reactor with double loops, in: Ind. Eng. Chem. Res., 2006: pp. 2689–
2696.
[65] F. García-Labiano, J. Adánez, L.F. de Diego, P. Gayán, A. Abad, Effect of Pressure on the
261
Behavior of Copper-, Iron-, and Nickel-Based Oxygen Carriers for Chemical-Looping
Combustion, Energy & Fuels. 20 (2006) 26–33.
[66] P. Cho, T. Mattisson, A. Lyngfelt, Comparison of iron-, nickel-, copper- and manganese-based
oxygen carriers for chemical-looping combustion, Fuel. 83 (2004) 1215–1225.
[67] P. Cho, T. Mattisson, A. Lyngfelt, Defluidization conditions for a fluidized bed of iron oxide-,
nickel oxide-, and manganese oxide-containing oxygen carriers for chemical-looping combustion,
Ind. Eng. Chem. Res. 45 (2006) 968–977.
[68] K.E. Sedor, M.M. Hossain, H.I. de Lasa, Reactivity and stability of Ni/Al2O3 oxygen carrier for
chemical-looping combustion (CLC), Chem. Eng. Sci. 63 (2008) 2994–3007.
[69] K.E. Sedor, M.M. Hossain, H.I. de Lasa, Reduction kinetics of a fluidizable nickel–alumina
oxygen carrier for chemical-looping combustion, Can. J. Chem. Eng. 86 (2008) 323–334.
[70] R. Villa, C. Cristiani, G. Groppi, L. Lietti, P. Forzatti, U. Cornaro, et al., Ni based mixed oxide
materials for CH4 oxidation under redox cycle conditions, J. Mol. Catal. A Chem. 204-205 (2003)
637–646.
[71] M. Johansson, T. Mattisson, A. Lyngfelt, Use of NiO/NiAl2O4 Particles in a 10 kW Chemical-
Looping Combustor, (2006) 5911–5919.
[72] L.F. de Diego, M. Ortiz, F. García-Labiano, J. Adánez, A. Abad, P. Gayán, Hydrogen production
by chemical-looping reforming in a circulating fluidized bed reactor using Ni-based oxygen
carriers, J. Power Sources. 192 (2009) 27–34.
[73] T. Mattisson, M. Johansson, A. Lyngfelt, The use of NiO as an oxygen carrier in chemical-
looping combustion, Fuel. 85 (2006) 736–747.
[74] A. Abad, T. Mattisson, A. Lyngfelt, M. Rydén, Chemical-looping combustion in a 300 W
continuously operating reactor system using a manganese-based oxygen carrier, Fuel. 85 (2006)
1174–1185.
[75] H.-J. Ryu, D.-H. Bae, G.-T. Jin, Effect of temperature on reduction reactivity of oxygen carrier
particles in a fixed bed chemical-looping combustor, Korean J. Chem. Eng. 20 (2003) 960–966.
[76] M. Ishida, M. Yamamoto, T. Ohba, Experimental results of chemical-looping combustion with
NiO/NiAl2O4 particle circulation at 1200 °C, Energy Convers. Manag. 43 (2002) 1469–1478.
[77] M. Rydén, A. Lyngfelt, T. Mattisson, Synthesis gas generation by chemical-looping reforming in
a continuously operating laboratory reactor, Fuel. 85 (2006) 1631–1641.
[78] E. Jerndal, T. Mattisson, A. Lyngfelt, Investigation of Different NiO/NiAl2O4 Particles as Oxygen
Carriers for Chemical-Looping Combustion, Energy & Fuels. 23 (2009) 665–676.
[79] P. Gayán, L.F. de Diego, F. García-Labiano, J. Adánez, A. Abad, C. Dueso, Effect of support on
reactivity and selectivity of Ni-based oxygen carriers for chemical-looping combustion, Fuel. 87
(2008) 2641–2650.
[80] A. Shulman, C. Linderholm, T. Mattisson, A. Lyngfelt, High reactivity and mechanical durability
of NiO/NiAl2O4 and NiO/NiAl2O4/MgAl2O4 oxygen carrier particles used for more than 1000 h in
a 10 kW CLC reactor, Ind. Eng. Chem. Res. 48 (2009) 7400–7405.
[81] M.M. Hossain, H.I. de Lasa, Chemical-looping combustion (CLC) for inherent separations—a
review, Chem. Eng. Sci. 63 (2008) 4433–4451.
[82] L.F. De Diego, F. García-Labiano, J. Adánez, P. Gayán, A. Abad, B.M. Corbella, et al.,
Development of Cu-based oxygen carriers for chemical-looping combustion, Fuel. 83 (2004)
1749–1757.
[83] Y. Cao, B. Casenas, W.-P. Pan, Investigation of chemical looping combustion by solid fuels. 2.
Redox reaction kinetics and product characterization with coal, biomass, and solid waste as solid
fuels and CuO as an oxygen carrier, Energy & Fuels. 20 (2006) 1845–1854.
[84] J. Ada, L.F. De Diego, F. Garcı, P. Gaya, A. Abad, M.L. Casta, Selection of Oxygen Carriers for
Chemical-Looping Combustion, (2004) 371–377.
[85] J. Adánez, F. García-Labiano, L.F. De Diego, P. Gayán, J. Celaya, A. Abad, Nickel-copper
oxygen carriers to reach zero CO and H2 emissions in chemical-looping combustion, in: Ind. Eng.
Chem. Res., 2006: pp. 2617–2625.
262
[86] B.M. Corbella, L.F. de Diego, F. García-Labiano, J. Adánez, J.M. Palacios, Performance in a
fixed-bed reactor of titania-supported nickel oxide as oxygen carriers for the chemical-looping
combustion of methane in multicycle tests, Ind. Eng. Chem. Res. 45 (2006) 157–165.
[87] B.M. Corbella, L.F. De Diego, F. García-Labiano, J. Adánez, J.M. Palaciost, J.M. Palacios,
Characterization study and five-cycle tests in a fixed-bed reactor of titania-supported nickel oxide
as oxygen carriers for the chemical-looping combustion of methane, Environ. Sci. Technol. 39
(2005) 5796–5803.
[88] L.F. de Diego, P. Gayán, F. García-Labiano, J. Celaya, A. Abad, J. Adánez, Impregnated
CuO/Al2O3 oxygen carriers for chemical-looping combustion: Avoiding fluidized bed
agglomeration, Energy and Fuels. 19 (2005) 1850–1856.
[89] F. García-Labiano, J. Adánez, L.F. de Diego, P. Gayán, A. Abad, Effect of pressure on the
behavior of copper-, iron-, and nickel-based oxygen carriers for chemical-looping combustion,
Energy and Fuels. 20 (2006) 26–33.
[90] S.Y. Chuang, J.S. Dennis, A.N. Hayhurst, S.A. Scott, Development and performance of Cu-based
oxygen carriers for chemical-looping combustion, Combust. Flame. 154 (2008) 109–121.
[91] B.M. Corbella, L.F. de Diego, F. Garcia-Labiano, J. Adánez, J.M. Palacios, Characterization and
Performance in a Multicycle Test in a Fixed-Bed Reactor of Silica-Supported Copper Oxide as
Oxygen Carrier for Chemical-Looping Combustion of Methane, Energy & Fuels. 20 (2006) 148–
154.
[92] Q. Zafar, T. Mattisson, B. Gevert, Integrated hydrogen and power production with CO2 capture
using chemical-looping reforming-redox reactivity of particles of CuO, Mn2O3, NiO, and Fe2O3
using SiO2 as a support, Ind. Eng. Chem. Res. 44 (2005) 3485–3496.
[93] Q. Zafar, T. Mattisson, B. Gevert, Redox Investigation of Some Oxides of Transition-State Metals
Ni , Cu , Fe , and Mn Supported on SiO2 and MgAl2O4, Energy & Fuels. 20 (2006) 34–44.
[94] S.R. Son, K.S. Go, S.D. Kim, Thermogravimetric Analysis of Copper Oxide for Chemical-
Looping Hydrogen Generation, Ind. Eng. Chem. Res. 48 (2009) 380–387.
[95] A. Tong, S. Bayham, M. V. Kathe, L. Zeng, S. Luo, L.-S. Fan, Iron-based syngas chemical
looping process and coal-direct chemical looping process development at Ohio State University,
Appl. Energy. 113 (2014) 1836–1845.
[96] S. Noorman, M. van Sint Annaland, Packed Bed Reactor Technology for Chemical-Looping
Combustion, Ind. Eng. Chem. Res. 46 (2007) 4212–4220.
[97] I.M. Dahl, E. Bakken, Y. Larring, A.I. Spjelkavik, S.F. Håkonsen, R. Blom, On the development
of novel reactor concepts for chemical looping combustion, Energy Procedia. 1 (2009) 1513–1519.
[98] Z. Zhao, T. Chen, A.F. Ghoniem, Rotary Bed Reactor for Chemical-looping Combustion with
Carbon Capture. Part II: Base Case and Sensitivity Analysis, Energy & Fuels. 27 (2013) 344-359.
[99] Z. Zhao, T. Chen, A.F. Ghoniem, Rotary Bed Reactor for Chemical-Looping Combustion with
Carbon Capture. Part 1: Reactor Design and Model Development, Energy & Fuels. 27 (2013) 327–
343.
[100] A. Lyngfelt, B. Leckner, T. Mattisson, A fluidized-bed combustion process with inherent CO2
separation; application of chemical-looping combustion, Chem. Eng. Sci. 56 (2001) 3101–3113.
[101] B. Kronberger, E. Johansson, G. Löffer, T. Mattisson, A. Lyngfelt, H. Hofbauer, A two-
compartment fluidized bed reactor for CO2 capture by chemical-looping combustion, Chem. Eng.
Technol. 27 (2004) 1318–1326.
[102] B. Kronberger, A. Lyngfelt, G. Löffler, H. Hofbauer, Design and Fluid Dynamic Analysis of a
Bench-Scale Combustion System with CO2 Separation−Chemical-Looping Combustion, Ind. Eng.
Chem. Res. 44 (2005) 546–556.
[103] P. Kolbitsch, T. Pröll, J. Bolhar-Nordenkampf, H. Hofbauer, J. Bolhàr-Nordenkampf, H.
Hofbauer, et al., Design of a Chemical Looping Combustor using a Dual Circulating Fluidized
Bed (DCFB) Reactor System, Chem. Eng. Technol. 32 (2009) 398–403.
[104] A. Lyngfelt, H. Thunman, Chemical-looping combustion: Design construction and 100 h of
operational experience of a 10 kW prototype, in: D. Thomas (Ed.), Carbon Dioxide Capture
263
Storage Deep Geol. Form. from CO2 Capture Proj. Vol. 1-Capture Sep. Carbon Dioxide from
Combust., Elsevier, London, UK, 2004.
[105] H. Ryu, G. Jin, C. Yi, Demonstration of inherent CO2 separation and no NOx emission in a 50kW
chemical-looping combustor: continuous reduction and oxidation experiment, in: Proc. 7th Int.
Conf. Greenh. Gas Control Technol., Vancouver, 2004.
[106] F. Li, L.-S. Fan, Clean coal conversion processes – progress and challenges, Energy Environ. Sci.
1 (2008) 248-267.
[107] F. Li, L. Zeng, L.G. Velazquez-vargas, Z. Yoscovits, L. Fan, Syngas Chemical Looping
Gasification Process : Bench-Scale Studies and Reactor Simulations, AIChE J. 56 (2010).
[108] H.P. Hamers, F. Gallucci, P.D. Cobden, E. Kimball, M. Van Sint Annaland, A novel reactor
configuration for packed bed chemical-looping combustion of syngas, Int. J. Greenh. Gas Control.
16 (2013) 1–12.
[109] V. Spallina, F. Gallucci, M.C. Romano, P. Chiesa, G. Lozza, M. Van Sint Annaland, Investigation
of heat management for CLC of syngas in packed bed reactors, Chem. Eng. J. 225 (2013) 174–
191.
[110] V. Spallina, P. Chiesa, E. Martelli, F. Gallucci, M.C. Romano, G. Lozza, et al., Reactor design
and operation strategies for a large-scale packed-bed CLC power plant with coal syngas, Int. J.
Greenh. Gas Control. 36 (2015) 34–50.
[111] V. Spallina, M.C.C. Romano, P. Chiesa, F. Gallucci, M. van Sint Annaland, G. Lozza, Integration
of coal gasification and packed bed CLC for high efficiency and near-zero emission power
generation, Int. J. Greenh. Gas Control. 27 (2014) 28–41.
[112] S.F. Håkonsen, C.A. Grande, R. Blom, Rotating bed reactor for CLC: Bed characteristics
dependencies on internal gas mixing, Appl. Energy. 113 (2014) 1952–1957.
[113] S.F. Håkonsen, R. Blom, Chemical looping combustion in a rotating bed reactor--finding optimal
process conditions for prototype reactor., Environ. Sci. Technol. 45 (2011) 9619–26.
[114] C. Dueso, M. Ortiz, A. Abad, F. García-Labiano, L.F. De Diego, P. Gayán, et al., Reduction and
oxidation kinetics of nickel-based oxygen-carriers for chemical-looping combustion and chemical-
looping reforming, Chem. Eng. J. 188 (2012) 142–154.
[115] A. Abad, F. García-Labiano, L.F. de Diego, P. Gayán, J. Adánez, Reduction kinetics of Cu-, Ni-,
and Fe-based oxygen carriers using syngas (CO + H2) for chemical-looping combustion, Energy &
Fuels. 21 (2007) 1843–1853.
[116] A. Cabello, P. Gayán, F. García-Labiano, L.F. de Diego, A. Abad, M.T. Izquierdo, et al.,
Relevance of the catalytic activity on the performance of a NiO/CaAl2O4 oxygen carrier in a CLC
process, Appl. Catal. B Environ. 147 (2014) 980–987.
[117] H. Rashidi, H. Ale Ebrahim, B. Dabir, Application of random pore model for synthesis gas
production by nickel oxide reduction with methane, Energy Convers. Manag. 74 (2013) 249–260.
[118] M. Ortiz, L.F. De Diego, A. Abad, F. García-Labiano, P. Gayán, J. Adánez, Catalytic Activity of
Ni-Based Oxygen-Carriers for Steam Methane Reforming in Chemical-Looping Processes, Energy
& Fuels. 26 (2012) 791–800.
[119] Z. Zhou, L. Han, G.M. Bollas, Model-based analysis of bench-scale fixed-bed units for chemical-
looping combustion, Chem. Eng. J. 233 (2013) 331–348.
[120] H.J. Jun, M.-J. Park, S.-C. Baek, J.W. Bae, K.-S. Ha, K.-W. Jun, Kinetics modeling for the mixed
reforming of methane over Ni-CeO2/MgAl2O4 catalyst, J. Nat. Gas Chem. 20 (2011) 9–17.
[121] M. Johansson, T. Mattisson, A. Lyngfelt, A. Abad, Using continuous and pulse experiments to
compare two promising nickel-based oxygen carriers for use in chemical-looping technologies,
Fuel. 87 (2008) 988–1001.
[122] A. Abad, J. Adánez, F. García-Labiano, L.F. De Diego, P. Gayán, P. Kolbitsch, et al., CLC
Modeling the fuel reactor at fast fluidization - Conversion of CH4 using a NiO-based oxygen
carrier in a 120 kWth unit, in: Proc. 1st Int Conf Chem. Looping. Lyon, Fr., 2010.
[123] A. Abad, J. Adánez, F. García-Labiano, L.F. de Diego, P. Gayán, Modeling of the chemical-
looping combustion of methane using a Cu-based oxygen-carrier, Combust. Flame. 157 (2010)
264
602–615.
[124] F.-X. Chiron, G.S. Patience, S. Rifflart, Kinetic mechanism derived through dosing reactants over
NiO, Ni and Ni-C, Proc. 1st Int Conf Chem. Looping. (2010).
[125] T. Mattisson, M. Johansson, A. Lyngfelt, The use of NiO as an oxygen carrier in chemical-
looping combustion, Fuel. 85 (2006) 736–747.
[126] T. Mendiara, J.M. Johansen, R. Utrilla, A.D. Jensen, P. Glarborg, Evaluation of different oxygen
carriers for biomass tar reforming (II): Carbon deposition in experiments with methane and other
gases, Fuel. 90 (2011) 1370–1382.
[127] M.K. Chandel, A. Hoteit, A. Delebarre, Experimental investigation of some metal oxides for
chemical looping combustion in a fluidized bed reactor, Fuel. 88 (2009) 898–908.
[128] L. Han, Z. Zhou, G.M. Bollas, Heterogeneous modeling of chemical-looping combustion. Part 2:
Particle model, Chem. Eng. Sci. 113 (2014) 116–128.
[129] J. Szekely, C.I. Lin, H.Y. Sohn, A structural model for gas-solid reactions with a moving
boundary-V an experimental study of the reduction of porous nickel-oxide pellets with hydrogen,
Chem. Eng. Sci. 28 (1973) 1975–1989.
[130] M.M. Hossain, M.R. Quddus, H.I. de Lasa, Reduction Kinetics of La Modified NiO/La-γAl2O3
Oxygen Carrier for Chemical-Looping Combustion, Ind. Eng. Chem. Res. 49 (2010) 11009–
11017.
[131] M.M. Hossain, H.I. De Lasa, Reactivity and stability of Co-Ni/Al2O3 oxygen carrier in
multicycle CLC, AIChE J. 53 (2007) 1817–1829.
[132] Z. Zhou, L. Han, G.M. Bollas, Kinetics of NiO reduction by H2 and Ni oxidation at conditions
relevant to chemical-looping combustion and reforming, Int. J. Hydrogen Energy. 39 (2014)
8535–8556.
[133] K. Mahalatkar, J. Kuhlman, E.D. Huckaby, T. O’Brien, CFD simulation of a chemical-looping
fuel reactor utilizing solid fuel, Chem. Eng. Sci. 66 (2011) 3617–3627.
[134] J. Jung, I.K. Gamwo, Multiphase CFD-based models for chemical looping combustion process:
Fuel reactor modeling, Powder Technol. 183 (2008) 401–409.
[135] Z. Deng, R. Xiao, B. Jin, Q. Song, Numerical simulation of chemical looping combustion process
with CaSO4 oxygen carrier, Int. J. Greenh. Gas Control. 3 (2009) 368–375.
[136] W. Shuai, Y. Yunchao, L. Huilin, X. Pengfei, S. Liyan, Computational Fluid Dynamic Simulation
Based Cluster Structures-Dependent Drag Coefficient Model in Dual Circulating Fluidized Beds
of Chemical Looping Combustion, Ind. Eng. Chem. Res. 51 (2012) 1396–1412.
[137] M. Xu, N. Ellis, C.J. Lim, H.-J. Ryu, Mapping of the operating conditions for an interconnected
fluidized bed reactor for CO2 separation by chemical looping combustion, Chem. Eng. Technol.
32 (2009) 404–409.
[138] W. Shuai, L. Guodong, L. Huilin, C. Juhui, H.H. Yurong, W. Jiaxing, Fluid dynamic simulation
in a chemical looping combustion with two interconnected fluidized beds, Fuel Process. Technol.
92 (2010) 385–393.
[139] M.M.M. Yazdanpanah, A. Forret, T. Gauthier, A. Delebarre, Modeling of CH4 combustion with
NiO/NiAl2O4 in a 10kWth CLC pilot plant, Appl. Energy. 113 (2014) 1933–1944.
[140] T.A. Brown, J.S. Dennis, S.A. Scott, J.F. Davidson, A.N. Hayhurst, Gasification and chemical-
looping combustion of a lignite char in a fluidized bed of iron oxide, Energy & Fuels. 24 (2010)
3034–3048.
[141] Z. Zhou, L. Han, G.M. Bollas, Model-assisted analysis of fluidized bed chemical-looping
reactors, Chem. Eng. Sci. 134 (2015) 619–631.
[142] Z. Zhou, L. Han, O. Nordness, G.M. Bollas, Continuous regime of chemical looping combustion
(CLC) and chemical-looping with oxygen uncoupling (CLOU) reactivity of CuO oxygen carriers,
Appl. Catal. B Environ. 166-167 (2015) 132–144.
[143] J. Wolf, M. Anheden, J. Yan, Comparison of nickel- and iron-based oxygen carriers in chemical
looping combustion for CO2 capture in power generation, Fuel. 84 (2005) 993–1006.
[144] S. Consonni, G. Lozza, G. Pelliccia, S. Rossini, F. Saviano, Chemical-Looping Combustion for

265
Combined Cycles With CO2 Capture, J. Eng. Gas Turbines Power. 128 (2006) 525.
[145] R. Naqvi, O. Bolland, Multi-stage chemical looping combustion (CLC) for combined cycles with
CO2 capture, Int. J. Greenh. Gas Control. 1 (2007) 19–30.
[146] S. Consonni, G. Lozza, G. Pelliccia, S. Rossini, F. Saviano, Chemical-looping combustion for
combined cycles with CO2 capture, J. Eng. Gas Turbines Power. 128 (2006) 525–534.
[147] G. Lozza, P. Chiesa, M. Romano, P. Savoldelli, Three Reactors Chemical Looping Combustion
for High Efficiency Electricity Generation With CO2 Capture From Natural Gas, in: ASME Turbo
Expo 2006 Power Land, Sea, Air, Barcelona, Spain, 2006: pp. 77–87.
[148] P. Chiesa, G. Lozza, A. Malandrino, M. Romano, V. Piccolo, Three-reactors chemical looping
process for hydrogen production, Int. J. Hydrogen Energy. 33 (2008) 2233–2245.
[149] B. Erlach, M. Schmidt, G. Tsatsaronis, Comparison of carbon capture IGCC with pre-combustion
decarbonisation and with chemical-looping combustion, Energy. 36 (2011) 3804–3815.
[150] S. Rezvani, Y. Huang, D. McIlveen-Wright, N. Hewitt, J.D. Mondol, Comparative assessment of
coal fired IGCC systems with CO2 capture using physical absorption, membrane reactors and
chemical looping, Fuel. 88 (2009) 2463–2472.
[151] V. Spallina, M.C. Romano, P. Chiesa, G. Lozza, Integration of Coal Gasification and Packed Bed
CLC process for High Efficiency and Near-zero Emission Power Generation, Energy Procedia. 37
(2013) 662–670.
[152] M. Sorgenfrei, G. Tsatsaronis, Design and evaluation of an IGCC power plant using iron-based
syngas chemical-looping (SCL) combustion, Appl. Energy. 113 (2014) 1958–1964.
[153] A.H. Sahir, J.S. Lighty, H.Y. Sohn, Kinetics of Copper Oxidation in the Air Reactor of a
Chemical Looping Combustion System using the Law of Additive Reaction Times, Ind. Eng.
Chem. Res. 50 (2011) 13330–13339.
[154] S. Noorman, F. Gallucci, M. Van Sint Annaland, J.A.M. Kuipers, A theoretical investigation of
CLC in packed beds. Part 1: Particle model, Chem. Eng. J. 167 (2011) 297–307.
[155] S. Noorman, F. Gallucci, M.van Sint Annaland, J.A.M. Kuipers, A theoretical investigation of
CLC in packed beds. Part 2: Reactor model, Chem. Eng. J. 167 (2011) 369–376.
[156] F. García-Labiano, L.F. De Diego, J. Adánez, A. Abad, P. Gayán, Temperature variations in the
oxygen carrier particles during their reduction and oxidation in a chemical-looping combustion
system, Chem. Eng. Sci. 60 (2005) 851–862.
[157] A. Lyngfelt, B. Leckner, T. Mattisson, A fluidized-bed combustion process with inherent CO2
separation; application of chemical-looping combustion, Chem. Eng. Sci. 56 (2001) 3101–3113.
[158] Z. Ilsen Önsan, A.K. Avci, Reactor Design for Fuel Processing, 2011. In: Fuel Cells:
Technologies for Fuel Processing, 451-516.
[159] K.B. Bischoff, O. Levenspiel, Fluid dispersion—generalization and comparison of mathematical
models—II comparison of models, Chem. Eng. Sci. 17 (1962) 257–264.
[160] J.O. Wilkes, Fluid mechanics for chemical engineers, 1999.
[161] E.A. Foumeny, M.A. Chowdhury, C. McGreavy, J.A.A. Castro, Estimation of Dispersion
Coefficients in Packed Beds, Chem. Eng. Techology. 15 (1992) 161–181.
[162] M.E. Davis, R.J. Davis, Fundamentals of Chemical Reaction Engineering, 2003.
[163] S. Yagi, D. Kunii, N. Wakao, Studies on axial effective thermal conductivities in packed beds,
AIChE J. 6 (1960) 543–546.
[164] S. Yagi, N. Wakao, Heat and mass transfer from wall to fluid in packed beds, AIChE J. 5 (1959)
79–85.
[165] N. Wako, S. Kaguei, T. Funazkri, Effect of fluid dispersion coefficients on particle-to-fluid heat
transfer coefficients in packed beds: Correlation of nusselt numbers, Chem. Eng. Sci. 34 (1979)
325–336.
[166] P.E. Peters, R.S. Schiffino, P. Harriott, Heat transfer in packed-tube reactors, Ind. Eng. Chem.
Res. 27 (1988) 226–233.
[167] C.N. Scatterfield, Mass Transfer in Heterogeneous Catalysis, 2nd ed., 1981.
[168] A.S. Pushnov, Calculation of average bed porosity, Chem. Pet. Eng. 42 (2006) 14–17.
266
[169] H.S. Fogler, Elements of chemical reaction engineering, 4th ed., 2005.
[170] Process Systems Enterprise Limited, gPROMS, (2015).
[171] H. Jin, M. Ishida, Reactivity Study on Natural-Gas-Fueled Chemical-Looping Combustion by a
Fixed-Bed Reactor, Ind. Eng. Chem. Res. 41 (2002) 4004–4007.
[172] M. Rydén, A. Lyngfelt, T. Mattisson, D. Chen, A. Holmen, E. Bjørgum, Novel oxygen-carrier
materials for chemical-looping combustion and chemical-looping reforming; LaxSr1-xFeyCo1-yO3-δ
perovskites and mixed-metal oxides of NiO, Fe2O3 and Mn3O4, Int. J. Greenh. Gas Control. 2
(2008) 21–36.
[173] L.-S. Fan, Chemical Looping Systems for Fossil Energy Conversions, 2011.
[174] H.A. Jakobsen, Fixed Bed Reactors, 2011.
[175] M. Johansson, T. Mattisson, A. Lyngfelt, Comparison of oxygen carriers for chemical-looping
combustion, Therm. Sci. 10 (2006) 93–107.
[176] M. Johansson, T. Mattisson, M. Rydén, A. Lyngfelt, Carbon Capture via Chemical-Looping
Combustion and Reforming Chemical-Looping Combustion, in: Int. Semin. Carbon Sequestration
Clim. Chang., Rio de Janeiro, 2006.
[177] A.M. Diskin, R.H. Cunningham, R.M. Ormerod, The oxidative chemistry of methane over
supported nickel catalysts, Catal. Today. 46 (1998) 147–154.
[178] H. Roh, K. Jun, W. Dong, S. Park, Y. Joe, Partial Oxidation of Methane over Ni/θ-Al2O3
Catalysts, Chem. Lett. (2001) 3–4.
[179] Y. Lu, J. Xue, C. Yu, Y. Liu, S. Shen, Mechanistic investigations on the partial oxidation of
methane to synthesis gas over a nickel-on-alumina catalyst, Appl. Catal. A Gen. 174 (1998) 121–
128.
[180] V.A. Tsipouriari, Z. Zhang, X.E. Verykios, Catalytic Partial Oxidation of Methane to Synthesis
Gas over Ni-Based Catalysts: 1. Catalyst Performance Characteristics, J. Catal. 291 (1998) 283–
291.
[181] Y. Zhang, G. Xiong, S. Sheng, W. Yang, Deactivation studies over NiO/γ-Al2O3 catalysts for
partial oxidation of methane to syngas, Catal. Today. 63 (2000) 517–522.
[182] K. Schulze, W. Makowski, R. Chyzy, Nickel doped hydrotalcites as catalyst precursors for the
partial oxidation of light paraffins, Appl. Clay Sci. 18 (2001) 59–69.
[183] J.I. Villacampa, C. Royo, E. Romeo, J.A. Montoya, P. Del Angel, a. Monzón, Catalytic
decomposition of methane over Ni-Al2O3 coprecipitated catalysts, Appl. Catal. A Gen. 252
(2003) 363–383.
[184] T. Mattisson, M. Johansson, E. Jerndal, A. Lyngfelt, The reaction of NiO/NiAl2O4 particles with
alternating methane and oxygen, Can. J. Chem. Eng. 86 (2008) 756–767.
[185] C. Linderholm, T. Mattisson, A. Lyngfelt, Long-term integrity testing of spray-dried particles in a
10-kW chemical-looping combustor using natural gas as fuel, Fuel. 88 (2009) 2083–2096.
[186] J.-I. Baek, J.-W. Kim, J.B. Lee, T.H. Eom, J. Ryu, C.K. Ryu, et al., Effects of support on the
performance of NiO-Based oxygen carriers , Eff. Du Support Sur Les Performances Matériaux
Transp. D’oxygène à Base D'oxyde Nickel. 66 (2011) 223–234.
[187] C. Dueso, A. Abad, F. García-Labiano, L.F. de Diego, P. Gayán, J. Adánez, et al., Reactivity of a
NiO/Al2O3 oxygen carrier prepared by impregnation for chemical-looping combustion, Fuel. 89
(2010) 3399–3409.
[188] P. Ollero, a. Serrera, R. Arjona, S. Alcantarilla, Diffusional effects in TGA gasification
experiments for kinetic determination q, Fuel. 81 (2002) 1989–2000.
[189] T. a. a. Utigard, M. Wu, G. Plascencia, T. Marin, Reduction kinetics of Goro nickel oxide using
hydrogen, Chem. Eng. Sci. 60 (2005) 2061–2068.
[190] R. Chatterjee, S. Banerjee, S. Banerjee, D. Ghosh, Reduction of Nickel Oxide Powder and Pellet
by Hydrogen, Trans. Indian Inst. Met. 65 (2012) 265–273.
[191] N.L. Galinsky, Y. Huang, A. Shafiefarhood, F. Li, Iron Oxide with Facilitated O 2– Transport for
Facile Fuel Oxidation and CO2 Capture in a Chemical Looping Scheme, ACS Sustain. Chem. Eng.
1 (2013) 364–373.

267
[192] A. Gómez-Barea, P. Ollero, R. Arjona, Reaction-diffusion model of TGA gasification
experiments for estimating diffusional effects, Fuel. 84 (2005) 1695–1704.
[193] L. Han, Z. Zhou, G.M. Bollas, Heterogeneous modeling of chemical-looping combustion. Part 1:
Reactor model, Chem. Eng. Sci. 104 (2013) 233–249.
[194] R.B. Bird, W.E. Stewart, E.N. Lightfoot, Transport Phenomena, 2nd ed., John Wiley & Sons,
Inc., 2007.
[195] G. Pantoleontos, E.S. Kikkinides, M.C. Georgiadis, A heterogeneous dynamic model for the
simulation and optimisation of the steam methane reforming reactor, Int. J. Hydrogen Energy.
(2012) 1–13.
[196] E. Johansson, T. Mattisson, A. Lyngfelt, H. Thunman, Combustion of syngas and natural gas in a
300 W chemical-looping combustor, Chem. Eng. Res. Des. 84 (2006) 819–827.
[197] J. Adánez, C. Dueso, L.F. De Diego, F. García-Labiano, P. Gayán, A. Abad, Methane combustion
in a 500 Wth chemical-looping combustion system using an impregnated ni-based oxygen carrier,
Energy and Fuels. 23 (2009) 130–142.
[198] L.F. de Diego, M. Ortiz, J. Adánez, F. García-Labiano, A. Abad, P. Gayán, Synthesis gas
generation by chemical-looping reforming in a batch fluidized bed reactor using Ni-based oxygen
carriers, Chem. Eng. J. 144 (2008) 289–298.
[199] J. Adanez, F. García-Labiano, L.F. de Diego, P. Gayán, J. Celaya, A. Abad, Characterization of
oxygen carriers for chemical-looping combustion, 7th Int. Conf. Greenh. Gas Technol. 18 (2004)
9.
[200] T. Mattisson, M. Johansson, A. Lyngfelt, Multicycle reduction and oxidation of different types of
iron oxide particles-application to chemical-looping combustion, Energy & Fuels. 18 (2004) 628–
637.
[201] L.F. de Diego, F. Garcıa-Labiano, J. Adánez, P. Gayán, A. Abad, B.M. Corbella, et al.,
Development of Cu-based oxygen carriers for chemical-looping combustion, Fuel. 83 (2004)
1749–1757.
[202] E. Jerndal, T. Mattisson, A. Lyngfelt, Investigation of Different NiO/NiAl2O4 Particles as Oxygen
Carriers for Chemical-Looping Combustion, Energy & Fuels. 94 (2009) 665–676.
[203] A. Shulman, C. Linderholm, T. Mattisson, A. Lyngfelt, High Reactivity and Mechanical
Durability of NiO/NiAl2O4 and NiO/NiAl2O4/MgAl2O4 Oxygen Carrier Particles Used for more
than 1000 h in a 10 kW CLC Reactor, Ind. Eng. Chem. Res. 48 (2009) 7400–7405.
[204] A. Fossdal, E. Bakken, B.A. Øye, C. Schøning, I. Kaus, T. Mokkelbost, et al., Study of
inexpensive oxygen carriers for chemical looping combustion, Int. J. Greenh. Gas Control. 5
(2011) 483–488.
[205] S. Zhang, C. Saha, Y. Yang, S. Bhattacharya, R. Xiao, Use of Fe2O3-Containing Industrial Wastes
As the Oxygen Carrier for Chemical-Looping Combustion of Coal: Effects of Pressure and
Cycles, Energy & Fuels. 25 (2011) 4357–4366.
[206] H. Gu, L. Shen, J. Xiao, S. Zhang, T. Song, Chemical Looping Combustion of Biomass/Coal with
Natural Iron Ore as Oxygen Carrier in a Continuous Reactor, Energy & Fuels. 25 (2011) 446–455.
[207] H. Leion, T. Mattisson, A. Lyngfelt, Use of Ores and Industrial Products As Oxygen Carriers in
Chemical-Looping Combustion, Energy & Fuels. 23 (2009) 2307–2315.
[208] T. Pröll, K. Mayer, J. Bolhàr-Nordenkampf, P. Kolbitsch, T. Mattisson, A. Lyngfelt, et al.,
Natural minerals as oxygen carriers for chemical looping combustion in a dual circulating
fluidized bed system, Energy Procedia. 1 (2009) 27–34.
[209] M. Schwaab, L.P. Lemos, J.C. Pinto, Optimum reference temperature for reparameterization of
the Arrhenius equation. Part 2: Problems involving multiple reparameterizations, Chem. Eng. Sci.
63 (2008) 2895–2906.
[210] H. Leion, A. Lyngfelt, M. Johansson, E. Jerndal, T. Mattisson, The use of ilmenite as an oxygen
carrier in chemical-looping combustion, Chem. Eng. Res. Des. 86 (2008) 1017–1026.
[211] H. Leion, E. Jerndal, B.-M. Steenari, S. Hermansson, M. Israelsson, E. Jansson, et al., Solid fuels
in chemical-looping combustion using oxide scale and unprocessed iron ore as oxygen carriers,
268
Fuel. 88 (2009) 1945–1954.
[212] M.M. Yazdanpanah, A. Forret, T. Gauthier, A. Delebarre, Modeling of CH4 combustion with
NiO/NiAl2O4 in a 10kWth CLC pilot plant, Appl. Energy. 113 (2014) 1933–1944.
[213] A. Cabello, P. Gayán, F. García-Labiano, L.F. de Diego, A. Abad, M.T. Izquierdo, et al.,
Relevance of the catalytic activity on the performance of a NiO/CaAl2O4 oxygen carrier in a CLC
process, Appl. Catal. B Environ. 147 (2014) 980–987.
[214] M.M. Hossain, H.I. de Lasa, Reduction and oxidation kinetics of Co-Ni/Al2O3 oxygen carrier
involved in a chemical-looping combustion cycles, Chem. Eng. Sci. 65 (2010) 98–106.
[215] H.-J. Ryu, D.-H. Bae, K.-H. Han, S.-Y. Lee, G.-T. Jin, J.-H. Choi, Oxidation and reduction
characteristics of oxygen carrier particles and reaction kinetics by unreacted core model, Korean J.
Chem. Eng. 18 (2001) 831–837.
[216] M. Ortiz, A. Abad, L.F. De Diego, F. García-Labiano, P. Gayán, J. Adánez, Optimization of
hydrogen production by Chemical-Looping auto-thermal Reforming working with Ni-based
oxygen-carriers, Int. J. Hydrogen Energy. 36 (2011) 9663–9672.
[217] A. Abad, J. Adánez, F. García-Labiano, L.F. de Diego, P. Gayán, J. Celaya, Mapping of the range
of operational conditions for Cu-, Fe-, and Ni-based oxygen carriers in chemical-looping
combustion, Chem. Eng. Sci. 62 (2007) 533–549.
[218] M.R. Rahimpour, M. Hesami, M. Saidi, A. Jahanmiri, M. Farniaei, M. Abbasi, Methane Steam
Reforming Thermally Coupled with Fuel Combustion: Application of Chemical Looping Concept
as a Novel Technology, Energy & Fuels. 27 (2013) 2351–2362.
[219] J. Xu, G.F. Froment, Methane steam reforming, methanation and water-gas shift: I. Intrinsic
kinetics, AIChE J. 35 (1989) 88–96.
[220] K. Hou, R. Hughes, The kinetics of methane steam reforming over a Ni/α-Al2O catalyst, Chem.
Eng. J. 82 (2001) 311–328.
[221] J. Klose, M. Baerns, Kinetics of the methanation of carbon monoxide on an alumina-supported
nickel catalyst, J. Catal. 85 (1984) 105–116.
[222] R.W. Atherton, R.B. Schainker, E.R. Ducot, On the statistical sensitivity analysis of models for
chemical kinetics, AIChE J. 21 (1975) 441–448.
[223] P. Heidebrecht, K. Sundmacher, L.T. Biegler, Optimal design of nonlinear temperature
programmed reduction experiments, AIChE J. 57 (2011) 2888–2901.
[224] Z.R. Lazic, Design of Experiments in Chemical Engineering: A Practical Guide, Wiley-VCH,
Weinheim, Germany, 2004.
[225] G.E.P. Box, N.R. Draper, Empirical Model-Building and Response Surfaces, 1st ed., Wiley, New
York, 1987.
[226] G.E.P. Box, J.S. Hunter, W.G. Hunter, Statistics for Experimenters: An Introduction to Design,
Data Analysis, and Model Building, Wiley, New York, 1978.
[227] A.C. Atkinson, A.N. Donev, Optimum Experimental Designs, Oxford University Press, New
York, 1992.
[228] G. Vicente, a Coteron, M. Martinez, J. Aracil, Application of the factorial design of experiments
and response surface methodology to optimize biodiesel production, Ind. Crops Prod. 8 (1998) 29–
35.
[229] M.A. Dias, C.A. Rosa, V.L.R. Linardi, R.A. Conte, H.F. de Castro, H.F. De Castro, Application
of factorial design to study of heavy metals biosorption by waste biomass from beverage
distillery., Appl. Biochem. Biotechnol. 91-93 (2001) 413–422.
[230] J. Chen, K. Wang, Sequential Experimental Design Strategy for Optimal Batch Profiles Using
Hybrid Function Approximations, Ind. Eng. Chem. Res. 43 (2004) 5260–5274.
[231] I. a M. Swinnen, K. Bernaerts, K. Gysemans, J.F. Van Impe, Quantifying microbial lag
phenomena due to a sudden rise in temperature: a systematic macroscopic study., Int. J. Food
Microbiol. 100 (2005) 85–96.
[232] G. Franceschini, S. Macchietto, Model-based design of experiments for parameter precision: State
of the art, Chem. Eng. Sci. 63 (2008) 4846–4872.
269
[233] G.F. Froment, L.H. Hosten, Catalytic kinetics: Modelling, in: J.R. Anderson, M. Boudart (Eds.),
Catal. Sci. Technol., Springer-Verlag, 1981.
[234] G.E.P. Box, W.G. Hunter, The Experimental Study of Physical Mechanisms, Technometrics. 7
(1965) 23–42.
[235] N.R. Draper, W.G. Hunter, The use of prior distributions in the design of experiments for
parameter estimation in non-linear situations: multiresponse case., Biometrika. 54 (1967) 662–
665.
[236] N.R. Draper, W.G. Hunter, Design of Experiments for Parameter Estimation in Multiresponse
Situations, Biometrika. 53 (1966) 525–533.
[237] W.G. Hunter, W.J. Hill, T.L. Henson, Designing experiments for precise estimation of all or some
of the constants in a mechanistic model, Can. J. Chem. Eng. 47 (1969) 76–80.
[238] R.K. Mehra, Optimal Input Signals for Parameter Estimation in Dynamic Systems-Survey and
New Results, IEEE Trans. Automat. Contr. 19 (1974) 753–768.
[239] R.W. Shirt, T.J. Harris, D.W. Bacon, Experimental Design Considerations for Dynamic Systems,
Ind. Eng. Chem. Res. 33 (1994) 2656–2667.
[240] D. Espie, S. Macchietto, The optimal design of dynamic experiments, AIChE J. 35 (1989) 223–
229.
[241] S.P. Asprey, S. Macchietto, Statistical tools for optimal dynamic model building, Comput. Chem.
Eng. 24 (2000) 1261–1267.
[242] L. Benabbas, S.P. Asprey, S. Macchietto, Curvature-based methods for designing optimally
informative experiments in multiresponse nonlinear dynamic situations, Ind. Eng. Chem. Res. 44
(2005) 7120–7131.
[243] F. Galvanin, M. Barolo, S. Macchietto, F. Bezzo, Optimal Design of Clinical Tests for the
Identification of Physiological Models of Type 1 Diabetes Mellitus, Ind. Eng. Chem. Res. 48
(2009) 1989–2002.
[244] A. Munack, Optimal Feeding Strategy for Identification of Monod-Type Models by Fed-Batch
Experiments, in: N.M. Fish, R.I. Fox, N.F. Thornhill (Eds.), Comput. Appl. Ferment. Technol.
Model. Control Biotechnol. Process., Springer Netherlands, 1989: pp. 195–204.
[245] P.A. Vanrolleghem, M. van Daele, D. Dochain, Practical identifiability of a biokinetic model of
activated sludge respiration, Water Res. 29 (1995) 2561–2570.
[246] A. Holmberg, On the practical identifiability of microbial growth models incorporating
Michaelis-Menten type nonlinearities, Math. Biosci. 62 (1982) 23–43.
[247] F.R. Sidoli, A. Mantalaris, S.P. Asprey, Toward global parametric estimability of a large-scale
kinetic single-cell model for mammalian cell cultures, Ind. Eng. Chem. Res. 44 (2005) 868–878.
[248] F. Galvanin, A. Boschiero, M. Barolo, F. Bezzo, Model-Based Design of Experiments in the
Presence of Continuous Measurement Systems, Ind. Eng. Chem. Res. 50 (2011) 2167–2175.
[249] G. Franceschini, S. Macchietto, Novel Anticorrelation Criteria for Model-Based Experiment
Design: Theory and Formulations, AIChE J. 54 (2008) 1009–1024.
[250] M. Brendel, W. Marquardt, Experimental design for the identification of hybrid reaction models
from transient data, Chem. Eng. J. 141 (2008) 264–277.
[251] M.D. Hoang, T. Barz, V.A. Merchan, L.T. Biegler, H. Arellano-Garcia, Simultaneous solution
approach to model-based experimental design, AIChE J. 59 (2013) 4169–4183.
[252] B.H. Chen, S.P. Asprey, On the Design of Optimally Informative Dynamic Experiments for
Model Discrimination in Multiresponse Nonlinear Situations, Ind. Eng. Chem. Res. 42 (2003)
1379–1390.
[253] M. Rodriguez-Fernandez, P. Mendes, J.R. Banga, A hybrid approach for efficient and robust
parameter estimation in biochemical pathways., Biosystems. 83 (2006) 248–265.
[254] S. Žaković, B. Rustem, S.P. Asprey, A parallel algorithm for semi-infinite programming, Comput.
Stat. Data Anal. 44 (2003) 377–390.
[255] T. Barz, H. Arellano-Garcia, G. Wozny, Handling Uncertainty in Model-Based Optimal
Experimental Design, Ind. Eng. Chem. Res. 49 (2010) 5702–5713.
270
[256] J.A. Francesconi, M.C. Mussati, P.A. Aguirre, Analysis of design variables for water-gas-shift
reactors by model-based optimization, J. Power Sources. 173 (2007) 467–477.
[257] C. Michalik, T. Schmidt, M. Zavrel, M. Ansorge-Schumacher, A. Spiess, W. Marquardt,
Application of the incremental identification method to the formate oxidation using formate
dehydrogenase, Chem. Eng. Sci. 62 (2007) 5592–5597.
[258] A. Vikhansky, Numerical analysis of the global identifiability of reaction–diffusion systems,
Comput. Chem. Eng. 35 (2011) 1978–1982.
[259] A. Yang, E. Martin, G. Montague, J. Morris, Optimal experimental design for the precision of a
subset of model parameters in process development, in: W. Markquardt, C. Pantelides (Eds.), 16th
Eur. Symp. Comput. Aided Process Eng. 9th Int. Symp. Process Syst. Eng., Elsevier B.V., 2006:
pp. 563–568.
[260] A.C. Atkinson, B. Bogacka, D- and Ds-Optimum Compound Designs for the Order of a Chemical
Determining Reaction, Technometrics. 39 (1997) 347–356.
[261] G. Franceschini, S. Macchietto, Anti-Correlation Approach to Model-Based Experiment Design:
Application to a Biodiesel Production Process, Ind. Eng. Chem. Res. 47 (2008) 2331–2348.
[262] G. Franceschini, S. Macchietto, Validation of a Model for Biodiesel Production through Model-
Based Experiment Design, Ind. Eng. Chem. Res. 46 (2007) 220–232. doi:10.1021/ie060758c.
[263] C. Han, K. Chaloner, Bayesian Experimental Design for Nonlinear Mixed-Effects Models with
Application to HIV Dynamics, Biometrics. 60 (2004) 25–33.
[264] P. Vajjah, S.B. Duffull, A generalisation of T-optimality for discriminating between competing
models with an application to pharmacokinetic studies., Pharm. Stat. 11 (2012) 503–510.
[265] M. Zavrel, C. Michalik, T. Schwendt, T. Schmidt, M. Ansorge-Schumacher, C. Janzen, et al.,
Systematic determination of intrinsic reaction parameters in enzyme immobilizates, Chem. Eng.
Sci. 65 (2010) 2491–2499.
[266] F. Galvanin, S. Macchietto, F. Bezzo, V. Pado, V. Marzolo, Model-Based Design of Parallel
Experiments, Ind. Eng. Chem. Res. 46 (2007) 871–882.
[267] L. Zivanović, A. Licanski, M. Zecević, B. Jocić, M. Kostić, Application of experimental design in
optimization of solid phase extraction of mycophenolic acid and mycophenolic acid glucuronide
from human urine and plasma and SPE-RP-HPLC method validation., J. Pharm. Biomed. Anal. 47
(2008) 575–585.
[268] M. Brendel, D. Bonvin, W. Marquardt, Incremental identification of kinetic models for
homogeneous reaction systems, Chem. Eng. Sci. 61 (2006) 5404–5420.
[269] M.P. Saccomani, S. Audoly, L. D’Angiò, Parameter identifiability of nonlinear systems: the role
of initial conditions, Automatica. 39 (2003) 619–632.
[270] O.-T. Chis, J.R. Banga, E. Balsa-Canto, Structural Identifiability of Systems Biology Models: A
Critical Comparison of Methods, PLoS One. 6 (2011) e27755.
[271] H. Miao, X. Xia, A.S. Perelson, H. Wu, On Identifiability of Nonlinear Ode Models and
Applications in Viral Dynamics, SIAM Rev. Soc. Ind. Appl. Math. 53 (2011) 3–39.
[272] L. Ljung, T. Glad, On Global Identifiability for Arbitrary Model Parametrizations, Automatica. 30
(1994) 265–276.
[273] A. Saltelli, M. Ratto, S. Tarantola, F. Campolongo, Sensitivity analysis for chemical models,
Chem. Rev. 105 (2005) 2811–2827.
[274] J. Guedj, R. Thiébaut, D. Commenges, Practical identifiability of HIV dynamics models., Bull.
Math. Biol. 69 (2007) 2493–2513.
[275] L. Denis-Vidal, G. Joly-blanchard, An Easy to Check Criterion for (Un)identifiability of
Uncontrolled Systems and Its Applications, IEEE Trans. Autom. Control Autom. Control. 45
(2000) 768–771.
[276] L. Denis-Vidal, G. Joly-Blanchard, C. Noiret, Some effective approaches to check the
identifiability of uncontrolled nonlinear systems, Math. Comput. Simul. 57 (2001) 35–44.
[277] E. Walter, I. Braems, L. Jaulin, M. Kieffer, Guaranteed Numerical Computation as an Alternative
to Computer Algebra for Testing Models for Identifiability, in: R. Alt, A. Frommer, R.B. Keafott,
271
W. Luther (Eds.), Numer. Softw. with Result Verif., Springer Berlin Heidelberg, Dagstuhl Castle,
2004: pp. 124–131.
[278] H. Pohjanpalo, System identifiability based on the power series expansion of the solution, Math.
Biosci. 41 (1978) 21–33.
[279] E. Walter, Y. Lecourtier, Global approaches to identifiability testing for linear and nonlinear state
space models, Math. Comput. Simul. 24 (1982) 472–482.
[280] M.J. Chappell, K.R. Godfrey, Structural identifiability of the parameters of a nonlinear batch
reactor model, Math. Biosci. 108 (1992) 241–251.
[281] S. Vajda, K.R. Godfrey, H. Rabitz, Similarity transformation approach to identifiability analysis
of nonlinear compartmental models, Math. Biosci. 93 (1989) 217–248.
[282] G. Margaria, E. Riccomagno, M.J. Chappell, H.P. Wynn, Differential algebra methods for the
study of the structural identifiability of rational function state-space models in the biosciences,
Math. Biosci. 174 (2001) 1–26.
[283] X. Xia, C.H. Moog, Identifiability of Nonlinear Systems With Application to HIV/AIDS Models,
IEEE Trans. Automat. Contr. 48 (2003) 330–336.
[284] B.H. Chen, S. Bermingham, A.H. Neumann, H.J.M. Kramer, S.P. Asprey, On the Design of
Optimally Informative Experiments for Dynamic Crystallization Process Modeling, Ind. Eng.
Chem. Res. 43 (2004) 4889–4902.
[285] A. Raue, C. Kreutz, T. Maiwald, J. Bachmann, M. Schilling, U. Klingmüller, et al., Structural and
practical identifiability analysis of partially observed dynamical models by exploiting the profile
likelihood., Bioinformatics. 25 (2009) 1923–1929.
[286] J. Karlsson, M. Anguelova, An Efficient Method for Structural Identifiability Analysis of Large
Dynamic Systems, in: 16th IFAC Symp. Syst. Identif., Brussels, Belgium, 2012: pp. 941–946.
[287] F. Galvanin, C.C. Ballan, M. Barolo, F. Bezzo, A general model-based design of experiments
approach to achieve practical identifiability of pharmacokinetic and pharmacodynamic models., J.
Pharmacokinet. Pharmacodyn. 40 (2013) 451–467.
[288] M. Rodriguez-Fernandez, J.A. Egea, J.R. Banga, Novel metaheuristic for parameter estimation in
nonlinear dynamic biological systems., BMC Bioinformatics. 7 (2006) 483.
[289] T.J. Rothenberg, Identification in Parametric Models, Econometrica. 39 (1971) 577–591.
[290] R. Mehra, Optimal input signals for parameter estimation in dynamic systems--Survey and new
results, IEEE Trans. Automat. Contr. 19 (1974).
[291] D.E. Zak, G.E. Gonye, J.S. Schwaber, F.J. Doyle III, Importance of Input Perturbations and
Stochastic Gene Expression in the Reverse Engineering of Genetic Regulatory Networks: Insights
From an Identifiability Analysis of an In Silico Network, Genome Res. 13 (2003) 2396–2405.
[292] A.J. Jacquez, P. Greif, Numerical Parameter Identifiability and Estimability: Integrating
Identifiability, Estimability, and Optimal Sampling Design, Math. Biosci. 77 (1985) 201–227.
[293] C. Cobelli, J.J. DiStefano, Parameter and structural identifiability concepts and ambiguities: a
critical review and analysis., Am. J. Physiol. 239 (1980) R7–R24.
[294] G.E. Box, K.B. Wilson, On the Experimental Attainment of Optimum Conditions, J. R. Stat. Soc.
Ser. B. 13 (1951) 1–45.
[295] F.R. Sidoli, A. Mantalaris, S.P. Asprey, Modelling of Mammalian cells and cell culture
processes., Cytotechnology. 44 (2004) 27–46.
[296] W.G. Hunter, A.M. Reiner, Designs for discriminating between two rival models, Technometrics.
7 (1965) 307–323.
[297] A.C. Atkinson, V. V Fedorov, Optimal design: Experiments for discriminating between several
models, Biometrika. 62 (1975) 289–303.
[298] A.C. Atkinson, V.V. Fedorov, The Design of Experiments for Discriminating Between two Rival
Models, Biometrika. 62 (1975) 57–70.
[299] S.M. Stigler, Optimal Experimental Design for Polynomial Regression, J. Am. Stat. Assoc. 66
(1971) 311–318.
[300] D. Uciński, B. Bogacka, T-optimum designs for discrimination between two multiresponse
272
dynamic models, J. R. Stat. Soc. B. 67 (2005) 3–18.
[301] H. Dette, V.B. Melas, P. Shpilev, Robust T-optimal discriminating designs, Ann. Stat. 41 (2013)
1693–1715.
[302] H. Dette, V.B. Melas, P. Shpilev, T-OPTIMAL DESIGNS FOR DISCRIMINATION BETWEEN
TWO POLYNOMIAL MODELS, Ann. Stat. 40 (2012) 188–205.
[303] C. Tommasi, J. López-Fidalgo, Bayesian optimum designs for discriminating between models
with any distribution, Comput. Stat. Data Anal. 54 (2010) 143–150.
[304] T.H. Waterhouse, J. a Eccleston, S.B. Duffull, Optimal design criteria for discrimination and
estimation in nonlinear models., J. Biopharm. Stat. 19 (2009) 386–402.
[305] R. King, S.P. Brooks, Bayesian model discrimination for multiple strata capture-recapture data,
Biometrika. 89 (2002) 785–806.
[306] W.E. Stewart, Y. Shon, G.E.P. Box, Discrimination and goodness of fit of multiresponse
mechanistic models, AIChE J. 44 (1998) 1404–1412.
[307] G.E.P. Box, W.J. Hill, Discrimination Among Mechanistic Models, Technometrics. 9 (1967) 57–
71.
[308] K. Chaloner, I. Verdinelli, Bayesian Experimental Design: A Review, Stat. Sci. 10 (1995) 273–
304.
[309] D.J. Pritchard, D.W. Bacon, Statistical assessment of chemical kinetic models, Chem. Eng. Sci.
30 (1975) 567–574.
[310] G. Buzzi-Ferraris, P. Forzatti, A new sequential experimental design procedure for discriminating
among rival models, Chem. Eng. Sci. 38 (1983) 225–232.
[311] G. Buzzi-Ferraris, Planning of experiments and kinetic analysis, Catal. Today. 52 (1999) 125–
132.
[312] W.W. Hines, D.C. Montgomery, Probability and Statistics in Engineering, 4th ed., Wiley, New
York, 2003.
[313] A.C. Atkinson, Posterior probabilities for choosing a regression model, Biometrika. 65 (1978)
39–48.
[314] F.J. Dumez, L.H. Hosten, G.F. Froment, The Use of Sequential Discrimination in the Kinetic
Study of 1 -Butene Dehydrogenation, Ind. Eng. Chem. Fundam. 16 (1977) 298–301.
[315] M.J. Cooney, K.A. McDonald, Optimal dynamic experiments for bioreactor model
discrimination, Appl. Microbiol. Biotechnol. 43 (1995) 826–837.
[316] G. Buzzi Ferraris, P. Forzatti, G. Emig, H. Hofmann, Sequential experimental design for model
discrimination in the case of multiple responses, Chem. Eng. Sci. 39 (1984) 81–85.
[317] E. Walter, L. Pronzato, Qualitative and quantitative experiment design for phenomenological
models—A survey, Automatica. 26 (1990) 195–213.
[318] A.C. Atkinson, A.N. Donev, Optimum experimental designs, Clarendon Press, 1992.
[319] D.L. Ma, R.D. Braatz, Robust identification and control of batch processes, Comput. Chem. Eng.
27 (2003) 1175–1184.
[320] E. Van Derlinden, K. Bernaerts, J.F. Van Impe, Simultaneous versus sequential optimal
experiment design for the identification of multi-parameter microbial growth kinetics as a function
of temperature, J. Theor. Biol. 264 (2010) 347–355.
[321] L.M. Cunha, F.A.R. Oliveira, Optimal experimental design for estimating the kinetic parameters
of processes described by the first-order Arrhenius model under linearly increasing temperature
profiles, J. Food Eng. 46 (2000) 53–60.
[322] A. Flores-Sánchez, A. Flores-Tlacuahuac, L.L. Pedraza-Segura, Model-Based Experimental
Design to Estimate Kinetic Parameters of the Enzymatic Hydrolysis of Lignocellulose, Ind. Eng.
Chem. Res. 52 (2013) 4834–4850.
[323] J.C. Pinto, M.W. Lobão, J.L. Monteiro, Sequential experimental design for parameter estimation:
a different approach, Chem. Eng. Sci. 45 (1990) 883–892.
[324] Z. Zhou, L. Han, G.M. Bollas, Overview of Chemical-Looping Reduction in Fixed Bed and
Fluidized Bed Reactors Focused on Oxygen Carrier Utilization and Reactor Efficiency, Aerosol

273
Air Qual. Res. 14 (2014) 559–571.
[325] J. Solsvik, H.A. Jakobsen, Impacts on the reactor performance of intra-particle multicomponent
mass diffusion limitations: Knudsen diffusion, Energy Procedia. 26 (2012) 116–124.
[326] J. Solsvik, H. a. Jakobsen, Modeling of multicomponent mass diffusion in porous spherical
pellets: Application to steam methane reforming and methanol synthesis, Chem. Eng. Sci. 66
(2011) 1986–2000.
[327] J. Solsvik, S. Tangen, H.A. Jakobsen, On the Consistent Modeling of Porous Catalyst Pellets:
Mass and Molar Formulations, Ind. Eng. Chem. Res. 51 (2012) 8222–8236.
[328] M. Schwaab, J.C. Pinto, Optimum reference temperature for reparameterization of the Arrhenius
equation. Part 1: Problems involving one kinetic constant, Chem. Eng. Sci. 62 (2007) 2750–2764.
[329] D.J. Pritchard, D.W. Bacon, Prospects for reducing correlations among parameter estimates in
kinetic models, Chem. Eng. Sci. 33 (1978) 1539–1543.
[330] A. Cuesta, A. Martínez-Alonso, J.M.D. Tascón, Correlation between Arrhenius Kinetic
Parameters in the Reaction of Different Carbon Materials with Oxygen, Energy & Fuels. 7 (1993)
1141–1145.
[331] D.M. Espie, S. Macchietto, Nonlinear transformations for parameter estimation, Ind. Eng. Chem.
Res. 27 (1988) 2175–2179.
[332] D.G. Watts, Estimating parameters in nonlinear rate equations, Can. J. Chem. Eng. 72 (1994)
701–710.
[333] L. Han, Z. Zhou, G.M. Bollas, Model-based Analysis of Chemical-Looping Combustion
Experiments. Part I: Structural Identifiability of Kinetic Models, AIChE J. (2015) (In Review).
[334] A.K. Avetisov, J.R. Rostrup-Nielsen, V.L. Kuchaev, J.-H. Bak Hansen, A.G. Zyskin, E.N.
Shapatina, Steady-state kinetics and mechanism of methane reforming with steam and carbon
dioxide over Ni catalyst, J. Mol. Catal. A Chem. 315 (2010) 155–162.
[335] J. Rostrup-Nielsen, L.J. Christiansen, Concepts in Syngas Manufacture (Catalytic Science), 1st
ed., Imperial College Press, 2011.
[336] J.R. Rostrup-Nielsen, Steam reforming, in: J.R. Anderson, M. Boudart (Eds.), Catal. Sci.
Technol., Springer-Verlag, Berlin, 1984: pp. 1–117.
[337] J. Rostrup-Nielsen, Reaction Kinetics and Industrial Catalysis, in: R.W. Joyner, R.A. van Santen
(Eds.), Elem. React. Steps Heterog. Catal., Kluwer Academic Publishers, Dordrecht, 1993: pp.
441–461.
[338] A. Franco, A. Franco, C. Casarosa, C. Casarosa, On some perspectives for increasing the
efficiency of combined cycle power plants, Appl. Therm. Eng. 22 (2002) 1501–1518.
[339] T. Heppenstall, Advanced gas turbine cycles for power generation: a critical review, Appl. Therm.
Eng. 18 (1998) 837–846.
[340] Sargent & Lundy, New Coal-fired Power Plant Performance and Cost Estimates, 2009.
[341] M.C. Woods, P.J. Capicotto, J.L. Haslbeck, N.J. Kuehn, M. Matuszewski, L.L. Pinkerton, et al.,
Cost and Performance Baseline for Fossil Energy Plants. Volume 1: Bituminous Coal and Natural
Gas to Electricity, DOE/NETL, 2013.
[342] T.A. Adams II, P.I. Barton, High-efficiency power production from natural gas with carbon
capture, J. Power Sources. 195 (2010) 1971–1983.
[343] P. Chiesa, S. Consonni, Natural Gas Fired Combined Cycles With Low CO2 Emissions, J. Eng.
Gas Turbines Power. 122 (2000) 429.
[344] Y.S. Kim, J.J. Lee, T.S. Kim, J.L. Sohn, Y.J. Joo, Performance analysis of a syngas-fed gas
turbine considering the operating limitations of its components, Appl. Energy. 87 (2010) 1602–
1611.
[345] C. Descamps, C. Bouallou, M. Kanniche, Efficiency of an Integrated Gasification Combined
Cycle (IGCC) power plant including CO2 removal, Energy. 33 (2008) 874–881.
[346] Rolf Bachmann, H. Nielsen, J. Warner, R. Kehlofer, Combined-Cycle Gas & Steam Turbine
Power Plants, 3rd ed., PennWell, Tulsa, Oklahoma, 2009.
274
[347] C. Linderholm, A. Abad, T. Mattisson, A. Lyngfelt, 160 h of chemical-looping combustion in a
10 kW reactor system with a NiO-based oxygen carrier, Int. J. Greenh. Gas Control. 2 (2008) 520–
530.
[348] J. Adánez, P. Gayán, J. Celaya, L.F. De Diego, F. García-Labiano, A. Abad, Chemical looping
combustion in a 10 kWth prototype using a CuO/Al2O3 oxygen carrier: Effect of operating
conditions on methane combustion, Ind. Eng. Chem. Res. 45 (2006) 6075–6080.
[349] E. Johansson, T. Mattisson, A. Lyngfelt, H. Thunman, A 300W laboratory reactor system for
chemical-looping combustion with particle circulation, Fuel. 85 (2006) 1428–1438.
[350] A. Abad, T. Mattisson, A. Lyngfelt, M. Johansson, The use of iron oxide as oxygen carrier in a
chemical-looping reactor, Fuel. 86 (2007) 1021–1035.
[351] R. Xiao, Q. Song, M. Song, Z. Lu, S. Zhang, L. Shen, Pressurized chemical-looping combustion
of coal with an iron ore-based oxygen carrier, Combust. Flame. 157 (2010) 1140–1153.
[352] R. Xiao, Q. Song, S. Zhang, W. Zheng, Y. Yang, Pressurized chemical-looping combustion of
chinese bituminous coal: Cyclic performance and characterization of iron ore-based oxygen
carrier, Energy & Fuels. 24 (2010) 1449–1463.
[353] A. Bischi, Ø. Langørgen, I. Saanum, J. Bakken, M. Seljeskog, M. Bysveen, et al., Design study of
a 150kWth double loop circulating fluidized bed reactor system for chemical looping combustion
with focus on industrial applicability and pressurization, Int. J. Greenh. Gas Control. 5 (2010)
467–474.
[354] J.R. Fernández, J.C. Abanades, Conceptual design of a Ni-based chemical looping combustion
process using fixed-beds, Appl. Energy. 135 (2014) 309–319.
[355] D.R. Clarke, M. Oechsner, N.P. Padture, Thermal-barrier coatings for more efficient gas-turbine
engines, MRS Bull. 37 (2012) 891–898.
[356] H.P. Hamers, M.C. Romano, V. Spallina, P. Chiesa, F. Gallucci, M.V.S. Annaland, Comparison
on process efficiency for CLC of syngas operated in packed bed and fluidized bed reactors, Int. J.
Greenh. Gas Control. 28 (2014) 65–78.
[357] S. Noorman, F. Gallucci, M.M. van Sint Annaland, J.A.M. Kuipers, A theoretical investigation of
CLC in packed beds. Part 2: Reactor model, Chem. Eng. J. 167 (2011) 369–376.
[358] V. Spallina, F. Gallucci, M.C.C. Romano, P. Chiesa, G. Lozza, M. Van Sint Annaland,
Investigation of heat management for CLC of syngas in packed bed reactors, Chem. Eng. J. 225
(2013) 174–191.
[359] I. Martínez, M.C. Romano, J.R. Fernández, P. Chiesa, R. Murillo, J.C. Abanades, Process design
of a hydrogen production plant from natural gas with CO2 capture based on a novel Ca/Cu
chemical loop, Appl. Energy. 114 (2014) 192–208.
[360] J.R. Fernández, J.M. Alarcón, Chemical looping combustion process in fixed-bed reactors using
ilmenite as oxygen carrier: Conceptual design and operation strategy, Chem. Eng. J. 264 (2015)
797–806.
[361] A. Tică, H. Guéguen, D. Dumur, D. Faille, F. Davelaar, Design of a combined cycle power plant
model for optimization, Appl. Energy. 98 (2012) 256–265.
[362] F. He, Z. Li, P. Liu, L. Ma, E.N. Pistikopoulos, Operation window and part-load performance
study of a syngas fired gas turbine, Appl. Energy. 89 (2012) 133–141.
[363] Y.S. Kim, S.K. Park, J.J. Lee, D.W. Kang, T.S. Kim, Analysis of the impact of gas turbine
modifications in integrated gasification combined cycle power plants, Energy. 55 (2013) 977–986.
[364] J.R. Fernandez, J.C. Abanades, R. Murillo, Modeling of Cu oxidation in an adiabatic fixed-bed
reactor with N2 recycling, Appl. Energy. 113 (2014) 1945–1951.
[365] B. Sathyaseelan, I. Baskaran, K. Sivakumar, Phase Transition Behavior of Nanocrystalline Al2O3
Powders, Soft Nanosci. Lett. 3 (2013) 69–74.
[366] C. Iloeje, Z. Zhao, A.F. Ghoniem, Analysis of thermally coupled chemical looping combustion-
based power plants with carbon capture, Int. J. Greenh. Gas Control. 35 (2015) 56–70.
[367] A. Lawal, M. Wang, P. Stephenson, O. Obi, Demonstrating full-scale post-combustion CO2
capture for coal-fired power plants through dynamic modelling and simulation, Fuel. 101 (2012)
275
115–128.
[368] L. Han, Z. Zhou, G.M. Bollas, Model-based Analysis of Chemical-Looping Combustion
Experiments. Part II: Optimal Design of Reduction Experiments, AIChE J. (2015) (In Review).
[369] O. Nordness, L. Han, Z. Zhou, G.M. Bollas, Kinetic Study of High-Pressure Chemical-Looping
Combustion (CLC) Experiments with Methane and Synthesis gas with Ni and Cu Oxygen
Carriers, Energy & Fuels. Accepted (2015).
[370] W.J. Fischer, P. Nag, H-class High Performance Siemens Gas Turbine SGT-8000H series, in:
Power-Gen Int., Las Vegas, NV, 2011.
[371] A. Foust, Siemens SGT6-5000F Gas Turbine - An Evolutionary Approach, in: Electr. Power
Conf. Exhib., New Orleans, LA, 2014.
[372] F.J. Brooks, GE Gas Turbine Performance Characteristics, Schenectady, NY, 2000.
[373] J.R. Johnston, Performance and Relability Improvements for Heavy-Duty Gas Turbines,
Schenectady, NY, 2000.
[374] L. Han, G.M. Bollas, Dynamic Optimization of Fixed Bed Chemical-Looping Processes, Energy.
(2015) (In review).
[375] A. Lyngfelt, M. Johansson, T. Mattisson, Chemical-Looping Combustion-Status of Development,
in: 9th Int. Conf. Circ. Fluid. Beds, Hamburg, Germany, 2008.
[376] J. Wolf, J. Yan, Parametric study of chemical looping combustion for tri-generation of hydrogen,
heat, and electrical power with CO2 capture, Int. J. Energy Res. 29 (2005) 739–753.
[377] M. Ishida, M. Yamamoto, T. Ohba, Experimental results of chemical-looping combustion with
NiO/NiAl2O4 particle circulation at 1200 ° C, Energy Convers. 43 (2002) 1469–1478.
[378] E. Jerndal, T. Mattisson, A. Lyngfelt, Investigation of Different NiO/NiAl2O4 Particles as
Oxygen Carriers for Chemical-Looping Combustion, Energy & Fuels. 23 (2009) 665–676.
[379] K.E. Sedor, M.M. Hossain, H.I. de Lasa, Reactivity and stability of Ni/Al2O3 oxygen carrier for
chemical-looping combustion (CLC), Chem. Eng. Sci. 63 (2008) 2994–3007.
[380] M. Johansson, T. Mattisson, A. Lyngfelt, Use of NiO/NiAl2O4 Particles in a 10 kW Chemical-
Looping Combustor, Ind. Eng. Chem. Res. 45 (2006) 5911–5919.
[381] H.-. J. Ryu, G. Jin, C. Yi, Demonstration of inherent CO2 separation and no NOx emission in a
50kW chemical-looping combustor: Continuous reduction and oxidation experiment, in: Conf.
Greenh. Gas Control Technol., Vancouver, Canada, 2004.
[382] M. Rydén, A. Lyngfelt, T. Mattisson, Chemical-looping combustion and chemical-looping
reforming in a circulating fluidized-bed reactor using Ni-based oxygen carriers, Energy and Fuels.
22 (2008) 2585–2597.
[383] J. Adánez, P. Gayán, J. Celaya, L.F. de Diego, F. Garcia-Labiano, A. Abad, Chemical Looping
Combustion in a 10 kW th Prototype Using a CuO/Al2O3 Oxygen Carrier: Effect of Operating
Conditions on Methane Combustion, Ind. Eng. Chem. Res. 45 (2006) 6075–6080.
[384] D. Sridhar, A. Tong, H. Kim, L. Zeng, F. Li, L. Fan, Syngas Chemical Looping Process: Design
and Construction of a 25 kWth Subpilot Unit, Energy & Fuels. 26 (2012) 2292−2302.
[385] A. Tong, D. Sridhar, Z. Sun, H.R. Kim, L. Zeng, F. Wang, et al., Continuous high purity
hydrogen generation from a syngas chemical looping 25kWth sub-pilot unit with 100% carbon
capture, Fuel. 103 (2013) 495–505.
[386] Q. Zhou, L. Zeng, L. Fan, Syngas Chemical Looping Process: Dynamic Modeling of a Moving-
Bed Reducer, AIChE J. 59 (2013) 3432–3443.
[387] S.F. Håkonsen, R. Blom, Chemical looping combustion in a rotating bed reactor - Finding optimal
process conditions for prototype reactor, Environ. Sci. Technol. 45 (2011) 9619–9626.
[388] R.K. Shah, T. Skiepko, Influence of leakage distribution on the thermal performance of a rotary
regenerator, Appl. Therm. Eng. 19 (1999) 685–705.
[389] Y.S. Matros, Prospects of use of unsteady-processes in catalytic reactors, JVKhO Im. D. I.
Mendeleeva [Journal All-Union Chem. Soc. 22 (1977) 576–580.
[390] Y.S. Matros, G.A. Bunimovich, Reverse-Flow Operation in Fixed Bed Catalytic Reactors, Catal.
Rev. 38 (1996) 1–68.
276
[391] G. Kolios, J. Frauhammer, G. Eigenberger, Autothermal fixed-bed reactor concepts, Chem. Eng.
Sci. 55 (2000) 5945–5967.
[392] F. Larachi, P.L. Mills, M.P. Duduković, Multiphase catalytic reactors: a perspective on current
knowledge and future trends, Catal. Rev. Sci. Eng. 44 (2002) 123–246.
[393] Y.S. Matros, Catalytic processes under unsteady state conditions, Elsvier, 1988.
[394] M.P. Dudukovic, Frontiers in reactor engineering., Science. 325 (2009) 698–701.
[395] M.S. Kulkarni, M.P. Duduković, A bidirectional fixed-bed reactor for coupling of exothermic and
endothermic reactions, AIChE J. 42 (1996) 2897–2910.
[396] G. Kolios, G. Eigenberger, Styrene synthesis in a reverse-flow reactor, Chem. Eng. Sci. 54 (1999)
2637–2646.
[397] M.S. Kulkarni, M.P. Dudukovic, Periodic Operation of Asymmetric Bidirectional Fixed-Bed
Reactors with Temperature Limitations, Ind. Eng. Chem. Res. 37 (1998) 770–781.
[398] M.S. Kulkarni, M.P. Duduković, A robust algorithm for fixed-bed reactors with steep moving
temperature and reaction fronts, Chem. Eng. Sci. 51 (1996) 571–585.
[399] M.S. Kulkarni, M.P. Dudukovic, Dynamics of gas phase and solid phase reactions in fixed bed
reactors, Chem. Eng. Sci. 51 (1996) 3083–3088.
[400] B. Glöckler, G. Kolios, C. Tellaeche, U. Nieken, A Heat-Integrated Reverse-Flow Reactor
Concept for Endothermic High-Temperature Syntheses. Part I: Fundamentals - Short-Cut Theory
and Experimental Verification of a Traveling Endothermic Reaction Zone, Chem. Eng. Technol.
32 (2009) 1339–1347.
[401] M.V.S. Annaland, H.A.R. Scholts, J.A.M. Kuipers, W.P.M. Van Swaaij, A novel reverse flow
reactor coupling endothermic and exothermic reactions Part II : Sequential reactor configurations
for reversible endothermic reactions, Chem. Eng. Sci. 57 (2002) 855–872.
[402] Y.S. Matros, G.A. Bunnimovich, G.K. Boreskov, Unsteady-State Performance of Sulphur
Dixodie Oxidation in Production of Sulphuric Acid, Front. Chem. React. Eng. 2 (1984) 386–397.
[403] G.A. Bunimovich, G.K. Boreskov, Y.S. Matros, A.A. Ivanov, Catalytic Processes Carried Out
Under Non-Steady-State Conditions: Switching the Direction for the Feed of the Reaction Mixture
to the Catalyst Bed. Experimental Results, Kinet. Catal. 23 (1982) 402–406.
[404] G.A. Bunimovich, N. V. Vernikovskaya, V.O. Strots, B.S. Balzhinimaev, Y.S. Matros, SO2
oxidation in a reverse-flow reactor: Influence of a vanadium catalyst dynamic properties, Chem.
Eng. Sci. 50 (1995) 565–580.
[405] R.F. Blanks, T.S. Wittrig, D.A. Peterson, Bidirectional adiabatic synthesis gas generator, Chem.
Eng. Sci. 45 (1990) 2407–2413.
[406] A.M. De Groote, G.F. Froment, T. Kobylinski, Synthesis gas production from natural gas in a
fixed bed reactor with reversed flow, Can. J. Chem. Eng. 74 (1996) 735–742.
[407] R. Hong, X. Li, H. Li, W. Yuan, Modeling and simulation of SO2 oxidation in a fixed-bed reactor
with periodic flow reversal, Catal. Today. 38 (1997) 47–58.
[408] W. De Xiao, H. Wang, W.K. Yuan, An SO2 converter with flow reversal and interstage heat
removal: From laboratory to industry, Chem. Eng. Sci. 54 (1999) 1307–1311.
[409] K.M. Vanden Bussche, S.N. Neophytides, I.A. Zolotarskii, G.F. Froment, Modelling and
simulation of the reversed flow operation of a fixed-bed reactor for methanol synthesis, Chem.
Eng. Sci. 48 (1993) 3335–3345.
[410] G. Eigenberger, U. Niecken, Catalytic Combustion with Periodic Flow Reversal, Chem. Eng. Sci.
43 (1988) 2109–2155.
[411] C. Sapundzhiev, J. Chaouki, C. Guy, D. Klvana, Catalytic combustion of natural gas in a fixed
bed reactor with flow reversal, Chem. Eng. Commun. 125 (1993) 171–186.
[412] J. Chaouki, C. Sapundzhiev, D. Kusohorsky, D. Klvana, Combustion of Methane in a Cyclic
Catalytic Reactor, Ind. Eng. Chem. Res. 33 (1994) 2957–2963.
[413] B. van de Beld, R.A. Borman, O.R. Derkx, B.A.A. van Woezik, K.R. Westerterp, Removal of
Volatile Organic Compounds from Polluted Air in a Reverse Flow Reactor: An Experimental
Study, Ind. Eng. Chem. Res. 33 (1994) 2946–2956.
277
[414] L. van de Beld, K.R. Westerterp, Air purification in a reverse-flow reactor: Model simulations vs.
experiments, AIChE J. 42 (1996) 1139–1148.
[415] L. van de Beld, K.R. Westerterp, Operation of a Catalytic Reverse Flow Reactor for the
Purification of Air Contaiminated with Volatile Organic Compounds, Can. J. Chem. Eng. 75
(1997) 975–983.
[416] H. Ziifle, T. Turek, Catalytic combustion in a reactor with periodic flow reversal . Part 1.
Experimental results, Chem. Eng. Process. 36 (1997) 327–340.
[417] H. Ziifle, T. Turek, Catalytic combustion in a reactor with periodic flow reversal. Part 2. Steady-
state reactor model, Chem. Eng. Process. 36 (1997) 341–352.
[418] J.L. Nijdam, C.W.M. Van Der Geld, A comparison of hybrid and numerical techniques to model
heat transfer in reverse flow reactors, Appl. Therm. Eng. 19 (1999) 1045–1070.
[419] J.L. Nijdam, C.W.M. van der Geld, Experiments with a large-scale reverse flow reactor, Chem.
Eng. Sci. 52 (1997) 2729–2741.
[420] M. Cittadini, M. Vanni, A. a. Barresi, G. Baldi, Simplified procedure for design of catalytic
combustors with periodic flow reversal, Chem. Eng. Process. Process Intensif. 40 (2001) 255–262.
[421] S. Salomons, R.E. Hayes, M. Poirier, H. Sapoundjiev, Modelling a reverse flow reactor for the
catalytic combustion of fugitive methane emissions, Comput. Chem. Eng. 28 (2004) 1599–1610.
[422] A. Kushwaha, M. Poirier, H. Sapoundjiev, R.E. Hayes, Effect of reactor internal properties on the
performance of a flow reversal catalytic reactor for methane combustion, Chem. Eng. Sci. 59
(2004) 4081–4093.
[423] R.Q. Ferreira, C.A. Costa, S. Masetti, Reverse-flow reactor for a selective oxidation process,
Chem. Eng. Sci. 54 (1999) 4615–4627.
[424] Z. Zhou, L. Han, G.M. Bollas, Model-assisted analysis of fluidized bed chemical-looping
reactors, Chem. Eng. Sci. 134 (2015) 619–631.
[425] O. V. Kiselev, Y.S. Matros, Intrinsic Energy Removal in the Heat Front Moving in Catalyst Bed,
Fiz. Goreniia I Vzryva [Combust. Explos. Shock Waves]. 23 (1987) 167–174.
[426] O. V. Kiselev, Y.S. Matros, N.A. Chumakova, Phenomenon of Heat Front Propagation in Catalyst
Bed, in: Y.S. Matros (Ed.), Propag. Heat Waves Heterog. Media [in Russ., Nauka, Novosibirsk,
1988: pp. 145–202.
[427] A. Gawdzik, L. Rakowski, Dynamic properties of the adiabatic tubular reactor with switch flow,
Chem. Eng. Sci. 43 (1988) 3023–3030.
[428] K. Gosiewski, R. Sztaba, Simplified design of reverse flow nonstationary reactor for low reactant
concentration, in: Unsteady State Process. Catal., VNU Science Press, Utrecht-Tokyo, 1990: pp.
629–635.
[429] J. Řeháček, M. Kubíček, M. Marek, Modelling of a tubular catalytic reactor with flow reversal,
Chem. Eng. Sci. 47 (1992) 2897–2902.
[430] J.D. Snyder, B. Subramaniam, Numerical simulation of a periodic flow reversal reactor for sulfur
dioxide oxidation, Chem. Eng. Sci. 48 (1993) 4051–4064.
[431] M.V.S. Annaland, R.C. Nijssen, A novel reverse flow reactor coupling endothermic and
exothermic reactions: an experimental study, Chem. Eng. Sci. 57 (2002) 4967–4985.
[432] M. van Sint Annaland, H.A.R. Scholts, J.A.M. Kuipers, W.P.M. van Swaaij, A novel reverse flow
reactor coupling endothermic and exothermic reactions. Part I: comparison of reactor
configurations for irreversible endothermic reactions, Chem. Eng. Sci. 57 (2002) 833–854.
[433] Y.W. Budhi, Reverse Flow Reactor Operation for Control of Catalyst Surface Coverage,
Ridderprint Offsetdrukkerij B.V., Eindhoven, the Netherlands, 2005.
[434] K.R. Rout, M. Hillestad, H. a. Jakobsen, A numerical study of pellet model consistency with
respect to molar and mass average velocities, pressure gradients and porosity models for methanol
synthesis process: Effects of flux models on reactor performance, Chem. Eng. Res. Des. 91 (2013)
296–317.
[435] P.S.E. GPROMS, gPROMS, (2014).
278
[436] Z. Zhou, L. Han, G.M. Bollas, Overview of chemical-looping reduction in fixed-bed and
fluidized-bed reactors focused on oxygen carrier utilization and reactor efficiency, Aerosol Air
Qual. Res. 14 (2014) 559-571.
[437] J. Adánez, C. Dueso, L.F. de Diego, F. Garcıa-Labiano, P. Gayan, A. Abad, Effect of Fuel Gas
Composition in Chemical-Looping Combustion with Ni-Based Oxygen Carriers. 2. Fate of Light
Hydrocarbons, Ind. Eng. Chem. Res. 48 (2009) 2509–2518.
[438] M. Zlokarnik, Scale-Up in Chemical Engineering, Wiley-VCH Verlag GmbH & Co. KGaA,
2002.
[439] L.R. Glicksman, Scaling relationships for fluidized beds, Chem. Eng. Sci. 43 (1988) 1419–1421.
[440] G. Donati, R. Paludetto, Scale up of chemical reactors, Catal. Today. 34 (1997) 483–533.
[441] E.B. Nauman, Chemical Reactor Design, Optimization, and Scaleup, McGraw-Hill, 2002.
[442] W. Kim, C. Yun, K.T. Jung, S. Park, S.H. Kim, Computer-aided scale-up of a packed-bed tubular
reactor, Comput. Chem. Eng. 39 (2012) 96–104.
[443] T.A. Adams II, P.I. Barton, A dynamic two-dimensional heterogeneous model for water gas shift
reactors, Int. J. Hydrogen Energy. 34 (2009) 8877–8891.
[444] W. Xiang, S. Wang, T. Di, Investigation of Gasification Chemical Looping Combustion
Combined Cycle Performance, Energy & Fuels. 22 (2008) 961–966.
[445] F. Petrakopoulou, G. Tsatsaronis, T. Morosuk, Conventional Exergetic and Exergoeconomic
Analyses of a Power Plant with Chemical Looping Combustion for CO2 Capture, Int. J.
Thermodyn. 13 (2010) 77–86.
[446] B. Hassan, T. Shamim, Effect of oxygen carriers on performance of power plants with chemical
looping combustion, Procedia Eng. 56 (2013) 407–412.
[447] O. Brandvoll, O. Bolland, Inherent CO2 Capture Using Chemical Looping Combustion in a
Natural Gas Fired Power Cycle, J. Eng. Gas Turbines Power. 126 (2004) 316.
[448] R. Sharma, M.K. Chandel, A. Delebarre, B. Alappat, 200-MW chemical looping combustion
based thermal power plant for clean power generation, Int. J. Energy Res. 37 (2013) 49–58.
[449] H.M. Kvamsdal, K. Jordal, O. Bolland, A quantitative comparison of gas turbine cycles with CO2
capture, Energy. 32 (2007) 10–24.
[450] M. Anheden, G. Svedberg, Chemical-looping combustion in combination with integrated coal
gasification-a way to avoid CO2 emission from coal fired power plants without a significant
decrease in net power efficiency, in: IECEC 96. Proc. 31st Intersoc. Energy Convers. Eng. Conf.,
IEEE, 1997: pp. 2045–2050.
[451] C. Dueso, F. García-Labiano, J. Adánez, L.F. de Diego, P. Gayán, A. Abad, Syngas combustion
in a chemical-looping combustion system using an impregnated Ni-based oxygen carrier, Fuel. 88
(2009) 2357–2364.
[452] M. Ishida, H. Jin, Chemical-looping combustion power generation plant system, Chem. Combust.
Power Gener. Plant Syst. (1995).
[453] R. Xiao, L. Chen, C. Saha, S. Zhang, S. Bhattacharya, Pressurized chemical-looping combustion
of coal using an iron ore as oxygen carrier in a pilot-scale unit, Int. J. Greenh. Gas Control. 10
(2012) 363–373.
[454] L. Han, G.M. Bollas, Chemical-looping combustion in a reverse-flow fixed bed reactor, Energy.
(in review (2015).
[455] Y. Kawajiri, L.T. Biegler, Optimization strategies for simulated moving bed and powerfeed
processes, AIChE J. 52 (2006) 1343–1350.
[456] A. Rajendran, G. Paredes, M. Mazzotti, Simulated moving bed chromatography for the separation
of enantiomers, J. Chromatogr. A. 1216 (2009) 709–738.
[457] P.S. Gomes, A.E. Rodrigues, Simulated moving bed chromatography: From concept to proof-of-
concept, Chem. Eng. Technol. 35 (2012) 17–34.
[458] L.-S. Fan, F. Li, Chemical looping technology and its fossil energy conversion applications, Ind.
Eng. Chem. Res. 49 (2010) 10200–10211.
[459] T.R. Marrero, E.A. Mason, Gaseous diffusion constants, J. Phys. Chem. Ref. Data. 1 (1972) 1–

279
118.
[460] B.E. Poling, J.M. Prausnitz, J.P. O’Connel, The properties of liquids and gases, 2000.
[461] R.H. Perry, D.W. Green, Perry’s chemical engineer’s handbook, 7th ed., 1997.
[462] Aspen, Aspen technology: physcial property system, (2007).