
DRAFT OF ENVIRONMENTAL IMPACT ASSESSMENT AND ...
283
DRAFT OF ENVIRONMENTAL IMPACT ASSESSMENT AND ENVIRONMENT MANAGEMENT PLAN FOR OBTAINING Environmental Clearance under EIA Notification – 2006 Schedule S. No. 1 (a) (i): Mining Project “B1” CATEGORY – MINOR MINERAL – CLUSTER – NONFOREST LAND * CLUSTER EXTENT = 20.19.0 Hectares KOTHAPETTA ROUGH STONE QUARRY CLUSTER At Kothapetta Village, Krishnagiri Taluk, Krishnagiri District, TamilNadu. ToR issued vide Lr. No. SEIAA-TN/F. No.8519/SEAC/ToR-992/2021 Dated 28.07.2021 -P1 ToR issued vide Lr. No. SEIAA-TN/F. No.8687/SEAC/ToR-1067/2022 Dated 01.03.2022 -P2 NAME OF PROPOSED PROJECT PROPONENTS APPLYING IN CLUSTER Code Name Extent & S.F. No. P1 Tmt.SA. Sumithashankr W/o.ShankarRaj No.252, Metbanda Village Venkatapuram Krishnagiri Taluk, Krishnagiri District – 635001 1.20.0 ha & 56/1(Part – 5) P2 M/s.MA Quality stone 58 B, Gandhi Nagar Krishnagiri District – 635001. 3.70.0 ha & 87/1B2(P) ENVIRONMENTAL CONSULTANT NOIDA TESTING LABORATORIES (An ISO: 9001 : 2015 & ISO 45001 : 2018 Certified Laboratory ) MoEF & CC (Ministry of Environment, Forest & Climate Change) UPPCB & HSPCB Recognized Laboratory, Uttrakhand. Baseline Study Period – October to December 2021
-
Upload
khangminh22 -
Category
Documents
-
view
0 -
download
0
Transcript of DRAFT OF ENVIRONMENTAL IMPACT ASSESSMENT AND ...

DRAFT OF ENVIRONMENTAL IMPACT ASSESSMENT
AND
ENVIRONMENT MANAGEMENT PLAN FOR OBTAINING
Environmental Clearance under EIA Notification – 2006
Schedule S. No. 1 (a) (i): Mining Project
“B1” CATEGORY – MINOR MINERAL – CLUSTER – NONFOREST LAND
* CLUSTER EXTENT = 20.19.0 Hectares
KOTHAPETTA ROUGH STONE QUARRY CLUSTER
At
Kothapetta Village, Krishnagiri Taluk, Krishnagiri District, TamilNadu.
ToR issued vide Lr. No. SEIAA-TN/F. No.8519/SEAC/ToR-992/2021 Dated 28.07.2021 -P1
ToR issued vide Lr. No. SEIAA-TN/F. No.8687/SEAC/ToR-1067/2022 Dated 01.03.2022 -P2
NAME OF PROPOSED PROJECT PROPONENTS APPLYING IN CLUSTER
Code Name
Extent & S.F. No.
P1
Tmt.SA. Sumithashankr
W/o.ShankarRaj
No.252, Metbanda Village
Venkatapuram
Krishnagiri Taluk,
Krishnagiri District – 635001
1.20.0 ha &
56/1(Part – 5)
P2
M/s.MA Quality stone
58 B, Gandhi Nagar
Krishnagiri District – 635001.
3.70.0 ha &
87/1B2(P)
ENVIRONMENTAL CONSULTANT
NOIDA TESTING LABORATORIES
(An ISO: 9001 : 2015 & ISO 45001 : 2018 Certified Laboratory )
MoEF & CC (Ministry of Environment, Forest & Climate Change)
UPPCB & HSPCB Recognized Laboratory,
Uttrakhand.
Baseline Study Period – October to December 2021

Table 1.2 List of Quarries within 500 Meter Radius
Source: i).AD Letter (P1) – Rc.No. 96/2021 - Mines, Date:10.03.2022
ii) AD Letter (P2) – Rc.No. 1179/2020 - Mines, Date:10.03.2022
Note: -
• Cluster area is calculated as per MoEF & CC Notification – S.O. 2269 (E) Dated: 01.07.2016
• EX1 and EX2 have been taken into the calculation of cluster extent. But they have not been
included in the cumulative studies as they are inactive.
PROPOSED QUARRIES
CODE Name of the Owner Village S.F. Nos Extent GO.No & Date Status
P1
Tmt. Sa. Sumitha
Shankar,
W/o Shankar Raj,
252, Metbanda Village,
Venkatapuram
Panchayat, Krishnagiri
(Po), Taluk District.
Kothapetta 56/1(Part – 5) 1.20.0 ha Roc.49/2016
(Mines – 2)
Dated 18.08.2016
01.09.2016
to
31.08.2026
(Scheme
for next
five years)
P2
M/s.MA Quality stone,
No.58 – B,
Gandhi Nagar,
Krishnagiri taluk,
District - 635001
Krishnagiri
taluk, kothapetta
village
87/1B2
(Part)
3.70.0 ha Roc.No.1179/2020/M
dated:22.02.2021
Proposed
quarry
TOTAL 4.90.0 ha
EXISTING QUARRIES
CODE Name of the Owner S.F. Nos &
Village
Extent GO.No & Date Lease
Period
E1 Tmt. K.M. Vijaya,
W/o Madhiazhagan,
No.58B Gandhi Nagar,
Krishnagiri Town and
Taluk.
Krishnagiri
taluk, kothapetta
village
78/1B 4.00.0 ha Roc.419/2018/M
Dated 30.05.2018
30.5.2018
to
29.5.2023
E2 M/s. Devarajaa M.
Sand, No. 58 B Gandhi
Nagar, Krishnagiri
Town and Taluk
Krishnagiri
taluk, kothapetta
village
78/1A (Part)
78/1B (Part)
4.00.0 ha Roc.418/2018/M
Dated 30.05.2018
31.5.2018
to
30.5.2023
TOTAL 8.00.0ha
TOTAL CLUSTER EXTENT 12.9.0 ha
DETAIL OF ABANDONED / OLD QUARRIES
CODE Name of the Owner S.F. Nos &
Village
Extent GO.No & Date Lease
Period
EX1 Tmt.Qummarunnisa,
W/o.Abdul Jaffer,
No.2, Rahamatulla,
St,Krishnagiri Dt.
Krishnagiri
taluk, kothapetta
village
87/1B1(Part),8
7/1B2
4.75.0 Roc.No.08/2013/Mines
dated: 05.02.2016
02.03.2016
to
01.03.2021
EX2 Thiru G. Ganesan,
Avdhanapatti
Village, Agraharam
Post, Krishnagiri taluk
Kothapetta 56/1 (P – D) 2.54.0 Roc.No.611/2009/Mines
- 2 dated: 14.05.2015
14.05.2015
to
13.05.2020
TOTAL 7.29.0ha
TOTAL CLUSTER EXTENT 20.19.0 ha

TERMS OF REFERENCE (ToR) COMPLIANCE
P1 – Tmt S.A. Sumithashankar
“ToR issued vide Letter No. SEIAA-TN/F.No. 8519/SEAC/ToR-992/2021 Dated: 28.07.2021
SPECIFIC CONDITIONS
1 A bench height of 5m needs to be maintained
as per the approved mining plan considering
the hydro-geological regime of the
surrounding area as well as for safe mining.
Yes, complied. The information
relevant to this has been shown in
pp.4-5 under chapter I.
2 There are many water bodies present within
500m, and 1km and hence impact study shall
be conducted considering those water bodies.
Yes, Complied.
3 The cumulative impact analysis due to
emission from the source and the fugitive
emission due to mining ae well as transport of
minerals needs to be assessed and the report
may be submitted.
The detail have been provided in
pp.137 – 143 under Chapter IV.
4 During EIA presentation the maximum depth
in adjacent mines should be given
considering the data on all cluster mines the
impact study shall be conducted.
Yes, Agreed.
5 The project proponent shall furnish the
contour map of the water table detailing the
number of wells located around the site and
its impacts on the wells due to mining
activity.
The contour maps and number of
well details have been provided in
pp.69-71 under chapter III.
6 The project proponent shall conduct the
hydro-geological study to evaluate the impact
of proposed mining activity on the
groundwater table, agriculture activity, and
water bodies such as rivers, tanks, canals,
ponds etc. located nearby by the proposed
mining area.
The hydro-geological study was
conducted to evaluate the possible
impact on both the surface and
subsurface water environment. No
significant impacts are anticipated on
the water bodies around the project
area. Details are discussed in pp.72-
75 under chapter III.
7 The project proponent shall furnish the details
on the number of groundwater pumping &
open wells within 1km (radius) along with the
Water levels in both monsoon and non-
monsoon seasons. The proponent also shall
collect the data of water table level from the
PWD/TWAD in this area in both monsoon
and non – monsoon seasons.
The number of wells used for the
collection of water level data and
other relevant information has been
given in pp.62-75 under chapter III.

8 The proponent shall carry out the cumulative
impact study on the agricultural area due to
mining, crushers and other activities around
the site area.
The cumulative impact study has
been discussed in pp.176-177 under
chapter VII.
9 The details of surrounding well and the
assessment of cumulative impact on the
groundwater due to mining shall be the part
of EIA study.
The hydro-geological study was
conducted to evaluate the possible
impact on both the surface and
subsurface water environment. No
significant impacts are anticipated on
the water bodies around the project
area. Details are discussed in p.62
under chapter III.
10 The Socio-Economic study should be carried
out within 10km buffer zone from the mines.
The socio-economic studies were
carried out for 10 km buffer zone
from proposed project site and the
results have been discussed in pp.
117-132 under chapter III.
11 A tree survey study shall be carried out (nos.,
name of the species, age etc.,) in the mining
lease applied area and its management during
mining activity.
The green belt development proposal
has been disclosed in pp.151-157
under chapter IV.
12 CER activities should be carried out taking
into consideration the requirement of the
local habitants available within the buffer
zone as per office Memorandum of M0EF
&CC.
Measures for environmental and
ecological preservation have been
discussed in pp.156-157 under
chapter IV. EMP has been provided
in pp.193-201 under chapter X. CER
and CSR activities have been
discussed in pp.190-191 under
chapter VIII.
13 A detailed mining closure plan for the
proposed project shall be submitted.
Mine closure details have been
provided in pp.27-29&41 under
chapter II and pp.160–161 under
chapter IV.
14 A detailed report on the safety and health
aspects of the workers and for the
surrounding habitations during operation of
mining for drilling and blasting shall be
submitted.
The details have been provided in
pp.201 – 206 under Chapter -X
15 The recommendation for the issue of “Terms of Reference” is subjected to the outcome of the Hon’ble NGT, Principal Bench, New Delhi in O.A.No.186 of 2016 (M.A.No.
350/2016) and O.A.No.200/2016 and
Agreed & noted.
O.A.No.580/2016(M.A.No.1182/2016) and
O.A. No. 102/2017 and O.A. No. 404/2016
(M.A.No758/2016, M.A.No 920/2016,
M.A.No. 1122/2016, M.A.No.12/2017 &
M.A.No. 843/2017) and O.A.No 405/2016
and O.A.No 520 of 2016 (M.A.No. 981/2016,
M.A.No.982/2016 & M.A.No. 384/2017)
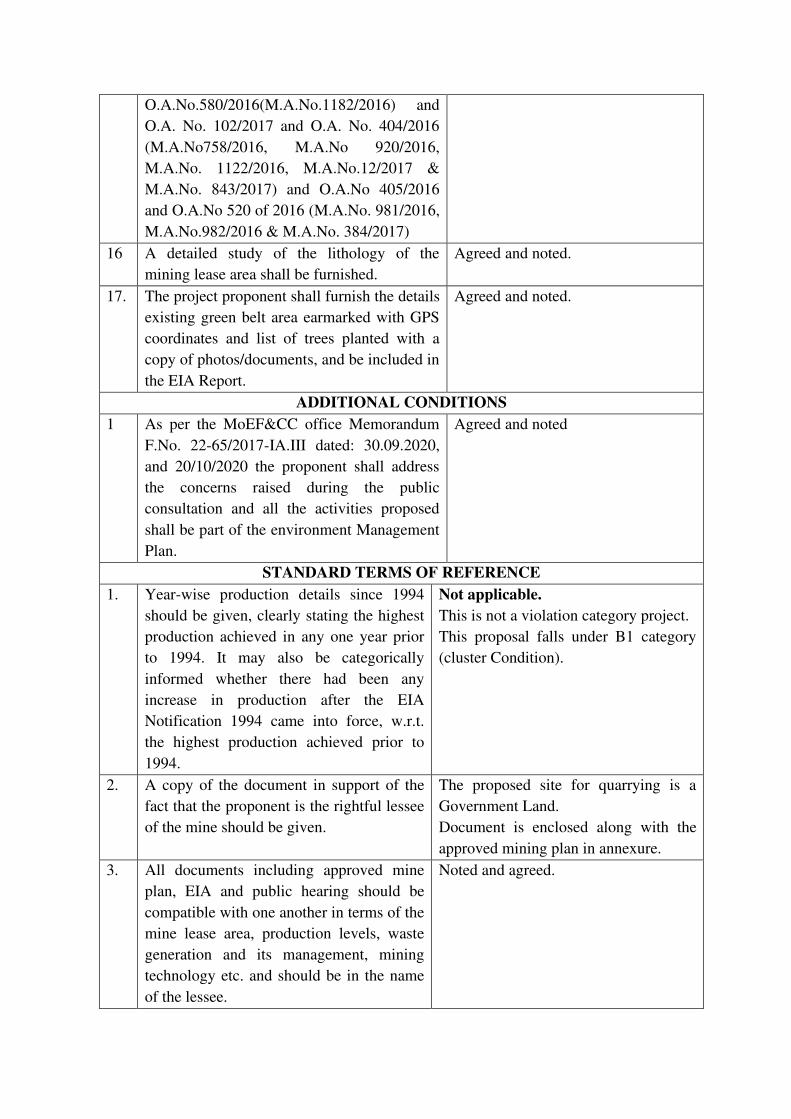
16 A detailed study of the lithology of the
mining lease area shall be furnished.
Agreed and noted.
17. The project proponent shall furnish the details
existing green belt area earmarked with GPS
coordinates and list of trees planted with a
copy of photos/documents, and be included in
the EIA Report.
Agreed and noted.
ADDITIONAL CONDITIONS
1 As per the MoEF&CC office Memorandum
F.No. 22-65/2017-IA.III dated: 30.09.2020,
and 20/10/2020 the proponent shall address
the concerns raised during the public
consultation and all the activities proposed
shall be part of the environment Management
Plan.
Agreed and noted
STANDARD TERMS OF REFERENCE
1. Year-wise production details since 1994
should be given, clearly stating the highest
production achieved in any one year prior
to 1994. It may also be categorically
informed whether there had been any
increase in production after the EIA
Notification 1994 came into force, w.r.t.
the highest production achieved prior to
1994.
Not applicable.
This is not a violation category project.
This proposal falls under B1 category
(cluster Condition).
2. A copy of the document in support of the
fact that the proponent is the rightful lessee
of the mine should be given.
The proposed site for quarrying is a
Government Land.
Document is enclosed along with the
approved mining plan in annexure.
3. All documents including approved mine
plan, EIA and public hearing should be
compatible with one another in terms of the
mine lease area, production levels, waste
generation and its management, mining
technology etc. and should be in the name
of the lessee.
Noted and agreed.

4. All corner coordinates of the mine lease
area, superimposed on a high-resolution
imagery/toposheet, topographic sheet,
geomorphology and geology of the area
should be provided. Such an imagery of the
proposed area should clearly show the land
use and other ecological features of the
study area (core and buffer zone).
Project area on satellite imagery has
been shown in Figure 2.3 in p.19.
An AutoCAD drawing plates showing
project area boundary pillars and corner
coordinates have been provided in
Figure 2.10 in p.33.
Project area showing 10km radius
buffer zone on Toposheet – Figure 1.3,
in p.9.
Surface Features around the project area
covering 1km radius – Figure 2.6 in
p.22.
Geology map of the project area
covering 10km radius has been given in
Figure 2.8, p.31.
Geomorphology map including the
study area covering 10 km radius has
been provided in Figure 2.9, p.32.
5. Information should be provided in Survey
of India Toposheet in 1:50,000 scale
indicating geology map of the area,
geomorphology of land forms of the area,
existing minerals and mining history of the
area, important water bodies, streams and
rivers and soil characteristics.
Map showing –
Geology map of the project area
covering 10km radius – Figure 2.8,
p.31.
Geomorphology map of the study area
covering 10 km radius – Figure 2.9,
p.32.
6. Details about the land proposed for mining
activities should be given with information
as to whether mining conforms to the land
use policy of the State; land diversion for
mining should have approval from State
land use board or the concerned authority.
The applied area was inspected by the
officers of Department of Geology
along with revenue officials and found
that the land is fit for quarrying under
the policy of State Government.
7. It should be clearly stated whether the
proponent company has a well laid down
Environment Policy approved by its Board
of Directors? If so, it may be spelt out in
the EIA Report with description of the
prescribed operating process/procedures to
bring into focus any
infringement/deviation/violation of the
environmental or forest norms/conditions?
The hierarchical system or administrative
order of the Company to deal with the
environmental issues and for ensuring
compliance with the EC conditions may
The proponent has framed
Environmental Policy and the same has
been discussed the pp.193-201 under
chapter X.
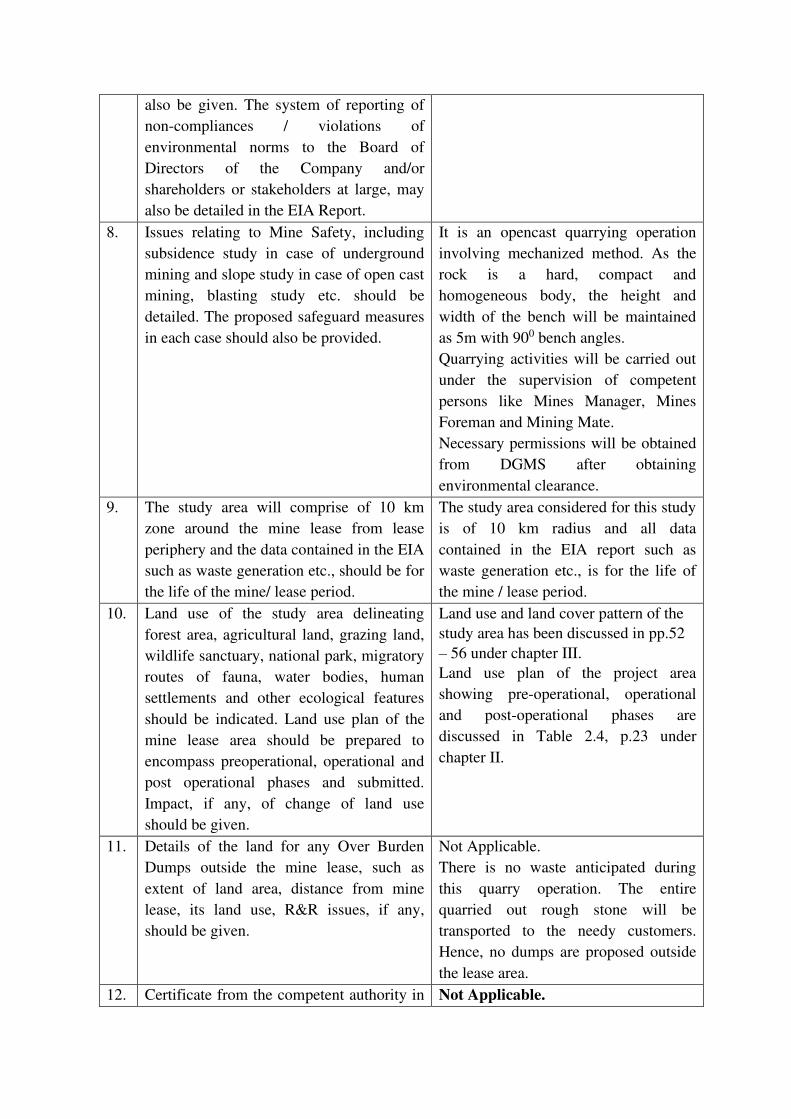
also be given. The system of reporting of
non-compliances / violations of
environmental norms to the Board of
Directors of the Company and/or
shareholders or stakeholders at large, may
also be detailed in the EIA Report.
8. Issues relating to Mine Safety, including
subsidence study in case of underground
mining and slope study in case of open cast
mining, blasting study etc. should be
detailed. The proposed safeguard measures
in each case should also be provided.
It is an opencast quarrying operation
involving mechanized method. As the
rock is a hard, compact and
homogeneous body, the height and
width of the bench will be maintained
as 5m with 900 bench angles.
Quarrying activities will be carried out
under the supervision of competent
persons like Mines Manager, Mines
Foreman and Mining Mate.
Necessary permissions will be obtained
from DGMS after obtaining
environmental clearance.
9. The study area will comprise of 10 km
zone around the mine lease from lease
periphery and the data contained in the EIA
such as waste generation etc., should be for
the life of the mine/ lease period.
The study area considered for this study
is of 10 km radius and all data
contained in the EIA report such as
waste generation etc., is for the life of
the mine / lease period.
10. Land use of the study area delineating
forest area, agricultural land, grazing land,
wildlife sanctuary, national park, migratory
routes of fauna, water bodies, human
settlements and other ecological features
should be indicated. Land use plan of the
mine lease area should be prepared to
encompass preoperational, operational and
post operational phases and submitted.
Impact, if any, of change of land use
should be given.
Land use and land cover pattern of the
study area has been discussed in pp.52
– 56 under chapter III.
Land use plan of the project area
showing pre-operational, operational
and post-operational phases are
discussed in Table 2.4, p.23 under
chapter II.
11. Details of the land for any Over Burden
Dumps outside the mine lease, such as
extent of land area, distance from mine
lease, its land use, R&R issues, if any,
should be given.
Not Applicable.
There is no waste anticipated during
this quarry operation. The entire
quarried out rough stone will be
transported to the needy customers.
Hence, no dumps are proposed outside
the lease area.
12. Certificate from the competent authority in Not Applicable.

the State Forest Department should be
provided, confirming the involvement of
forest land, if any, in the project area. In
the event of any contrary claim by the
Project Proponent regarding the status of
forests, the site may be inspected by the
State Forest Department along with the
Regional Office of the Ministry to ascertain
the status of forests, based on which, the
Certificate in this regard as mentioned
above be issued. In all such cases, it would
be desirable for representative of the State
Forest Department to assist the Expert
Appraisal Committees.
There is no forest land involved within
the proposed project area and the
proposed project area is a government
land. Approved mining plan has been
enclosed in Annexure Volume 1.
13. Status of forestry clearance for the broken-
up area and virgin forestland involved in
the project including deposition of Net
Present Value (NPV) and compensatory
afforestation (CA) should be indicated. A
copy of the forestry clearance should also
be furnished.
Not Applicable.
The proposed project area does not
involve any forest land.
14. Implementation status of recognition of
forest rights under the Scheduled Tribes
and other Traditional Forest Dwellers
(Recognition of Forest Rights) Act, 2006
should be indicated.
Not Applicable.
The project doesn't attract Recognition
of Forest Rights Act, 2006.
15. The vegetation in the RF / PF areas in the
study area, with necessary details, should
be given.
No Reserve Forest within the study
area.
16. A study should be done to ascertain the
impact of the mining project on wildlife of
the study area and details furnished. Impact
of the project on the wildlife in the
surrounding and any other protected area
and accordingly, detailed mitigative
measures required, should be worked out
with cost implications and submitted.
Not Applicable.
There is no any wildlife/protected area
within 10 km radius from the periphery
of the project area.
17. Location of National Parks, Sanctuaries,
Biosphere Reserves, Wildlife Corridors,
Ramsar Site, Tiger/ Elephant Reserves/
(existing as well as proposed), if any,
within 10 km of the mine lease should be
clearly indicated, supported by a location
Not Applicable.
There are no National Parks, Biosphere
Reserves, Wildlife Corridors, and
Tiger/ Elephant Reserves within 10 km
radius from the periphery of the project
area.

map duly authenticated by Chief Wildlife
Warden. Necessary clearance, as may be
applicable to such projects due to
proximity of the ecologically sensitive
areas as mentioned above, should be
obtained from the Standing Committee of
National Board of Wildlife and copy
furnished.
18. A detailed biological study of the study
area [core zone and buffer zone (10 km
radius of the periphery of the mine lease)]
shall be carried out. Details of flora and
fauna, endangered, endemic and RET
Species duly authenticated, separately for
core and buffer zone should be furnished
based on such primary field survey, clearly
indicating the Schedule of the fauna
present. In case of any scheduled-I fauna
found in the study area, the necessary plan
along with budgetary provisions for their
conservation should be prepared in
consultation with State Forest and Wildlife
Department and details furnished.
Necessary allocation of funds for
implementing the same should be made as
part of the project cost.
A detailed biological study was carried
out in both core and buffer zones and
the results have been discussed in
pp.92-117 under chapter III.
There is no schedule I species of
animals observed within study area as
per Wildlife Protection Act, 1972 and
no species falls in vulnerable,
endangered or threatened category as
per IUCN. There is no endangered red
list species found in the study area.
19. Proximity to areas declared as 'Critically
Polluted' or the project areas likely to come
under the 'Aravalli Range', (attracting court
restrictions for mining operations), should
also be indicated and where so required,
clearance certifications from the prescribed
Authorities, such as the SPCB or State
Mining Department should be secured and
furnished to the effect that the proposed
mining activities could be considered.
Not Applicable.
Project area / Study area is not declared
in ‘Critically Polluted’ Area and does not come under ‘Aravalli Range.
20. Similarly, for coastal Projects, A CRZ map
duly authenticated by one of the authorized
agencies demarcating LTL. HTL, CRZ
area, location of the mine lease with
respect to CRZ, coastal features such as
mangroves, if any, should be furnished.
(Note: The Mining Projects falling under
Not Applicable.
The project doesn't attract the C.R.Z.
Notification, 2018.

CRZ would also need to obtain approval of
the concerned Coastal Zone Management
Authority).
21. R&R plan/compensation details for the
Project Affected People (PAP) should be
furnished. While preparing the R&R Plan,
the relevant State/National Rehabilitation
& Resettlement Policy should be kept in
view. In respect of SCs /STs and other
weaker sections of the society in the study
area, a need-based sample survey, family-
wise, should be undertaken to assess their
requirements, and action programmes
prepared and submitted accordingly,
integrating the sectoral programmes of line
departments of the State Government. It
may be clearly brought out whether the
village(s) located in the mine lease area
will be shifted or not. The issues relating to
shifting of village(s) including their R&R
and socio-economic aspects should be
discussed in the report.
Not Applicable.
There are no approved habitations
within a radius of 300 meters.
Therefore, R&R plan / compensation
details for the Project Affected People
(PAP) is not anticipated.
22. One season (non-monsoon) [i.e., March-
May (Summer Season); October-December
(post monsoon season); December –
February (winter season)] primary baseline
data on ambient air quality as per CPCB
Notification of 2009, water quality, noise
level, soil and flora and fauna shall be
collected and the AAQ and other data so
compiled presented date-wise in the EIA
and EMP Report. Site-specific
meteorological data should also be
collected. The location of the monitoring
stations should be such as to represent
whole of the study area and justified
keeping in view the pre-dominant
downwind direction and location of
sensitive receptors. There should be at least
one monitoring station within 500 m of the
mine lease in the predominant downwind
direction. The mineralogical composition
Baseline data were collected for the
period of October-December 2021 as
per CPCB notification and MoEF & CC
Guidelines.
Details have been included in pp.49-
117 under chapter III.
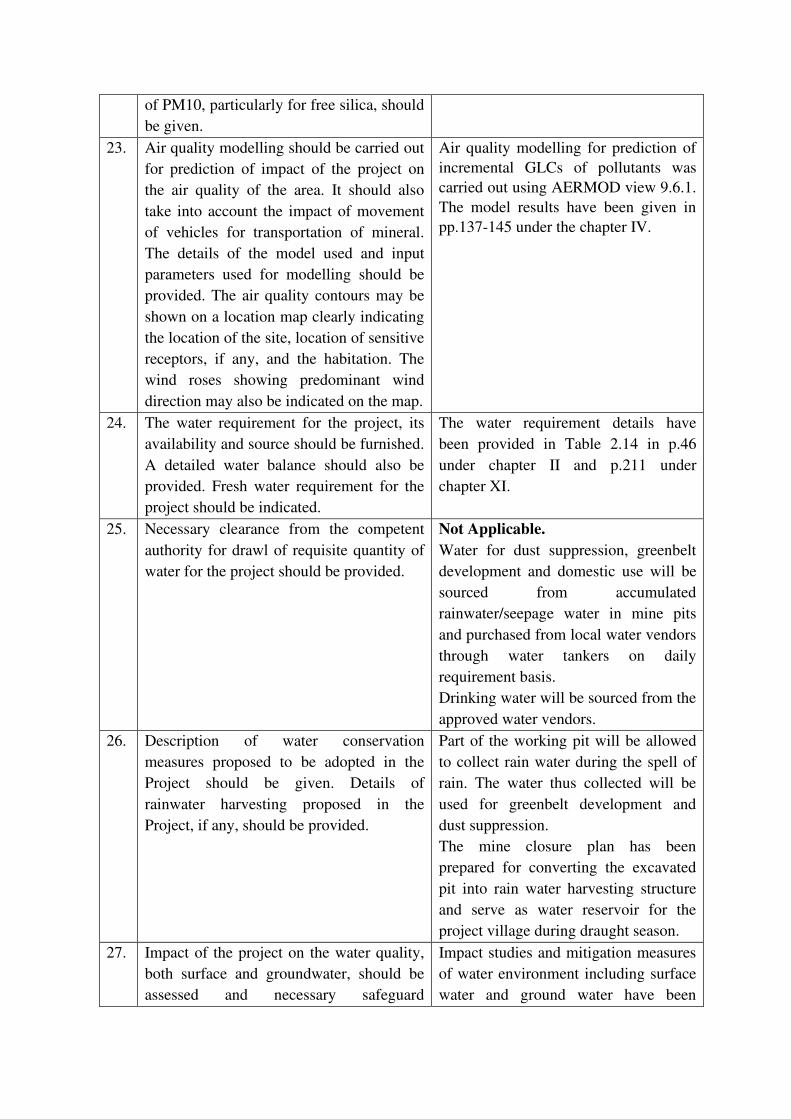
of PM10, particularly for free silica, should
be given.
23. Air quality modelling should be carried out
for prediction of impact of the project on
the air quality of the area. It should also
take into account the impact of movement
of vehicles for transportation of mineral.
The details of the model used and input
parameters used for modelling should be
provided. The air quality contours may be
shown on a location map clearly indicating
the location of the site, location of sensitive
receptors, if any, and the habitation. The
wind roses showing predominant wind
direction may also be indicated on the map.
Air quality modelling for prediction of
incremental GLCs of pollutants was
carried out using AERMOD view 9.6.1.
The model results have been given in
pp.137-145 under the chapter IV.
24. The water requirement for the project, its
availability and source should be furnished.
A detailed water balance should also be
provided. Fresh water requirement for the
project should be indicated.
The water requirement details have
been provided in Table 2.14 in p.46
under chapter II and p.211 under
chapter XI.
25. Necessary clearance from the competent
authority for drawl of requisite quantity of
water for the project should be provided.
Not Applicable.
Water for dust suppression, greenbelt
development and domestic use will be
sourced from accumulated
rainwater/seepage water in mine pits
and purchased from local water vendors
through water tankers on daily
requirement basis.
Drinking water will be sourced from the
approved water vendors.
26. Description of water conservation
measures proposed to be adopted in the
Project should be given. Details of
rainwater harvesting proposed in the
Project, if any, should be provided.
Part of the working pit will be allowed
to collect rain water during the spell of
rain. The water thus collected will be
used for greenbelt development and
dust suppression.
The mine closure plan has been
prepared for converting the excavated
pit into rain water harvesting structure
and serve as water reservoir for the
project village during draught season.
27. Impact of the project on the water quality,
both surface and groundwater, should be
assessed and necessary safeguard
Impact studies and mitigation measures
of water environment including surface
water and ground water have been

measures, if any required, should be
provided.
discussed in pp. 135-137 under the
chapter IV.
28. Based on actual monitored data, it may
clearly be shown whether working will
intersect groundwater. Necessary data and
documentation in this regard may be
provided. In case the working will intersect
groundwater table, a detailed
hydrogeological study should be
undertaken and report furnished. The
Report inter-alia shall include details of the
aquifers present and impact of mining
activities on these aquifers. Necessary
permission from Central Ground Water
Authority for working below ground water
and for pumping of ground water should
also be obtained and copy should be
furnished.
Not Applicable.
The ground water table is found at the
depth of 70m below ground level.
The Proposed depth of quarry is 40m
[10m above ground level + 30m below
ground level]. Therefore, the mining
activity will not intersect the ground
water table. Data regarding the
occurrence of groundwater table have
been provided in p.74 under the chapter
III.
29. Details of any stream, seasonal or
otherwise, passing through the lease area
and modification / diversion proposed, if
any, and the impact of the same on the
hydrology should be brought out.
Not Applicable.
There are no streams, seasonal or other
water bodies passing within the project
area. Therefore, no modification or
diversion of water bodies is anticipated.
30. Information on site elevation, working
depth, groundwater table etc. should be
provided both in AMSL and BGL. A
schematic diagram may also be provided
for the same.
The elevation of the project area is 525-
531 AMSL.
The depth of the mine is 40m [10m
above ground level + 30m below
ground level]
Depth to the water level in the area is
70m BGL.
31. A time bound Progressive Greenbelt
Development Plan shall be prepared in a
tabular form (indicating the linear and
quantitative coverage, plant species and
time frame) and submitted, keeping in
mind, the same will have to be executed
prior to commencement of the project.
Phase-wise plan of plantation and
compensatory afforestation should be
charted clearly indicating the area to be
covered under plantation and the species to
be planted. The details of plantation
already done should be given. The plant
Greenbelt development plan has been
given in p.151-157 under chapter IV.

species selected for green belt should have
greater ecological value and should be of
good utility value to the local population
with emphasis on local and native species
and the species which are tolerant to
pollution.
32. Impact on local transport infrastructure due
to the project should be indicated.
Projected increase in truck traffic as a
result of the project in the present road
network (including those outside the
project area) should be worked out,
indicating whether it is capable of handling
the incremental load. Arrangement for
improving the infrastructure, if
contemplated (including action to be taken
by other agencies such as State
Government) should be covered. Project
proponent shall conduct impact of
transportation study as per Indian Road
Congress Guidelines.
Traffic density survey was carried out
to analyse the impact of transportation
in the study area as per IRC guidelines
1961 and it is inferred that there is no
significant impact due to the proposed
transportation from the project area.
Details have been provided in pp.44&
46 under chapter II.
33. Details of the onsite shelter and facilities to
be provided to the mine workers should be
included in the EIA Report.
Infrastructure & other facilities will be
provided to the mine workers after the
grant of quarry lease and the same has
been discussed in pp.46-47 under
chapter II.
34. Conceptual post mining land use and
reclamation and restoration of mined out
areas (with plans and with adequate
number of sections) should be given in the
EIA report.
Mine closure plan is a part of approved
mining plan enclosed as Annexure I.
35. Occupational health impacts of the project
should be anticipated and the proposed
preventive measures spelt out in detail.
Details of pre-placement medical
examination and periodical medical
examination schedules should be
incorporated in the EMP. The project
specific occupational health mitigation
measures with required facilities proposed
in the mining area may be detailed.
Occupational health impacts of the
project and preventive measures have
been explained in detail in pp.158-161
under chapter IV.
36. Public health implications of the project
and related activities for the population in
No public health implications are
anticipated due to this project. Details

the impact zone should be systematically
evaluated and the proposed remedial
measures should be detailed along with
budgetary allocations.
of CER and CSR have been given in
pp.190-191under the chapter VIII.
37. Measures of socio-economic significance
and influence to the local community
proposed to be provided by the project
proponent should be indicated. As far as
possible, quantitative dimensions may be
given with time frames for implementation.
No negative impact on socio-economic
environment of the study area is
anticipated and this project shall benefit
the Socio-Economic environment by
offering employment for 30 people
directly as discussed in p.189 under
chapter VIII.
38. Detailed environmental management plan
(EMP) to mitigate the environmental
impacts which, should inter-alia include the
impacts of change of land use, loss of
agricultural and grazing land, if any,
occupational health impacts besides other
impacts specific to the proposed Project.
Detailed environment management plan
for the project to mitigate the
anticipated impacts has been included
in pp.193-206 under chapter X.
39. Public hearing points raised and
commitment of the project proponent on
the same along with time bound Action
Plan with budgetary provisions to
implement the same should be provided
and also incorporated in the final EIA/EMP
report of the project.
The outcome of public hearing will be
updated in the final EIA/EMP report.
40. Details of litigation pending against the
project, if any, with direction /order passed
by any Court of Law against the Project
should be given.
No litigation is pending in any court
against this project.
41. The cost of the Project (capital cost and
recurring cost) as well as the cost towards
implementation of EMP should be clearly
spelt out.
Project cost is Rs. 92,31,000/- CER cost
is Rs. 1,84,620/-
In order to implement the
environmental protection measures, an
amount of Rs.10.45 lakhs as capital cost
and Rs.2.34 lakhs as recurring cost is
proposed considering present market
scenario for the proposed project in
pp.205-206 under chapter X.
42. A disaster management plan shall be
prepared and included in the EIA/EMP
report.
Details regarding disaster management
plan have been provided in pp.171-175
under chapter VII.
43. Benefits of the project if the project is
implemented should be spelt out. The
Details have been given in p.189 – 191
under chapter VIII.

benefits of the project shall clearly indicate
environmental, social, economic,
employment potential, etc.
44. Besides the above, the below mentioned general points are also to be followed:
a) Executive summary of the EIA/EMP report Enclosed as separate booklet.
b) All documents to be properly referenced
with index and continuous page
numbering.
All the documents have been properly
referenced with index and continuous
page numbering.
c) Where data are presented in the report,
especially in tables, the period in which the
data were collected and the sources should
be indicated.
List of tables and source of the data
collected have been mentioned.
d) Project Proponent shall enclose all the
analysis/testing reports of water, air, soil,
noise etc. using the MoEF&CC/NABL
accredited laboratories. All the original
analysis/testing reports should be available
during appraisal of the Project
Baseline monitoring reports are
enclosed with This report in chapter III.
Original Baseline monitoring reports
will be submitted in the final EIA report
during appraisal.
e) Where the documents provided are in a
language other than English, an English
translation should be provided.
Not Applicable.
f) The questionnaire for environmental
appraisal of mining projects as devised
earlier by the Ministry shall also be filled
and submitted.
That will be enclosed along with final
EIA/EMP report.
g) While preparing the EIA report, the
instructions for the proponents and
instructions for the consultants issued by
MoEF&CC vide O.M. No. J-
11013/41/2006-IA. II (I) dated 4th August,
2009, which are available on the website of
this Ministry, should be followed.
Noted & agreed.
Instructions issued by MoEF & CC
O.M. No. J-11013/41/2006-IA. II (I)
dated 4th August, 2009 have been
followed.
h) Changes, if any made in the basic scope
and project parameters (as submitted in
Form-I and the PFR for securing the TOR)
should be brought to the attention of
MoEF&CC with reasons for such changes
and permission should be sought, as the
ToR may also have to be altered. Post
public hearing changes in structure and
content of the draft EIA/EMP (other than
modifications arising out of the P.H.
process) will entail conducting the PH
Noted & agreed.

again with the revised documentation
i) As per the circular No. J-11011/618/2010-
IA. II(I) dated 30.5.2012, certified report of
the status of compliance of the conditions
stipulated in the environment clearance for
the existing operations of the project,
should be obtained from the Regional
Office of Ministry of Environment, Forest
and Climate Change, as may be applicable.
Not applicable.
j) The EIA report should also include (i)
surface plan of the area indicating contours
of main topographic features, drainage and
mining area, (ii) geological maps and
sections and (iii) sections of the mine pit
and external dumps, if any, clearly
showing the land features of the adjoining
area.
Surface & geological plans have been
included in Figures 2.10&2.11 in pp.33-
34.
Closure plan has been included in
Figures 2.12 in p.35.
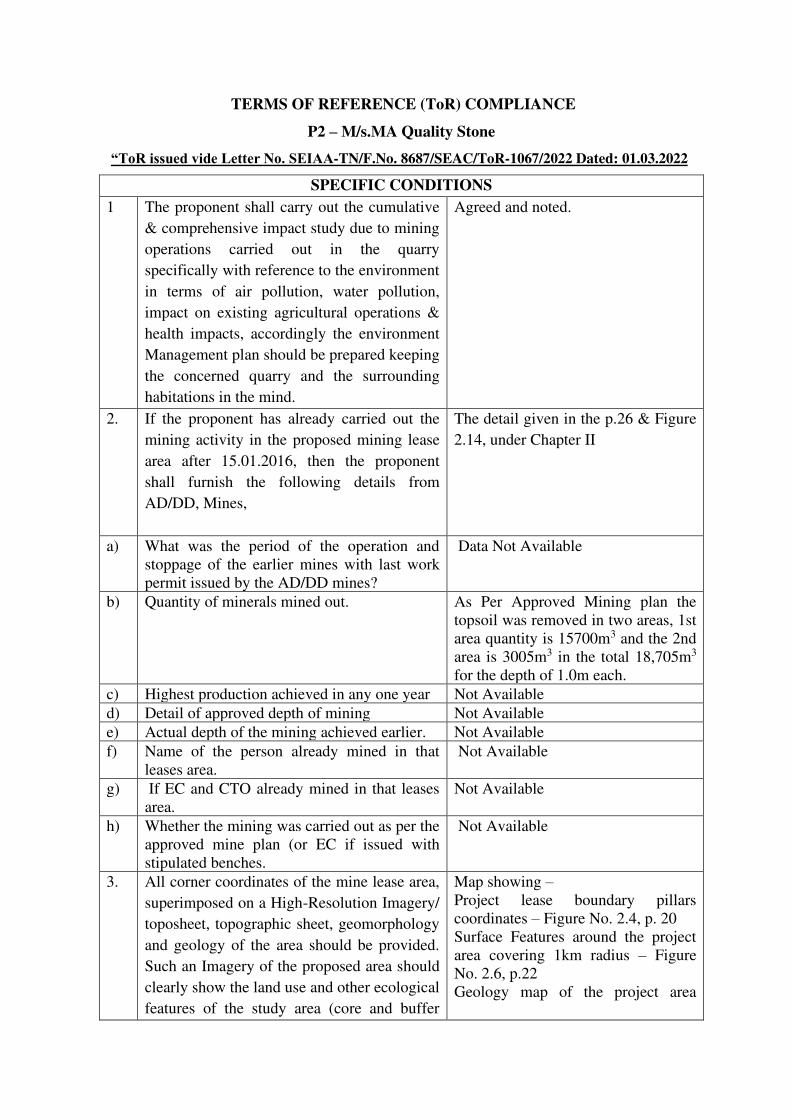
TERMS OF REFERENCE (ToR) COMPLIANCE
P2 – M/s.MA Quality Stone
“ToR issued vide Letter No. SEIAA-TN/F.No. 8687/SEAC/ToR-1067/2022 Dated: 01.03.2022
SPECIFIC CONDITIONS
1 The proponent shall carry out the cumulative
& comprehensive impact study due to mining
operations carried out in the quarry
specifically with reference to the environment
in terms of air pollution, water pollution,
impact on existing agricultural operations &
health impacts, accordingly the environment
Management plan should be prepared keeping
the concerned quarry and the surrounding
habitations in the mind.
Agreed and noted.
2. If the proponent has already carried out the
mining activity in the proposed mining lease
area after 15.01.2016, then the proponent
shall furnish the following details from
AD/DD, Mines,
The detail given in the p.26 & Figure
2.14, under Chapter II
a) What was the period of the operation and
stoppage of the earlier mines with last work
permit issued by the AD/DD mines?
Data Not Available
b) Quantity of minerals mined out. As Per Approved Mining plan the
topsoil was removed in two areas, 1st
area quantity is 15700m3 and the 2nd
area is 3005m3 in the total 18,705m3
for the depth of 1.0m each.
c) Highest production achieved in any one year Not Available
d) Detail of approved depth of mining Not Available
e) Actual depth of the mining achieved earlier. Not Available
f) Name of the person already mined in that
leases area.
Not Available
g) If EC and CTO already mined in that leases
area.
Not Available
h) Whether the mining was carried out as per the
approved mine plan (or EC if issued with
stipulated benches.
Not Available
3.
All corner coordinates of the mine lease area,
superimposed on a High-Resolution Imagery/
toposheet, topographic sheet, geomorphology
and geology of the area should be provided.
Such an Imagery of the proposed area should
clearly show the land use and other ecological
features of the study area (core and buffer
Map showing –
Project lease boundary pillars
coordinates – Figure No. 2.4, p. 20
Surface Features around the project
area covering 1km radius – Figure
No. 2.6, p.22
Geology map of the project area

zone). covering 10km radius – Figure No.
2.8, p.31
Geomorphology Map of the Study
Area covering 10 km radius – Figure
No. 2.9, p.32
4 The Proponent shall furnish photographs of
adequate fencing, green belt along the
periphery including replantation of existing
tree & Safety distance between the adjacent
quarries & water bodies nearby provided as
per the approved mining plan.
Yes. Agreed.
5 The project proponent shall provide the
details of mineral reserves and mineable
reserves, planned production capacity,
proposed working methodology with
justifications, the anticipatd impacts of the
mining operations on the surrounding
environment and the remedial measures for
the same.
The details have been provided in
Table.2.3, p.17 under chapter II.
6 The project proponent shall provide the
Organization chart indicating the appointment
of various statutory officials and other
competent persons to be appointed as per the
provisions of Mines Act 1952 and the
MMR,1961 for carrying out the quarrying
Operations scientifically and systematically
in order to ensure safety and to protect the
environment.
Agreed & noted.
7 The project proponent shall conduct the
hydro – geological study considering the
contour map of the water table detailing the
number of groundwater pumping wells, open
wells and surface water bodies such as rivers,
tanks, canals, ponds etc. within 1Km(radius)
along with the collected water level data for
both monsoon and non-monsoon seasons
from the PWD \ TWAD so as to assess the
impacts on wells due to mining activity.
Based on actual monitored data, it may
clearly be shown whether working will
intersect groundwater. Necessary data and
documentation in this regard may be
provided.
The details have been provided in
pp.62 -75 under chapter III.

8 The proponent shall furnish the baseline data
for the environment and ecological
parameters with regard to surface water
/ground water quality, air quality, soil quality
& flora/fauna including traffic/vehicular
movement study.
The details have been provided in
pp.62 -117 under chapter III.
9. A tree survey study shall be carried out (nos.
name of the species, age, diameter etc.,) both
withing the mining leases applied area &
300m buffer zone and its management during
mining activity.
The detailed Greenbelt Development
Plan is discussed in p.151-157 under
IV.
10 A detailed mine closure plan for the proposed
project shall be included in EIA/EMP report
which should be site – specific.
Mine Closure Plan is a part of
Approved Mining Plan enclosed as
Annexure Volume – 1.
11 The public hearing advertisement shall be
published in one major national daily and one
most circulated vernacular daily.
Agreed & noted.
12 The recommendation for the issue of “Terms of Reference” is subjected to the outcome of
the Hon’ble NGT, Principal Bench, New Delhi in O.A.No.186 of 2016 (M.A.No.
350/2016) and O.A.No.200/2016 and
O.A.No.580/2016(M.A.No.1182/2016) and
O.A. No. 102/2017 and O.A. No. 404/2016
(M.A.No758/2016, M.A.No 920/2016,
M.A.No. 1122/2016, M.A.No.12/2017 &
M.A.No. 843/2017) and O.A.No 405/2016
and O.A.No 520 of 2016 (M.A.No. 981/2016,
M.A.No.982/2016 & M.A.No. 384/2017).
Agreed & noted.
13 The purpose of green belt around the project
is to capture the fugitive emissions, carbon
sequestration and to attenuate the noise
generated, in addition to improving the
aesthetics. A wide range of indigenous plant
species should be planted a given in the
appendix in consultation with the DFO, State
Agriculture University and local
school/collage authorities. The plant species
with dense/moderate canopy of native origin
should be chosen. Species of
small/medium/tall trees alternating with
shrubs should be planted in a mixed manner.
Agreed & noted.
The detailed Greenbelt Development
Plan is discussed in p.151-157 under
IV.
14 Taller/one year old saplings raised in Agreed & noted

appropriate size of bags, preferably eco-
friendly bags should be planted in proper
spacing as per the advice of local forest
authorities/botanist/Horticulturist with regard
to site specific choices. The proponent shall
earmark the greenbelt area with GPS
coordinates all along the boundary of the
project site with at least 3 meters wide and in
between blocks in an organized manner.
15. A Disaster Management plan shall be
prepared and included in the EIA/EMP
Report.
The details have been provided in
pp.171 -175 under chapter VII.
16. A Risk Assessment and management plan
shall be prepared and included in the
EIA/EMP Report.
The details have been provided in
pp.169 -171 under chapter VII.
17. The Socio – economic studies should be
carried out within a 5 km buffer zone from
the mining activity, Measures of socio –
economic significance and influence to the
local community proposed to be provided by
the project proponent should be indicated. As
far as possible, quantitative dimensions may
be given with time frames for
implementation.
The socio-economic studies were
carried out for 10 km buffer zone
from proposed project site and the
results have been discussed in pp.
117-132 under chapter III.
18. If any quarrying operations were carried out
in the proposed quarrying site for which now
the EC is sought, the project proponent shall
furnish the detailed compliance to EC
conditions given in the previous EC with the
site photographs which shall duly be certified
by MoEF&CC, regional office, Chennai (or)
the concerned DEE/TNPCB.
Agreed and noted.
19. Concealing any factual information or
submission of false/fabricated data and failure
to comply with any of the conditions
mentioned above may result in withdrawal of
this terms of reference besides attracting
penal provisions in the Environment
(Protection) Act, 1986.
Agreed and noted.
ADDITIONAL CONDITIONS
1 As per the MoEF&CC office Memorandum
F.No. 22-65/2017-IA.III dated: 30.09.2020,
and 20/10/2020 the proponent shall address
Agreed and noted

the concerns raised during the public
consultation and all the activities proposed
shall be part of the environment Management
Plan.
2 The environmental impact assessment shall
study in detail the carbon emission and also
suggest the measures to mitigate carbon
emission including development of carbon
sinks and temperature reduction including
control of other emission and climate
mitigation activities.
Agreed and noted
3 The environmental impact assessment should
study the biodiversity, the natural ecosystem,
the soil micro flora, fauna and soil seed bank
and suggest measures to maintain natural
ecosystem.
The details have been provided in
pp.90 -117 under chapter III.
4 Action should specifically be suggested for
sustainable management of the area and
restoration of ecosystem for flow of goods
and services.
Agreed and noted
5 The project proponent shall study impact on
fish habits and the food WEB/FOOD chain in
the water body and Reservoir.
Not applicable.
6 The terms of Reference should specifically
study impact on soil health, soil erosion, the
soil physical, chemical components and
microbial components.
Baseline monitoring reports are
enclosed with this report in chapter
III.
7 The environment impact assessment should
study impact on biodiversity, vegetation,
endemic, vulnerable and endangered
indigenous flora and fauna.
Endangered indigenous flora and
fauna. Original Baseline monitoring
reports will be submitted in the final
EIA report during appraisal.
8 The environmental impact assessment should
study impact on standing trees and the trees
should be numbered.
Agreed and noted
9 The environmental impact assessment should
study on wetlands, odai, wells, water bodies,
river streams, lakes and farmer sites.
Agreed and noted
10 The environmental impact assessment should
hold detailed study on EMP with budget for
green belt development and mine closure plan
including disaster management plan.
The detail have been given in Table
10.11 and 10.11(a),p.205 under
Chapter X.
The green belt development detail
have been in Table 4.15, p.154 under
IV.

Mine closure Budget detail have been
given in table 2.9 under Chapter II
11 The environmental impact assessment should
study impact on climate change, temperate
rise, pollution and above soil & below soil
carbon stock.
Baseline monitoring reports are
enclosed with this report in chapter
III.
12 The environmental impact assessment should
study impact on protected areas, reserve
forest, national parts Corridors and wildlife
pathways.
Not applicable.
13 The project proponent shall furnish the details
of impact on green fields/farms, it is seen
from google image the vegetation within the
quarry site and outside.
Not applicable.
14 The Environmental impact assessment should
study impact of noise on elephant corridors
and migratory Wildlife.
Not applicable.
STANDARD TERMS OF REFERENCE
1 Year-wise production details since 1994
should be given, clearly stating the highest
production achieved in any one year prior
to 1994. It may also be categorically
informed whether there had been any
increase in production after the EIA
Notification 1994 came into force, w.r.t.
the highest production achieved prior to
1994.
Not applicable.
This is not a violation category project.
This proposal falls under B1 category
(cluster Condition).
2 A copy of the document in support of the
fact that the proponent is the rightful lessee
of the mine should be given.
The proposed site for quarrying is a
Patta Land.
Document is enclosed along with the
approved mining plan in annexure.
3. All documents including approved mine
plan, EIA and public hearing should be
compatible with one another in terms of the
mine lease area, production levels, waste
generation and its management, mining
technology etc. and should be in the name
of the lessee.
Noted and agreed.
4. All corner coordinates of the mine lease
area, superimposed on a high-resolution
imagery/ toposheet, topographic sheet,
geomorphology and geology of the area
should be provided. Such an imagery of the
Map showing –
Project lease boundary pillars
coordinates – Figure No. 2.4, p.20
Surface Features around the project area
covering 1km radius – Figure No. 2.6,
Page No. 22

proposed area should clearly show the land
use and other ecological features of the
study area (core and buffer zone).
An AutoCAD drawing plates showing
project area boundary pillars and corner
coordinates have been provided in
Figure 2.14 in p.37.
Geology map of the project area
covering 10km radius – Figure No. 2.8,
p.31
Geomorphology Map of the Study Area
covering 10 km radius – Figure No. 2.9,
p.32
5. Information should be provided in Survey
of India Toposheet in 1:50,000 scale
indicating geology map of the area,
geomorphology of land forms of the area,
existing minerals and mining history of the
area, important water bodies, streams and
rivers and soil characteristics.
Map showing –
Geology map of the project area
covering 10km radius – Figure No. 2.8,
p.31
Geomorphology Map of the Study Area
covering 10 km radius – Figure No. 2.9,
p.32
6. Details about the land proposed for mining
activities should be given with information
as to whether mining conforms to the land
use policy of the State; land diversion for
mining should have approval from State
land use board or the concerned authority.
The applied area was inspected by the
officers of Department of Geology
along with revenue officials and found
that the land is fit for quarrying under
the policy of State Government.
7. It should be clearly stated whether the
proponent company has a well laid down
Environment Policy approved by its Board
of Directors? If so, it may be spelt out in
the EIA Report with description of the
prescribed operating process/procedures to
bring into focus any
infringement/deviation/violation of the
environmental or forest norms/conditions?
The hierarchical system or administrative
order of the Company to deal with the
environmental issues and for ensuring
compliance with the EC conditions may
also be given. The system of reporting of
non-compliances / violations of
environmental norms to the Board of
Directors of the Company and/or
shareholders or stakeholders at large, may
also be detailed in the EIA Report.
The proponent has framed
Environmental Policy and the same has
been discussed the pp.193-201 under
chapter X.

8. Issues relating to Mine Safety, including
subsidence study in case of underground
mining and slope study in case of open cast
mining, blasting study etc. should be
detailed. The proposed safeguard measures
in each case should also be provided.
It is an opencast quarrying operation
involving mechanized method. As the
rock is a hard, compact and
homogeneous body, the height 7m and
width of the bench 5m will be
maintained as with 900 bench angles.
Quarrying activities will be carried out
under the supervision of competent
persons like Mines Manager, Mines
Foreman and Mining Mate.
Necessary permissions will be obtained
from DGMS after obtaining
environmental clearance.
9. The study area will comprise of 10 km
zone around the mine lease from lease
periphery and the data contained in the EIA
such as waste generation etc., should be for
the life of the mine/ lease period.
The study area considered for this study
is of 10 km radius and all data
contained in the EIA report such as
waste generation etc., is for the life of
the mine / lease period.
10. Land use of the study area delineating
forest area, agricultural land, grazing land,
wildlife sanctuary, national park, migratory
routes of fauna, water bodies, human
settlements and other ecological features
should be indicated. Land use plan of the
mine lease area should be prepared to
encompass preoperational, operational and
post operational phases and submitted.
Impact, if any, of change of land use
should be given.
Land use and land cover pattern of the
study area has been discussed in pp.52
– 56 under chapter III.
Land use plan of the project area
showing pre-operational, operational
and post-operational phases are
discussed in Table 2.3, p.17 under
chapter II.
11. Details of the land for any Over Burden
Dumps outside the mine lease, such as
extent of land area, distance from mine
lease, its land use, R&R issues, if any,
should be given.
Not Applicable.
There is no waste anticipated during
this quarry operation. The entire
quarried out rough stone will be
transported to the needy customers.
Hence, no dumps are proposed outside
the lease area.
12. Certificate from the competent authority in
the State Forest Department should be
provided, confirming the involvement of
forest land, if any, in the project area. In
the event of any contrary claim by the
Project Proponent regarding the status of
forests, the site may be inspected by the
Not Applicable.
There is no forest land involved within
the proposed project area and the
proposed project area is a patta land.
Approved mining plan has been
enclosed in Annexure Volume 1.

State Forest Department along with the
Regional Office of the Ministry to ascertain
the status of forests, based on which, the
Certificate in this regard as mentioned
above be issued. In all such cases, it would
be desirable for representative of the State
Forest Department to assist the Expert
Appraisal Committees.
13. Status of forestry clearance for the broken-
up area and virgin forestland involved in
the project including deposition of Net
Present Value (NPV) and compensatory
afforestation (CA) should be indicated. A
copy of the forestry clearance should also
be furnished.
Not Applicable.
The proposed project area does not
involve any forest land.
14 Implementation status of recognition of
forest rights under the Scheduled Tribes
and other Traditional Forest Dwellers
(Recognition of Forest Rights) Act, 2006
should be indicated.
Not Applicable.
The project doesn't attract Recognition
of Forest Rights Act, 2006.
15 The vegetation in the RF / PF areas in the
study area, with necessary details, should
be given.
No Reserve Forest within the study
area.
16 A study should be done to ascertain the
impact of the mining project on wildlife of
the study area and details furnished. Impact
of the project on the wildlife in the
surrounding and any other protected area
and accordingly, detailed mitigative
measures required, should be worked out
with cost implications and submitted.
Not Applicable.
There is no any wildlife/protected area
within 10 km radius from the periphery
of the project area.
17 Location of National Parks, Sanctuaries,
Biosphere Reserves, Wildlife Corridors,
Ramsar Site, Tiger/ Elephant Reserves/
(existing as well as proposed), if any,
within 10 km of the mine lease should be
clearly indicated, supported by a location
map duly authenticated by Chief Wildlife
Warden. Necessary clearance, as may be
applicable to such projects due to
proximity of the ecologically sensitive
areas as mentioned above, should be
obtained from the Standing Committee of
Not Applicable.
There are no National Parks, Biosphere
Reserves, Wildlife Corridors, and
Tiger/ Elephant Reserves within 10 km
radius from the periphery of the project
area.

National Board of Wildlife and copy
furnished.
18 A detailed biological study of the study
area [core zone and buffer zone (10 km
radius of the periphery of the mine lease)]
shall be carried out. Details of flora and
fauna, endangered, endemic and RET
Species duly authenticated, separately for
core and buffer zone should be furnished
based on such primary field survey, clearly
indicating the Schedule of the fauna
present. In case of any scheduled-I fauna
found in the study area, the necessary plan
along with budgetary provisions for their
conservation should be prepared in
consultation with State Forest and Wildlife
Department and details furnished.
Necessary allocation of funds for
implementing the same should be made as
part of the project cost.
A detailed biological study was carried
out in both core and buffer zones and
the results have been discussed in
pp.92-117 under chapter III.
There is no schedule I species of
animals observed within study area as
per Wildlife Protection Act, 1972 and
no species falls in vulnerable,
endangered or threatened category as
per IUCN. There is no endangered red
list species found in the study area.
19 Proximity to areas declared as 'Critically
Polluted' or the project areas likely to come
under the 'Aravalli Range', (attracting court
restrictions for mining operations), should
also be indicated and where so required,
clearance certifications from the prescribed
Authorities, such as the SPCB or State
Mining Department should be secured and
furnished to the effect that the proposed
mining activities could be considered.
Not Applicable.
Project area / Study area is not declared
in ‘Critically Polluted’ Area and does not come under ‘Aravalli Range.
20 Similarly, for coastal Projects, A CRZ map
duly authenticated by one of the authorized
agencies demarcating LTL. HTL, CRZ
area, location of the mine lease with
respect to CRZ, coastal features such as
mangroves, if any, should be furnished.
(Note: The Mining Projects falling under
CRZ would also need to obtain approval of
the concerned Coastal Zone Management
Authority).
Not Applicable.
The project doesn't attract the C.R.Z.
Notification, 2018.
21 R&R plan/compensation details for the
Project Affected People (PAP) should be
Not Applicable.
There are no approved habitations

furnished. While preparing the R&R Plan,
the relevant State/National Rehabilitation
& Resettlement Policy should be kept in
view. In respect of SCs /STs and other
weaker sections of the society in the study
area, a need-based sample survey, family-
wise, should be undertaken to assess their
requirements, and action programmes
prepared and submitted accordingly,
integrating the sectoral programmes of line
departments of the State Government. It
may be clearly brought out whether the
village(s) located in the mine lease area
will be shifted or not. The issues relating to
shifting of village(s) including their R&R
and socio-economic aspects should be
discussed in the report.
within a radius of 300 meters.
Therefore, R&R plan / compensation
details for the Project Affected People
(PAP) is not anticipated.
22 One season (non-monsoon) [i.e., March-
May (Summer Season); October-December
(post monsoon season); December –
February (winter season)] primary baseline
data on ambient air quality as per CPCB
Notification of 2009, water quality, noise
level, soil and flora and fauna shall be
collected and the AAQ and other data so
compiled presented date-wise in the EIA
and EMP Report. Site-specific
meteorological data should also be
collected. The location of the monitoring
stations should be such as to represent
whole of the study area and justified
keeping in view the pre-dominant
downwind direction and location of
sensitive receptors. There should be at least
one monitoring station within 500 m of the
mine lease in the predominant downwind
direction. The mineralogical composition
of PM10, particularly for free silica, should
be given.
Baseline data were collected for the
period of October-December 2021 as
per CPCB notification and MoEF & CC
Guidelines.
Details have been included in pp.49-
117 under chapter III.
23 Air quality modelling should be carried out
for prediction of impact of the project on
the air quality of the area. It should also
take into account the impact of movement
Air quality modelling for prediction of
incremental GLCs of pollutants was
carried out using AERMOD view 9.6.1.
The model results have been given in
pp.137-143 under the chapter IV.

of vehicles for transportation of mineral.
The details of the model used and input
parameters used for modelling should be
provided. The air quality contours may be
shown on a location map clearly indicating
the location of the site, location of sensitive
receptors, if any, and the habitation. The
wind roses showing predominant wind
direction may also be indicated on the map.
24 The water requirement for the project, its
availability and source should be furnished.
A detailed water balance should also be
provided. Fresh water requirement for the
project should be indicated.
The water requirement details have
been provided in Table 2.14 in p.46
under chapter II and Table 11.7 p.211
under chapter XI.
25 Necessary clearance from the competent
authority for drawl of requisite quantity of
water for the project should be provided.
Not Applicable.
Water for dust suppression, greenbelt
development and domestic use will be
sourced from accumulated
rainwater/seepage water in mine pits
and purchased from local water vendors
through water tankers on daily
requirement basis.
Drinking water will be sourced from the
approved water vendors.
26 Description of water conservation
measures proposed to be adopted in the
Project should be given. Details of
rainwater harvesting proposed in the
Project, if any, should be provided.
Part of the working pit will be allowed
to collect rain water during the spell of
rain. The water thus collected will be
used for greenbelt development and
dust suppression.
The mine closure plan has been
prepared for converting the excavated
pit into rain water harvesting structure
and serve as water reservoir for the
project village during draught season.
27 Impact of the project on the water quality,
both surface and groundwater, should be
assessed and necessary safeguard
measures, if any required, should be
provided.
Impact studies and mitigation measures
of water environment including surface
water and ground water have been
discussed in pp. 135-137 under the
chapter IV.
28 Based on actual monitored data, it may
clearly be shown whether working will
intersect groundwater. Necessary data and
documentation in this regard may be
The ground water table is found at the
depth of 70-75m below ground level.
The depth of quarry is 50m(45m
AGL+5m BGL) Therefore, the mining
activity will not intersect the ground

provided. In case the working will intersect
groundwater table, a detailed
hydrogeological study should be
undertaken and report furnished. The
Report inter-alia shall include details of the
aquifers present and impact of mining
activities on these aquifers. Necessary
permission from Central Ground Water
Authority for working below ground water
and for pumping of ground water should
also be obtained and copy should be
furnished.
water table. Data regarding the
occurrence of groundwater table have
been provided in p.74-75 under the
chapter III.
29 Details of any stream, seasonal or
otherwise, passing through the lease area
and modification / diversion proposed, if
any, and the impact of the same on the
hydrology should be brought out.
Not Applicable.
There are no streams, seasonal or other
water bodies passing within the project
area. Therefore, no modification or
diversion of water bodies is anticipated.
30 Information on site elevation, working
depth, groundwater table etc. should be
provided both in AMSL and BGL. A
schematic diagram may also be provided
for the same.
The highest elevation of the project area
is 570 AMSL.
Ultimate depth of the mine is 50 m (1m
Topsoil + 49m Rough Stone) 45m
above ground level +5m below ground
level.
Depth to the water level in the area is
70-75m BGL.
31 A time bound Progressive Greenbelt
Development Plan shall be prepared in a
tabular form (indicating the linear and
quantitative coverage, plant species and
time frame) and submitted, keeping in
mind, the same will have to be executed
prior to commencement of the project.
Phase-wise plan of plantation and
compensatory afforestation should be
charted clearly indicating the area to be
covered under plantation and the species to
be planted. The details of plantation
already done should be given. The plant
species selected for green belt should have
greater ecological value and should be of
good utility value to the local population
with emphasis on local and native species
and the species which are tolerant to
Greenbelt development plan has been
given in p.151-157 under chapter IV.

pollution.
32 Impact on local transport infrastructure due
to the project should be indicated.
Projected increase in truck traffic as a
result of the project in the present road
network (including those outside the
project area) should be worked out,
indicating whether it is capable of handling
the incremental load. Arrangement for
improving the infrastructure, if
contemplated (including action to be taken
by other agencies such as State
Government) should be covered. Project
proponent shall conduct impact of
transportation study as per Indian Road
Congress Guidelines.
Traffic density survey was carried out
to analyse the impact of transportation
in the study area as per IRC guidelines
1961 and it is inferred that there is no
significant impact due to the proposed
transportation from the project area.
Details have been provided in pp.44&
46 under chapter II.
33 Details of the onsite shelter and facilities to
be provided to the mine workers should be
included in the EIA Report.
Infrastructure & other facilities will be
provided to the mine workers after the
grant of quarry lease and the same has
been discussed in p.47 under chapter II.
34 Conceptual post mining land use and
reclamation and restoration of mined out
areas (with plans and with adequate
number of sections) should be given in the
EIA report.
Mine closure plan is a part of approved
mining plan enclosed as Annexure I.
35 Occupational health impacts of the project
should be anticipated and the proposed
preventive measures spelt out in detail.
Details of pre-placement medical
examination and periodical medical
examination schedules should be
incorporated in the EMP. The project
specific occupational health mitigation
measures with required facilities proposed
in the mining area may be detailed.
Occupational health impacts of the
project and preventive measures have
been explained in detail in pp.158-161
under chapter IV.
36 Public health implications of the project
and related activities for the population in
the impact zone should be systematically
evaluated and the proposed remedial
measures should be detailed along with
budgetary allocations.
No public health implications are
anticipated due to this project. Details
of CER and CSR have been given in
pp.190-191under the chapter VIII.

37 Measures of socio-economic significance
and influence to the local community
proposed to be provided by the project
proponent should be indicated. As far as
possible, quantitative dimensions may be
given with time frames for implementation.
No negative impact on socio-economic
environment of the study area is
anticipated and this project shall benefit
the Socio-Economic environment by
offering employment for 15 people
directly as discussed in p.189 under
chapter VIII.
38 Detailed environmental management plan
(EMP) to mitigate the environmental
impacts which, should inter-alia include the
impacts of change of land use, loss of
agricultural and grazing land, if any,
occupational health impacts besides other
impacts specific to the proposed Project.
Detailed environment management plan
for the project to mitigate the
anticipated impacts has been included
in pp.193-206 under chapter X.
39 Public hearing points raised and
commitment of the project proponent on
the same along with time bound Action
Plan with budgetary provisions to
implement the same should be provided
and also incorporated in the final EIA/EMP
report of the project.
The outcome of public hearing will be
updated in the final EIA/AMP report.
40 Details of litigation pending against the
project, if any, with direction /order passed
by any Court of Law against the Project
should be given.
No litigation is pending in any court
against this project.
41 The cost of the Project (capital cost and
recurring cost) as well as the cost towards
implementation of EMP should be clearly
spelt out.
Project cost is Rs. 66,40,000/- CER cost
is Rs. 1,32,800/-
In order to implement the
environmental protection measures, an
amount of Rs.12.25 lakhs as capital cost
and Rs.2.79 lakhs as recurring cost is
proposed considering present market
scenario for the proposed project in
pp.205-206 under chapter X.
42 A disaster management plan shall be
prepared and included in the EIA/EMP
report.
Details regarding disaster management
plan have been provided in pp.171-175
under chapter VII.
43 Benefits of the project if the project is
implemented should be spelt out. The
benefits of the project shall clearly indicate
environmental, social, economic,
employment potential, etc.
Details have been given in p.189 – 191
under chapter VIII.
44 Besides the above, the below mentioned general points are also to be followed:

a) Executive summary of the EIA/EMP report Enclosed as separate booklet.
b)
All documents to be properly referenced
with index and continuous page
numbering.
All the documents have been properly
referenced with index and continuous
page numbering.
c) Where data are presented in the report,
especially in tables, the period in which the
data were collected and the sources should
be indicated.
List of tables and source of the data
collected have been mentioned.
d) Project Proponent shall enclose all the
analysis/testing reports of water, air, soil,
noise etc. using the MoEF&CC/NABL
accredited laboratories. All the original
analysis/testing reports should be available
during appraisal of the Project
Baseline monitoring reports are
enclosed with This report in chapter III.
Original Baseline monitoring reports
will be submitted in the final EIA report
during appraisal.
e) Where the documents provided are in a
language other than English, an English
translation should be provided.
Not Applicable.
f) The questionnaire for environmental
appraisal of mining projects as devised
earlier by the Ministry shall also be filled
and submitted.
That will be enclosed along with final
EIA/EMP report.
g) While preparing the EIA report, the
instructions for the proponents and
instructions for the consultants issued by
MoEF&CC vide O.M. No. J-
11013/41/2006-IA. II (I) dated 4th August,
2009, which are available on the website of
this Ministry, should be followed.
Noted & agreed.
Instructions issued by MoEF & CC
O.M. No. J-11013/41/2006-IA. II (I)
dated 4th August, 2009 have been
followed.
h) Changes, if any made in the basic scope
and project parameters (as submitted in
Form-I and the PFR for securing the TOR)
should be brought to the attention of
MoEF&CC with reasons for such changes
and permission should be sought, as the
ToR may also have to be altered. Post
public hearing changes in structure and
content of the draft EIA/EMP (other than
modifications arising out of the P.H.
process) will entail conducting the PH
again with the revised documentation.
Noted & agreed.
i) As per the circular No. J-11011/618/2010-
IA. II(I) dated 30.5.2012, certified report of
the status of compliance of the conditions
Not applicable.

stipulated in the environment clearance for
the existing operations of the project,
should be obtained from the Regional
Office of Ministry of Environment, Forest
and Climate Change, as may be applicable.
j) The EIA report should also include (i)
surface plan of the area indicating contours
of main topographic features, drainage and
mining area, (ii) geological maps and
sections and (iii) sections of the mine pit
and external dumps, if any, clearly
showing the land features of the adjoining
area.
Surface & geological plans have been
included in Figures 2.14 &2.15 in
pp.37-38.
Closure plan has been included in
Figures 2.17in p.40.

CONTENTS
S.NO TITLE PAGE
NO
I Introduction 1-14
1.0 Preamble 1
1.1 Purpose of the Report 1-2
1.2 Identification of project and project proponent 2
1.3 Brief Description of the Project P1&P2 4
1.3.1 Location of the Project 7
1.4 Environmental Clearance 10
1.4.1 Screening 10
1.4.2 Scoping 11
1.4.3 Public Consultation 12
1.4.4 Appraisal 12
1.5 Terms of Reference (ToR) 12
1.6 Post Environment Clearance Monitoring 12
1.7 Generic Structure of EIA Document 12
1.8 Scope of the Study 13
1.8.1 Regulatory Compliance & Applicable Laws/Regulations from
proposed project 14
II PROJECT DESCRIPTION 15-48
2.0 General Introduction 15
2.1 Description of the Projects 15
2.1.1 Location Details of the Project 15
2.1.2 Magnitude of Operation 17
2.2 Project Area 23
2.3 Geology and geomorphology 23
2.3.1 Regional geology and geomorphology 23
2.3.2 Local geology & Geomorphology 24
2.4 Resources and reserves – P1&P2 25
2.4.1 Disposal of Waste(P1) 26
2.4.1.1 Disposal of Waste(P2) 26

2.4.2 Conceptual Mining Plan and sections 26
2.4.3 Mine closure 27
2.4.4 Closure Planning & Options Considerations in Mine Design 28
2.4.5 Post – Closure Monitoring 28
2.5 Method of Mining 42
2.5.1 Drilling & Blasting 42
2.5.1.1 Type of Explosives 43
2.5.1.2 Storage of Explosives 43
2.5.2 Extent of Mechanization 43
2.6 General Features 43
2.6.1 Drainage Pattern 43
2.6.2 Traffic Density 44
2.6.3 Mineral Benefication and processing 46
2.6.4 Existing Infrastructures 46
2.7 Project requirements 46
2.7.1 Water Requirement 46
2.7.2 Power and other infrastructure Requirement 46
2.7.3 Fuel requirement 47
2.7.4 Project cost 47
2.7.5 Employment requirement 47
2.8 Project implementation schedule 48
III DESCRIPTION OF THE ENVIRONMENT 49-132
3.0 General 49
3.1 Land Environment 52
3.1.1 Land Use/Land Cover 52
3.1.2 Topography 54
3.1.3 Drainage pattern of the area 54
3.1.4 Seismic sensitivity 54
3.1.5 Environmental features in the study area 55
3.1.6 Soil environment 56
3.1.6.1 Methodology 57
3.1.6.2 Soil Testing Results 57

3.1.6.3 Results and Discussion 58
3.2 Water environment 62
3.2.1 Surface water resources 62
3.2.2 Ground water resources 62
3.2.3 Methodology 62
3.2.4 Result and discussion 68
3.2.4.1 Surface Water 68
3.2.4.2 Ground Water 68
3.2.5 Hydrogeological Studies 68
3.2.5.1 Groundwater Levels and Flow Direction 68
3.2.5.2 Electrical Resistivity Investigation 72
3.2.5.3 Methodology and Data Acquisition 72
3.2.5.4 Data Presentation 73
3.2.5.5 Geophysical data interpretation 74
3.3 Air Environment 75
3.3.1 Meteorology 75-76
3.3.1.1 Climate 76
3.3.1.2 Rainfall 77
3.3.1.3 Wind Pattern 77
3.3.1.4 Correlation between Primary and Secondary Data 77-78
3.3.2 Methodology and Objectives 78
3.3.3 Sampling and Analytical Techniques 78
3.3.4 Frequency and Parameters for Sampling 79
3.3.5 Ambient Air Quality Monitoring Stations 79
3.3.6 Fugitive Dust Emission 85
3.3.7 Results & Discussion 86
3.4 Noise Environment 86
3.4.1 Identification of sampling locations 86
3.4.2 Method of Monitoring 87
3.4.3 Analysis of ambient noise level in the study area 89
3.4.4 Result & Discussion 90
3.5 Ecological environment 90

3.5.1 Introductions 92
3.5.2 Scope of work 92
3.5.3 Objectives of biological studies 93
3.5.3.1 Methodology of sampling 93-94
3.5.4 Quadrats Method 94
3.5.4.1 Flora 94
3.5.4.2 Flora in Core Zone 95
3.5.4.3 Flora in Buffer Zone 95
3.5.4.4 Aquatic Vegetation 103
3.5.4.5 Rare and Endangered Flora in the Study Area 103
3.5.4.6 Endemic Plants of the Study Area 103
3.5.4.7 Enlistment of Vegetation in the buffer zones and core zone 104
3.5.5 Fauna 106
3.5.5.1 Fauna Methodology 107
3.5.5.2 Fauna in Core Zone 107
3.5.5.3 Fauna in Buffer Zone 110
3.5.5.4 Rare and Endangered fauna of the study area 115
3.5.6 Results and Discussion 117
3.6 Socio-Economic Environment 117
3.6.1 Objectives of the Study 117
3.6.2 Scope of Work 118
3.6.3 District Profile 118
3.6.4 Socio-Economic Status of Study area 118
3.6.4.1 Literacy of Krishnagiri Taluk 119
3.6.4.2 Worker’s profile of Krishnagiri Taluk 119
3.6.5 Recommendation and Suggestion 132
3.6.6 Summary & Conclusion 132
IV ANTICIPATED ENVIRONMENTAL IMPACTS
AND MITIGATION MEASURES 133-161
4.0 General 133
4.1 Land Environment 133
4.1.1 Anticipated Impact 133-134

4.1.2 Common Mitigation Measures from proposed project 134
4.1.1 Soil environment 134
4.1.1.1 Anticipated Impact on Soil Environment 134
4.1.1.2 Common Mitigation Measures from proposed project 135
4.1.1.3 Waste dump management 135
4.2 Water Environment 135
4.2.1 Anticipated Impact 135-136
4.2.1.1 Details of water requirements in KLD 136
4.2.2 Common Mitigation Measures for the Proposed Project 136-137
4.3 Air Environment 137
4.3.1 Anticipated Impact from all proposed project 137
4.3.2 Emission Estimation 138
4.3.2.1 Frame work of Computation and Model Details 138
4.3.2.2 Modelling of Incremental Concentration from the proposed
projects 139
4.3.2.3 Model Results 141
4.3.2.4 Common Mitigation Measures 144
4.3.2.4.1 Drilling 144
4.3.2.4.2 Blasting 144
4.3.2.4.3 Haul Road and Transportation 144-145
4.3.2.4.4 Green Belt 145
4.3.2.4.5 Occupational Health 145
4.4 Noise Environment 145-146
4.4.1 Anticipated Impact 146
4.4.2 Common Mitigation Measures 147
4.4.3 Ground Vibrations 148
4.4.3.1 Common Mitigation Measures 149
4.5 Biological Environment 150
4.5.1 Anticipated impact on Flora 151
4.5.2 Mitigation Measures 151
4.5.2.1 General Guidelines for Green belt Development 151

4.5.2.2 Environmental Management plan – flora and Fauna 151-152
4.5.2.3 Species recommendation for plantation granted in the district 152
4.5.3 Anticipated Impact on Fauna 154
4.5.3.1 Measures for protection and conservation of wildlife species 155
4.5.3.2 Mitigation Measures 155
4.5.4 Impact on Aquatic Biodiversity 155
4.5.5 Impact Assessment on Biological Environment 155
4.5.6 Impact evaluation 157
4.6 Socio Economic Environment 157
4.6.1 Anticipated Impact from proposed and existing Projects 157
4.6.2 Common Mitigation Measures for proposed project 158
4.7 Occupational Health and Safety 158
4.7.1 Respiratory Hazards 158
4.7.2 Noise 158
4.7.3 Physical hazards 159
4.7.4 Occupational Health Survey 159
4.8 Mine waste management 160
4.9 Mine closure 160
4.9.1 Mine Closure Criteria 160
4.9.1.1 Physical Stability 160
4.9.1.2 Chemical Stability 161
4.9.1.3 Biological Stability 161
V ANALYSIS OF ALTERNATIVES
(TECHNOLOGY AND SITE) 162-163
5.1 Introduction 162
5.2 Factors Behind the Selection of Project Site 162
5.3 Analysis of Alternative Site 162
5.4 Factors Behind Selection of Proposed Technology 162-163
5.5 Analysis of Alternative Technology 163
VI ENVIRONMENTAL MONITORING PROGRAMME 164-168
6.0 General 164
6.1 Methodology of Monitoring Mechanism 164-165

6.2 Implementation Schedule of Mitigation Measures 166
6.3 Monitoring Schedule and Frequency 166
6.4 Budgetary Provision for EMP 167
6.5 Reporting Schedules OF Monitored Data 168
VII ADDITIONAL STUDIES 169-188
7.0 General 169
7.1 Public Consultation for Proposed Projects P1 and P2 169
7.2 Risk Assessment for Proposed Project P1 and P2 169
7.3 Disaster Management Plan for Proposed Projects P1 and P2 171-172
7.3.1 Roles and Responsibilities of Emergency Team 173-174
7.3.2 Emergency Control Procedure 174
7.3.3 Proposed Fire Extinguishers 174
7.3.4 Alarm System 175
7.4 Cumulative Impact Study 176
7.4.1 Air Environment 180
7.4.2 Noise Environment 182
7.4.3 Ground Vibrations 183
7.4.4 Socio Economic Environment 184
7.5 Plastic Waste Management Plan for Proposed Projects P1& P2 185
7.5.1 Objective 186
7.6 Post Covid Health Management Plan for Proposed Project 186
7.6.1 Post-Covid Follow Up Protocol 187-188
VIII PROJECTS BENEFITS 189-191
8.0 General 189
8.1 Employment Potential 189
8.2 Socio – Economic Welfare Measure Proposed 189
8.3 Improvement in Physical Infrastructure 189
8.4 Improvement in Social Infrastructure 190
8.5 Other Tangible Benefits 190
8.6 Corporate Social Responsibility 190
8.7 Corporate Environment Responsibility 191
IX ENVIRONMENTAL COST BENEFIT ANALYSIS 192

X ENVIRONMENTAL MANAGEMENT PLAN 193-206
10.0 General 193
10.1 Environmental Policy- P1&P2 193
10.1.1 Description of the Administration and Technical Setup- P1&P2 194
10.2 Land Environment Management- P1&P2 194
10.3 Soil Management - P1&P2 195
10.4 Water Management- P1 195
10.4.1 Water Management- P2 195
10.5 Air Quality Management- P1&P2 196
10.6 Noise Pollution Control- P1&P2 197
10.7 Ground Vibration and Fly Rock Control- P1&P2 197
10.8 Biological Environment Management- P1&P2 198
10.8.1 Green belt development plan-P1 199
10.8.1.1 Green belt development plan-P2 200
10.8.2 Species recommended for plantation- P1&P2 200
10.9 Occupational safety & health management- P1&P2 201
10.9.1 Medical surveillance and examinations- P1&P2 201-202
10.9.2 Proposed occupational health and safety measures- P1&P2 202-203
10.9.3 Health and safety training programme- P1&P2 203
10.9.4 Budgetary provision for environmental management- P1&P2 204
10.10 Conclusion 206
XI SUMMARY AND CONCLUSION 207-222
11.0 Introduction 207
11.1 Project Description 207
11.2 Description of the Environment 212
11.2.1 Land Environment 212
11.3 Soil Characteristics 213
11.3.1 Physical Characteristics 213
11.3.2 Chemical Characteristics 213
11.4 Water Environment 213
11.4.1 Surface Water 213
11.4.2 Ground Water 213

11.5 Air Environment 213
11.5.1 Site Specific Meteorology 213
11.5.2 Ambient Air Quality Results 214
11.6 Noise Environment 214
11.7 Biological Environment 214
11.8 Socio – Economic Environment 215
11.9 Anticipated Environmental Impacts and Mitigation Measures
for Proposed Project P1&P2
215
11.10 Analysis Of Alternatives 218
11.11 Environmental Monitoring Program 218
11.12 Additional Studies 219
11.12.1 Public Consultation for P1&P2 219
11.12.2 Risk Analysis & Disaster Management Plan for P1&P2 219-220
11.13 Project Benefits for P1&P2 220
11.14 Conclusion 222
XII DISCLOSURE OF CONSULTANT 223-227
LIST OF TABLES
TABLE
No. CONTENTS
PAGE
No
1.1 Salient Features of the Proposed Project Site (P1) 2
1.2 Salient Features of the Proposed Project Site (P2) 2
1.3 Brief Description of the Project (P1) 4-5
1.4 Brief Description of the Project (P2) 5-6
1.4 Environment Attributes 13-14
2.1 Site Connectivity for Projects (P1&P2) 15-16
2.2 Boundary Co-Ordinates of Proposed Project (P1&P2) 16
2.3 Operational Details for Proposed Project- P1&P2 17
2.4 Land Use Pattern of the Proposed Project - P1&P2 23
2.5 Geological Resources and Mineable Reserves of
Proposed Projects – P1 & P2
25
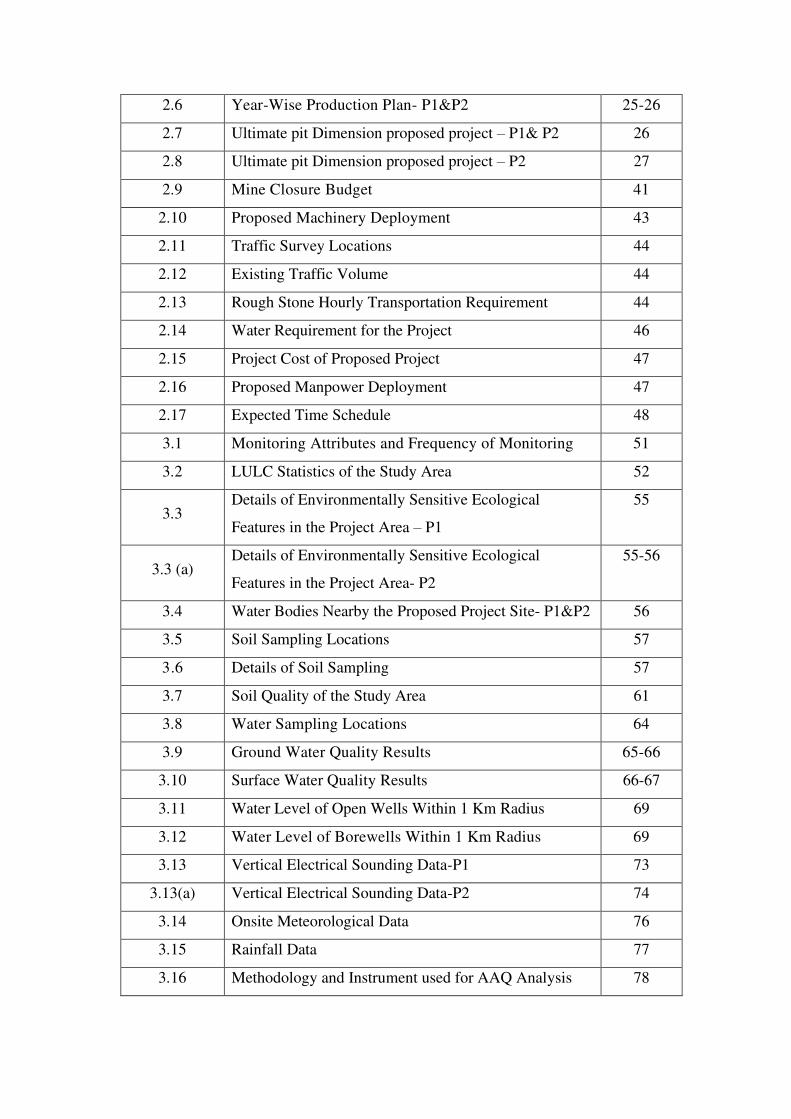
2.6 Year-Wise Production Plan- P1&P2 25-26
2.7 Ultimate pit Dimension proposed project – P1& P2 26
2.8 Ultimate pit Dimension proposed project – P2 27
2.9 Mine Closure Budget 41
2.10 Proposed Machinery Deployment 43
2.11 Traffic Survey Locations 44
2.12 Existing Traffic Volume 44
2.13 Rough Stone Hourly Transportation Requirement 44
2.14 Water Requirement for the Project 46
2.15 Project Cost of Proposed Project 47
2.16 Proposed Manpower Deployment 47
2.17 Expected Time Schedule 48
3.1 Monitoring Attributes and Frequency of Monitoring 51
3.2 LULC Statistics of the Study Area 52
3.3 Details of Environmentally Sensitive Ecological
Features in the Project Area – P1
55
3.3 (a) Details of Environmentally Sensitive Ecological
Features in the Project Area- P2
55-56
3.4 Water Bodies Nearby the Proposed Project Site- P1&P2 56
3.5 Soil Sampling Locations 57
3.6 Details of Soil Sampling 57
3.7 Soil Quality of the Study Area 61
3.8 Water Sampling Locations 64
3.9 Ground Water Quality Results 65-66
3.10 Surface Water Quality Results 66-67
3.11 Water Level of Open Wells Within 1 Km Radius 69
3.12 Water Level of Borewells Within 1 Km Radius 69
3.13 Vertical Electrical Sounding Data-P1 73
3.13(a) Vertical Electrical Sounding Data-P2 74
3.14 Onsite Meteorological Data 76
3.15 Rainfall Data 77
3.16 Methodology and Instrument used for AAQ Analysis 78

3.17 National Ambient Air Quality Standards 79
3.18 Ambient Air Quality (AAQ) Monitoring Locations 80
3.19 Summary of AAQ Result 82
3.20
Maximum, Minimum, Average and 98th Percentile of
Average Air Pollutant Concentrations Over the Study
Area
82
3.21 Average Fugitive Dust Sample Values 85
3.22 Fugitive Dust Sample Values in µg/m3 85
3.23 Details of Noise Monitoring Locations 87
3.24 Ambient Noise Quality Result 89
3.25 Flora species in Core Zone 97
3.26 Flora species in Buffer Zone 98-102
3.27 List of Aquatic plants observed in the study area 103
3.28 Different crops in Krishnagiri District 105
3.29 List of Horticulture Cultivation 106
3.30 Methodology applied during survey of fauna 107
3.31 Faunal diversity in core zone 108-109
3.32 Faunal diversity in Buffer zone 111-113
3.33 Krishnagiri Taluk Population facts 119
3.34 Demographics population of Krishnagiri Taluk 119
3.35 Krishnagiri taluk - Census 2011 data 120
3.36 Krishnagiri Working Population data 120
3.37 Population and Literacy Data of Study Area 121-122
3.38 Workers Profile of Study Area 122-123
3.39 Communication & Transport Facilities in the Study
Area
124-125
3.40 Water& Drainage Facilities in the Study Area 125-126
3.41 Other Facilities in the study Area 127-128
3.42 Educational Facilities in the study area 128-129
3.43 Medical Facilities in the study area 130-131
4.1 Water Requirements – P1&P2 136
4.2 Estimated Emission Rate for PM10 139

4.3 Estimated Emission Rate for SO2 139
4.4 Estimated Emission Rate for Nox 139
4.5 Incremental & Resultant GLC Of PM2.5 141
4.6 Incremental & Resultant GLC Of PM10 142
4.7 Incremental & Resultant GLC Of SO2 142
4.8 Incremental & Resultant GLC Of NOX 143
4.9 Incremental & Resultant GLC Of Fugitive Dust 143
4.10 Activity and Noise Level Produced by Machinery 146
4.11 Predicted Noise Incremental Values(P1&P2) 146-147
4.12 Predicted PPV Values Due to Blasting P1&P2 148
4.13 Recommended Species for Greenbelt Development
Plan- P1&P2
152-153
4.14 Greenbelt Development Plan- P1&P2 153-154
4.15 Budget For Greenbelt Development Plan- P1&P2 154
4.16
Ecological impact assessments of Kothapetta Village,
Roughstone quarry, Krishnagiri Taluk, Krishnagiri
District, Tamilnadu.
156
4.17 Impact Evalution for Biological Resources 157
6.1 Implementation Schedule for Proposed Project- P1&P2 166
6.2 Proposed Monitoring Schedule Post EC for the
Proposed Quarry- P1&P2
167
6.3 Environment Monitoring Budget- P1&P2 168
7.1 Risk Assessment& Control Measures for Proposed
Project- P1&P2
170-171
7.2 Proposed Teams for Emergency Situation- P1&P2 173
7.3 Proposed Fire Extinguishers at Different Locations in-
P1&P2
175
7.4 List of Quarries Within 500-Meter Radius 176
7.5 Salient Features of Proposed Project Site- P1 177
7.6 Salient Features of Proposed Project Site -P2 178
7.7 Salient Features of Existing Quarry “E1” 179
7.8 Salient Features of Existing Quarry “E2” 179-180
7.9 Salient Features of Abundant quarry – ABD – 1&2 180

7.10 Cumulative Production Load of Rough Stone 180
7.11 Emission Estimation from Quarries Within 500-Meter
Radius
181
7.12 Incremental & Resultant GLC Within Cluster 182
7.13 Predicted Noise Incremental Values from Cluster 183
7.14 Nearest Habitation from Each Mine 184
7.15 Ground Vibrations At 4Mines 184
7.16 Socio Economic Benefits from 4 Mines 184
7.17 Employment Benefits from 4 Mines 185
7.18 Greenbelt Development Benefits from 4 Mines 185
7.19 Action Plan to Manage Plastic Waste 186
8.1 CER – Action Plan Proposed Projects- P1&P2 191
10.1 Proposed Controls for Land Environment- P1 & P2 194-195
10.2 Proposed Controls for Soil Management- P1 & P2 195
10.3 Proposed Controls for Water Environment- P1 & P2 196
10.4 Proposed Controls for Air Environment- P1 & P2 196
10.5 Proposed Controls for Noise Environment- P1 & P2 197
10.6 Proposed Controls for Ground Vibrations & Fly Rock-
P1 & P2
198
10.7 Proposed Green Belt Activities for 5 Years- P1&P2 199-200
10.8 Recommended Species to Plant in the Green Belt-
P1&P2
200-201
10.9 Medical Examination Schedule- P1&P2 202
10.10 List of Periodical Trainings Proposed for Employees-
P1&P2
204
10.11 EMP Budget for Proposed Project- P1 205
10.11(a) EMP Budget for Proposed Project- P2 205
11.1 Salient Features – Proposed Quarry- P1 207-208
11.2 Salient Features – Proposed Quarry- P2 208-209
11.3 Land Use Pattern of the Proposed Project- P1&P2 209
11.4 Resources and Reserves of Proposed Project – P1&P2 210
11.5 Operational detail for proposed projects – P1&P2 210

11.6 Ultimate Pit Dimension – P1&P2 211
11.7 Water Requirement of the Proposed Project– P1&P2 211
11.8 Land Use / Land Cover Statistics for 10 Km Radius 212
11.9 Meteorological Data Recorded at Site 214
11.10 Anticipated Impacts & Mitigation Measures 215-218
11.11 Post Project Monitoring Program for Proposed Project 219
11.11(a) EMP Budget Proposed Project- P1 221
11.12 EMP Budget Proposed Project-P2 221
LIST OF FIGURES
FIG. NO. TITLE PAGE
NO.
1.1 Satellite Imagery Showing Cluster of Quarries within
500m Radius 3
1.2 Key Map Showing the Location of the Proposed Project
Site 8
1.3 Geo-Referenced Toposheet Showing the Proposed
Project Site Around10 Km Radius 9
2.1 Field Photographs showing different angles of the
project area P1 18
2.2 Field Photographs showing different angles of the
project area-P2 18
2.3 Google Image Showing the Proposed Project Site-P1 19
2.4 Google Image Showing the Proposed Project SiteP2 20
2.5 Google earth image showing 300and 500m radius limits
drawn from the proposed projects-p1&p2 21
2.6 Location Map Showing Surface Features Around 1km
Radius from the Proposed Project Site-P1&P2 22
2.7 Geology map of Krishnagiri District 30
2.8 Geology Map of 10km Radius from the Proposed Project
Site 31
2.9 Geomorphology Map 0f 10km Radius from the Proposed
Project 32
2.10 Surface Plan for the project-P1 33
2.11 Topography, geological plan, year-wise development &
production plan and sections P1 34
2.12 Progressive mine closure plan and sections P1 35
2.13 Conceptual plan and sections P1 36
2.14 Surface Plan for the project-P2 37

2.15 Year-wise development production plan & section -P2 38
2.16 Conceptual and final mine closure plan & sections-P2 39
2.17 Progressive mine closure plan-P2 40
2.18 Drainage map of 10km radius from the proposed project
site-P1&P2 45
3.1 LULC Map of 10km Radius from the Proposed Project
Site 53
3.2 Pie Diagram Showing Proportion of LULC in the Study
Area 54
3.3 Geo-referenced toposheet showing soil sampling
locations within 10km radius around the proposed project
site
59
3.4 Soil Classification around 10km radius from the proposed
projects sites 60
3.5
Geo-referenced toposheet showing water sampling
locations within 10k m radius around the proposed project
sites
63
3.6 Water samples collection for water quality analysis 64
3.7
Open well static groundwater elevation map showing
the direction of groundwater flow within unconfined
aquifer
70
3.8 Bore well static groundwater elevation map showing the
direction of groundwater flow within confined aquifer 71
3.9 Principle of Electrical Resistivity Investigation 72
3.10 Graph showing occurrence of water bearing fracture
zones indicated by water purple squares 73
3.11 Graph showing occurrence of water bearing fracture
zones indicated by water purple squares 74
3.12 Onsite Wind Rose Diagram 77
3.13(a) Ambient air quality data collection in core zone -P1 80
3.13(b) Ambient air quality data collection in core zone - P2 80
3.14 Ambient air quality data collection in buffer Zone 80
3.15 Geo- referenced toposheet showing Ambient air quality
monitoring station locations around 10km radius from
the proposed project sites
81
3.16
Bar chart showing maximum, minimum, and the average
concentrations of PM2.5 measured from the eight air
quality monitoring stations within 10km radius
83
3.17
Bar chart showing maximum, minimum, and the
average concentrations of PM10 measured from the
eight air quality monitoring stations within 10km
radius
83
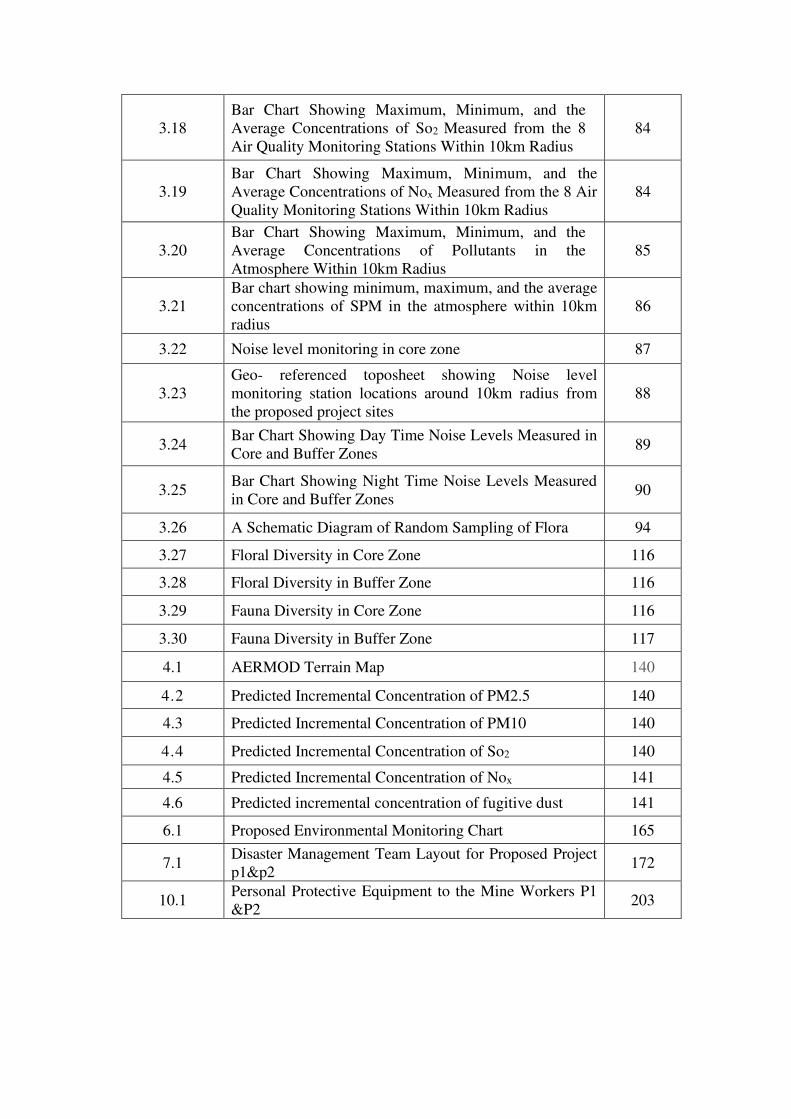
3.18 Bar Chart Showing Maximum, Minimum, and the
Average Concentrations of So2 Measured from the 8
Air Quality Monitoring Stations Within 10km Radius
84
3.19
Bar Chart Showing Maximum, Minimum, and the
Average Concentrations of Nox Measured from the 8 Air
Quality Monitoring Stations Within 10km Radius
84
3.20 Bar Chart Showing Maximum, Minimum, and the
Average Concentrations of Pollutants in the
Atmosphere Within 10km Radius
85
3.21
Bar chart showing minimum, maximum, and the average
concentrations of SPM in the atmosphere within 10km
radius
86
3.22 Noise level monitoring in core zone 87
3.23
Geo- referenced toposheet showing Noise level
monitoring station locations around 10km radius from
the proposed project sites
88
3.24 Bar Chart Showing Day Time Noise Levels Measured in
Core and Buffer Zones 89
3.25 Bar Chart Showing Night Time Noise Levels Measured
in Core and Buffer Zones 90
3.26 A Schematic Diagram of Random Sampling of Flora 94
3.27 Floral Diversity in Core Zone 116
3.28 Floral Diversity in Buffer Zone 116
3.29 Fauna Diversity in Core Zone 116
3.30 Fauna Diversity in Buffer Zone 117
4.1 AERMOD Terrain Map 140
4.2 Predicted Incremental Concentration of PM2.5 140
4.3 Predicted Incremental Concentration of PM10 140
4.4 Predicted Incremental Concentration of So2 140
4.5 Predicted Incremental Concentration of Nox 141
4.6 Predicted incremental concentration of fugitive dust 141
6.1 Proposed Environmental Monitoring Chart 165
7.1 Disaster Management Team Layout for Proposed Project
p1&p2 172
10.1 Personal Protective Equipment to the Mine Workers P1
&P2 203

Page | 1
CHAPTER I
INTRODUCTION
1.0 PREAMBLE
Environmental Impact Assessment (EIA) is the management tool to ensure the
sustainable development. It is a process involved in the identification of the environmental,
social and economic impacts of a project. It is used by the decision makers/environmental
managers as a tool in taking appropriate decisions for any project. EIA systematically
examines both beneficial and adverse consequences of the project and ensures that these
impacts are taken into account during the project designing. It also reduces conflicts by
promoting community participation, information, and helps in developing the base for
environmentally sound project.
The cluster area was calculated as per MoEF & CC Notification S.O. 2269(E) dated 1st
July 2016. The cluster covers an area of 20.19.0 hectares in Kothapetta Village, Krishnagiri
Taluk, Krishnagiri District and Tamil Nadu State and consists of 2 proposed projects
mentioned as P1 and P2 and 2 existing projects mentioned as E1, E2, and 2 abundant quarries
proposed for cluster of EIA study.
The baseline environmental data were collected for the period of (October 2021 to
December 2021) to prepare a detailed EIA report in compliance with the ToR obtained vide
letter No. SEIAA-TN/F.No.8519/SEAC/ToR-992/2021, dated28.07.2021–
Tmt.SA.Sumithashankar for the proposed project (P1) and letter No. SEIAA-
TN/F.No.8687/SEAC/ToR-1067/2022 Dated:01.03.2022 – M/s. MA Quality Stone for the
proposed project (P2).
The report thus prepared discusses the cumulative impacts of the 2 proposed projects
and the 2 existing projects and 2 abundant quarries for proposed a detailed Environmental
Management Plan (EMP) to minimize the adverse impacts of those projects.
1.1 PURPOSE OF THE REPORT
The Ministry of Environment and Forests, Govt. of India, through its EIA notification
S.O. 1533(E) of 14th September 2006 and its subsequent amendments as per Gazette
Notification S.O. 3977 (E) of 14thAugust 2018, has classified mining projects into two
categories, i.e. A (> 100 ha) and B (≤ 100 ha).
The order dated 04.09.2018 & 13.09.2018 passed by Hon'ble National Green Tribunal,
New Delhi in O.A. No. 173 of 2018 & O.A. No, 186 of 2016 and MoEF & CC Office
Memorandum F. No. L-11011/175/2018-IA-II (M) dated 12.12.2018 states that all project
areas falling in B1 category requires a detailed report of EIA and EMP appraised by SEAC/

Page | 2
SEIAA. On the basis of the EIA notification,2006, the proposed projects (P1&P2) have been
categorized as “B1”. The purpose of the EIA report is:
o To describe and quantify the impacts on the environment as a result of the proposed
projects and the existing projects contained in the cluster of 500m radius from the
proposed projects
o To provide mitigation measures to reduce the adverse environmental impacts
1.2 IDENTIFICATION OF PROJECT AND PROJECT PROPONENT
Table 1.1 Salient Features of The Proposed Project Sites -P1&P2
P1
Name of the Project Tmt.SA.Sumithashankr Rough stone quarry Project
S.F. No. S.F.No. 56/1 (Part-5)
Extent 1.20.0 ha
Land Type It is a Government Poramboke land - non-Forest land
Village Taluk and
District
Kothapetta Village, Krishnagiri Taluk, Krishnagiri District,
Tamil Nadu.
P2
Name of the Project M/s. MA Quality Stone - Rough stone quarry
S.F. No. 87/1 B2 (P)
Extent 3.70.0 hectares
Land Type Patta Land
Village Taluk and
District
Kothapetta Village, Krishnagiri Taluk, Krishnagiri District,
Tamil Nadu.
Source: Approved mining plan.
Table 1.2 Details of Project Proponents- P1&P2
P1
Name of the Project Proponent Tmt.SA.Sumithashankr
Address
W/o. Shankar Raj,
No.252, Metbanda Village,
Venkatapuram,
Krishnagiri Taluk & District,
Tamil Nadu State – 635 001
Mobile +91 98429 72729
Status Proprietor
P2
Name of the Project Proponent M/s. MA Quality Stone
Address 58B, Gandhi Nagar,
Krishnagiri District - 635 001
Mobile ---
Status Proprietor
Source: Approved mining plan of Respective Proposal.

Page | 3
Figure 1.1 Satellite Imagery Showing Cluster of Quarries Within 500m Radius

Page | 4
1.3 BRIEF DESCRIPTION OF THE PROJECT (P1&P2)
Open cast method of Mining is being carried out with 5.0-meter vertical bench with a
bench width is not less than the bench height. The Rough Stone is proposed to quarry at 5m
bench height & width with conventional opencast manual method of quarrying. The quarry
operation involves equipment’s like hammer and chisel and slurry blasting like expanding
chemicals will be used for liberates the required size of foundation stones and jelly from the
parent rock mass and Manual Loading and transportation of rough stone to the needy
customer. The production of rough stone in this quarry involves the following method which
is typical for Rough Stone quarrying in contrast to other major mineral mining. Splitting of
rock mass of considerable volume from the parent rock mass by Handy hammer, chisel and
slurry explosives like expanding chemical and further made to smaller sizes by manually with
Handy hammer and chisel and loading the Rough Stone by manually from pithead to the
needy customer.
Table 1.3 Brief Description of The Project (P1)
Name of the Quarry Tmt.SA. Sumithashankr Rough stone quarry Toposheet No 57 – L/02 Latitude between 12°32'53.25"N to 12°32'57.45"N Longitude between 78°12'29.71"E to 78°12'35.28"E Highest Elevation 525m-531m AMSL Ultimate depth of Mining 40m [10m above ground level + 30m below ground level]
Geological Resources Rough Stone in m3 Top soil m3
4,73,598 -
Mineable Reserves Rough Stone in m3 Top Soil m3
1,79,843 -
Proposed reserve for five years up to the depth of 40m bgl
1,79,843 -
Existing Pit Dimension Existing Pit Dimension: 49m (L) x 60m (W) x 5m (D) AGL
Ultimate Pit Dimension Pit I - 63m (L) x 46m (W) x 40m (D) [10m AGL + 30m BGL] Pit I - 90m (L) x 58m (W) x 35m (D) [10m AGL + 25m BGL]
Water Level in the surrounds area
70m bgl
Method of Mining
Opencast Manual Method, the quarry operation involves equipment’s like hammer and chisel and slurry blasting like expanding chemicals (Calcium carbide) will be used for liberate the required size of foundation stones and jelly from the parent rock mass.
Topography The Project area is exhibiting undulated terrain. The gradient is towards North-eastern side and altitude of the area is ranges between 525 m to 531m above from Mean Sea level.
Machinery proposed Tippers 3Nos Blasting Method The quarrying operation is proposed to carried out by Manual

Page | 5
Opencast Method in conjunction with conventional method of mining to splitting of rock mass of considerable volume from the parent rock mass by hammer, chisel and slurry explosives like expanding chemical to loosen the rough stone and further made to smaller sizes by manually with Handy hammer and chisel and loading the rough stone by manually from pithead to the needy customer. No deep hole drilling and heavy blasting involved in this manual quarry operation.
Proposed Manpower Deployment
30 Nos
Project Cost Rs.92,31,000, /- CER Cost @ 2% of Project Cost
Rs.1,84,620/-
Nearby Water Bodies Periya lake 1.5km South Kathinayanapalli lake 2.9km East Krishnagiri dam 4.9 SW
Greenbelt Development Plan
Proposed to plant 150 trees in 1406 Sq.m area in the 7.5 &10 m Safety Zone
Proposed Water Requirement
3.5 KLD
Nearest Habitation Kallukurikki –1.0Km - NE Source: Approved mining plan
Opencast method of semi mechanized mining is being adopted to the proposed project
(P2) extract rough stone of required size, proposed bench height 7meter bench width 5meter
machineries like tractor mounted compressor attached with jack hammer is used for drilling
and blasting. Excavators are used for quarrying of rough stone and Tippers / Lorries are used
for the transportation of rough stone to the destination. It is a semi mechanized quarrying
operation using hole drilling with the help of compressor and jack hammers and smooth
blasting. Rough stone are removed using hydraulic excavator and loaded directly to the
tippers and transported to the needy buyers.
Table 1.4 Brief Description of the Project – P2
Name of the Quarry M/s. MA Quality Stone Rough stone quarry.
Toposheet No. 57-L/2
Latitude Between 12°33' 04.6251''N to12° 32' 53.7570''N
Longitude Between 78°12'46.0552''E to78°12' 57.5020''E
Highest Elevation 570m AMSL
Proposed Depth of Mining 50 m (1m Topsoil + 49m Rough Stone) 45m AGL +5m
BGL
Geological Resources Rough Stone in m3 Mine waste in m3 Topsoil in m3
7,35,007 36,749 7,713
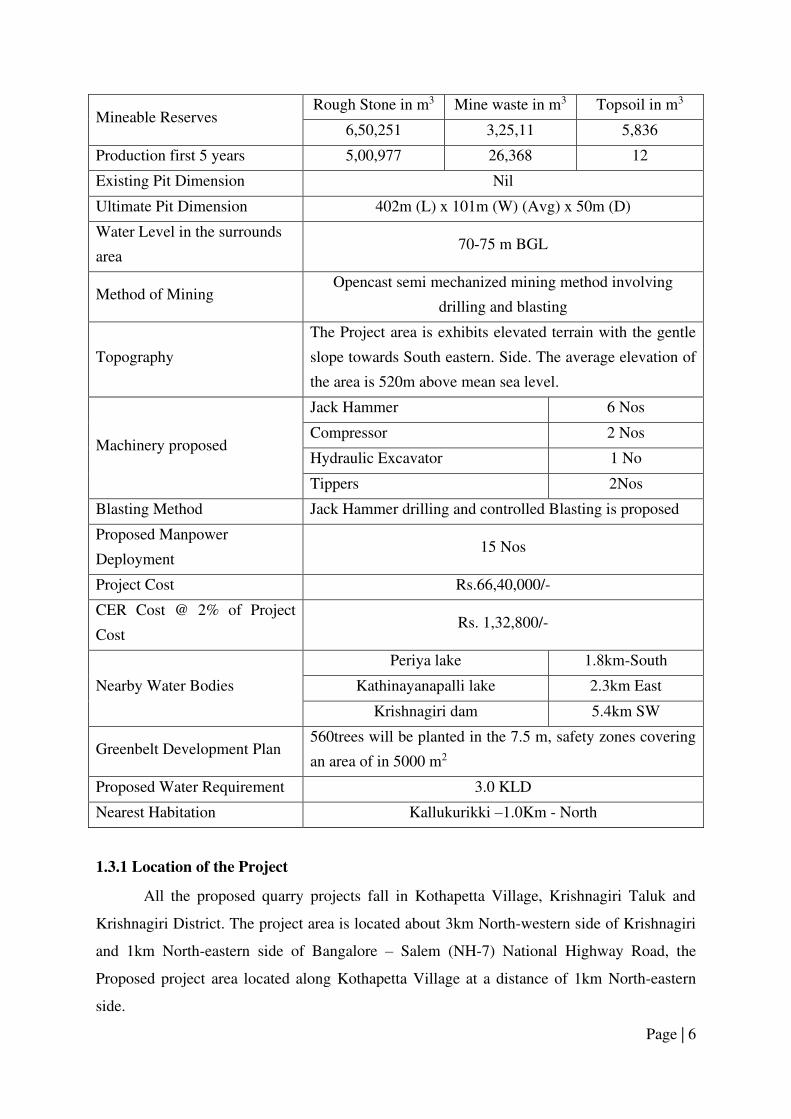
Page | 6
Mineable Reserves Rough Stone in m3 Mine waste in m3 Topsoil in m3
6,50,251 3,25,11 5,836
Production first 5 years 5,00,977 26,368 12
Existing Pit Dimension Nil
Ultimate Pit Dimension 402m (L) x 101m (W) (Avg) x 50m (D)
Water Level in the surrounds
area 70-75 m BGL
Method of Mining Opencast semi mechanized mining method involving
drilling and blasting
Topography
The Project area is exhibits elevated terrain with the gentle
slope towards South eastern. Side. The average elevation of
the area is 520m above mean sea level.
Machinery proposed
Jack Hammer 6 Nos
Compressor 2 Nos
Hydraulic Excavator 1 No
Tippers 2Nos
Blasting Method Jack Hammer drilling and controlled Blasting is proposed
Proposed Manpower
Deployment 15 Nos
Project Cost Rs.66,40,000/-
CER Cost @ 2% of Project
Cost Rs. 1,32,800/-
Nearby Water Bodies
Periya lake 1.8km-South
Kathinayanapalli lake 2.3km East
Krishnagiri dam 5.4km SW
Greenbelt Development Plan 560trees will be planted in the 7.5 m, safety zones covering
an area of in 5000 m2
Proposed Water Requirement 3.0 KLD
Nearest Habitation Kallukurikki –1.0Km - North
1.3.1 Location of the Project
All the proposed quarry projects fall in Kothapetta Village, Krishnagiri Taluk and
Krishnagiri District. The project area is located about 3km North-western side of Krishnagiri
and 1km North-eastern side of Bangalore – Salem (NH-7) National Highway Road, the
Proposed project area located along Kothapetta Village at a distance of 1km North-eastern
side.

Page | 7
The proposed project (P1) area is marked in the Survey of India. Toposheet No 5-
L/02. Latitude between: 12°32'53.25"N to 12°32'57.45"N and Longitude between:
78°12'29.71"E to 78°12'35.28"E.
The proposed project (P2) area is marked in the Survey of India. Latitude between:
12°33' 04.6251''N to12° 32' 53.7570''N and Longitude between: 78°12'46.0552''E to78°12'
57.5020''E.

Page | 8
Figure 1.2 Key Map showing location of the proposed project site
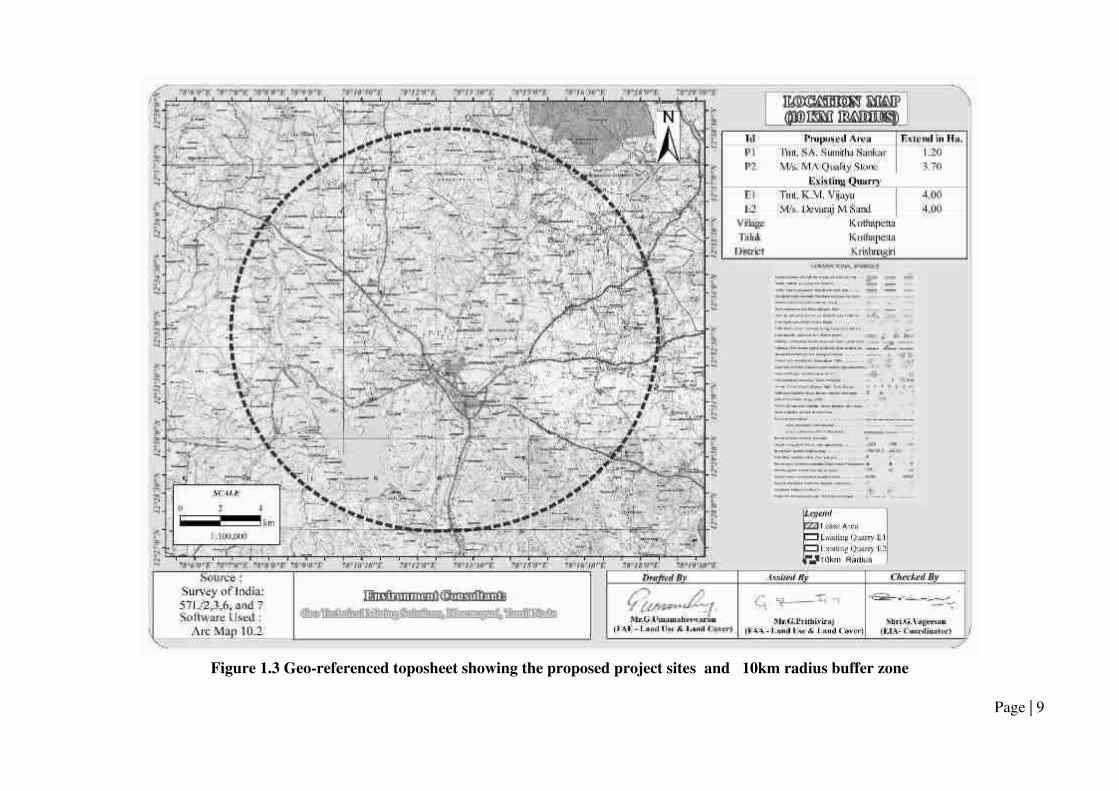
Page | 9
Figure 1.3 Geo-referenced toposheet showing the proposed project sites and 10km radius buffer zone

Page | 10
1.4 ENVIRONMENTAL CLEARANCE
The Environmental Clearance process for the projects will comprise of four stages, as
given below:
o Screening
o Scoping
o Public consultation &
o Appraisal
1.4.1 Screening
Screening is the first stage of the EIA process. During the stage of screening, the
SEAC will decide whether the project proponent should conduct the EIA or not. The project
proponents often need to follow specific procedures as described below:
PROPONENT – P1
o Precise Area Communication Letter was issued by the District Collector,
Krishnagiri Rc.No.49/2016 (Mines-2), Dated: 29.02.2016
o The mining plan was prepared in respect of rough stone quarry and the same was
approved by the Deputy Director, Department of Geology and Mining,
Krishnagiri District vide Rc.No.49/2016/Mines-1, Dated: 06.04.2016.
o The District Collector, Krishnagiri District passed Proceedings vide
Rc.No.49/2016 (Mines-2), Dated: 18.08.2016, subsequently the lease was
executed on 01.09.2016 and the lease period is valid from 01.09.2016 to
31.08.2026.
o The Scheme of Mining plan was approved by the Assistant Director
(Addl.Charge), Department of Geology and Mining, Krishnagiri vide
Rc.No.96/2021/Mines Dated: 17.02.2021.
o The proposed project falls under “B1” Category as per Order Dated: 04.09.2018
& 13.09.2018 passed by Hon'ble National Green tribunal, New Delhi in O.A. No.
173 of 2018 & O.A. No, 186 of 2016 and MoEF & CC Office Memorandum F.
No. L-11011/175/2018-IA-II (M) Dated: 12.12.2018.
o Proponent applied for ToR for Environmental Clearance vides online Proposal
No. SIA/TN/MIN/62641/2021 Dated: 12.04.2021.
PROPONENT – P2
o The proponent applied for the lease of rough stone quarry on 04.12.2020

Page | 11
o Precise area communication letter was issued by the Assistant Director
(Addl.Charge), Department of Geology and Mining, Krishnagiri Roc.No.
1179/2020-Mines, Date: 22.02.2021.
o The Mining Plan was prepared by Recognized Qualified Person and approved by
Assistant Director (Addl.Charge), Department of Geology and Mining, Krishnagiri
Roc.No. 1179/2020-Mines, Date: 27.02.2021.
o As the proposed project falls under “B1” Category as per order dated 04.09.2018 &
13.09.2018 passed by Hon'ble National Green tribunal, New Delhi in O.A. No. 173
of 2018 & O.A. No, 186 of 2016 and MoEF & CC Office Memorandum F. No. L-
11011/175/2018-IA-II (M) Dated: 12.12.2018.
o The proponent applied for ToR for Environmental Clearance online, proposal No.
SIA/TN/ MIN/ 61732 /2021, dated 11.03.2021.
o ToR proposal submitted to SEIAA-TN office, acknowledgement Lr. No. SEIAA-
TN/ F.No. 8687 /2021, dated 02.08.2021.
1.4.2 Scoping
Scoping is critical as it sets up the boundaries of the EIA, including the project area; it
establishes what the EIA will include and how to put the EIA together in accordance with the
terms of reference (TOR). It also helps to select what is needed and what is not relevant, and
thus it serves as a work plan for the entire EIA process. The information gathered during the
scoping phase is used in the next steps of the EIA. Before moving on to the phase of scoping,
the proponents need to go through the following procedures as described below:
PROPONENT – P1
o The proposal was placed in 215th SEAC meeting held on 29.06.2021 and the
committee recommended for issue of ToR.
o The proposal was considered in 448th SEIAA meeting held on 23.07.2021 and issued
ToR vide Letter No SEIAA-TN/F.No. 8519/SEAC/ToR-992/2021 Dated 28.07.2021
PROPONENT – P2
o The proposal was placed in 245th SEAC meeting held on 11.02.2022 and the
committee recommended for issue of ToR.
o The proposal was considered in 488th SEIAA meeting held on 28.02.2022 and
issued ToR vide Letter No SEIAA-TN/F.No.8687/SEAC/ToR-1067/2022
Dated:01.03.2022.
Page | 12
1.4.3 Public Consultation
Application along with this draft of EIA/ EMP report is submitted to the member
secretary of the Tamil Nadu Pollution Control Board (TNPCB) to conduct public hearing in a
systematic, time bound and transparent manner ensuring widest possible public participation
at the project site or in its close proximity in the district.
1.4.4 Appraisal
Appraisal is the detailed scrutiny by the State Expert Appraisal Committee (SEAC) of
the application and other documents like the final EIA & EMP report, outcome of the public
consultations including public hearing proceedings submitted by the proponent to the
regulatory authority concerned for grant of environmental clearance. The report has been
prepared using the following references:
o Guidance Manual of Environmental Impact Assessment for Mining of Minerals,
Ministry of Environment and Forests, 2010
o EIA Notification, 14thSeptember, 2006
o ToR Lr.No. SEIAA-TN/F.No. 8519/SEAC/ToR-992/2021 Dated 28.07.2021– P1
o ToR Lr.No. SEIAA-TN/F.No.8687/SEAC/ToR-1067/2022 Dated:01.03.2022.– P2
o Approved Mining Plan of Respective Proposed Projects
1.5 TERMS OF REFERENCE (ToR)
Compliance to ToR issued vide
o ToR Lr.No. SEIAA-TN/F.No. 8519/SEAC/ToR-992/2021 Dated 28.07.2021– P1
o ToR Lr.No. SEIAA-TN/F.No.8687/SEAC/ToR-1067/2022 Dated:01.03.2022.– P2
1.6 POST ENVIRONMENT CLEARANCE MONITORING
The respective proposed project proponents shall submit a half-yearly compliance
report in respect of stipulated environmental clearance terms and conditions to MoEF & CC
Regional Office & SEIAA after grant of EC on 1st June and 1st December of each calendar
year as per MoEF & CC Notification S.O. 5845 (E) dated: 26.11.2018.
1.7 GENERIC STRUCTURE OF EIA DOCUMENT
The overall contents of the EIA report follow the list of contents prescribed in the EIA
notification, 2006 and the “Environmental Impact Assessment Guidance Manual for Mining
of Minerals” published by MoEF & CC. The generic structure of the EIA document should
be as under:
I. Introduction
II. Project Description
III. Description of the Environment

Page | 13
IV. Anticipated Environmental Impact & Mitigation Measures
V. Analysis of Alternatives (Technology & Site)
VI. Environmental Monitoring Program
VII. Additional Studies
VIII. Project Benefits
IX. Environmental Cost Benefit Analysis
X. Environmental Management Plan (EMP)
XI. Summary & Conclusion
XII. Disclosure of Consultants.
1.8 SCOPE OF THE STUDY
The main scope of the EIA study is to quantify the cumulative impact in the study area
due to cluster quarries and formulate the effective mitigation measures for each individual
leases. A detailed account of the emission sources, emissions control equipment, background
air quality levels, meteorological measurements, dispersion model and all other aspects of
pollution like effluent discharge, dust generation etc., have been discussed in this report. The
baseline monitoring study has been carried out during the post monsoon season (October
2021 to December 2021) for various environmental components so as to assess the
anticipated impacts of the cluster quarry projects on the environment and suggest suitable
mitigation measures for likely adverse impacts due to the proposed project.
Table 1.4 Environment Attributes
S. No. Attributes Parameters Source and Frequency
1 Ambient Air
Quality PM10, PM 2.5, SO2, NO2
Continuous 24-hourly
samples twice a week for
three months at 8 locations
(2 core & 7 buffer)
2 Meteorology
Wind speed and direction,
temperature, relative
humidity and rainfall
Near project site continuous
for three months with hourly
recording and from secondary
sources of IMD station
3 Water quality Physical, Chemical and
Bacteriological parameters
Grab samples were collected
at 6 locations – 4 ground
water and 2 surface water
samples; once during study
period
4 Ecology
Existing terrestrial and
aquatic flora and fauna
within 10 km radius circle.
Limited primary survey and
secondary data collected from
the forest department

Page | 14
5 Noise levels Noise levels in dB(A)
8 locations – data monitored
once for 24 hours during EIA
study
6 Soil
Characteristics
Physical and Chemical
Parameters
Once at 6 locations during
study period
7 Land use Existing land use for
different categories
Based on Survey of India
topographical sheet and
satellite imagery and primary
survey
8 Socio-Economic
Aspects
Socio-economic and
demographic
characteristics, worker
characteristics
Based on primary survey and
secondary sources data like
census of India 2011
9 Hydrology
Drainage pattern of the
area, nature of streams,
aquifer characteristics,
recharge and discharge
areas
Based on data collected from
secondary sources as well as
hydro-geology study report
prepared
10
Risk assessment
and Disaster
Management
Plan
Identify areas where
disaster can occur by fires
and explosions and release
of toxic substances
Based on the findings of risk
analysis done for the risk
associated with mining
Source: Field Monitoring Data
The data has been collected as per the requirements of the ToR issued by SEIAA – TN.
1.8.1 Regulatory Compliance & Applicable Laws/Regulations for the proposed projects
Application was made for obtaining quarry lease as per Tamil Nadu Minor Mineral
Concession Rules, 1959.
Precise area communication letter was obtained from the respective authority as per
Tamil Nadu Minor Mineral Concession Rules, 1959 for preparation of mining plan
and obtaining Environmental Clearance.
The mining plan was approved under Rules, 41 & 42 amended in Tamil Nadu Minor
Mineral Concession Rules, 1959.
ToR Lr.No. SEIAA-TN/F.No. 8519/SEAC/ToR-992/2021 Dated 28.07.2021– P1
ToR Lr.No. SEIAA-TN/F.No.8687/SEAC/ToR-1067/2022 Dated:01.03.2022.– P2
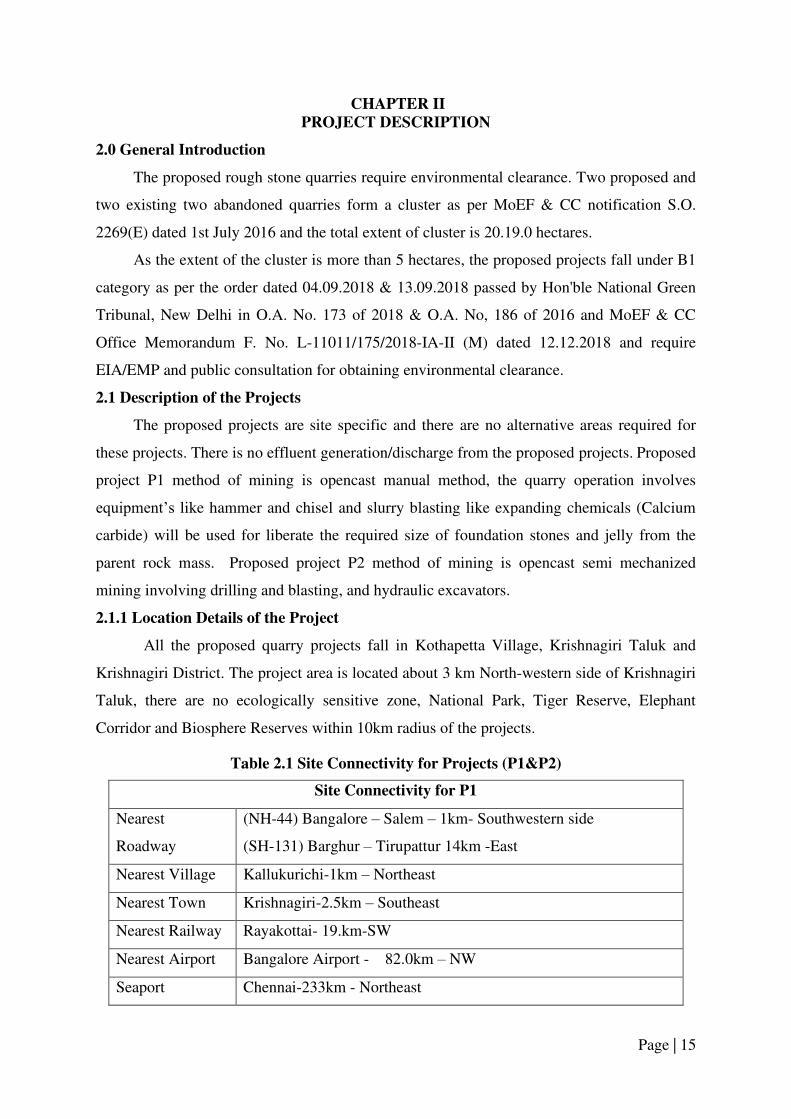
Page | 15
CHAPTER II
PROJECT DESCRIPTION
2.0 General Introduction
The proposed rough stone quarries require environmental clearance. Two proposed and
two existing two abandoned quarries form a cluster as per MoEF & CC notification S.O.
2269(E) dated 1st July 2016 and the total extent of cluster is 20.19.0 hectares.
As the extent of the cluster is more than 5 hectares, the proposed projects fall under B1
category as per the order dated 04.09.2018 & 13.09.2018 passed by Hon'ble National Green
Tribunal, New Delhi in O.A. No. 173 of 2018 & O.A. No, 186 of 2016 and MoEF & CC
Office Memorandum F. No. L-11011/175/2018-IA-II (M) dated 12.12.2018 and require
EIA/EMP and public consultation for obtaining environmental clearance.
2.1 Description of the Projects
The proposed projects are site specific and there are no alternative areas required for
these projects. There is no effluent generation/discharge from the proposed projects. Proposed
project P1 method of mining is opencast manual method, the quarry operation involves
equipment’s like hammer and chisel and slurry blasting like expanding chemicals (Calcium
carbide) will be used for liberate the required size of foundation stones and jelly from the
parent rock mass. Proposed project P2 method of mining is opencast semi mechanized
mining involving drilling and blasting, and hydraulic excavators.
2.1.1 Location Details of the Project
All the proposed quarry projects fall in Kothapetta Village, Krishnagiri Taluk and
Krishnagiri District. The project area is located about 3 km North-western side of Krishnagiri
Taluk, there are no ecologically sensitive zone, National Park, Tiger Reserve, Elephant
Corridor and Biosphere Reserves within 10km radius of the projects.
Table 2.1 Site Connectivity for Projects (P1&P2)
Site Connectivity for P1
Nearest
Roadway
(NH-44) Bangalore – Salem – 1km- Southwestern side
(SH-131) Barghur – Tirupattur 14km -East
Nearest Village Kallukurichi-1km – Northeast
Nearest Town Krishnagiri-2.5km – Southeast
Nearest Railway Rayakottai- 19.km-SW
Nearest Airport Bangalore Airport - 82.0km – NW
Seaport Chennai-233km - Northeast

Page | 16
Site Connectivity for P2
Nearest
Roadway
(NH-44) Bangalore – Salem – 1.5km- Southwestern side
(SH-131) Barghur – Tirupattur 13km -East
Nearest Village Kallukurichi-0.6km – Northeast
Nearest Town Krishnagiri-2.4km – South
Nearest Railway Rayakottai- 20.km-SW
Nearest Airport Bangalore Airport - 82.0km – NW
Seaport Chennai-232km - Northeast
Source: Survey of India Toposheet & Google Earth image
Table 2.2 Boundary Co-Ordinates of Proposed Projects (P1&P2)
Boundary Co-Ordinates of Project Site – P1
Corner Pillar
Nos. Latitude Longitude
1 12°32’53.25” N 78°12’29.71” E
2 12°32’55.26” N 78°12’29.89” E
3 12°32’55.87” N 78°12’31.65” E
4 12°32’55.24” N 78°12’32.25” E
5 12°32’57.45” N 78°12’33.10” E
6 12°32’57.37” N 78°12’34.13” E
7 12°32’56.16” N 78°12’35.28” E
8 12°32’55.08” N 78°12’34.78” E
9 12°32’54.01” N 78°12’34.28” E
Boundary Co-Ordinates of Project Site – P2
Corner Pillar
Nos. Latitude Longitude
1 12°33’3.6761” N 78°12’46.0552” E
2 12°33’4.6251” N 78°12’47.7907” E
3 12°32’58.9647” N 78°12’53.1805” E
4 12°32’59.4118” N 78°12’56.4576” E
5 12°32’57.9026” N 78°12’56.7320” E
6 12°32’57.0662” N 78°12’57.5020” E
7 12°32’56.7570” N 78°12’56.5139” E
Source: Approved Mining Plan
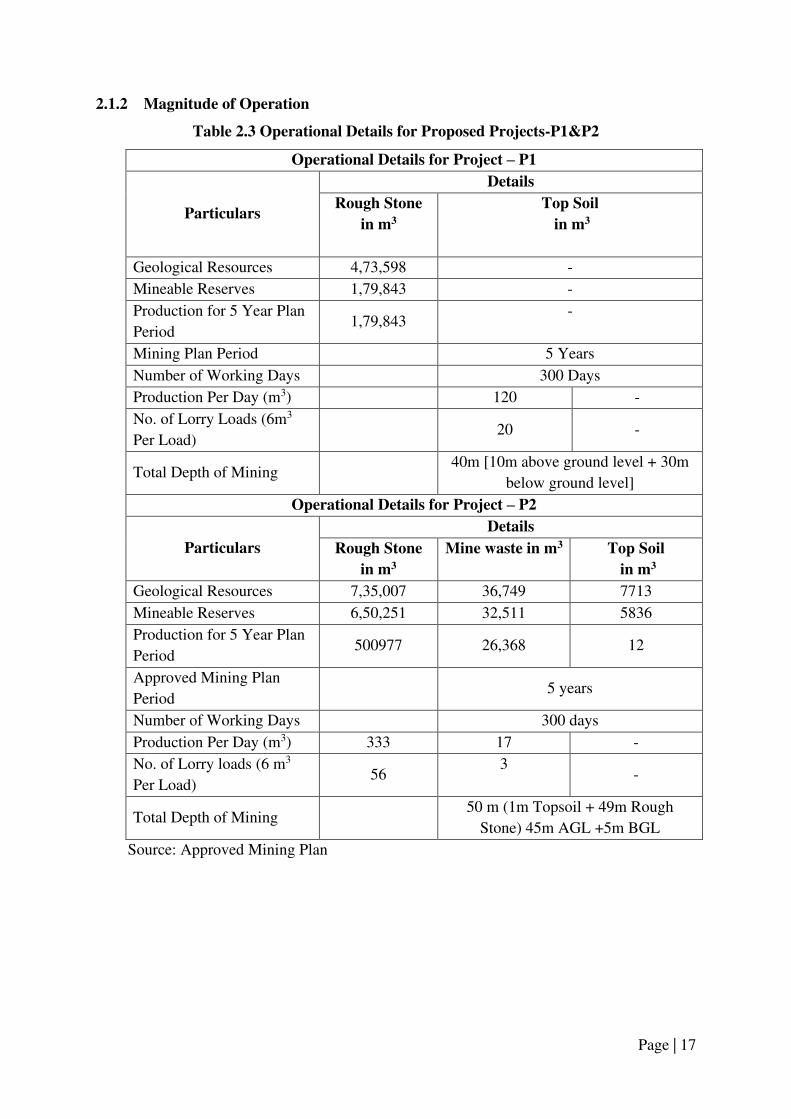
Page | 17
2.1.2 Magnitude of Operation
Table 2.3 Operational Details for Proposed Projects-P1&P2
Operational Details for Project – P1
Particulars
Details
Rough Stone
in m3
Top Soil
in m3
Geological Resources 4,73,598 -
Mineable Reserves 1,79,843 -
Production for 5 Year Plan
Period 1,79,843
-
Mining Plan Period 5 Years
Number of Working Days 300 Days
Production Per Day (m3) 120 -
No. of Lorry Loads (6m3
Per Load)
20 -
Total Depth of Mining 40m [10m above ground level + 30m
below ground level]
Operational Details for Project – P2
Particulars
Details
Rough Stone
in m3
Mine waste in m3 Top Soil
in m3 Geological Resources 7,35,007 36,749 7713
Mineable Reserves 6,50,251 32,511 5836
Production for 5 Year Plan
Period 500977 26,368 12
Approved Mining Plan
Period
5 years
Number of Working Days 300 days
Production Per Day (m3) 333 17 -
No. of Lorry loads (6 m3
Per Load) 56
3 -
Total Depth of Mining 50 m (1m Topsoil + 49m Rough
Stone) 45m AGL +5m BGL
Source: Approved Mining Plan

Page | 18
Figure 2.1 Topographical view of the proposed project area-P1
Figure 2.2 Field Photograph proposed project area-P2

Page | 19
Figure 2.3 Google image showing the proposed project site-P1

Page | 20
Figure 2.4 Google image showing the proposed project site-P2

Page | 21
Figure 2.5 Google earth image showing 500m radius limits drawn from the proposed projects-p1&p2

Page | 22
Figure 2.6 Location map showing surface features around 1km radius from the proposed project sites- P1&P2

Page | 23
2.2 PROJECT AREA
o The proposed project is site specific
o There are no mineral beneficiation or processing plants proposed inside the project
area
o There is no forest land in the proposed project area and is devoid of major vegetation
and trees
Table 2.4 Land Use Pattern of the Proposed Projects- P1 & P2
LAND USE PATTERN OF PROPOSED PROJECT – P1
Description Present area in
(hectares)
Area at the end of life of
quarry (hectares)
Area under quarry 0.29.00 0.81.60
Infrastructure Nil 0.01.00
Roads 0.01.00 0.01.00
Green Belt Nil 0.14.06
Un – utilized area 0.90.00 0.22.34
Grand Total 1.20.00 1.20.00
LAND USE PATTERN OF PROPOSED PROJECT – P2
Description Present area in
(hectares)
Area at the end of life of
quarry (hectares)
Area under quarry Nil 3.18.0
Infrastructure Nil 0.01.0
Roads Nil 0.01.0
Green Belt Nil 0.50.0
Un – utilized area 3.70.0 Nil
Grand Total 3.70.0 3.70.0
Source: Approved mining plan
2.3 GEOLOGY AND GEOMORPHOLOGY
2.3.1 Regional Geology & Geomorphology
The geological formations of the district belong mainly to Archaean age along with
rock of Proterozoic age. The former is represented by Khondalite Group of rocks,
Charnockite Group of rocks, Migmatites Complex, Sathya mangalam Group of rocks, while
the latter is represented by Alkaline rocks. The Khondalite Group includes garnet sillimanite
gneiss and quartzite which occur as small patches. The migmatite complex includes
garnetiferous quartzo feldspathic gneiss and hornblends biotite gneiss, the former exposed on
the western part of the district. The Sathya mangalam Group includes fuchsite quartzite,
sillimanite mica schist and amphibolites. The Bhavani Group in this area includes
fissilehornblende-biotite gneiss, granitoid gneiss and pink migmatite. Amphibolites with

Page | 24
barbed ferruginous quartzite and associated quartzo feldspathic rocks (Champion Gneiss)
represent the Kolar group and are found west and southwest of Veppanapalli. Following this
there are basic intrusions occurring as dykes. The Charnockite Group occupies a major part
of the south-west portion of this district with small bands of Garnetiferous quartzo feldspathic
gneiss, Granite gneiss and dolerite dykes. The North-East and Northern part of the district
mainly consist of granite gneiss with small patches of Pink Migmatite, hornblende-biotite
gneiss and dolerite dykes. The Eastern part of the district consists of Epidote-Hornblende
Gneiss, Ultra Mafics, Syenite and Carbonatite. The Alkaline Complex is represented by
epidote-hornblende gneiss, ultramafics, syenite and carbonatite and these are distributed in
the eastern part of the district. Innumerable basic dykes and felsites, quartz, barites and
pegmatite veins form part of the Alkali Complex. The crystalline lime stone deposits in the
areas of the villages of samalpatti / Padavanur, Uthangarai Taluk of Krishnagiri District is
fine grained and are mainly made up of aggregate of calcite with subordinate amount of
quartz and silicate minerals. They occur as long, narrow band sand as veins within the
gneissic country rocks. The lime stone are generally white, pink and grey in colour. The main
impurity in the lime stone is silica. As for as the grade of the lime stone is concerned it is of
‘Cement and Refractory Grade’. The calcium carbonate is about 85%andthe rest is mainly
made up of silica in the form of free silica or as silicate minerals such as wollastonite,
feldspar
Era Group Formation
Recent age ------------------ Topsoil-Red soil (1-2 thick)
Proterozoic age Sathyamangalam - Charnockite and Khondalite
Archaean age Kolar group - Quartzo Feldspathic rock, Granites,
Pre-Archaean Dharwar group - Peninsular gneisses complex
2.3.2 Local Geology & Geomorphology
The Peninsular gneiss forms the oldest rock formations, in which the massive
formation of Charnockite lies over with rich accumulation of recent quaternary formation. On
regional scale of the Charnockite is body N10°E – S10°W with dipping towards SE40º.
Regional stratigraphic sequence:
AGE FORMATION
Recent – Quaternary formation
------------Unconformity------------
Archaean– Charnockite

Page | 25
Geomorphologically, the proposed project area consists of undulating and plain
landforms. In plain landforms, weathered moderate and shallow Weathered & shallow buried
Pediplain have occupied major part of the study area and followed by Dome type
denudational hills as shown in Figure 2.8
2.4 RESOURCES AND RESERVES (P1&P2)
The resources and reserves of rough stone (Table 2.6) were calculated based on cross-
section method by plotting sections to cover the maximum lease area for the proposed project
(P1). based on the availability of geological resources the mineable reserves for the proponent,
P1 are calculated by considering excavation of bench formation and leaving essential safety
distance of 7.5 m and 10m (P1), as per the precise area communication letter deducting the
locked-up reserves during bench formation (also called as bench loss) and the mineable reserves
is calculated considering there is no waste / overburden / side burden for the proposed project
P1.
Based on the availability of geological resources the mineable reserves for the
proponent, P2 are calculated by considering excavation of bench formation and leaving essential
safety distance of 7.5 m (P2), as per the precise area communication letter. The geological and
mineable reserves are estimated by cross-sectional methods up to a depth of 50m (1m top soil +
49m Rough Stone) from 45m above ground level, 5m below ground level. Recovery of rough
stone (Charnockite) is taken as 95% and 5% shall be fines, mining losses and locked undermine
benches.
Table 2.5 Geological Resources and Mineable Reserves of Proposed Projects- P1&P2
PROPOSED PROJECT – P1
Rough Stone in m3 Top Soil in m3
Geological Resource 4,73,598 -
Mineable Reserves 1,79,843 -
PROPOSED PROJECT – P2
Volume Recoverable
Reserves in m3 @
95%
Mine waste m3
@ 5% Top Soil in m3
Geological Resource 755007 698258 36749 7713
Mineable Reserves 650251 617740 32511 5836
Table 2.6 Year-wise production plan-P1&P2
PROPOSED PROJECT – P1
Year Rough Stone (m3) Top soil (m3)
I 36,013 - II 38,735 - III 40,905 -

Page | 26
IV 41,690 - V 22,500 -
Total 1,79,843 -
PROPOSED PROJECT – P2
Year Recoverable
Reserves in m3 @ 95% Mine waste in m3 @ 5% Top soil (m3)
I 137449 7234 12 II 87620 4612 - III 87620 4612 - IV 98167 5167 - V 90121 4743 -
Total 500977 26368 12
2.4.1 Disposal of Waste (P1)
There is no overburden/Waste generated during the scheme period. Hence, there is no
disposal of Topsoil or Waste. The excavated rough stone will be directly loaded into Tippers to
the needy customers.
2.4.1.1 Disposal of Waste (P2)
The waste is generated during the mining period is 26368m3 will be proposed dump into the all
side of the mined-out pits of the lease area. The top soil of the lease area 12m3 top soil will be
utilized for the formation of mine roads, Construction of bund and afforestation purposes.
Top soil removed area-1. 1570 Sq.mt×1.0 (D)=15700m3
Top soil removed area-2 3005 Sq.mt×1.0 (D)=3005m3
2.4.2 Conceptual Mining Plan and Sections
Conceptual scheme of mining is prepared with an object of long-term systematic
development of benches, layouts, selection of permanent structures, depth of quarrying and
ultimate pit dimensions, selection of sites for construction of infrastructure, etc.,
The ultimate pit size is designed based on certain practical parameters such as economical depth
of mining, safety zones, permissible area, etc., The conceptual mining plan (Figures 2.13&2.16)
and the corresponding cross sections are used to calculate yearly rough stone production from
the proponents P1 and P2.
Table 2.7 Ultimate Pit Dimension proposed project-P1
Sections Length in m
(Max) Width in m
(Max) Depth in m (Max)
P1
63 46 40m [10m above ground level + 30m below
ground level]
90 58 35m [10m above ground level + 25m below
ground level]

Page | 27
2.8 Ultimate Pit Dimension proposed project-P2
Ultimate Pit Dimension
402m (L)8×101m(W)(Avg)×50(D)
Source: Approved Mining Plan
2.4.3 Mine closure
o At the end of life of mine, the excavated mine pit / void will act as artificial reservoir for
collecting rain water and helps to meet out the demand or crises during drought season.
o After mine closure the greenbelt developed along the safety barrier and top benches and
temporary water reservoir will enhance the ecosystem
o Mine Closure is a process of returning a disturbed site to its natural state or which
prepares it for other productive uses that prevents or minimizes any adverse effects on
the environment or threats to human health and safety.
o The principal closure objectives are for rehabilitated mines to be physically safe to
humans and animals, geo-technically stable, geo-chemically non-polluting/ non-
contaminating, and capable of sustaining an agreed post-mining land use.

Page | 28
2.4.4 Closure Planning & Options Considerations in Mine Design
o The closure of mine is well planned at the initial stage of planning & design
consideration by the internal and external stake holders.
o Construction of 2m height bund all along the mine pit boundary and ensure its stability
all time & construction of garland drain along the natural slope to avoid sliding and
collection of soil to the pit & surface runoff during rainfall.
o After complete exploitation of mineral, the lowest bench foot wall side will be
maintained as plain surface without any sump pits to avoid any accidents.
o All the sharp edges will be dressed to smoother face before the closure of mine and
ensure no loose debris on hanging wall side.
o The project proponent as a part of social responsibilities assures to supply the stored
mine pit water to the nearby villages after effective treatment process as per the
standards of TNPCB & TWAD.
o Native species will be planted in 3 row patterns on the boundary barriers and 1st bench, a
full-time sentry will be appointed at the gate to prevent inherent entry of public & cattle.
o The access road to the quarry will be cut-off immediately after the closure.
o The layout design shall be prepared and get approved from Department of Geology and
Mining.
o The proponent is instructed to construct as per the layout approved.
o Physical and chemical stability of structures left in place at the site, the natural
rehabilitation of a biologically diverse, stable environment, the ultimate land use is
optimized and is compatible with the surrounding area and the requirements of the local
community, and taking the needs of the local community into account and minimizing
the socio-economic impact of closure.
There will be a positive change in the environmental and ecology due to the mine closure.
2.4.5 Post-Closure Monitoring
The purpose of post-closure monitoring with respect to open pit mine workings is to
ensure the attainment of closure objectives
o Monitor physical and geotechnical stability of remnant pit walls
o Monitor the ground regime in pit walls to confirm achievement of design objectives
o Monitor water level in pit to confirm closure objectives regarding fish, fish habitat, and
wildlife safety are being achieved
o Sample water quality and quantity at controlled pit discharge points
o Identify and test unanticipated areas where water management is an issue
o Inspect integrity of barriers such as berms & fences.
o Monitor wildlife interactions with barriers to determine effectiveness
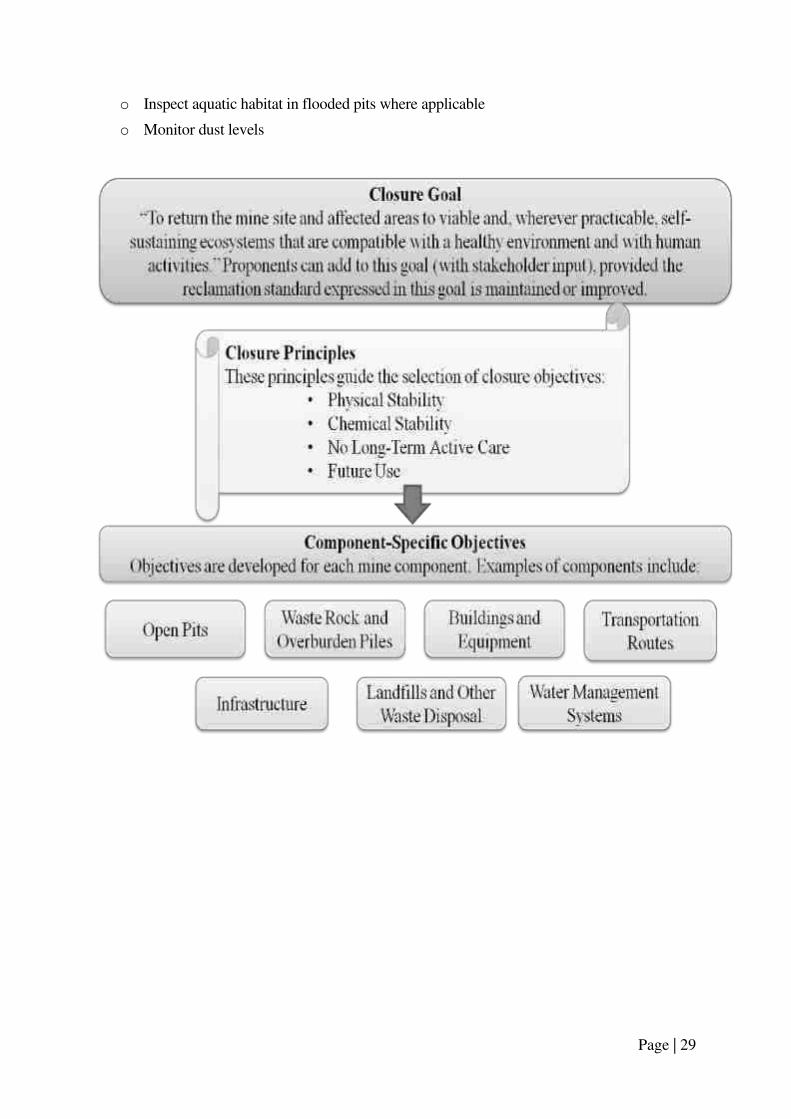
Page | 29
o Inspect aquatic habitat in flooded pits where applicable
o Monitor dust levels

Page | 30
Figure 2.7 Geology map of Krishnagiri District

Page | 31
Figure 2.8 Geology map of 10km radius from the proposed project site

Page | 32
Figure. 2.9 Geomorphology map of 10km radius from the proposed project site

Page | 33
Figure. 2.10 Surface Plan for the project-P1
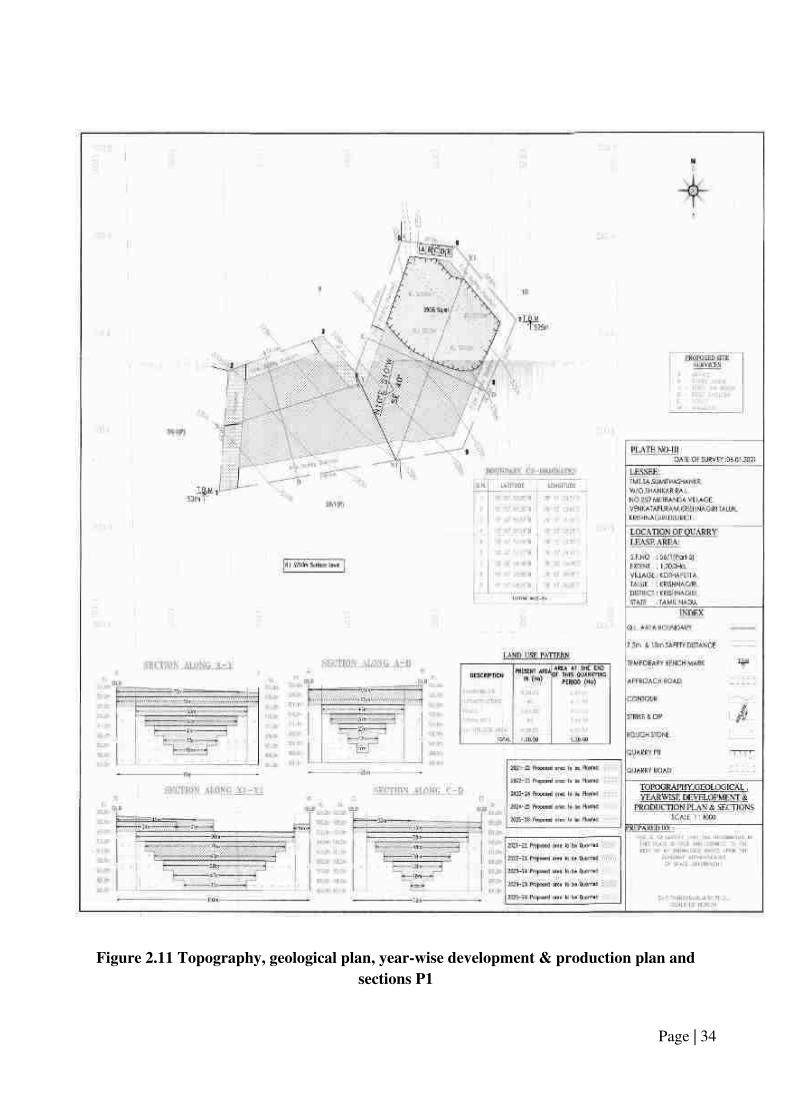
Page | 34
Figure 2.11 Topography, geological plan, year-wise development & production plan and
sections P1

Page | 35
Figure 2.12 Progressive mine closure plan and sections P1

Page | 36
Figure 2.13 Conceptual plan and sections P1

Page | 37
Figure. 2.14 Surface Plan for the project-P2

Page | 38
Figure 2.15 Year-wise development production plan & section -P2

Page | 39
Figure 2.16 Conceptual and final mine closure plan & sections-P2

Page | 40
Figure 2.17 Progressive mine closure plan-P2
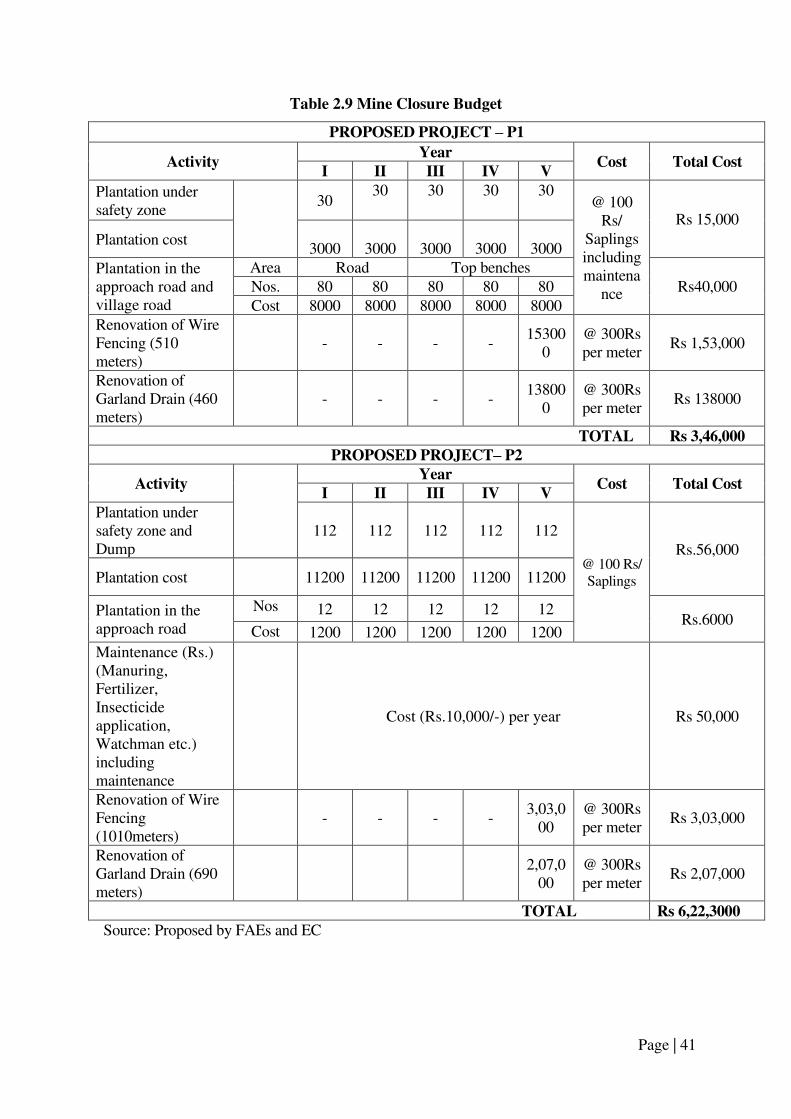
Page | 41
Table 2.9 Mine Closure Budget
PROPOSED PROJECT – P1
Activity Year
Cost Total Cost I II III IV V
Plantation under safety zone
30
30 30 30 30 @ 100
Rs/ Saplings including maintena
nce
Rs 15,000
Plantation cost
3000
3000
3000
3000
3000 Plantation in the approach road and village road
Area Road Top benches Rs40,000 Nos. 80 80 80 80 80
Cost 8000 8000 8000 8000 8000 Renovation of Wire Fencing (510 meters)
- - - - 15300
0 @ 300Rs per meter
Rs 1,53,000
Renovation of Garland Drain (460 meters)
- - - - 13800
0 @ 300Rs per meter
Rs 138000
TOTAL Rs 3,46,000 PROPOSED PROJECT– P2
Activity Year
Cost Total Cost I II III IV V
Plantation under safety zone and Dump
112 112 112 112 112
@ 100 Rs/ Saplings
Rs.56,000
Plantation cost
11200 11200 11200 11200 11200
Plantation in the approach road
Nos 12 12 12 12 12 Rs.6000
Cost 1200 1200 1200 1200 1200 Maintenance (Rs.) (Manuring, Fertilizer, Insecticide application, Watchman etc.) including maintenance
Cost (Rs.10,000/-) per year Rs 50,000
Renovation of Wire Fencing (1010meters)
- - - -
3,03,000
@ 300Rs per meter
Rs 3,03,000
Renovation of Garland Drain (690 meters)
2,07,000
@ 300Rs per meter
Rs 2,07,000
TOTAL Rs 6,22,3000 Source: Proposed by FAEs and EC

Page | 42
2.5 METHOD OF MINING
The Rough Stone is proposed to quarry at 5m bench height & width with conventional
opencast manual method of quarrying. The quarry operation involves equipment’s like
hammer and chisel and slurry blasting like expanding chemicals will be used for liberates the
required size of foundation stones and jelly from the parent rock mass and Manual Loading
and transportation of rough stone to the needy customer.
The production of rough stone in this quarry involves the following method which is
typical for Rough Stone quarrying in contrast to other major mineral mining.
Splitting of rock mass of considerable volume from the parent rock mass by Handy
hammer, chisel and slurry explosives like expanding chemical and further made to smaller
sizes by manually with Handy hammer and chisel and loading the Rough Stone by manually
from pithead to the needy customer.
Opencast method of semi mechanized mining is being adopted to the proposed (Project
P2) extract Rough Stone of required size, proposed bench height 7meter and bench Width
5meter Machineries like Tractor mounted compressor attached with Jack hammer is used for
drilling and blasting. Excavators are used for quarrying of Rough Stone and Tippers / Lorries
are used for the transportation of Rough Stone to the destination. It is a semi mechanized
quarrying operation using hole drilling with the help of compressor and jack hammers and
smooth blasting. Rough stone are removed using hydraulic excavator and loaded directly to
the tippers and transported to the needy buyers. However, as far as the quarrying of rough
stone is concerned, observance of the provisions of Regulation 106 (2) (b) as above is seldom
possible due to various inherent petrogenetic factors coupled with mining difficulties. Hence,
it is proposed to obtain relaxation to the provisions of the above regulation from the Director
of Mines Safety for which necessary provision is available with the Regulation 106 (2) (b) of
MMR-1961, under Mine Act – 1952.
2.5.1 Drilling & Blasting
Drilling & Blasting will be carried out as per parameters given below:
Spacing – 1.2m
Burden – 1.0 m
Depth of hole – 1.5 m
Charge per hole – 0.50 – 0.75kg
Powder factor – 6 tonnes/kg
Diameter of hole – 32 mm
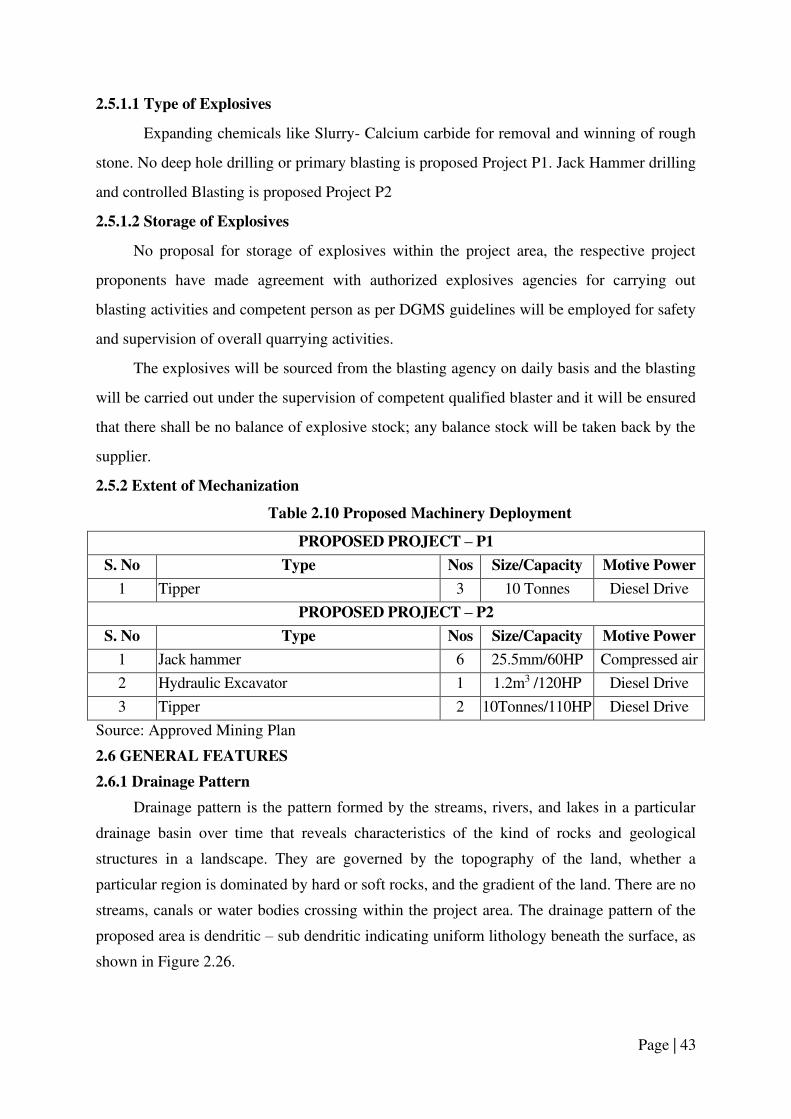
Page | 43
2.5.1.1 Type of Explosives
Expanding chemicals like Slurry- Calcium carbide for removal and winning of rough
stone. No deep hole drilling or primary blasting is proposed Project P1. Jack Hammer drilling
and controlled Blasting is proposed Project P2
2.5.1.2 Storage of Explosives
No proposal for storage of explosives within the project area, the respective project
proponents have made agreement with authorized explosives agencies for carrying out
blasting activities and competent person as per DGMS guidelines will be employed for safety
and supervision of overall quarrying activities.
The explosives will be sourced from the blasting agency on daily basis and the blasting
will be carried out under the supervision of competent qualified blaster and it will be ensured
that there shall be no balance of explosive stock; any balance stock will be taken back by the
supplier.
2.5.2 Extent of Mechanization
Table 2.10 Proposed Machinery Deployment
PROPOSED PROJECT – P1
S. No Type Nos Size/Capacity Motive Power
1 Tipper 3 10 Tonnes Diesel Drive
PROPOSED PROJECT – P2
S. No Type Nos Size/Capacity Motive Power
1 Jack hammer 6 25.5mm/60HP Compressed air
2 Hydraulic Excavator 1 1.2m3 /120HP Diesel Drive
3 Tipper 2 10Tonnes/110HP Diesel Drive
Source: Approved Mining Plan
2.6 GENERAL FEATURES
2.6.1 Drainage Pattern
Drainage pattern is the pattern formed by the streams, rivers, and lakes in a particular
drainage basin over time that reveals characteristics of the kind of rocks and geological
structures in a landscape. They are governed by the topography of the land, whether a
particular region is dominated by hard or soft rocks, and the gradient of the land. There are no
streams, canals or water bodies crossing within the project area. The drainage pattern of the
proposed area is dendritic – sub dendritic indicating uniform lithology beneath the surface, as
shown in Figure 2.26.

Page | 44
2.6.2 Traffic Density
The traffic survey conducted based on the transportation route of material, the rough
stone is proposed to be transported mainly through Kallukurikki -Chinnamelupalli Village
Road that connects to Krishnagiri – Rayakkottai state highway through Maharajakadai road
on South eastern Side.
Traffic density measurements were performed at two locations:
1.Kallukurikki – Chinnamelupalli Village Road
2.Hosur-Krishnagiri NH-44 Road.
Traffic density measurement were made continuously for 24 hours by visual
observation and counting of vehicles under three categories, viz., heavy motor vehicles, light
motor vehicles and two/three wheelers. As traffic densities on the roads are high, two skilled
persons were deployed simultaneously at each station during each shift- one person on either
direction for counting the traffic. At the end of each hour, fresh counting and recording was
undertaken.
Table.2.11 Traffic Survey Locations
Station Code Road Name Distance and
Direction Type of Road
TS1
Kallukurikki- Chinnamelupalli Village Road (Connecting Krishnagiri -Rayakkottai State Highway through Maharajakadi Road)
North East 1.2Km
Village Road (Single Lane)
TS2 NH-44-Hosur – Krishnagiri
Road South West 2Km
NH-44 road (State Highway)
Source: On-site monitoring by GTMS FAE & TM
Table 2.12 Existing Traffic Volume
Station code HMV LMV 2/3 Wheelers
Total PCU No PCU No PCU No PCU
TS1 60 180 20 20 60 30 230 TS2 130 390 50 50 120 60 500
Source: On-site monitoring by GTMS FAE & TM * PCU conversion factor: HMV (Trucks and Bus) = 3, LMV (Car, Jeep and Auto) = 1 and 2/3 Wheelers = 0.5
Table 2.13 Rough Stone Hourly Transportation Requirement
Transportation of Rough Stone & Topsoil per day Capacity of
trucks No. of Trips per day Volume in PCU
15 tonnes 76 228 Source: Approved Mining Plan

Page | 45
Figure 2.18 Drainage map of 10km radius from the proposed project site-P1&P2

Page | 46
Due to this project the existing traffic volume will not exceed
As per the IRC 1960 this existing village road can handle 1,200 PCU in hour and
Major district road can handle 1500 PCU in hour. Hence there will not be any
conjunction due to this proposed transportation.
2.6.3 Mineral Beneficiation and Processing
THERE is no proposal for the mineral processing or ore beneficiation in any of the
proposed project.
2.6.4 Existing Infrastructures
Infrastructures like mine office, temporary rest shelters for workers, latrine and urinal
facilities will be constructed as per the mine rule after the grant of quarry lease.
2.7 PROJECT REQUIREMENT
2.7.1 Water Requirement
Details of water requirements in KLD as given below:
Table 2.14 Water Requirement for the Project
PROPOSED PROJECT – P1
*Purpose Quantity Source
Dust Suppression 1.5 KLD From Existing bore wells from nearby area
Green Belt development 1.0 KLD From Existing bore wells from nearby area
Domestic purpose 1.0 KLD From Existing, bore wells and drinking water
will be sourced from Approved Water vendors.
Total 3.5 KLD
PROPOSED PROJECT – P2
*Purpose Quantity Source
Dust Suppression 1.5 KLD From existing bore wells from nearby area/
rainwater harvesting pits
Green Belt development 1.0 KLD From existing bore wells from nearby area/rain
water harvesting pits
Domestic purpose 0.7 KLD From existing, bore wells and drinking water
will be sourced from approved water vendors.
Total 3.2 KLD
Source: Prefeasibility report
2.7.2 Power and Other Infrastructure Requirement
No proposed project requires power supply for the mining operations. The quarrying
activity is proposed during day time only (General shift 8 AM – 5 PM, Lunch break 1 PM – 2
PM). Electricity for use in office and other internal infrastructure will be obtained from SEB
by respective project proponent.

Page | 47
No workshops are proposed inside the project area. Hence there will not be any effluent
generation from the project area. Domestic effluents from the mine office will be discharged
to septic tank and soak pit. There are no toxic effluents expected to generate in the form of
solid, liquid or gaseous form. Hence there is no requirement of waste treatment plant.
2.7.3 Fuel Requirement
High Speed Diesel (HSD) will be used for mining machineries. Diesel will be brought
from nearby Fuel Stations. Diesel required for this proposed project (P1) is very minimal.
Average diesel consumption of proposed project (P2) is around 250 litres of HSD / day.
2.7.4 Project Cost
Table 2.15 Project Cost of Proposed Projects
PROPOSED PROJECT – P1
Project Cost Rs. 92,31,000/- PROPOSED PROJECT – P2
Project Cost Rs. 66,40,000/- Source: Approved Mining Plan & Prefeasibility Report
2.7.5 Employment Requirement
The following manpower has been proposed in the mining plan to carry out the day-
to-day quarrying activities. The employment is aimed at the proposed production target and
also to comply with the statutory provisions of the metalliferous mine’s regulations, 1961 for
the proposed projects.
Table 2.16 Proposed Manpower Deployment
PROPOSED PROJECT – P1
Blaster/mate 1 Quarry operation and Loading 16 Chisel man 3 Tipper driver 3 Helper 3 Cleaner 3 Security 1 Total 30
PROPOSED PROJECT – P2
Operator 2 Mechanic 1 Blaster/ Mate 1 Driver 2 Musdoor & Labors 4 Cleaner 2 Office boy 1 Management & Supervisory Staff 2 Total 15
Source: Approved Mining Plans

Page | 48
2.8 PROJECT IMPLEMENTATION SCHEDULE
The commercial operation will commence after the grant of Environmental Clearance.
CTO and CTE will be obtained from the Tamil Nadu State Pollution Control Board. The
conditions imposed during the Environmental Clearance will be compiled before the start of
mining operation.
Table 2.17 Expected Time Schedule
S.
No. Particulars
Time Schedule (In Month) Remarks if any
1st 2nd 3rd 4th 5th
1 Environmental
Clearance
2 Consent to Establish Project Establishment
Period
3 Consent to Operate Production Starting
Period
Time line may vary; subjected to rules and regulations /& other unforeseen
circumstances
Source: EIA Notification & CPCB Guidelines
Page | 49
CHAPTER III
DESCRIPTION OF THE ENVIRONMENT
3.0 GENERAL
This chapter presents a regional background to the baseline data at the very onset, which
will help in better appreciation of micro-level field data, generated on several environmental
and ecological attributes of the study area. The baseline status of the project environment is
described section wise for better understanding of the broad-spectrum conditions. The baseline
environment quality represents the background environmental scenario of various
environmental components such as land, water, air, noise, biological and socio-economic status
of the study area. Field monitoring studies to evaluate the base line status of the project sites
were carried out covering October, November, and December 2021 with CPCB guidelines.
Environmental data have been collected by NOIDA TESTING LABORATORIES (An ISO:
9001: 2015 & ISO 45001: 2018 Certified Laboratory), MoEF & CC (Ministry of Environment,
Forest & Climate Change), UPPCB & HSPCB Recognized Laboratory, Uttarkhand for the
following attributes:
o Land
o Water
o Air
o Noise
o Biological
o Socio-economic status
Study Area
An area of 10 km radius (aerial distance) around the periphery of the cluster is considered
for EIA study. The data collection has been used to understand the existing environment
scenario around the cluster against which the potential impacts of the project can be assessed.
The study area has been divided into two zones: core zone and buffer zone. Core zone is
considered as cluster and buffer zone as 10km radius from the periphery of the cluster. Both
core and buffer zones are taken as the study area.
Study Period
The baseline study was conducted during the study period of October 2021– December
2021.
Study Methodology
o The project area was surveyed in detail with the help of total station and the boundary
pillars were picked up with the help of GPS. The boundary coordinates were

Page | 50
superimposed on the satellite imagery to understand the relief of the area, besides
Land use pattern of the area was studied through the Bhuvan (ISRO).
o Soil samples were collected and analysed for relevant physio-chemical characteristics,
exchangeable cations, nutrients & micro nutrients etc., in order to assess the impact
due to mining activities and to recommend saplings for Greenbelt development.
o Ground water samples were collected during the study period from the existing bore
wells, while surface water was collected from ponds in the buffer zone. The samples
were analysed for parameters necessary to determine water quality (based on IS:
10500:2012 criteria) and those which are relevant from the point of view of
environmental impact of the proposed mines.
o An onsite meteorological station was setup in cluster area to collect data about wind
speed, wind direction, temperature, relative humidity, rainfall and general weather
conditions were recorded throughout the study period.
o In order to assess the Ambient Air Quality (AAQ), samples of ambient air were
collected using Respiratory Dust Samplers (RDS) for fugitive dust, PM10 and SO2,
NOX with gaseous attachments & Fine Dust Samplers (FDS) for PM2.5 and other
parameters as per NAAQ norms and analysed for primary air pollutants to work out
the existing status of air quality.
o The noise level measurements were also made at various locations in different
intervals of time with the help of sound level meter to establish the baseline noise
levels in the impact zone.
o Baseline biological studies were carried out to assess the ecology of the study area to
study the existing flora and fauna pattern of the area.
o Socio-economic survey was conducted at village and household level in the study area
to understand the present socio-economic conditions and assess the extent of impact
due to the proposed mining project.
The sampling methodologies for the various environmental parameters required for the
study, frequency of sampling, method of sample analysis, etc., are given in Table 3.1.

Page | 51
Table 3.1 Monitoring Attributes and Frequency of Monitoring
Attributes Parameters Frequency of
Monitoring
No. of
Locations Protocol
Land Use/ Land Cover
Land-use Pattern within 10 km radius of the study area
Data from census handbook 2011 and from the satellite imagery
Study Area Satellite Imagery Primary Survey
*Soil Physico-Chemical characteristics
Once during the study period
6 (1 core & 5 buffer zone)
IS 2720 Agriculture Handbook - Indian Council of Agriculture Research, New Delhi
*Water Quality
Physical, Chemical and Bacteriological Parameters
Once during the study period
6 (2 surface water & 4
ground water)
IS 10500& CPCB Standards
Meteorology
Wind speed Wind direction Temperature Cloud cover Dry bulb temperature Rainfall
1 hourly continuous mechanical/automatic weather station
1
Site specific primary data & secondary data from IMD Station
*Ambient Air Quality
PM10 PM2.5
SO2 NOX Fugitive dust
24 hourly twice a week (October – December 2021)
8 (1 core & 7
buffer)
IS 5182 Part 1-23 National Ambient Air Quality Standards, CPCB
*Noise Levels
Ambient noise Hourly observation for 24 hours per location
8 (1 core & 7 buffer zone)
IS 9989 As per CPCB Guidelines
Ecology Existing flora and fauna
Through field visit during the study period
Study area
Primary Survey by Quadrate & Transect Study Secondary Data – Forest Working Plan
Socio Economic Aspects
Socio–economic characteristics, Population statistics and existing infrastructure in the study area
Site visit & Census Handbook, 2011
Study area
Primary Survey, census handbook & need based assessments.
Source: On-site monitoring/sampling by Noida Testing Laboratories in association with GTMS
* All monitoring and testing have been carried out as per the Guidelines of CPCB and MoEF
& CC.

Page | 52
3.1 LAND ENVIRONMENT
The main objective of this section is to provide a baseline status of the study area
covering 10km radius around the proposed mine site so that temporal changes in the
surroundings due to the mining activities can be assessed in future.
3.1.1 Land Use/ Land Cover
A visual interpretation technique has been adopted for land use classification based on
the keys suggested in the chapter – V, the guidelines issued by NNRMS, Bangalore & Level
III classification with 1:50,000 scale for the preparation of land use mapping. Land use pattern
of the area was studied through LISS III imagery of Bhuvan (ISRO). The 10 km radius map of
study area was taken for analysis of land use cover.
Table 3.2 LULC Statistics of the Study Area
S. No. LULC Category LU/LC Area (ha) LU/LC Area (%)
1. Barren Rocky/Stone waste/sheet rock
area 24.7 0.10
2 Crop Land 12491.0 40.2
3 Dense Forest 308.1 1.0
4 Fallow land 1897.1 6.10
5 Land affected by salinity/salinity coastal 173.1 0.60
6 Land with or without scrub 11410.6 36.7
7 Manmade features 879.9 2.8
8 Mining/Industrial wastelands 65.2 0.20
9 Plantations 3344.1 10.80
10 Settlements 310.4 1.0
11 Water Bodies 196.1 0.6
Total 31100.32 100
Source: Survey of India Toposheet and Landsat Satellite Image

Page | 53
Figure 3.1 LULC map of 10km radius from the proposed project sites

Page | 54
From the land use/land cover map (Fig.3.1), the table (3.2), and the pie diagram
(Fig.3.2), it is inferred that the majority of the land in the study area is crop land covering
40.2% of the total land area, followed by Land with/Without scrub land (36.7%), Plantation
(10.80%), Fallow land (6.10%), Manmade features (2.8%) Settlements (1%) Dense Forest
(1%) water bodies (0.60%) and mining land/ industrial waste land (0.20%). The total mining
area within the study area is 4.90 hectares (i.e., 0.01%). This small percentage of mining
activities shall not have any significant impact on the environment.
Figure 3.2 Pie Diagram Showing Proportion of LULC In the Study Area
3.1.2 Topography
The proposed project area is an undulated terrain. Massive charnockite formation is
found beneath the gravel formation.
3.1.3 Drainage Pattern of the Area
As already described in the chapter 2, the project sites fall within the area showing
dendritic pattern.
3.1.4 Seismic Sensitivity
The proposed project sites falls in the seismic Zone III, moderate damage risk zone as
per BMTPC because the project area falls in the hard rock terrain of the peninsular shield of
south India.
40.20%
36.70%
10.80%
6.10%
2.80%1.00%
1% 0.20%
CROP LAND LAND WITH Or WITH OUT SCRUB LAND
PLANTATIONS FALLOW LAND
MANMADE FEATURES SETTELMENTS
DENSE FOREST MINING LANDS

Page | 55
3.1.5 Environmental Features in the Study Area
There are no Wildlife Sanctuaries, National Park and Archaeological monuments within
the project area. No Protected and Reserved Forest area is located within the project area.
Therefore, there will be no need of acquisition/diversion of forest land. The details related to
the environmentally sensitivity features around the proposed mine lease area are given in the
Tables 3.3&3.3(a) and the nearby water bodies in the Table 3.4.
Table 3.3 Details of Environmentally Sensitive Ecological Features in the Project Area- P1
S. No Sensitive Ecological
Features Name
Areal Distance in km from
cluster
1 National Park /
Wild life Sanctuaries None Nil within 10km radius
2 Reserve Forest Naralapalli R. F 6.2km NE
3 Lakes/Reservoirs/
Dams/Streams/Rivers
Periya lake 1.5km South Kathinayanapalli lake 2.9km East
Krishnagiri dam 4.9 SW Avathanapatti Lake 6.5km SE
Thenpennaiyaru 8.9 SW
4 Tiger Reserve/Elephant
Reserve/ Biosphere Reserve
None Nil within 10km radius
5 Critically Polluted
Areas None Nil within 10km radius
6 Mangroves None Nil within 10km radius 7 Mountains/Hills None Nil within 10km radius
8 Notified Archaeological
Sites None Nil within 10km radius
9 Industries/
Thermal Power Plants None Nil within 10km radius
10 Defence Installation None Nil within 10km radius Source: Survey of India Toposheet and prefeasibility report
Table 3.3 (a) Details of Environmentally Sensitive Ecological Features in the Project Area- P2
SI.
No
Sensitive Ecological
Features Name
Areal Distance in km from
cluster
1 National Park /
Wild life Sanctuaries None Nil within 10km radius
2 Reserve Forest Naralapalli R. F 6 km NE
3 Lakes/Reservoirs/
Dams/Streams/Rivers
Periya lake 1.8km-South
Kathinayanapalli lake 2.3km East
Krishnagiri dam 5.4km SW
Avathanapatti Lake 6.7km SW

Page | 56
Thenpennaiyaru 9.2km SW
4
Tiger Reserve/Elephant
Reserve/ Biosphere
Reserve
None Nil within 10km radius
5 Critically Polluted
Areas None Nil within 10km radius
6 Mangroves None Nil within 10km radius
7 Mountains/Hills None Nil within 10km radius
8 Notified Archaeological
Sites None Nil within 10km radius
9 Industries/
Thermal Power Plants None Nil within 10km radius
10 Defence Installation None Nil within 10km radius
Table 3.4 Water Bodies Nearby the Proposed Project Sites- P1&P2
PROPOSED SITE P1
S. No. Name Distance & Direction
1 Periya lake 1.5km South
2 Kathinayanapalli lake 2.9km East
3 Krishnagiri dam 4.9 SW
4 Avathanapatti Lake 6.5km SE
5 Thenpennaiyaru 8.9 SW
PROPOSED SITE P2 Name Distance & Direction
1 Periya lake 1.8km-South
2 Kathinayanapalli lake 2.3km East
3 Krishnagiri dam 5.4km SW
4 Avathanapatti Lake 6.7km SW
5 Thenpennaiyaru 9.2km SW
Source: Village Cadastral Map and Field Survey
3.1.6 Soil Environment
Soil quality of the study area is one of the important components of the land environment.
The composite soil samples were collected from the study area and analysed for different
parameters. The locations of the monitoring sites are shown in Table 3.5 and Figure 3.4. The
objective of the soil sampling is:
o to determine the baseline soil characteristics of the study area
o to study the impact of proposed activity on soil characteristics and
o to study the impact on agriculture production

Page | 57
Table 3.5 Soil Sampling Locations
S. No Location
Code
Monitoring
Locations
Distance &
Direction
Coordinates
1 S-1 Core Zone Project Area 12°32'54.95"N 78°12'30.54"E
2 S-2 Kallukurikki 500m North 12°33'27.91"N 78°12'39.71"E
3 S-3 Kondepalli 3.5km SW 12°32'47.85"N 78°10'18.61"E
4 S-4 Samanthamalai 2.8km NW 12°34'29.95"N 78°11'37.30"E
5 S-5 Karadiguri 3.5km NE 12°33'39.15"N 78°14'43.53"E
6 S-6 Peddatalapalli 3.5km SW 12°31'13.39"N 78°11'9.72"E
Source: On-site monitoring/sampling by Noida Testing Laboratories in association with
GTMS
3.1.6.1 Methodology
For studying soil quality, sampling locations were selected to assess the existing soil
conditions in and around the project sites representing various land use conditions. The
samples were collected by auger boring (Figure 3.3) into the soil up to 90-cm depth. Six (6)
locations were selected for soil sampling on the basis of soil types, vegetative cover,
industrial & residential activities including infrastructure facilities, which would accord an
overall idea of the soil characteristics. The samples were analysed for physical and chemical
characteristics. The samples were sent to laboratory for analysis. The samples were filled in
Polythene bags, coded and sent to laboratory for analysis and the details of methodology are
given in Table 3.6.
Table 3.6 Details of Soil Sampling
Particulars Details
Frequency One grab sample from each station-once during the study period
Methodology Composite grab samples of the topsoil were collected from 3 depth levels
and mixed to provide a representative sample for analysis. They were
stored in airtight polythene bags and analysed at the laboratory.
Source: On-site monitoring/sampling by Noida Testing Laboratories in association with
GTMS
3.1.6.2 Soil Testing Results
The samples were analysed as per the standard methods prescribed in “Soil Chemical
Analysis (M.L. Jackson, 1967) & Department of Agriculture, Cooperation & Farmers Welfare,
Ministry of Agriculture & Farmers Welfare, Government of India”. The important properties
analysed for soil are bulk density, porosity, infiltration rate, pH and Organic matter, Nitrogen,

Page | 58
Phosphorous and Potassium. The standard classifications of soil are presented below in Figure
3.5 and the physio-chemical characteristics of the soil & test results in Table 3.7.
3.1.6.3 Results and Discussion
Physical Characteristics
The physical properties of the soil samples were examined for texture, bulk density, porosity
and water holding capacity. The soil texture found in the study area is clay to clay loam. The
bulk density of soils in the study area varies between 1.01 and 1.35 g/cc. The water holding
capacity varies from 41.1 46.6 and porosity from 28 to 40%.
Chemical Characteristics
o The nature of soil is slightly alkaline to strongly alkaline with pH ranging from 7.23
to 8.53°C
o The nitrogen ranges between 167 and 210 kg/ha
o The phosphorus ranges between 0.64 and 1.21kg/ha
o The potassium ranges between 21.3 and 40 mg/kg

Page | 59
Figure 3.3 Geo-Referenced Toposheet Showing Soil Sampling Locations Within 10km Radius Around the Proposed Project Site

Page | 60
Figure 3.4 Soil Classification Around 10km Radius from The Proposed Projects Sites

Page | 61
Table 3.7 Soil Quality of the Study Area
Source: Sampling Results by Noida Testing Laboratories
Parameter S-1
Core Zone S-2
Kallukurikki S-3
Kondepalli S-4
Samanthamalai S-5
Karadiguri S-6
Peddatalapalli
1 pH at 27°C 7.76 8.44 8.02 8.29 7.23 8.53 2 Electrical Conductivity at 25C 324 500 425 290 344 410 3 Texture Clay Loam Clay Loam Clay Loam Clay Loam Clay Loam Clay Loam 4 Sand 36.5 33.5 32.4 32.2 33.3 34.3 5 Slit 37.1 35.4 34.1 36.7 32.4 39.8 6 Clay 26.4 31.1 33.5 31.1 34.3 25.9 7 Water Holding Capacity 44.1 46.5 45.3 49.2 41.1 46.6 8 Bulk Density 1.22 1.02 1.35 1.01 1.09 0.97 9 Porosity 31.8 28 31.7 35.2 34.5 40 10 Calcium (Ca) 182 172 140 138.5 133 123 11 Magnesium (Mg) 22.4 21 30.3 25 39 24.5 12 Manganese (Mn) 31 35 31.7 37.6 28.7 21 13 Zinc (Zn) 0.38 0.56 1.15 1.21 1.24 0.51 14 Boron (B) 0.64 0.56 0.59 0.79 1.03 0.66 15 Chloride (Cl) 139 118 136 155 137 165 16 Sulphate(S04) 122 110 141.2 138 151 90 17 Potassium(K) 37.6 36.1 40 29.4 30.2 213 18 Phosphorous(P) 0.81 1.05 0.88 0.71 1.21 0.64 19 Nitrogen (N) 210 190 173 185 167 170 20 Cadmium (Cd) BDL(DL:0.003) 21 Chromium (Cr) BDL (DL:0.05) 22 Copper (Cu) BDL (DL:0.05) 23 Lead (Pb) 0.73 0.62 0.76 1.05 1.20 0.21 24 Total Iron 1.55 1.40 1.05 2.22 1.55 2.63 25 Organic Matter 1.36 2.46 2.12 1.86 1.39 1.67 26 Organic Carbon 0.79 1.43 1.23 1.08 0.81 0.97 27 CEC 30.4 31.4 27.6 32.7 45.7 40

Page | 62
3.2 WATER ENVIRONMENT
The water resources, both surface and groundwater play a significant role in the
development of the area. The purpose of this study is to assess the critical water quality
parameters and evaluate the impacts on agricultural productivity, domestic community usage,
recreational resources and aesthetics in the vicinity. The water samples were collected and
transported as per the norms in pre-treated sampling cans to laboratory for analysis.
3.2.1 Surface Water Resources
The rainfall over the area is moderate, the rainwater storage in open wells is in practice over
the area and the stored water acts as the source of drinking water for few months after rainy
season.
3.2.2 Ground Water Resources
Groundwater occurs in all the crystalline formations of Achaean and Recent alluvium.
The occurrence and behaviour of groundwater are controlled by rainfall, topography,
geomorphology, geology, structures etc. Ground water occurs in phreatic conditions in
weathered and fractured rocks. The movement of the groundwater is controlled by the intensity
of weathering and fracturing. Dug wells and bore wells are the most common ground water
abstraction structures in the area. The diameter of the dug well is in the range of 7 to 10 m and
depths of dug wells range from 9 to 13m bgl. The dug wells yield up to 1 lps in summer months
and few wells remains dry. The yield is adequate for irrigating one or two crops in the monsoon
period.
3.2.3 Methodology
Reconnaissance survey was undertaken and monitoring locations were finalized based on:
o Drainage pattern
o Location of residential areas /likely impact areas
o Likely areas which can represent baseline conditions
Two (2) surface, two (2) open well and two (2) bore well water samples (Figures 3.7(a)
& (b)) were collected from the study area and were analysed for physico-chemical conditions,
heavy metals and bacteriological contents in order to assess the effect of mining and other
activities on surface and ground water. The samples were analysed as per the procedures
specified by CPCB, IS-10500:2012 and ‘Standard methods for the examination of water and
wastewater’ published by American Public Health Association (APHA). The water sampling
locations are given in Figure 3. 5 and Table 3.8.

Page | 63
Figure 3.5 Geo-Referenced Toposheet Showing Water Sampling Locations Within 10k M Radius Around the Proposed Project Sites

Page | 64
Figure 3.6 Water Samples Collection for Water Quality Analysis
Table 3.8 Water Sampling Locations
S.No. Code Locations Distance &
Direction Coordinates
Surface Water
1 SW-1 Tank Near Krishnagiri
2.5km SW 12°31'12.70"N 78°12'39.42"E
2 SW-2 Ponnaiyar River (Sembadamuthur)
7km West 12°32'58.83"N78°8'19.31"E
Ground Water 3 WW-1 Core Zone Near Project Area 12°33'3.69"N 78°12'39.93"E 4 WW-2 Kondepalli 3.5km SW 12°32'41.59"N 78°10'10.65"E 5 BW-1 Core Zone Near Project Area 12°32'56.78"N 78°12'15.26"E 6 BW-2 Samanthamalai 2.8km NW 12°34'29.68"N 78°11'38.38"E Source: On-site monitoring/sampling by Noida Testing Laboratories in association with GTMS

Page | 65
Table 3.9 Ground Water Quality Results
S.No. Parameters Units
RESULTS Standards as Per IS
10500: 2012
WW1 WW2 BW1 BW2 Acceptable
Limit
Permissible
Limit
1 Color Hazen < 5 < 5 < 5 < 5 5 15 2 Odour - Agreeable Agreeable Agreeable Agreeable Agreeable Agreeable
3 pH@ 25°C - 6.86 7.21 7.03 7.75
6.5-8.5 No
relaxation
4 Electrical
Conductivity @ 25°C
µs/cm 725 782 676 617 Not
specified Not
specified
5 Turbidity NTU < 1 < 1 < 1 < 1 1 5 6 TDS mg /l 428 460 398 364 500 2000
7 Total
Hardness mg/l 132.57 175.31 180.76 110.77 200 600
8 Calcium Ca mg/l 24.3 37.8 30.1 21 75 200
9 Magnesium
Mg mg/l
17.5 19.7 25.7 14.2 30 100
10 Total
Alkalinity mg/l
167 178 146 120 200 600
11 Chloride Cl- mg/l 95.3 82 72.5 66.3 250 1000
12 Sulphate
SO4- mg/l
25.7 22.1 20.4 30.7 200 400
13 Iron Fe mg/l 0.13 0.18 0.22 BDL
(DL:0.1) 0.3
No relaxation
14 Free
Residual Cl mg/l
BDL(DL: 2.0)
BDL(DL: 2.0)
BDL(DL: 2.0)
BDL(DL: 2.0)
0.2 1
15 Fluoride F mg/l 0.18 0.11 0.25 0.3 1.0 1.5
16 Nitrates NO3 mg/l 13.3 12.4 15.7 20
45 No
relaxation
17 Copper Cu mg/l BDL
(DL:0.2) BDL
(DL:0.2) BDL
(DL:0.2) BDL
(DL:0.2) 0.05 1.5
18 Manganese
Mn mg/l
BDL (DL:0.05)
BDL (DL:0.05)
BDL (DL:0.05)
BDL (DL:0.05)
0.1 0.3
19 Mercury Hg mg/l (BDL (DL:
0.0005) (BDL (DL:
0.0005) (BDL (DL:
0.0005) (BDL (DL:
0.0005) 0.001
No relaxation
20 Cadmium Cd mg/l BDL
(DL:0.01) BDL
(DL:0.01) BDL
(DL:0.01) BDL
(DL:0.01) 0.003
No relaxation
21 Selenium Se mg/l BDL (DL:
0.05) BDL (DL:
0.05) BDL (DL:
0.05) BDL (DL:
0.05) 0.01
No relaxation
22 Aluminium
Al mg/l
BDL (DL: 0.03)
BDL (DL: 0.03)
BDL (DL: 0.03)
BDL (DL: 0.03)
0.03 No
relaxation
23 Lead Pb mg/l BDL
(DL:0.01) BDL
(DL:0.01) BDL
(DL:0.01) BDL
(DL:0.01) 0.01
No relaxation
24 Zinc Zn mg/l BDL
(DL:0.02) BDL
(DL:0.02) BDL
(DL:0.02) BDL
(DL:0.02) 5 15
25 Total
Chromium mg/l
BDL (DL: 0.05)
BDL (DL: 0.05)
BDL (DL: 0.05)
BDL (DL: 0.05)
0.05 No
relaxation
26 Boron B mg/l BDL
(DL:0.1) BDL
(DL:0.1) BDL
(DL:0.1) BDL
(DL:0.1) 0.5 1.0
27 Mineral Oil mg/l BDL
(DL:1.0) BDL
(DL:1.0) BDL
(DL:1.0) BDL
(DL:1.0) 0.5
No relaxation

Page | 66
28 Phenolic
Compounds mg/l Absent Absent Absent Absent 0.001
No relaxation
29 Anionic
Detergents mg/l
BDL (DL:0.1)
BDL (DL:0.1)
BDL (DL:0.1)
BDL (DL:0.1)
0.2 0.1
30 Cyanide CN mg/l Absent Absent Absent Absent 0.05 No
relaxation
31 Total
Coliform MPN/ 100ml
< 2 < 2 < 2 < 2 Shall not
be detectable in any100
ml
Shall not be detectable in any100
ml 32 E-Coli < 2 < 2 < 2 < 2
33 Barium Ba mg/l BDL
(DL:0.5) BDL
(DL:0.5) BDL
(DL:0.5) BDL
(DL:0.5) 0.7
No relaxation
34 Ammonia mg/l BDL
(DL:0.1) BDL
(DL:0.1) BDL
(DL:0.1) BDL
(DL:0.1) 0.5
No relaxation
35 Sulphide
H2S mg/l
BDL (DL:0.05)
BDL (DL:0.05)
BDL (DL:0.05)
BDL (DL:0.05)
0.05 No
relaxation
36 Molybdenum mg/l BDL
(DL:0.5) BDL
(DL:0.5) BDL
(DL:0.5) BDL
(DL:0.5) 0.07
No relaxation
37 Total
Arsenic mg/l
BDL (DL:0.01)
BDL (DL:0.01)
BDL (DL:0.01)
BDL (DL:0.01)
0.01 0.05
38 Total
Suspended Solids
Mg/l BDL(DL:2) BDL(DL:2) BDL(DL:2) BDL(DL:2) - -
* IS: 10500:2012-Drinking Water Standards; # within the permissible limit as per the WHO
Standard. The water can be used for drinking purpose in the absence of alternate sources.
Note: WW- Open well Water, BW – Bore well Water
Table 3.10 Surface Water Quality Results
Sl.
No. Parameter Unit
RESULT CPCB
Designated
Best Use
SW1
Tank Near
Krishnagiri
SW2
Ponnaiyar River
1 Color Hazen 5 10 300
2 Odour - Agreeable Agreeable Not specified
3 pH@ 25oC - 7.27 7.51 6.5 – 8.5
4 Electrical Conductivity @
25°C µs/cm 777 720
5 Turbidity NTU 4.2 7.1 Not specified
6 Total Dissolved Solids mg /l 459 425 1500
7 Total Hardness CaCO3 mg/l 187.8 182.4 Not specified
8 Calcium Ca mg/l 34.1 36.2 Not specified
9 Magnesium Mg mg/l 25 22.4 Not specified
10 Total Alkalinity CaCO3 mg/l 160 154 Not specified
11 Chloride Cl- mg/l 79.3 70.2 600
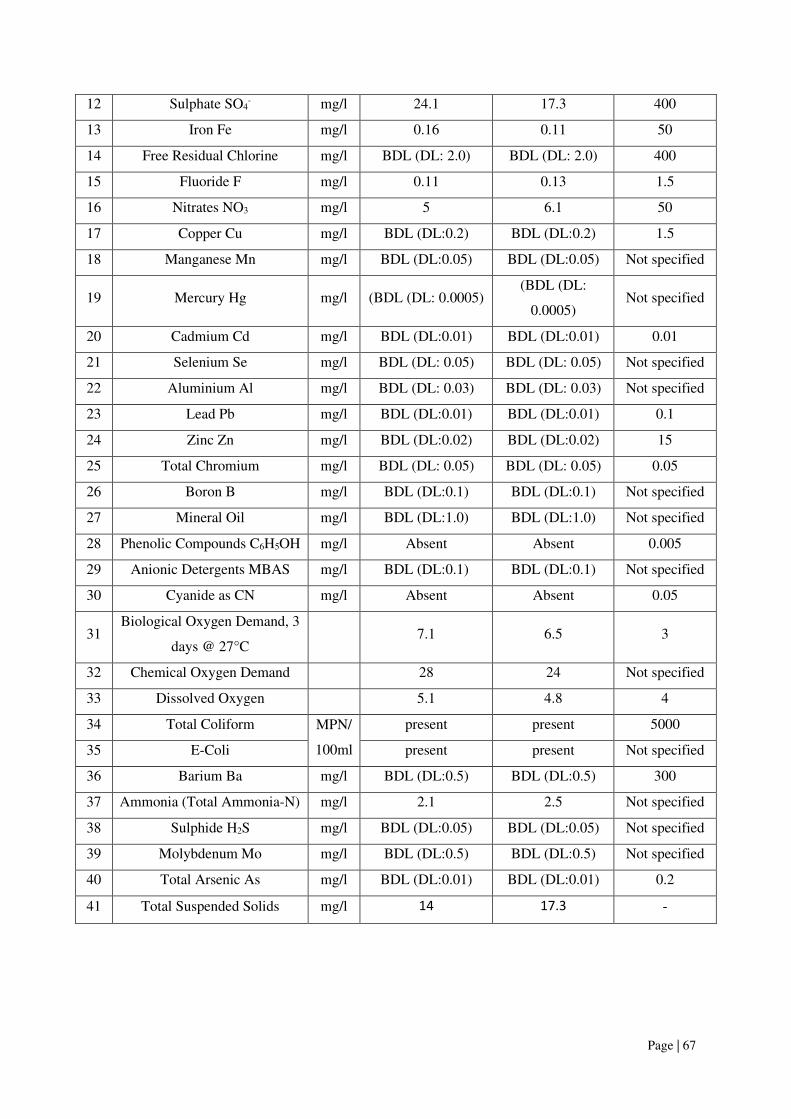
Page | 67
12 Sulphate SO4- mg/l 24.1 17.3 400
13 Iron Fe mg/l 0.16 0.11 50
14 Free Residual Chlorine mg/l BDL (DL: 2.0) BDL (DL: 2.0) 400
15 Fluoride F mg/l 0.11 0.13 1.5
16 Nitrates NO3 mg/l 5 6.1 50
17 Copper Cu mg/l BDL (DL:0.2) BDL (DL:0.2) 1.5
18 Manganese Mn mg/l BDL (DL:0.05) BDL (DL:0.05) Not specified
19 Mercury Hg mg/l (BDL (DL: 0.0005) (BDL (DL:
0.0005) Not specified
20 Cadmium Cd mg/l BDL (DL:0.01) BDL (DL:0.01) 0.01
21 Selenium Se mg/l BDL (DL: 0.05) BDL (DL: 0.05) Not specified
22 Aluminium Al mg/l BDL (DL: 0.03) BDL (DL: 0.03) Not specified
23 Lead Pb mg/l BDL (DL:0.01) BDL (DL:0.01) 0.1
24 Zinc Zn mg/l BDL (DL:0.02) BDL (DL:0.02) 15
25 Total Chromium mg/l BDL (DL: 0.05) BDL (DL: 0.05) 0.05
26 Boron B mg/l BDL (DL:0.1) BDL (DL:0.1) Not specified
27 Mineral Oil mg/l BDL (DL:1.0) BDL (DL:1.0) Not specified
28 Phenolic Compounds C6H5OH mg/l Absent Absent 0.005
29 Anionic Detergents MBAS mg/l BDL (DL:0.1) BDL (DL:0.1) Not specified
30 Cyanide as CN mg/l Absent Absent 0.05
31 Biological Oxygen Demand, 3
days @ 27°C 7.1 6.5 3
32 Chemical Oxygen Demand 28 24 Not specified
33 Dissolved Oxygen 5.1 4.8 4
34 Total Coliform MPN/
100ml
present present 5000
35 E-Coli present present Not specified
36 Barium Ba mg/l BDL (DL:0.5) BDL (DL:0.5) 300
37 Ammonia (Total Ammonia-N) mg/l 2.1 2.5 Not specified
38 Sulphide H2S mg/l BDL (DL:0.05) BDL (DL:0.05) Not specified
39 Molybdenum Mo mg/l BDL (DL:0.5) BDL (DL:0.5) Not specified
40 Total Arsenic As mg/l BDL (DL:0.01) BDL (DL:0.01) 0.2
41 Total Suspended Solids mg/l 14 17.3 -

Page | 68
3.2.4 Results and Discussion
Results of important water quality parameters were compared with the standards of IS
10500:2012 and have been discussed in the following sections.
3.2.4.1 Surface Water
The pH varies from 7.27 to 7.51, while turbidity is found within the acceptable limits.
TDS including carbonates, bicarbonates, chlorides, phosphates, nitrates, calcium,
magnesium, and sodium in the surface water varies from 425 to 459 mg/l. Chloride varies
from 70.2. to 79.3.mg/l; nitrate varies from 5 to 6.1 mg/l, whereas sulphate from 17.3. to
24.1mg/l.
3.2.4.2 Ground Water
The pH (6.86 to 7.75) of the water samples falls within the acceptable limit of 6.5 to
8.5. Sulphates and chlorides of water samples from all the sources are within the acceptable
limits as per the water quality standard. Turbidity in the water samples meets the requirement.
TDS are found in the range of 364- 460mg/l in all samples. The total hardness varies between
110.77 and 180.76 mg/l for all samples. When speaking about microbiological parameters,
the water samples from all the locations meet the requirement. When compared to IS
10500:2012 all the parameters thus analysed fall within the prescribed limits.
3.2.5 Hydrogeological Studies
The area within 10km radius consists of numerous open wells and deep wells. The
groundwater potential study was conducted to ascertain the water yielding capacity of the
wells in the study area. For this study, groundwater prospecting map was prepared, as shown
in Figure 3.8. The map shows that wells located in the major portion of the study area can be
capable of yielding 50-100 liters of water per minute.
3.2.5.1 Groundwater Levels and Flow Direction
As the groundwater moves from the points of highest static groundwater elevation to the points
of lowest static groundwater elevation under the influence of gravity, data regarding depth to
groundwater levels are essential to infer the direction of groundwater movement within the
study area. Knowledge of groundwater flow direction is must in choosing location for
background groundwater quality monitoring well and in locating recharge and discharge areas.
Therefore, data regarding groundwater elevations were collected from 6 open wells and 6 bore
wells at various locations within 1km radius around the proposed project sites for the period
from October through December, 2021. The data thus collected from 8 open wells and 8
borewells are provided in Tables 3.11 and 3.12. According to the data, average depths to the
static water table in open wells range from 13.73 to 14.36m; average depths to static
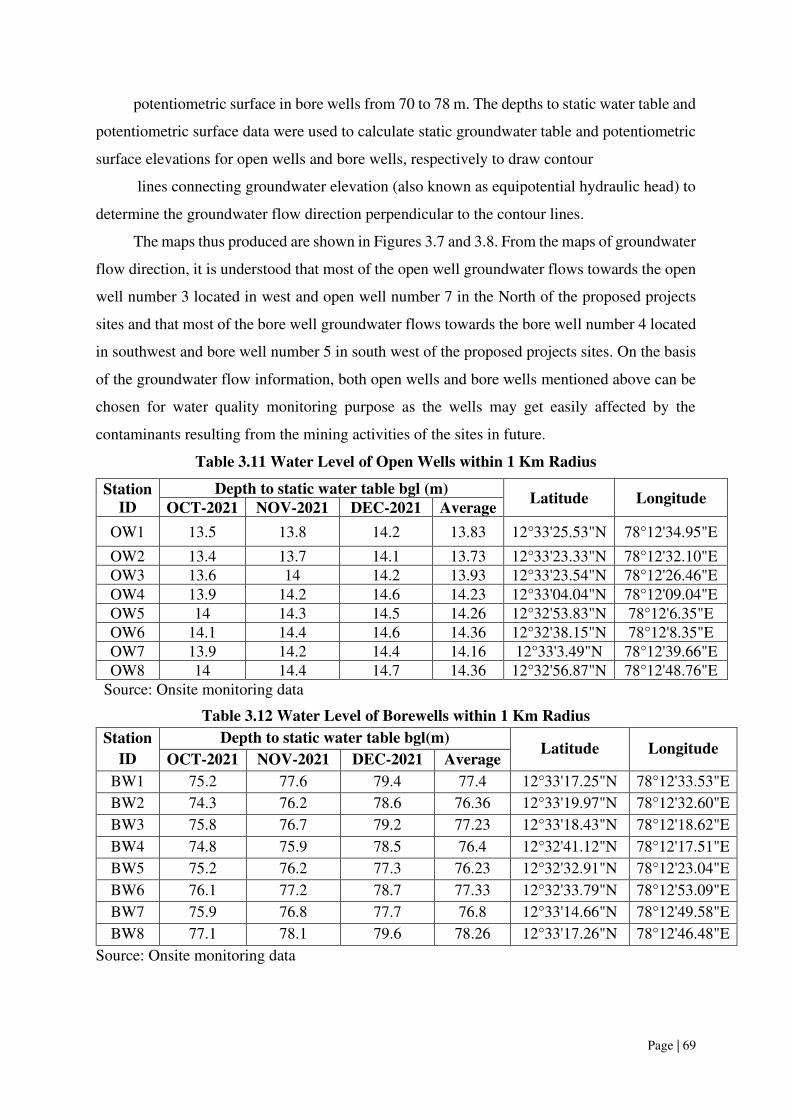
Page | 69
potentiometric surface in bore wells from 70 to 78 m. The depths to static water table and
potentiometric surface data were used to calculate static groundwater table and potentiometric
surface elevations for open wells and bore wells, respectively to draw contour
lines connecting groundwater elevation (also known as equipotential hydraulic head) to
determine the groundwater flow direction perpendicular to the contour lines.
The maps thus produced are shown in Figures 3.7 and 3.8. From the maps of groundwater
flow direction, it is understood that most of the open well groundwater flows towards the open
well number 3 located in west and open well number 7 in the North of the proposed projects
sites and that most of the bore well groundwater flows towards the bore well number 4 located
in southwest and bore well number 5 in south west of the proposed projects sites. On the basis
of the groundwater flow information, both open wells and bore wells mentioned above can be
chosen for water quality monitoring purpose as the wells may get easily affected by the
contaminants resulting from the mining activities of the sites in future.
Table 3.11 Water Level of Open Wells within 1 Km Radius
Station
ID
Depth to static water table bgl (m) Latitude Longitude
OCT-2021 NOV-2021 DEC-2021 Average
OW1 13.5 13.8 14.2 13.83 12°33'25.53"N 78°12'34.95"E
OW2 13.4 13.7 14.1 13.73 12°33'23.33"N 78°12'32.10"E OW3 13.6 14 14.2 13.93 12°33'23.54"N 78°12'26.46"E OW4 13.9 14.2 14.6 14.23 12°33'04.04"N 78°12'09.04"E OW5 14 14.3 14.5 14.26 12°32'53.83"N 78°12'6.35"E OW6 14.1 14.4 14.6 14.36 12°32'38.15"N 78°12'8.35"E OW7 13.9 14.2 14.4 14.16 12°33'3.49"N 78°12'39.66"E OW8 14 14.4 14.7 14.36 12°32'56.87"N 78°12'48.76"E
Source: Onsite monitoring data
Table 3.12 Water Level of Borewells within 1 Km Radius
Station
ID
Depth to static water table bgl(m) Latitude Longitude
OCT-2021 NOV-2021 DEC-2021 Average
BW1 75.2 77.6 79.4 77.4 12°33'17.25"N 78°12'33.53"E
BW2 74.3 76.2 78.6 76.36 12°33'19.97"N 78°12'32.60"E
BW3 75.8 76.7 79.2 77.23 12°33'18.43"N 78°12'18.62"E
BW4 74.8 75.9 78.5 76.4 12°32'41.12"N 78°12'17.51"E
BW5 75.2 76.2 77.3 76.23 12°32'32.91"N 78°12'23.04"E
BW6 76.1 77.2 78.7 77.33 12°32'33.79"N 78°12'53.09"E
BW7 75.9 76.8 77.7 76.8 12°33'14.66"N 78°12'49.58"E
BW8 77.1 78.1 79.6 78.26 12°33'17.26"N 78°12'46.48"E
Source: Onsite monitoring data

Page | 70
Figure 3.7 Open Well Static Groundwater Elevation Map Showing the Direction of Groundwater Flow Within Unconfined Aquifer

Page | 71
Figure 3.8 Bore Well Static Groundwater Elevation Map Showing the Direction of Groundwater Flow Within Confined Aquifer
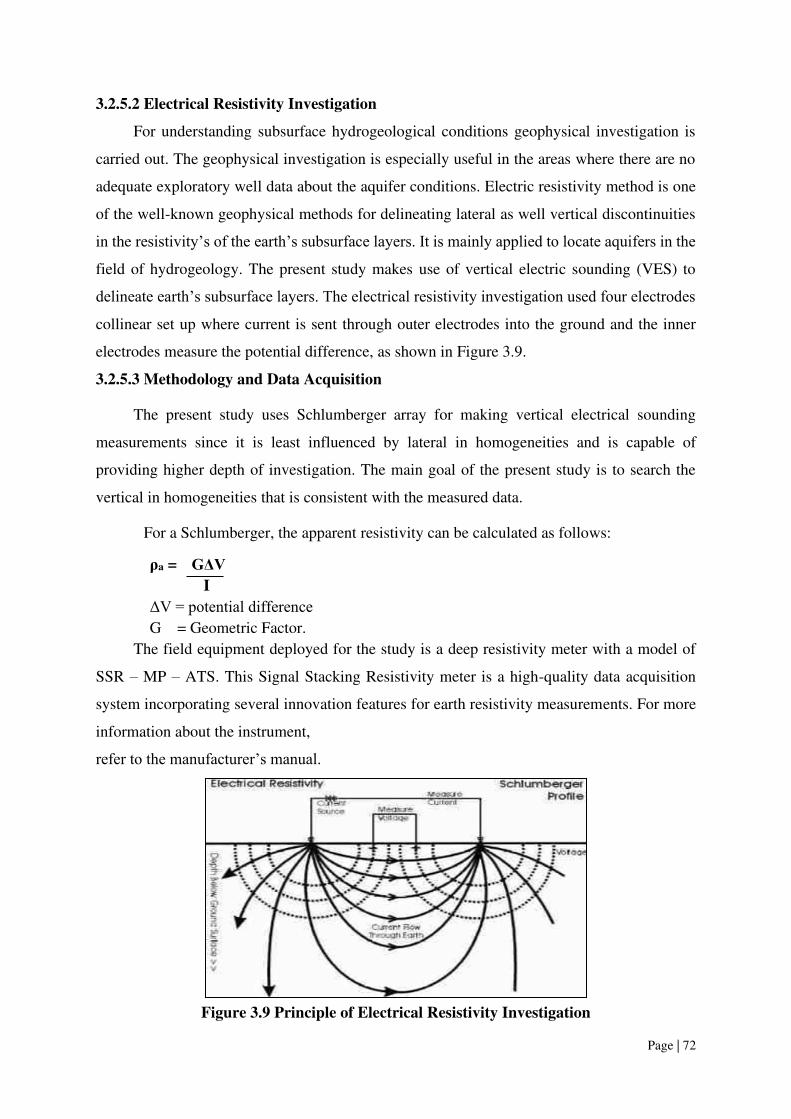
Page | 72
3.2.5.2 Electrical Resistivity Investigation
For understanding subsurface hydrogeological conditions geophysical investigation is
carried out. The geophysical investigation is especially useful in the areas where there are no
adequate exploratory well data about the aquifer conditions. Electric resistivity method is one
of the well-known geophysical methods for delineating lateral as well vertical discontinuities
in the resistivity’s of the earth’s subsurface layers. It is mainly applied to locate aquifers in the
field of hydrogeology. The present study makes use of vertical electric sounding (VES) to
delineate earth’s subsurface layers. The electrical resistivity investigation used four electrodes
collinear set up where current is sent through outer electrodes into the ground and the inner
electrodes measure the potential difference, as shown in Figure 3.9.
3.2.5.3 Methodology and Data Acquisition
The present study uses Schlumberger array for making vertical electrical sounding
measurements since it is least influenced by lateral in homogeneities and is capable of
providing higher depth of investigation. The main goal of the present study is to search the
vertical in homogeneities that is consistent with the measured data.
For a Schlumberger, the apparent resistivity can be calculated as follows:
ρa = GΔV
I
ΔV = potential difference G = Geometric Factor.
The field equipment deployed for the study is a deep resistivity meter with a model of
SSR – MP – ATS. This Signal Stacking Resistivity meter is a high-quality data acquisition
system incorporating several innovation features for earth resistivity measurements. For more
information about the instrument,
refer to the manufacturer’s manual.
Figure 3.9 Principle of Electrical Resistivity Investigation

Page | 73
0.00
100.00
200.00
300.00
400.00
500.00
600.00
700.00
800.00
900.00
1000.00
0 20 40 60 80 100 120
Re
sist
ivit
y V
alu
es
in
Oh
ms
Depth in meters
Vertical Electrical Sounding - 12
4
6
8
10
10
20
30
40
50
60
70
80
90
100
3.2.5.4 Data Presentation
The Geophysical VES data obtained from the project sites have been shown in Table 3.13.
The field data obtained from a detailed geophysical investigation were plotted with the help of
software provided by the manufacturer (I.G.I.S) for interpretation. The plots, known as inverse
slope used for the purpose of interpretation have been shown in Figures 3.12 and 3.12(a).
Table 3.13 Vertical Electrical Sounding Data- P1
GPS Coordinates - 12°32'54.11"N 78°12'30.58"E
S.No. AB/2(m) MN/2(m) Geometrical
Factor (G)
Resistance in
Ω
Apparent
Resistivity in
Ωm 1 2 1 4.71 23.56 110.97
2 4 1 23.55 9.45 222.55
3 6 1 54.95 5.23 287.39
4 8 1 98.91 3.44 340.25
5 10 1 155.45 2.41 374.63
6 10 5 23.55 19.10 449.81
7 20 5 117.75 4.05 476.89
8 30 5 274.75 1.99 546.75
9 40 5 494.55 1.21 598.41
10 50 5 777.15 0.83 645.03
11 60 5 1122.55 0.65 729.66
12 70 5 1530.75 0.47 719.45
13 80 5 2001.75 0.41 820.72
14 90 5 2535.55 0.33 836.73
15 100 5 3132.15 0.28 877.00
Figure 3.10 Graph Showing Occurrence of Water Bearing Fracture Zones
Indicated by Water Purple Squares

Page | 74
Table 3.13 (a) Vertical Electrical Sounding Data- P2
GPS Coordinates - 12°32'58.47"N 78°12'49.35"E
S.No. AB/2(m) MN/2(m) Geometrical
Factor (G)
Resistance
in Ω
Apparent
Resistivity in Ωm 1 2 1 4.71 24.50 115.40 2 4 1 23.55 9.46 222.78 3 6 1 54.95 5.24 287.94 4 8 1 98.91 3.44 340.25 5 10 1 155.45 2.45 380.85 6 10 5 23.55 19.20 452.16 7 20 5 117.75 4.10 482.78 8 30 5 274.75 1.90 522.03 9 40 5 494.55 1.20 593.46 10 50 5 777.15 0.85 660.58 11 60 5 1122.55 0.64 718.43 12 70 5 1530.75 0.46 704.14 13 80 5 2001.75 0.38 760.67 14 90 5 2535.55 0.33 836.73 15 100 5 3132.15 0.27 845.68
Figure 3.11 Graph Showing Occurrence of Water Bearing Fracture Zones Indicated by
Water Purple Squares
3.2.5.5 Geophysical Data Interpretation
The Proposed project (P1) rock formation with low resistivity’s indicating occurrence
of water occurs at the depth of 70m below ground level, the maximum quarrying operation is
proposed up to a depth of 40m (10m above ground level + 30m below ground level), as shown
in Figures 3.10
0.00
100.00
200.00
300.00
400.00
500.00
600.00
700.00
800.00
900.00
0 20 40 60 80 100 120
Re
sist
ivit
y V
alu
es
in
Oh
ms
Depth in meters
Vertical Eletrical Sounding Graph - P22
4
6
8
10
10
15
20
30
40
50
60
70
80
90
100

Page | 75
The Proposed project (P2) rock formation with low resistivity’s indicating occurrence
of water occurs at the depths between 70m to 75m below ground level, the maximum quarrying
operation is proposed upto a depth of 50 m, 45m (above ground level +5m below ground level)
as shown in Figures 3.11
3.3 AIR ENVIRONMENT
The existing ambient air quality of the area is important for evaluating the impact of
mining activities on the ambient air quality.
The baseline studies on air environment include identification of specific air pollution
parameters and their existing levels in ambient air. The ambient air quality with respect to the
study zone of 10 km radius around the cluster forms the baseline information. The sources of
air pollution in the region are mostly due to vehicular traffic, dust arising from unpaved village
road and domestic & agricultural activities. The prime objective of the baseline air quality
study was to establish the existing ambient air quality of the study area. These will also be
useful for assessing the conformity to standards of the ambient air quality during the operation
of proposed project in cluster.
This section describes the identification of sampling locations, methodology adopted
during the monitoring period and sampling frequency.
3.3.1 Meteorology
Meteorology is the key to understand the air quality. The essential relationship between
meteorological condition and atmospheric dispersion involves the wind in the broadest sense.
Wind fluctuations over a very wide range of time accomplish dispersion and strongly influence
other processes associated with them.
A temporary meteorological station was installed at the project sites by covering cluster
quarries. The station was installed at a height of 3 m above the ground level as there are no
obstructions facilitating flow of wind, wind speed, wind direction, humidity and temperature.
Meteorological data obtained from the onsite monitoring station are provided in Table 3.14.
According to the onsite data, the temperature in October, 2021 varied from 22.1 to 24.70C
with the average of 23.40C; in November, 2021 from 20.1 to 240C with the average of 22.10C;
and in December, 2021 from 17.7 to 23.50C with the average of 20.60C. During the period of
the three months, relative humidity ranged from 83.1 to 92 % in average. The highest average
humidity was measured in November, 2021, whereas the lowest in December, 2021. When
speaking about wind velocity, the wind velocity in October, 2021 varied from 1.37 to 3.75m/s
with the average of 2.56m/s; in November, 2021 from 1.37 to 5.48m/s with the average of

Page | 76
3.42m/s; and in December, 2021 from 1.09 to 5.16m/s with the average of 3.12m/s. During the
three months, the values of cloud cover ranged from 0 to 8 oktas. The wind was dominant in
the directions of E and ENE in October, 2021; in the directions of ENE and E in November,
2021; and in the directions of ENE and E in December, 2021.
Table 3.14 Onsite Meteorological Data
S.No Parameters Oct–2021 Nov–2021 Dec-2021
1 Temperature (0C) Max 24.7 24.0 23.5
Min 22.1 20.1 17.7 Avg 23.4 22.1 20.6
2 Relative Humidity (%) Avg 86 92 83.1
3 Wind Speed (m/s) Max 3.75 5.48 5.16 Min 1.37 1.37 1.09 Avg 2.56 3.42 3.12
4 Cloud Cover (OKTAS) 0-8 0-8 0-8 5 Wind Direction SW, WSW ENE, WSW NE, ENE
Source: On-site monitoring/sampling by Noida Testing Laboratories in association with GTMS
3.3.1.1 Climate
Krishnagiri is 914 m above mean sea level. Krishnagiri climate is classified as semi-
arid climate tropical savanna climate (AW). The lowest temperature is reached in January when
the mean daily minimum is about 19°C. However, in higher areas i.e., Hosur, Thally and
Krishnagiri taluks day and night temperature are lower by about 2 to 3°C. The climatic
conditions of Krishnagiri have been explained as below:
Climate –
The climate is tropical in Krishnagiri. The summers are much rainier than the winters
in Krishnagiri. This climate is considered to be Aw according to the Köppen-Geiger
climate classification.
The temperature here averages 25.5 °C | 77.9 °F. Precipitation here is about 773 mm |
30.4 inch per year.
The driest month is February. There is 6 mm | 0.2 inch of precipitation in February. The
greatest amount of precipitation occurs in October, with an average of 144 mm | 5.7
inch.
With an average of 29.0 °C | 84.2 °F, April is the warmest month. The lowest average
temperatures in the year occur in December, when it is around 21.9 °C | 71.4 °F.
The precipitation varies 138 mm | 5 inches between the driest month and the wettest
month. The variation in temperatures throughout the year is 7.1 °C | 12.8 °F.
Source: https:en.climate-data.org/asia/india/tamil-nadu/krishnagiri-34157

Page | 77
3.3.1.2 Rainfall
Table 3.15 Rainfall Data
Actual Rainfall in Mm Normal Rainfall in
mm 2013 2014 2015 2016 2017
766.0 757.6 1049.7 590.6 1145.9 850.58
Data regarding precipitation were collected for the district of the study area from
https://www.twadboard.tn.gov.in/content/Krishnagiri, From the data for the period of 2013-17,
the average annual rainfall has been calculated to be 850 .58mm. Of the 5 years, the lowest
rainfall (590mm) occurred in the year 2016, while the highest rainfall(1145mm) in the year
2017.
3.3.1.3 Wind Pattern
Local wind pattern will largely influence the dispersion pattern of air pollutants and noise
from the proposed project sites. Analysis of wind pattern requires hourly site-specific data of
wind speed and direction over a period of 3 months. The wind rose thus produced, as shown in
Figure 3.12 reveals that:
o The measured average wind velocity during the study period is 3.03m/s
o Predominant wind direction during the study period is northeast to southwest
Figure 3.12 Onsite Wind Rose Diagram
3.3.1.4 Correlation between Primary and Secondary Data
The meteorological data collected at the site is almost similar to that of secondary data
collected from IMD Krishnagiri. The correlation analysis reveals the following details:

Page | 78
o The average, maximum, and minimum temperatures of IMD, Krishnagiri were high
in respect of on-site data, i.e., Kotthapetta Village
o The relative humidity levels were lesser at site as compared to IMD, Krishnagiri
o The wind speed and direction at site shows similar trend to that of IMD, Krishnagiri
3.3.2 Methodology and Objectives
The prime objective of the ambient air quality study is to assess the existing air quality
of the study area and its conformity to NAAQS. The observed sources of air pollution in the
study area are industrial, traffic and domestic activities. The baseline status of the ambient air
quality has been established through a scientifically designed ambient air quality monitoring
network considering the followings:
o Meteorological condition on synoptic scale
o Topography of the study area
o Representatives of regional background air quality for obtaining baseline status
o Location of residential areas representing different activities
o Accessibility and power availability
3.3.3 Sampling and Analytical Techniques
Table 3.16 Methodology and Instrument Used for AAQ Analysis
Parameter Method Instrument
PM2.5 Gravimetric method Beta attenuation method
Fine Particulate Sampler Make – Thermo Environmental Instruments – TEI 121
PM10 Gravimetric method Beta attenuation method
Respirable Dust Sampler Make –Thermo Environmental Instruments – TEI 108
SO2 IS-5182 Part II (Improved West & Gaeke method)
Respirable Dust Sampler with gaseous attachment
NOx IS-5182 Part II (Jacob & Hochheiser modified method)
Respirable Dust Sampler with gaseous attachment
Free Silica NIOSH – 7601 Visible Spectrophotometry Source: Sampling methodology based on Noida Testing Laboratories & CPCB Notification

Page | 79
Table 3.17 National Ambient Air Quality Standards
Sl.
No.
Pollutant Time
Weighted
Average
Concentration in ambient air
Industrial,
Residential,
Rural & other
areas
Ecologically
Sensitive area
(Notified by Central
Govt.)
1 Sulphur Dioxide (μg/m3)
Annual Avg.*
24 hours**
50.0 80.0
20.0 80.0
2 Nitrogen Dioxide (μg/m3)
Annual Avg.
24 hours
40.0 80.0
30.0 80.0
3 Particulate matter (size less than 10µm) PM10 (μg/m3)
Annual Avg.
24 hours
60.0 100.0
60.0 100.0
4 Particulate matter (size less than 2.5 µm PM2.5 (μg/m3)
Annual Avg.
24 hours
40.0 60.0
40.0 60.0
Source: NAAQS CPCB Notification No. B-29016/20/90/PCI-I Dated: 18th Nov 2009
*Annual Arithmetic mean of minimum 104 measurements in a year taken twice a Week 24
hourly at uniform Interval.
** 24 hourly / 8 hourly or 1 hourly monitored value as applicable shall be complied with 98 %
of the time in a year. However, 2% of the time, they may exceed the limits but not on two
consecutive days of monitoring.
3.3.4 Frequency and Parameters for Sampling
Ambient air quality monitoring has been carried out with a frequency of two samples per
week at eight (8) locations, adopting a continuous 24 hourly (3 shift of 8-hour) schedule for
the period October – December 2021. The baseline data of ambient air has been generated for
PM10, PM2.5, sulphur dioxide (SO2) and nitrogen dioxide (NO2) Monitoring has been carried
out as per the CPCB, MoEF guidelines and notifications.
It was ensured that the equipment was placed preferably at a height of at least 3 ± 0.5m
above the ground level at each monitoring station for negating the effects of wind-blown
ground dust. The equipment was placed at open space free from trees and vegetation which
otherwise act as a sink of pollutants resulting in lower levels in monitoring results.
3.3.5 Ambient Air Quality Monitoring Stations
Eight monitoring stations were set up in the study area as depicted in Figures 3.14 &
3.14(a) for the assessment of the existing ambient air quality. Details of the sampling locations
are given in the Table 3.18. The concentrations of air pollutants measured from the proposed
project sites have been given in Tables 3.19 - 3.20 and the bar charts for easy visualisation as
shown in Figures 3.16 - 3.20.

Page | 80
Table 3.18 Ambient Air Quality (AAQ) Monitoring Locations
S.
No
Location
Code
Monitoring
Locations
Distance &
Direction Coordinates
1 AAQ-1 Core Zone Project Area 12°32'54.12"N 78°12'32.15"E 2 AAQ-2 Core Zone Near Project Area 12°32'55.98"N 78°12'17.98"E 3 AAQ-3 Kallukurikki 500m North 12°33'30.16"N 78°12'41.09"E 4 AAQ-4 Kondepalli 3.5km SW 12°32'48.33"N 78°10'18.52"E 5 AAQ-5 Samanthamalai 2.8km NW 12°34'31.05"N 78°11'36.81"E 6 AAQ-6 Karadiguri 3.5km NE 12°33'39.74"N 78°14'42.77"E 7 AAQ-7 Peddatalapalli 3.5km SW 12°31'12.55"N 78°11'8.94"E 8 AAQ-8 Peddanapalli 4.5km SE 12°31'16.68"N 78°14'50.65"E
Source: On-site monitoring/sampling by Noida Testing Laboratories in association with GTMS
Figure 3.13 (a) Ambient air quality data collection Figure 3.13 (b) Ambient air quality data
in core zone -P1 collection in core zone -P2
Figure 3.14 Ambient air quality data collection in buffer Zone

Page | 81
Figure 3.15 Geo- Referenced Toposheet Showing Ambient Air Quality Monitoring Station Locations Around 10km Radius from The
Proposed Project Sites

Page | 82
Table 3.19 Summary of AAQ Result
Particulate matter PM-2.5
Station Max Min Mean 98 Percentile STDEV AAQ-1 26.9 22.5 25.30 26.85 1.30 AAQ-2 26.3 20.5 22.64 25.85 1.37 AAQ-3 18.9 17.1 17.89 18.9 0.63 AAQ-4 21.4 17.6 19.01 21 0.98 AAQ-5 24.7 21.3 23.00 24.6 1.06 AAQ-6 25.9 21.4 23.98 25.85 1.16 AAQ-7 25.8 21.6 23.63 25.65 1.21 AAQ-8 23.9 21 22.89 23.85 0.67
Particulate matter PM-10 Station Max Min Mean 98 Percentile STDEV AAQ-1 46.8 42.1 45.16 46.75 1.58 AAQ-2 45.5 41.4 42.98 45.2 1.05 AAQ-3 39.4 35.8 37.41 39.25 0.92 AAQ-4 44.7 41.9 43.08 44.45 0.66 AAQ-5 44.7 41.2 42.71 44.65 0.98 AAQ-6 46.5 41.4 43.22 45.85 1.23 AAQ-7 45.9 41.5 43.90 45.8 1.17 AAQ-8 44.7 41.1 42.78 44.3 0.86
Sulphur Di-oxide as SO2 Station Max Min Mean 98 Percentile STDEV AAQ-1 8.9 7 7.66 8.75 0.56 AAQ-2 7.9 6.1 7.20 7.9 0.57 AAQ-3 6.9 5.1 6.09 6.9 0.60 AAQ-4 6.9 5.9 6.51 6.9 0.26 AAQ-5 8.8 7.1 7.86 8.75 0.54 AAQ-6 8.6 6.1 7.26 8.6 0.64 AAQ-7 8.9 6.1 7.48 8.9 0.88 AAQ-8 9.6 5.2 7.05 9.6 1.37
Oxide of Nitrogen as NO2
Station Max Min Mean 98 Percentile STDEV AAQ-1 28.4 24.2 25.97 28.4 1.12 AAQ-2 25.9 21.1 23.00 25.2 1.11 AAQ-3 19.8 16.2 17.04 18.75 0.74 AAQ-4 19.2 15.6 17.34 19 0.97 AAQ-5 26.8 21.5 23.41 26.35 1.45 AAQ-6 25.6 21.4 23.47 25.5 1.32 AAQ-7 26.4 21.5 24.01 26.4 1.41 AAQ-8 24.8 18 20.11 23.15 1.44
Table 3.20 Maximum, Minimum, Average And 98th Percentile of Average
Air Pollutant Concentrations Over the Study Area
S.No
Parameter
Pollutant Concentration, µg/m3 PM2.5 PM10 SO2 NO2
1 Maximum 24.23 44.78 8.31 24.61 2 Minimum 20.38 40.80 6.08 19.94 3 Mean 22.29 42.66 7.14 21.79 4 98th percentile 24.07 44.53 8.29 24.09 5 NAAQ Norms 60 100 80 80
Note: PM2.5-Particulate Matter size less than 2.5 µm; PM10- Particulate Matter size less than 10 µm;
SO2-Sulphur dioxide; NOx-Oxides of Nitrogen; SD-Standard Deviation

Page | 83
Figure 3.16 Bar Chart Showing Maximum, Minimum, And the Average Concentrations
of PM2.5 Measured from The Eight Air Quality Monitoring Stations Within 10km Radius
Figure 3.17 Bar Chart Showing Maximum, Minimum, And the Average Concentrations
of PM10 Measured from The Eight Air Quality Monitoring Stations Within 10km Radius
AAQ1 AAQ2 AAQ3 AAQ4 AAQ5 AAQ6 AAQ7 AAQ8
Maximum 26.9 26.3 18.9 21.4 24.7 25.9 25.8 23.9
Minimum 22.5 20.5 17.1 17.6 21.3 21.4 21.6 21
Mean 25.30 22.64 17.89 19.01 23.00 23.98 23.63 22.89
98th percentile 26.85 25.85 18.9 21 24.6 25.85 25.65 23.85
NAAQ Norms 60 60 60 60 60 60 60 60
0.0
10.0
20.0
30.0
40.0
50.0
60.0
70.0
PM
2.5
con
cen
trati
on
in
µg
/m³
AAQ1 AAQ2 AAQ3 AAQ4 AAQ5 AAQ6 AAQ7 AAQ8
Maximum 46.8 45.5 39.4 44.7 44.7 46.5 45.9 44.7
Minimum 42.1 41.4 35.8 41.9 41.2 41.4 41.5 41.1
Mean 45.16 42.98 37.41 43.08 42.71 43.22 43.90 42.78
98th percentile 46.75 45.2 39.25 44.45 44.65 45.85 45.8 44.3
NAAQ Norms 100 100 100 100 100 100 100 100
0.0
10.0
20.0
30.0
40.0
50.0
60.0
70.0
80.0
90.0
100.0
110.0
PM
10
con
cen
tra
tio
n i
n µ
g/m
³

Page | 84
Figure 3.18 Bar Chart Showing Maximum, Minimum, And the Average Concentrations
of SO2 Measured from The Eight Air Quality Monitoring Stations Within 10km Radius
Figure 3.19 Bar Chart Showing Maximum, Minimum, And the Average Concentrations
of Nox Measured from The Eight Air Quality Monitoring Stations Within 10km Radius
AAQ1 AAQ2 AAQ3 AAQ4 AAQ5 AAQ6 AAQ7 AAQ8
Maximum 8.9 7.9 6.9 6.9 8.8 8.6 8.9 9.6
Minimum 7 6.1 5.1 5.9 7.1 6.1 6.1 5.2
Mean 7.66 7.20 6.09 6.51 7.86 7.26 7.48 7.05
98th percentile 8.75 7.9 6.9 6.9 8.75 8.6 8.9 9.6
NAAQ Norms 80 80 80 80 80 80 80 80
0.0
10.0
20.0
30.0
40.0
50.0
60.0
70.0
80.0
90.0
SO
2 c
on
cen
tra
tio
n i
n µ
g/m
³
AAQ1 AAQ2 AAQ3 AAQ4 AAQ5 AAQ6 AAQ7 AAQ8
Maximum 28.4 25.9 19.8 19.2 26.8 25.6 26.4 24.8
Minimum 24.2 21.1 16.2 15.6 21.5 21.4 21.5 18
Mean 25.97 23.00 17.04 17.34 23.41 23.47 24.01 20.11
98th percentile 28.4 25.2 18.75 19 26.35 25.5 26.4 23.15
NAAQ Norms 80 80 80 80 80 80 80 80
0.0
10.0
20.0
30.0
40.0
50.0
60.0
70.0
80.0
90.0
NO
2co
nce
ntr
ati
on
in
µg/m
³

Page | 85
Figure 3.20 Bar Chart Showing Maximum, Minimum, And the Average Concentrations of
Pollutants in The Atmosphere Within 10km Radius
3.3.6 Fugitive Dust Emission
Fugitive dust was recorded at 8 AAQ monitoring stations for 30 days during the study
period. The results are given in Tables 3.21.
Table 3.21 Average Fugitive Dust Sample Values
AAQ Locations Avg SPM (µg/m3)
AAQ 1 60.96 AAQ 2 58.82 AAQ 3 56.95 AAQ 4 56.35 AAQ 5 57.22 AAQ 6 54.28 AAQ7 54.96 AAQ 8 54.36
Source: Onsite monitoring/ sampling by Noida Testing Laboratories
Table 3.22 Fugitive Dust Sample Values
SPM
(µg/m3) AAQ1 AAQ2 AAQ3 AAQ4 AAQ5 AAQ6 AAQ7 AAQ8
Average 60.96 58.82 56.95 56.35 57.22 54.28 54.96 54.36
Min 59.3 57.6 55.3 54.6 54.2 53.3 52.6 52.3
Max 62.3 58.3 58.3 57.6 59.6 56.5 56.4 55.9
Source: Calculations from Lab Analysis Reports
PM2.5 PM10 SO2 NO2
Maximum 24.23 44.78 8.31 24.61
Minimum 20.38 40.80 6.08 19.94
Mean 22.29 42.66 7.14 21.79
98th percentile 24.07 44.53 8.29 24.09
NAAQ Norms 60 100 80 80
0.0
10.0
20.0
30.0
40.0
50.0
60.0
70.0
80.0
90.0
100.0
110.0Summary of Ambient Air Quality Datas ( AAQ1 - AAQ8)
Po
llu
tan
t c
on
cen
tra
tion
in
µg/m
³

Page | 86
Figure 3.21 Bar Chart Showing Minimum, Maximum, And the Average Concentrations
of SPM In the Atmosphere Within 10km Radius
3.3.7 Results & Discussion
As per the monitoring data, PM10 ranges from 35.8 µg/m3 to 46.8 µg/m3; PM2.5 from
22.5 µg/m3 to 26.9 µg/m3; SO2 from 5.1µg/m3 to 9.6 µg/m3; NO2 from 15.6 µg/m3 to 28.4
µg/m3. The concentration levels of the pollutants fall within the acceptable limits of NAAQS
prescribed by CPCB.
3.4 NOISE ENVIRONMENT
The vehicular movement on road and mining activities is the major sources of noise in
the study area, the environmental assessment of noise from the mining activity and vehicular
traffic can be undertaken by taking into consideration various factors like potential damage
to hearing, physiological responses, and annoyance and general community responses.
The main objective of noise monitoring in the study area is to establish the baseline
noise level and assess the impact of the total noise expected to be generated during the project
operations around the project sites.
3.4.1 Identification of Sampling Locations
In order to assess the ambient noise levels within the study area, noise monitoring was
carried out at eight (8) locations as shown in Table 3.23 and Figure 3.23, covering
commercial, residential, rural areas within the radius of 10km. A suitable noise monitoring
methodology was chosen to meet the purpose and objectives of the study.
Table 3.23 Details of Noise Monitoring Locations
AAQ1 AAQ2 AAQ3 AAQ4 AAQ5 AAQ6 AAQ7 AAQ8
Average 60.96 58.82 56.95 56.35 57.22 54.28 54.96 54.36
Min 59.3 57.6 55.3 54.6 54.2 53.3 52.6 52.3
Max 62.3 58.3 58.3 57.6 59.6 56.5 56.4 55.9
46
48
50
52
54
56
58
60
62
64
Avg SPM (µg/m3)

Page | 87
S. No Location
Code
Monitoring
Locations
Distance &
Direction Coordinates
1 N-1 Core Zone Project Area 12°32'54.35"N 78°12'32.32"E 2 N-2 Core Zone Near Project Area 12°32'55.83"N 78°12'17.93"E
3 N-3 Kallukurikki 500m North 12°33'30.04"N 78°12'41.14"E
4 N-4 Kondepalli 3.5km SW 12°32'48.22"N 78°10'18.39"E 5 N-5 Samanthamalai 2.8km NW 12°34'30.95"N 78°11'36.78"E 6 N-6 Karadiguri 3.5km NE 12°33'39.90"N 78°14'42.91"E 7 N-7 Peddatalapalli 3.5km SW 12°31'12.52"N 78°11'9.11"E 8 N-8 Peddanapalli 4.5km SE 12°31'16.46"N 78°14'50.70"E
Source: On-site monitoring/sampling by Noida Testing Laboratories in association with GTMS
3.4.2 Method of Monitoring
Digital Sound Level Meter was used for the study. All reading was taken on the ‘A-
Weighting’ frequency network at a height of 1.5 meters from ground level. The sound level
meter does not give a steady and consistent reading and it is quite difficult to assess the actual
sound level over the entire monitoring period. To mitigate this shortcoming, the Continuous
Equivalent Sound level indicated by Leq, is used. Equivalent sound level, ‘Leq’, can be
obtained from variable sound pressure level, ‘L’, over a time period by using following
equation. The equivalent noise level is defined mathematically as below:
Leq = 10 Log L / T∑ (10Ln/10)
Where L = Sound pressure level at function of time dB (A)
T = Time interval of observation
Measured noise levels, displayed as a function of time, is useful for describing the
acoustical climate of the community. Noise levels recorded at each station with a time interval
of about 60 minutes are computed for equivalent noise levels. Equivalent noise level is a
single number descriptor for describing time varying noise levels.
Figure 3.22 Noise level monitoring in core zone

Page | 88
Figure 3.23 Geo- Referenced Toposheet Showing Noise Level Monitoring Station Locations Around 10km Radius from The
Proposed Project Sites

Page | 89
3.4.3 Analysis of Ambient Noise Level in the Study Area
The Digital Sound pressure level has been measured by a sound level meter (Model:
HTC SL-1352). An analysis of the different Leq data obtained during the study period has
been made. Variation was noted during the day-time as well as night-time. The results are
presented in below Table 3.24 and Figures 3.24 & 3.25.
Day time: 6:00 hours to 22.00 hours.
Night time: 22:00 hours to 6.00 hours.
Table 3.24 Ambient Noise Quality Result
S.
No Locations
Noise level (dB (A)
Leq) Ambient Noise
Standards Day
Time
Night
Time
1 Core Zone 47.7 40.3 Industrial
Day Time- 75 dB (A)
Night Time- 70 dB (A)
2 Core Zone 46.9 37.4
Residential
Day Time– 55 dB (A)
Night Time- 45 dB (A)
3 Kallukurikki 46.1 38.5 4 Kondepalli 42.3 35.0 5 Samanthamalai 40.0 36.8 6 Karadiguri 36.5 39.7 7 Peddatalapalli 39.7 36.8 8 Peddanapalli 39.4 36.4
Source: On-site monitoring/sampling by Noida Testing Laboratories in association with GTMS
Figure 3.24 Bar Chart Showing Day Time Noise Levels Measured in Core and
Buffer Zones
N1-P1 N2-P2 N3 N4 N5 N6 N7 N8
Day Time (Db (A) Leq) 47.7 46.9 46.1 42.3 40 36.5 39.7 39.4
Standards 75 75 55 55 55 55 55 55
0
10
20
30
40
50
60
70
80
No
ise
Lev
el i
n d
B (
A)
Day Time Noise Level in Core and Buffer Zone
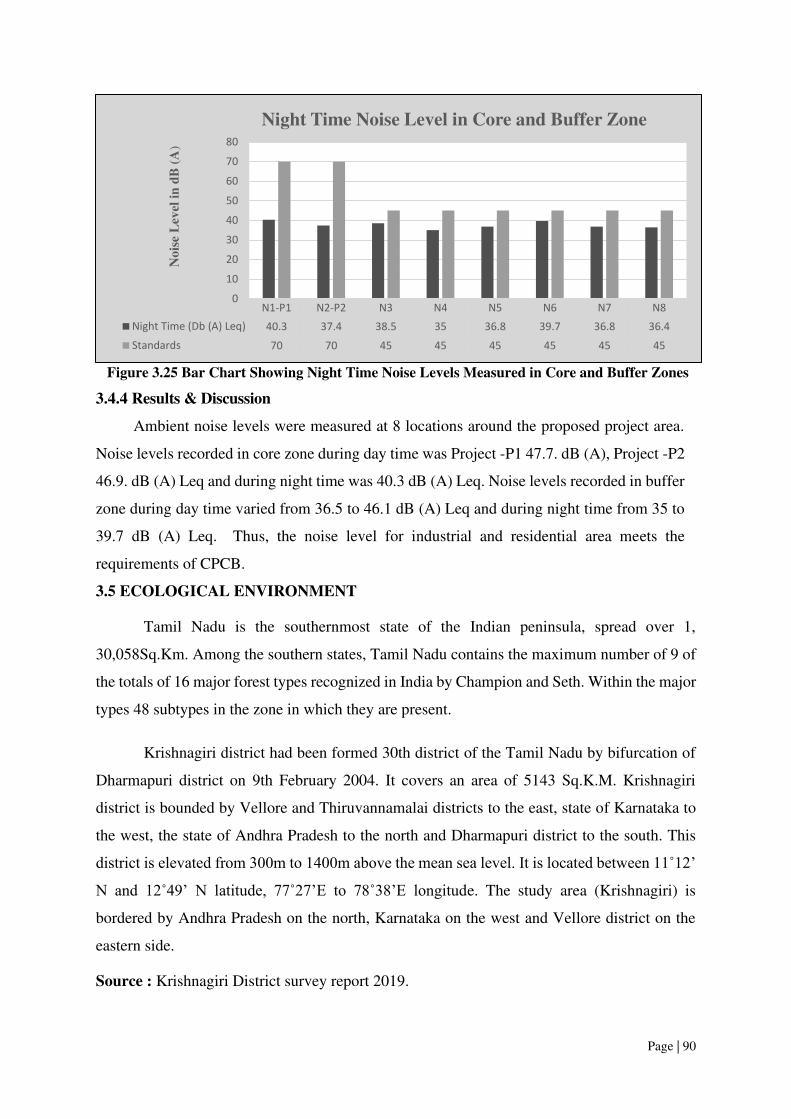
Page | 90
Figure 3.25 Bar Chart Showing Night Time Noise Levels Measured in Core and Buffer Zones
3.4.4 Results & Discussion
Ambient noise levels were measured at 8 locations around the proposed project area.
Noise levels recorded in core zone during day time was Project -P1 47.7. dB (A), Project -P2
46.9. dB (A) Leq and during night time was 40.3 dB (A) Leq. Noise levels recorded in buffer
zone during day time varied from 36.5 to 46.1 dB (A) Leq and during night time from 35 to
39.7 dB (A) Leq. Thus, the noise level for industrial and residential area meets the
requirements of CPCB.
3.5 ECOLOGICAL ENVIRONMENT
Tamil Nadu is the southernmost state of the Indian peninsula, spread over 1,
30,058Sq.Km. Among the southern states, Tamil Nadu contains the maximum number of 9 of
the totals of 16 major forest types recognized in India by Champion and Seth. Within the major
types 48 subtypes in the zone in which they are present.
Krishnagiri district had been formed 30th district of the Tamil Nadu by bifurcation of
Dharmapuri district on 9th February 2004. It covers an area of 5143 Sq.K.M. Krishnagiri
district is bounded by Vellore and Thiruvannamalai districts to the east, state of Karnataka to
the west, the state of Andhra Pradesh to the north and Dharmapuri district to the south. This
district is elevated from 300m to 1400m above the mean sea level. It is located between 11˚12’
N and 12˚49’ N latitude, 77˚27’E to 78˚38’E longitude. The study area (Krishnagiri) is
bordered by Andhra Pradesh on the north, Karnataka on the west and Vellore district on the
eastern side.
Source : Krishnagiri District survey report 2019.
N1-P1 N2-P2 N3 N4 N5 N6 N7 N8
Night Time (Db (A) Leq) 40.3 37.4 38.5 35 36.8 39.7 36.8 36.4
Standards 70 70 45 45 45 45 45 45
0
10
20
30
40
50
60
70
80
No
ise
Lev
el i
n d
B (
A)
Night Time Noise Level in Core and Buffer Zone

Page | 91
Forestry in Krishnagiri District
The major types of forest seen here are tropical, deciduous, thorny shrubs and bamboo
forests. Dense forest cover is at Denkanikottai region. The forests falling in Denkanikottai taluk
have been declared as ‘Elephant Reserve’ during 2003. The other region contains shrubs, hills
and hillocks with bushes. In the past, the forests of Krishnagiri district were well known for its
valuable sandal wood since the days of Tipu Sultan.
The forests of the district are forming part of the Eastern Ghats. The major hills are
known by the name Melagiri and Baramahal. The forest cover of the district extends over 1482
sq.kms, constitutes 28% of the area under forests in the district, forming catchment for the
important rivers like Cauvery and Chinnar. For the ecological importance of the hills and
forests, the district is known for its eco-tourism potential. The forests are managed for the
ecological and environmental benefits by strict protection through implementation of Tamil
Nadu Forest Act , 1982, Wildlife Protection Act, 1972, and Forest Conservation Act, 1980.
Since 1997, through Joint Forest Management, the degraded forests are being upgraded by
implementation of scheme like Tamil Nadu Forest Afforestation Project.
Source: Krishnagiri District Census Handbook - 2011
Flora and Fauna in Krishnagiri District
As the district is mountain terrain, the flora and fauna in the district are rich. The flora
include a variety of timber trees like Rose wood, Teak, Sandal, Bamboo, Charakkonnai, and
hundreds of medicinal herbs, minor forest plants like Nelli, Kadukkai, Cheekai, Pungam etc.
Pungam oil is extracted from the seeds of pungam tree, creating a non-polluting bio-fuel. The
fruit trees like tamarind, mango and lime are widely spread over in this district. Krishnagiri
district is the first place in the production of different types of Mangoes in Tamil Nadu. Almost\
20% of the mango varieties like ‘Thothapuri’ and ‘Alphonso’ that are produced in this district,
are processed into pulp.The Hosur roses are exported internationally.
The major wild animals include Elephants, Sambar, Spotted Deer, Gaur, Wild boar,
Panther, etc. The forest area of Denkanikottai taluk forms the prime elephant habitat with lot
of bamboos and this area constitutes the Cauvery Elephant Reserve. The bird population is also
attractive with beautiful birds like the Paradise flycatcher. Big lakes in Anchetti and Hosur
areas also attract large number of migratory birds like Painted storks, Teals etc. In addition to
these birds and mammals, there are variety of butterflies, giant spiders etc. that are coming
under endangered list. Kodakkarai shoal forest in Denkanikottai taluk is known for large scale

Page | 92
migratory butterflies during a particular season. During this period, one can observe thousands
of migratory butterflies passing through this forest like a passing cloud.
3.5.1 INTRODUCTIONS
Ecology is a branch of science which dealing the relations and interactions between
organisms and their environment. An ecological survey of the study area was conducted,
particularly with reference to listing of species and assessment of the existing baseline
ecological conditions in the study area. The main objective of biological study is to collect the
baseline data regarding flora and fauna in the study area. Data has been collected through
extensive survey of the area with reference to flora and fauna. Information is also collected
from different sources i.e. government departments such as District Forest Office, Government
of Tamil Nadu. On the basis of onsite observations as well as forest department records the
checklist of flora and fauna was prepared.
3.5.2 Scope Of Work
Scope of work for this study includes identification of ecologically sensitive receptors,
based on literature survey, field investigations and their mitigation with conservation action
plan. The study was carried out in the core as well as buffer zone of the Proposed Rough stone
quarry. The study was carried out systematically and scientifically using primary and secondary
data in order to bring out factual information on the ecological conditions of the mine site and
10 km radius study area.
The study involved assessment of general habitat type, vegetation pattern, preparation
of inventory of flora and fauna of terrestrial ecosystem within 10 km radius from the boundary
of Proposed Mine site. Biological assessment of the site was done to identify ecologically
sensitive areas and whether there are any rare, endangered, endemic or threatened (REET)
species of flora & fauna in the core area as well its buffer zone to be impacted. The study also
designed to suggest suitable mitigation measures if necessary for protection of wildlife habitats
and conservation of REET species if any.
Study area Ecology
The proposed Projects core area extent of 4.90.0 Ha of Rough stone quarry has an
impact on diversity of flora and fauna of surrounding area but present work was carried out on
detailed study of the impacts of Rough stone quarry on ecology and biodiversity of core lease
area with the proper mitigation and sustainable management plan. The quarry lease applied
area is a plain topography whereas in buffer zone some places agricultural land is dominated.

Page | 93
The following methods were applied during the baseline study of flora, fauna and diversity
assessment.
3.5.3 Objectives of Biological Studies
The present study was undertaken with the following objectives:
a. To study the likely impact of the proposed mining project on the local biodiversity and
to suggest mitigation measure, if required, for vulnerable biota.
b. To assess the nature and distribution of vegetation (Terrestrial and Aquatic) in and
around the mining activity.
c. Detail of flora and fauna, Endemic, Rare, Endangered and Threatened (RET Species)
separately for core and buffer area based on such primary field survey and clearly
indicating the Schedule of fauna present. In case of any schedule- I fauna found in the
study area, the necessary plan along with budgetary provisions for their conservation
should be prepared in consultation with State Forest and Wildlife Department and
details furnished.
d. Devise management & conservation measures for biodiversity.
3.5.3.1 Methodology of Sampling
The present study was carried out in given steps
1. Field survey was conducted by visual encounter survey for flora present within the 10
km radius study area of proposed mine site.
2. After surveying the core and buffer areas, a detailed floral inventory has been compiled.
List of all plants of the study area was prepared and their habitats were recorded.
3. Verification of Rare, Endangered and Threatened Flora species from IUCN Red Data
Book.
4. Selection of sampling locations was made with reference to topography, land use,
vegetation pattern, etc. The observations were taken on natural vegetation, roadside
plantation and nonforest area (agricultural field, in plain areas, Village wasteland, etc.)
for quantitative representation of different species.
A methodology of Sampling Flora and fauna studies were carried out during the winter
season to assess the list of terrestrial plant and animal species that occur in the core area and
the buffer area up to 10 km radius from the project site. No damage is created to flora and fauna
during the sampling.

Page | 94
In order to provide representative ecological status for the study area, the 10-km buffer
zone has been divided into four quartiles for biodiversity sampling, i.e., NE (Quartile-1), NW
(Quartile-2) SW (Quartile-3) and SE (Quartile-4). Each of the quartiles have been examined
for representative flora on randomly sampled quadrats for trees (20x20-m), shrubs (10x10-m)
and herbs (2x2-m) depending upon prevailing geographical conditions and bio-diversity
aspects of study area.
3.5.4 Quadrats method
Quadrats of 20 × 20-m were laid down randomly within core and 5-km buffer area;
each quadrat was laid to assess the trees (>5 cm GBH) and one, 10 × 10-m sub-quadrat nested
within the quadrat for shrubs. The quadrats were laid randomly to cover the area to maximize
the sampling efforts and minimize the species homogeneity, such as small stream area, trees in
agricultural bunds, tank bunds, farm forestry plantations, wildlife areas, natural forest area,
avenue plantations, house backyards, etc. In each quadrat individuals belonging to tree (20 ×
20-m) and shrub (10 × 10-m) were recorded separately and have been identified on the
field.quadrates sampling methods is given in Fig no 3.26
Figure 3.26 A Schematic diagram of random sampling of flora
3.5.4.1 Flora
Flora study was conducted using the above said methodology to inventory the existing
terrestrial plants in both core and buffer zones. Details of plants have been described in the
succeeding sections.

Page | 95
3.5.4.2 Flora in Core Zone
Taxonomically a total of 17 species belonging to 14 families have been recorded from
the core mining lease area. Based on habitat classification of the enumerated plants the majority
of species were tree 5 (29%) followed by herbs 5 (29%), Shrubs 4 (24%), and Climber 2 (12%),
Cactus one 1 (4%). Details of flora with the scientific name were mentioned in Table.3.25 The
result of core zone of flora studies shows that Fabaceae and Cactaceae are the main dominating
species in the study area it mentioned in Table.3.25 and the details of diversity of flora family’s
pattern are given in Fig.3.27 No species found as threatened category (Table No. 3.25)
3.5.4.3 Flora in Buffer Zone
Similar type of environment also in buffer area but with more flora diversity compare
than core zone area, because of nearby agriculture land was found to be dominate in all the
directions. Majority of the flat landscape around project unit is occupied by agriculture fields.
It contains a total of 94 species belonging to 44 families have been recorded from the buffer
zone. The floral (94) varieties among them thirty-seven Trees 37 (39%) Nineteen Herbs 19
(20%) and fourteen shrubs 14 (14%) and Climbers eleven 11 (12%), Five Creeper 5 (5%),
Three Grass 7 (8%), one Cactus 1 (1%) were identified. The result of buffer zone of flora
studies shows that Poaceae and Fabaceae, Euphorbiaceae are the main dominating species in
the study area it mentioned in Table.3.26
There is no Rare, Endangered and Threatened Flora species in mining area and their
surrounding area. Details of flora with the scientific name were mentioned in Table.3.26. The
diversity of flora families is given in Fig.3.28
However, the information required as per the Standard Terms of Reference (ToR)
Tor No: 10. Land use of the study area delineating forest area, agricultural land, grazing
land, wildlife sanctuary, National Park, migratory routes of fauna, water bodies, human
settlements and other ecological features should be indicated. Land use plan of the mine
lease area should be prepared to encompass preoperational, operational and post
operational phases and submitted. Impact, if any, of change of land use should be given.
The mine lease area is exhibiting undulated terrain. The area has gentle sloping towards
North-eastern cover. There are no protected or ecologically sensitive areas such as the Wildlife
sanctuaries or National parks or Important Bird Areas (IBAs), or Wetlands or migratory routes
of fauna or water bodies or human settlements within the proposed mine lease area. Even in
the 10 Km buffer zone around the mine lease area, there are no reserve forests nearby project
site. Hence, no certificate from the Forest department is required. No Biosphere reserves or

Page | 96
wildlife sanctuaries or National parks or Important Bird Areas (IBAs), or migratory routes of
fauna. Thus, the area under study (Mine lease area and the 10 Km buffer zone) is not
ecologically sensitive.
Tor No: 12) A Certificate from the Competent Authority in the State Forest Department
should be provided, confirming the involvement of forest land, if any, in the project area.
In the event of any contrary claim by the Project Proponent regarding the status of
forests, the site may be inspected by the State Forest Department along with the Regional
Office of the Ministry to ascertain the status of forests, based on which, the Certificate in
this regard as mentioned above be issued. In all such cases, it would be desirable for
representative of the State Forest Department to assist the Expert Appraisal Committees.
There are neither reserved (RF) nor protected (PF) forests either in the mine lease area
or in the buffer zone. Thus, no forest land is involved in any manner. Hence, no certificate from
the Forest department is required. (Please refer Annexure).
Tor No: 13) Status of forestry clearance for the broken-up area and virgin forestland
involved in the Project including deposition of net present value (NPV) and compensatory
afforestation (CA) should be indicated. A copy of the forestry clearance should also be
furnished.
As stated earlier, no forest land is involved in the proposed project. Hence, no certificate
from the Forest department is required.
Tor No: 14) Implementation status of recognition of forest rights under the Scheduled
Tribes and other Traditional Forest Dwellers (Recognition of Forest Rights) Act, 2006
should be indicated.
There are neither forests nor forest dwellers nor forest dependent communities in the
mine lease area. There shall be no forest impacted families (PF) or people (PP). Thus, the rights
of Traditional Forest Dwellers will not be compromised on account of the project.
Tor No: 15) The vegetation in the RF / PF areas in the study area, with necessary details,
should be given.
There are neither reserved forests (RF) nor Protected Forests (PF) in the study area.
There is no reserve forest nearby study area. Hence, no certificate from the Forest department
is required. Detailed list of flora found in the mine lease area and the buffer zone have been
collected during September 2021 (Rainy Season) based on primary survey. In each quadrat
individuals belonging to tree (20 × 20-m) and shrub (10 × 10-m) were recorded separately and
have been identified on the field. Quadrates sampling methods is given in Figures 3.26. But no
quadrat analysis was done in seasonal crop lands. Vegetation and flora of the Mine lease area
is given in below Table.3.25

Page | 97
Table No: 3.25 Flora Species in Core Zone
S.No English Name Vernacular Name Scientific Name Family Name
Trees
1 Mesquite Velikathan maram Prosopis juliflora Fabaceae
2 Neem Vembu Azadirachta indica Meliaceae
3 Millettia pinnata Pongam oiltree Pongamia pinnata Fabaceae
4 Noni Nuna maram Morinda citrifolia Rubiaceae
5 Acacia Nilotica Karuvelam maram Vachellia nilotica Fabaceae
Shrubs
1 Touch-me-not Thottalchinungi Mimosa pudica Mimosaceae
2 Milk Weed Erukku Calotropis gigantea Apocynaceae
3 Wild sage Unichedi Lantana camara Verbenaceae
4 Columnar Cactus Sippaai kathaalai Cereus pterogonus Cactaceae
Herbs
1 Common leucas Thumbai Leucas aspera Lamiaceae
2 Common nut sedge Korai Cyperus rotundus Cyperaceae
3 Mountain knotgrass Poolai poondu Aerva lanata Amaranthaceae
4 Indian doab Arugampul Cynodon dactylon Poaceae
5 Devil ‘s thorn Nerunji Tribulus terrestris Zygophyllales
Climbers
1 Slender dwarf morning-
glory
Vishnukrandi Evolvulus alsinoides Convolvulaceae
2 Stemmed vine Perandai Cissus quadrangularis Vitaceae
Cactus
1 Prickly pear Nagathali Opuntia dillenii Cactaceae

Page | 98
Table No: 3.26 Flora Species in Buffer Zone
Sl.No English Name Vernacular Name Scientific Name Family Name Resource use type
*(E, M, EM)
Trees
1 Acacia Nilotica Karuvelam maram Vachellia nilotica Fabaceae M
2 Neem or Indian lilac Vembu Azadirachta indica Meliaceae M
3 Millettia pinnata Pongam oiltree Pongamia pinnata Fabaceae E
4 Indian fir tree Nettilinkam Polylathia longifolia Annonaceae E
5 Coconut Thennai maram Cocos nucifera Arecaceae EM
6 Peepal Arasanmaram Ficus religiosa Moraceae M
7 Tamarind Puliyamaram Tamarindus indica Legumes EM
8 Lemon Ezhumuchaipalam Citrus lemon Rutaceae EM
9 Indian fig tree Athi Ficus recemosa Moraceae EM
10 Banana tree Vazhaimaram Musa Musaceae EM
11 Chebulic myrobalan Kadukkai Terminalia chebula Combretaceae M
12 Indian fir tree Nettilinkam Polylathia longifolia Annonaceae E
13 Jack fruit Palamaram Artocarpus heterophyllus Moraceae E
14 Giant thorny bamboo Perumungil Bambusa bambos Poaceae M
15 Cutch tree Karungali Acacia sundra Legumes M
16 Manilkara zapota Sapota Manilkara zapota Sapotaceae E
17 Eucalyptus Eucalyptus Eucalyptus globules Myrtaceae EM
18 Black plum Navalmaram Sygygium cumini Myrtaceae EM

Page | 99
19 Gum arabic tree Karuvelam Acacia nilotica Mimosaceae NE
20 Banyan tree Alamaram Ficus benghalensis Moraceae E
21 Asian Palmyra palm Panai maram Borassus flabellifer Arecaceae E
22 Teak Thekku Tectona grandis Verbenaceae E
23 Indian gooseberry Nelli Emblica officinalis Phyllanthaceae EM
24 Castor oil plant Amanakku Ricinus communis Euphorbiaceae M
25 Beauty leaf Punnai Calophyllu inophyllum Calophyllaceae M
26 Mango Manga Mangifera indica Anacardiaceae E
27 Creamy Peacock Flower Vadanarayani Delonix elata Fabaceae M
28 Henna Marudaani Lawsonia inermis Lythraceae EM
29 Haldina cordifolia Manja kadambai Adina cordifolia Rubiaceae M
30 Papaya Pappali maram Carica papaya L Caricaceae EM
31 Chinese chaste tree Nochi Vitex negundo Verbenaceae E
32 Indian bael Vilvam Aegle marmelos Rutaceae EM
33 Noni Nuna maram Morinda citrifolia Rubiaceae M
34 Guava Koyya Psidium guajava Myrtaceae EM
35 Custard apple Seethapazham Annona reticulata Annonaceae E
36 Curry tree Velipparuthi Murraya koenigii Asclepiadaceae EM
37 Bamboo Moonghil Bambusa bambo Poaceae E
Shrubs
1 Flame of the Woods Idlipoo xoracoc cinea Rubiaceae M
2 Night shade plan Sundaika Solanum torvum Solanaceae EM

Page | 100
3 Indian mallow Thuthi Abutilon indicum Meliaceae M
4 Indian Oleander Arali Nerium indicum Apocynaceae M
5 Touch-me-not Thottalchinungi Mimosa pudica Mimosaceae M
6 Hygrophila spinosa Neermulli Hydrophila auriculata Acanthaceae M
7 Ceylon Date Palm Icham Phoenix pusilla Arecaceae EM
8 Triangular spruge Chaturakalli Euphorbia antiquorum Euphorbiaceae NE
9 Puriging nut Kattamanakku Jatropha curcas Euphorbiaceae EM
10 Avaram Avarai Senna auriculata Fabaceae M
11 Shoe flower Chemparuthi Hibiscu rosa-sinensis Malvaceae EM
12 Rosary pea Kundumani Abrus precatorius Fabaceae M
13 Milk Weed Erukku Calotropis gigantea Apocynaceae M
14 Columnar Cactus Sappathikalli Cereus pterogonus Cactaceae M
Herbs
1 Prickly chaff flower Nayuruv Achyranthes aspera Amaranthaceae M
2 Tridax daisy Veetukaayapoondu Tridax procumbens Asteraceae M
3 Common leucas Thumbai Leucas aspera Lamiaceae M
4 Jointed flatsedge Koraikkilangu Cyperus articulates Cyperaceae M
5 Cleome viscosa Nai kadugu Celome viscosa Capparidaceae M
6 Turmeric's Manjal Curcuma longa Zingiberaceae EM
7 Elephant-ear Chempu Colocasia indica Araceae EM
8 Holy basil Thulasi Ocimum tenuiflorum Lamiaceae M
9 Common nut sedge Korai Cyperus rotundus Cyperaceae NE

Page | 101
10 Poor land flatsedg Kunnakora Cyperus compressus Cyperaceae NE
11 Chili Milagai Capsicum frutescens Solanaceae EM
12 Benghal dayflower Kanamvazha Commelina benghalensis Commelinaceae M
13 False daisy Karisilanganni Eclipta prostata Asteraceae EM
14 Carrot grass Parttiniyam Parthenium hysterophorus Asteraceae NE
15 Red Hogweed Mukurattai Boerhavia diffusa Nyctaginaceae M
16 Indian Copperleaf Kuppaimeni Acalypha indica Euphorbiaceae M
17 Indian doab Arugampul Cynodon dactylon Poaceae E
18 European black
nightshade
Manathakkali Solanum nigrum Solanaceae EM
19 Vigna mungo Ulunthu Vigna mungo Fabaceae EM
Climber
1 Ivy gourd Kovai Coccinia grandis Cucurbitaceae M
2 Indian sarsparilla Nannari Hemidesmus indicus Asclepiadaceae M
3 Stemmed vine Perandai Cissus quadrangularis Vitaceae M
4 Butterfly pea Karkakartum Clitoria ternatea Fabaceae M
5 Betel Vetrilai Piper betle Piperaceae EM
6 Bottle Guard Sorakkai Lagenaria siceraria Cucurbitaceae EM
7 Pointed gourd Kovakkai Trichosanthes dioica Cucurbitaceae EM
8 Butterfly-pea Sangupoo Clitoria ternatia Fabaceae M
9 Wild jasmine Malli Jasminum augustifolium Oleaceae EM

Page | 102
10 Balloon vine Mudakkotan Cardiospermum
helicacabum
Sapindaceae M
11 Mukia maderaspatana Musumusukkai Mukia maderaspatana Cucurbitaceae M
Creeper
1 Water spinach Vallikeerai Ipomoea aquatica Convolvulaceae EM
2 Grona triflora Siru puladi Desmodium triflorum Fabaceae EM
3 Ground Spurge Sithrapaalavi Euphorbia prostrata Euphorbiaceae EM
4 Nut grass Korai Cyperus rotandus Poaceae M
5 Creeping-oxeye Malai mookuthi
poondu
Wedelia trilobata Asteraceae M
Grass
1 Jungle rice Kuthirai vaal Kattu
arusi
Echinochloa colona Poaceae NE
2 Eragrostis Pullu Eragrostis ferruginea Poaceae E
3 Corn Solam Zea Poaceae E
4 Asian rice Nellu Oryza sativa Poaceae E
5 Sorghum Gambu Sorghum Poaceae E
6 Finger millet Kezhvaragu Eleusine coracana Poaceae EM
7 Windmill grass Chevvarakupul Chloris barbata Amaranthaceae NE
Cactus
1 Prickly pear Nagathali Opuntia dillenii Cactaceae M
*E- Economical, M- Medicinal, EM- Both Economical and Medicinal, NE- Not evaluated.

Page | 103
3.5.4.4 AQUATIC VEGETATION
The field survey for assessing the aquatic vegetation was also undertaken during the
study period. The list of aquatic plants observed in the study area is given in Table 3.27
Table No: 3.27 List of aquatic plants observed in the study area
Sl.No Scientific name Common Name Vernacular
Name (Tamil)
IUCN Red List of
Threatened Species
1 Eichornia crassipe Water hyacinth Agayatamarai NA
2 Nymphaea nauchali Blue lotus Alli LC
3 Nymphaea nouchali Blue water lily Nellambal LC
4 Carex cruciata Cross Grass Koraipullu NA
5 Hydrilla verticillata Waterthymes Amiranappaci LC
6 Cynodon dactylon Scutch grass Arugampul LC
7 Cyperus exaltatus Tall Flat Sedge Koraikizhangu LC
8 Nelumbo nucifera Sacred lotus Chenthaamarai LC
*LC- Least Concern, NA-Not yet assessed
3.4.1.2. List out endangered and endemic species as per the schedule of the Wildlife
Protection Act 1972
3.5.4.5 Rare and Endangered Flora in the Study Area
The IUCN Red List is the world's most comprehensive inventory of the global
conservation status of plant and animal species. It uses a set of criteria to evaluate the extinction
risk of thousands of species and subspecies. These criteria are relevant to all species and all
regions of the world. With its strong scientific base, the IUCN Red List is recognized as the
most authoritative guide to the status of biological diversity. Among the enumerated flora in
the study area, none of them were assigned any threat category.
3.5.4.6 Endemic Plants of the Study Area
De Candolle (1855) first used the concept of “Endemic”, which is defined as an area
of a taxonomic unit, especially a species which has a restricted distribution or habitat, isolated
from its surrounding region through geographical, ecological or temporal barriers. Among
recorded plant species none are assigned the status of endemic plant of this region.

Page | 104
3.5.4.7 Enlistment of Vegetation in the buffer zone and core zone
1. Trees:
The species enlisted from the buffer zone and core is given in the Table:3.25- Table:
3.26) The common species are those which are useful to the human beings. The species
commonly found are Mangifera indica, Madhuca longifolia, Tamarindus indica, Artocarpus
heterophyllus, Ficus religiosa, Psidium guajava, Azadirachta indica, etc.,
2. National Parks/Sanctuaries
As per Ministry of Environment & Forests Notifications and local forest notifications,
there are no wildlife/bird sanctuaries/national parks/ biospheres in 10-km radius from mining
lease site.
3. Biodiversity Hotspots
A biodiversity hotspot is a biogeographic region with a significant reservoir of
biodiversity that is under threat from humans. There is no any hotspot nearby study area.
4. Reserved Forest / Forest / Social Forest / wild life sanctuary etc.
There are no PF and National park, Wild life sanctuary, Ramsar site, Wildlife Corridors,
Tiger/Elephat Reserves, Biosphere Reserves are located near to mining lease area. Hence it is
not coming under any violation.
Cropping Pattern
A variety of fruits and vegetables are cultivated in Krishnagiri. The important crops of
this district are Paddy, Maize, Ragi, Banana, Sugarcane, Cotton, Tamarind, Coconut, Mango,
Groundnut, Vegetables and Flowers. The land is very fertile and there is significant access to
fresh water. Roses are also grown in large numbers. Hosur is popular for cultivation of a variety
of roses.
Agriculture
Agriculture development is the key to poverty alleviation and development of rural
areas. The district has an excellent scope for agri-business. Regional Agricultural Research
Centre of Tamil Nadu Agricultural University is functioning efficiently at Paiyur in
Kaveripattinam union since 1973 AD. This centre is functioning in 18.5 hectares of land. It
helps the peasants to develop and adopt the modern technique of cultivation. It has developed
hybrid seeds by research which yields more with good quality this district is the largest
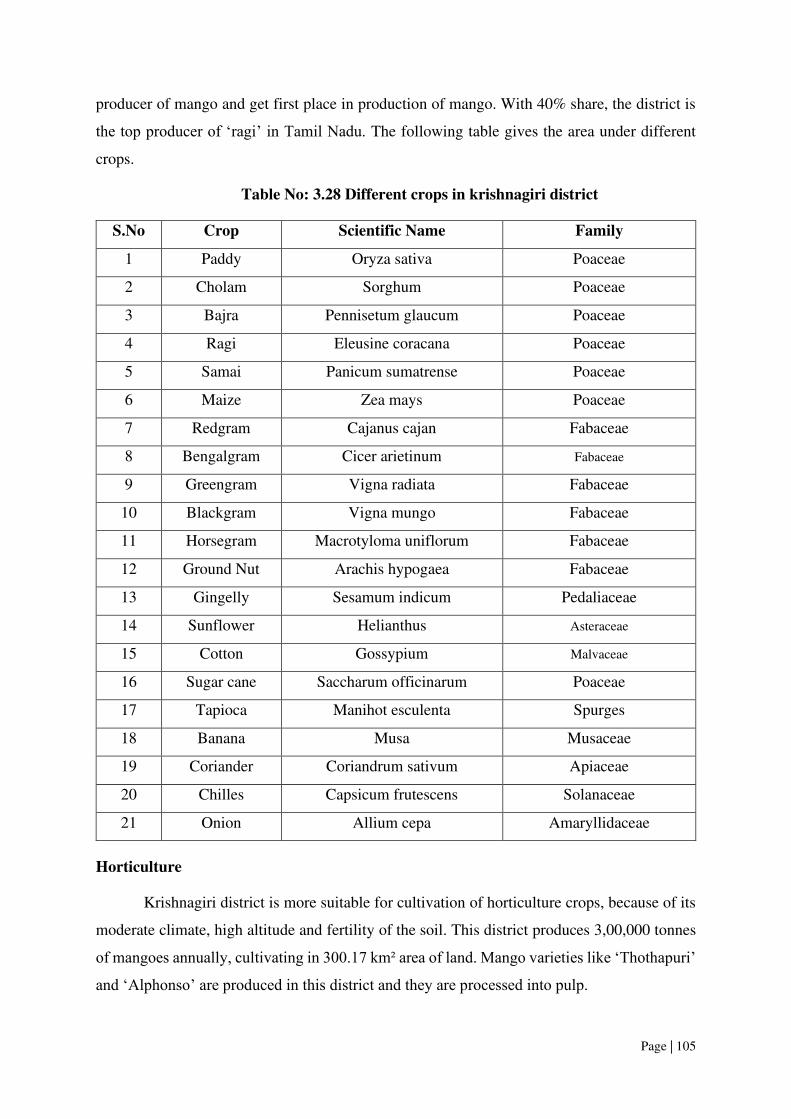
Page | 105
producer of mango and get first place in production of mango. With 40% share, the district is
the top producer of ‘ragi’ in Tamil Nadu. The following table gives the area under different
crops.
Table No: 3.28 Different crops in krishnagiri district
S.No Crop Scientific Name Family
1 Paddy Oryza sativa Poaceae
2 Cholam Sorghum Poaceae
3 Bajra Pennisetum glaucum Poaceae
4 Ragi Eleusine coracana Poaceae
5 Samai Panicum sumatrense Poaceae
6 Maize Zea mays Poaceae
7 Redgram Cajanus cajan Fabaceae
8 Bengalgram Cicer arietinum Fabaceae
9 Greengram Vigna radiata Fabaceae
10 Blackgram Vigna mungo Fabaceae
11 Horsegram Macrotyloma uniflorum Fabaceae
12 Ground Nut Arachis hypogaea Fabaceae
13 Gingelly Sesamum indicum Pedaliaceae
14 Sunflower Helianthus Asteraceae
15 Cotton Gossypium Malvaceae
16 Sugar cane Saccharum officinarum Poaceae
17 Tapioca Manihot esculenta Spurges
18 Banana Musa Musaceae
19 Coriander Coriandrum sativum Apiaceae
20 Chilles Capsicum frutescens Solanaceae
21 Onion Allium cepa Amaryllidaceae
Horticulture
Krishnagiri district is more suitable for cultivation of horticulture crops, because of its
moderate climate, high altitude and fertility of the soil. This district produces 3,00,000 tonnes
of mangoes annually, cultivating in 300.17 km² area of land. Mango varieties like ‘Thothapuri’
and ‘Alphonso’ are produced in this district and they are processed into pulp.

Page | 106
There are about 150 mango nurseries which produce mango saplings in and around
Santhur village. The district exports mango based products worth over 8 billion. Under the
horticulture development program, government owned horticulture farms are functioning here.
Through these farms, about 3,00,000 fruit saplings are produced and distributed under different
schemes. Majority of the people in the district is employed through mango cultivation and work
in labourer. Almost 20% of the industries located in this district are engaged in mango
processing. Apart from production and export, Krishnagiri also hosts Mango exhibition every
year which is the unique in its kind in line with the annual exhibition held at New Delhi.
Table No: 3.29 List of Horticulture cultivation
S.No Name of the crop Scientific name Family
1 Banana Musa Musaceae
2 Mango Mangifera indica Anacardiaceae
3 Onion Allium cepa Amaryllidaceae
4 Chilies Capsicum frutescens Solanaceae
5 Tapioca Manihot esculenta Spurges
Irrigation
Cauvery, Then Pennar and Kattar are the main rivers that flow through the district.
Krishnagiri Reservoir Project, Shoolagiri-Chinnar Reservoir, Thangarai Reservoir, Pambar
Reservoir, Kelevarapalli Reservoir Project and Baarur Tank are other sources of irrigation in
this district. By all these water reservoirs 18,965 hectares of land is irrigated.
The district has 4 Reservoir, 109 Canals of 137 kms in length, 8599 tube wells, 1327
tanks, 57355 wells for irrigation purpose and 5801 wells for domestic purpose. According to
the Village Records, 48894 hectares of land is irrigated. Of this irrigated land, 5951.6 hectares
of land is irrigated by canals, 288885.7 hectares of land is irrigated by wells/tube wells and
12560.5 hectares of land is irrigated by tanks. The Public Works Department and Panchayat
union tanks, ponds and water supply channels plays an important role in the irrigation of land
in this district.
3.5.5 FAUNA
The faunal survey has been carried out as per the methodology cited and listed out
Mammals, birds, Reptiles, Amphibians and Butterflies. All the listed species were compared

Page | 107
with Red Data Book and Indian Wildlife Protection Act, 1972. There are no rare, endangered,
threatened (RET) and endemic species present in core area.
3.5.5.1 Fauna methodology
The study of fauna takes substantial amount of time to understand the specific faunal
characteristics of the area. The assessment of fauna has been done on the bases of primary data
collected from the lease sites. The presence was also confirmed from the local inhabitants
depending on the animal sightings and the frequency of their visits in the project area. In
addition, officials, local peoples were another source of information for studying the fauna of
the area. Field activities are physical/active search, covering rocks, burrows, hollow inspection
and location of nesting sites and habitat assessment etc. Taxonomical identification was done
by the field guide book and wildlife envis data base (wiienvis.nic.in/Database/Schedule Species
Database) and Zoological Survey of India (ZSI). Detailed faunas’ methodology is mentioned
in the Table. 3.30.
Table No: 3.30 Methodology applied during survey of fauna
S.No Taxa Method of Sampling References
1 Insects
Random walk, Opportunistic
observations
Pollard (1977);
Kunte (2000)
2 Reptiles Visual encounter survey (Direct Search)
Daniel J.C (2002) 3 Amphibians Visual encounter survey (Direct Search)
4 Mammals Tracks and Signs Menon V (2014)
5 Avian Random walk, Opportunistic
observations
Grimmett R (2011);
Ali S (1941)
3.5.5.2 Fauna in Core Zone
A total of 24 varieties of species observed in the Core zone of Kothapetta village, rough
stone quarry (Table.3.31) among them numbers of Insects 7 (29%), Reptiles 5 (21%),
Mammals 3 (13%) and Avian 9 (37%). A total of 24 species belonging to 17 families have
been recorded from the core mining lease area. Number of species decreases towards the
mining area this might be due the lack of vegetation. None of these species are threatened or
endemic. There is no Schedule I species and nine species are under schedule IV according to
Indian wild life Act 1972. A total nine species of bird were sighted in the mining lease area.
There are no critically endangered, endangered, vulnerable and endemic species were
observed. A detail of fauna diversity of family’s pattern is given in Figures 3.29
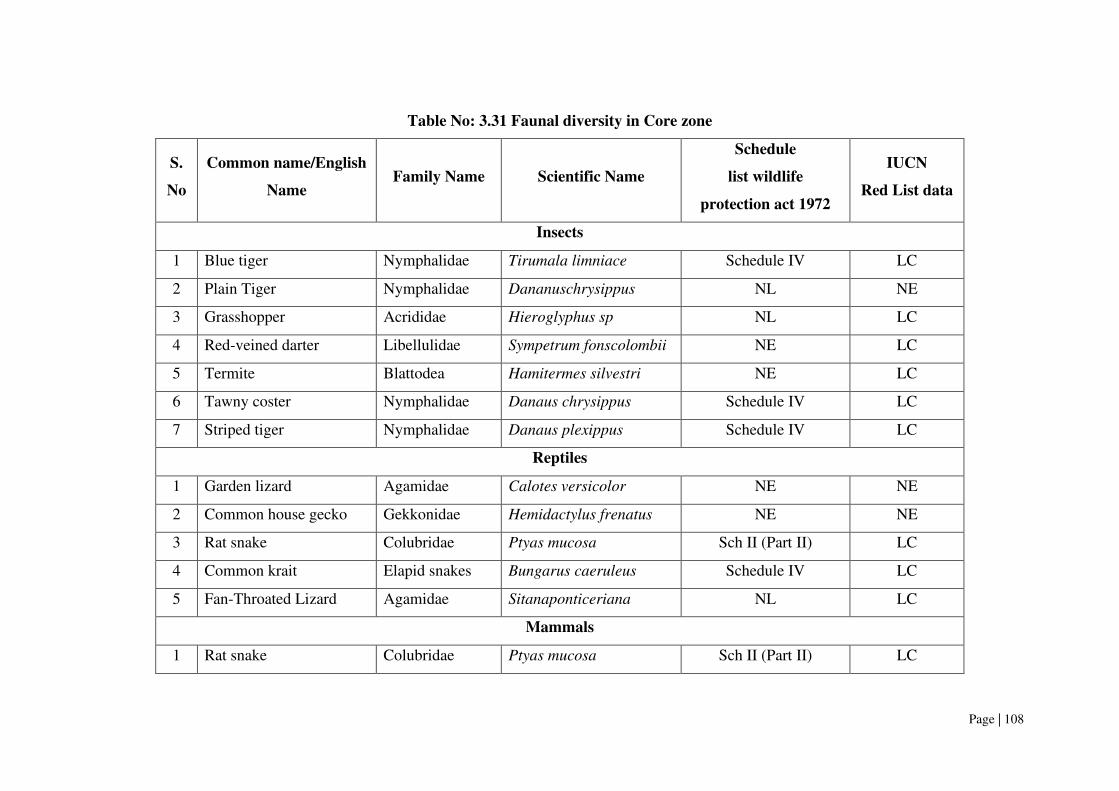
Page | 108
Table No: 3.31 Faunal diversity in Core zone
S.
No
Common name/English
Name Family Name Scientific Name
Schedule
list wildlife
protection act 1972
IUCN
Red List data
Insects
1 Blue tiger Nymphalidae Tirumala limniace Schedule IV LC
2 Plain Tiger Nymphalidae Dananuschrysippus NL NE
3 Grasshopper Acrididae Hieroglyphus sp NL LC
4 Red-veined darter Libellulidae Sympetrum fonscolombii NE LC
5 Termite Blattodea Hamitermes silvestri NE LC
6 Tawny coster Nymphalidae Danaus chrysippus Schedule IV LC
7 Striped tiger Nymphalidae Danaus plexippus Schedule IV LC
Reptiles
1 Garden lizard Agamidae Calotes versicolor NE NE
2 Common house gecko Gekkonidae Hemidactylus frenatus NE NE
3 Rat snake Colubridae Ptyas mucosa Sch II (Part II) LC
4 Common krait Elapid snakes Bungarus caeruleus Schedule IV LC
5 Fan-Throated Lizard Agamidae Sitanaponticeriana NL LC
Mammals
1 Rat snake Colubridae Ptyas mucosa Sch II (Part II) LC

Page | 109
2 Rat Murids Rattusrattus Schedule IV LC
3 Indian Field Mouse Muridae Mus booduga Schedule IV LC
Avian
1 Asian green bee-eater Meropidae Meropsorientalis NL LC
2 Black drongo Dicruridae Dicrurus macrocercus NE LC
3 Koel Cucalidae Eudynamys scolopaceus Schedule IV LC
4 Common cuckoo Cucalidae Cuculus canorus NE LC
5 Common myna Sturnidae Acridotheres tristis NE LC
6 Crow Pheasant Cucalidae Centropus sinensis Schedule IV LC
7 Rose-ringed parakeet Psittaculidae Psittacula krameri Schedule IV LC
8 House crow Corvidae Corvus splendens NE LC
9 Cattle egret Ardeidae Bubulcus ibis NE LC
*NE- Not evaluated; LC- Least Concern, NT –Near Threatened, T-Threatened

Page | 110
3.5.5.3 Fauna in Buffer Zone
Taxonomically a total of 53 species belonging to 37 families have been recorded from
the buffer zone area. Based on habitat classification the majority of species were Insects 14
(26%), followed by Birds 18 (34%), Reptiles 13 (25%), Mammals 5 (9%) and Amphibians 3
(6%). There are six Schedule II species and thirty species are under schedule IV according to
Indian wild life Act 1972. A total eighteen species of bird were sighted in the study area. There
are no critically endangered, endangered, vulnerable and endemic species were observed.
Dominant species are mostly birds and insects and three amphibians were observed
during the extensive field visit (Hoplobatrachus tigerinus), (Rana hexadactyla), (Bufo
melonosticatus). The result of core & Buffer zone of fauna studies shows that Nymphalidae
and Scincidae, Elapidae are the main dominating species in the study area; it is mentioned in
Table No.3.31 & 3.32. There is no schedule I Species in study area. A detail of fauna diversity
of family’s pattern is given in Fig No.3.30. There are no critically endangered, endangered,
vulnerable and endemic species were observed. Details of faunal diversity in buffer zone are
given in Table.3.32.
Tor No: 16) A study shall be got done to ascertain the impact of the Mining Project on
wildlife of the study area and details furnished. Impact of the project on the wildlife in
the surrounding and any other protected area and accordingly, detailed mitigative
measures required, should be worked out with cost Implications and submitted.
Out of the total mine lease area of 1.20.0 Ha, just about 0.81.60 Ha is proposed to be
used for mining activity during the first five years as per the mining plan. Blasting, noise and
vibrations and other disturbances including dust generation are likely to have an adverse impact
on wildlife. But these impacts are unlikely to extend beyond 500 m from the actual mine area.
There are Seven Schedule II species and thirty numbers are under schedule IV according to
Indian wild life Act 1972. A total eighteen species of bird were sighted in the buffer zone area.
There are no critically endangered, endangered, vulnerable and endemic species were
observed. As the rainfall in the area is scanty and as no toxic wastes are produced or discharged
on account of mining, the proposed mining activity is not going to have any additional and
adverse impacts on these RET species. There are no ecologically sensitive areas or protected
areas within the 10 Km radius. Hence no specific conservation for conservation of any RET
species or Wildlife is envisaged.

Page | 111
Table No: 3.32 Faunal diversity in Buffer zone
SI.No Common
Name/English Name Family Name Scientific Name
Schedule list wildlife
Protection act 1972
IUCN Red
List data
Insects
1 Common Tiger Nymphalidae Danaus genutia Schedule IV LC
2 Blue tiger Nymphalidae Tirumala limniace Schedule IV LC
3 Common Indian crow Nymphalidae Euploea core Schedule IV LC
4 Praying mantis Mantidae mantis religiosa NL NL
5 Grasshopper Acrididae Hieroglyphus sp NL LC
6 Jewel beetle Buprestidae Eurythyrea austriaca Schedule IV NA
7 Striped tiger Nymphalidae Danaus plexippus Schedule IV LC
8 Ant Formicidae Camponotus Vicinus NL NL
9 Red-veined darter Libellulidae Sympetrum fonscolombii NL LC
10 Dragonfly Gomphidae Ceratogomphus pictus Schedule IV LC
11 Milkweed butterfly Nymphalidae Danainae NL LC
12 Indian honey bee Apidae Apis cerana Schedule IV LC
13 Lesser grass blue Lycaenidae Zizina Otis indica Schedule IV LC
14 Tawny coster Nymphalidae Danaus chrysippus Schedule IV LC
Reptiles
1 Garden lizard Agamidae Calotes versicolor NL LC
2 Common house gecko Gekkonidae Hemidactylus frenatus NL LC
3 Chameleon Chamaeleonidae Chameleon zeylanicus Schedule II LC
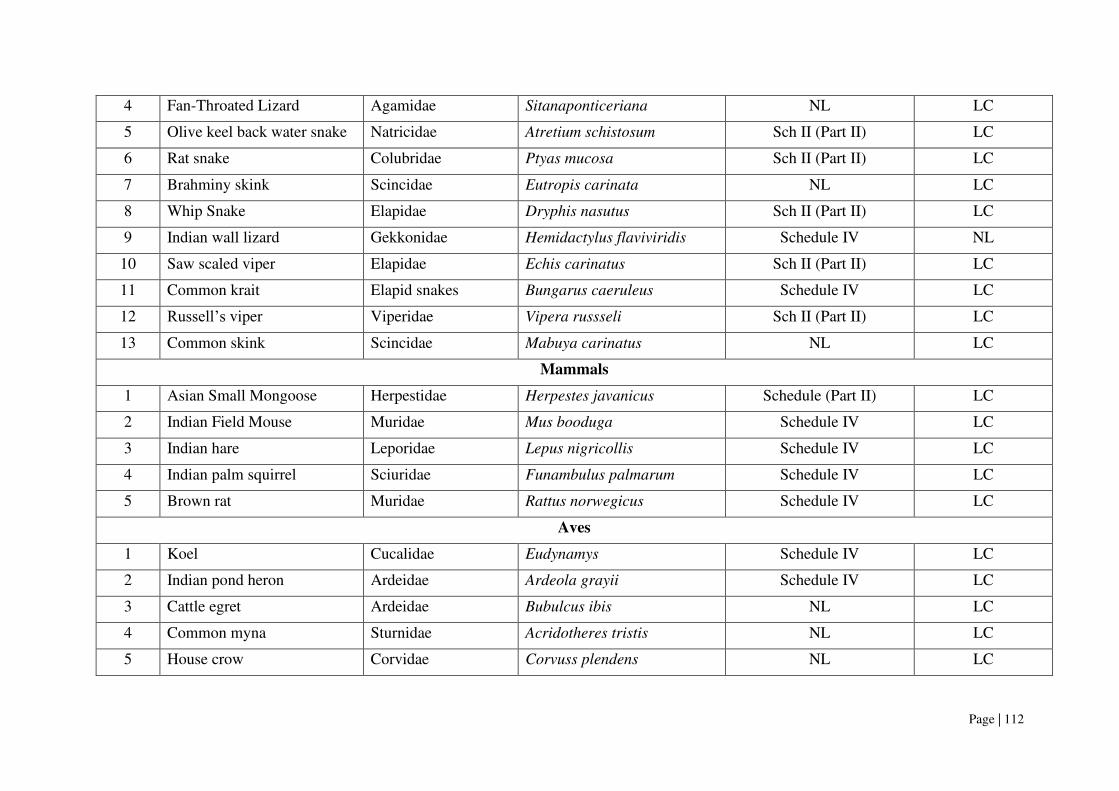
Page | 112
4 Fan-Throated Lizard Agamidae Sitanaponticeriana NL LC
5 Olive keel back water snake Natricidae Atretium schistosum Sch II (Part II) LC
6 Rat snake Colubridae Ptyas mucosa Sch II (Part II) LC
7 Brahminy skink Scincidae Eutropis carinata NL LC
8 Whip Snake Elapidae Dryphis nasutus Sch II (Part II) LC
9 Indian wall lizard Gekkonidae Hemidactylus flaviviridis Schedule IV NL
10 Saw scaled viper Elapidae Echis carinatus Sch II (Part II) LC
11 Common krait Elapid snakes Bungarus caeruleus Schedule IV LC
12 Russell’s viper Viperidae Vipera russseli Sch II (Part II) LC
13 Common skink Scincidae Mabuya carinatus NL LC
Mammals
1 Asian Small Mongoose Herpestidae Herpestes javanicus Schedule (Part II) LC
2 Indian Field Mouse Muridae Mus booduga Schedule IV LC
3 Indian hare Leporidae Lepus nigricollis Schedule IV LC
4 Indian palm squirrel Sciuridae Funambulus palmarum Schedule IV LC
5 Brown rat Muridae Rattus norwegicus Schedule IV LC
Aves
1 Koel Cucalidae Eudynamys Schedule IV LC
2 Indian pond heron Ardeidae Ardeola grayii Schedule IV LC
3 Cattle egret Ardeidae Bubulcus ibis NL LC
4 Common myna Sturnidae Acridotheres tristis NL LC
5 House crow Corvidae Corvuss plendens NL LC

Page | 113
6 Woodpecker bird Picidae Picidae Schedule IV LC
7 Asian green bee-eater Meropidae Meropsorientalis NL LC
8 Red-vented Bulbul Pycnonotidae Pycnonotuscafer Schedule IV LC
9 Rose-ringed parkeet Psittaculidae Psittacula krameri Schedule IV LC
10 Common quail Phasianidae Coturnix coturnix Schedule IV LC
11 Kingfisher Alcedinidae Alcedinidae Schedule IV LC
12 Black drongo Dicruridae Dicrurus macrocercus Schedule IV LC
13 Two-tailed Sparrow Dicruridae Passer domesticus Schedule IV LC
14 Grey Francolin Phasianidae Francolinus pondicerianus Schedule IV LC
15 Common Quail Phasianidae Coturnix coturnix Schedule IV LC
16 Shikra Accipitridae Accipiter badius NL LC
17 White-breasted water hen Rallidae Amaurornis phoenicurus NL LC
18 Common Coot Rallidae Fulica atra Schedule IV LC
Amphibians
1 Indian Burrowing frog Dicroglossidae Sphaerotheca breviceps Schedule IV LC
2 Green Pond Frog Ranidae Rana hexadactyla Schedule IV LC
3 Tiger Frog Chordata Hoplobatrachus tigerinus
(Rana tigerina)
Schedule IV LC
*NL- Not listed, LC- Least concern, NT- Near threatened

Page | 114
Tor No: 17) Location of National Parks, Sanctuaries, Biosphere Reserves, Wildlife
Corridors, Ramsar site Tiger/Elephant Reserves/(existing as well as proposed), if any,
within 10 km of the mine lease should be clearly indicated, supported by a location map
duly authenticated by Chief Wildlife Warden. Necessary clearance, as may be applicable
to such projects due to proximity of the ecologically sensitive areas as mentioned above,
should be obtained from the Standing Committee of National Board of Wildlife and copy
furnished.
There are no National Parks, Sanctuaries, Biosphere Reserves, Wildlife Corridors,
Ramsar sites, Tiger/Elephant Reserves/ (existing as well as proposed) within 10 km of the mine
lease area. There are no reserved of even protected forests within the project area. Hence
submission of clearance from the National Board of Wildlife does not arise. The applicant has
obtained NOC from the District Forest Officer (Please refer Annexure).
Tor No: 18) A detailed biological study of the study area [core zone and buffer zone (10
km radius of the periphery of the mine lease)] shall be carried out. Details of flora and
fauna, endangered, endemic and RET Species duly authenticated, separately for core and
buffer zone should be furnished based on such primary field survey, clearly indicating
the Schedule of the fauna present. In case of any scheduled-I fauna found in the study
area, the necessary plan along with budgetary provisions for their conservation should
be prepared in consultation with State Forest and Wildlife Department and details
furnished. Necessary allocation of funds for implementing the same should be made as
part of the project cost.
A detailed biological study of the study area [core zone and buffer zone of 10 km radius
of the periphery of the mine lease] has been carried out and the results are presented under in
Tables 3.31 to 3.32 There are seven Schedule II species and thirty numbers species are under
schedule IV according to Indian wild life Act 1972. A total eighteen species of bird were
sighted in the study area. The main threat to the bird is the use of pesticides in agriculture.
There is no endangered, endemic and RET Species. There is no Schedule I species in study
area [core zone and buffer zone (10 km radius of the periphery of the mine lease)] The proposed
project is not going to have any direct or indirect adverse impact on the species mentioned
above. Hence, no certificate from the Forest department is required.
Tor No: 31) A time bound Progressive Greenbelt Development Plan shall be
prepared in a tabular form (indicating the linear and quantitative coverage, plant species,

Page | 115
and time frame) and submitted, keeping in mind, the same will have to be executed up
front on commencement of the Project. Phase-wise plan of plantation and compensatory
afforestation should be charted clearly indicating the area to be covered under plantation
and the species to be planted. The details of plantation already done should be given. The
plant species selected for green belt should have greater ecological value and should be of
good utility value to the local population with emphasis on local and native species and
the species which are tolerant to pollution.
Only about 0.14.06 Ha of the mine lease area is going to be used for Greenbelt Development
during the first five years for proposed project P1. The mine lease area 0.50.0ha is going to be
used for Greenbelt Development during the first five years for proposed project P2 Regional
trees like Neem, Pongamia Pinnata, teak will be planted along the Lease boundary and avenues
as well as over non-active dumps. Afforestation Plan is given in 4th chapter. Details of Green
belt development plan are given in Table 4.14.
3.5.5.4 Rare and Endangered fauna of the study area:
1. As per Indian Wild Life (Protection) Act, 1972
Wild Life (Protection) Act, 1972, as amended on 17th January 2003, is an Act to
provide for the protection of wild animals, birds and plants and for matters connected therewith
or ancillary or incidental thereto with a view to ensuring the ecological and environmental
security of the country. Some of the sighted faunas were given protection by the Indian Wild
Life (Protection) Act, 1972 by including them in different schedules. Here no endemic,
endangered migratory fauna found in the area. This area is not also a migratory path of any
faunal species.
2. As per IUCN RED (2013) list
The IUCN Red List is the world's most comprehensive inventory of the global conservation
status of plant and animal species. It uses a set of criteria to evaluate the extinction risk of
thousands of species and subspecies. These criteria are relevant to all species and all regions
of the world. With its strong scientific base, the IUCN Red List is recognized as the most
authoritative guide to the status of biological diversity. Among reported species Schedule II
and IV in the core and buffer zone are presented below,
I. Schedule II species
Common Mongoose, Saw scaled viper, Russell’s viper, Whip Snake, Olive keel
back water snake, Rat snake, Chameleon zeylanicus.

Page | 116
II. Schedule IV species
Green Pond Frog, Indian Burrowing frog, Black drongo, Red-vented Bulbul, Kole, Indian Field
Mouse, Indian palm squirrel, Lesser grass, Common Indian crow, striped tiger, Common Tiger,
Blue tiger, Tawny coster, Indian wall lizard etc.,
Figure 3.27 Floral diversity in core zone
Figure 3.28 Floral diversity in buffer zone
Figure 3.29 Fauna diversity in core zone
39%
15%
20%
12%
5%8%
1%
Trees Shrubs Herbs
Climbers Creeper Grass
Cactus
3
1 1 1 1 1 1 1 1 1 1 1 1
2
00.5
11.5
22.5
33.5
Fab
acea
e
Mel
iace
ae
Ru
biac
eae
Vit
acea
e
Lam
iace
ae
Zyg
ophy
llal
es
Cy
pera
ceae
Poa
ceae
Mim
osac
eae
Ap
ocy
nace
ae
Ver
ben
acea
e
Am
aran
thac
eae
Co
nvol
vula
ceae
Cac
tace
ae
Flora Families
Trees
29%
Shrubs
24%
Herbs
29%
Climbers
12%
Cactus
6%
21
2
9
24
23
13
112
112
13
4
13
12
11
10
2
5
122
33111111
21111
02468
1012
Mel
iace
ae
Fab
acea
e
Mim
osac
eae
Myr
tace
ae
Ver
ben
acea
e
Ru
tace
ae
Cu
curb
itac
eae
Vit
acea
e
Ru
biac
eae
Eup
horb
iace
ae
Am
aran
thac
eae
Co
mm
elin
acea
e
Co
mbr
etac
eae
Cac
tace
ae
Cap
pari
dac
eae
Flora Families
29%
37%
13%
21%
Insects Birds Mammals Reptiles
4
1 1 1
2
1 1 1 1
4
1 1 1 1 1 1 1
00.5
11.5
22.5
33.5
44.5
Ny
mp
hali
dae
Lib
ellu
lid
ae
Acr
idid
ae
Bla
ttod
ea
Ag
amid
ae
Gek
koni
dae
Mur
idae
Mur
ids
Stu
rnid
ae
Cu
cali
dae
Co
rvid
ae
Dic
ruri
dae
Mer
opid
ae
Ard
eida
e
Co
lubr
idae
Ela
pid
sna
kes
Psi
ttac
ulid
ae
Fauna Families

Page | 117
Figure 3.30 Fauna diversity in buffer zone
3.5.6 Results and Discussion
There is no schedule I species of animals observed within study area as per Wildlife
Protection Act, 1972 and no species in vulnerable, endangered or threatened category as per
IUCN. There is no endangered red list species found in the study area. Hence, this small mining
operation over short period of time will not have any significant impact on the surrounding
flora and fauna.
3.6 SOCIO-ECONOMIC ENVIRONMENT
Socio-economic study is an essential part of environmental study. It includes
demographic structure of the area, provision of basic amenities viz., housing, education, health
and medical services, occupation, water supply, sanitation, communication, transportation,
prevailing diseases pattern as well as features like temples, historical monuments etc., at the
baseline level. This will help in visualizing and predicting the possible impact depending upon
the nature and magnitude of the project.
It is expected that the socio-economic status of the area will substantially improve
because of this proposed project. As the proposed project will provide direct and indirect
employment and improve the infrastructural facilities in that area, thus leading to the
improvement of their standard of living.
3.6.1 Objectives of the Study
The objectives of the socio-economic study are as follows:
o To study the socio-economic status of the people living in the study area of the proposed
mining project
o To assess the impact of the project on quality of life of the people in the study area
o To recommend community development measures to be taken up in the study area
1
6
1111111
2
11
3
22
11
2
1111111
222
1111
3
1111
01234567
Ap
idae
Bu
pres
tid
aeF
orm
icid
aeM
anti
dae
Lyc
aen
idae
Co
lubr
idae
Sci
ncid
aeM
urid
aeC
uca
lida
eS
turn
idae
Mer
opid
aeP
sitt
acul
idae
Pha
sian
idae
Pha
sian
idae
Dic
rogl
oss
idae
Ch
ord
ata
Ela
pid
aeV
iper
idae
Lep
orid
ae
Fauna Families
26%
34%
9%
25%
6%
Insects Birds Mammals
Reptiles Amphibians

Page | 118
3.6.2 Scope of Work
o To study the socio-economic environment of the area from the secondary sources
o Data Collection & Analysis
o Prediction of project impact
o Mitigation Measures
3.6.3 District Profile
Krishnagiri district is one of the 38 districts (a district in the north western part) of the
state of Tamil Nadu, in India. This district is carved out from Dharmapuri District by 2004.
The municipal town of Krishnagiri is the district headquarters. In Tamil Nadu, e-Governance
was first introduced at Krishnagiri district under the National e-Governance Project (NEGP) in
revenue and social welfare departments on a pilot basis. The district is one of the largest
producers of mangoes in India.
A district collector heads the district administration. Krishnagiri district is divided into
two divisions and seven taluks for the purpose of revenue administration. A Revenue
Divisional Officer heads each division and a Tahsildars are in charge of taluk level
administration. Development administration in this district is coordinated by panchayats (or
blocks) in rural areas. There are about ten panchayat unions, seven town panchayats, 352
village Panchayats and 874 revenue villages in this district. The two revenue divisions are
KrishnagiriandHosur.Theeighttaluksare Krishnagiri, Hosur, Pochampalli, Uthangarai, Shoola
giri, Bargur and Anchetti, Denkanikottai There are12 panchayat unions: Kelamangalam,
Thalli,, Krishnagiri, Shoolagiri, Veppanapalli, Hosur, Kaveripattinam, Pochampalli, Mathur,
and Uthangarai..
3.6.4 Socio-Economic Status of Study area
Krishnagiri district of Tamil Nadu has total population of 1,879,809 as per the Census
2011. Out of which 960,232 are males while 919,577 are females. In 2011 there were total
448,053 families residing in Krishnagiri district. The Average Sex Ratio of Krishnagiri district
is 958. As per Census 2011 out of total population, 22.8% people live in Urban areas while
77.2% lives in the Rural areas. The average literacy rate in urban areas is 85.5% while that in
the rural areas is 67.3%. Also, the Sex Ratio of Urban areas in Krishnagiri district is 967 while
that of Rural areas is 955.
The population of Children of age 0-6 years in Krishnagiri district is 217323 which is 12% of
the total population. There are 112832 male children and 104491 female children between the
age 0-6 years. Thus, as per the Census 2011 the Child Sex Ratio of Krishnagiri is 926 which is
less than Average Sex Ratio (958) of Krishnagiri district. The total literacy rate of Krishnagiri

Page | 119
district is 71.46%. The male literacy rate is 69.47% and the female literacy rate is 56.65% in
Krishnagiri district.
Table 3.33 Krishnagiri Taluk Population Facts
Number of Households 4,934
Population 597,071
Male Population 300,821
Female Population 296,250
Children Population 67,555
Sex-ratio 985
Literacy 72.85%
Male Literacy 71.16%
Female Literacy 57.95%
Source: https://censusindia.co.in/subdistrict/krishnagiri-taluka-tamil-nadu-5891
As per Census 2011, there are total 31,149 families under Krishnagiri Taluka living in
urban areas while 31,149 families are living within Rural areas. Thus around 22.2% of total
population of Krishnagiri Taluka lives in Urban areas while 77.8% lives under Rural areas.
Population of children (0 - 6 years) in urban region is 14,503 while that in rural region is 53,052.
Table 3.34 Demographics Population of Krishnagiri Taluk
Total Population Male Population Female Population
597,071 300,821 296,250
Source: https://censusindia.co.in/subdistrict/krishnagiri-taluka-tamil-nadu-5891
3.6.4.1 Literacy of Krishnagiri Taluk
Average literacy rate of Krishnagiri Taluka in 2011 were 72.85% in which, male and
female literacy were 80.57% and 65.08% respectively. Total literate in Krishnagiri Taluka were
385,758 of which male and female were 214,076 and 171,682 respectively.
3.6.4.2 Worker’s profile of Krishnagiri Taluk
Krishnagiri Taluka out of total population, 268,706 were engaged in work activities.
82.9% of workers describe their work as Main Work (Employment or Earning more than 6
Months) while 17.1% were involved in Marginal activity providing livelihood for less than 6
months. Of 268,706 workers engaged in Main Work, 54,817 were cultivators (owner or co-
owner) while 60,941 were Agricultural labourer.

Page | 120
Table 3.35 Krishnagiri taluk - Census 2011 data
Description Census 2011 Data
Teshil Name Krishnagiri
District Name Krisnagiri
State Name Tamil Nadu
Total Population 597,071
Total No of House Holds 4.931
Total Male Population 300,821
Total Female Population 296,250
0-6 Age group Total Population 67,555
0-6 Age group Male Population 35,118
0-6 Age group Female Population 32,437
Total Person Literates 72.85%
Total Male Literates 71.16%
Total Female Literates 57.95%
Scheduled Cast Persons 72,144
Scheduled Cast Males 35,913
Scheduled Cast Females 36,201
Scheduled Tribe Persons 4,427
Scheduled Tribe Males 2,189
Scheduled Tribe Females 2,238
Source: https://censusindia.co.in/subdistrict/krishnagiri-taluka-tamil-nadu-5891
Table 3.36 Krishnagiri Working Population data
Total Male Female
Main Workers 222,851 148,113 74,738
Cultivators 54,817 34,437 20,380
Agriculture
Labourer 60,941 31,318 29,623
Household
Industries 4,934 2,165 2,769
Other Workers 102,159 80,193 21,966
Marginal Workers 45,855 23,029 22,826
Non-Working 328,365 129,679 198,686
Source: https://censusindia.co.in/subdistrict/krishnagiri-taluka-tamil-nadu-5891

Page | 121
Table 3.37 Population and Literacy Data of Study Area
S.
No
.
Name
No of
House
holds
Total
Population
Person
Total
Population
Male
Total
Population
Female
Literates
Population
Person
Literates
Population
Male
Literates
Population
Female
Illiterate
Persons
Illiterat
e Male
Illiterate
Female
1 Agaram 1452 5697 2856 2841 3297 1903 1394 2400 953 1447
2 Agasipalli 2811 12915 6548 6367 8199 4578 3621 4716 1970 2746
3 Balinayanapall
i 1132 4761 2470 2291 3121 1767 1354 1640 703 937
4 Bellampalli
(Part) 407 1605 809 796 853 485 368 752 324 428
5 Bellarapalli 1140 4891 2479 2412 2938 1660 1278 1953 819 1134
6 Billanakuppam 1046 4546 2327 2219 2727 1555 1172 1819 772 1047
7 Boganapalli 1979 8763 4478 4285 5518 3156 2362 3245 1322 1923
8 Chendrapalli 1507 6467 3266 3201 3817 2188 1629 2650 1078 1572
9 Chinnathimmi
nayanapalli 1115 4794 2390 2404 3067 1716 1351 1727 674 1053
10 Devasamudira
m 475 2057 1016 1041 1333 724 609 724 292 432
11 Gangaleri 766 3242 1617 1625 2011 1106 905 1231 511 720
12 Gollapalli 121 534 291 243 241 158 83 293 133 160
13 Gooliam 437 2079 1039 1040 1083 618 465 996 421 575
14 Junjupalli 1177 4826 2309 2517 3170 1743 1427 1656 566 1090
15 Kallukurikki 1334 6097 2967 3130 3931 2083 1848 2166 884 1282
16 Kammaampalli 1399 5759 2831 2928 3541 2019 1522 2218 812 1406
17 Kathinayanapa
lli 1408 6060 2975 3085 3971 2194 1777 2089 781 1308
18 Katteri 161 813 399 414 632 340 292 181 59 122
19 Kodipalli 621 2735 1410 1325 1570 917 653 1165 493 672
20 Kompalli 169 749 361 388 449 257 192 300 104 196
21 Kondepalli 693 2729 1339 1390 1819 1053 766 910 286 624
22 Kothigutalapall
i 1058 4402 2127 2275 2946 1583 1363 1456 544 912
23 Kundarapalli 1100 4702 2262 2440 3133 1698 1435 1569 564 1005
24 Kurubarapalli 1171 5354 2760 2594 3100 1766 1334 2254 994 1260
25 Marachandira
m 1517 6939 3535 3404 3818 2220 1598 3121 1315 1806

Page | 122
26 Marigampalli 608 2523 1308 1215 1637 959 678 886 349 537
27 Modikuppam 662 2525 1277 1248 1625 951 674 900 326 574
28 Naralapalli 1460 6234 3139 3095 3509 2023 1486 2725 1116 1609
29 Orappam 1549 6796 3378 3418 4338 2385 1953 2458 993 1465
30 Palepalle 1847 7631 3698 3933 5448 2832 2616 2183 866 1317
31 Peddatalapalli 2234 9773 4925 4848 5729 3190 2539 4044 1735 2309
32 Periamuthu 1969 8413 4230 4183 5208 2923 2285 3205 1307 1898
33 Polupalli 626 2639 1318 1321 1575 907 668 1064 411 653
34 Puliyancheri 210 843 426 417 563 325 238 280 101 179
35 Ragimanapalli 205 812 412 400 403 234 169 409 178 231
36 Sembadamuthu
r 554 2484 1300 1184 1395 830 565 1089 470 619
37 Sokkadi 1242 4931 2564 2367 2732 1629 1103 2199 935 1264
38 Soolamalai 477 1966 1027 939 1174 704 470 792 323 469
39 Sulamalai 112 460 210 250 299 150 149 161 60 101
40 Sundekuppam 2073 8661 4386 4275 4847 2798 2049 3814 1588 2226
41 Timmapuram 1524 6337 3176 3161 4176 2342 1834 2161 834 1327
Source: www.censusindia.gov.in - Tamilnadu Census of India – 2011
Table 3.38 Workers Profile of Study Area
S.No
. Village
Total
Worker
Populatio
n Person
Total
Worker
Populatio
n Male
Total
Worker
Populatio
n Female
Main
Working
Populatio
n Person
Main
Working
Populatio
n Male
Main
Working
Populatio
n Female
Main
Cultivato
r
Populatio
n Person
Main
Agricultur
al
Labourers
Population
Person
Main
Other
Workers
Populatio
n Person
Non-
Working
Populatio
n Person
1 Agaram 2556 1645 911 2421 1571 850 515 1203 669 3141 2 Agasipalli 4959 3325 1634 4053 2856 1197 568 894 2469 7956 3 Balinayanapalli 2013 1273 740 699 506 193 229 114 339 2748 4 Bellampalli (Part) 727 457 270 717 451 266 394 224 97 878 5 Bellarapalli 2463 1436 1027 2097 1283 814 624 800 650 2428 6 Billanakuppam 2131 1359 772 1989 1285 704 862 561 501 2415 7 Boganapalli 3404 2319 1085 2967 2096 871 278 460 2123 5359 8 Chendrapalli 3084 1969 1115 2753 1778 975 820 879 1009 3383

Page | 123
9 Chinnathimminayanap
alli 2726 1384 1342 2214 1134 1080 690 1256 239 2068
10 Devasamudiram 755 551 204 715 536 179 28 67 617 1302 11 Gangaleri 1393 952 441 1170 842 328 318 354 494 1849 12 Gollapalli 277 144 133 274 141 133 122 143 8 248 13 Gooliam 1231 626 605 936 542 394 575 257 95 848 14 Junjupalli 1954 1241 713 1702 1157 545 837 217 622 2872 15 Kallukurikki 2409 1607 802 2033 1400 633 292 395 1301 3688 16 Kammaampalli 2841 1545 1296 2083 1314 769 603 781 686 2918 17 Kathinayanapalli 2508 1551 957 2310 1503 807 513 951 822 3552 18 Katteri 413 215 198 413 215 198 224 131 58 400 19 Kodipalli 1246 934 312 1211 906 305 287 549 327 1489 20 Kompalli 408 212 196 396 208 188 198 161 28 341 21 Kondepalli 1084 680 404 845 579 266 371 144 318 1645 22 Kothigutalapalli 1956 1171 785 1883 1145 738 196 785 890 2446 23 Kundarapalli 1869 1193 676 1466 980 486 462 462 511 2833 24 Kurubarapalli 2235 1470 765 1524 1117 407 253 236 1008 3119 25 Marachandiram 3307 2046 1261 2624 1692 932 849 414 1062 3632 26 Marigampalli 1300 800 500 1198 740 458 503 407 221 1223 27 Modikuppam 1212 734 478 979 661 318 191 290 496 1313 28 Naralapalli 2931 1872 1059 2059 1337 722 753 667 570 3303 29 Orappam 2719 1707 1012 2269 1471 798 414 1027 803 4077 30 Palepalle 3597 2084 1513 2400 1399 1001 487 776 1087 4034 31 Peddatalapalli 3988 2703 1285 3540 2495 1045 475 542 2481 5785 32 Periamuthu 3753 2373 1380 3031 1971 1060 849 656 1450 4660 33 Polupalli 1407 801 606 1338 780 558 716 196 417 1232 34 Puliyancheri 489 268 221 483 267 216 187 97 193 354 35 Ragimanapalli 509 267 242 314 173 141 221 15 10 303 36 Sembadamuthur 1343 700 643 1138 592 546 917 134 81 1141 37 Sokkadi 2787 1579 1208 2305 1343 962 743 1073 441 2144 38 Soolamalai 965 618 347 869 605 264 175 293 398 1001 39 Sulamalai 221 116 105 187 99 88 91 24 68 239 40 Sundekuppam 4715 2572 2143 4217 2352 1865 2024 1409 758 3946 41 Timmapuram 2760 1752 1008 2393 1536 857 682 811 841 3577
Source: www.censusindia.gov.in - Tamilnadu Census of India – 2011

Page | 124
Table 3.39 Communication & Transport Facilities in the Study Area
S.No
. Village Name PO SPO PTO T
PC
O MP
IC/CS
C BS PBS RS NH SH
MD
R
BT
R GR
NW
R FP
1 Agaram 2 1 2 1 1 1 2 2 2 2 2 2 1 1 1 1 2 2 Agasipalli 2 1 2 1 1 1 2 2 1 1 2 1 1 1 1 1 2 3 Balinayanapalli 2 1 2 1 1 1 2 2 1 2 2 1 1 1 1 1 2 4 Bellampalli 2 1 2 2 2 1 2 2 1 1 2 2 2 2 1 1 2 5 Bellarapalli 2 1 2 1 1 1 2 2 1 2 2 2 2 1 1 1 2 6 Billanakuppam 2 1 2 1 1 1 2 2 2 2 2 2 2 2 1 1 2 7 Boganapalli 1 1 1 1 1 1 2 1 1 1 2 1 1 1 1 1 2 8 Chendrapalli 2 1 2 2 2 1 2 2 2 2 2 1 1 1 1 1 2
9 Chinnathimminayanapalli 2 1 2 1 1 1 2 2 1 1 2 2 1 2 1 1 2
10 Devasamudiram 2 1 2 1 1 1 2 2 1 1 2 1 1 1 1 1 2 11 Gangaleri 2 1 2 1 2 1 1 2 1 1 2 2 1 1 1 1 2 12 Gollapalli 2 2 2 1 1 1 2 2 2 2 2 2 2 2 2 1 2 13 Gooliam 2 2 2 1 1 1 2 2 1 2 2 2 1 1 1 1 2 14 Junjupalli 2 1 2 1 2 1 2 2 1 1 2 1 1 1 1 1 2 15 Kammaampalli 2 1 2 1 1 1 1 2 1 1 2 1 1 1 1 1 2 16 Kathinayanapalli 1 1 1 1 1 1 1 2 1 1 2 1 1 1 1 1 2 17 Katteri 2 2 2 1 1 1 2 2 1 1 2 2 2 2 1 1 2 18 Kodipalli 2 1 2 1 1 1 2 2 2 2 2 2 1 1 1 1 2 19 Kompalli 2 2 2 1 2 1 2 2 2 2 2 2 2 2 1 1 2 20 Kondepalli 2 2 2 1 1 1 1 2 1 2 1 2 2 2 1 1 2 21 Kothigutalapalli 2 1 2 1 1 1 2 2 1 2 2 2 1 2 1 1 2 22 Kundarapalli 2 1 2 2 2 1 2 2 2 2 2 1 1 1 1 1 2 23 Kurubarapalli 2 1 2 1 1 1 1 2 1 1 2 1 1 1 1 1 2 24 Marachandiram 2 1 2 1 1 1 2 2 1 2 2 2 1 1 1 1 2 25 Marigampalli 2 2 2 1 1 1 2 2 2 2 2 2 1 1 1 1 2 26 Modikuppam 2 1 2 1 1 1 2 2 1 2 2 2 2 2 1 1 2 27 Naralapalli 2 1 2 1 1 1 1 2 1 1 2 2 2 1 1 1 2 28 Orappam 2 1 2 1 1 1 2 2 1 1 2 1 1 1 1 1 2 29 Palepalle 1 1 1 1 1 1 2 2 1 1 2 1 2 1 1 1 2 30 Peddatalapalli 2 1 2 1 2 1 2 2 1 1 2 2 1 1 1 1 2 31 Peddathanapalli 2 1 2 1 1 1 1 2 1 2 2 2 2 1 1 1 2

Page | 125
32 Periamuthu 1 1 1 1 2 1 2 2 1 1 2 1 1 1 1 1 2 33 Polupalli 2 2 2 1 1 1 2 2 1 2 2 1 1 1 1 1 2 34 Puliyancheri 2 1 2 1 1 1 2 2 1 1 2 2 1 1 1 1 2 35 Ragimanapalli 2 2 2 2 2 1 2 2 1 1 2 1 1 1 1 1 2 36 Sembadamuthur 2 1 2 1 1 1 2 2 1 2 2 2 1 1 1 1 2 37 Sokkadi 2 2 2 2 2 1 2 2 1 2 2 2 2 2 1 1 2 38 Soolamalai 2 2 2 1 1 1 2 2 2 1 2 1 2 1 1 1 2 39 Sulamalai 2 2 2 2 2 1 2 2 1 1 2 2 2 2 1 1 2 40 Sundekuppam 2 1 2 1 2 1 2 2 2 2 2 1 1 1 1 1 2 41 Timmapuram 2 1 2 1 1 1 1 2 1 2 2 1 1 1 1 1 2 Abbreviations: PO - Post Office; MP - Mobile Phone Coverage; RS - Railway Station; GR - Gravel Roads; SPO - Sub Post Office; IC / CSC - Internet Cafe/Common
Service Centre; NH - National Highways; NWR - Navigate waterways River; PTO - Post & Telegraph office; PCF - Private Courier Facility; SH - State Highways; P
- Foot path; T- Telephone (Landline); BS - Public Bus Service; MDR - Major District Road; PCO - Public call office / Mobile; PBS - Private Bus Service; BTR -
Black Topped (Pucca Roads). Note: 1 - Available within the village 2 - Not available.
Table 3.40 Water & Drainage Facilities in the Study Area
S.No. Village Name TP CW UCW HP TW/BH S R/C T/P/L CD OD CT
1 Agaram 1 1 1 1 1 1 0 1 2 1 2 Agasipalli 1 1 1 1 1 1 0 0 1 2 2 3 Balinayanapalli 1 1 1 1 1 1 0 0 1 2 1 4 Bellampalli 1 1 1 1 1 0 0 1 1 2 2 5 Bellarapalli 1 1 1 1 1 0 0 0 2 2 1 6 Billanakuppam 1 1 1 1 1 0 0 0 2 2 2 7 Boganapalli 1 1 1 1 1 1 0 0 1 2 2 8 Chendrapalli 1 1 1 1 1 1 0 0 1 2 2 9 Chinnathimminayanapalli 1 1 1 1 1 1 0 1 1 2 2 10 Devasamudiram 1 1 1 1 1 1 0 0 1 2 2 11 Gangaleri 1 1 1 1 1 0 0 0 1 2 1 12 Gollapalli 1 0 0 0 0 0 0 0 2 2 2 13 Gooliam 1 1 1 1 1 0 0 0 1 1 2 14 Junjupalli 1 1 1 1 1 1 0 0 2 2 2
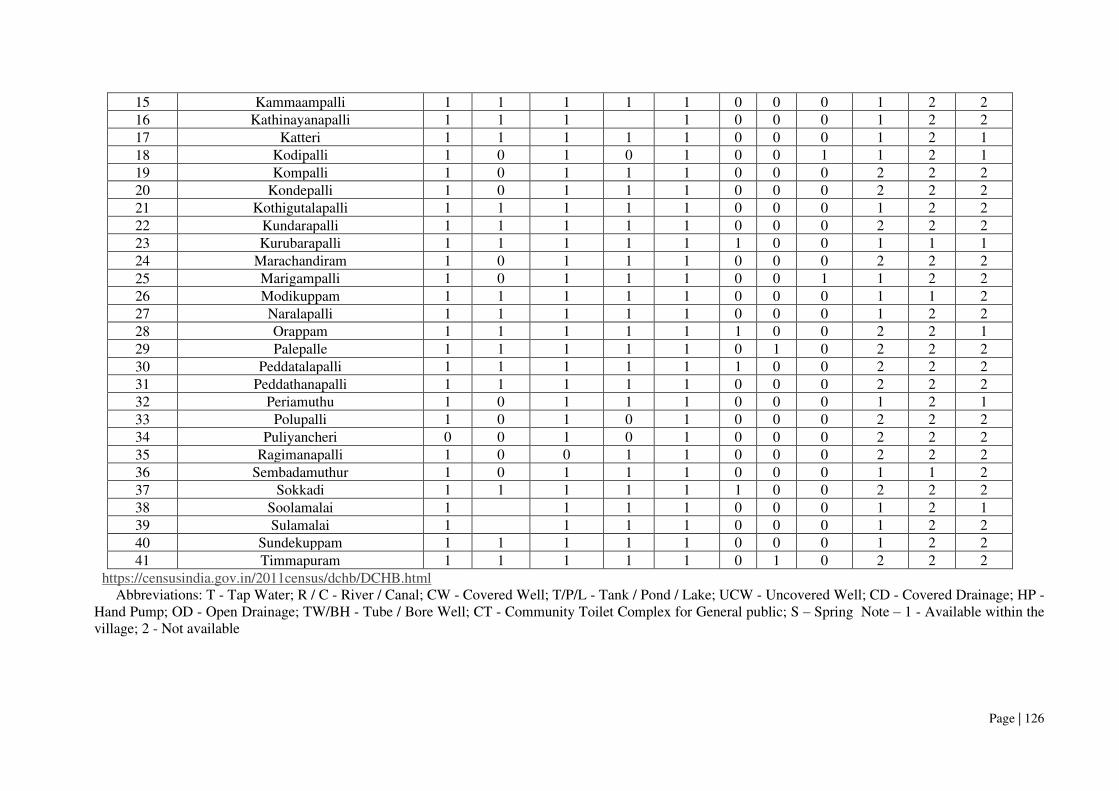
Page | 126
15 Kammaampalli 1 1 1 1 1 0 0 0 1 2 2 16 Kathinayanapalli 1 1 1 1 0 0 0 1 2 2 17 Katteri 1 1 1 1 1 0 0 0 1 2 1 18 Kodipalli 1 0 1 0 1 0 0 1 1 2 1 19 Kompalli 1 0 1 1 1 0 0 0 2 2 2 20 Kondepalli 1 0 1 1 1 0 0 0 2 2 2 21 Kothigutalapalli 1 1 1 1 1 0 0 0 1 2 2 22 Kundarapalli 1 1 1 1 1 0 0 0 2 2 2 23 Kurubarapalli 1 1 1 1 1 1 0 0 1 1 1 24 Marachandiram 1 0 1 1 1 0 0 0 2 2 2 25 Marigampalli 1 0 1 1 1 0 0 1 1 2 2 26 Modikuppam 1 1 1 1 1 0 0 0 1 1 2 27 Naralapalli 1 1 1 1 1 0 0 0 1 2 2 28 Orappam 1 1 1 1 1 1 0 0 2 2 1 29 Palepalle 1 1 1 1 1 0 1 0 2 2 2 30 Peddatalapalli 1 1 1 1 1 1 0 0 2 2 2 31 Peddathanapalli 1 1 1 1 1 0 0 0 2 2 2 32 Periamuthu 1 0 1 1 1 0 0 0 1 2 1 33 Polupalli 1 0 1 0 1 0 0 0 2 2 2 34 Puliyancheri 0 0 1 0 1 0 0 0 2 2 2 35 Ragimanapalli 1 0 0 1 1 0 0 0 2 2 2 36 Sembadamuthur 1 0 1 1 1 0 0 0 1 1 2 37 Sokkadi 1 1 1 1 1 1 0 0 2 2 2 38 Soolamalai 1 1 1 1 0 0 0 1 2 1 39 Sulamalai 1 1 1 1 0 0 0 1 2 2 40 Sundekuppam 1 1 1 1 1 0 0 0 1 2 2 41 Timmapuram 1 1 1 1 1 0 1 0 2 2 2
https://censusindia.gov.in/2011census/dchb/DCHB.html Abbreviations: T - Tap Water; R / C - River / Canal; CW - Covered Well; T/P/L - Tank / Pond / Lake; UCW - Uncovered Well; CD - Covered Drainage; HP -
Hand Pump; OD - Open Drainage; TW/BH - Tube / Bore Well; CT - Community Toilet Complex for General public; S – Spring Note – 1 - Available within the village; 2 - Not available

Page | 127
Table 3.41 Other Facilities in the Study Area
S.No. Village Name ATM CB COB ACS SHG PDS RM AMS NC NC-
AC CC SF PL APS BDRO PS
1 Agaram 2 2 1 1 1 1 2 2 1 1 1 1 1 1 1 2 2 Agasipalli 2 2 2 2 1 1 2 2 1 1 1 1 2 1 1 1 3 Balinayanapalli 2 2 2 2 2 1 2 2 1 1 1 2 2 1 1 1 4 Bellampalli 2 2 2 2 1 1 2 2 1 1 1 1 2 1 1 1 5 Bellarapalli 2 2 2 2 1 1 2 2 1 1 1 1 1 1 2 1 6 Billanakuppam 2 2 1 1 1 1 2 2 1 1 1 1 1 1 1 1 7 Boganapalli 2 2 1 2 1 1 2 2 1 1 1 1 2 1 1 1 8 Chendrapalli 2 2 1 1 1 1 2 1 1 1 1 1 2 1 1 2 9 Chinnathimminayanapalli 2 2 2 2 1 1 2 2 1 1 2 1 1 1 1 1 10 Devasamudiram 2 2 2 2 1 1 2 2 1 1 2 1 2 2 1 2 11 Gangaleri 2 2 2 2 1 1 2 2 1 1 2 1 2 1 1 1 12 Gollapalli 2 2 1 1 1 1 2 2 1 1 2 2 2 2 2 1 13 Gooliam 2 2 2 2 1 1 2 2 1 1 1 1 1 1 1 2 14 Junjupalli 2 2 2 2 1 1 2 2 1 1 1 1 2 1 1 1 15 Kammaampalli 2 2 2 2 1 1 2 2 1 1 1 1 2 1 2 1 16 Kathinayanapalli 2 2 2 1 1 1 1 2 1 1 1 1 2 1 1 1 17 Katteri 2 2 2 2 1 1 2 2 1 1 2 1 2 1 1 1 18 Kodipalli 2 2 2 2 1 1 2 2 1 1 1 1 2 1 1 1 19 Kompalli 2 2 2 2 1 2 2 2 2 2 2 2 2 2 1 2 20 Kondepalli 2 2 2 2 1 1 2 2 1 1 2 2 1 1 1 2 21 Kothigutalapalli 2 2 2 1 1 1 2 2 1 1 1 1 1 1 2 2 22 Kundarapalli 2 2 1 1 1 1 2 2 1 1 1 1 1 1 2 1 23 Kurubarapalli 1 1 2 2 1 1 2 2 1 1 1 1 1 1 1 1 24 Marachandiram 2 2 2 2 1 1 2 2 1 1 1 2 1 1 1 2 25 Marigampalli 2 2 2 2 1 1 1 2 1 1 1 1 1 1 1 2 26 Modikuppam 2 2 2 2 1 1 2 2 1 1 1 1 1 1 1 1 27 Naralapalli 2 1 2 1 1 1 1 1 1 1 1 1 1 1 1 1 28 Orappam 2 2 1 2 1 1 2 2 1 1 1 1 1 1 1 1 29 Palepalle 2 1 2 2 1 1 2 2 1 1 2 1 1 1 1 1 30 Peddatalapalli 2 2 2 2 1 1 2 2 1 1 2 1 1 1 1 1 31 Peddathanapalli 2 2 1 2 1 1 2 2 1 1 1 1 2 1 1 1

Page | 128
32 Periamuthu 2 1 1 1 1 1 2 2 1 1 1 1 1 1 2 1 33 Polupalli 2 2 2 2 1 1 2 2 1 1 1 2 2 1 1 1 34 Puliyancheri 2 2 2 2 1 1 2 2 1 1 2 2 2 1 2 1 35 Ragimanapalli 2 2 2 2 1 2 2 2 2 2 2 2 2 2 2 1 36 Sembadamuthur 2 2 2 2 1 1 2 2 1 1 1 2 1 1 1 1 37 Sokkadi 2 2 2 2 1 1 2 2 1 1 1 1 1 1 1 1 38 Soolamalai 2 2 2 2 1 1 2 2 1 1 1 2 2 1 1 1 39 Sulamalai 2 2 2 2 1 1 2 2 1 1 2 2 2 1 2 1 40 Sundekuppam 2 2 2 2 1 1 2 2 1 1 1 2 1 1 2 1 41 Timmapuram 2 1 1 1 1 1 2 2 1 1 1 1 1 1 1 1
https://censusindia.gov.in/2011census/dchb/DCHB.html Abbreviations: ATM - Automatic Teller Machine; PDS - Public Distribution System (Shop); CB - Commerical Bank; RM - Regular Market; COB - Co-operative Bank; AMS - Agricultural Market Society; ACS - Agricultural Credit Societies; NC - Nutritional Centres; SHG - Self Help Group; NC-AC - Nutritional Centres - Anganwadi Centre; DBRO - Birth & Death Registration Office; PS - Power Supply Note – 1 - Available within the village; 2 - Not available
Table 3.42 Educational Facilities in the Study Area
S.No. PPS PS MS SS SSS DC EC MC MI PT VTS SSD
G P G P G P G P G P G P G P G P G P G P G P G P
1 Agaram 1 1 1 1 1 2 1 2 2 0 2 2 2 2 2 2 2 2 2 2 2 2 2 2
2 Agasipalli 1 1 1 1 1 1 1 1 2 2 2 1 2 2 2 2 2 2 2 2 2 2 2 2
3 Balinayanapalli 1 2 1 2 1 2 2 2 2 0 2 2 2 1 2 2 2 2 1 2 2 2 2 2
4 Bellampalli 1 2 1 2 1 2 1 2 2 0 2 2 2 2 2 2 2 2 2 2 2 2 2 2
5 Bellarapalli 1 1 1 2 1 2 1 2 2 0 2 2 2 2 2 2 2 2 2 2 2 2 2 2
6 Billanakuppam 1 2 1 2 2 2 2 2 2 0 2 2 2 2 2 2 2 2 2 2 2 2 2 2
7 Boganapalli 1 2 1 2 1 2 2 2 2 0 1 2 2 2 2 2 2 2 1 2 1 2 2 2
8 Chendrapalli 2 1 1 1 1 2 1 1 1 1 2 2 2 2 2 2 2 2 2 1 2 2 2 2
9 Chinnathimminayanapalli 1 2 1 2 1 2 1 2 2 0 2 2 2 2 2 2 2 2 2 2 2 2 2 2
10 Devasamudiram 1 2 1 2 1 1 1 1 1 1 2 2 2 2 2 2 2 2 2 2 2 2 2 2
11 Gangaleri 1 2 1 1 1 2 1 2 2 0 2 2 2 2 2 2 2 2 2 2 2 2 2 2
12 Gollapalli 1 2 1 2 2 2 2 2 2 0 2 2 2 2 2 2 2 2 2 2 2 2 2 2
13 Gooliam 1 2 1 2 2 2 2 2 2 0 2 2 2 2 2 2 2 2 2 2 2 2 2 2
14 Junjupalli 1 2 1 2 1 2 2 2 2 0 2 2 2 2 2 2 2 2 2 2 2 2 2 2
15 Kammaampalli 1 2 1 2 1 2 1 2 2 0 2 2 2 2 2 2 2 2 2 2 2 2 2 2
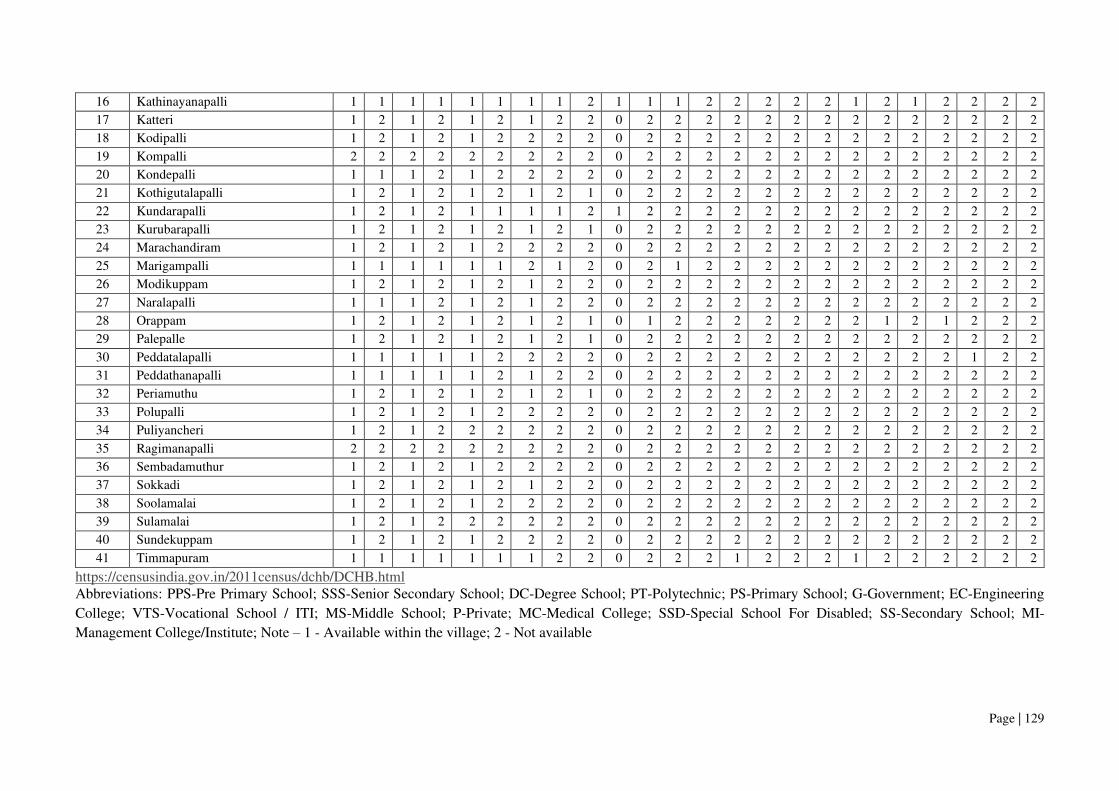
Page | 129
16 Kathinayanapalli 1 1 1 1 1 1 1 1 2 1 1 1 2 2 2 2 2 1 2 1 2 2 2 2
17 Katteri 1 2 1 2 1 2 1 2 2 0 2 2 2 2 2 2 2 2 2 2 2 2 2 2
18 Kodipalli 1 2 1 2 1 2 2 2 2 0 2 2 2 2 2 2 2 2 2 2 2 2 2 2
19 Kompalli 2 2 2 2 2 2 2 2 2 0 2 2 2 2 2 2 2 2 2 2 2 2 2 2
20 Kondepalli 1 1 1 2 1 2 2 2 2 0 2 2 2 2 2 2 2 2 2 2 2 2 2 2
21 Kothigutalapalli 1 2 1 2 1 2 1 2 1 0 2 2 2 2 2 2 2 2 2 2 2 2 2 2
22 Kundarapalli 1 2 1 2 1 1 1 1 2 1 2 2 2 2 2 2 2 2 2 2 2 2 2 2
23 Kurubarapalli 1 2 1 2 1 2 1 2 1 0 2 2 2 2 2 2 2 2 2 2 2 2 2 2
24 Marachandiram 1 2 1 2 1 2 2 2 2 0 2 2 2 2 2 2 2 2 2 2 2 2 2 2
25 Marigampalli 1 1 1 1 1 1 2 1 2 0 2 1 2 2 2 2 2 2 2 2 2 2 2 2
26 Modikuppam 1 2 1 2 1 2 1 2 2 0 2 2 2 2 2 2 2 2 2 2 2 2 2 2
27 Naralapalli 1 1 1 2 1 2 1 2 2 0 2 2 2 2 2 2 2 2 2 2 2 2 2 2
28 Orappam 1 2 1 2 1 2 1 2 1 0 1 2 2 2 2 2 2 2 1 2 1 2 2 2
29 Palepalle 1 2 1 2 1 2 1 2 1 0 2 2 2 2 2 2 2 2 2 2 2 2 2 2
30 Peddatalapalli 1 1 1 1 1 2 2 2 2 0 2 2 2 2 2 2 2 2 2 2 2 1 2 2
31 Peddathanapalli 1 1 1 1 1 2 1 2 2 0 2 2 2 2 2 2 2 2 2 2 2 2 2 2
32 Periamuthu 1 2 1 2 1 2 1 2 1 0 2 2 2 2 2 2 2 2 2 2 2 2 2 2
33 Polupalli 1 2 1 2 1 2 2 2 2 0 2 2 2 2 2 2 2 2 2 2 2 2 2 2
34 Puliyancheri 1 2 1 2 2 2 2 2 2 0 2 2 2 2 2 2 2 2 2 2 2 2 2 2
35 Ragimanapalli 2 2 2 2 2 2 2 2 2 0 2 2 2 2 2 2 2 2 2 2 2 2 2 2
36 Sembadamuthur 1 2 1 2 1 2 2 2 2 0 2 2 2 2 2 2 2 2 2 2 2 2 2 2
37 Sokkadi 1 2 1 2 1 2 1 2 2 0 2 2 2 2 2 2 2 2 2 2 2 2 2 2
38 Soolamalai 1 2 1 2 1 2 2 2 2 0 2 2 2 2 2 2 2 2 2 2 2 2 2 2
39 Sulamalai 1 2 1 2 2 2 2 2 2 0 2 2 2 2 2 2 2 2 2 2 2 2 2 2
40 Sundekuppam 1 2 1 2 1 2 2 2 2 0 2 2 2 2 2 2 2 2 2 2 2 2 2 2
41 Timmapuram 1 1 1 1 1 1 1 2 2 0 2 2 2 1 2 2 2 1 2 2 2 2 2 2
https://censusindia.gov.in/2011census/dchb/DCHB.html Abbreviations: PPS-Pre Primary School; SSS-Senior Secondary School; DC-Degree School; PT-Polytechnic; PS-Primary School; G-Government; EC-Engineering
College; VTS-Vocational School / ITI; MS-Middle School; P-Private; MC-Medical College; SSD-Special School For Disabled; SS-Secondary School; MI-
Management College/Institute; Note – 1 - Available within the village; 2 - Not available

Page | 130
Table 3.43 Medical Facilities in the Study Area
S.No. VIllage Name CHC PHC PHSC MCW TBC HA HAM D VH MHC FWC NGM-I/O
1 Agaram 0 0 1 0 0 0 0 0 0 0 0 1
2 Agasipalli 0 2 1 2 2 0 0 2 0 0 2 2
3 Balinayanapalli 0 0 1 0 0 0 0 0 0 0 0 0
4 Bellampalli 0 0 1 0 0 0 0 0 0 0 0 0
5 Bellarapalli 0 2 2 2 2 0 0 2 1 0 2 0
6 Billanakuppam 0 0 1 0 0 0 0 0 0 0 0 0
7 Boganapalli 0 0 3 0 0 0 0 0 0 0 0 0
8 Chendrapalli 0 0 1 1 0 0 0 0 0 0 0 0
9 Chinnathimminayanapalli 0 0 1 0 0 0 0 0 0 0 0 0
10 Devasamudiram 0 0 0 0 0 0 0 0 0 0 0 0
11 Gangaleri 0 0 1 0 0 0 0 0 0 0 0 0
12 Gollapalli 0 0 0 0 0 0 0 0 0 0 0 0
13 Gooliam 0 0 0 0 0 0 0 0 0 0 0 0
14 Junjupalli 0 0 1 0 0 0 0 0 0 0 0 1
15 Kammaampalli 0 0 1 0 0 0 0 0 0 0 0 0
16 Kathinayanapalli 0 0 1 0 0 0 0 0 0 0 0 1
17 Katteri 0 0 0 0 0 0 0 0 1 0 0 0
18 Kodipalli 0 0 0 0 0 0 0 0 0 0 0 0
19 Kompalli 0 0 0 0 0 0 0 0 0 0 0 0
20 Kondepalli 0 0 0 0 0 0 0 0 0 0 0 0
21 Kothigutalapalli 1 1 2 1 1 0 0 1 1 0 1 0
22 Kundarapalli 0 0 1 0 0 0 0 0 1 0 0 0
23 Kurubarapalli 0 0 0 0 0 0 0 0 0 0 0 0
24 Marachandiram 0 0 3 0 0 0 0 0 0 0 0 0
25 Marigampalli 0 0 0 0 0 0 0 0 0 0 0 1
26 Modikuppam 0 0 0 0 0 0 0 0 0 0 0 0
27 Naralapalli 0 0 1 0 0 0 0 0 0 0 0 1
28 Orappam 1 1 1 1 1 0 0 1 1 0 1 0
29 Palepalle 0 0 1 1 0 0 0 0 1 0 0 2
30 Peddatalapalli 0 0 3 0 0 0 0 0 0 0 0 0
31 Peddathanapalli 0 0 1 0 0 0 0 0 0 0 0 0

Page | 131
32 Periamuthu 0 0 1 0 0 0 0 0 1 0 0 2
33 Polupalli 0 0 0 0 0 0 0 0 0 0 0 0
34 Puliyancheri 0 0 0 0 0 0 0 0 0 0 0 0
35 Ragimanapalli 0 0 0 0 0 0 0 0 0 0 0 0
36 Sembadamuthur 0 0 0 0 0 0 0 0 0 0 0 0
37 Sokkadi 0 0 1 0 0 0 0 0 0 0 0 0
38 Soolamalai 0 0 0 0 0 0 0 0 0 0 0 0
39 Sulamalai 0 0 0 0 0 0 0 0 0 0 0 0
40 Sundekuppam 0 0 1 0 0 0 0 0 0 0 0 2
41 Timmapuram 0 0 1 0 0 0 0 0 0 0 0 0
https://censusindia.gov.in/2011census/dchb/DCHB.html Abbreviations: CHC-Community Health Centre; TBC-TB Clinic; VH- Veternity Hospital; PHC-Primary Health Centre; HA-Aallopathic Hospital; FWC-Family Welfare Centre; PHSC-Primary Health Sub Centre; HAM-Alternative Medicine Hospital; MH-Mobile Health Clinic; MCW-Maternity and Child Welfare Centre; D-Dispensary; NGM-I/O-Non-Government Medical Facilities In & Out Patient Note – 1 - Available within the village; 2 - Not available a-facility available at <5kms b-facility available at >10kms Source: www.censusindia.gov.in – Tamil Nadu Census of India – 2011
Page | 132
3.6.5 Recommendation and Suggestion
o Awareness program should be conducted to make the population aware of education
and to get a better livelihood.
o Vocational training programme should be organized to make the people self -
employed, particularly for women and unemployed youth.
o On the basis of qualification and skills local community may be preferred. Long term
and short-term employments should be generated.
o Health care centre and ambulance facility should be provided to the population to get
easy access to medical facilities. Maternity facility should be made available at the
place to avoid going to distant places for treatment which involves risks. Apart from
that, as these areas are prone to various diseases a hospital with modern facilities
should be opened on a priority basis in a central place to provide better health facilities
to the villagers around the project.
o While developing an Action Plan, it is very important to identify the population who
falls under the marginalized and vulnerable groups. So that special attention can be
given to these groups with special provisions while making action plans.
3.6.6 Summary & Conclusion
The socio-economic study in the study area gives a clear picture of its population,
average household size, literacy rate and sex ratio etc. It is also found that a part of population
is suffering from a lack of permanent job to run their day-to-day life. Their expectation is to
earn some income for their sustainability on a long-term basis.
The proposed project will aim to provide preferential employment to the local people
there by improving the employment opportunity in the area and in turn the social standards will
improve.

Page | 133
CHAPTER IV
ANTICIPATED ENVIRONMENTAL IMPACTS AND MITIGATION MEASURES
4.0 GENERAL
Environmental impacts both direct and indirect on various environmental attributes due to
proposed mining activity will be created in the surrounding environment, during the operational
and post–operational phases. The occurrence of mineral deposits, being site specific, their
exploitation, often, does not allow for any choice except adoption of eco-friendly operation. The
methods are required to be selected in such a manner, so as to maintain environmental equilibrium
ensuring sustainable development.
In order to maintain the environmental commensuration with the mining operation, it is
essential to undertake studies on the existing environmental scenario and assess the impact on
different environmental components. This would help in formulating suitable management plans
sustainable resource extraction.
Several scientific techniques and methodologies are available to predict impacts of physical
environment. Mathematical models are the best tools to quantitatively describe the cause-and-
effect relationships between sources of pollution and different components of environment. In
cases where it is not possible to identify and validate a model for a particular situation, predictions
have been arrived at based on logical reasoning / consultation / extrapolation.
The following parameters are of significance in the Environmental Impact Assessment and are
being discussed in detail:
o Land environment
o Soil environment
o Water Environment
o Air Environment
o Noise Environment
o Socio economic environment
o Biological Environment
Based on the baseline environmental status at the project site, the environmental factors that
are likely to be affected are identified, quantified and assessed.
4.1 LAND ENVIRONMENT
4.1.1 Anticipated Impact
o Permanent or temporary change on land use and land cover.
o Change in topography of the mine lease area will change at the end of the life of the mine.
o Problems to agricultural land and human habitations due to dust, and noise caused by
movement of heavy vehicles
o Degradation of the aesthetic environment of the core zone due to quarrying

Page | 134
o Soil erosion and sediment deposition in the nearby water bodies due to earthworks during
the rainy season
o Siltation of water course due to wash off from the exposed working area
4.1.2 Common Mitigation Measures from Proposed Project
o The mining activity will be gradual confined in blocks and excavation will be undertaken
progressively along with other mitigative measures like phase wise development of
greenbelt etc.
o Construction of garland drains all around the quarry pits and construction of check dam
at strategic location in lower elevations to prevent erosion due to surface runoff during
rainfall and also to collect the storm water for various uses within the proposed area.
o Green belt development along the boundary within safety zone. The small quantity of
water stored in the mined-out pit will be used for greenbelt
o Thick plantation will be carried out on unutilized area, top benches of mined out pits, on
safety barrier, etc.,
o At conceptual stage, the land use pattern of the quarry will be changed into Greenbelt
area and temporary reservoir.
o In terms of aesthetics, natural vegetation surrounding the quarry will be retained (such
as in a buffer area i.e., 7.5 m safety barrier and other safety provided) so as to help
minimize dust emissions.
o Proper fencing will be carried out at the conceptual stage, Security will be posted round
the clock, to prevent inherent entry of the public and cattle.
4.1.1 SOIL ENVIRONMENT
There is no topsoil proposed project (P1). The proposed project (P2) area is covered by
thin layer of Topsoil formation and the average thickness is about 0.5 to 1m, the excavated
Topsoil will be used for landfilling purposes.
4.1.1.1 Anticipated Impact on Soil Environment
Following impacts are anticipated due to mining operations:
o Removal of protective vegetation cover
o Exposure of underlying soil horizons that may be less pervious, or more erodible
than the surface layers
o Reduced capacity of soils to absorb rainfall
o Increased energy in storm-water runoff due to concentration and velocity
o Exposure of subsurface materials which are unsuitable for vegetation establishment

Page | 135
4.1.1.2 Common Mitigation Measures from proposed project
o Run-off diversion – Garland drains will be constructed around the project boundary
to prevent surface flows from entering the quarry works areas and will be discharged
into vegetated natural drainage lines, or as distributed flow across an area stabilised
against erosion.
o Sedimentation ponds - Run-off from working areas will be routed towards
sedimentation ponds. These trap sediment and reduce suspended sediment loads
before runoff is discharged from the quarry site. Sedimentation ponds should be
designed based on runoff, retention times, and soil characteristics. There may be a
need to provide a series of sedimentation ponds to achieve the desired outcome.
o Retain vegetation – Retain existing or re-plant the vegetation at the site wherever
possible.
o Monitoring and maintenance – Weekly monitoring and daily maintenance of erosion
control systems so that they perform as specified specially during rainy season.
4.1.1.3 Waste Dump Management
Proposed project (P1) there is no overburden/Waste generated during the scheme period.
Hence, there is no disposal of Topsoil or Waste. The excavated rough stone will be directly loaded
into Tippers to the needy customers.
Proposed project (P2) the waste is generated during the mining period is 26368m3 will be
proposed dump into the all side of the mined-out pits of the lease area. The top soil of the lease
area 12m3 top soil will be utilized for the formation of mine roads, Construction of bund and
afforestation purposes
4.2 WATER ENVIRONMENT
4.2.1 Anticipated Impact
The major sources of water pollution normally associated due to mining and allied
operations are:
o Generation of waste water from vehicle washing.
o Washouts from surface exposure or working areas
o Domestic sewage
o Disturbance to drainage course in the project area
o Mine Pit water discharge
o Increase in sediment load during monsoon in downstream of lease area

Page | 136
o This being a mining project, there will be no process effluent. Waste from washing of
machinery may result in discharge of Oil & grease, suspended solids.
o The sewage from soak pit may percolate to the ground water table and contaminate it.
o Surface drainage may be affected due to Mining
o Abstraction of water may lead to depletion of water table
4.2.1.1 Details of water requirements in KLD
Table 4.1 Water Requirements-P1&P2
Proposed Project Site – P1
*Purpose Quantity Source
Dust Suppression 1.5 KLD From existing bore wells from nearby area Green Belt development 1.0 KLD From existing bore wells from nearby area Domestic purpose 1.0 KLD From existing, bore wells and drinking water
will be sourced from approved water vendors. Total 3.5 KLD
Proposed Project Site – P2
*Purpose Quantity Source
Dust Suppression 1.5 KLD From existing bore wells from nearby area/ rainwater harvesting pits
Green Belt development 1.0 KLD From existing bore wells from nearby area/rain water harvesting pits
Drinking & Domestic purpose
0.7 KLD From existing, bore wells and drinking water will be sourced from approved water vendors.
Total 3.2 KLD
* Water for drinking purpose will be brought from approved water vendors.
Source: Approved Mining Plan Pre-Feasibility Report
4.2.2 Common Mitigation Measures for the Proposed Project
o Garland drainage system and settling tank will be constructed along the proposed
mining lease area. The garland drainage will be connected to settling tank and
sediments will be trapped in the settling tanks and only clear water will be discharged
to the natural drainage.
o Rainwater from the mining pits will be collected in sump and will be allowed to store
and pumped out to surface settling tank of 15 m x 10m x 3m to remove suspended
solids if any. This collected water will be judiciously used for dust suppression and
such sites where dust likely to be generated and for developing green belt. The
proponent will collect and judicially utilize the rainwater as part of rainwater
harvesting system.

Page | 137
o Benches will be provided with inner slopes and through a system of drains and
channels, rain water will be allowed to descent into surrounding drains to minimize
the effects of erosion and water logging arising out of uncontrolled descent of water.
o The water collected will be reused during storm for dust suppression and greenbelt
development within the mines.
o Interceptor traps/oil separators will be installed to remove oils and greases. Water
from the tipper wash-down facility and machinery maintenance yard will be passed
through interceptor traps/oil separators prior to its reuse.
o Flocculating or coagulating agents will be used to assist in the settling of suspended
solids during monsoon seasons.
o Periodic (every 6 month once) analysis of ground water quality of quarry pit water
and ground water of nearby villages will be conducted.
o Domestic sewage from site office and urinals/latrines provided in ML is discharged
in septic tank followed by soak pits.
o Waste water discharge from mine will be treated in settling tanks before using for dust
suppression and tree plantation purposes.
o De-silting will be carried out before and immediately after the monsoon season.
o Regular monitoring (once every 6 months) and analysing the quality of water in open
well, bore wells and surface water.
4.3 AIR ENVIRONMENT
4.3.1 Anticipated Impact from all proposed project
o During mining at various stages of activities such as excavation, drilling, blasting, and
transportation of materials, particular matter (PM), gases such as sulphur dioxide,
oxides of nitrogen from vehicular exhaust are the main air pollutants
o Emissions of noxious gases due to incomplete detonation of explosive may sometimes
pollute the air
o The fugitive dust released from the mining operations may cause effect on the mine
workers who are directly exposed to the fugitive dust
o Simultaneously, the air-borne dust may travel to longer distances and settle in the
villages located near the mine lease area
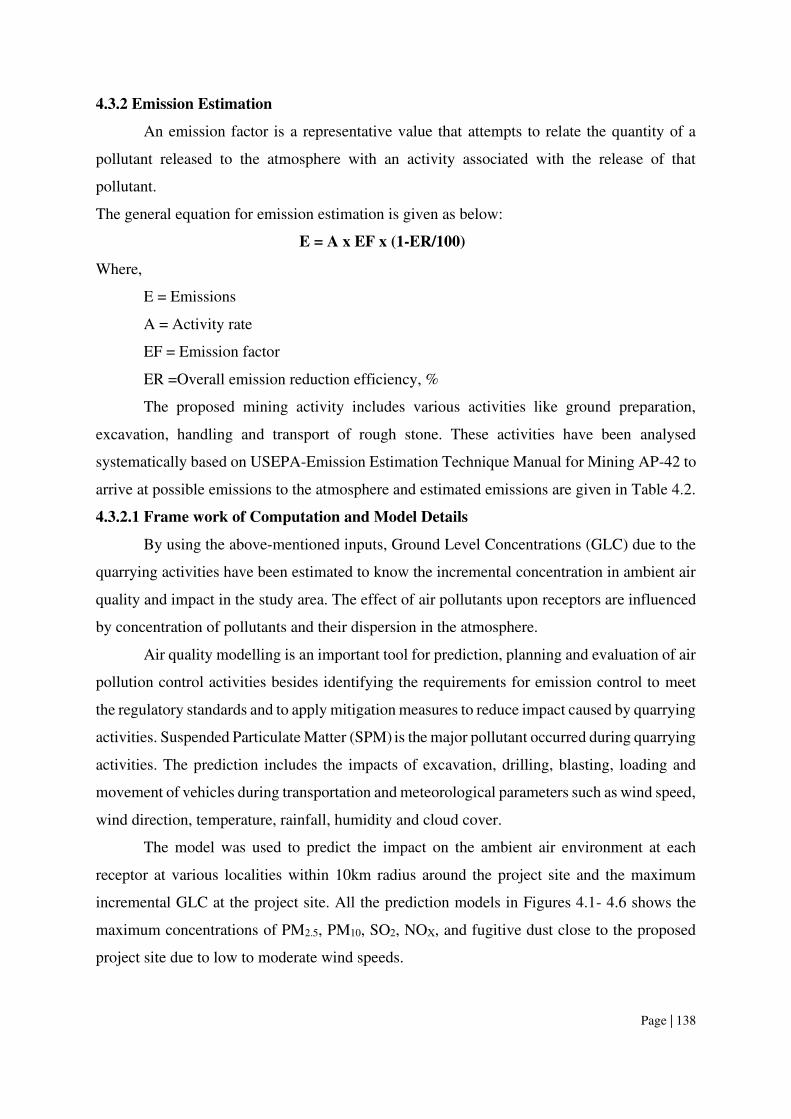
Page | 138
4.3.2 Emission Estimation
An emission factor is a representative value that attempts to relate the quantity of a
pollutant released to the atmosphere with an activity associated with the release of that
pollutant.
The general equation for emission estimation is given as below:
E = A x EF x (1-ER/100)
Where,
E = Emissions
A = Activity rate
EF = Emission factor
ER =Overall emission reduction efficiency, %
The proposed mining activity includes various activities like ground preparation,
excavation, handling and transport of rough stone. These activities have been analysed
systematically based on USEPA-Emission Estimation Technique Manual for Mining AP-42 to
arrive at possible emissions to the atmosphere and estimated emissions are given in Table 4.2.
4.3.2.1 Frame work of Computation and Model Details
By using the above-mentioned inputs, Ground Level Concentrations (GLC) due to the
quarrying activities have been estimated to know the incremental concentration in ambient air
quality and impact in the study area. The effect of air pollutants upon receptors are influenced
by concentration of pollutants and their dispersion in the atmosphere.
Air quality modelling is an important tool for prediction, planning and evaluation of air
pollution control activities besides identifying the requirements for emission control to meet
the regulatory standards and to apply mitigation measures to reduce impact caused by quarrying
activities. Suspended Particulate Matter (SPM) is the major pollutant occurred during quarrying
activities. The prediction includes the impacts of excavation, drilling, blasting, loading and
movement of vehicles during transportation and meteorological parameters such as wind speed,
wind direction, temperature, rainfall, humidity and cloud cover.
The model was used to predict the impact on the ambient air environment at each
receptor at various localities within 10km radius around the project site and the maximum
incremental GLC at the project site. All the prediction models in Figures 4.1- 4.6 shows the
maximum concentrations of PM2.5, PM10, SO2, NOX, and fugitive dust close to the proposed
project site due to low to moderate wind speeds.

Page | 139
Table 4.2 Estimated emission rate for PM10
Activity Source type Value
Unit P1 P2
Drilling Point Source 0.079473760 0.113672828 g/s Blasting Point Source 0.000766890 0.004590899 g/s
Mineral Loading Point Source 0.040666760 0.045819521 g/s Haul Road Line Source 0.002488629 0.002503491 g/s
Overall Mine Area Source 0.041981206 0.069708223 g/s
Table 4.3 estimated emission rate for SO2
Activity Source type Value
Unit P1 P2
Overall Mine Area Source 0.000431996 0.001535583 g/s
Table 4.4 estimated emission rate for NOX
Activity Source type Value
Unit P1 P2
Overall Mine Area Source 0.000012315 0.000125187 g/s
4.3.2.2 Modelling of Incremental Concentration from the Proposed Projects
The air borne particulate matter such as PM10 and PM2.5 generated by quarrying
operation, transportation, and wind erosion of the exposed areas and emissions of sulphur
dioxide (SO2) and oxides of nitrogen (NOx) due to excavation and loading equipment’s and
vehicles plying on haul roads are the cause of air pollution in the project area. Similarly, loading
- unloading and transportation of Rough Stone, wind erosion of the exposed area and movement
of light vehicles causes of pollution. This leads to an impact on the ambient air environment
around the project area. as shown in Tables 4.5-4.9.
The impact on Air Environment is due to the mining and allied activities during Land
Development phase, Mining process and Transportation. The emissions of Sulphur dioxide
(SO2), Oxides of Nitrogen (NOx) due to excavation/loading equipment and vehicles plying on
haul roads are marginal. Loading - unloading and transportation of Rough Stone, wind erosion
of the exposed area and movement of light vehicles will be the main polluting source in the
mining activities releasing Particulate Matter (PM10) affecting Ambient Air of the area.
Prediction of impacts on air environment has been carried out taking into consideration
cumulative production two proposed quarries. Air environment and net increase in emissions
by Open pit source modelling in AERMOD Software as shown in Tables 4.5-4.9.

Page | 140
Figure 4.1 AERMOD terrain map
Figure 4.2 Predicted incremental concentration of PM2.5
Figure 4.3 Predicted incremental concentration of PM10
Figure 4.4 Predicted incremental concentration of SO2
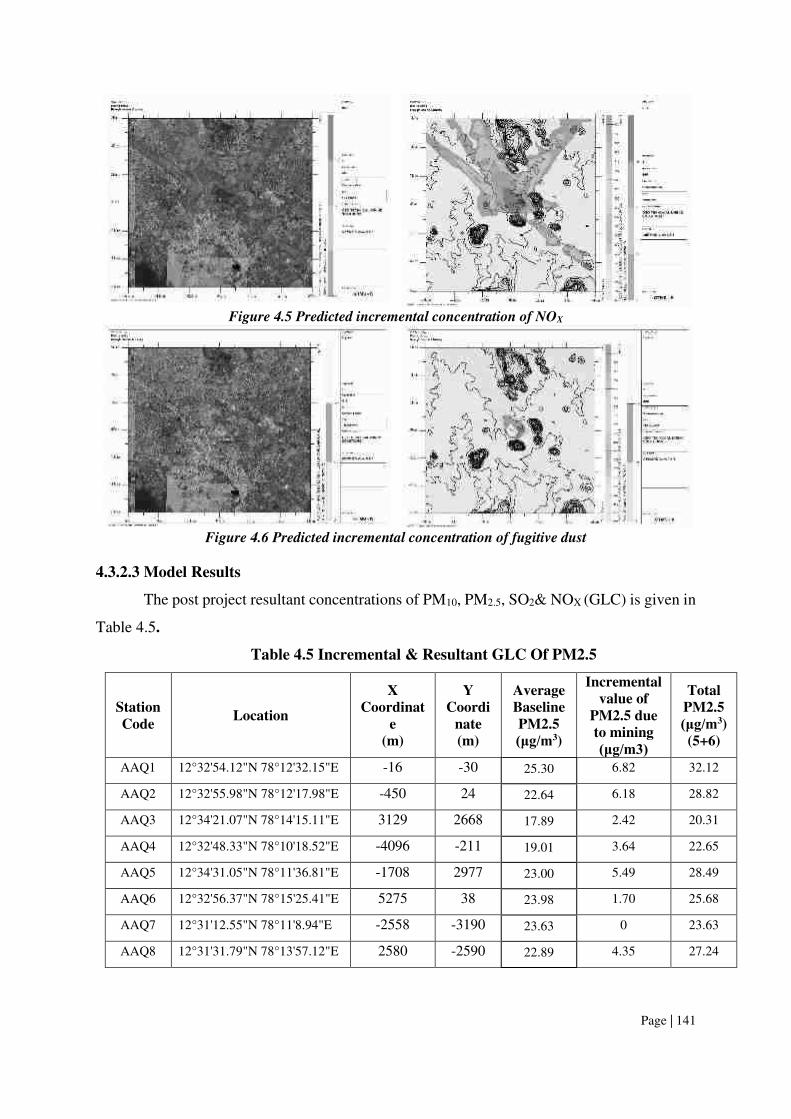
Page | 141
Figure 4.5 Predicted incremental concentration of NOX
Figure 4.6 Predicted incremental concentration of fugitive dust
4.3.2.3 Model Results
The post project resultant concentrations of PM10, PM2.5, SO2& NOX (GLC) is given in
Table 4.5.
Table 4.5 Incremental & Resultant GLC Of PM2.5
Station
Code Location
X
Coordinat
e
(m)
Y
Coordi
nate
(m)
Average
Baseline
PM2.5
(μg/m3)
Incremental
value of
PM2.5 due
to mining
(μg/m3)
Total
PM2.5
(μg/m3) (5+6)
AAQ1 12°32'54.12"N 78°12'32.15"E -16 -30 25.30 6.82 32.12
AAQ2 12°32'55.98"N 78°12'17.98"E -450 24 22.64 6.18 28.82
AAQ3 12°34'21.07"N 78°14'15.11"E 3129 2668 17.89 2.42 20.31
AAQ4 12°32'48.33"N 78°10'18.52"E -4096 -211 19.01 3.64 22.65
AAQ5 12°34'31.05"N 78°11'36.81"E -1708 2977 23.00 5.49 28.49
AAQ6 12°32'56.37"N 78°15'25.41"E 5275 38 23.98 1.70 25.68
AAQ7 12°31'12.55"N 78°11'8.94"E -2558 -3190 23.63 0 23.63
AAQ8 12°31'31.79"N 78°13'57.12"E 2580 -2590 22.89 4.35 27.24

Page | 142
Table 4.6 Incremental and Resultant GLC of PM10
Station
Code Location
X
Coordinate
(m)
Y
Coordinate
(m)
Average
Baseline
PM10
(μg/m3)
Incremental
value of
PM10 due
to mining
(μg/m3)
Total
PM10
(μg/m3) (5+6)
AAQ1 12°32'54.12"N 78°12'32.15"E
-16 -30 45.16
14.92 60.08
AAQ2 12°32'55.98"N 78°12'17.98"E
-450 24 42.98
14.21 57.19
AAQ3 12°34'21.07"N 78°14'15.11"E
3129 2668 37.41
3.18 40.59
AAQ4 12°32'48.33"N 78°10'18.52"E
-4096 -211 43.08
5.25 48.33
AAQ5 12°34'31.05"N 78°11'36.81"E
-1708 2977 42.71
11.33 54.04
AAQ6 12°32'56.37"N 78°15'25.41"E
5275 38 43.22
1.12 44.34
AAQ7 12°31'12.55"N 78°11'8.94"E
-2558 -3190 43.90
0 43.90
AAQ8 12°31'31.79"N 78°13'57.12"E
2580 -2590 42.78
7.80 50.58
Table 4.7 Incremental & Resultant GLC of SO2
Station
Code Location
X
Coordinate
(m)
Y
Coordinate
(m)
Average
Baseline
So2
(μg/m3)
Incremental
value of
So2 due
to mining
(μg/m3)
Total
So2
(μg/m3)
(5+6)
AAQ1 12°32'54.12"N
78°12'32.15"E -16 -30
7.66 3.46 11.12
AAQ2 12°32'55.98"N
78°12'17.98"E -450 24
7.20 3.05 10.25
AAQ3 12°34'21.07"N
78°14'15.11"E 3129 2668
6.09 0.98 7.07
AAQ4 12°32'48.33"N
78°10'18.52"E -4096 -211
6.51 0.15 6.66
AAQ5 12°34'31.05"N
78°11'36.81"E -1708 2977
7.86 2.80 10.66
AAQ6 12°32'56.37"N
78°15'25.41"E 5275 38
7.26 0 7.26
AAQ7 12°31'12.55"N
78°11'8.94"E -2558 -3190
7.48 0 7.48
AAQ8 12°31'31.79"N
78°13'57.12"E 2580 -2590
7.05 1.65 8.7
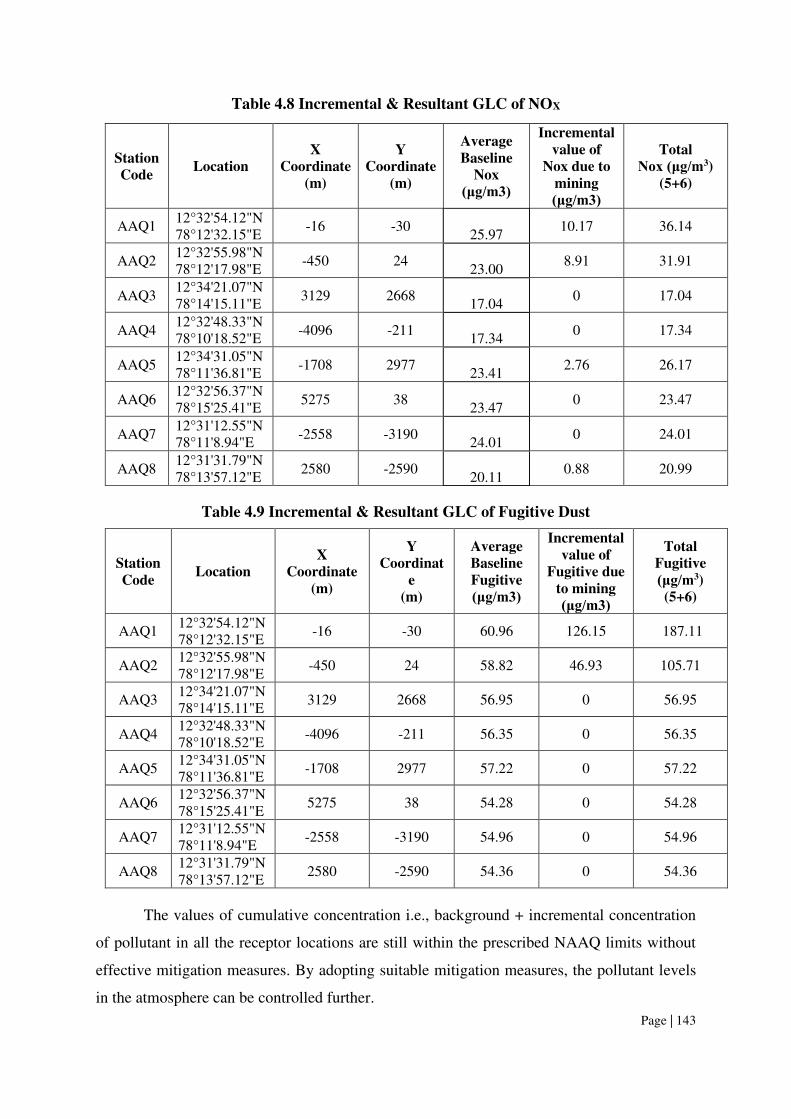
Page | 143
Table 4.8 Incremental & Resultant GLC of NOX
Station
Code Location
X
Coordinate
(m)
Y
Coordinate
(m)
Average
Baseline
Nox
(μg/m3)
Incremental
value of
Nox due to
mining
(μg/m3)
Total
Nox (μg/m3) (5+6)
AAQ1 12°32'54.12"N 78°12'32.15"E
-16 -30 25.97
10.17 36.14
AAQ2 12°32'55.98"N 78°12'17.98"E
-450 24 23.00
8.91 31.91
AAQ3 12°34'21.07"N 78°14'15.11"E
3129 2668 17.04
0 17.04
AAQ4 12°32'48.33"N 78°10'18.52"E
-4096 -211 17.34
0 17.34
AAQ5 12°34'31.05"N 78°11'36.81"E
-1708 2977 23.41
2.76 26.17
AAQ6 12°32'56.37"N 78°15'25.41"E
5275 38 23.47
0 23.47
AAQ7 12°31'12.55"N 78°11'8.94"E
-2558 -3190 24.01
0 24.01
AAQ8 12°31'31.79"N 78°13'57.12"E
2580 -2590 20.11
0.88 20.99
Table 4.9 Incremental & Resultant GLC of Fugitive Dust
Station
Code Location
X
Coordinate
(m)
Y
Coordinat
e
(m)
Average
Baseline
Fugitive
(μg/m3)
Incremental
value of
Fugitive due
to mining
(μg/m3)
Total
Fugitive
(μg/m3)
(5+6)
AAQ1 12°32'54.12"N 78°12'32.15"E
-16 -30 60.96 126.15 187.11
AAQ2 12°32'55.98"N 78°12'17.98"E
-450 24 58.82 46.93 105.71
AAQ3 12°34'21.07"N 78°14'15.11"E
3129 2668 56.95 0 56.95
AAQ4 12°32'48.33"N 78°10'18.52"E
-4096 -211 56.35 0 56.35
AAQ5 12°34'31.05"N 78°11'36.81"E
-1708 2977 57.22 0 57.22
AAQ6 12°32'56.37"N 78°15'25.41"E
5275 38 54.28 0 54.28
AAQ7 12°31'12.55"N 78°11'8.94"E
-2558 -3190 54.96 0 54.96
AAQ8 12°31'31.79"N 78°13'57.12"E
2580 -2590 54.36 0 54.36
The values of cumulative concentration i.e., background + incremental concentration
of pollutant in all the receptor locations are still within the prescribed NAAQ limits without
effective mitigation measures. By adopting suitable mitigation measures, the pollutant levels
in the atmosphere can be controlled further.

Page | 144
4.3.2.4 Common Mitigation Measures
4.3.2.4.1 Drilling
To control dust at source, wet drilling will be practiced. Where there is a scarcity of water,
suitably designed dust extractor will be provided for dry drilling along with dust hood at the
mouth of the drill-hole collar.
Advantages of Wet Drilling
o In this system dust gets suppressed close to its formation. Dust suppression becomes
very effective and the work environment will be improved from the point of view of
occupational comfort and health
o Due to dust free atmosphere, the life of engine, compressor etc., will be increased
o The life of drill bit will be increased
o The rate of penetration of drill will be increased
o Due to the dust free atmosphere visibility will be improved resulting in safer working
conditions
4.3.2.4.2 Blasting
o Suitable time of blasting will be chosen according to the local conditions and water
will be sprinkled on blasting face
o Blasting will be avoided when temperature inversion is likely to occur and strong wind
blows towards residential areas
o Controlled blasting will be carried out using suitable explosive charge and short delay
detonators, adequate stemming of holes at collar zone
o Blasting will be restricted to a particular time of the day i.e., at the time of lunch hours
o Before loading of material water will be sprayed on blasted material
o Dust mask will be provided to the workers and their use will be strictly monitored
4.3.2.4.3 Haul Road and Transportation
o Water will be sprinkled on haul roads twice a day to avoid dust generation during
transportation
o Transportation of material will be carried out during day time and material will be
covered with taurpaulin
o The speed of tippers plying on the haul road will be limited to < 20 km/hr to avoid
generation of dust
o Water sprinkling on haul roads and loading points will be carried out twice a day
o Main source of gaseous pollution will be from vehicle used for transportation of
mineral; therefore, weekly maintenance of machines improves combustion process
and reduces pollution

Page | 145
o The un-metaled haul roads will be compacted weekly before being put into use
o Overloading of tippers will be avoided to prevent spillage
o It will be ensured that all transportation vehicles carry a valid PUC certificate
o Haul roads and service roads will be graded to clear accumulation of loose materials
4.3.2.4.4 Green Belt
o Planting of trees all along main mine haul roads and regular grading of haul roads will
be practiced to prevent the generation of dust due to movement of tractors/tippers
o Green belt of adequate width will be developed around the project site
4.3.2.4.5 Occupational Health
o Dust mask will be provided to the workers and their use will be strictly monitored
o Annual medical checkups, trainings and campaigns will be arranged to ensure
awareness about importance of wearing dust masks among all mine workers and tipper
drivers
o Ambient air quality monitoring will be conducted every six months to assess
effectiveness of mitigation measures proposed
4.4 NOISE ENVIRONMENT
Noise pollution is mainly due to operation like drilling, blasting and plying of trucks &
HEMM. These activities will not cause any problem to the inhabitants of this area because
there is no human settlement in close proximity to the project area. Noise modelling has been
carried out considering blasting and compressor operation (drilling) and transportation
activities.
Predictions have been carried out to compute the noise level at various distances around
the working pit due to these major noise-generating sources. Noise modelling has been carried
out to assess the impact on surrounding ambient noise levels.
Basic phenomenon of the model is the geometric attenuation of sound. Noise at a point
generates spherical waves which are propagated outwards from the source through the air at a
speed of 1,10° ft/sec with the first wave making an ever-increasing sphere with time. As the
wave spreads the intensity of noise diminishes as the fixed amount of energy is spread over an
increasing surface area of the sphere. The assumption of the model is based on point source
relationship i.e., for every doubling of the distance the noise levels are decreased by 6 dB (A).
For hemispherical sound wave propagation through homogeneous loss free medium,
one can estimate noise levels at various locations at different sources using a mathematical
model based on first principle.
Lp2 = Lp1 - 20 log (r2/r1) - Ae1, 2
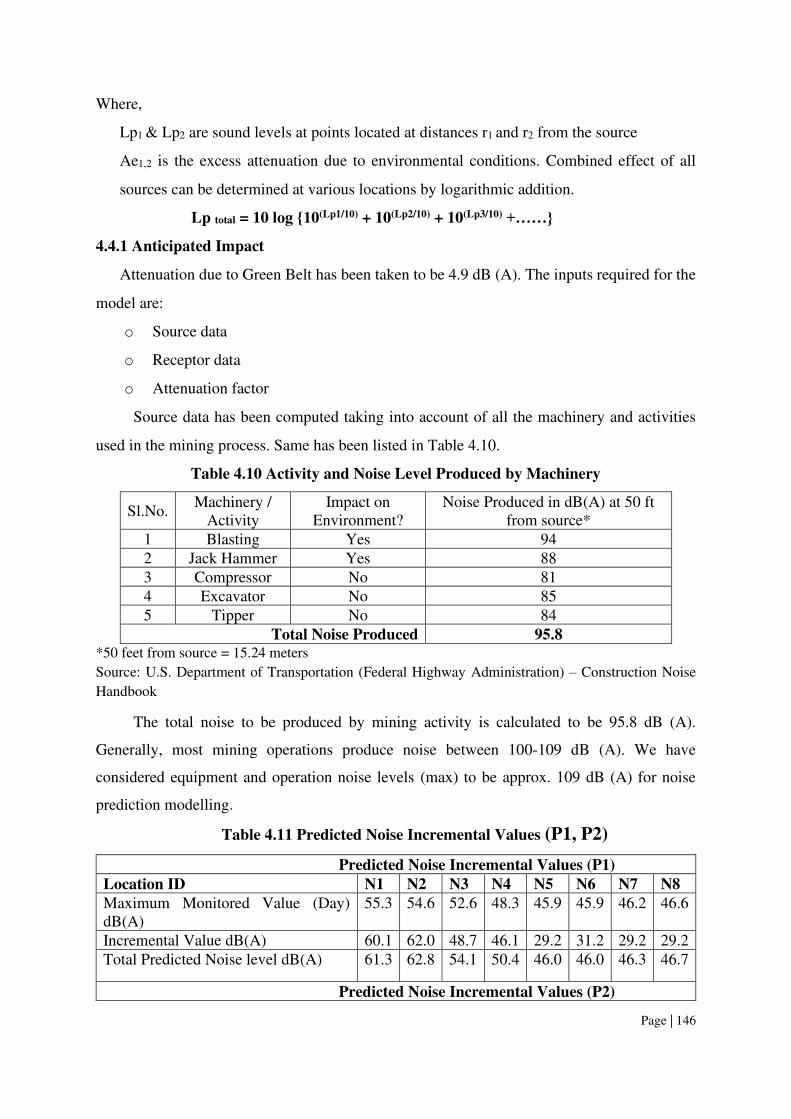
Page | 146
Where,
Lp1 & Lp2 are sound levels at points located at distances r1 and r2 from the source
Ae1,2 is the excess attenuation due to environmental conditions. Combined effect of all
sources can be determined at various locations by logarithmic addition.
Lp total = 10 log 10(Lp1/10) + 10(Lp2/10) + 10(Lp3/10) +……
4.4.1 Anticipated Impact
Attenuation due to Green Belt has been taken to be 4.9 dB (A). The inputs required for the
model are:
o Source data
o Receptor data
o Attenuation factor
Source data has been computed taking into account of all the machinery and activities
used in the mining process. Same has been listed in Table 4.10.
Table 4.10 Activity and Noise Level Produced by Machinery
Sl.No. Machinery /
Activity Impact on
Environment? Noise Produced in dB(A) at 50 ft
from source* 1 Blasting Yes 94 2 Jack Hammer Yes 88 3 Compressor No 81 4 Excavator No 85 5 Tipper No 84
Total Noise Produced 95.8 *50 feet from source = 15.24 meters
Source: U.S. Department of Transportation (Federal Highway Administration) – Construction Noise
Handbook
The total noise to be produced by mining activity is calculated to be 95.8 dB (A).
Generally, most mining operations produce noise between 100-109 dB (A). We have
considered equipment and operation noise levels (max) to be approx. 109 dB (A) for noise
prediction modelling.
Table 4.11 Predicted Noise Incremental Values (P1, P2)
Predicted Noise Incremental Values (P1)
Location ID N1 N2 N3 N4 N5 N6 N7 N8
Maximum Monitored Value (Day) dB(A)
55.3 54.6 52.6 48.3 45.9 45.9 46.2 46.6
Incremental Value dB(A) 60.1 62.0 48.7 46.1 29.2 31.2 29.2 29.2 Total Predicted Noise level dB(A) 61.3 62.8 54.1 50.4 46.0 46.0 46.3 46.7
Predicted Noise Incremental Values (P2)

Page | 147
Maximum Monitored Value (Day) dB(A)
55.7 54.6 52.6 48.3 45.9 45.9 46.2 46.6
Incremental Value dB(A) 61.0 60.1 42.0 27.4 29.5 29.7 27.2 27.0 Total Predicted Noise level dB(A) 62.0 61.2 53.0 48.3 46.0 46.0 46.3 46.6
The incremental noise level is found to be Project -P1 60.1 dB (A), Project -P2-61dB (A
in Core Zone, and ranges between 29.2 – 62 dB (A) in Buffer zone. The noise level at different
receptors in buffer zone is lower due to the distance involved and other topographical features
adding to the noise attenuation. The resultant Noise level due to monitored values and
calculated values at the receptors are based on the mathematical formula considering
attenuation due to Green Belt as 4.9 dB (A) the barrier effect. From the above table, it can be
seen that the ambient noise levels at all the locations are within permissible limits of Industrial
area (core zone) & Residential area (buffer zone) as per the noise pollution (regulation and
control) rules, 2000 (The Principal Rules were published in the Gazette of India, vide S.O.
123(E), dated 14.2.2000 and subsequently amended vide S.O. 1046(E), dated 22.11.2000, S.O.
1088(E), dated 11.10.2002, S.O. 1569 (E), dated 19.09.2006 and S.O. 50 (E) dated 11.01.2010
under the Environment (Protection) Act, 1986.).
4.4.2 Common Mitigation Measures
The following noise mitigation measures are proposed for control of noise:
o Usage of sharp drill bits while drilling which will help in reducing noise
o Secondary blasting will be totally avoided and hydraulic rock breaker will be used for
breaking boulders
o Controlled blasting with proper spacing, burden, stemming and optimum charge/delay
will be maintained
o The blasting will be carried out during favourable atmospheric condition and less
human activity timings by using nonelectrical initiation system
o Proper maintenance, oiling and greasing of machines will be done every week to
reduce generation of noise
o Provision of sound insulated chambers for the workers working on machines (HEMM)
producing higher levels of noise
o Silencers / mufflers will be installed in all machineries
o Green Belt/Plantation will be developed around the project area and along the haul
roads. The plantation minimizes propagation of noise
o Personal Protective Equipment (PPE) like ear muffs/ear plugs will be provided to the
operators of HEMM and persons working near HEMM and their use will be ensured
though training and awareness

Page | 148
o Regular medical check–up and proper training to personnel to create awareness about
adverse noise level effects
4.4.3 Ground Vibrations
Ground vibrations due to the proposed mining activities are anticipated due to operation
of mining machines like excavators, drilling and blasting, transportation vehicles, etc.,
however, the major source of ground vibration from the quarry is blasting. The major impact
of the ground vibrations is observed on the domestic houses located in the villages nearby the
mine lease area. The kuchha houses are more prone to cracks and damage due to the vibrations
induced by blasting whereas RCC framed structures can withstand more ground vibrations.
Apart from this, the ground vibrations may develop a fear factor in the nearby settlements.
Another impact due to blasting activities is fly rocks. These may fall on the houses or
agricultural fields nearby the mining lease area and may cause injury to persons or damage to
the structures. Nearest habitation from the proposed project areas are listed in in table 4.12.
The ground vibrations due to the blasting in the quarry are calculated using the empirical
equation.
The empirical equation for assessment of peak particle velocity (PPV) is given below:
V = K [R/Q0.5] –B
Where, V = peak particle velocity (mm/s) K = site and rock factor constant (500) Q = maximum instantaneous charge (kg) B = constant related to the rock and site (usually 1.6) R = distance from charge (m)
Table 4.12 Predicted PPV Values due to Blasting-P1&P2
Location ID Maximum Charge in kgs Nearest Habitation in m PPV in mm/s
P1 52 340m SW 1.051 P2 48 320m NE 1.086
Proposed Project P1 the charge of 52 kg/ blast is well below the Peak Particle Velocity
of 1.051 mm/s as per Directorate General of Mines Safety for safe level criteria through
Circular No. 7 dated 29/8/1997. But all the project proponents ensure that the charge per blast
shall be less than 100 kg and carry out blasting twice or thrice a day based on the onsite
conditions under the supervision of competent person employed. However, as per statutory
requirement control measures will be adopted to avoid the impacts due to ground vibrations
and fly rocks due to blasting.
Proposed Project P2 the charge of 48 kg/ blast is well below the Peak Particle Velocity
of 1.086 mm/s as per Directorate General of Mines Safety for safe level criteria through
Circular No. 7 dated 29/8/1997. But all the project proponents ensure that the charge per blast

Page | 149
shall be less than 100 kg and carry out blasting twice or thrice a day based on the onsite
conditions under the supervision of competent person employed. However, as per statutory
requirement control measures will be adopted to avoid the impacts due to ground vibrations
and fly rocks due to blasting
4.4.3.1 Common Mitigation Measures
o The blasting operations in the cluster quarries are carried out without deep hole
drilling and blasting using delay detonators which reduce the ground vibrations
o Proper quantity of explosives, suitable stemming materials and appropriate delay
system will be adopted to avoid overcharging and for safe blasting
o Adequate safe distance from blasting will be maintained as per DGMS guidelines
o Blasting shelter will be provided as per DGMS guidelines
o Blasting operations will be carried out only during day time
o The charge per delay will be minimized and preferably a greater number of delays
will be used per blasts
o During blasting, other activities in the immediate vicinity will be temporarily stopped
o Drilling parameters like depth, diameter and spacing will be properly designed to give
proper blast
o A fully trained explosives blast man (Mining Mate, Mines Foreman, 2nd Class Mines
Manager/ 1st Class Mines Manager) will be appointed
o A set of shot firing rules will be drawn up and blasting shall commence outlining the
detailed operating procedures that will be followed to ensure that shot firing
operations on site take place without endangering the workforce or public
o Sufficient angular stemming material will be used to confine the explosive force and
minimise environmental disturbance caused by venting / misfire
o The detonators will be connected in a predetermined sequence to ensure that only one
charge is detonated at any one time and a NONEL or similar type initiation system
will be used
o The detonation delay sequence shall be designed so as to ensure that firing of the holes
is in the direction of free faces so as to minimise vibration effects
o Appropriate blasting techniques shall be adopted in such a way that the predicted peak
particle velocity shall not exceed 0.251mm/s
o Vibration monitoring will be carried out every 6 months to check the efficacy of
blasting practices

Page | 150
4.5. BIOLOGICAL ENVIRONMENT
Methodology of Sampling Flora and fauna studies were carried out during the post
monsoon to assess the list of terrestrial plant and animal species that occur in the core area and
the buffer area up to 10 km radius from project site. No damage is created to flora and fauna
during the sampling. None of the specimens were collected as voucher specimens and for
herbarium. It is basically done through field observations only.
The core area in P1& P2 extent of 4.90.0 Ha of Rough stone quarry has an impact on
diversity of flora and fauna of surrounding area but present work was carried out on detailed
study of the impacts of Rough stone quarry on ecology and biodiversity of core lease area with
the proper mitigation and sustainable management plan. The quarry lease applied area is a plain
topography whereas in buffer zone some places agricultural land is dominated. The following
methods were applied during the baseline study of flora, fauna and diversity assessment.
The biodiversity studies were already carried out in the entire study area of 10 km
radius. The study of flora is conducted as per the guidelines of the Ministry of Environment
and Forests (MoEF & CC) and Botanical Survey of India (BSI).
The study involved in collection of primary data by conducting survey in the field,
examination of floral and faunal records in previously published reports and records. Analysis
of the information is the view of possible alteration in environment of the project site. For the
survey of fauna both direct and indirect observation methods were used.
Study of biological environment is one of the important aspects in Environmental
Impact Assessments. Biotic component comprises of both plant and animal communities which
interact within the community and between themselves but also with abiotic i.e., physical and
chemical components of the environment. Generally, a biological community is being
dependent on the environmental conditions and resources of its location it may change if there
are many major changes in the environment. The number of variables like temperature,
humidity, atmospheric conditions, soil, and topography, etc. is responsible for maintaining the
homeostasis of the environment and a change in any one or more of these variables may tend
to destabilize the ecosystem. In such cases the change may be mostly irreversible. Therefore,
the need to assess the changes of the plant and animal resources is primary requisite as these
living things determine the environmental healthiness of any given ecosystem or environment.
Page | 151
4.5.1. Anticipated Impact on Flora
None of the plants will be cut during operational phase of the mine.
There shall be negligible air emissions or effluents from the project site. During loading
the truck, dust generation will be likely. This shall be a temporary effect and not
anticipated to affect the surrounding vegetation significantly.
Most of the land in the buffer area is undulating terrain with crop lands, grass patches
and small shrubs. Hence, there will be no effect on flora of the region.
4.5.2 Mitigation Measures
4.5.2.1. General Guidelines for Green Belt Development
The project site should have a land to develop greenbelt in and around the limits of the
mine, along roads and other vacant area. The main objective of the green belt is to provide a
barrier between the source of pollution and the surrounding areas. Although, the project will
not lead to any tree cutting, it is proposed to improve the greenery of the locality by plantation
services. To avoid dust emissions, the mined materials will be covered with tarpaulin during
transportation.
Plants that grow fast will be preferred.
Preference for high canopy covers plants with local varieties.
Perennial and evergreen plants will be preferred.
The development of Green Belt is an important aspect for any plant because:
It improves the ambient air quality by controlling Suspended Particulate Matter (SPM)
in air.
It helps in noise abatement for the surrounding area.
It helps in settlement of new birds and insects within itself.
It maintains the ecological balance.
It increases the aesthetic value of site.
4.5.2.2. Environmental Management Plan - Flora and Fauna
ToR No: 38) Detailed environmental management plan (EMP) to mitigate the
environmental impacts which, should inter-alia include the impacts of change of land use,
loss of agricultural and grazing land, if any, occupational health impacts besides other
impacts specific to the proposed Project.
a. Afforestation
More number of trees has been observed along the approach road in the lease area,
which is developed by the lease owner. The 7.5m Safety distance along the boundary has been

Page | 152
identified to be utilized for subsequent Afforestation. However, the afforestation should always
be carried out in a systematic and scientific manner. Regional trees like Neem, Pongamia,
Pinnata, Casuarina will be planted along the Lease boundary and avenues as well as over non-
active dumps with interval 2m in between. A retaining wall will be constructed around the
dumping yard. The rate of survival expected to be 80% in this area. Preparation of green belt
details are given in approved mining plan.
After complete extraction of mineral, the pit will be allowed to collect rain and seepage
water to serve as a reservoir to charge the nearby wells. Fish culture will also be attempted. A
bund will be constructed around the pits. In order to minimize the impact of mining on the
vegetation outside the mine lease area, it is recommended that adequate protection measures
must be implemented. As mining involves movement of vehicles and increased anthropogenic
activities, some of the areas can be fenced by involving local people and educating them about
increased benefits of such activities.
4.5.2.3. Species Recommendation for Plantation granted in the district
Following points have been considered while recommending the species for plantation:
Natural growth of existing species and survival rate of various species.
Suitability of a particular plant species for a particular type of area.
Creating of biodiversity.
Fast growing, thick canopy copy, perennial and evergreen large leaf area.
Efficient in absorbing pollutants without major effects of natural growth.
The following species may be considering primary for plantation best suited for the
prevailing climate condition in the area.
Table No 4.13 Recommended species to plant in the greenbelt P1&P2
SI.
No
Botanical
Name of the
Plant
Family
Name
Common
Name Category
Height
(m)
Regene
rations
Sp
aci
ng
(m)
Evergr
een/
Decidu
ous
Efficien
cy
of Dust
Remova
l (%)
1 Azadiracht
a indica
Meliaceae
Neem, Vembu
Tree 15–20 Seedlin
gs 8x8
Evergreen
25.54
2 Techtona
grandis
Lamiaceae
Teak
Tree 40 Seedlin
gs 2x2
Deciduous
14.94
3 Polyalthia
longifolia
Annonaceae
Nettilingam
Tree 10 Seedlin
gs 3x3
Evergreen
29.84
4 Nerium
indicum
Apocynaceae
Arali Shrub 2–6 Cutting
s 2x2
Evergreen
12.3

Page | 153
5 Bougainvill
iea glavra
Nycaginaceae
Kakithapoo
Shrub 4 Cutting
s 3x3
Evergreen
21.35
6 Albizia
lebbeck
Fabaceae
Vagai Tree 18–30 Seedlin
g
3x3/5x5
Evergreen
23.03
7 Delonix
regia
Fabaceae
Cemmayir-konrai
Tree 12 Cutting
s
3x3/5x5
Deciduous
18.05
8
Hibiscus
rosa
sinensis
Malvaceae
seamparuthi
shrub 3 Cutting
s 3x3
Evergreen
21.09
Table 4.14 Greenbelt Development Plan P1
Year No. of trees
proposed to
be planted
Survival % Area to be
covered in m2
Name of
the
species
No. of trees
expected to
be grown
Plantation under safety zone
(In Nos.)
I 30 80% 280 Azadirac
hta
indica
Albizia
lebbeck
Delonix
regia
Techtona
grandis
Nerium
indicum, etc.,
24 II 30 80% 280 24 III 30 80% 280 24 IV 30 80% 280 24 V 30 80% 280 24
Year Plantation in quarry approach road and
village road (In Nos)
I 80 80% 80% 80% 80% 80%
64 II 80 64 III 80 64 IV 80 64 V 80 64
Proposed Project Site – P2
No. of trees
proposed to
be planted
Surviva
l % Area to be
covered in m2 Name of
the
species
No. of trees
expected to
be grown Plantation under safety zone and Dumb
(In Nos.) I 112 80% 1000 Azadirac
hta
indica
Albizia
lebbeck
Delonix
regia
Techtona
grandis
Nerium
indicum, etc.,
89 II 112 80% 1000 89 III 112 80% 1000 89 IV 112 80% 1000 89 V 112 80% 1000 89
Plantation in quarry approach road Side
(In Nos)
I 12 80% 20 9 II 12 80% 20 9 III 12 80% 20 9 IV 12 80% 20 9 V 12 80% 20 9

Page | 154
Table 4.15 Budget for Greenbelt Development Plan (P1)
S.
No Details of work
Year wise details plantation for each area
1st year
2nd year
3rd years
4th years
5th years
Rate Total
Cost
(Rs.)
1 Plantation under
safety zone (In Nos.) 30 30
30
30
30
@100 Rs Per
sapling
15,000
Plantation cost 3000 3000 3000 3000 3000
2
Plantation in quarry approach road and
village road (In Nos)
80 80 80 80 80
40,000
8000 8000 8000 8000 8000 Plantation cost
3
Maintenance (Rs.) (Manuring, Fertilizer,
Insecticide application,
watchman etc.)
Cost (Rs. 10000/-) per year for five-year period 50,000
Total 1,0,5000
Budget For Greenbelt Development Plan (P2)
1
Plantation under safety zone and Dump
(In Nos.)
112
112
112
112
112
@100 Rs Per
sapling
56,000
Plantation cost 11,200 11,200 11,200 11,200 11,200
2 Plantation in quarry
approach road 12 12 12 12 12
6,000
Plantation cost 1200 1200 1200 1200 1200
3
Maintenance (Rs.) (Manuring, Fertilizer,
Insecticide application,
watchman etc.)
Cost (Rs. 10000/-) per year for five-year period 50,000
Total 1,12,000
4.5.3. Anticipated Impact on Fauna
There is no Wildlife Sanctuary and Biosphere Reserve within 10 km radius of the
project site.
No rare, endemic & endangered species are reported in the buffer zone. However,
during the course of mining, the management will practice scientific method of mining
with proper Environmental Management Plan including pollution control measures
especially for air and noise, to avoid any adverse impact on the surrounding wildlife.
Fencing around the mine lease area to restrict the entry of stray animals.

Page | 155
Green belt development will be carried out which will help in minimizing adverse
impact on the flora found in the area.
4.5.3.1. Measures for protection and conservation of wildlife species
Topsoil has a large number of seeds of native plant species in the mining area.
Topsoil will be used for restoration and suitable surface for planted seedlings.
Checks and controls on the movement of vehicles in and out of the mine.
Undertaking mitigative measures for conducive environment to the flora and fauna in
consultation with Forest Department.
Dust suppression system will be installed within mine and periphery of mine.
Plantation around mine area will help in creating habitats for small faunal species and
to create better environment for various fauna. Creating and developing awareness for
nature and wildlife in the adjoining villages.
4.5.3.2. Mitigation Measures
Suitable plan for conservation of Schedule-I Species have prepared and necessary fund
for implement for the same will be made.
All the preventive measures will be taken for growth & development of fauna.
Creating and development awareness for nature and wildlife in the adjoin villages.
The workers shall be trained to not harm any wildlife, should it come near the project
site. No work shall be carried out after 6.00 pm.
4.5.4. Impact on Aquatic Biodiversity
Mining activities will not disturb the aquatic ecology as there is no effluent discharge
proposed from the rough stone quarry. There is no natural perennial surface water body within
the mine lease area. Krishnagiri dam is located about 8 km on the south side and Krishnagiri
Lake is located about 4.5 km on the eastern side and followed by Avathanapatti Lake is 6.5km
on the same side. Thenpenaiyaru and Markandeya river merge point is about 8.5km on the
western side. All the water bodies are located away from the applied study area, there are no
impacts of water bodies due to these mining activities. Aquatic biodiversity is observed in the
water bodies.
4.5.5. Impact Assessment on Biological Environment
This chapter highlights the various impacts on ecology and biodiversity due to mining
activity. It addresses the baseline data and its effect on flora and wild life fauna especially
threatened species (Critically Endangered, Endangered, and Vulnerable) in core mining lease
area. A detail of impact and assessments was mentioned in Table No 4.16

Page | 156
Table No 4.16 Ecological impact assessments of Kothapetta Village, Rough stone
quarry, Krishnagiri Taluk, Krishnagiri District, Tamil Nadu.
S. No Attributes Assessment
1 Activities of the project affects the
breeding/nesting sites of birds and animals
No breeding and nesting site was identified in mining lease site. The fauna sighted mostly migrated from buffer area.
2 Located near an area populated by rare or endangered species
No Endangered, Critically Endangered, vulnerable species sighted in core mining lease area.
3 Proximity to national park/wildlife
sanctuary/reserve forest /mangroves/ coastline/estuary/sea
No National Park or Eco-sensitive zone around 10km radius.
4 Proposed project restricts access to waterholes for wildlife
‘NO ‘
5 Proposed mining project impact surface water quality that also provide water to wildlife
‘NO ‘scheduled or threatened wildlife animal sighted regularly core in core area.
6 Proposed mining project increase siltation that would affect nearby biodiversity area.
Surface runoff management such as drains is constructed properly so there will be no siltation affect in nearby mining area.
7 Risk of fall/slip or cause death to wild animals due to project activities
‘NO ‘
8 The project release effluents into a water body that also supplies water to a wildlife
No water body near to core zone so chances of water become polluted is low.
9 Mining project effect the forest-based livelihood/ any specific forest product on which local livelihood depended
‘NO ‘
10 Project likely to affect migration routes ‘NO ‘migration route observed during monitoring period.
11 Project likely to affect flora of an area, which have medicinal value
‘NO ‘
12 Forestland is to be diverted, has carbon high sequestration
‘NO ‘There was no forest land diverted.
13 The project likely to affect wetlands,
Fish breeding grounds, marine ecology
‘NO ‘. Wetland was not present in near core
Mining lease area. No breeding and nesting ground present in core mining area.
*(Format Source: EIA Guidance Manual-Mining and Minerals, 2010)

Page | 157
4.5.6. Impact evaluation
Table No: 4.17 Impact Evaluation for Biological Resources
Impact Evaluation
Element
Change in the biological resources of the area due to mine development & operation and generation of emissions.
Potential Effect/
Concern
Loss of habitat, Impact on health of biological receptors due to area and line sources of air emissions including fugitive dust emissions during Rough Stone quarry development & operation activities.
Characteristics of Impacts
Nature Positive Negative Neutral
Type Direct Indirect Cumulative
Extent Project Area Local Zonal Regional
Duration Short – term Long- term
Intensity Low Medium High
Frequency Remote (R) Occasional (O) Periodic (P) Continuous (C)
Significance of Impact
Significance Insignificant Minor Moderate Major
*Note: Mark ‘’ indicates the Yes and ‘’ indicates the No.
4.6 SOCIO ECONOMIC ENVIRONMENT
4.6.1 Anticipated Impact from Proposed and Existing Projects
o Dust generation from mining activity can have negative impact on the health of the
workers and people in the nearby area.
o Approach roads can be damaged by the movement of tippers
o Increase in Employment opportunities both direct and indirect thereby increasing
economic status of people of the region.

Page | 158
4.6.2 Common Mitigation Measures for Proposed Project
o Good maintenance practices will be adopted for all machinery and equipment, which
will help to avert potential noise problems.
o Green belt will be developed in and around the project site as per Central Pollution
Control Board (CPCB) guidelines.
o Air pollution control measure will be taken to minimize the environmental impact
within the core zone.
o For the safety of workers, personal protective appliances like hand gloves, helmets,
safety shoes, goggles, aprons, nose masks and ear protecting devices will be provided
as per mines act and rules.
o Benefit to the State and the Central governments through financial revenues by way of
royalty, tax, duties, etc.., from this project directly and indirectly.
o From above details, the quarry operations will have highly beneficial positive impact
in the area
4.7 OCCUPATIONAL HEALTH AND SAFETY
Occupational health and safety hazards occur during the operational phase of mining and primarily
include the following:
o Respiratory hazards
o Noise
o Physical hazards
o Explosive storage and handling
4.7.1 Respiratory Hazards
Long-term exposure to silica dust may cause silicosis the following measures are proposed:
o Cabins of excavators and tippers will be enclosed with AC and sound proof
o Use of personal dust masks will be made compulsory
4.7.2 Noise
Workers are likely to get exposed to excessive noise levels during mining activities. The following
measures are proposed for implementation
o No employee will be exposed to a noise level greater than 85 dB(A) for a duration of
more than 8 hours per day without hearing protection
o The use of hearing protection will be enforced actively when the equivalent sound level
over 8 hours reaches 85 dB(A), the peak sound levels reach 140 dB(C), or the average
maximum sound level reaches 110 dB(A)

Page | 159
o Ear muffs provided will be capable of reducing sound levels at the ear to at least 85
dB(A)
o Periodic medical hearing checks will be performed on workers exposed to high noise
levels
4.7.3 Physical Hazards
The following measures are proposed for control of physical hazards
o Specific personnel training on work-site safety management will be taken up;
o Work site assessment will be done by rock scaling of each surface exposed to workers
to prevent accidental rock falling and / or landslide, especially after blasting activities;
o Natural barriers, temporary railing, or specific danger signals will be provided along
rock benches or other pit areas where work is performed at heights more than 2m from
ground level;
o Maintenance of yards, roads and footpaths, providing sufficient water drainage and
preventing slippery surfaces with an all-weather surface, such as coarse gravel will be
taken up.
4.7.4 Occupational Health Survey
All the persons will undergo pre-employment and periodic medical examination.
Employees will be monitored for occupational diseases by conducting the following tests
o General physical tests
o Audiometric tests
o Full chest, X-ray, Lung function tests, Spiro metric tests
o Periodic medical examination – yearly
o Lung function test – yearly, those who are exposed to dust
o Eye test
Essential medicines will be provided at the site. The medicines and other test facilities will
be provided at free of cost. The first aid box will be made available at the mine for immediate
treatment.
First aid training will be imparted to the selected employees regularly. The lists of first aid
trained members shall be displayed at strategic places.
Page | 160
4.8 MINE WASTE MANAGEMENT
Proposed project (P1) there is no overburden/Waste generated during the scheme
period. Hence, there is no disposal of Topsoil or Waste. The excavated rough stone will be
directly loaded into Tippers to the needy customers.
Proposed project (P2) the waste is generated during the mining period is 26368m3 will be
proposed dump into the all side of the mined-out pits of the lease area. The top soil of the lease
area 12m3 top soil will be utilized for the formation of mine roads, Construction of bund and
afforestation purposes
4.9 MINE CLOSURE
Mine closure plan is the most important environmental requirement in mining project. The
mine closure plan should cover technical, environmental, social, legal and financial aspects
dealing with progressive and post closure activities. The closure operation is a continuous series
of activities starting from the decommissioning of the project. Therefore, progressive mine closure
plan should be specifically dealt with in the mining plan and is to be reviewed along with mining
plan. As progressive mine closure is a continuous series of activities, it is obvious that the
proposals of scientific mining have included most of the activities to be included in the closure
plan. While formulating the closure objectives for the site, it is important to consider the existing
or the pre-mining land use of the site; and how the operation will affect this activity.
The primary aim is to ensure that the following broad objectives along with the
abandonment of the mine can be successfully achieved:
o To create a productive and sustainable after-use for the site, acceptable to mine owners,
regulatory agencies, and the public
o To protect public health and safety of the surrounding habitation
o To minimize environmental damage
o To conserve valuable attributes and aesthetics
o To overcome adverse socio-economic impacts.
4.9.1 Mine Closure Criteria
The criteria involved in mine closure are discussed below:
4.9.1.1 Physical Stability
All anthropogenic structures, which include mine workings, buildings, rest shelters etc.,
remaining after mine decommissioning should be physically stable. They should present no
hazard to public health and safety as a result of failure or physical deterioration and they should
continue to perform the functions for which they were designed. The design periods and factors

Page | 161
of safety proposed should take full account of extreme events such as floods, hurricane, winds or
earthquakes, etc. and other natural perpetual forces like erosion, etc.,
4.9.1.2 Chemical Stability
The solid wastes on the mine site should be chemically stable. This means that the
consequences of chemical changes or conditions leading to leaching of metals, salts or organic
compounds should not endanger public health and safety nor result in the deterioration of
environmental attributes. If the pollutant discharge likely to cause adverse impacts is predicted in
advance, appropriate mitigation measures like settling of suspended solids or passive treatment to
improve water quality as well as quantity, etc., could be planned. Monitoring should demonstrate
that there is no adverse effect of pollutant concentrations exceeding the statutory limits for the
water, soil and air qualities in the area around the closed mine.
4.9.1.3 Biological Stability
The stability of the surrounding environment is primarily dependent upon the physical and
chemical characteristics of the site, whereas the biological stability of the mine site itself is closely
related to rehabilitation and final land use. Nevertheless, biological stability can significantly
influence physical or chemical stability by stabilizing soil cover, prevention of erosion/wash off,
leaching, etc.,
A vegetation cover over the disturbed site is usually one of the main objectives of the
rehabilitation programme, as vegetation cover is the best long-term method of stabilizing the site.
When the major earthwork components of the rehabilitation programme have been completed, the
process of establishing a stable vegetation community begins. For re-vegetation, management of
soil nutrient levels is an important consideration. Additions of nutrients are useful under three
situations.
o Where the nutrient level of spread topsoil is lower than material in-situ e.g., for
development of social forestry
o Where it is intended to grow plants with a higher nutrient requirement than those
occurring naturally e.g., planning for agriculture.Where it is desirable to get a quick
growth response from the native flora during those times when moisture is not a
limiting factor e.g., development of green barriers
The Mine closure plan should be as per the approved mining plan. The mine closure is a
part of approved mine plan and activities of closure shall be carried out as per the process described
in mine closure plan.

Page | 162
CHAPTER V
ANALYSIS OF ALTERNATIVES TECHNOLOGY AND SITE
5.1 Introduction
Consideration of alternatives to a project proposal is a requirement of EIA process.
During the scoping process, alternatives to a proposal can be considered or refined, either
directly or by reference to the key issues identified. A comparison of alternatives helps to
determine the best method of achieving the project objectives with minimum environmental
impacts or indicates the most environmentally friendly and cost-effective options.
5.2 Factors Behind the Selection of Project Site
Kothapetta village Rough Stone Quarry project for excavation of Rough Stone, which is site
specific. All the proposed mining lease areas have following advantages The mineral deposit
occurs in a non-forest area.
o There is no habitation within the project area; hence no R & R issues exist.
o There is no river, stream, nallah and water bodies in the applied mine lease areas.
o Availability of skilled, semi-skilled and unskilled workers in this region.
o All the basic amenities such as medical, firefighting, education, transportation,
communication and infrastructural facilities are well connected and accessible.
o The mining operations will not intersect the ground water level. Hence, no impact
on ground water environment.
o Study area falls in seismic zone – III, there is no major history of landslides,
earthquake, subsidence etc., recorded in the past history.
5.3 Analysis of Alternative Site
No alternatives are suggested as the mine site is mineral specific.
5.4 Factors Behind Selection of Proposed Technology
Proposed project P1 opencast manual method of quarrying. The quarry operation
involves equipment’s like hammer and chisel and slurry blasting like expanding chemicals will
be used for liberates the required size of foundation stones and jelly from the parent rock mass
and Manual Loading and transportation of rough stone
Semi mechanized open cast mining operation with drilling and blasting method will be
used to extract rough stone in the proposed project P2. The proposed mining lease areas have
following advantages:
o As the mineral deposition is homogeneous and batholith formation, therefore
opencast method of working is preferred over underground method.
Page | 163
o The material will be loaded with the help of excavators into tracters / trippers and
transported to the need by customers.
o Blasting and availability of drills along with controlled blasting technology gives
desired fragmentation so that the mineral is handled safely and used without
secondary blasting.
o Semi-skilled labours fit for quarrying operations are easily available around the
nearby villages.
5.5 Analysis of Alternative Technology
Open cast Semi mechanized method has been selected for this project. This technology
is having least gestation period, economically viable, safest and less labour intensive. The
method has inbuilt flexibility for increasing or decreasing the production as per market
condition.

Page | 164
CHAPTER VI
ENVIRONMENTAL MONITORING PROGRAMME
6.0 General
The monitoring and evaluation of environmental parameters indicates potential changes
occurring in the environment, which paves way for implementation of rectifying measures
wherever required to maintain the status of the natural environment. Evaluation is also a very
effective tool to judge the effectiveness or deficiency of the measures adopted and provides
insight for future corrections.
The main objective of environmental monitoring is to ensure that the obtained results in
respect of environmental attributes and prevailing conditions during operation stage are in
conformity with the prediction during the planning stage. In case of substantial deviation from
the earlier prediction of results, this forms as base data to identify the cause and suggest
remedial measures. Environmental monitoring is mandatory to meet compliance of statutory
provisions under the Environment (Protection) Act, 1986, relevant conditions regarding
monitoring covered under EC orders issued by the SEIAA-TN as well as the conditions set
forth under the order issued by Tamil Nadu Pollution Control Board while granting CTE/CTO.
6.1 Methodology of Monitoring Mechanism
Implementation of EMP and periodic monitoring will be carried out by respective project
proponents. A comprehensive monitoring mechanism has been devised for monitoring of
impacts due to Proposed Projects; Environmental protection measures like dust suppression,
control of noise and blast vibrations, maintenance of machinery and vehicles, housekeeping in
the mine premises, plantation, implementation of Environmental Management Plan and
environmental clearance conditions will be monitored by the respective mine management. On
the other hand, implementation of area level protection measures like green belt development,
environmental quality monitoring etc., are taken up by a senior executive who reports to their
Mine Management.
An Environment monitoring cell (EMC) will be constituted to monitor the
implementation of EMP and other environmental protection measures in the proposed quarry.
The responsibilities of this cell will be:
o Implementation of pollution control measures
o Monitoring programme implementation
o Post-plantation care
o To check the efficiency of pollution control measures taken

Page | 165
o Any other activity as may be related to environment
o Seeking expert’s advice when needed.
The environmental monitoring cell will co-ordinate all monitoring programs at site and
data thus generated will be regularly furnished to the State regulatory agencies as compliance
status reports.
The sampling and analysis report of the monitored environmental attributes will be
submitted to the Tamil Nadu Pollution Control Board (TNPCB) at a frequency of half-yearly
and yearly by each proposed project proponent. The half-yearly reports are submitted to
Ministry of Environment and Forest, Regional Office and SEIAA-TN as well.
The sampling and analysis of the environmental attributes will be as per the guidelines
of Central Pollution Control Board (CPCB)/Ministry of Environment, Forest and Climate
Change (MoEF & CC). Figure 6.1
Figure 6.1: Proposed Environmental Monitoring Chart
*The Environmental Monitoring Cell will be formed in the Proposed Projects
* Respective Proposed
Project proponent.
HEAD OF ORGANIZATION
MINE MANAGEMENT LEVEL
Mines Manager
Mine Foreman Mining Mate Site Supervisor
Empanelled Consultant /
External Laboratory
Approved by NABL /
MoEF
AREA LEVEL
Environment Officer
Assistant Gardner Water Sprinkler
Operator

Page | 166
6.2 Implementation Schedule of Mitigation Measures
The mitigation measures proposed in Chapter-IV will be implemented so as to reduce
the impact on the environment due to the operations of the Proposed Projects. Implementation
schedule of mitigation measures is given in Table 6.1.
Table 6.1 Implementation Schedule for Proposed Projects- P1&P2
Sl
No. RECOMMENDATIONS TIME PERIOD SCHEDULE
1 Land Environment Control Measures
Before commissioning of the project
Immediately after the commencement of
project
2 Soil Quality Control
Measures Before commissioning of the
project
Immediately after the commencement of
project
3 Water Pollution Control
Measures
Before commissioning of the project and along with
mining operation
Immediately and as project progress
4 Air Pollution Control
Measures
Before commissioning of the project and along with
mining operation
Immediately and as project progress
5 Noise Pollution Control
Measures
Before commissioning of the project and along with
mining operation
Immediately and as project progress
6 Ecological Environment Phase wise implementation every year along with mine
operations
Immediately and as project progress
6.3 Monitoring Schedule and Frequency
Monitoring shall confirm that commitments are being met. This may take the form of
direct measurement and recording of quantitative information, such as amounts and
concentrations of discharges, emissions and wastes, for measurement against statutory
standards. Monitoring may include socio-economic interaction, through local liaison activities
or even assessment of complaints.
The environmental monitoring will be conducted in the mine operations as follows:
Air quality
Water and wastewater quality
Noise levels
Soil Quality and
Greenbelt Development
The details of monitoring are detailed in Table 6.2.

Page | 167
Table 6.2 Proposed Monitoring Schedule Post EC for the Proposed Quarry P1&P2
S.
No.
Environment
Attributes Location
Monitoring Parameters
Duration Frequency
1 Air Quality 2 Locations (1 Core &
1 Buffer) 24 hours
Once in 6
months
Fugitive Dust, PM2.5,
PM10, SO2 and NOx.
2 Meteorology
At mine site before
start of Air Quality
Monitoring & IMD
Secondary Data
Hourly /
Daily
Continuous
online
monitoring
Wind speed, Wind
direction,
Temperature, Relative
humidity and Rainfall
3
Water
Quality
Monitoring
2 Locations (1SW & 1
GW) -
Once in 6
months
Parameters specified
under IS:10500, 1993
& CPCB Norms
4 Hydrology
Water level in open
wells in buffer zone
around 1 km at specific
wells
- Once in 6
months Depth in bgl
5 Noise 2 Locations (1 Core &
1 Buffer)
Hourly –
1 Day
Once in 6
months
Leq, Lmax, Lmin, Leq
Day & Leq Night
6 Vibration
At the nearest
habitation (in case of
reporting)
–
During
blasting
Operation
Peak Particle Velocity
7 Soil 2 Locations (1 Core &
1 Buffer) –
Once in six
months
Physical and
Chemical
Characteristics
8 Greenbelt Within the Project Area Daily Monthly Maintenance
Source: Guidance of manual for mining of minerals, February 2010
6.4 Budgetary Provision for EMP
The cost in respect of monitoring of environmental attributes, parameter to be
monitored, sampling/monitoring locations with frequency and cost provision against each
proposal is shown in Table 6.3. Monitoring work will be outsourced to external laboratory
approved by NABL / MoEF.
The proposed capital cost for Environmental Monitoring Programme is Rs 76,000/- and
the recurring cost is Rs 3,80,000/- per annum for Proposed Project P1.
The proposed capital cost for Environmental Monitoring Programme is Rs 64,000/- and
the recurring cost is Rs 3,20,000/- per annum for Proposed Project P2.

Page | 168
Table 6.3 Environment Monitoring Budget P1&P2
PROPOSED PROJECT SITE – P1
S. No. Parameter Capital Cost Recurring Cost Per Annum
1 Air Quality
Rs. 3,80,000/- Rs. 76,000/-
2 Meteorology 3 Water Quality 4 Hydrology 5 Soil Quality 6 Noise Quality 7 Vibration Study
Total Rs. 3,80,000/- Rs. 76,000/-
PROPOSED PROJECT SITE – P2
1 Air Quality
Rs. 3,20,000/- Rs. 64,000/-
2 Meteorology 3 Water Quality 4 Hydrology 5 Soil Quality 6 Noise Quality 7 Vibration Study
Total Rs. 3,20,000/- Rs. 64,000/-
Source: Approved Mining Plan
6.5 Reporting Schedules of Monitored Data
The monitored data on air quality, water quality, noise levels and other environmental
attributes will be periodically examined by the Cluster Mine Management Coordinator and
Respective Head of Organization for taking necessary corrective measures. The monitoring
data will be submitted to Tamil Nadu State Pollution Control Board in the Compliance to CTO
Conditions & environmental audit statements every year to MoEF & CC and Half-Yearly
Compliance Monitoring Reports to MoEF & CC Regional Office and SEIAA.
Periodical reports to be submitted to:
o MoEF & CC – Half yearly status report
o TNPCB - Half yearly status report
o Department of Geology and Mining: quarterly, half yearly annual reports
Besides the Mines Manager/Agent of respective project will submit the periodical reports to:
o Director of mines safety
o Labour enforcement officer
o Controller of explosives as per the norms stipulated by the department

Page | 162
CHAPTER V
ANALYSIS OF ALTERNATIVES TECHNOLOGY AND SITE
5.1 Introduction
Consideration of alternatives to a project proposal is a requirement of EIA process.
During the scoping process, alternatives to a proposal can be considered or refined, either
directly or by reference to the key issues identified. A comparison of alternatives helps to
determine the best method of achieving the project objectives with minimum environmental
impacts or indicates the most environmentally friendly and cost-effective options.
5.2 Factors Behind the Selection of Project Site
Kothapetta village Rough Stone Quarry project for excavation of Rough Stone, which is site
specific. All the proposed mining lease areas have following advantages The mineral deposit
occurs in a non-forest area.
o There is no habitation within the project area; hence no R & R issues exist.
o There is no river, stream, nallah and water bodies in the applied mine lease areas.
o Availability of skilled, semi-skilled and unskilled workers in this region.
o All the basic amenities such as medical, firefighting, education, transportation,
communication and infrastructural facilities are well connected and accessible.
o The mining operations will not intersect the ground water level. Hence, no impact
on ground water environment.
o Study area falls in seismic zone – III, there is no major history of landslides,
earthquake, subsidence etc., recorded in the past history.
5.3 Analysis of Alternative Site
No alternatives are suggested as the mine site is mineral specific.
5.4 Factors Behind Selection of Proposed Technology
Proposed project P1 opencast manual method of quarrying. The quarry operation
involves equipment’s like hammer and chisel and slurry blasting like expanding chemicals will
be used for liberates the required size of foundation stones and jelly from the parent rock mass
and Manual Loading and transportation of rough stone
Semi mechanized open cast mining operation with drilling and blasting method will be
used to extract rough stone in the proposed project P2. The proposed mining lease areas have
following advantages:
o As the mineral deposition is homogeneous and batholith formation, therefore
opencast method of working is preferred over underground method.

Page | 163
o The material will be loaded with the help of excavators into tracters / trippers and
transported to the need by customers.
o Blasting and availability of drills along with controlled blasting technology gives
desired fragmentation so that the mineral is handled safely and used without
secondary blasting.
o Semi-skilled labours fit for quarrying operations are easily available around the
nearby villages.
5.5 Analysis of Alternative Technology
Open cast Semi mechanized method has been selected for this project. This technology
is having least gestation period, economically viable, safest and less labour intensive. The
method has inbuilt flexibility for increasing or decreasing the production as per market
condition.

Page | 164
CHAPTER VI
ENVIRONMENTAL MONITORING PROGRAMME
6.0 General
The monitoring and evaluation of environmental parameters indicates potential changes
occurring in the environment, which paves way for implementation of rectifying measures
wherever required to maintain the status of the natural environment. Evaluation is also a very
effective tool to judge the effectiveness or deficiency of the measures adopted and provides
insight for future corrections.
The main objective of environmental monitoring is to ensure that the obtained results in
respect of environmental attributes and prevailing conditions during operation stage are in
conformity with the prediction during the planning stage. In case of substantial deviation from
the earlier prediction of results, this forms as base data to identify the cause and suggest
remedial measures. Environmental monitoring is mandatory to meet compliance of statutory
provisions under the Environment (Protection) Act, 1986, relevant conditions regarding
monitoring covered under EC orders issued by the SEIAA-TN as well as the conditions set
forth under the order issued by Tamil Nadu Pollution Control Board while granting CTE/CTO.
6.1 Methodology of Monitoring Mechanism
Implementation of EMP and periodic monitoring will be carried out by respective project
proponents. A comprehensive monitoring mechanism has been devised for monitoring of
impacts due to Proposed Projects; Environmental protection measures like dust suppression,
control of noise and blast vibrations, maintenance of machinery and vehicles, housekeeping in
the mine premises, plantation, implementation of Environmental Management Plan and
environmental clearance conditions will be monitored by the respective mine management. On
the other hand, implementation of area level protection measures like green belt development,
environmental quality monitoring etc., are taken up by a senior executive who reports to their
Mine Management.
An Environment monitoring cell (EMC) will be constituted to monitor the
implementation of EMP and other environmental protection measures in the proposed quarry.
The responsibilities of this cell will be:
o Implementation of pollution control measures
o Monitoring programme implementation
o Post-plantation care
o To check the efficiency of pollution control measures taken

Page | 165
o Any other activity as may be related to environment
o Seeking expert’s advice when needed.
The environmental monitoring cell will co-ordinate all monitoring programs at site and
data thus generated will be regularly furnished to the State regulatory agencies as compliance
status reports.
The sampling and analysis report of the monitored environmental attributes will be
submitted to the Tamil Nadu Pollution Control Board (TNPCB) at a frequency of half-yearly
and yearly by each proposed project proponent. The half-yearly reports are submitted to
Ministry of Environment and Forest, Regional Office and SEIAA-TN as well.
The sampling and analysis of the environmental attributes will be as per the guidelines
of Central Pollution Control Board (CPCB)/Ministry of Environment, Forest and Climate
Change (MoEF & CC). Figure 6.1
Figure 6.1: Proposed Environmental Monitoring Chart
*The Environmental Monitoring Cell will be formed in the Proposed Projects
* Respective Proposed
Project proponent.
HEAD OF ORGANIZATION
MINE MANAGEMENT LEVEL
Mines Manager
Mine Foreman Mining Mate Site Supervisor
Empanelled Consultant /
External Laboratory
Approved by NABL /
MoEF
AREA LEVEL
Environment Officer
Assistant Gardner Water Sprinkler
Operator

Page | 166
6.2 Implementation Schedule of Mitigation Measures
The mitigation measures proposed in Chapter-IV will be implemented so as to reduce
the impact on the environment due to the operations of the Proposed Projects. Implementation
schedule of mitigation measures is given in Table 6.1.
Table 6.1 Implementation Schedule for Proposed Projects- P1&P2
Sl
No. RECOMMENDATIONS TIME PERIOD SCHEDULE
1 Land Environment Control Measures
Before commissioning of the project
Immediately after the commencement of
project
2 Soil Quality Control
Measures Before commissioning of the
project
Immediately after the commencement of
project
3 Water Pollution Control
Measures
Before commissioning of the project and along with
mining operation
Immediately and as project progress
4 Air Pollution Control
Measures
Before commissioning of the project and along with
mining operation
Immediately and as project progress
5 Noise Pollution Control
Measures
Before commissioning of the project and along with
mining operation
Immediately and as project progress
6 Ecological Environment Phase wise implementation every year along with mine
operations
Immediately and as project progress
6.3 Monitoring Schedule and Frequency
Monitoring shall confirm that commitments are being met. This may take the form of
direct measurement and recording of quantitative information, such as amounts and
concentrations of discharges, emissions and wastes, for measurement against statutory
standards. Monitoring may include socio-economic interaction, through local liaison activities
or even assessment of complaints.
The environmental monitoring will be conducted in the mine operations as follows:
Air quality
Water and wastewater quality
Noise levels
Soil Quality and
Greenbelt Development
The details of monitoring are detailed in Table 6.2.

Page | 167
Table 6.2 Proposed Monitoring Schedule Post EC for the Proposed Quarry P1&P2
S.
No.
Environment
Attributes Location
Monitoring Parameters
Duration Frequency
1 Air Quality 2 Locations (1 Core &
1 Buffer) 24 hours
Once in 6
months
Fugitive Dust, PM2.5,
PM10, SO2 and NOx.
2 Meteorology
At mine site before
start of Air Quality
Monitoring & IMD
Secondary Data
Hourly /
Daily
Continuous
online
monitoring
Wind speed, Wind
direction,
Temperature, Relative
humidity and Rainfall
3
Water
Quality
Monitoring
2 Locations (1SW & 1
GW) -
Once in 6
months
Parameters specified
under IS:10500, 1993
& CPCB Norms
4 Hydrology
Water level in open
wells in buffer zone
around 1 km at specific
wells
- Once in 6
months Depth in bgl
5 Noise 2 Locations (1 Core &
1 Buffer)
Hourly –
1 Day
Once in 6
months
Leq, Lmax, Lmin, Leq
Day & Leq Night
6 Vibration
At the nearest
habitation (in case of
reporting)
–
During
blasting
Operation
Peak Particle Velocity
7 Soil 2 Locations (1 Core &
1 Buffer) –
Once in six
months
Physical and
Chemical
Characteristics
8 Greenbelt Within the Project Area Daily Monthly Maintenance
Source: Guidance of manual for mining of minerals, February 2010
6.4 Budgetary Provision for EMP
The cost in respect of monitoring of environmental attributes, parameter to be
monitored, sampling/monitoring locations with frequency and cost provision against each
proposal is shown in Table 6.3. Monitoring work will be outsourced to external laboratory
approved by NABL / MoEF.
The proposed capital cost for Environmental Monitoring Programme is Rs 76,000/- and
the recurring cost is Rs 3,80,000/- per annum for Proposed Project P1.
The proposed capital cost for Environmental Monitoring Programme is Rs 64,000/- and
the recurring cost is Rs 3,20,000/- per annum for Proposed Project P2.
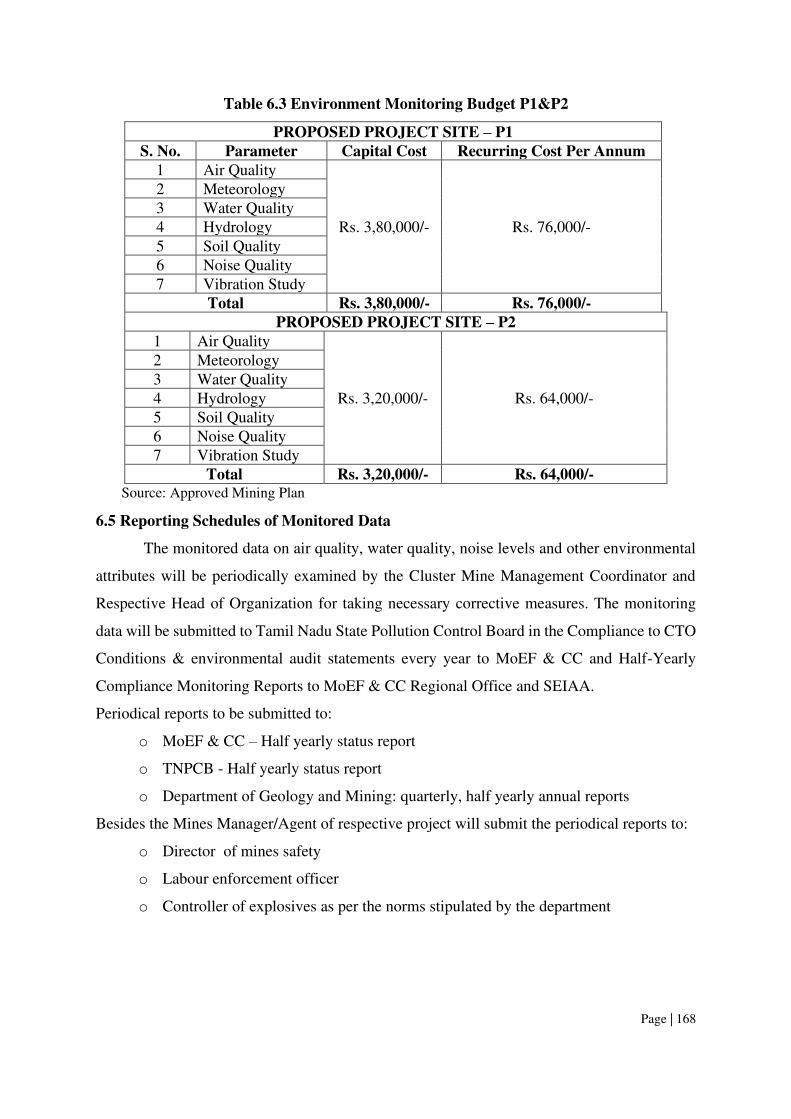
Page | 168
Table 6.3 Environment Monitoring Budget P1&P2
PROPOSED PROJECT SITE – P1
S. No. Parameter Capital Cost Recurring Cost Per Annum
1 Air Quality
Rs. 3,80,000/- Rs. 76,000/-
2 Meteorology 3 Water Quality 4 Hydrology 5 Soil Quality 6 Noise Quality 7 Vibration Study
Total Rs. 3,80,000/- Rs. 76,000/-
PROPOSED PROJECT SITE – P2
1 Air Quality
Rs. 3,20,000/- Rs. 64,000/-
2 Meteorology 3 Water Quality 4 Hydrology 5 Soil Quality 6 Noise Quality 7 Vibration Study
Total Rs. 3,20,000/- Rs. 64,000/-
Source: Approved Mining Plan
6.5 Reporting Schedules of Monitored Data
The monitored data on air quality, water quality, noise levels and other environmental
attributes will be periodically examined by the Cluster Mine Management Coordinator and
Respective Head of Organization for taking necessary corrective measures. The monitoring
data will be submitted to Tamil Nadu State Pollution Control Board in the Compliance to CTO
Conditions & environmental audit statements every year to MoEF & CC and Half-Yearly
Compliance Monitoring Reports to MoEF & CC Regional Office and SEIAA.
Periodical reports to be submitted to:
o MoEF & CC – Half yearly status report
o TNPCB - Half yearly status report
o Department of Geology and Mining: quarterly, half yearly annual reports
Besides the Mines Manager/Agent of respective project will submit the periodical reports to:
o Director of mines safety
o Labour enforcement officer
o Controller of explosives as per the norms stipulated by the department

Page | 169
CHAPTER VII
ADDITIONAL STUDIES
7.0 General
The following additional studies were done as per items identified by project proponents
and items identified by regulatory authority. Public and other stakeholders will be incorporated
after Public Hearing.
o Public Consultation
o Risk Assessment
o Disaster Management Plan
o Cumulative Impact Study
o Plastic Waste Management
o Post-COVID Health Management Plan
7.1 Public Consultation for Proposed Projects P1 And P2
Application to The Member Secretary of the Tamil Nadu Pollution Control Board
(TNPCB) to conduct Public Hearing in a systematic, time bound and transparent manner
ensuring widest possible public participation at the project site or in its close proximity in the
district is submitted along with this Draft EIA / EMP Report and the outcome of public hearing
proceedings will be detailed in the Final EIA/EMP Report.
7.2 Risk Assessment for Proposed Projects P1 And P2
The methodology for the risk assessment has been based on the specific risk assessment
guidance issued by the Directorate General of Mine Safety (DGMS), Dhanbad, vide Circular
No.13 of 2002, dated 31st December, 2002. The DGMS risk assessment process is intended to
identify existing and probable hazards in the work environment and all operations and assess
the risk levels of those hazards in order to prioritize those that need immediate attention.
Further, mechanisms responsible for these hazards are identified and their control measures,
set to timetable are recorded along with pinpointed responsibilities.
The whole quarry operation will be carried out under the direction of a Qualified
Competent Mine Manager holding certificate of competency to manage a metalliferous mine
granted by the DGMS, Dhanbad for proposed project. Risk Assessment is all about prevention
of accidents and to take necessary steps to prevent it from happening.
Factors of risks involved due to human induced activities in connection with these
proposed mining & allied activities with detailed analysis of causes and control measures for
the mine is given in below Table 7.1.
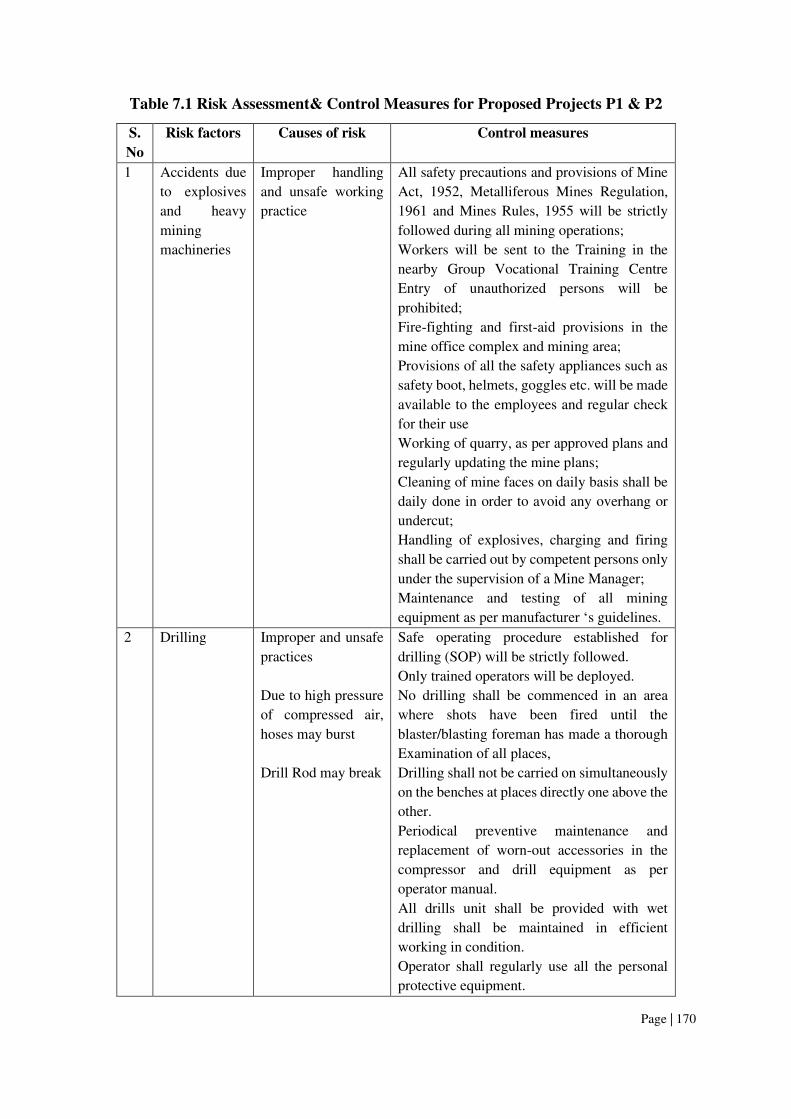
Page | 170
Table 7.1 Risk Assessment& Control Measures for Proposed Projects P1 & P2
S.
No
Risk factors Causes of risk Control measures
1 Accidents due
to explosives
and heavy
mining
machineries
Improper handling
and unsafe working
practice
All safety precautions and provisions of Mine
Act, 1952, Metalliferous Mines Regulation,
1961 and Mines Rules, 1955 will be strictly
followed during all mining operations;
Workers will be sent to the Training in the
nearby Group Vocational Training Centre
Entry of unauthorized persons will be
prohibited;
Fire-fighting and first-aid provisions in the
mine office complex and mining area;
Provisions of all the safety appliances such as
safety boot, helmets, goggles etc. will be made
available to the employees and regular check
for their use
Working of quarry, as per approved plans and
regularly updating the mine plans;
Cleaning of mine faces on daily basis shall be
daily done in order to avoid any overhang or
undercut;
Handling of explosives, charging and firing
shall be carried out by competent persons only
under the supervision of a Mine Manager;
Maintenance and testing of all mining
equipment as per manufacturer ‘s guidelines.
2 Drilling Improper and unsafe
practices
Due to high pressure
of compressed air,
hoses may burst
Drill Rod may break
Safe operating procedure established for
drilling (SOP) will be strictly followed.
Only trained operators will be deployed.
No drilling shall be commenced in an area
where shots have been fired until the
blaster/blasting foreman has made a thorough
Examination of all places,
Drilling shall not be carried on simultaneously
on the benches at places directly one above the
other.
Periodical preventive maintenance and
replacement of worn-out accessories in the
compressor and drill equipment as per
operator manual.
All drills unit shall be provided with wet
drilling shall be maintained in efficient
working in condition.
Operator shall regularly use all the personal
protective equipment.

Page | 171
4 Blasting Fly rock, ground
vibration, Noise and
dust.
Improper charging,
stemming &
Blasting/ fining of
blast holes
Vibration due to
movement of
vehicles
Restrict maximum charge per delay as per
regulations and by optimum blast hole pattern,
vibrations will be controlled within the
permissible limit and blasting can be
conducted safely.
SOP for Charging, Stemming &
Blasting/Firing of Blast Holes will be
followed by blasting crew during initial stage
of operation
Shots are fired during daytime only.
All holes charged on any one day shall be fired
on the same day.
The danger zone will be distinctly demarcated
(by means of red flags)
5 Transportation Potential hazards
and unsafe workings
contributing to
accident and injuries
Overloading of
material
While reversal &
overtaking of vehicle
Operator of truck
leaving his cabin
when it is loaded.
Before commencing work, drivers personally
check the truck/tipper for oil(s), fuel and water
levels, tyre inflation, general cleanliness and
inspect the brakes, steering system, warning
devices including automatically operated
audio-visual reversing alarm, rear view
mirrors, side indicator lights etc., are in good
condition.
Not allow any unauthorized person to ride on
the vehicle nor allow any unauthorized person
to operate the vehicle.
Concave mirrors should be kept at all corners
All vehicles should be fitted with reverse horn
with one spotter at every tipping point
Loading according to the vehicle capacity
Periodical maintenance of vehicles as per
operator manual
6 Natural
calamities
Unexpected
happenings
Escape Routes will be provided to prevent
inundation of storm water
Fire Extinguishers & Sand Buckets
7 Failure of
Mine Benches
and Pit Slope
Slope geometry,
Geological structure
Ultimate or over all pit slope shall be below
60° and each bench height shall be 5m height.
Source: Analysed and Proposed by FAE & EC
7.3 Disaster Management Plan for Proposed Projects P1 And P2
Natural disasters like Earthquake, Landslides have not been recorded in the past history
as the terrain is categorized under seismic zone III. The area is far away from the sea hence the
disaster due to heavy floods and tsunamis are not anticipated.

Page | 172
EMERGENCY
COORDINATOR
MINE MANAGER
SUPPORT
TEAM
RESCUE
TEAM
FIRE-FIGHTING
TEAM
The Disaster Management Plan is aimed to ensure safety of life, protection of
environment, protection of installation, restoration of production and salvage operations in this
same order of priorities.
The objective of the Disaster Management Plan is to make use of the combined resources of
the mine and the outside services to achieve the following:
o Rescue and medical treatment of casualties;
o Safeguard other people;
o Minimize damage to property and the environment;
o Initially contain and ultimately bring the incident under control;
o Secure the safe rehabilitation of affected area; and
o Preserve relevant records and equipment for the subsequent inquiry into the cause
and circumstances of the emergency.
In case a disaster takes place, despite preventive actions, disaster management will have
to be done in line with the descriptions below. There is an organization proposed for dealing
with the emergency situations and the coordination among key personnel and their team has
been shown in Fig- 7.1.
Figure 7.1 Disaster Management Team Layout for Proposed Projects P1 And P2
The emergency organization shall be headed by emergency coordinator who will be
qualified competent mines manager. In his absence senior most people available at the mine
shall be emergency coordinator till arrival of mines manager. There would be three teams for
taking care of emergency situations – Fire-Fighting Team, Rescue Team and Support Team.
The proposed composition of the teams is given in Table 7.2.

Page | 173
Table 7.2 Proposed Teams for Emergency Situation -P1 & P2
DESIGNATION QUALIFICATION
FIRE-FIGHTING TEAM
Team Leader/ Emergency Coordinator (EC)
Mines Manager
Team Member Mines Foreman Team Member Mining Mate
RESCUE TEAM
Team Leader/ Emergency Coordinator (EC)
Mines Manager
Team Member/ Incident Controller (IC) Environment Officer Team Member Mining Foreman
SUPPORT TEAM
Team Leader/ Emergency Coordinator (EC)
Mines Manager
Assistant Team Leader Environment Officer Team Member Mining Mate
Security Team Leader/ Emergency Security Controller
Mines Foreman
Once the mine becomes operational, the above table along with names of personnel will
be prepared and made easily available to workers for respective proposed quarries. A mobile
communication network and wireless shall connect Mine Emergency Control Room (MECR)
to control various departments of the mine, fire station and neighbouring industrial units/mines.
7.3.1 Roles and Responsibilities of Emergency Team
(a) Emergency coordinator (EC)
The emergency coordinator shall assume absolute control of site and shall be located at
MECR.
(b) Incident controller (IC)
Incident controller shall be a person who shall go to the scene of emergency and
supervise the action plan to overcome or contain the emergency. Shift supervisor or
Environmental Officer shall assume the charge of IC.
(c) Communication and advisory team
The advisory and communication team shall consist of heads of Mining Departments
i.e., Mines Manager
(d) Roll call coordinator
The Mine Foreman shall be Roll Call Coordinator. The roll call coordinator will
conduct the roll call and will evacuate the mine personnel to assembly point. His prime
function shall be to account for all personnel on duty.
(e) Search and rescue team

Page | 174
There shall be a group of people trained and equipped to carryout rescue operation of
trapped personnel. The people trained in first aid and fire-fighting shall be included in search
and rescue team.
(f) Emergency security controller
Emergency Security Controller shall be senior most security person located at main
gate office and directing the outside agencies e.g., fire brigade, police, doctor and media
men etc.,
7.3.2 Emergency Control Procedure
The onset of emergency, will in all probability, commence with a major fire or
explosion or collapse of wall along excavation and shall be detected by various safety devices
and also by members of operational staff on duty. If located by a staff member on duty, he (as
per site emergency procedure of which he is adequately briefed) will go to nearest alarm call
point, break glass and trigger off the alarms. He will also try his best to inform about location
and nature of accident to the emergency control room. In accordance with work emergency
Procedure the following key activities will immediately take place to interpret and take control
of emergency.
o On site fire crew led by a fireman will arrive at the site of incident with fire foam tenders
and necessary equipment.
o Emergency security controller will commence his role from main gate office
o Incident controller shall rush to the site of emergency and with the help of rescue team
and will start handling the emergency.
o Site main controller will arrive at MECR with members of his advisory and
communication team and will assume absolute control of the site.
o He will receive information continuously from incident controller and give decisions
and directions to:
Incident controller
Mine control rooms
Emergency security controller
7.3.3 Proposed Fire Extinguishers
The following type of fire extinguishers has been proposed at strategic locations within
the mine.

Page | 175
Table 7.3 Proposed Fire Extinguishers at Different Locations in P1 & P2
Location Type of Fire Extinguishers
Electrical Equipment’s CO2 type, foam type, dry chemical powder type Fuel Storage Area CO2 type, foam type, dry chemical powder type, Sand bucket Office Area Dry chemical type, foam type
7.3.4 Alarm System
On receiving the message of disaster from Site Controller, fire-fighting team, the mine
control room attendant will sound siren wailing for 5 minutes. Incident controller will arrange
to broadcast disaster message through public address system. On receiving the message of
"Emergency Over" from Incident Controller the emergency control room attendant will give
"All Clear Signal”, by sounding alarm straight for 2 minutes.
The features of alarm system will be explained to one and all to avoid panic or
misunderstanding during disaster. In order to prevent or take care of hazard / disasters if any
the following control measures have been adopted.
o Fire-fighting and first-aid provisions in the mines office complex and mining area
are provided.
o Provisions of all the safety appliances such as safety boot, helmets, goggles, dust
masks, ear plugs and ear muffs etc. are made available to the employees and the use
of same is strictly adhered to through regular monitoring.
o Training and refresher courses for all the employees working in hazardous
premises.
o Working of mine, as per approved plans and regularly updating the mine plans.
o Cleaning of mine faces is regularly done.
o Handling of explosives, charging and blasting are carried out only by qualified
persons following SOP.
o Checking and regular maintenance of garland drains and earthen bunds to avoid any
inflow of surface water in the mine pit.
o Provision of high-capacity standby pumps with generator sets with enough quantity
of diesel for emergency pumping especially during monsoon.
o A blasting SIREN is used at the time of blasting for audio signal.
o Before blasting and after blasting, red and green flags are displayed as visual
signals.
o Warning notice boards indicating the time of blasting and NOT TO TRESPASS are
displayed at prominent places.
o Regular maintenance and testing of all mining equipment were carried out as per
manufacturer’s guidelines.

Page | 176
7.4 Cumulative Impact Study
For easy representation of Proposed and Existing quarries in the Cluster are given
unique codes and identifies and studied in this EIA & EMP Report.
Table 7.4 List of Quarries within 500 Meter Radius
Source: i).AD Letter (P1) – Rc.No. 96/2021 - Mines, Date:10.03.2022
ii) AD Letter (P2) – Rc.No. 1179/2020 - Mines, Date:10.03.2022
Note: -
Cluster area is calculated as per MoEF & CC Notification – S.O. 2269 (E) Dated: 01.07.2016 EX1 and EX2 have been taken into the calculation of cluster extent. But they have not been included in the cumulative studies as they are inactive.
PROPOSED QUARRIES Code Name of the Owner Village &
Taluk
S.F. Nos Extent GO.No &
Date
Status
P1
Tmt.SA.SumithaShankr, W/o Shankar Raj, 252, Metbanda Village, Venkatapuram Panchayat, Krishnagiri (Po), Taluk District.
Kothapetta Village
Krishnagiri Taluk,
56/1 (Part -5)
1.20.0 ha Roc.49/2016 (Mines – 2)
Dated 18.08.2016
01.09.2016 to 31.08.2026 (Scheme for
next five years)
P2
M/s.MA Quality stone, No.58 – B, Gandhi Nagar, Krishnagiri taluk, District - 635001
Kothapetta Village
Krishnagiri Taluk,
87/1B2 (Part)
3.70.0 ha Roc.No.1179/2020/M
dated:22.02.2021
Proposed quarry
TOTAL 4.90.0 ha EXISTING QUARRIES
Code Name of the Owner Village &
Taluk
S.F. Nos Extent GO.No &
Date
Lease Period
E1 Tmt. K.M. Vijaya, W/o Madhiazhagan, No.58B Gandhi Nagar, Krishnagiri Town and Taluk.
Kothapetta Village
Krishnagiri Taluk,
78/1B 4.00.0 ha Roc.419/2018/M
Dated 30.05.2018
30.5.2018 to 29.5.2023
E2 M/s. Devarajaa M. Sand, No. 58 B Gandhi Nagar, Krishnagiri Town and Taluk
Kothapetta Village
Krishnagiri Taluk,
78/1A (Part) 78/1B (Part)
4.00.0 ha Roc.418/2018/M
Dated 30.05.2018
31.5.2018 to 30.5.2023
TOTAL 8.00.0ha
TOTAL CLUSTER EXTENT 12.9.0 ha
DETAIL OF ABANDONED / OLD QUARRIES
Code Name of the Owner Village &
Taluk
S.F. Nos Extent GO.No &
Date
Lease Period
EX1 Tmt.Qummarunnisa, W/o.Abdul Jaffer, No.2, Rahamatulla, St,Krishnagiri Dt.
Kothapetta Village
Krishnagiri Taluk,
87/1B1(Part),87/1B2
4.75.0 Roc.No.08/2013/Mines
dated: 05.02.2016
02.03.2016 to
01.03.2021
EX2 Thiru G. Ganesan, Avdhanapatti Village, Agraharam Post, Krishnagiri taluk
Kothapetta Village
Krishnagiri Taluk,
56/1 (P – D) 2.54.0 Roc.No.611/2009/Mines - 2 dated:
14.05.2015
14.05.2015 to
13.05.2020
TOTAL 7.29ha
TOTAL CLUSTER EXTENT 20.19.0 ha

Page | 177
Table 7.5 Salient Features of Proposed Project Site -P1
Name of the Quarry Tmt.SA. Sumithashankr Rough stone quarry Toposheet No 57 – L/02 Latitude between 12°32'53.25"N to 12°32'57.45"N Longitude between 78°12'29.71"E to 78°12'35.28"E Highest Elevation 525m-531m AMSL Ultimate depth of Mining
40m [10m above ground level + 30m below ground level]
Geological Resources Rough Stone in m3 Top soil m3
4,73,598 -
Mineable Reserves Rough Stone in m3 Top Soil m3
1,79,843 - Proposed reserve for five years up to the depth of 40m bgl
1,79,843 -
Existing Pit Dimension Existing Pit Dimension: 49m (L) x 60m (W) x 5m (D) AGL
Ultimate Pit Dimension Pit I - 63m (L) x 46m (W) x 40m (D) [10m AGL + 30m BGL] Pit I - 90m (L) x 58m (W) x 35m (D) [10m AGL + 25m BGL]
Water Level in the surrounds area
70 m bgl
Method of Mining
Opencast Manual Method, the quarry operation involves equipments like hammer and chisel and slurry blasting like expanding chemicals (Calcium carbide) will be used for liberate the required size of foundation stones and jelly from the parent rock mass.
Topography The Project area is exhibiting undulated terrain. The gradient is towards North-eastern side and altitude of the area is ranges between 525 m to 531m above from Mean Sea level.
Tippers 3Nos
Blasting Method
The quarrying operation is proposed to carried out by Manual Opencast Method in conjunction with conventional method of mining to splitting of rock mass of considerable volume from the parent rock mass by hammer, chisel and slurry explosives like expanding chemical to loosen the rough stone and further made to smaller sizes by manually with Handy hammer and chisel and loading the rough stone by manually from pithead to the needy customer. No deep hole drilling and heavy blasting involved in this manual quarry operation.
Proposed Manpower Deployment
30 Nos
Project Cost Rs.92,31,000, /- CER Cost @ 2% of Project Cost
Rs.1,84,620/-
Nearby Water Bodies Periya lake 1.5km South Kathinayanapalli lake 2.9km East Krishnagiri dam 4.9 SW
Greenbelt Development Plan
Proposed to plant 150 trees in 1406 Sq.m area in the 7.5 &10 m Safety Zone
Proposed Water Requirement
3.5 KLD
Nearest Habitation Kallukurikki –1.0Km - NE

Page | 178
Table 7.6 Salient Features of Proposed Project Site -P2
Name of the Quarry M/s. MA Quality Stone Rough Stone Quarry.
Toposheet No. 57-L/02 Latitude Between 12°33' 04.6251''N to12° 32' 53.7570''N Longitude Between 78°12'46.0552''E to78°12' 57.5020''E Highest Elevation 570m AMSL
Proposed Depth of Mining 50 m (1m Topsoil + 49m Rough Stone) 45m AGL +5m
BGL
Geological Resources Rough Stone in m3 Mine waste in m3 Topsoil in m3
7,35,007 36749 7713
Mineable Reserves Rough Stone in m3 Mine waste in m3 Topsoil in m3
650251 32511 5836 Production first 5 years 500977 26368 12 Existing Pit Dimension Nil Ultimate Pit Dimension 402m (L) x 101m (W) (Avg) x 50m (D) Water Level in the surrounds area
70m to 75m BGL
Method of Mining Opencast semi mechanized mining method involving drilling and blasting.
Topography The Project area is exhibits elevated terrain with the gentle slope towards South eastern. Side. The average elevation of the area is 520m above mean sea level.
Machinery proposed
Jack Hammer 6 Nos Compressor 2 Nos Hydraulic Excavator 1 No Tippers 2Nos
Blasting Method Jack Hammer drilling and controlled Blasting is proposed Proposed Manpower Deployment
15 Nos
Project Cost Rs.66,40,000/- CER Cost @ 2% of Project Cost
Rs. 1,32,800/-
Nearby Water Bodies Periya lake 1.8km-South
Kathinayanapalli lake 2.3km East Krishnagiri dam 5.4km SW
Greenbelt Development Plan 560trees will be planted in the 7.5 m, safety zones covering an area of in 5000 m2
Proposed Water Requirement 3.0 KLD Nearest Habitation Kallukurikki –1.0Km - North
Source: Approved Mining Plan

Page | 179
Table 7.7 Salient Features of Existing Quarry -E1
Salient features of Existing quarry – E1
Name of the Quarry Tmt. K.M. Vijaya, Rough Stone Quarry Toposheet No 78/1B Latitude between 12° 32' 44.24"N to 12° 32' 42.74"N, Longitude between 12' 52.82"E to 78°12' 44.59"E
Geological Resources Rough Stone in m3 Topsoil m3
9,52,000 m3 -
Mineable Reserves Rough Stone in m3 Topsoil m3
4,56,960 m3 - Ultimate Pit Dimension 158m (L) * 126m (W) * 38m (D)
Method of Mining Opencast Mechanized Mining Method involving drilling
and blasting
Machinery proposed
Jack Hammer 6 Nos Compressor 2 Nos Hydraulic Excavator 1 No Tippers 4 Nos
Blasting Method
Controlled Blasting Method by shot hole drilling and small dia of 25mm slurry explosive are proposed to be used for shattering and heaving effect for removal and winning of Rough Stone. No deep hole drilling is proposed.
Proposed Manpower Deployment
18
Project Cost 30.3 lakhs CER Cost @ 2% of Project Cost
Rs.67,000/-
Source: Approved Mining Plan
Table 7.8 Salient Features of Existing Quarry -E2
Salient features of Existing quarry – E2
Name of the Quarry Thiru. Sri Devaraajaa 'M' Sand, Rough Stone Quarry Toposheet No 78/1A(P) & 78/1B(P) Latitude between 12° 32' 49.88"N to 12° 32' 46.60"N Longitude between 78° 12' 49.42"E to 78°12' 39.28"E
Geological Resources Rough Stone in m3 Gravel m3
8,68,000 m3 -
Mineable Reserves Rough Stone in m3 Gravel m3
5,03,440 m3 - Ultimate Pit Dimension 162m (L) * 134m (W) * 35m (D)
Method of Mining Opencast Mechanized Mining Method involving drilling
and blasting
Machinery proposed
Jack Hammer 4 Nos Compressor 2 Nos Hydraulic Excavator 1 No Tippers 3 Nos
Blasting Method Controlled Blasting Method by shot hole drilling and small dia of 25mm slurry explosive are proposed to be used for

Page | 180
shattering and heaving effect for removal and winning of Rough Stone. No deep hole drilling is proposed.
Proposed Manpower Deployment
18
Project Cost 30.0 lakhs CER Cost @ 2% of Project Cost
Rs.67,000/-
Table 7.9 Salient Features of Abundant Quarry -ABD-1&2 Abandoned / Old Quarries
S.
No.
Name and Address of
the lessee
Village &
Taluk
S.F.
No’s. Extent
(in ha)
District Proc.
Letter / Date
Lease
Period
1.
Tmt.Qummarunnisa, W/o.Abdul Jaffer, No.2, Rahamatulla, St,Krishnagiri Dt.
Kothapetta
Village
Krishnagiri
Taluk,
87/1B1
(Part),8
7/1B2
4.75.0 Roc.No.08/201
3/Mines dated:
05.02.2016
02.03.2016
to
01.03.2021
2.
Thiru G. Ganesan, Avdhanapatti Village,Agraharam
Post, Krishnagiri taluk
Kothapetta
Village
Krishnagiri
Taluk,
56/1
(Part-D)
2.54.0 Roc.No.611/20
09/Mines - 2
dated:
14.05.2015
14.05.2015
to
13.05.2020
The Cumulative Impact is mainly anticipated due to drilling & blasting and excavation
and transportation activities in all the quarries (proposed and existing) within the cluster and
major impact anticipated is on Air & Noise Environment and Ground Vibrations due to
blasting.
7.4.1 Air Environment
Calculating the Cumulative Load of Mining within the cluster is as shown in table 7.10
Table 7.10 Cumulative Production Load of Rough Stone
Quarry Production for five
years plan period
Per Year
Production in m3
Per Day
Production in
m3
Number of
Lorry Load Per
Day
P1 1,79,843 35,969 120 20
P2 5,00,977 1,00,195 334 56
Total 6,80,820 1,36,164 454 76
E1 4,56,960 91,392 305 51
E2 5,03,440 1,00,688 336 56
Total 9,60,400 1,92,080 641 107
Grand Total 16,41,220 3,28,244 1095 183
On a cumulative basis considering the two proposed quarries, it can be seen that the
overall production of Rough Stone is 454 m3 per day with capacity of 76 trips of Rough Stone
per day from the cluster. And the load of existing quarries is covered under existing
environment of the cluster. Based on the above production quantities the emissions due to

Page | 181
various activities in all the 4 mines includes various activities like ground preparation,
excavation, handling and transport of ore. These activities have been analysed systematically
basing on USEPA-Emission Estimation Technique Manual, for Mining AP-42, to arrive at
possible emissions to the atmosphere and estimated emissions are given in Table 7.11.
Table 7.11 Emission Estimation from Quarries Within 500 Meter Radius
EMISSION ESTIMATION FOR QUARRY “P1”
Estimated Emission Rate for PM10
Activity Source type Value Unit
Drilling Point Source 0.045758480 g/s
Blasting Point Source 0.000048526 g/s
Mineral Loading Point Source 0.034857187 g/s
Haul Road Line Source 0.002483544 g/s/m
Overall Mine Area Source 0.040647399 g/s
Estimated Emission Rate for SO2 Overall Mine Area Source 8.86071E-05 g/s
Estimated Emission Rate for NOx Overall Mine Area Source 0.000002427 g/s
EMISSION ESTIMATION FOR QUARRY “P2”
Estimated Emission Rate for PM10
Activity Source type Value Unit
Drilling Point Source 0.088846782 g/s
Blasting Point Source 0.001339131 g/s
Mineral Loading Point Source 0.043058810 g/s
Haul Road Line Source 0.002493618 g/s/m
Overall Mine Area Source 0.056948569 g/s
Estimated Emission Rate for SO2 Overall Mine Area Source 0.000783053 g/s
Estimated Emission Rate for NOx Overall Mine Area Source 0.000043090 g/s
EMISSION ESTIMATION FOR QUARRY “E1”
Estimated Emission Rate for PM10
Activity Source type Value Unit
Drilling Point Source 0.085194351 g/s
Blasting Point Source 0.001085597 g/s
Mineral Loading Point Source 0.041619985 g/s
Haul Road Line Source 0.002490316 g/s/m
Overall Mine Area Source 0.049975097 g/s
Estimated Emission Rate for SO2 Overall Mine Area Source 0.000565509 g/s
Estimated Emission Rate for NOx Overall Mine Area Source 0.000023612 g/s
EMISSION ESTIMATION FOR QUARRY “E2”
Estimated Emission Rate for PM10
Activity Source type Value Unit
Drilling Point Source 0.086229927 g/s
Blasting Point Source 0.001153200 g/s
Mineral Loading Point Source 0.041787943 g/s
Haul Road Line Source 0.002490652 g/s/m
Overall Mine Area Source 0.050853075 g/s
Estimated Emission Rate for SO2 Overall Mine Area Source 0.00059062 g/s
Estimated Emission Rate for NOx Overall Mine Area Source 0.000025593 g/s
Source: Emission Calculations

Page | 182
Table 7.12 Incremental & Resultant GLC within Cluster
PM10 in µg/m3
Location P1 P2 E1 E2
Background 38.0 35.0 36.0 33.0 Highest Incremental 13.89 13.89 12.82 12.45
Resultant 51.89 48.89 48.82 45.45 NAAQ Norms 100 µg/m3
SO2 in µg/m3
Location P1 P2 E1 E2
Background 6.1 6.0 5.2 5.3 Highest Incremental 3.49 3.49 3.32 3.30
Resultant 9.59 9.49 8.52 8.60 NAAQ Norms 80 µg/m3
NOx in µg/m3
Location P1 P2 E1 E2
Background 21.8 21.4 19.4 19.7 Incremental 8.79 8.79 7.92 7.85
Resultant 30.59 30.19 27.32 27.55 NAAQ Norms 80 µg/m3
7.4.2 Noise Environment
Noise pollution is mainly due to operation like drilling & blasting and plying of trucks
& HEMM. Cumulative Noise modelling has been carried out considering blasting and
compressor operation (drilling) and transportation activities. Predictions have been carried out
to compute the noise level at various distances around the different quarries within the 500 m
radius.
For hemispherical sound wave propagation through homogeneous loss free medium,
one can estimate noise levels at various locations at different sources using model based on
first principle.
Lp2 = Lp1 - 20 log (r2/r1) - Ae1, 2
Where:
Lp1& Lp2 are sound levels at points located at distances r1& r2 from the source.
Ae1, 2 is the excess attenuation due to environmental conditions. Combined effect of all sources
can be determined at various locations by logarithmic addition.
Lptotal = 10 log 10(Lp1/10) + 10(Lp2/10) + 10(Lp3/10) +……
Attenuation due to Green Belt has been taken to be 4.9 dB (A). The inputs required for the
model are:
Source data has been computed taking into account of all the machinery and activities used in
the mining process.
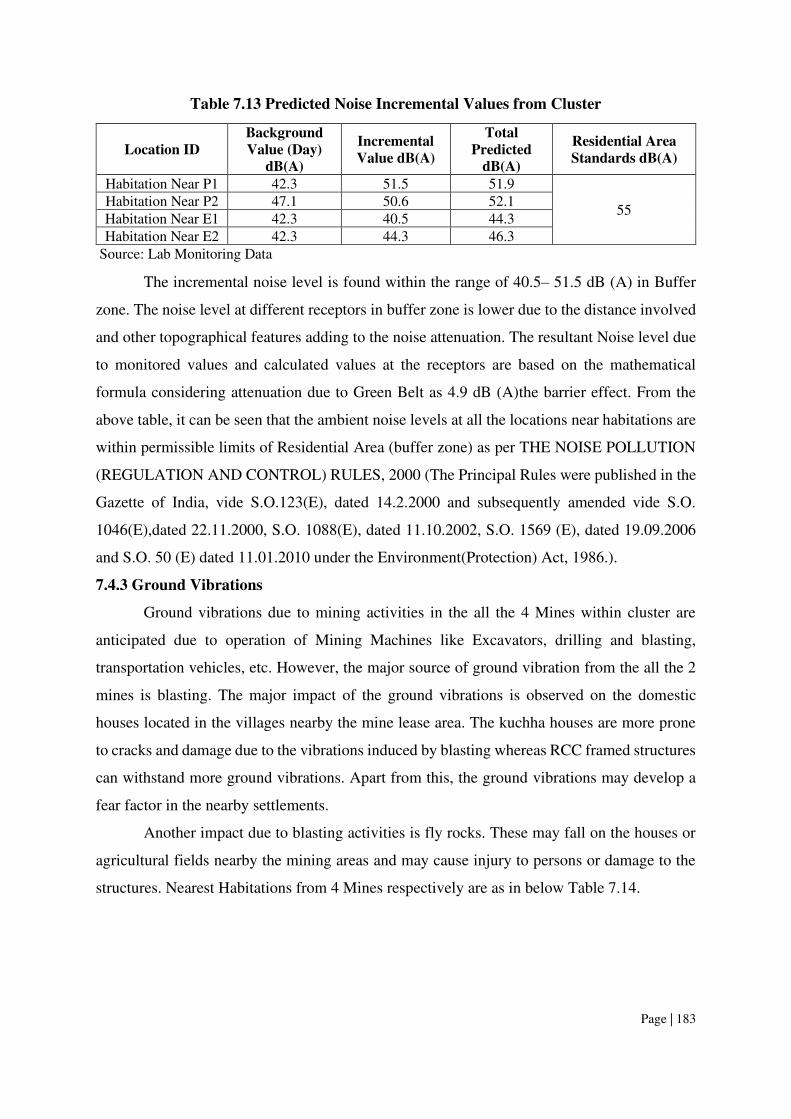
Page | 183
Table 7.13 Predicted Noise Incremental Values from Cluster
Location ID
Background
Value (Day)
dB(A)
Incremental
Value dB(A)
Total
Predicted
dB(A)
Residential Area
Standards dB(A)
Habitation Near P1 42.3 51.5 51.9
55 Habitation Near P2 47.1 50.6 52.1 Habitation Near E1 42.3 40.5 44.3 Habitation Near E2 42.3 44.3 46.3
Source: Lab Monitoring Data
The incremental noise level is found within the range of 40.5– 51.5 dB (A) in Buffer
zone. The noise level at different receptors in buffer zone is lower due to the distance involved
and other topographical features adding to the noise attenuation. The resultant Noise level due
to monitored values and calculated values at the receptors are based on the mathematical
formula considering attenuation due to Green Belt as 4.9 dB (A)the barrier effect. From the
above table, it can be seen that the ambient noise levels at all the locations near habitations are
within permissible limits of Residential Area (buffer zone) as per THE NOISE POLLUTION
(REGULATION AND CONTROL) RULES, 2000 (The Principal Rules were published in the
Gazette of India, vide S.O.123(E), dated 14.2.2000 and subsequently amended vide S.O.
1046(E),dated 22.11.2000, S.O. 1088(E), dated 11.10.2002, S.O. 1569 (E), dated 19.09.2006
and S.O. 50 (E) dated 11.01.2010 under the Environment(Protection) Act, 1986.).
7.4.3 Ground Vibrations
Ground vibrations due to mining activities in the all the 4 Mines within cluster are
anticipated due to operation of Mining Machines like Excavators, drilling and blasting,
transportation vehicles, etc. However, the major source of ground vibration from the all the 2
mines is blasting. The major impact of the ground vibrations is observed on the domestic
houses located in the villages nearby the mine lease area. The kuchha houses are more prone
to cracks and damage due to the vibrations induced by blasting whereas RCC framed structures
can withstand more ground vibrations. Apart from this, the ground vibrations may develop a
fear factor in the nearby settlements.
Another impact due to blasting activities is fly rocks. These may fall on the houses or
agricultural fields nearby the mining areas and may cause injury to persons or damage to the
structures. Nearest Habitations from 4 Mines respectively are as in below Table 7.14.

Page | 184
Table 7.14 Nearest Habitation from Each Mine
Location ID Distance & Direction
Habitation Near P1 340m SW
Habitation Near P2 320m NE
Habitation Near E1 740m NW
Habitation Near E2 860m NW
The ground vibrations due to the blasting in all the mines are calculated using the
empirical equation for assessment of peak particle velocity (PPV) is:
V = K [R/Q0.5] –B
Where –
V = Peak particle velocity (mm/s)
K = Site and rock factor constant
Q = Maximum instantaneous charge (kg)
B = Constant related to the rock and site (usually 1.6)
R = Distance from charge (m)
Table 7.15 Ground Vibrations At 4 Mines
Location ID Maximum Charge in kgs Nearest Habitation in m PPV in mm/s
P1 52 340m SW 1.051
P2 48 320m NE 1.086
E1 44 740m NW 0.265
E2 48 860m NW 0.223
Source: Blasting Calculations
From the above table, the charge per blast is considered as maximum in each mine and
the resultant PPV is well below the Peak Particle Velocity of 8 mm/s as per Directorate General
of Mines Safety for safe level criteria through Circular No. 7 dated 29/8/1997.
7.4.4 Socio Economic Environment
The 4 Mines shall contribute towards CER and the community shall develop.
Table 7.16 Socio Economic Benefits From 4 Mines
Project Cost CER @ 2%
P1 Rs.92,31,000/- Rs.1,84,620/-
P2 Rs. 66,40,000/- Rs.1,32,800/-
Total Rs. 1,58,71,000/- Rs. 3,17,420/-
E1 Rs.30,30,000/- Rs.60,600/-
E2 Rs.30,00,000/- Rs.60,000/-
Total Rs.60,30,000/- Rs 1,20,000/-
Grand Total Rs. 2,19,01,000/- Rs. 4,37,420/-
As per para 6 (II) of the office memorandum, all the mines being a green field project
& Capital Investment is ≤ 100 crores, they shall contribute 2% of Capital Investment towards
CER as per directions of EAC/SEAC.
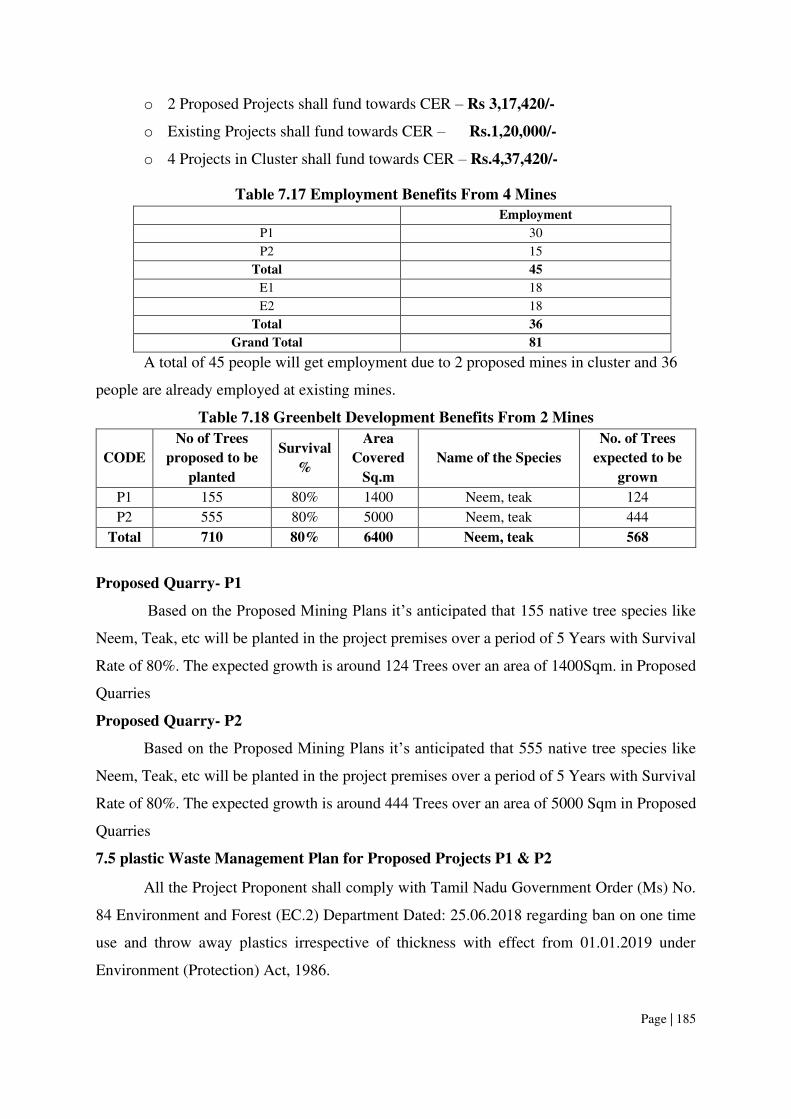
Page | 185
o 2 Proposed Projects shall fund towards CER – Rs 3,17,420/-
o Existing Projects shall fund towards CER – Rs.1,20,000/-
o 4 Projects in Cluster shall fund towards CER – Rs.4,37,420/-
Table 7.17 Employment Benefits From 4 Mines
Employment
P1 30
P2 15
Total 45
E1 18
E2 18
Total 36
Grand Total 81
A total of 45 people will get employment due to 2 proposed mines in cluster and 36
people are already employed at existing mines.
Table 7.18 Greenbelt Development Benefits From 2 Mines
CODE
No of Trees
proposed to be
planted
Survival
%
Area
Covered
Sq.m
Name of the Species
No. of Trees
expected to be
grown
P1 155 80% 1400 Neem, teak 124
P2 555 80% 5000 Neem, teak 444
Total 710 80% 6400 Neem, teak 568
Proposed Quarry- P1
Based on the Proposed Mining Plans it’s anticipated that 155 native tree species like
Neem, Teak, etc will be planted in the project premises over a period of 5 Years with Survival
Rate of 80%. The expected growth is around 124 Trees over an area of 1400Sqm. in Proposed
Quarries
Proposed Quarry- P2
Based on the Proposed Mining Plans it’s anticipated that 555 native tree species like
Neem, Teak, etc will be planted in the project premises over a period of 5 Years with Survival
Rate of 80%. The expected growth is around 444 Trees over an area of 5000 Sqm in Proposed
Quarries
7.5 plastic Waste Management Plan for Proposed Projects P1 & P2
All the Project Proponent shall comply with Tamil Nadu Government Order (Ms) No.
84 Environment and Forest (EC.2) Department Dated: 25.06.2018 regarding ban on one time
use and throw away plastics irrespective of thickness with effect from 01.01.2019 under
Environment (Protection) Act, 1986.

Page | 186
7.5.1 Objective
o To investigate the actual supply chain network of plastic waste.
o To identify and propose a sustainable plastic waste management by installing bins
for collection of recyclables with all the plastic waste
o Preparation of a system design layout, and necessary modalities for implementation
and monitoring.
Table 7.19 Action Plan to Manage Plastic Waste P1 & P2
Sl.No. Activity Responsibility
1 Framing of Layout Design by incorporating provision of the Rules, user
fee to be charged from waste generators for plastic waste management,
penalties/fines for littering, burning plastic waste or committing any other
acts of public nuisance
Mines
Manager
2 Enforcing waste generators to practice segregation of bio-degradable,
recyclable and domestic hazardous waste
Mines
Manager
3 Collection of plastic waste Mines
Foreman
4 Setting up of Material Recovery Facilities Mines
Manager
5 Segregation of Recyclable and Non-Recyclable plastic waste at Material
Recovery Facilities
Mines
Foreman
6 Channelization of Recyclable Plastic Waste to registered recyclers Mines
Foreman
7 Channelization of Non-Recyclable Plastic Waste for use either in Cement
kilns, in Road Construction
Mines
Foreman
8 Creating awareness among all the stakeholders about their responsibility Mines
Manager
9 Surprise checking’s of littering, open burning of plastic waste or committing any other acts of public nuisance
Mine Owner
Source: Proposed by FAE’s and EC
7.6 POST COVID HEALTH MANAGEMENT PLAN FOR PROPOSED PROJECTS P1
& P2
COVID – 19 diseases caused by SARS-CoV-2 Coronavirus is relatively a new disease,
with fresh information being known on a dynamic basis about the natural history of the disease,
especially in terms of post-recovery events.
After acute COVID-19 illness, recovered patients may continue to report wide variety
of signs and symptoms including fatigue, body ache, cough, sore throat, difficulty in breathing,
etc. As of now there is limited evidence of post-COVID sequalae and further research is
required and is being actively pursued. A holistic approach is required for follow up care and
well-being of all post COVID recovering patients.

Page | 187
7.6.1 Post-COVID Follow Up Protocol
o Continue COVID appropriate behaviour (use of mask, hand & respiratory hygiene,
physical distancing).
o Drink adequate amount of warm water (if not contra-indicated).
o Make sure your workplaces are clean and hygienic
o Surfaces (e.g., desks and tables) and objects (e.g., telephones, helmet) need to be
wiped with disinfectant regularly
o Put sanitizing hand rub dispensers in prominent places around the workplace. Make
sure these dispensers are regularly refilled
o Display posters promoting hand-washing
o Make sure that staff, contractors and customers have access to places where they can
wash their hands with soap and water
o Display posters promoting respiratory hygiene.
o Brief your employees, contractors and customers that if COVID-19 starts spreading
in your community anyone with even a mild cough or low-grade fever (37.3°C or
more) need to stay at home. They should also stay home (or work from home) if they
have had to take simple medications, such as paracetamol/acetaminophen, ibuprofen
or aspirin, which may mask symptoms of infection
o Keep communicating and promoting the message that people need to stay at home
even if they have just mild symptoms of COVID-19.
o Consider whether a face-to-face meeting or event is needed. Could it be replaced by
a teleconference or online event?
o Could the meeting or event be scaled down so that fewer people attend?
o Pre-order sufficient supplies and materials, including tissues and hand sanitizer for
all employees. Have surgical masks available to offer anyone who develops
respiratory symptoms.
o It is also suggested by the Ministry of AYUSH that the use of Chyawanprash in the
morning (1 teaspoonful) with Luke warm water/milk is highly recommended (under
the direction of Registered Ayurveda physician) as in the clinical practice
Chyawanprash is believed to be effective in post-recovery period.
o If there is persistent dry cough / sore throat, do saline gargles and take steam
inhalation. The addition of herbs/spices for gargling/steam inhalation. Cough

Page | 188
medications, should be taken on advice of medical doctor or qualified practitioner
of Ayush.
o Look for early warning signs like high grade fever, breathlessness, Sp 02 < 95%,
unexplained chest pain, new onset of confusion, focal weakness.
o Avoid smoking and consumption of alcohol.
o Communicate to your employees and contractors about the plan and make sure they
are aware of what they need to do – or not do – under the plan. Emphasize key points
such as the importance of staying away from work even if they have only mild
symptoms or have had to take simple medications (e.g., paracetamol, ibuprofen)
which may mask the symptoms
The plan should address how to keep your business running even if a significant number of
employees, contractors and suppliers cannot come to your place of business - either due to local
restrictions on travel or due to illness.

Page | 189
CHAPTER VIII
PROJECT BENEFITS
8.0 GENERAL
The proposed projects P1&P2 at Kothapetta Village aims to produce cumulatively
6,80,820m3 rough stone over a period of 5 years. This will enhance the socio-economic
activities in the adjoining areas and will result in the following benefits
o Increase in Employment Potential
o Improvement in Socio-Economic Welfare
o Improvement in Physical Infrastructure
o Improvement in Social infrastructure
8.1 EMPLOYMENT POTENTIAL
It is proposed to provide employment to about 30 persons in (P1) and 15 Persons in
(P2) quarry for carrying out mining operations and give preference to the local people in
providing employment in this cluster. In addition, there will be opportunity for indirect
employment to many people in the form of contractual jobs, business opportunities, service
facilities etc. the economic status of the local people will be enhanced due to mining project.
8.2 SOCIO-ECONOMIC WELFARE MEASURES PROPOSED
The impact of mining activity in the area will be more positive on the socio-economic
environment in the immediate project impact area. The employment opportunities both direct
and indirect will contribute to enhanced money incomes to job seekers with minimal skill sets
especially among the local communities.
8.3 IMPROVEMENT IN PHYSICAL INFRASTRUCTURE
The proposed quarry is located in Kothapetta Village, Krishnagiri Taluk, Krishnagiri
District of Tamil Nadu and the area have communications, roads and other facilities already
well established. The following physical infrastructure facilities will further improve due to
proposed mine.
o Road Transport facilities
o Communications
o Medical, Educational and social benefits will be made available to the nearby civilian
population in addition to the workmen employed in the mine.

Page | 190
8.4 IMPROVEMENT IN SOCIAL INFRASTRUCTURE
Employment is expected during civil construction period, in trade, garbage lifting,
sanitation and other ancillary services, Employment in these sectors will be primarily
temporary or contractual and involvement of unskilled labour will be more. A major part of the
labour force will be mainly from local villagers who are expected to engage themselves both
in agriculture and mining activities. This will enhance their income and lead to overall
economic growth of the area.
8.5 OTHER TANGIBLE BENEFITS
The proposed mine is likely to have other tangible benefits as given below.
o Indirect employment opportunities to local people in contractual works like
construction of infrastructural facilities, transportation, sanitation for supply of goods
and services to the mine and other community services
o Additional housing demand for rental accommodation will increase
o Cultural, recreation and aesthetic facilities will also improve
o Improvement in communication, transport, education, community development and
medical facilities and overall change in employment and income opportunity
o The State Government will also benefit directly from the proposed mine, through
increased revenue from royalties, cess, DMF, GST etc.,
8.6 CORPORATE SOCIAL RESPONSIBILITY
Individual Project Proponents will take responsibility to develop awareness among all
levels of their staff about CSR activities and the integration of social processes with business
processes. Those involved with the undertaking of CSR activities will be provided with
adequate training and re-orientation.
Under this programme, the project proponents will take-up following programmes for
social and economic development of villages within 10 km of the project site. For this purpose,
separate budget will be provided every year. For finalization of these schemes, proponent will
interact with LSG. The schemes will be selected from the following broad areas –
o Health Services
o Social Development
o Infrastructure Development
o Education & Sports
o Self-Employment
o CSR Cost Estimation

Page | 191
o CSR activities will be taken up in the Kothapetta village mainly contributing to
education, health, training of women self-help groups and contribution to infrastructure
etc., CSR budget is allocated as 2.5% of the profit.
8.7 CORPORATE ENVIRONMENT RESPONSIBILITY
Allocation for Corporate Environment Responsibility (CER) shall be made as per
Government of India, MoEF & CC Office Memorandum F.No.22-65/2017-IA.III dated
01.05.2018.
As per para 6 (II) of the office memorandum, being a green field project & Capital
Investment is ≤ 100 crores, All the proposed projects shall contribute 2% of Capital Investment
towards CER as per directions of EAC/SEAC. Cumulative Capital cost is Rs.1,58,71,000/- and
2% of the same works out to Rs.3,17,420/-
Table 8.1 CER Action Plan for Proposed Projects-P1&P2
PROPOSED PROJECT-P1
Activity Beneficiaries Total
Developing and maintaining the Garden in Kothapetta
Govt. School.
If the proponent is instructed by PWD/ other competent
bodies to desilt the nearby water bodies, the CER fund
will be spent towards that.
Kothapetta Villagers Rs.1,84,620/-
PROPOSED PROJECT-P2
Water Purifier, Medicine Storage rack, Cot and Bed
facilities to the Dispensary and Water Purifier and Table
facilities to the Government school at 2.0% from the total
project cost.
Kothapetta Villagers Rs. 1,32,800/-
TOTAL Rs.3,17,420/-
Source: Field survey conducted by FAE in consultation with project proponent

Page | 192
CHAPTER IX
ENVIRONMENTAL COST BENEFIT ANALYSIS
Not Applicable, Since Environmental Cost Benefit Analysis not recommended at the
Scoping stage.

Page | 193
CHAPTER X
ENVIRONMENTAL MANAGEMENT PLAN
10.0 GENERAL
Environment Management Plan (EMP) aims at the preservation of ecological system
by considering in-built pollution abatement facilities at the proposed site. Good practices of
Environmental Management plan will ensure to keep all the environmental parameters of the
project in respect of Ambient Air quality, Water quality, Socio – economic improvement
standards.
Mitigation measures at the source level and an overall environment management plan
at the study area are elicited so as to improve the supportive capacity of the receiving bodies.
The EMP presented in this chapter discusses the administrative aspects of ensuring that
mitigative measures are implemented and their effectiveness monitored after approval of the
EIA.
10.1 ENVIRONMENTAL POLICY-P1&P2
The Project Proponent is committed to conduct all its operations and activities in an
environmentally responsible manner and to continually improve environmental performance.
The Project-1 Proponent Tmt.SA.Sumithashankar and Project-2 Proponent M/s.MA Quality
Stone will
o Meet the requirements of all laws, acts, regulations, and standards relevant to its
operations and activities
o Implement a program to train employees in general environmental issues and individual
workplace environmental responsibilities
o Allocate necessary resources to ensure the implementation of the environmental policy
o Ensure that an effective closure strategy is in place at all stages of project development
and that progressive reclamation is undertaken as early as possible to reduce potential
long-term environmental and community impacts
o Implement monitoring programmes to provide early warning of any deficiency or
unanticipated performance in environmental safeguards
o Conduct periodic reviews to verify environmental performance and to continuously
strive towards improvement

Page | 194
10.1.1 Description of the Administration and Technical Setup- P1&P2
The Environment Monitoring Cell discussed under Chapter-6 will ensure effective
implementation of environment management plan and to ensure compliance of environmental
statutory guidelines through Mine Management Level of proposed quarry.
The said team will be responsible for:
o Monitoring of the water/ waste water quality, air quality and solid waste generated
o Analysis of the water and air samples collected through external laboratory
o Implementation and monitoring of the pollution control and protective measures/
devices which shall include financial estimation, ordering, installation of air
pollution control equipment, waste water treatment plant, etc.
o Co-ordination of the environment related activities within the project as well as with
outside agencies
o Collection of health statistics of the workers and population of the surrounding
villages
o Green belt development
o Monitoring the progress of implementation of the environmental monitoring
programme
o Compliance to statutory provisions, norms of State Pollution Control Board,
Ministry of Environment and Forests and the conditions of the environmental
clearance as well as the consents to establish and consents to operate.
10.2 LAND ENVIRONMENT MANAGEMENT- P1 & P2
Landscape of the area will be changed due to the quarrying operation, restoration of the
land by converting the quarry pit into temporary reservoir and the remaining part of the area
(un utilized areas, infrastructure, haul Roads) will be utilized for greenbelt development.
Aesthetic of the Environment will not be affected. There is no major vegetation in the project
area during the course of quarrying operation and after completion of the quarrying operation
thick plantation will be developed under greenbelt development programme.
Table 10.1 Proposed Controls for Land Environment- P1 & P2
CONTROL RESPONSIBILITY
Design vehicle wash-down areas so that all runoff water is captured and passed through oil water separators and sediment catchment devices.
Mines Manager
Refueling to be undertaken in a safe location, away from vehicle movement pathways &100 m away of any watercourse Refueling activity to be under visual observation at all times.
Mine Foreman & Mining Mate

Page | 195
Drainage of refueling areas to sumps with oil/water separation
Soil and groundwater testing as required following up a particular incident of contamination.
Mines Manager
At conceptual stage, the mining pits will be converted into Rain Water Harvesting. Remaining area will be converted into greenbelt area
Mines Manager
No external dumping i.e., outside the project area Mine Foreman Garland drains with catch pits / settlement traps to be provided all around the project area to prevent run off affecting the surrounding lands.
Mines Manager
The periphery of Project area will be planted with thick plantation to arrest the fugitive dust, which will also act as acoustic barrier.
Mines Manager
Source: Proposed by FAE’s & EIA Coordinator
10.3 SOIL MANAGEMENT- P1& P2
There is no overburden or waste anticipated from Proposed Projects.
Table 10.2 Proposed Controls for Soil Management- P1 & P2
CONTROL RESPONSIBILITY
Surface run-off from the project boundary via garland drains will
be diverted to the mine pits
Mine Foreman &
Mining Mate
Design haul roads and other access roads with drainage systems
to minimize concentration of flow and erosion risk
Mines Manager
Empty sediment from sediment traps
Maintain, repair or upgrade garland drain system
Mines Manager
Test soils for pH, EC, chloride, size & water holding capacity Manager Mines
Source: Proposed by FAE’s & EIA Coordinator
10.4 WATER MANAGEMENT- P1
In the proposed quarrying project, no process is involved for the effluent generation, only
oil & grease from the machinery wash is anticipated and domestic sewage from mine office.
The quarrying operation is proposed upto a depth of 40 m BGL, the water table in the area is
70m –75m below ground level, hence the proposed project will not intersect the Ground water
table during entire quarry period
10.4.1 WATER MANAGEMENT- P2
In the proposed quarrying project, no process is involved for the effluent generation, only
oil & grease from the machinery wash is anticipated and domestic sewage from mine office.
The quarrying operation is proposed upto a depth of 45m AGL+5m BGL, the water table in
the area is 70m – 75m below ground level, hence the proposed project will not intersect the
Ground water table during entire quarry period.

Page | 196
Table 10.3 Proposed Controls for Water Environment- P1 & P2
CONTROL RESPONSIBILITY
To maximize the reuse of pit water for water supply Mines Foreman
Temporary and permanent garland drain will be constructed to contain the catchments of the mining area and to divert runoff from undisturbed areas through the mining areas
Mines Manager
Natural drains/nallahs/brooklets outside the project area should not be disturbed at any point of mining operations
Mines Manager
Ensure there is no process effluent generation or discharge from the project area into water bodies
Mines Foreman
Domestic sewage generated from the project area will be disposed in septic tank and soak pit system
Mines Foreman
Monthly or after rainfall, inspection for performance of water management structures and systems
Mines Manager
Conduct ground water and surface water monitoring for parameters specified by CPCB
Manager Mines
Source: Proposed by FAE’s & EIA Coordinator
10.5 AIR QUALITY MANAGEMENT- P1&P2
The proposed quarrying activity would result in the increase of particulate matter
concentrations due to fugitive dust. Daily water sprinkling on the haul roads, approach roads
in the vicinity would be undertaken and will be continued as there is possibility for dust
generation due to truck mobility. It will be ensured that vehicles are properly maintained to
comply with exhaust emission requirements.
Table 10.4 Proposed Controls for Air Environment- P1 & P2
CONTROL RESPONSIBILITY
Generation of dust during excavation is minimized by daily (twice) water sprinkling on working face and daily (twice) water sprinkling on haul road
Mines Manager
Wet drilling procedure /drills with dust extractor system to control dust generation during drilling at source itself is implemented
Mines Manager
Maintenance as per operator manual of the equipment and machinery in the mines to minimizing air pollution
Mines Manager
Ambient Air Quality Monitoring carried out in the project area and in surrounding villages to access the impact due to the mining activities and the efficacy of the adopted air pollution control measures
Mines Manager
Provision of Dust Mask to all workers Mines Manager Greenbelt development all along the periphery of the project area
Mines Manager
Source: Proposed by FAE’s & EIA Coordinator

Page | 197
10.6 NOISE POLLUTION CONTROL- P1&P2
There will be intermittent noise levels due to vehicular movement, trucks loading,
drilling and blasting and cutting activities. No mining activities are planned during night time.
Table 10.5 Proposed Controls for Noise Environment- P1 & P2
CONTROL RESPONSIBILITY
Development of thick greenbelt all along the Buffer Zone (7.5
Meters) of the project area to attenuate the noise and the same
will be maintained
Mines Manager
Preventive maintenance of mining machinery and replacement
of worn-out accessories to control noise generation
Mines Foreman
Deployment of mining equipment with an inbuilt mechanism
to reduce noise
Mines Manager
Provision of earmuff / ear plugs to workers working in noise
prone zones in the mines
Mining Mate
Provision of effective silencers for mining machinery and
transport vehicles
Mines Manager
Provision of sound proof AC operator cabins to HEMM Mines Manager
Sharp drill bits are used to minimize noise from drilling Mines Foreman
Controlled blasting technologies are adopted by using delay
detonators to minimize noise from blasting
Mines Manager
Annual ambient noise level monitoring is carried out in the
project area and in surrounding villages to access the impact
due to the mining activities and the efficacy of the adopted
noise control measures. Additional noise control measures will
be adopted if required as per the observations during
monitoring
Mines Manager
Reduce maximum instantaneous charge using delays while
blasting
Mining Mate
Change the burden and spacing by altering the drilling pattern
and/or delay layout, or altering the hole inclination
Mines Manager
Undertake noise or vibration monitoring Mines Manager
Source: Proposed by FAE’s & EIA Coordinator
10.7 GROUND VIBRATION AND FLY ROCK CONTROL- P1&P2
The Rough stone quarry operation creates vibration due to the blasting and movement
of Heavy Earth moving machineries, fly rocks due to the blasting.

Page | 198
Table 10.6 Proposed Controls for Ground Vibrations & Fly Rock- P1 & P2
CONTROL RESPONSIBILITY
Controlled blasting using delay detonators will be carried out to maintain the PPV value (below 8Hz) well within the prescribed standards of DGMS
Mines Manager
Drilling and blasting will be carried under the supervision of qualified persons
Mines Manager
Proper stemming of holes should be carried out with statutory competent qualified blaster under the supervision of statutory mines manager to avoid any anomalies during blasting
Mines Manager
Suitable spacing and burden will be maintained to avoid misfire / fly rocks
Manager Mines
Number of blast holes will be restricted to control ground vibrations Manager Mines Blasting will be carried out only during noon time Mining Mate Undertake noise or vibration monitoring Mines Manager ensure blast holes are adequately stemmed for the depth of the hole and stemmed with suitable angular material
Mines Foreman
Source: Proposed by FAE’s & EIA Coordinator 10.8 BIOLOGICAL ENVIRONMENT MANAGEMENT- P1& P2
The proponent will take all necessary steps to avoid the impact on the ecology of the
area by adopting suitable management measures in the planning and implementation stage.
During mining, thick plantation will be carried out around the project periphery, on safety
barrier zone, on top benches of quarried out area etc.,
Following control measures are proposed for its management and will be the responsibility of
the Mines Manager.
o Greenbelt development all along the safety barrier of the project area
o It is also proposed to implement the greenbelt development programme and post
plantation status will be regularly checked for every season.
o The main attributes that retard the survival of sapling is fugitive dust, this fugitive
dust can be controlled by water sprinkling on the haul roads and installing a sprinkler
unit near the newly planted area.
o Year wise greenbelt development will be recorded and monitored
Based on the area of plantation.
Period of plantation
Type of plantation
Spacing between the plants
Type of manuring and fertilizers and its periods
Lopping period, interval of watering
Survival rate

Page | 199
Density of plantation
o The ultimate reclamation planned leaves a congenial environment for development of flora
& immigration of small fauna through green belt and water reservoir. The green belt and
water reservoir developed within the Project at the end of mine life will attract the birds
and animals towards the project area in the post mining period.
10.8.1 Green Belt Development Plan- P1
About 150 nos. of saplings is proposed to be planted for the Mining plan period in safety
barrier of applied mine lease area with survival rate 80%. The greenbelt development plan has
been prepared keeping in view the land use changes that will occur due to mining operation in the
area.
Table 10.7 Proposed Green Belt Activities for 5 Years - P1&P2
Year No. of trees
proposed to be
planted
Survival
%
Area to be
covered in m2
Name of
the species
No. of trees
expected to
be grown
Plantation under safety zone (In Nos.)
I 30 80% 280 Azadirachta
indica
Albizia
lebbeck
Delonix
regia
Techtona
grandis
Nerium
indicum, etc.,
24 II 30 80% 280 24 III 30 80% 280 24 IV 30 80% 280 24 V 30 80% 280 24
Year Plantation in quarry approach road and
village road (In Nos)
I 80 80% 80% 80% 80% 80%
64 II 80 64 III 80 64 IV 80 64 V 80 64
Proposed Project Site – P2
No. of trees
proposed to be
planted
Survival
% Area to be
covered in m2 Name of
the species No. of trees
expected to
be grown Plantation under safety zone and Dump
(In Nos.)
I 112 80% 1000 Azadirachta
indica
Albizia
lebbeck
Delonix
regia
Techtona
grandis
Nerium
indicum,
89
II 112 80% 1000 89
III 112 80% 1000 89
IV 112 80% 1000 89
V 112 80% 1000 89
Plantation in quarry approach road Side
(In Nos)
I 12 80% 20 9

Page | 200
II 12 80% 20 etc., 9
III 12 80% 20 9
IV 12 80% 20 9
V 12 80% 20 9
Source: Conceptual Plan of Approved Mining plan & proposed by FAE’s & EIA Coordinator
10.8.1.1 Green Belt Development Plan- P2
About 560 nos. of saplings is proposed to be planted for the Mining plan period in safety
barrier of applied mine lease area with survival rate 80%. The greenbelt development plan has
been prepared keeping in view the land use changes that will occur due to mining operation in the
area.
The objectives of the greenbelt development plan are:
o Provide a green belt around the periphery of the quarry area to combat the dispersal of dust
in the adjoining areas,
o Protect the erosion of the soil, Conserve moisture for increasing ground water recharging,
o Restore the ecology of the area, restore aesthetic beauty of the locality and meet the
requirement of fodder, fuel and timber of the local community.
A well-planned Green Belt with multi rows (three tiers) preferably with long canopy leaves
shall be developed with dense plantations around the boundary and haul roads to prevent air,
dust noise propagation to undesired places and efforts will be taken for the enhancement of
survival rate.
10.8.2 Species Recommended for Plantation- P1& P2
Following points have been considered while recommending the species for plantation:
o Creating of bio-diversity.
o Fast growing, thick canopy cover, perennial and evergreen large leaf area.
o Efficient in absorbing pollutants without major effects on natural growth.
Table 10.8 Recommended Species to Plant in the Green Belt- P1 & P2
SI.
No
Botanical
Name of
the Plant
Family
Name
Com
mon
Name
Categ
ory
Height
(m)
Regene
rations
Spa
cing
(m)
Evergreen
/
Deciduous
Efficie
ncy
of Dust
Remov
al (%)
1 Azadiracht
a indica
Meliace
ae
Neem,
Vemb
u
Tree 15–20 Seedlin
gs 8x8 Evergreen 25.54
2 Techtona
grandis
Lamiac
eae
Teak
Tree 40
Seedlin
gs 2x2 Deciduous 14.94

Page | 201
3 Polyalthia
longifolia
Annona
ceae
Nettili
ngam Tree 10
Seedlin
gs 3x3 Evergreen 29.84
4 Nerium
indicum
Apocyn
aceae Arali Shrub 2–6
Cutting
s 2x2 Evergreen 12.3
5 Bougainvill
iea glavra
Nycagi
naceae
Kakith
apoo Shrub 4
Cutting
s 3x3 Evergreen 21.35
6 Albizia
lebbeck
Fabace
ae Vagai Tree 18–30
Seedlin
g
3x3/
5x5 Evergreen 23.03
7 Delonix
regia
Fabace
ae
Cemm
ayir-
konrai
Tree 12 Cutting
s
3x3/
5x5 Deciduous 18.05
8
Hibiscus
rosa
sinensis
Malvac
eae
seamp
aruthi shrub 3
Cutting
s 3x3 Evergreen 21.09
Source: Proposed by FAE’s & EIA Coordinator
10.9 OCCUPATIONAL SAFETY & HEALTH MANAGEMENT- P1&P2
Occupational safety and health are very closely related to productivity and good
employer-employee relationship. The main factors of occupational health impact in quarries
are fugitive dust and noise. Safety of employees during quarrying operation and maintenance
of mining equipment will be taken care as per Mines Act 1952 and Rule 29 of Mines Rules
1955. To avoid any adverse effect on the health of workers due to dust, noise and vibration
sufficient measures have been provided.
10.9.1 Medical Surveillance and Examinations P1&P2
o Identifying workers with conditions that may be aggravated by exposure to dust & noise
and establishing baseline measures for determining changes in health.
o Evaluating the effect of noise on workers
o Enabling corrective actions to be taken when necessary
o Providing health education
The health status of workers in the mine shall be regularly monitored under an occupational
surveillance program. Under this program, all the employees are subjected to a detailed medical
examination at the time of employment. The medical examination covers the following tests
under mines act 1952.
o General Physical Examination and Blood Pressure
o X-ray Chest and ECG
o Sputum test
o Detailed Routine Blood and Urine examination

Page | 202
The medical histories of all employees will be maintained in a standard format annually.
Thereafter, the employees will be subject to medical examination annually. The below tests
keep upgrading the database of medical history of the employees.
Table 10.9 Medical Examination Schedule- P1 & P2
Sl.No. Activities 1st Year
2nd Year
3rd Year
4th Year
5th Year
1 Initial Medical Examination (Mine Workers) A Physical Check-up B Psychological Test C Audiometric Test D Respiratory Test 2 Periodical Medical Examination (Mine Workers) A Physical Check – up B Audiometric Test C Eye Check – up D Respiratory Test 3 Medical Camp (Mine Workers &
Nearby Villagers)
4 Training (Mine Workers)
Medical Follow ups: Work force will be divided into three targeted groups age wise as follows: Age Group PME as per Mines Rules 1955 Special Examination
Less than 25 years Once in a Three Years In case of emergencies Between 25 to 40 Years Once in a Three Years In case of emergencies Above 40 Years Once in a Three Years In case of emergencies Medical help on top priority immediately after diagnosis/ accident is the essence of preventive aspects.
10.9.2 Proposed Occupational Health and Safety Measures- P1& P2
o The mine site will have adequate drinking water supply so that workers do not get
dehydrated.
o Lightweight and loose-fitting clothes having light colours will be preferred to wear.
o Noise exposure measurements will be taken to determine the need for noise control
strategies.
o The personal protective equipment will be provided for mine workers.
o Supervisor will be instructed for reporting any problems with hearing protectors or
noise control equipment.
o At noisy working activity, exposure time will be minimized.
o Dust generating sources will be identified and proper control measure will be adopted.

Page | 203
o Periodic medical examinations will be provided for all workers.
o Strict observance of the provisions of DGMS Acts, Rules and Regulations in respect of
safety both by management and the workers.
o The width of road will be maintained more than thrice the width of the vehicle. A code
of traffic rules will be implemented.
o In respect of contract work, safety code for contractors and workers will be
implemented. They will be allowed to work under strict supervision of statutory
person/officials only after they will impart training at vocational training centres. All
personal protective equipment's will be provided to them.
o A safety committee meeting every month will be organized to discuss the safety of the
mines and the persons employed.
o Celebration of annual mines safety week and environmental week in order to develop
safety awareness and harmony amongst employees and co quarry owners.
Figure 10.1 Personal protective equipment to the mine workers- P1 & P2
10.9.3 Health and Safety Training Programme- P1&P2
The Proponent will provide special induction program along with machinery
manufacturers for the operators and co-operators to run and maintain the machinery effectively
and efficiently. The training program for the supervisors and office staffs will be
arranged in the Group Vocational Training Centres in the State and engage Environmental

Page | 204
Consultants to provide periodical training to all the employees to carry out the mining operation
in and eco-friendly manner.
Table 10.10 List of Periodical Trainings Proposed for Employees- P1 & P2
Course Personnel Frequency Duration Instruction
New-Employee Training
All new employees exposed to
mine hazards
Once One week
Employee rights Supervisor responsibilities Self-rescue Respiratory devices Transportation controls Communication systems Escape and emergency evacuation Ground control hazards Occupational health hazards Electrical hazards First aid Explosives
Task Training Like Drilling, Blasting,
Stemming, safety, Slope stability,
Dewatering, Haul Road maintenance,
Employees assigned to new work
tasks
Before new Assignments
Variable
Task-specific health &safety procedures and SOP for various mining activity. Supervised practice in assigned work tasks.
Refresher Training
All employees
who received new-hire training
Yearly One week
Required health and safety standards Transportation controls Communication systems Escape ways, emergency evacuations Fire warning Ground control hazards First aid Electrical hazards Accident prevention Explosives, Respirator devices
Hazard Training
All employees exposed to
mine hazards
Once Variable
Hazard recognition and avoidance Emergency evacuation procedures Health standards, Safety rules Respiratory devices
Source: Proposed by FAE’s & EIA Coordinator as per DGMS Norms
10.9.4 Budgetary Provision for Environmental Management -P1&P2
Adequate budgetary provision has been made by the Company for execution of
Environmental Management Plan. The Table 10. 10.11(a) gives overall investment on the
environmental safeguards and recurring expenditure for successful monitoring and
implementation of control measures.

Page | 205
Table 10.11 EMP Budget for Proposed Project-P1
Sl.No. Description Item
Capital
Cost (Rs.
In Lakhs)
Recurring
Cost per
Annum
(Rs. in
Lakhs)
1 Occupational health & safety
Dust Mask, Safety Shoes, Helmets Ear Plugs, Gloves, Goggles Reflector jacket, Safety Belt, Medical check ups
1.00 0.20
2 Environmental Monitoring
Air, Water, Noise & Vibration, Soil Parameters
3.80 0.76
3 Water & Soil erosion
Garland drains &Settling tanks, check dam/gully plugs, etc
0.60 0.12
4 Drinking Water Facilities and Sanitation Facilities 1.00 0.20 5 Water Sprinkling Arrangements 0.80 0.16 6 Haul Road Maintenance 1.00 0.20 7 Green belt Development & Plantation 1.00 0.20 8 Environmental Awareness Programme 0.25 0.25 Fencing, Fertilizer, Manure, Manpower, etc. 1.00 0.25
Total 10.45 2.34
In order to implement the environmental protection measures, an amount of
Rs.10.45lakhs as capital cost and recurring cost as Rs. 2.34 lakhs as recurring cost is proposed
considering present market price considering present market scenario for the proposed project.
Table 10.11(a) EMP Budget for Proposed Project-P2
Sl.No. Description Item
Capital
Cost (Rs.
In Lakhs)
Recurring
Cost per
Annum
(Rs. in
Lakhs)
1 Occupational health & safety
Dust Mask, Safety Shoes, Helmets Ear Plugs, Gloves, Goggles Reflector jacket, Safety Belt, Medical check ups
1.00 0.20
2 Environmental Monitoring
Air, Water, Noise & Vibration, Soil Parameters
3.20 0.64
3 Water & Soil erosion
Garland drains &Settling tanks, check dam/gully plugs, etc
1.20 0.24
4 Drinking Water Facilities and Sanitation Facilities 0.80 0.20 5 Water Sprinkling Arrangements 1.20 0.24 6 Haul Road Maintenance 1.00 0.30 7 Green belt Development & Plantation 1.10 0.22 8 Environmental Awareness Programme 0.25 0.25 Fencing, Fertilizer, Manure, Manpower, etc. 2.50 0.50
Total 12.25 2.79

Page | 206
In order to implement the environmental protection measures, an amount of Rs.12.25
lakhs as capital cost and recurring cost as Rs.2.79 lakhs as recurring cost is proposed
considering present market price considering present market scenario for the proposed project
10.10 CONCLUSION
Various aspects of mining activities were considered and related impacts were
evaluated. Considering all the possible ways to mitigate the environmental concerns
Environmental Management Plan was prepared and fund has been allocated for the same. The
EMP is dynamic, flexible and subjected to periodic review. For project where the major
environmental impacts are associated, EMP will be under regular review. Senior Management
responsible for the project will conduct a review of EMP and its implementation to ensure that
the EMP remains effective and appropriate. Thus, the proper steps will be taken to accomplish
all the goals mentioned in the EMP and the project will bring the positive impact in the study
area.

Page | 207
CHAPTER XI
SUMMARY AND CONCLUSION
11.0 INTRODUCTION
This EIA report is prepared by considering Cumulative load proposed & existing quarries
of Kothapetta Village, Rough Stone Cluster Quarries consisting of Two Proposed and Two
Existing Quarries and 2 abundant Quarries with total extent of Cluster of 20.19.0 ha in
Kothapetta Village, Krishnagiri Taluk, Krishnagiri District and Tamil Nadu State, cluster area
calculated as per MoEF & CC Notification S.O. 2269(E) Dated 1st July 2016.
This EIA Report is prepared in compliance with ToR obtained –
ToR Lr.No. SEIAA-TN/F.No. 8519/SEAC/ToR-992/2021 Dated 28.07.2021-P1
ToR Lr.No. SEIAA-TN/F.No.8687/SEAC/ToR-1067/2022 Dated:01.03.2022– P2
And the Baseline Monitoring study has been carried out during the period of October 2021 to
December 2021.
11.1 PROJECT DESCRIPTION
Table 11.1 Salient Features – P1
Name of the Quarry Tmt.SA. Sumithashankr Rough stone quarry
Toposheet No 57 – L/02
Latitude between 12°32'53.25"N to 12°32'57.45"N
Longitude between 78°12'29.71"E to 78°12'35.28"E
Highest Elevation 525m-531m AMSL
Ultimate depth of
Mining 40m [10m above ground level + 30m below ground level]
Geological Resources Rough Stone in m3 Top soil m3
4,73,598 -
Mineable Reserves Rough Stone in m3 Top Soil m3
1,79,843 -
Proposed reserve for
five years up to the
depth of 40m bgl
1,79,843 -
Existing Pit Dimension Existing Pit Dimension: 49m (L) x 60m (W) x 5m (D) AGL
Ultimate Pit Dimension Pit I - 63m (L) x 46m (W) x 40m (D) [10m AGL + 30m BGL]
Pit I - 90m (L) x 58m (W) x 35m (D) [10m AGL + 25m BGL]
Water Level in the
surrounds area 70 m bgl
Method of Mining
Opencast Manual Method, the quarry operation involves equipment’s
like hammer and chisel and slurry blasting like expanding chemicals
(Calcium carbide) will be used for liberate the required size of
foundation stones and jelly from the parent rock mass.
Topography The Project area is exhibiting undulated terrain. The gradient is
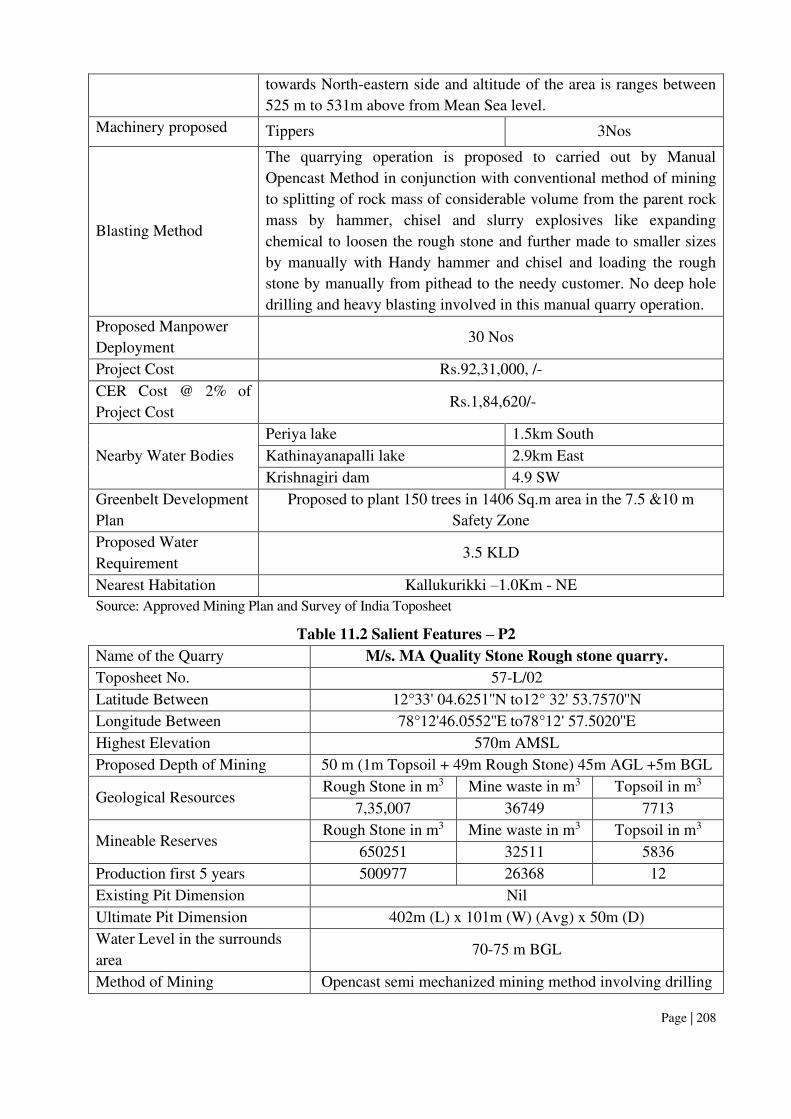
Page | 208
towards North-eastern side and altitude of the area is ranges between
525 m to 531m above from Mean Sea level.
Machinery proposed Tippers 3Nos
Blasting Method
The quarrying operation is proposed to carried out by Manual
Opencast Method in conjunction with conventional method of mining
to splitting of rock mass of considerable volume from the parent rock
mass by hammer, chisel and slurry explosives like expanding
chemical to loosen the rough stone and further made to smaller sizes
by manually with Handy hammer and chisel and loading the rough
stone by manually from pithead to the needy customer. No deep hole
drilling and heavy blasting involved in this manual quarry operation.
Proposed Manpower
Deployment 30 Nos
Project Cost Rs.92,31,000, /-
CER Cost @ 2% of
Project Cost Rs.1,84,620/-
Nearby Water Bodies
Periya lake 1.5km South
Kathinayanapalli lake 2.9km East
Krishnagiri dam 4.9 SW
Greenbelt Development
Plan
Proposed to plant 150 trees in 1406 Sq.m area in the 7.5 &10 m
Safety Zone
Proposed Water
Requirement 3.5 KLD
Nearest Habitation Kallukurikki –1.0Km - NE
Source: Approved Mining Plan and Survey of India Toposheet
Table 11.2 Salient Features – P2
Name of the Quarry M/s. MA Quality Stone Rough stone quarry.
Toposheet No. 57-L/02
Latitude Between 12°33' 04.6251''N to12° 32' 53.7570''N
Longitude Between 78°12'46.0552''E to78°12' 57.5020''E
Highest Elevation 570m AMSL
Proposed Depth of Mining 50 m (1m Topsoil + 49m Rough Stone) 45m AGL +5m BGL
Geological Resources Rough Stone in m3 Mine waste in m3 Topsoil in m3
7,35,007 36749 7713
Mineable Reserves Rough Stone in m3 Mine waste in m3 Topsoil in m3
650251 32511 5836
Production first 5 years 500977 26368 12
Existing Pit Dimension Nil
Ultimate Pit Dimension 402m (L) x 101m (W) (Avg) x 50m (D)
Water Level in the surrounds
area 70-75 m BGL
Method of Mining Opencast semi mechanized mining method involving drilling
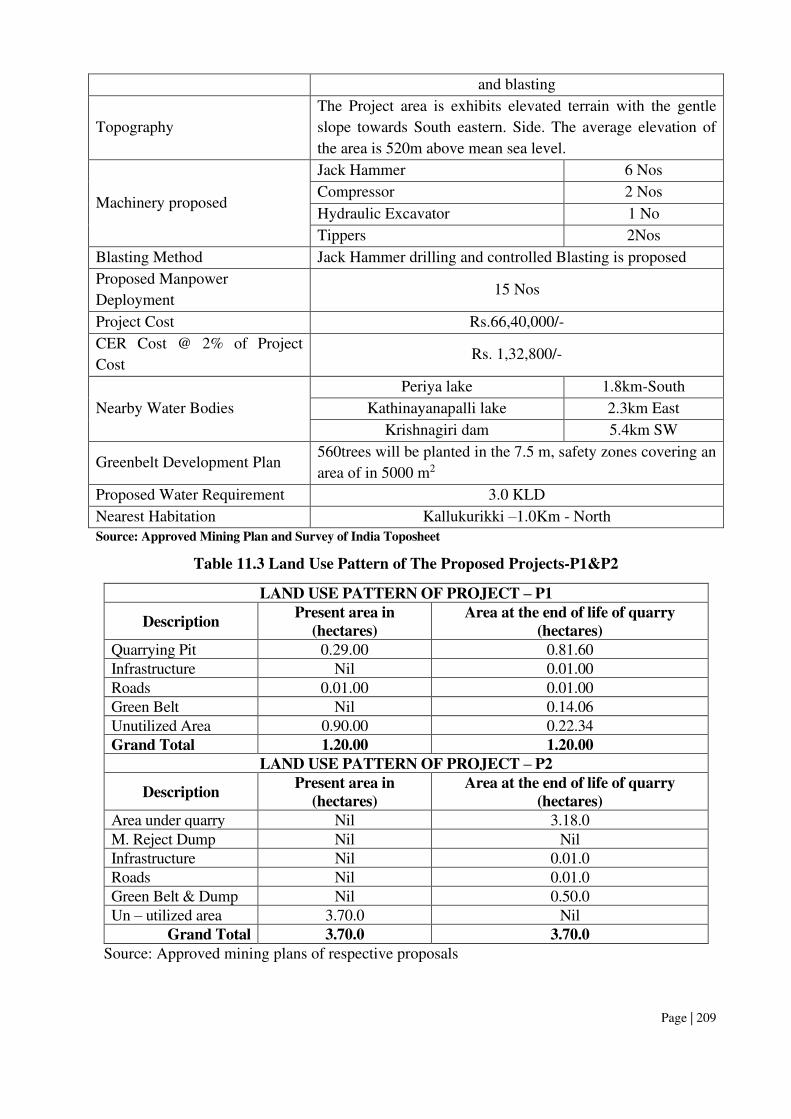
Page | 209
and blasting
Topography
The Project area is exhibits elevated terrain with the gentle
slope towards South eastern. Side. The average elevation of
the area is 520m above mean sea level.
Machinery proposed
Jack Hammer 6 Nos
Compressor 2 Nos
Hydraulic Excavator 1 No
Tippers 2Nos
Blasting Method Jack Hammer drilling and controlled Blasting is proposed
Proposed Manpower
Deployment 15 Nos
Project Cost Rs.66,40,000/-
CER Cost @ 2% of Project
Cost Rs. 1,32,800/-
Nearby Water Bodies
Periya lake 1.8km-South
Kathinayanapalli lake 2.3km East
Krishnagiri dam 5.4km SW
Greenbelt Development Plan 560trees will be planted in the 7.5 m, safety zones covering an
area of in 5000 m2
Proposed Water Requirement 3.0 KLD
Nearest Habitation Kallukurikki –1.0Km - North Source: Approved Mining Plan and Survey of India Toposheet
Table 11.3 Land Use Pattern of The Proposed Projects-P1&P2
LAND USE PATTERN OF PROJECT – P1
Description Present area in
(hectares)
Area at the end of life of quarry
(hectares)
Quarrying Pit 0.29.00 0.81.60 Infrastructure Nil 0.01.00 Roads 0.01.00 0.01.00 Green Belt Nil 0.14.06 Unutilized Area 0.90.00 0.22.34 Grand Total 1.20.00 1.20.00
LAND USE PATTERN OF PROJECT – P2
Description Present area in
(hectares)
Area at the end of life of quarry
(hectares)
Area under quarry Nil 3.18.0 M. Reject Dump Nil Nil Infrastructure Nil 0.01.0 Roads Nil 0.01.0 Green Belt & Dump Nil 0.50.0 Un – utilized area 3.70.0 Nil
Grand Total 3.70.0 3.70.0
Source: Approved mining plans of respective proposals
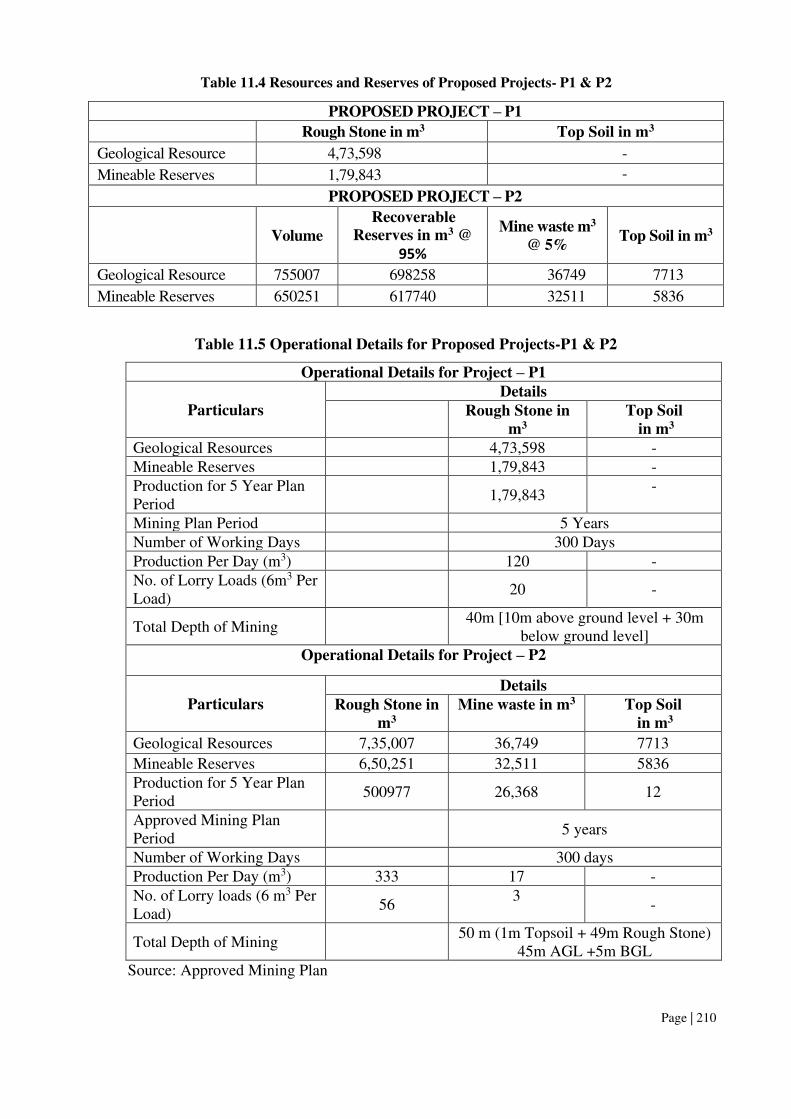
Page | 210
Table 11.4 Resources and Reserves of Proposed Projects- P1 & P2
PROPOSED PROJECT – P1
Rough Stone in m3 Top Soil in m3
Geological Resource 4,73,598 -
Mineable Reserves 1,79,843 -
PROPOSED PROJECT – P2
Volume
Recoverable
Reserves in m3 @
95%
Mine waste m3
@ 5% Top Soil in m3
Geological Resource 755007 698258 36749 7713
Mineable Reserves 650251 617740 32511 5836
Table 11.5 Operational Details for Proposed Projects-P1 & P2
Operational Details for Project – P1
Particulars
Details
Rough Stone in
m3
Top Soil
in m3
Geological Resources 4,73,598 - Mineable Reserves 1,79,843 - Production for 5 Year Plan Period
1,79,843
-
Mining Plan Period 5 Years Number of Working Days 300 Days Production Per Day (m3) 120 - No. of Lorry Loads (6m3 Per Load)
20 -
Total Depth of Mining 40m [10m above ground level + 30m
below ground level] Operational Details for Project – P2
Particulars Details
Rough Stone in
m3
Mine waste in m3 Top Soil
in m3
Geological Resources 7,35,007 36,749 7713
Mineable Reserves 6,50,251 32,511 5836 Production for 5 Year Plan Period
500977 26,368 12
Approved Mining Plan Period
5 years
Number of Working Days 300 days Production Per Day (m3) 333 17 - No. of Lorry loads (6 m3 Per Load)
56 3
-
Total Depth of Mining 50 m (1m Topsoil + 49m Rough Stone)
45m AGL +5m BGL Source: Approved Mining Plan

Page | 211
Table 11.6 Ultimate Pit Dimension- P1&P2
PROPOSAL – P1
Sections Length (Max) (m) Width (Max) (m) Depth (Max)
Pit-I
63 46
40m [10m above ground
level + 30m below ground
level]
90 58
35m [10m above ground
level + 25m below ground
level]
PROPOSAL – P2
Pit Length (Max) (m) Width (Max) (m) Depth (Max)
I 402 101
50 m (1m Topsoil + 49m
Rough Stone) 45m AGL
+5m BGL Source: Approved Mining Plans
Table 11.7 Water Requirement of the Proposed Projects- P1&P2
PROPOSAL – P1
*Purpose Quantity Source
Domestic &
Drinking Purpose
1.0 KLD From Existing, bore wells and drinking water will be
sourced from Approved Water Vendors.
Dust Suppression 1.5 KLD From Existing bore wells from nearby area/Rainwater
harvesting pits
Green Belt
development
1.0 KLD From Existing bore wells from nearby area
Total 3.5 KLD
PROPOSAL – P2
*Purpose Quantity Source
Dust Suppression 1.5 KLD From existing bore wells from nearby area/ rainwater
harvesting pits
Green Belt
development
1.0 KLD From existing bore wells from nearby area/rain water
harvesting pits
Domestic &
Drinking purpose
0.7 KLD From existing, bore wells and drinking water will be
sourced from approved water vendors.
Total 3.2 KLD
* Water for drinking purpose will be brought from approved water vendors
Source: Approved Mining Plan Pre-Feasibility Report

Page | 212
11.2 DESCRIPTION OF THE ENVIRONMENT
The baseline monitoring study was carried out during Oct 2021 – Dec 2021.to assess the
existing environmental scenario in the area. For the purpose of EIA studies, project area was
considered as the core zone and area outside the project area up to 10km radius from the
periphery of the project site was considered as buffer zone.
Baseline Environmental data has been collected with reference to proposed mines for: -
a) Land
b) Water
c) Air
d) Noise
e) Biological
f) Socio-economic status
11.2.1 Land Environment
The existing land use pattern of the study area based on the latest satellite imagery is given
below:
Table 11.8 Land Use / Land Cover Statistics for the study area of 10 Km Radius
S. No. LULC Category LU/LC Area (ha) LU/LC Area (%)
1. Barren Rocky/Stone waste/sheet rock area 24.7 0.10 2 Crop Land 12491.0 40.2 3 Dense Forest 308.1 1.0 4 Fallow land 1897.1 6.10 5 Land affected by salinity/salinity coastal 173.1 0.60 6 Land with or without scrub 11410.6 36.7 7 Manmade features 879.9 2.8 8 Mining/Industrial wastelands 65.2 0.20 9 Plantations 3344.1 10.80
10 Settlements 310.4 1.0 11 Water Bodies 196.1 0.6
Total 31100.32 100 Source: Survey of India Toposheet and Landsat Satellite Image
From the land use/land cover map (Fig.3.1), the table (3.2), and the pie diagram (Fig.3.2),
it is inferred that the majority of the land in the study area is crop land covering 40.2% of the
total land area, followed by Land with/Without scrub land (36.7%), Plantation (10.80%), Fallow
land (6.10%), Manmade features (2.8%) Settlements (1%) Dense Forest (1%) water bodies
(0.60%) and mining land/ industrial waste land (0.20%). The total mining area within the study
area is 4.90 hectares (i.e., 0.01%). This small percentage of mining activities shall not have any
significant impact on the environment.

Page | 213
11.3 SOIL CHARACTERISTICS
11.3.1 Physical Characteristics
The physical properties of the soil samples were examined for texture, bulk density,
porosity and water holding capacity. The soil texture found in the study area is clay to clay loam.
The bulk density of soils in the study area varies between 1.01 and 1.35 g/cc. The water holding
capacity varies from 41.5 to 49.2 and porosity from 28 to 40%.
11.3.2 Chemical Characteristics
o The nature of soil is slightly alkaline to strongly alkaline with pH ranging from 7.23
to 8.53°C.
o The nitrogen ranges between 167 and 210 kg/ha.
o The phosphorus ranges between 0.64 and 1.21kg/ha.
o The potassium ranges between 21.3 and 40 mg/kg.
11.4 WATER ENVIRONMENT
11.4.1 Surface Water
The pH varies from 7.27 to 7.51, while turbidity is found within the acceptable limits.
TDS including carbonates, bicarbonates, chlorides, phosphates, nitrates, calcium, magnesium,
and sodium in the surface water varies from 425 to 459 mg/l. Chloride varies from 70.2. to
79.3.mg/l; nitrate varies from 5 to 6.1 mg/l, whereas sulphate from 17.3. to 24.1mg/l.
11.4.2 Ground Water
The pH (6.86 to 7.75) of the water samples falls within the acceptable limit of 6.5 to
8.5. Sulphates and chlorides of water samples from all the sources are within the acceptable
limits as per the water quality standard. Turbidity in the water samples meets the requirement.
TDS are found in the range of 364- 460mg/l in all samples. The total hardness varies between
110.77 and 180.76 mg/l for all samples. When speaking about microbiological parameters, the
water samples from all the locations meet the requirement. When compared to IS 10500:2012
all the parameters thus analysed fall within the prescribed limits.
11.5 AIR ENVIRONMENT
11.5.1 Site Specific Meteorology
Site specific meteorology during the study period was recorded by an automated weather station.

Page | 214
TABLE 11.9 Meteorological Data Recorded at Site
S.No Parameters Oct–2021 Nov–2021 Dec-2021
1 Temperature (0C)
Max 24.7 24.0 23.5
Min 22.1 20.1 17.7
Avg 23.4 22.1 20.6
2 Relative Humidity (%) Avg 86 92 83.1
3 Wind Speed (m/s)
Max 3.75 5.48 5.16
Min 1.37 1.37 1.09
Avg 2.56 3.42 3.12
4 Cloud Cover (OKTAS) 0-8 0-8 0-8
5 Wind Direction SW, WSW ENE, WSW NE, ENE
Source: On-site monitoring/sampling by Excellence Laboratory in association with GTMS
11.5.2 Ambient Air Quality Results –
The results of ambient air quality monitoring for the period (Oct 2021 – Dec 2021.) are
presented in the report. Data has been complied for three months.
As per the monitoring data, PM10 ranges from 35.8 µg/m3 to 46.8 µg/m3; PM2.5 from
22.5 µg/m3 to 26.9 µg/m3; SO2 from 5.1µg/m3 to 9.6 µg/m3; NO2 from 15.6 µg/m3 to 28.4
µg/m3. The concentration levels of the pollutants fall within the acceptable limits of NAAQS
prescribed by CPCB.
11.6 Noise Environment
Ambient noise levels were measured at 8 locations around the proposed project area.
Noise levels recorded in core zone during day time was Project -P1 47.7. dB (A), Project -P2
46.9. dB (A) Leq and during night time was 40.3 dB (A) Leq. Noise levels recorded in buffer
zone during day time varied from 36.5 to 46.1 dB (A) Leq and during night time from 35 to
39.7 dB (A) Leq. Thus, the noise level for industrial and residential area meets the
requirements of CPCB.
11.7 Biological Environment
There is no schedule I species of animals observed within study area as per Wildlife
Protection Act 1972 as well as no species is in vulnerable, endangered or threatened category as
per IUCN. There is no endangered red list species found in the study area. Hence this small
mining operation over short period of time will not have any significant impact on the
surrounding flora and fauna.

Page | 215
11.8 Socio-Economic Environment
An attempt has been made to assess the impact of the proposed mining project at
Kothapetta Village on Socio-economic aspect of the study area. The various attributes that have
been taken into account are population composition, employment generation, occupational shift,
household income and consumption pattern. Implementation of the Proposed Mine Project will
generate both direct and indirect employment. Besides, Mining operation will be legally valid
and it will bring income to the state exchequer. At present seasonal agriculture is the main
occupation of the people as more than half of the population depends on it. With the
implementation of the proposed mining project the occupational pattern of the people in the area
will change making more people engaged in mining-based activities rather in seasonal
agriculture.
11.9 ANTICIPATED ENVIRONMENTAL IMPACTS AND MITIGATION MEASURES
FOR P1 & P2
The summary of anticipated adverse environmental impacts due to the proposed project
and mitigation measures are given below: -
Table 11.10 Anticipated Impacts & Mitigation Measures
Impact Mitigation Measure
Land Environment
o Destruction of natural landscapes
o Changes in soil characteristics
o Soil erosion and slope instability
o Mining will be carried out as per approved mine plan
in scientific and systematic way
o Safety Zone or Buffer area will be maintained and will
not be mined and instead plantation will be carried out
in the safety zone
o Barbed wire fencing will be provided all along the
proposed mine boundary
o At conceptual stage, the land use pattern of the quarry
will be changed into Greenbelt area and temporary
reservoir
o Construction of garland
o Construction of garland drains all around the quarry pit
and construction of settling traps at strategic location in
lower elevations to prevent soil erosion due to surface
runoff during rainfall and also to collect the storm water
for various uses within the proposed area
Water Environment
o Decrease in aquifer recharge and
increase in surface runoff;
o Disturbance to land drainage,
overload and erosion of
watercourses;
o Construction of garland drains all around the quarry pit
and construction of settling traps at strategic location in
lower elevations to prevent soil erosion due to surface
runoff during rainfall and also to collect the storm water
for various uses within the proposed area

Page | 216
o Changes to the surface over which
water flows;
o Changes to surface and groundwater
resources quantity and quality due to
stream blockage and contamination
by particulate matter or waste;
o Contamination of aquifers due to
removal of the natural filter medium.
o De-silting will be carried out before and immediately
after the monsoon season and the settling tank and
drains will be cleaned weekly, especially during
monsoons
o Domestic sewage from site office & urinals/latrines
provided in project area will be discharged through
septic tank followed by soak pit system.
o Tippers & HEMM will be washed in a designated area
and the washed water will be routed through drains to a
settling tank, which has an oil & grease trap, only clear
water will be reused for greenbelt development.
Air Environment
o Generation of Fugitive Dust
o Dust will be generated mainly during
excavation, loading &unloading
activities.
o Gaseous pollutants will by generated
mostly by the traffic.
o Reduction in visibility due to dust
plumes.
o Coating of surfaces leading to
annoyance and loss of amenity.
o Physical and/or chemical
contamination and corrosion.
o Increase in the concentration of
suspended particles in runoff
water.
o Coating of vegetation leading to
reduced photosynthesis,
o Inhibited growth, destroying of
foliage, degradation of crops;
o Increase in health hazards due to
inhalation of dust.
o Haul roads will be well maintained by sprinkling water
twice a day
o The access road will be cleaned and brushed to ensure
that mud and dust deposits do not accumulate.
o To ensure that dust and debris is minimised on the
access road, all the tipper drivers will be instructed to
use water spray system on all the tyres and spray water
on the loaded material that is provided at the compound
area before leaving the site
o Speed restrictions will be imposed to avoid spillage of
loaded materials upon the road and to reduce wear and
tear of the road.
o Weekly inspections of the condition of the access road
by competent person employed, and immediate action
will be taken to address any potholes or damage to the
road surface.
o Dust wetting agents can be mixed with the water
applied to haul roads during hot, dry weather conditions
to increase the duration that the road surface remains
damp.
o Personal Protective Equipment’s will be provided to all workers
o All drilling rods used will have dust suppression
systems fitted which injects water into the hole.
o Wet gunny bags will be used as a cover while drilling.
o The blast zone will be kept damp by the application of
water from the rain gun fitted to the water tanker prior
to each blast to control any fugitive dust emissions that
could arise from the surface during detonation.
o A daily visual inspection shall be conducted by the site
manager who will keep a daily log of all process
operations and site activities and note any malfunctions
which could lead to abnormal emissions from the
quarry operations.
o A site speed limit of 20 km/h will be set to minimise the
potential for dust generation

Page | 217
o Weekly maintenance programme to identify machinery
due for maintenance, based on the number of hours it
has been in operation.
o Air filters are renewed after every 1000 hours of use,
unless otherwise indicated by an on-board computer
system.
o All site machineries & tippers will be serviced and
maintained 6 months once and drivers will report any
defects immediately to the site manager to enable
repairs to be carried out promptly.
Noise & Vibration
o Annoyance and deterioration of the
quality of life;
o Propelling of rocks fragments by
blasting.
o Shaking of buildings and people due
to blasting;
o Usage of sharp drill bits while drilling which will help
in reducing noise;
o Secondary blasting will be totally avoided and
hydraulic rock breaker will be used for breaking
boulders;
o Controlled blasting with proper spacing, burden,
stemming and optimum charge/delay will be
maintained;
o The blasting will be carried out during favourable
atmospheric condition and less human activity timings
by using nonelectrical initiation system;
o Proper maintenance, oiling and greasing of machines
will be done every week to reduce generation of noise;
o Provision of sound insulated chambers for the workers
working on machines (HEMM) producing higher levels
of noise;
o Silencers / mufflers will be installed in all machineries;
o Green Belt/Plantation will be developed around the
project area and along the haul roads. The plantation
minimizes propagation of noise;
o Personal Protective Equipment (PPE) like ear muffs/ear
plugs will be provided to the operators of HEMM and
persons working near HEMM and their use will be
ensured though training and awareness.
Biological Environment
o Direct impacts include land clearance
and excavation causing destruction of
flora and fauna and loss of habitats;
o Indirect impacts include habitat
degradation due to noise, dust, and
human activity.
o Only some common herbs, shrubs and grass will be
cleared. So there will be no impact on the biodiversity.
o Green belt development with suitable species will
enhance the biodiversity of the project area.
o The core zone or buffer zone does not encompass any
threatened flora or fauna species.
Socio-Economic Environment
o Health and safety of workers and the
general public;
o Increase in traffic volumes and sizes
of road vehicles;
o Economic issues, including the
o The mining activity puts negligible change in the socio-
economic profile.
o Around 88 local workers will get employment
opportunities along with periodical training to generate
local skills.

Page | 218
increase in employment
opportunities;
o New patterns of indirect employment/ income will
generate.
o Regular health check-up camp.
o Assistance to schools and scholarship to children will
be provided.
Occupational Health & Safety
o Exposure to Dust
o Noise and Vibration Exposure
o Physical Hazards
o Respiratory hazards due to Dust
exposure
o Provision of rest shelters for mine workers with
amenities like drinking water etc.
o All safety measures like use of safety appliances, such
as dust masks, helmets, shoes, safety awareness
programs, awards, posters, slogans related to safety etc.
o Training of employees for use of safety appliances and
first aid in vocational training center.
o Weekly maintenance and testing of all equipment as per
manufacturers’ guidelines.
o Pre placement and Yearly Medical Examination of all
workers by a medical Officer
o First Aid facility will be provided at the mine site.
o Close surveillance of the factors in working
environment and work practices which may affect
environment and worker’s health by the mine’s manager employed.
o Working of mine as per approved mining plan and
environmental plans
11.10 ANALYSIS OF ALTERNATIVES
There are no alternatives suggested as the proposed mining area has the following advantages –
o The mineral deposit occurs in a non-forest area.
o There is no habitation within the applied lease area; hence no R & R issues exist.
o There is no river, stream, nallas and water bodies in the or passing through the applied
mine lease areas.
o Availability of skilled, semi-skilled and unskilled workers in this region.
o All the basic amenities such as medical, firefighting, education, transportation,
communication and infrastructural facilities are accessible.
o Mine connectivity through road and rail is good.
o The proposed mining operations do not intersect the ground water level. Hence, no
impact on ground water environment.
11.11 ENVIRONMENTAL MONITORING PROGRAM
Environmental Monitoring program will be conducted for various environmental
components as per conditions stipulated in Environmental Clearance Letter issued by SEIAA &
Consent to Operate issued by TNPCB.
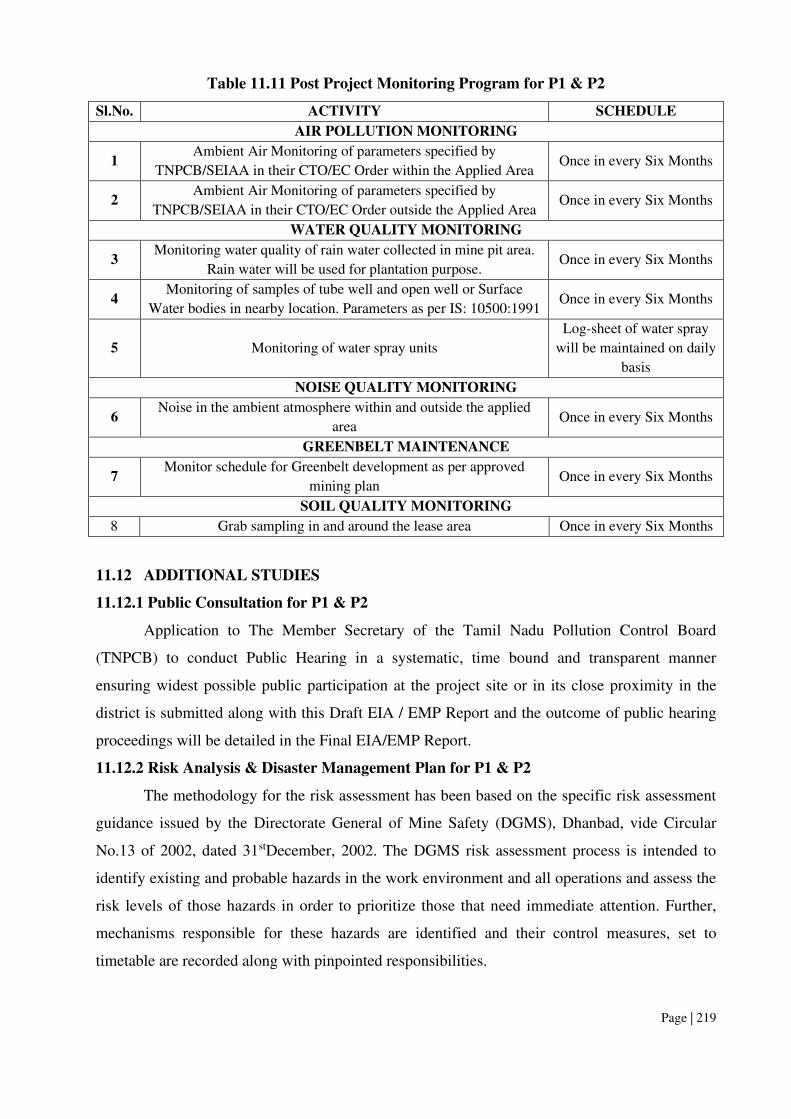
Page | 219
Table 11.11 Post Project Monitoring Program for P1 & P2
Sl.No. ACTIVITY SCHEDULE
AIR POLLUTION MONITORING
1 Ambient Air Monitoring of parameters specified by
TNPCB/SEIAA in their CTO/EC Order within the Applied Area Once in every Six Months
2 Ambient Air Monitoring of parameters specified by
TNPCB/SEIAA in their CTO/EC Order outside the Applied Area Once in every Six Months
WATER QUALITY MONITORING
3 Monitoring water quality of rain water collected in mine pit area.
Rain water will be used for plantation purpose. Once in every Six Months
4 Monitoring of samples of tube well and open well or Surface
Water bodies in nearby location. Parameters as per IS: 10500:1991 Once in every Six Months
5 Monitoring of water spray units
Log-sheet of water spray
will be maintained on daily
basis
NOISE QUALITY MONITORING
6 Noise in the ambient atmosphere within and outside the applied
area Once in every Six Months
GREENBELT MAINTENANCE
7 Monitor schedule for Greenbelt development as per approved
mining plan Once in every Six Months
SOIL QUALITY MONITORING
8 Grab sampling in and around the lease area Once in every Six Months
11.12 ADDITIONAL STUDIES
11.12.1 Public Consultation for P1 & P2
Application to The Member Secretary of the Tamil Nadu Pollution Control Board
(TNPCB) to conduct Public Hearing in a systematic, time bound and transparent manner
ensuring widest possible public participation at the project site or in its close proximity in the
district is submitted along with this Draft EIA / EMP Report and the outcome of public hearing
proceedings will be detailed in the Final EIA/EMP Report.
11.12.2 Risk Analysis & Disaster Management Plan for P1 & P2
The methodology for the risk assessment has been based on the specific risk assessment
guidance issued by the Directorate General of Mine Safety (DGMS), Dhanbad, vide Circular
No.13 of 2002, dated 31stDecember, 2002. The DGMS risk assessment process is intended to
identify existing and probable hazards in the work environment and all operations and assess the
risk levels of those hazards in order to prioritize those that need immediate attention. Further,
mechanisms responsible for these hazards are identified and their control measures, set to
timetable are recorded along with pinpointed responsibilities.

Page | 220
In the unlikely event that a consequence has occurred, disaster management kicks in.
This includes instituting procedures pertaining to a number of issues such as communication,
rescue, and rehabilitation. These are addressed in the disaster management plan. Both, the RA
and DMP, are living documents and need to be updated whenever there are changes in
operations, equipment, or procedures Assessment is all about preventing accidents and taking
necessary steps to prevent it from happening.
The Disaster Management Plan (DMP) is a guide, giving general considerations,
directions, and procedures for handling emergencies likely to arise from planned operations. The
DMP has been prepared on the basis of the Risk Assessment and related findings covered in the
report.
11.13 PROJECT BENEFITS FOR P1 & P2
Various benefits are envisaged due to the proposed mine and a comprehensive
description of various advantages and benefits anticipated from the proposed project to the
locality, neighbourhood, region and nation as a whole are –
o Improved road communication.
o Rain water harvesting structures to augment the water availability for irrigation and
plantation and groundwater recharge.
o Creation of community assets (infrastructure) like school buildings, village roads/
linked roads, dispensary & health Centre, community Centre, market place etc.,
o Strengthening of existing community facilities through the Community Development
Programme.
o Skill development & capacity building like vocational training.
o Awareness program and community activities, like health camps, medical aids, sports
& cultural activities, plantation etc.
In order to implement the environmental protection measures, budget is proposed
considering present market price considering present market scenario in the below table for
respective proposed projects.

Page | 221
TABLE 11.11 EMP Budget – P1
Sl.No. Description Item
Capital
Cost (Rs.
In Lakhs)
Recurring
Cost per
Annum
(Rs. in
Lakhs)
1 Occupational
health & safety
Dust Mask, Safety Shoes, Helmets Ear
Plugs, Gloves, Goggles Reflector
jacket, Safety Belt, Medical check ups
1.00 0.20
2 Environmental
Monitoring
Air, Water, Noise & Vibration, Soil
Parameters 3.80 0.76
3 Water & Soil
erosion
Garland drains &Settling tanks, check
dam/gully plugs, etc 0.60 0.12
4 Drinking Water Facilities and Sanitation Facilities 1.00 0.20
5 Water Sprinkling Arrangements 0.80 0.16
6 Haul Road Maintenance 1.00 0.20
7 Green belt Development & Plantation 1.00 0.20
8 Environmental Awareness Programme 0.25 0.25
Fencing, Fertilizer, Manure, Manpower, etc. 1.00 0.25
Total 10.45 2.34
Table 11.12 EMP Budget – P2
Sl.No. Description Item
Capital
Cost (Rs.
In Lakhs)
Recurring
Cost per
Annum
(Rs. in
Lakhs)
1 Occupational
health & safety
Dust Mask, Safety Shoes, Helmets Ear
Plugs, Gloves, Goggles Reflector
jacket, Safety Belt, Medical check ups
1.00 0.20
2 Environmental
Monitoring
Air, Water, Noise & Vibration, Soil
Parameters 3.20 0.64
3 Water & Soil
erosion
Garland drains &Settling tanks, check
dam/gully plugs, etc 1.20 0.24
4 Drinking Water Facilities and Sanitation Facilities 0.80 0.20
5 Water Sprinkling Arrangements 1.20 0.24
6 Haul Road Maintenance 1.00 0.30
7 Green belt Development & Plantation 1.10 0.22
8 Environmental Awareness Programme 0.25 0.25
Fencing, Fertilizer, Manure, Manpower, etc. 2.50 0.50
Total 12.25 2.79

Page | 222
11.14 CONCLUSION
EIA study was performed as per the approved ToR and Standard ToR. Various
environmental attributes were studied relating with aspects of mining activities. The related
impacts were identified and evaluated. Considering all the possible ways to mitigate the
environmental concerns Environmental Management Plan was prepared and accordingly fund
was allocated. The EMP has been dynamic, flexible and subject to periodic review. CER
activities were identified and for its time bound implementation, fund has been allocated.
The project will increase the revenue of the State Govt. as well as it will help in the
social upliftment of the local community. The green belt development programme will help in
increasing the green cover in the area. Thus, the proposed project is not likely to affect the
environment or adjacent ecosystem in an adverse way.
The Mines Management will be responsible for the project review of EMP and its
implementation to ensure that the EMP remains effective and appropriate. Thus, the proper steps
will be taken to accomplish all the goals mentioned in the EMP and the project will bring the
positive impact in the study area.

Page | 223
CHAPTER XII
DISCLOSURES OF CONSULTANT
The Project Proponent – Tmt.SA.Sumithashankr and M/s. MA Quality Stone have
engaged Geo Technical Mining Solutions, an Accredited Organization under Quality Council of
India – National Accreditation Board for Education & Training, New Delhi, for carrying out the EIA
Study as per the ToR Issued.
Name and address of the consultancy:
GEO TECHNICAL MINING SOLUTIONS
No: 1/213B Natesan complex,
Oddapatti, Dharmapuri – 636705,
Tamil Nadu, India.
Email:[email protected]
Web: www.gtmsind.com
Phone: 04342 232777.
The Accredited Experts and associated members who were engaged for this EIA study as given
below:
S.No Name of the expert In house/ Empanelled
FAE
Sector Function
al Area Category
1. Shri G. Vageesan EIA Coordinator (EC)
In-house 1(a)(i) Mining
B
2. Dr.S. Karuppannan In-house
FAE
1(a)(i) LU, HG,
GEO B
3. Dr.M. VijayPrabhu In-house
FAE 1(a)(i) HG, LU,
GEO B
4. Dr.J. Rajarajeswari In-house 1(a)(i) EB, SC B 5. Dr.G. Prabakaran In-house 1(a)(i) SE B
6. Dr.R. ArunBalaji In-house
FAE
1(a)(i) AP, AQ,
NV B
7. Mr.J.N. Manikandan Empanelled
1(a)(i) RH,
SHW, AP B
8. Dr.S. Malar In-house
FAE
1(a)(i) WP B
9. Mr.G. UmaMaheswaran In-house
FAE 1(a)(i) HG, LU,
GEO B
10. Mr.S. GopalaKrishnan In-house
FAE 1(a)(i)
HG, GEO B
11. Mr.G. Prithiviraj FAA 1(a)(i) LU, HG B 12. Mr.C. Kumaresan FAA 1(a)(i) NV B
13. Mr.N. GokulPraveen FAA 1(a)(i) HG B
14. Mr.S. Dinesh FAA 1(a)(i) HG, GEO B
15. Mr.P. Vellaiyan FAA 1(a)(i) HG, GEO B
16. Dr.A. Kalaiyarasi Team Member - HG - 17. Mr.M. Saravannan Team Member - GIS -
18. Mr.P. Venkatesh Team Member - SHW,
AP, RH -
19. Mr. SriKrishna Team Member - LU, HG -

Page | 224
Abbreviations
EC EIA Coordinator NV Noise and Vibration
FAE Functional Area Expert SE Socio Economics
FAA Functional Area Associates HG Hydrology, ground water and water
conservation
TM Team Member SC Soil conservation
GEO Geology RH Risk assessment and hazard management
WP Water pollution monitoring,
prevention and control
SHW Solid and hazardous wastes
AP Air pollution monitoring,
prevention and control
MSW Municipal Solid Wastes
LU Land Use ISW Industrial Solid Wastes
AQ Meteorology, air quality
modeling, and prediction
HW Hazardous Wastes
EB Ecology and bio-diversity GIS Geographical Information System
DECLARATION BY EXPERTS CONTRIBUTING TO THE EIA & EMP
Declaration by experts contributing to the Cluster EIA/EMP for Kothapetta village
rough stone quarry project over a Cluster Extent of 20.19.0 hectares in Kothapetta Village,
Krishnagiri Taluk, Krishnagiri District and Tamil Nadu State.It is also certified that
information furnished in the above EIA study are true and correct to the best of our
knowledge.
I, hereby, certify that I was a part of the EIA team in the following capacity that
developed the EIA/EMP Report.
Name : Shri. G. VAGESAN
Designation : EIA Coordinator
Date & Signature :
Period of Involvement : January 2021 to till date

Page | 225
FUNCTIONAL AREA EXPERTS ENGAGED IN THE PROJECT
Sl.
N
o.
Function
al Area Involvement Name of the Expert/s Signature
1 AP
o Identification of different sources of air pollution due to the proposed mine activity
o Prediction of air pollution and propose mitigation measures / control measures
Mr.J.N. Manikandan
2 WP
o Suggesting water treatment systems, drainage facilities
o Evaluating probable impacts of effluent/waste water discharges into the receiving environment/water bodies and suggesting control measures.
Dr.S.Malar
3 HG
o Interpretation of ground water table and predict impact and propose mitigation measures.
o Analysis and description of aquifer Characteristics
Dr.M. Vijay Prabhu
Mr.G. UmaMaheswaran
4 GEO
o Field Survey for assessing the regional and local geology of the area.
o Preparation of mineral and geological maps.
o Geology and Geo morphological analysis/description and Stratigraphy/Lithology.
Mr.G.GopalaKrishnan
5 SE
o Revision in secondary data as per Census of India, 2011.
o Impact Assessment & Preventive Management Plan
o Corporate Environment Responsibility.
Dr.G. Prabhakaran
6 EB
o Collection of Baseline data of Flora and Fauna.
o Identification of species labelled as Rare, Endangered and threatened as per IUCN list.
o Impact of the project on flora and fauna.
o Suggesting species for greenbelt development.
Dr.J. Rajarajeshwari
7 RH
o Identification of hazards and hazardous substances
o Risks and consequences analysis o Vulnerability assessment o Preparation of Emergency
Preparedness Plan o Management plan for safety.
Mr.J.N. Manikandan
8 LU
o Construction of Land use Map o Impact of project on surrounding land
use o Suggesting post closure sustainable
land use and mitigative measures.
Dr.S. Karuppannan

Page | 226
9 NV
o Identify impacts due to noise and vibrations
o Suggesting appropriate mitigation measures for EMP.
Dr.R. Arun Balaji
10 AQ
o Identifying different source of emissions and propose predictions of incremental GLC using AERMOD.
o Recommending mitigations measures for EMP
Dr.R. ArunBalaji
11 SC o Assessing the impact on soil
environment and proposed mitigation measures for soil conservation
Dr.J. Rajarajeshwari
12 SHW
o Identify source of generation of non-hazardous solid waste and hazardous waste.
o Suggesting measures for minimization of generation of waste and how it can be reused or recycled.
Mr.J.N. Manikandan
LIST OF TEAM MEMBERS ENGAGED IN THIS PROJECT
S.No. Name Functional
Area Involvement Signature
1 Mr.G. Prithiviraj AQ, AP,
LU, HG
o Site visit with FAE
o Provide inputs & Assisting FAE with
sources of Air Pollution, its impact and
suggest control measures
o Analyse & provide inputs and assist
FAE with meteorological data,
emission estimation, AERMOD
modelling and suggesting control
measures
2 Mr.N.GokulPraveen HG
o Site visit with FAE
o Assisting FAE on sources of water
pollution, its impacts and suggest
control measures
o Assisting FAE in preparation of land
use maps
3 Mr.C. Kumaresan NV
o Assist in Resources & Reserve
Calculation and preparation of
Production Plan & Conceptual Plan
4 Mr. S. Dinesh HG; GEO
o Site visit with FAE
o Provide inputs on Geological Aspects
o Assist in Resources & Reserve
calculation and preparation of
production Plan & Conceptual Plan
5 Mr.P. Vellaiyan HG; GEO
o Site visit with FAE
o Assist FAE with collection of data
o Provide inputs by analysing primary
and secondary data

Page | 227
DECLARATION BY THE HEAD OF THE ACCREDITED CONSULTANT
ORGANIZATION
I, Dr. S. KARUPPANNAN, Managing Partner, Geo Technical Mining Solutions, hereby,
confirm that the above-mentioned Functional Area Experts and Team Members prepared the Cluster
EIA/EMP for Kothapetta village rough stone quarry project over a cluster extent of 20.19.0 hectares
in Kothapetta Village, Krishnagiri Taluk, Krishnagiri District and Tamil Nadu State. It is also certified
that information furnished in the EIA report is true and correct to the best of our knowledge.
Signature& Date :
Name : Dr. S. Karuppannan
Designation : Managing Partner
Name of the EIA Consultant Organization : Geo Technical Mining Solutions
NABET Certificate No & Issue Date : NABET/EIA/2023/IA0067
Dated: March 30, 2021
Validity : Valid till 29.12.2023
Minutes of 254th Accreditation Committee Meeting for Initial Accreditation held on 29.01.2021.