Dose Adaptation Based on Pharmacometric Models
82
-
Upload
khangminh22 -
Category
Documents
-
view
0 -
download
0
Transcript of Dose Adaptation Based on Pharmacometric Models

������������������� ���������� �
����
���������� �������������� ������������������� ������� ������������������� �������
����� ��� ��� �������������� �� ����
������������
��������� ���!��"���#$ �� ��� #�$$ �%��&�'�&��&%%& ( �))���

����������������������� ������� ������������������������������������������������������ ����!���� ��������"������������#��$%%&����%&'�#�(���)���������(������(*)����)��+"�������(�*)������,-�.)�����������/�����������������0����)-
��������
1������2-�$%%&-�����3���������������*)�����������������-�+��������������3�������,-�3���� ������������ ���������-����������� �������������� ������������������ �������� ������������������� �����&�-�4%���-� ������-������&546&�6##�65�446�-
������������)�������7������������������)��)������������+*8,�����)������������+*�,������������)������������)������(��)�����������(�������������-�9���������������������)���/�����������+::9,����/�������/��)���������������)��������(������+:;9,-�:��������/��)���/��)�����������������������������::9��������������������<�����������������������-3��������������)�������������(���+��� � �,����(����+������ � �,�(���������������������-.)��(��������������������)�������������(�������/�������(������������)���������(���������������/���)����������������������/)������������ � �����������������������������6������������������-�;(�������������=�������������������)��������������� �����(-� :� ���)� ������������ ������������ �������������� ������������ (�������������������-:��)����)������/��)����������������/)���������������������)����������������������������
�)�� ������������� (� �� � � �� ��� �� ���� � �� ���� ��������>� ��������� ��������� /)���������������������������������������������������(���������������������������������������-�:���������������������������)���������/����(��������(��������������(�����������������)�������������������������6�����������-�?�/�*8�������/�������������������������������/����������������������(���)���������������������������=����)��)������)����������������)����������������6�����������-"�� �������� ��������� ������ ���������� /���� �����(���� �)��� ������� ��������� ::9� �
�������������-� :;9�/���� (��� ����� �/��� �)�� ::9�/)��)� �������� �)��� ����������������������������� � ����������������-��������������������������������������������������������������������)�������(����������������������)������������������/��������������������������-�.������������(����������������/�������������������������������(����������)��������/�������������-�@��������)/���������������������(����������������(������)��������������������-.)���������������������)����)�����)����������������������A�0�����������(���������
(���������������/�/���������������������������������������/��)����������������������������(����������������(�/���-
���� �����)���������������)���������������������������������������������������������� ������ �
����� �����!������������ ������������������������������������� ���"�������������������������������������������������#$%&'()��������!�������
B�2)��1�����$%%&
:AA?��C#�6C�&$:A�?�&546&�6##�65�446���'�'��'��'����6�%%#C&�+)���'DD��-��-��D������E��F��'�'��'��'����6�%%#C&,

Sie ist ein Modell und sie sieht gut ausKraftwerk 1978


List of Papers
This thesis is based on the following papers:
I Wallin JE, Friberg LE, Fasth A, Staatz CE. Population pharma-cokinetics of tacrolimus in paediatric haematopoietic stem cell transplant recipients: New initial dosage suggestions and a model based dosage adjustment tool (Submitted)
II Wallin JE, Nydert PS, Wilczek HE, Karlsson MO, Staatz CE. Population pharmacokinetics of tacrolimus in paediatric liver transplant recipients, a model to describe early post-transplantation apparent clearance (In manuscript)
III Kloft C, Wallin JE, Henningsson A, Chatelut E, Karlsson MO. Population pharmacokinetic-pharmacodynamic model for neu-tropenia with patient subgroup identification: comparison across anticancer drugs. Clin Cancer Res 2006; 12 (18): 5481-90
IV Hansson EK, Wallin JE, Lindman H, Sandström M, Karlsson MO, Friberg LE. Limited inter-occasion variability in relation to inter-individual variability in chemotherapy-induced myelosup-pression (Submitted)
V Wallin JE, Friberg LE, Karlsson MO. CE Model Based Neutro-phil Guided Dose Adaptation in Chemotherapy; Evaluation of Predicted Outcome with Different Type and Amount of Informa-tion (Submitted)
VI Wallin JE, Friberg LE, Karlsson MO. A tool for neutrophil guided dose adaptation in chemotherapy. Comput Methods Pro-grams Biomed 2009; 93 (3): 283-91
Reprints were made with permission from the respective publishers.


Contents
Introduction ................................................................................................... 11 Dose selection .......................................................................................... 11
The dose-response relationship ............................................................ 11 A priori dosing ..................................................................................... 14 A posteriori dosing .............................................................................. 14
Population modelling ............................................................................... 17 Basic principles .................................................................................... 17 Modelling TDM data ........................................................................... 18
The therapeutic areas ................................................................................ 18 Immunosuppression in paediatric transplantation ............................... 18 Myelosuppression in anticancer treatment .......................................... 20
Aim of the thesis ........................................................................................... 24
Methods used ................................................................................................ 25 Description of data ................................................................................... 25
Tacrolimus in paediatric transplantation .............................................. 25 Myelosuppression ................................................................................ 26
Modelling and simulation ......................................................................... 28 Population analysis .............................................................................. 28 Simulation studies ................................................................................ 32 Dosing tool .......................................................................................... 34
Results ........................................................................................................... 35 Models for tacrolimus PK in paediatric transplantation ........................... 35
Patients and data collection ................................................................. 35 Bayesian forecasting with previously developed models .................... 35 Population modelling ........................................................................... 36 Dose revision ....................................................................................... 38
Variability parameters in the myelosuppression model ........................... 42 System related covariates .................................................................... 42 Interoccasion variability ...................................................................... 46 Dose optimisation with nadir level as target ........................................ 48
Bayesian dose adaptation in Excel ........................................................... 51 Dosing tool for intravenous tacrolimus ............................................... 51 Dosing tool for neutrophil nadir as target ............................................ 52

Discussion ..................................................................................................... 54 Tacrolimus dose adaptation ...................................................................... 54 Dose adaptation with myelosuppression target ........................................ 57 Model based dose adaptation in perspective ............................................ 60
Conclusions ................................................................................................... 63
Svensk sammanfattning ................................................................................ 65
Acknowledgments......................................................................................... 67
References ..................................................................................................... 70

Abbreviations
AAG α1-acid glycoprotein ALB albumin ALP alkaline phosphatase ALT alanine aminotransferase ANC absolute neutrophil count AST aspartate aminotransferase BASE baseline neutrophil level without treatment BMT bone marrow transplantation BSA body surface area CI confidence interval CL clearance CL0 clearance at time zero CLmax maximal clearance level Corr correlation between individual estimates COV covariate Crea creatinine CrCL creatinine clearance CV coefficient of variation CWRES conditional weighted residuals DV dependent variable E0 effect when no drug is present EBE empirical Bayes’ estimate EC50 concentration to produce 50% of Emax Emax maximum effect F bioavailability FO first order estimation FOCE first order conditional estimation GAM generalised additive modelling GGT γ-glutamyl transferase GLS generalised least squares GVHD graft-versus-host-disease HPLC high-performance liquid chromatography HSCT haematopoietic stem-cell transplantation IIV inter-individual variability IOV inter-occasion variability IPRED individual prediction

iv intravenous IWRES individual weighted residuals kin enzyme formation rate kout enzyme degradation rate LBW lean body weitht LC/MS liquid chormatography/mass spectrography LDH lutheine dehydrogenase MEIA microemission immuno-assay MPE mean prediction error MTT mean transition time NEUto baseline neutrophil value before treatment OFV objective function value PD Pharmacodynamic PK Pharmacokinetic po per os (oral administration) POD post-operative day PRED population prediction Q intercompartmental clearance RMSE root mean squared error RSE relative standard error SD standard deviation SLOPE drug efficacy parameter SmPC summary of product characteristics t½ half-life TCL50 time to 50% of maximum clearance TDM therapeutic drug monitoring V apparent volume of distribution � (epsilon) difference between individual prediction and observa-
tion (residual error) � (eta) difference between population and individual parame-
ter estimate � (theta) fixed-effect parameter (typical value) � (kappa) difference in individual parameter estimates between
occasions � (pi) standard deviation of �:s � (sigma) standard deviation of �:s � (Omega) variance-covariance matrix of �:s � (omega) standard deviation of �:s

11
Introduction
Dose selection In clinical drug development, a key target is to achieve the simplest pos-
sible dosing schedules; where one-dose-fits-all would most commonly be desired. Unfortunately many drugs exhibit major variability in both pharma-cokinetic (PK) and pharmacodynamic (PD) parameters, which in some cases call for a dose individualisation. Variability can both occur between patients, even if demographically similar, as well as within patients over the course of time, so called inter-individual and inter-occasional variability (IIV and IOV). In population pharmacokinetics/pharmacodynamics (PK/PD), typical parameters as well as their variability distribution in a population can be characterised.
In the optimal case, the clinical outcome can easily be studied or quanti-fied, but in many cases there is a substantial time lag between the dose event and the clinical end-point, or the clinical end-point cannot easily be ob-served. It can therefore be very useful to characterise the dose-response rela-tionship, and the possible causes of variability within this relationship. With an understanding of this, dose selection might be performed with greater confidence.
The dose-response relationship Dose and concentration
Pharmacokinetics in short is the study of what happens to a drug when administered to the body. Concentration of drug in blood or plasma arising after administration can be described as a number of physiological events, usually divided into absorption, distribution, metabolism and excretion (ADME). The extent and rate of these are dependent on both the physico-chemical properties of the drug and the drug delivery system, as well as the biological properties of the patient (or animal) observed. Since these are biological processes it is most likely that some degree of variability may arise in any of these, both between individuals and during time within the individual.

12
Pharmacodynamics on the other hand is the study of what happens to the body caused by the drug administered. The effect of a drug is thought to be dependent on the concentration at the effect site. The effect of drug can be exerted through many different mechanisms, but often requires binding to a target, which then leads to a biological effect. This effect could either be an immediate reaction or consist of a whole chain of events. This means that depending on the mechanism of action, the correlation between drug concen-trations and the effect observed may be either direct or offset in time, which may demand consideration when modelling the pharmacodynamics of a drug. The relation of concentration and effect may be modelled in numerous ways, from linear approximations to highly complex functions depending on the problem at hand.
Biomarkers and surrogate markers Effects may also be divided into desired and adverse events. In cases
where the effect is hard to observe, or has a markedly long time offset to be of use in clinical decision making, some intermediate biological effect might be used. In a case where the causal chain of events from binding of drug to the primary effect includes a characteristic that can easily be objectively measured, and have a clear quantitative relation to both the effective concen-tration and the primary effect, this can be called a biomarker. The biomarker could thus be used in the decision making in replacement of, or in addition to, the primary effect.
There might also be effects observed that are neither primarily wanted nor
unwanted, but still have a close correlation to the primary effect. If the primary effect might not be readily observed, a biomarker that is intended to serve as a substitute for a clinically meaningful endpoint and is expected to predict the effect of a therapeutic intervention can be used as a surrogate marker.
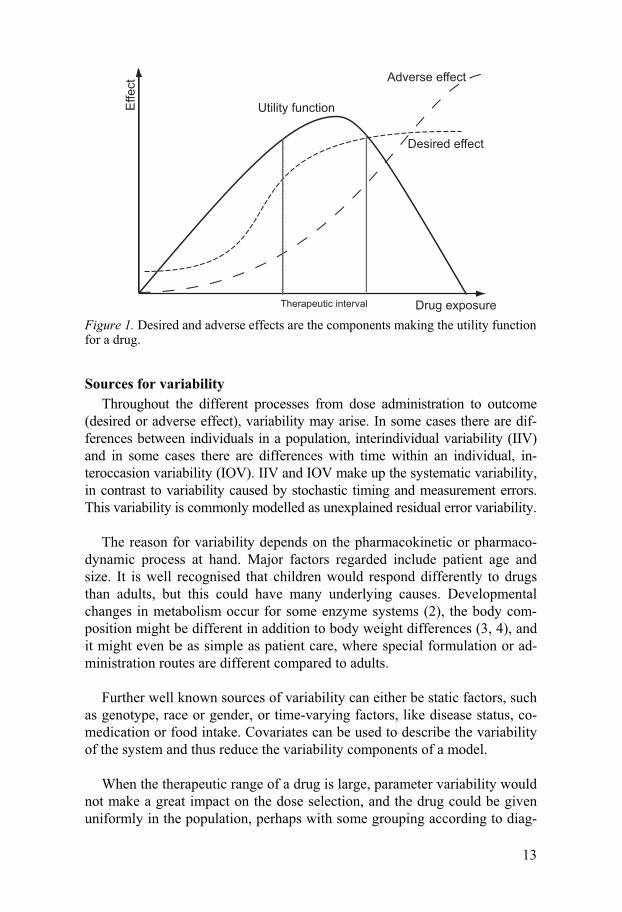
Therapeutic interval In order to decide upon a suitable drug dose, one needs to define the level
of desired effect. Often a utility function is constructed, weighing desired and undesired effects against each other. This utility can in some cases be clearly related to doses, but in cases where variability in the system is pro-nounced, it should rather be correlated to drug concentration, biomarker or surrogate marker. In such cases the utility function is often translated into a therapeutic interval (see Figure 1), meaning that dose should be selected to achieve concentration or biomarker levels within the therapeutic interval. The concept of this would be that there is a concentration or biomarker range where the drug is not too toxic but still has sufficient effect (1). The utility function could also be interpreted into a therapeutic target, rather than an interval, assuming that there is actually one specific point of the utility func-tion curve which is optimal.
13
Desired effect
Adverse effect
Drug exposure
Utility function
Therapeutic interval
Effe
ct
Figure 1. Desired and adverse effects are the components making the utility function for a drug.
Sources for variability Throughout the different processes from dose administration to outcome
(desired or adverse effect), variability may arise. In some cases there are dif-ferences between individuals in a population, interindividual variability (IIV) and in some cases there are differences with time within an individual, in-teroccasion variability (IOV). IIV and IOV make up the systematic variability, in contrast to variability caused by stochastic timing and measurement errors. This variability is commonly modelled as unexplained residual error variability.
The reason for variability depends on the pharmacokinetic or pharmaco-
dynamic process at hand. Major factors regarded include patient age and size. It is well recognised that children would respond differently to drugs than adults, but this could have many underlying causes. Developmental changes in metabolism occur for some enzyme systems (2), the body com-position might be different in addition to body weight differences (3, 4), and it might even be as simple as patient care, where special formulation or ad-ministration routes are different compared to adults.
Further well known sources of variability can either be static factors, such
as genotype, race or gender, or time-varying factors, like disease status, co-medication or food intake. Covariates can be used to describe the variability of the system and thus reduce the variability components of a model.
When the therapeutic range of a drug is large, parameter variability would not make a great impact on the dose selection, and the drug could be given uniformly in the population, perhaps with some grouping according to diag-

14
nosis or demographics. But in some therapeutic areas the therapeutic range is often small, and if variability at the same time is high, uniform doses are less appropriate and dose individualisation is called for.
A priori dosing If certain covariates are known to affect pharmacokinetic or pharmacody-
namic parameters of importance to the outcome, these could be used to indi-vidualise the dose on beforehand, so called a priori dose adaptation. Dose adaptation based on covariate models could be carried out with various de-grees of flexibility. As an example, digoxin against heart failure is often reduced by 50% or 75% if the calculated creatinine clearance is below 50 or 10 mL/min. This is an example of a fixed step dosing strategy. In other cases there are more step levels, where a simple table would provide an aid to the physician for adjusting the dose, by age for example. Fixed dosing steps are often a necessity in orally administered drugs, where tablet or capsule sizes limit the number of different possible dose levels to be prescribed.
More flexible ways of a priori dosing are common in many intravenous
therapies, and dose can then be set on a continuous scale. For example, many anticancer agents are dose based on body surface area, and anaesthetic drugs are often dose based on patient weight. A priori dosing schedules might also have higher grades of complexity, like some antibacterial drugs that are dosed both according to patient weight, renal function and to the targeted bacterial strain. In such cases a computer based tool could be an aid to the prescriber.
A posteriori dosing If a dose is reviewed based on observation of the drug response, this is
called a posteriori dose adaptation. Adjusting dose based on measurement of a drug characteristic rather than the clinical endpoint is known as therapeutic drug monitoring, TDM. The most common use of TDM is the procedure of interpreting a plasma concentration in relation to the given dose, but it might also be interpreting a measurement of biomarker or surrogate marker. Most commonly dose adjustment is carried out in standard increments, or accord-ing to the clinician’s own gut-feeling or experience.
When the dose and response relation express high variability between in-
dividuals caution is required in making interpretations on the dose selection based on the response. In Figure 2, panel a) the general pattern of a linear dose response relationship is described if patients would have been given either a randomised or one and the same (uniform) dose. The trend line fol-lows the line of unity, and the distribution of response measurements is de-

15
termined by the parameter variability distribution and random residual error. Panel b) depicts the same linear dose response plot if dose adaptation has taken place. If the dose was previously adjusted based on a measurement, the distribution pattern will be conditioned on the variability distribution in the parameters. For example, if dose is adjusted based on steady state plasma concentrations, this will lead to high clearance patients receiving a higher dose and low clearance patients receiving a lower dose. This sometimes leads to the assumption that there is no evident positive relationship between dose and response when studying TDM data, since the trend line rather tends to form a horizontal line. On the contrary, if applying population model based techniques; this would help to identify the correlation between meas-urements on the individual level as shown in panel c). Population techniques could thus be used to identify the typical response in the population and the variability distribution in the parameters involved, enabling the individual predictions of future measurements, as depicted in panel d).
Dose level
Resp
on
se
Dose level
Resp
on
se
Dose level
Resp
on
se
Resp
on
se
Individual prediction
a. b.
c. d.
Figure 2. The apparent population dose-response relation in a) randomised and b) adaptive dosing. Population models recognise the interindividual variability in this response c) and would be able to make individual predictions d). Grey line repre-sents the line of unity, black line the regression fit to data.

16
With the application of population models for dose adaptation the interin-dividual variability in parameters is recognised. In a case where the variabil-ity between patients is large, and appropriate dose adaptation is not easily determined directly from the response measurement, pharmacometric mod-els would be valuable. If the distribution pattern of parameters in a popula-tion is known, this can be used for making educated guesses on an individual level, based on observations. These methods are referred to as Bayesian methods.
Bayesian forecasting is a method for updating a model with information
to estimate the individual parameters of the model for the present subject, commonly used also in econometrics or meteorology. In this context, Bayes-ian methods are used to obtain empirical Bayes’ estimates (EBE) of the indi-vidual parameters of the population model for the patient at hand, using a measurement of a component of the model; a concentration or a biomarker. The measurements are used in a population model in combination with in-formation on the dosing history, and are counterweighted by the information on the typical parameters and the variability distribution, to produce a curve fit. These individual parameters can be used to forecast what outcome will result from dose adjustment, and one can thus use this parameter set to maximise the possibility of reaching a specified target, see Figure 3.
conc
entra
tion
timefuturehistoric data
prediction
curve fit = individual profile
?
profile of typical individual
observations
Figure 3. Measurements and dose history are used to predict outcome of future dosing.
There are several dedicated software developed for the purpose of Bayes-
ian forecasting in therapeutic drug monitoring, such as AbbottBase (Abbott Diagnostics, Chicago Ill., USA), MW Pharm (MediWare, Leiden, Nether-lands) and USC pack (USC, Los Angeles Ca., USA). In addition to this mixed-effect modelling softwares such as NONMEM (ICON, Ellicott City

17
Md., USA) Monolix (INRIA, Paris, France) or NLME (Bell Labs, Murray Hill NJ, USA) can be used for the same purpose. None of the dedicated software are designed to implement more complicated PK/PD models, but are capable of handling multi-compartmental PK-models. These are models that can be solved analytically, whereas many PK/PD models have a higher grade of complexity that would require an ordinary differential equation (ODE) solver.
Population modelling Basic principles
Pharmacometrics can be defined as the science of quantifying drug behav-iour and actions, and can also encompass disease development and clinical trial design. It is used to aid efficient drug development, regulatory decisions and therapeutic decisions. The quantification usually means construction of statistical models, which can either be traditional fixed effects models or mixed effect models, also called population models. In fixed effects models all individuals are thought to share the same model parameters and interindi-vidual differences are not considered. In non-linear mixed-effects modelling (also called population modelling) parameters are assumed to posses a typi-cal value, �, with � describing the differences between � and the parameter estimate for the individual. The �-distribution, �, can attain any shape, but is often assumed to be normal or log-normal. In addition to IIV, a similar dis-tribution for �, called �, can also be assigned to describe the IOV, where � is the difference between the individual parameter estimate from one occasion to another.
In addition to the typical parameters and variability distributions, random
measurement and timing errors are described by a residual error model. This is often described by an additive and/or a proportional component. Further-more, covariates can be included to explain variability. Examples of covari-ates can be age, gender, weight, concomitant medication or organ function indicators. In general a covariate is included in a model if it can improve the fit of a model. It can also be judged by the ability to reduce the unexplained random residual error or the variability estimates. Covariates can be divided into categorical or continuous. Categorical covariates can assume only cer-tain values, and may even be as simple as yes or no, whereas continuous covariates could assume any value. Covariates can be included into the model in various manners depending on their nature and on their correlation to parameters and measurements. Examples of covariate parameterisation are linear, exponential or stepwise.

18
Modelling TDM data As earlier mentioned, data obtained after adaptive feedback control like
TDM, requires some caution in interpretation. This is also true when it comes to modelling, and above all in model diagnostics. Population predic-tion based graphics are often used in model development to assess the global fit of the data. In adaptive design data, predictions would appear skewed towards the adaptive control target in the very same manner fig 2b, and indi-vidual based predictions should rather be used. Simulation based diagnostics, such as numerical predictive checks, visual predictive plots or mirror plots should also be used with caution, since they would exaggerate interindi-vidual variability.
Furthermore sampling TDM data are rarely planned for optimal parameter
identification purposes, and when modelling such data bias in some parame-ters may arise. For example only sampling trough concentrations may limit the identifiability in distribution parameters. In such cases prior information from other populations can be introduced with corresponding uncertainties using Bayesian techniques to support the estimation process (5).
The therapeutic areas In this thesis, various aspects of dose adaptation are discussed in two dif-
ferent. The therapeutic areas chosen typically high variability in PK and or PD in combination with a high risk for severe adverse effects. In addition, a sufficient effect is critical for patient survival.
Immunosuppression in paediatric transplantation The need for immunosuppression
In transplantation it is necessary to suppress the immune system to avoid graft rejection, while at the same time, over aggressive immunosuppression increase the risk of tumours and opportunistic infections. Most of the drugs used in the area can also cause severe neuro-, nephro- or hepatotoxicity at high concentrations. In solid organ transplantation immunosuppressants are used to avoid rejection, i.e. that the immune system recognises the donated organ as a foreign object, and begins an attack that can lead to organ loss. In heterologous stem cell transplantation (HSCT) the recipient’s immune sys-tem has been heavily suppressed, if not totally eradicated, and the focus lies more on hindering the immune cells developed from the donated stem cells from recognising the new environment as a foreign object, so called graft-versus-host-disease (GVHD). A major difference between solid organ and HSCT is the time needed to develop tolerance. In solid organ transplantation

19
this might be on a decade scale, and the patients might need life-long immu-nosuppression, whereas in HSCT most patients could phase out the treatment after less than a year if the matching of donor and recipient has been suc-cessful.
Tacrolimus in immunosuppression Modern transplantation was enabled by the development of effective im-
munosuppressive drugs, which involved combinations of high-dose steroids, methotrexate and cyclosporine-A. Tacrolimus was discovered in 1984 from the fermentation broth of a Japanese soil sample containing the fungus Strep-tomyces tsukubaensis, and was found to have immunosuppressive effects (6, 7). It acts through inhibition of calcineurin phosphatase, thus limiting activa-tion of T-lymphocytes (8). Over the years it has emerged as an important asset in transplantation, and has become an important adjuvant, or even a replacement, to cyclosporine-A (9, 10). Trough concentrations are thought to correspond well with the area under the concentration-time curve, and can be use as an indicator of total drug exposure (11, 12). Monitoring of trough con-centrations has also proven to be a good indicator of efficacy and toxicity (13, 14). It is thus used for TDM of tacrolimus, which is facilitated by fast and accurate analytical methods (15).
Tacrolimus paediatric pharmacokinetics Liver transplantation
To date seven population pharmacokinetic studies of tacrolimus in adult liver transplant recipients (16-22) and four studies in children (23-26) have been presented. Factors reported to influence the apparent clearance (CL/F) of tacrolimus include patient hepatic and renal function, body size, age (in paediatrics), time post-transplant and transplant type (whole or cut-down graft). Factors reported to influence the apparent volume of distribution (V/F) of tacrolimus include patient size and haematocrit level. In general the paediatric studies report higher volumes of distribution as well as apparent clearance in relation to patient linear weight. Moreover, when recalculating clearance estimates from the linear scale using allometric principles (3, 4), paediatric and adult findings express a high degree of consistency, suggest-ing that there are no major metabolic differences in adults and children. Al-lometric scaling of CL to the weight3/4 has been shown to better reflect physiological differences in drug elimination with weight than a linear rela-tionship, both across species (27, 28) and over age ranges (3, 4).
In several pharmacokinetic studies to date, the CL/F of tacrolimus has
been reported to increase significantly during the first weeks post-transplant (16, 25, 29-33). Possible explanations have included enzyme induction by concomitant steroid therapy, donor organ recovery or altered protein levels.
20
Two previous population pharmacokinetic studies of tacrolimus in adults have focused on predicting early post-transplant CL/F of tacrolimus (16, 29), suggesting a sigmoid Emax function for CL, with time as operator. This model has previously not been presented with paediatric data.
Stem cell transplantation The pharmacokinetics of tacrolimus in bone marrow transplantation are
less well characterised. HSCT recipients often receive continuous intrave-nous (iv) tacrolimus therapy initially, followed by oral therapy and are at risk of developing chemotherapy-related complications including mucositis, re-nal dysfunction and veno-occlusive disease as well as GVHD of the gastro-intestinal tract and/or liver. These factors may alter the bioavailability and/or clearance of tacrolimus in this population (34). Only four published studies have investigated the pharmacokinetics of tacrolimus in HSCT patients to date. Two of these studies were in adults (34, 35) and two were in children (36, 37).
The two paediatric studies only present clearance values computed using
assumed steady state concentrations after iv infusion. They did not consider interindividual differences in the time it takes to reach steady-state drug con-centrations following a change in dose. Data in these studies did not contrib-ute information regarding distribution or bioavailability. Consequently, it is at present difficult to make individualised dosing decisions with regards to tacrolimus therapy in paediatric HSCT recipients due to lack of information on the full pharmacokinetic profile of this agent in this population and on factors that cause pharmacokinetic variability. Tacrolimus is not licensed in HSCT and use is still off-label. Dosing protocols used in children have been adapted from protocols used in adults (38), with guidelines for optimal use in children still evolving
Myelosuppression in anticancer treatment Myelosuppression as side effect
Myelosuppression means suppression of bone marrow. Cytotoxic chemo-therapy used in anticancer treatment often suppresses the haematopoietic system, which leads to fewer stem cells in the bone marrow developing to circulating neutrophils in the blood. Neutropenia is a state with low levels of circulating neutrophils, which like many other anticancer treatment side ef-fects can be divided into four grades of severity (39), with grade 4 as the most severe. Neutropenia often constitutes the dose-limiting side effect for anti-cancer agents (40, 41), since the degree and duration determines the risk of infection (42). On the other hand, there is strong belief that a high dose intensity correlates with the chance of successfully eradicating the cancer

21
(43-47). The relation between haematological toxicity and patient survival has been investigated in clinical studies of breast cancer and non-small cell lung cancer, suggesting that a grade 2-3 neutropenia provides an increased patient survival compared to milder or more severe toxicity (48-52). In this thesis a number of different anticancer agents have been studied. They all possess myelosuppressive properties, and represent many different drug classes used for treatment of solid tumours.
Myelosuppression models Many attempts have been made over the years to model myelosuppres-
sion in anticancer therapy. A typical time-profile of myelosuppression usu-ally consists of a lag-time in drop of circulating cell counts after the drug administration. The pre-treatment cell count is often called baseline level. After reaching a minimum, also called nadir, the cell counts increase again, which sometimes lead to an overshoot of the pre-treatment baseline value before returning to normal.
Models presented in the literature have ranged from being of quite em-
pirical nature up to physiologically based models trying to encompass bio-logical mechanisms involved. Among the empirical models some have only focused on describing the relation of drug to some specific measure such as the experienced lowest cell count during the treatment, the nadir, a neutro-penic event or febrile neutropenia (53-58), whereas others have aimed to describe the whole time-course (59, 60). Several mechanism-based models have also been proposed, acknowledging the physiological properties of the haematological system (61-64). One mechanism-based model, here called the semi-physiological myelosuppression model, was presented by Friberg et al in 2002 (65). The term semi-physiological tells that the model incorpo-rates knowledge of physiological events and properties, while introducing some simplifications where suitable. The semi-physiological model has been shown to be of good aid in clinical drug development and study (66-81), but has not yet been applied in day-to-day patient care.
The model is composed of three transit compartments linking the matura-
tion and proliferation from the stem cell pool in bone marrow to circulating neutrophils and a feedback function representing the granulocyte colony stimulating factor (G-CSF) mediated bone-marrow regulation. Drug effect can often be sufficiently described by a linear function relating the plasma concentration to inhibition of cell proliferation and cell kill in the prolifera-tion pool. The model is semi-mechanistic in the sense that it does not fully represent all the maturation and proliferation steps, but still captures the main physiological processes. It is parameterised in terms of a mean transit time (MTT) and neutrophil baseline level (BASE). The third system parame-ter (γ) characterises the magnitude of the feedback function in which the

22
current level of neutrophils is related to the estimated baseline neutrophil count (Fig 4). The drug-specific toxicity parameter is denoted SLOPE. Drug effect can be incorporated in different manners, such as linear, Emax or sig-moidal Emax functions. This transit compartment model is nonlinear by na-ture and has no simple analytical solution, but can be easily described with differential equation systems, see eq.1-6. ktr is the transition rate between compartments determined as 4/MTT, and kcirc is the elimination rate of circu-lating neutrophils determined by their half life as kcirc=ln2/t½.
ktrktr ktr
ktrk circ
E = f (Θ ,C )drugdrug
proliferating progenitor cell pool
differentiated neutrophils
transitcompartment
transitcompartment
transitcompartment
BASENEUt
( )γ
feedback
k = ktrprol
bone marrow systemic circulation
Figure 4. The semi-physiological myelosuppression model
{ } )1(*)5(
*1*)1(*)1( AkA
BASEEAkdt
dAtrdrugtr −
���
�
���
���
���
−=
γ
(eq.1)
),( SlopeConcfE DrugDrug = (eq.2)
)2(*)1(*)2( AkAkdt
dAtrtr −= (eq.3)
)3(*)2(*)3( AkAkdt
dAtrtr −= (eq.4)
)4(*)3(*)4( AkAkdt
dAtrtr −= (eq.5)
)5(*)4(*)5( AkAkdt
dAcirctr −= (eq.6)

23
Many attempts to define a priori dosage adjustments of anticancer agents have been made, and predominantly such dosing algorithms base dosage on renal function (82-86) or hepatic function (87-89). A more refined way to dose adjust has been the application of a maximum a posteriori (MAP) Bayesian guided dosing, utilizing knowledge of the population distribution of the pharmacokinetic (PK) parameters for the drug (90-92). By using drug concentration measurements from a patient and a population PK model, the most likely parameters for the individual at hand can be obtained by optimi-zation of a Bayesian function. These parameters can then be used to calcu-late the dose intended to result in a target drug exposure best correlated to the desired effect in the population. MAP Bayesian guided dosing has been developed for several anticancer drugs, for a wider overview of the area, see Rousseau et al (93).
IIV in the pharmacodynamics is generally thought to be larger than the
IIV in pharmacokinetics (94). This has also been shown in chemotherapy-induced myelosuppression (73, 74). This would theoretically mean that measurement of cell count would be more predictive to the dose-outcome relation than a drug concentration. With a model involving both observed plasma drug concentration and neutrophil counts from the first cycle, not only the pharmacokinetic parameters of the patient can be assessed, but also the pharmacodynamic parameters of the dose-limiting toxicity, and thus drug therapy can be optimized on an even more individualized level. A predictive pharmacokinetic-pharmacodynamic (PKPD) model of myelosuppression may use the individual pharmacokinetic parameters, the individual pharma-codynamic system parameters as well as an estimate of the individual’s drug sensitivity. Some attempts have been made at incorporating both cell counts and drug concentrations simultaneously for a posteriori dose adaptation based on empirical models (95-97).

24
Aim of the thesis
The aim of this thesis was to investigate the application of population pharmacokinetic/pharmacodynamic models in dose individualisation, with application to two different therapeutic areas; the immunosuppressant agent tacrolimus in paediatric transplantation and myelosuppressive drugs in anti-cancer treatment. This was performed by investigating the possibility to im-plement a priori and a posteriori dose adaptation, both by application of previously published models, as well as by developing new models for this purpose.
In particular the aims were:
• To revise the initial dosing schedule and adaptation techniques in paedi-
atric transplantation, to increase the number of patients within the target concentration range.
• To characterise interoccasion variability magnitude and covariate influ-
ence on the system parameters in a semi-mechanistic model of myelo-suppression.
• To perform simulations to study the influence of amount and type of
information, as well as the influence of interindividual and interoccasion variability magnitude in PK and myelosuppression, in relation to the per-formance of dose adaptation.
• To implement proposed population PK and PK/PD models for dose ad-
aptation with Bayesian procedures in MS Excel.

25
Methods used
Description of data Data used for the work in this thesis are of two different basic origins.
The data concerning myelosuppressive anticancer drugs were all collected during prospective clinical trials. Data from tacrolimus in transplantation were collected retrospectively from TDM in routine patient care.
Tacrolimus in paediatric transplantation Data were obtained from two different patient groups; paediatric HSCT
recipients and paediatric liver transplant recipients.
Tacrolimus in HSCT All patients aged from birth to 18 years who underwent allogeneic HSCT
between 1997 and 2007 at Queen Silvia Children’s Hospital in Gothenburg, Sweden, and received tacrolimus as initial prophylaxis against GVHD were eligible for inclusion in this study. Pharmacokinetic, demographic and other clinical data were collected retrospectively from patient electronic medical records. Patients were followed for as long as medical records were avail-able, within the first year following stem cell transplantation.
Patients received tacrolimus as a continuous iv infusion (0.03 mg/kg/day),
starting two days prior to stem cell transplantation. Patients were converted to twice daily oral tacrolimus therapy two to three weeks after transplanta-tion. Tacrolimus dosage was adjusted to maintain whole blood concentra-tions at target (12 ng/mL), and on the basis of clinical evidence of efficacy and toxicity. Tacrolimus treatment was discontinued in patients not experi-encing GVHD at four months following stem cell transplantation by step-wise dose reduction over approximately six weeks.
During administration of the iv infusion tacrolimus blood concentrations
were measured three to four times weekly for TDM aiming to reach and maintain a steady-state concentration of 12 ng/mL. During oral therapy tac-rolimus blood concentrations were measured one to two times weekly (be-coming less frequent as time post-transplant increased) to maintain trough concentrations between 12 and 15 ng/mL.

26
Tacrolimus in liver transplantation The possibility to predict future tacrolimus concentrations with Bayesian
forecasting employing two previously published models (24, 25) were evaluated in children receiving whole or cut-down liver. Data were collected retrospectively from 20 paediatric organ recipients at the Karolinska Univer-sity Hospital in Stockholm, Sweden.
Tacrolimus dosage history, trough concentration measurements and pa-
tient covariate values were recorded in the first, third and twelfth months after transplant. Tacrolimus trough concentrations had been measured daily (before the morning dose) in the first month post-transplant, twice weekly in the third month and weekly in the twelfth month post-transplant. Trough concentrations of 10-20 ng/ml, 5-15 ng/ml and 2-10 ng/mL were targeted over these three periods respectively.
Additional data were collected for the development of a new population
PK model. Data were collected from another 18 paediatric liver transplant recipients at the Karolinska University Hospital to encompass the first year of therapy post transplantation. Data from 35 Australian paediatric liver trans-plant recipients were also made available. Data from all 73 patients were pooled to one dataset and used to develop a population pharmacokinetic model of tacrolimus that focused on the early post-transplantation period.
Myelosuppression Drug dosing history and neutrophil counts were available following therapy
with docetaxel, paclitaxel, epirubicin-docetaxel, 5-fluorouracil-epirubicin-cyclophosphamide, topotecan and etoposide. In some cases drug concentra-tions were also available. Data from treatment cycles where patients were known to have received G-CSF therapy were excluded from the analysis.
Docetaxel In the analysis of covariate influence of system parameters, docetaxel
plasma concentrations and neutrophil counts were collected from 637 carci-noma, melanoma and sarcoma patients (98). Docetaxel was applied as single agent therapy at a dosage of 75 mg/m2 or 100 mg/m2 (one hour iv infusion every three weeks). Due to very few patients receiving two or three infusions only data of the first cycle were considered.
A second dataset was used for the analysis of IOV. Neutrophil counts
from 244 metastatic breast cancer patients treated with docetaxel were in-cluded in the analysis (99). Initial dose level was 100 mg/m2 of docetaxel administered as a one hour intravenous infusion in a three week cycle. Dose

27
reductions were based on haematological and non-haematological toxicity and resulted in a final dose range of 50-100 mg/m2.
Epirubicin-docetaxel The epirubicin-docetaxel (ET) dataset included 41 advanced breast cancer
patients (75). Epirubicin was given in a three week cycle as a one hour infu-sion followed by a one hour drug free interval and then a one hour infusion of docetaxel. Initial doses were 75/70 mg/m2 respectively with esca-lated/reduced doses in the following cycles based on leukocyte and platelet counts according to the study protocol.
Etoposide Data from 44 patients with solid tumours and haematological malignan-
cies who received two treatment courses of a three day continuous infusion of etoposide in a 28 day cycle were analyzed (96, 97). Patients were random-ised to either standard dosing with a total dose of 375 mg/m2 or concentra-tion guided dosing where the total delivered dose ranged from 225-789 mg/m2 following dose adjustments
5-Fluorouracil - epirubicin - cyclophosphamide Sixty breast cancer patients treated with either standard or tailored 5-
fluorouracil-epirubicin-cyclophosphamide (FEC) regimen were included in the analysis (74). The treatment was administered every third week as a 15 min infusion of cyclophosphamide followed by 5-fluorouracil given as an intravenous bolus dose and epirubicin given either as a bolus or as a one hour infusion. Initial doses of 5-fluorouracil, epirubicin and cyclophos-phamide were in the first treatment cycle for standard FEC 600/60/600 mg/m2, respectively, and for the tailored therapy 600/75/900 mg/m2, respec-tively. Subsequent doses were reduced based on toxicity in the standard therapy and in the tailored therapy doses were stepwise escalated or de-creased based on the observed nadir and the dosing day leukocyte/platelet count according to a dose escalation/reduction protocol.
Paclitaxel The paclitaxel data included neutrophil counts from 45 patients with dif-
ferent cancer forms (100). Paclitaxel was administered as a three hour infu-sion with an initial dose of 175 mg/m2 every third week. Doses were ad-justed based on haematological and non-haematological toxicity resulting in a final dose range of 110-232 mg/m2.
Topotecan In the covariate analysis, topotecan lactone concentrations and neutrophil
counts were available from 191 patients with various solid tumour types, mainly gynaecological and colorectal. 126 patients received topotecan as

28
monotherapy and 65 patients in combination with cisplatin. 71 patients were given topotecan as daily 30-minute infusions for 5-13 days at a dose range from 0.2 to 2.4 mg/m2/day and the remaining 120 patients were given the drug orally at a dose range from 0.15 to 2.7 mg/m2/day for 5-21 days (73). Topotecan data from the first treatment cycle were available for the analysis.
A second dataset was used to estimate the IOV of topotecan. Total topo-
tecan plasma concentrations and neutrophil counts from 26 patients with various types of solid tumours treated with topotecan as single anticancer drug therapy were included in the analysis (101). Initial dose level was 6 mg/m2 administered as a 24-hour intravenous infusion every third week.
Modelling and simulation Population analysis Software used
Bayesian forecasting investigated in tacrolimus therapy in paediatric liver transplantation was carried out using AbbottBase (102). AbbottBase is a DOS-based software designed to enable dose individualisation based on drug dosing history and prior measurements. It is capable of handling multicom-partmental pharmacokinetic models, and applying some different covariate structures and residual error models. It was marketed with models set up for some commonly PK monitored drugs, but additional prior models can be introduced. Different methods are available for estimation of the individual patient’s parameters, including linear least squares regression, non-linear least squares regression as well as Bayesian techniques. The Bayesian func-tionality in AbbottBase is applied similar to as suggested by Sheiner et al in 1977 (103). The software uses a search algorithm to minimise the value of a Maximum A Posteriori Bayesian objective function (MAP) for a number of concentration-time measurements (n= i) and parameters (n= j) (eq.7).
( )[ ] ( )[ ]2
1
2
1/ˆ/ˆ �� ==
−+−= m
i iiip
j jjjMAP CCPPOBJ σω (eq.7) The difference between an observed concentration iC and the model pre-
dicted concentration iC is minimised by adjusting a predicted individual parameter jP , which is balanced by the typical population estimate, jP , and IIV jω . The final jP s will constitute the EBEs. The weight the process as-signs to a concentration measurement is influenced by the residual error variability iσ . In short, the software searches for individual parameter esti-mates to explain observations. The fit to data is thus counter-balanced by population model predictions as to how likely a certain individual parameter estimate would be (103-105).

29
Non-linear mixed effect model development was carried out using the NONMEM software (106) versions VI �, VI 1.0 and VI 2.0. Post-processing of NONMEM-runs was done with Xpose, a graphical package based on the R-language (107). Xpose was used for evaluation of goodness-of-fit of mod-els, and for graphical exploration of data to guide the model building proc-ess. Additional graphical presentation of data and results were carried out in S-Plus (108), as were some statistical tests such as Kolmogorov-Smirnov tests for normality.
Bayesian forecasting of tacrolimus concentrations Two different previously published models to be evaluated for their pre-
dictive performance were set up in the AbbotBase program. Sixteen recipi-ents from Singapore (24) and 35 recipients from Australia (25) were used to develop population pharmacokinetic models of tacrolimus in paediatric liver transplantation, here called the Sam and Staatz models respectively. Both models are one-compartmental with first order absorption and elimination. Under the Sam model, typical population CL/F was estimated to be 7.4 L/h and typical population V/F was estimated to be 198 L. Parameter IIV esti-mates were CV%CL=34%, CV%V=33% and CV%F=24%. Under the Staatz model, typical population CL/F was estimated to be 5.75 L/h in cut-down liver recipients and 44 L/h in whole liver recipients and typical population V/F was estimated to be 617 L. Parameter IIV estimates were 144% (CV%CL/F cut-down) or 297% (CV%CL/F whole liver) and 42%. (CV%V/F)
EBEs of individual pharmacokinetic parameters were estimated with the
two different models for each of the 20 patient included. EBEs were calcu-lated based on dosing history, covariate values and observed concentrations. Only CL/F and V/F were estimated in the program, while absorption rate constant (ka) was fixed to 4.48 h-1 (12). The assay coefficient of variation was set to 7.5%. Measured tacrolimus blood concentrations were integrated chronologically. The first concentration could be used in the prediction of the second, and the first and second concentrations could be used in the pre-diction of the third etc.
Bias and precision of the two models were calculated in terms of mean
prediction error (MPE) and root mean squared error (RMSE)(109), as well as 95% confidence intervals. MPE provides a measure of bias and RMSE provides a measure of imprecision. Over four different time periods (day 1-14, day 15-30, third month, > 1 year) the use of one, three, five or ten previ-ous samples for prediction of the subsequent sample were compared.

30
Analysis of tacrolimus PK in paediatric transplantation NONMEM estimation of parameters was carried out using the first order
conditional estimates with interaction (FOCE Inter). For the IIV a log-normal distribution of the parameters was assumed, and random effect para-meters were assumed to be symmetrically distributed with zero mean and variance ω2 or σ2, respectively.
One- and two-compartment pharmacokinetic models were compared and
both untransformed and log-transformed tacrolimus concentrations were evaluated. Models that allowed for changes in structural parameters with time following transplantation were also tested.
Allometric scaling (3, 4) was applied on the base model, i.e. CL =
�1•weight3/4 and V= �2•weight where � is the typical value of the parameter in a child weighing 1 kg. Total body weight (BWT), lean body weight (LBW) (James formula) (110) and non-lean body weight (i.e. BWT-LBW), were evaluated as size measures. Additional covariates evaluated for influ-ence on the pharmacokinetic parameters were somewhat different in the two different therapeutic areas, but both datasets included age, sex, number of days since transplantation, plasma proteins, kidney function indicators and liver function tests. Covariates were screened using scatter plots of individ-ual parameter estimates against clinical characteristics and by generalised additive modelling (GAM) using Xpose. Additional selection was made based upon possible mechanisms of effect, and clinical judgment. Poten-tially useful covariates were tested in linear, piece-wise linear and exponen-tial relationships with the pharmacokinetic parameters in NONMEM using a step-wise covariate model building procedure (SCM).
Nested models were compared statistically using a likelihood ratio test on the differences in objective function value (OFV). SCM search was carried out with a forward inclusion criteria of p<0.01 and a backward elimination criteria of p<0.001. During each step in the model building process, im-provements to the model were also assessed by evaluation of agreement between observed and predicted tacrolimus blood concentration, increases in precision of parameter estimates and reduction in IIV and residual error.
Analysis of myelosuppression data In all modelling of myelosuppression data, the earlier described semi-
physiological model (65) was used. NONMEM estimation of parameters was carried out using FOCE Inter, and in one case the generalised least squares (GLS) method was applied to reduce runtime. For the IIV a log-normal distribution of the parameters was assumed, as well as for inter-occasional variability where applicable (111). All random effects (η,� and ε)

31
were assumed to be symmetrically distributed with zero mean and variance ω2, �2 or σ2, respectively.
The model structure was the same as in the original publication except the
absolute neutrophil count (ANC) data were Box-Cox transformed in all ex-amples but the covariate analysis in Paper IV. Data was transformed (eq. 8) with �=0.2 prior to the analysis as this transformation resulted in random residuals with a symmetrical distribution around zero (60, 61). With the ex-ception of the covariate analysis, additional modification to the model was fixing the half-life of circulating neutrophils was to the literature value of 7 hours (112)
λ
λ 1−= ANCANC dtransforme (eq. 8)
Covariate analysis Covariates (COV) influential on the system parameters of the myelosup-
pression were investigated as described in Paper IV, using data from do-cetaxel, paclitaxel, etoposide and topotecan. Patient-specific characteristics were analyzed for influence on the estimated PD parameters of the basic model, the system-related (BASE, MTT and �) as well as the drug-specific efficacy parameters (SLOPE). Categorical dichotomous relations were ex-pressed as %-change of the typical parameter from one category to the other:
( )COV1 COVPPCOV,P ⋅θ+⋅θ=θ − (eq. 9) where θP is the typical population estimate. θP-COV, is the quantitative dif-
ference from one covariate category to the other, resulting in a covariate-adjusted typical parameter estimate of θP, COV. As an example, COV was coded as 0 for males and as 1 for females. Thus, θP represents the typical population parameter estimate the for males and θP, COV for females being θP-COV % higher or lower than P� .Continuous covariates relations were mod-elled as %-change from typical parameter value per unit deviation from me-dian COV:
( )( )COVCOVPPCOV,P medianCOV1 −⋅θ+⋅θ=θ − (eq. 10) with medianCOV being the median value of the covariate in the data set. Covariates were investigated in an automated procedure in NONMEM
with the SCM (113), with a significance level of p<0.001. Confidence inter-vals (CI:s) were calculated from the standard errors (SEs) estimated by

32
NONMEM or by log-likelihood profiling (114). Once the final model was established, all available covariates were once again evaluated on the system parameters for estimates to be included in the meta-analysis.
For the covariate effects on system-related parameters, meta-analysis of
joint weighted means and SEs for the estimates from all four drug analyses were calculated using the inverse variance method (115, 116):
�� −= 22
1
ii
COVP
SESEmeanWeighted i
θ (eq. 11)
�
�
���
�= � 2
11iSE
meanthisforSEWeighted (eq. 12) where SEi is the standard error for the covariate effect θP-COVi of each drug. Joint estimates were calculated for those relations available in at least two drug analyses. Results were recalculated to show the %-difference from the typical value of the parameter with the alternative dichotomous COV charac-teristic or with the alteration in COV units (continuous covariate).
Analysis of IOV Significance and magnitude of IOV in addition to IIV in system- and
drug-related parameters of the myelosuppression was investigated in do-cetaxel, etoposide, ET, FEC, paclitaxel and topotecan. IIV was included for the model parameters BASE, MTT and Slope for all datasets. IOV was evaluated for statistical significance (p < 0.001) using OFV in the likelihood ratio test for BASE, MTT and Slope. One occasion was defined as one treatment course with the nominal cycle length of 21 or 28 (etoposide) days. Time-dependent changes in the model fit were also evaluated by graphical assessment of the conditional weighted residuals (CWRES) (117).
The total magnitude of IOV in the myelosuppression model parameters in
relation to the total IIV was explored by simulations. The final parameter estimates for each of the six analyzed data sets were used simulating 1000 time-courses of myelosuppression for all the treatment regimes including only IIV, only IOV, or both IOV and IIV in NONMEM. The impact of IOV and IIV was visualized graphically.
Simulation studies In the development of new dosing schedules for tacrolimus, as well as in-
vestigating the possible benefit of a posteriori dose adaptation with the mye-losuppression model simulation studies were carried out.

33
Dosing schedules for tacrolimus The final tacrolimus PK models were used for calculation of new dosing
regimens. These doses were based on the distribution and elimination prop-erties, and in HSCT also the bioavailability, of tacrolimus in the population. By simulating a large number of individuals, the typical profile as well as the 95% prediction interval coming of these dose schedules, could be compared to the predictions for the current protocol regimens.
Outcome of dose adaptation with myelosuppression model From a model representing etoposide PK (118) in combination with the
myelosuppression model, 1000 patients receiving 5 courses of etoposide therapy was simulated. IIV- and IOV-levels used were median values in Sandström et al (75) for the PK model and Paper V for the PD model. Dose schedule was selected according to the current Vepeside® summary of prod-uct characteristics (SmPC) (119), i.e. 1-hour infusions for five consecutive days in a 21 day course cycle. A target nadir value of 1·109/l was selected based on it being the limit of grade 2 and 3 neutropenia (48-52). The dose level of 80 mg per day was chosen as it was predicted to result in a median nadir value at the target in a typical individual, i.e. non-adaptive designs would result in a median nadir of 1·109/l. Simulated data had observed drug concentrations at 1 and 24 h after start of each infusion and neutrophil counts at baseline and at 7, 13 and 17 days after each.
A method for targeting a second derivative of a differential equation sys-
tem in NONMEM was developed, using the COMRES functionality (106) and creation of dummy compartments. Calculations were done using multi-ple sub-problems for simulation, re-estimation, dose selection and evaluation of outcome by adapted dose with true parameters.
Outcome was evaluated in terms of dosing precision, target precision as
well as fraction of patients in the target therapeutic range. Performance of dose adaptation was evaluated using various degrees of PK- and/or PD-information. These methods were compared to a 25% dose reduction in case of grade 4 neutropenia (119), called the standard method, and to when a case where no dose adaptation was made. The outcome was also evaluated using information from an increasing number of courses, leading to multiple dose adaptations. Additionally, since the estimates of IIV and IOV presented in Sandström et al (75) and Paper V exhibit variability between drugs, outcome was evaluated at 50% and 200% of nominal values (CV) for all included variability terms.

34
Dosing tool The PK model for tacrolimus in paediatric HSCT as well as a PK/PD
model for etoposide were implemented in MS Excel. The tacrolimus model was used to construct a tool for both a priori and a posteriori dose adapta-tion, and the etoposide model was used for a tool that uses a biomarker for feedback control. The tacrolimus model could be solved numerically, whereas the myelosuppression model would require a differential equation solver, a feature not included in MS Excel. By the application of an add-on, PopTools (CSIRO)(120), a solution could be approximated.
A priori dose adaptation in Excel The final PK model for tacrolimus in paediatric HSCT contained signifi-
cant covariates that helped explain IIV. Such covariates could be of use for a priori dose adaptation, but such model could benefit from a computer based tool. The model was thus implemented in MS Excel, and the tool should allow the input of individual covariate values and application of the PK model to maximise the likelihood of achieving the user specified target con-centration.
Bayesian application in Excel Both the tacrolimus and etoposide dosing tools included a Bayesian feed-
back function. After input of PK or PD measurements in combination with dosing history, the tool should estimate the individual parameters for the model at hand. By using a macro to minimise a Bayesian function (eq.7) utilising the Solver functionality of MS Excel, the EBEs of the model can be obtained. A second macro then calculates the optimal dose based on the EBEs, and present the results numerically and graphically.
Computational performance of the tool for myelosuppression guided dos-
ing was compared to NONMEM (106). NONMEM was used to simulate 75 patients receiving two courses of etoposide in SmPC-stated standard dosing (119) using previously published parameters for PK (118) and PD (65). Data from first course was then made available to NONMEM or the dosing tool to calculate EBEs of parameters, and make predictions of measurements in the second course. Accuracy and precision were computed for EBEs and predic-tions by calculating MPE and RMSE (109).

35
Results
Models for tacrolimus PK in paediatric transplantation Patients and data collection Paediatric HSCT
Data were collected from 22 children who had undergone HSCT, with a wide variety of diagnoses. Covariate information was available for all pa-tients. The final data set used for population modelling consisted of 743 tac-rolimus concentration-time measurements; 229 samples were taken during continuous iv infusion and 514 samples during oral therapy.
Paediatric liver transplantation 605 tacrolimus concentration time-points were collected from 20 paedia-
tric liver transplant recipients for evaluation of Bayesian forecasting. 3284 tacrolimus concentration time-points were collected from 73 paediatric liver transplant recipients for building of a new population model.
Bayesian forecasting with previously developed models Predictive performance of Bayesian forecasting in terms of MPE and
RMSE under the Sam (21) and Staatz (25) models with differing amount of prior information and over different study periods is summarised in Table 1. The Staatz model showed somewhat better overall predictive performance than the Sam model. Predictive performance improved with time post-transplant. Using only one previous sample showed the best predictive per-formance during the first and third months post-transplant, use of three sam-ples was somewhat better in the twelfth month based on both bias and preci-sion. Predictive performance was notably worse when five or ten previous samples were used in the Bayesian feedback process. MPE of the Staatz model went from 51% during the first month post-transplant to 1.2% in the twelfth month if based on three previous samples, and RMSE improved from 107% to 60%.

36
Table 1. Accuracy and precision of Bayesian forecasting expressed in terms of mean prediction error (MPE) and root mean squared error (RMSE) Median conc.
(range) Mod-el
1 sample 3 samples 5 samples 10 samples
MPE RMSE MPE RMSE MPE RMSE MPE RMSE
Day 1-14 13.4 ng/ml Sam 14% 56% 51% 114% 80% 155% 238% 480% (2.2-67.2) Staatz 11% 56% 51% 107% 86% 142% 277% 451% Day 15-30 12 ng/ml Sam 14% 52% 26% 59% 37% 71% 69% 112% (5.1-30.5) Staatz 11% 49% 24% 53% 34% 64% 74% 123% 3rd month 9.9 ng/ml Sam 13% 49% 17% 54% 23% 62% 37% 99%
(3.0-30) Staatz 9% 47% 19% 55% 23% 56% 38% 95%
After 1 year 6 ng/ml Sam 1% 68% 5% 62% 5% 58% 3% 55%
(2.0-13.5) Staatz 0.1% 71% 1% 60% 1% 53% 0.5% 52%
Population modelling A one-compartment pharmacokinetic model with first-order absorption
following oral drug administration adequately described the data. The use of log-transformed tacrolimus concentrations in the modeling resulted in resi-duals more evenly distributed around zero and were hence used. A propor-tional residual error model (additive on the logarithmic scale) was selected for the HSCT data, and a combined additive + proportional for the liver data. IIV in residual error magnitude was also included. Allometric scaling was applied for CL and F. The absorption rate constant associated with oral ther-apy (ka) was fixed to a literature value of 4.48 h-1 (12).
Paediatric HSCT When only iv data were used in the modelling, CL was estimated to be
162 mL/h/kg and V to be 3.67 L/kg. When enteric data was added there were difficulties in simultaneously estimating V and F with accurate precision, likely because mainly trough concentrations were available in the enteric data. Prior information on tacrolimus V was thus used (5). The prior (typi-cal population value and uncertainty) of V (1.67 L/kg; Relative Standard Error, RSE=61%) was obtained from a previous non-compartmental analysis in 12 adult HSCT recipients (35). Tacrolimus CL decreased with decreasing S-Crea-1. Tacrolimus F was found to decrease with increasing number of days post-transplantation. Post-transplantation time was not significant as a covariate for CL. The final population model is presented in Table 2.

37
Table 2. Parameter estimates, relative standard errors (RSE) provided by NON-MEM and 95% confidence interval (CI) obtained from bootstrap (1000 samples) for the final model for tacrolimus in HSCT
Typical estimate RSE (95% CI) CL = θ1 x (1 + θ2 x (S-Crea-1– 38-1
median)) (mL/h/kg0.75) θ1 106 (17%) (79-140) θ2 18.7 (18%) (4.9-28) �CL (%) 50 (33%) (34-65) V# (L/kg) = θ3 3.71 (13%) (3.1-4.4) �V (%) 122 (28%) (85-154) F = θ4 x (1 + θ5 x PTD-14) (%) θ4 15.7 (20%) (12-21) θ5 -0.0020 (47%) (-0.0023- -0.0011) �F (%) 61 (24%) (38-86) Proportional error (%) 38.8 (7%) (34-43) �ε (%) 18 (38%) (2-27)
θ = typical parameter value, � = interindividual variability (CV), S-Crea= serum creatinine; PTD = post-transplantation day; #estimated using a prior
Paediatric liver transplantation A change in CL/F with time post-transplant was evident and was best de-
scribed by a sigmoidal CLmax/F model with the addition of a CL0/F parame-ter. Alternate inclusions of time as descriptor of CL such as the turn-over model or the piecewise linear model was also investigated. Covariate analy-sis suggested a negative relationship between patient age and CLmax/F, and a positive relationship between bilirubin level and time to 50% of maximum increase of CL/F (TCL50/F), whereas these covariate relations made only a minor impact (less than 1%) on IIV and residual error. Bootstrap analysis showed that confidence intervals associated with addition of these covariates into the model included zero. The final population model thus included pa-tient weight and time post-transplantation as covariates (Table 3).

38
time post-transplantation
Clearance
CLmax
tCL50
CL0
CL =CL +50CL + CLmax 0
0 2CL 50
0CL=CL + CL · tmaxγ
t + tCL50γ γ
Figure 5. The sigmoidal CLmax model.
Table 3. Final model population pharmacokinetic parameter estimates, relative standard errors (RSE) and 95% confidence interval (CI) obtained from non-parametric bootstrapping (500 samples)
Typical estimate RSE (95% CI) Final model
CLmax(mL/h/kg0.75) 1.37 (10%) (1.07-1.69) �CLmax (%) 65 (19%) (52-84) CL0(mL/h/kg0.75) 0.148 (24%) (0.009-0.186) TCL50 (days) 5.38 (8%) (4.5-6.7) �TCL50 (%) 54 (30%) (40-67) Gamma 3.78 (6%) (2.6-5.1) V (L/kg) 27.2 (32%) (20.8-41.1) �V (%) 90 (22%) (75-107) Additive error (ng/ml) 1.63 (5%) (1.4-2.0) Proportional error (%) 29.2 (8%) (23.8-32.7) �ε (%) 29 (24%) (21-40)
� = inter individual variability
Dose revision Paediatric HSCT Initial i.v. dose
Current treatment protocols at the Queen Silvia Children’s Hospital rec-ommend initial iv tacrolimus therapy of 0.03 mg/kg/day as a constant infu-sion, starting 36-48 hours prior to stem cell transplantation. Clinicians aim to achieve a tacrolimus concentration of 12 ng/mL at the time of transplanta-tion. Dose adjustment is made based on a tacrolimus concentration meas-urement taken 2-12 hours prior to transplantation. The concentration-time profile of tacrolimus over the first 8 days of continuous iv therapy was simu-

39
lated for 500 individuals weighing 20 kg based on the typical population CL and V estimates in this study. Figure 8 shows the risk for overshooting the target concentration of 12 ng/ml in a majority of patients with the standard dose 0.03 mg/kg/day (left panel), whereas 0.035 mg/kg0.75/day would lead to median concentrations at target, and the addition of a loading dose of 0.07 mg/kg/day (right panel) would mean a higher fraction of patients on target at the time of transplantation. Figure 9 shows median concentration of patients with different weights, highlighting the results of linear /kg dosing over a wide size range like the paediatric population.
0.035mg/kg
0 2 4 6 0 2 4 6 0 2 4 6
Time (days)
0
5
10
15
20
25
Con
c.(n
g/m
l)
0.035 mg/kg0.750.03 mg/kg0.07 mg/kg loading dose
0.75 maint. dose
Figure 6. Prediction interval from 500 simulations of tacrolimus blood concentra-tions in a 20 kg individual with standard dosage (left), proposed dosage that results in a steady-state concentration of 12 ng/mL (middle) and proposed maintenance dosage combined with a loading dose (right). Solid lines represent the median pre-dicted values, and the dashed lines represent the 5th and 95th percentiles.
0 2 4 6 0 2 4 6 0 2 4 6Time (days)
0
5
10
15
20
25
10 kg20 kg50 kg
0.035mg/kg0.035 mg/kg0.750.03 mg/kg0.07 mg/kg loading dose
0.75 maint. dose
Con
c.(n
g/m
l)
Figure 7. Predicted tacrolimus concentrations in a 10 kg, 20 kg and 50 kg typical individual, with standard dosage (left), proposed dosage that results in a steady-state concentration of 12 ng/mL (middle) and proposed maintenance dosage combined with a loading dose (right).

40
Oral conversion At the Queen Silvia Children’s Hospital conversion from iv to oral tac-
rolimus therapy occurs approximately two weeks post-transplantation, by administering an oral daily dose four times higher than the current iv daily dose. Our estimate of F suggests that a six times higher dose should be used to maintain the same average steady-state concentration. The concentration-time profile of tacrolimus for the first 8 days of oral therapy was simulated for 500 individuals weighing 20 kg based on a four-fold (Figure 10, left panel) and six-fold (Figure 10, right panel) dosage increase using the typical population CL and V estimates in this study.
0 2 4 6 0 2 4 6Time (days)
0
5
10
15
20
25
4 final i.v. dose 6 final i.v. dose
Con
c.(n
g/m
l)
x x
Figure 8. Simulated median (thick line) and 90% prediction intervals (dashed lines) of tacrolimus blood concentrations for a 20 kg individual with an oral conversion factor of four (left) and six (right) times the iv dose that result in the target concen-tration of 12 ng/ml. Individual CL and V are assumed to be known from iv therapy and variability arises from variability in F and residual error.
Paediatric liver transplantation Our findings suggested that the current initial dosage schedule of tacroli-
mus in paediatric liver transplant recipients at the Karolinska University Hospital should be revised based on a lower initial CL/F immediately post-transplant. Current hospital guidelines of 0.05-0.1 mg/kg twice daily were compared to a model based dosing strategy. In order to achieve a correct initial concentration a loading dose should be calculated as a function of V/F, followed by a maintenance dose based on CL/F and dosing interval. Dose will thus be dependent on weight and time. Based on our final model a dosing schedule was calculated as presented in Table 4. Loading dose was divided onto the first four occasions in order to avoid extremely high con-centrations in patients with a low V, or to limit consequences by errors in administration. Simulations were made for a typical individual of 15.4 kg based on a) a standard dose of 0.2 mg/kg/day b) the new proposed schedule without a loading dose, c) the new proposed schedule including a loading

41
dose and d) the new proposed schedule with the loading dose divided on the first four occasions. The predicted median concentrations and 95% predic-tion intervals are depicted in Figure 6. Figure 7 show the median concentra-tions from standard dosing versus model based dosing over a range of weights.
Table 4. Dose suggestion for the initial therapy based on final model population pharmacokinetic parameters Day Dose
Day of transplantation 0.135 mg/kg twice daily Day 1 post-transplantation 0.135 mg/kg twice daily Day 2 post-transplantation 0.07 mg/kg0.75 twice daily Day 3 post-transplantation 0.09 mg/kg0.75 twice daily Day 4 post-transplantation 0.14 mg/kg0.75 twice daily Day 5 post-transplantation 0.19 mg/kg0.75 twice daily Day 6 post-transplantation 0.24 mg/kg0.75 twice daily
1 3 5 7 1 3 5 7
Time (days)
0
20
40
60
80
0
20
40
60
80
Con
cent
ratio
n (n
g/m
l)
a) Standard dose b) Model dose without loading
c) Model dose with fast loading d) Model dose with slow loading
Figure 9. Median and 95 percent prediction interval of a) standard dose 0.3 mg/kg; b) model based dose 0.2 mg/kg; c) model based dose with loading dose and d) mod-el based dose with loading dose divided over four occasions.

42
1 3 5 7
Time (days)
10
30
Con
cent
ratio
n (n
g/m
l)Standard dose Model dose with slow loading
1 3 5 7
10 kg20 kg40 kg
Figure 10. Predicted concentrations in a typical 10, 20 or 40 kg child using the stan-dard dose (0.1 mg/kg twice daily if >20 kg, else 0.15 mg/kg twice daily) or the suggested model based dose.
Variability parameters in the myelosuppression model System related covariates
The estimates of the final models are summarized in Table 5. System-related showed consistency across drugs, with differences of 19% for BASE, 40% for MTT and 52% for γ. In contrast, the drug-specific parameter SLOPE was highly variable, ranging from 0.162 to 68.1 L/μmol.
Table 5 further shows the significant covariate relations. The precision of
all parameter estimates in the final model was high with narrow 95%-CIs never including zero. Inclusion of covariates reduced the IIV by 10 up to 36% for the parameters concerned. To assess the clinical implication of the statistically significant covariate relations neutrophil concentration-time profiles were generated (Fig 11). These predictions were based on each final model and all observed covariate sets. Uniform SmPC stated doses for the drugs were used, in an individual with size and age representing the median of all data sets.

Tabl
e 5.
Fin
al p
opul
atio
n m
odel
par
amet
er e
stim
ates
(with
95%
CI i
n pa
rent
hese
s) fo
r all
drug
s See
Abb
revi
atio
ns se
ctio
n fo
r cov
aria
te n
ames
.
Doc
etax
el
Pacl
itaxe
l E
topo
side
T
opot
ecan
Para
met
er
Est
imat
e (9
5% C
I)
IIV
[CV
%]
(95%
CI)
E
stim
ate
(95%
CI)
II
V [C
V%
] (9
5% C
I)
Est
imat
e (9
5% C
I)
IIV
[CV
%]
(95%
CI)
E
stim
ate
(95%
CI)
II
V [C
V%
] (9
5% C
I)
BA
SE1 [·1
09 /L]
5.22
(4.9
3 –
5.51
) 25
(22
– 2
8)
6.41
(5.
44 –
7.2
9)
30 (
24 –
40)
5.42
(4.7
6 –
6.08
) 41
(32
– 48
)5.
66(5
.14
– 6.
17)
40 (2
0 –
60)
BA
SE –
AA
G,
if A
AG
< 1
.34
if
AA
G >
1.3
4
0.
175
(0.1
30 -
0.22
0)
0.49
5 (0
.262
– 0
.728
)
BA
SE –
SEX
-0
.121
(-0.
176
– -0
.066
)
-0.2
15 (-
0.31
4 –
-0.1
16)
B
ASE
– P
ERF
0.13
1 (0
.067
– 0
.195
)
BA
SE –
PC
-0
.147
(-0.
202
– -0
.092
)
BA
SE –
RT
-0.3
48 (-
0.47
7 –
-0.1
85)
B
ASE
– B
IL
-0.3
83 (-
0.51
8 –
-0.2
48)
B
ASE
– A
LB
-0.0
289
(-0.
0425
– -0
.015
3)
MTT
[h]
84.2
(82
.7 –
85.
7)
14 (1
3 –
15)
128
(121
– 1
36)
17 (1
3 –
23)
141
(131
– 1
50)
17 (1
3 –
20)
140
(121
– 1
59)
32 (4
3 –
43)
MTT
– B
IL
-0.1
98 (-
0.26
68 –
-0.0
923)
MTT
-HG
T
0.
018
(0.0
115
– 0.
0245
)
γ 0.
145
(0.1
41 –
0.1
49)
15 (1
2 –
17)
0.20
3 (0
.184
– 0
.232
)
0.17
1 (0
.152
– 0
.190
)
0.09
76 (0
.075
5 –
0.12
0)
γ
– A
ST
0.12
8 (0
.086
0 –
0.20
2)
γ
– LD
H
-0.0
0595
(-0.
0070
5– -0
.004
79)
γ
– B
BIL
0.
327
(0.1
09 –
0.5
45)
γ
– D
BIL
0.
712
(0.1
12 –
1.3
1)
SL
OPE
2) [μ
M-1
] 15
.6 (
15.1
– 1
6.2)
36
(33
– 39
) 56
.0 (
48.2
– 6
4.8)
38
(27
– 52
)0.
162
(0.1
43 –
0.1
81)
33 (1
2 –
45)
68.1
(58.
0 –
78.1
) 53
(31
– 74
) SL
OPE
– A
AG
-0
.351
(-0
.363
– -0
.339
)
SLO
PE –
BA
LB
-0.0
462
(-0.
070–
-0.0
23)
SL
OPE
– D
BIL
0.
939
(0.2
95 –
1.5
8)
SL
OPE
– R
OU
T
-0
.580
(-0.
724
– -0
.436
)
SLO
PE –
CO
CD
4.
34 (2
.34
– 6.
34)
R
esid
ual e
rror
Pr
opor
tiona
l, %
42
.4 (
39.6
– 4
5.2)
25.9
(19
.4 –
29.
6)
34
.9 (2
8.4
– 41
.4)
19
.7 (7
.5 –
32)
Add
itive
[·10
9 /L]
0.60
8 (0
.468
– 0
.849
)
0.51
4 (0
.353
– 0
.675
)
0.27
3 (0
.224
– 0
.322
)

44
Paclitaxel
Etoposide
Topotecan
Docetaxel0 10 205 15
0 10 205 15
0 10 205 15
0 10 205 15
Pre
dict
ion
(·10
/L)
910
1.0
0.1
Pre
dict
ion
(·10
/L)
9
10
1.0
0.1
Pre
dict
ion
(·10
/L)
9
10
1.0
0.1
Pre
dict
ion
(·10
/L)
9
10
1.0
0.1
Figure 11. Population predicted time courses of neutrophil concentration based on the final model, observed individual sets of covariates, and population pharmacokinetic after a standard dose of docetaxel (100 mg/m2), paclitaxel (175 mg/m2), a median concentration time profile of etoposide or a standard dose of topotecan (1.5 mg/m2/d iv for 5 days); horizontal lines, neutropenia grades 1to 4 according to WHO (24).
Meta-analysis of all relations across drugs irrespective of their statistical significance on BASE and MTT are depicted in Fig. 12. For dichotomous covariates (e.g. sex) the circle represents the %-change in MTT or BASE of one sex to the other. The error bars indicate the 95%-CI to be regarded as the uncertainty of the overall influence. For continuous covariates both borders

45
of the box represent the %-changes of MTT or BASE of individuals with the extremes of that covariate from the “typical” estimate (individual with me-dian COV). The error bars symbolize the uncertainty around these values as 95%-CIs.
AGE††††
ALB–††*
AST –†– †
-10%-20%-30%-40%-50% 40%30%20%10% 50%
Height–†–†
Weight–†–†
Sex*††*
Performance status*†††Previous chemotherapy*†–†
BIL–†*†
CREA–†–†
ALT–†–†
60%-60%
AGE††††
ALB–†††
BIL–*††
CREA–†–†
AST –†– †
ALT–†– †
Height–†– *
Weight–†– †
Sex††††
Performance status††††
††–†Previous chemotherapy
MTT
BASE
-10%-20%-30%-40%-50% 40%30%20%10% 50% 60%-60%
Figure 12. Overall percentage change with 95% CI in MTT and baseline neutrophil concentration by different covariates. Superscripts correspond to docetaxel, pacli-taxel, etoposide and topotecan relations in this order: *significant relation;†non-significant relation; and -missing in data set.
Covariate relations were considered clinically significant if the change in
parameter estimate was greater than 20%. Performance status, gender and prior chemotherapy would thus not cause a clinical significant effect on BASE, whereas height and bilirubin might be influential on MTT: Overall, it can be concluded that there was a high consistency across the drugs in in-fluencing system-related parameters.

46
Interoccasion variability The myelosuppression model was able to fit both the single-agent and
combination therapy datasets. System-related parameters and IIV estimates were in accordance with previous findings as in Paper IV and (65). IOV in MTT was significant and of similar magnitude (7.5-16 % CV) for all the investigated datasets, except for topotecan where only IOV in Slope was significant. IOV in Slope was also found to be significant for docetaxel and etoposide. Inclusion of IOV in the myelosuppression model parameters de-creased the residual error by 21% (Table 6). No significant time-dependent changes in parameters where seen when IOV was included, indicating that �s were random and not time dependent.
Table 6. Estimated IIV CV % and IOV CV % (relative SE %) Data set IIVBASE IIVMTT IIVSlope IOVBASE IOVMTT IOVSlope �Residua-
lerror % Docetaxel 33 (5.9) 9.0 (19) 37 (7.0) - 16 (4.8) 19 (12) 17 Paclitaxel 36 (13) 17 (22) 39 (20) - 16 (8.5) - 41 Epirubicin + docetaxel
37 (15) 12 (21) 22 (23) - 8.0 (20) - 17
5-FU + epi-rubicin + cyclo-phosphamide
28 (15) 16 (13) 23 (14) - 7.5 (11) - 7.0
Topotecan 32 (27) 15 (34) 62 (45) - - 28 (39) 3.3 Etoposide 47 (15) 23 (24) 28 (42) - 12 (39) 39 (24) 38
To visualize the relative impact of the estimated IIV and IOV variability
twenty simulated time-courses of myelosuppression following chemotherapy treatment including only IIV, only IOV, or both IOV and IIV are shown in Figure 13. In addition to this, the corresponding distribution of nadir values might be of even higher clinical importance, and one thousand patients were simulated to construct Figure 14. In all the analyzed datasets the estimated total IOV was clearly lower than the total IIV.

47
0 7 14 21 0 7 14 21 0 7 14 21
Etoposide IIV only Etoposide IOV only Etoposide IIV + IOV
0.1110
Topotecan IIV only Topotecan IOV only Topotecan IIV + IOV
FEC IIV only FEC IOV only FEC IIV + IOV
ET IIV only ET IOV only ET IIV + IOV
Paclitaxel IIV only Paclitaxel IOV only Paclitaxell IIV + IOV
Docetaxel IIV only Docetaxel IOV only Docetaxel IIV + IOV
Neu
troph
il co
unt (
cells
·10
/L)
9
Time (days)
0.1110
0.1110
0.1110
0.1110
0.1110
Figure 13. Twenty simulated individual time-courses of myelosuppression including IIV only, IOV only or IIV and IOV for all the six investigated datasets.
Nad
ir co
unt (
cells
·10
)9
Docetaxel Paclitaxel ET
FEC Topotecan Etoposide
0.01
0.1
1
10
IIV+IOV IIV IOV IIV+IOV IIV IOV IIV+IOV IIV IOVVariability term
0.1
1
10
Figure 14. Distribution of nadir values from 1000 patients receiving standard dose simulated with final model or only IIV or IOV.

48
Dose optimisation with nadir level as target The PD and PKPD-guided dosing were superior in targeting a desired
median nadir neutrophil count of 1·109 cells/L compared to other methods. In contrast to the standard method, model-based adjustment allowed an in-crease of dose for patient with sub-toxic levels, leading to a portion of pa-tients receiving an increased dose of up to double the initial dose already in the second course. Despite of this, the occurrence of severe (grade 4) toxicity was comparable to standard 25% dose adjustment in the second course (Fig-ure 15). The methods utilizing at least the baselines and near nadir neutrophil information had less dose imprecision than the other methods, and only baseline measures or plasma concentrations had a dose imprecision in the same magnitude as the standard method. The distribution of doses was also larger in the methods including a near nadir sample, than in the PK- or Base-line-guided methods. Little loss in performance of dose adaptation was seen when using the limited PD sampling, where only baseline and near nadir neutrophil measures were made (PDlim), compared to using full PD profiles or all available PK/PD information.
29%
35%
36%
27%
34%
39%
30%
32%
38%
29%
32%
40%
27%
38%
35%
30%
36%
35%
31%
33%
36%
27%
40%
33%
27%
40%
33%
28%
39%
33%
27%
41%
33%
0%
20%
40%
60%
80%
100%
No adj.
mad
e
25% re
d.
PK c1
Base c
1
Base c
2
BASE c1+2
PK c1+B
ase c
2
PDlimite
d c1
PD full c
1
PKPDlimite
d c1
PKPDfull c
1
SubTargetTox
Figure 15. Outcome in terms of highest model predicted toxicity grade with true parameters in second course of treatment with different optimization methods, Tox=grade 4, Target=grade 2 or 3 and Sub=grade 0 or 1 neutropenia.
In Figure 16 the difference in outcome from the second to the fifth course of treatment can be seen, with comparison of the standard method to the PDlim method. Outcome has been categorized into subtherapeutic (grade 0 or 1 neutropenia), on target (grade 2 or 3) or toxic (grade 4). The design of

49
the standard method is aimed at avoiding severe neutropenia, with the off-set that many patients receive sub-therapeutic treatment. The PDlim method targeting a nadir of 1.0·109/L potentially would substantially increase the number of patients in the target range after five continuous courses, but the number of patients experiencing severe neutropenia would double compared to the standard method.
29%
35%
36%
27%
34%
39%
27%
40%
33%
20%
38%
42%
0%
20%
40%
60%
80%
100%
No adj. 25% red. PDlim 1.0 PDlim 1.3
Second course SubTargetTox
34%
31%
36%
12%
41%
47%
21%
47%
33%
11%
52%
37%
0%
20%
40%
60%
80%
100%
No adj. 25% red. PDlim 1.0 PDlim 1.3
Fifth course SubTargetTox
Figure 16. Outcome in terms of highest model predicted toxicity grade with true parameters with increasing courses of treatment , Tox=grade 4, Target=grade 2 or 3 and Sub=grade 0 or 1 neutropenia.
Since nadir values are not normally distributed, it can be expected that the median value and geometric mean is separated (1.0·109 /L vs. 0.83·109 /L), in this case meaning that target median should be adjusted to achieve the geo-metric mean at mid-target range to maximize the number of patients in the target range. A target of 1.3·109 /L was found to produce a geometric mean of 0.99·109 /L, see Figure 17. With this adjusted target the number of pa-tients at risk of severe neutropenia could be kept at the same level as with the

50
standard method, while increasing the number of patients in the target range by 27%.
0 2 4 60.0
0.2
0.4
PDlim1.0
25% adjustmentj
PDlim1.3
f
Nadir count (·10 cells/L)9
Figure 17. Distribution of neutrophil nadir with standard method and the PDlim method with 1.0 or 1.3 as target.
In order to evaluate the impact of variability, data were also simulated us-ing half or double variability terms. The imprecision in target achievement (RMSE) was evaluated over the variability ranges, as well as categorical outcome in terms of patient fraction within target range. Figure 18 depicts the outcome of dose optimization with the PDlim dosing strategy with in-formation from one previous course. The RMSE increases with CV for all interoccasion variability terms, but remain constant over interindividual va-riability sizes, apart from IIV in BASE, where the highest CV level results in a marked increase in RMSE. The fraction of patients on target decreases when IOV increase in all parameters, but remains constant with varying IIV, apart from when IIV in the slope parameter increases.

51
0.0 0.1 0.2 0.3 0.4 0.5 0.6 0.7CV%
95%
105%
115%
125%R
MS
E
0.0 0.1 0.2 0.3 0.4 0.5 0.6 0.7CV%
30%
35%
40%
45%
50%
Pat
ient
s in
targ
et ra
nge
IIV-BaseIIV-CLIIV-MTTIIV-SlopeIOV-CLIOV-MTTIOV-Slope
IIV-BaseIIV-CLIIV-MTTIIV-SlopeIOV-CLIOV-MTTIOV-Slope
Figure 18. Target imprecision expressed as RMSE and fraction of patients in target range using the limited PD sampling strategy with varying levels of variability.
Bayesian dose adaptation in Excel The two dosing tools presented share some common functionality, but
differ somewhat in the complexity needed. They both allow the user to graphically examine the fit to data, and to explore the predicted outcome of user-specified dosing schedules. The tacrolimus one-compartment model can be solved analytically, which makes the Bayesian estimation procedure very fast, whereas the differential equation system needed to implement the mye-losuppression model leads to estimation times of approximately 1-3 minutes.
Dosing tool for intravenous tacrolimus The dosing tool can be used for a priori dose adaptation, by suggesting an
initial continuous iv infusion rate of tacrolimus based on patient covariate data (weight and S-Crea). It also contains a function for a posteriori dose adaptation. Following measurement of tacrolimus concentrations the dosage adjustment tool is capable of suggesting a tailored dosage rate based on indi-vidualised parameter estimates from a Bayesian process. Figure 19 shows the front Excel worksheet of the tacrolimus dosage adjustment tool.

52
etaluclac era sdleif yerg ,resu eht yb dellif eb ot era sdleif wolleY d:slaitini tneitaP YX
:)sraey( egA 02:)gk( thgieW5.2:etaD 59)mc( TH:edoC 54:)L/lomμ( aerC-S
m37.1/nim/lm( )ztrawhcS( LCrC 2) 99M)elamef=F elam=M( xeS
00.1)h42/gm( esod gnidaol deretsinimdA42)h( emit noisufni esod gnidaoL82.0)h42/gm( esod ecnaniatniam deretsinimdA
63)srh( emit noisufni esod ecnaniatniaM0
)L/gμ( .cnoC)h( trats tnemtaert retfa emiT90.42110.63
21)Lm/gn( tegrat 0C)h42/gm( esod ecnanetniam detsegguS 92.0
.noisufni suonitnoc sa deretsinimda sumilorcat rof elbacilppa ylnO
SCIHPARGOMED
ESOD ECNANETNIAM
esod laitini eht gniwollof snoitavresbO
A SOD LAUTC E
MARGORP GNISOD SUMILORCAT NILLAW NAHOJ 8002© etamitsEsretemarap
ot ataD dneSrohtuA
SNOITCIDERP ESOD ECNANIATNIAM
02468012141
69482706846342210)h( esod laitini eht retfa emiT
Con
cent
ratio
n ( μ
g/L)
noitavresbOtneitap tnerruC
esod .tniam detsegguS
Figure 19. Front Excel® worksheet of the dosage adaptation tool. Clinicians can add patient data to obtain a Bayesian prediction of the dose most likely resulting in the target concentration.
Dosing tool for neutrophil nadir as target The ODE solver was capable of solving the differential equation system
into a matrix, where a lookup function is used to match predicted neutrophil counts to measurements input by the user. Two matrices were output, one for the population predictions and one for the individual predictions. The user thus is presented both the individual fit to data as well as population predic-tions in graphics.
Computational performance of the dosing tool was compared to NON-
MEM in 75 simulated individuals. Accuracy and precision were very simi-lar between the two methods, and most likely to be attributed to the different versions of differential equation solvers implemented in NONMEM and PopTools; Runge-Kutta method 5,6 versus 4,5 (121). Figure 20 shows the accordance in parameter estimates and predictions of the two methods.

53
50 90 130 170
50
90
130
170
Dose (mg)
NONMEM
100 120 140 160 180
100
120
140
160
180
MTT (h)
Exc
el
Exc
el
Exc
el
NONMEM
0 5 10 15
5
10
15
Base (109/L)
NONMEM
9
10-1 100 101
10-1
100
101
Cells (10 /L)
NONMEM
0 0.1 0.2 0.3 0.4
0.1
0.2
0.3
0.4
Slope (μmol-1)
NONMEM
Exc
el
Exc
el
Figure 20. Predictions of pharmacodynamic parameters, neutrophil counts and sug-gested dose of Excel vs NONMEM.

54
Discussion
Tacrolimus dose adaptation In the transplantation community there is a long tradition of monitoring
drug concentrations and effects. There is a deep understanding of the high complexity of the patient therapy, and the marked pharmacokinetic variabili-ty exhibited by many immunosuppressants makes TDM seen as an important tool by clinicians. Numerous reviews have tried to summarize the current position, revealing there are many different levels in the current practice of monitoring these drugs. PK monitoring is still praxis, ranging from aiming at a trough level in target range, application of limited sampling schedules for AUC estimation to Bayesian forecasting (122-128). Even PD approaches with biomarker monitoring have been suggested, such as calcineurin or inter-leukin measurments, while still no such application in tacrolimus has been prospectively evaluated (129-131).
This work was based on retrospective data and as such some uncertainty
exists in dose and sample time records, especially in the outpatient setting. This also means sample times could not be designed to be optimally infor-mative to all parameters, and during oral therapy absorption rate needed to be fixed according to the literature. Furthermore some potentially important covariates could not be screened due to insufficient documentation in patient files. Veno-occlusive disease and GVHD are diagnoses likely to influence tacrolimus CL and F in HSCT, and chronic as well as rejection episodes would likely influence oral CL in liver transplantation. The number of pae-diatric patients receiving tacrolimus after HSCT or liver transplantation in Sweden has up to date been low, and the number of patients in this work may not have been sufficient to identify all possible covariate relations. However this analysis is the largest study of population pharmacokinetics of tacrolimus in these patient groups to date. Likely because there were rela-tively many observations per individual available and frequent dose adjust-ments were made during iv infusion, the estimated parameters were reliable and estimated with adequate precision.
The developed dosage-adjustment tool presented in Paper I may assist
physicians in individualising tacrolimus therapy in new paediatric HSCT recipients in the early phase of treatment. Large variability in tacrolimus

55
dosing requirements was evident also in HSCT, confirming the necessity for TDM. Application of Bayesian techniques should aid in interpretation of concentration data through utilisation of prior knowledge of population pharmacokinetics and prior dosing history in the individual patient allowing target concentrations to be obtained more rapidly. Bayesian forecasting of tacrolimus has previously been investigated in liver transplantation in Paper II and in previous reports (19, 132) as well as kidney transplantation (133), indicating a benefit over standard TDM. It is not likely that results could be fully transferred from solid organ transplantation to HSCT, since the sources of interindividual and interoccasion variability may be very different. Popu-lation models in published studies have been applied using specialized soft-ware, rather than a generic software like Excel which is intended to facilitate the distribution to end-users.
Data from liver transplantation confirmed the high variability in distribu-
tion and elimination parameters previously reported (134), and highlighted the highly varying initial exposure from the current dosing schedule. This variability shows the necessity of a revised dose schedule, as well as a need for TDM. A population pharmacokinetic model of tacrolimus is required that can be used in a Bayesian forecasting program to assist with drug dosing in the immediate post-transplant period in paediatric liver transplant recipients. Previously published population pharmacokinetic models of tacrolimus in pediatric liver transplantation when applied during Bayesian forecasting were shown not to adequately predict the pharmacokinetics of tacrolimus in the first critical weeks of treatment. These models were not developed for the immediate post-transplant period, and they also performed much better in predicting later measurements. A similar study of prediction of trough con-centrations in adult transplantation showed poor performance in this early phase (19), so it may well be necessary to have models that recognize the time-varying pharmacokinetics to enable model based dose adaptation in this critical phase. A pharmacokinetic model for tacrolimus in paediatric liver transplantation has been developed using data from the early post-transplant period which aimed at explaining not only steady-state pharmacokinetics, but also the initial change in apparent drug clearance of tacrolimus. Differ-ent modelling equations were tested to describe tacrolimus apparent clear-ance in the immediate post-transplant period. The proposed model in Paper II still needs to be externally validated for predictive performance.
In addition to investigating the possibilities of a posteriori dose adapta-
tion of tacrolimus with model based methods in the two populations, we have also revised the dose schedules to incorporate the pharmacokinetic models in a priori dose adaptation. The application of allometric principles for modelling of paediatric data has previously been shown to be a sound principle (3, 4, 135), and with the wide age and weight span as the observed

56
populations in this work it would be unwise to not apply these principles. Prior reports of age dependence in clearance have occurred when scaling to linear weight or with no scaling at all (36, 37, 136-140). Time dependence have often be reported to have functions contradicting the reported develop-ment pattern of CYP3A4/5 with age (2, 141). In one commonly cited study the authors have ignored the fact that age dependence disappeared with BSA as size scaling parameter rather than linear weight (37). In the populations studied in our work no age dependence could be seen after allometric scal-ing, whereas if linear scaling was applied there were indications to age de-pendence. Since all data are collected from ages reported to be characterized by a stable CYP3A4/5 function (2, 141) it seems likely allometric scaling is more suitable than linear. This would also mean that current dosing regimens should be revised, to acknowledge this parameter distribution.
The models presented in Paper I and II share some common features, but
must be regarded to be essentially different. Even though they both describe tacrolimus ADME in paediatric populations, it is likely that the underlying diagnoses and treatment has a strong influence. When applying the final model from one of the populations to data from the other it describes these data quite poorly. For model based dose adaption to be successful, the model has to be applicable to the population at hand, and it seems that drug behav-iour is very different between HSCT and liver transplantation. What has been shown here is that population model building can be carried out with data collected in routine care.
Dose regimens suggested by us in Paper I and II should be seen as con-
structed for the target concentrations in the centres at hand, and are thus site specific. No evaluation has been done to investigate whether these target concentrations are optimal or not. This work rather points to the use of model based methods to maximize the number of patients reaching a target, with a priori and a posteriori methods. The outcome of these dose recom-mendations have not been externally validated, and even though previous dosing recommendations where just linear extrapolations from adults whereas the recommendations presented here follow probably more sound allometric principles, some prospective validation is required to prove the benefit of a new schedule. There are however examples of where simulations alone have been used for dose recommendations in a regulatory perspective, even in paediatric populations (142, 143). This said, still it would be desir-able to prospectively evaluate the here presented recommendations with some close monitoring to ensure satisfactory concentrations.
57
Dose adaptation with myelosuppression target In this thesis variability components of the myelosuppression model has
been investigated in various aspects, in order to evaluate the opportunity of model based strategies for a priori and a posteriori dosing. Findings of sig-nificant covariate relations in the system parameters would help to reduce unexplained variability and could be used for a priori dose selection, but also serve as important information for clinical drug development. Covariate influence on drug specific parameters such as pharmacokinetic parameters and the efficacy parameter slope is of course important to the dose selection of the drug at hand, whereas the overall goal of this work has been to charac-terize the myelosuppression model in a general perspective and suggest methods applicable to a range of drugs, hence the focus on BASE and MTT in paper IV.
The covariate analysis in Paper III explored the influence of a large num-
ber of demographic and clinical chemistry factors on the system-related pa-rameters BASE and MTT. For the vast majority, including weight, age, crea-tinine and several liver enzymes, we did not find a statistically significant influence. As patient characteristics in the populations used for the modeling of the four drugs naturally differed, this might introduce a potential bias in the between-drug comparison of the system-related parameters but the joint analysis and the magnitude of difference and standard errors of the estimates for the four drugs support our approach. The across-drug comparison re-vealed that the 95%-CIs did not include relevant changes for these covari-ates, except extreme values of bilirubin, creatinine and height on MTT, al-bumin and creatinine on BASE. The comparison revealed that there was high consistency among the different data sets with respect to the sign of all four relations between one system-related parameter and one covariate that was available for all drugs (sex, age, performance status). That nearly all patient characteristics can be regarded as not clinically relevant on these system-specific parameters is of value in clinical practice and development of new agents.
Analysis of variability in Paper IV showed that IIV was in accordance
with previous results (65). IIV in BASE and Slope parameters was larger than IIV in MTT. IIV in BASE was similar across drugs while the IIV in Slope varied (22-62 % CV) between the different treatments. IOV in MTT was significant for all the investigated datasets except for topotecan. This may indicate that MTT is a parameter which influences most of the neutro-phil observations and therefore inclusion of IOV in MTT results in a signifi-cant improvement of the fit. Variability between treatment courses in drug sensitivity and baseline neutrophil count within an individual appeared how-ever of lower importance.

58
Therapeutic drug monitoring with adaptive control of cytotoxic agents has
been described in numerous publications, but has up to date most often been focused on the targeting plasma concentration levels. These studies rely on the assumption that there is a clear correlation between systemic exposure and the efficacy and/or toxicity for these agents. Population model based approaches have been applied for a range of drugs, and two extensive re-views on the subject has been published by Rousseau et al (93, 144). In gen-eral, studies show model based approaches to be beneficial in achieving tar-get exposure of drug, but none of these have attempted to incorporate PD as an operator. Only in a very limited number of trials a biomarker or outcome measure has been used for a posteriori dose adaptation.
Published studies on have investigated the application of empirical meth-
ods, with little possibility to generalize findings across drugs. Almost twenty years ago Ratain et al (96, 97) explored dosing etoposide based on an algo-rithm taking drug concentration and pre-treatment white blood count (WBC) level to target a WBC nadir. These studies recognized the interindividual variability in both PK and PD, and the adaptation was made during constant infusion. By using a PKPD guided dose adaptation, a 22% average increase in delivered dose was reported, without an increase in severe leukopenia, compared to the fixed dose group. The main difference, between this method and the one proposed in this Paper, apart from the using WBC rather than neutrophil count, is that the Ratain method for dose adaptation used WBC as a covariate at baseline only and does not incorporate the information that is gained by monitoring WBC during the course(s). The adaption method sug-gested by Ratain et al is two-sided in the same manner as our proposed method, and thus allow a tailored increase or decrease with full flexibility in dose sizes, as opposed to fixed dosing decrements. A very similar approach was applied in another study of oral etoposide (95), where baseline neutro-phil counts were used in combination with a plasma concentration drawn at the eighth day of the cycle to adjust the dose in 20 mg increments for the remainder of the course according to an empirical algorithm much like the one described by Ratain et al. In this study no comparison was made to any control arm, and the benefit of the adaptation method is thus hard to judge. In the described studies, dose adaptation was carried out during the ongoing course, which might be beneficial to the method we propose, where dose adaptation is calculated for the upcoming course of treatment. Adaptation during ongoing course would however not be possible for short infusion times or single bolus dosing. The empirical etoposide methods would be comparable in regards of amount of information to the PK+base method in this work. One major drawback with using only baseline measurements of PD is that individual estimates of the drug efficacy parameter could not be obtained.

59
One way of obtaining estimates of individual drug sensitivity was pre-
sented by Conley et al (145), where dose rate was adjusted based on the percentage change of thrombocyte levels during a constant infusion of hexamethylene bisacetamide from start of infusion to the end of infusion on day five, in order to achieve a specified target nadir. Results indicate that the PD based dose adapted patients achieved thrombocyte nadirs closer to target.
A study in 525 breast cancer patients investigated a so called tailored FEC
regimen in comparison to conventional chemotherapy (146). In the tailored arm, patients received a stepwise decrease or increase of the anticancer agents, based on the WBC and platelet counts at near nadir measurements. The tailored dose patients showed an increased chance of survival compared to the conventional arm. The method uses fixed dosing steps like the stan-dard method but allowing dose increments for patients showing little or no haematological toxicity. This makes it more similar to the PDlim method, but with less flexibility in the dose decrements/increments. Considering the positive results in such an important outcome measure as life prolongation, this study provides a strong support for PD-based dosing.
The analysis of different variability levels and their impact on outcome by
dose adaptation in Paper V reveals that the size of IOV is more important than the size of IIV. It can be concluded that in general high IIV does not harm the outcome of dose adaptation, whereas high IOV may limit the po-tential for adaptation. Covariates explaining the IIV can be of good use for the selection of initial dose, but in order to ensure predictability from one course to the next focus should be made to characterize covariates explaining IOV. This could mean that in order to facilitate dose tailoring, constant cova-riates such as genotype, gender or race might be less important than time-varying covariates such as liver status, concomitant medication or plasma protein levels. Many of the covariate relations found significant in Paper IV are of a time-varying nature, and thus could help explain a portion of the IOV, thus increasing precision of a posteriori dose adaptation.
Previous studies investigating the variability magnitude of drugs included
in this thesis show the magnitude of IOV in volume of distribution and clearance to be low in comparison to IIV (74, 75, 147-149). The investiga-tion in Paper IV of PD variability found that in general IOV was lower than IIV on the parameter level, and most importantly even more markedly so in the secondary parameter neutrophil nadir, which is influential on the inci-dence of toxicity. Results in Paper V indicate that when PD samples are available, PK samples are of low additional informative value for model based dose adaptation. Dose adaptation based on PK samples alone would even perform worse than the standard method; a one-sided fixed decrement
60
PD based strategy. By using PD sampling it could be possible to characterise the entire dose-toxicity relation, instead of focusing on only the dose-exposure.
The method proposed in this thesis for limited neutrophil sampling in
model based dose adaptation has yet only been evaluated by simulations, and the suggested benefit would need to be confirmed in prospective trials. This could be facilitated by the application of the tool presented in Paper VI. Ap-plication of a multi-compartmental PKPD model for dose adaptation and the use of secondary parameters as target would normally require highly specific statistical software, while the presented tool uses macros and add-ons in MS Excel, allowing wide distribution and a clear graphical presentation for deci-sion making.
The pharmacodynamic target used in this thesis has been neutropenia,
whereas there are other biomarkers and outcome measures that could be modelled and used for dose adaptation. Examples of such could be tumour vascularisation, tumour size or tumour antigen levels. A suitable PD target should be on the causal pathway between dose and clinical end-point, and be correlated to drug dose.
Model based dose adaptation in perspective Currently most TDM carried out around the world utilizes drug concen-
trations, and in a few cases biomarkers, in empirical titration towards a target range. Some people within the TDM community have propagated the use of target concentration level as opposed to a target range ever since the 1960’s. To separate the two concepts, the term target concentration strategy (TCS) has been proposed (150), recognizing residual variability and population pharmacokinetic principles. The main difference to TDM is that TCS recog-nizes that the measured concentration is perhaps not the true concentration, and should be used as an indication of individual behaviour rather than a treatment goal itself.
Using target levels instead of ranges is based on the assumption that there
is such a thing as an optimal exposure, and aiming for this would reduce the variability in drug effect. It is not really a new concept, and in fact the most common approach in Bayesian forecasting, since the method is designed to maximize the likelihood of reaching a specific target rather than a range (150). Another perspective is to assume that concentrations within the range are regarded as desired, whereas doses resulting in concentrations above or below should be avoided at any cost. This can be included in the Bayesian approach by assigning a cost function to doses risking to result in concentra-
61
tions outside the range (151). There are more elaborate ways to this, such as the multiple model approach, where non-parametric distributions are used to examine alternate dosing schedules and evaluating the most likely to fulfil the desired goal (152). One complicating issue could be that levels below or above the target are not regarded as an equal loss of utility. For example, a too low level might lead to failure of therapy, whereas a too high concentra-tion might lead to a toxicity that is regarded as less dangerous to the patient. This could be addressed by the inclusion of a one-sided punishment function for the Bayesian algorithm, as discussed by Jeliffe et al (153), while no pro-spective study of this concept has yet been presented.
A further development of this principle is to incorporate clinical efficacy
to select an individual target concentration. This strategy has been proposed as adaptive control (AC) (105, 153) or target concentration intervention (TCI) (154). These concepts do not generally involve a full PKPD model for dose adaptation using the efficacy measurements, but is rather a way of us-ing concentration measurements in relation to a pre-stated clinical need or to an individual assessment of efficacy.
The concept of model based methods to achieve target levels as opposed
to empirical titration towards a target range is as earlier stated not new, and relies on sound statistical and pharmacological principles. However, Bayes-ian approaches are rarely used outside a few geographic areas, and often rely on single individuals advocating the methods. When looking for reasons for the limited application of these methods, two basic arguments are commonly raised. The first would be the question about outcome, has it really been proven to be superior to standard TDM? The other would be the problem of implementation, how should it be carried out practically?
To answer the first question; in comparison to the multitude of papers de-
scribing TDM versus uniform dosing, there is much less published on TCS and/or Bayesian forecasting. An overview by Kraiczi et al of target concen-tration-controlled trials summarize examples of successful Bayesian fore-casting (155). In the field of anti-cancer treatment where the concept of con-centration guided dosing is rather well-accepted, but still rarely used, even though several studies have found that TCS and Bayesian techniques are valuable (156-163). Evans et al were even able to show improved outcome on patient survival in leukaemia after Bayesian dose adaptation of meth-otrexate with PK sampling (161). It can be concluded that model based dose adjustments with target concentration is superior to uniform dosing, but pro-spective evaluation of TCS versus TDM in clinical care has up to date not been presented, and an inarguable value of model application compared to empirical dosing using the same concentrations as guidance has never been shown. The results in Paper V furthermore suggest a shift from concentra-

62
tion monitoring to pharmacodynamic monitoring if possible. Model based pharmacodynamic monitoring has been applied in only a few therapeutic areas, and actual assessment of outcome is even rarer than in model based concentration monitoring. One of the successful examples is the application of so called closed-loop systems for anaesthesia, where EEG data are used for on-line adaptation of drug infusion rate. This method has been prospec-tively evaluated and proven superior to manual dose adaptation in a number of anaesthetic drugs (164-172). In many other drugs pharmacodynamic monitoring has been suggested but only rarely evaluated. Examples include warfarin and bleeding time (173), insulin and glucose levels (174, 175) and amiodarone and hepatic toxicity markers (176).
The second issue regarding the practical implementation of models for
dose adaptation boils down to knowledge of the principles and access to the practical tools needed, which cannot be assumed to be held by clinicians in general. The pharmacometric community should put some emphasis in communicating the ideas and deliver concise examples on the benefits of the approaches in the right forums, which might be publishing in journals and presentation at conferences, as well as the daily interactions with clinically active colleagues. In many cases publications of population models encour-age the use of TDM/TCS/AC/TCI, preferably using the model presented. Models have most often been developed in highly specific statistical soft-ware, and these could not be assumed to be accessible in clinics, and a more common platform is desired. There are previous literature examples of appli-cation of empirical Bayesian algorithms for dose adaptation in generic soft-ware like Excel (177), but what is new in this thesis is the application of complex PKPD model that requires an ODE solver. Application in Excel allows a wide distribution, and a complete transparency in calculations and a high flexibility in model implementation, as opposed to designated TDM Bayesian software. The apparent drawbacks are that complex dosing histo-ries are difficult to handle, as well as a loss in computational speed.
63
Conclusions
Data assembled during routine clinical care has been collected for tac-rolimus in paediatric transplantation. Previously published population phar-macokinetic models did not sufficiently predict data in paediatric liver trans-plant recipients, and a new population pharmacokinetic model was devel-oped. Previous population pharmacokinetic models for tacrolimus in hema-topoietic stem cell transplantation have only described adults and a model for paediatric pharmacokinetics was developed. These models incorporate allometric scaling of parameters to weight and additional significant covari-ates, such as post-transplantation time and serum creatinine. The models used to describe the two populations share some common features but must be regarded as essentially different. The proposed models have been used to evaluate the current dosing strategies derived directly from adults, and to suggest alternate dosing schedules tailored for the paediatric population. These dosing schedules aim to increase the number of patients rapidly reach-ing a target with satisfactory concentrations.
A semi-mechanistic model of myelosuppression has been investigated for
application in dose individualisation. Covariate influence on model parame-ters was evaluated in four different anticancer drugs, suggesting up to six statistically significant relations for a single drug, while across drug com-parison of statistical and clinical significance rejected many of these. Re-maining covariate relations were found only on MTT, while effects on BASE were not statistically and/or clinically relevant. High bilirubin de-creased MTT, whereas patient height was positively correlated to MTT.
IOV in the parameters of the myelosuppression model was found signifi-
cant for MTT in five out of six data sets and for the drug-specific efficacy parameter SLOPE in three of the datasets but was not significant for the neutrophil baseline value. Overall IOV was low in relation to IIV when comparing full time-neutrophil profiles as well as distribution of nadir val-ues, implying that dose adaptation based on neutrophil counts would be fea-sible.
Paper V investigated the application of the myelosuppression model in
dose adaptation to target a specified nadir value. Findings suggest that plasma concentrations contribute very little to the performance of dose adap-

64
tation if neutrophil counts are available. Dose adaptation based on a limited sampling schedule of neutrophil measurements performed almost as well as when using a dense sampling scheme in combination with plasma concentra-tions, and was superior to the standard toxicity guided dose reduction proto-col. The importance of the magnitude of IOV and IIV in pharmacokinetic and myelosuppression model parameters was investigated in regards to achieving the target neutrophil count following model based dose adaptation. The method performed well also when IIV as high, whereas it was more sensitive to IOV magnitude, especially for the SLOPE parameter.
Tools for dose adaptation have been presented, with applications of both a
linear pharmacokinetic model for tacrolimus in paediatric transplantation as well as the more complex pharmacokinetic/pharmacodynamic model for myelosuppression. These tools include a Bayesian forecasting process, and the possibility to define various treatment targets for dose selection, and are based on Excel macros. This method has been compared to NONMEM, and found to perform similarly for this purpose.

65
Farmakometriska modeller som grund för dosanpassning
Det optimala läkemedlet vore ett där en och samma dos ger samma effekt i alla patienter. De allra flesta patienter får dock varierande effekt av läke-medel, beroende på skillnader i hur kroppen tar upp, fördelar och eliminerar läkemedlet (farmakokinetik) eller i hur kroppen reagerar på läkemedlet (far-makodynamik). Somliga läkemedel har väldigt snäva intervall mellan vilka nivåer som är effektiva och vilka som riskerar att ge biverkningar. I vissa fall är det enkelt att utvärdera effekten av läkemedlet, till exempel smärtstillande medel kan enkelt dosjusteras baserat på hur ont patienten har, och biverk-ningar som illamående eller dåsighet kan också enkelt utvärderas. I andra fall kan det istället vara långt mellan dostillfället och den önskade eller oönskade effekten, eller så är effekten väldigt svårstuderad. En lösning kan i vissa fall vara att göra en mätning i kedjan av skeenden som länkar dos och effekt.
Exempelvis kan en mätning av läkemedelskoncentration i blod eller
plasma vara en vägledning till om patienten fått rätt dos. Ibland är det möj-ligt att mäta en kroppsegen substans eller göra en objektiv funktionsskatt-ning som är nära länkad till den önskade eller oönskade effekten, en så kal-lad biomarkör. Vid exempelvis behandling av blodproppar med warfarin kan man mäta koncentrationen av läkemedlet, men ännu bättre är att mäta koagu-lationstiden, då detta är närmare sammanlänkat med risken för blodpropp eller blödning. Om man mäter koncentrationen kan man få en uppfattning om patienten i fråga har ett lågt upptag eller en snabb metabolism, men får fortfarande anta att korrelationen mellan koncentration och blödningsrisk är den samma som i en typisk individ. Genom att mäta koagulationstiden, bio-markören, kan man istället bilda sig en uppfattning om hur läkemedlet på-verkar blödningsfunktionen specifikt hos patienten. För många läkemedels-behandlingar finns dock inga praktiska sådana biomarkörer, eller behovet av dem är lågt då de flesta patienter reagerar ungefär lika vid samma nivåer av läkemedel, och då kan koncentrationer vara en god vägledning för dosin-ställning.
Ämnet farmakometri handlar om att karakterisera farmakokinetiken och
farmakodynamiken hos läkemedel genom statistiska modeller. Dessa model-

66
ler syftar till att beskriva skeenden i kroppen, och inkludera biologisk och empirisk kunskap. De kan även beskriva på vilket sätt individer skiljer sig från varandra, och hur en individ ändras med tiden. Dessa modeller kan t.ex. användas för simuleringar av olika doseringscheman eller kliniska prövning-ar. Man kan också använda modeller för dosinställning av patienter med hjälp av så kallade Bayesianska tekniker. Kort sammanfattat går det ut på att använda modellerna tillsammans med mätningar från den aktuella individen för att förutsäga vilken dosering som statistiskt mest sannolikt är rätt för patienten.
I denna avhandlng har jag undersökt möjligheten inom två kritiska terapi-
områden att använda olika typer av mätningar för dosjustering med hjälp av farmakometriska modeller. Det ena fallet är blodkoncentrationer av det im-munosuppressiva läkemedlet tacrolimus i lever- respektive benmärgstransp-lantaterade barn. Idag används en doseringsstrategi som är direkt överförd från behandlingen av vuxna, och arbetet syftade till att utvärdera lämplighe-ten i detta. Data har samlats in från kliniker och dessa har använts för att konstruera modeller som beskriver farmakokinetiken i transplanterade barn. Med hjälp av simuleringar baserat på modellerna har dagens dosering jäm-förts med nya doseringsscheman ämnade att bättre passa barn, framför allt i det kritiska skedet under den första tiden efter transplantation.
I det andra fallet har jag använt mätningar av neutrofiler, den vanligaste
typen av vita blodkroppar, under cancerbehandling som exempel, där sänk-ningen av cellantalet är en kritisk biverkan av många cystostatika och ofta begränsar möjligheten att ge tänkt dos. Faktorer som påverkar hur olika pati-enter reagerar på läkemedel har undersökts, liksom skillnader inom indivi-den över tiden. Simuleringar har använts för att undersöka hur läkemedels-koncentrationer och/eller blodkroppsräkningar kan användas i de farmako-metriska modellerna för att justera dosen till ett specikt mål; en viss lägsta nivå av cellantalet. Genom att mäta blodkroppsantalet före läkemedel ges och ungefär tio dagar senare och låta modellen använda dessa för en dosbe-räkning kan man öka behandlingsintensiteteten i patientgruppen som helhet utan att samtidigt öka antalet patienter som får allvarliga biverkningar.
Modellbaserad dosanpassning kräver vanligtvis specialiserad mjukvara
för de beräkningar som krävs, men för att möjliggöra användande inom vår-den på klinik krävs lättillgängliga lösningar. I den här avhandlingen presen-teras en implentering av de i avhandlingen diskuterade modellerna samt de Bayesianska beräkningsprocesserna i Excel. Denna har jämförts och visat sig jämbördig med högspecialiserad statistisk mjukvara.

67
Acknowledgments
First of all thanks to my wonderful Ida. For your support, understanding and for believing in me. For putting up with me working to four in the nights and sleeping to ten. And thank you for being my sugar mama; now will come a future with Mulberry bags and diamonds. And PS3:s. To my supervisor Mats Karlsson and my co-supervisor Lena Friberg. Mats; thanks for all the discussions, the wild ideas, good advice and most of all for always seeing the opportunities! And Lena; thanks for keeping the perspec-tive when our ideas flew to high, and for your great concern to details. It has been a pleasure to work with you both, and it made this trip quite fun. And I have learned so much. To Niclas Jonsson, who started out as my co-supervisor. Thanks for trying to teach me how to actually do this modelling thing. To Anna Reimers, Elisabeth Psaros and Anna Lindblad for spending endless hours searching through patient files. And for being great masters-students. Nice work, couldn’t have done this without you. I would also like to thank Apotekarsocieteten and Apoteket AB for funding, and especially Peter Persson for creating this opportunity and Anders Carlsten for all support. To Martin, my room-mate. If it hadn’t been for us sharing room, we would both have been PhDs long time ago. But in the meantime we have solved almost every problem existing in this world. We just have to take charge and implement all our ideas now. To Jörgen and Bettan, my previous room-mates. There has always been breakfast on the table, and I’m very grateful. Let’s see if we can find a way to stick together for at least another 16 years. To Anders, Anja, Charlotte, Christine, Emma and Henryk, my co-authors. Thank you for all your input and efforts.

68
To Magnus for giving me new old computers every three months, for all the help and the open door. To Lasse, Pontus and Kajsa for helping me out when I needed psn to do things it didn’t want to. You always had a million things to do, but somehow made it anyway. To Joe, for reading the thesis and for good discussions on the way there. When everyone else gets lost in methodology, you keep remembering the patient. To Hanna, for leading the way up to the dissertation. For the comfort and the laughs. To all you other wonderful people who have been at the department; Agneta, Ami, Anders, Anders, Andy, Angelica, Anja, Anna, Anna, Anna-Maria, Annika, Ann-Marie, Anubha, Bengt, Bettan, Britt, David, Doaa, Elodie, Emma, Emma, Emma, Grant, Guangli, Hanna, Hanna, Jacob, Jakob, Jessica, Jocke, Jonna, Joseph , Joy, Justin, Jörgen , Kajsa, Karin, Karin, Kjell, Klas, Kristin, Kristin, Lasse, Lena, Lena, Lotfi, Magnus, Mama, Marcus, Marga-reta, Maria, Marina, Markus, Martin, Mats, Matts, Mia, Niclas, Paul, pH, Pontus, Poppi, Rada, Rikard, Rocio, Siv, Stefanie, Stina, Sven, Ulrika, Ul-rika, Waqas and Åsa! Hope I didn’t forget anyone. Even though you do such different things like programming R or teaching clinical pharmacy; come from such different places as Hallstavik or Cape Town; stay for a week or twenty years, there is still a certain spirit at the department which I will defi-nitely miss. To Oh Yes! and the Big No-No’s featuring Maybe, we’ll talk about that later… for showing me you’re never too old to live the dream. When the bandstarter returns we’ll get back on it. Or move to Brazil and form a samba orchestra. There is a light that never goes out. Hände hoch! To Nike for all the wonderful designs, giving the people round the coffee table something to talk about.

69
Tack till alla vänner, som hjälpt mig koppla när det gått trögt och glatts med mig när det gått bra. Speciellt tack till några: Till Louise & Johan, som alltid är beredda att dela en flaska champagne eller en gryta stuvade makaroner. Till Erik & Sara för resor med hyrbil och rått kött, och för att köpet av ett gästrum. Till Per & Denny för att funnits med i vått och torrt. Till Kicki och Anna för att ni förgyllde alla luncher på de kackiga krogarna runt BMC. Till Mattias, pH och Jacob för att ni berättat hur livet i den riktiga världen funge-rar. Till Lotta för att alltid ha ett glas rött väntande i Gbg. Till Andreas & Stina för ett färdigbäddat golv och en 240 alltid redo (?) för en tur runt Skånska slott och herresäten. Till Anna och Martin för att det alltid står en panna té på gång i ett välkomnande hus en trött söndag. Till Gia & Fredrik för att ni alltid vågar pröva något nytt. Till Cia och Johan E för att ni alltid ställt upp på en öl på nåt Söderhak. Till Basti för att visat att man kan tjäna pengar på modeller. Till gobbarna hemifrån för att det ibland kan få vara skönt att vara typ 17 igen. Och till Jorsan för allt vårt ftp:ande, IT! Och sist men inte minst: Tack till min familj som stått bakom mig hela vä-gen. Nu är jag äntligen klar i skolan vid 34 år ålder. Hade ni någon aning om att det skulle ta så lång tid när ni en dag i början på 80-talet skickade iväg mig till Mariebergsskolan?

70
References
1. Sheiner LB, Melmon KL. The utility function of antihypertensive therapy. Ann N Y Acad Sci 1978; 304: 112-27.
2. Tanaka E. In vivo age-related changes in hepatic drug-oxidizing capacity in humans. J Clin Pharm Ther 1998; 23(4): 247-55.
3. Anderson BJ, Allegaert K, Holford NH. Population clinical pharmacology of children: general principles. Eur J Pediatr 2006; 165(11): 741-6.
4. Anderson BJ, Allegaert K, Holford NH. Population clinical pharmacology of children: modelling covariate effects. Eur J Pediatr 2006; 165(12): 819-29.
5. Gisleskog PO, Karlsson MO, Beal SL. Use of prior information to stabilize a population data analysis. J Pharmacokinet Pharmacodyn 2002; 29(5-6): 473-505.
6. Kino T, Hatanaka H, Hashimoto M, Nishiyama M, Goto T, Okuhara M et al. FK-506, a novel immunosuppressant isolated from a Streptomyces. I. Fermen-tation, isolation, and physico-chemical and biological characteristics. J Antibiot (Tokyo) 1987; 40(9): 1249-55.
7. Kino T, Hatanaka H, Miyata S, Inamura N, Nishiyama M, Yajima T et al. FK-506, a novel immunosuppressant isolated from a Streptomyces. II. Immuno-suppressive effect of FK-506 in vitro. J Antibiot (Tokyo) 1987; 40(9): 1256-65.
8. Fukudo M, Yano I, Masuda S, Okuda M, Inui K. Distinct inhibitory effects of tacrolimus and cyclosporin a on calcineurin phosphatase activity. J Pharmacol Exp Ther 2005; 312(2): 816-25.
9. Plosker GL, Foster RH. Tacrolimus: a further update of its pharmacology and therapeutic use in the management of organ transplantation. Drugs 2000; 59(2): 323-89.
10. Scott LJ, McKeage K, Keam SJ, Plosker GL. Tacrolimus: a further update of its use in the management of organ transplantation. Drugs 2003; 63(12): 1247-97.
11. Ihara H, Shinkuma D, Ichikawa Y, Nojima M, Nagano S, Ikoma F. Intra- and interindividual variation in the pharmacokinetics of tacrolimus (FK506) in kid-ney transplant recipients--importance of trough level as a practical indicator. Int J Urol 1995; 2(3): 151-5.
12. Jusko WJ. Analysis of tacrolimus (FK 506) in relation to therapeutic drug monitoring. Ther Drug Monit 1995; 17(6): 596-601.
13. Backman L, Nicar M, Levy M, Distant D, Eisenstein C, Renard T et al. FK506 trough levels in whole blood and plasma in liver transplant recipients. Correla-tion with clinical events and side effects. Transplantation 1994; 57(4): 519-25.
14. Kershner RP, Fitzsimmons WE. Relationship of FK506 whole blood concen-trations and efficacy and toxicity after liver and kidney transplantation. Trans-plantation 1996; 62(7): 920-6.
71
15. Napoli KL. Is microparticle enzyme-linked immunoassay (MEIA) reliable for use in tacrolimus TDM? Comparison of MEIA to liquid chromatography with mass spectrometric detection using longitudinal trough samples from transplant recipients. Ther Drug Monit 2006; 28(4): 491-504.
16. Antignac M, Hulot JS, Boleslawski E, Hannoun L, Touitou Y, Farinotti R et al. Population pharmacokinetics of tacrolimus in full liver transplant patients: modelling of the post-operative clearance. Eur J Clin Pharmacol 2005; 61(5-6): 409-16.
17. Bruce N, Thomson AH, Elliot H. Population pharmacokinetics of tacrolimus in liver transplant patients [abstract ]. In: PAGE 1995. Frankfurt am Main, Ger-many: Population Approach Group Europe, 1995.
18. Fukatsu S, Yano I, Igarasi T. Population pharmacokinetics of tacrolimus in adult recipients receiving living-donor liver transplantation. Eur J Clin Phar-macol 2001; 57(6-7): 479-484.
19. Macchi-Andanson M, Charpiat B, Jelliffe RW, Ducerf C, Fourcade N, Baulieux J. Failure of traditional trough levels to predict tacrolimus concentra-tions. Ther Drug Monit 2001; 23(2): 129-33.
20. Mekki Q, Lee CC. Population pharmacokinetics of tacrolimus (FK506) in liver transplant patients [abstract]. Clin Pharmacol Ther 1994; 55(2): 162.
21. Sam WJ, Tham LS, Holmes MJ, Aw M, Quak SH, Lee KH et al. Population pharmacokinetics of tacrolimus in whole blood and plasma in asian liver trans-plant patients. Clin Pharmacokinet 2006; 45(1): 59-75.
22. Staatz CE, Willis C, Taylor PJ, Lynch SV, Tett SE. Toward better outcomes with tacrolimus therapy: population pharmacokinetics and individualized dos-age prediction in adult liver transplantation. Liver Transpl 2003; 9(2): 130-7.
23. Garcia Sanchez MJ, Manzanares C, Santos-Buelga D, Blazquez A, Manzanares J, Urruzuno P et al. Covariate effects on the apparent clearance of tacrolimus in paediatric liver transplant patients undergoing conversion therapy. Clin Phar-macokinet 2001; 40(1): 63-71.
24. Sam WJ, Aw M, Quak SH, Lim SM, Charles BG, Chan SY et al. Population pharmacokinetics of tacrolimus in Asian paediatric liver transplant patients. Br J Clin Pharmacol 2000; 50(6): 531-41.
25. Staatz CE, Taylor PJ, Lynch SV, Willis C, Charles BG, Tett SE. Population pharmacokinetics of tacrolimus in children who receive cut-down or full liver transplants. Transplantation 2001; 72(6): 1056-61.
26. Yasuhara M, Hashida T, Toraguchi M, Hashimoto Y, Kimura M, Inui K et al. Pharmacokinetics and pharmacodynamics of FK 506 in pediatric patients re-ceiving living-related donor liver transplantations. Transplant Proc 1995; 27(1): 1108-10.
27. Sinha VK, De Buck SS, Fenu LA, Smit JW, Nijsen M, Gilissen RA et al. Pre-dicting oral clearance in humans: how close can we get with allometry? Clin Pharmacokinet 2008; 47(1): 35-45.
28. Fagerholm U. Prediction of human pharmacokinetics - renal metabolic and excretion clearance. J Pharm Pharmacol 2007; 59(11): 1463-71.
29. Antignac M, Barrou B, Farinotti R, Lechat P, Urien S. Population pharmacoki-netics and bioavailability of tacrolimus in kidney transplant patients. Br J Clin Pharmacol 2007: 1-8.
30. Hu RH, Lee PH, Tsai MK. Clinical influencing factors for daily dose, trough level, and relative clearance of tacrolimus in renal transplant recipients. Transplant Proc 2000; 32(7): 1689-92.

72
31. Molinaro M, Regazzi MB, Pasquino S, Rinaldi M, Iacona I, Campana C et al. Pharmacokinetics of tacrolimus during the early phase after heart transplanta-tion. Transplant Proc 2001; 33(3): 2386-9.
32. Pou L, Brunet M, Andres I, Rodamilans M, Lopez R, Corbella J. Influence of posttransplant time on dose and concentration of tacrolimus in liver transplant patients. Transpl Int 1998; 11 Suppl 1: S270-1.
33. Undre NA, Schafer A. Factors affecting the pharmacokinetics of tacrolimus in the first year after renal transplantation. European Tacrolimus Multicentre Re-nal Study Group. Transplant Proc 1998; 30(4): 1261-3.
34. Jacobson P, Ng J, Ratanatharathorn V, Uberti J, Brundage RC. Factors affect-ing the pharmacokinetics of tacrolimus (FK506) in hematopoietic cell trans-plant (HCT) patients. Bone Marrow Transplant 2001; 28(8): 753-8.
35. Boswell GW, Bekersky I, Fay J, Wingard J, Antin J, Weisdorf D et al. Tac-rolimus pharmacokinetics in BMT patients. Bone Marrow Transplant 1998; 21(1): 23-8.
36. Mehta P, Beltz S, Kedar A, Graham-Pole J, Wingard JR. Increased clearance of tacrolimus in children: need for higher doses and earlier initiation prior to bone marrow transplantation. Bone Marrow Transplant 1999; 24(12): 1323-7.
37. Przepiorka D, Blamble D, Hilsenbeck S, Danielson M, Krance R, Chan KW. Tacrolimus clearance is age-dependent within the pediatric population. Bone Marrow Transplant 2000; 26(6): 601-5.
38. Przepiorka D, Ippoliti C, Khouri I, Anderlini P, Mehra R, Giralt S et al. Al-logeneic transplantation for advanced leukemia: improved short-term outcome with blood stem cell grafts and tacrolimus. Transplantation 1996; 62(12): 1806-10.
39. NCI. Common toxicity criteria, version 2.0. In: National Cancer Institute, 2003.
40. Crawford J, Dale DC, Lyman GH. Chemotherapy-induced neutropenia: risks, consequences, and new directions for its management. Cancer 2004; 100(2): 228-37.
41. Lyman GH. Risk assessment in oncology clinical practice. From risk factors to risk models. Oncology (Williston Park) 2003; 17(11 Suppl 11): 8-13.
42. Bodey GP, Buckley M, Sathe YS, Freireich EJ. Quantitative relationships between circulating leukocytes and infection in patients with acute leukemia. Ann Intern Med 1966; 64(2): 328-40.
43. Bonadonna G, Valagussa P, Moliterni A, Zambetti M, Brambilla C. Adjuvant cyclophosphamide, methotrexate, and fluorouracil in node-positive breast can-cer: the results of 20 years of follow-up. N Engl J Med 1995; 332(14): 901-6.
44. Budman DR, Berry DA, Cirrincione CT, Henderson IC, Wood WC, Weiss RB et al. Dose and dose intensity as determinants of outcome in the adjuvant treatment of breast cancer. The Cancer and Leukemia Group B. J Natl Cancer Inst 1998; 90(16): 1205-11.
45. Epelbaum R, Faraggi D, Ben-Arie Y, Ben-Shahar M, Haim N, Ron Y et al. Survival of diffuse large cell lymphoma. A multivariate analysis including dose intensity variables. Cancer 1990; 66(6): 1124-9.
46. Kwak LW, Halpern J, Olshen RA, Horning SJ. Prognostic significance of actual dose intensity in diffuse large-cell lymphoma: results of a tree-structured survival analysis. J Clin Oncol 1990; 8(6): 963-77.
47. Lepage E, Gisselbrecht C, Haioun C, Sebban C, Tilly H, Bosly A et al. Prog-nostic significance of received relative dose intensity in non-Hodgkin's lym-phoma patients: application to LNH-87 protocol. The GELA. (Groupe d'Etude des Lymphomes de l'Adulte). Ann Oncol 1993; 4(8): 651-6.

73
48. Cameron DA, Massie C, Kerr G, Leonard RC. Moderate neutropenia with adjuvant CMF confers improved survival in early breast cancer. Br J Cancer 2003; 89(10): 1837-42.
49. Di Maio M, Gridelli C, Gallo C, Shepherd F, Piantedosi FV, Cigolari S et al. Chemotherapy-induced neutropenia and treatment efficacy in advanced non-small-cell lung cancer: a pooled analysis of three randomised trials. Lancet Oncol 2005; 6(9): 669-77.
50. Poikonen P, Saarto T, Lundin J, Joensuu H, Blomqvist C. Leucocyte nadir as a marker for chemotherapy efficacy in node-positive breast cancer treated with adjuvant CMF. Br J Cancer 1999; 80(11): 1763-6.
51. Saarto T, Blomqvist C, Rissanen P, Auvinen A, Elomaa I. Haematological toxicity: a marker of adjuvant chemotherapy efficacy in stage II and III breast cancer. Br J Cancer 1997; 75(2): 301-5.
52. Yamanaka T, Matsumoto S, Teramukai S, Ishiwata R, Nagai Y, Fukushima M. Predictive value of chemotherapy-induced neutropenia for the efficacy of oral fluoropyrimidine S-1 in advanced gastric carcinoma. Br J Cancer 2007; 97(1): 37-42.
53. Egorin MJ, Van Echo DA, Whitacre MY, Forrest A, Sigman LM, Engisch KL et al. Human pharmacokinetics, excretion, and metabolism of the anthracycline antibiotic menogaril (7-OMEN, NSC 269148) and their correlation with clini-cal toxicities. Cancer Res 1986; 46(3): 1513-20.
54. Jakobsen P, Bastholt L, Dalmark M, Pfeiffer P, Petersen D, Gjedde SB et al. A randomized study of epirubicin at four different dose levels in advanced breast cancer. Feasibility of myelotoxicity prediction through single blood-sample measurement. Cancer Chemother Pharmacol 1991; 28(6): 465-9.
55. Jenkins P, Freeman S. Pretreatment haematological laboratory values predict for excessive myelosuppression in patients receiving adjuvant FEC chemother-apy for breast cancer. Ann Oncol 2009; 20(1): 34-40.
56. Minami H, Ando Y, Sakai S, Shimokata K. Clinical and pharmacologic analy-sis of hyperfractionated daily oral etoposide. J Clin Oncol 1995; 13(1): 191-9.
57. van Groeningen CJ, Pinedo HM, Heddes J, Kok RM, de Jong AP, Wattel E et al. Pharmacokinetics of 5-fluorouracil assessed with a sensitive mass spectro-metric method in patients on a dose escalation schedule. Cancer Res 1988; 48(23): 6956-61.
58. Zhou H, Choi L, Lau H, Bruntsch U, Vries EE, Eckhardt G et al. Population pharmacokinetics/toxicodynamics (PK/TD) relationship of SAM486A in phase I studies in patients with advanced cancers. J Clin Pharmacol 2000; 40(3): 275-83.
59. Karlsson MO, Molnar V, Bergh J, Freijs A, Larsson R. A general model for time-dissociated pharmacokinetic-pharmacodynamic relationship exemplified by paclitaxel myelosuppression. Clin Pharmacol Ther 1998; 63(1): 11-25.
60. Karlsson MO, Port RE, Ratain MJ, Sheiner LB. A population model for the leukopenic effect of etoposide. Clin Pharmacol Ther 1995; 57(3): 325-34.
61. Friberg LE, Brindley CJ, Karlsson MO, Devlin AJ. Models of schedule de-pendent haematological toxicity of 2'-deoxy-2'-methylidenecytidine (DMDC). Eur J Clin Pharmacol 2000; 56(8): 567-74.
62. Friberg LE, Freijs A, Sandstrom M, Karlsson MO. Semiphysiological model for the time course of leukocytes after varying schedules of 5-fluorouracil in rats. J Pharmacol Exp Ther 2000; 295(2): 734-40.
63. Minami H, Sasaki Y, Saijo N, Ohtsu T, Fujii H, Igarashi T et al. Indirect-response model for the time course of leukopenia with anticancer drugs. Clin Pharmacol Ther 1998; 64(5): 511-21.

74
64. Zamboni WC, D'Argenio DZ, Stewart CF, MacVittie T, Delauter BJ, Farese AM et al. Pharmacodynamic model of topotecan-induced time course of neu-tropenia. Clin Cancer Res 2001; 7(8): 2301-8.
65. Friberg LE, Henningsson A, Maas H, Nguyen L, Karlsson MO. Model of che-motherapy-induced myelosuppression with parameter consistency across drugs. J Clin Oncol 2002; 20(24): 4713-21.
66. Hing J, Perez-Ruixo JJ, Stuyckens K, Soto-Matos A, Lopez-Lazaro L, Zan-nikos P. Mechanism-based pharmacokinetic/pharmacodynamic meta-analysis of trabectedin (ET-743, Yondelis) induced neutropenia. Clin Pharmacol Ther 2008; 83(1): 130-43.
67. Karlsson MO, Anehall T, Friberg LE, Henningsson A, Kloft C, Sandstrom M et al. Pharmacokinetic/pharmacodynamic modelling in oncological drug de-velopment. Basic Clin Pharmacol Toxicol 2005; 96(3): 206-11.
68. Kathman SJ, Williams DH, Hodge JP, Dar M. A Bayesian population PK-PD model of ispinesib-induced myelosuppression. Clin Pharmacol Ther 2007; 81(1): 88-94.
69. Kathman SJ, Williams DH, Hodge JP, Dar M. A Bayesian population PK-PD model for ispinesib/docetaxel combination-induced myelosuppression. Cancer Chemother Pharmacol 2009; 63(3): 469-76.
70. Kloft C, Wallin J, Henningsson A, Chatelut E, Karlsson MO. Population pharmacokinetic-pharmacodynamic model for neutropenia with patient sub-group identification: comparison across anticancer drugs. Clin Cancer Res 2006; 12(18): 5481-90.
71. Latz JE, Karlsson MO, Rusthoven JJ, Ghosh A, Johnson RD. A semimechanis-tic-physiologic population pharmacokinetic/pharmacodynamic model for neu-tropenia following pemetrexed therapy. Cancer Chemother Pharmacol 2006; 57(4): 412-26.
72. Latz JE, Rusthoven JJ, Karlsson MO, Ghosh A, Johnson RD. Clinical applica-tion of a semimechanistic-physiologic population PK/PD model for neutro-penia following pemetrexed therapy. Cancer Chemother Pharmacol 2006; 57(4): 427-35.
73. Leger F, Loos WJ, Bugat R, Mathijssen RH, Goffinet M, Verweij J et al. Mechanism-based models for topotecan-induced neutropenia. Clin Pharmacol Ther 2004; 76(6): 567-78.
74. Sandström M, Lindman H, Nygren P, Johansson M, Bergh J, Karlsson MO. Population analysis of the pharmacokinetics and the haematological toxicity of the fluorouracil-epirubicin-cyclophosphamide regimen in breast cancer pa-tients. Cancer Chemother Pharmacol 2006; 58(2): 143-56.
75. Sandström M, Lindman H, Nygren P, Lidbrink E, Bergh J, Karlsson MO. Model describing the relationship between pharmacokinetics and hematologic toxicity of the epirubicin-docetaxel regimen in breast cancer patients. J Clin Oncol 2005; 23(3): 413-21.
76. Urso R, Nencini C, Giorgi G, Fiaschi AI. Chemotherapy-induced myelosup-pression by vinorelbine: a comparison between different dose schedules by simulation. Eur Rev Med Pharmacol Sci 2007; 11(6): 413-7.
77. van Kesteren C, Zandvliet AS, Karlsson MO, Mathot RA, Punt CJ, Armand JP et al. Semi-physiological model describing the hematological toxicity of the anti-cancer agent indisulam. Invest New Drugs 2005; 23(3): 225-34.
78. Zandvliet AS, Schellens JH, Beijnen JH, Huitema AD. Population pharma-cokinetics and pharmacodynamics for treatment optimization in clinical oncol-ogy. Clin Pharmacokinet 2008; 47(8): 487-513.

75
79. Zandvliet AS, Schellens JH, Copalu W, Beijnen JH, Huitema AD. A semi-physiological population pharmacokinetic model describing the non-linear dis-position of indisulam. J Pharmacokinet Pharmacodyn 2006; 33(5): 543-70.
80. Zandvliet AS, Schellens JH, Dittrich C, Wanders J, Beijnen JH, Huitema AD. Population pharmacokinetic and pharmacodynamic analysis to support treat-ment optimization of combination chemotherapy with indisulam and car-boplatin. Br J Clin Pharmacol 2008; 66(4): 485-97.
81. Zandvliet AS, Siegel-Lakhai WS, Beijnen JH, Copalu W, Etienne-Grimaldi MC, Milano G et al. PK/PD model of indisulam and capecitabine: interaction causes excessive myelosuppression. Clin Pharmacol Ther 2008; 83(6): 829-39.
82. Chinnaswamy G, Cole M, Boddy AV, Keir M, Price L, Parry A et al. Estima-tion of renal function and its potential impact on carboplatin dosing in children with cancer. Br J Cancer 2008; 99(6): 894-9.
83. Donadio C, Lucchesi A, Ardini M, Cosio S, Fanucchi A, Gadducci A. Dose individualization can minimize nephrotoxicity due to carboplatin therapy in pa-tients with ovarian cancer. Ther Drug Monit 2009; 31(1): 63-9.
84. Joel SP, Shah R, Clark PI, Slevin ML. Predicting etoposide toxicity: relation-ship to organ function and protein binding. J Clin Oncol 1996; 14(1): 257-67.
85. Lichtman SM, Boparai MK. Anticancer drug therapy in the older cancer pa-tient: pharmacology and polypharmacy. Curr Treat Options Oncol 2008; 9(2-3): 191-203.
86. Nguyen L, Chatelut E, Chevreau C, Tranchand B, Lochon I, Bachaud JM et al. Population pharmacokinetics of total and unbound etoposide. Cancer Chemo-ther Pharmacol 1998; 41(2): 125-32.
87. Arbuck SG, Douglass HO, Crom WR, Goodwin P, Silk Y, Cooper C et al. Etoposide pharmacokinetics in patients with normal and abnormal organ func-tion. J Clin Oncol 1986; 4(11): 1690-5.
88. Stewart CF, Arbuck SG, Fleming RA, Evans WE. Changes in the clearance of total and unbound etoposide in patients with liver dysfunction. J Clin Oncol 1990; 8(11): 1874-9.
89. Stewart CF, Fleming RA, Arbuck SG, Evans WE. Prospective evaluation of a model for predicting etoposide plasma protein binding in cancer patients. Cancer Res 1990; 50(21): 6854-6.
90. de Jonge ME, Huitema AD, Schellens JH, Rodenhuis S, Beijnen JH. Individu-alised cancer chemotherapy: strategies and performance of prospective studies on therapeutic drug monitoring with dose adaptation: a review. Clin Pharmacokinet 2005; 44(2): 147-73.
91. Evene E, Chatelut E, Tranchand B, Canal P, Lochon I, Iliadis A et al. [Bayes-ian estimation of pharmacokinetic parameters of etoposide]. Bull Cancer 1997; 84(7): 699-703.
92. Tranchand B, Amsellem C, Chatelut E, Freyer G, Iliadis A, Ligneau B et al. A limited-sampling strategy for estimation of etoposide pharmacokinetics in can-cer patients. Cancer Chemother Pharmacol 1999; 43(4): 316-22.
93. Rousseau A, Marquet P, Debord J, Sabot C, Lachatre G. Adaptive control methods for the dose individualisation of anticancer agents. Clin Pharmacoki-net 2000; 38(4): 315-53.
94. Levy G. Predicting effective drug concentrations for individual patients. De-terminants of pharmacodynamic variability. Clin Pharmacokinet 1998; 34(4): 323-33.
95. Miller AA, Tolley EA, Niell HB. Therapeutic drug monitoring of 21-day oral etoposide in patients with advanced non-small cell lung cancer. Clin Cancer Res 1998; 4(7): 1705-10.

76
96. Ratain MJ, Mick R, Schilsky RL, Vogelzang NJ, Berezin F. Pharmacologically based dosing of etoposide: a means of safely increasing dose intensity. J Clin Oncol 1991; 9(8): 1480-6.
97. Ratain MJ, Schilsky RL, Choi KE, Guarnieri C, Grimmer D, Vogelzang NJ et al. Adaptive control of etoposide administration: impact of interpatient phar-macodynamic variability. Clin Pharmacol Ther 1989; 45(3): 226-33.
98. Bruno R, Hille D, Riva A, Vivier N, ten Bokkel Huinnink WW, van Oosterom AT et al. Population pharmacokinetics/pharmacodynamics of docetaxel in phase II studies in patients with cancer. J Clin Oncol 1998; 16(1): 187-96.
99. O'Shaughnessy J, Miles D, Vukelja S, Moiseyenko V, Ayoub JP, Cervantes G et al. Superior survival with capecitabine plus docetaxel combination therapy in anthracycline-pretreated patients with advanced breast cancer: phase III trial results. J Clin Oncol 2002; 20(12): 2812-23.
100. Henningsson A, Sparreboom A, Sandstrom M, Freijs A, Larsson R, Bergh J et al. Population pharmacokinetic modelling of unbound and total plasma con-centrations of paclitaxel in cancer patients. Eur J Cancer 2003; 39(8): 1105-14.
101. van Warmerdam LJ, ten Bokkel Huinink WW, Rodenhuis S, Koier I, Davies BE, Rosing H et al. Phase I clinical and pharmacokinetic study of topotecan administered by a 24-hour continuous infusion. J Clin Oncol 1995; 13(7): 1768-76.
102. AbbottLaboratories. ABBOTTBASE Pharmacokinetic Systems. In: 1.10 v, (ed). 1.10 ed, 1992.
103. Sheiner LB, Beal S, Rosenberg B, Marathe VV. Forecasting individual phar-macokinetics. Clin Pharmacol Ther 1979; 26(3): 294-305.
104. Bayes T. An Essay Towards Solving a Problem in the Doctrine of Chances. Philos Trans R Soc 1763; 53: 420-426.
105. Jelliffe RW, Schumitzky A, Van Guilder M, Liu M, Hu L, Maire P et al. Indi-vidualizing drug dosage regimens: roles of population pharmacokinetic and dynamic models, Bayesian fitting, and adaptive control. Ther Drug Monit 1993; 15(5): 380-93.
106. Beal SL, Sheiner LB. NONMEM users guides. In. Hanover Maryland: Glo-boMax, Inc., 1989-2006.
107. Jonsson EN, Karlsson MO. Xpose-an S-PLUS based population pharmacoki-netic/pharmacodynamic model building aid for NONMEM. Comput Methods Programs Biomed 1999; 58(1): 51-64.
108. Insightful. S-Plus 6.2 for Windows Professional Edition. In: S-Plus. Build 6713 ed. Seattle, WA, USA: Insightful Corp., 2003.
109. Sheiner LB, Beal SL. Some suggestions for measuring predictive performance. J Pharmacokinet Biopharm 1981; 9(4): 503-12.
110. James WBT. Research on obesity. . Her Majesty's Stationery Office. London. 1976.
111. Karlsson MO, Sheiner LB. The importance of modeling interoccasion variabil-ity in population pharmacokinetic analyses. J Pharmacokinet Biopharm 1993; 21(6): 735-50.
112. Cartwright GE, Athens JW, Wintrobe MM. The Kinetics Of Granulopoiesis In Normal Man. Blood 1964; 24: 780-803.
113. Jonsson EN, Karlsson MO. Automated covariate model building within NONMEM. Pharm Res 1998; 15(9): 1463-8.
114. Sheiner LB. Analysis of pharmacokinetic data using parametric models. III. Hypothesis tests and confidence intervals. J Pharmacokinet Biopharm 1986; 14(5): 539-55.

77
115. Alderson P, Green S, Higgins J. Cochrane Reviewers’ Handbook 4.2.2 [up-dated December 2003]. In, 2003.
116. Juul S. Epidemiologi og evidens, 1 edn Munksgaard: Copenhagen, 2004. 117. Hooker AC, Staatz CE, Karlsson MO. Conditional weighted residuals
(CWRES): a model diagnostic for the FOCE method. Pharm Res 2007; 24(12): 2187-97.
118. Toffoli G, Corona G, Sorio R, Robieux I, Basso B, Colussi AM et al. Popula-tion pharmacokinetics and pharmacodynamics of oral etoposide. Br J Clin Pharmacol 2001; 52(5): 511-9.
119. FDA. Vepesid (Bristol Myers-Squibb) Approved Drug Label NDA 018768. In: Research FCfDEa, (ed). Washington DC: FDA, 1999.
120. Hood G. PopTools. In. Internet resource; www.csiro.au.org/poptools: CSIRO, 2007.
121. Dormand JR, Prince PJ. A family of embedded Runge-Kutta formulae. J Comp Appl Math 1980; 6: 19-26.
122. del Mar Fernandez De Gatta M, Santos-Buelga D, Dominguez-Gil A, Garcia MJ. Immunosuppressive therapy for paediatric transplant patients: pharma-cokinetic considerations. Clin Pharmacokinet 2002; 41(2): 115-35.
123. Kahan BD, Keown P, Levy GA, Johnston A. Therapeutic drug monitoring of immunosuppressant drugs in clinical practice. Clin Ther 2002; 24(3): 330-50; discussion 329.
124. Lindholm A, Sawe J. Pharmacokinetics and therapeutic drug monitoring of immunosuppressants. Ther Drug Monit 1995; 17(6): 570-3.
125. Oellerich M, Armstrong VW. The role of therapeutic drug monitoring in indi-vidualizing immunosuppressive drug therapy: recent developments. Ther Drug Monit 2006; 28(6): 720-5.
126. Pons G, Treluyer JM, Dimet J, Merle Y. Potential benefit of Bayesian forecast-ing for therapeutic drug monitoring in neonates. Ther Drug Monit 2002; 24(1): 9-14.
127. Tsunoda SM, Aweeka FT. The use of therapeutic drug monitoring to optimise immunosuppressive therapy. Clin Pharmacokinet 1996; 30(2): 107-40.
128. Wong SH. Therapeutic drug monitoring for immunosuppressants. Clin Chim Acta 2001; 313(1-2): 241-53.
129. Oellerich M, Barten MJ, Armstrong VW. Biomarkers: the link between thera-peutic drug monitoring and pharmacodynamics. Ther Drug Monit 2006; 28(1): 35-8.
130. Soldin SJ. Role of immunophilins in therapeutic drug monitoring of immuno-suppressive drugs. Clin Biochem 1998; 31(5): 381-4.
131. Yatscoff RW, Aspeslet LJ, Gallant HL. Pharmacodynamic monitoring of im-munosuppressive drugs. Clin Chem 1998; 44(2): 428-32.
132. Staatz CE, Tett SE. Comparison of two population pharmacokinetic programs, NONMEM and P-PHARM, for tacrolimus. Eur J Clin Pharmacol 2002; 58(9): 597-605.
133. Scholten EM, Cremers SC, Schoemaker RC, Rowshani AT, van Kan EJ, den Hartigh J et al. AUC-guided dosing of tacrolimus prevents progressive sys-temic overexposure in renal transplant recipients. Kidney Int 2005; 67(6): 2440-7.
134. Staatz CE, Tett SE. Clinical pharmacokinetics and pharmacodynamics of tac-rolimus in solid organ transplantation. Clin Pharmacokinet 2004; 43(10): 623-53.
135. Holford NH. A size standard for pharmacokinetics. Clin Pharmacokinet 1996; 30(5): 329-32.

78
136. Cacciarelli TV, Esquivel CO, Cox KL, Hayashi M, Berquist WE, Concepcion W et al. Oral tacrolimus (FK506) induction therapy in pediatric orthotopic liver transplantation. Transplantation 1996; 61(8): 1188-92.
137. Jain AB, Fung JJ, Tzakis AG, Venkataramanan R, Abu-Elmagd K, Alessiani M et al. Comparative study of cyclosporine and FK 506 dosage requirements in adult and pediatric orthotopic liver transplant patients. Transplant Proc 1991; 23(6): 2763-6.
138. Kim JS, Aviles DH, Silverstein DM, Leblanc PL, Matti Vehaskari V. Effect of age, ethnicity, and glucocorticoid use on tacrolimus pharmacokinetics in pedi-atric renal transplant patients. Pediatr Transplant 2005; 9(2): 162-9.
139. Moreno M, Manzanares C, Castellano F, Medina E, Urruzuno P, Camarena C et al. Monitoring of tacrolimus as rescue therapy in pediatric liver transplanta-tion. Ther Drug Monit 1998; 20(4): 376-9.
140. Shishido S, Asanuma H, Tajima E, Honda M, Nakai H. Pharmacokinetics of tacrolimus in pediatric renal transplant recipients. Transplant Proc 2001; 33(1-2): 1066-8.
141. Björkman S. Prediction of cytochrome p450-mediated hepatic drug clearance in neonates, infants and children : how accurate are available scaling methods? Clin Pharmacokinet 2006; 45(1): 1-11.
142. Karlsson MO, Lutsar I, Milligan PA. Population pharmacokinetic analysis of voriconazole plasma concentration data from pediatric studies. Antimicrob Agents Chemother 2009; 53(3): 935-44.
143. Robie-Suh K. NDA 20-883/SE8-014 Argatroban Injection, Pediatric labeling supplement. In: Center for Drug Evaluation and Research F, (ed). Silver Spring, MD: FDA, 2008.
144. Rousseau A, Marquet P. Application of pharmacokinetic modelling to the routine therapeutic drug monitoring of anticancer drugs. Fundam Clin Phar-macol 2002; 16(4): 253-62.
145. Conley BA, Egorin MJ, Sinibaldi V, Sewack G, Kloc C, Roberts L et al. Ap-proaches to optimal dosing of hexamethylene bisacetamide. Cancer Chemother Pharmacol 1992; 31(1): 37-45.
146. Bergh J, Wiklund T, Erikstein B, Lidbrink E, Lindman H, Malmstrom P et al. Tailored fluorouracil, epirubicin, and cyclophosphamide compared with mar-row-supported high-dose chemotherapy as adjuvant treatment for high-risk breast cancer: a randomised trial. Scandinavian Breast Group 9401 study. Lan-cet 2000; 356(9239): 1384-91.
147. Batey MA, Wright JG, Azzabi A, Newell DR, Lind MJ, Calvert AH et al. Population pharmacokinetics of adjuvant cyclophosphamide, methotrexate and 5-fluorouracil (CMF). Eur J Cancer 2002; 38(8): 1081-9.
148. Freyer G, Tranchand B, Ligneau B, Ardiet C, Souquet PJ, Court-Fortune I et al. Population pharmacokinetics of doxorubicin, etoposide and ifosfamide in small cell lung cancer patients: results of a multicentre study. Br J Clin Phar-macol 2000; 50(4): 315-24.
149. Leger F, Loos WJ, Fourcade J, Bugat R, Goffinet M, Mathijssen RH et al. Factors affecting pharmacokinetic variability of oral topotecan: a population analysis. Br J Cancer 2004; 90(2): 343-7.
150. Sheiner LB, Tozer TN. Clinical pharmacokinetics: The use of plasma concen-trations of drugs. In: Melmon KL, Morelli HF (eds). Clinical Pharmacology: Basic Principles of Therapeutics. Macmillan: New York, 1978, pp 71-109.

79
151. Taright N, Mentre F, Mallet A, Jouvent R. Nonparametric estimation of popu-lation characteristics of the kinetics of lithium from observational and experi-mental data: individualization of chronic dosing regimen using a new Bayesian approach. Ther Drug Monit 1994; 16(3): 258-69.
152. Bayard DS, Milman MH, Schumitzky A. Design of dosage regimens: a multi-ple model stochastic control approach. Int J Biomed Comput 1994; 36(1-2): 103-15.
153. Jelliffe RW, Schumitzky A, Bayard D, Milman M, Van Guilder M, Wang X et al. Model-based, goal-oriented, individualised drug therapy. Linkage of popu-lation modelling, new 'multiple model' dosage design, bayesian feedback and individualised target goals. Clin Pharmacokinet 1998; 34(1): 57-77.
154. Holford NH. Target concentration intervention: beyond Y2K. Br J Clin Phar-macol 2001; 52 Suppl 1: 55S-59S.
155. Kraiczi H, Jang T, Ludden T, Peck CC. Randomized concentration-controlled trials: motivations, use, and limitations. Clin Pharmacol Ther 2003; 74(3): 203-14.
156. Aggarwal C, Gupta S, Vaughan WP, Saylors GB, Salzman DE, Katz RO et al. Improved outcomes in intermediate- and high-risk aggressive non-Hodgkin lymphoma after autologous hematopoietic stem cell transplantation substituting intravenous for oral busulfan in a busulfan, cyclophosphamide, and etoposide preparative regimen. Biol Blood Marrow Transplant 2006; 12(7): 770-7.
157. Booth BP, Rahman A, Dagher R, Griebel D, Lennon S, Fuller D et al. Popula-tion pharmacokinetic-based dosing of intravenous busulfan in pediatric pa-tients. J Clin Pharmacol 2007; 47(1): 101-11.
158. Bornhauser M, Storer B, Slattery JT, Appelbaum FR, Deeg HJ, Hansen J et al. Conditioning with fludarabine and targeted busulfan for transplantation of al-logeneic hematopoietic stem cells. Blood 2003; 102(3): 820-6.
159. de Jonge ME, Huitema AD, Tukker AC, van Dam SM, Rodenhuis S, Beijnen JH. Accuracy, feasibility, and clinical impact of prospective Bayesian pharma-cokinetically guided dosing of cyclophosphamide, thiotepa, and carboplatin in high-dose chemotherapy. Clin Cancer Res 2005; 11(1): 273-83.
160. Evans WE, Pratt CB, Taylor RH, Barker LF, Crom WR. Pharmacokinetic monitoring of high-dose methotrexate. Early recognition of high-risk patients. Cancer Chemother Pharmacol 1979; 3(3): 161-6.
161. Evans WE, Relling MV, Rodman JH, Crom WR, Boyett JM, Pui CH. Conven-tional compared with individualized chemotherapy for childhood acute lym-phoblastic leukemia. N Engl J Med 1998; 338(8): 499-505.
162. Grochow LB. Busulfan disposition: the role of therapeutic monitoring in bone marrow transplantation induction regimens. Semin Oncol 1993; 20(4 Suppl 4): 18-25; quiz 26.
163. McCune JS, Gibbs JP, Slattery JT. Plasma concentration monitoring of busul-fan: does it improve clinical outcome? Clin Pharmacokinet 2000; 39(2): 155-65.
164. Absalom AR, Kenny GN. Closed-loop control of propofol anaesthesia using bispectral index: performance assessment in patients receiving computer-controlled propofol and manually controlled remifentanil infusions for minor surgery. Br J Anaesth 2003; 90(6): 737-41.
165. Absalom AR, Sutcliffe N, Kenny GN. Closed-loop control of anesthesia using Bispectral index: performance assessment in patients undergoing major ortho-pedic surgery under combined general and regional anesthesia. Anesthesiology 2002; 96(1): 67-73.

80
166. Agarwal J, Puri GD, Mathew PJ. Comparison of closed loop vs. manual ad-ministration of propofol using the Bispectral index in cardiac surgery. Acta Anaesthesiol Scand 2009; 53(3): 390-7.
167. De Smet T, Struys MM, Greenwald S, Mortier EP, Shafer SL. Estimation of optimal modeling weights for a Bayesian-based closed-loop system for propo-fol administration using the bispectral index as a controlled variable: a simula-tion study. Anesth Analg 2007; 105(6): 1629-38, table of contents.
168. Leslie K, Absalom A, Kenny GN. Closed loop control of sedation for colono-scopy using the Bispectral Index. Anaesthesia 2002; 57(7): 693-7.
169. Morley A, Derrick J, Mainland P, Lee BB, Short TG. Closed loop control of anaesthesia: an assessment of the bispectral index as the target of control. An-aesthesia 2000; 55(10): 953-9.
170. Puri GD, Kumar B, Aveek J. Closed-loop anaesthesia delivery system (CLADS) using bispectral index: a performance assessment study. Anaesth In-tensive Care 2007; 35(3): 357-62.
171. Struys MM, De Smet T, Greenwald S, Absalom AR, Binge S, Mortier EP. Performance evaluation of two published closed-loop control systems using bispectral index monitoring: a simulation study. Anesthesiology 2004; 100(3): 640-7.
172. Struys MM, De Smet T, Versichelen LF, Van De Velde S, Van den Broecke R, Mortier EP. Comparison of closed-loop controlled administration of propofol using Bispectral Index as the controlled variable versus "standard practice" controlled administration. Anesthesiology 2001; 95(1): 6-17.
173. Doi SA. Pharmacodynamic optimization of warfarin therapy II. Am J Ther 2001; 8(1): 41-7.
174. Cook CB, Mann LJ, King EC, New KM, Vaughn PS, Dames FD et al. Man-agement of insulin therapy in urban diabetes patients is facilitated by use of an intelligent dosing system. Diabetes Technol Ther 2004; 6(3): 326-35.
175. Cook CB, McMichael JP, Lieberman R, Mann LJ, King EC, New KM et al. The Intelligent Dosing System: application for insulin therapy and diabetes management. Diabetes Technol Ther 2005; 7(1): 58-71.
176. Pollak PT, Shafer SL. Use of population modeling to define rational monitor-ing of amiodarone hepatic effects. Clin Pharmacol Ther 2004; 75(4): 342-51.
177. Sandström M, Karlsson MO, Ljungman P, Hassan Z, Jonsson EN, Nilsson C et al. Population pharmacokinetic analysis resulting in a tool for dose individuali-zation of busulphan in bone marrow transplantation recipients. Bone Marrow Transplant 2001; 28(7): 657-64.


����*� (��� �� ��*��� ��� ����������� �������������� ������������������� ������� ������������������� �������
+ ���&�,��������-�����.�%��/��-�0����/
��������� ������ ���-��������.�%��/��-�0����/1�*����*� (��� �/1� ��%�%��/���%���/��-���%�'����-������2���-�3��� ����-�������������� ������ ������4�������5����3� ����������� '�� ��1�3� ��������%���/������ �� ��� '%�� ������ ����/�����%6��������� ���� 6 ���7��������� (��%��� ����-�*������ ������ ����-��������.�%��/��-0����/2�80� ��������%�/1�!))�1�������� ���3���%'� ���%��������� ����97��������� (���%��� ����-�*����� ������ ����-��������.�%��/��-�0����/:2;
� ��� '%� ��&��%'� �� ���2%%2��%��&�'�&��&%%& ( �))���
������������������� ���������� �
����