collection and use of local data to end tuberculosis - Ted ...
Paper
EVALUATION OF TOTAL EFFECTIVE DOSE DUE TO CERTAINENVIRONMENTALLY PLACED NATURALLY OCCURRING
RADIOACTIVE MATERIALS USING A PROCEDURALADAPTATION OF RESRAD CODE
Z. S. Beauvais, K. H. Thompson, and K. J. Kearfott*
Abstract—Due to a recent upward trend in the price ofuranium and subsequent increased interest in uranium min-ing, accurate modeling of baseline dose from environmentalsources of radioactivity is of increasing interest. Residualradioactivity model and code (RESRAD) is a program used tomodel environmental movement and calculate the dose due tothe inhalation, ingestion, and exposure to radioactive materialsfollowing a placement. This paper presents a novel use ofRESRAD for the calculation of dose from non-enhanced, orancient, naturally occurring radioactive material (NORM). Inorder to use RESRAD to calculate the total effective dose(TED) due to ancient NORM, a procedural adaptation wasdeveloped to negate the effects of time progressive distributionof radioactive materials. A dose due to United States’ averageconcentrations of uranium, actinium, and thorium series ra-dionuclides was then calculated. For adults exposed in aresidential setting and assumed to eat significant amounts offood grown in NORM concentrated areas, the annual dose dueto national average NORM concentrations was 0.935 mSv y�1.A set of environmental dose factors were calculated for simpleestimation of dose from uranium, thorium, and actinium seriesradionuclides for various age groups and exposure scenarios asa function of elemental uranium and thorium activity concen-trations in groundwater and soil. The values of these factorsfor uranium were lowest for an adult exposed in an industrialsetting: 0.00476 �Sv kg Bq�1 y�1 for soil and 0.00596 �Sv m3
Bq�1 y�1 for water (assuming a 1:1 234U:238U activity ratio inwater). The uranium factors were highest for infants exposedin a residential setting and assumed to ingest food grownonsite: 34.8 �Sv kg Bq�1 y�1 in soil and 13.0 �Sv m3 Bq�1 y�1
in water.Health Phys. 97(1):50–67; 2009
Key words: modeling, dose assessment; modeling, environmen-tal; naturally occurring radionuclides; exposure, population
INTRODUCTION
ScopeA number of reports review the annual radiation
dose and risk to humans from various natural, artifi-cial, and naturally occurring technologically enhancedsources of radioactive materials (Klement et al. 1972;NCRP 1987a and c; UNSCEAR 2000; NRC 1999a).Other reports have focused on dose from exposures tonaturally occurring radioactive material (NORM) (NRC1999b; NCRP 1987b). A 1972 report from the UnitedStates Environmental Protection Agency (EPA) esti-mated the annual dose from natural radiation in theUnited States to be 1.30 mSv y�1 (Klement et al. 1972).The 2000 report of the United Nations Scientific Com-mittee on the Effects of Atomic Radiation (UNSCEAR)gives the worldwide average effective dose due toexposure to natural sources of radiation as 2.4 mSv y�1
(UNSCEAR 2000). Other estimates of dose due tonatural radioactivity give a range from 3 to 4.5 mSv y�1
(Wilson 1993). Additionally, major contributions to thenatural background doses reported in the literature areattributed to exposure to terrestrial sources of actinium,uranium, and thorium series radionuclides, with particu-lar emphasis on the inhalation of radon and its decayprogeny (NRC 1999a and b; Wilson 1993). Likewise,several reports have tabulated the concentrations ofactinium, uranium, and thorium series radionuclides ingroundwater and surface soil, often at levels of importanceand concern (Cooper 1958; Hoffman and Buttleman 1994;Cothern and Lappenbusch 1983; Cothern and Rebers 1990;Myrick 1983; Hackonson-Hayes et al. 2002; Ramli et al.2005; Hughes et al. 2005).
Precise and accurate computer models of environ-mental movement and dose computation are required toassess the doses and relative biological impacts associ-ated with terrestrial NORM concentrations. Moreover, itis important that the computer models consider bothexternal sources and internal sources of radioactivity.
* Nuclear Engineering and Radiological Sciences Department,University of Michigan–Ann Arbor, 1943 Cooley Laboratory, 2355Bonisteel Boulevard, Ann Arbor, MI 48109-2104.
For correspondence contact: K. Kearfott at the above address, oremail at [email protected].
(Manuscript accepted 5 February 2009)0017-9078/09/0Copyright © 2009 Health Physics Society
50
Internal sources, such as radioactive materials that enterthe body through the ingestion of contaminated plant andanimal foodstuffs, are an essential dose pathway for theconsideration of residential exposure scenarios. Severalcomputer programs exist for similar purposes of dosecomputation including Dose and Risk Calculation(DCAL), Prediction of Radiological Effects due to Shal-low Trench Operations (PRESTO), IMPACTS—BelowRegulatory Concern (IMPACTS-BRC), PATHRAE, andResidual Radioactivity (RESRAD) (Eckerman 2007;Darnell et al. 1991; Robinson et al. 1987; Cheng and Yu1993; Klein et al. 1987; Yu et al. 2001).
DCAL, developed for the EPA, is a very powerfuldose calculation tool for, among other uses, the compu-tation of dose coefficients. However, DCAL lacks mod-els for environmental distribution and requires a higherdegree of user expertise than is desired for this applica-tion. PATHRAE and PRESTO, computer codes generallyrestricted for use within the EPA, do include environ-mental distribution models but require much user inputand expertise as well. RESRAD code, though extensivelyused for modeling of artificially placed radionuclides, isnot designed to, nor has it been used to, model environ-mentally placed, non-technologically enhanced NORM,hereafter referred to as ancient NORM. However RESRADis a free, publicly available code with extensive bench-marking of its dose computation and environmentalmodels, and has become an industry standard of residualradioactivity modeling (Faillace et al. 1994; Rittmann1995). RESRAD also models the time progression ofradioactive materials in an environment, a feature vital tomany applications, but inherently contradictory to thenature of ancient NORM; thus, an adaptation ofRESRAD is required to model ancient NORM.
There has been an increased interest in uraniumprospecting over the past few years resulting from boththe rise in uranium ore market prices from under 10 USDin 2002 to 135 USD in 2005, and the renewed worldwideinterest in nuclear power (Murphy 2008). With newuranium mining operations, accurate baseline radiationdose assessments for areas yet unaffected by uraniummining become a necessity because of potential environ-mental impacts (Rahn et al. 1996; Mudd 2001). Logi-cally, ancient NORM concentrations are high in mostareas of interest for uranium mining. The potentially highancient NORM concentrations and their correspondingbackground doses could disallow the development ofmining facilities on such sites on the basis of public andoccupational safety. This work presents a proceduraladaptation of RESRAD code for novel use in calculationof total effective dose (TED) due to ancient NORM. TEDis the sum of the internal and external components to theeffective dose, whereas committed effective dose (CED)
includes only contributions from internal components.The nomenclature reflects the use of International Com-mission on Radiological Protection (ICRP) Publication72 dose coefficients throughout this work (ICRP 1995a,1996). Additionally, a method is presented which usesthe procedural adaptation of RESRAD to compute fac-tors that can be used to directly estimate the annual TEDdue to chronic exposures to ancient NORM based onactivity concentrations in soil and groundwater. Thesefactors are defined as environmental dose factors (EDFs).The EDFs for uranium and thorium in soil and ground-water have been calculated and are presented for variousexposure scenarios and age groups ranging from infant toadult. Both the procedural adaptation of RESRAD andEDFs could be used to aid in baseline dose assessmentsfor uranium mining or to calculate or estimate thebiological implications of ancient NORM.
Background information on RESRADThe RESRAD computer code was used for bio-
sphere modeling and dose computations in this research.RESRAD was developed by the Environmental Assess-ment Division at Argonne National Laboratory as a toolto aid in the development of cleanup criteria for residualradioactive materials, but it is also used to conductsite-specific dose assessments for observed and mea-sured radionuclide concentrations (Yu et al. 2001). Theeffective dose per unit intake or exposure for residual andenvironmental radioactivity is the same from an unnatu-ral source as from a naturally occurring and naturallyplaced source.
Beyond the calculation of dose due to a givenconcentration profile of radioactive materials, RESRADis renowned and extensively utilized for its models ofenvironmental distribution and migration of radioactivematerials throughout the environment with time. Assuch, a RESRAD site assessment models many factors,including the percolation of water through contaminatedsoil, the uptake of radioactive materials from both soiland water into plant food sources, and the exhalation ofradon from soil. RESRAD dose estimations are reportedby contributing pathway and by radionuclide, allowingeasy manipulation and analysis.
For the calculation of effective dose due to back-ground NORM at a given site, it is essential to accuratelymodel the distribution of radioactive materials through-out the site. Although the distributions of backgroundNORM and that of residual radioactivity differ by natureof the times that the respective concentrations are al-lowed to diffuse through the environment, they sharemany similarities if properly considered. In contrast toresidual radioactivity, ancient NORM radionuclides in a
51Dose and NORM ● Z. S. BEAUVAIS ET AL.
decay series should be in, or nearly in, secular equilib-rium with the head of the series. For example, all progenyin the actinium series are in secular equilibrium with235U. This was the assumption for most hypotheticalsituations calculated and considered for this project. Theassumption of secular equilibrium was only disregardedfor certain calculations of dose in which a variableactivity ratio between 234U and 238U was considered.RESRAD allows the user to input radionuclide concen-trations in soil and water reflecting this assumption andconsequently carries these concentrations, reflective ofsecular equilibrium, through its environmental distribu-tion models.
The radiation dose calculated by RESRAD for agiven site is organized in the output by the pathway inwhich it is received. The results presented in this paperreflect this by separating the annual TED into its respec-tive contributions for each radionuclide and pathway.Pathways are further separated into water independentpathways, for which the dose depends upon the soilradionuclide concentrations, and water dependent path-ways, for which the dose depends upon the radionuclideconcentration in groundwater (Yu et al. 2001).
The water independent pathways are as follows:“Ground,” the dose due to external exposure; “Inhala-tion,” the dose due to non-radon inhalation of particulates;“Radon,” the dose due to the inhalation of terrestrial radon;“Plant,” the dose due to ingestion of vegetables grown inradioactive soils; “Meat,” the dose due to ingestion ofmeat contaminated with radioactive materials; “Milk,”the dose due to ingestion of milk contaminated withradioactive materials; and “Soil,” the dose due to inad-vertent ingestion of soil containing radionuclides (Yu etal. 2001). The water dependent pathways are as follows:“Water,” the dose due to ingestion of water containingradionuclides; “Fish,” the dose due to ingestion ofaquatic animals containing radionuclides; “Radon,” thedose due to inhalation of radon released from watersources; “Plant,” the dose due to ingestion of vegetablesgrown with water containing radionuclides; “Meat,” thedose due to the ingestion of meat from animals that drankwater contaminated with radionuclides; and “Milk,” thedose due to the ingestion of milk from animals that drankwater contaminated with radionuclides (Yu et al. 2001).
In the same way as residual radioactive materials,RESRAD will model the movement of ancient NORMinto food sources through soil and water, into homesthrough radon exhalation, and into each of the multiplepathways considered by RESRAD. Since the timesrequired for uniform distribution of radioactive materialsinto food sources and the clearance rates of air within ahome are short relative to the time that the site has been
contaminated with either NORM or the residual radioac-tivity, those models hold.
Related to the assumption of secular equilibrium, itis assumed that the concentrations of background NORMare constant for a specific site. The TED calculated byRESRAD reflects a time integration of dose over aone-year period in which RESRAD models the move-ment and decay of the radionuclides present. Thus, underthe default procedure, the TED calculated by RESRADreflects a variable concentration in violation of theassumption for ancient NORM. In order to more accu-rately calculate the dose due to a constant concentrationof radioactive material, which is the case for ancientNORM, a procedural adaptation of RESRAD is required.
In RESRAD, annual dose and risk are numericallyintegrated over a specified number of time intervalsduring the year, which reflect modeled movements ofradioactive materials in the environment to reflect achronic exposure throughout the year. The concentra-tions used for these dose calculations differ from thoseentered by the user. The default setting for integration ofdose and risk over 17 and 257 points, respectively, mayensure precision for certain applications of RESRAD.For assessment of ancient NORM, this default integra-tion is inappropriate.
In order to directly enter a radionuclide water concen-tration in RESRAD, the user must specify a “Time SinceMaterial Placement” (TI). Since RESRAD is primarily usedto model the movement of radioactive materials following aspill, leak, or artificial placement, the use of a TI stands toreason. However, with respect to ancient NORM and thegeneral assumption of time constant concentration, a TIcannot be determined and has no true meaning. Addition-ally, 238U and 232Th are primordial in origin and the timesince their placement into the environment is not relevantand outside of the scope of possibility for modeling.RESRAD is designed with the assumption that the radionu-clide concentration in groundwater is due to the leaching ofradioactive materials through the soil. This assumption can beoverridden with the input of a TI and a water concentration,although the TI must agree with the input water concentrationor else the code is designed to override the user specifiedconcentration and compute one based on the leaching from thesoil (Yu et al. 2001). Once again, the need for a proceduraladaptation of RESRAD to more accurately estimate dose dueto ancient NORM is discussed in the methods.
MATERIALS AND METHODS
Hardware and softwareFor this work, RESRAD calculations were con-
ducted using RESRAD version 6.4 (RESRAD 6.4, Ar-gonne National Laboratory, 9700 South Cass Avenue,
52 Health Physics July 2009, Volume 97, Number 1
EVS/900, Argonne, IL 60439) on a 1.2 GHz personalcomputer (Dell Inspiron E1405, Dell Inc., 1 Dell Way,Round Rock, TX 78682). Data were collected andanalyzed using standard, commercially available spread-sheet software (Microsoft Excel, Microsoft Corporation,version 11.3.7, 1 Microsoft Way, Redmond, WA 98073).Within its library, RESRAD version 6.4 contains doseconversion factors (DCFs) from a variety of sources. Allrelevant calculations performed for this project used theICRP 72 age-dependent DCFs, excluding those for radonand its decay products. RESRAD calculations of dosedue to inhalation of 222Rn and 220Rn use dose coefficientsbased upon the Committee on the Biological Effects ofIonizing Radiation (BEIR) report IV and ICRP publica-tions 32 and 47 (ICRP 1981, 1986; NRC 1988; Yu et al.2001). The radon DCFs are not age-dependent in thattheir values remain constant for the various age-dependent DCF libraries in RESRAD.
Selection of parametersSoil and water activity concentrations, hydrology
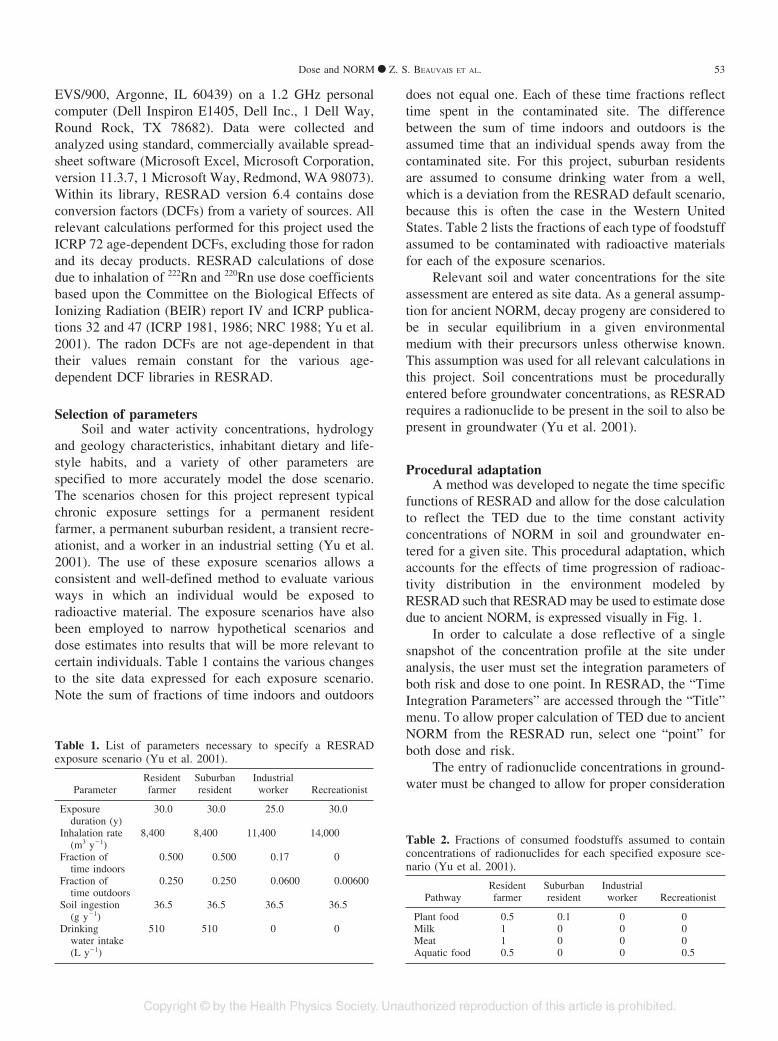
and geology characteristics, inhabitant dietary and life-style habits, and a variety of other parameters arespecified to more accurately model the dose scenario.The scenarios chosen for this project represent typicalchronic exposure settings for a permanent residentfarmer, a permanent suburban resident, a transient recre-ationist, and a worker in an industrial setting (Yu et al.2001). The use of these exposure scenarios allows aconsistent and well-defined method to evaluate variousways in which an individual would be exposed toradioactive material. The exposure scenarios have alsobeen employed to narrow hypothetical scenarios anddose estimates into results that will be more relevant tocertain individuals. Table 1 contains the various changesto the site data expressed for each exposure scenario.Note the sum of fractions of time indoors and outdoors
does not equal one. Each of these time fractions reflecttime spent in the contaminated site. The differencebetween the sum of time indoors and outdoors is theassumed time that an individual spends away from thecontaminated site. For this project, suburban residentsare assumed to consume drinking water from a well,which is a deviation from the RESRAD default scenario,because this is often the case in the Western UnitedStates. Table 2 lists the fractions of each type of foodstuffassumed to be contaminated with radioactive materialsfor each of the exposure scenarios.
Relevant soil and water concentrations for the siteassessment are entered as site data. As a general assump-tion for ancient NORM, decay progeny are considered tobe in secular equilibrium in a given environmentalmedium with their precursors unless otherwise known.This assumption was used for all relevant calculations inthis project. Soil concentrations must be procedurallyentered before groundwater concentrations, as RESRADrequires a radionuclide to be present in the soil to also bepresent in groundwater (Yu et al. 2001).
Procedural adaptationA method was developed to negate the time specific
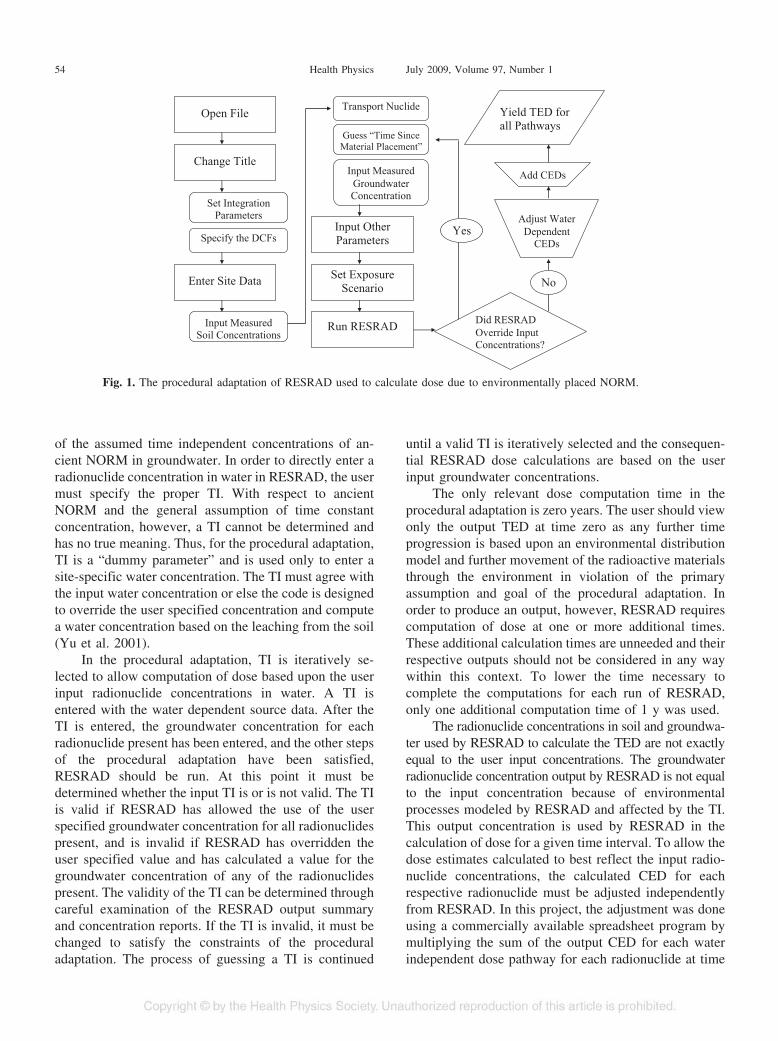
functions of RESRAD and allow for the dose calculationto reflect the TED due to the time constant activityconcentrations of NORM in soil and groundwater en-tered for a given site. This procedural adaptation, whichaccounts for the effects of time progression of radioac-tivity distribution in the environment modeled byRESRAD such that RESRAD may be used to estimate dosedue to ancient NORM, is expressed visually in Fig. 1.
In order to calculate a dose reflective of a singlesnapshot of the concentration profile at the site underanalysis, the user must set the integration parameters ofboth risk and dose to one point. In RESRAD, the “TimeIntegration Parameters” are accessed through the “Title”menu. To allow proper calculation of TED due to ancientNORM from the RESRAD run, select one “point” forboth dose and risk.
The entry of radionuclide concentrations in ground-water must be changed to allow for proper consideration
Table 2. Fractions of consumed foodstuffs assumed to containconcentrations of radionuclides for each specified exposure sce-nario (Yu et al. 2001).
PathwayResidentfarmer
Suburbanresident
Industrialworker Recreationist
Plant food 0.5 0.1 0 0Milk 1 0 0 0Meat 1 0 0 0Aquatic food 0.5 0 0 0.5
Table 1. List of parameters necessary to specify a RESRADexposure scenario (Yu et al. 2001).
ParameterResidentfarmer
Suburbanresident
Industrialworker Recreationist
Exposureduration (y)
30.0 30.0 25.0 30.0
Inhalation rate(m3 y�1)
8,400 8,400 11,400 14,000
Fraction oftime indoors
0.500 0.500 0.17 0
Fraction oftime outdoors
0.250 0.250 0.0600 0.00600
Soil ingestion(g y�1)
36.5 36.5 36.5 36.5
Drinkingwater intake(L y�1)
510 510 0 0
53Dose and NORM ● Z. S. BEAUVAIS ET AL.
of the assumed time independent concentrations of an-cient NORM in groundwater. In order to directly enter aradionuclide concentration in water in RESRAD, the usermust specify the proper TI. With respect to ancientNORM and the general assumption of time constantconcentration, however, a TI cannot be determined andhas no true meaning. Thus, for the procedural adaptation,TI is a “dummy parameter” and is used only to enter asite-specific water concentration. The TI must agree withthe input water concentration or else the code is designedto override the user specified concentration and computea water concentration based on the leaching from the soil(Yu et al. 2001).
In the procedural adaptation, TI is iteratively se-lected to allow computation of dose based upon the userinput radionuclide concentrations in water. A TI isentered with the water dependent source data. After theTI is entered, the groundwater concentration for eachradionuclide present has been entered, and the other stepsof the procedural adaptation have been satisfied,RESRAD should be run. At this point it must bedetermined whether the input TI is or is not valid. The TIis valid if RESRAD has allowed the use of the userspecified groundwater concentration for all radionuclidespresent, and is invalid if RESRAD has overridden theuser specified value and has calculated a value for thegroundwater concentration of any of the radionuclidespresent. The validity of the TI can be determined throughcareful examination of the RESRAD output summaryand concentration reports. If the TI is invalid, it must bechanged to satisfy the constraints of the proceduraladaptation. The process of guessing a TI is continued
until a valid TI is iteratively selected and the consequen-tial RESRAD dose calculations are based on the userinput groundwater concentrations.
The only relevant dose computation time in theprocedural adaptation is zero years. The user should viewonly the output TED at time zero as any further timeprogression is based upon an environmental distributionmodel and further movement of the radioactive materialsthrough the environment in violation of the primaryassumption and goal of the procedural adaptation. Inorder to produce an output, however, RESRAD requirescomputation of dose at one or more additional times.These additional calculation times are unneeded and theirrespective outputs should not be considered in any waywithin this context. To lower the time necessary tocomplete the computations for each run of RESRAD,only one additional computation time of 1 y was used.
The radionuclide concentrations in soil and groundwa-ter used by RESRAD to calculate the TED are not exactlyequal to the user input concentrations. The groundwaterradionuclide concentration output by RESRAD is not equalto the input concentration because of environmentalprocesses modeled by RESRAD and affected by the TI.This output concentration is used by RESRAD in thecalculation of dose for a given time interval. To allow thedose estimates calculated to best reflect the input radio-nuclide concentrations, the calculated CED for eachrespective radionuclide must be adjusted independentlyfrom RESRAD. In this project, the adjustment was doneusing a commercially available spreadsheet program bymultiplying the sum of the output CED for each waterindependent dose pathway for each radionuclide at time
Open File
Change Title
Enter Site Data
Set Integration Parameters
Specify the DCFs
Input Measured Soil Concentrations
Transport Nuclide
Guess “Time Since Material Placement”
Input Measured GroundwaterConcentration
Input Other Parameters
Set Exposure Scenario
Run RESRAD Did RESRAD Override Input Concentrations?
Adjust Water Dependent
CEDs
Add CEDs
Yield TED for all Pathways
Yes
No
Fig. 1. The procedural adaptation of RESRAD used to calculate dose due to environmentally placed NORM.
54 Health Physics July 2009, Volume 97, Number 1
zero by the quotient of the respective user input soilconcentration and the soil concentration used byRESRAD in its calculation. The surface soil concentra-tion used in the RESRAD calculations is listed in theresulting “Concentration Report.”
For the proscribed procedural adaptation ofRESRAD, the water dependent pathway is adjustedsimilarly. The adjusted water dependent dose for a givenradionuclide is equal to the product of the sum of theCEDs for all water dependent pathways multiplied by thequotient of the user input groundwater concentration andthe groundwater concentration used by RESRAD, asfound in the “Concentration Report.” The adjusted TEDfor all pathways and media is equal to the sum of theadjusted TED for all radionuclides present for both thewater dependant and water independent pathways.
The dependence on TI of the radionuclide concen-trations used by RESRAD, and likewise the need toadjust the calculated TED, is studied quantitatively inthis work. For a resident farmer scenario and a givenconcentration profile, the TI is varied from 2 to 12 y, inincrements of 2 y. Each of the radionuclides in theuranium series with half-lives longer than 180 d, includ-ing 210Pb, 226Ra, 230Th, 234U, and 238U, is given a 1 Bq g�1
activity concentration in soil, and RESRAD was run forboth 1 and 2 Bq L�1 activity concentrations in water. Thecalculated concentrations were compared to their userinput values.
Test cases for procedural adaptationUsing the procedural adaptation, a TED due to the
average concentrations of ancient NORM in the UnitedStates was calculated for adults and infants based on aresident farmer exposure scenario. The United Statesaverage soil concentrations, as used for the calculation,are 35.0 Bq kg�1 for the uranium series radionuclideswith half-lives longer than 180 d, which include 210Pb,226Ra, 230Th, 234U, and 238U; 37.0 Bq kg�1 for the thoriumseries radionuclides with half-lives longer than 180 d,which are 228Ra, 228Th, and 232Th; and 1.63 Bq kg�1 forthe actinium series radionuclides with half-lives longerthan 180 d, which are 227Ac, 231Pa, and 235U (Myrick1983; NRC 1999b). The United States average ground-water concentrations used in the calculation for theradionuclides with half-lives longer than 180 d for eachof the following decay series are: 15.0 Bq L�1 for theuranium series, 26.0 Bq L�1 for the thorium series, and3.00 Bq L�1 for the actinium series (Cothern andLappenbusch 1983; NRC 1999b).
In addition to the technical differences betweenadapted RESRAD and the default procedures that aredirectly stipulated above, the extent of the change inprocedure on the calculated TED is also quantitatively
shown. The dose due to the national average concentrationsof ancient NORM was calculated using the default proce-dures of RESRAD as well as the procedural adaptation. Forthe default procedures, a resident farmer exposure scenariowas assumed, dose was integrated for a chronic annualexposure based on seventeen points or times, and thecalculated TED was not adjusted for variances in theradionuclide concentration used by RESRAD.
Computation of environmental dose factorsThe relationship between the TED calculated using
the procedural adaptation of RESRAD for a given set ofinput parameters and the respective concentrations ofradionuclides in soil and groundwater on which thecalculation was based was evaluated and compared. Thedependence of TED on soil concentration was examinedby varying the soil concentration of each of the uraniumseries radionuclides with half-lives longer than 180 dbetween 0.25 and 1 Bq kg�1, in increments of 0.25 Bqkg�1, for four constant groundwater concentrations rang-ing from 0.25 Bq L�1 to 1 Bq L�1 in increments of 0.25Bq L�1. Similarly, the relationship between TED andgroundwater concentration was examined by varyinggroundwater concentration for the same radionuclidesfrom 0 to 1 Bq L�1 in increments of 0.25 Bq L�1 for aconstant soil concentration ranging from 0.25 to 1 Bqkg�1 in increments of 0.25 Bq kg�1.
Here, EDFs are defined as factors that relate TEDdue to a chronic exposure to ancient NORM to theelemental activity concentration of a given element insoil or water for a certain age group and exposurescenario. Only uranium and thorium EDFs were calcu-lated for this project. It was assumed that all progenyradionuclides remain in secular equilibrium with theirprecursors unless explicitly stated. Natural abundance bymass of uranium in soil is assumed as 99.2745% 238U,0.0055% 234U, and 0.7200% 235U; while 232Th is assumedto be 100% of natural thorium (Parrington 1996).RESRAD exposure scenarios are also used to classify thevarious EDFs, where ingestion of well water is stillassumed for suburban residents. Furthermore, the annualTED to a given age group for a given exposure scenariois estimated as the sum of the activity concentrations ofall of the radionuclides in both soil and groundwater,multiplied by their proper respective EDFs. This isexpressed mathematically as:
TEDAge, Exposure Scenario � �z
�m
EDFz,m Cz,m, (1)
where z is the element under consideration, m is theenvironmental medium, and C is the activity concentra-tion of element z in media m. For this work, z will beuranium and thorium and m will be soil and water.
55Dose and NORM ● Z. S. BEAUVAIS ET AL.
To calculate an EDF, it is first necessary to calculatethe CED per unit activity concentration in a givenenvironmental medium, for each pathway, and of each ofthe decay progeny for all of the naturally abundantradioisotopes of the element using the procedural adap-tation of RESRAD. An EDF for a given element,exposure scenario, age of applicability, and environmen-tal medium is calculated as the sum over all of the naturalisotopes of the given element of the product of thatelement’s fractional abundance by mass multiplied by itsmaximum specific activity. This is multiplied again bythe sum of the CED per unit activity concentration overall dose pathways for the given environmental mediumfor all decay progeny of that isotope, and everything isdivided by the sum of the products of the fractionalabundance by mass and the maximum specific activity ofeach of the natural isotopes of the element. This isexpressed mathematically as:
EDFz,m �
�k
�Fk�SAmax)k �i
�j
Pi,j�
�k
Fk�SAmax)k, (2)
where k is a naturally occurring radionuclide of elementz, i is a decay product of radionuclide k, and j is the dosepathway. F is fractional abundance by mass of radionu-clide k with respect to element z, SAmax is the maximumspecific activity of radionuclide k, and P is the CED perunit activity concentration of radionuclide i in pathway jcalculated using the procedural adaptation of RESRAD.For this work, k will be 234U, 235U, 238U, and 232Th.Consequently, the radionuclides, i, will correspond tothose in the uranium, actinium, and thorium series,respectively. The pathways, j, are the dose pathwaysconsidered by RESRAD for a given exposure scenario.For uranium, the EDF will reflect contributions of dosefrom both the uranium and actinium series as 238U and234U are in the uranium series and 235U is in the actiniumseries. In the calculation of the EDF for uranium, theprogeny were only summated for 238U between 238U and234U. For thorium, only the dose contribution from thethorium series is considered since 232Th is the only thoriumisotope that naturally occurs in appreciable amounts. In thecase of thorium, the EDF for a given environmental me-dium and exposure scenario is the sum of the CED per unitactivity concentration of all progeny radionuclides over allpathways, expressed mathematically as:
EDFthorium, m � �i
�j
Pi,j, (3)
where P is the CED due to radionuclide i in dose pathwayj for each m, water and soil.
Due to the differing solubilities of the short livedradionuclides decaying between 234U and 238U in theuranium series, the activity ratio between 234U and 238U isquite variable in water (Plater et al. 1992). The fractionalabundance of 235U was assumed to remain constant for allactivity ratios of 234U:238U.
Uranium EDFs were calculated for two activityratios of 234U:238U in water, 1:1 and 2.4:1. The 1:1 ratioextends the assumption of secular equilibrium to watersources, and the 2.4:1 represents an estimated commonaverage (Cothern and Lappenbusch 1983).† UraniumEDFs were also calculated to both include and excludethe dose contribution due to radon inhalation. Overall,EDFs were calculated for uranium and thorium in bothwater and soil; for the resident farmer, suburban resident,and recreationist exposure scenarios for six age groupsranging from infant to adult; and for the industrial workersetting for adults.
A graph showing the quantitative relationship be-tween the uranium water EDF for a resident farmerexposure scenario and the activity ratio of 234U:238U wasgenerated. The activity ratio was varied from 0.8:1 to 5:1.Since the EDF is a function of the fractional abundanceby mass of each naturally occurring radionuclide consid-ered, the relationship between the water dependent EDFand the activity ratio of 234U:238U can also be expressedmathematically as a function of fractional abundance bymass. The variance of activity ratio does not affect theconcentration of 235U in a given sample and thus does notaffect its fractional abundance by mass. The activity ratiofor two radionuclides is equivalent to the ratio betweenthe products of their respective maximum specific activ-ities and fractional abundances by mass. It follows thatthe fractional abundance by mass of 238U can be ex-pressed mathematically as:
FA238U �FA235U
1 � �R � SAmax 238U�/SAmax 234U, (4)
where FA235U is the constant fractional abundance of 235Uby mass, equal to 0.007204, R is the specified activityratio of 234U:238U, and SAmax 234U and SAmax 238U are therespective maximum specific activities of 234U and 238U(Parrington 1996). Similarly, the fractional abundance bymass of 234U is mathematically expressed as:
FA234U�FA235U
1 � SAmax 234U/�R � SAmax 238U�. (5)
† Personal communication, R.L. Metzger, Radiation Safety Engi-neering, Inc., 3245 North Washington St., Chandler, AZ 85225; 2007.
56 Health Physics July 2009, Volume 97, Number 1
The concentrations of subsequent radionuclides in theuranium series were assumed to follow the concentrationof 234U in secular equilibrium.
The contributions to both the soil and water uraniumEDFs by pathway were separated and graphically dis-played so as to show the contribution of each pathway asa fraction of the whole EDF. This was done only for theresident farmer scenario, but for all six age groups. Thecontribution to the EDF from a particular dose pathwayis expressed mathematically as:
EDFj �
�k
�Fk�SAmax)k�i
Pi,j�
�k
Fk(SAmax)k. (6)
The dose contribution to the EDF by pathway is calcu-lated in much the same way as the total EDF, howeverthe P value is not summed over all pathways. For thegraphic display the water independent “Plant,” “Meat,”and “Milk,” and the water dependent “Fish,” “Plant,”“Meat,” and “Milk” pathways were combined to displaywater independent and water dependent “Foodstuff”pathways, respectively.
RESULTS
In the procedural adaptation of RESRAD describedin the methods above, the TED calculated by RESRAD isadjusted to account for deviations from the user specifiedradionuclide concentrations in those calculated byRESRAD. The magnitude of the deviation from the userspecified values is dependent on the TI parameter chosenfor the given scenario. As a general trend, the RESRADcalculated groundwater concentration varied more forlarger values of TI, which was expected because a largertime allows for a greater movement of radioactivity in theenvironment. For a user input groundwater concentrationof 1 Bq L�1, the mean variance in groundwater concen-tration of the uranium series radionuclides expressed as apercentage of the user specified concentration rangedfrom 1.4% for a 2-y TI to 10% for a 12-y TI. Similarresults were obtained for a uranium series groundwaterconcentration of 2 Bq L�1 with a minimum averagevariance of 1.4% for a 2-y TI and 10% for a 12-y TI. Foreach TI tested, the calculated variance of the 210Pbconcentration was the highest of any of the other uraniumseries radionuclides, with a maximum variance of 34%corresponding to an input concentration of 2 Bq L�1 anda TI of 12 y. The RESRAD calculated radionuclideconcentration in soil did not vary from the user specifiedvalue for any calculations encountered. The pattern of thevariances was fairly erratic. The R2 coefficients ofdetermination for the deviations from the user input
values of 210Pb concentrations with respect to TI werehigh at 0.96 and 0.97 for groundwater concentrations of1 and 2 Bq L�1, respectively. The coefficients of deter-mination for the other uranium series radionuclide con-centration deviations ranged between 0.23 and 0.25 forgroundwater concentrations of 1 Bq L�1 and between0.23 to 0.28 for concentrations of 2 Bq L�1.
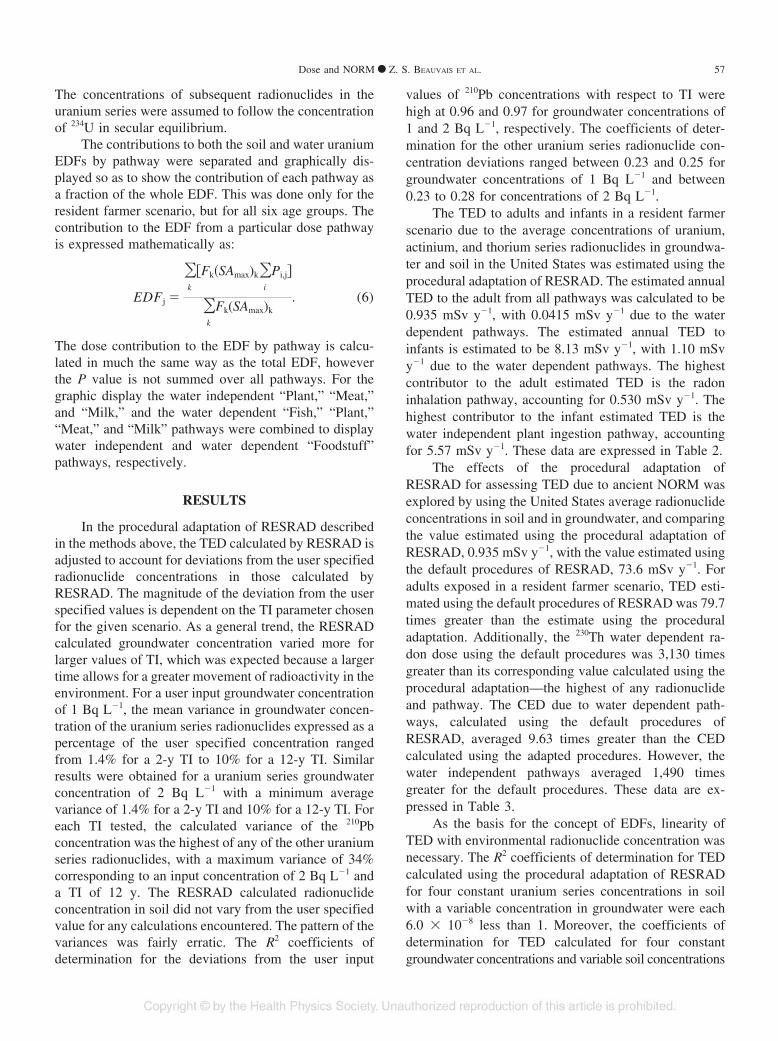
The TED to adults and infants in a resident farmerscenario due to the average concentrations of uranium,actinium, and thorium series radionuclides in groundwa-ter and soil in the United States was estimated using theprocedural adaptation of RESRAD. The estimated annualTED to the adult from all pathways was calculated to be0.935 mSv y�1, with 0.0415 mSv y�1 due to the waterdependent pathways. The estimated annual TED toinfants is estimated to be 8.13 mSv y�1, with 1.10 mSvy�1 due to the water dependent pathways. The highestcontributor to the adult estimated TED is the radoninhalation pathway, accounting for 0.530 mSv y�1. Thehighest contributor to the infant estimated TED is thewater independent plant ingestion pathway, accountingfor 5.57 mSv y�1. These data are expressed in Table 2.
The effects of the procedural adaptation ofRESRAD for assessing TED due to ancient NORM wasexplored by using the United States average radionuclideconcentrations in soil and in groundwater, and comparingthe value estimated using the procedural adaptation ofRESRAD, 0.935 mSv y�1, with the value estimated usingthe default procedures of RESRAD, 73.6 mSv y�1. Foradults exposed in a resident farmer scenario, TED esti-mated using the default procedures of RESRAD was 79.7times greater than the estimate using the proceduraladaptation. Additionally, the 230Th water dependent ra-don dose using the default procedures was 3,130 timesgreater than its corresponding value calculated using theprocedural adaptation—the highest of any radionuclideand pathway. The CED due to water dependent path-ways, calculated using the default procedures ofRESRAD, averaged 9.63 times greater than the CEDcalculated using the adapted procedures. However, thewater independent pathways averaged 1,490 timesgreater for the default procedures. These data are ex-pressed in Table 3.
As the basis for the concept of EDFs, linearity ofTED with environmental radionuclide concentration wasnecessary. The R2 coefficients of determination for TEDcalculated using the procedural adaptation of RESRADfor four constant uranium series concentrations in soilwith a variable concentration in groundwater were each6.0 � 10�8 less than 1. Moreover, the coefficients ofdetermination for TED calculated for four constantgroundwater concentrations and variable soil concentrations
57Dose and NORM ● Z. S. BEAUVAIS ET AL.
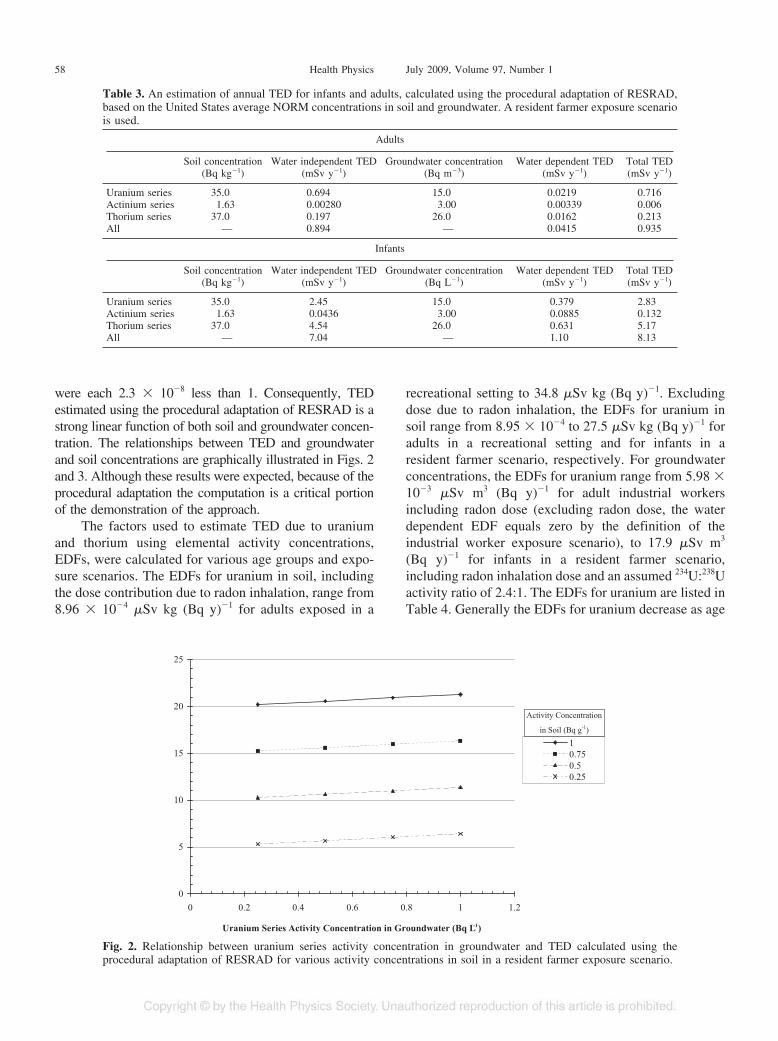
were each 2.3 � 10�8 less than 1. Consequently, TEDestimated using the procedural adaptation of RESRAD is astrong linear function of both soil and groundwater concen-tration. The relationships between TED and groundwaterand soil concentrations are graphically illustrated in Figs. 2and 3. Although these results were expected, because of theprocedural adaptation the computation is a critical portionof the demonstration of the approach.
The factors used to estimate TED due to uraniumand thorium using elemental activity concentrations,EDFs, were calculated for various age groups and expo-sure scenarios. The EDFs for uranium in soil, includingthe dose contribution due to radon inhalation, range from8.96 � 10�4 �Sv kg (Bq y)�1 for adults exposed in a
recreational setting to 34.8 �Sv kg (Bq y)�1. Excludingdose due to radon inhalation, the EDFs for uranium insoil range from 8.95 � 10�4 to 27.5 �Sv kg (Bq y)�1 foradults in a recreational setting and for infants in aresident farmer scenario, respectively. For groundwaterconcentrations, the EDFs for uranium range from 5.98 �10�3 �Sv m3 (Bq y)�1 for adult industrial workersincluding radon dose (excluding radon dose, the waterdependent EDF equals zero by the definition of theindustrial worker exposure scenario), to 17.9 �Sv m3
(Bq y)�1 for infants in a resident farmer scenario,including radon inhalation dose and an assumed 234U:238Uactivity ratio of 2.4:1. The EDFs for uranium are listed inTable 4. Generally the EDFs for uranium decrease as age
0
5
10
15
20
25
0 0.2 0.4 0.6 0.8 1 1.2
Uranium Series Activity Concentration in Groundwater (Bq L )-1
10.750.50.25
Activity Concentration
in Soil (Bq g-1)
Fig. 2. Relationship between uranium series activity concentration in groundwater and TED calculated using theprocedural adaptation of RESRAD for various activity concentrations in soil in a resident farmer exposure scenario.
Table 3. An estimation of annual TED for infants and adults, calculated using the procedural adaptation of RESRAD,based on the United States average NORM concentrations in soil and groundwater. A resident farmer exposure scenariois used.
Adults
Soil concentration(Bq kg�1)
Water independent TED(mSv y�1)
Groundwater concentration(Bq m�3)
Water dependent TED(mSv y�1)
Total TED(mSv y�1)
Uranium series 35.0 0.694 15.0 0.0219 0.716Actinium series 1.63 0.00280 3.00 0.00339 0.006Thorium series 37.0 0.197 26.0 0.0162 0.213All — 0.894 — 0.0415 0.935
Infants
Soil concentration(Bq kg�1)
Water independent TED(mSv y�1)
Groundwater concentration(Bq L�1)
Water dependent TED(mSv y�1)
Total TED(mSv y�1)
Uranium series 35.0 2.45 15.0 0.379 2.83Actinium series 1.63 0.0436 3.00 0.0885 0.132Thorium series 37.0 4.54 26.0 0.631 5.17All — 7.04 — 1.10 8.13
58 Health Physics July 2009, Volume 97, Number 1
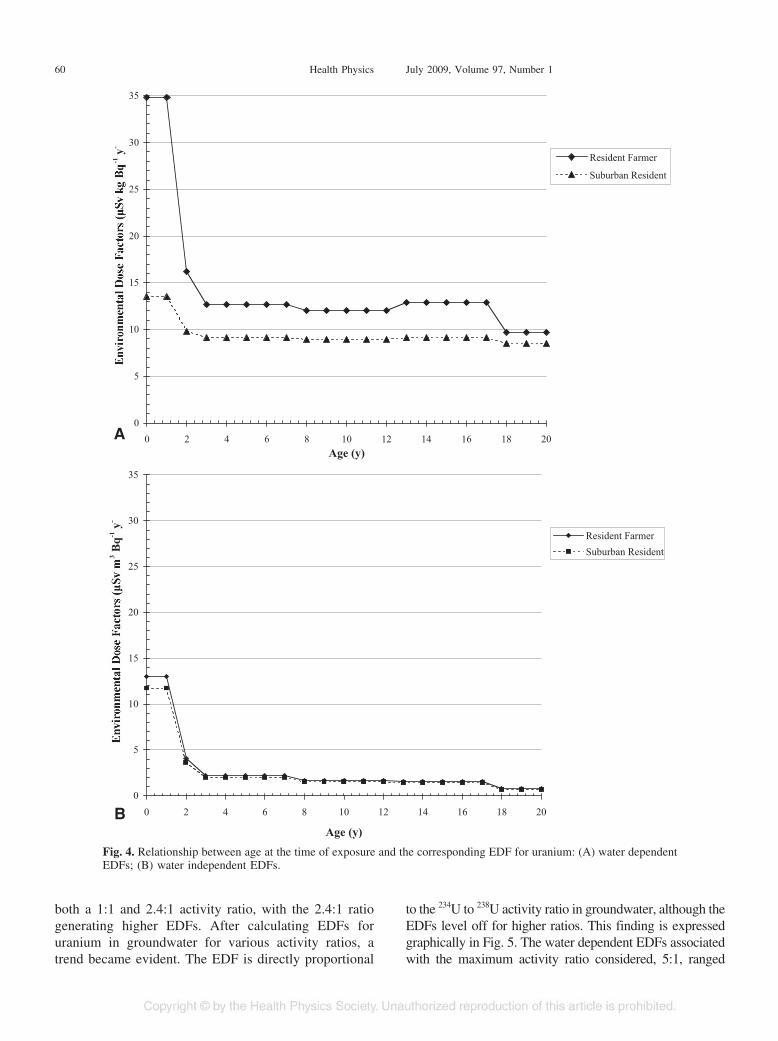
increases, with slightly increased dose for teenagers. Thistrend is graphically shown in Fig. 4.
For thorium in soil, including dose due to radoninhalation, the EDFs ranged from 2.54 � 10�3 �Sv kg (Bqy)�1 for adult recreationists to 123 �Sv kg (Bq y)�1 forinfants exposed in a resident farmer scenario. For thorium ingroundwater, including dose due to radon inhalation, the
EDFs ranged from 5.71 � 10�5 �Sv m3 (Bq y)�1 for adultindustrial workers to 24.0 �Sv m3 (Bq y)�1 for infantsexposed in a resident farmer scenario. The differences inthorium EDFs caused by the dose due to inhalation of radonwere negligible. The thorium EDFs are compiled in Table 5.
To account for the variability of the 234U to 238Uactivity ratio in water, uranium EDFs were calculated for
0
5
10
15
20
25
0 0.2 0.4 0.6 0.8 1
Uranium Series Activity Concentration in Soil (Bq g-1)
10.750.50.25
Activity Concentration
in Water (Bq L-1)
Fig. 3. Relationship between uranium series activity concentration in soil and TED calculated using the proceduraladaptation of RESRAD for various activity concentrations in groundwater in a resident farmer exposure scenario.
Table 4. Environmental dose factors (EDFs) for uranium in groundwater and soil for ages from infant to adult in eachof the RESRAD specified exposure pathways.
Environmental dose factors—Uranium
Age group
Including dose due to radon inhalation Excluding dose due to radon inhalation
Exposure scenarioSoil
(�Sv kg Bq�1 y�1)
Water (�Sv m3 Bq�1 y�1)Activity ratio 234U:238U Soil
(�Sv kgBq�1 y�1)
Water (�Sv m3 Bq�1 y�1)Activity ratio 234U:238U
1:1 2.4:1 1:1 2.4:1
Infant 34.8 13.0 17.9 27.5 13.0 17.9 Resident farmer1 y 16.2 4.04 5.66 8.83 4.02 5.63 Resident farmer5 y 12.7 2.20 3.10 5.34 2.22 3.09 Resident farmer10 y 12.0 1.66 2.31 4.65 1.64 2.28 Resident farmer15 y 12.9 1.56 2.18 5.52 1.54 2.16 Resident farmerAdult 9.73 0.738 1.02 2.37 0.721 0.994 Resident farmerInfant 13.5 11.8 16.2 6.16 11.7 16.1 Suburban resident1 y 9.82 3.64 5.11 2.46 3.63 5.08 Suburban resident5 y 9.12 2.02 2.82 1.76 2.00 2.79 Suburban resident10 y 8.97 1.49 2.08 1.61 1.48 2.06 Suburban resident15 y 9.12 1.40 1.96 1.75 1.39 1.94 Suburban residentAdult 8.52 0.674 0.926 1.16 0.657 0.901 Suburban residentInfant 0.00138 0.165 0.231 0.00138 0.164 0.230 Recreationist1 y 0.00104 0.055 0.0776 0.00104 0.0546 0.0774 Recreationist5 y 0.000960 0.030 0.0418 0.000959 0.0295 0.0417 Recreationist10 y 0.000933 0.021 0.0293 0.000932 0.0206 0.0292 Recreationist15 y 0.000928 0.017 0.0244 0.000927 0.0172 0.0244 RecreationistAdult 0.000896 0.009 0.0126 0.000895 0.00893 0.0126 RecreationistAdult 0.00476 0.00598 0.00852 0.00476 0.00 0.00 Industrial
59Dose and NORM ● Z. S. BEAUVAIS ET AL.
both a 1:1 and 2.4:1 activity ratio, with the 2.4:1 ratiogenerating higher EDFs. After calculating EDFs foruranium in groundwater for various activity ratios, atrend became evident. The EDF is directly proportional
to the 234U to 238U activity ratio in groundwater, although theEDFs level off for higher ratios. This finding is expressedgraphically in Fig. 5. The water dependent EDFs associatedwith the maximum activity ratio considered, 5:1, ranged
0
5
10
15
20
25
30
35
0 2 4 6 8 10 12 14 16 18 20Age (y)
-1 y
-
Resident Farmer
Suburban Resident
A
0
5
10
15
20
25
30
35
0 2 4 6 8 10 12 14 16 18 20
Age (y)
3 Bq-1
y-
Resident FarmerSuburban Resident
B
Fig. 4. Relationship between age at the time of exposure and the corresponding EDF for uranium: (A) water dependentEDFs; (B) water independent EDFs.
60 Health Physics July 2009, Volume 97, Number 1
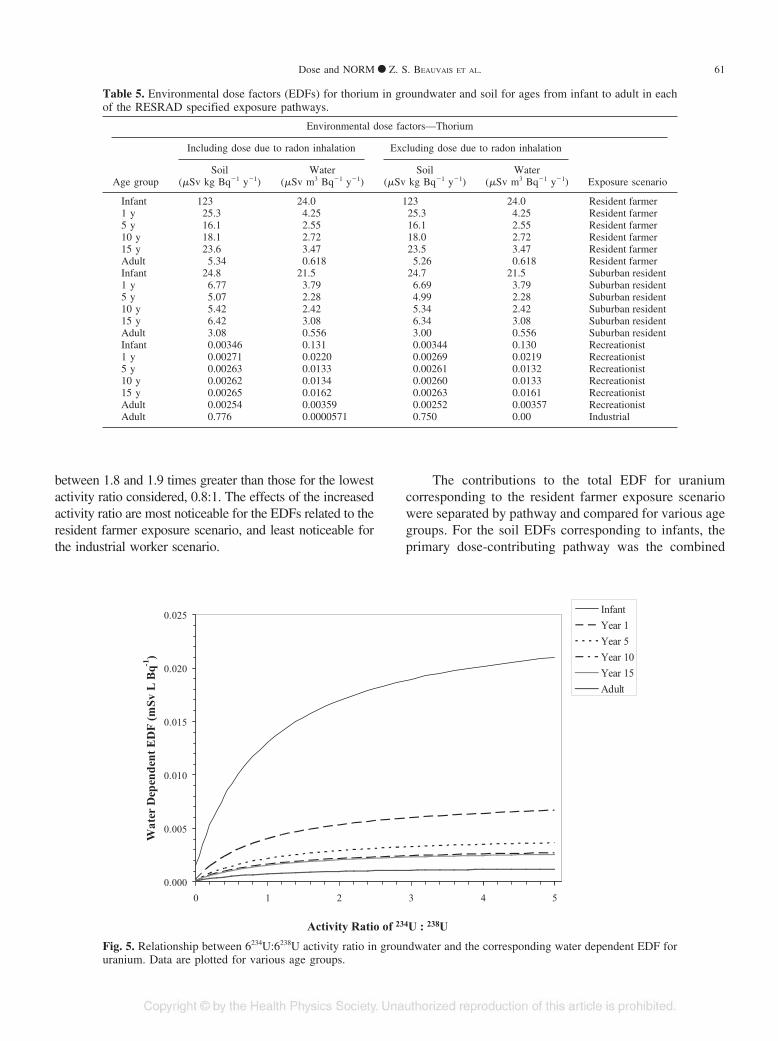
between 1.8 and 1.9 times greater than those for the lowestactivity ratio considered, 0.8:1. The effects of the increasedactivity ratio are most noticeable for the EDFs related to theresident farmer exposure scenario, and least noticeable forthe industrial worker scenario.
The contributions to the total EDF for uraniumcorresponding to the resident farmer exposure scenariowere separated by pathway and compared for various agegroups. For the soil EDFs corresponding to infants, theprimary dose-contributing pathway was the combined
Activity Ratio of 234U : 238U
0.000
0.005
0.010
0.015
0.020
0.025
0 1 2 3 4 5
Wat
er D
epen
dent
ED
F (m
Sv L
Bq-1
)
InfantYear 1Year 5Year 10Year 15Adult
Fig. 5. Relationship between 6234U:6238U activity ratio in groundwater and the corresponding water dependent EDF foruranium. Data are plotted for various age groups.
Table 5. Environmental dose factors (EDFs) for thorium in groundwater and soil for ages from infant to adult in eachof the RESRAD specified exposure pathways.
Environmental dose factors—Thorium
Age group
Including dose due to radon inhalation Excluding dose due to radon inhalation
Exposure scenarioSoil
(�Sv kg Bq�1 y�1)Water
(�Sv m3 Bq�1 y�1)Soil
(�Sv kg Bq�1 y�1)Water
(�Sv m3 Bq�1 y�1)
Infant 123 24.0 123 24.0 Resident farmer1 y 25.3 4.25 25.3 4.25 Resident farmer5 y 16.1 2.55 16.1 2.55 Resident farmer10 y 18.1 2.72 18.0 2.72 Resident farmer15 y 23.6 3.47 23.5 3.47 Resident farmerAdult 5.34 0.618 5.26 0.618 Resident farmerInfant 24.8 21.5 24.7 21.5 Suburban resident1 y 6.77 3.79 6.69 3.79 Suburban resident5 y 5.07 2.28 4.99 2.28 Suburban resident10 y 5.42 2.42 5.34 2.42 Suburban resident15 y 6.42 3.08 6.34 3.08 Suburban residentAdult 3.08 0.556 3.00 0.556 Suburban residentInfant 0.00346 0.131 0.00344 0.130 Recreationist1 y 0.00271 0.0220 0.00269 0.0219 Recreationist5 y 0.00263 0.0133 0.00261 0.0132 Recreationist10 y 0.00262 0.0134 0.00260 0.0133 Recreationist15 y 0.00265 0.0162 0.00263 0.0161 RecreationistAdult 0.00254 0.00359 0.00252 0.00357 RecreationistAdult 0.776 0.0000571 0.750 0.00 Industrial
61Dose and NORM ● Z. S. BEAUVAIS ET AL.
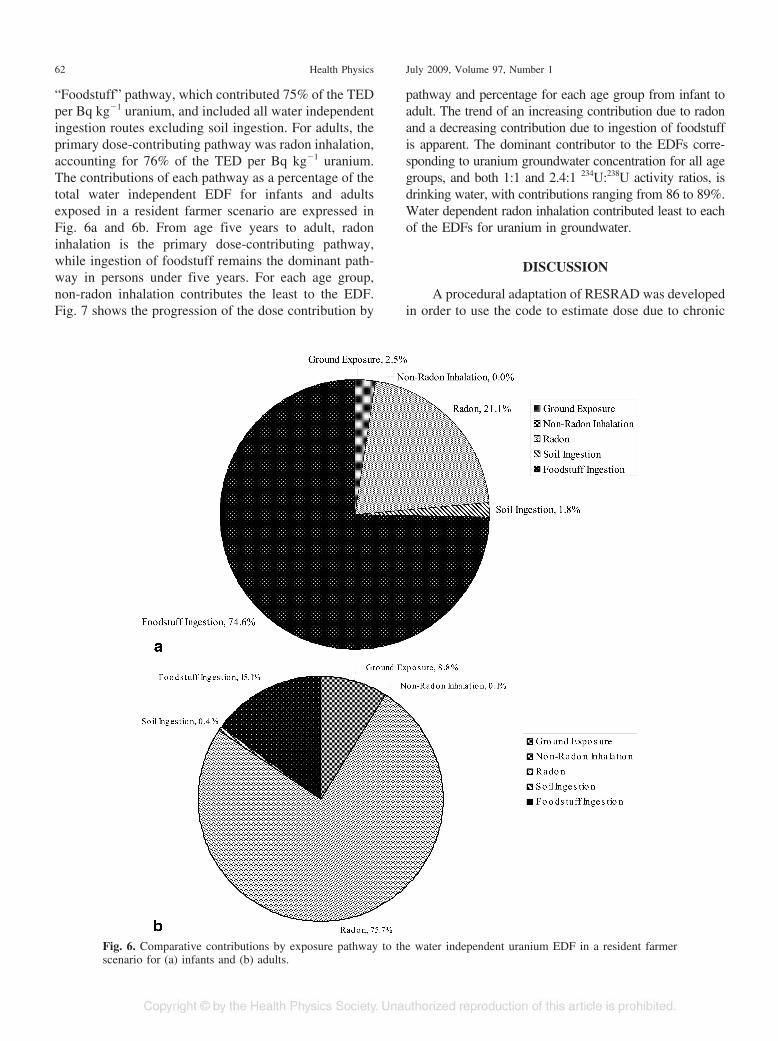
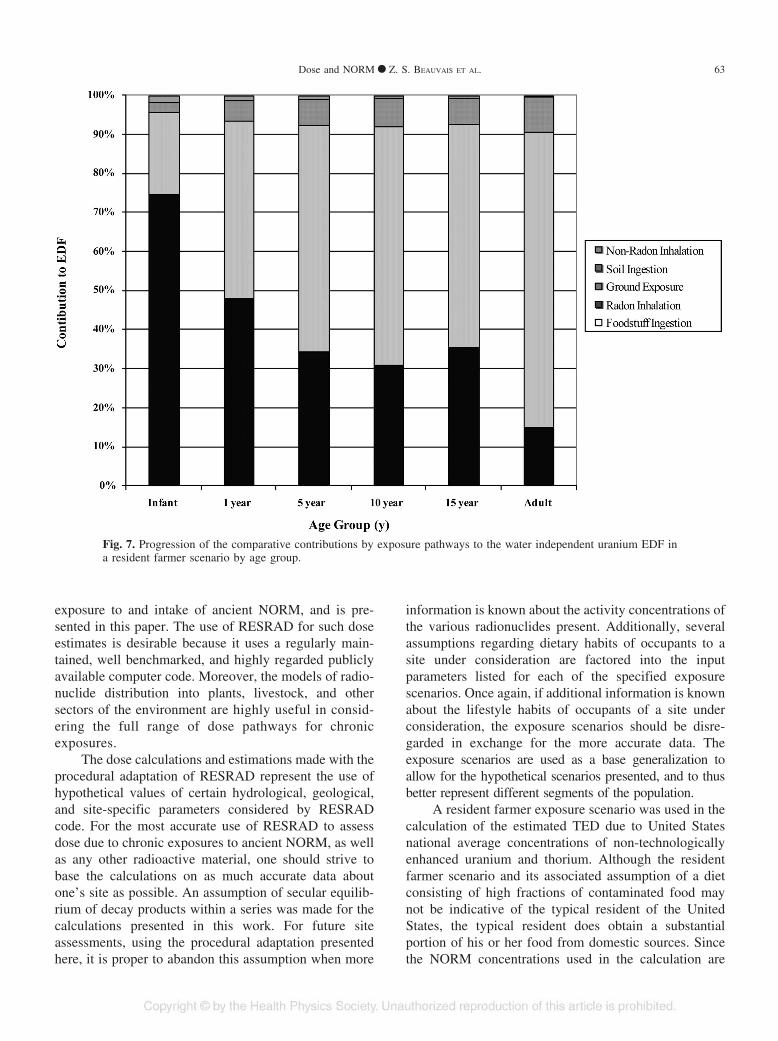
“Foodstuff” pathway, which contributed 75% of the TEDper Bq kg�1 uranium, and included all water independentingestion routes excluding soil ingestion. For adults, theprimary dose-contributing pathway was radon inhalation,accounting for 76% of the TED per Bq kg�1 uranium.The contributions of each pathway as a percentage of thetotal water independent EDF for infants and adultsexposed in a resident farmer scenario are expressed inFig. 6a and 6b. From age five years to adult, radoninhalation is the primary dose-contributing pathway,while ingestion of foodstuff remains the dominant path-way in persons under five years. For each age group,non-radon inhalation contributes the least to the EDF.Fig. 7 shows the progression of the dose contribution by
pathway and percentage for each age group from infant toadult. The trend of an increasing contribution due to radonand a decreasing contribution due to ingestion of foodstuffis apparent. The dominant contributor to the EDFs corre-sponding to uranium groundwater concentration for all agegroups, and both 1:1 and 2.4:1 234U:238U activity ratios, isdrinking water, with contributions ranging from 86 to 89%.Water dependent radon inhalation contributed least to eachof the EDFs for uranium in groundwater.
DISCUSSION
A procedural adaptation of RESRAD was developedin order to use the code to estimate dose due to chronic
Fig. 6. Comparative contributions by exposure pathway to the water independent uranium EDF in a resident farmerscenario for (a) infants and (b) adults.
62 Health Physics July 2009, Volume 97, Number 1
exposure to and intake of ancient NORM, and is pre-sented in this paper. The use of RESRAD for such doseestimates is desirable because it uses a regularly main-tained, well benchmarked, and highly regarded publiclyavailable computer code. Moreover, the models of radio-nuclide distribution into plants, livestock, and othersectors of the environment are highly useful in consid-ering the full range of dose pathways for chronicexposures.
The dose calculations and estimations made with theprocedural adaptation of RESRAD represent the use ofhypothetical values of certain hydrological, geological,and site-specific parameters considered by RESRADcode. For the most accurate use of RESRAD to assessdose due to chronic exposures to ancient NORM, as wellas any other radioactive material, one should strive tobase the calculations on as much accurate data aboutone’s site as possible. An assumption of secular equilib-rium of decay products within a series was made for thecalculations presented in this work. For future siteassessments, using the procedural adaptation presentedhere, it is proper to abandon this assumption when more
information is known about the activity concentrations ofthe various radionuclides present. Additionally, severalassumptions regarding dietary habits of occupants to asite under consideration are factored into the inputparameters listed for each of the specified exposurescenarios. Once again, if additional information is knownabout the lifestyle habits of occupants of a site underconsideration, the exposure scenarios should be disre-garded in exchange for the more accurate data. Theexposure scenarios are used as a base generalization toallow for the hypothetical scenarios presented, and to thusbetter represent different segments of the population.
A resident farmer exposure scenario was used in thecalculation of the estimated TED due to United Statesnational average concentrations of non-technologicallyenhanced uranium and thorium. Although the residentfarmer scenario and its associated assumption of a dietconsisting of high fractions of contaminated food maynot be indicative of the typical resident of the UnitedStates, the typical resident does obtain a substantialportion of his or her food from domestic sources. Sincethe NORM concentrations used in the calculation are
Fig. 7. Progression of the comparative contributions by exposure pathways to the water independent uranium EDF ina resident farmer scenario by age group.
63Dose and NORM ● Z. S. BEAUVAIS ET AL.
national averages, it follows that there is an equalchance that these are the concentrations for the hypo-thetical residence as for the site on which the food wasproduced.
The estimate of TED due to average uranium andthorium concentrations in the United States is lower thanthe estimate for worldwide background radiation due toterrestrial radionuclides given in the UNSCEAR 2000report (UNSCEAR 2000). The estimate presented in thispaper for adults of 0.891 mSv y�1, pertaining to uraniumand thorium series soil concentrations of 35.0 and 37.0Bq kg�1, respectively, is lower than the 1.72 mSv y�1
given by UNSCEAR, pertaining to worldwide uraniumand thorium series soil concentrations of 35.0 and 30.0Bq kg�1, respectively (UNSCEAR 2000). However, theresults compare favorably when the TED due to inhala-tion of radon and its decay products is not considered:0.405 mSv y�1 estimated with the procedural adaptationof RESRAD and 0.455 mSv y�1 from UNSCEAR.Deviation of the estimate presented from that in theliterature could be caused by a misuse of exposurescenario, as discussed previously, by deviations from theassumption of secular equilibrium, by the use of hypo-thetical values for hydrological and geological parame-ters, or by an inaccurate or inappropriate calculation ofradon dose within RESRAD.
The estimate of TED due to exposure to UnitedStates average terrestrial NORM concentrations usingthe default procedures of RESRAD was much greaterthan that using the procedural adaptation. The enormousdifference is primarily explained by the difference indose integration between the two procedures. As ex-plained in the Materials and Methods section, the TEDestimated using the procedural adaptation reflects onlythe input radionuclide concentrations at time 0 whereasthe default procedure integrates the dose over the dura-tion of the first year. Due to environmental movementduring the first year, as modeled by RESRAD, there is aconsiderably higher concentration of each radionuclidepresent in the United States average scenario in ground-water and surface water at the end of the first year. TheTED calculated using the default procedures incorrectlyreflects this, while the procedural adaptation purposelydoes not.
EDFs were defined and generated for estimation ofTED due to certain ancient NORM using elementalconcentrations of either uranium or thorium. The EDFswere calculated for several age groups and exposurescenarios. The tables of EDFs (Tables 3 and 4) allow forestimates of dose to be made without the direct use ofRESRAD or a computer. These can be valuable tools indetermining the necessity of further assessment of radi-ation dose and risk in areas of high background. If further
information about a site or a general area is known, suchas hydrological parameters considered by RESRAD, ordeviations from the assumptions stipulated in the meth-ods, a procedure is described for the computation ofEDFs to more accurately provide TED estimates forspecific sites.
A comparison of EDFs on the basis of age is shownin Figs. 4a and 4b, with a slight deviation from thegeneral trend occurring between the ages of 13 and 17 yin each of the four exposure scenarios. In each scenario,though most noticeable for the resident farmer, theage-dependent EDFs increase slightly for the ages be-tween 13 and 17 y. This is a direct reflection of anincrease in the ICRP age-dependent DCF for this agegroup. As described in ICRP 69, uranium and radiumboth seek bone as they have similar chemical propertiesto alkaline earth metals and calcium in particular (ICRP1995b). Moreover, uranium and radium attach them-selves to new-growth bone and thus give a higher dose tothose who are growing. This is illustrated by the in-creased dose coefficients to bone surfaces from the5-y-old age group to the 10-y-old age group and from the10-y-old age group to the 15-y-old age group for 226Raand each of the natural uranium isotopes. Additionally,there is an increased dose coefficient in red marrow andeffective dose between 10-y-old and 15-y-old age groupsin 226Ra and each of the natural uranium isotopes (ICRP1994a and b).
The variations in the age-dependent DCFs are fur-ther illustrated in Figs. 6a and b, and 7. Since RESRADdid not consider the age dependence of dose due to radoninhalation, the contribution due to radon inhalation isconstant for each age group for a given exposure sce-nario; however, the percent contribution to the wholedose, and in particular the EDF, due to radon is notconstant since the magnitude of the dose from the otherpathways is age-dependent. The use of a constant radonDCF corresponding to an age-constant radon dose isreasonable. According to BEIR VI, the ratio between thedose to adults and infants, as extrapolated from the“k-factors” presented in that report, is near unity (NRC1999a). Accuracy of the radon DCF used by RESRAD isopen to additional debate since various approaches tocalculation yield highly different results. By using a DCFthat utilized dosimetric methods in its derivation, thecalculated dose due to radon could be more than threetimes greater than that calculated with a DCF derivedfrom epidemiological data (Nikezic et al. 2006).
An example of a situation suited to the use of EDFsis for persons living in an area of high backgroundconcentrations of uranium or thorium, such as areas witha prevalence of heavy metal mining. Typical high ura-nium concentrations in soil and groundwater for such
64 Health Physics July 2009, Volume 97, Number 1

areas in South Dakota are 780 Bq kg�1 and 1,200 Bq m�3
(CFR 2007).‡ Typical high thorium concentrations forthe same region in soil and groundwater are 56 Bq kg�1
and 1,600 Bq m�3, respectively (CFR 2007).‡ WithEDFs, the TED to infants and adults was estimated forboth resident farmer and suburban resident exposurescenarios.
Using eqn 1 with the appropriate EDFs and the highuranium and thorium concentrations typical of certainareas in South Dakota, the uranium activity concentra-tions of 780 Bq kg�1 in soil and 1,200 Bq m�3 ingroundwater, and thorium activity concentrations of 56Bq kg�1 in soil and 1,600 Bq m�3 in water, were gatheredas typical values from state-wide soil and water sam-plings (Hoffman and Buttleman 1994).‡ The TED toinfants exposed in a resident farmer scenario was esti-mated at 88 mSv y�1 and to infants exposed in a suburbanresident scenario at 60 mSv y�1. The estimated TED foradults in a resident farmer scenario is 9.8 mSv y�1 andfor adults exposed in a suburban resident scenario 8.5
mSv y�1. These estimated high background TEDs arelisted in Table 6. In each of the scenarios assessed, theestimated TED was considerably higher than thecorresponding estimate for TED due to the nationalaverage ancient NORM concentrations. Additionally,each of the doses projected are non-trivial by radiationprotection standards.
CONCLUSION
In this work, a method to procedurally adaptRESRAD for use in calculating dose due to chronicexposure to ancient NORM was successfully demon-strated. Using this approach, EDFs were defined andcomputed which can be used to easily estimate dose dueto chronic exposures to ancient NORM for various agegroups and exposure scenarios based on elemental activ-ity concentrations of source elements in soil and ground-water. With this procedural adaptation, a TED due toexposure to the average concentrations of uranium,actinium, and thorium series radionuclides in the soil andgroundwater of the United States was determined to be0.935 mSv y�1 for adults and 8.13 mSv y�1 for infants. In
‡ Personal communication, J. Stone, Department of Civil andEnvironmental Engineering, South Dakota School of Mines andTechnology, 501 East Saint Joseph St., Rapid City, SD 57701; 2008.
Table 6. Annual TED for infants living in an area of high background radiation, estimated for resident farmer andsuburban resident exposure scenarios using EDFs.
Infant resident farmer exposure scenario
Element
Soilconcentration
(Bq kg�1)EDF
(�Sv kg Bq�1 y�1)Dose
(mSv y�1)
Groundwaterconcentration
(Bq m�3)EDF
(�Sv m3 Bq�1 y�1)Dose
(mSv y�1)Total dose(mSv y�1)
Uranium 780 34.8 27 1,200 13.0 16 43Thorium 56 123 7 1,600 24.0 38 45Total 34 54 88
Infant suburban resident exposure scenario
Element
Soilconcentration
(Bq kg�1)EDF
(�Sv kg Bq�1 y�1)Dose
(mSv y�1)
Groundwaterconcentration
(Bq m�3)EDF
(�Sv m3 Bq�1 y�1)Dose
(mSv y�1)Total dose(mSv y�1)
Uranium 780 13.5 11 1,200 11.8 14 25Thorium 56 24.8 1.4 1,600 21.5 34 36Total 12 49 60
Adult resident farmer exposure scenario
Element
Soilconcentration
(Bq kg�1)EDF
(�Sv kg Bq�1 y�1)Dose
(mSv y�1)
Groundwaterconcentration
(Bq m�3)EDF
(�Sv m3 Bq�1 y�1)Dose
(mSv y�1)Total dose(mSv y�1)
Uranium 780 9.73 7.6 1,200 0.738 0.90 8.5Thorium 56 5.34 0.30 1,600 0.618 0.99 1.3Total 7.9 1.9 9.8
Adult suburban resident exposure scenario
Element
Soilconcentration
(Bq kg�1)EDF
(�Sv kg Bq�1 y�1)Dose
(mSv y�1)
Groundwaterconcentration
(Bq m�3)EDF
(�Sv m3 Bq�1 y�1)Dose
(mSv y�1)Total dose(mSv y�1)
Uranium 780 8.52 6.7 1,200 0.674 0.81 7.5Thorium 56 3.08 0.17 1,600 0.556 0.89 1.1Total 6.8 1.7 8.5
65Dose and NORM ● Z. S. BEAUVAIS ET AL.
geographical areas rich in uranium and radium in theUnited States, these doses were estimated to be as high as88 mSv y�1 for infants and 9.8 mSv y�1 for adultsexposed in a resident farmer scenario. The correspondingdose estimates for a suburban resident exposure are 60mSv y�1 for infants and 8.5 mSv y�1 for adults. Anexample of the use of EDFs was given for hypotheticalareas in South Dakota showing a non-trivial dose due toancient NORM. The values of said EDFs were comparedand contrasted, with discussion given about the nature ofthe ICRP age-dependent DCFs used within RESRAD intheir derivation.
Acknowledgments—The authors would like to express sincere gratitude toSunita Kamboj of Argonne National Laboratories for her technical supportwith RESRAD code and assistance in development of the proceduraladaptation.
REFERENCES
Cheng JJ, Yu C. Using the RESRAD computer code toevaluate human health risks from radionuclides and hazard-ous chemicals. J Hazard Mater 35:353–367; 1993.
Code of Federal Regulations. Transportation. Washington, DC:U.S. Government Printing Office; Title 49 CFR Parts100–185; 2007.
Cooper M. Geological Survey (U.S.), U.S. Atomic EnergyCommission, Division of Raw Materials. Bibliography andindex of literature on uranium and thorium and radioactiveoccurrences in the United States: Part 5: Connecticut,Delaware, Illinois, Indiana, Maine, Maryland, Massachu-setts, Michigan, New Hampshire, New Jersey, New York,Ohio, Pennsylvania, Rhode Island, Vermont, and Wiscon-sin. New York: Geological Society of America; 1958.
Cothern CR, Lappenbusch WL. Occurrence of uranium indrinking water in the U.S. Health Phys 45:89–99; 1983.
Cothern CR, Rebers P. Radon, radium, and uranium in drinkingwater. Chelsea, MI: Lewis Publishers; 1990.
Darnell GR, Shuman R, Chau N, Jennrich EA. Abovegradeearth-mounded concrete vault—structural and radiologicalperformance. ACS Symposium Series 468:415–430; 1991.
Eckerman KF. Oak Ridge National Laboratory’s DCAL soft-ware package. In: Nihon Krenshiryoku Kenkyu KaihatsuKiko. Proceedings of the Fourth Japan Atomic EnergyAgency-U.S. Environmental Protection Agency Workshopon Radiation Risk Assessment. Tokeimura, Japan: JapanAtomic Energy Agency; 2007:52–58.
Faillace E, Cheng JJ, Yu C. RESRAD benchmarking againstsix radiation exposure pathway models. Washington, DC:U.S. Department of Energy and Argonne National Labora-tory; Report ANL/EAD/TM-24; 1994.
Hakonson-Hayes AC, Fresquez PR, Whicker FW. Assessingpotential risks from exposure to natural uranium in wellwater. J Environ Radioact 59:29–40; 2002.
Hoffman JD, Buttleman K. National geochemical data basenational uranium resource evaluation data for the contermi-nous United States. Reston, VA: U.S. Geological Survey;1994.
Hughes LD, Powell BA, Soureefan AM, Falta DA, DeVol TA.Anomalously high levels of uranium and other naturally
occurring radionuclides in private wells in the PiedmontRegion of South Carolina. Health Phys 88:248–252; 2005.
International Commission on Radiological Protection. Limitsof inhalation of radon daughters by workers. Oxford:Pergamon Press; ICRP Publication 32; Ann ICRP 6(1);1981.
International Commission on Radiological Protection. Radia-tion Protection of workers in mines. Oxford: PergamonPress; ICRP Publication 47; Ann ICRP 16(1); 1986.
International Commission on Radiological Protection. Protec-tion against radon-222 at home and at work. Oxford:Pergamon Press; ICRP Publication 65; Ann ICRP 23(2);1994a.
International Commission on Radiological Protection. Age-dependent doses to members of the public from intake ofradionuclides. Oxford: Pergamon Press; ICRP Publication72, Part 2; Ann ICRP 26(1); 1994b.
International Commission on Radiological Protection. Age-dependent doses to members of the public from intake ofradionuclides. Oxford: Pergamon Press; ICRP Publication72, Part 3; Ann ICRP 26(1); 1995a.
International Commission on Radiological Protection. Age-dependent doses to members of the public from intake ofradionuclides. Oxford: Pergamon Press; ICRP Publication69; Ann ICRP 25(1); 1995b.
International Commission on Radiological Protection. Age-dependent doses to members of the public from intake ofradionuclides. Oxford: Pergamon Press; ICRP Publication72, Part 5; Ann ICRP 26(1); 1996.
Klein RB, Bernhardt DE, Rogers VC. Use of multiple pathwaycomputer codes for assessment of health effects fromlow-level radioactive waste. Proceedings of the NWWAFOCUS Conference on Midwestern Ground Water Issues.Dublin, OH: National Water Well Associations; 1987:327–338.
Klement AW, Miller CR, Minx RP, Shleien B. Estimates ofionizing radiation doses in the United States 1960–2000.Rockville, MD: Office of Radiation Programs, Division ofCriteria and Standards; Report: ORP/CSD-72-1; 1972.
Mudd G. Critical review of acid in situ leach uranium mining:1. USA and Australia. Environ Geol 41:390–403; 2001.
Murphy E. Interest in North Dakota’s uranium deposits is back.Environ Geol 54:432; 2008.
Myrick TE. Determination of concentrations of selected radio-nuclides in surface soil in the U.S. Health Physics 45:631–642; 1983.
National Council on Radiation Protection and Measurements.Exposure of the population in the United States and Canadafrom natural background radiation. Bethesda, MD: NCRP;NCRP Report 94; 1987a.
National Council on Radiation Protection and Measurements.Ionizing radiation exposure of the population of the UnitedStates. Bethesda, MD: NCRP; NCRP Report 93; 1987b.
National Council on Radiation Protection and Measurements.Radiation exposure of the U.S. population from consumerproducts and miscellaneous sources. Bethesda, MD: NCRP;NCRP Report 95; 1987c.
National Research Council, Committee on the BiologicalEffects of Ionizing Radiation, Board on Radiation EffectsResearch, Commission on Life Sciences. Health risks ofradon and other internally deposited alpha-emitters. Wash-ington DC: National Academy Press; BEIR IV; 1988.
National Research Council, Committee on Health Risks ofExposure to Radon, Board on Radiation Effects Research,Commission on Life Sciences, National Research Council.
66 Health Physics July 2009, Volume 97, Number 1
Health effects of exposure to radon. Washington DC:National Academy Press; BEIR VI; 1999a.
National Research Council, Committee on Evaluation of EPAGuidelines for Exposure to Naturally Occurring RadioactiveMaterials, Board on Radiation Effects Research, Commission onLife Sciences, National Research Council. NetLibrary I.Evaluation of guidelines for exposures to technologicallyenhanced naturally occurring radioactive materials [online].Washington, DC: National Academy Press; 1999b.
Nikezic D, Lau BMF, Yu KN. Comparison of dose conversionfactors for radon progeny from the ICRP 66 regional modeland an airway tube model of tracheo-bronchial tree. RadiatEnviron Biophys 45:153–157; 2006.
Parrington JR. Nuclides and isotopes. Schenectady, NY: LockheedMartin; San Jose, CA: Distributed by GE Nuclear Energy;1996.
Plater AJ, Ivanovich M, Dugdale RE. Uranium series disequi-librium in river sediments and waters: the significance ofanomalous activity ratios. Appl Geochem 7:101–110; 1992.
Rahn PH, Davis AD, Webb CJ, Nichols AD. Water qualityimpacts from mining in the Black Hills, South Dakota,USA. Environ Geol 27:38–53; 1996.
Ramli AT, Wahab A, Hussein MA, Khalik Wood A. Environ-mental 238U and 232Th concentration measurements in an
area of high level natural background radiation at Palong,Johor, Malaysia. J Environ Radioact 80:287–304; 2005.
Rittmann PD. Comparison of RESRAD with hand calculations.Proceedings of the 17th Annual U.S. Department of EnergyLow-Level Radioactive Waste Management Conference.Phoenix, AR: U.S. DOE; 1995.
Robinson PJ, Davis JP, Ung DT, Parrish BR, Chan DW,Wofford BW. Parametric studies of the impact of conven-tional disposal of wastes below regulatory concern (BRC)using the IMPACTS computer code with the EPRIIMPACTS-PLUS interface. Waste Management ’87: WasteIsolation in the U.S., Technical Programs and Public Edu-cation. Proceedings of the Symposium 3:249–253; 1987.
United Nations Scientific Committee on the Effects of IonizingRadiation. Annex B: Exposures from natural radiationsources. New York: United Nations; 2000.
Wilson WF. A guide to naturally occurring radioactive material(NORM). Tulsa, OK: PennWell Books; 1993.
Yu C, Zielen AJ, Cheng JJ, LePoire DJ, Gnanapragasam EK,Kamboj S, Arnish J, Wallo J III, Williams WA, Peterson H.User’s manual for RESRAD version 6. Oak Ridge, TN:U.S. Department of Energy Office of Scientific and Tech-nical Information; 2001.
f f
67Dose and NORM ● Z. S. BEAUVAIS ET AL.
Copyright © 2022 FDOKUMEN