
DOE-ER-0313/38 - Oak Ridge National Laboratory
178
DOE-ER-0313/38 Distribution Categories UC-423, -424 FUSION MATERIALS SEMIANNUAL PROGRESS REPORT FOR THE PERIOD ENDING June 30, 2005 Prepared for DOE Office of Fusion Energy Sciences (AT 60 20 10 0) DATE PUBLISHED: SEPTEMBER 2005 Prepared for OAK RIDGE NATIONAL LABORATORY Oak Ridge, Tennessee 37831 Managed by UT-Battelle, LLC For the U.S. DEPARTMENT OF ENERGY
-
Upload
khangminh22 -
Category
Documents
-
view
0 -
download
0
Transcript of DOE-ER-0313/38 - Oak Ridge National Laboratory
DOE-ER-0313/38 Distribution Categories
UC-423, -424
FUSION MATERIALS SEMIANNUAL PROGRESS REPORT
FOR THE PERIOD ENDING June 30, 2005
Prepared for DOE Office of Fusion Energy Sciences
(AT 60 20 10 0)
DATE PUBLISHED: SEPTEMBER 2005
Prepared for OAK RIDGE NATIONAL LABORATORY
Oak Ridge, Tennessee 37831 Managed by
UT-Battelle, LLC For the
U.S. DEPARTMENT OF ENERGY

i
FOREWORD This is the thirty-eighth in a series of semiannual technical progress reports on fusion materials science activities supported by the Fusion Energy Sciences Program of the U.S. Department of Energy. This report focuses on research addressing the effects on materials properties and performance from exposure to the neutronic, thermal, and chemical environments anticipated in the chambers of fusion experiments and energy systems. This research is a major element of the national effort to establish the materials knowledge base of an economically and environmentally attractive fusion energy source. Research activities on issues related to the interaction of materials with plasmas are reported separately. The results reported are the product of a national effort involving a number of national laboratories and universities. A large fraction of this work, particularly in relation to fission reactor irradiations, is carried out collaboratively with partners in Japan, Russia, and the European Union. The purpose of this series of reports is to provide a working technical record for the use of program participants, and to provide a means of communicating the efforts of fusion materials scientists to the broader fusion community, both nationally and worldwide. This report has been compiled and edited under the guidance of R. L. Klueh and Teresa Roe, Oak Ridge National Laboratory. Their efforts, and the efforts of the many persons who made technical contributions, are gratefully acknowledged. G. R. Nardella Research Division Office of Fusion Energy Sciences


iii
TABLE OF CONTENTS
1.0 VANADIUM ALLOYS 1 1.1 THE EFFECT OF TI AND ZR ON PRECIPITATION IN THE EXPERIMENTAL HR SERIES
OF VANADIUM ALLOYS—D. T. Hoelzer, A. F. Rowcliffe, and M. Li (Oak Ridge National Laboratory) To investigate the effect of two processing conditions and the effectiveness of Ti and Zr solute atoms on the precipitation of interstitial C, O, and N atoms in three HR alloys using Transmission Electron Microscopy (TEM), electrical resistivity, and Vicker’s hardness. The alloys that were studied had nominal compositions of V-4Cr-4Ti (HR1), V-4Cr-0.21Ti (HR6), and V-4Cr-0.37Zr (HR7).
2
2.0 CERAMIC COMPOSITE MATERIALS 12 2.1 APPLICATION OF BEND STRESS RELAXATION TECHNIQUE TO STUDY OF HIGH
TEMPERATURE CREEP OF BULK SILICON CARBIDE CERAMICS—Y. Katoh and L. L. Snead (Oak Ridge National Laboratory) Bend stress relaxation (BSR) creep experiment was performed using thin strip specimens machined out of chemically vapor deposited (CVD) SiC in two different material classes, in a stress range of general interest for structural ceramics and composites. The primary objective of the experiment was to demonstrate the applicability of BSR technique to the thermal and irradiation creep studies of bulk SiC. Additionally, it was attempted to help understanding the high temperature deformation mechanism for high purity and stoichiometric SiC using the limited data obtained.
13
2.2 MECHANICAL PROPERTIES OF FCVI SIC-MATRIX COMPOSITES REINFORCED WITH
TYRANNO™-SA GRADE-3 SIC FIBER FABRICS—Y. Katoh, T. Nozawa, L. L. Snead (Oak Ridge National Laboratory) The objective of this work is to determine tensile properties of structural ceramic composites with reinforcement by Tyranno™-SA Grade-3 near-stoichiometric silicon carbide (SiC) fiber fabrics, pyrolytic carbon (PyC) interlayer, and SiC matrix densified through forced-flow chemical vapor infiltration process. An emphasis was put on role of the PyC interlayer on various tensile and fracture properties of the composites.
19
2.3 PROPERTY TAILORABILITY FOR ADVANCED CVI SILICON CARBIDE COMPOSITES
FOR FUSION—Y. Katoh, T. Nozawa, and L. L. Snead (Oak Ridge National Laboratory), T. Hinoki and A. Kohyama (Kyoto University) The objective of this work is to determine the tailorability of anisotropic thermomechanical properties for chemically vapor-infiltrated (CVI) SiC/SiC composites after neutron irradiation.
31
2.4 INTERFACIAL SHEAR PROPERTIES OF SILICON CARBIDE COMPOSITES WITH
MULTI-LAYERED INTERFACE—T. Nozawa, Y. Katoh, and L. L. Snead (Oak Ridge National Laboratory) The primary objective of this study is to identify the optimum interlayer design of multiple pyrolytic carbon (PyC) / silicon carbide (SiC) interphase. For this purpose, the effect of interlayer thickness on interfacial shear properties of (non-irradiated) SiC/SiC composites with single PyC interphase and multiple PyC/SiC (ML) interphase is specifically addressed on.
40
iv
2.5 ERRATUM TO “STRENGTH AND ELASTIC MODULUS OF NEUTRON-IRRADIATED
CUBIC SILICON CARBIDE,” in Fusion Materials Semiannual Progress Report for the Period Ending June 30, 2004, DOE/ER-0313/36
45
3.0 FERRITIC/MARTENSITIC STEELS AND ODS STEELS 46 3.1 FRICTION STIR WELDING OF OXIDE DISPERSION STRENGTHENED EUROFER
STEEL—G. J. Grant and D. S. Gelles (Pacific Northwest National Laboratory), R. J. Steel (MegaStir Technologies), and R. Lindau (FZK Karlsruhe, Germany) The objective of this effort is to investigate friction stir welding technology for application to oxide dispersion strengthened ferritic steels.
47
3.2 MECHANICAL PROPERTIES OF NEUTRON-IRRADIATED NICKEL-CONTAINING
MARTENSITIC STEELS FOR HELIUM-EFFECTS STUDIES: I. EXPERIMENTAL STUDY—R. L. Klueh, N. Hashimoto, and M. A. Sokolov (Oak Ridge National Laboratory), K. Shiba and S. Jitsakawa (Japan Atomic Energy Research Institute, Tokai, Japan) The objective of this work is to develop an understanding of the effect of transmutation helium on the irradiated mechanical properties of ferritic/martensitic steels for fusion applications and to use that knowledge to develop steels with improved properties.
54
3.3 PHASE TRANSFORMATIONS OBSERVED IN EP-450 FERRITIC/MARTENSITIC STEEL
IRRADIATED AT ~ 300ºC TO 40.3 DPA IN THE BN-350 FAST REACTOR—O. P. Maksimkin, L. G. Turubarova., T. A. Doronina (Institute of Nuclear Physics, National Nuclear Centre, Alma Ata, Kazakhstan), and F. A. Garner (Pacific Northwest National Laboratory) The objective of this effort is to establish the mechanisms by which ferritic/martensitic steels change their microstructure and properties during irradiation.
68
4.0 COPPER ALLOYS
No contributions
74
5.0 REFRACTORY METALS AND ALLOYS
No contributions
75
6.0 AUSTENITIC STAINLESS STEELS 76 6.1 CORRELATION OF YIELD STRESS AND MICROHARDNESS IN 08CR16NI11MO3
IRRADIATED TO HIGH DOSE IN THE BN-350 FAST REACTOR—O. P. Maksimkin, M. N. Gusev, O. V. Tivanova, N. S. Silnaygina (Institute of Nuclear Physics, National Nuclear Center, Almaty, Kazakhstan), and F. A. Garner (Pacific Northwest National Laboratory) The objective of this effort is to develop methods of extracting data on radiation-induced changes in mechanical properties when the material of interest is highly irradiated, in an inconvenient location or configuration, or when significant gradients in mechanical properties are anticipated over small dimensions.
77
7.0 MHD INSULATORS, INSULATING CERAMICS, AND OPTICAL MATERIALS 83 7.1 STUDY OF THE LONG-TERM STABILITY OF MULTI- LAYER MHD COATINGS FOR
FUSION REACTOR APPLICATIONS—B. A. Pint, J. L. Moser (Oak Ridge National Laboratory), and A. Jankowski(Lawrence Livermore National Laboratory)
84

v
The objective of this task is to assess the long-term, high-temperature compatibility of high electrical resistance, multi-layer coatings with lithium at high temperatures. Electrically insulating coatings on the first wall of magnetic confinement reactors are essential to reduce the magnetohydrodynamic (MHD) force that would otherwise inhibit the flow of the lithium coolant. An assessment of the crack tolerance for these coatings determined that a multi-layer coating with metal and ceramic layers was needed to prevent Li from wetting cracks or defects in a single-layer ceramic coating. Experimental compatibility tests are being conducted on bulk materials and single and multi-layer coatings.
8.0 BREEDING MATERIALS 88 8.1 COMPATIBILITY ISSUES FOR Pb-Li SYSTEMS—B. A. Pint, P. F. Tortorelli, and J. L.
Moser (Oak Ridge National Laboratory) The objective of this task is to assess the long-term, high-temperature compatibility of various materials with Pb-Li. One proposed fusion reactor concept uses SiC/SiC composites with a self-cooled Pb-17Liblanket. Another concept uses a SiC/SiC flow channel insert with a dual coolant of He and Pb-Li at~800°C. This concept also requires tubing material to carry the Pb-Li between the first wall and the heat exchanger. As a first step in the evaluation process, monolithic SiC and potential tubing and coating materials are being exposed to Pb-17Li in capsule tests at 700°-1200°C.
89
9.0 RADIATION EFFECTS, MECHANISTIC STUDIES, AND EXPERIMENTAL METHODS 94 9.1 AN IN-SITU HE IMPLANTER APPROACH TO IRRADIATIONS WITH CONTROLLED
HE/DPA RATIOS AT FUSION RELEVANT CONDITIONS—T. Yamamoto, G. R. Odette (University of California, Santa Barbara), and L. R. Greenwood (Pacific Northwest National Laboratory) This research is aimed at designing and implementing a novel method for in-situ He implantation in mixed spectrum reactor irradiations at controlled and fusion relevant He/dpa ratios and dpa rates. The implantation of He from 6Li(n,α) reactions into and through vanadium alloy substrate insulator coatings in fusion neutron spectra is also examined.
95
9.2 ON THE INTRINSIC INITIATION AND ARREST CLEAVAGE FRACTURE TOUGHNESS
OF FERRITE—M. L. Hribernik, G. R. Odette, and M. Y. He (University of California, Santa Barbara) The temperature dependence of the initiation and crack arrest fracture toughness of cleavage oriented Fe single crystals have been measured. The primary objective is to assess the hypothesis that a universal master toughness temperature curve shape, KJc(T - To), observed in structural steels, where To is reference temperature, derives from an underlying universal temperature dependence of the intrinsic ferrite lattice micro-arrest toughness, Kµ(T). These results also represent the first database on the fundamental toughness properties of Fe and will provide critical insight on the atomic processes governing the brittle-to-ductile transition (BDT).
109
9.3 MODELLING THERMODYNAMICS OF ALLOYS FOR FUSION APPLICATION—A. Caro,
B. Sadigh, P. E. A. Turchi, M. Caro (Lawrence Livermore National Laboratory), E. Lopasso (Centro Atomico Bariloche, Argentine), and D. Crowson (Virginia Polytechnical Institute) This research has two main objectives. • On one side is the development of computational tools to evaluate alloy properties, using
the information contained in thermodynamic functions to improve the ability of classic
117
vi
potentials to account for complex alloy behavior. • On the other hand, to apply the tools so developed to predict properties of alloys under
irradiation.
9.4 TOWARDS UNDERSTANDING THE FORMATION AND STABILITY OF NANOMETER
SCALE Y-Ti-O CLUSTERS IN NANOSTRUCTURED FERRITIC ALLOYS USING LATTICE-BASED MONTE CARLO SIMULATIONS—M. J. Alinger and B. D. Wirth (University of California, Berkeley) The objective of this study is to explore the factors that control the formation, stability and composition of Y-Ti-O nanoclusters (NCs) in nanostructured ferritic alloys (NFAs) using Lattice-based Monte Carlo (LMC) simulations.
124
9.5 THE INTERACTION MECHANISM OF A GLIDING DISLOCATION WITH A STACKING
FAULT TETRAHEDRON—H.-J. Lee and B. D. Wirth (University of California, Berkeley) The objective of this work is to understand the sequence of events controlling the interaction between a stacking fault tetrahedron and gliding edge, screw and 60 degree mixed dislocation using molecular dynamics simulations.
135
10.0 DOSIMETRY, DAMAGE PARAMETERS, AND ACTIVATION CALCULATIONS
No contributions
156
11.0 MATERIALS ENGINEERING AND DESIGN REQUIREMENTS
No contributions
157
12.0 IRRADIATION FACILITIES AND TEST MATRICES 158 12.1 IRRADIATION PROGRESS OF MFE-RB-17J EXPERIMENT—D. K. Felde and R. L.
Wallace (Oak Ridge National Laboratory) The objective of this work is to irradiate mostly vanadium alloy specimens in direct contact with lithium at temperatures of 450°C, 600°C, and 700°C in a europium-shielded RB position of the High Flux Isotope Reactor (HFIR). Some steel and ceramic specimens are included but are isolated from the primary lithium bath.
159
12.2 ASSEMBLY OF THE US-JAPAN JP-28 and JP-29 EXPERIMENTS AND START OF
IRRADIATION IN THE HFIR—D. K. Felde, D. W. Heatherly, S. H. Kim, R. G. Sitterson, R. E. Stoller, and C. Wang (Oak Ridge National Laboratory), M. Ando and H. Tanigawa (Japan Atomic Energy Research Institute, Tokai, Japan) This work is being carried out under Annex I of the Collaboration on Fusion Materials between the U.S. DOE and the Japan Atomic Energy Research Institute. The JP-28 and JP-29 capsules are part of the Phase-IV experiments with the goal of elucidating the effects of helium in candidate engineering and model alloys, and verifying the irradiation response of alloy F82H. These two capsules will extend the irradiation to significantly higher levels than the previous capsules in this series, JP-26 and JP-27, with planned exposure to greater than 50 dpa.
164

1.0 VANADIUM ALLOYS
1
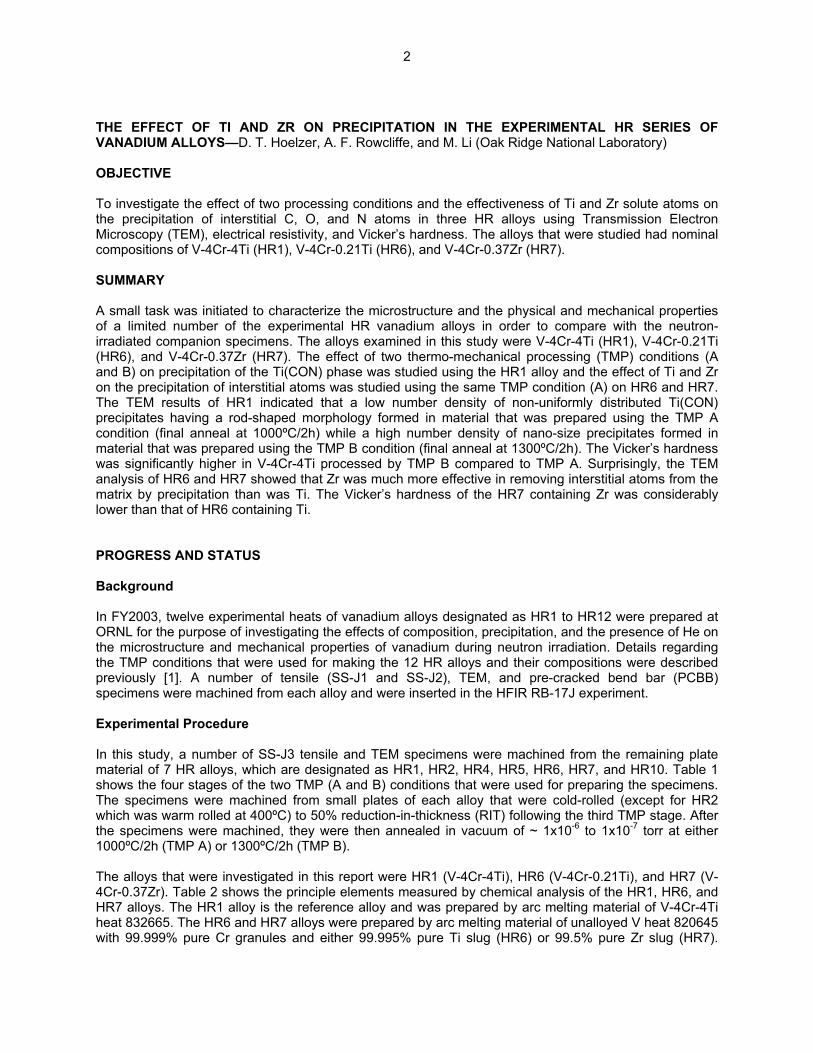
THE EFFECT OF TI AND ZR ON PRECIPITATION IN THE EXPERIMENTAL HR SERIES OF VANADIUM ALLOYS—D. T. Hoelzer, A. F. Rowcliffe, and M. Li (Oak Ridge National Laboratory) OBJECTIVE To investigate the effect of two processing conditions and the effectiveness of Ti and Zr solute atoms on the precipitation of interstitial C, O, and N atoms in three HR alloys using Transmission Electron Microscopy (TEM), electrical resistivity, and Vicker’s hardness. The alloys that were studied had nominal compositions of V-4Cr-4Ti (HR1), V-4Cr-0.21Ti (HR6), and V-4Cr-0.37Zr (HR7). SUMMARY A small task was initiated to characterize the microstructure and the physical and mechanical properties of a limited number of the experimental HR vanadium alloys in order to compare with the neutron-irradiated companion specimens. The alloys examined in this study were V-4Cr-4Ti (HR1), V-4Cr-0.21Ti (HR6), and V-4Cr-0.37Zr (HR7). The effect of two thermo-mechanical processing (TMP) conditions (A and B) on precipitation of the Ti(CON) phase was studied using the HR1 alloy and the effect of Ti and Zr on the precipitation of interstitial atoms was studied using the same TMP condition (A) on HR6 and HR7. The TEM results of HR1 indicated that a low number density of non-uniformly distributed Ti(CON) precipitates having a rod-shaped morphology formed in material that was prepared using the TMP A condition (final anneal at 1000ºC/2h) while a high number density of nano-size precipitates formed in material that was prepared using the TMP B condition (final anneal at 1300ºC/2h). The Vicker’s hardness was significantly higher in V-4Cr-4Ti processed by TMP B compared to TMP A. Surprisingly, the TEM analysis of HR6 and HR7 showed that Zr was much more effective in removing interstitial atoms from the matrix by precipitation than was Ti. The Vicker’s hardness of the HR7 containing Zr was considerably lower than that of HR6 containing Ti. PROGRESS AND STATUS Background In FY2003, twelve experimental heats of vanadium alloys designated as HR1 to HR12 were prepared at ORNL for the purpose of investigating the effects of composition, precipitation, and the presence of He on the microstructure and mechanical properties of vanadium during neutron irradiation. Details regarding the TMP conditions that were used for making the 12 HR alloys and their compositions were described previously [1]. A number of tensile (SS-J1 and SS-J2), TEM, and pre-cracked bend bar (PCBB) specimens were machined from each alloy and were inserted in the HFIR RB-17J experiment. Experimental Procedure In this study, a number of SS-J3 tensile and TEM specimens were machined from the remaining plate material of 7 HR alloys, which are designated as HR1, HR2, HR4, HR5, HR6, HR7, and HR10. Table 1 shows the four stages of the two TMP (A and B) conditions that were used for preparing the specimens. The specimens were machined from small plates of each alloy that were cold-rolled (except for HR2 which was warm rolled at 400ºC) to 50% reduction-in-thickness (RIT) following the third TMP stage. After the specimens were machined, they were then annealed in vacuum of ~ 1x10⁻⁶ to 1x10⁻⁷ torr at either 1000ºC/2h (TMP A) or 1300ºC/2h (TMP B). The alloys that were investigated in this report were HR1 (V-4Cr-4Ti), HR6 (V-4Cr-0.21Ti), and HR7 (V-4Cr-0.37Zr). Table 2 shows the principle elements measured by chemical analysis of the HR1, HR6, and HR7 alloys. The HR1 alloy is the reference alloy and was prepared by arc melting material of V-4Cr-4Ti heat 832665. The HR6 and HR7 alloys were prepared by arc melting material of unalloyed V heat 820645 with 99.999% pure Cr granules and either 99.995% pure Ti slug (HR6) or 99.5% pure Zr slug (HR7).
2
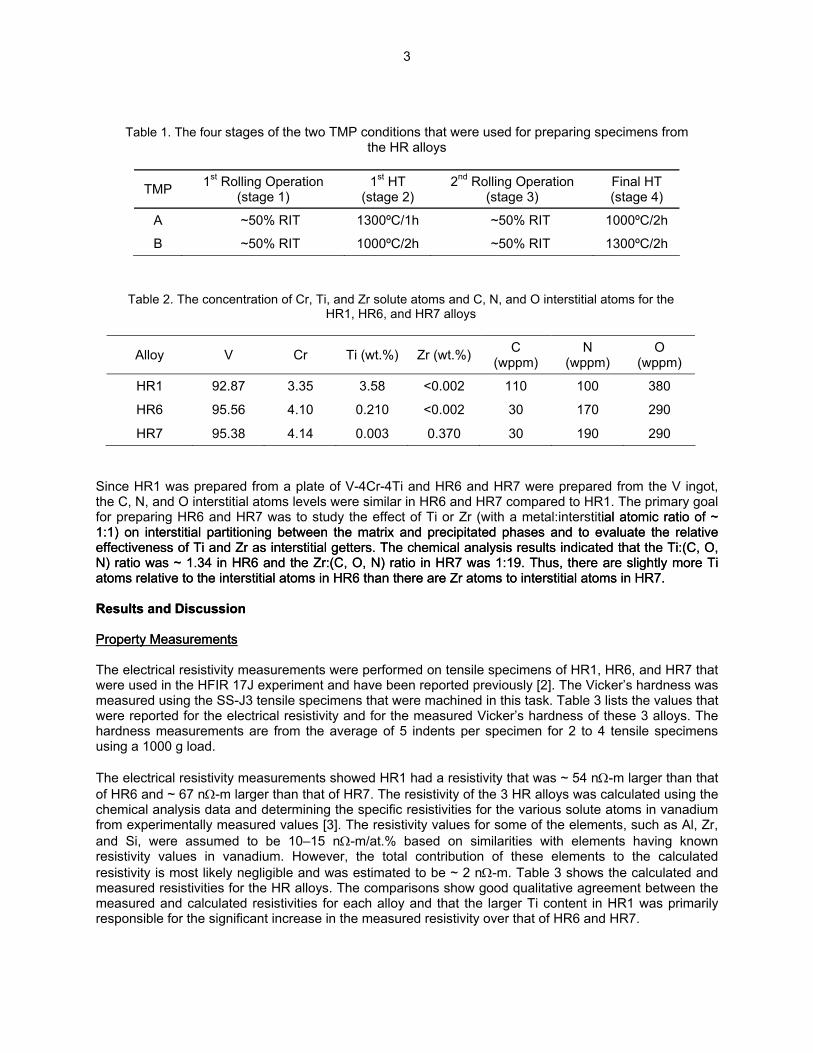
Table 1. The four stages of the two TMP conditions that were used for preparing specimens from the HR alloys
TMP 1st Rolling Operation (stage 1)
1st HT (stage 2)
2nd Rolling Operation (stage 3)
Final HT (stage 4)
A ~50% RIT 1300ºC/1h ~50% RIT 1000ºC/2h
B ~50% RIT 1000ºC/2h ~50% RIT 1300ºC/2h
Table 2. The concentration of Cr, Ti, and Zr solute atoms and C, N, and O interstitial atoms for the HR1, HR6, and HR7 alloys
C
(wppm) N
(wppm) O
(wppm) Alloy V Cr Ti (wt.%) Zr (wt.%)
HR1 92.87 3.35 3.58 <0.002 110 100 380
HR6 95.56 4.10 0.210 <0.002 30 170 290
HR7 95.38 4.14 0.003 0.370 30 190 290
Since HR1 was prepared from a plate of V-4Cr-4Ti and HR6 and HR7 were prepared from the V in, N, and O interstitial atoms levels were similar in HR6 and HR7 compared to HR1. The primary g
effect of Ti or
got, the C oal for preparing HR6 and HR7 was to study the Zr (with a metal:interstitial atomic ratio of ~ 1:1) on interstitial partitioning between the matrix and prec effective f T gette c cated i:(C, O, N) ratio was ~ 1.34 in HR6 and the Zr:(C, O in HR7 wa us, there a more Ti atoms rel e to the inte s in HR6 are Zr atom itial atom Results and Discussio
ial atomic ratio of ~ 1:1) on interstitial partitioning between the matrix and prec effective f T gette c cated i:(C, O, N) ratio was ~ 1.34 in HR6 and the Zr:(C, O in HR7 wa us, there a more Ti atoms rel e to the inte s in HR6 are Zr atom itial atom Results and Discussio
ipitated phases and to evaluate the relativeal analysis results indiipitated phases and to evaluate the relative
al analysis results indiness oness o i and Zr as interstitial i and Zr as interstitial rs, N) ratio rs, N) ratio
. The chemi. The chemi that the T that the Ts 1:19. Ths 1:19. Th re slightly re slightly
ativativ rstitial atomrstitial atom than there than there s to intersts to interst s in HR7. s in HR7.
n n
Property MeasurementsProperty Measurements The electrical resistivity measurements were performed on tensile specimens of HR1, HR6, and HR7 that were used in the HFIR 17J experiment and have been reported previously [2]. The Vicker’s hardness was measured using the SS-J3 tensile specimens that were machined in this task. Table 3 lists the values that were reported for the electrical resistivity and for the measured Vicker’s hardness of these 3 alloys. The hardness measurements are from the average of 5 indents per specimen for 2 to 4 tensile specimens using a 1000 g load. The electrical resistivity measurements showed HR1 had a resistivity that was ~ 54 nΩ-m larger than that of HR6 and ~ 67 nΩ-m larger than that of HR7. The resistivity of the 3 HR alloys was calculated using the chemical analysis data and determining the specific resistivities for the various solute atoms in vanadium from experimentally measured values [3]. The resistivity values for some of the elements, such as Al, Zr, and Si, were assumed to be 10–15 nΩ-m/at.% based on similarities with elements having known resistivity values in vanadium. However, the total contribution of these elements to the calculated resistivity is most likely negligible and was estimated to be ~ 2 nΩ-m. Table 3 shows the calculated and measured resistivities for the HR alloys. The comparisons show good qualitative agreement between the measured and calculated resistivities for each alloy and that the larger Ti content in HR1 was primarily responsible for the significant increase in the measured resistivity over that of HR6 and HR7.
3

Table 3. The electrical resitivity and Vicker’s hardness measured for HR1 (TMP A and B) and HR6 and HR7
Electrical Resistivity (nΩ-m) Vicker’s Alloy TMP Hardness Measured Calculated
HR1 A 289 282 153.4 - HR1 B 282 186.8
HR6 A 235 225 138.7 HR7 A 223 225 94.0
The Vicker’s hardness (VH) that was measured for the 3 HR alloys depended on both the TMP condition and alloy composition. In HR1, specimens prepared using TMP B showed an increase of 33.4 VH compared to those prepared using TMP A. It will be shown in the next section that the precipitation of the Ti-CON phase is altered by the higher temperature anneal used in TMP B (1300ºC) verses TMP A (1000ºC) and that this may account for the increase in hardness. The hardness that was measured in HR6 TMP A (V-4Cr-0.21Ti) was 138.7 VH, which is similar to the hardness of 139.7 VH that was measured in V-4Cr-4Ti after annealing at 1000ºC for 2h [4]. The reason for this could be due to differences in grain size and/or differences in the distribution of interstitial atoms in the vanadium matrix. The HR7 alloy had the lowest hardness value, which was 94.0 VH. This value is within the range of hardness measured for recrystallized pure vanadium [5]. This result is surprising since HR7 contains ~ 4.14 wt.% Cr (~ 4.06 at.% Cr). The Cr addition to vanadium should cause some hardening since it increases the yield and ultimate tensile strengths and decreases the ductility of vanadium [5]. Microstructural Characterization The results of the microstructural analysis of HR1, HR6, and HR7 using transmission electron microscopy (TEM) are separated into two sections. The first section focuses on the effect of the two TMP conditions on the precipitation in HR1, which is essentially re-arc melted V-4Cr-4Ti. The second section compares the effectiveness of Ti and Zr solute atoms on precipitation in V-4Cr -X, where X = 0.21Ti (HR6) or 0.37Zr (HR7), which were prepared with the TMP A condition. Section 1: HR1: TMP A Verses TMP B Figure 1 shows representative bright-field TEM micrographs of the microstructures observed in HR 1 prepared by the two processing conditions. Figure 1a shows the microstructure that was observed in HR1-A (TMP A). A low number density of non-uniformly distributed Ti-CON precipitates was observed in the grains and on low angle grain boundaries. However, the microstructure was not fully recrystallized. These precipitates appear to have inhibited the recrystallization in HR1 A during annealing at 1000ºC. This result is different from past research since it has generally been found that a final annealing at 1000ºC for 2h causes full recrystallization in ~ 40% cold-rolled V-4Cr-4Ti. The HR1 alloys were 50% cold-rolled prior to the final annealing at 1000ºC for 2h. The material of HR1-B (TMP B) was annealed at 1300ºC for 2h and this resulted in full recrystallization as shown in Fig. 1b. This figure shows a grain boundary and several dislocations that were decorated with small precipitates. The morphology of the precipitates that formed in HR1 A is shown in Fig. 2. The precipitates have shapes resembling small rods with a length-to-width aspect ratio of ~ 4–7:1. The diffraction analysis showed that the crystal structure of the precipitates was consistent with the fcc structure of the Ti(CON) phase, Fm3m space group [6]. The SAD pattern shown in Fig. 2b was obtained by tilting several degrees from the [001]bcc zone axis along g = 200. This imaging condition indicated that the rod-shaped Ti(CON) precipitates do not have the Baker-Nutting orientation relationship (OR) with the matrix. In previous work, it was shown that Ti(CON) precipitates with a plate-shaped morphology possess the Baker-Nutting OR with the matrix, which is <100>bcc//<110>fcc and 200bcc//220fcc [7].
4
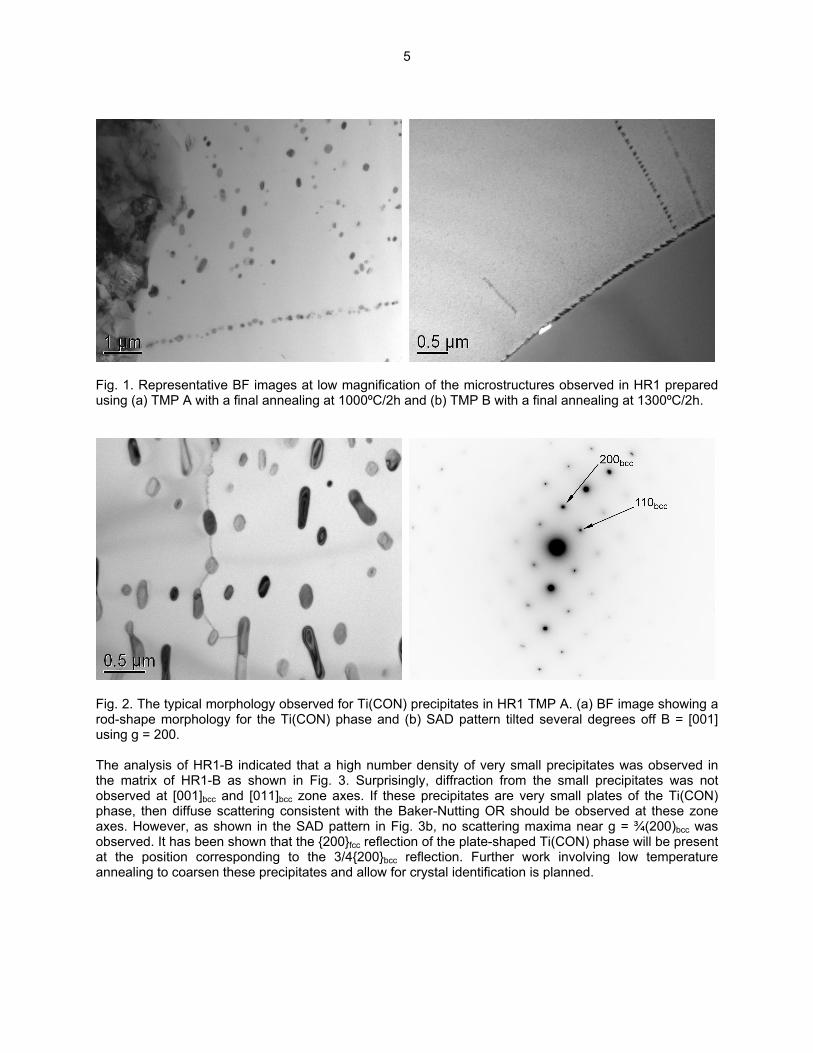
Fig. 1. Representative BF images at low magnification of the microstructures observed in HR1 prepared using (a) TMP A with a final annealing at 1000ºC/2h and (b) TMP B with a final annealing at 1300ºC/2h.
Fig. 2. The typical morphology observed for Ti(CON) precipitates in HR1 TMP A. (a) BF image showing a rod-shape morphology for the Ti(CON) phase and (b) SAD pattern tilted several degrees off B = [001] using g = 200. The analysis of HR1-B indicated that a high number density of very small precipitates was observed in the matrix of HR1-B as shown in Fig. 3. Surprisingly, diffraction from the small precipitates was not observed at [001]bcc and [011]bcc zone axes. If these precipitates are very small plates of the Ti(CON) phase, then diffuse scattering consistent with the Baker-Nutting OR should be observed at these zone axes. However, as shown in the SAD pattern in Fig. 3b, no scattering maxima near g = ¾(200)bcc was observed. It has been shown that the 200fcc reflection of the plate-shaped Ti(CON) phase will be present at the position corresponding to the 3/4200bcc reflection. Further work involving low temperature annealing to coarsen these precipitates and allow for crystal identification is planned.
5
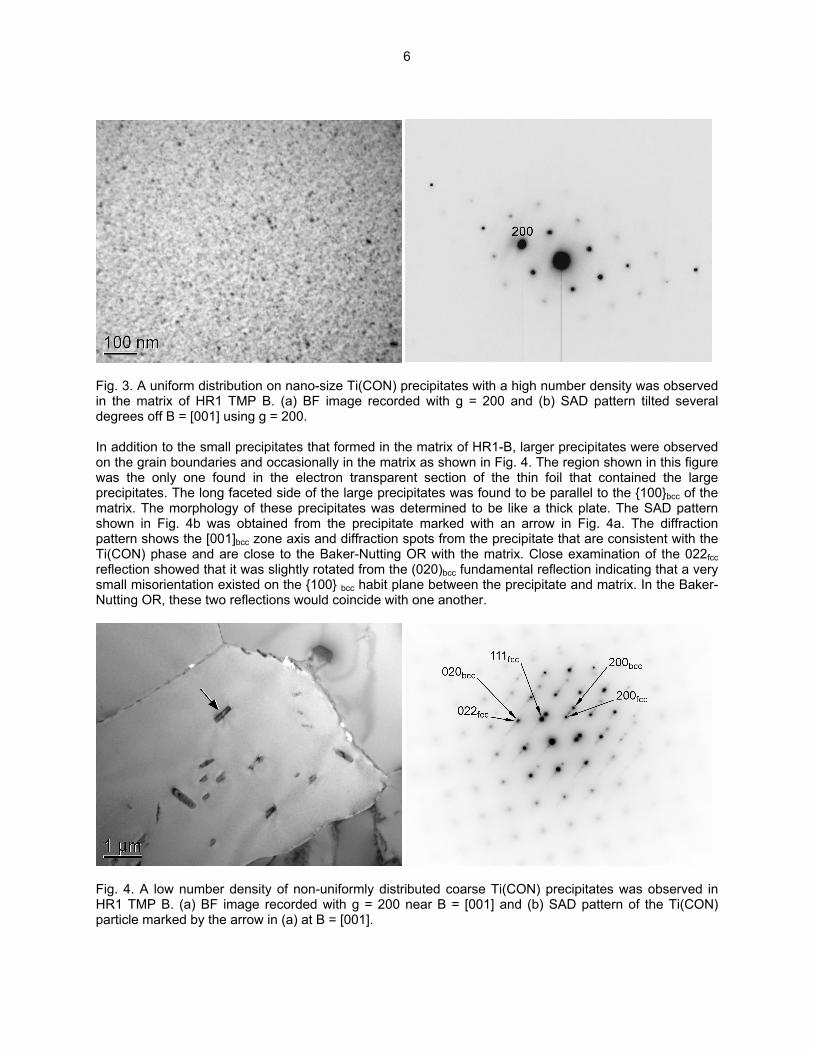
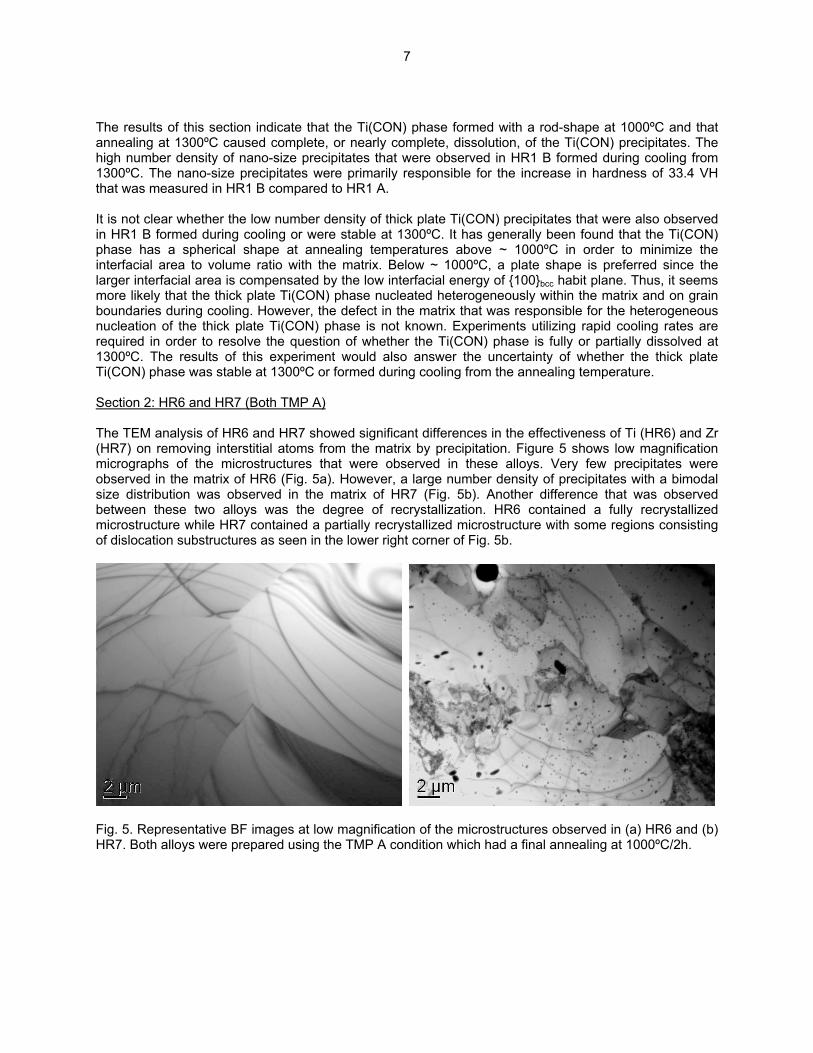
Fig. 3. A uniform distribution on nano-size Ti(CON) precipitates with a high number density was observed in the matrix of HR1 TMP B. (a) BF image recorded with g = 200 and (b) SAD pattern tilted several degrees off B = [001] using g = 200. In addition to the small precipitates that formed in the matrix of HR1-B, larger precipitates were observed on the grain boundaries and occasionally in the matrix as shown in Fig. 4. The region shown in this figure was the only one found in the electron transparent section of the thin foil that contained the large precipitates. The long faceted side of the large precipitates was found to be parallel to the 100bcc of the matrix. The morphology of these precipitates was determined to be like a thick plate. The SAD pattern shown in Fig. 4b was obtained from the precipitate marked with an arrow in Fig. 4a. The diffraction pattern shows the [001]bcc zone axis and diffraction spots from the precipitate that are consistent with the Ti(CON) phase and are close to the Baker-Nutting OR with the matrix. Close examination of the 022fcc reflection showed that it was slightly rotated from the (020)bcc fundamental reflection indicating that a very small misorientation existed on the 100 bcc habit plane between the precipitate and matrix. In the Baker-Nutting OR, these two reflections would coincide with one another.
Fig. 4. A low number density of non-uniformly distributed coarse Ti(CON) precipitates was observed in HR1 TMP B. (a) BF image recorded with g = 200 near B = [001] and (b) SAD pattern of the Ti(CON) particle marked by the arrow in (a) at B = [001].
6
The results of this section indicate that the Ti(CON) phase formed with a rod-shape at 1000ºC and that annealing at 1300ºC caused complete, or nearly complete, dissolution, of the Ti(CON) precipitates. The high number density of nano-size precipitates that were observed in HR1 B formed during cooling from 1300ºC. The nano-size precipitates were primarily responsible for the increase in hardness of 33.4 VH that was measured in HR1 B compared to HR1 A. It is not clear whether the low number density of thick plate Ti(CON) precipitates that were also observed in HR1 B formed during cooling or were stable at 1300ºC. It has generally been found that the Ti(CON) phase has a spherical shape at annealing temperatures above ~ 1000ºC in order to minimize the interfacial area to volume ratio with the matrix. Below ~ 1000ºC, a plate shape is preferred since the larger interfacial area is compensated by the low interfacial energy of 100bcc habit plane. Thus, it seems more likely that the thick plate Ti(CON) phase nucleated heterogeneously within the matrix and on grain boundaries during cooling. However, the defect in the matrix that was responsible for the heterogeneous nucleation of the thick plate Ti(CON) phase is not known. Experiments utilizing rapid cooling rates are required in order to resolve the question of whether the Ti(CON) phase is fully or partially dissolved at 1300ºC. The results of this experiment would also answer the uncertainty of whether the thick plate Ti(CON) phase was stable at 1300ºC or formed during cooling from the annealing temperature. Section 2: HR6 and HR7 (Both TMP A) The TEM analysis of HR6 and HR7 showed significant differences in the effectiveness of Ti (HR6) and Zr (HR7) on removing interstitial atoms from the matrix by precipitation. Figure 5 shows low magnification micrographs of the microstructures that were observed in these alloys. Very few precipitates were observed in the matrix of HR6 (Fig. 5a). However, a large number density of precipitates with a bimodal size distribution was observed in the matrix of HR7 (Fig. 5b). Another difference that was observed between these two alloys was the degree of recrystallization. HR6 contained a fully recrystallized microstructure while HR7 contained a partially recrystallized microstructure with some regions consisting of dislocation substructures as seen in the lower right corner of Fig. 5b.
Fig. 5. Representative BF images at low magnification of the microstructures observed in (a) HR6 and (b) HR7. Both alloys were prepared using the TMP A condition which had a final annealing at 1000ºC/2h.
7
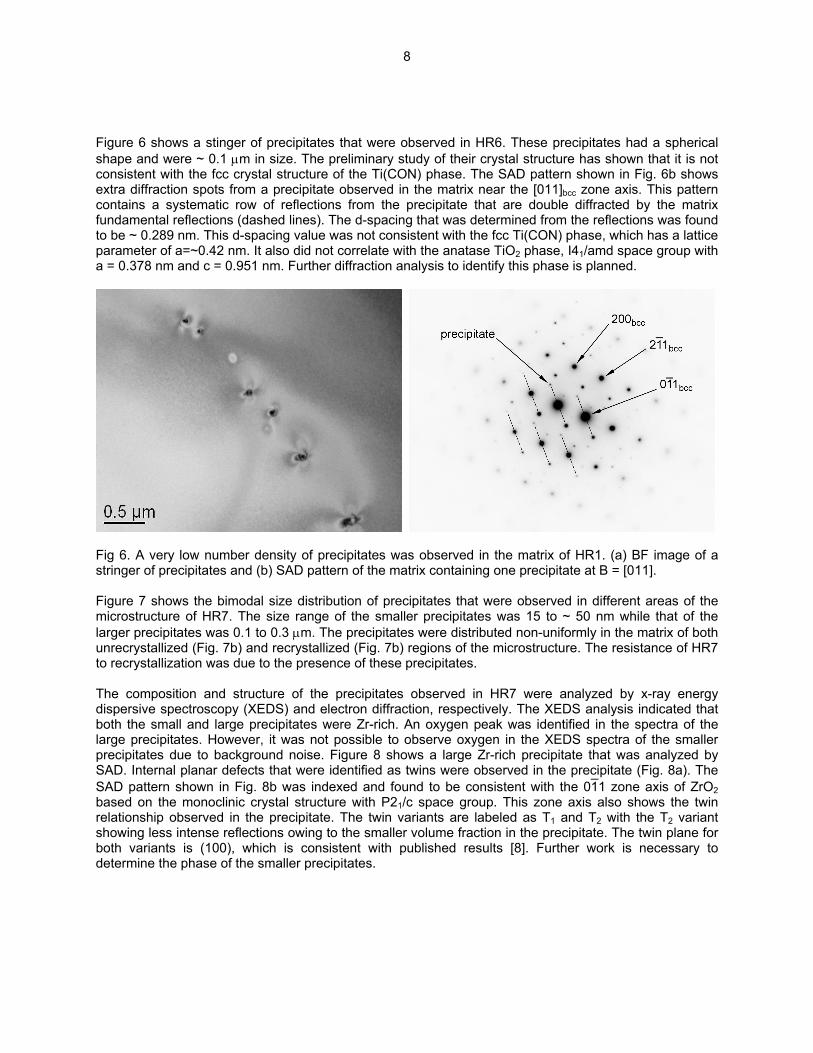
Figure 6 shows a stinger of precipitates that were observed in HR6. These precipitates had a spherical shape and were ~ 0.1 µm in size. The preliminary study of their crystal structure has shown that it is not consistent with the fcc crystal structure of the Ti(CON) phase. The SAD pattern shown in Fig. 6b shows extra diffraction spots from a precipitate observed in the matrix near the [011]bcc zone axis. This pattern contains a systematic row of reflections from the precipitate that are double diffracted by the matrix fundamental reflections (dashed lines). The d-spacing that was determined from the reflections was found to be ~ 0.289 nm. This d-spacing value was not consistent with the fcc Ti(CON) phase, which has a lattice parameter of a=~0.42 nm. It also did not correlate with the anatase TiO2 phase, I41/amd space group with a = 0.378 nm and c = 0.951 nm. Further diffraction analysis to identify this phase is planned.
Fig 6. A very low number density of precipitates was observed in the matrix of HR1. (a) BF image of a stringer of precipitates and (b) SAD pattern of the matrix containing one precipitate at B = [011]. Figure 7 shows the bimodal size distribution of precipitates that were observed in different areas of the microstructure of HR7. The size range of the smaller precipitates was 15 to ~ 50 nm while that of the larger precipitates was 0.1 to 0.3 µm. The precipitates were distributed non-uniformly in the matrix of both unrecrystallized (Fig. 7b) and recrystallized (Fig. 7b) regions of the microstructure. The resistance of HR7 to recrystallization was due to the presence of these precipitates. The composition and structure of the precipitates observed in HR7 were analyzed by x-ray energy dispersive spectroscopy (XEDS) and electron diffraction, respectively. The XEDS analysis indicated that both the small and large precipitates were Zr-rich. An oxygen peak was identified in the spectra of the large precipitates. However, it was not possible to observe oxygen in the XEDS spectra of the smaller precipitates due to background noise. Figure 8 shows a large Zr-rich precipitate that was analyzed by SAD. Internal planar defects that were identified as twins were observed in the precipitate (Fig. 8a). The SAD pattern shown in Fig. 8b was indexed and found to be consistent with the 011 zone axis of ZrO2 based on the monoclinic crystal structure with P21/c space group. This zone axis also shows the twin relationship observed in the precipitate. The twin variants are labeled as T1 and T2 with the T2 variant showing less intense reflections owing to the smaller volume fraction in the precipitate. The twin plane for both variants is (100), which is consistent with published results [8]. Further work is necessary to determine the phase of the smaller precipitates.
8

Fig. 7. (a) BF image showing a bimodal distribution of Zr-rich precipitates near a grain boundary that separates a recrystallized grain (left) and unrecrystallized grain (right) in HR7. (b) BF image showing the two precipitate sizes in the matrix of HR7 at higher magnification.
Fig. 8. Structural analysis of the large Zr-rich precipitates. (a) BF image showing twins in the precipitate and (b) SAD pattern of the twin relationship that is consistent with the 011 zone axis of ZrO2 and (100) twin plane. Several questions arise based on the results above that showed the larger precipitates to be ZrO2. This oxide phase should be very stable at high temperatures. It is possible that the large ZrO2 precipitates formed during the first annealing at 1300ºC in stage 2 (see Table 1). The diffusivity of Zr and the interstitial atoms should be very high at this temperature and this would lead to both a low nucleation rate and high growth rate for precipitates. The second annealing for HR7 was at 1000ºC in stage 4. A decrease in the solubility range of the interstitial atoms at 1000ºC would favor additional nucleation of precipitates. The smaller size may be attributed to lower diffusion rates at 1000ºC. Another issue that needed to be resolved is whether the ZrO2 precipitates contain any significant levels of N and C. The C content of HR7 was only ~ 30 wppm, but the N content was ~ 190 wppm. If ZrO2 phase has a low solubility range for C and N, then the smaller Zr-rich precipitates may be a different phase, such as
9
Zr(CN). The crystal structures for ZrC and ZrN are the same and are similar to that of the fcc Ti(CON) phase, which means that C and N would be isomorphous in the structure. Further work is required to determine the stability of ZrO2 at 1300ºC and the interstitial content of the smaller precipitates. It will be necessary to apply electron energy loss spectroscopy (EELS) to determine the interstitial content of the smaller precipitates. As described in the experimental procedures, HR6 and HR7 were prepared with Ti and Zr additions, respectively, that were closely matched on a 1:1 atomic percent ratio with the total concentration of interstitial C, O, and N atoms. The results indicate that Zr is much more effective in removing interstitial atoms from the matrix by precipitation than Ti. Both the hardness and electrical resistivity data support this conclusion. HR6 had a higher hardness than HR7 (138.7 VH vs. 94.0 VH) and a higher electrical resistivity (235 nΩ-m vs. 223 nΩ-m). These results are consistent with a large fraction of interstitial and solute Ti atoms in solution in HR6. On the other hand, the solute Zr atoms in HR7 react with the interstitial atoms and remove them from solution, which lowers the hardness and electrical resistivity. What is surprising is that the precipitates observed in HR7 do not cause any strengthening since the hardness value that was measured is within the range of hardness that is typically measured in unalloyed recrystallized vanadium. Conclusions The results of the characterization of three experimental HR vanadium alloys (HR1: V-4Cr-4Ti, HR6: V-4Cr-0.21Ti, and HR7: V-4Cr-0.37Zr) using TEM, electrical resistivity, and microhardness has revealed the following: (1) In HR1, the final anneal at 1300ºC (TMP B) caused complete, or nearly complete, dissolution of the
coarse Ti(CON) precipitates that formed during annealing at 1000ºC (TMP A). This resulted in the formation of a high number density of nano-size precipitates, presumed to be the Ti(CON) phase, in HR1 B compared to the low number density of non-uniformly distributed Ti(CON) precipitates having a rod-shaped morphology that formed in HR1 A.
(2) Significant hardening occurred in HR1 B due to the high-number density of nano-size precipitates.
The Vicker’s hardness increased from 153.4 in HR1 A to 186.8 in HR1 B. (3) The presence of 0.37wt.%Zr in HR7 A (V-4Cr-0.37Zr) was found to be much more effective in
removing interstitial atoms from the matrix by precipitation than the presence of 0.21wt.%Ti in HR6 A (V-4Cr-0.21Ti). Notably, precipitates having a bimodal size distribution formed in HR7 A. The large precipitates were identified as monoclinic ZrO2 phase while the smaller precipitates were Zr-rich but were not identified.
(4) The Vicker’s hardness and electrical resistivity measured in HR7 A were lower than that measured in
HR6 A. These results indicated that a larger fraction of interstitial atoms were removed from the matrix in HR7 A compared to HR6 and this could be attributed to the Zr addition.
Future Work If resources permit, the characterization of other HR alloys will be conducted. In addition, tensile tests are also planned for investigating the effects of composition and microstructural differences on the tensile properties and dynamic strain aging (DSA) behavior of the HR alloys. References [1] D. T. Hoelzer, A. F. Rowcliffe, and L. T. Gibson, DOE/ER-0313/34 (2003) 22–26. [2] M. Li, D. T. Hoelzer, and S. J. Zinkle, DOE/ER-0313/34 (2003) 2–5. [3] S. J. Zinkle, A. N. Gubbi, and W. S. Eatherly, DOE/ER-0313/21 (1996) 15–19. [4] D. T. Hoelzer, M. K. West, S. J. Zinkle, and A. F. Rowcliffe, J. Nucl. Mater. 283–287 (2000) 616–621.
10

[5] D. L. Harrod and R. E. Gold, Int. Metals Reviews 25(4) (1980) 163–221. [6] D. T. Hoelzer, DOE/ER-0313/25 (1998) 59–63. [7] D. T. Hoelzer and S. J. Zinkle, DOE/ER-0313/29 (2000) 19–25. [8] M. Ruhle and A. H. Heuer, in N. Claussen, M. Ruhle, and A. H. Heuer (ed.), Advances in Ceramics, Vol. 12 (The American Ceramic Society, Columbus, OH, 1983) 14–32.
11

2.0 CERAMIC COMPOSITE MATERIALS
12
APPLICATION OF BEND STRESS RELAXATION TECHNIQUE TO STUDY OF HIGH TEMPERATURE CREEP OF BULK SILICON CARBIDE CERAMICS—Y. Katoh and L. L. Snead (Oak Ridge National Laboratory) OBJECTIVE Bend stress relaxation (BSR) creep experiment was performed using thin strip specimens machined out of chemically vapor deposited (CVD) SiC in two different material classes, in a stress range of general interest for structural ceramics and composites. The primary objective of the experiment was to demonstrate the applicability of BSR technique to the thermal and irradiation creep studies of bulk SiC. Additionally, it was attempted to help understanding the high temperature deformation mechanism for high purity and stoichiometric SiC using the limited data obtained. SUMMARY Bend stress relaxation (BSR) creep of two forms of chemically vapor-deposited beta phase silicon carbide, namely polycrystalline and single-crystalline, was studied. The experiment was primarily oriented to demonstrate the applicability of BSR technique to irradiation-induced / enhanced creep behavior of silicon carbide in nuclear environments. It was demonstrated that thin strip samples with sufficient strength for BSR experiment could be machined and the small creep strains occurred in those samples could be measured to sufficient accuracy. The thermal creep experiment was conducted at 1573–1773K in argon to maximum hold time of 10 hours. Both materials exhibited similar primary creep deformation at the initial stresses of 65–100 MPa. The relative stress relaxation determined in the present experiment appeared significantly smaller than those reported for a commercial CVD SiC fiber at given temperature, implying a significant effect of the initial material conditions on the relaxation behavior. The analysis based on the relaxation time/temperature relationship gave an activation energy of ~ 850 kJ/mol for the primary responsible process in CVD SiC. PROGRESS AND STATUS Introduction Creep property is among the major potential lifetime-limiting factors for high temperature materials, including silicon carbide (SiC) ceramics and SiC-based ceramic composites. SiC-based ceramics and composites are considered for application in advanced fission and fusion power systems [1,2]. In nuclear environments, irradiation-induced/enhanced creep (“irradiation creep”) is added to thermally-activated creep deformation. In many cases, irradiation creep is caused by preferred absorption of supersaturated point defects at edge dislocations in favor of stress relaxation, and hence generally dominates at relatively low temperatures where thermal creep is not of concern [3]. Integrity of gas reactor fuel particles will be affected by creep of SiC shell as the primary fission gas container. Lifetime of SiC-based structural composites in fusion system will be potentially limited by irradiation creep [4]. Irradiation creep data for ceramics are extremely limited because of difficulty in applying conventional pressurized tube technique [5] or other external loading techniques to ceramic samples in nuclear reactors. Bend stress relaxation (BSR), developed for evaluation of creep properties of ceramic fibers [6], is a technique that is easily applicable to irradiation creep studies. BSR technique has been applied to irradiation creep studies on SiC-based ceramics in forms of thin fibers [7]. However, creep properties of bulk SiC (monolithic SiC or matrix material of ceramic composites) might differ significantly from those of SiC-based fibers, because of significant differences in grain size, micro/nano-structures and chemistry. Also, the stress range of concern for bulk SiC is significantly lower than that for fibers in many cases. In this work, BSR creep experiment was performed using thin strip specimens machined out of chemically vapor deposited (CVD) SiC in two different material classes, in a stress range of general interest for
13
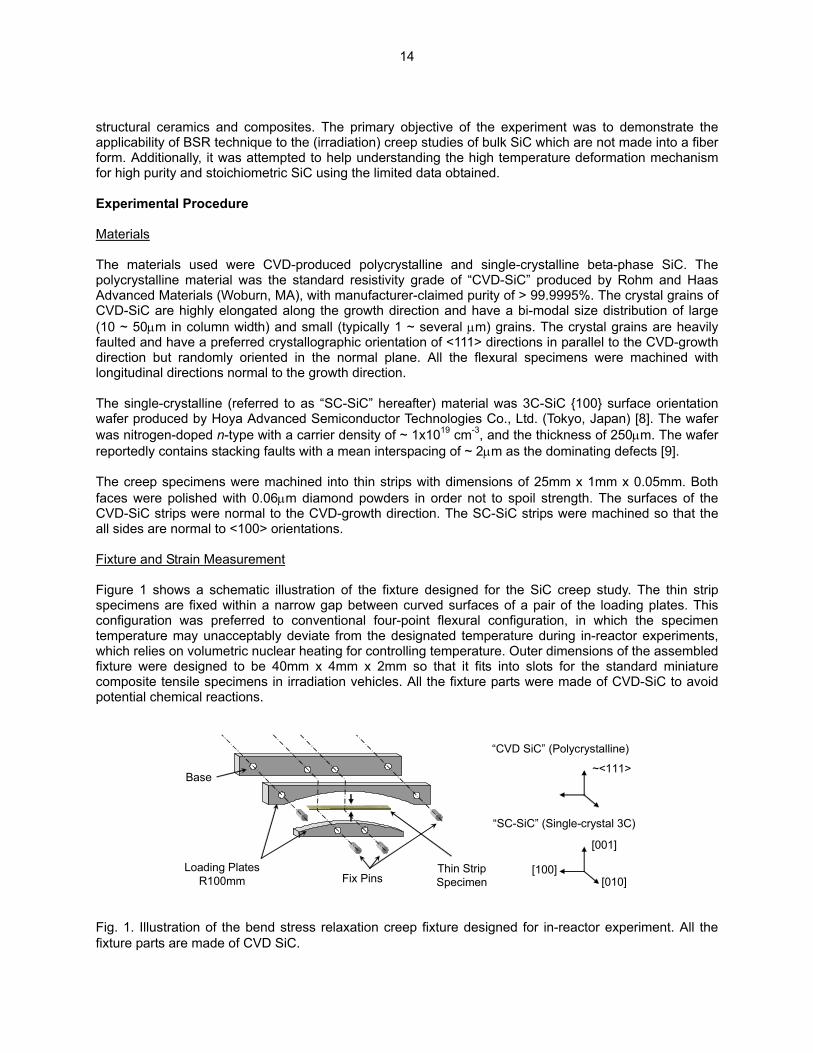
structural ceramics and composites. The primary objective of the experiment was to demonstrate the applicability of BSR technique to the (irradiation) creep studies of bulk SiC which are not made into a fiber form. Additionally, it was attempted to help understanding the high temperature deformation mechanism for high purity and stoichiometric SiC using the limited data obtained. Experimental Procedure Materials The materials used were CVD-produced polycrystalline and single-crystalline beta-phase SiC. The polycrystalline material was the standard resistivity grade of “CVD-SiC” produced by Rohm and Haas Advanced Materials (Woburn, MA), with manufacturer-claimed purity of > 99.9995%. The crystal grains of CVD-SiC are highly elongated along the growth direction and have a bi-modal size distribution of large (10 ~ 50µm in column width) and small (typically 1 ~ several µm) grains. The crystal grains are heavily faulted and have a preferred crystallographic orientation of <111> directions in parallel to the CVD-growth direction but randomly oriented in the normal plane. All the flexural specimens were machined with longitudinal directions normal to the growth direction. The single-crystalline (referred to as “SC-SiC” hereafter) material was 3C-SiC 100 surface orientation wafer produced by Hoya Advanced Semiconductor Technologies Co., Ltd. (Tokyo, Japan) [8]. The wafer was nitrogen-doped n-type with a carrier density of ~ 1x1019 cm-3, and the thickness of 250µm. The wafer reportedly contains stacking faults with a mean interspacing of ~ 2µm as the dominating defects [9]. The creep specimens were machined into thin strips with dimensions of 25mm x 1mm x 0.05mm. Both faces were polished with 0.06µm diamond powders in order not to spoil strength. The surfaces of the CVD-SiC strips were normal to the CVD-growth direction. The SC-SiC strips were machined so that the all sides are normal to <100> orientations. Fixture and Strain Measurement Figure 1 shows a schematic illustration of the fixture designed for the SiC creep study. The thin strip specimens are fixed within a narrow gap between curved surfaces of a pair of the loading plates. This configuration was preferred to conventional four-point flexural configuration, in which the specimen temperature may unacceptably deviate from the designated temperature during in-reactor experiments, which relies on volumetric nuclear heating for controlling temperature. Outer dimensions of the assembled fixture were designed to be 40mm x 4mm x 2mm so that it fits into slots for the standard miniature composite tensile specimens in irradiation vehicles. All the fixture parts were made of CVD-SiC to avoid potential chemical reactions.
Thin Strip Specimen
Loading Plates R100mm Fix Pins
Base~<111>
“CVD SiC” (Polycrystalline)
[001]
[100][010]
“SC-SiC” (Single-crystal 3C)
Fig. 1. Illustration of the bend stress relaxation creep fixture designed for in-reactor experiment. All the fixture parts are made of CVD SiC.
14
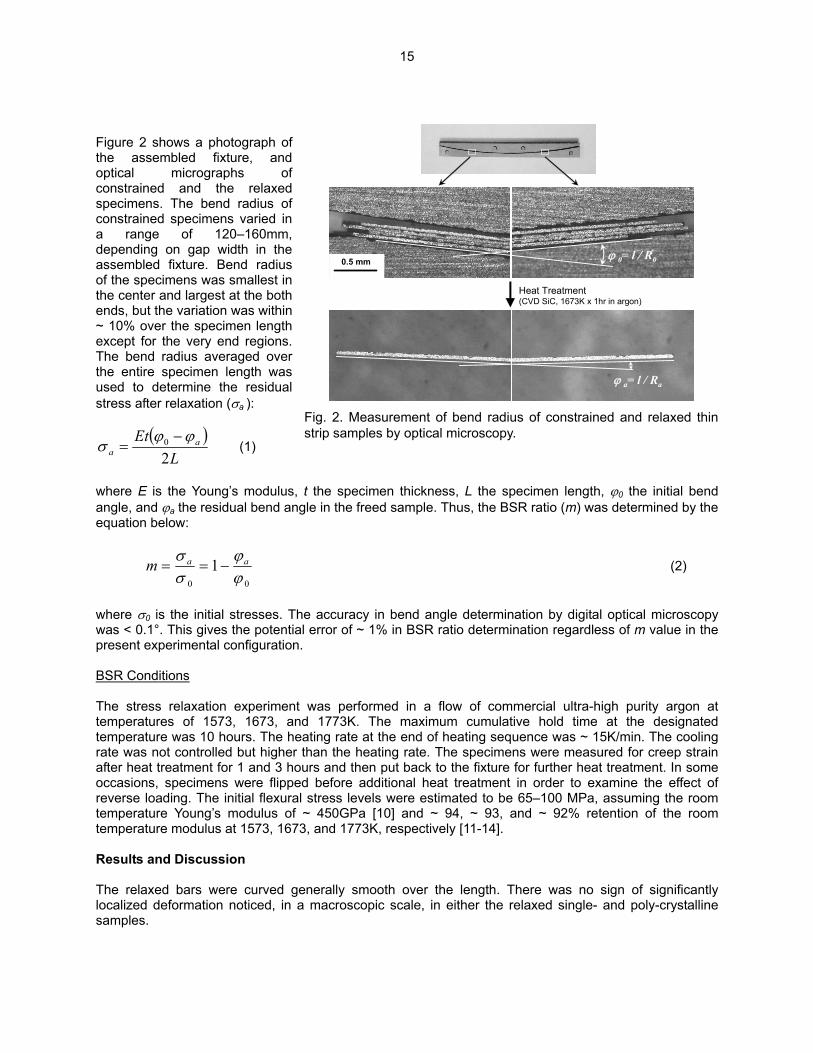
Figure 2 shows a photograph of the assembled fixture, and optical micrographs of constrained and the relaxed specimens. The bend radius of constrained specimens varied in a range of 120–160mm, depending on gap width in the assembled fixture. Bend radius of the specimens was smallest in the center and largest at the both ends, but the variation was within ~ 10% over the specimen length except for the very end regions. The bend radius averaged over the entire specimen length was used to determine the residual stress after relaxation (σa ):
0.5 mm0.5 mm ϕ 0= l / R0
Heat Treatment(CVD SiC, 1673K x 1hr in argon)
ϕ a= l / Ra
Fig. 2. Measurement of bend radius of constrained and relaxed thin strip samples by optical microscopy.
( )
LEt a
a 20 ϕϕσ −
= (1)
where E is the Young’s modulus, t the specimen thickness, L the specimen length, ϕ0 the initial bend angle, and ϕa the residual bend angle in the freed sample. Thus, the BSR ratio (m) was determined by the equation below:
00
1ϕϕ
σσ aam −== (2)
where σ0 is the initial stresses. The accuracy in bend angle determination by digital optical microscopy was < 0.1°. This gives the potential error of ~ 1% in BSR ratio determination regardless of m value in the present experimental configuration. BSR Conditions The stress relaxation experiment was performed in a flow of commercial ultra-high purity argon at temperatures of 1573, 1673, and 1773K. The maximum cumulative hold time at the designated temperature was 10 hours. The heating rate at the end of heating sequence was ~ 15K/min. The cooling rate was not controlled but higher than the heating rate. The specimens were measured for creep strain after heat treatment for 1 and 3 hours and then put back to the fixture for further heat treatment. In some occasions, specimens were flipped before additional heat treatment in order to examine the effect of reverse loading. The initial flexural stress levels were estimated to be 65–100 MPa, assuming the room temperature Young’s modulus of ~ 450GPa [10] and ~ 94, ~ 93, and ~ 92% retention of the room temperature modulus at 1573, 1673, and 1773K, respectively [11-14]. Results and Discussion The relaxed bars were curved generally smooth over the length. There was no sign of significantly localized deformation noticed, in a macroscopic scale, in either the relaxed single- and poly-crystalline samples.
15

Flexural stress in the constrained specimens, calculated from the constrained and unconstrained bend radii, is plotted in Fig. 3 as a function of cumulative hold time at the designated temperature. In all cases, the stress exhibited a steep initial drop during the first hour, followed by the periods of much slower relaxation process. Despite of the somewhat varied initial stresses, higher relaxation rates were generally noted at higher temperatures, indicating the responsible mechanism is thermally activated. The residual stress approached to an asymptotic value, which varied but did not appear to systematically depend on materials or temperature. The observed stress relaxation behavior is believed to be due to primary creep, since SiC is known to exhibit only primary creep in the temperature range of this work [15]. CVD-SiC and SC-SiC exhibited similar stress relaxation behavior during the first hour at all temperatures, although the absolute relaxation rate of SC-SiC might be slightly lower than that of CVD-SiC. The residual stress in SC-SiC remained almost unchanged after the first hour of heat treatment, whereas CVD-SiC continued to reduce in stress between 1 and ~ 10 hours. The minimum stresses achieved were higher for SC-SiC than for CVD-SiC at 1673 and 1773K, while they appeared opposite at 1573K, where the initial stress in the CVD-SiC sample was significantly higher than in the SC-SiC sample. Despite of the differences noted above, the similarity in stress relaxation behavior between CVD-SiC and SC-SiC during the first hour suggests that the identical operating mechanism is responsible for the initial stage of the primary creep, eliminating the possibility of major contribution of the grain boundary diffusion and/or sliding [16,17].
0
20
40
60
80
100
120
0 2 4 6 8 10
Time Elapsed (hr)S
tres
s (M
Pa)
12
CVD-SiC at 1773K SC-SiC at 1773KCVD-SiC at 1673K SC-SiC at 1673KCVD-SiC at 1573K SC-SiC at 1573K
Reverse-Loaded
Reverse-Loaded
Fig . 3. Relaxation behavior of the maximum surface stress in polycrystal (CVD-SiC) and single-crystal (SC-SiC) beta-SiC samples during BSR experiment. Reverse loading was applied to some specimens by putting back into the fixture after flipping.
Carter et al. reported a lack of compressive stress creep deformation in CVD-SiC at temperatures < 1923K when the specimens were loaded along the CVD-growth direction, and attributed it to the dislocation motion on 111 slip planes as the responsible creep mechanism [18]. If we assume the dislocation glide along <110> directions on 111 planes as the primary operating mechanism, the loading orientation in SC-SiC specimens should give significantly higher average Schmid factor than in CVD-SiC specimens. The possibly lower stress relaxation rate and the higher minimum stress in SC-SiC observed in this work indicate that the operation of such mechanism is unlikely. Figure 4 plots the BSR ratio, m, against the reciprocal temperature. The m values for CVD-SiC exhibited the expected hold time-dependence, whereas those for SC-SiC did not due to the very small deformation during the period beyond 1 hour. The stress relaxation in the SC-SiC samples needs to be measured after shorter hold time, or preferably be measured by an in-situ type experiment, in order to determine the effect of hold time on the m values. Assuming a thermally activated relaxation mechanism, the activation energy (Q) for the responsible process can be determined from the temperature dependence of m values at different hold times by the relationship,
16
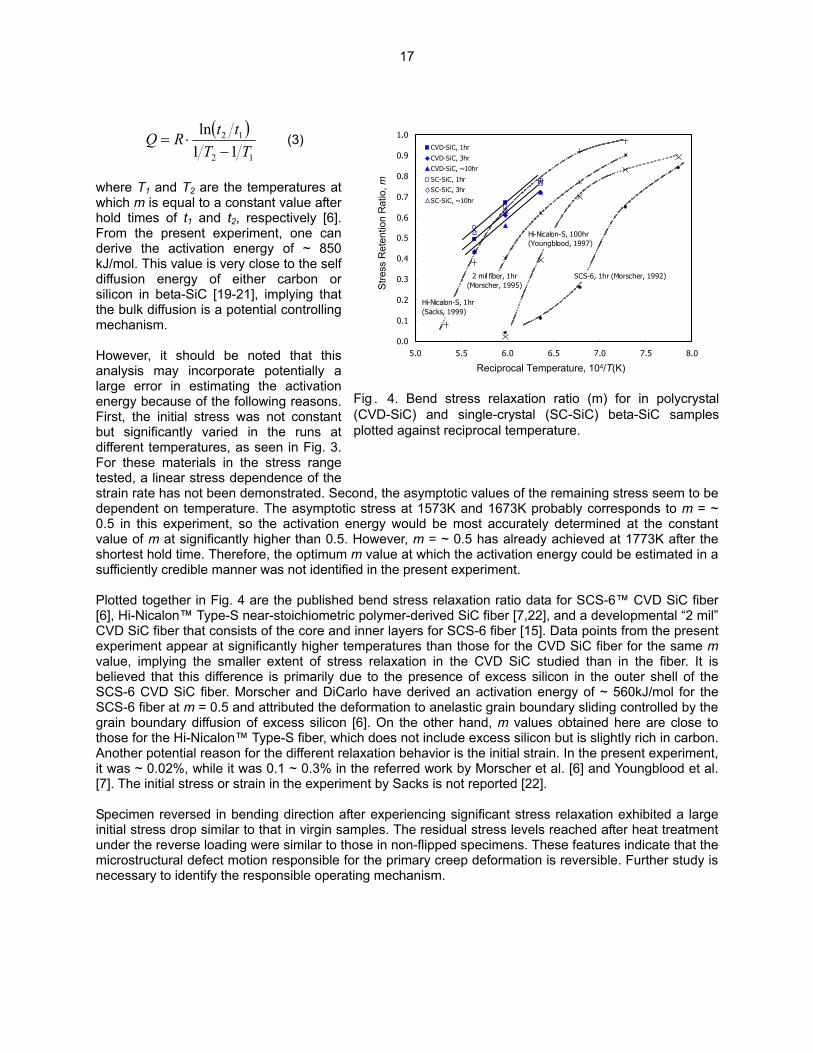
( )
12
12
11ln
TTttRQ
−⋅= (3)
where T1 and T2 are the temperatures at which m is equal to a constant value after hold times of t1 and t2, respectively [6]. From the present experiment, one can derive the activation energy of ~ 850 kJ/mol. This value is very close to the self diffusion energy of either carbon or silicon in beta-SiC [19-21], implying that the bulk diffusion is a potential controlling mechanism. However, it should be noted that this analysis may incorporate potentially a large error in estimating the activation energy because of the following reasons. First, the initial stress was not constant but significantly varied in the runs at different temperatures, as seen in Fig. 3. For these materials in the stress range tested, a linear stress dependence of the strain rate has not been demonstrated. Second, the asymptotic values of the remaining stress seem to be dependent on temperature. The asymptotic stress at 1573K and 1673K probably corresponds to m = ~ 0.5 in this experiment, so the activation energy would be most accurately determined at the constant value of m at significantly higher than 0.5. However, m = ~ 0.5 has already achieved at 1773K after the shortest hold time. Therefore, the optimum m value at which the activation energy could be estimated in a sufficiently credible manner was not identified in the present experiment.
0.0
0.1
0.2
0.3
0.4
0.5
0.6
0.7
0.8
0.9
1.0
5.0 5.5 6.0 6.5 7.0 7.5 8.0
Reciprocal Temperature, 1E+4/T(K)St
ress
Rel
axat
ion
Ratio
, m
CVD-SiC, 1hr
CVD-SiC, 3hrCVD-SiC, ~10hr
SC-SiC, 1hrSC-SiC, 3hr
SC-SiC, ~10hr
SCS-6, 1hr (Morscher, 1992)
Hi-Nicalon-S, 100hr(Youngblood, 1997)
Hi-Nicalon-S, 1hr(Sacks, 1999)
2 mil fiber, 1hr(Morscher, 1995)
Reciprocal Temperature, 104/T(K)St
ress
Ret
entio
n R
atio
, m
Fig . 4. Bend stress relaxation ratio (m) for in polycrystal (CVD-SiC) and single-crystal (SC-SiC) beta-SiC samples plotted against reciprocal temperature.
Plotted together in Fig. 4 are the published bend stress relaxation ratio data for SCS-6™ CVD SiC fiber [6], Hi-Nicalon™ Type-S near-stoichiometric polymer-derived SiC fiber [7,22], and a developmental “2 mil” CVD SiC fiber that consists of the core and inner layers for SCS-6 fiber [15]. Data points from the present experiment appear at significantly higher temperatures than those for the CVD SiC fiber for the same m value, implying the smaller extent of stress relaxation in the CVD SiC studied than in the fiber. It is believed that this difference is primarily due to the presence of excess silicon in the outer shell of the SCS-6 CVD SiC fiber. Morscher and DiCarlo have derived an activation energy of ~ 560kJ/mol for the SCS-6 fiber at m = 0.5 and attributed the deformation to anelastic grain boundary sliding controlled by the grain boundary diffusion of excess silicon [6]. On the other hand, m values obtained here are close to those for the Hi-Nicalon™ Type-S fiber, which does not include excess silicon but is slightly rich in carbon. Another potential reason for the different relaxation behavior is the initial strain. In the present experiment, it was ~ 0.02%, while it was 0.1 ~ 0.3% in the referred work by Morscher et al. [6] and Youngblood et al. [7]. The initial stress or strain in the experiment by Sacks is not reported [22]. Specimen reversed in bending direction after experiencing significant stress relaxation exhibited a large initial stress drop similar to that in virgin samples. The residual stress levels reached after heat treatment under the reverse loading were similar to those in non-flipped specimens. These features indicate that the microstructural defect motion responsible for the primary creep deformation is reversible. Further study is necessary to identify the responsible operating mechanism.
17
References [1] R. H. Jones et al., Promise and challenges of SiCf/SiC composites for fusion energy applications, J. Nucl. Mater. 307–311 (2002) 1057–72. [2] G. O. Hayner et al., Next Generation Nuclear Plant Materials Research and Development Program Plan, INEEL/EXT-04-02347, Revision 1, Idaho National Engineering and Environmental Laboratory, Idaho Falls, Idaho (2004). [3] J. L. Straalsund, Radiation Effects in Breeder Reactor Structural Materials, Metallurgical Society of American Institute of Mining, Metallurgical, and Petroleum Engineers, New York (1977). [4] R. Scholz and G. E. Youngblood, Irradiation creep of advanced silicon carbide fibers, J. Nucl. Mater. 283–287 (2000) 372–75. [5] G. W. Lewthwaite, Irradiation creep during void production, J. Nucl. Mater. 46 (1973) 324–28. [6] G. N. Morscher and J. A. DiCarlo, A simple test for thermomechanical evaluation of ceramic fibers, J. Am. Ceram. Soc. 75 (1992) 136–40. [7] G. E. Youngblood, R. H. Jones, G. N. Morscher, and A. Kohyama, Creep Behavior for Advanced Polycrystalline SiC Fibers, Fusion Reactor Materials Semiannual Progress Report, DOE/ER-0313/22 (1997) 81–86. [8] H. Nagasawa, K. Yagi, and T. Kawahara, 3C-SiC Hetero-epitaxial growth on undulant Si(001) substrate, J. Crystal Growth 237–239 (2002) 1244–49. [9] E. Polychroniadis, M. Syvajarvi, R. Yakimova, and J. Stoemenos, Microstructural characterization of very thick freestanding 3C-SiC wafers, J. Crystal Growth 263 (2004) 68–75. [10] Y. Katoh and L. L. Snead, Mechanical Properties of Cubic Silicon Carbide after Neutron Irradiation at Elevated Temperatures, Journal of ASTM International (in press). [11] J. R. Hellmann, D. J. Green, and M. F. Modest, Physical Property Measurements of High Temperature Composites, in J. R. Hellmann and B. K. Kennedy (eds.), Projects Within the Center for Advanced Materials (1990) 95–114. [12] W. S. Coblenz, Elastic moduli of boron-doped silicon carbide, J. Am. Ceram. Soc. 58 (1975) 530–531. [13] R. G. Munro, Material properties of a sintered-SiC, J. Phys. Chem. Ref. Data 26 (1997) 1195–1203. [14] J. Kubler, Weibull Characterization of Four Hipped/Posthipped Engineering Ceramics Between Room Temperature and 1500°C, Mechanische Charakterisierung von Hochleistungskeramik Festigkeitsunte, EMPA Swiss Federal Laboratories for Materials Testing and Research, 1–88 (1992). [15] G. N. Morscher, C. A. Lewinsohn, C. E. Bakis, R. E. Tressler, and T. Wagner, Comparison of bend stress relaxation and tensile creep of CVD SiC fibers, J. Am. Ceram. Soc. 78 (1995) 3244–52. [16] C. A. Lewinsohn, L. A. Giannuzzi, C. E. Bakis, and R. E. Tressler, High-temperature creep and microstructural evolution of chemically vapor-deposited silicon carbide fibers, J. Am. Ceram. Soc. 82 (1999) 407–13. [17] J. A. DiCarlo, Creep of chemically vapour deposited SiC fibers, J. Mater. Sci. 21 (1986) 217–224. [18] C. H. Carter, Jr., R. F. Davis, and J. Bentley, Kinetics and mechanisms of high-temperature creep in silicon carbide: II. Chemically vapor deposited, J. Am. Ceram. Soc. 67 (1984) 732–40. [19] M. H. Hon, R. F. Davis, and D. E. Newbury, J. Mater. Sci. 15 (1980) 2073. [20] J. Li, L. Porter, and S. Yip, Atomistic modeling of finite-temperature properties of crystalline beta-SiC: II. Thermal conductivity and effects of point defects, J. Nucl. Mater. 255 (1998) 139–152. [21] F. Gao, W. J. Weber, M. Posselt, and V. Belko, Atomistic study of intrinsic defect migration in 3C-SiC, Phys. Rev. B 69 (2004) 245–205. [22] M. D. Sacks, Effect of composition and heat treatment conditions on the tensile strength and creep resistance of SiC-based fibers, J. Eu. Ceram. Soc. 19 (1999) 2305–15.
18
MECHANICAL PROPERTIES OF FCVI SIC-MATRIX COMPOSITES REINFORCED WITH TYRANNO™-SA GRADE-3 SIC FIBER FABRICS—Y. Katoh, T. Nozawa, L. L. Snead (Oak Ridge National Laboratory) OBJECTIVE The objective of this work is to determine tensile properties of structural ceramic composites with reinforcement by Tyranno™-SA Grade-3 near-stoichiometric silicon carbide (SiC) fiber fabrics, pyrolytic carbon (PyC) interlayer, and SiC matrix densified through forced-flow chemical vapor infiltration process. An emphasis was put on role of the PyC interlayer on various tensile and fracture properties of the composites. SUMMARY Tensile properties of Tyranno™-SA near-stoichiometric SiC-fiber-reinforced chemically vapor infiltrated SiC-matrix composites with pyrolytic carbon interphases were experimentally studied. The influence of interphase thickness in a range of 60–300nm on the tensile properties of the materials appeared to be generally minor. Thin interphase (< 100nm) did not result in significant deteriorating effect on composite properties, which has commonly been reported for conventional SiC fiber composites. For very thin interphase (< 60nm) composites, a slight decrease in fracture strain and a substantial increase in interfacial sliding stress were noted. Increases in ultimate tensile strength and fracture strain were observed at much thicker interphase (> 600nm) at an expense of composite stiffness. PROGRESS AND STATUS Introduction Silicon carbide (SiC) continuous fiber-reinforced SiC matrix composites (SiC/SiC composites) are promising structural materials for internal components of nuclear reactors [1 ] . Particularly, SiC/SiC composites are considered for the manufacture of control rod parts in Very High Temperature Reactors (VHTR), which is the concept of a gas-cooled thermal fission reactor with ceramic fuel, based on the expectation that replacing carbon-based materials with SiC/SiC composites provides much longer life time of the components and hence ultimately reduces the total cost of energy. SiC/SiC composites are also considered as very attractive materials for core components in gas-cooled fast breeder reactors (GFR) [2], blanket/first wall structures and inserts in fusion power reactors [3,4], and intermediate heat exchangers of gas-cooled nuclear systems [5] in a long term. Such a high expectation for SiC/SiC composites in nuclear energy systems is based on various preferred properties of the beta-phase SiC such as superior thermo-physical and thermo-mechanical properties, generally reasonable corrosion resistance, inherently low induced radioactivity and low decay heat, and excellent neutron irradiation tolerance [6]. The service environment of SiC/SiC composites for nuclear applications involves a strong neutron radiation field while other conditions like temperature and oxidative environment will be relatively mild. For example, control rods and guide tubes of VHTR are expected to receive a life time fast neutron dose of > 2x1026 n/m2 (E > 0.1MeV), which corresponds to a damage level of approximately 20 displacement per atom (dpa) in SiC, while the helium coolant in VHTR pressure vessel will have a normal outlet temperature and oxygen/water vapor concentrations of ~ 1,000°C and ~ 0.1 parts-per-million (for both O2 and H2O), respectively. Early generations of SiC/SiC composites produced before the mid-1990s were highly susceptible to neutron damage and exhibited severe strength degradation before receiving a few dpa of irradiation damage [7]. The strength reduction was attributed to interfacial debonding due to the significant irradiation-induced shrinkage of non-stoichiometric SiC(-based) fibers (e.g., Ceramic-grade [CG] Nicalon™ and Hi-Nicalon™). As near-stoichiometric and high crystallinity SiC fibers (Hi-Nicalon™ Type-S and Tyranno™-SA) became available, composites with these fibers, pyrolytic carbon (PyC)
19

interphase, and chemically vapor infiltrated (CVI) SiC-matrices were put in research reactors to prove their largely improved irradiation resistance [8,9]. According to irradiation studies reported for chemically vapor deposited (CVD) SiC, it is very likely that polycrystalline beta-SiC maintains mechanical strength up to high neutron fluences at temperatures of interest for nuclear applications (roughly 500–1000°C) [10,11]. This immatrix or near-stoichiometric SiC fiber might not cacomposites. Therefore, the behavior of the PyC interthe irradiation response of the composites. Generalirradiation damage than SiC [12]. It is reported thasignificant microstructural modification in the PyC intewhile the other constituents retained the microstructudegradation of single-fiber push-in shear strength ostoichiometric SiC fiber CVI-SiC composites with 6000.5dpa at 300 and 500°C [14]. Therefore, one of the tolerance of SiC/SiC composites is to introduce signapplied. In the present work, the influence of PyC intin near-stoichiometric SiC fiber CVI-SiC matrix compo Experimental Procedure The composites used in this study were produced thrinfiltration (F-CVI) process developed at Oak Ridge Nof Tyranno™-SA Grade-3 (SA3) sintered SiC fibersdiameter of ~ 7.5µm, in a 2D plain-woven architectuSA3-S1I16PX, respectively) [16]. Properties of TyranThread count of the fabric is 17 yarns per inch and theach composite, approximately 70 fabrics punched inorientation [(0/90) hereafter] and held tightly in a graphmatrix densification. The PyC interphase was deposited in an isotherma1100°C, total pressure of 5kPa, and the flow rates oargon, respectively. The deposition rate of PyC wcontrolled by the time of deposition. The matrix infi(MTS, Gelest Inc., Tullytown, Pennsylvania) at the fiback pressure of ~ 100kPa. The MTS precursor wasand the carrier of 0.3g/min and 450cm3/min, respe20nm/min. A thin SiC coating was applied to somdeposition in order to modify the effective surface roudeposited at one half of the flow rates for both MTconfiguration. A list of materials is provided in Table the 3-inch diameter discs was typically ±30%.
20
Table 1. Properties of Tyranno™-SA Grade-3 fiber
Properties Tyranno™-SA Grade-3 Atomic composition SiC1.08Al0.005 Diameter (µm) 7.5 Number of filaments / yarn 1600 Tensile strength (GPa) 2.5 Tensile modulus (GPa) 400 Mass density (g/cm3) 3.1
plies that irradiation effects on either the CVI-SiC use severe irradiation-induced degradation of the
phases during irradiation is most likely to determine ly, carbon materials are much more susceptible to t ion irradiation to 10 dpa at 600°C caused very rphase in near-stoichiometric SiC fiber composites, ral stability [13]. In another experiment, an obvious f the fiber-matrix interface was observed in near-nm-thick PyC interphase after neutron irradiation to potential directions to further improve the irradiation ificantly thinner PyC interphase than those usually
erphase thickness on tensile fast fracture properties sites was systematically studied.
ough a forced-flow thermal gradient chemical vapor ational Laboratory [15]. The reinforcement consisted (Ube Industries, Ltd., Ube, Japan), with average re (fiber and cloth lot numbers PSA-S17I16PX and no™-SA Grade-3 fiber are summarized in Table 1. e number of filaments per yarn is 1600 nominal. For to 3-inch diameter circles were stacked in a [0°/90°] ite fixture for interphase deposition and subsequent
l configuration using propylene as the precursor at f 50 and 1000 cm3/min for propylene and diluting
as ~ 1nm/min. Thickness of the interphase was ltration was carried out using methyltrichlorosilane xture’s hot surface temperature of 1050°C and the carried by hydrogen bubbling at flow rates for MTS ctively. The deposition rate is estimated to be ~ e of the composites prior to the PyC interphase ghness of the fibers. In such cases, the coating was S and hydrogen and at 1100°C in an isothermal
2. The variation of PyC interphase thickness within
Material ID CVI-1266 CVReinforcement Fiber Architecture
Fiber volume fraction 35.2% 3Interphase thickness (nm) SiC (measured average) None (range of scatter) PyC (measured average) 42 (range of scatter) 26–54 8Matrix / Composite Density (g/cm3) 2.62 Porosity 17.4% 1
Tensile specimens were machined orectangular blocks were also cut from characterization, and to allow measurefield emission scanning electron microwithin individual blocks were ~ 10%. electron microscopy for closer examinFiber volume fraction and apparent mGenerally, the PyC interphase thicknesrelatively thick at the bottom center (rdeviation of the average PyC interphasaverage in a single composite disc; fospecimens of the composite CVI-1266 shown in Table 2. The matrix density waat the bottom edge. The (micro-) strucstudied in a companion work [17]. A miniature tensile specimen geometremployed for the tensile testing [18]. Ththick. The gauge width was selected sois the minimum requirement to avoid thnumber of fiber strands [19]. The gaugtesting was performed following genedisplacement rate of 0.5mm/min. For tboth faces by wedge grips with aluminmeasured using a set of strain gaugcomponent appeared to be less than 10used for analysis. The elevated temperature tensile testestimated oxygen partial pressure durinafter one hour of equilibration periodmaintained during the testing. Only limitof the testing was performed without aelevated temperature testing are reporte
21
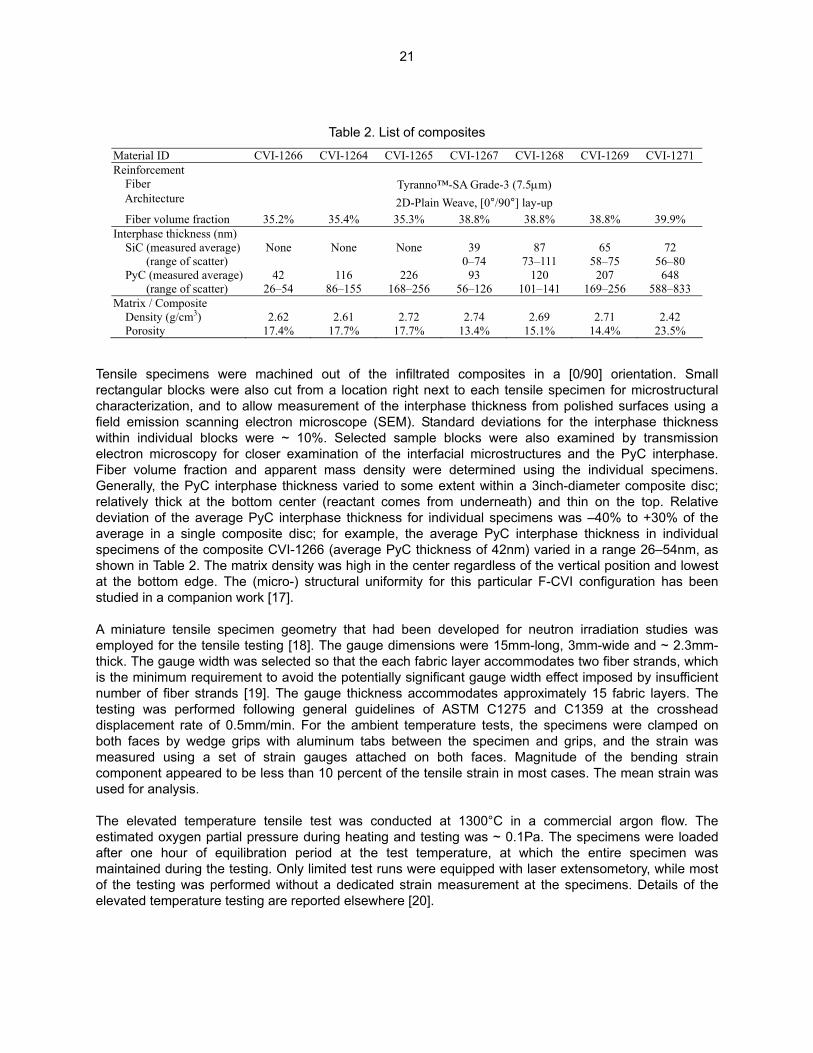
Table 2. List of composites
I-1264 CVI-1265 CVI-1267 CVI-1268 CVI-1269 CVI-1271
Tyranno™-SA Grade-3 (7.5µm) 2D-Plain Weave, [0°/90°] lay-up
5.4% 35.3% 38.8% 38.8% 38.8% 39.9%
None None 39 87 65 72 0–74 73–111 58–75 56–80
116 226 93 120 207 648 6–155 168–256 56–126 101–141 169–256 588–833
2.61 2.72 2.74 2.69 2.71 2.42 7.7% 17.7% 13.4% 15.1% 14.4% 23.5%
ut of the infiltrated composites in a [0/90] orientation. Small a location right next to each tensile specimen for microstructural ment of the interphase thickness from polished surfaces using a scope (SEM). Standard deviations for the interphase thickness Selected sample blocks were also examined by transmission
ation of the interfacial microstructures and the PyC interphase. ass density were determined using the individual specimens.
s varied to some extent within a 3inch-diameter composite disc; eactant comes from underneath) and thin on the top. Relative e thickness for individual specimens was –40% to +30% of the r example, the average PyC interphase thickness in individual
(average PyC thickness of 42nm) varied in a range 26–54nm, as s high in the center regardless of the vertical position and lowest tural uniformity for this particular F-CVI configuration has been
y that had been developed for neutron irradiation studies was e gauge dimensions were 15mm-long, 3mm-wide and ~ 2.3mm-
that the each fabric layer accommodates two fiber strands, which e potentially significant gauge width effect imposed by insufficient e thickness accommodates approximately 15 fabric layers. The ral guidelines of ASTM C1275 and C1359 at the crosshead he ambient temperature tests, the specimens were clamped on um tabs between the specimen and grips, and the strain was es attached on both faces. Magnitude of the bending strain percent of the tensile strain in most cases. The mean strain was
was conducted at 1300°C in a commercial argon flow. The g heating and testing was ~ 0.1Pa. The specimens were loaded at the test temperature, at which the entire specimen was ed test runs were equipped with laser extensometory, while most dedicated strain measurement at the specimens. Details of the d elsewhere [20].
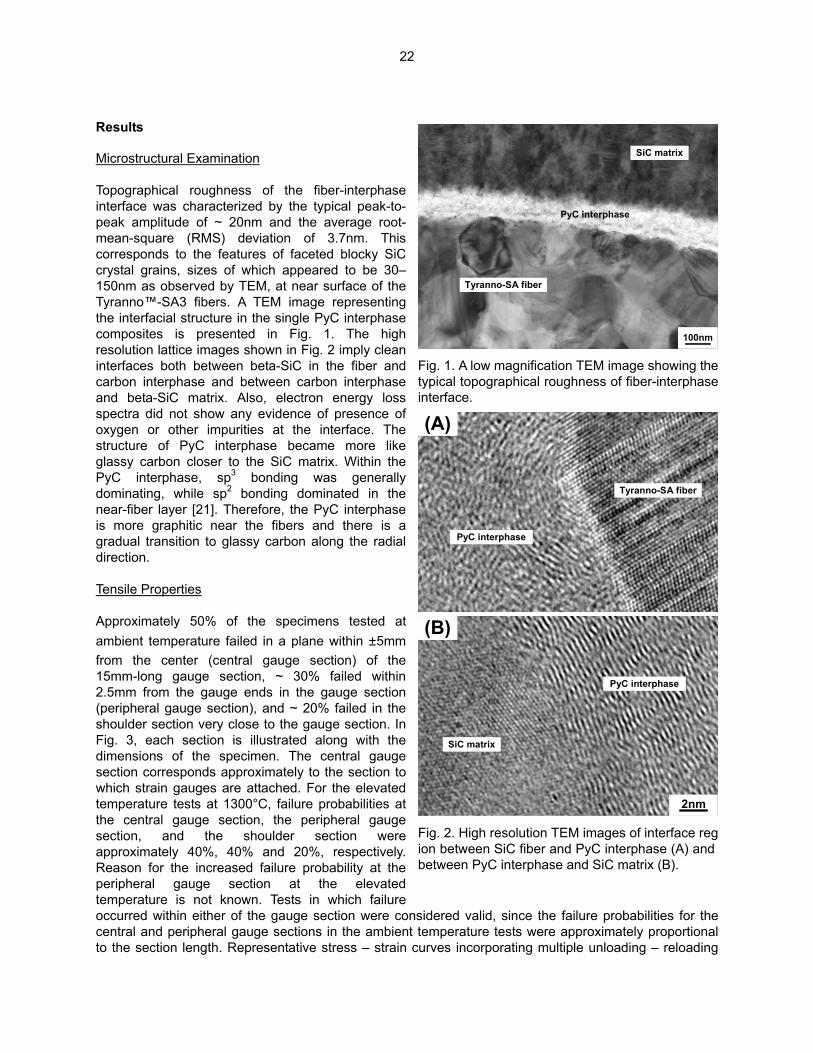
Results Microstructural Examination Topographical roughness of the fiber-interphase interface was characterized by the typical peak-to-peak amplitude of ~ 20nm and the average root-mean-square (RMS) deviation of 3.7nm. This corresponds to the features of faceted blocky SiC crystal grains, sizes of which appeared to be 30–150nm as observed by TEM, at near surface of the Tyranno™-SA3 fibers. A TEM image representing the interfacial structure in the single PyC interphase composites is presented in Fig. 1. The high resolution lattice images shown in Fig. 2 imply clean interfaces both between beta-SiC in the fiber and carbon interphase and between carbon interphase and beta-SiC matrix. Also, electron energy loss spectra did not show any evidence of presence of oxygen or other impurities at the interface. The structure of PyC interphase became more like glassy carbon closer to the SiC matrix. Within the PyC interphase, sp3 bonding was generally dominating, while sp2 bonding dominated in the near-fiber layer [21]. Therefore, the PyC interphase is more graphitic near the fibers and there is a gradual transition to glassy carbon along the radial direction. Tensile Properties Approximately 50% of the specimens tested at ambient temperature failed in a plane within ±5mm from the center (central gauge section) of the 15mm-long gauge section, ~ 30% failed within 2.5mm from the gauge ends in the gauge section (peripheral gauge section), and ~ 20% failed in the shoulder section very close to the gauge section. In Fig. 3, each section is illustrated along with the dimensions of the specimen. The central gauge section corresponds approximately to the section to which strain gauges are attached. For the elevated temperature tests at 1300°C, failure probabilities at the central gauge section, the peripheral gauge section, and the shoulder section were approximately 40%, 40% and 20%, respectively. Reason for the increased failure probability at the peripheral gauge section at the elevated temperature is not known. Tests in which failure occurred within either of the gauge section were considered valid, since the failure probabilities for the central and peripheral gauge sections in the ambient temperature tests were approximately proportional to the section length. Representative stress – strain curves incorporating multiple unloading – reloading
Fig. 2. High resolution TEM images of interface region between SiC fiber and PyC interphase (A) and between PyC interphase and SiC matrix (B).
(B)
2nm2nm
PyC interphase
SiC matrix
(A)
Tyranno-SA fiber
PyC interphase
100nm100nm
Tyranno-SA fiber
SiC matrix
PyC interphase
Fig. 1. A low magnification TEM image showing the typical topographical roughness of fiber-interphase interface.
22
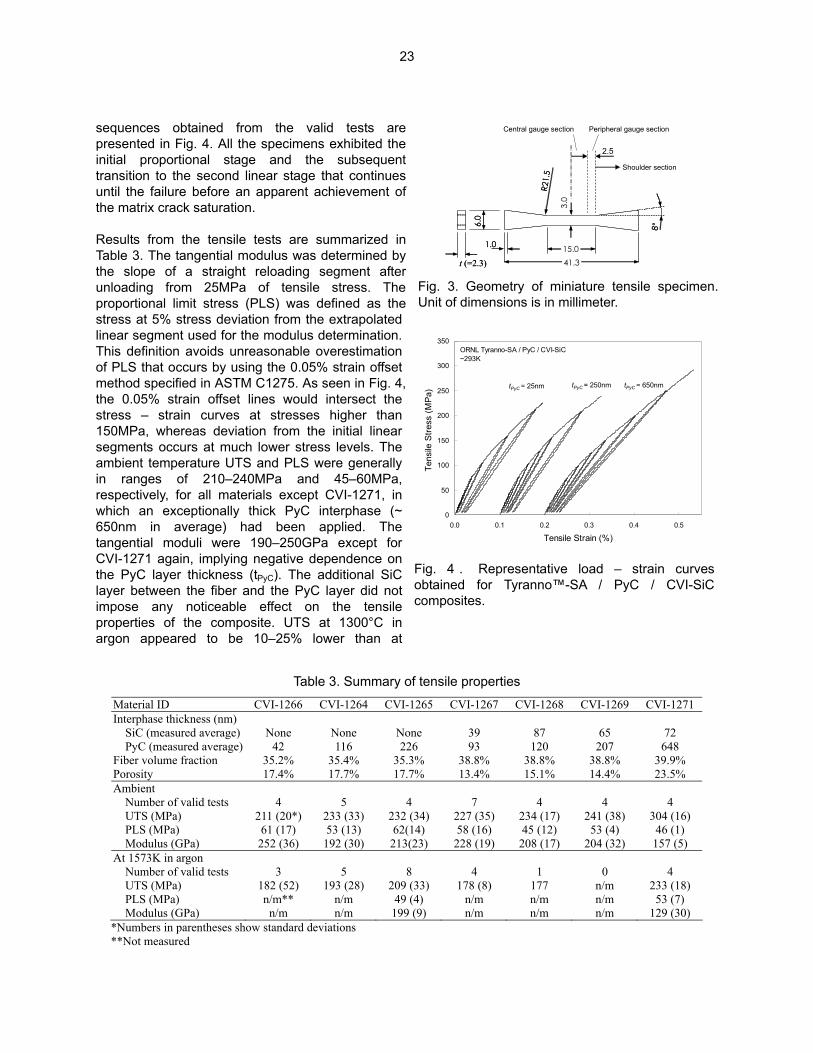
sequences obtained from the valid tests are presented in Fig. 4. All the specimens exhibited the initial proportional stage and the subsequent transition to the second linear stage that continues until the failure before an apparent achievement of the matrix crack saturation. Results from the tensile tests are summarized in Table 3. The tangential modulus was determined by the slope of a straight reloading segment after unloading from 25MPa of tensile stress. The proportional limit stress (PLS) was defined as the stress at 5% stress deviation from the extrapolated linear segment used for the modulus determination. This definition avoids unreasonable overestimation of PLS that occurs by using the 0.05% strain offset method specified in ASTM C1275. As seen in Fig. 4, the 0.05% strain offset lines would intersect the stress – strain curves at stresses higher than 150MPa, whereas deviation from the initial linear segments occurs at much lower stress levels. The ambient temperature UTS and PLS were generally in ranges of 210–240MPa and 45–60MPa, respectively, for all materials except CVI-1271, in which an exceptionally thick PyC interphase (~ 650nm in average) had been applied. The tangential moduli were 190–250GPa except for CVI-1271 again, implying negative dependence on the PyC layer thickness (tPyC). The additional SiC layer between the fiber and the PyC layer did not impose any noticeable effect on the tensile properties of the composite. UTS at 1300°C in argon appeared to be 10–25% lower than at
Central gauge section Peripheral gauge section
Shoulder section
2.5
41.315.01.0
6.0
3.0
t (=2.3)
8°
R21.5
41.315.01.0
6.0
3.0
t (=2.3)
8°
R21.5
Fig. 3. Geometry of miniature tensile specimen. Unit of dimensions is in millimeter.
0
50
100
150
200
250
300
350
0.0 0.1 0.2 0.3 0.4 0.5
Tensile Strain (%)
Tens
ile S
tress
(MPa
) .
ORNL Tyranno-SA / PyC / CVI-SiC~293K
tPyC = 25nm tPyC = 250nm tPyC = 650nm
Fig. 4 . Representative load – strain curves obtained for Tyranno™-SA / PyC / CVI-SiC composites.
T
Material ID CVI-126Interphase thickness (nm) SiC (measured average) None PyC (measured average) 42 Fiber volume fraction 35.2% Porosity 17.4% Ambient Number of valid tests 4 UTS (MPa) 211 (20* PLS (MPa) 61 (17) Modulus (GPa) 252 (36At 1573K in argon Number of valid tests 3 UTS (MPa) 182 (52 PLS (MPa) n/m** Modulus (GPa) n/m *Numbers in parentheses show standar**Not measured
23
able 3. Summary of tensile properties
6 CVI-1264 CVI-1265 CVI-1267 CVI-1268 CVI-1269 CVI-1271
None None 39 87 65 72 116 226 93 120 207 648
35.4% 35.3% 38.8% 38.8% 38.8% 39.9% 17.7% 17.7% 13.4% 15.1% 14.4% 23.5%
5 4 7 4 4 4
) 233 (33) 232 (34) 227 (35) 234 (17) 241 (38) 304 (16) 53 (13) 62(14) 58 (16) 45 (12) 53 (4) 46 (1) ) 192 (30) 213(23) 228 (19) 208 (17) 204 (32) 157 (5)
5 8 4 1 0 4
) 193 (28) 209 (33) 178 (8) 177 n/m 233 (18) n/m 49 (4) n/m n/m n/m 53 (7) n/m 199 (9) n/m n/m n/m 129 (30)
d deviations
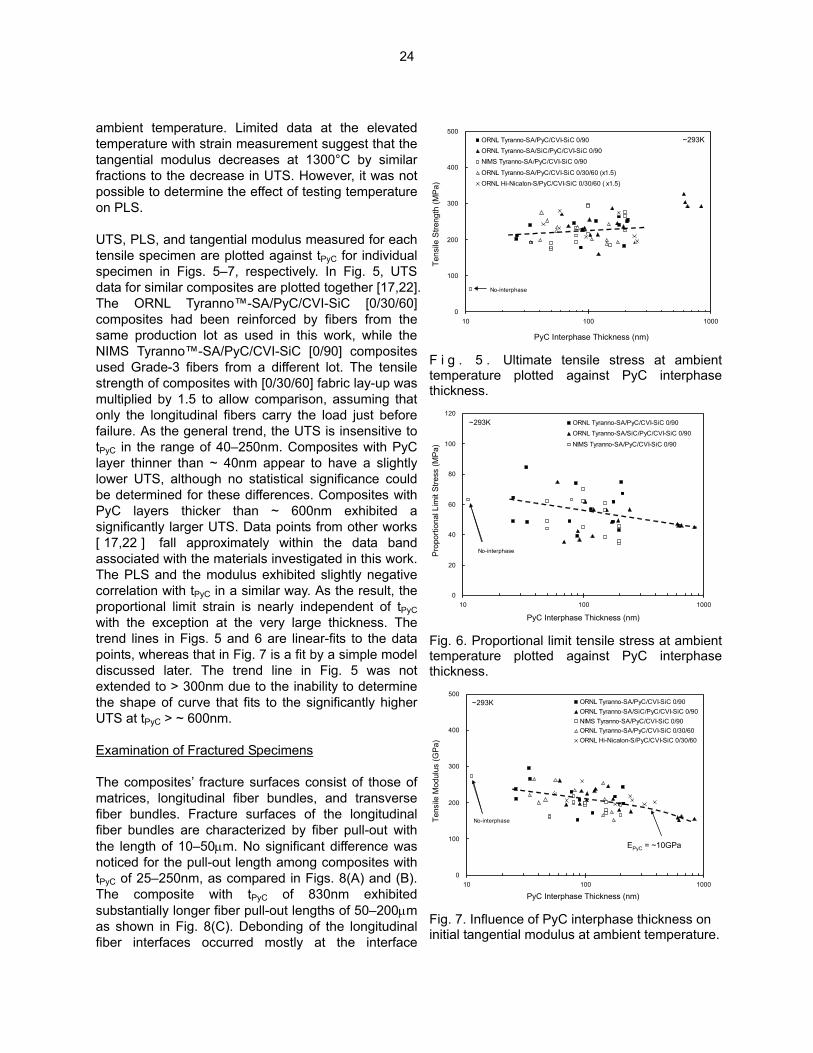
ambient temperature. Limited data at the elevated temperature with strain measurement suggest that the tangential modulus decreases at 1300°C by similar fractions to the decrease in UTS. However, it was not possible to determine the effect of testing temperature on PLS. UTS, PLS, and tangential modulus measured for each tensile specimen are plotted against tPyC for individual specimen in Figs. 5–7, respectively. In Fig. 5, UTS data for similar composites are plotted together [17,22]. The ORNL Tyranno™-SA/PyC/CVI-SiC [0/30/60] composites had been reinforced by fibers from the same production lot as used in this work, while the NIMS Tyranno™-SA/PyC/CVI-SiC [0/90] composites used Grade-3 fibers from a different lot. The tensile strength of composites with [0/30/60] fabric lay-up was multiplied by 1.5 to allow comparison, assuming that only the longitudinal fibers carry the load just before failure. As the general trend, the UTS is insensitive to tPyC in the range of 40–250nm. Composites with PyC layer thinner than ~ 40nm appear to have a slightly lower UTS, although no statistical significance could be determined for these differences. Composites with PyC layers thicker than ~ 600nm exhibited a significantly larger UTS. Data points from other works [ 17,22 ] fall approximately within the data band associated with the materials investigated in this work. The PLS and the modulus exhibited slightly negative correlation with tPyC in a similar way. As the result, the proportional limit strain is nearly independent of tPyC with the exception at the very large thickness. The trend lines in Figs. 5 and 6 are linear-fits to the data points, whereas that in Fig. 7 is a fit by a simple model discussed later. The trend line in Fig. 5 was not extended to > 300nm due to the inability to determine the shape of curve that fits to the significantly higher UTS at tPyC > ~ 600nm. Examination of Fractured Specimens The composites’ fracture surfaces consist of those of matrices, longitudinal fiber bundles, and transverse fiber bundles. Fracture surfaces of the longitudinal fiber bundles are characterized by fiber pull-out with the length of 10–50µm. No significant difference was noticed for the pull-out length among composites with tPyC of 25–250nm, as compared in Figs. 8(A) and (B). The composite with tPyC of 830nm exhibited substantially longer fiber pull-out lengths of 50–200µm as shown in Fig. 8(C). Debonding of the longitudinal fiber interfaces occurred mostly at the interface
F t t
F t t
Fi
24
0
100
200
300
400
500
10 100 1000
ORNL Tyranno-SA/PyC/CVI-SiC 0/90ORNL Tyranno-SA/SiC/PyC/CVI-SiC 0/90NIMS Tyranno-SA/PyC/CVI-SiC 0/90
ORNL Tyranno-SA/PyC/CVI-SiC 0/30/60 (x1.5)ORNL Hi-Nicalon-S/PyC/CVI-SiC 0/30/60 ( x1.5)
No-interphase
~293K
PyC Interphase Thickness (nm)
Tens
ile S
treng
th (M
Pa)
i g . 5 . Ultimate tensile stress at ambientemperature plotted against PyC interphasehickness.
0
20
40
60
80
100
120
10 100 1000
ORNL Tyranno-SA/PyC/CVI-SiC 0/90ORNL Tyranno-SA/SiC/PyC/CVI-SiC 0/90
NIMS Tyranno-SA/PyC/CVI-SiC 0/90
No-interphase
~293K
PyC Interphase Thickness (nm)
Pro
porti
onal
Lim
it S
tress
(MPa
)
ig. 6. Proportional limit tensile stress at ambientemperature plotted against PyC interphasehickness.
0
100
200
300
400
500
10 100 1000
ORNL Tyranno-SA/PyC/CVI-SiC 0/90ORNL Tyranno-SA/SiC/PyC/CVI-SiC 0/90NIMS Tyranno-SA/PyC/CVI-SiC 0/90ORNL Tyranno-SA/PyC/CVI-SiC 0/30/60ORNL Hi-Nicalon-S/PyC/CVI-SiC 0/30/60
No-interphase
~293K
PyC Interphase Thickness (nm)
Tens
ile M
odul
us (G
Pa)
EPyC = ~10GPa
ig. 7. Influence of PyC interphase thickness on nitial tangential modulus at ambient temperature.
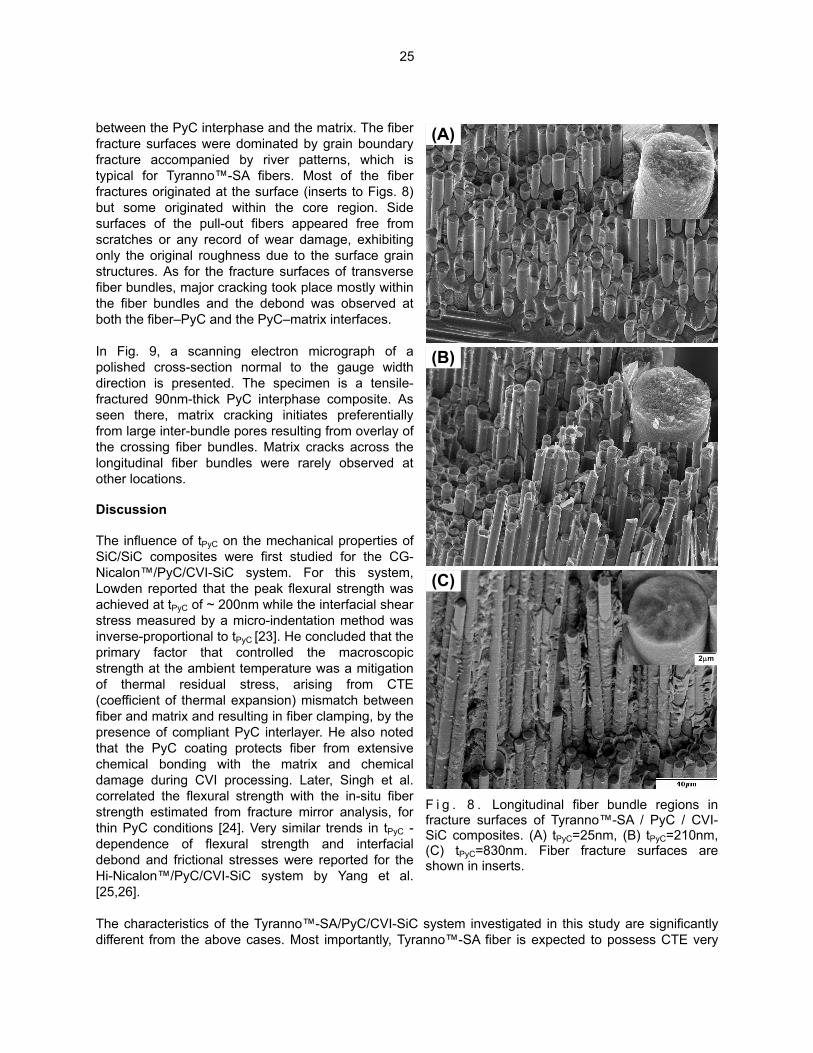
between the PyC interphase and the matrix. The fiber fracture surfaces were dominated by grain boundary fracture accompanied by river patterns, which is typical for Tyranno™-SA fibers. Most of the fiber fractures originated at the surface (inserts to Figs. 8) but some originated within the core region. Side surfaces of the pull-out fibers appeared free from scratches or any record of wear damage, exhibiting only the original roughness due to the surface grain structures. As for the fracture surfaces of transverse fiber bundles, major cracking took place mostly within the fiber bundles and the debond was observed at both the fiber–PyC and the PyC–matrix interfaces. In Fig. 9, a scanning electron micrograph of a polished cross-section normal to the gauge width direction is presented. The specimen is a tensile-fractured 90nm-thick PyC interphase composite. As seen there, matrix cracking initiates preferentially from large inter-bundle pores resulting from overlay of the crossing fiber bundles. Matrix cracks across the longitudinal fiber bundles were rarely observed at other locations. Discussion The influence of tPyC on the mechanical properties of SiC/SiC composites were first studied for the CG-Nicalon™/PyC/CVI-SiC system. For this system, Lowden reported that the peak flexural strength was achieved at tPyC of ~ 200nm while the interfacial shear stress measured by a micro-indentation method was inverse-proportional to tPyC [23]. He concluded that the primary factor that controlled the macroscopic strength at the ambient temperature was a mitigation of thermal residual stress, arising from CTE (coefficient of thermal expansion) mismatch between fiber and matrix and resulting in fiber clamping, by the presence of compliant PyC interlayer. He also noted that the PyC coating protects fiber from extensive chemical bonding with the matrix and chemical damage during CVI processing. Later, Singh et al. correlated the flexural strength with the in-situ fiber strength estimated from fracture mirror analysis, for thin PyC conditions [24]. Very similar trends in tPyC -dependence of flexural strength and interfacial debond and frictional stresses were reported for the Hi-Nicalon™/PyC/CVI-SiC system by Yang et al. [25,26].
(A)
(B)
(C)
2µm
F i g . 8 . Longitudinal fiber bundle regions in fracture surfaces of Tyranno™-SA / PyC / CVI-SiC composites. (A) tPyC=25nm, (B) tPyC=210nm, (C) tPyC=830nm. Fiber fracture surfaces are shown in inserts.
The characteristics of the Tyranno™-SA/PyC/CVI-SiC system investigated in this study are significantly different from the above cases. Most importantly, Tyranno™-SA fiber is expected to possess CTE very
25

similar to that of CVI-SiC matrices. Tyranno™-SA fiber consists primarily of beta-SiC crystal grains with a small amount (~ 10% volume) of glassy carbon, which is concentrated at the multi-grain junctions in the core region. The CTEs of CG-Nicalon™ and Hi-Nicalon™ are 3.2 and 3.5x10⁻⁶/K for 25–500°C, respectively [27], in contrast to the average CTE of ~ 3.9x10⁻⁶/K for 25–500°C for chemically vapor deposited (CVD) beta-SiC. Second, it is unlikely that Tyranno™-SA fibers experience substantial chemical damage during processing. Anticipated reactions involving excess carbon and silica in CG-Nicalon™ and Hi-Nicalon™ fibers and the reactants (MTS and hydrogen) do not occur on the stoichiometric SiC surface of Tyranno™-SA [ 28 ] . Additionally, the mismatch in elastic modulus between the fibers and matrix is small, as the manufacturer-claimed Young’s modulus of Tyranno™-SA is 400GPa in contrast to 220GPa for CG-Nicalon™. Interesting features in Fig. 5 are the general insensitivity of UTS to tPyC at tPyC < ~ 300nm and the significantly higher UTS at tPyC > ~ 600nm. The former can be attributed primarily to the relative unimportance of the role of interphase in mitigating the fiber clamping stress arising from the CTE mismatch. The latter observation, along with the longer fiber pull-out length and the greater strain to fracture at the thicker interphase shown in Figs. 8 and 10, indicates that the interphase thicker than ~ 300nm allows interfacial sliding necessary to obtain the highest UTS. The primary reason for the thicker optimum tPyC for the highest strength in the Tyranno™-SA composites compared to that in the CG-Nicalon™ and Hi-Nicalon™ composites [23,25] is presumably the difference in fiber surface roughness. It is not possible to further narrow down the optimum tPyC range for the highest UTS from the present data. However, an optimum tPyC may be found at > 300nm for applications in which the environmental performance of thick PyC interphase is not of strong concern. As shown in Fig. 7, the tangential elastic modulus decreases slightly as tPyC increases. This is an effect of the larger volume fraction of low modulus interphase, because the porosity is not correlated with tPyC. If we assume a very simple model for the composite modulus, in which 1/3 of the interphase layer is normal to, and 2/3 along the loading direction, it would be:
inter-bundle pore
longitudinal fibers
transverse cracks
Fig. 9. An SEM micrograph of polished cross-section normal to the gauge width direction in Tyranno™-SA / PyC (90nm) / CVI-SiC composites.
0.0
0.1
0.2
0.3
0.4
0.5
10 100 1000
Tyranno-SA/PyC/CVI-SiCTyranno-SA/SiC/PyC/CVI-SiC
~293K
PyC Interphase Thickness (nm)
Stra
in to
Fra
c%
)tu
re (
Fig. 10. Influence of PyC interphase thickness on strain to fracture of Tyranno™-SA / (SiC/) PyC / CVI-SiC composites
0
200
400
600
800
1000
0 0.01 0.02 0.03 0.04
NIMS Tyranno-SA/PyC/CVI-SiC, Berkovich (Yang)
NIMS Hi-Nicalon/PyC/CVI-SiC, Berkovich (Yang)
ORNL CG-Nicalon/PyC/CVI-SiC, Vickers (Lowden)
No-interphase
~293K
Reciprocal PyC Interphase Thickness (nm-1)
Pus
h-ou
t Loa
d di
vide
d by
Fib
er S
ure
a (M
Pa)
rface
A
F i g . 11 . Interfacial shear debond stress as estimated by single fiber push-out method.
26
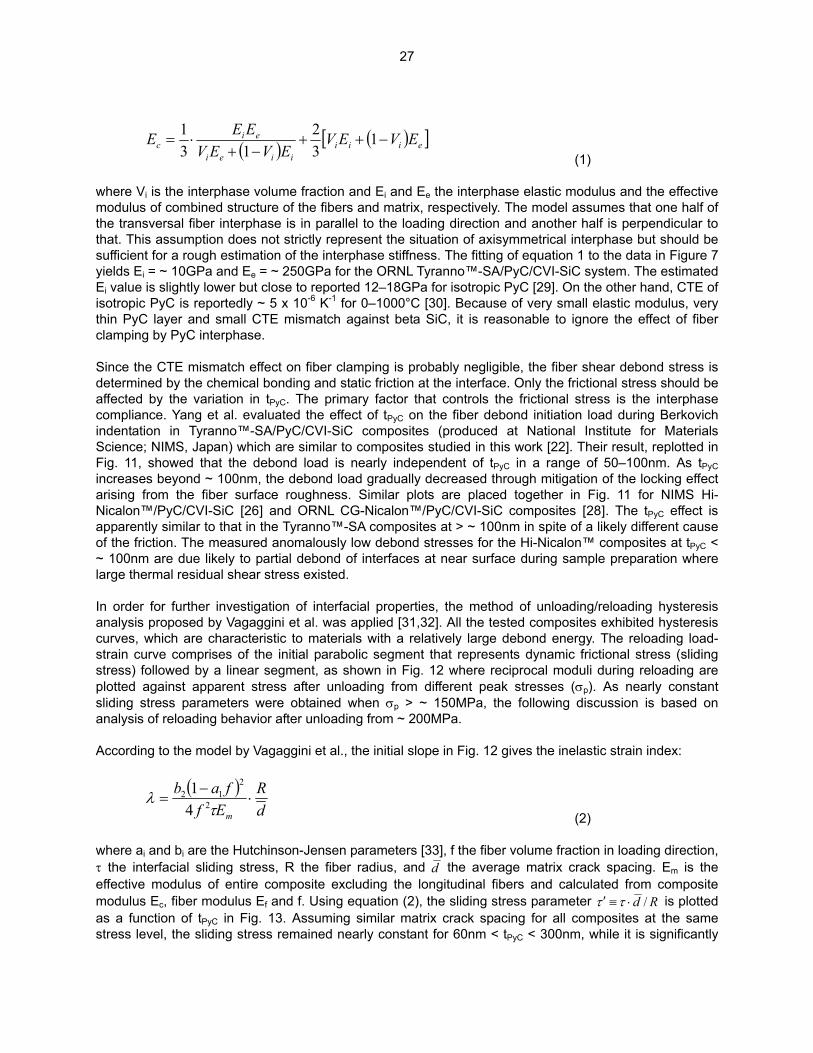
( ) ( )[ ]eiiiiiei
eic EVEV
EVEVEEE −++−+
⋅= 132
131
(1) where Vi is the interphase volume fraction and Ei and Ee the interphase elastic modulus and the effective modulus of combined structure of the fibers and matrix, respectively. The model assumes that one half of the transversal fiber interphase is in parallel to the loading direction and another half is perpendicular to that. This assumption does not strictly represent the situation of axisymmetrical interphase but should be sufficient for a rough estimation of the interphase stiffness. The fitting of equation 1 to the data in Figure 7 yields Ei = ~ 10GPa and Ee = ~ 250GPa for the ORNL Tyranno™-SA/PyC/CVI-SiC system. The estimated Ei value is slightly lower but close to reported 12–18GPa for isotropic PyC [29]. On the other hand, CTE of isotropic PyC is reportedly ~ 5 x 10⁻⁶ K-1 for 0–1000°C [30]. Because of very small elastic modulus, very thin PyC layer and small CTE mismatch against beta SiC, it is reasonable to ignore the effect of fiber clamping by PyC interphase. Since the CTE mismatch effect on fiber clamping is probably negligible, the fiber shear debond stress is determined by the chemical bonding and static friction at the interface. Only the frictional stress should be affected by the variation in tPyC. The primary factor that controls the frictional stress is the interphase compliance. Yang et al. evaluated the effect of tPyC on the fiber debond initiation load during Berkovich indentation in Tyranno™-SA/PyC/CVI-SiC composites (produced at National Institute for Materials Science; NIMS, Japan) which are similar to composites studied in this work [22]. Their result, replotted in Fig. 11, showed that the debond load is nearly independent of tPyC in a range of 50–100nm. As tPyC increases beyond ~ 100nm, the debond load gradually decreased through mitigation of the locking effect arising from the fiber surface roughness. Similar plots are placed together in Fig. 11 for NIMS Hi-Nicalon™/PyC/CVI-SiC [26] and ORNL CG-Nicalon™/PyC/CVI-SiC composites [28]. The tPyC effect is apparently similar to that in the Tyranno™-SA composites at > ~ 100nm in spite of a likely different cause of the friction. The measured anomalously low debond stresses for the Hi-Nicalon™ composites at tPyC < ~ 100nm are due likely to partial debond of interfaces at near surface during sample preparation where large thermal residual shear stress existed. In order for further investigation of interfacial properties, the method of unloading/reloading hysteresis analysis proposed by Vagaggini et al. was applied [31,32]. All the tested composites exhibited hysteresis curves, which are characteristic to materials with a relatively large debond energy. The reloading load-strain curve comprises of the initial parabolic segment that represents dynamic frictional stress (sliding stress) followed by a linear segment, as shown in Fig. 12 where reciprocal moduli during reloading are plotted against apparent stress after unloading from different peak stresses (σp). As nearly constant sliding stress parameters were obtained when σp > ~ 150MPa, the following discussion is based on analysis of reloading behavior after unloading from ~ 200MPa. According to the model by Vagaggini et al., the initial slope in Fig. 12 gives the inelastic strain index:
( )dR
Effab
m
⋅−
=τ
λ 2
212
41
(2) where ai and bi are the Hutchinson-Jensen parameters [33], f the fiber volume fraction in loading direction, τ the interfacial sliding stress, R the fiber radius, and d the average matrix crack spacing. Em is the effective modulus of entire composite excluding the longitudinal fibers and calculated from composite modulus Ec, fiber modulus Ef and f. Using equation (2), the sliding stress parameter Rd /⋅≡′ ττ is plotted as a function of tPyC in Fig. 13. Assuming similar matrix crack spacing for all composites at the same stress level, the sliding stress remained nearly constant for 60nm < tPyC < 300nm, while it is significantly
27
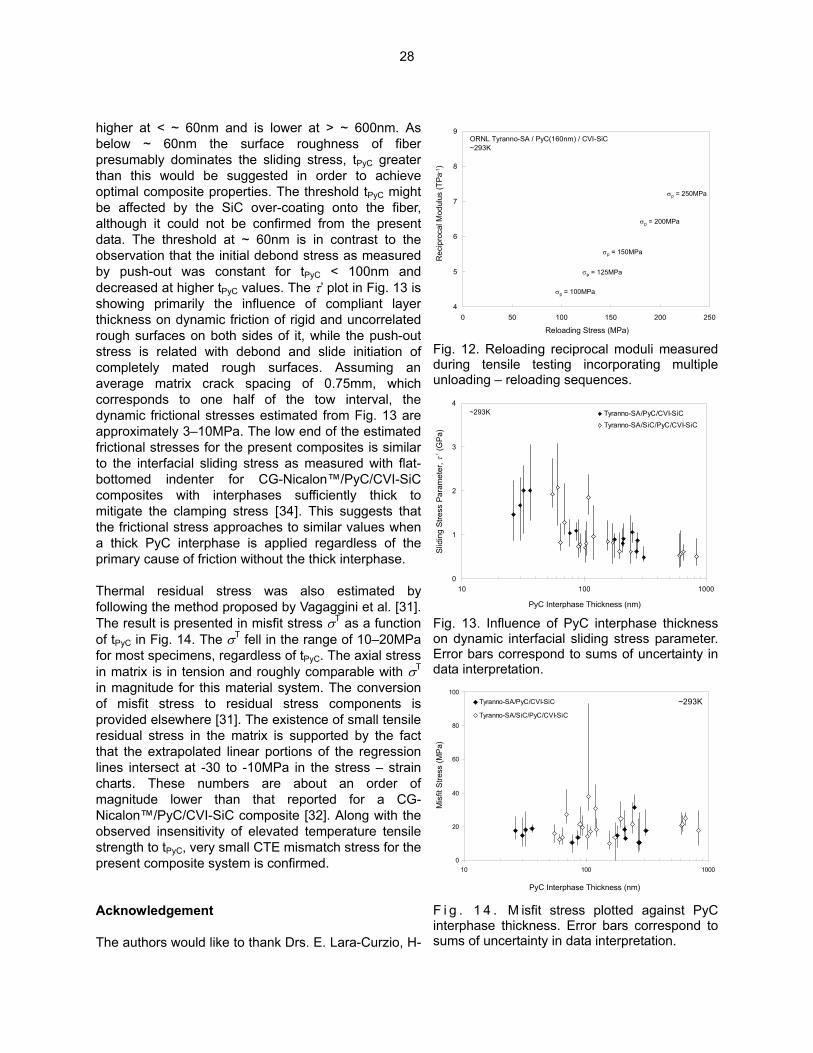
higher at < ~ 60nm and is lower at > ~ 600nm. As below ~ 60nm the surface roughness of fiber presumably dominates the sliding stress, tPyC greater than this would be suggested in order to achieve optimal composite properties. The threshold tPyC might be affected by the SiC over-coating onto the fiber, although it could not be confirmed from the present data. The threshold at ~ 60nm is in contrast to the observation that the initial debond stress as measured by push-out was constant for tPyC < 100nm and decreased at higher tPyC values. The τ’ plot in Fig. 13 is showing primarily the influence of compliant layer thickness on dynamic friction of rigid and uncorrelated rough surfaces on both sides of it, while the push-out stress is related with debond and slide initiation of completely mated rough surfaces. Assuming an average matrix crack spacing of 0.75mm, which corresponds to one half of the tow interval, the dynamic frictional stresses estimated from Fig. 13 are approximately 3–10MPa. The low end of the estimated frictional stresses for the present composites is similar to the interfacial sliding stress as measured with flat-bottomed indenter for CG-Nicalon™/PyC/CVI-SiC composites with interphases sufficiently thick to mitigate the clamping stress [34]. This suggests that the frictional stress approaches to similar values when a thick PyC interphase is applied regardless of the primary cause of friction without the thick interphase. Thermal residual stress was also estimated by following the method proposed by Vagaggini et al. [31]. The result is presented in misfit stress σT as a function of tPyC in Fig. 14. The σT fell in the range of 10–20MPa for most specimens, regardless of tPyC. The axial stress in matrix is in tension and roughly comparable with σT in magnitude for this material system. The conversion of misfit stress to residual stress components is provided elsewhere [31]. The existence of small tensile residual stress in the matrix is supported by the fact that the extrapolated linear portions of the regression lines intersect at -30 to -10MPa in the stress – strain charts. These numbers are about an order of magnitude lower than that reported for a CG-Nicalon™/PyC/CVI-SiC composite [32]. Along with the observed insensitivity of elevated temperature tensile strength to tPyC, very small CTE mismatch stress for the present composite system is confirmed.
4
5
6
7
8
9
0 50 100 150 200 250
ORNL Tyranno-SA / PyC(160nm) / CVI-SiC~293K
Reloading Stress (MPa)
Rec
ipro
cal M
odul
us (T
Pa-1
)
σp = 250MPa
σp = 200MPa
σp = 150MPa
σp = 125MPa
σp = 100MPa
Fig. 12. Reloading reciprocal moduli measured during tensile testing incorporating multiple unloading – reloading sequences.
0
1
2
3
4
10 100 1000
Tyranno-SA/PyC/CVI-SiCTyranno-SA/SiC/PyC/CVI-SiC
~293K
PyC Interphase Thickness (nm)
Slid
ing
Stre
sste
r, τ
’(G
Pa)
Par
ame
Fig. 13. Influence of PyC interphase thickness on dynamic interfacial sliding stress parameter. Error bars correspond to sums of uncertainty in data interpretation.
0
20
40
60
80
100
10 100 1000
Tyranno-SA/PyC/CVI-SiC
Tyranno-SA/SiC/PyC/CVI-SiC
~293K
PyC Interphase Thickness (nm)
Mis
fit S
tress
(MP
a)
F i g . 1 4 . M isfit stress plotted against PyC interphase thickness. Error bars correspond to sums of uncertainty in data interpretation.
Acknowledgement The authors would like to thank Drs. E. Lara-Curzio, H-
28
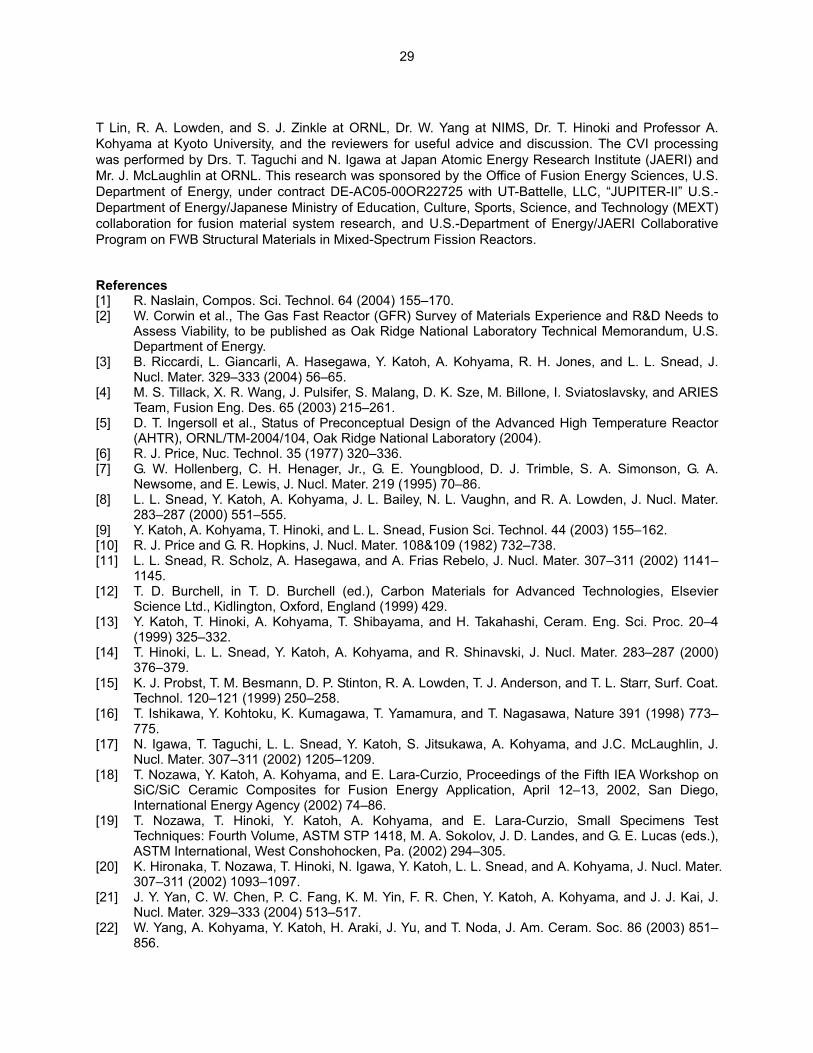
T Lin, R. A. Lowden, and S. J. Zinkle at ORNL, Dr. W. Yang at NIMS, Dr. T. Hinoki and Professor A. Kohyama at Kyoto University, and the reviewers for useful advice and discussion. The CVI processing was performed by Drs. T. Taguchi and N. Igawa at Japan Atomic Energy Research Institute (JAERI) and Mr. J. McLaughlin at ORNL. This research was sponsored by the Office of Fusion Energy Sciences, U.S. Department of Energy, under contract DE-AC05-00OR22725 with UT-Battelle, LLC, “JUPITER-II” U.S.-Department of Energy/Japanese Ministry of Education, Culture, Sports, Science, and Technology (MEXT) collaboration for fusion material system research, and U.S.-Department of Energy/JAERI Collaborative Program on FWB Structural Materials in Mixed-Spectrum Fission Reactors. References [1] R. Naslain, Compos. Sci. Technol. 64 (2004) 155–170. [2] W. Corwin et al., The Gas Fast Reactor (GFR) Survey of Materials Experience and R&D Needs to
Assess Viability, to be published as Oak Ridge National Laboratory Technical Memorandum, U.S. Department of Energy.
[3] B. Riccardi, L. Giancarli, A. Hasegawa, Y. Katoh, A. Kohyama, R. H. Jones, and L. L. Snead, J. Nucl. Mater. 329–333 (2004) 56–65.
[4] M. S. Tillack, X. R. Wang, J. Pulsifer, S. Malang, D. K. Sze, M. Billone, I. Sviatoslavsky, and ARIES Team, Fusion Eng. Des. 65 (2003) 215–261.
[5] D. T. Ingersoll et al., Status of Preconceptual Design of the Advanced High Temperature Reactor (AHTR), ORNL/TM-2004/104, Oak Ridge National Laboratory (2004).
[6] R. J. Price, Nuc. Technol. 35 (1977) 320–336. [7] G. W. Hollenberg, C. H. Henager, Jr., G. E. Youngblood, D. J. Trimble, S. A. Simonson, G. A.
Newsome, and E. Lewis, J. Nucl. Mater. 219 (1995) 70–86. [8] L. L. Snead, Y. Katoh, A. Kohyama, J. L. Bailey, N. L. Vaughn, and R. A. Lowden, J. Nucl. Mater.
283–287 (2000) 551–555. [9] Y. Katoh, A. Kohyama, T. Hinoki, and L. L. Snead, Fusion Sci. Technol. 44 (2003) 155–162. [10] R. J. Price and G. R. Hopkins, J. Nucl. Mater. 108&109 (1982) 732–738. [11] L. L. Snead, R. Scholz, A. Hasegawa, and A. Frias Rebelo, J. Nucl. Mater. 307–311 (2002) 1141–
1145. [12] T. D. Burchell, in T. D. Burchell (ed.), Carbon Materials for Advanced Technologies, Elsevier
Science Ltd., Kidlington, Oxford, England (1999) 429. [13] Y. Katoh, T. Hinoki, A. Kohyama, T. Shibayama, and H. Takahashi, Ceram. Eng. Sci. Proc. 20–4
(1999) 325–332. [14] T. Hinoki, L. L. Snead, Y. Katoh, A. Kohyama, and R. Shinavski, J. Nucl. Mater. 283–287 (2000)
376–379. [15] K. J. Probst, T. M. Besmann, D. P. Stinton, R. A. Lowden, T. J. Anderson, and T. L. Starr, Surf. Coat.
Technol. 120–121 (1999) 250–258. [16] T. Ishikawa, Y. Kohtoku, K. Kumagawa, T. Yamamura, and T. Nagasawa, Nature 391 (1998) 773–
775. [17] N. Igawa, T. Taguchi, L. L. Snead, Y. Katoh, S. Jitsukawa, A. Kohyama, and J.C. McLaughlin, J.
Nucl. Mater. 307–311 (2002) 1205–1209. [18] T. Nozawa, Y. Katoh, A. Kohyama, and E. Lara-Curzio, Proceedings of the Fifth IEA Workshop on
SiC/SiC Ceramic Composites for Fusion Energy Application, April 12–13, 2002, San Diego, International Energy Agency (2002) 74–86.
[19] T. Nozawa, T. Hinoki, Y. Katoh, A. Kohyama, and E. Lara-Curzio, Small Specimens Test Techniques: Fourth Volume, ASTM STP 1418, M. A. Sokolov, J. D. Landes, and G. E. Lucas (eds.), ASTM International, West Conshohocken, Pa. (2002) 294–305.
[20] K. Hironaka, T. Nozawa, T. Hinoki, N. Igawa, Y. Katoh, L. L. Snead, and A. Kohyama, J. Nucl. Mater. 307–311 (2002) 1093–1097.
[21] J. Y. Yan, C. W. Chen, P. C. Fang, K. M. Yin, F. R. Chen, Y. Katoh, A. Kohyama, and J. J. Kai, J. Nucl. Mater. 329–333 (2004) 513–517.
[22] W. Yang, A. Kohyama, Y. Katoh, H. Araki, J. Yu, and T. Noda, J. Am. Ceram. Soc. 86 (2003) 851–856.
29
[23] R. A. Lowden, Advanced composite materials, Ceram. Trans. 19 (1991) 619–630. [24] D. Singh, J. P. Singh, and M. J. Wheeler, J. Am. Ceram. Soc. 79 (1996) 591–596. [25] W. Yang, H. Araki, T. Noda, J. Y. Park, Y. Katoh, T. Hinoki, J. Yu, and A. Kohyama, Mater. Trans. 43
(2002) 2568–2573. [26] W. Yang, H. Araki, A. Kohyama, Y. Katoh, Q. Hu, H. Suzuki, and T. Noda, Ibid 25, 2574–2577. [27] K. Okamura, Encyclopedia of Materials: Science and Technology, ISBN 0-08-0431526, Elsevier
Science Ltd. (2001) 1051–1056. [28] R. A. Lowden, Characterization and Control of the Fiber-Matrix Interface in Ceramic Matrix
Composites, ORNL/TM-11039, Oak Ridge National Laboratory (1989). [29] R. J. Price and J. C. Bokros, J. Nucl. Mater. 21 (1967) 158. [30] Material Models of Pyrocarbon and Pyrolytic Silicon Carbide, CEGA-002820, CEGA Corporation
(1993). [31] E. Vagaggini, J-M. Domergue, and A.G. Evans, J. Am. Ceram. Soc. 78 (1995) 2709–2720. [32] J-M. Domergue, E. Vagaggini, and A. G. Evans, Ibid 31, 2721–2731. [33] J. W. Hutchinson and H. M. Jensen, Mech. Mater. 9 (1990) 139–163. [34] E. Lara-Curzio, M. K. Ferber, and R. A. Lowden, Ceram. Eng. Sci. Proc. 15 (1994) 989–1000.
30
PROPERTY TAILORABILITY FOR ADVANCED CVI SILICON CARBIDE COMPOSITES FOR FUSION—Y. Katoh, T. Nozawa, and L. L. Snead (Oak Ridge National Laboratory), T. Hinoki and A. Kohyama (Kyoto University) OBJECTIVE The objective of this work is to determine the tailorability of anisotropic thermomechanical properties for chemically vapor-infiltrated (CVI) SiC/SiC composites after neutron irradiation. SUMMARY Chemically vapor infiltrated (CVI) silicon carbide (SiC) matrix composites with uni-directional and various two- and three-dimensional reinforcements with near-stoichiometric SiC fibers or SiC/graphite hybrid fabrics were produced and evaluated for tensile, thermal and electrical properties. The parallel-serial approach models of these properties reasonably explained the experimental results. The experimental data and the model-based analysis suggested that: (1) the strength properties are determined primarily by the volume fraction of longitudinal fibers, approximately following the theory that assumes global load sharing, (2) presence of the axial fiber tows is the key factor in providing high thermal conductivity as it is determined by the significant contributions from the axial fibers (when present), matrix within and surrounding the axial fiber tows, and the remaining constituents of the composite, (3) among the composite systems studied, the maximum and minimum post-irradiation through-thickness conductivity observed were 10–15 W/m-K at 800–1000°C for 3D architecture and < 5 W/m-K at < 800°C for 2D architecture, respectively, and (4) the orthogonal 3D configurations of x:y:z = 1:1:0.2–1:1:0.5 will provide the highest post-irradiation resistance to thermal stress due to through-thickness heat flow. PROGRESS AND STATUS Introduction Silicon carbide (SiC) is a unique material that retains its strength and chemical stability at elevated temperatures and under intense neutron irradiation [1]. Additionally, SiC provides safety features when applied to fusion nuclear systems due to its low activation / low decay heat characteristics [2]. SiC fiber-reinforced SiC-matrix composites (SiC/SiC composites), which add mechanical damage tolerance to inherently brittle monolithic SiC, are thus promising candidates for fusion blanket / first wall structures [3], and flow channel inserts [4]. Due to the complex role and design diversity of the breeding blankets of fusion reactors, the proposed application of SiC/SiC composites to various blanket designs demands a wide range of material properties [5]. Mechanical strength and thermal and electrical conductivity are the properties of primary concern for fusion blanket applications, and they can be anisotropically tailored in fibrous composites. The objectives of this work are to determine the tailorability of anisotropic thermomechanical properties for chemically vapor-infiltrated (CVI) SiC/SiC composites and the trade-off between the mechanical and thermal properties. For these purposes, CVI SiC-matrix composites were fabricated employing the uni-directional (UD), common two-dimensional (2D), and three-dimensional (3D) reinforcements by near-stoichiometric SiC fibers and their mechanical and thermal / electrical transport properties were evaluated. The measured properties were analyzed using theoretical models and the influence of neutron irradiation on temperature dependent composite properties was predicted.
31
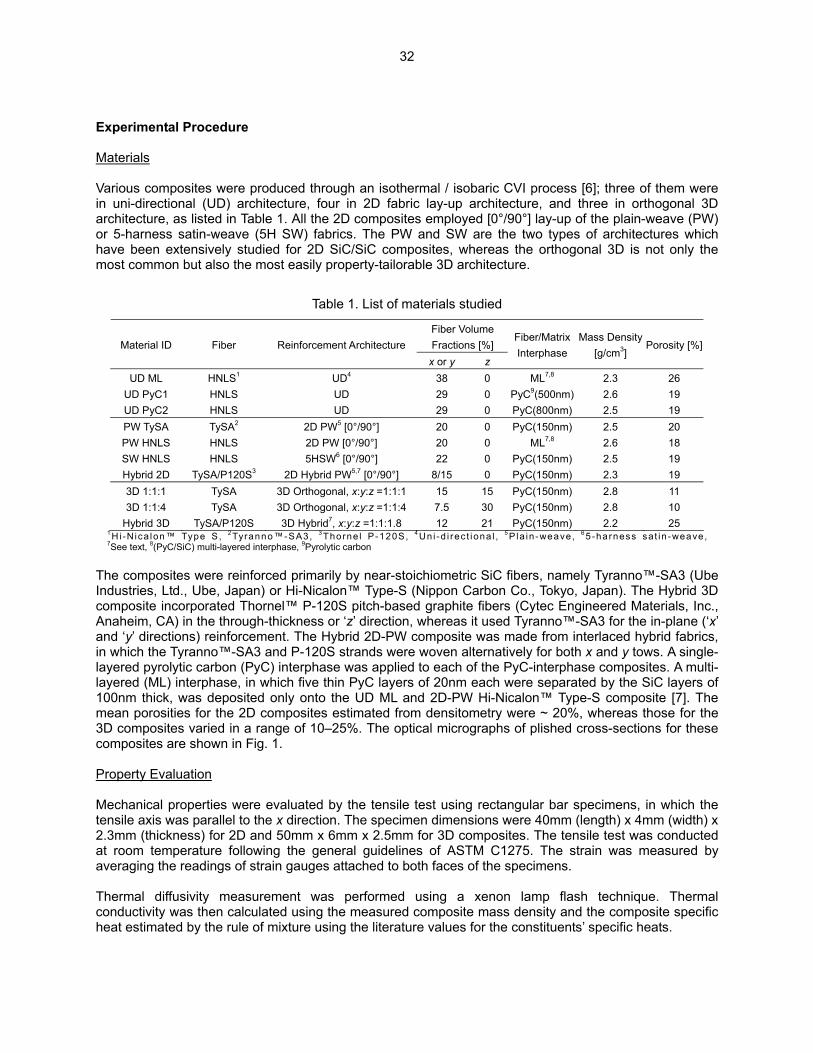
Experimental Procedure Materials Various composites were produced through an isothermal / isobaric CVI process [6]; three of them were in uni-directional (UD) architecture, four in 2D fabric lay-up architecture, and three in orthogonal 3D architecture, as listed in Table 1. All the 2D composites employed [0°/90°] lay-up of the plain-weave (PW) or 5-harness satin-weave (5H SW) fabrics. The PW and SW are the two types of architectures which have been extensively studied for 2D SiC/SiC composites, whereas the orthogonal 3D is not only the most common but also the most easily property-tailorable 3D architecture.
Table 1. List of materials studied
Fiber Volume Fractions [%] Material ID Fiber Reinforcement Architecture x or y z
Fiber/Matrix Interphase
Mass Density [g/cm3]
Porosity [%]
UD ML HNLS1 UD4 38 0 ML7,8 2.3 26 UD PyC1 HNLS UD 29 0 PyC9(500nm) 2.6 19 UD PyC2 HNLS UD 29 0 PyC(800nm) 2.5 19 PW TySA TySA2 2D PW5 [0°/90°] 20 0 PyC(150nm) 2.5 20 PW HNLS HNLS 2D PW [0°/90°] 20 0 ML7,8 2.6 18 SW HNLS HNLS 5HSW6 [0°/90°] 22 0 PyC(150nm) 2.5 19 Hybrid 2D TySA/P120S3 2D Hybrid PW5,7 [0°/90°] 8/15 0 PyC(150nm) 2.3 19 3D 1:1:1 TySA 3D Orthogonal, x:y:z =1:1:1 15 15 PyC(150nm) 2.8 11 3D 1:1:4 TySA 3D Orthogonal, x:y:z =1:1:4 7.5 30 PyC(150nm) 2.8 10
Hybrid 3D TySA/P120S 3D Hybrid7, x:y:z =1:1:1.8 12 21 PyC(150nm) 2.2 25 1 H i -N ica lon™ Type S, 2 Tyranno™-SA3, 3 Thorne l P-120S, 4 Un i -d i rec t iona l , 5 P la in -weave, 6 5 -harness sat in -weave, 7See text, 8(PyC/SiC) multi-layered interphase, 9Pyrolytic carbon
The composites were reinforced primarily by near-stoichiometric SiC fibers, namely Tyranno™-SA3 (Ube Industries, Ltd., Ube, Japan) or Hi-Nicalon™ Type-S (Nippon Carbon Co., Tokyo, Japan). The Hybrid 3D composite incorporated Thornel™ P-120S pitch-based graphite fibers (Cytec Engineered Materials, Inc., Anaheim, CA) in the through-thickness or ‘z’ direction, whereas it used Tyranno™-SA3 for the in-plane (‘x’ and ‘y’ directions) reinforcement. The Hybrid 2D-PW composite was made from interlaced hybrid fabrics, in which the Tyranno™-SA3 and P-120S strands were woven alternatively for both x and y tows. A single-layered pyrolytic carbon (PyC) interphase was applied to each of the PyC-interphase composites. A multi-layered (ML) interphase, in which five thin PyC layers of 20nm each were separated by the SiC layers of 100nm thick, was deposited only onto the UD ML and 2D-PW Hi-Nicalon™ Type-S composite [7]. The mean porosities for the 2D composites estimated from densitometry were ~ 20%, whereas those for the 3D composites varied in a range of 10–25%. The optical micrographs of plished cross-sections for these composites are shown in Fig. 1. Property Evaluation Mechanical properties were evaluated by the tensile test using rectangular bar specimens, in which the tensile axis was parallel to the x direction. The specimen dimensions were 40mm (length) x 4mm (width) x 2.3mm (thickness) for 2D and 50mm x 6mm x 2.5mm for 3D composites. The tensile test was conducted at room temperature following the general guidelines of ASTM C1275. The strain was measured by averaging the readings of strain gauges attached to both faces of the specimens. Thermal diffusivity measurement was performed using a xenon lamp flash technique. Thermal conductivity was then calculated using the measured composite mass density and the composite specific heat estimated by the rule of mixture using the literature values for the constituents’ specific heats.
32
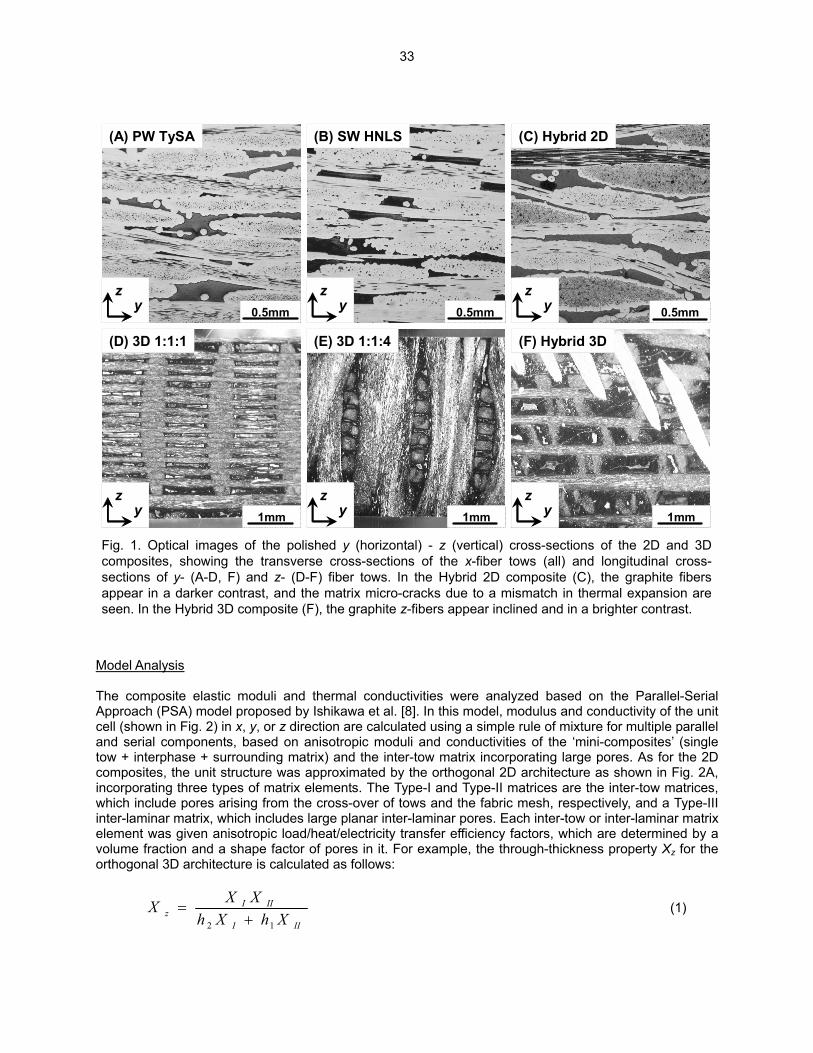
(A) PW TySA (B) SW HNLS (C) Hybrid 2D
(E) 3D 1:1:4(D) 3D 1:1:1 (F) Hybrid 3D
1mm1mm
0.5mm 0.5mm0.5mm 0.5mm0.5mm
1mm1mm 1mm1mm
yz
yz
yz
yz
yz
yz
yz
yz
yz
yz
yz
yz
Fig. 1. Optical images of the polished y (horizontal) - z (vertical) cross-sections of the 2D and 3D composites, showing the transverse cross-sections of the x-fiber tows (all) and longitudinal cross-sections of y- (A-D, F) and z- (D-F) fiber tows. In the Hybrid 2D composite (C), the graphite fibers appear in a darker contrast, and the matrix micro-cracks due to a mismatch in thermal expansion are seen. In the Hybrid 3D composite (F), the graphite z-fibers appear inclined and in a brighter contrast.
Model Analysis The composite elastic moduli and thermal conductivities were analyzed based on the Parallel-Serial Approach (PSA) model proposed by Ishikawa et al. [8]. In this model, modulus and conductivity of the unit cell (shown in Fig. 2) in x, y, or z direction are calculated using a simple rule of mixture for multiple parallel and serial components, based on anisotropic moduli and conductivities of the ‘mini-composites’ (single tow + interphase + surrounding matrix) and the inter-tow matrix incorporating large pores. As for the 2D composites, the unit structure was approximated by the orthogonal 2D architecture as shown in Fig. 2A, incorporating three types of matrix elements. The Type-I and Type-II matrices are the inter-tow matrices, which include pores arising from the cross-over of tows and the fabric mesh, respectively, and a Type-III inter-laminar matrix, which includes large planar inter-laminar pores. Each inter-tow or inter-laminar matrix element was given anisotropic load/heat/electricity transfer efficiency factors, which are determined by a volume fraction and a shape factor of pores in it. For example, the through-thickness property Xz for the orthogonal 3D architecture is calculated as follows:
III
IIIz XhXh
XXX12 +
= (1)
33
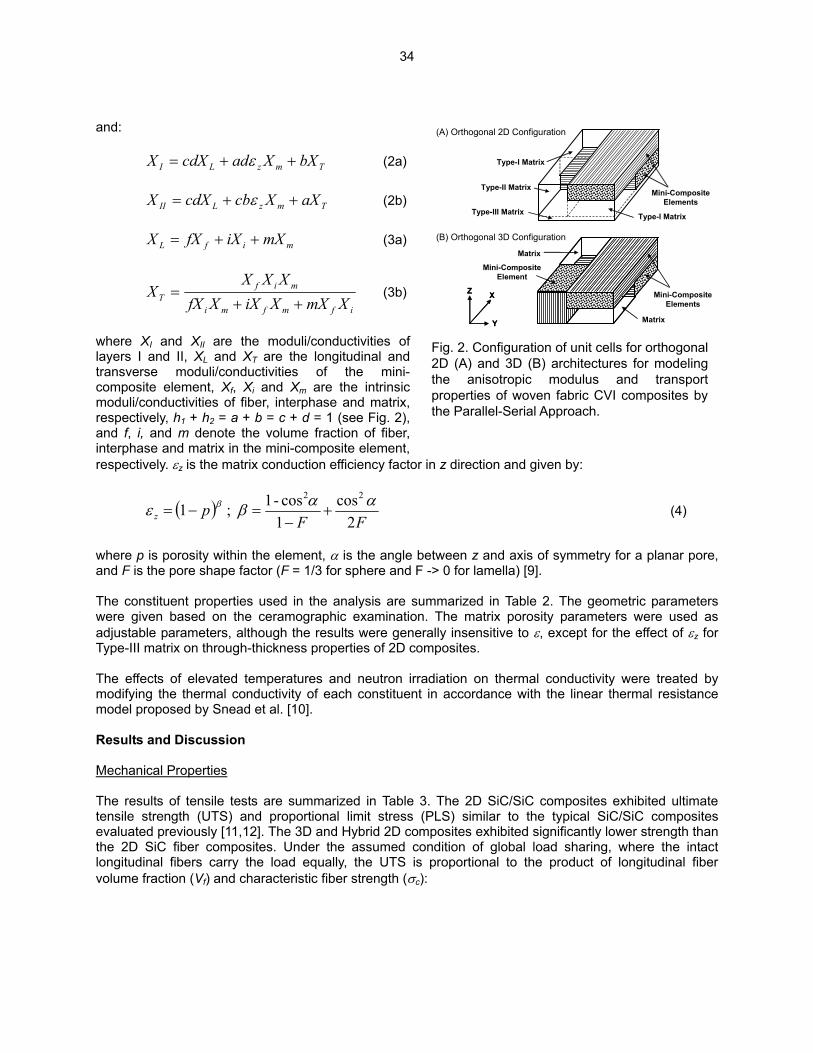
and:
TmzLI bXXadcdXX ++= ε (2a)
TmzLII aXXcbcdXX ++= ε (2b)
mifL mXiXfXX ++= (3a)
ifmfmi
mifT XmXXiXXfX
XXXX
++= (3b)
where XI and XII are the moduli/conductivities of layers I and II, XL and XT are the longitudinal and transverse moduli/conductivities of the mini-composite element, Xf, Xi and Xm are the intrinsic moduli/conductivities of fiber, interphase and matrix, respectively, h1 + h2 = a + b = c + d = 1 (see Fig. 2), and f, i, and m denote the volume fraction of fiber, interphase and matrix in the mini-composite element, respectively. εz is the matrix conduction efficiency factor in z direction and given by:
(A) Orthogonal 2D Configuration
Type-I Matrix
Type-I Matrix
X
Y
Z X
Y
Z
Type-II Matrix
(B) Orthogonal 3D Configuration
Matrix
Matrix
Type-III Matrix
Mini-CompositeElements
Mini-CompositeElements
Mini-CompositeElement
Fig. 2. Configuration of unit cells for orthogonal 2D (A) and 3D (B) architectures for modeling the anisotropic modulus and transport properties of woven fabric CVI composites by the Parallel-Serial Approach.
( )FF
pz 2cos
1cos-1 ; 1
22 ααβε β +−
=−= (4)
where p is porosity within the element, α is the angle between z and axis of symmetry for a planar pore, and F is the pore shape factor (F = 1/3 for sphere and F -> 0 for lamella) [9]. The constituent properties used in the analysis are summarized in Table 2. The geometric parameters were given based on the ceramographic examination. The matrix porosity parameters were used as adjustable parameters, although the results were generally insensitive to ε, except for the effect of εz for Type-III matrix on through-thickness properties of 2D composites. The effects of elevated temperatures and neutron irradiation on thermal conductivity were treated by modifying the thermal conductivity of each constituent in accordance with the linear thermal resistance model proposed by Snead et al. [10]. Results and Discussion Mechanical Properties The results of tensile tests are summarized in Table 3. The 2D SiC/SiC composites exhibited ultimate tensile strength (UTS) and proportional limit stress (PLS) similar to the typical SiC/SiC composites evaluated previously [11,12]. The 3D and Hybrid 2D composites exhibited significantly lower strength than the 2D SiC fiber composites. Under the assumed condition of global load sharing, where the intact longitudinal fibers carry the load equally, the UTS is proportional to the product of longitudinal fiber volume fraction (Vf) and characteristic fiber strength (σc):
34
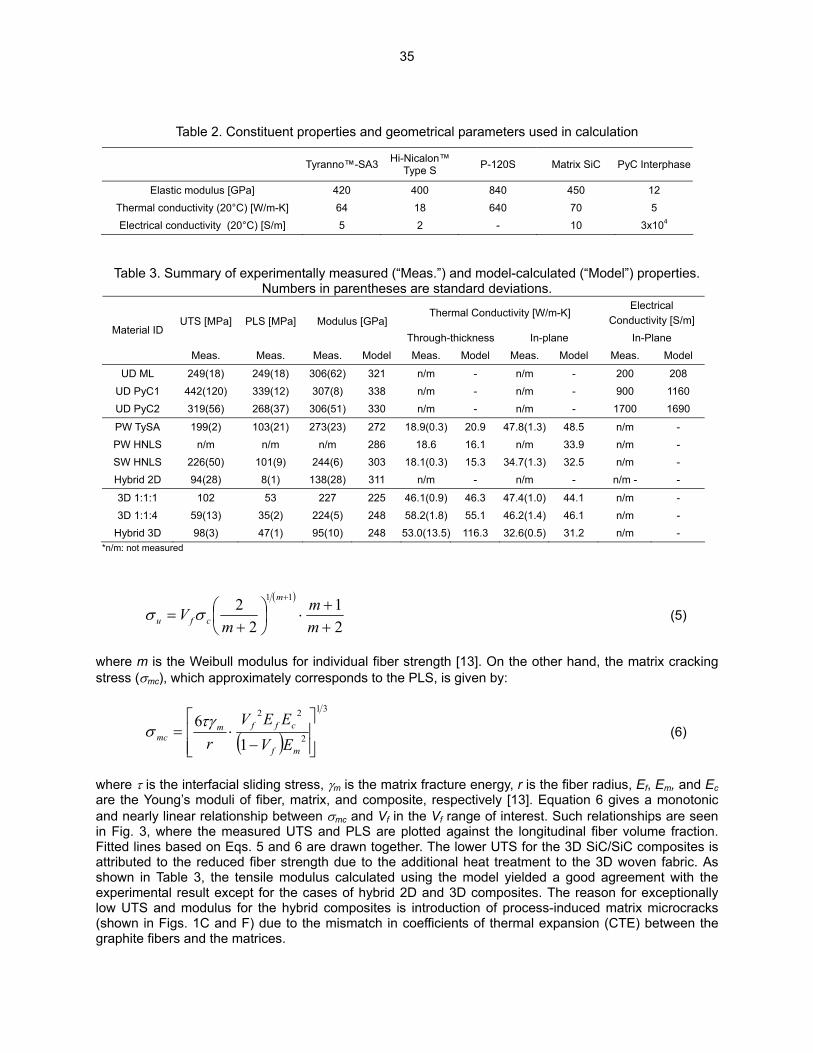
Table 2. Constituent properties and geometrical parameters used in calculation
Tyranno™-SA3 Hi-Nicalon™ Type S P-120S Matrix SiC PyC Interphase
Elastic modulus [GPa] 420 400 840 450 12 Thermal conductivity (20°C) [W/m-K] 64 18 640 70 5 Electrical conductivity (20°C) [S/m] 5 2 - 10 3x10⁴
Table 3. Summary of experimentally measured (“Meas.”) and model-calculated (“Model”) properties. Numbers in parentheses are standard deviations.
Thermal Conductivity [W/m-K] Electrical
Conductivity [S/m] UTS [MPa] PLS [MPa] Modulus [GPa] Through-thickness In-plane In-Plane
Material ID
Meas. Meas. Meas. Model Meas. Model Meas. Model Meas. Model
UD ML 249(18) 249(18) 306(62) 321 n/m - n/m - 200 208 UD PyC1 442(120) 339(12) 307(8) 338 n/m - n/m - 900 1160 UD PyC2 319(56) 268(37) 306(51) 330 n/m - n/m - 1700 1690
PW TySA 199(2) 103(21) 273(23) 272 18.9(0.3) 20.9 47.8(1.3) 48.5 n/m - PW HNLS n/m n/m n/m 286 18.6 16.1 n/m 33.9 n/m - SW HNLS 226(50) 101(9) 244(6) 303 18.1(0.3) 15.3 34.7(1.3) 32.5 n/m - Hybrid 2D 94(28) 8(1) 138(28) 311 n/m - n/m - n/m - -
3D 1:1:1 102 53 227 225 46.1(0.9) 46.3 47.4(1.0) 44.1 n/m - 3D 1:1:4 59(13) 35(2) 224(5) 248 58.2(1.8) 55.1 46.2(1.4) 46.1 n/m -
Hybrid 3D 98(3) 47(1) 95(10) 248 53.0(13.5) 116.3 32.6(0.5) 31.2 n/m - *n/m: not measured
( )
21
22 11
++
⋅⎟⎠⎞
⎜⎝⎛
+=
+
mm
mV
m
cfu σσ (5)
where m is the Weibull modulus for individual fiber strength [13]. On the other hand, the matrix cracking stress (σmc), which approximately corresponds to the PLS, is given by:
( )31
2
22
16
⎥⎥⎦
⎤
⎢⎢⎣
⎡
−⋅=
mf
cffmmc EV
EEVrτγσ (6)
where τ is the interfacial sliding stress, γm is the matrix fracture energy, r is the fiber radius, Ef, Em, and Ec are the Young’s moduli of fiber, matrix, and composite, respectively [13]. Equation 6 gives a monotonic and nearly linear relationship between σmc and Vf in the Vf range of interest. Such relationships are seen in Fig. 3, where the measured UTS and PLS are plotted against the longitudinal fiber volume fraction. Fitted lines based on Eqs. 5 and 6 are drawn together. The lower UTS for the 3D SiC/SiC composites is attributed to the reduced fiber strength due to the additional heat treatment to the 3D woven fabric. As shown in Table 3, the tensile modulus calculated using the model yielded a good agreement with the experimental result except for the cases of hybrid 2D and 3D composites. The reason for exceptionally low UTS and modulus for the hybrid composites is introduction of process-induced matrix microcracks (shown in Figs. 1C and F) due to the mismatch in coefficients of thermal expansion (CTE) between the graphite fibers and the matrices.
35

Thermal Conductivity Thermal conductivity measured along the in-plane and through-thickness directions at room temperature is summarized in Table 3. The Hybrid 2D composite underwent delamination during processing and, therefore, was not subjected to thermal conductivity measurement. The data are also plotted in Fig. 4 as a function of the estimated contribution from the fibers along the heat transport axis to the composite thermal conductivity. The in-plane fiber contribution to through-thickness thermal conductivity in the 2D composite systems is due to the through-thickness component of the wavy fiber tows in 2D woven fabrics. The linear fit indicates the slope of slightly higher than unity and intersects the vertical axis at ~35 W/m-K, in contrast to the 15–20 W/m-K of through-thickness thermal conductivity for the 2D composites. This implies a significant contribution of the matrix within and surrounding the axial fiber tows, in addition to the contribution from the axial fibers themselves, to the composite thermal conductivity. Therefore, the presence of the axial fiber tows is the key factor that enables a large heat conductance. In other words, the large planar matrix pores distinctive to the 2D laminate composites are effective in lowering the through-thickness heat transport. The model-prediction showed a good agreement between the calculated and experimental thermal conductivity in both the in-plane and through-thickness directions, as shown in Table 3. The geometric parameters used for thermal conductivity are identical with those used for the elastic modulus calculation. It was assumed that these results validate the applicability of this approach to the approximate estimation of various transport properties in the present composite systems.
0
20
40
60
80
100
120
140
160
0 0.1 0.2 0.3
Axial Fiber Volume Fraction
Prop
ortio
nal L
imit
Stre
ss (M
Pa)
.
SiC/SiC 2DSiC/SiC 3DHybrid 3DModel, fitted
0
50
100
150
200
250
300
0 0.1 0.2 0.3
Axial Fiber Volume Fraction
Ultim
ate
Tens
ile S
tress
(MPa
) .
SiC/SiC 2DSiC/SiC 3DHybrid 3DLinear fit
Fig. 3. The influence of fiber volume fraction along the tensile axis on the ultimate tensile stress and proportional limit stress. Error bars indicate the standard deviation. The low strength for Hybrid 2D composite is due to process-induced extensive matrix cracking.
0
10
20
30
40
50
60
70
0 5 10 15 20 25
Axial Fiber Contribution (W/m-K)
Com
posi
te T
herm
al C
ondu
ctiv
ity (W
/m-K
)
SiC/SiC 2D, in-planeSiC/SiC 2D, through-thicknessSiC/SiC 3DHybrid 3D, in-plane
2D in-plane and 3D
2D through-thickness
RT
Fig. 4. Effect of heat conduction through axial fibers on composite thermal conductivity at room temperature. The dotted line represents a linear fit to data points for SiC/SiC composites in one of the fiber directions.
In Fig. 5, the calculated temperature dependence of thermal conductivity for selected composites is presented along with experimental data [14]. For this calculation, linearly temperature dependent reciprocal thermal diffusivity was assumed for both matrix and fibers, based on the thermal conductivity data for chemically vapor-deposited SiC [14], and the coefficient of thermal resistance was adjusted to fit the experimental data in Fig. 5.
36

Neutron irradiation is known to further increase thermal resistance for SiC, which initially increase with fluence and tends to saturate by a few dpa of neutron exposure. The saturated defect thermal resistance is linearly dependent on the irradiation temperature at 300–800°C [15] and the data could be fitted to the equation below:
( )CTKrd
o41013.1119.01 −×−= (7)
Figure 6 presents the post-irradiation thermal conductivity at the irradiation temperature calculated using Eq. 7. The positive temperature dependence of the post-irradiation thermal conductivity is due to the strong contribution from the defect thermal resistance, in contrast to the negative temperature dependence for the non-irradiated materials. The model prediction suggests that, when through-thickness fibers are incorporated in CVI SiC-matrix composites, the post-irradiation through-thickness thermal conductivity of 10–15 W/m-K is feasible for high-heat flux applications at 800–1000°C, which is the temperature range of primary interest for power reactor design studies [5]. Meanwhile, 2D laminated composites are more appropriate when the through-thickness thermal conductivity < 5 W/m-K is desired under irradiation at < 800°C, which is of interest for the flow channel insert application [4]. Substantial increase or reduction in through-thickness thermal conductivity from these upper or lower limits will require the incorporation of a heat conductive or thermally insulating medium within the composites [16].
0
10
20
30
40
50
60
70
80
0 200 400 600 800 1000 1200
Temperature (°C)
Ther
rmal
Con
duct
ivity
(W/m
-K)
3D 1:1:4 TySA / PyC, Through-thickness, Model3D 1:1:1 TySA / PyC, Through-thickness, Model2D-PW TySA / PyC, Through-thickness, Model5HSW HNLS / PyC, Through-thickness, Model3D 1:1:4 TySA/PyC Through-thickness, Experiment3D 1:1:1 Ty/SA/PyC Through-thickness, Experiment2D-PW TySA / PyC Through-thickness, Experiment5HSW HNLS / PyC Through-thickness, Experiment
Fig. 5. Temperature-dependent thermal conductivity of various CVI SiC/SiC composites: comparison of model-prediction and experimental data.
0
5
10
15
20
25
30
35
40
0 200 400 600 800 1000 1200
Irradiation / Test Temperature (°C)
Ther
rmal
Con
duct
ivity
(W/m
-K)
3D 1:1:4 TySA / PyC, Through-thickness, Model3D 1:1:1 TySA / PyC, Through-thickness, Model2D-PW TySA / PyC, Through-thickness, Model5HSW HNLS / PyC, Through-thickness, ModelCVD SiC, ModelCVD SiC, Experiment (Snead, 2004)
Fig. 6. Post-irradiation thermal conductivity of CVI SiC/SiC composites as a function of temperature predicted by the model. The temperature at which thermal conductivity was calculated is equal to the irradiation temperature.
Optimizing the 3D Configuration For high through-thickness heat flux applications such as blanket first walls, thermal stress arising from the temperature gradient across the wall thickness will be a major design issue that limits the operating condition of specific systems [5]. The general resistance of materials to thermal stress is conveniently indexed by a thermal stress figure of merit (M) [17]:
( )E
vKM tha
ασ −
=1
(7)
37
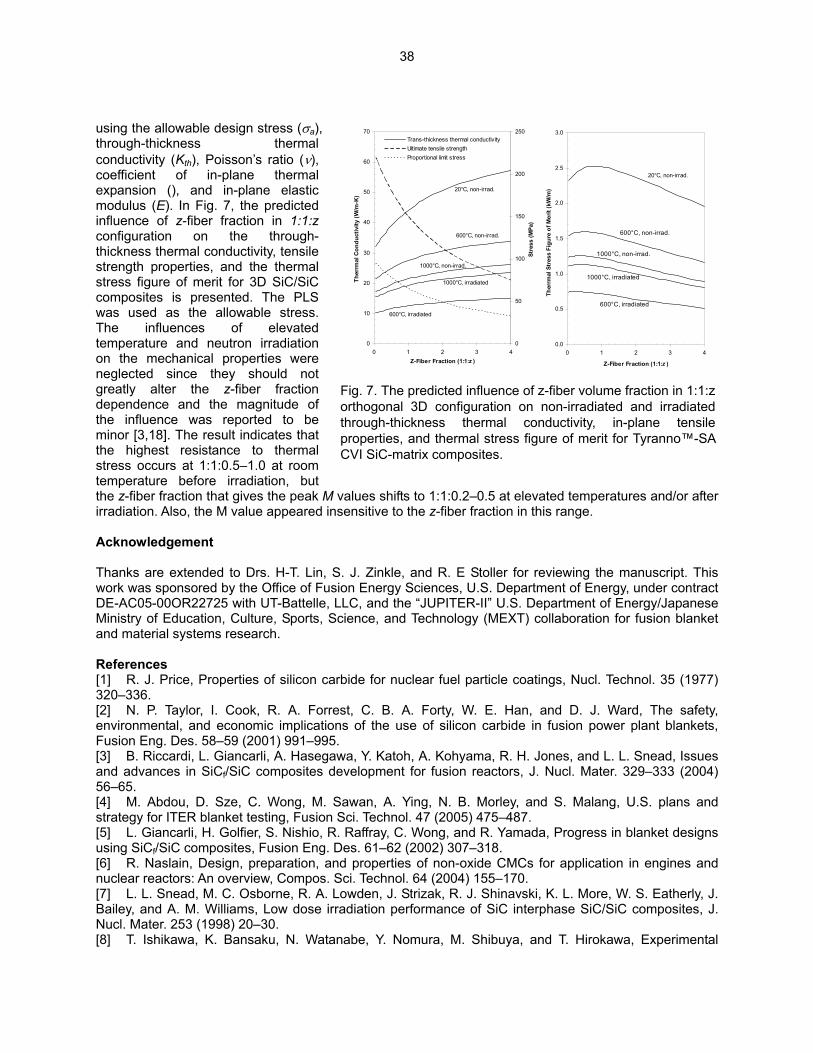
using the allowable design stress (σa), through-thickness thermal conductivity (Kth), Poisson’s ratio (ν), coefficient of in-plane thermal expansion (), and in-plane elastic modulus (E). In Fig. 7, the predicted influence of z-fiber fraction in 1:1:z configuration on the through-thickness thermal conductivity, tensile strength properties, and the thermal stress figure of merit for 3D SiC/SiC composites is presented. The PLS was used as the allowable stress. The influences of elevated temperature and neutron irradiation on the mechanical properties were neglected since they should not greatly alter the z-fiber fraction dependence and the magnitude of the influence was reported to be minor [3,18]. The result indicates that the highest resistance to thermal stress occurs at 1:1:0.5–1.0 at room temperature before irradiation, but the z-fiber fraction that gives the peak M irradiation. Also, the M value appeared in Acknowledgement Thanks are extended to Drs. H-T. Lin, Swork was sponsored by the Office of FusDE-AC05-00OR22725 with UT-Battelle, LMinistry of Education, Culture, Sports, Sand material systems research. References [1] R. J. Price, Properties of silicon car320–336. [2] N. P. Taylor, I. Cook, R. A. Forreenvironmental, and economic implicationFusion Eng. Des. 58–59 (2001) 991–995.[3] B. Riccardi, L. Giancarli, A. Hasegawand advances in SiCf/SiC composites de56–65. [4] M. Abdou, D. Sze, C. Wong, M. Sstrategy for ITER blanket testing, Fusion [5] L. Giancarli, H. Golfier, S. Nishio, Rusing SiCf/SiC composites, Fusion Eng. D[6] R. Naslain, Design, preparation, annuclear reactors: An overview, Compos. S[7] L. L. Snead, M. C. Osborne, R. A. LBailey, and A. M. Williams, Low dose irrNucl. Mater. 253 (1998) 20–30. [8] T. Ishikawa, K. Bansaku, N. Watan
38
0
10
20
30
40
50
60
70
0 1 2 3 4Z-Fiber Fraction (1:1:z )
Ther
rmal
Con
duct
ivity
(W/m
-K)
0
50
100
150
200
250
Stre
ss (M
Pa)
Trans-thickness thermal conductivityUltimate tensile strengthProportional limit stress
20°C, non-irrad.
600°C, non-irrad.
1000°C, non-irrad.
600°C, irradiated
1000°C, irradiated
0.0
0.5
1.0
1.5
2.0
2.5
3.0
0 1 2 3 4
Z-Fiber Fraction (1:1:z )
Ther
rmal
Str
ess
Figu
re o
f Mer
it (k
W/m
)
20°C, non-irrad.
600°C, non-irrad.
1000°C, non-irrad.
600°C, irradiated
1000°C, irradiated
Fig. 7. The predicted influence of z-fiber volume fraction in 1:1:z orthogonal 3D configuration on non-irradiated and irradiated through-thickness thermal conductivity, in-plane tensile properties, and thermal stress figure of merit for Tyranno™-SA CVI SiC-matrix composites.
values shifts to 1:1:0.2–0.5 at elevated temperatures and/or after sensitive to the z-fiber fraction in this range.
. J. Zinkle, and R. E Stoller for reviewing the manuscript. This ion Energy Sciences, U.S. Department of Energy, under contract LC, and the “JUPITER-II” U.S. Department of Energy/Japanese
cience, and Technology (MEXT) collaboration for fusion blanket
bide for nuclear fuel particle coatings, Nucl. Technol. 35 (1977)
st, C. B. A. Forty, W. E. Han, and D. J. Ward, The safety, s of the use of silicon carbide in fusion power plant blankets, a, Y. Katoh, A. Kohyama, R. H. Jones, and L. L. Snead, Issues velopment for fusion reactors, J. Nucl. Mater. 329–333 (2004)
awan, A. Ying, N. B. Morley, and S. Malang, U.S. plans and Sci. Technol. 47 (2005) 475–487. . Raffray, C. Wong, and R. Yamada, Progress in blanket designs es. 61–62 (2002) 307–318. d properties of non-oxide CMCs for application in engines and ci. Technol. 64 (2004) 155–170. owden, J. Strizak, R. J. Shinavski, K. L. More, W. S. Eatherly, J. adiation performance of SiC interphase SiC/SiC composites, J.
abe, Y. Nomura, M. Shibuya, and T. Hirokawa, Experimental
stress/strain behavior of SiC-matrix composites reinforced with Si-Ti-C-O fibers and estimation of matrix elastic modulus, Compos. Sci. Technol. 58 (1998) 51–63. [9] B. Schulz, Thermal conductivity of porous and highly porous materials, High Temp. High Press. 13 (1981) 649–660. [10] L. L. Snead, S. J. Zinkle, and D. P. White, Thermal conductivity degradation of ceramic materials due to low temperature, low dose neutron irradiation, J. Nucl. Mater. 340 (2005) 187–202. [11] Y. Katoh, T. Nozawa, and L. L. Snead, Mechanical properties of thin PyC interphase SiC-matrix composites reinforced with near-stoichiometric SiC fibers, Journal of American Ceramic Society (accepted). [12] Y. Katoh, T. Nozawa, L. L. Snead, T. Hinoki, A. Kohyama, N. Igawa, and T. Taguchi, Mechanical properties of chemically vapor-infiltrated silicon carbide structural composites with thin carbon interphases for fusion and advanced fission applications, Mater. Trans. 46 (2005) 527–535. [13] W. A. Curtin, Theory of mechanical properties of ceramic-matrix composites, J. Am. Ceram. Soc. 74 (1991) 2837–2845. [14] G. E. Youngblood, D. J. Senor, and R. H. Jones, Effects of irradiation and post-irradiation annealing on the thermal conductivity/diffusivity of monolithic SiC and f-SiC/SiC composites, J. Nucl. Mater. 329–333 (2004) 507–512. [15] L. L. Snead, Limits on irradiation-induced thermal conductivity and electrical resistivity in silicon carbide materials, J. Nucl. Mater. 329–333 (2004) 524–529. [16] L. L. Snead, M. Balden, R. A. Causey, and H. Atsumi, High thermal conductivity of graphite fiber silicon carbide composites for fusion reactor application, J. Nucl. Mater. 307–311 (2002) 1200–1204. [17] S. J. Zinkle and N. M. Ghoniem, Operating temperature windows for fusion reactor structural materials, Fusion Eng. Des. 51–52 (2000) 55–71. [18] K. Hironaka, T. Nozawa, T. Hinoki, N. Igawa, Y. Katoh, L. L. Snead, and A. Kohyama, High-temperature tensile strength of near-stoichiometric SiC/SiC composites, J. Nucl. Mater. 307–311 (2002) 1093–1097.
39

INTERFACIAL SHEAR PROPERTIES OF SILICON CARBIDE COMPOSITES WITH MULTI-LAYERED
INTERFACE⎯T. Nozawa, Y. Katoh, and L. L. Snead (Oak Ridge National Laboratory)
OBJECTIVE
The primary objective of this study is to identify the optimum interlayer design of multiple pyrolytic carbon
(PyC) / silicon carbide (SiC) interphase. For this purpose, the effect of interlayer thickness on interfacial
shear properties of (non-irradiated) SiC/SiC composites with single PyC interphase and multiple PyC/SiC
(ML) interphase is specifically addressed on.
SUMMARY
Interfacial shear properties of ML composites are significantly dependent on the total PyC interlayer
thickness, which affects thermally-induced residual radial- and axial-stresses in the fiber. Rough crack
surface of ML composites, most of which have an interfacial crack between the fiber and the first PyC
layer, also increases frictional shear stress during fiber pull-out due to contribution from roughness of the
adjacent SiC sub-layer. Preliminary test results indicate the flexible tailorability of multilayer interphase to
provide moderate interfacial shear strength by applying the optimum total PyC thickness, even though
each PyC layer remains thin enough.
PROGRESS AND STATUS
Introduction
Silicon carbide matrix composites are being developed for structural applications in fusion systems for their
promise of high-temperature performance and low-induced activation. The stability of highly crystalline
fibers has led to composites with very good irradiation stability [1, 2]. Specifically, recent report by the
authors [3] suggested that the overall composite strength was closely dependent on the neutron irradiation
stability of PyC interphase. For non-nuclear applications, a multilayer interphase composed of sequences
of thin (< 50 nm) PyC and SiC results in superior composite strength and oxidation resistance [4]. The
irradiation effect on interfacial shear properties has been investigated by many authors [5, 6]. However,
they did not sufficiently consider the effect of interlayer thickness, which significantly influences the
interfacial shear properties. Specifically, the effect of neutron irradiation on ML interphase is still unclear.
40
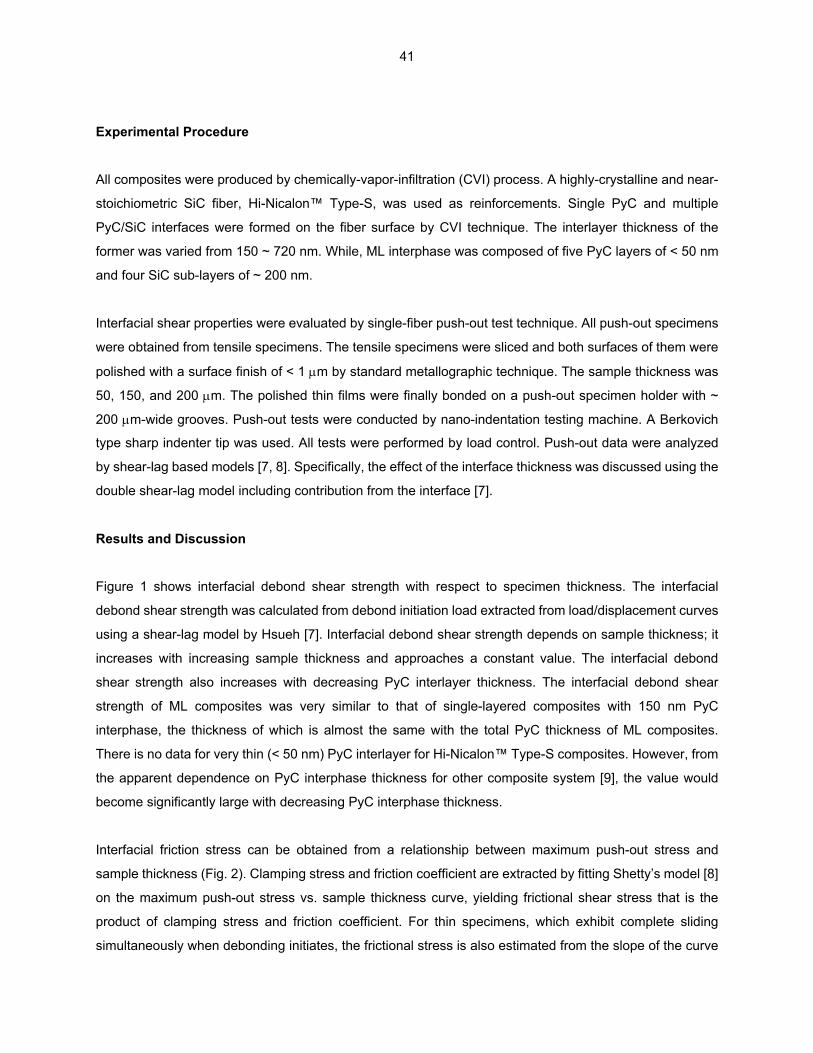
Experimental Procedure
All composites were produced by chemically-vapor-infiltration (CVI) process. A highly-crystalline and near-
stoichiometric SiC fiber, Hi-Nicalon™ Type-S, was used as reinforcements. Single PyC and multiple
PyC/SiC interfaces were formed on the fiber surface by CVI technique. The interlayer thickness of the
former was varied from 150 ~ 720 nm. While, ML interphase was composed of five PyC layers of < 50 nm
and four SiC sub-layers of ~ 200 nm.
Interfacial shear properties were evaluated by single-fiber push-out test technique. All push-out specimens
were obtained from tensile specimens. The tensile specimens were sliced and both surfaces of them were
polished with a surface finish of < 1 µm by standard metallographic technique. The sample thickness was
50, 150, and 200 µm. The polished thin films were finally bonded on a push-out specimen holder with ~
200 µm-wide grooves. Push-out tests were conducted by nano-indentation testing machine. A Berkovich
type sharp indenter tip was used. All tests were performed by load control. Push-out data were analyzed
by shear-lag based models [7, 8]. Specifically, the effect of the interface thickness was discussed using the
double shear-lag model including contribution from the interface [7].
Results and Discussion
Figure 1 shows interfacial debond shear strength with respect to specimen thickness. The interfacial
debond shear strength was calculated from debond initiation load extracted from load/displacement curves
using a shear-lag model by Hsueh [7]. Interfacial debond shear strength depends on sample thickness; it
increases with increasing sample thickness and approaches a constant value. The interfacial debond
shear strength also increases with decreasing PyC interlayer thickness. The interfacial debond shear
strength of ML composites was very similar to that of single-layered composites with 150 nm PyC
interphase, the thickness of which is almost the same with the total PyC thickness of ML composites.
There is no data for very thin (< 50 nm) PyC interlayer for Hi-Nicalon™ Type-S composites. However, from
the apparent dependence on PyC interphase thickness for other composite system [9], the value would
become significantly large with decreasing PyC interphase thickness.
Interfacial friction stress can be obtained from a relationship between maximum push-out stress and
sample thickness (Fig. 2). Clamping stress and friction coefficient are extracted by fitting Shetty’s model [8]
on the maximum push-out stress vs. sample thickness curve, yielding frictional shear stress that is the
product of clamping stress and friction coefficient. For thin specimens, which exhibit complete sliding
simultaneously when debonding initiates, the frictional stress is also estimated from the slope of the curve
41
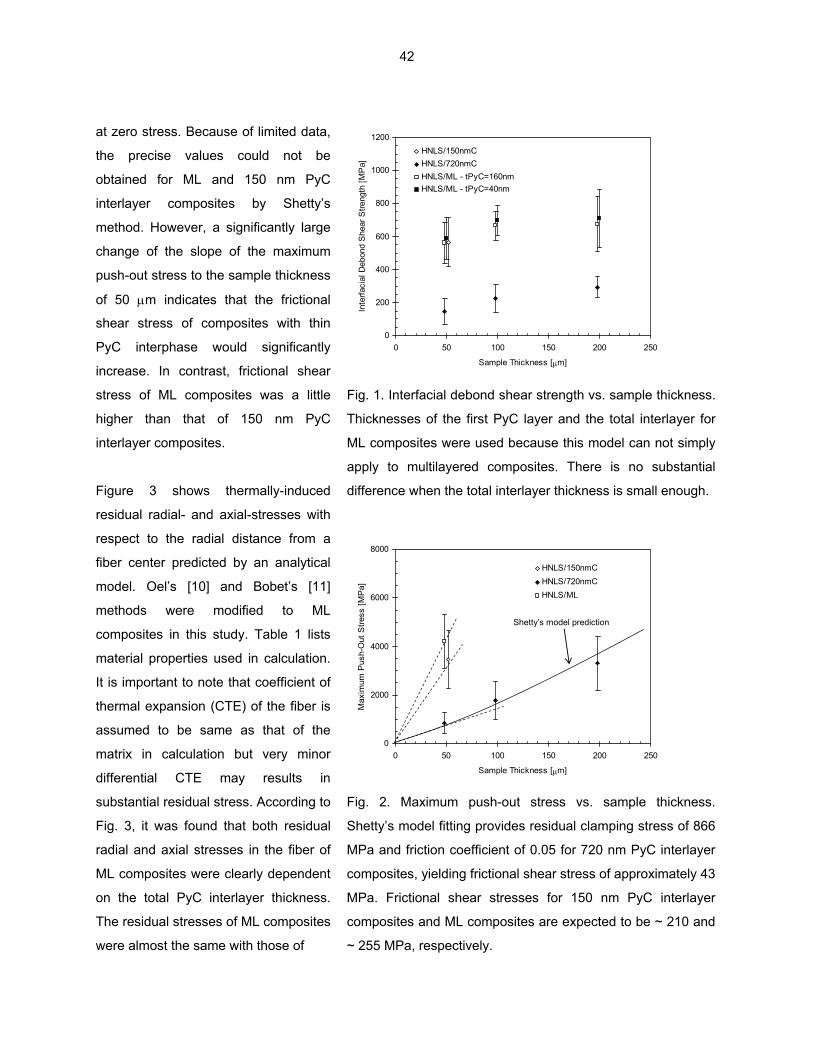
at zero stress. Because of limited data,
the precise values could not be
obtained for ML and 150 nm PyC
interlayer composites by Shetty’s
method. However, a significantly large
change of the slope of the maximum
push-out stress to the sample thickness
of 50 µm indicates that the frictional
shear stress of composites with thin
PyC interphase would significantly
increase. In contrast, frictional shear
stress of ML composites was a little
higher than that of 150 nm PyC
interlayer composites.
Figure 3 shows thermally-induced
residual radial- and axial-stresses with
respect to the radial distance from a
fiber center predicted by an analytical
model. Oel’s [10] and Bobet’s [11]
methods were modified to ML
composites in this study. Table 1 lists
material properties used in calculation.
It is important to note that coefficient of
thermal expansion (CTE) of the fiber is
assumed to be same as that of the
matrix in calculation but very minor
differential CTE may results in
substantial residual stress. According to
Fig. 3, it was found that both residual
radial and axial stresses in the fiber of
ML composites were clearly dependent
on the total PyC interlayer thickness.
The residual stresses of ML composites
were almost the same with those of
0
200
400
600
800
1000
1200
0 50 100 150 200 250
Sample Thickness [µm]In
terfa
cial
Deb
ond
She
ar S
treng
th [M
Pa]
HNLS/150nmCHNLS/720nmCHNLS/ML - tPyC=160nmHNLS/ML - tPyC=40nm
Fig. 1. Interfacial debond shear strength vs. sample thickness.
Thicknesses of the first PyC layer and the total interlayer for
ML composites were used because this model can not simply
apply to multilayered composites. There is no substantial
difference when the total interlayer thickness is small enough.
0
2000
4000
6000
8000
0 50 100 150 200 250
Sample Thickness [µm]
Max
imum
Pus
h-O
ut S
tress
[MP
a]
HNLS/150nmCHNLS/720nmCHNLS/ML
Shetty’s model prediction
Fig. 2. Maximum push-out stress vs. sample thickness.
Shetty’s model fitting provides residual clamping stress of 866
MPa and friction coefficient of 0.05 for 720 nm PyC interlayer
composites, yielding frictional shear stress of approximately 43
MPa. Frictional shear stresses for 150 nm PyC interlayer
composites and ML composites are expected to be ~ 210 and
~ 255 MPa, respectively.
42
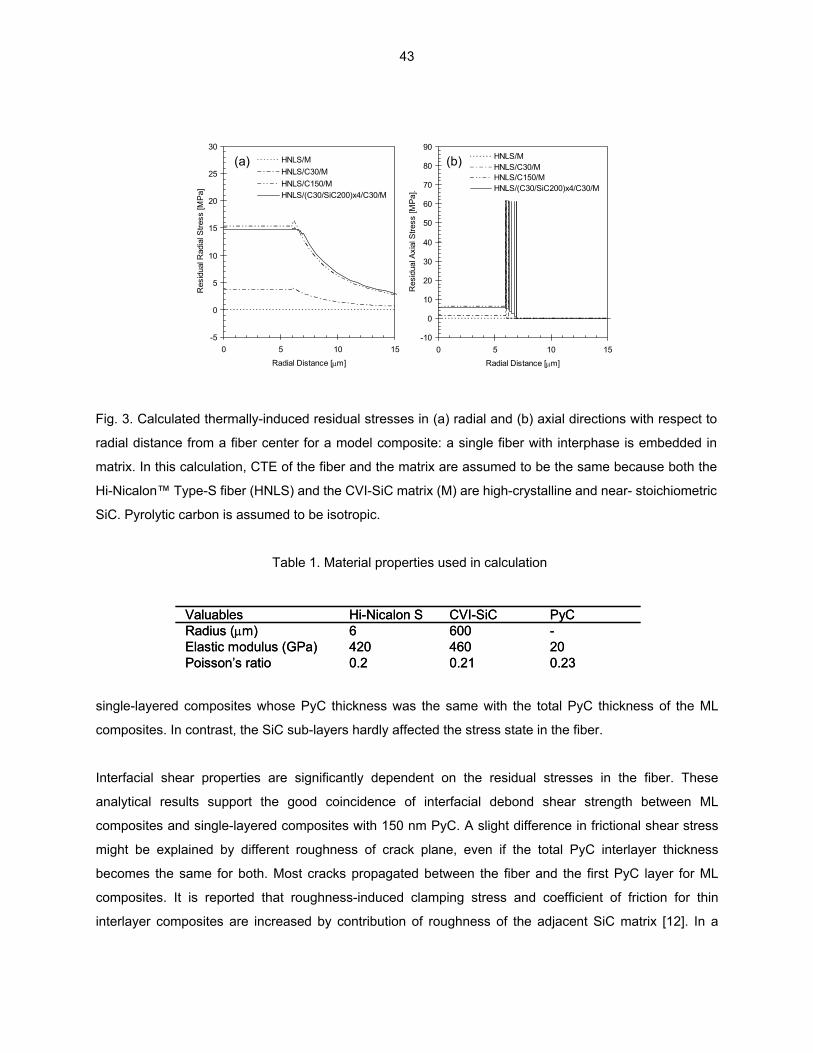
(a) (b)
-5
0
5
10
15
20
25
30
0 5 10 15
Radial Distance [µm]
Res
idua
l Rad
ial S
tress
[MP
a]
HNLS/MHNLS/C30/MHNLS/C150/MHNLS/(C30/SiC200)x4/C30/M
-10
0
10
20
30
40
50
60
70
80
90
0 5 10
Radial Distance [µm]
Res
idua
l Axi
al S
tress
[MP
a]
15
.
HNLS/MHNLS/C30/MHNLS/C150/MHNLS/(C30/SiC200)x4/C30/M
Fig. 3. Calculated thermally-induced residual stresses in (a) radial and (b) axial directions with respect to
radial distance from a fiber center for a model composite: a single fiber with interphase is embedded in
matrix. In this calculation, CTE of the fiber and the matrix are assumed to be the same because both the
Hi-Nicalon™ Type-S fiber (HNLS) and the CVI-SiC matrix (M) are high-crystalline and near- stoichiometric
SiC. Pyrolytic carbon is assumed to be isotropic.
Table 1. Material properties used in calculation
-6006Radius (µm)
0.2420
Hi-Nicalon S
0.21460
CVI-SiC
0.23Poisson’s ratio20Elastic modulus (GPa)
PyCValuables-6006Radius (µm)
0.2420
Hi-Nicalon S
0.21460
CVI-SiC
0.23Poisson’s ratio20Elastic modulus (GPa)
PyCValuables
single-layered composites whose PyC thickness was the same with the total PyC thickness of the ML
composites. In contrast, the SiC sub-layers hardly affected the stress state in the fiber.
Interfacial shear properties are significantly dependent on the residual stresses in the fiber. These
analytical results support the good coincidence of interfacial debond shear strength between ML
composites and single-layered composites with 150 nm PyC. A slight difference in frictional shear stress
might be explained by different roughness of crack plane, even if the total PyC interlayer thickness
becomes the same for both. Most cracks propagated between the fiber and the first PyC layer for ML
composites. It is reported that roughness-induced clamping stress and coefficient of friction for thin
interlayer composites are increased by contribution of roughness of the adjacent SiC matrix [12]. In a
43

similar manner, ML composites probably exhibit larger frictional shear stress due to contribution from
roughness of the adjacent SiC sub-layer.
Generally, very thin carbon interphase provides very strong interface, leading brittle fracture. Hence, the
optimum PyC interphase thickness of 100 ~ 200 nm was suggested for non-nuclear applications [9]. Figure
3 implies a great advantage to select thin-layered ML interphase; the moderate interfacial strength and
better friction are easily obtained by designing the optimum total PyC interphase thickness, even though
each PyC layer remains thin enough.
Acknowledgement
This research was sponsored by the Office of Fusion Energy Sciences, U.S. Department of Energy under
contract DE-AC05-00OR22725 with UT-Battelle, LLC.
References
[1] L. L. Snead, Y. Katoh, A. Kohyama, J. L. Bailey, N. L. Vaughn, and R. A. Lowden, J. Nucl. Mater.
283–287 (2000) 551.
[2] T. Hinoki, L. L. Snead, Y. Katoh, A. Hasegawa, T. Nozawa, and A. Kohyama, J. Nucl. Mater. 307–311
(2002) 1157.
[3] T. Nozawa, K. Ozawa, S. Kondo, T. Hinoki, Y. Katoh, L. L. Snead, and A. Kohyama, J. ASTM Int. 2
(2005).
[4] R. Naslain, P. Pailler, X. Bourrat, D. Bertrand, F. Heurtevent, P. Dupel, and F. Lamouroux, Solid State
Ionics 141–142 (2001) 541.
[5] L. L. Snead, D. Steiner, and S. J. Zinkle, J. Nucl. Mater. 191–194 (1992) 566.
[6] T. Hinoki, L. L. Snead, Y. Katoh, A. Kohyama, and R. Shinavski, J. Nucl. Mater. 283–287 (2000) 376.
[7] C-H. Hsueh, Mater. Sci. Eng. A165 (1993) 189.
[8] D. K. Shetty, J. Am. Ceram. Soc. 71 (1988) C208.
[9] Y. Katoh, T. Nozawa, and L. L. Snead, Journal of American Ceramic Society (in press).
[10] H. J. Oel and V. D. Frechette, J. Am. Ceram. Soc. 69 (1986) 342.
[11] J.-L. Bobet and J. Lamon, Acta Metall. Mater. 43 (1995) 2241.
[12] E. Lara-Curzio, M. K. Ferber, and R. A. Lowden, Ceram. Eng. Sci. Proc. 15 (1994) 989.
44

ERRATUM TO “STRENGTH AND ELASTIC MODULUS OF NEUTRON-IRRADIATED CUBIC SILICON CARBIDE,” in Fusion Materials Semiannual Progress Report for the Period Ending June 30, 2004, DOE/ER-0313/36 Figure 5 of this report contained an error. The error has been corrected, and a revised version of the report is available on-line in DOE/ER-0313/36. Anyone who downloaded and/or referred the original report is encouraged to obtain the corrected copy.
45

3.0 FERRITIC/MARTENSITIC STEELS AND ODS STEELS
46
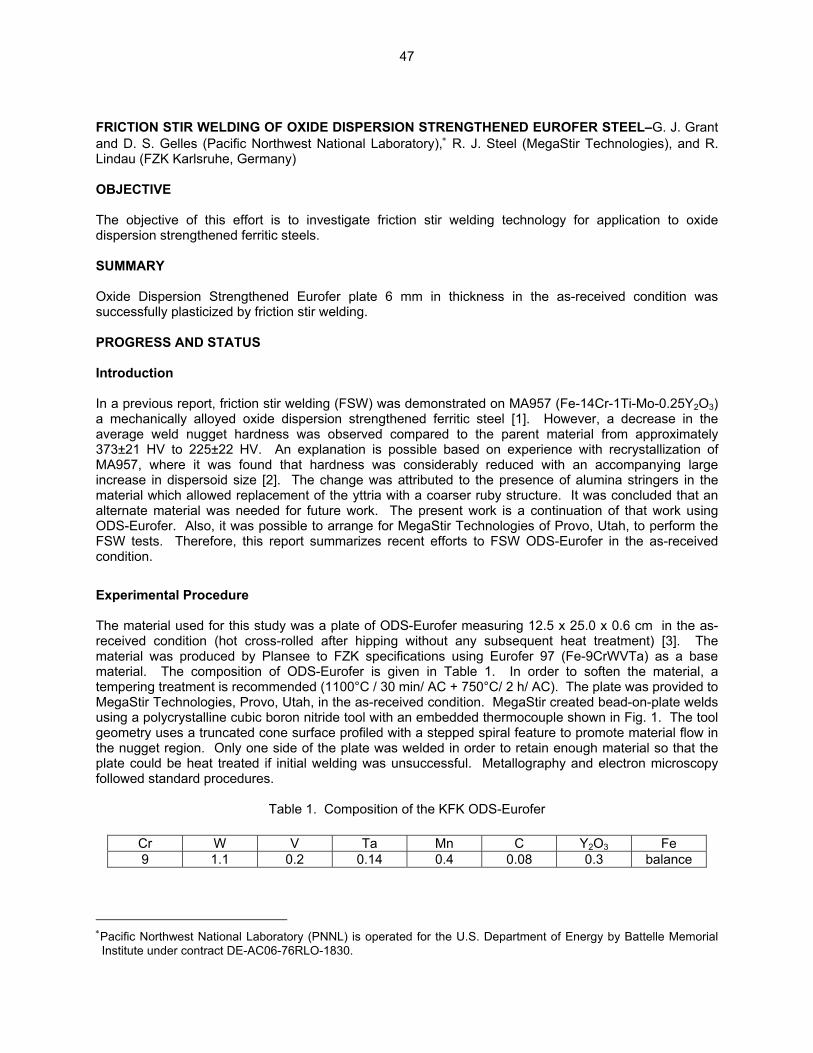
FRICTION STIR WELDING OF OXIDE DISPERSION STRENGTHENED EUROFER STEEL–G. J. Grant and D. S. Gelles (Pacific Northwest National Laboratory),∗ R. J. Steel (MegaStir Technologies), and R. Lindau (FZK Karlsruhe, Germany) OBJECTIVE The objective of this effort is to investigate friction stir welding technology for application to oxide dispersion strengthened ferritic steels. SUMMARY Oxide Dispersion Strengthened Eurofer plate 6 mm in thickness in the as-received condition was successfully plasticized by friction stir welding. PROGRESS AND STATUS Introduction In a previous report, friction stir welding (FSW) was demonstrated on MA957 (Fe-14Cr-1Ti-Mo-0.25Y2O3) a mechanically alloyed oxide dispersion strengthened ferritic steel [1]. However, a decrease in the average weld nugget hardness was observed compared to the parent material from approximately 373±21 HV to 225±22 HV. An explanation is possible based on experience with recrystallization of MA957, where it was found that hardness was considerably reduced with an accompanying large increase in dispersoid size [2]. The change was attributed to the presence of alumina stringers in the material which allowed replacement of the yttria with a coarser ruby structure. It was concluded that an alternate material was needed for future work. The present work is a continuation of that work using ODS-Eurofer. Also, it was possible to arrange for MegaStir Technologies of Provo, Utah, to perform the FSW tests. Therefore, this report summarizes recent efforts to FSW ODS-Eurofer in the as-received condition.
Experimental Procedure The material used for this study was a plate of ODS-Eurofer measuring 12.5 x 25.0 x 0.6 cm in the as-received condition (hot cross-rolled after hipping without any subsequent heat treatment) [3]. The material was produced by Plansee to FZK specifications using Eurofer 97 (Fe-9CrWVTa) as a base material. The composition of ODS-Eurofer is given in Table 1. In order to soften the material, a tempering treatment is recommended (1100°C / 30 min/ AC + 750°C/ 2 h/ AC). The plate was provided to MegaStir Technologies, Provo, Utah, in the as-received condition. MegaStir created bead-on-plate welds using a polycrystalline cubic boron nitride tool with an embedded thermocouple shown in Fig. 1. The tool geometry uses a truncated cone surface profiled with a stepped spiral feature to promote material flow in the nugget region. Only one side of the plate was welded in order to retain enough material so that the plate could be heat treated if initial welding was unsuccessful. Metallography and electron microscopy followed standard procedures.
Table 1. Composition of the KFK ODS-Eurofer
Cr W V Ta Mn C Y2O3 Fe 9 1.1 0.2 0.14 0.4 0.08 0.3 balance
∗Pacific Northwest National Laboratory (PNNL) is operated for the U.S. Department of Energy by Battelle Memorial Institute under contract DE-AC06-76RLO-1830.
47
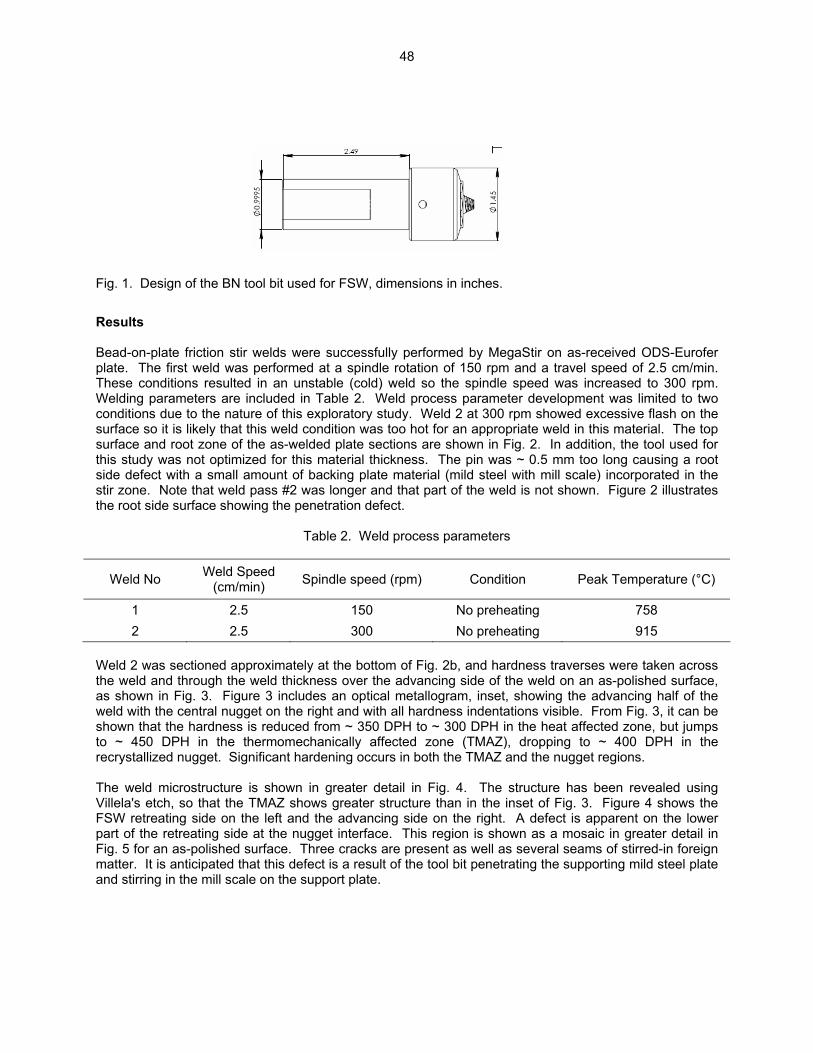
Fig. 1. Design of the BN tool bit used for FSW, dimensions in inches.
Results Bead-on-plate friction stir welds were successfully performed by MegaStir on as-received ODS-Eurofer plate. The first weld was performed at a spindle rotation of 150 rpm and a travel speed of 2.5 cm/min. These conditions resulted in an unstable (cold) weld so the spindle speed was increased to 300 rpm. Welding parameters are included in Table 2. Weld process parameter development was limited to two conditions due to the nature of this exploratory study. Weld 2 at 300 rpm showed excessive flash on the surface so it is likely that this weld condition was too hot for an appropriate weld in this material. The top surface and root zone of the as-welded plate sections are shown in Fig. 2. In addition, the tool used for this study was not optimized for this material thickness. The pin was ~ 0.5 mm too long causing a root side defect with a small amount of backing plate material (mild steel with mill scale) incorporated in the stir zone. Note that weld pass #2 was longer and that part of the weld is not shown. Figure 2 illustrates the root side surface showing the penetration defect.
Table 2. Weld process parameters
Weld No Weld Speed (cm/min) Spindle speed (rpm) Condition Peak Temperature (°C)
1 2.5 150 No preheating 758 2 2.5 300 No preheating 915
Weld 2 was sectioned approximately at the bottom of Fig. 2b, and hardness traverses were taken across the weld and through the weld thickness over the advancing side of the weld on an as-polished surface, as shown in Fig. 3. Figure 3 includes an optical metallogram, inset, showing the advancing half of the weld with the central nugget on the right and with all hardness indentations visible. From Fig. 3, it can be shown that the hardness is reduced from ~ 350 DPH to ~ 300 DPH in the heat affected zone, but jumps to ~ 450 DPH in the thermomechanically affected zone (TMAZ), dropping to ~ 400 DPH in the recrystallized nugget. Significant hardening occurs in both the TMAZ and the nugget regions. The weld microstructure is shown in greater detail in Fig. 4. The structure has been revealed using Villela's etch, so that the TMAZ shows greater structure than in the inset of Fig. 3. Figure 4 shows the FSW retreating side on the left and the advancing side on the right. A defect is apparent on the lower part of the retreating side at the nugget interface. This region is shown as a mosaic in greater detail in Fig. 5 for an as-polished surface. Three cracks are present as well as several seams of stirred-in foreign matter. It is anticipated that this defect is a result of the tool bit penetrating the supporting mild steel plate and stirring in the mill scale on the support plate.
48
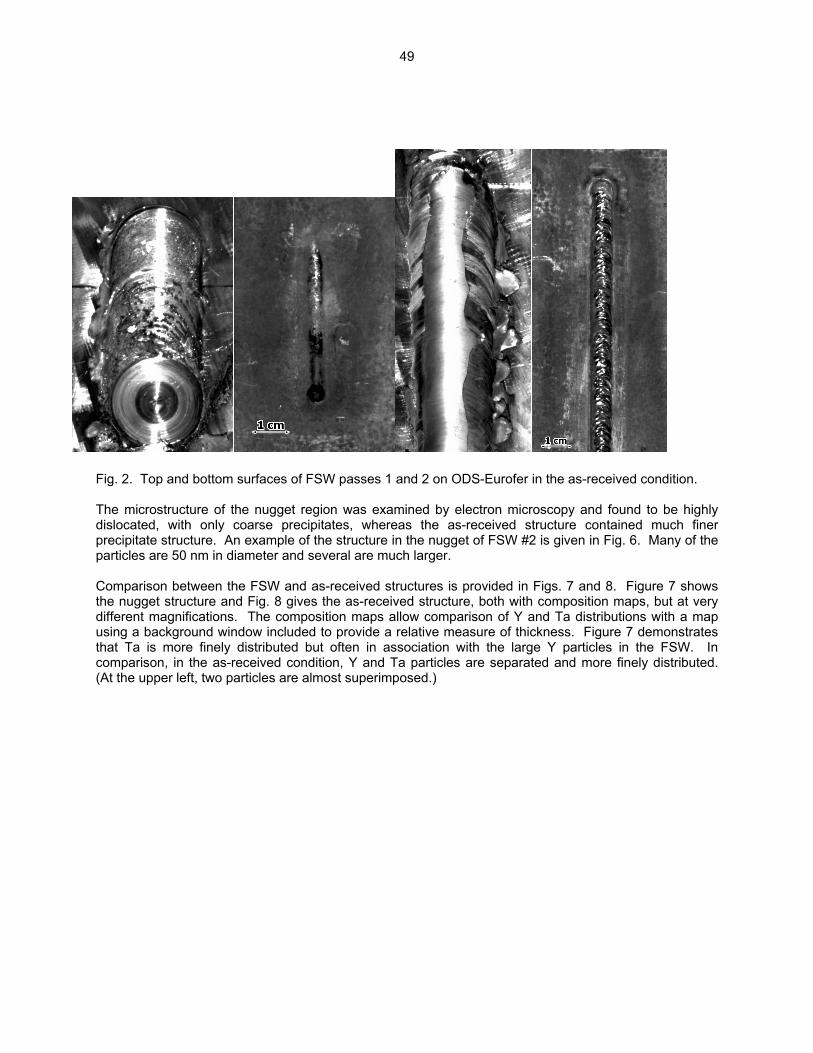
Fig. 2. Top and bottom surfaces of FSW passes 1 and 2 on ODS-Eurofer in the as-received condition. The microstructure of the nugget region was examined by electron microscopy and found to be highly dislocated, with only coarse precipitates, whereas the as-received structure contained much finer precipitate structure. An example of the structure in the nugget of FSW #2 is given in Fig. 6. Many of the particles are 50 nm in diameter and several are much larger. Comparison between the FSW and as-received structures is provided in Figs. 7 and 8. Figure 7 shows the nugget structure and Fig. 8 gives the as-received structure, both with composition maps, but at very different magnifications. The composition maps allow comparison of Y and Ta distributions with a map using a background window included to provide a relative measure of thickness. Figure 7 demonstrates that Ta is more finely distributed but often in association with the large Y particles in the FSW. In comparison, in the as-received condition, Y and Ta particles are separated and more finely distributed. (At the upper left, two particles are almost superimposed.)
49
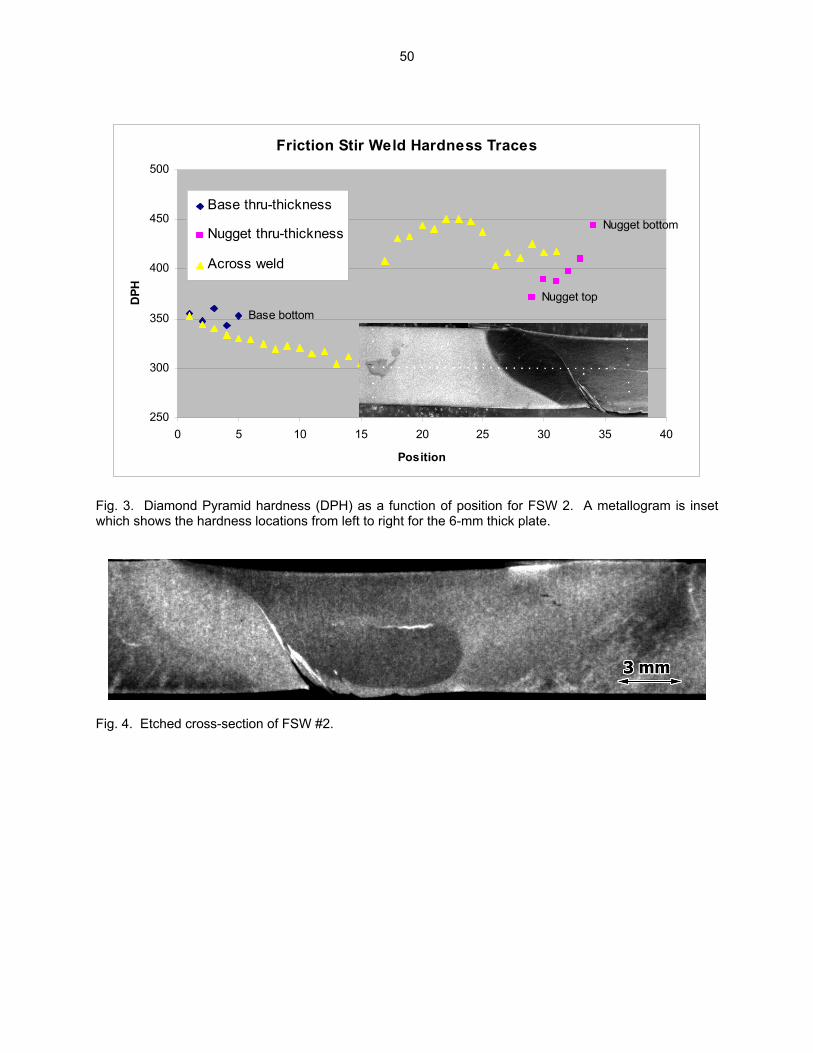
Friction Stir Weld Hardness Traces
Base bottom
Nugget bottom
Nugget top
250
300
350
400
450
500
0 5 10 15 20 25 30 35 40
Position
DPH
Base thru-thickness
Nugget thru-thickness
Across weld
Fig. 3. Diamond Pyramid hardness (DPH) as a function of position for FSW 2. A metallogram is inset which shows the hardness locations from left to right for the 6-mm thick plate.
Fig. 4. Etched cross-section of FSW #2.
50
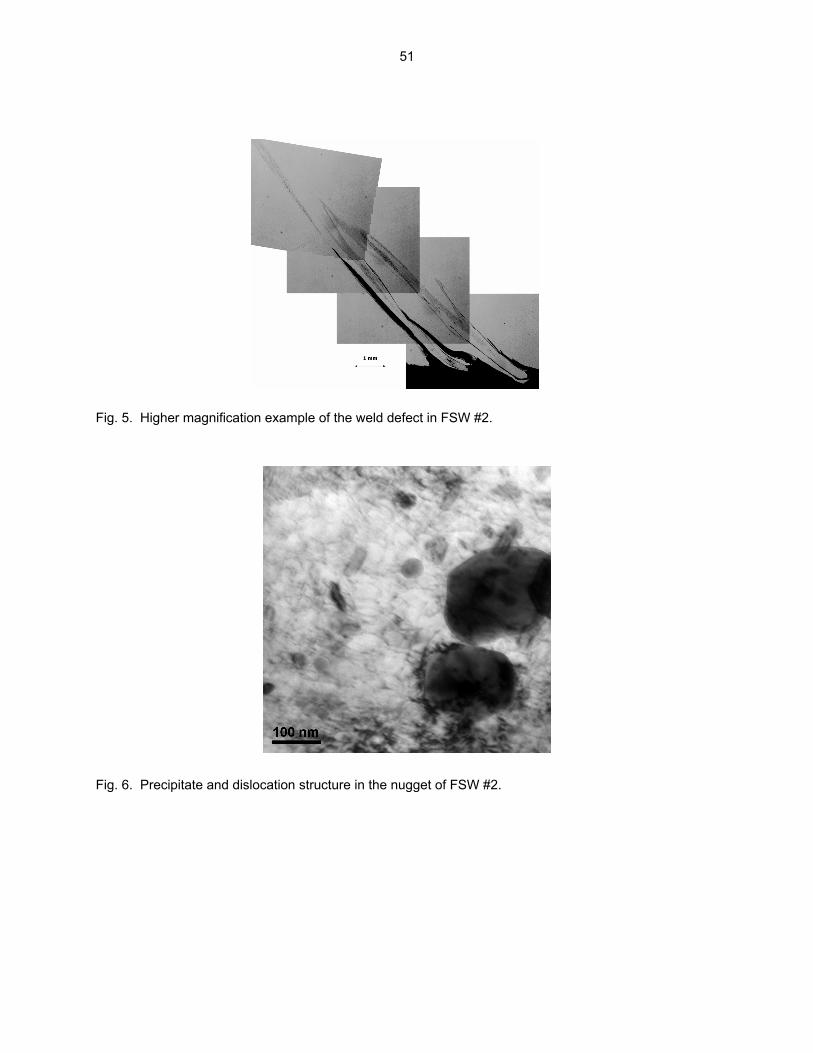
Fig. 5. Higher magnification example of the weld defect in FSW #2. Fig. 6. Precipitate and dislocation structure in the nugget of FSW #2.
51

52
Fig. 7. Precipitate particles in the nugget of FSW #2 showing a) the area of interest, composition maps for b) Fe Kα1, c) O Kα1, d) Y Kα1, and e) Ta Lα1, and f) an x-ray background map showing relative thickness.
Fig. 8. Precipitate particles in as-received ODS-Eurofer showing a) the area of interest, compositionmaps for b) Fe Kα1, c) O Kα1, d) Y Kα1, and e) Ta Lα1, and f) an x-ray background map showing relative thickness.
Discussion The as-received condition of ODS-Eurofer includes particles as small as 5 nm, and most are Y2O3, but several are TaO2, whereas in the nugget of FSW #2 particles are much coarser, generally larger than 50 nm and often containing Y2O3, with embedded discrete TaO2 particles. Significant coarsening of the dispersoid appears to have occurred during FSW, with coalescence of Y2O3 and TaO2 phases. The particle distributions cannot account for the hardening observed in the nugget. As the nugget region generally undergoes dynamic recrystallization, the high dislocation density observed likely demonstrates that a martensite transformation occurred on cooling, which probably provides explanation for observed hardening in the nugget. The cause of the particle coarsening is worthy of speculation. Peak temperatures recorded at the tool bit during FSW were fairly low, 758 and 916°C for welds 1 and 2, respectively, and the weld times were short, 4 and 6 minutes. BN has good heat transfer properties, so it is anticipated that the temperature was not much hotter under the tool bit. Therefore, it is hard to envision that bulk diffusion would promote much coarsening, given the operating temperature and time at temperature. For comparison, Alinger and Odette predict that effective coarsening of the dispersoid will occur at 1000°C only after 104 h [4]. It has been shown that in MA957, dynamic recrystallization is required to cause dissolution of the dispersoid, to be replaced by a ruby compound [2]. It therefore seems likely that the dynamic recrystallization that occurs during FSW may be responsible for the large coarsening observed. Not only does grain boundary diffusion play a role, but the exothermic response due to the annihilation of the energy stored in the dislocation structure and the opportunity for pipe diffusion should enhance diffusion processes. Nonetheless, transfer of that much matter by coarsening is unexpected, and particle accumulation at moving boundaries, transference over large distances and coalescence may be primarily responsible for the coarsening that was observed. We may be able to shed further light on the kinetics of this process by examining coarsening behavior in the nugget of FSW #1, which reached a temperature ~ 150°C lower. Conclusions The ODS-Eurofer alloy can be successfully plasticized by FSW. Future Work The effort will be continued as opportunities become available. References [1] S. M. Howard, B. K. Jasthi, W. J. Arbegast, G. J. Grant, S. Koduri, D. R. Herling, and D. S. Gelles, DOE/ER-0313/37 (2004) 55. [2] M. L. Hamilton, D. S. Gelles, R. J. Lobsinger, M. M. Paxton, and W. F. Brown, Fabrication Technology for ODS Alloy MA957, PNL-13165 (2000) 10. [3] R. Lindau, A. Möslang, A. Alamo, C. Cayron, G. Filacchioni, R. Schäublin, and E. Diegele, presented at the International Symposium on Application of Nano-particle Dispersion Strengthened Steels to Advanced Nuclear Power Plant, December 6–7, 2003, Kyoto, Japan. [4] M. J. Alinger and G. R. Odette, DOE/ER-0313/37 (2004) 61.
53

MECHANICAL PROPERTIES OF NEUTRON-IRRADIATED NICKEL-CONTAINING MARTENSITIC STEELS FOR HELIUM-EFFECTS STUDIES: I. EXPERIMENTAL STUDY―R. L. Klueh, N. Hashimoto, and M. A. Sokolov (Oak Ridge National Laboratory), K. Shiba and S. Jitsakawa (Japan Atomic Energy Research Institute, Tokai, Japan) OBJECTIVE
The objective of this work is to develop an understanding of the effect of transmutation helium on the irradiated mechanical properties of ferritic/martensitic steels for fusion applications and to use that knowledge to develop steels with improved properties. SUMMARY
Tensile and Charpy specimens of 9Cr-1MoVNb and 12Cr-1MoVW steels and these steels doped with 2% Ni were irradiated at 300 and 400ºC in the High Flux Isotope Reactor (HFIR) up to ≈ 12 dpa and at 393ºC in the Fast Flux Test Facility (FFTF) to ≈ 15 dpa. In HFIR, a mixed-spectrum reactor, (n, α) reactions of thermal neutrons with 58Ni produce helium in the steels. Little helium is produced during irradiation in FFTF. After HFIR irradiation, the yield stress of all steels increased, with the largest increases occurring for nickel-doped steels. The ductile-brittle transition temperature ()DBTT) increased up to two times and 1.7 times more in steels with 2% Ni than in those without the nickel addition after HFIR irradiation at 300 and 400ºC, respectively. Much smaller differences occurred after irradiation in FFTF. The )DBTTs for steels with 2% Ni after HFIR irradiation were 2–4 times greater than after FFTF irradiation. Results indicated there was hardening due to helium in addition to hardening by displacement damage and irradiation-induced precipitation. PROGRESS AND STATUS Introduction Irradiation of a ferritic/martensitic steel first wall of a tokamak fusion reactor by 14 MeV neutrons from the deuterium/tritium fusion reaction will cause displacement damage and the production of large amounts of transmutation helium (≈ 10 appm He/dpa) in the steel. Because no fusion reactor or 14-MeV neutron source exists, such neutron effects cannot be studied directly. Fission reactors with neutron energies greater than ≈ 0.1 MeV can be used to study displacement damage. However, helium formed in a fusion reactor first wall is produced by high-energy neutrons (/ 5 MeV), and in the absence of a 14 MeV neutron source, special techniques are required to simulate the simultaneous production of helium and displacement damage. Simultaneous displacement damage and helium formation can be produced in alloys containing nickel by irradiating in a mixed-spectrum fission reactor, where displacement damage is produced by fast neutrons in the spectrum, and helium forms by a two-step reaction of 58Ni with thermal neutrons in the spectrum. Natural nickel contains 68% 58Ni. For a steel with about 2% Ni, irradiation in the High Flux Isotope Reactor (HFIR) at the Oak Ridge National Laboratory (ORNL) produces approximately the same helium to displacement damage ratio (10 appm/dpa) attained in the undoped steel in a tokamak first wall. Previous papers reported on the tensile [1–3] and Charpy [4–7] behavior of commercial 9Cr-1MoVNb (modified 9Cr-1Mo) and 12Cr-1MoVW (Sandvik HT9) steels and these steels with 1 and 2% Ni after irradiation in HFIR and in the Experimental Breeder Reactor (EBR-II), a fast reactor where little helium forms. In this paper, results are presented from studies of these steels irradiated in the Fast Flux Test Facility (FFTF), another fast reactor where little helium forms, and in the HFIR, where considerably more helium forms in nickel-containing steels.
54
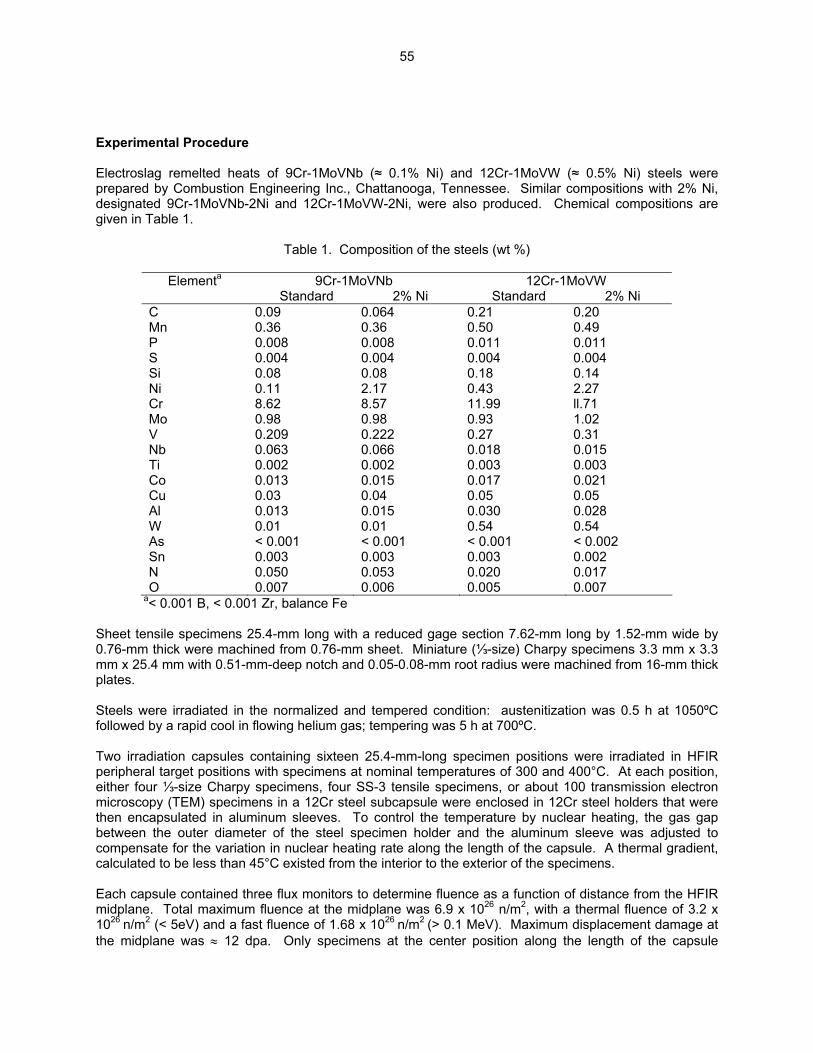
Experimental Procedure Electroslag remelted heats of 9Cr-1MoVNb (≈ 0.1% Ni) and 12Cr-1MoVW (≈ 0.5% Ni) steels were prepared by Combustion Engineering Inc., Chattanooga, Tennessee. Similar compositions with 2% Ni, designated 9Cr-1MoVNb-2Ni and 12Cr-1MoVW-2Ni, were also produced. Chemical compositions are given in Table 1.
Table 1. Composition of the steels (wt %)
Elementa 9Cr-1MoVNb Standard 2% Ni
12Cr-1MoVW Standard 2% Ni
C 0.09 0.064 0.21 0.20 Mn 0.36 0.36 0.50 0.49 P 0.008 0.008 0.011 0.011 S 0.004 0.004 0.004 0.004 Si 0.08 0.08 0.18 0.14 Ni 0.11 2.17 0.43 2.27 Cr 8.62 8.57 11.99 ll.71 Mo 0.98 0.98 0.93 1.02 V 0.209 0.222 0.27 0.31 Nb 0.063 0.066 0.018 0.015 Ti 0.002 0.002 0.003 0.003 Co 0.013 0.015 0.017 0.021 Cu 0.03 0.04 0.05 0.05 Al 0.013 0.015 0.030 0.028 W 0.01 0.01 0.54 0.54 As < 0.001 < 0.001 < 0.001 < 0.002 Sn 0.003 0.003 0.003 0.002 N 0.050 0.053 0.020 0.017 O 0.007 0.006 0.005 0.007
a< 0.001 B, < 0.001 Zr, balance Fe Sheet tensile specimens 25.4-mm long with a reduced gage section 7.62-mm long by 1.52-mm wide by 0.76-mm thick were machined from 0.76-mm sheet. Miniature (⅓-size) Charpy specimens 3.3 mm x 3.3 mm x 25.4 mm with 0.51-mm-deep notch and 0.05-0.08-mm root radius were machined from 16-mm thick plates. Steels were irradiated in the normalized and tempered condition: austenitization was 0.5 h at 1050ºC followed by a rapid cool in flowing helium gas; tempering was 5 h at 700ºC. Two irradiation capsules containing sixteen 25.4-mm-long specimen positions were irradiated in HFIR peripheral target positions with specimens at nominal temperatures of 300 and 400°C. At each position, either four ⅓-size Charpy specimens, four SS-3 tensile specimens, or about 100 transmission electron microscopy (TEM) specimens in a 12Cr steel subcapsule were enclosed in 12Cr steel holders that were then encapsulated in aluminum sleeves. To control the temperature by nuclear heating, the gas gap between the outer diameter of the steel specimen holder and the aluminum sleeve was adjusted to compensate for the variation in nuclear heating rate along the length of the capsule. A thermal gradient, calculated to be less than 45°C existed from the interior to the exterior of the specimens. Each capsule contained three flux monitors to determine fluence as a function of distance from the HFIR midplane. Total maximum fluence at the midplane was 6.9 x 1026 n/m2, with a thermal fluence of 3.2 x 1026 n/m2 (< 5eV) and a fast fluence of 1.68 x 1026 n/m2 (> 0.1 MeV). Maximum displacement damage at the midplane was ≈ 12 dpa. Only specimens at the center position along the length of the capsule
55
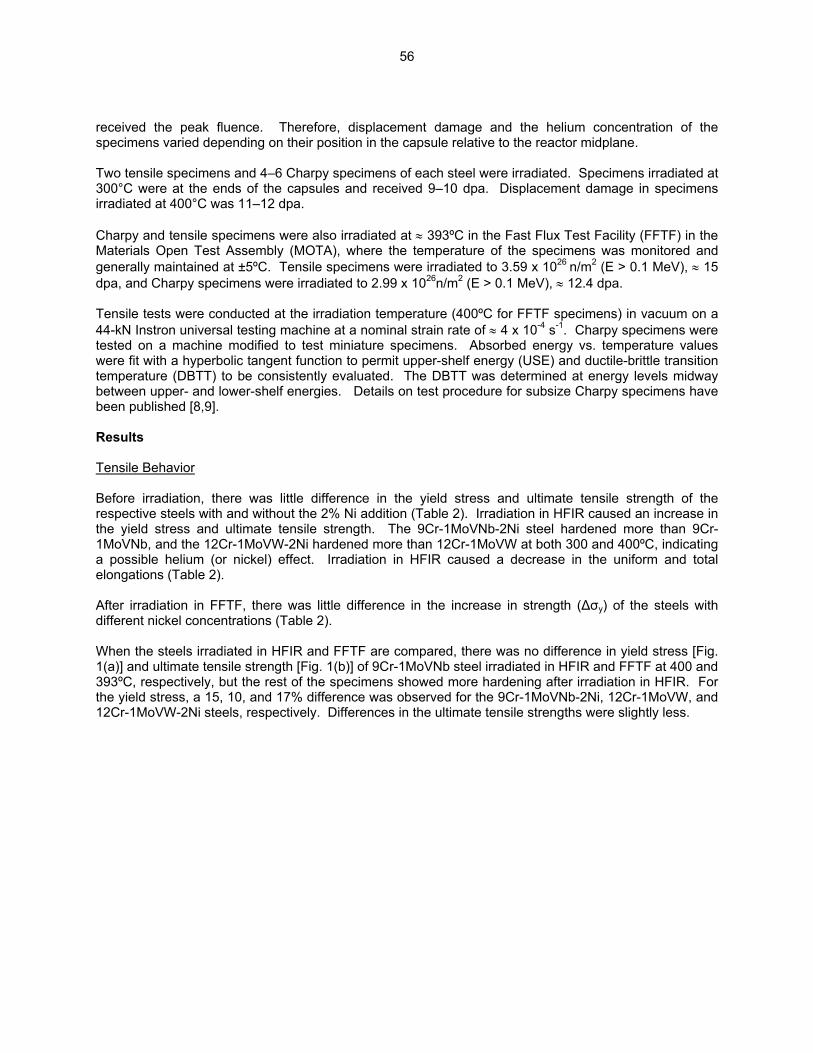
received the peak fluence. Therefore, displacement damage and the helium concentration of the specimens varied depending on their position in the capsule relative to the reactor midplane. Two tensile specimens and 4–6 Charpy specimens of each steel were irradiated. Specimens irradiated at 300°C were at the ends of the capsules and received 9–10 dpa. Displacement damage in specimens irradiated at 400°C was 11–12 dpa. Charpy and tensile specimens were also irradiated at ≈ 393ºC in the Fast Flux Test Facility (FFTF) in the Materials Open Test Assembly (MOTA), where the temperature of the specimens was monitored and generally maintained at ±5ºC. Tensile specimens were irradiated to 3.59 x 1026 n/m2 (E > 0.1 MeV), ≈ 15 dpa, and Charpy specimens were irradiated to 2.99 x 1026n/m2 (E > 0.1 MeV), ≈ 12.4 dpa. Tensile tests were conducted at the irradiation temperature (400ºC for FFTF specimens) in vacuum on a 44-kN Instron universal testing machine at a nominal strain rate of ≈ 4 x 10⁻⁴ s-1. Charpy specimens were tested on a machine modified to test miniature specimens. Absorbed energy vs. temperature values were fit with a hyperbolic tangent function to permit upper-shelf energy (USE) and ductile-brittle transition temperature (DBTT) to be consistently evaluated. The DBTT was determined at energy levels midway between upper- and lower-shelf energies. Details on test procedure for subsize Charpy specimens have been published [8,9]. Results Tensile Behavior Before irradiation, there was little difference in the yield stress and ultimate tensile strength of the respective steels with and without the 2% Ni addition (Table 2). Irradiation in HFIR caused an increase in the yield stress and ultimate tensile strength. The 9Cr-1MoVNb-2Ni steel hardened more than 9Cr-1MoVNb, and the 12Cr-1MoVW-2Ni hardened more than 12Cr-1MoVW at both 300 and 400ºC, indicating a possible helium (or nickel) effect. Irradiation in HFIR caused a decrease in the uniform and total elongations (Table 2). After irradiation in FFTF, there was little difference in the increase in strength (∆σy) of the steels with different nickel concentrations (Table 2). When the steels irradiated in HFIR and FFTF are compared, there was no difference in yield stress [Fig. 1(a)] and ultimate tensile strength [Fig. 1(b)] of 9Cr-1MoVNb steel irradiated in HFIR and FFTF at 400 and 393ºC, respectively, but the rest of the specimens showed more hardening after irradiation in HFIR. For the yield stress, a 15, 10, and 17% difference was observed for the 9Cr-1MoVNb-2Ni, 12Cr-1MoVW, and 12Cr-1MoVW-2Ni steels, respectively. Differences in the ultimate tensile strengths were slightly less.
56
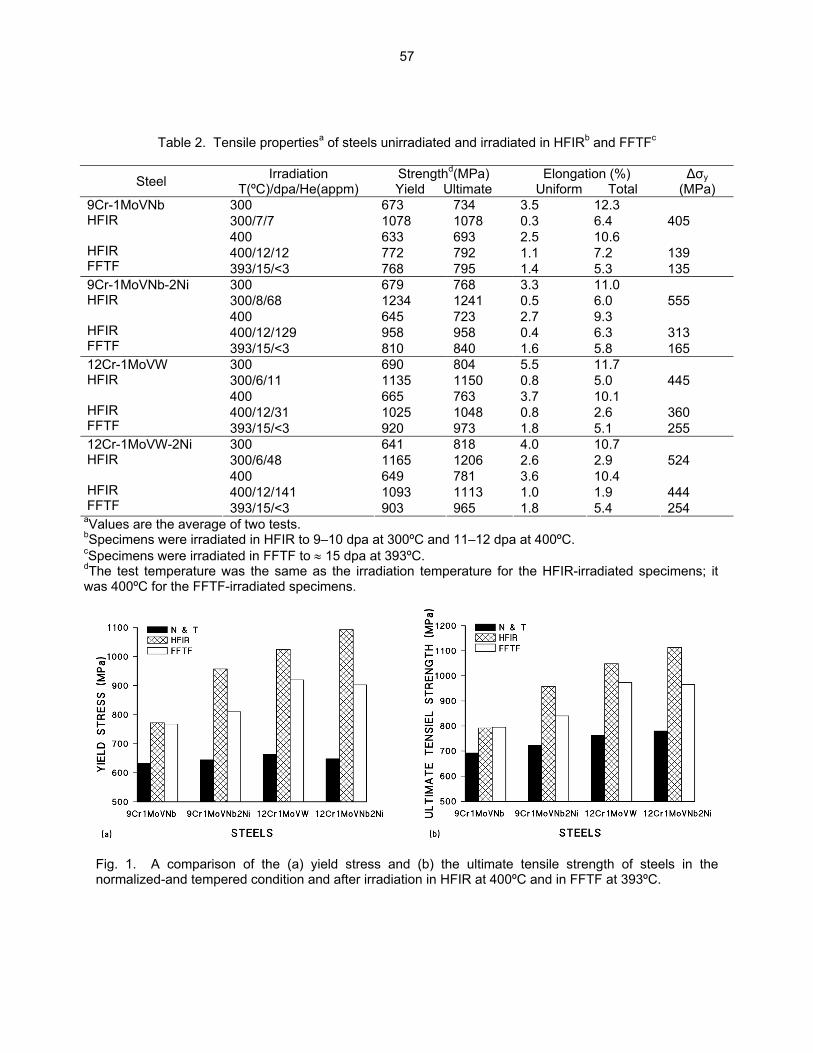
Table 2. Tensile propertiesa of steels unirradiated and irradiated in HFIRb and FFTFc
Steel Irradiation T(ºC)/dpa/He(appm)
Strengthd(MPa) Yield Ultimate
Elongation (%) Uniform Total
∆σy (MPa)
300 673 734 3.5 12.3 300/7/7 1078 1078 0.3 6.4 405 400 633 693 2.5 10.6 400/12/12 772 792 1.1 7.2 139
9Cr-1MoVNb HFIR HFIR FFTF 393/15/<3 768 795 1.4 5.3 135
300 679 768 3.3 11.0 300/8/68 1234 1241 0.5 6.0 555 400 645 723 2.7 9.3 400/12/129 958 958 0.4 6.3 313
9Cr-1MoVNb-2Ni HFIR HFIR FFTF 393/15/<3 810 840 1.6 5.8 165
300 690 804 5.5 11.7 300/6/11 1135 1150 0.8 5.0 445 400 665 763 3.7 10.1 400/12/31 1025 1048 0.8 2.6 360
12Cr-1MoVW HFIR HFIR FFTF 393/15/<3 920 973 1.8 5.1 255
300 641 818 4.0 10.7 300/6/48 1165 1206 2.6 2.9 524 400 649 781 3.6 10.4 400/12/141 1093 1113 1.0 1.9 444
12Cr-1MoVW-2Ni HFIR HFIR FFTF 393/15/<3 903 965 1.8 5.4 254
aValues are the average of two tests. bSpecimens were irradiated in HFIR to 9–10 dpa at 300ºC and 11–12 dpa at 400ºC. cSpecimens were irradiated in FFTF to ≈ 15 dpa at 393ºC. dThe test temperature was the same as the irradiation temperature for the HFIR-irradiated specimens; it was 400ºC for the FFTF-irradiated specimens.
Fig. 1. A comparison of the (a) yield stress and (b) the ultimate tensile strength of steels in the normalized-and tempered condition and after irradiation in HFIR at 400ºC and in FFTF at 393ºC.
57

Charpy Behavior Irradiation caused an increase in the DBTT ()DBTT) and a reduction in the USE for all specimens irradiated at 300 and 400ºC in HFIR and at 393ºC in FFTF (Table 3). The HFIR results indicated a larger )DBTT for steels irradiated at 300ºC than at 400ºC (Fig. 2). Irradiations at 300ºC produced a larger shift in DBTT for the steels with the 2% Ni, with the largest effect occurring for the 9Cr-1MoVNb-2Ni steel, where the shift was over twice that for the steel with no nickel addition. A smaller difference (≈ 1.4 times) occurred for the 12 Cr steels, where the difference in helium concentration of the two steels was less. As similar effect was observed for the steels after irradiation in HFIR at 400ºC, the ∆DBTT for 9Cr-1MoVNb-2Ni was ≈ 1.7 times that for 9Cr-1MoVNb, and that for 12Cr-1MoVW-2Ni was ≈ 1.6 times that for 12Cr-1MoVW. The )DBTTs for the 9Cr-1MoVNb steel were similar after irradiation at 400ºC in HFIR and 393ºC in FFTF (Fig. 2). For the 9Cr-1MoVNb-2Ni steel, however, the )DBTT after HFIR irradiation at 400ºC was four times as great as after irradiation in FFTF at 393ºC. The )DBTTs for the 12Cr-1MoVW and 12Cr-1MoVW-2Ni after irradiation in HFIR at 400ºC were both about twice as large as after irradiation in FFTF at 393ºC. The reduction in USE was generally greater for the steels irradiated in HFIR than FFTF; the largest change occurred for the steels with 2% Ni (Fig. 3). The difference between steels irradiated at 300 and 400ºC in HFIR was generally quite small. Transmission electron microscopy (TEM) and scanning electron microscopy (SEM) Specimens of 9Cr-1MoVNb and 9Cr-1MoVNb-2Ni steels irradiated in HFIR at 400ºC were examined by TEM. Results will only be discussed briefly, since details were presented previously [10]. Both the 9Cr-1MoVNb and 9Cr-1MoVNb-2Ni steels irradiated in HFIR at 400ºC developed a0 < 10 > and (a0/2) < 111 > dislocation loops with the number density slightly larger and the loops slightly smaller for 9Cr-1MoVNb-2Ni (Fig. 4). Cavities also developed, with 9Cr-1MoVNb-2Ni steel having a higher number density (9 x10²¹ vs. 3x10²¹m-3) and smaller size (5 vs. 9 nm) (Fig. 5). Swelling in the steel with nickel was ≈ 0.004%, compared to ≈ 0.002% for the steel without nickel, an indication that helium (nickel) may have affected swelling [10]. Precipitate microstructure before irradiation consisted primarily of M23C6 with similar quantities (< 1 x 10²⁰ m-3) and sizes (≈ 100 nm) in both the 9Cr-1MoVNb and 9Cr-1MoVNb-2Ni steels. There were also a few MX particles. Irradiation caused little change in the M23C6 structure for either steel, and no new precipitates formed in the 9Cr-1MoVNb [Fig 6 (a)]. However, irradiation-induced precipitate identified as M2X at a number density of 5x10²⁰ m-3 and a mean size of 54 nm was observed in the 9Cr-1MoVNb-2Ni steel [Fig. 6(b)] [10].
58
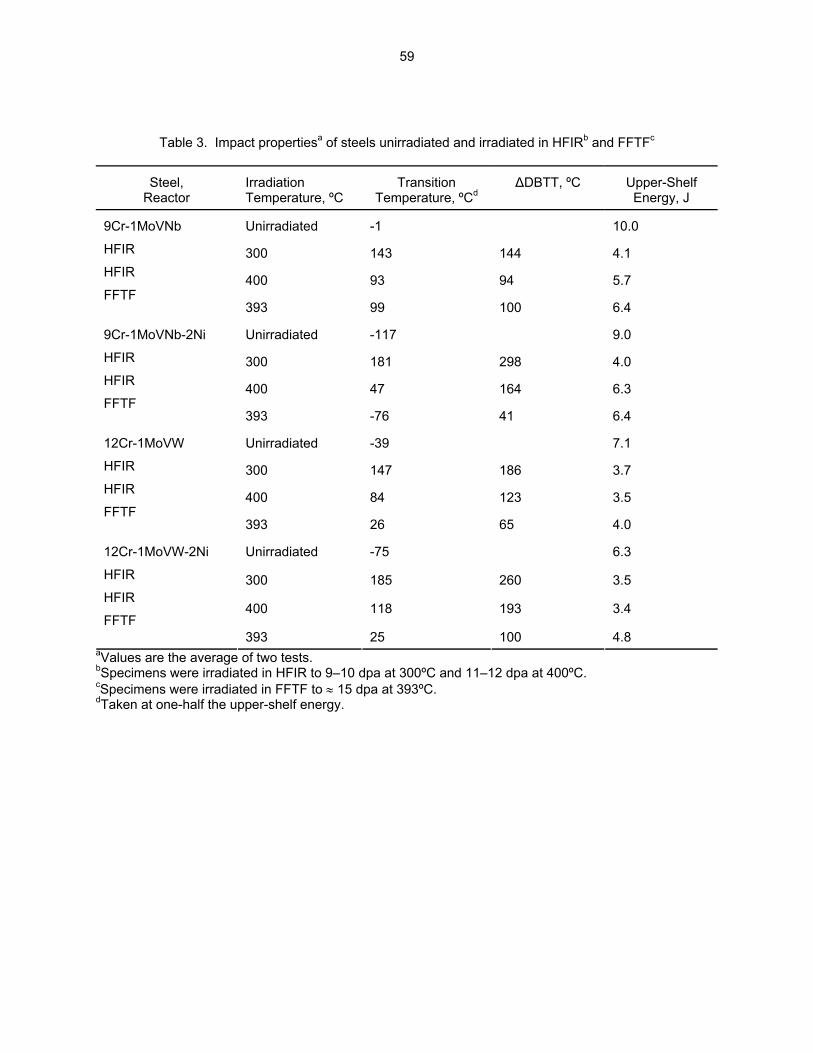
Table 3. Impact propertiesa of steels unirradiated and irradiated in HFIRb and FFTFc
Steel, Reactor
Irradiation Temperature, ºC
Transition
Temperature, ºCd
∆DBTT, ºC
Upper-Shelf Energy, J
Unirradiated
-1
10.0
300
143
144
4.1
400
93
94
5.7
9Cr-1MoVNb
HFIR
HFIR
FFTF 393
99
100
6.4
Unirradiated
-117
9.0
300
181
298
4.0
400
47
164
6.3
9Cr-1MoVNb-2Ni
HFIR
HFIR
FFTF 393
-76
41
6.4
Unirradiated
-39
7.1
300
147
186
3.7
400
84
123
3.5
12Cr-1MoVW
HFIR
HFIR
FFTF 393
26
65
4.0
Unirradiated
-75
6.3
300
185
260
3.5
400
118
193
3.4
12Cr-1MoVW-2Ni
HFIR
HFIR
FFTF 393
25
100
4.8
aValues are the average of two tests. bSpecimens were irradiated in HFIR to 9–10 dpa at 300ºC and 11–12 dpa at 400ºC. cSpecimens were irradiated in FFTF to ≈ 15 dpa at 393ºC. dTaken at one-half the upper-shelf energy.
59
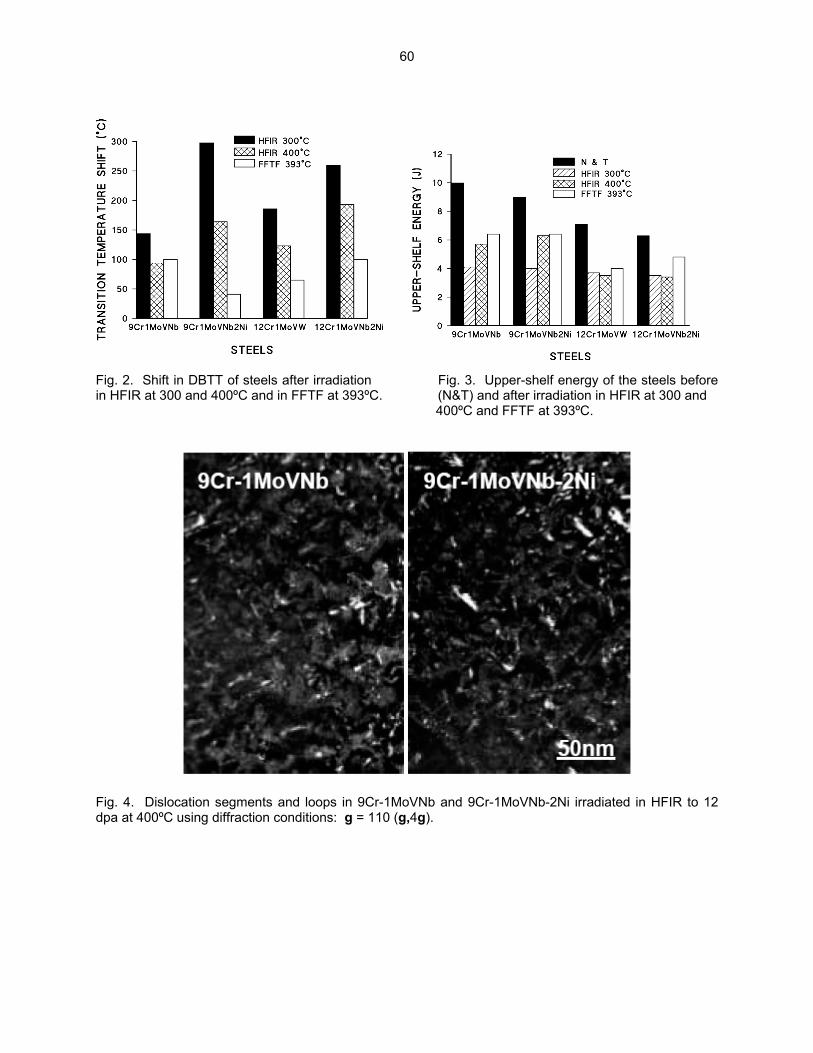
Fig. 2. Shift in DBTT of steels after irradiation Fig. 3. Upper-shelf energy of the steels before in HFIR at 300 and 400ºC and in FFTF at 393ºC. (N&T) and after irradiation in HFIR at 300 and 400ºC and FFTF at 393ºC.
Fig. 4. Dislocation segments and loops in 9Cr-1MoVNb and 9Cr-1MoVNb-2Ni irradiated in HFIR to 12 dpa at 400ºC using diffraction conditions: g = 110 (g,4g).
60
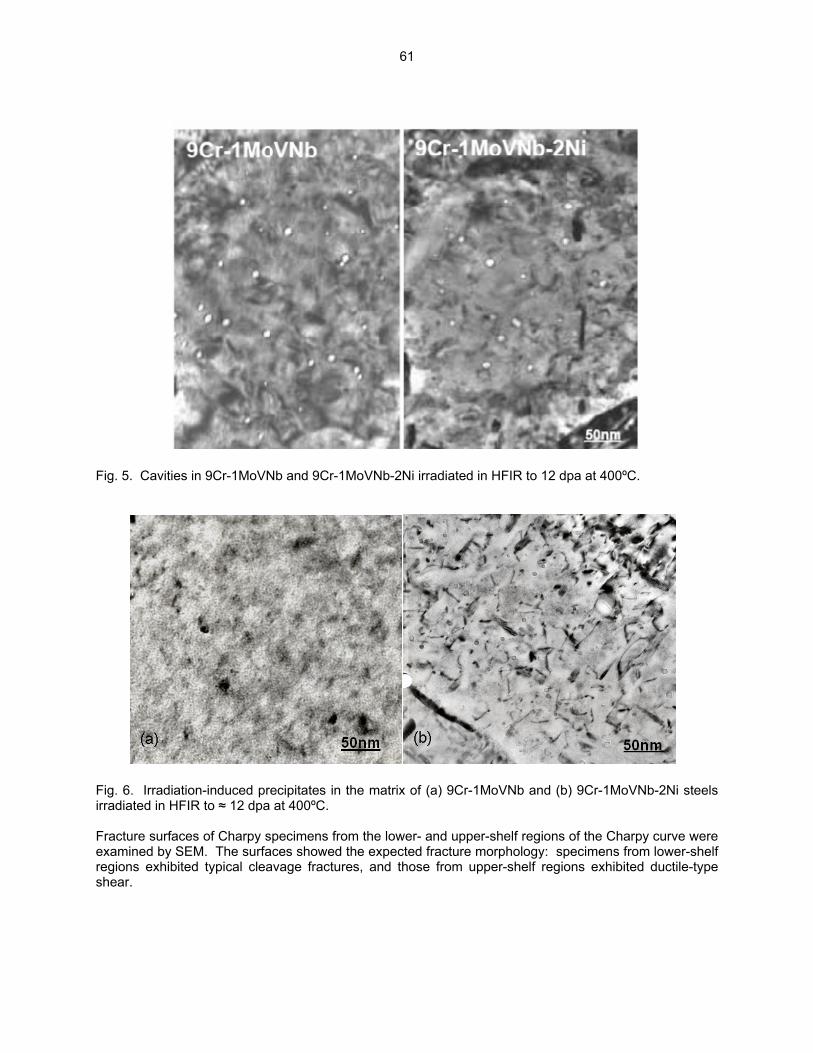
Fig. 5. Cavities in 9Cr-1MoVNb and 9Cr-1MoVNb-2Ni irradiated in HFIR to 12 dpa at 400ºC.
Fig. 6. Irradiation-induced precipitates in the matrix of (a) 9Cr-1MoVNb and (b) 9Cr-1MoVNb-2Ni steels irradiated in HFIR to ≈ 12 dpa at 400ºC. Fracture surfaces of Charpy specimens from the lower- and upper-shelf regions of the Charpy curve were examined by SEM. The surfaces showed the expected fracture morphology: specimens from lower-shelf regions exhibited typical cleavage fractures, and those from upper-shelf regions exhibited ductile-type shear.
61
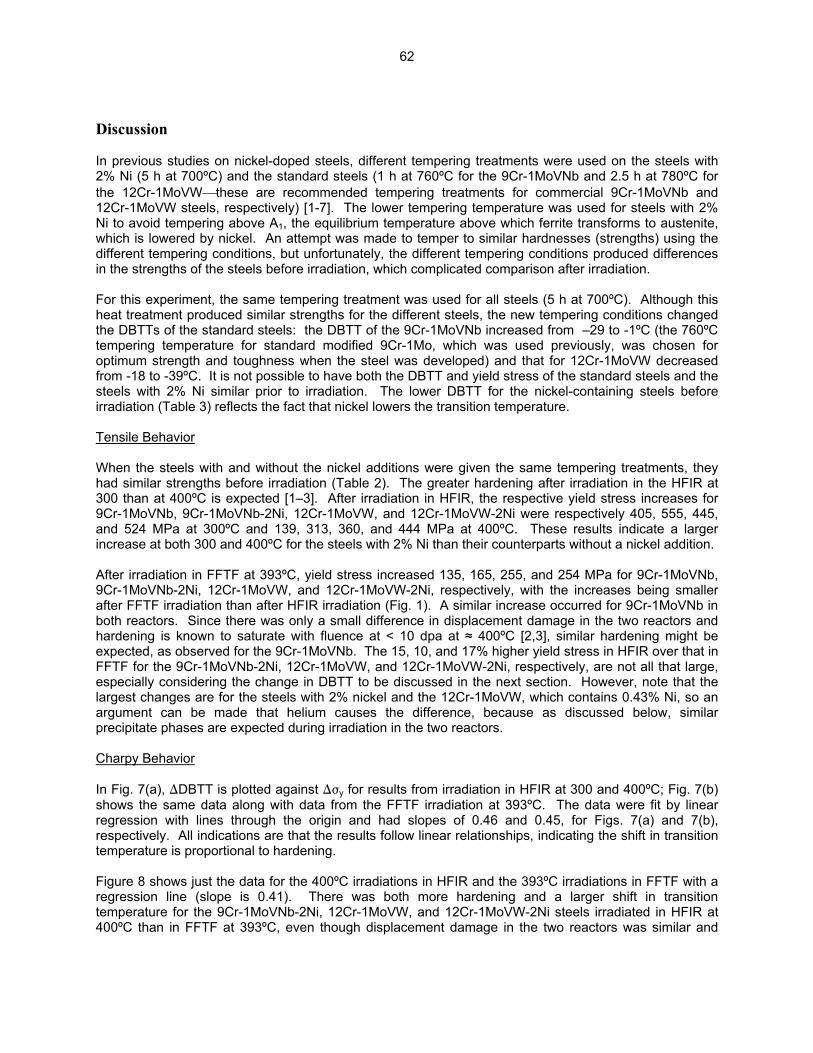
Discussion In previous studies on nickel-doped steels, different tempering treatments were used on the steels with 2% Ni (5 h at 700ºC) and the standard steels (1 h at 760ºC for the 9Cr-1MoVNb and 2.5 h at 780ºC for the 12Cr-1MoVW⎯these are recommended tempering treatments for commercial 9Cr-1MoVNb and 12Cr-1MoVW steels, respectively) [1-7]. The lower tempering temperature was used for steels with 2% Ni to avoid tempering above A1, the equilibrium temperature above which ferrite transforms to austenite, which is lowered by nickel. An attempt was made to temper to similar hardnesses (strengths) using the different tempering conditions, but unfortunately, the different tempering conditions produced differences in the strengths of the steels before irradiation, which complicated comparison after irradiation. For this experiment, the same tempering treatment was used for all steels (5 h at 700ºC). Although this heat treatment produced similar strengths for the different steels, the new tempering conditions changed the DBTTs of the standard steels: the DBTT of the 9Cr-1MoVNb increased from –29 to -1ºC (the 760ºC tempering temperature for standard modified 9Cr-1Mo, which was used previously, was chosen for optimum strength and toughness when the steel was developed) and that for 12Cr-1MoVW decreased from -18 to -39ºC. It is not possible to have both the DBTT and yield stress of the standard steels and the steels with 2% Ni similar prior to irradiation. The lower DBTT for the nickel-containing steels before irradiation (Table 3) reflects the fact that nickel lowers the transition temperature. Tensile Behavior When the steels with and without the nickel additions were given the same tempering treatments, they had similar strengths before irradiation (Table 2). The greater hardening after irradiation in the HFIR at 300 than at 400ºC is expected [1–3]. After irradiation in HFIR, the respective yield stress increases for 9Cr-1MoVNb, 9Cr-1MoVNb-2Ni, 12Cr-1MoVW, and 12Cr-1MoVW-2Ni were respectively 405, 555, 445, and 524 MPa at 300ºC and 139, 313, 360, and 444 MPa at 400ºC. These results indicate a larger increase at both 300 and 400ºC for the steels with 2% Ni than their counterparts without a nickel addition. After irradiation in FFTF at 393ºC, yield stress increased 135, 165, 255, and 254 MPa for 9Cr-1MoVNb, 9Cr-1MoVNb-2Ni, 12Cr-1MoVW, and 12Cr-1MoVW-2Ni, respectively, with the increases being smaller after FFTF irradiation than after HFIR irradiation (Fig. 1). A similar increase occurred for 9Cr-1MoVNb in both reactors. Since there was only a small difference in displacement damage in the two reactors and hardening is known to saturate with fluence at < 10 dpa at ≈ 400ºC [2,3], similar hardening might be expected, as observed for the 9Cr-1MoVNb. The 15, 10, and 17% higher yield stress in HFIR over that in FFTF for the 9Cr-1MoVNb-2Ni, 12Cr-1MoVW, and 12Cr-1MoVW-2Ni, respectively, are not all that large, especially considering the change in DBTT to be discussed in the next section. However, note that the largest changes are for the steels with 2% nickel and the 12Cr-1MoVW, which contains 0.43% Ni, so an argument can be made that helium causes the difference, because as discussed below, similar precipitate phases are expected during irradiation in the two reactors. Charpy Behavior In Fig. 7(a), )DBTT is plotted against )Fy for results from irradiation in HFIR at 300 and 400ºC; Fig. 7(b) shows the same data along with data from the FFTF irradiation at 393ºC. The data were fit by linear regression with lines through the origin and had slopes of 0.46 and 0.45, for Figs. 7(a) and 7(b), respectively. All indications are that the results follow linear relationships, indicating the shift in transition temperature is proportional to hardening. Figure 8 shows just the data for the 400ºC irradiations in HFIR and the 393ºC irradiations in FFTF with a regression line (slope is 0.41). There was both more hardening and a larger shift in transition temperature for the 9Cr-1MoVNb-2Ni, 12Cr-1MoVW, and 12Cr-1MoVW-2Ni steels irradiated in HFIR at 400ºC than in FFTF at 393ºC, even though displacement damage in the two reactors was similar and
62

saturation with fluence would be expected for these doses [11]. There was no difference for the two reactors for 9Cr-1MoVNb, which contained the least helium after HFIR irradiation.
Fig. 7. Shift in ductile-brittle transition temperature plotted against shift in yield stress for 9Cr-1MoVNb, 9Cr-1MoVNb-2Ni, 12Cr-1MoVW, and 12Cr-1MoVW steels irradiated in (a) HFIR at 300 and 400ºC and (b) HFIR at 300 and 400ºC and FFTF at 393ºC.
Fig. 8. Shift in ductile-brittle transition temperature plotted against shift in yield stress for 9Cr-1MoVNb, 9Cr-1MoVNb-2Ni, 12Cr-1MoVW, and 12Cr-1MoVW for irradiation in HFIR at 400ºC and FFTF at 393ºC. There has been concern about using nickel-doped steels to determine helium effects, because of the effect nickel might have on the microstructure and mechanical properties [12–16]. Excess hardening in terms of increased yield stress was observed on JLF-1 (9Cr-2WVTa) steel containing 1% Ni relative to the undoped steel after irradiations to ≈ 0.15 dpa at 170 ºC in the Japan Materials Test Reactor (JMTR) [14,15]. No excess hardening was observed for similar irradiation at 220ºC. Irradiation of these steels in the Advanced Test Reactor (ATR) to 2.2 and 3.8 dpa at 270 and 348ºC, respectively, produced excess hardening (up to 350 MPa) for the 270ºC irradiation. Similar strengths were observed for the steels irradiated at 348ºC [16]. The excess hardening was accompanied by a larger increase in DBTT for the nickel-containing steel. Microstructural observations by TEM revealed that irradiation-induced dislocation loops were finer and denser in the 1% Ni steel than in the undoped steel, which suggested that the nickel addition affected nucleation and growth of dislocation loops to produce excess hardening and
63

embrittlement [16]. No such hardening attributable to nickel has been observed previously for neutron irradiations of the nickel-doped 9Cr-1MoVNb and 12Cr-1MoVW steels at 300 and 400ºC [1–3], temperatures above those where the excess hardening was observed [13–16]. In dual ion-beam irradiations (6.4 MeV Fe3+ and degraded 1 MeV He+) to 5 dpa of F82H without nickel and with 1% and 2% Ni, hardness measurements by an ultra-micro-indentation technique indicated some excess hardening in the 2% Ni irradiated at 350ºC [17]. However, it is unclear how this might compare with neutron irradiation, since the ion irradiations are at a dose rate several orders of magnitude higher than for fast-reactor irradiations. Results from neutron irradiations indicated a two-step hardening-recovery process for the irradiated steels, with the second step occurring at / 300ºC [14]. Presumably recovery would proceed during irradiation simultaneously with hardening, thus explaining the effect of temperature on the excess hardening. Such recovery would not occur during ion irradiations to 5dpa, which are completed within several hours, compared with several months for irradiation to 10 dpa and higher. Nevertheless, the possibility of excess hardening for the 300ºC tests must be kept in mind when evaluating these results, since there are no FFTF experiments at this temperature to determine the effect of the nickel. As pointed out in earlier irradiation experiments with the nickel-doped steels, irradiation-induced nickel-containing M6C formed in the 9Cr-1MoVNb-2Ni and 12Cr-1MoVW-2Ni steels during HFIR irradiation to ≈ 40 dpa at 400ºC [17,18]. However, the same M6C precipitates formed in irradiations of the steels to ≈ 47 dpa at 407ºC in the fast reactor FFTF [17,18]. If these precipitates caused hardening in the HFIR-irradiated steel, they should have caused a similar effect in FFTF for similar doses. Therefore, it was concluded that the larger )DBTT after irradiation in HFIR was due to helium, since helium formation in the nickel-containing steels irradiated in HFIR was the only obvious difference compared to irradiation in FFTF [6]. Note that the 9Cr-1MoVNb-2Ni irradiated to ≈ 12 dpa in HFIR at 400ºC in the present work did not contain the high density of M6C found for the previous 40-plus dpa irradiations, but rather, it contained a relatively small number of M2X (Fig. 6). This will be discussed below. Although there is no difference between the )DBTT for the 9Cr-1MoVNb in FFTF at 393ºC and HFIR at 400ºC in the present irradiations, there are differences for the 9Cr-1MoVNb-2Ni, 12Cr-1MoVW, and 12Cr-1MoVW-2Ni steels (Fig. 8). For the latter three steels, the )DBTT values after irradiation in HFIR are 2–4 times greater than in FFTF, which is consistent with a helium effect. This follows since the 9Cr-1MoVNb steel contained only about 12 appm He after irradiation in HFIR, compared to ≈ 31, 129, and 141 for the 12Cr-1MoVW, 9Cr-1MoVNb-2Ni, and 12Cr-1MoVW-2Ni steels, respectively. Thus, a larger effect would be expected for the latter steels if it is a helium effect. Since there was a similar difference in the hardening of the steels depending on the helium concentration, it is concluded that there is excess hardening over and above that due to displacement damage and precipitation that is due to helium, and that hardening causes a further increase in ∆DBTT after irradiation in HFIR. After irradiation at 300ºC, where there is no comparison with irradiation in a fast reactor, the )DBTT for the 9Cr-1MoVNb is again the smallest (144ºC), followed by 12Cr-1MoVW (186ºC), 12Cr-1MoVW-2Ni (260ºC), and 9Cr-1MoVNb-2Ni (298ºC). This is also in line with )Fy [Fig. 5(a)] and the amount of helium present in the respective steels (the 9Cr-1MoVNb, 12Cr-1MoVW, 12Cr-1MoVW-2Ni, and 9Cr-1MoVNb-2Ni steels contain ≈ 8, 20, 48, and 47 appm He, respectively). Microstructure The observation that swelling was higher in 9Cr-1MoVNb-2Ni than in 9Cr-1MoVNb (Fig. 5) [10] agreed with previous work that indicated helium affected swelling [17–19]. However, the microstructural observations on 9Cr-1MoVNb-2Ni differed from earlier studies, where a high number density of nickel-rich M6C particles formed during irradiation in FFTF to ≈ 47 dpa and HFIR to ≈ 40 dpa; a few M2X precipitates also formed [17,18]. In the steels irradiated in the present experiment, M2X particles were observed [Fig 6(b)], but no M6C was detected.
64

The presence of M2X is not surprising, because this precipitate is enriched in chromium and nitrogen (basically Cr2N) with some of the chromium replaced by other solutes and some nitrogen replaced by carbon. It can form more easily in 9Cr-1MoVNb steel because the specification for this steel includes 0.03-0.07% N, and the 9Cr-1MoVNb and 9Cr-1MoVNb-2Ni in this experiment contained 0.05% N (Table 1). Because of the relatively large size and small number density of M2X precipitates, it would not be expected to contribute much to hardening. A similar precipitation sequence should also occur for irradiation to a similar dose in FFTF. A possible explanation for the absence of M6C in the irradiated 9Cr-1MoVNb-2Ni, as observed in higher-dose irradiations [17,18], is that M2X is an intermediate phase, or the small amounts present can form more quickly, and more time―a higher irradiation dose―is required for M6C to form in sizes that can be observed and identified. Irradiations were to ≈ 40 dpa and higher where M6C was observed, compared to about 12 dpa for the steels irradiated in the present experiment. The M6C was previously analyzed as being rich in Cr, Ni, and Si, along with some iron and traces of Mo, P, and V [17,18]. A similar precipitate was detected in 12Cr-1MoVW steel irradiated in EBR-II, but in that case it was identified as G-phase, and for that steel the precipitate composition was determined as Ni-24.1Fe-12.7Si-8.7Mn-3.8Mo-1.9Cr [20]. In the irradiation capsule used for the present experiment, the reduced-activation steel 9Cr-2WVTa and that steel with 2% Ni (9Cr-2WVTa-2Ni) were also irradiated [21]. Before irradiation, the microstructures of these steels were respectively similar to those of 9Cr-1MoVNb and 9Cr-1MoVNb-2Ni―tempered martensite with M23C6 and MX precipitates [10]. Likewise, there was only a minor difference in the dislocation loop structure after irradiation. However, the 9Cr-2WVTa-2Ni contained a high number density (2 x 10²¹ m-3) of small (7 nm) irradiation-induced particles identified as M6C (Fig 9). The size was less and the number density higher than for M2X in 9Cr-1MoVNb-2Ni (54 nm and 5 x 10²⁰ m-3) [compare Figs. 9 and 6(b)] [10]. Based on the above hypothesis, the absence of M2X in the 9Cr-2WVTa is not unexpected, since this steel contains only about 0.01% N. The microstructure of 9Cr-2WVTa-2Ni was similar to structures found for 9Cr-1MoVNb-2Ni after higher-dose irradiations, supporting the hypothesis concerning the kinetics of M6C formation in 9Cr-1MoVNb-2Ni, although this implies different kinetics for the 9Cr-2WVTa-2Ni steel.
Fig. 9. Irradiation-induced M6C precipitates in the matrix of 9Cr-2WVTa-2Ni steel irradiated in HFIR to 12 dpa at 400ºC. Compare with Fig. 6 that shows 9Cr-1MoVNb-2Ni irradiated similarly but containing irradiation-induced M2X.
65

Helium Effects As with all irradiation experiments, the results of this experiment involve uncertainty introduced by the small number of tests (due to limited reactor space for inserting specimens). Within the limits of such uncertainties, the present results lead to some conclusions concerning the effect of helium on mechanical properties. If it is assumed that similar displacement damage and precipitation occurs in the steels irradiated in FFTF and HFIR at similar temperatures, then the results from the present irradiations indicate there was a component of hardening that must be attributed to helium. It therefore follows that this hardening produced an increment of increase in transition temperature in the Charpy tests over and above the hardening caused by displacement damage and irradiation-induced precipitation. Mechanisms for how helium may affect hardening will be discussed in a companion (part II) paper. Several published studies have presented evidence for a helium effect on the mechanical properties of irradiated steels using the nickel-doping technique as well as other experimental techniques. Also, the results of the present work showing a hardening effect due to helium differ from the previous high-dose experiments, where embrittlement occurred without an increase in hardness that could be attributed to helium [6,7]. In the paper that accompanies this contribution, the present results will be examined in light of previous experiments. Summary and Conclusions The 9Cr-1MoVNb and 12Cr-1MoVW steels and these steels with 2% Ni additions were irradiated in HFIR to ≈ 10 dpa at 300ºC and ≈ 12 dpa at 400ºC and in FFTF to ≈ 15 dpa at 393ºC. After irradiation in HFIR, steels with 2% Ni hardened more than steels without a nickel addition. When 9Cr-1MoVNb-2Ni, 12Cr-1MoVW, and 12Cr-1MoVW-2Ni steels were irradiated in HFIR at 400ºC, they hardened more than when irradiated in FFTF at 393ºC. The 9Cr-1MoVNb steel hardened to the same level in both FFTF and HFIR. For all but the 9Cr-1MoVNb steel, shifts in DBTT of the steels irradiated in HFIR were greater than shifts for the same steels irradiated in FFTF. Irradiation in HFIR at 300 and 400ºC caused a larger shift for the steels containing 2% Ni than for the steels with no nickel addition. The increase in DBTT appeared to be related to the increase in yield stress. Despite the uncertainty inherent in the experiments, the results lead to the conclusion that helium caused an increment of hardening that contributed to the extra shift in DBTT over that observed after irradiation in FFTF where little helium formed. References [1] R. L. Klueh, P. J. Maziasz, and J. M. Vitek, J. Nucl. Mater. 141–143 (1986) 960. [2] R. L. Klueh and J. M. Vitek, J. Nucl. Mater. 150 (1987) 272. [3] R. L. Klueh and P. J. Maziasz, J. Nucl. Mater. 187 (1992) 43. [4] J. M. Vitek, W. R. Corwin, R. L. Klueh, and J. R. Hawthorne, J. Nucl. Mater. 141–143 (1986) 948. [5] W. R. Corwin, J. M. Vitek, and R. L. Klueh, J. Nucl. Mater. 149 (1987) 312. [6] R. L. Klueh and D. J. Alexander, J. Nucl. Mater. 187 (1992) 60. [7] R. L. Klueh and D. J. Alexander, J. Nucl. Mater. 218 (1995) 151. [8] D. J. Alexander, R. K. Nanstad, W. R. Corwin, and J. T. Hutton, in A. A. Braun, N. E. Ashbaugh, and F. M. Smith (eds.), Applications of Automation Technology to Fatigue and Fracture Testing, ASTM STP 1092 (American Society for Testing and Materials, Philadelphia, 1990) 83. [9] M. A. Sokolov and R. K. Nanstad, in D. S. Gelles, R. K. Nanstad, A. S. Kumar, and E. A. Little (eds.), Effects of Radiation on Materials: 17th International Symposium, ASTM STP 1270 (American Society for Testing and Materials, Philadelphia, 1996) 384. [10] N. Hashimoto and R. L. Klueh, J. Nucl. Mater. 305 (2002) 153. [11] W. L. Hu and D. S. Gelles, in F. A. Garner, C. H. Henager, Jr., and N. Igata (eds.), Influence of Radiation on Material Properties: 13th International Symposium (Part II), ASTM STP 956 (American Society for Testing Materials, Philadelphia, 1987) 83.
66
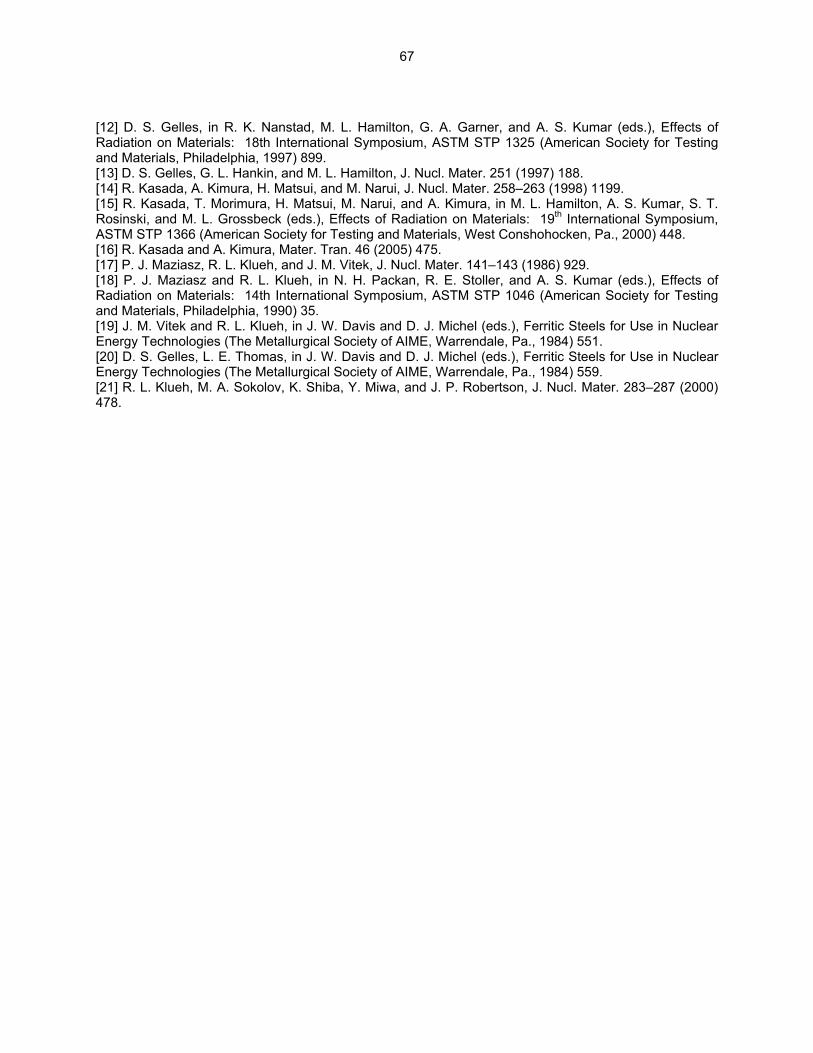
[12] D. S. Gelles, in R. K. Nanstad, M. L. Hamilton, G. A. Garner, and A. S. Kumar (eds.), Effects of Radiation on Materials: 18th International Symposium, ASTM STP 1325 (American Society for Testing and Materials, Philadelphia, 1997) 899. [13] D. S. Gelles, G. L. Hankin, and M. L. Hamilton, J. Nucl. Mater. 251 (1997) 188. [14] R. Kasada, A. Kimura, H. Matsui, and M. Narui, J. Nucl. Mater. 258–263 (1998) 1199. [15] R. Kasada, T. Morimura, H. Matsui, M. Narui, and A. Kimura, in M. L. Hamilton, A. S. Kumar, S. T. Rosinski, and M. L. Grossbeck (eds.), Effects of Radiation on Materials: 19th International Symposium, ASTM STP 1366 (American Society for Testing and Materials, West Conshohocken, Pa., 2000) 448. [16] R. Kasada and A. Kimura, Mater. Tran. 46 (2005) 475. [17] P. J. Maziasz, R. L. Klueh, and J. M. Vitek, J. Nucl. Mater. 141–143 (1986) 929. [18] P. J. Maziasz and R. L. Klueh, in N. H. Packan, R. E. Stoller, and A. S. Kumar (eds.), Effects of Radiation on Materials: 14th International Symposium, ASTM STP 1046 (American Society for Testing and Materials, Philadelphia, 1990) 35. [19] J. M. Vitek and R. L. Klueh, in J. W. Davis and D. J. Michel (eds.), Ferritic Steels for Use in Nuclear Energy Technologies (The Metallurgical Society of AIME, Warrendale, Pa., 1984) 551. [20] D. S. Gelles, L. E. Thomas, in J. W. Davis and D. J. Michel (eds.), Ferritic Steels for Use in Nuclear Energy Technologies (The Metallurgical Society of AIME, Warrendale, Pa., 1984) 559. [21] R. L. Klueh, M. A. Sokolov, K. Shiba, Y. Miwa, and J. P. Robertson, J. Nucl. Mater. 283–287 (2000) 478.
67
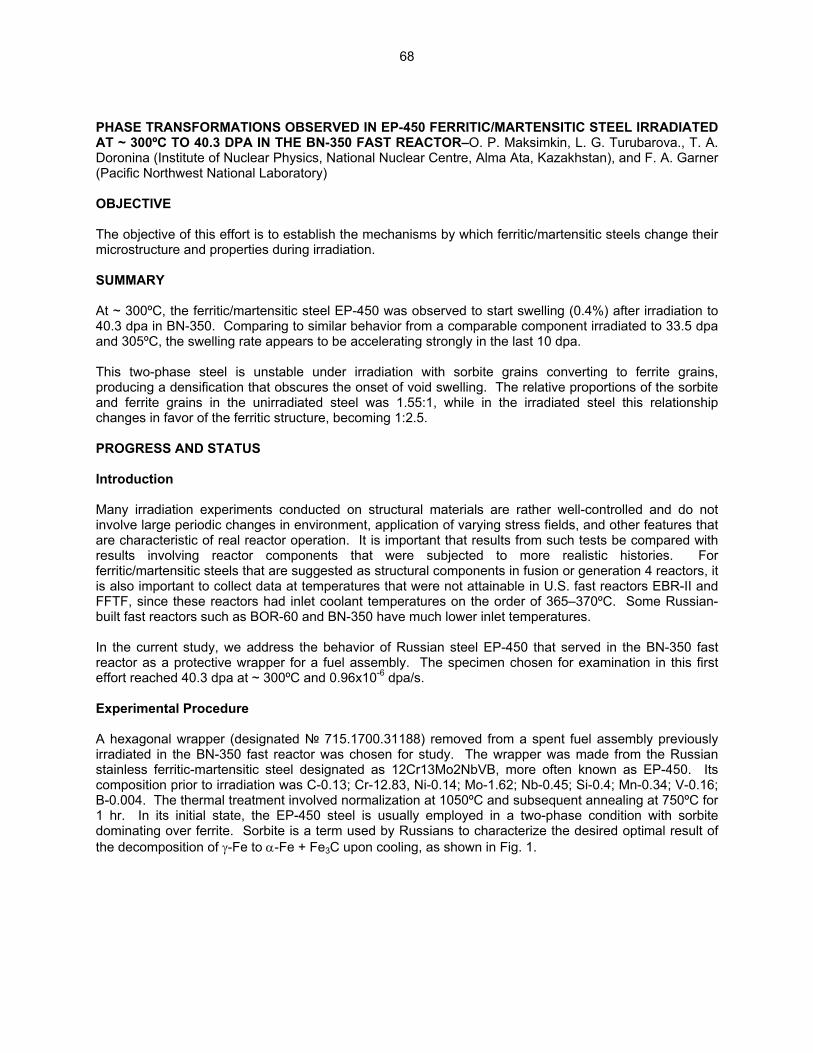
PHASE TRANSFORMATIONS OBSERVED IN EP-450 FERRITIC/MARTENSITIC STEEL IRRADIATED AT ~ 300ºC TO 40.3 DPA IN THE BN-350 FAST REACTOR–O. P. Maksimkin, L. G. Turubarova., T. A. Doronina (Institute of Nuclear Physics, National Nuclear Centre, Alma Ata, Kazakhstan), and F. A. Garner (Pacific Northwest National Laboratory) OBJECTIVE The objective of this effort is to establish the mechanisms by which ferritic/martensitic steels change their microstructure and properties during irradiation. SUMMARY At ~ 300ºC, the ferritic/martensitic steel EP-450 was observed to start swelling (0.4%) after irradiation to 40.3 dpa in BN-350. Comparing to similar behavior from a comparable component irradiated to 33.5 dpa and 305ºC, the swelling rate appears to be accelerating strongly in the last 10 dpa. This two-phase steel is unstable under irradiation with sorbite grains converting to ferrite grains, producing a densification that obscures the onset of void swelling. The relative proportions of the sorbite and ferrite grains in the unirradiated steel was 1.55:1, while in the irradiated steel this relationship changes in favor of the ferritic structure, becoming 1:2.5. PROGRESS AND STATUS Introduction Many irradiation experiments conducted on structural materials are rather well-controlled and do not involve large periodic changes in environment, application of varying stress fields, and other features that are characteristic of real reactor operation. It is important that results from such tests be compared with results involving reactor components that were subjected to more realistic histories. For ferritic/martensitic steels that are suggested as structural components in fusion or generation 4 reactors, it is also important to collect data at temperatures that were not attainable in U.S. fast reactors EBR-II and FFTF, since these reactors had inlet coolant temperatures on the order of 365–370ºC. Some Russian-built fast reactors such as BOR-60 and BN-350 have much lower inlet temperatures. In the current study, we address the behavior of Russian steel EP-450 that served in the BN-350 fast reactor as a protective wrapper for a fuel assembly. The specimen chosen for examination in this first effort reached 40.3 dpa at ~ 300ºC and 0.96x10⁻⁶ dpa/s. Experimental Procedure A hexagonal wrapper (designated 715.1700.31188) removed from a spent fuel assembly previously irradiated in the BN-350 fast reactor was chosen for study. The wrapper was made from the Russian stainless ferritic-martensitic steel designated as 12Cr13Mo2NbVB, more often known as EP-450. Its composition prior to irradiation was C-0.13; Cr-12.83, Ni-0.14; Mo-1.62; Nb-0.45; Si-0.4; Mn-0.34; V-0.16; B-0.004. The thermal treatment involved normalization at 1050ºC and subsequent annealing at 750ºC for 1 hr. In its initial state, the EP-450 steel is usually employed in a two-phase condition with sorbite dominating over ferrite. Sorbite is a term used by Russians to characterize the desired optimal result of the decomposition of γ-Fe to α-Fe + Fe3C upon cooling, as shown in Fig. 1.
68
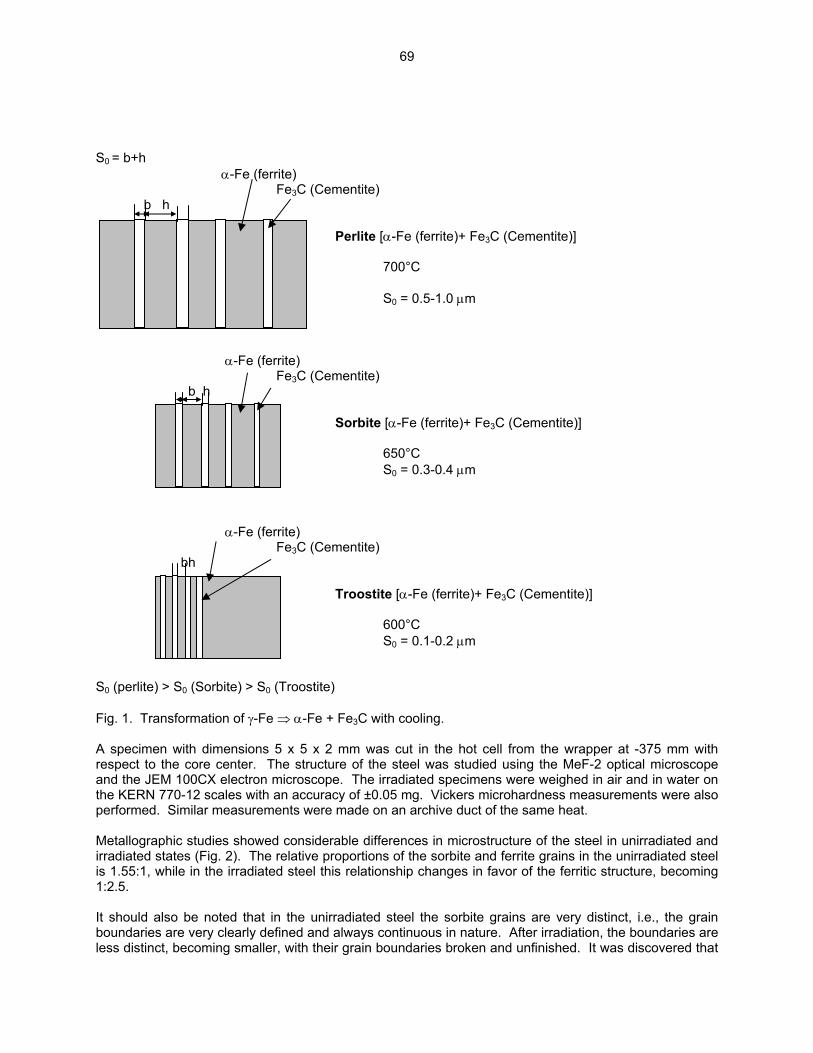
S0 = b+h α-Fe (ferrite) Fe3C (Cementite) b h Perlite [α-Fe (ferrite)+ Fe3C (Cementite)] 700°C S0 = 0.5-1.0 µm α-Fe (ferrite) Fe3C (Cementite) b h Sorbite [α-Fe (ferrite)+ Fe3C (Cementite)] 650°C S0 = 0.3-0.4 µm α-Fe (ferrite) Fe3C (Cementite) bh Troostite [α-Fe (ferrite)+ Fe3C (Cementite)] 600°C S0 = 0.1-0.2 µm S0 (perlite) > S0 (Sorbite) > S0 (Troostite) Fig. 1. Transformation of γ-Fe ⇒ α-Fe + Fe3C with cooling. A specimen with dimensions 5 x 5 x 2 mm was cut in the hot cell from the wrapper at -375 mm with respect to the core center. The structure of the steel was studied using the MeF-2 optical microscope and the JEM 100CX electron microscope. The irradiated specimens were weighed in air and in water on the KERN 770-12 scales with an accuracy of ±0.05 mg. Vickers microhardness measurements were also performed. Similar measurements were made on an archive duct of the same heat. Metallographic studies showed considerable differences in microstructure of the steel in unirradiated and irradiated states (Fig. 2). The relative proportions of the sorbite and ferrite grains in the unirradiated steel is 1.55:1, while in the irradiated steel this relationship changes in favor of the ferritic structure, becoming 1:2.5. It should also be noted that in the unirradiated steel the sorbite grains are very distinct, i.e., the grain boundaries are very clearly defined and always continuous in nature. After irradiation, the boundaries are less distinct, becoming smaller, with their grain boundaries broken and unfinished. It was discovered that
69
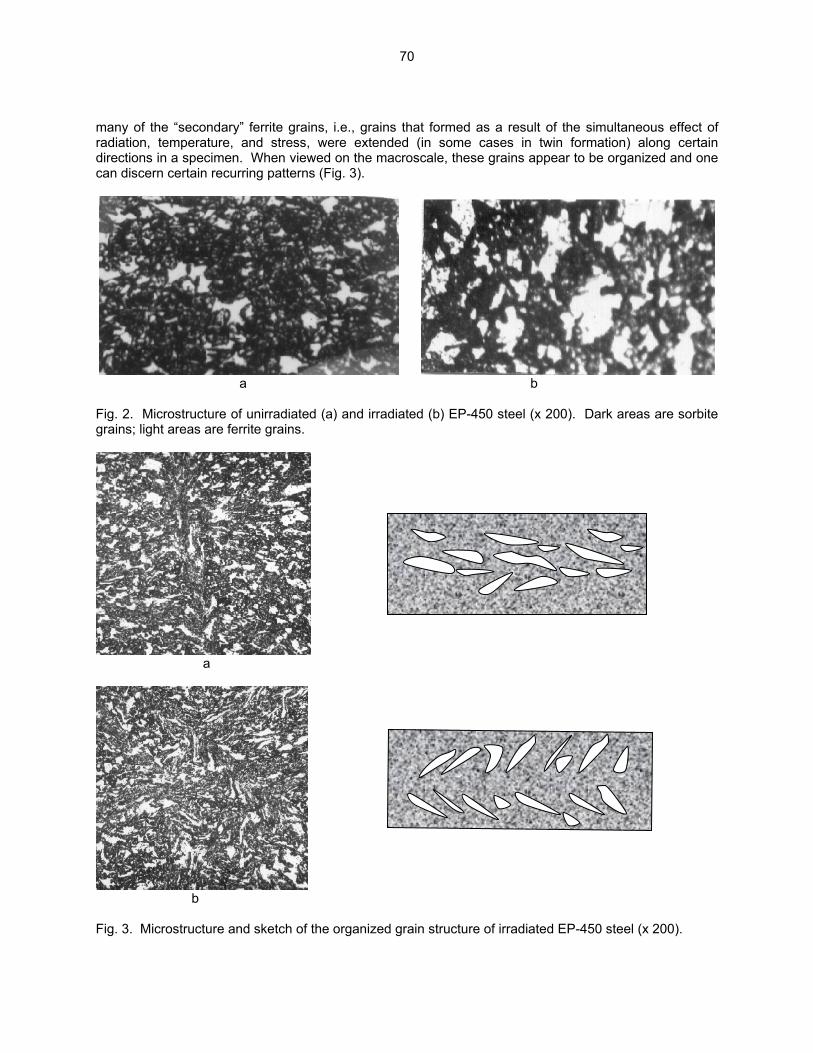
many of the “secondary” ferrite grains, i.e., grains that formed as a result of the simultaneous effect of radiation, temperature, and stress, were extended (in some cases in twin formation) along certain directions in a specimen. When viewed on the macroscale, these grains appear to be organized and one can discern certain recurring patterns (Fig. 3).
a b Fig. 2. Microstructure of unirradiated (a) and irradiated (b) EP-450 steel (x 200). Dark areas are sorbite grains; light areas are ferrite grains.
a
b Fig. 3. Microstructure and sketch of the organized grain structure of irradiated EP-450 steel (x 200).
70
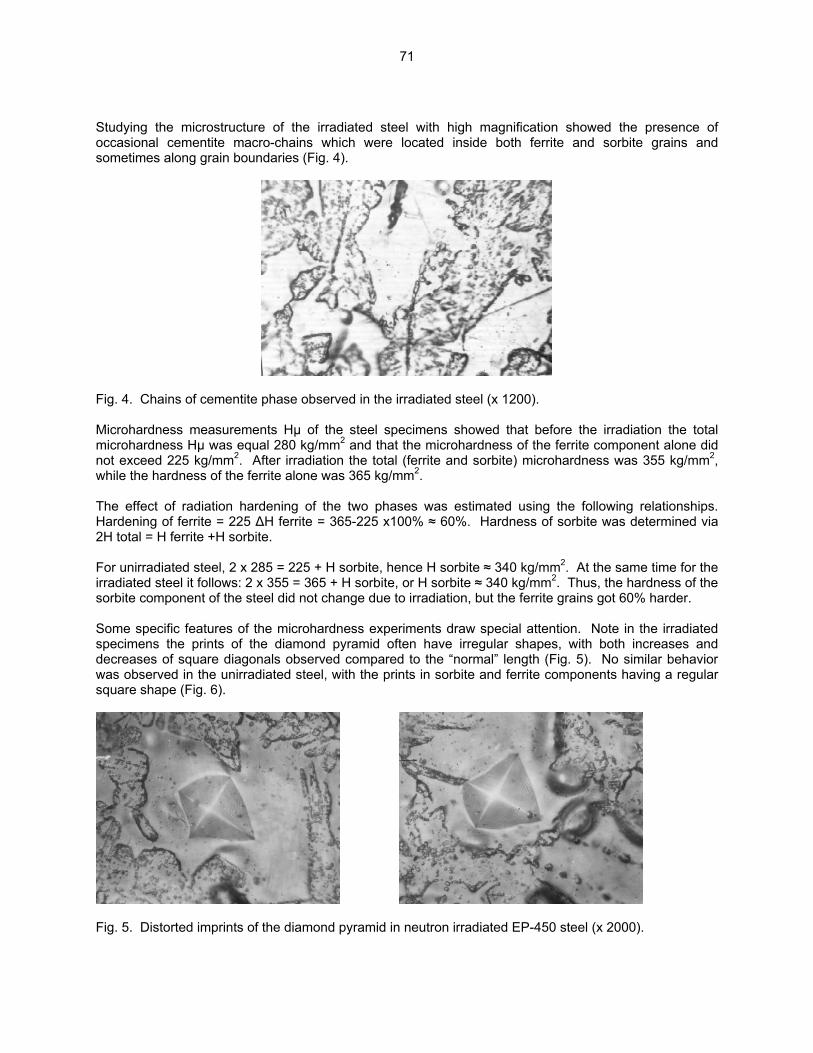
Studying the microstructure of the irradiated steel with high magnification showed the presence of occasional cementite macro-chains which were located inside both ferrite and sorbite grains and sometimes along grain boundaries (Fig. 4).
Fig. 4. Chains of cementite phase observed in the irradiated steel (x 1200). Microhardness measurements Hµ of the steel specimens showed that before the irradiation the total microhardness Hµ was equal 280 kg/mm2 and that the microhardness of the ferrite component alone did not exceed 225 kg/mm2. After irradiation the total (ferrite and sorbite) microhardness was 355 kg/mm2, while the hardness of the ferrite alone was 365 kg/mm2. The effect of radiation hardening of the two phases was estimated using the following relationships. Hardening of ferrite = 225 ∆H ferrite = 365-225 x100% ≈ 60%. Hardness of sorbite was determined via 2H total = H ferrite +H sorbite. For unirradiated steel, 2 x 285 = 225 + H sorbite, hence H sorbite ≈ 340 kg/mm2. At the same time for the irradiated steel it follows: 2 x 355 = 365 + H sorbite, or H sorbite ≈ 340 kg/mm2. Thus, the hardness of the sorbite component of the steel did not change due to irradiation, but the ferrite grains got 60% harder. Some specific features of the microhardness experiments draw special attention. Note in the irradiated specimens the prints of the diamond pyramid often have irregular shapes, with both increases and decreases of square diagonals observed compared to the “normal” length (Fig. 5). No similar behavior was observed in the unirradiated steel, with the prints in sorbite and ferrite components having a regular square shape (Fig. 6).
Fig. 5. Distorted imprints of the diamond pyramid in neutron irradiated EP-450 steel (x 2000).
71

Fig. 6. Imprints of the diamond pyramid in ferrite (a) and sorbite (b) of unirradiated EP-450 steel (x 2000). There is considerable difference observed between density change data and the microscopy data. Hydrostatic measurement showed a density decrease with respect to the unirradiated steel of only 0.04 %, and microscopy showed the presence of small voids, the concentration and size distribution of which imply ~ 0.4% swelling (Fig. 7). This implies that there is a densification of ~ 0.4% that obscures the onset of swelling as might be observed via density measurements.
Fig. 7. Voids observed in irradiated EP-450 stainless steel after irradiation in BN-350 to 40.3 dpa at 300ºC. Results It is obvious from these results that EP-450 under neutron irradiation can swell at ~ 300ºC, but depending on one’s point of view, the amount of swelling is either rather small or significantly larger than expected. Swelling of 0.4% at 40.3 dpa and a low temperature of only 300ºC is relatively larger than usually expected and may be a reflection of unanticipated swelling at low-temperature and low-flux predicted by Garner and coworkers for ferritic and ferritic/martensitic steels (1-4). This steel has recently been shown to swell at temperatures as low as 275ºC in BN-350 (3). At 305ºC and 33.5 dpa in another BN-350 wrapper swelling of 0.015% was observed, indicating an average swelling rate of only 4 x 10⁻⁴ %/dpa. (3). As shown in Fig. 8, swelling data on EP-450 was compiled by Dvoriashin and coworkers as an average swelling rate (swelling divided by dpa) over the range of temperatures experienced in the BR-10, BN-350, and BN-600 fast reactors (3). Note that the average swelling (1 x 10⁻² %/dpa) observed at 300ºC and 40.3 dpa in this study falls at the high end of the swelling rates observed by Dvoriashin, indicating that the swelling rate at 300ºC is increasing between 33.5 and 40.3 dpa.
72
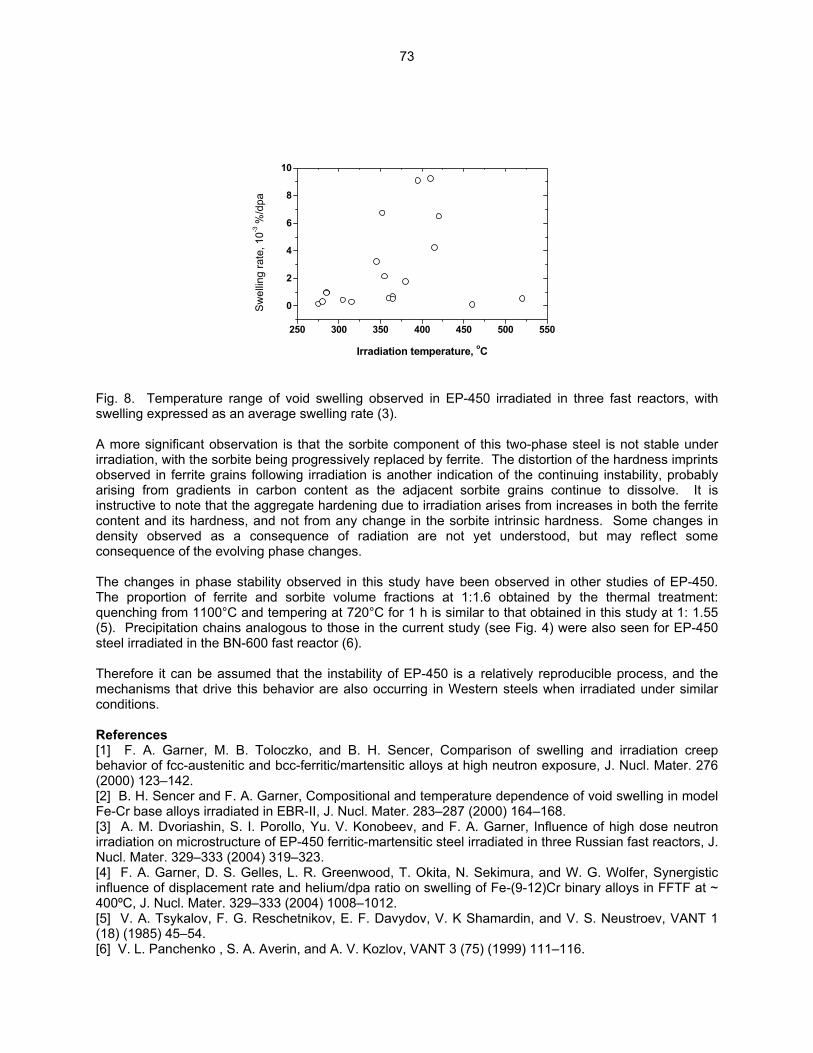
250 300 350 400 450 500 550
0
2
4
6
8
10
Sw
ellin
g ra
te, 1
0-3 %
/dpa
Irradiation temperature, оС
Fig. 8. Temperature range of void swelling observed in EP-450 irradiated in three fast reactors, with swelling expressed as an average swelling rate (3). A more significant observation is that the sorbite component of this two-phase steel is not stable under irradiation, with the sorbite being progressively replaced by ferrite. The distortion of the hardness imprints observed in ferrite grains following irradiation is another indication of the continuing instability, probably arising from gradients in carbon content as the adjacent sorbite grains continue to dissolve. It is instructive to note that the aggregate hardening due to irradiation arises from increases in both the ferrite content and its hardness, and not from any change in the sorbite intrinsic hardness. Some changes in density observed as a consequence of radiation are not yet understood, but may reflect some consequence of the evolving phase changes. The changes in phase stability observed in this study have been observed in other studies of EP-450. The proportion of ferrite and sorbite volume fractions at 1:1.6 obtained by the thermal treatment: quenching from 1100°С and tempering at 720°C for 1 h is similar to that obtained in this study at 1: 1.55 (5). Precipitation chains analogous to those in the current study (see Fig. 4) were also seen for EP-450 steel irradiated in the BN-600 fast reactor (6). Therefore it can be assumed that the instability of EP-450 is a relatively reproducible process, and the mechanisms that drive this behavior are also occurring in Western steels when irradiated under similar conditions. References [1] F. A. Garner, M. B. Toloczko, and B. H. Sencer, Comparison of swelling and irradiation creep behavior of fcc-austenitic and bcc-ferritic/martensitic alloys at high neutron exposure, J. Nucl. Mater. 276 (2000) 123–142. [2] B. H. Sencer and F. A. Garner, Compositional and temperature dependence of void swelling in model Fe-Cr base alloys irradiated in EBR-II, J. Nucl. Mater. 283–287 (2000) 164–168. [3] A. M. Dvoriashin, S. I. Porollo, Yu. V. Konobeev, and F. A. Garner, Influence of high dose neutron irradiation on microstructure of EP-450 ferritic-martensitic steel irradiated in three Russian fast reactors, J. Nucl. Mater. 329–333 (2004) 319–323. [4] F. A. Garner, D. S. Gelles, L. R. Greenwood, T. Okita, N. Sekimura, and W. G. Wolfer, Synergistic influence of displacement rate and helium/dpa ratio on swelling of Fe-(9-12)Cr binary alloys in FFTF at ~ 400ºC, J. Nucl. Mater. 329–333 (2004) 1008–1012. [5] V. A. Tsykalov, F. G. Reschetnikov, E. F. Davydov, V. K Shamardin, and V. S. Neustroev, VANT 1 (18) (1985) 45–54. [6] V. L. Panchenko , S. A. Averin, and A. V. Kozlov, VANT 3 (75) (1999) 111–116.
73

4.0 COPPER ALLOYS No contributions.
74
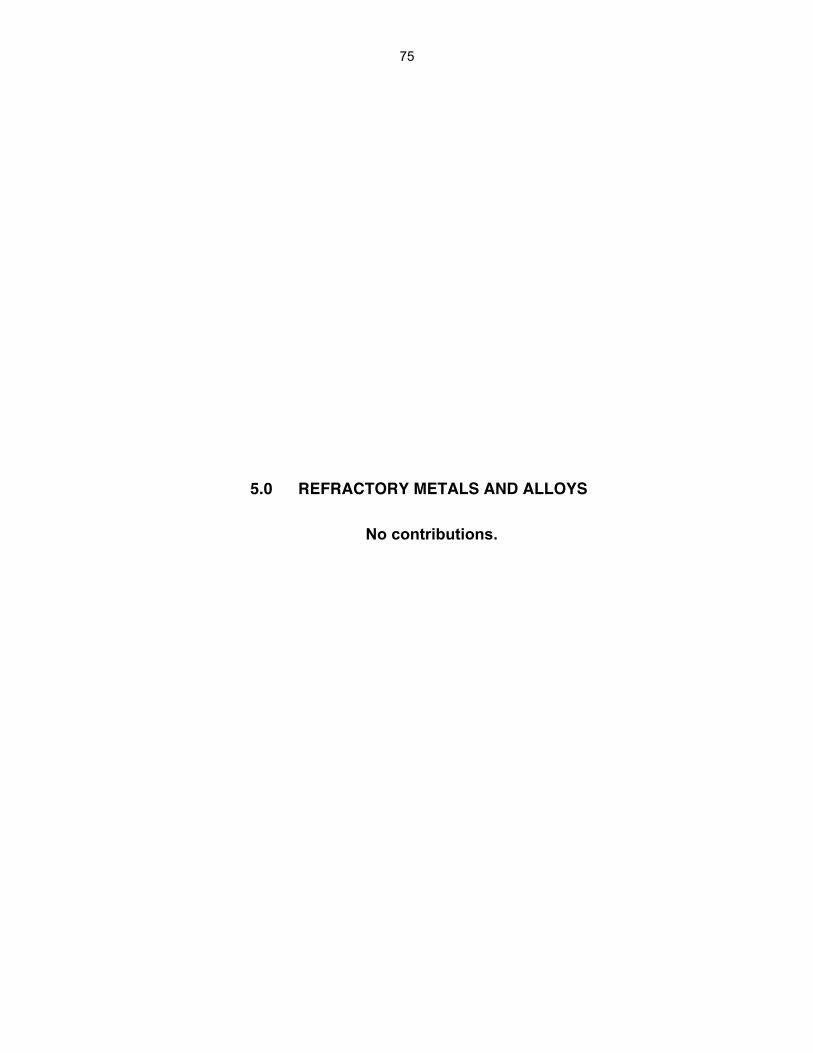
5.0 REFRACTORY METALS AND ALLOYS No contributions.
75

6.0 AUSTENITIC STAINLESS STEELS
76

CORRELATION OF YIELD STRESS AND MICROHARDNESS IN 08CR16NI11MO3 IRRADIATED TO HIGH DOSE IN THE BN-350 FAST REACTOR–O. P. Maksimkin, M. N. Gusev, O. V. Tivanova, N. S. Silnaygina (Institute of Nuclear Physics, National Nuclear Center, Almaty, Kazakhstan), and F. A. Garner (Pacific Northwest National Laboratory)*
OBJECTIVE The objective of this effort is to develop methods of extracting data on radiation-induced changes in mechanical properties when the material of interest is highly irradiated, in an inconvenient location or configuration, or when significant gradients in mechanical properties are anticipated over small dimensions. SUMMARY The relationship between values of the microhardness Нµ and the engineering yield stress, σ02, in steel 08Cr16Ni11Mo3 (Russian analog of AISI 316) heavily irradiated in the BN-350 reactor has been experimentally derived. It agrees very well with the previously published correlation developed by Toloczko for unirradiated 316 in a variety of cold-work conditions. Even more importantly, when the correlation is derived in the K∆ format where the correlation involves changes in the two properties, we find excellent agreement with a universal K∆ correlation developed by Busby and coworkers. With this K∆ correlation, one can predict the value of yield stress in irradiated material based on measured values of microhardness. The technique is particularly suitable when the material of interest is in an inconvenient location or configuration, or when significant gradients in mechanical properties are anticipated over small dimensions. This approach makes it possible to reduce the labor input and risk when conducting such work. It appears that the derived correlation is equally applicable to both Russian and Western austenitic steel, and also in both irradiated and unirradiated conditions. Additionally, this report points out that microhardness measurements must take into account that high temperature sodium exposure alters the metal surface to produce ferrite, and therefore the altered layers should be removed prior to testing. PROGRESS AND STATUS Introduction The yield strength σ0.2 is a basic parameter used in engineering calculations and its proper determination is an important task for design of fission or fusion reactors. For fusion applications, however, data generated in the appropriate spectra are not available, so data from surrogate spectra are required to validate the measurement technique and to allow extrapolation to the target spectra. Even in surrogate spectra it is not always possible, however, to determine σ0.2 on highly irradiated material using direct techniques such as uniaxial tensile tests, particularly when there are large levels of induced radioactivity. It can also be difficult when the material volume is either too small to produce a tensile or other mechanical property specimen, when the material of interest is in an inconvenient location or configuration, or when significant gradients in mechanical properties are anticipated over small dimensions. The latter might arise where there are strong local gradients in temperature or neutron flux across the material of interest. One approach to surmount such difficulties is to establish property-property correlations using appropriate correlation relations with other quantities, such as the critical transverse strain measured using the shear punch test [1] or the microhardness Hµ [2]. While both of these techniques are useful for measurement using small specimens, the latter is particularly suited to measurements made in very small dimensions with potentially steep environmental gradients. Both of these techniques are very convenient for working with irradiated material.
*Pacific Northwest National Laboratory (PNNL) is operated for the U.S. Department of Energy by Battelle Memorial Institute under contract DE-AC06-76RLO-1830.
77

A review summary of microhardness-tensile correlations has recently been published by Busby, Hash, and Was [3]. They demonstrated that two types of correlation have been published based on either the direct measurements (Нµ ~ k1⋅σ02 + σ1) or the change in measurements Нµ ~ k∆⋅σ02. As noted by Busby et al., the successful use of the first correlation requires that both properties be measured at the same temperature. It is important to note that σ02 is a bulk-averaged property while Нµ reflects primarily the surface properties, so care should be taken to ensure that no significant surface modification has occurred in the surrogate environment. If the potential for such modification is present, then the surface layers should be removed. In the present work, the quantities σ0.2 and Hµ are measured and compared for Russian austenitic stainless steel designated 08Cr16Ni11Mo3 (Russian analog of AISI 316, chemical composition – Cr: 16%, Ni: 11.4%, Mn: 1.6%, Mo: 1.8%) which was irradiated in flowing sodium to doses as large as 15.6 dpa in the BN-350 fast reactor in Aktau, Kazakhstan. A limited range of specimen temperatures was chosen to minimize the influence of variables other than dpa level. The objective of this effort is to provide yield strength predictions for Russian steels for fusion reactor conditions employing fast reactor data as surrogates. A secondary objective is to show that Russian and Western steels all respond in a similar manner to radiation exposure. Experimental Procedure Specimens with different damage doses and irradiation temperatures (see Table 1) were cut from the protective hexagonal shroud of spent assembles H-214(II), H-110, B-337, and B-300, with all assemblies located at different distances from the reactor core center line. Two types of specimens were selected (see Fig. 1). The first type was sliced from the central part of the wrapper faces. The second type was sliced from the corners of the hexagonal assembly. The use of the two types of specimens reflects the fact that the technique used for manufacturing the wrappers may have induced structural differences between the faces and corners of the wrapper. Both types of specimens were removed by slicing, followed by mechanical and electrolytic polishing of the specimens to remove the influence of the specimen surface, which had been in long contact with sodium at elevated temperatures and therefore likely to be unrepresentative of bulk composition and properties [4-7]. In general, such exposure leads to the removal of nickel, chromium, and other elements near the surface, often producing a ferrite layer on the surface as a consequence.
Table 1. Irradiation conditions
Distance from reactor core, mm Damage dose, dpa Dose rate, dpa/s Irradiation temperature, °С -1200 (H-214) 0.25 8⋅10-10 280 -900 (H-214) 1.27 4⋅10-9 281 +500 (H-214) 6.03 2.2⋅10-8 365 -500 (B-300) 11 4.9⋅10- 8 302 -500 (B-337) 12 2.6⋅10-7 309 0 (H-110) 13 4.2⋅10-7 311 0 (H-214) 15.6 4.8⋅10-7 337
78
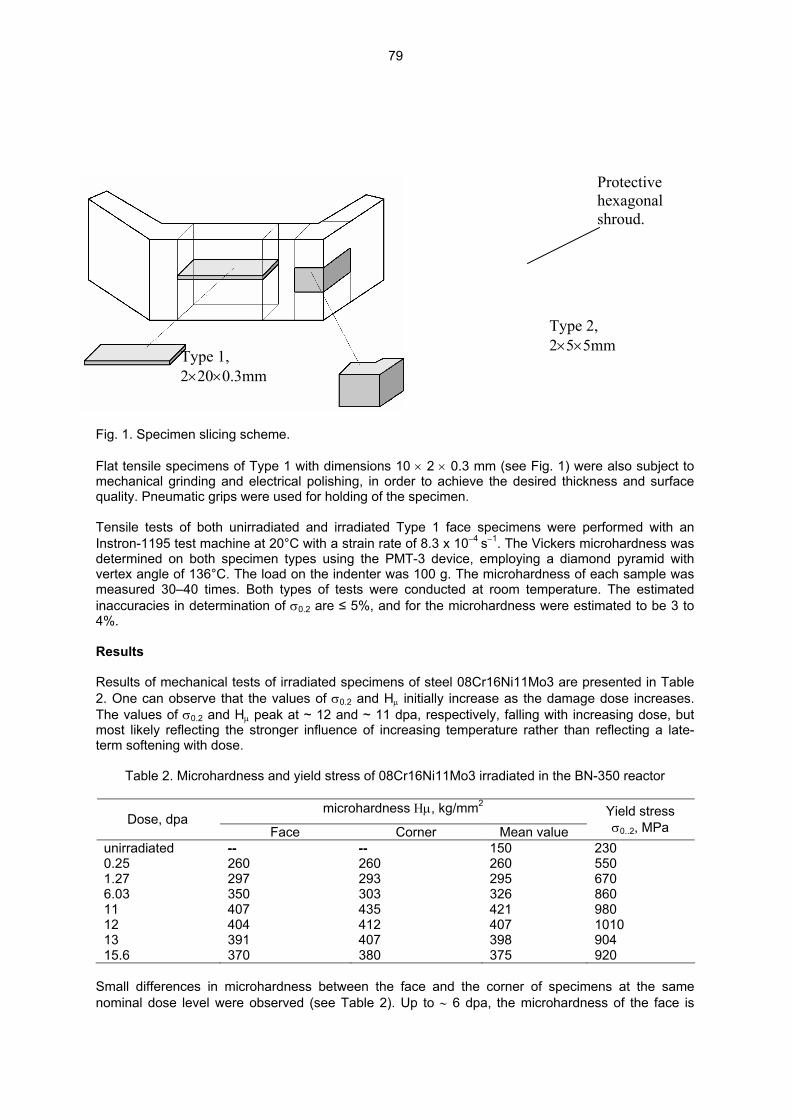
Protective hexagonal shroud.
Type 2, 2×5×5mm
Type 1, 2×20×0.3mm
Fig. 1. Specimen slicing scheme. Flat tensile specimens of Type 1 with dimensions 10 × 2 × 0.3 mm (see Fig. 1) were also subject to mechanical grinding and electrical polishing, in order to achieve the desired thickness and surface quality. Pneumatic grips were used for holding of the specimen. Tensile tests of both unirradiated and irradiated Type 1 face specimens were performed with an Instron-1195 test machine at 20°С with a strain rate of 8.3 x 10⁻⁴ s−1. The Vickers microhardness was determined on both specimen types using the PMT-3 device, employing a diamond pyramid with vertex angle of 136°C. The load on the indenter was 100 g. The microhardness of each sample was measured 30–40 times. Both types of tests were conducted at room temperature. The estimated inaccuracies in determination of σ0.2 are ≤ 5%, and for the microhardness were estimated to be 3 to 4%. Results Results of mechanical tests of irradiated specimens of steel 08Cr16Ni11Mo3 are presented in Table 2. One can observe that the values of σ0.2 and Нµ initially increase as the damage dose increases. The values of σ0.2 and Нµ peak at ~ 12 and ~ 11 dpa, respectively, falling with increasing dose, but most likely reflecting the stronger influence of increasing temperature rather than reflecting a late-term softening with dose.
Table 2. Microhardness and yield stress of 08Cr16Ni11Mo3 irradiated in the BN-350 reactor
microhardness Ηµ, kg/mm2 Dose, dpa
Face Corner Mean value Yield stress σ0..2, МPа
unirradiated -- -- 150 230 0.25 260 260 260 550 1.27 297 293 295 670 6.03 350 303 326 860 11 407 435 421 980 12 404 412 407 1010 13 391 407 398 904 15.6 370 380 375 920
Small differences in microhardness between the face and the corner of specimens at the same nominal dose level were observed (see Table 2). Up to ∼ 6 dpa, the microhardness of the face is
79
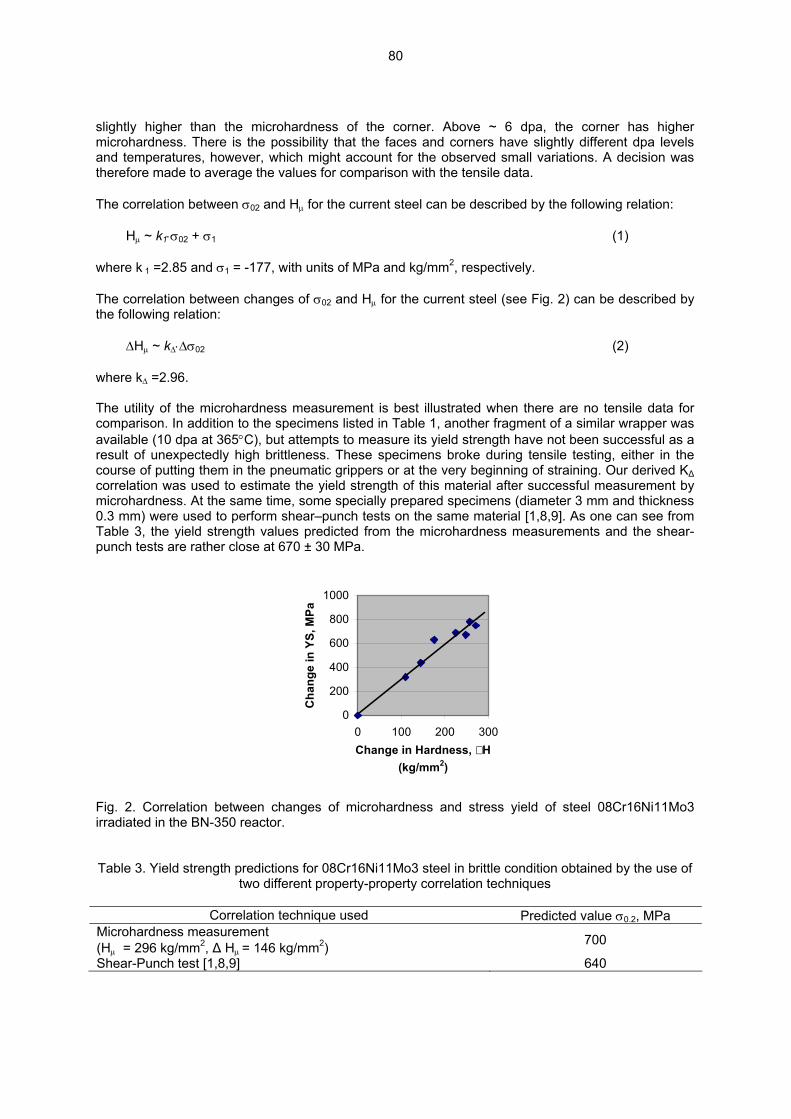
slightly higher than the microhardness of the corner. Above ~ 6 dpa, the corner has higher microhardness. There is the possibility that the faces and corners have slightly different dpa levels and temperatures, however, which might account for the observed small variations. A decision was therefore made to average the values for comparison with the tensile data. The correlation between σ02 and Нµ for the current steel can be described by the following relation:
Нµ ~ k1⋅σ02 + σ1 (1) where k 1 =2.85 and σ1 = -177, with units of MPa and kg/mm2, respectively. The correlation between changes of σ02 and Нµ for the current steel (see Fig. 2) can be described by the following relation:
∆Нµ ~ k∆⋅∆σ02 (2) where k∆ =2.96. The utility of the microhardness measurement is best illustrated when there are no tensile data for comparison. In addition to the specimens listed in Table 1, another fragment of a similar wrapper was available (10 dpa at 365°С), but attempts to measure its yield strength have not been successful as a result of unexpectedly high brittleness. These specimens broke during tensile testing, either in the course of putting them in the pneumatic grippers or at the very beginning of straining. Our derived K∆ correlation was used to estimate the yield strength of this material after successful measurement by microhardness. At the same time, some specially prepared specimens (diameter 3 mm and thickness 0.3 mm) were used to perform shear–punch tests on the same material [1,8,9]. As one can see from Table 3, the yield strength values predicted from the microhardness measurements and the shear-punch tests are rather close at 670 ± 30 MPa.
0
200
400
600
800
1000
0 100 200 300Change in Hardness, H
(kg/mm2)
Cha
nge
in Y
S, M
Pa
Fig. 2. Correlation between changes of microhardness and stress yield of steel 08Cr16Ni11Mo3 irradiated in the BN-350 reactor. Table 3. Yield strength predictions for 08Cr16Ni11Mo3 steel in brittle condition obtained by the use of
two different property-property correlation techniques
Correlation technique used Predicted value σ0.2, MPa Microhardness measurement (Нµ = 296 kg/mm2, ∆ Нµ = 146 kg/mm2) 700
Shear-Punch test [1,8,9] 640
80
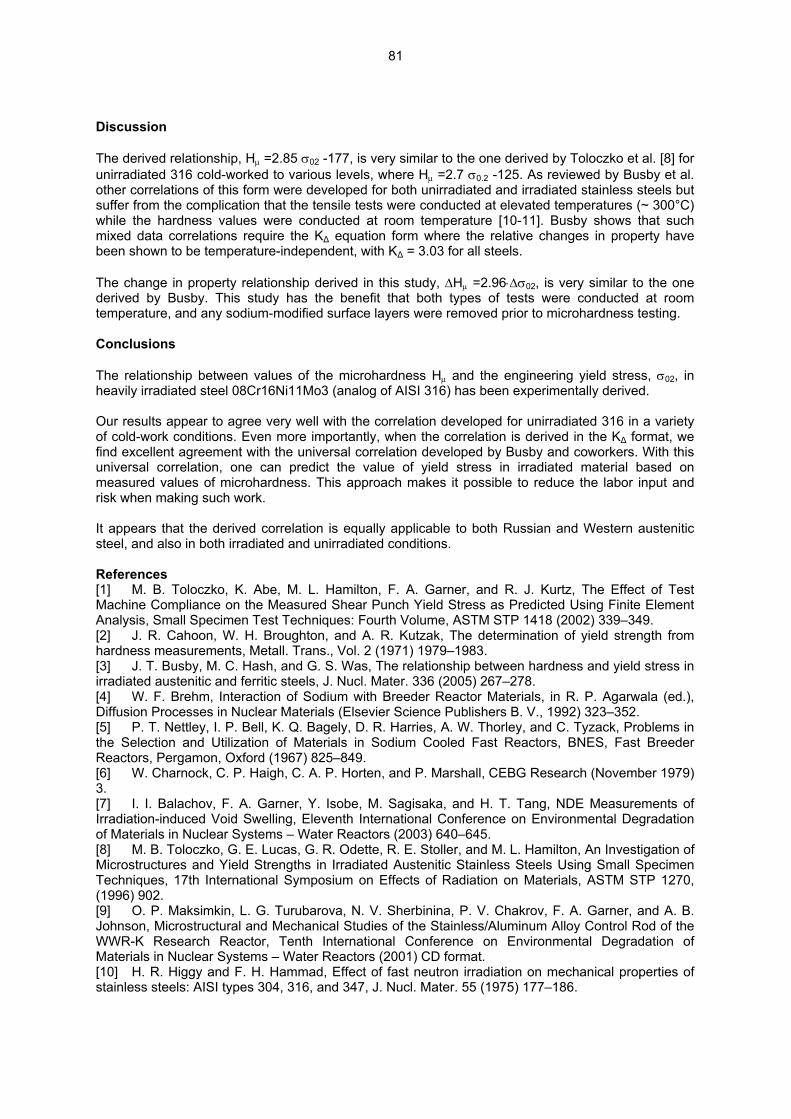
Discussion The derived relationship, Нµ =2.85 σ02 -177, is very similar to the one derived by Toloczko et al. [8] for unirradiated 316 cold-worked to various levels, where Нµ =2.7 σ0.2 -125. As reviewed by Busby et al. other correlations of this form were developed for both unirradiated and irradiated stainless steels but suffer from the complication that the tensile tests were conducted at elevated temperatures (~ 300°C) while the hardness values were conducted at room temperature [10-11]. Busby shows that such mixed data correlations require the K∆ equation form where the relative changes in property have been shown to be temperature-independent, with K∆ = 3.03 for all steels. The change in property relationship derived in this study, ∆Нµ =2.96⋅∆σ02, is very similar to the one derived by Busby. This study has the benefit that both types of tests were conducted at room temperature, and any sodium-modified surface layers were removed prior to microhardness testing. Conclusions The relationship between values of the microhardness Нµ and the engineering yield stress, σ02, in heavily irradiated steel 08Cr16Ni11Mo3 (analog of AISI 316) has been experimentally derived. Our results appear to agree very well with the correlation developed for unirradiated 316 in a variety of cold-work conditions. Even more importantly, when the correlation is derived in the K∆ format, we find excellent agreement with the universal correlation developed by Busby and coworkers. With this universal correlation, one can predict the value of yield stress in irradiated material based on measured values of microhardness. This approach makes it possible to reduce the labor input and risk when making such work. It appears that the derived correlation is equally applicable to both Russian and Western austenitic steel, and also in both irradiated and unirradiated conditions. References [1] M. B. Toloczko, K. Abe, M. L. Hamilton, F. A. Garner, and R. J. Kurtz, The Effect of Test Machine Compliance on the Measured Shear Punch Yield Stress as Predicted Using Finite Element Analysis, Small Specimen Test Techniques: Fourth Volume, ASTM STP 1418 (2002) 339–349. [2] J. R. Cahoon, W. H. Broughton, and A. R. Kutzak, The determination of yield strength from hardness measurements, Metall. Trans., Vol. 2 (1971) 1979–1983. [3] J. T. Busby, M. C. Hash, and G. S. Was, The relationship between hardness and yield stress in irradiated austenitic and ferritic steels, J. Nucl. Mater. 336 (2005) 267–278. [4] W. F. Brehm, Interaction of Sodium with Breeder Reactor Materials, in R. P. Agarwala (ed.), Diffusion Processes in Nuclear Materials (Elsevier Science Publishers B. V., 1992) 323–352. [5] P. T. Nettley, I. P. Bell, K. Q. Bagely, D. R. Harries, A. W. Thorley, and C. Tyzack, Problems in the Selection and Utilization of Materials in Sodium Cooled Fast Reactors, BNES, Fast Breeder Reactors, Pergamon, Oxford (1967) 825–849. [6] W. Charnock, C. P. Haigh, C. A. P. Horten, and P. Marshall, CEBG Research (November 1979) 3. [7] I. I. Balachov, F. A. Garner, Y. Isobe, M. Sagisaka, and H. T. Tang, NDE Measurements of Irradiation-induced Void Swelling, Eleventh International Conference on Environmental Degradation of Materials in Nuclear Systems – Water Reactors (2003) 640–645. [8] M. B. Toloczko, G. E. Lucas, G. R. Odette, R. E. Stoller, and M. L. Hamilton, An Investigation of Microstructures and Yield Strengths in Irradiated Austenitic Stainless Steels Using Small Specimen Techniques, 17th International Symposium on Effects of Radiation on Materials, ASTM STP 1270, (1996) 902. [9] O. P. Maksimkin, L. G. Turubarova, N. V. Sherbinina, P. V. Chakrov, F. A. Garner, and A. B. Johnson, Microstructural and Mechanical Studies of the Stainless/Aluminum Alloy Control Rod of the WWR-K Research Reactor, Tenth International Conference on Environmental Degradation of Materials in Nuclear Systems – Water Reactors (2001) CD format. [10] H. R. Higgy and F. H. Hammad, Effect of fast neutron irradiation on mechanical properties of stainless steels: AISI types 304, 316, and 347, J. Nucl. Mater. 55 (1975) 177–186.
81

[11] M. Kodama, S. Suzuki, K. Nakata, S. Nishimura, K. Fukuya, T. Kato, Y. Tanaka, and S. Shima, Mechanical Properties of Various Kinds of Irradiated Austenitic Stainless Steels, 8th International Symposium on Environmental Degradation-Water Reactors (August 1997) 833.
82

7.0 MHD INSULATORS, INSULATING CERAMICS, ANDOPTICAL MATERIALS
83

S T U D Y OF THE LONG-TERM STA B I L I T Y OF MULT I - L AYER MHD C O ATINGS FOR FUSIONREACTOR APPLICATIONS—B. A. Pint, J. L. Moser (Oak Ridge National Laboratory), and A. Jankowski
(Lawrence Livermore National Laboratory)
OBJECTIVE
The objective of this task is to assess the long-term, high-temperature compatibility of high electricalresistance, multi-layer coatings with lithium at high temperatures. Electrically insulating coatings on thefirst wall of magnetic confinement reactors are essential to reduce the magnetohydrodynamic (MHD) forcethat would otherwise inhibit the flow of the lithium coolant. An assessment of the crack tolerance for thesecoatings determined that a multi-layer coating with metal and ceramic layers was needed to prevent Lifrom wetting cracks or defects in a single-layer ceramic coating. Experimental compatibility tests are beingconducted on bulk materials and single and multi-layer coatings.
SUMMARY
The Li chemistry before and after a capsule test with V-4Cr-4Ti specimens has been obtained. Althoughit is difficult to measure low levels of impurities, the analysis has assisted in interpreting the mass changeresults. Further characterization of recently fabricated, electron beam, physical vapor deposition (EB-PVD) Er2O3 coatings indicated that those coated at a low substrate temperature may have containedErO6 which made them more susceptible to attack by Li during the in-situ test. New coatings that are fullyEr2O3 and are protected with a thicker outer vanadium layer have been fabricated.
PROGRESS AND STATUS
Introduction
The current focus of the U.S. MHD coating program is the fabrication and testing of multi-layer coatingswith a combination of high-resistance ceramic layers and vanadium layers to prevent interaction betweenLi and the ceramic layer. A recent evaluation of the effects of cracks and defects on the performance ofsingle-layer MHD coatings concluded that only a very small fraction of through-thickness cracks could betolerated, assuming that Li will wet the cracks and short the coating.[1] Besides wetting, Li ions also coulddope the ceramic layer, thereby increasing its conductivity. Thus, a more robust flaw-tolerant coatingsystem with a dense metallic layer is desired for contact with flowing Li. Vanadium would be the primemetallic coating candidate among refractory metals with good Li compatibility at 700°C. For example, aflow-channel insert could be constructed, Fig. 1, similar in concept to that proposed and tested for a Pb-Lisystem.[2,3] This strategy switches the main lithium compatibility requirement from the ceramic layer tothe metallic layer and thereby increases the number of candidate materials. However, the ceramic layermust have some degree of compatibility in case the metallic layer has a defect or fails in service.
The results presented in this report include the chemical analysis of the Li before and after a capsule testat 800°C with V-4Cr-4Ti specimens.[4] Also, further analysis of the EB-PVD Er2O3 coatings revealed adifference in crystal structure depending on deposition temperature. This may explain the previouslyreported poor performance of these coatings in the in-situ test.[5,6] New coatings are being fabricated forfurther testing.
Experimental Procedure
The experimental procedure for the capsule testing has been reported previously.[7] The Li chemicalanalysis was performed at the Y-12 plant in Oak Ridge, TN and used inductively coupled plasma (metals),
84
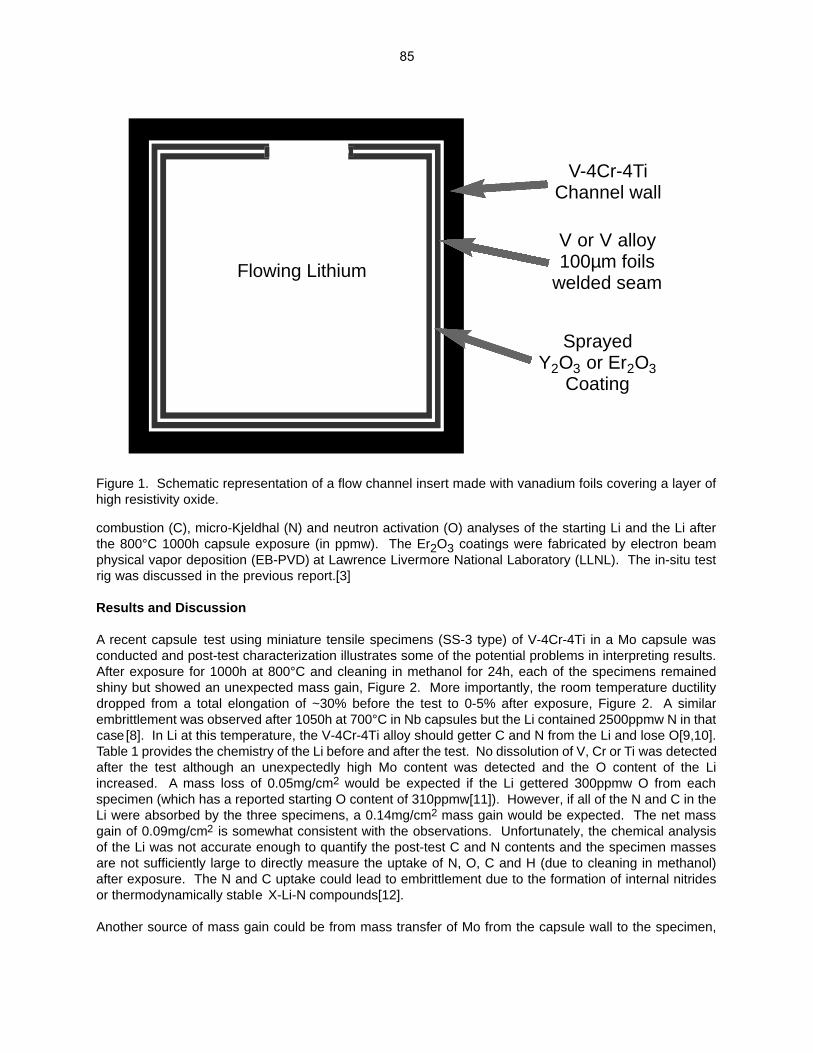
combustion (C), micro-Kjeldhal (N) and neutron activation (O) analyses of the starting Li and the Li afterthe 800°C 1000h capsule exposure (in ppmw). The Er2O3 coatings were fabricated by electron beamphysical vapor deposition (EB-PVD) at Lawrence Livermore National Laboratory (LLNL). The in-situ testrig was discussed in the previous report.[3]
Results and Discussion
A recent capsule test using miniature tensile specimens (SS-3 type) of V-4Cr-4Ti in a Mo capsule wasconducted and post-test characterization illustrates some of the potential problems in interpreting results.After exposure for 1000h at 800°C and cleaning in methanol for 24h, each of the specimens remainedshiny but showed an unexpected mass gain, Figure 2. More importantly, the room temperature ductilitydropped from a total elongation of ~30% before the test to 0-5% after exposure, Figure 2. A similarembrittlement was observed after 1050h at 700°C in Nb capsules but the Li contained 2500ppmw N in thatcase [8]. In Li at this temperature, the V-4Cr-4Ti alloy should getter C and N from the Li and lose O[9,10].Table 1 provides the chemistry of the Li before and after the test. No dissolution of V, Cr or Ti was detectedafter the test although an unexpectedly high Mo content was detected and the O content of the Liincreased. A mass loss of 0.05mg/cm2 would be expected if the Li gettered 300ppmw O from eachspecimen (which has a reported starting O content of 310ppmw[11]). However, if all of the N and C in theLi were absorbed by the three specimens, a 0.14mg/cm2 mass gain would be expected. The net massgain of 0.09mg/cm2 is somewhat consistent with the observations. Unfortunately, the chemical analysisof the Li was not accurate enough to quantify the post-test C and N contents and the specimen massesare not sufficiently large to directly measure the uptake of N, O, C and H (due to cleaning in methanol)after exposure. The N and C uptake could lead to embrittlement due to the formation of internal nitridesor thermodynamically stable X-Li-N compounds[12].
Another source of mass gain could be from mass transfer of Mo from the capsule wall to the specimen,
Figure 1. Schematic representation of a flow channel insert made with vanadium foils covering a layer ofhigh resistivity oxide.
Flowing Lithium
V-4Cr-4TiChannel wall
V or V alloy100µm foils
welded seam
SprayedY2O3 or Er2O3
Coating
85
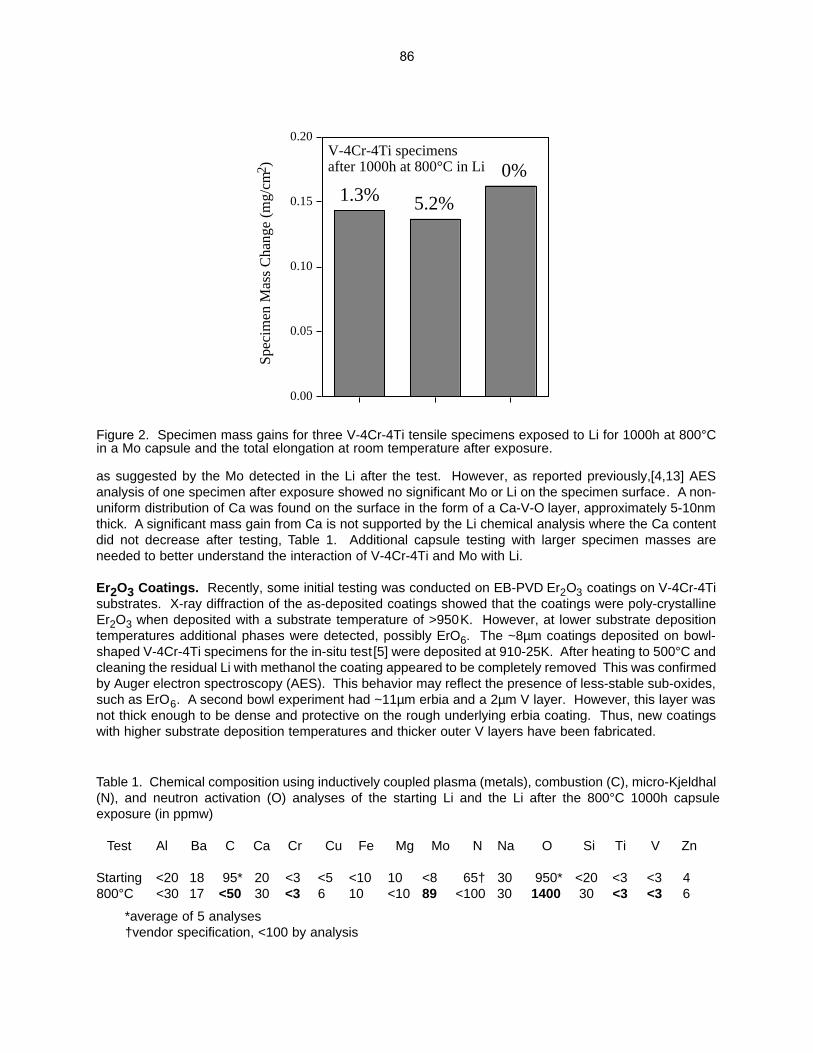
as suggested by the Mo detected in the Li after the test. However, as reported previously,[4,13] AESanalysis of one specimen after exposure showed no significant Mo or Li on the specimen surface. A non-uniform distribution of Ca was found on the surface in the form of a Ca-V-O layer, approximately 5-10nmthick. A significant mass gain from Ca is not supported by the Li chemical analysis where the Ca contentdid not decrease after testing, Table 1. Additional capsule testing with larger specimen masses areneeded to better understand the interaction of V-4Cr-4Ti and Mo with Li.
Er2O3 Coatings. Recently, some initial testing was conducted on EB-PVD Er2O3 coatings on V-4Cr-4Tisubstrates. X-ray diffraction of the as-deposited coatings showed that the coatings were poly-crystallineEr2O3 when deposited with a substrate temperature of >950K. However, at lower substrate depositiontemperatures additional phases were detected, possibly ErO6. The ~8µm coatings deposited on bowl-shaped V-4Cr-4Ti specimens for the in-situ test [5] were deposited at 910-25K. After heating to 500°C andcleaning the residual Li with methanol the coating appeared to be completely removed This was confirmedby Auger electron spectroscopy (AES). This behavior may reflect the presence of less-stable sub-oxides,such as ErO6. A second bowl experiment had ~11µm erbia and a 2µm V layer. However, this layer wasnot thick enough to be dense and protective on the rough underlying erbia coating. Thus, new coatingswith higher substrate deposition temperatures and thicker outer V layers have been fabricated.
Table 1. Chemical composition using inductively coupled plasma (metals), combustion (C), micro-Kjeldhal(N), and neutron activation (O) analyses of the starting Li and the Li after the 800°C 1000h capsuleexposure (in ppmw)
Test Al Ba C Ca Cr Cu Fe Mg Mo N Na O Si Ti V Zn
Starting <20 18 95* 20 <3 <5 <10 10 <8 65† 30 950* <20 <3 <3 4800°C <30 17 <50 30 <3 6 10 <10 89 <100 30 1400 30 <3 <3 6
*average of 5 analyses†vendor specification, <100 by analysis
0.00
0.05
0.10
0.15
0.20
Spec
imen
Mas
s C
hang
e (m
g/cm
2 )
V-4Cr-4Ti specimensafter 1000h at 800°C in Li
1.3% 5.2%
0%
Figure 2. Specimen mass gains for three V-4Cr-4Ti tensile specimens exposed to Li for 1000h at 800°Cin a Mo capsule and the total elongation at room temperature after exposure.
86
References[1] B. A. Pint, P. F. Tortorelli, A. Jankowski, J. Hays, T. Muroga, A. Suzuki, O. I. Yeliseyeva, and V.M. Chernov, J. Nucl. Mater. 329-333 (2004) 119.[2] I. Cook et al., Fus. Sci. Technol. 47 (2005) 384.[3] L. Barleon, V. Casal, and L. Lenhart, Fusion Eng. Des. 14 (1991) 401.[4] B. A. Pint, P. F. Tortorelli, L. D. Chitwood, H. M. Meyer, and M. Fujiwara, DOE-ER-0313/36 (2004) 76.[5] B. A. Pint, K. L. More, J. L. Moser, A. Jankowski, and A. Suzuki, DOE-ER-0313/37 (2005) 101.[6] B. A. Pint, J. L. Moser, and P. F. Tortorelli, Fusion Science and Technology (in press).[7] B. A. Pint, L. D. Chitwood, and J. R. DiStefano, J. Nucl. Mater. 289 (2001) 52.[8] V. A. Evtikhin, I. E. Lyublinski, V. Y. Pankratov, and L. P. Zavyalski, J. Nucl. Mater. 191-194 (1992) 924.[9] O. K. Chopra and A. B. Hull, Fus. Technol. 15 (1989) 309.[10] J. R. DiStefano, Oak Ridge National Laboratory report #3551, Oak Ridge, Tenn. (1964).[11] D. L. Smith, H. M. Chung, B. A. Loomis, and H.-C. Tsai, J. Nucl. Mater. 233-237 (1996) 356.[12] P. Hubberstey and P. G. Roberts, J. Nucl. Mater. 155-157 (1988) 694.[13] B. A. Pint, K. L. More, H. M. Meyer, and J. R. DiStefano, Fus. Sci. Technol. 47 (2005) 851.
87

8.0 BREEDING MATERIALS
88
COMPATIBILITY ISSUES FOR Pb-Li SYSTEMS – B. A. Pint, P. F. Tortorelli, and J. L. Moser (Oak RidgeNational Laboratory)
OBJECTIVE
The objective of this task is to assess the long-term, high-temperature compatibility of various materialswith Pb-Li. One proposed fusion reactor concept uses SiC/SiC composites with a self-cooled Pb-17Liblanket. Another concept uses a SiC/SiC flow channel insert with a dual coolant of He and Pb-Li at~800°C. This concept also requires tubing material to carry the Pb-Li between the first wall and the heatexchanger. As a first step in the evaluation process, monolithic SiC and potential tubing and coatingmaterials are being exposed to Pb-17Li in capsule tests at 700°-1200°C.
SUMMARY
Several long-term capsule tests with high-purity SiC specimens have recently been completed. Thespecimen mass showed little change after various times at 800°, 1100° and 1200°C. After 2,000h at1100°C, a low level of Si was detected in the Pb-17Li after the test. A number of Al-containing alloys werescreened for 1000h at 700°C in PbLi in order to confirm the role of Al in protecting Fe- or Ni-base alloysagainst dissolution. The dissolution rates for 316SS were significantly higher than those for the Al-containing alloys, including Ni-42.5at.%Al, which showed the lowest mass loss in the test.
PROGRESS AND STATUS
Introduction
Among the proposed fusion reactor concepts, silicon carbide composites are a structural material optionthat is thought to allow the highest reactor operating temperature (1000°-1100°C) and thus the highestoperating efficiency.[1,2] Both the TAURO and ARIES-AT proposals have Pb-17at.%Li self-cooledblankets which are attractive because the Pb-17Li acts as coolant, neutron multiplier and tritiumbreeder.[3] (The eutectic Pb-Li composition was chosen because it has a low melting point of 235°C.)Another concept uses SiC/SiC composite flow channel inserts with a dual coolant blanket based onARIES-ST.[4] The insert serves as an electrical and thermal insulator between Pb-Li at 800°C and He-cooled ferritic steels. This concept also requires corrosion resistant tubing to carry the Pb-Li between thefirst wall and the heat exchanger. Contact of Fe-base, or particularly Ni-base, alloys with flowing Pb-Li atthis temperature would result in unacceptably high dissolution rates[5-7]. While refractory metals are oneoption to transport Pb-Li outside the first wall [8], fabrication and durability of Nb or Mo tubing could be anissue. An alternative is to consider corrosion resistant coatings for conventional Fe- or Ni-base alloys thatwould have sufficient strength to operate at ≤700°C. Since the activity of Li in Pb-17Li is greatly reduced(1.2x10⁻⁴ at 500°C)[9], both thermodynamic calculations [10] and experimental results [11] suggest thataluminide coatings (or Al containing alloys) could be protective, but little experimental work has beenperformed above 450°-600°C. Present assessments of the materials feasibility for both of these strategiesare incomplete because there is little information available on the high temperature compatibility with Pb-Li at temperatures of 700°C and higher.
To complement prior work on SiC,[12-14] an initial series of static Pb-17Li capsule tests were performedon high-purity (99.9995%) chemical vapor deposited (CVD) β-SiC specimens and the experimentalprocedure and results are detailed elsewhere.[15,16] (These experiments used monolithic SiC specimensinstead of composites as a first step towards evaluating SiC compatibility to avoid the microstructural andmicrochemistry complexities of composites) To avoid unwanted reactions of the capsule with Pb-Li, theSiC specimens were contained in CVD SiC capsules. After 1000h at 800°C, no wetting was observedbetween Pb-Li and SiC and therefore no chemical attack would be expected. At 1100°C, there was
89
evidence of only limited wetting after 1000h. After cleaning the specimens, no mass change wasmeasurable at either temperature suggesting that SiC is compatible with static Pb-17Li to at least 1100°C.In both cases, no Si was detected in the Pb-Li after the test.[17] To follow up on these results, longerexperiments were initiated at 800° and 1100°C and a 1000h test was conducted at 1200°C. Capsule testsalso were initiated at 700°C to evaluate the role of Al in protecting Fe- and Ni-base alloys.
Results
CVD SiC Specimens. Three new capsule experiments with CVD SiC inner capsules and specimenshave recently been completed. After the capsule was opened, the specimens were cleaned with a mixtureof acetic acid, hydrogen peroxide and ethanol for 24-72h. The mass changes for these experiments areshown in Table 1 along with the results from the prior experiments. In most cases, the slight mass gainsand losses are not statistically significant. The exception is the mass gain for the specimen after 5,000hat 800°C. This specimen will be examined more carefully for possible penetrations or surface reactions.(For the previous two specimens (1000h at 800° and 1100°C), only a layer of C and some residual nativeoxide was detected by Auger electron spectroscopy. Small amounts of Pb and Li were detected on thespecimen surfaces using x-ray photoelectron spectroscopy (XPS).) At the higher temperatures, morewetting of the Pb-Li was observed, as expected. The breakdown of a native SiO2 surface layer at longertimes and higher temperatures may be responsible. Prior work indicated that extended incubation periodswere needed to develop wetting between stainless steel and mercury.[18]
At present, only the Pb-Li from the 2,000h/1100°C capsule has been analyzed and these results are shownin Table 2 along with the prior results. (The variation in Li may be an experimental error. It is magnifiedby the conversion from mass%.) For the most recent experiment, 185ppma Si was detected in the Pb-Li.This is still significantly less Si than was detected by microprobe analysis (350ppmw) after an 800°Cexposure by Kleykamp.[13] However, the C content did not increase compared to the shorter test. Theother major impurities detected were O and N with low levels of some metals, Table 2. These resultssuggest that monolithic, high-purity SiC is compatible with Pb-17Li to at least 1200°C in a staticenvironment. More interaction may be expected with SiC-base fibers or the fiber-matrix interface.However, it is anticipated that a dense CVD SiC seal coat will cover the outer layer of any SiC compositecomponents. To study the compatibility of SiC/SiC composites, specimens were recently fabricated by B.Riccardi (ENEA, Italy) and sent to ORNL for capsule exposures.
Metallic Specimens. Few Al-containing alloys have good strength at 700°-800°C except for oxidedispersion strengthened (ODS) FeCrAl. Thus, aluminide coatings may be needed for higher strengthconventional alloys. One concern about coatings on Ni-base alloys or even 300-series stainless steels(e.g. type 316, Fe-20at%Cr-10%Ni) is that the outer coating will contain some Ni-rich aluminide [19] andNi preferentially dissolves in Pb-Li. Another concern was the method for conducting the capsule test.Traditionally, the capsule was made from the same material as the specimen to eliminate the possibility ofdissimilar metal interaction.[20] However, it would be difficult to aluminize an entire capsule. Therefore,a standard capsule material might be useful.
Table 1. Mass change of CVD SiC specimens after exposure in Pb-17Li
Temperature Time Mass Change(mg) (mg/cm2)
800°C 1,000h -0.02 ±0.04 -0.01 ±0.015,000h +0.10 +0.03
1100°C 1,000h -0.02 -0.012,000h +0.02 +0.01
1200°C 1,000h +0.04 +0.01
90
A series of experiments was designed to begin assessing some of these issues. Specimens of type 316stainless steel (Table 3) were exposed for 1000h at 700°C to Pb-17Li in three different capsule materials,type 316, low carbon steel and Mo. Also, several Al-containing alloys, Fe3Al, NiAl and ODS FeCrAl(Plansee alloy PM2000) were exposed under the same conditions using Mo capsules. (The aluminideswere selected as representative of the CVD coating composition and ODS FeCrAl was selected becauseit could potentially be used as a tube material without coating.) The 1.5mm thick specimens had a surfacearea of 4-5cm2 and all were polished to a 600grit SiC finish prior to exposure and were not pre-oxidized.The same high purity Pb and Li materials was used as in the previously described experiments, Table 2,and the same cleaning procedure was used.
Mass changes from the initial capsule experiments are shown in Table 4 and the chemical analysis for thePb-Li after test are shown in Table 5. The lowest mass loss for a 316SS specimen was in the 316SScapsule. This can be understood based on the fundamental flux equation governing dissolution in a liquidmetal like Pb-Li:
Ji = k (CiS-Ci) [1]
where Ji is the flux of species i into (positive) or from (negative) the liquid metal, CiS is the solubility of i in
the Pb-Li and C i is the instantaneous concentration of i in the liquid. In a capsule experiment, dissolutioncontinues until the liquid metal is saturated, i.e. Ci
S = Ci. Therefore, with a 316SS capsule, the predominantdissolution of Ni and Cr would reach saturation quickly due to the large surface area of the capsule itself(relative to the specimen). This correlates well with the high levels of Ni, Mn and Cr observed in the Pb-Li from this capsule, Table 5. In contrast, with a Fe or Mo capsule all of the Ni and Cr needed to reachsaturation would come from the 316SS specimen. Thus the higher mass losses for these tests areexpected. However, the measured mass change also may be affected by dissimilar metal transfer to thespecimen surface or to the capsule wall. In general, Mo was not detected in the Pb-Li after these tests sothis is not expected to be a problem. Additional characterization of the specimens and capsule material
Table 3. Alloy chemical compositions (atomic% or ppma) determined by inductively coupled plasma analysis and combustion analysis
Material Fe Ni Cr Al O C N S Other316SS 65.1 8.9 19.9 0.02 490 3360 2380 68 1.94Si,1.67Mn,
1.38Mo,0.21CuODS FeCrAl 67.8 0.02 20.0 10.6 7430 340 210 50 0.44Ti,0.23Y
0.04Si, 0.04MnFe-28Al-2Cr+Zr 70.0 < 2.0 27.9 70 400 < 46 0.026Zr, 0.005HfNi-42.5Al < 57.3 < 42.6 40 380 < < < < indicates below the detectability limit of <0.01% or <0.001% for interstitials
Table 2. Chemical composition using inductively coupled plasma and combustion analysis of the startingPb and the Pb-Li after capsule exposures at the indicated temperatures for 1000h (in ppma except for Li in atomic%)[12]
Test Li Si C O N Al Cr Fe Mo Ni YStarting n.d. <40 <170 1270 <40 <8 <4 <4 <2 <4 <21000h exposure800°C 17.49% <30 1850 4090 100 6 <3 6 <2 <3 <2
1100°C 16.27% <30 1160 3550 90 <6 <3 6 <2 <3 <22000h exposure1100°C 15.99% 185 1025 7890 200 <60 <30 <30 <20 <30 <20
91

will help to determine the extent of any such interactions.
All of the Al-containing materials showed relatively low specimen mass losses despite the use of Mocapsules. Based on thermodynamic calculations [10], it is likely that the addition of Al results in theformation of a protective Al2O3 layer by gettering O from the Pb-Li. (The higher levels of O and N in thePb-Li after exposure may reflect contamination during specimen collection or handling after the test, Table5.) Initial characterization by scanning electron microscopy equipped with energy dispersive x-ray analysisconfirmed that Al-rich oxide layers are present. In view of the high solubility of Ni in Pb-Li, it was surprisingthat the specimen of NiAl showed the lowest mass loss, Table 4. However, this material had the highestAl content (Table 3) and possibly was able to form a protective alumina layer more easily than the othermaterials. The high level of Fe in the Pb-Li from this capsule is unexplained. Additional characterizationof these specimens is underway. The next series of capsule experiments will examine CVD-coated 316and pre-oxidized Al-containing alloys.
For both liquid metal systems, future work will eventually need to include flowing liquid metal experimentswith a temperature gradient. Static capsule experiments can only be expected to produce a limited pictureof the compatibility issue where saturation of one or more of the dissolving components can inhibit furtherreaction, Eqn. 1. However, the observation of little or no detectable Si in the Pb-Li and low mass lossesfor the Al-containing materials are promising results for candidate materials in the Pb-Li system.
Table 5. Chemical composition using inductively coupled plasma and combustion analysis of the startingPb and the Pb-Li after capsule exposures at the indicated temperatures for 1000h (in ppma except for Li in atomic%)
Test Li Fe Cr Ni Mn Si Al Mo C O N SStarting n.d. <4 <4 <4 <4 <40 <8 <2 <170 1270 <40 <50316SS (SS) 16.4% 60 160 740 380 <60 <60 <20 1420 4810 160 320316SS (FS) 17.3% 30 <30 90 30 <60 <60 <20 970 3346 40 110316SS (Mo) 17.4% <30 <30 90 <30 <60 <60 <20 1590 7440 60 903FeCrAl (Mo) 17.9% 30 <30 <60 <30 <60 <60 <20 1260 4140 90 370Fe3Al (Mo) 16.5% <30 <30 <60 <30 <60 <60 <20 1520 14860 320 110NiAl (Mo) 18.2% 840 <30 30 <30 <60 <60 20 1200 10310 370 1100
Table 4. Mass change of specimens after 1000h at 700°C in Pb-17Li
Specimen Capsule Mass Change(mg) (mg/cm2)
316SS 316SS -3.1 -0.67316SS Fe -26.2 -5.72316SS Mo -17.4 -3.79ODS FeCrAl Mo -1.4 -0.20Fe-28Al-2Cr+Zr Mo -1.0 -0.25Ni-42.5Al Mo -0.4 -0.09
92
References[1] A. Hasegawa, A. Kohyama, R. H. Jones, L. L. Snead, B. Riccardi, and P. Fenici, J. Nucl. Mater.283-287 (2000) 128.[2] R. H. Jones, L. Giancarli, A. Hasegawa, Y. Katoh, A. Kohyama, B. Riccardi, L. L. Snead, and W.J. Weber, J. Nucl. Mater. 307-311 (2002) 1057.[3] A. R. Raffray et al., Fusion Eng. Des. 55 (2001) 55.[4] P. Noajitra, L. Buhler, U. Fischer, S. Malang, G. Reimann, and H. Schnauder, Fusion Eng. Des.61-62 (2002) 449.[5] O. K. Chopra, D. L. Smith, P. F. Tortorelli, J. H. DeVan, and D. K. Sze, Fusion Technol. 8 (1985)1956.[6] S. J. Zinkle and N. M. Ghoniem, Fusion Eng. Des. 51-52 (2000) 55.[7] J. Konys, W. Krauss, Z. Voss, and O. Wedemeyer, J. Nucl. Mater. 329-333 (2004) 1379.[8] H. Feuerstein, H. Gräbner, J. Oschinski, and S. Horn, J. Nucl. Mater. 233-237 (1996) 1383.[9] P. Hubberstey, J. Nucl. Mater. 247 (1997) 208.[10] P. Hubberstey, T. Sample, and A. Terlain, Fusion Technol. 28 (1995) 1194.[11] H. Glasbrenner, J. Konys, Z. Voss, and O. Wedemeyer, J. Nucl. Mater. 307-311 (2002) 1360.[12] F. Barbier, Ph. Deloffre, and A. Terlain, J. Nucl. Mater. 307-311 (2002) 1351.[13] H. Kleykamp, J. Nucl. Mater. 321 (2003) 170.[14] H. Kleykamp, J. Nucl. Mater. 283-287 (2000) 1385.[15] B. A. Pint, L. D. Chitwood, and J. R. DiStefano, DOE/ER-0313/35 (2003) 13.[16] B. A. Pint, K. L. More, H. M. Meyer, and J. R. DiStefano, Fusion Sci. Technol. 47 (2005) 851.[17] B. A. Pint and J. L. Moser, DOE-ER-0313/37 (2005) 9.[18] S. J. Pawel, ORNL/TM-2002/280, Oak Ridge National Laboratory, Oak Ridge, Tenn. (2002).[19] Y. Zhang, B. A. Pint, J. A. Haynes, I. G. Wright, and P. F. Tortorelli, Oxid. Met. 62 (2004) 103.[20] P. F. Tortorelli and J. H. DeVan, J. Mater. Energy Syst. 4 (1982) 78.
93

9.0 RADIATION EFFECTS, MECHANISTIC STUDIES,AND EXPERIMENTAL METHODS
94
AN IN-SITU HE IMPLANTER APPROACH TO IRRADIATIONS WITH CONTROLLED HE/DPA RATIOS AT FUSION RELEVANT CONDITIONS—T. Yamamoto, G. R. Odette (University of California, Santa Barbara), and L. R. Greenwood (Pacific Northwest National Laboratory) OBJECTIVE This research is aimed at designing and implementing a novel method for in-situ He implantation in mixed spectrum reactor irradiations at controlled and fusion relevant He/dpa ratios and dpa rates. The implantation of He from 6Li(n,α) reactions into and through vanadium alloy substrate insulator coatings in fusion neutron spectra is also examined. SUMMARY The design and implementation of a novel in-situ He-implanter technique, utilizing the 59Ni(n,α) reaction, to characterize the effect of the He/dpa ratio on microstructural evolution and changes in the flow properties for fusion relevant alloys and conditions (dpa, dpa rate, and temperature) is described. Irradiations (JP-26, JP27, and JP28/29) in the peripheral target (PTP) positions in the High Flux Isotope reactor (HFIR) result in α-implantation from thin layers of NiAl into adjacent iron based alloys, yielding a region of uniform He concentration of 5 to 50 appm He/dpa to a depth of 5 to 8 µm. Electron beam co-deposition of Al and Ni was used to produce 1 to 5 µm thick NiAl coatings on TEM discs. The NiAl coatings were characterized by a number of techniques. The He-implantation technique was applied to three types of materials: cold worked and annealed unalloyed Fe, ≈ 8Cr tempered martensitic steels (TMS) and nano-dispersion strengthened ferritic alloys (NFAs). Other approaches to, and applications of, in-situ He implantation are also described. Our primary objective is to assess He transport, fate and consequences, as well as He management by trapping at nanoscale precipitate interfaces. We also examine He implantation from Li in fusion neutron spectra into and through insulator coatings on vanadium alloy substrates. Introduction Predicting and mitigating the effects of combinations of large levels of transmutation product He and displacement damage (dpa) produced by high energy neutrons on the mechanical properties of structural materials is one of the key challenges in the development of fusion energy. Indeed there the fundamental overriding questions about He-dpa synergisms include:
What is the transport and fate of He and displacement damage defects and the consequential effects on microstructural evolutions and mechanical property changes? What are the basic interacting mechanisms controlling He and defect transport, fate, and consequences? How is He and defect transport, fate, and consequences influenced by the combination of the starting microstructure (and microchemistry) of the material and irradiation variables (dpa rate, He/dpa ratio, temperature, and applied stress) and variable history? How can the detrimental effects of He-dpa synergisms be mitigated and managed, primarily by proper design of the materials starting microstructure?
Indeed, understanding the effects of He-dpa synergisms on microstructural evolutions and property changes under fusion relevant conditions (He/dpa ≈ 10 appm/dpa, 10-6 dpa/s) is the primary motivation for proposals to construct a high-energy fusion neutron source, such as the IFMIF. However, in the meantime, it will be necessary to utilize fission reactor and dual ion irradiations to study He-dpa synergisms. Dual ion irradiations are useful to explore mechanisms, but they do not simulate fusion conditions because of their highly accelerated dpa rates and other confounding factors, such as the
95
proximity of free surface sinks. To date, most fission reactor studies of He-dpa synergisms have utilized 59Ni and 10B (n,α) ‘alloying element’ reactions to produce high levels of He. However, with the exception of austenitic stainless steels, neither Ni nor B constitutes a normal alloying element in candidate fusion structural material systems (≈ 8Cr tempered martensitic steels, nano-dispersion strengthened ferritic alloys, solid solution vanadium alloys, and SiC/SiC ceramic composites). Thus, while artificially adding Ni or B, combined with isotopic and/or spectral tailoring, is very useful, these techniques cannot be considered simulations either, since doping introduces a significant number of confounding factors. It is also noted that spallation proton irradiations produce ultra-high levels of He at rates of ≈ 80 to 150 appm/dpa. In-situ He implantation in fission reactors is an alternative and very attractive approach to assessing the effects of He-dpa synergisms that avoids most of the confounding effects of doping. The basic idea is to use an implanter foil to inject high-energy α-particles from (n,α) reactions into an adjacent sample undergoing displacement damage. Implanting He using the decay of an α-emitting radioactive isotope adjacent to the target specimen was first proposed in the late 1970s to early 1980s [1,2]. However, the isotope decay technique produces few dpa and, thus, a very high He/dpa ratio. Different variants of a He implanter foil technique utilizing (n,α) reactions from triple fission [3] (to exploit the high α-energy) and 59Ni-type isotope reactions reaction [3,4] to produce fusion relevant He/dpa ratios in virtually any material of choice were first proposed in the mid-to-late 1980s. The triple fission technique was applied a tensile specimen of a ferritic steel [5]. However, this experiment was not completely successful due to difficulties in controlling temperature increases arising from heat generated by the fission reaction, as well as in obtaining the desired He/dpa ratio. An implanter approach based on the 59Ni(nth,α) reaction is much simpler to implement. However, this idea lay dormant for many years, but was resurrected by our group at UCSB in the early part of planning for a series of HFIR experiments that form the core of the US-JAERI fusion materials collaboration. We decided that a thin µm-scale Ni containing coating layer on TEM discs would serve as a good implanter foil. In this case, He is implanted uniformly over ≈ 5 to 8 µm layer. This is sufficiently thick for low load Vickers micro-hardness and nano-hardness measurements, as well as for extensive microstructural characterization. Hence, the objective of the initial phase of this research was to design, develop, and implement a technique to deposit and characterize Ni containing implanter foils on TEM discs to be included in coated-uncoated pairs in the HFIR-PTP irradiations, with nominal peak target doses of 10, 25, and 60 dpa at irradiation temperatures of 300, 400, and 500°C. Implanter Foil Design Concepts There are three basic approaches to implanter foil design. Here we will refer to thin and thick, specifically meaning a specimen (ts) or implanter foil (tf) thickness that is less than or greater than the corresponding α-particle range, respectively. Thin foils produce uniform implantation at a selected, implanter foil thickness-dependent He/dpa ratio. Thick implanter foils on one side of a thick specimen produce linear concentration profiles, with the maximum concentration of He at the specimen surface. Thick implanter foils on both sides of a thin specimen also produce a uniform concentration profile at the maximum concentration of He. In this section, the conceptual design of a thin implanter foil is first summarized, followed by a description of the actual fabrication and characterization of NiAl coatings on TEM discs to attain controlled fusion relevant He/dpa ratios in the JP26 to JP28/29 experiments. He Implantation Profiles The implanter foil contain an isotope with a large (n,α) reaction cross section, such as 59Ni, 10B, 6Li, producing an α-particle with characteristic energy and corresponding range in the foil and sample of Rf and Rs, respectively. Figure 1a shows thick specimen, thick implanter foil configuration. The α-particles emitted from the foil under neutron irradiation are deposited in the specimen up to the depth of Rs. All calculations in this section assume the area (y, z) dimensions of the implanter foil-specimen are much larger than Rf,, hence, edge effects can be neglected. For simplicity, we first assume Rf = Rs = R and
96

ignore α-particle straggling. The He concentration, CHe, at a depth x (x < R) in the specimen is proportional to the area fraction, f(x), of the spherical shell in the implanter foil of radius, R, centered on x, as shown in Fig. 1b. The f(x) is given by: (1) θ
Here θ is the angle between the radial vector R and the normal to the specimen surface and θmax occurs at the implanter foil/specimen boundary. The resulting He concentration profile is linear, with f(x) decreasing from 1/2 at x = 0 to 0 at x = Rs. Difference in the implanter foil versus specimen α-particle ranges, Rf and Rs, are accounted for by a range ratio factor of Rf/Rs, and CHe(x) is given by: (2) Here Cf is the volumetric concentration of He in the implanter foil which is the same as the bulk concentration for a given implanter foil composition and neutron dose. The corresponding molar (or atomic) concentration cf must be adjusted by multiplying Cf by the ratio of the foil/specimen atomic densities (N), Nf/Ns. Fig. 1. Schematic illustration of a) a thick implanter foil; b) the implanter source volume for He deposited at a depth x in the specimen; c) the He concentration profile for thick foil implantations from one side of a thick specimen; and d) the uniform He concentration profile for thick foil implantations from both sides of a thin specimen (in this case with ts = 2Rs). The gradient in the He concentration may be acceptable, or even advantageous, in some cases. However, in others a uniform He distribution is preferable. As noted above regions with uniform concentrations can be obtained using thin specimens implanted from both sides. However there are practical difficulties in fabricating such thin specimens. Fortunately, as illustrated in Fig. 2a, a uniform distribution of He near the surface of a thick specimen can also be obtained by using thin implanter foils, with tf << R. The He profile for a thin implanter can be determined by simply superimposing linear profiles from various depths in the foil, after subtracting off the missing contributions from the (n,α) reactions further from the interface. For Rf = Rs = R, the result is a uniform region of He concentration of CHe(x) = [Cf/2][tf/R] up to a maximum xm = R - tf. At larger x > R - tf the CHe(x) decreases from [Cf/2][tf/R] to 0 at x = R. In the case where Rf ≠ Rs the xm = Rf(1 - tf/Rs). Thus,
f (x) = 2πRsinθ0
max
∫ • Rdθ 4πR2 =21 1−
Rx⎛ ⎞
⎝ ⎜
⎠ ⎟
nth
Ni (B, Li. Cu) implanter
specimen
nth
α
α a.
implanter
R
specimen
x dθ
b.
0 θ
0 x
Rs
Cmax =C f
2R f
Rs
CHe c.
0x
Rs
C He =C f
2Rf
Rs
CHe d.
CHe x( )=C f
2Rf
Rs
1−Rs
x⎛
⎝ ⎜
⎞
⎠ ⎟
97

CHe(x) =
C f
2t f
Rs
0 ≤ x ≤ xm( )
C f
2Rf
Rs
1−xRs
⎛
⎝ ⎜
⎞
⎠ ⎟ (xm < x < Rs)
⎧
⎨ ⎪ ⎪
⎩ ⎪ ⎪
(3)
As illustrated in Fig. 2b, implantation from thin foils on both sides of the specimen with ts = 2Rs - xm result in a uniform helium concentration.
xm0 x
Rs
Cmax = C f t f Rs 2
CHe
t f
a.
2Rt-xm
CHe b. x Fig. 2. Schematic illustration of the CHe(x) for thin implanter foils on: a) a single side; b) both sides. The key conclusions from this analysis are: 1. Various He profiles in a specimen can be produced with combinations of one or two-sided thick or
thin implanter foil and specimen combinations. 2. Uniform helium concentrations can be produced over useful regions of a specimen by thin foil
implantation from one side. 3. The concentration of He in a specimen can be controlled by both the thickness and composition
(coupled with the neutron spectrum) of a thin implanter foil. Thus it is possible to control (dial-in) the corresponding He/dpa ratio over a wide range of values.
4. Thin foil implantation from two sides of a thin specimen roughly doubles the size of the region with a
uniform He concentration. 5. In principle the implanter technique is optimized by using (n,α) reactions with the highest α-particle
energy possible. For example, the triple 235U fission produces α-particles with a typical energy of ≈ 16 MeV corresponding to a range of ≈ 60 µm in Fe and a maximum thin specimen thickness up to ≈ 60 µm [3]. This dimension is sufficient for specialized tensile specimen tests, possibly even in the creep regime. Further, while the dimensions are far too small for measuring fast fracture properties, they may be sufficient to measure fast fracture related processes and mechanisms, such as weakening of grain boundaries due to He accumulation.
While the implanter foil concept is not new [3,4] the opportunities that it presents, perhaps aptly described as a micro IFMIF, have been neglected for far too long. Thus, in the following section, we describe the detailed design and first implementation of the in-situ implanter technique as part of the JP26 to 29 experiments in HFIR.
98
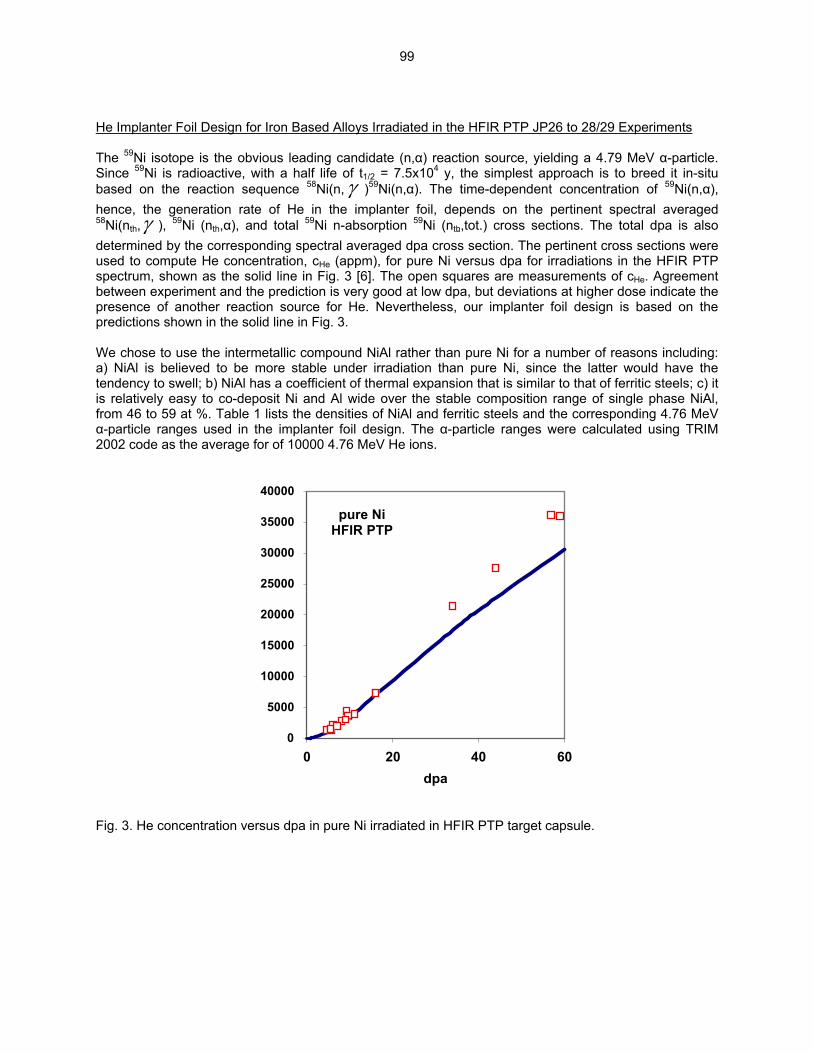
He Implanter Foil Design for Iron Based Alloys Irradiated in the HFIR PTP JP26 to 28/29 Experiments The 59Ni isotope is the obvious leading candidate (n,α) reaction source, yielding a 4.79 MeV α-particle. Since 59Ni is radioactive, with a half life of t1/2 = 7.5x10⁴ y, the simplest approach is to breed it in-situ based on the reaction sequence 58Ni(n, γ )59Ni(n,α). The time-dependent concentration of 59Ni(n,α), hence, the generation rate of He in the implanter foil, depends on the pertinent spectral averaged 58Ni(nth,γ ), 59Ni (nth,α), and total 59Ni n-absorption 59Ni (nth,tot.) cross sections. The total dpa is also determined by the corresponding spectral averaged dpa cross section. The pertinent cross sections were used to compute He concentration, cHe (appm), for pure Ni versus dpa for irradiations in the HFIR PTP spectrum, shown as the solid line in Fig. 3 [6]. The open squares are measurements of cHe. Agreement between experiment and the prediction is very good at low dpa, but deviations at higher dose indicate the presence of another reaction source for He. Nevertheless, our implanter foil design is based on the predictions shown in the solid line in Fig. 3. We chose to use the intermetallic compound NiAl rather than pure Ni for a number of reasons including: a) NiAl is believed to be more stable under irradiation than pure Ni, since the latter would have the tendency to swell; b) NiAl has a coefficient of thermal expansion that is similar to that of ferritic steels; c) it is relatively easy to co-deposit Ni and Al wide over the stable composition range of single phase NiAl, from 46 to 59 at %. Table 1 lists the densities of NiAl and ferritic steels and the corresponding 4.76 MeV α-particle ranges used in the implanter foil design. The α-particle ranges were calculated using TRIM 2002 code as the average for of 10000 4.76 MeV He ions.
pure Ni HFIR PTP
0
5000
10000
15000
20000
25000
30000
35000
40000
0 20 40dpa
60
Fig. 3. He concentration versus dpa in pure Ni irradiated in HFIR PTP target capsule.
99

Table 1. Parameters used for the NiAl implanter foil design
Density of NiAl 5.90 g/cm3
Density of 8Cr-2W steel 7.9 g/cm3
Energy of α-particle from 59Ni(n,α) 4.76 MeV
Range in NiAl 11.5 µm
Range in 8Cr-2W steel 9.1 µm
Nominal He/dpa ratio (for 5 dpa) 5, 10, 20*
Nominal He/dpa ratio for 25 & 60 dpa 10, 20, 50
Figure 4 shows the He concentration profiles in ferritic steel specimens for NiAl implanter foils with tf = 1, 2, and 4 µm for low (4.3 dpa) and high (60 dpa) dose conditions, corresponding to target exposures for the JP-26 and JP-28/29 capsules, respectively. Due to the dose transient to ‘burn-in’ 59Ni to a quasi steady-state concentration, producing an approximately constant He generation rate (see Fig. 3), the He/dpa ratio roughly doubles in going from the lowest to highest dose. Thus implanter foil designs targeting a specified He/dpa ratio must consider the intended dpa dose. There is also a direct trade-off between the implanter foil thickness, or the corresponding region of uniform He composition in the specimen and the maximum He/dpa ratio that can be achieved. Nevertheless, even at the lowest dose irradiation, an average He/dpa ratio of 20 appm He/ dpa can be attained over an ≈ 6 µm thick specimen region. Implanter foil thicknesses of 1, 2, and 4 µm yield He/dpa ratios of ≈ 5, 10, and 20 appm He/ dpa at the target dose of 4.3 dpa for the JP26 capsule. However, rather than trying to make thinner coatings, which are more difficult to characterize, similar implanter foil thicknesses were used in the JP27 experiment, with a target dose of 25 dpa, leading to He/dpa ratios of ≈ 10, 20, and 50 appm He/dpa. The foil thicknesses were slightly reduced in the JP28/29 experiment, with a target dose of 60 dpa, to maintain similar He/dpa ratios of 10, 20, and 50 appm He/dpa.
0
50
100
150
0 2 4 6 8 10 0
50
100
150
0 2 4 6 8
HFIR(TPT)60 dpa
10
t > 11.5 (µm)t = 4 (µm)t = 1.6 (µm)t = 0.8 (µm)
He/
dpa
x (µm)
HFIR(TPT)4.3dpa
NiAl foilt > 11.5 (µm)t = 4 (µm)t = 2 (µm)t = 1 (µm)
He/
dpa
x (µm) Fig. 4. He concentration profiles in ferritic steel specimens for low (4.3 dpa ) and high (60 dpa) dose conditions corresponding to targets for the JP-26 and JP-28/29 capsules, respectively, for NiAl implanter foils with tf = 1, 2, and 4 µm.
100
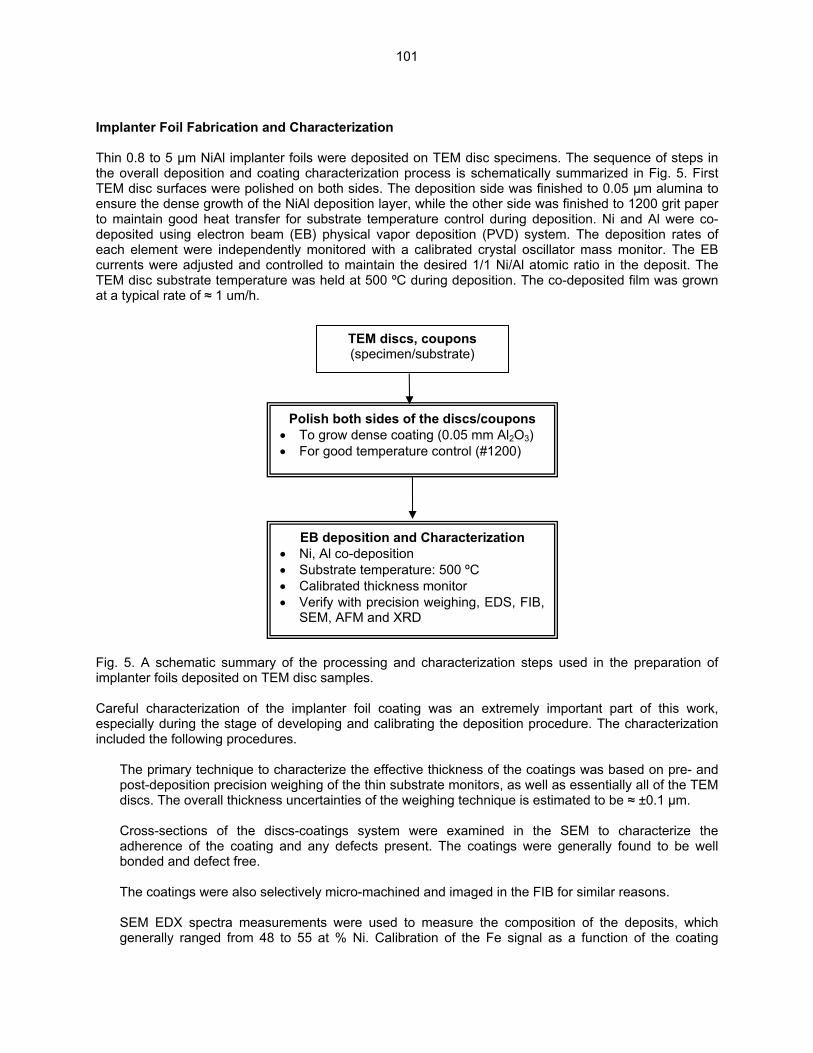
Implanter Foil Fabrication and Characterization Thin 0.8 to 5 µm NiAl implanter foils were deposited on TEM disc specimens. The sequence of steps in the overall deposition and coating characterization process is schematically summarized in Fig. 5. First TEM disc surfaces were polished on both sides. The deposition side was finished to 0.05 µm alumina to ensure the dense growth of the NiAl deposition layer, while the other side was finished to 1200 grit paper to maintain good heat transfer for substrate temperature control during deposition. Ni and Al were co-deposited using electron beam (EB) physical vapor deposition (PVD) system. The deposition rates of each element were independently monitored with a calibrated crystal oscillator mass monitor. The EB currents were adjusted and controlled to maintain the desired 1/1 Ni/Al atomic ratio in the deposit. The TEM disc substrate temperature was held at 500 ºC during deposition. The co-deposited film was grown at a typical rate of ≈ 1 um/h.
TEM discs, coupons (specimen/substrate)
••
••••
Fig. 5. A schematic summary implanter foils deposited on TEM Careful characterization of theespecially during the stage of dincluded the following procedure
The primary technique to chpost-deposition precision wediscs. The overall thickness
Cross-sections of the disadherence of the coating abonded and defect free.
The coatings were also sele
SEM EDX spectra measurgenerally ranged from 48 t
101
Polish both sides of the discs/coupons To grow dense coating (0.05 mm Al2O3) For good temperature control (#1200)
EB deposition and Characterization Ni, Al co-deposition Substrate temperature: 500 ºC Calibrated thickness monitor Verify with precision weighing, EDS, FIB,
SEM, AFM and XRD
of the processing and characterization steps used in the preparation of disc samples.
implanter foil coating was an extremely important part of this work, eveloping and calibrating the deposition procedure. The characterization s.
aracterize the effective thickness of the coatings was based on pre- and ighing of the thin substrate monitors, as well as essentially all of the TEM
uncertainties of the weighing technique is estimated to be ≈ ±0.1 µm.
cs-coatings system were examined in the SEM to characterize the nd any defects present. The coatings were generally found to be well
ctively micro-machined and imaged in the FIB for similar reasons.
ements were used to measure the composition of the deposits, which o 55 at % Ni. Calibration of the Fe signal as a function of the coating
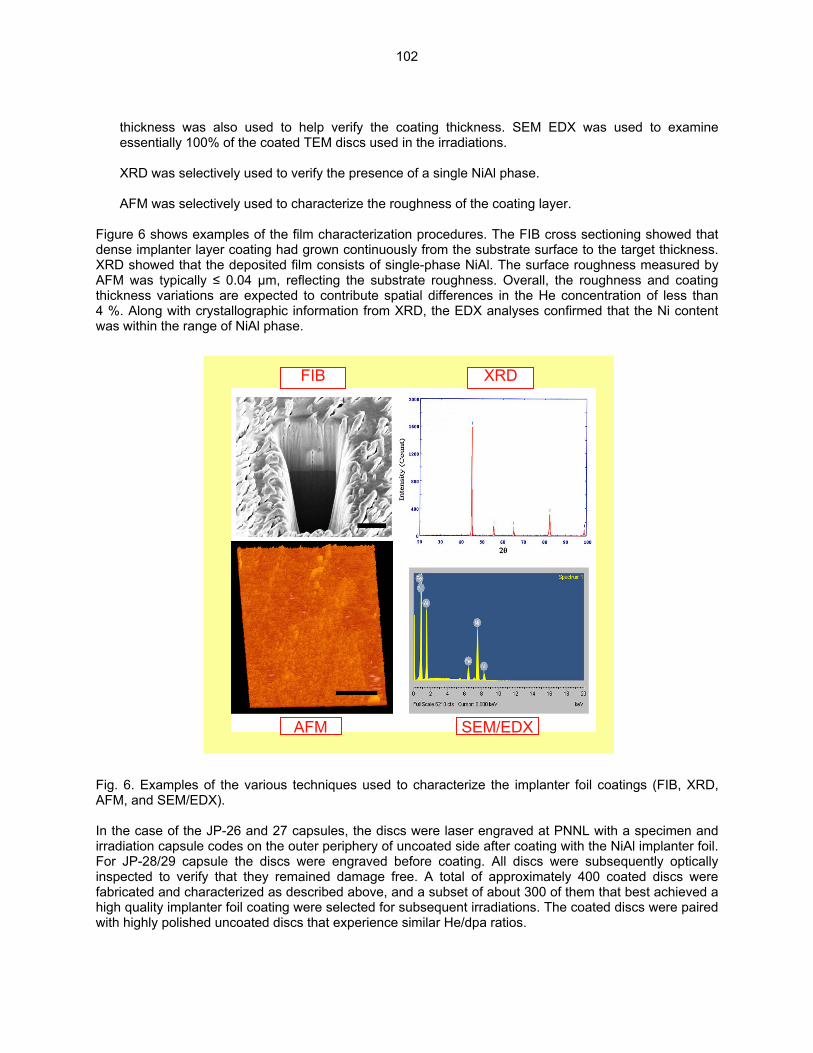
thickness was also used to help verify the coating thickness. SEM EDX was used to examine essentially 100% of the coated TEM discs used in the irradiations.
XRD was selectively used to verify the presence of a single NiAl phase.
AFM was selectively used to characterize the roughness of the coating layer.
Figure 6 shows examples of the film characterization procedures. The FIB cross sectioning showed that dense implanter layer coating had grown continuously from the substrate surface to the target thickness. XRD showed that the deposited film consists of single-phase NiAl. The surface roughness measured by AFM was typically ≤ 0.04 µm, reflecting the substrate roughness. Overall, the roughness and coating thickness variations are expected to contribute spatial differences in the He concentration of less than 4 %. Along with crystallographic information from XRD, the EDX analyses confirmed that the Ni content was within the range of NiAl phase.
AFM
XRD
SEM/EDX
FIB Fig. 6. Examples of the various techniques used to characterize the implanter foil coatings (FIB, XRD, AFM, and SEM/EDX). In the case of the JP-26 and 27 capsules, the discs were laser engraved at PNNL with a specimen and irradiation capsule codes on the outer periphery of uncoated side after coating with the NiAl implanter foil. For JP-28/29 capsule the discs were engraved before coating. All discs were subsequently optically inspected to verify that they remained damage free. A total of approximately 400 coated discs were fabricated and characterized as described above, and a subset of about 300 of them that best achieved a high quality implanter foil coating were selected for subsequent irradiations. The coated discs were paired with highly polished uncoated discs that experience similar He/dpa ratios.
102
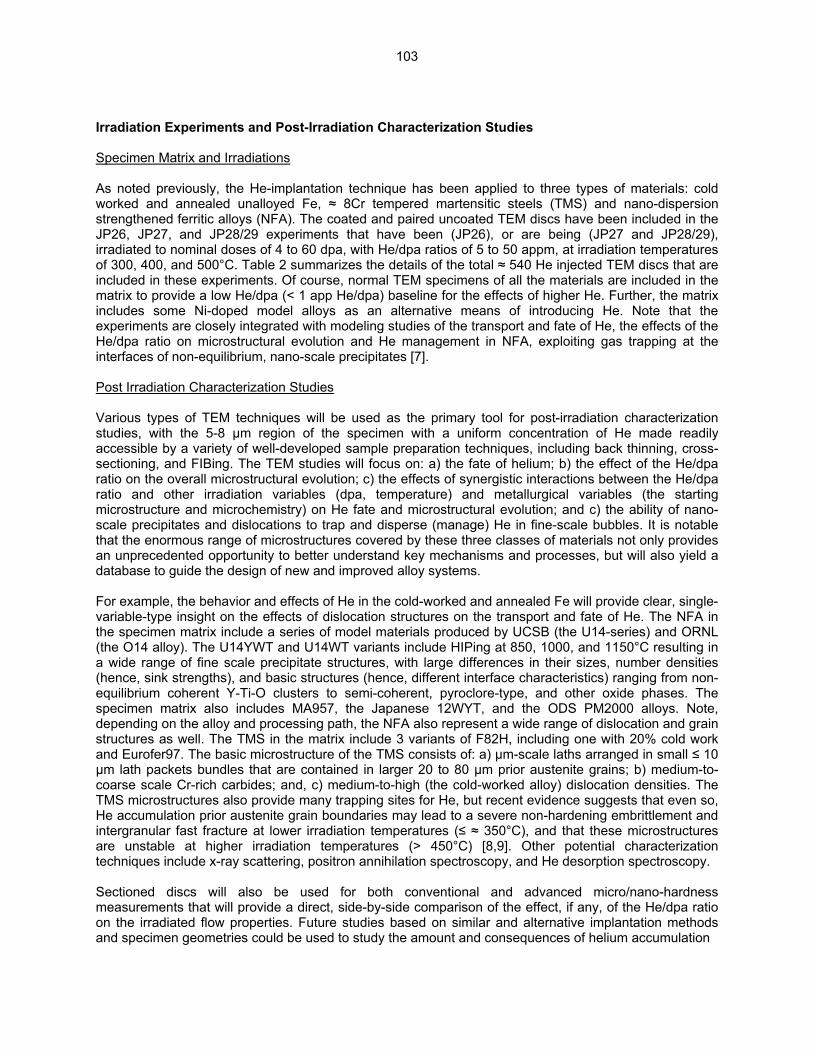
Irradiation Experiments and Post-Irradiation Characterization Studies Specimen Matrix and Irradiations As noted previously, the He-implantation technique has been applied to three types of materials: cold worked and annealed unalloyed Fe, ≈ 8Cr tempered martensitic steels (TMS) and nano-dispersion strengthened ferritic alloys (NFA). The coated and paired uncoated TEM discs have been included in the JP26, JP27, and JP28/29 experiments that have been (JP26), or are being (JP27 and JP28/29), irradiated to nominal doses of 4 to 60 dpa, with He/dpa ratios of 5 to 50 appm, at irradiation temperatures of 300, 400, and 500°C. Table 2 summarizes the details of the total ≈ 540 He injected TEM discs that are included in these experiments. Of course, normal TEM specimens of all the materials are included in the matrix to provide a low He/dpa (< 1 app He/dpa) baseline for the effects of higher He. Further, the matrix includes some Ni-doped model alloys as an alternative means of introducing He. Note that the experiments are closely integrated with modeling studies of the transport and fate of He, the effects of the He/dpa ratio on microstructural evolution and He management in NFA, exploiting gas trapping at the interfaces of non-equilibrium, nano-scale precipitates [7]. Post Irradiation Characterization Studies Various types of TEM techniques will be used as the primary tool for post-irradiation characterization studies, with the 5-8 µm region of the specimen with a uniform concentration of He made readily accessible by a variety of well-developed sample preparation techniques, including back thinning, cross-sectioning, and FIBing. The TEM studies will focus on: a) the fate of helium; b) the effect of the He/dpa ratio on the overall microstructural evolution; c) the effects of synergistic interactions between the He/dpa ratio and other irradiation variables (dpa, temperature) and metallurgical variables (the starting microstructure and microchemistry) on He fate and microstructural evolution; and c) the ability of nano-scale precipitates and dislocations to trap and disperse (manage) He in fine-scale bubbles. It is notable that the enormous range of microstructures covered by these three classes of materials not only provides an unprecedented opportunity to better understand key mechanisms and processes, but will also yield a database to guide the design of new and improved alloy systems. For example, the behavior and effects of He in the cold-worked and annealed Fe will provide clear, single-variable-type insight on the effects of dislocation structures on the transport and fate of He. The NFA in the specimen matrix include a series of model materials produced by UCSB (the U14-series) and ORNL (the O14 alloy). The U14YWT and U14WT variants include HIPing at 850, 1000, and 1150°C resulting in a wide range of fine scale precipitate structures, with large differences in their sizes, number densities (hence, sink strengths), and basic structures (hence, different interface characteristics) ranging from non-equilibrium coherent Y-Ti-O clusters to semi-coherent, pyroclore-type, and other oxide phases. The specimen matrix also includes MA957, the Japanese 12WYT, and the ODS PM2000 alloys. Note, depending on the alloy and processing path, the NFA also represent a wide range of dislocation and grain structures as well. The TMS in the matrix include 3 variants of F82H, including one with 20% cold work and Eurofer97. The basic microstructure of the TMS consists of: a) µm-scale laths arranged in small ≤ 10 µm lath packets bundles that are contained in larger 20 to 80 µm prior austenite grains; b) medium-to-coarse scale Cr-rich carbides; and, c) medium-to-high (the cold-worked alloy) dislocation densities. The TMS microstructures also provide many trapping sites for He, but recent evidence suggests that even so, He accumulation prior austenite grain boundaries may lead to a severe non-hardening embrittlement and intergranular fast fracture at lower irradiation temperatures (≤ ≈ 350°C), and that these microstructures are unstable at higher irradiation temperatures (> 450°C) [8,9]. Other potential characterization techniques include x-ray scattering, positron annihilation spectroscopy, and He desorption spectroscopy. Sectioned discs will also be used for both conventional and advanced micro/nano-hardness measurements that will provide a direct, side-by-side comparison of the effect, if any, of the He/dpa ratio on the irradiated flow properties. Future studies based on similar and alternative implantation methods and specimen geometries could be used to study the amount and consequences of helium accumulation
103
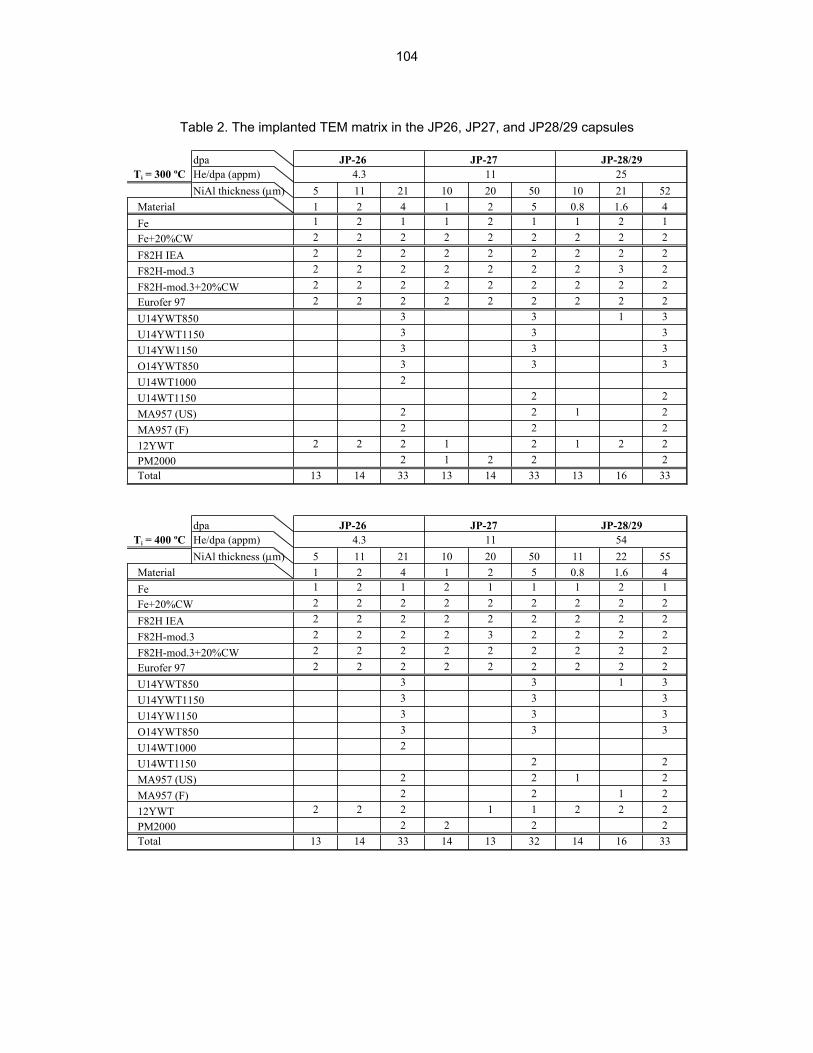
Table 2. The implanted TEM matrix in the JP26, JP27, and JP28/29 capsules
dpa JP-26 JP-27 JP-28/29Ti = 300 ºC He/dpa (appm) 4.3 11 25
NiAl thickness (µm) 5 11 21 10 20 50 10 21 52Material 1 2 4 1 2 5 0.8 1.6 4Fe 1 2 1 1 2 1 1 2 1Fe+20%CW 2 2 2 2 2 2 2 2 2F82H IEA 2 2 2 2 2 2 2 2 2F82H-mod.3 2 2 2 2 2 2 2 3 2F82H-mod.3+20%CW 2 2 2 2 2 2 2 2 2Eurofer 97 2 2 2 2 2 2 2 2 2U14YWT850 3 3 1U14YWT1150 3 3U14YW1150 3 3O14YWT850 3 3U14WT1000 2U14WT1150 2 2MA957 (US) 2 2 1MA957 (F) 2 212YWT 2 2 2 1 2 1 2 2PM2000 2 1 2 2 2Total 13 14 33 13 14 33 13 16 33
3333
22
dpa JP-26 JP-27 JP-28/29Ti = 400 ºC He/dpa (appm) 4.3 11 54
NiAl thickness (µm) 5 11 21 10 20 50 11 22 55Material 1 2 4 1 2 5 0.8 1.6 4Fe 1 2 1 2 1 1 1 2 1Fe+20%CW 2 2 2 2 2 2 2 2 2F82H IEA 2 2 2 2 2 2 2 2 2F82H-mod.3 2 2 2 2 3 2 2 2 2F82H-mod.3+20%CW 2 2 2 2 2 2 2 2 2Eurofer 97 2 2 2 2 2 2 2 2 2U14YWT850 3 3 1U14YWT1150 3 3U14YW1150 3 3O14YWT850 3 3U14WT1000 2U14WT1150 2 2MA957 (US) 2 2 1MA957 (F) 2 2 112YWT 2 2 2 1 1 2 2 2PM2000 2 2 2 2Total 13 14 33 14 13 32 14 16 33
3333
22
104
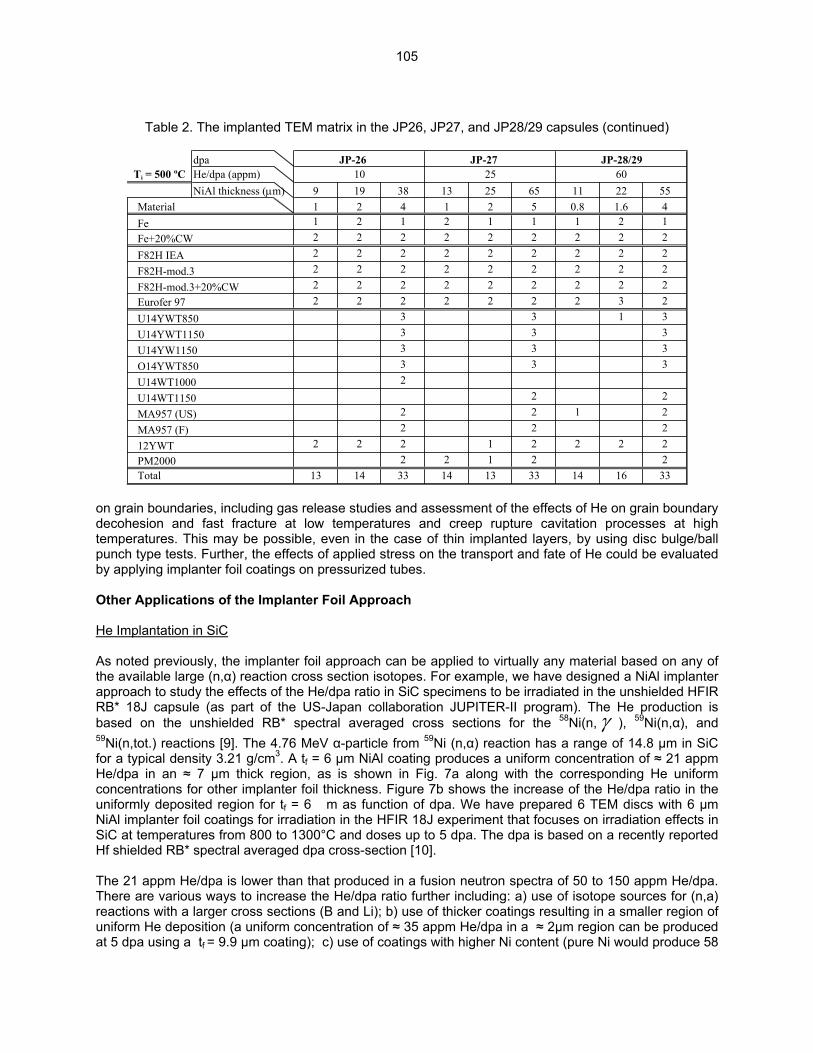
Table 2. The implanted TEM matrix in the JP26, JP27, and JP28/29 capsules (continued)
dpa JP-26 JP-27 JP-28/29Ti = 500 ºC He/dpa (appm) 10 25 60
NiAl thickness (µm) 9 19 38 13 25 65 11 22 55Material 1 2 4 1 2 5 0.8 1.6 4Fe 1 2 1 2 1 1 1 2 1Fe+20%CW 2 2 2 2 2 2 2 2 2F82H IEA 2 2 2 2 2 2 2 2 2F82H-mod.3 2 2 2 2 2 2 2 2 2F82H-mod.3+20%CW 2 2 2 2 2 2 2 2 2Eurofer 97 2 2 2 2 2 2 2 3 2U14YWT850 3 3 1U14YWT1150 3 3U14YW1150 3 3O14YWT850 3 3U14WT1000 2U14WT1150 2 2MA957 (US) 2 2 1MA957 (F) 2 212YWT 2 2 2 1 2 2 2 2PM2000 2 2 1 2 2Total 13 14 33 14 13 33 14 16 33
3333
22
on grain boundaries, including gas release studies and assessment of the effects of He on grain boundary decohesion and fast fracture at low temperatures and creep rupture cavitation processes at high temperatures. This may be possible, even in the case of thin implanted layers, by using disc bulge/ball punch type tests. Further, the effects of applied stress on the transport and fate of He could be evaluated by applying implanter foil coatings on pressurized tubes. Other Applications of the Implanter Foil Approach He Implantation in SiC As noted previously, the implanter foil approach can be applied to virtually any material based on any of the available large (n,α) reaction cross section isotopes. For example, we have designed a NiAl implanter approach to study the effects of the He/dpa ratio in SiC specimens to be irradiated in the unshielded HFIR RB* 18J capsule (as part of the US-Japan collaboration JUPITER-II program). The He production is based on the unshielded RB* spectral averaged cross sections for the 58Ni(n, γ ), 59Ni(n,α), and 59Ni(n,tot.) reactions [9]. The 4.76 MeV α-particle from 59Ni (n,α) reaction has a range of 14.8 µm in SiC for a typical density 3.21 g/cm3. A tf = 6 µm NiAl coating produces a uniform concentration of ≈ 21 appm He/dpa in an ≈ 7 µm thick region, as is shown in Fig. 7a along with the corresponding He uniform concentrations for other implanter foil thickness. Figure 7b shows the increase of the He/dpa ratio in the uniformly deposited region for tf = 6 m as function of dpa. We have prepared 6 TEM discs with 6 µm NiAl implanter foil coatings for irradiation in the HFIR 18J experiment that focuses on irradiation effects in SiC at temperatures from 800 to 1300°C and doses up to 5 dpa. The dpa is based on a recently reported Hf shielded RB* spectral averaged dpa cross-section [10]. The 21 appm He/dpa is lower than that produced in a fusion neutron spectra of 50 to 150 appm He/dpa. There are various ways to increase the He/dpa ratio further including: a) use of isotope sources for (n,a) reactions with a larger cross sections (B and Li); b) use of thicker coatings resulting in a smaller region of uniform He deposition (a uniform concentration of ≈ 35 appm He/dpa in a ≈ 2µm region can be produced at 5 dpa using a tf = 9.9 µm coating); c) use of coatings with higher Ni content (pure Ni would produce 58
105
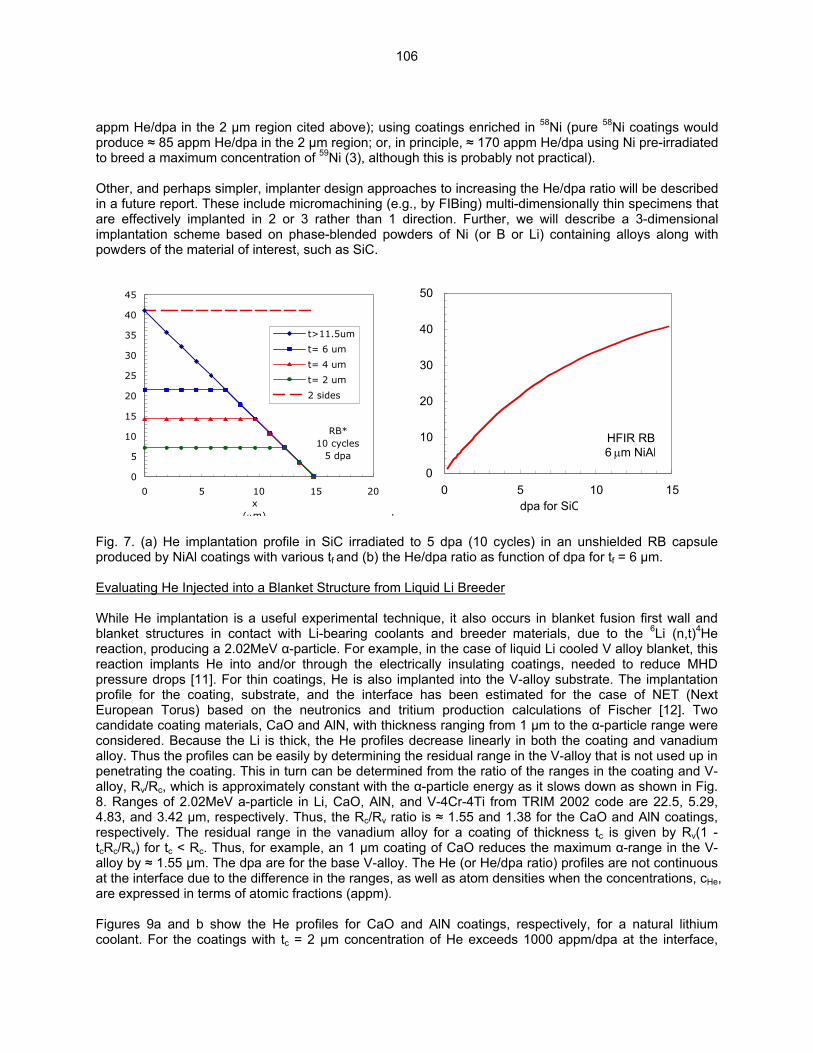
appm He/dpa in the 2 µm region cited above); using coatings enriched in 58Ni (pure 58Ni coatings would produce ≈ 85 appm He/dpa in the 2 µm region; or, in principle, ≈ 170 appm He/dpa using Ni pre-irradiated to breed a maximum concentration of 59Ni (3), although this is probably not practical). Other, and perhaps simpler, implanter design approaches to increasing the He/dpa ratio will be described in a future report. These include micromachining (e.g., by FIBing) multi-dimensionally thin specimens that are effectively implanted in 2 or 3 rather than 1 direction. Further, we will describe a 3-dimensional implantation scheme based on phase-blended powders of Ni (or B or Li) containing alloys along with powders of the material of interest, such as SiC.
RB* 10 cycles
5 dpa
0
5
10
15
20
25
30
35
40
45
0 5 10 15 20x
(µm)
t>11.5um
t= 6 um
t= 4 um
t= 2 um
2 sides
.
HFIR RB6 µm NiAl
0
10
20
30
40
50
0 5 10 15dpa for SiC
Fig. 7. (a) He implantation profile in SiC irradiated to 5 dpa (10 cycles) in an unshielded RB capsule produced by NiAl coatings with various tf and (b) the He/dpa ratio as function of dpa for tf = 6 µm. Evaluating He Injected into a Blanket Structure from Liquid Li Breeder While He implantation is a useful experimental technique, it also occurs in blanket fusion first wall and blanket structures in contact with Li-bearing coolants and breeder materials, due to the 6Li (n,t)4He reaction, producing a 2.02MeV α-particle. For example, in the case of liquid Li cooled V alloy blanket, this reaction implants He into and/or through the electrically insulating coatings, needed to reduce MHD pressure drops [11]. For thin coatings, He is also implanted into the V-alloy substrate. The implantation profile for the coating, substrate, and the interface has been estimated for the case of NET (Next European Torus) based on the neutronics and tritium production calculations of Fischer [12]. Two candidate coating materials, CaO and AlN, with thickness ranging from 1 µm to the α-particle range were considered. Because the Li is thick, the He profiles decrease linearly in both the coating and vanadium alloy. Thus the profiles can be easily by determining the residual range in the V-alloy that is not used up in penetrating the coating. This in turn can be determined from the ratio of the ranges in the coating and V-alloy, Rv/Rc, which is approximately constant with the α-particle energy as it slows down as shown in Fig. 8. Ranges of 2.02MeV a-particle in Li, CaO, AlN, and V-4Cr-4Ti from TRIM 2002 code are 22.5, 5.29, 4.83, and 3.42 µm, respectively. Thus, the Rc/Rv ratio is ≈ 1.55 and 1.38 for the CaO and AlN coatings, respectively. The residual range in the vanadium alloy for a coating of thickness tc is given by Rv(1 - tcRc/Rv) for tc < Rc. Thus, for example, an 1 µm coating of CaO reduces the maximum α-range in the V-alloy by ≈ 1.55 µm. The dpa are for the base V-alloy. The He (or He/dpa ratio) profiles are not continuous at the interface due to the difference in the ranges, as well as atom densities when the concentrations, cHe, are expressed in terms of atomic fractions (appm). Figures 9a and b show the He profiles for CaO and AlN coatings, respectively, for a natural lithium coolant. For the coatings with tc = 2 µm concentration of He exceeds 1000 appm/dpa at the interface,
106
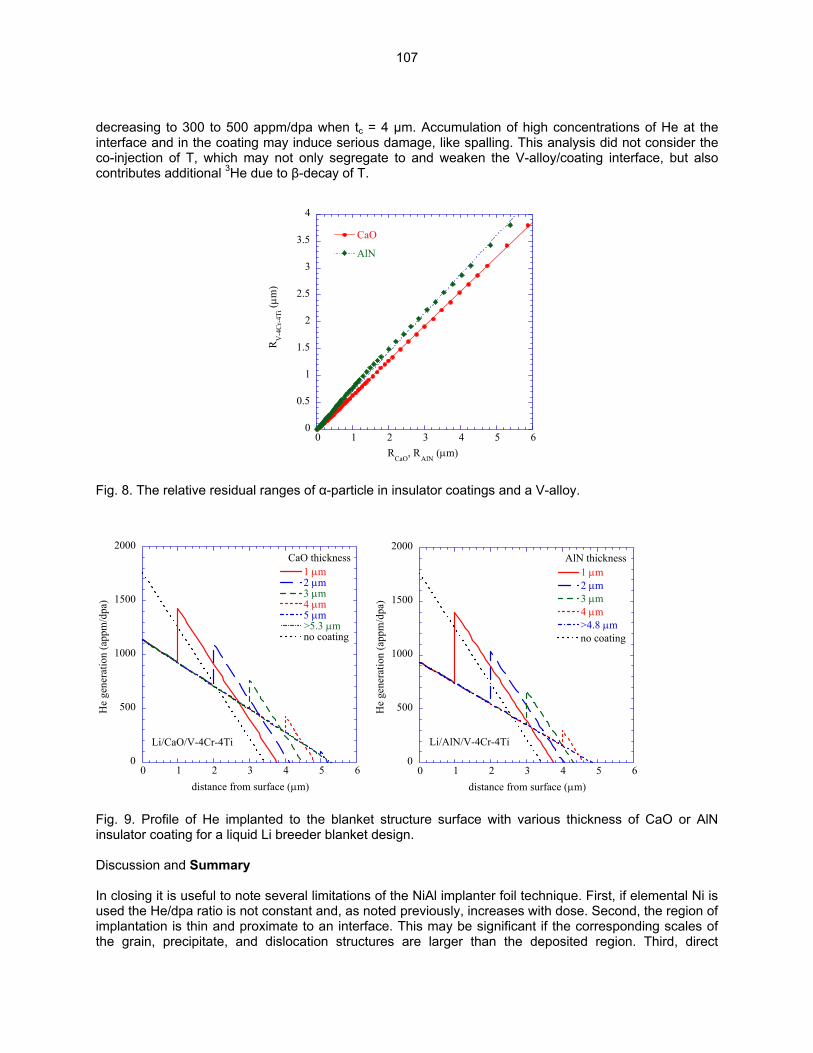
decreasing to 300 to 500 appm/dpa when tc = 4 µm. Accumulation of high concentrations of He at the interface and in the coating may induce serious damage, like spalling. This analysis did not consider the co-injection of T, which may not only segregate to and weaken the V-alloy/coating interface, but also contributes additional 3He due to β-decay of T.
0
0.5
1
1.5
2
2.5
3
3.5
4
0 1 2 3 4 5 6
CaO
AlN
RV
-4C
r-4T
i (µm
)
RCaO
, RAlN
(µm)
Fig. 8. The relative residual ranges of α-particle in insulator coatings and a V-alloy.
0
500
1000
1500
2000
0 1 2 3 4 5 6
Li/CaO/V-4Cr-4Ti
1 µm2 µm3 µm4 µm5 µm>5.3 µmno coating
He
gene
ratio
n (a
ppm
/dpa
)
distance from surface (µm)
CaO thickness
0
500
1000
1500
2000
0 1 2 3 4 5 6
Li/AlN/V-4Cr-4Ti
1 µm2 µm3 µm4 µm>4.8 µmno coating
He
gene
ratio
n (a
ppm
/dpa
)
distance from surface (µm)
AlN thickness
Fig. 9. Profile of He implanted to the blanket structure surface with various thickness of CaO or AlN insulator coating for a liquid Li breeder blanket design. Discussion and Summary In closing it is useful to note several limitations of the NiAl implanter foil technique. First, if elemental Ni is used the He/dpa ratio is not constant and, as noted previously, increases with dose. Second, the region of implantation is thin and proximate to an interface. This may be significant if the corresponding scales of the grain, precipitate, and dislocation structures are larger than the deposited region. Third, direct
107
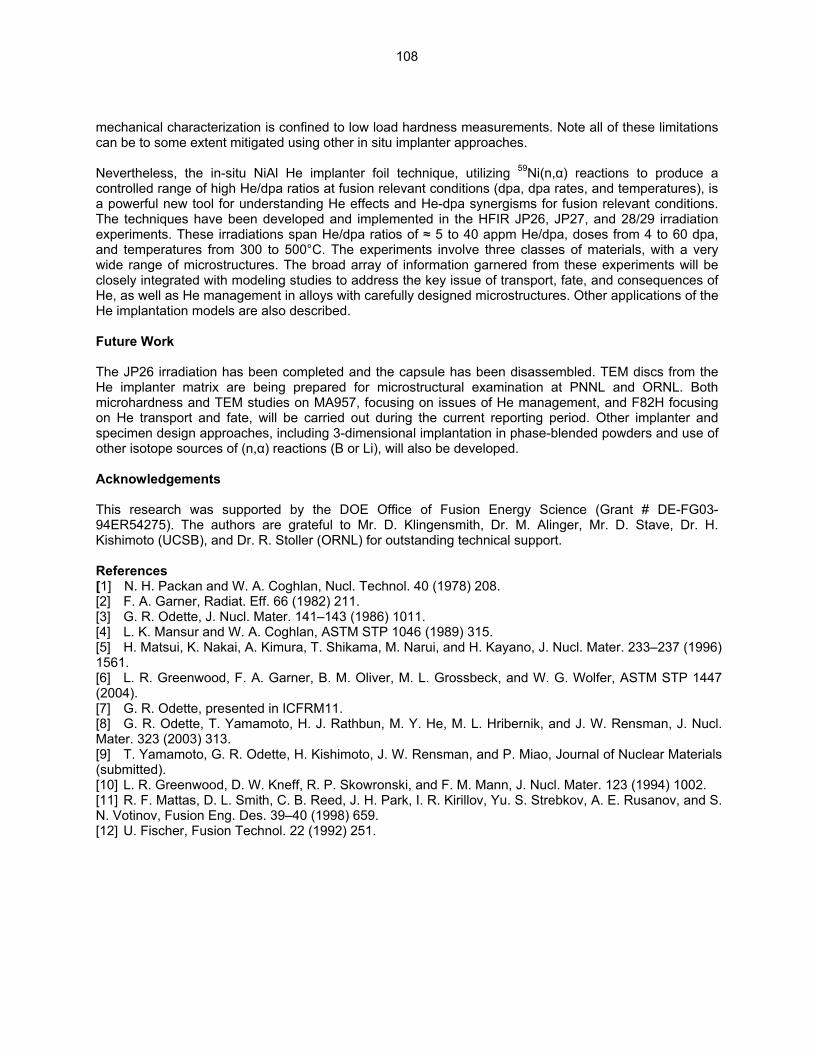
mechanical characterization is confined to low load hardness measurements. Note all of these limitations can be to some extent mitigated using other in situ implanter approaches. Nevertheless, the in-situ NiAl He implanter foil technique, utilizing 59Ni(n,α) reactions to produce a controlled range of high He/dpa ratios at fusion relevant conditions (dpa, dpa rates, and temperatures), is a powerful new tool for understanding He effects and He-dpa synergisms for fusion relevant conditions. The techniques have been developed and implemented in the HFIR JP26, JP27, and 28/29 irradiation experiments. These irradiations span He/dpa ratios of ≈ 5 to 40 appm He/dpa, doses from 4 to 60 dpa, and temperatures from 300 to 500°C. The experiments involve three classes of materials, with a very wide range of microstructures. The broad array of information garnered from these experiments will be closely integrated with modeling studies to address the key issue of transport, fate, and consequences of He, as well as He management in alloys with carefully designed microstructures. Other applications of the He implantation models are also described. Future Work The JP26 irradiation has been completed and the capsule has been disassembled. TEM discs from the He implanter matrix are being prepared for microstructural examination at PNNL and ORNL. Both microhardness and TEM studies on MA957, focusing on issues of He management, and F82H focusing on He transport and fate, will be carried out during the current reporting period. Other implanter and specimen design approaches, including 3-dimensional implantation in phase-blended powders and use of other isotope sources of (n,α) reactions (B or Li), will also be developed. Acknowledgements This research was supported by the DOE Office of Fusion Energy Science (Grant # DE-FG03-94ER54275). The authors are grateful to Mr. D. Klingensmith, Dr. M. Alinger, Mr. D. Stave, Dr. H. Kishimoto (UCSB), and Dr. R. Stoller (ORNL) for outstanding technical support. References [1] N. H. Packan and W. A. Coghlan, Nucl. Technol. 40 (1978) 208. [2] F. A. Garner, Radiat. Eff. 66 (1982) 211. [3] G. R. Odette, J. Nucl. Mater. 141–143 (1986) 1011. [4] L. K. Mansur and W. A. Coghlan, ASTM STP 1046 (1989) 315. [5] H. Matsui, K. Nakai, A. Kimura, T. Shikama, M. Narui, and H. Kayano, J. Nucl. Mater. 233–237 (1996) 1561. [6] L. R. Greenwood, F. A. Garner, B. M. Oliver, M. L. Grossbeck, and W. G. Wolfer, ASTM STP 1447 (2004). [7] G. R. Odette, presented in ICFRM11. [8] G. R. Odette, T. Yamamoto, H. J. Rathbun, M. Y. He, M. L. Hribernik, and J. W. Rensman, J. Nucl. Mater. 323 (2003) 313. [9] T. Yamamoto, G. R. Odette, H. Kishimoto, J. W. Rensman, and P. Miao, Journal of Nuclear Materials (submitted). [10] L. R. Greenwood, D. W. Kneff, R. P. Skowronski, and F. M. Mann, J. Nucl. Mater. 123 (1994) 1002. [11] R. F. Mattas, D. L. Smith, C. B. Reed, J. H. Park, I. R. Kirillov, Yu. S. Strebkov, A. E. Rusanov, and S. N. Votinov, Fusion Eng. Des. 39–40 (1998) 659. [12] U. Fischer, Fusion Technol. 22 (1992) 251.
108
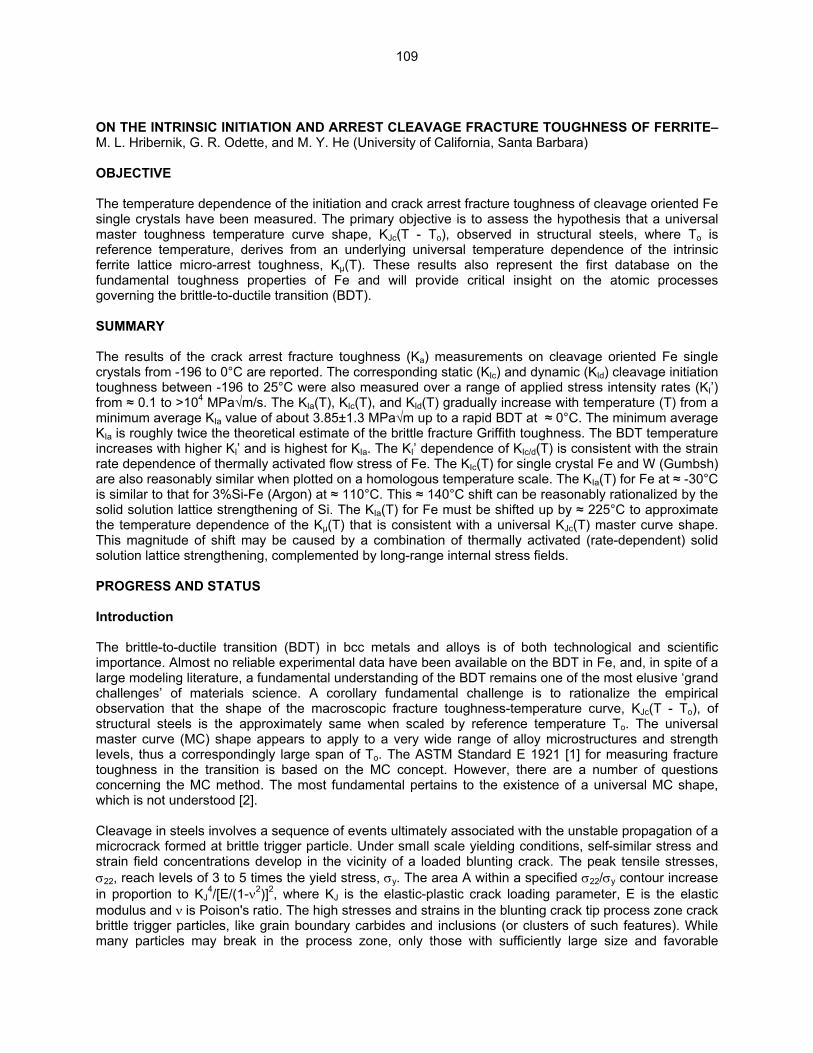
ON THE INTRINSIC INITIATION AND ARREST CLEAVAGE FRACTURE TOUGHNESS OF FERRITE–M. L. Hribernik, G. R. Odette, and M. Y. He (University of California, Santa Barbara) OBJECTIVE The temperature dependence of the initiation and crack arrest fracture toughness of cleavage oriented Fe single crystals have been measured. The primary objective is to assess the hypothesis that a universal master toughness temperature curve shape, KJc(T - To), observed in structural steels, where To is reference temperature, derives from an underlying universal temperature dependence of the intrinsic ferrite lattice micro-arrest toughness, Kµ(T). These results also represent the first database on the fundamental toughness properties of Fe and will provide critical insight on the atomic processes governing the brittle-to-ductile transition (BDT). SUMMARY The results of the crack arrest fracture toughness (Ka) measurements on cleavage oriented Fe single crystals from -196 to 0°C are reported. The corresponding static (KIc) and dynamic (KId) cleavage initiation toughness between -196 to 25°C were also measured over a range of applied stress intensity rates (KI’) from ≈ 0.1 to >104 MPa√m/s. The KIa(T), KIc(T), and KId(T) gradually increase with temperature (T) from a minimum average KIa value of about 3.85±1.3 MPa√m up to a rapid BDT at ≈ 0°C. The minimum average KIa is roughly twice the theoretical estimate of the brittle fracture Griffith toughness. The BDT temperature increases with higher KI’ and is highest for KIa. The KI’ dependence of KIc/d(T) is consistent with the strain rate dependence of thermally activated flow stress of Fe. The KIc(T) for single crystal Fe and W (Gumbsh) are also reasonably similar when plotted on a homologous temperature scale. The KIa(T) for Fe at ≈ -30°C is similar to that for 3%Si-Fe (Argon) at ≈ 110°C. This ≈ 140°C shift can be reasonably rationalized by the solid solution lattice strengthening of Si. The KIa(T) for Fe must be shifted up by ≈ 225°C to approximate the temperature dependence of the Kµ(T) that is consistent with a universal KJc(T) master curve shape. This magnitude of shift may be caused by a combination of thermally activated (rate-dependent) solid solution lattice strengthening, complemented by long-range internal stress fields. PROGRESS AND STATUS Introduction The brittle-to-ductile transition (BDT) in bcc metals and alloys is of both technological and scientific importance. Almost no reliable experimental data have been available on the BDT in Fe, and, in spite of a large modeling literature, a fundamental understanding of the BDT remains one of the most elusive ‘grand challenges’ of materials science. A corollary fundamental challenge is to rationalize the empirical observation that the shape of the macroscopic fracture toughness-temperature curve, KJc(T - To), of structural steels is the approximately same when scaled by reference temperature To. The universal master curve (MC) shape appears to apply to a very wide range of alloy microstructures and strength levels, thus a correspondingly large span of To. The ASTM Standard E 1921 [1] for measuring fracture toughness in the transition is based on the MC concept. However, there are a number of questions concerning the MC method. The most fundamental pertains to the existence of a universal MC shape, which is not understood [2]. Cleavage in steels involves a sequence of events ultimately associated with the unstable propagation of a microcrack formed at brittle trigger particle. Under small scale yielding conditions, self-similar stress and strain field concentrations develop in the vicinity of a loaded blunting crack. The peak tensile stresses, σ22, reach levels of 3 to 5 times the yield stress, σy. The area A within a specified σ22/σy contour increase in proportion to KJ
4/[E/(1-ν2)]2, where KJ is the elastic-plastic crack loading parameter, E is the elastic modulus and ν is Poison's ratio. The high stresses and strains in the blunting crack tip process zone crack brittle trigger particles, like grain boundary carbides and inclusions (or clusters of such features). While many particles may break in the process zone, only those with sufficiently large size and favorable
109

orientation with respect to low cleavage toughness crystallographic planes and directions in the adjoining ferrite are ‘eligible’ for a microcrack propagation event. That is, the propagation, versus arrest, of a dynamic microcrack into the adjacent ferrite matrix is the critical event for macroscopic cleavage [3,4]. Because of the distribution of the largest and properly oriented particles in any sampling volume, cleavage is basically a statistical process, leading to a wide specimen-to-specimen distribution of the measured fracture toughness. However, the mean (or median) cleavage condition be described in terms of a critical stress contour σ22 = σ* encompassing a critical volume V* of material in the process zone, V* = A*B, where A* is a critically stressed in-plane area and B is the specimen thickness [2,3]. The critical σ*-A* constitutes the local cleavage fracture property that depends on the trigger particle microstructure, and the corresponding KJc depends on the σ*-A* and the constitutive properties, σ(ε), of the steel. The loading increases until cleavage occurs KJ = KJc at σ22 = σ* and A(σ22) = A* [2-3]. The σ* can be expressed in terms pf a modified Griffith criteria in Equation 1 [2-4]:
σ* = CKµ/√d (1) Here, C is a geometric factor, of order unity, that depends on the assumed trigger particle crack shape and d is the characteristic trigger particle size. Thus the macroscopic cleavage KJc is controlled, or valved, by the Kµ (<< KJc) of ferrite. Finite element simulations of crack tip fields for a specified σ(ε) can be used to evaluate the fields, hence, KJc at σ22 = σ* and A(σ22) = A* [2,3,5]. The temperature-dependence of KJc(T) is mediated by the temperature dependence of σ(T,ε) and σ*(T), since A* primarily depends only on the microstructure. At low temperatures the σ*-A* KJc(T) model predictions are consistent with the MC shape based on the traditional assumption that σ* is approximately independent of temperature. In this case, the temperature dependence of KJc(T) is fully controlled by the corresponding thermally activated component of σy(T), which is similar in most Fe based bcc alloys. Irradiation of ferritic steels produces nano-scale precipitates and defect clusters that result in a temperature independent increase in the athermal yield and flow strength, and a corresponding upward shift in To. The coarser scale microstructure is unaffected. As T0 increases, due to a ∆σy, the constant σ*-A* model predicts a reduction (layover) of the MC slope in the transition that are not observed experimentally [1-3]. These layovers are a consequence of the decreasing temperature dependence of σy(T) at higher T0 ≥ ≈ 0°C. The inconsistency between model and observation can be remedied by incorporating a modest temperature dependence in σ*(T). The temperature dependence of σ*(T) demands a corresponding temperature dependence of Kµ(T). The fact that the position (To), but not the shape, of the MC depends on microstructure and alloy strength leads to the hypothesis that Kµ(T) is independent of the fine, nano-scale features such as those introduced by irradiation. This further suggests that some intrinsic property of the ferrite matrix controls Kµ(T). Thus the focus of this work is on assessing Kµ(T) in Fe. While it can be inferred from the trigger particle size distribution and σ*, Kµ cannot be directly measured [2-4]. However, it is possible to measure various toughness parameters of single crystal Fe single crystals oriented for cleavage, including the static (KIc) and dynamic (KId) initiation toughness for sharp cracks, as well as the arrest toughness (KIa) for propagating cracks. While certainly not identical properties, we propose that the Ka(T) is a good surrogate for Kµ(T). Indeed, KIc, KId, KIa, and Kµ all reflect the fundamental phenomena of the BDT in Fe. In spite of the paucity of data, many models have been proposed to describe the BDT in Fe and other bcc metals and alloys. Regardless of detail and level of approximation, however, most BDT models are based on the interaction between a (usually) sharp crack tip under increasing remote loading (KI) and the evolution of local dislocation structures, that alters (shields) the elastic crack tip field and dissipates energy. The shielding reduces the effective crack tip stress intensity factor kt relative to the KI, kt/KI, < 1. As KI and kt increase, the local stresses may, or may not, reach a level capable of breaking bonds; or
110

from an energy balance perspective, kt may (T < TBDT) or may not (T > TBDT) reach the brittle fracture Griffith criteria kg. The first successful attempt to model the BDT, based on an energy criterion mediating the nucleation of a single dislocation (ductile) prior to bond breaking (brittle), was proposed by Rice and Thomson (RT) [6]. The RT model and its progeny focusing on the nucleation and glide of dislocations, coupled with some detailed experimental observations, have helped to clarify the specific crystallographic slip processes involved in shielding a stationary crack tip. However, the various BDT models involve a number of assumptions and approximations and predict a wide range of behavior. Indeed, the models and model parameters, such as the type and spacing of dislocation sources [7], can be adjusted to match wide range of experimental results [frequently based on inappropriate choices like the macroscopic KJc(T)]. Further, the BDT models have generally not addressed the crack tip processes involved in continued propagation of a cleavage crack, or arrest of the crack by the evolution of crack tip shielding dislocations. Thus, it is clear that the atomic level processes that govern the BDT are not fully understood in general, and for crack arrest in particular. Hence, our major objective is to develop a unique database of initiation and arrest toughness of unalloyed Fe single crystals over a wide range of temperature. Experimental Procedures The following section only very briefly outlines the challenging experimental techniques used in this study. Additional details will be provided in future reports. Single crystal rods slightly less than 1 cm in diameter and 5–6 cm in length with orientations consistent with EDM sectioning into thin rectangular slices with the desired (100)[010] and (100)[011] cleavage plane and crack direction orientations were procured from Monocrystals Corporation. The crystal orientations were confirmed by Laue back reflection x-ray diffraction. The most significant challenge was to design a specimen and test procedure that allowed the initiation and arrest of a cleavage crack in the very small distance (< 8 mm) that was available. As illustrated in Fig. 1, properly oriented single crystal slices were incorporated into composite specimens reflecting two different approaches to testing. Both types of composite specimens were fabricated by diffusion bonding, and in some cases brazing, the single crystal slices to high strength steel sections that served both to transmit loads and store and release elastic energy.
W
b
a B
L
t
BridgeWedge
φ t
a
W
B
h
b a
W
a
b Fig. 1. The a) bridge anvil specimen and b) double cantilevered beam chevron wedge specimen.
111
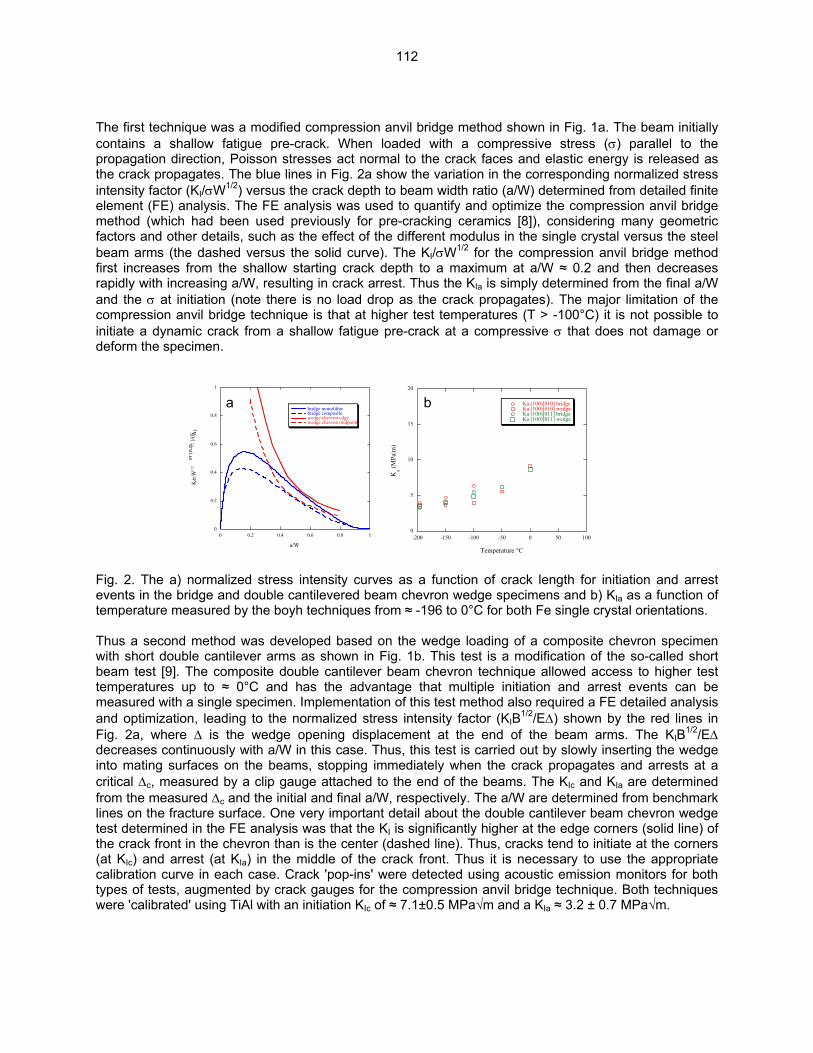
The first technique was a modified compression anvil bridge method shown in Fig. 1a. The beam initially contains a shallow fatigue pre-crack. When loaded with a compressive stress (σ) parallel to the propagation direction, Poisson stresses act normal to the crack faces and elastic energy is released as the crack propagates. The blue lines in Fig. 2a show the variation in the corresponding normalized stress intensity factor (KI/σW1/2) versus the crack depth to beam width ratio (a/W) determined from detailed finite element (FE) analysis. The FE analysis was used to quantify and optimize the compression anvil bridge method (which had been used previously for pre-cracking ceramics [8]), considering many geometric factors and other details, such as the effect of the different modulus in the single crystal versus the steel beam arms (the dashed versus the solid curve). The KI/σW1/2 for the compression anvil bridge method first increases from the shallow starting crack depth to a maximum at a/W ≈ 0.2 and then decreases rapidly with increasing a/W, resulting in crack arrest. Thus the KIa is simply determined from the final a/W and the σ at initiation (note there is no load drop as the crack propagates). The major limitation of the compression anvil bridge technique is that at higher test temperatures (T > -100°C) it is not possible to initiate a dynamic crack from a shallow fatigue pre-crack at a compressive σ that does not damage or deform the specimen.
0
0.2
0.4
0.6
0.8
1
0 0.2 0.4 0.6 0.8 1
bridge monolithicbridge compositewedge chevron edgewedge chevron midpoint
a/W
K/ σ
W1/
2 o
r (K
B 1/2
)/(E ∆
)
0
5
10
15
20
-200 -150 -100 -50 0 50 100
Ka (100)[010] bridgeKa (100)[010] wedgeKa (100)[011] bridgeKa (100)[011] wedge
Ka (M
Pa¦m
)
Temperature °C
a b
Fig. 2. The a) normalized stress intensity curves as a function of crack length for initiation and arrest events in the bridge and double cantilevered beam chevron wedge specimens and b) KIa as a function of temperature measured by the boyh techniques from ≈ -196 to 0°C for both Fe single crystal orientations. Thus a second method was developed based on the wedge loading of a composite chevron specimen with short double cantilever arms as shown in Fig. 1b. This test is a modification of the so-called short beam test [9]. The composite double cantilever beam chevron technique allowed access to higher test temperatures up to ≈ 0°C and has the advantage that multiple initiation and arrest events can be measured with a single specimen. Implementation of this test method also required a FE detailed analysis and optimization, leading to the normalized stress intensity factor (KIB1/2/E∆) shown by the red lines in Fig. 2a, where ∆ is the wedge opening displacement at the end of the beam arms. The KIB1/2/E∆ decreases continuously with a/W in this case. Thus, this test is carried out by slowly inserting the wedge into mating surfaces on the beams, stopping immediately when the crack propagates and arrests at a critical ∆c, measured by a clip gauge attached to the end of the beams. The KIc and KIa are determined from the measured ∆c and the initial and final a/W, respectively. The a/W are determined from benchmark lines on the fracture surface. One very important detail about the double cantilever beam chevron wedge test determined in the FE analysis was that the KI is significantly higher at the edge corners (solid line) of the crack front in the chevron than is the center (dashed line). Thus, cracks tend to initiate at the corners (at KIc) and arrest (at KIa) in the middle of the crack front. Thus it is necessary to use the appropriate calibration curve in each case. Crack 'pop-ins' were detected using acoustic emission monitors for both types of tests, augmented by crack gauges for the compression anvil bridge technique. Both techniques were 'calibrated' using TiAl with an initiation KIc of ≈ 7.1±0.5 MPa√m and a KIa ≈ 3.2 ± 0.7 MPa√m.
112

Following bridge testing, the beam specimens are left with a deep and very sharp pre-crack, providing the opportunity to obtain initiation toughness measurements over a range of loading rates from static (KIc) to dynamic (KId). The initiation tests were carried out in 4-point bending on a servo-hydraulic load frame at K' from ≈ 1 to 3000 MPa√m/s and from ≈ 8000 to 20,000 MPa√m/s on a drop tower. A calibrated piezoelectric instrumented TUP was used to measure the linear load time trace. Note the corresponding K' for the double cantilevered beam chevron wedge specimen tests was ≈ 0.1 MPa√m/s. Note, since the crack arrests under decreasing KI conditions the actual arrest toughness may be somewhat higher than the measured value. However, we believe the difference is small to negligible for a variety of reasons. Results The average KIa results for the bridge and wedge tests for both cleavage orientations are shown in Fig. 1b. There is generally good agreement between the two techniques in the temperature range where they overlap, although the compression anvil bridge data KIa data is, on average, slightly higher. Each point represents at least four tests. The standard deviations of the KIa data scatter are not shown, but are in the range of ±1.0 to1.5 MPa√m. The limited results for KId at three characteristic K' rates and both Fe single crystal orientations are summarized in Fig. 3. As expected, the KId decrease with increasing K'.
0
5
10
15
20
-200 -150 -100 -50 0 50 100
KId
(MPa
¦m)
Temperature °C
0
5
10
15
20
-200 -150 -100 -50 0 50 100
KId
(MPa
¦m)
Temperature °C
~1 ~103
~104
(100)[010] (100)[011]
~1 ~103
~104
Fig. 3. The KId as a function of temperature for characteristic K' from -196 to 25°C for both the (100)[010] and (100)[011] cleavage orientations. It is expected that the K' dependence of KId derives from the corresponding strain rate dependence of σy (or, more precisely, the critical resolved shear stresses for the glide of screw dislocations on pertinent slip systems). To test this hypothesis the data from Fig. 3, along with the KIc from the double cantilevered beam chevron wedge specimen test are re-plotted in Fig. 4 on a K' compensated temperature scale T', analogous to a strain rate compensated temperature. T' (°K) is given by:
T' = T[1 - Cln(K'/K'r)]. (2) Here K' is the loading rate for a specific test and K'r is a reference rate of1500 MPa√m/s. The C is 0.035 consistent with the corresponding strain rate dependence of σy. While the data remain scattered, the KIc/d data fall in a common band, except possible at the lowest temperature where the KIc data remains higher than the KId results. However, these results lend powerful support to the hypothesis that the BDT in Fe (and other bcc metals and alloys) is controlled by thermally activated dislocation glide processes. Figure 5a compares KIc data on (100)[010] W single crystals reported by Gumbsh [10] to the corresponding KIc and KId data for Fe plotted on a homologous T/Tm scale, where Tm is the melting temperature. Overall, the initiation toughness data are similar. At low temperatures, the W data are somewhat lower and higher than the Fe KIc and KId data, respectively. Agreement is better at higher temperatures although an abrupt BDT for W occurs at a lower T/Tm. Generally similar results are found for the (100)[011] orientation.
113
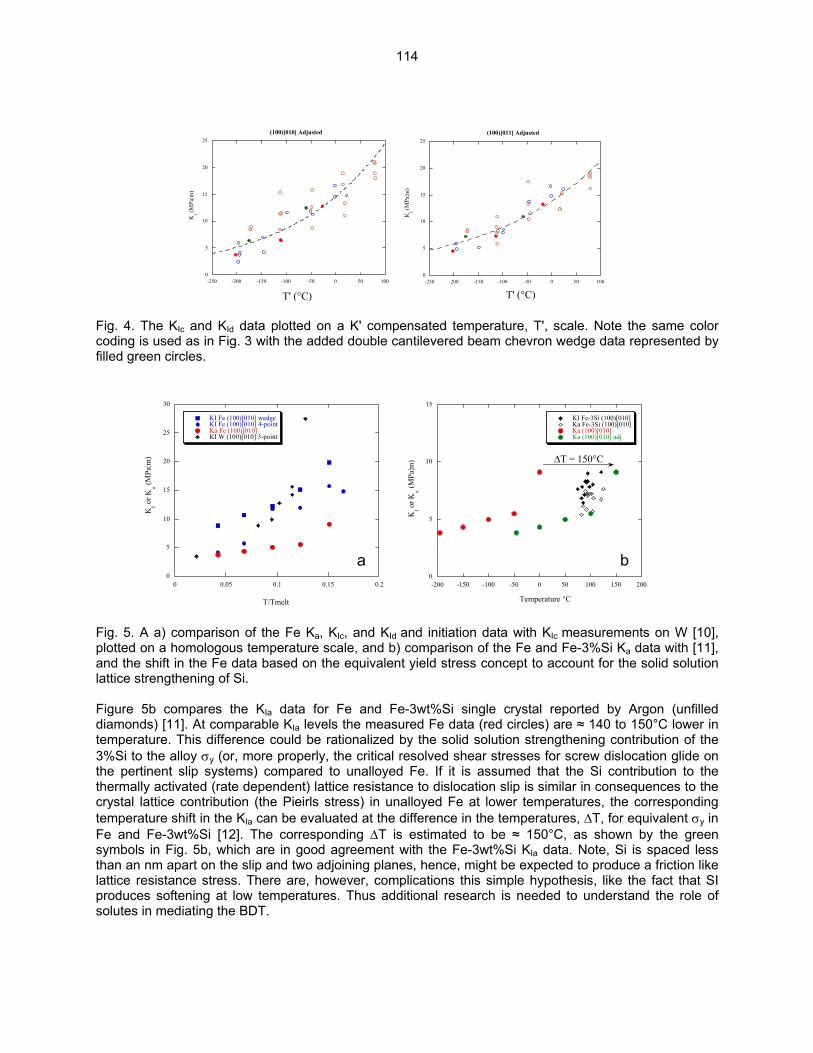
0
5
10
15
20
25
-250 -200 -150 -100 -50 0 50 100
(100)[010] Adjusted
y = 14.591 * e^(0.005198x) R= 0.87531
KI (M
Pa¦m
)
Temperature °C
K rate ref = 1500 MPa¦m/sC = 0.035
0
5
10
15
20
25
-250 -200 -150 -100 -50 0 50 100
(100)[011] Adjusted
y = 13.895 * e^(0.0043247x) R= 0.9019
KI (M
Pa¦m
)
T
K rate ref = 1500 MPa¦m/sC = 0.035
emperature °CT' (°C)T' (°C)
Fig. 4. The KIc and KId data plotted on a K' compensated temperature, T', scale. Note the same color coding is used as in Fig. 3 with the added double cantilevered beam chevron wedge data represented by filled green circles.
0
5
10
15
20
25
30
0 0.05 0.1 0.15 0.2
KI Fe (100)[010] wedgeKI Fe (100)[010] 4-pointKa Fe (100)[010]KI W (100)[010] 3-point
T/Tmelt
KI o
r Ka (M
Pa¦m
)
0
5
10
15
-200 -150 -100 -50 0 50 100 150 200
KI Fe-3Si (100)[010]Ka Fe-3Si (100)[010]Ka (100)[010]Ka (100)[010] adj
∆T = 150°C
Temperature °C
KI o
r Ka (M
Pa¦m
)
a b
Fig. 5. A a) comparison of the Fe Ka, KIc, and KId and initiation data with KIc measurements on W [10], plotted on a homologous temperature scale, and b) comparison of the Fe and Fe-3%Si Ka data with [11], and the shift in the Fe data based on the equivalent yield stress concept to account for the solid solution lattice strengthening of Si. Figure 5b compares the KIa data for Fe and Fe-3wt%Si single crystal reported by Argon (unfilled diamonds) [11]. At comparable KIa levels the measured Fe data (red circles) are ≈ 140 to 150°C lower in temperature. This difference could be rationalized by the solid solution strengthening contribution of the 3%Si to the alloy σy (or, more properly, the critical resolved shear stresses for screw dislocation glide on the pertinent slip systems) compared to unalloyed Fe. If it is assumed that the Si contribution to the thermally activated (rate dependent) lattice resistance to dislocation slip is similar in consequences to the crystal lattice contribution (the Pieirls stress) in unalloyed Fe at lower temperatures, the corresponding temperature shift in the KIa can be evaluated at the difference in the temperatures, ∆T, for equivalent σy in Fe and Fe-3wt%Si [12]. The corresponding ∆T is estimated to be ≈ 150°C, as shown by the green symbols in Fig. 5b, which are in good agreement with the Fe-3wt%Si KIa data. Note, Si is spaced less than an nm apart on the slip and two adjoining planes, hence, might be expected to produce a friction like lattice resistance stress. There are, however, complications this simple hypothesis, like the fact that SI produces softening at low temperatures. Thus additional research is needed to understand the role of solutes in mediating the BDT.
114
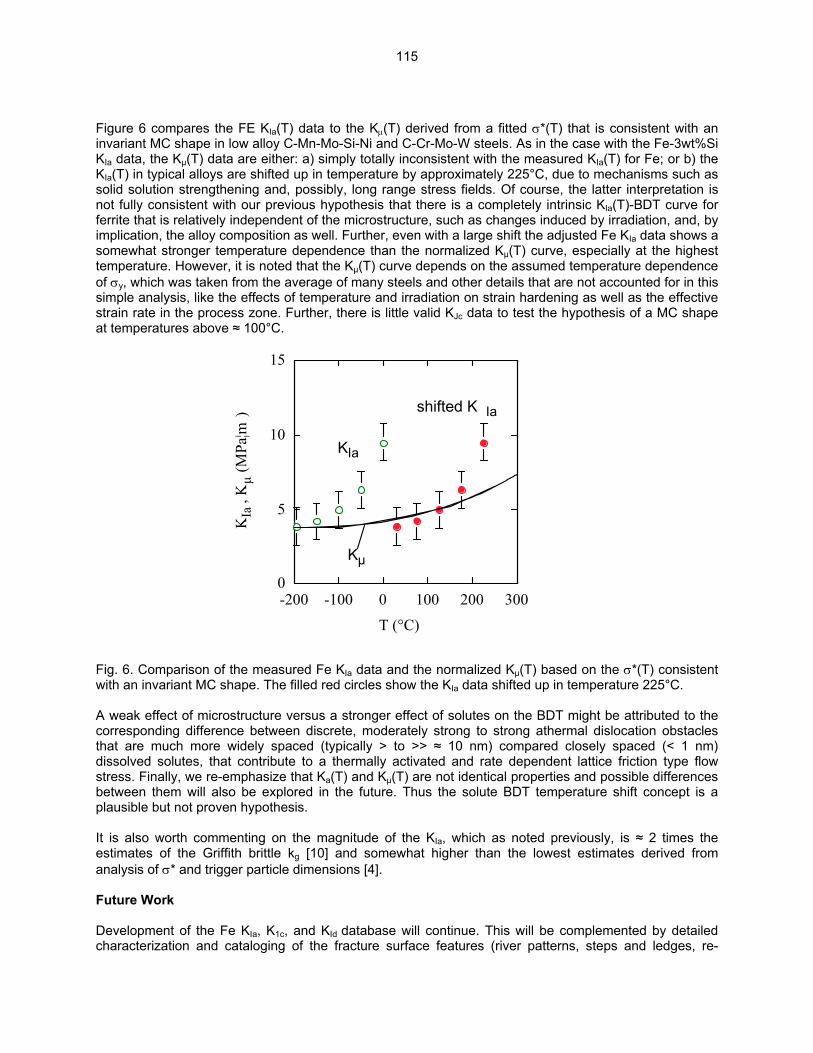
Figure 6 compares the FE KIa(T) data to the Kµ(T) derived from a fitted σ*(T) that is consistent with an invariant MC shape in low alloy C-Mn-Mo-Si-Ni and C-Cr-Mo-W steels. As in the case with the Fe-3wt%Si KIa data, the Kµ(T) data are either: a) simply totally inconsistent with the measured KIa(T) for Fe; or b) the KIa(T) in typical alloys are shifted up in temperature by approximately 225°C, due to mechanisms such as solid solution strengthening and, possibly, long range stress fields. Of course, the latter interpretation is not fully consistent with our previous hypothesis that there is a completely intrinsic KIa(T)-BDT curve for ferrite that is relatively independent of the microstructure, such as changes induced by irradiation, and, by implication, the alloy composition as well. Further, even with a large shift the adjusted Fe KIa data shows a somewhat stronger temperature dependence than the normalized Kµ(T) curve, especially at the highest temperature. However, it is noted that the Kµ(T) curve depends on the assumed temperature dependence of σy, which was taken from the average of many steels and other details that are not accounted for in this simple analysis, like the effects of temperature and irradiation on strain hardening as well as the effective strain rate in the process zone. Further, there is little valid KJc data to test the hypothesis of a MC shape at temperatures above ≈ 100°C.
0
5
10
15
KIa
, K
µ (M
Pa¦m
)
-200 -100 0 100 200 300
T (°C)
Kµ
KIa
shifted K Ia
Fig. 6. Comparison of the measured Fe KIa data and the normalized Kµ(T) based on the σ*(T) consistent with an invariant MC shape. The filled red circles show the KIa data shifted up in temperature 225°C. A weak effect of microstructure versus a stronger effect of solutes on the BDT might be attributed to the corresponding difference between discrete, moderately strong to strong athermal dislocation obstacles that are much more widely spaced (typically > to >> ≈ 10 nm) compared closely spaced (< 1 nm) dissolved solutes, that contribute to a thermally activated and rate dependent lattice friction type flow stress. Finally, we re-emphasize that Ka(T) and Kµ(T) are not identical properties and possible differences between them will also be explored in the future. Thus the solute BDT temperature shift concept is a plausible but not proven hypothesis. It is also worth commenting on the magnitude of the KIa, which as noted previously, is ≈ 2 times the estimates of the Griffith brittle kg [10] and somewhat higher than the lowest estimates derived from analysis of σ* and trigger particle dimensions [4]. Future Work Development of the Fe KIa, K1c, and KId database will continue. This will be complemented by detailed characterization and cataloging of the fracture surface features (river patterns, steps and ledges, re-
115
initiation crack tip opening displacements and sites, and so on), as well as slip steps, systems, and dislocation structures using a variety of techniques, including optical and scanning electron microscopy (OM and SEM), TEM, and AFM techniques. The results of the characterization studies will be correlated with the measured KIa, K1c, and KId data, with special emphasis on the effects of temperature. References [1] ASTM Standard E 1921-97, ASTM 2003. [2] G. R. Odette and M. Y. He, J. Nucl. Mater. 283–287 (2000) 120. [3] G. R. Odette, T. Yamamoto, H. J. Rathbun, M. L. Hribernik, and J. W. Rensman, J. Nucl. Mater. 323 (2003) 313. [4] G. T. Hahn, Metal. Trans. 15A (1984) 987. [5] M. Navaleinen and R. H. Dodds, Int. J. Fract. 74 (1985) 131. [6] J. R. Rice and R. Thomson, Philos. Mag. 29 (1974) 73. [7] S. G. Roberts, M. Ellis, and P. B. Hirsch, Mater. Sci. Eng. A 164 (1993) 135. [8] ASTM Standard C 1421-99, ASTM 2000. [9] ASTM Standard E 1304-97, ASTM 1998. [10] P. Gumbsch, J. Riedle, A. Hartmaier, and H. F. Fischmeister, Science 282 (1998) 1293. [11] Y. Qiao and A. S. Argon, Mech. Mater. 35 (2003) 903. [12] P. B. Pickering, Phys. Metall. Des. Steels (1978) 65.
116

MODELLING THERMODYNAMICS OF ALLOYS FOR FUSION APPLICATION—A. Caro, B. Sadigh, P. E. A. Turchi, M. Caro (Lawrence Livermore National Laboratory), E. Lopasso (Centro Atomico Bariloche, Argentine), and D. Crowson (Virginia Polytechnical Institute) OBJECTIVE This research has two main objectives. • On one side is the development of computational tools to evaluate alloy properties, using the
information contained in thermodynamic functions to improve the ability of classic potentials to account for complex alloy behavior.
• On the other hand, to apply the tools so developed to predict properties of alloys under
irradiation. SUMMARY Atomistic simulations of alloys at the empirical level face the challenge of correctly modeling basic thermodynamic properties. In this work we propose a methodology to generalize many-body classic potentials to incorporate complex formation energy curves. Application to Fe-Cr allows us to correctly predict the order vs. segregation tendency in this alloy, as observed experimentally and calculated with ab initio techniques, providing in this way a potential suitable for radiation damage studies. PROGRESS AND STATUS Computational Materials Science is nowadays a standard approach to study complex problems in solids. Besides ab initio techniques, a great interest exists for classic approaches adequate for large number of atoms, as needed in studies of large crystalline defects with long range interactions. The requirement of accurate, predictive simulation tools points towards the necessity of models for the interactions that are able to reproduce important fundamental properties of materials. Usually the models used are known as 'many body' potentials, grouped in large categories as the Embedded Atom Models and the Second Moment Approximation [1]. Most of the vast amount of work done using these classic potentials addresses either pure elements or intermetallic compounds, only a few address concentrated alloys. Based on the enormous success of these many body potentials for large scale atomistic simulations of materials [2,3], there has been a continuous progress in the field since its inception, extending the models towards increasingly complex materials like bcc, covalent, ordered compounds and dilute alloys. In this work, we focus on concentrated alloys with complex heat of formation and provide a methodology to address arbitrarily complex systems. This methodology is applied to Fe-Cr, a system of interest in fission and fusion technology as structural material with good mechanical, thermal, and radiation properties. Computer simulation studies of radiation damage in these alloys require models that can adequately predict alloy stability / microstructure evolution under large doses. The so-called many body potentials have in common a description of the total energy in terms of the sum over atom energies, themselves composed of two contributions, namely embedding and pair potential terms. For hetero-atomic systems, let's say binary alloys involving elements A and B, it reads:
117
where α, β stand for elements A or B sitting at sites i, j; F's are the embedding functions for either type of elements, and V's and ρ's are the pair potentials and densities between α−β pairs. Alloy properties are therefore described by the functions ρAB and VAB. Depending on the model considered, the density functions do not always include the cross term ρAB. Different expressions for the embedding energies, densities, and pair potentials enclose a large diversity of similar models. In recent papers we addressed the problem of alloy description with atomistic models from the perspective of thermodynamics rather than the properties of a single impurity. We developed numerical tools to calculate free energies of the relevant phases and applied them to a couple of systems, namely Au-Ni [4] and Fe-Cu [5]. Both these systems have in common the fact that the formation energy of the alloy is a rather symmetric function of the composition and, as it is shown below, a standard approach using a cross pair potential term was enough to reproduce their properties. We found that alloy models fitted to properties of the dilute limit usually show erroneous behavior in the concentrated case. For Fe-Cr in particular, this problem is at the core of the limitations of the classic potentials due to the highly non-symmetric formation energy that even changes sign at low Cr composition [6]. Focusing our attention on disordered alloys, the strategies to develop alloy potentials have been at least twofold: perform a global optimization of all functions in Eq. (1) together, to match the targeted properties of A, B, and AB systems, or start by developing potentials for pure A and pure B, and then fit the alloy properties by adjusting the cross terms in that equation. By far, most of the work done on alloys has used the dilute heat of solution as the key alloy property to fit, but in general, the description of concentrated alloys requires more information than that contained in this sole quantity. A convenient way to analyze alloy properties with independence of the pure elements is to discuss excess quantities, i.e., quantities measured with respect to the ideal solution. Ideal solutions, by definition, have null excess quantities and their energy, Eq. (1), is given by the linear interpolation between the two constituents. To construct models that depart from ideality, we can use either or both terms in Eq. (1). It is important to notice that even without using a cross density, the embedding term always introduces a heat of formation, i.e., a non-linearity of energy vs. composition, through the non-linear functions Fαβ. In this work, we follow the strategy of using potentials for the pure elements already available in the literature, thereby taking advantage of the continuous progress in the field. We then adjust the alloy terms, focusing on non-linearities built upon the pair potential cross term alone. To this end, we use a representation that minimizes the non-linear contribution of the embedding term. We start with a preparation of the two pure element potentials in a way that is adequate for our purpose, that is, the effective representation with normalized densities, which for α = A,B reads:
where the superscript o stands for original, ρ0
α,eq for the density on a lattice site at equilibrium, and the prime ' for derivative. These transformations do not alter the properties of the pure elements but have the advantage of minimizing the contribution of the embedding term to the formation energy of the alloy, as is discussed below, and allows us to combine potentials for pure elements coming from different authors with eventually very different and unrelated magnitudes of the densities. In this work, we use the Fe potential reported in [7] and the Cr potential reported in [8].
118
The free energy of a random solid solution phase of an alloy with composition x at temperature T is conveniently expressed as:
where gref is the compositional weighted free energy of the pure components, and gmix is the free energy contribution from the entropy of mixing for a random alloy. The excess Gibbs energy of mixing is conveniently expressed by a Redlich - Kister expansion [9] as:
where Lp is the pth-order binary interaction parameter; in general it is a function of temperature. Due to the complexity that represents fitting potentials to actual temperature dependent functions, in what follows we shall adopt two important simplifications: neglecting the excess vibrational entropy and assuming that the formation energy does not depend on T. This simplifies Eq. (4) to:
For Fe-Cr the formation energy has recently been calculated ab initio [6] together with a rough estimate of the bulk modulus B and lattice parameter of the alloy a0. These calculations contain several simplifications, as Fe and Cr both have magnetism, and are therefore not to be considered as the definitive values classic models have to reproduce, but as first estimates upon which classic models can be developed. From those results, we shall consider the formation energy as our single target function to be reproduced. From Fig. 5 in Ref [6] the formation energy of bcc ferromagnetic Fe-Cr alloys can be reproduced by a Redlich-Kister expansion, Eq. (5), to 4th order in (1-2x). To find the functional form of the cross potential we need an analytic model for the alloy. We adopt a model in which the species that sits on site i can either be A or B, but both are embedded in the same average environment, as discussed by Ackland and Vitek [2]:
with . The contribution of the embedding terms to the energy of mixing, ∆ Eemb, is:
By making a taylor development we can see that this contribution is small:
119
For the potentials we use in this work, the transformations (2) in fact drop the contribution of the embedding term to the formation energy down to ~1 meV/atom at x ~ 0.5, making it negligible when compared to the target value for this alloy ~100 meV/atom, [6]. This in practice leaves the pair potential as the sole contributor to the formation energy. The contribution to the energy of mixing from the pair potential terms is:
We now introduce our proposition for the alloy potential based on the following points: i- Taking advantage of the result Eq. (8) we build up the non-linearity upon the pair potential alone (this is a simplification adopted for this case in particular; it can easily be removed in other cases to use either or both contributions); ii- we assume that VAB is a function, of both (x,r), that can be separated into a product h(x)uAB(r), we then choose:
This election of the cross pair potential allows us to describe any type of formation energy curves, giving an ideal solution for h(x)=1, a regular solution with positive or negative heat of mixing for h(x) # 1, and an arbitrary complex heat of mixing for h(x) a polynomial on x. We also see that without introducing a polynomial on x we can not go beyond symmetric formation energies, i.e., only L0 in the expansion Eq. (4). Eq. (10) also shows that if the target function is a fourth order Redlich-Kister polynomial, so will h(x) be. It then provides us with a hint as to what functional form to use in the optimization procedure. We replace now VAB(rij) in Eq. (6) by h(x)1\2(VAA(rij)+ VBB(rij)) and by minimizing the difference between this expression for the energy and the target formation energy Eq. (5), at the lattice parameter that minimizes the energy, we find the coefficients of h(x). It is interesting to point out that if Eq. (8) gives a really small contribution, as is the case for these two pure element potentials in the effective representation, we can neglect altogether the contribution of the embedding terms. Then, by equating Eqs. (5) and (9) instead of minimizing a target function, we can define h(x), the composition dependence of the cross potential, through an identity, namely:
The formation energy, the lattice parameter, and the bulk modulus of the resulting alloy are shown in Fig. 1.
120
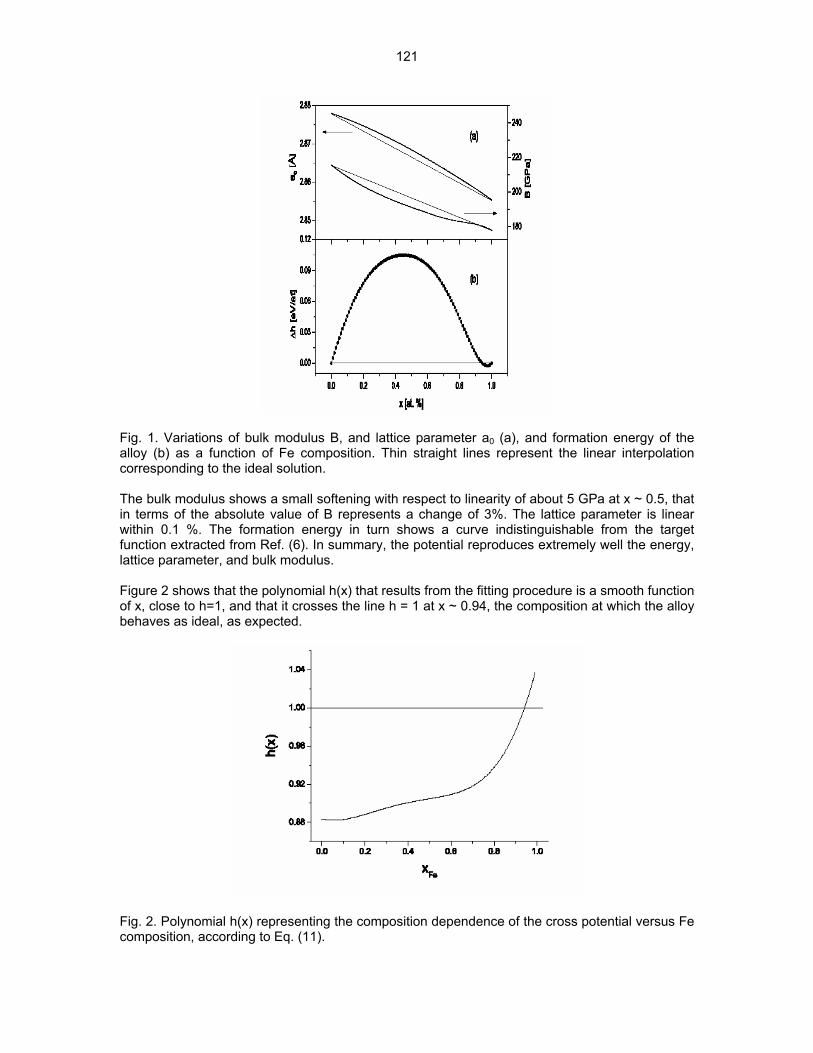
Fig. 1. Variations of bulk modulus B, and lattice parameter a0 (a), and formation energy of the alloy (b) as a function of Fe composition. Thin straight lines represent the linear interpolation corresponding to the ideal solution. The bulk modulus shows a small softening with respect to linearity of about 5 GPa at x ~ 0.5, that in terms of the absolute value of B represents a change of 3%. The lattice parameter is linear within 0.1 %. The formation energy in turn shows a curve indistinguishable from the target function extracted from Ref. (6). In summary, the potential reproduces extremely well the energy, lattice parameter, and bulk modulus. Figure 2 shows that the polynomial h(x) that results from the fitting procedure is a smooth function of x, close to h=1, and that it crosses the line h = 1 at x ~ 0.94, the composition at which the alloy behaves as ideal, as expected.
Fig. 2. Polynomial h(x) representing the composition dependence of the cross potential versus Fe composition, according to Eq. (11).
121
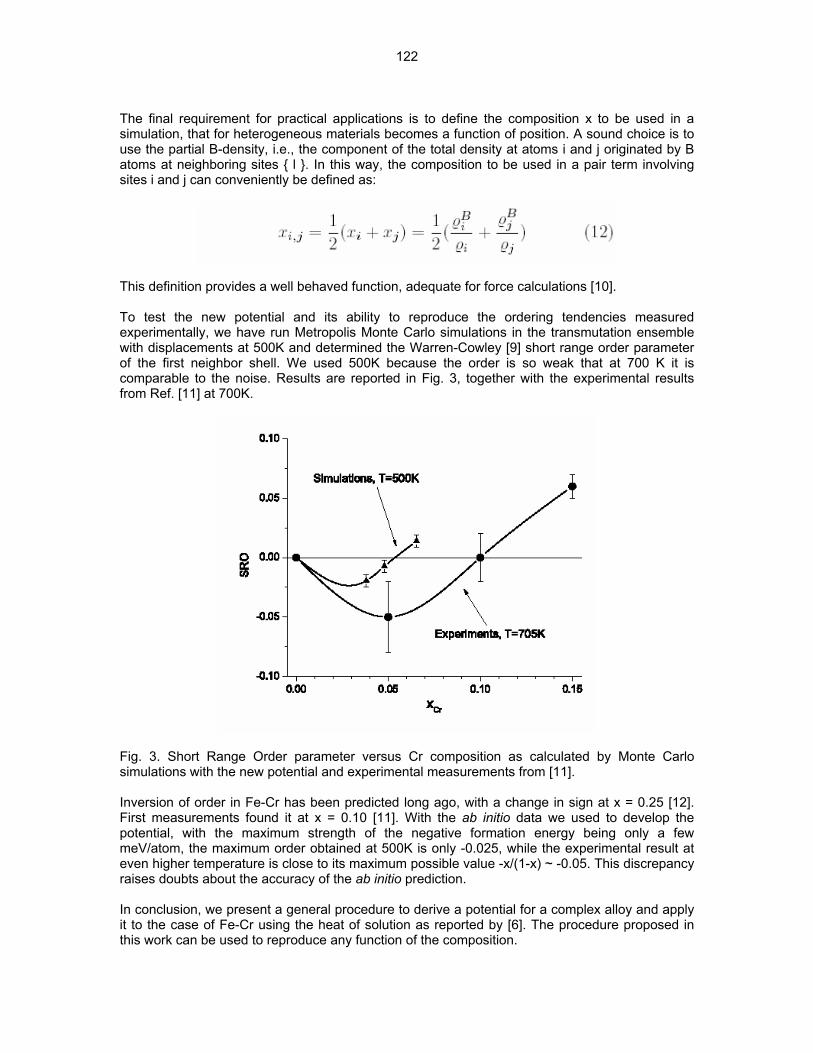
The final requirement for practical applications is to define the composition x to be used in a simulation, that for heterogeneous materials becomes a function of position. A sound choice is to use the partial B-density, i.e., the component of the total density at atoms i and j originated by B atoms at neighboring sites l . In this way, the composition to be used in a pair term involving sites i and j can conveniently be defined as:
This definition provides a well behaved function, adequate for force calculations [10]. To test the new potential and its ability to reproduce the ordering tendencies measured experimentally, we have run Metropolis Monte Carlo simulations in the transmutation ensemble with displacements at 500K and determined the Warren-Cowley [9] short range order parameter of the first neighbor shell. We used 500K because the order is so weak that at 700 K it is comparable to the noise. Results are reported in Fig. 3, together with the experimental results from Ref. [11] at 700K.
Fig. 3. Short Range Order parameter versus Cr composition as calculated by Monte Carlo simulations with the new potential and experimental measurements from [11]. Inversion of order in Fe-Cr has been predicted long ago, with a change in sign at x = 0.25 [12]. First measurements found it at x = 0.10 [11]. With the ab initio data we used to develop the potential, with the maximum strength of the negative formation energy being only a few meV/atom, the maximum order obtained at 500K is only -0.025, while the experimental result at even higher temperature is close to its maximum possible value -x/(1-x) ~ -0.05. This discrepancy raises doubts about the accuracy of the ab initio prediction. In conclusion, we present a general procedure to derive a potential for a complex alloy and apply it to the case of Fe-Cr using the heat of solution as reported by [6]. The procedure proposed in this work can be used to reproduce any function of the composition.
122
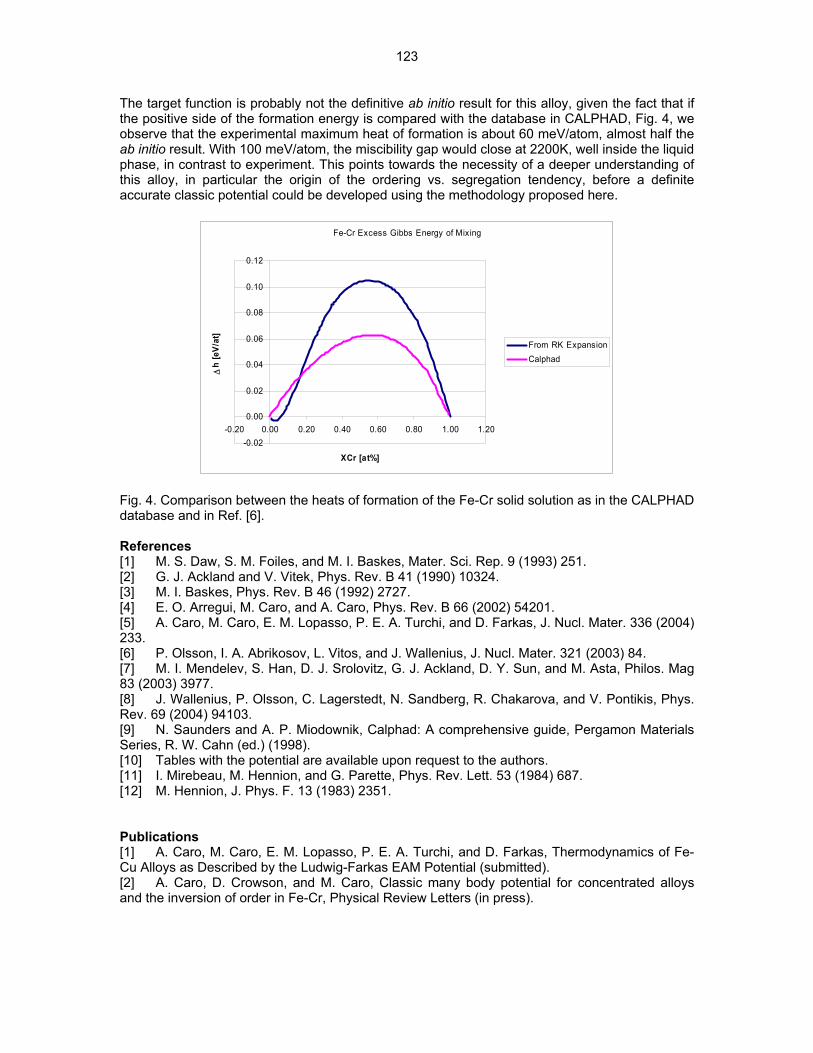
The target function is probably not the definitive ab initio result for this alloy, given the fact that if the positive side of the formation energy is compared with the database in CALPHAD, Fig. 4, we observe that the experimental maximum heat of formation is about 60 meV/atom, almost half the ab initio result. With 100 meV/atom, the miscibility gap would close at 2200K, well inside the liquid phase, in contrast to experiment. This points towards the necessity of a deeper understanding of this alloy, in particular the origin of the ordering vs. segregation tendency, before a definite accurate classic potential could be developed using the methodology proposed here.
Fe-Cr Excess Gibbs Energy of Mixing
-0.02
0.00
0.02
0.04
0.06
0.08
0.10
0.12
-0.20 0.00 0.20 0.40 0.60 0.80 1.00 1.20
XCr [at%]
∆h
[eV/
at]
From RK ExpansionCalphad
Fig. 4. Comparison between the heats of formation of the Fe-Cr solid solution as in the CALPHAD database and in Ref. [6]. References [1] M. S. Daw, S. M. Foiles, and M. I. Baskes, Mater. Sci. Rep. 9 (1993) 251. [2] G. J. Ackland and V. Vitek, Phys. Rev. B 41 (1990) 10324. [3] M. I. Baskes, Phys. Rev. B 46 (1992) 2727. [4] E. O. Arregui, M. Caro, and A. Caro, Phys. Rev. B 66 (2002) 54201. [5] A. Caro, M. Caro, E. M. Lopasso, P. E. A. Turchi, and D. Farkas, J. Nucl. Mater. 336 (2004) 233. [6] P. Olsson, I. A. Abrikosov, L. Vitos, and J. Wallenius, J. Nucl. Mater. 321 (2003) 84. [7] M. I. Mendelev, S. Han, D. J. Srolovitz, G. J. Ackland, D. Y. Sun, and M. Asta, Philos. Mag 83 (2003) 3977. [8] J. Wallenius, P. Olsson, C. Lagerstedt, N. Sandberg, R. Chakarova, and V. Pontikis, Phys. Rev. 69 (2004) 94103. [9] N. Saunders and A. P. Miodownik, Calphad: A comprehensive guide, Pergamon Materials Series, R. W. Cahn (ed.) (1998). [10] Tables with the potential are available upon request to the authors. [11] I. Mirebeau, M. Hennion, and G. Parette, Phys. Rev. Lett. 53 (1984) 687. [12] M. Hennion, J. Phys. F. 13 (1983) 2351. Publications [1] A. Caro, M. Caro, E. M. Lopasso, P. E. A. Turchi, and D. Farkas, Thermodynamics of Fe-Cu Alloys as Described by the Ludwig-Farkas EAM Potential (submitted). [2] A. Caro, D. Crowson, and M. Caro, Classic many body potential for concentrated alloys and the inversion of order in Fe-Cr, Physical Review Letters (in press).
123
TOWARDS UNDERSTANDING THE FORMATION AND STABILITY OF NANOMETER SCALE Y-Ti-O CLUSTERS IN NANOSTRUCTURED FERRITIC ALLOYS USING LATTICE-BASED MONTE CARLO SIMULATIONS—M. J. Alinger and B. D. Wirth (University of California, Berkeley) OBJECTIVE The objective of this study is to explore the factors that control the formation, stability and composition of Y-Ti-O nanoclusters (NCs) in nanostructured ferritic alloys (NFAs) using Lattice-based Monte Carlo (LMC) simulations. SUMMARY Lattice-based Monte Carlo (LMC) simulations are currently being developed to better understand the formation and stability of nm-scale clusters, or nanoclusters (NCs), in nanostructured ferritic alloys (NFAs). NFAs typically have a nominal composition in the range of Fe-(13-15) at %Cr-(0-1)W-(0.25-1)Ti-(0.1-0.25)Y-(0.15-0.40)O. A key fundamental issue is the local atomic arrangement (structure) and chemistry of the Y-Ti-O NCs. The LMC program has been written, debugged and the alloy thermodynamics have been verified against phase diagrams over the past several months. Bond energies have been obtained from calculations of the mixing enthalpies within a regular-solution thermodynamics model, making the simplification of a pure Fe (as opposed to Fe-14Cr) matrix and omitting the impurity elements. The mixing enthalpies have been obtained from the free energies for Y, Ti and O solute atoms. The simulations are performed on a body-centered cubic lattice, with oxygen situated on an octahedral interstitial sub-lattice. NC evolution is being simulated starting from a random super-saturated solution. The resulting structures will be compared to experimental observations by transmission electron microscopy, small angle neutron scattering, atom probe tomography and positron annihilation spectroscopy. Combined, these results will provide atomic-level insight into the NC structure and chemistry and provide a basis for optimizing NFA development as well as understanding the thermal and radiation stability of the NCs. PROGRESS AND STATUS Introduction Nanostructured ferritic alloys (NFAs) are promising candidates for high temperature structural materials, tailored specifically for fusion environments [1,2]. The key component in these alloys is a high density (>1022 m-3) of nm-scale (r = 1-2 nm) clusters or precipitates which can act to impede dislocation motion at elevated temperatures as well as provide sink sites for radiation damage and transmutation He. Studies using small angle neutron scattering (SANS) and atom probe tomography (APT) have shown that certain combinations of alloy chemistry and processing are capable of forming such nanoclusters [1,3,4]. These studies have revealed the key components for NC formation as well as the effective precipitation energy and thermal stability. However, many details are still elusive and computational simulations can provide valuable insight on the atomic scale. Monte Carlo Model and Simulation Technique Atomistic Model A lattice-based Monte Carlo (LMC) model has been developed to simulate the atomic scale configuration of Y-Ti-O nanoclusters in nanostructured ferritic alloys (NFAs). Several simplifying assumptions are made regarding the alloy composition. First, the chromium, which does not play an obvious role in the formation of NCs, is omitted from the simulations. Second, the tungsten, which has been shown not to play a role in NC formation [4], is also not included. Therefore, the alloy chemistry simulated is Fe-0.47at%Ti-0.12Y-0.19O, as opposed to Fe-15at%Cr-0.91W-0.47Ti-0.12Y-0.19O. As oxygen typically resides in octahedral
124
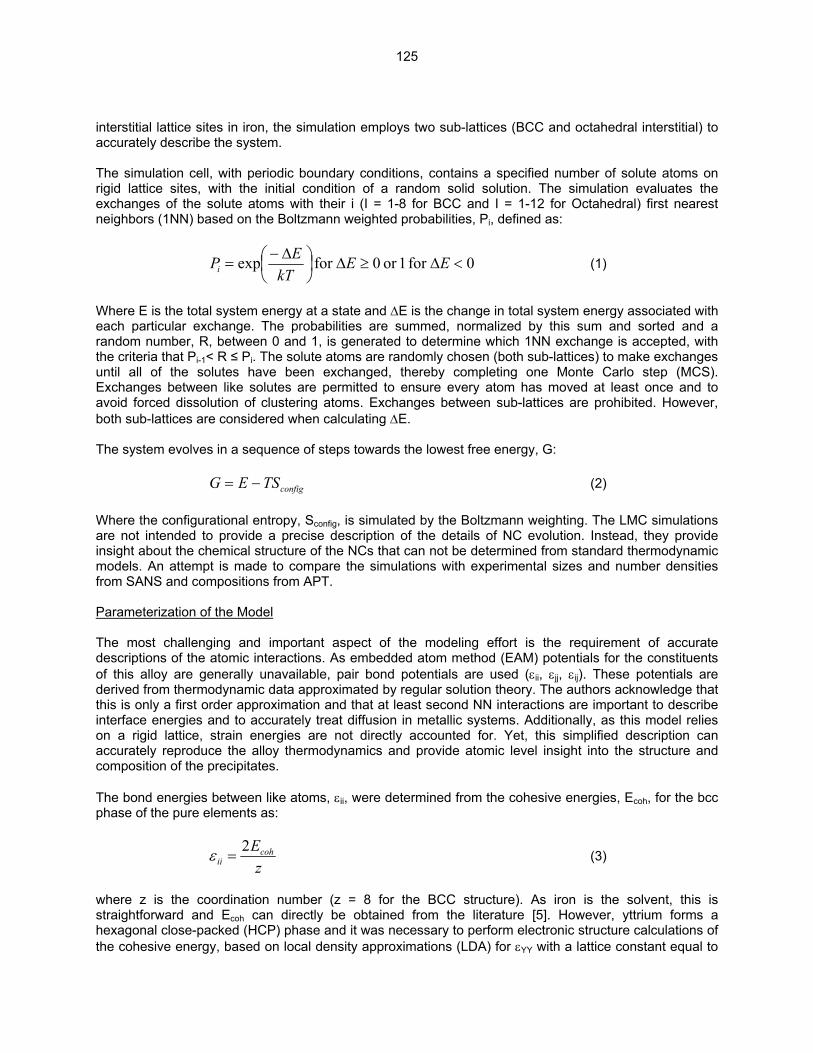
interstitial lattice sites in iron, the simulation employs two sub-lattices (BCC and octahedral interstitial) to accurately describe the system. The simulation cell, with periodic boundary conditions, contains a specified number of solute atoms on rigid lattice sites, with the initial condition of a random solid solution. The simulation evaluates the exchanges of the solute atoms with their i (I = 1-8 for BCC and I = 1-12 for Octahedral) first nearest neighbors (1NN) based on the Boltzmann weighted probabilities, Pi, defined as:
0for 1or 0for exp <∆≥∆⎟⎠⎞
⎜⎝⎛ ∆−
= EEkT
EPi (1)
Where E is the total system energy at a state and ∆E is the change in total system energy associated with each particular exchange. The probabilities are summed, normalized by this sum and sorted and a random number, R, between 0 and 1, is generated to determine which 1NN exchange is accepted, with the criteria that Pi-1< R ≤ Pi. The solute atoms are randomly chosen (both sub-lattices) to make exchanges until all of the solutes have been exchanged, thereby completing one Monte Carlo step (MCS). Exchanges between like solutes are permitted to ensure every atom has moved at least once and to avoid forced dissolution of clustering atoms. Exchanges between sub-lattices are prohibited. However, both sub-lattices are considered when calculating ∆E. The system evolves in a sequence of steps towards the lowest free energy, G:
configTSEG −= (2) Where the configurational entropy, Sconfig, is simulated by the Boltzmann weighting. The LMC simulations are not intended to provide a precise description of the details of NC evolution. Instead, they provide insight about the chemical structure of the NCs that can not be determined from standard thermodynamic models. An attempt is made to compare the simulations with experimental sizes and number densities from SANS and compositions from APT. Parameterization of the Model The most challenging and important aspect of the modeling effort is the requirement of accurate descriptions of the atomic interactions. As embedded atom method (EAM) potentials for the constituents of this alloy are generally unavailable, pair bond potentials are used (εii, εjj, εij). These potentials are derived from thermodynamic data approximated by regular solution theory. The authors acknowledge that this is only a first order approximation and that at least second NN interactions are important to describe interface energies and to accurately treat diffusion in metallic systems. Additionally, as this model relies on a rigid lattice, strain energies are not directly accounted for. Yet, this simplified description can accurately reproduce the alloy thermodynamics and provide atomic level insight into the structure and composition of the precipitates. The bond energies between like atoms, εii, were determined from the cohesive energies, Ecoh, for the bcc phase of the pure elements as:
zEcoh
ii2
=ε (3)
where z is the coordination number (z = 8 for the BCC structure). As iron is the solvent, this is straightforward and Ecoh can directly be obtained from the literature [5]. However, yttrium forms a hexagonal close-packed (HCP) phase and it was necessary to perform electronic structure calculations of the cohesive energy, based on local density approximations (LDA) for εYY with a lattice constant equal to
125
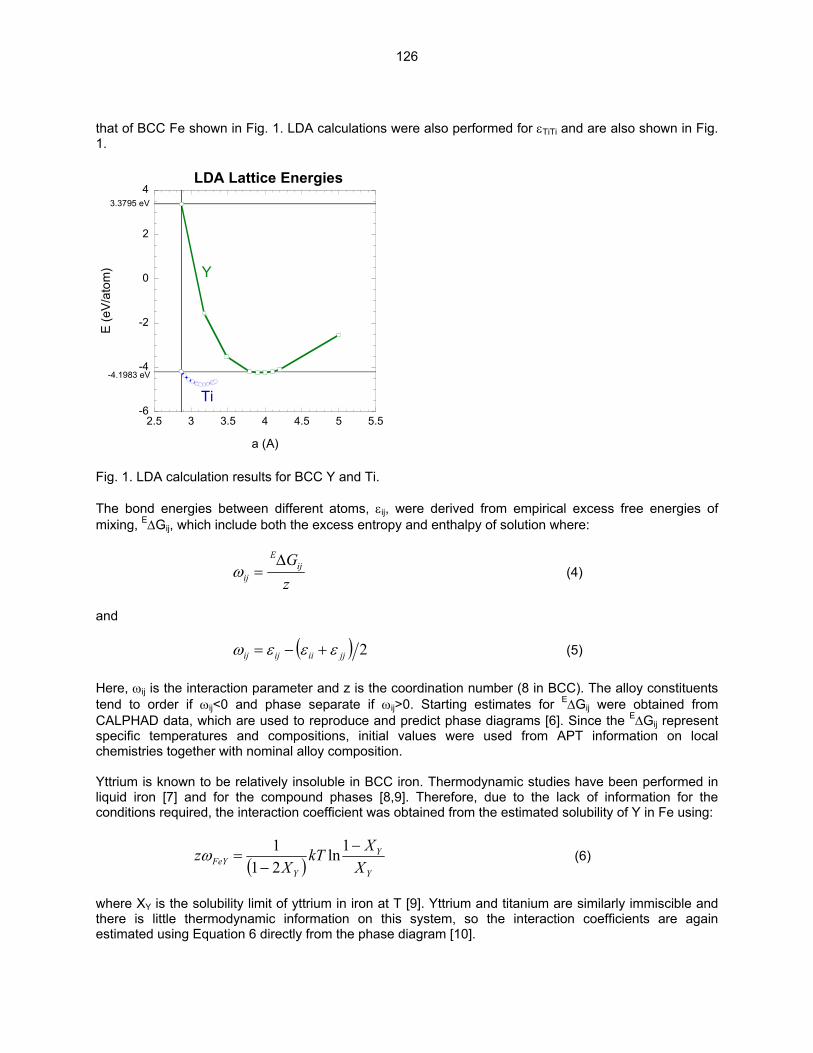
that of BCC Fe shown in Fig. 1. LDA calculations were also performed for εTiTi and are also shown in Fig. 1.
-6
-4
-2
0
2
4
2.5 3 3.5 4 4.5 5 5.
LDA Lattice Energies
E (e
V/at
om)
a (A)
3.3795 eV
-4.1983 eV
Y
Ti5
Fig. 1. LDA calculation results for BCC Y and Ti. The bond energies between different atoms, εij, were derived from empirical excess free energies of mixing, E∆Gij, which include both the excess entropy and enthalpy of solution where:
zGij
E
ij
∆=ω (4)
and
( ) 2jjiiijij εεεω +−= (5) Here, ωij is the interaction parameter and z is the coordination number (8 in BCC). The alloy constituents tend to order if ωij<0 and phase separate if ωij>0. Starting estimates for E∆Gij were obtained from CALPHAD data, which are used to reproduce and predict phase diagrams [6]. Since the E∆Gij represent specific temperatures and compositions, initial values were used from APT information on local chemistries together with nominal alloy composition. Yttrium is known to be relatively insoluble in BCC iron. Thermodynamic studies have been performed in liquid iron [7] and for the compound phases [8,9]. Therefore, due to the lack of information for the conditions required, the interaction coefficient was obtained from the estimated solubility of Y in Fe using:
( ) Y
Y
YFeY X
XkTX
z −−
=1ln
211ω (6)
where XY is the solubility limit of yttrium in iron at T [9]. Yttrium and titanium are similarly immiscible and there is little thermodynamic information on this system, so the interaction coefficients are again estimated using Equation 6 directly from the phase diagram [10].
126
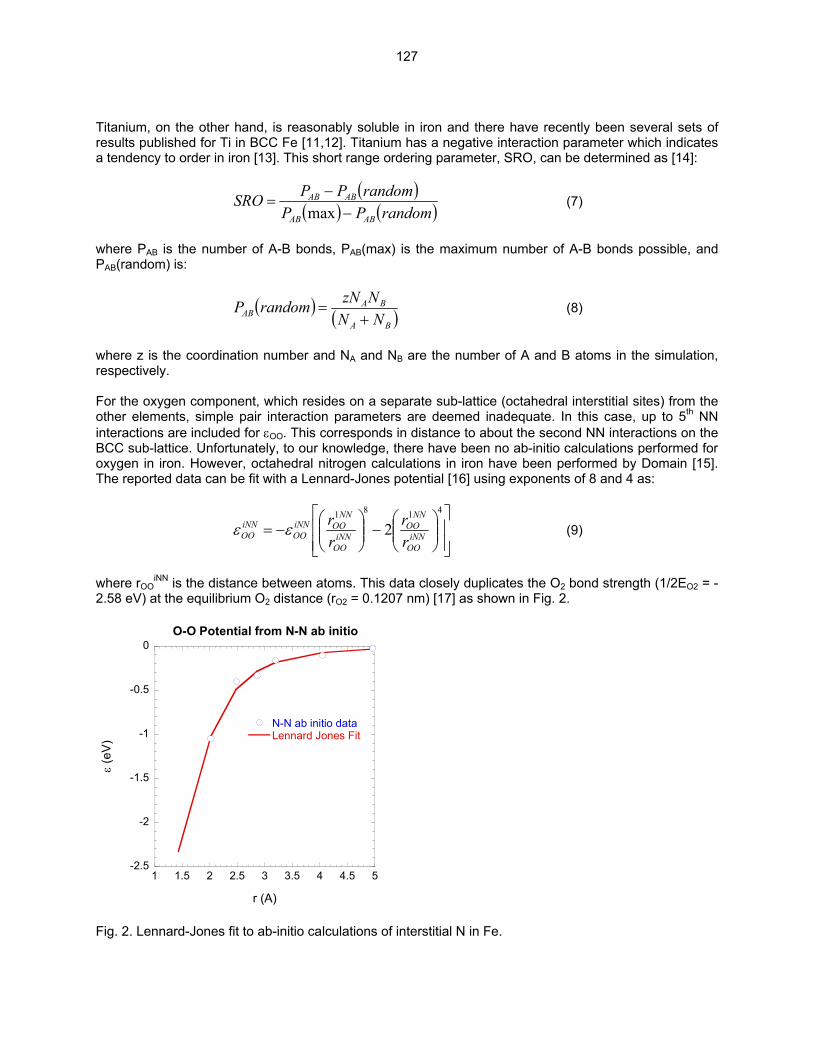
Titanium, on the other hand, is reasonably soluble in iron and there have recently been several sets of results published for Ti in BCC Fe [11,12]. Titanium has a negative interaction parameter which indicates a tendency to order in iron [13]. This short range ordering parameter, SRO, can be determined as [14]:
( )( ) ( )randomPP
randomPPSROABAB
ABAB
−−
=max
(7)
here PAB is the number of A-B bonds, PAB(max) is the maximum number of A-B bonds possible, and
)
wPAB(random) is:
( ) ( BA
BAAB NN
NzNrandomP+
= (8)
here z is the coordination number and NA and NB are the number of A and B atoms in the simulation,
or the oxygen component, which resides on a separate sub-lattice (octahedral interstitial sites) from the
wrespectively. Fother elements, simple pair interaction parameters are deemed inadequate. In this case, up to 5th NN interactions are included for εOO. This corresponds in distance to about the second NN interactions on the BCC sub-lattice. Unfortunately, to our knowledge, there have been no ab-initio calculations performed for oxygen in iron. However, octahedral nitrogen calculations in iron have been performed by Domain [15]. The reported data can be fit with a Lennard-Jones potential [16] using exponents of 8 and 4 as:
⎥⎥⎦
⎤
⎢⎢⎣
⎡⎟⎟⎠
⎞⎜⎜⎝
⎛−⎟⎟
⎠
⎞⎜⎜⎝
⎛−=
4181
2 iNNOO
NNOO
iNNOO
NNOOiNN
OOiNNOO r
rrrεε (9)
here rOO
iNN is the distance between atoms. This data closely duplicates the O2 bond strength (1/2EO2 = -
ig. 2. Lennard-Jones fit to ab-initio calculations of interstitial N in Fe.
w2.58 eV) at the equilibrium O2 distance (rO2 = 0.1207 nm) [17] as shown in Fig. 2.
-2.5
-2
-1.5
-1
-0.5
0
1 1.5 2 2.5 3 3.5 4 4.5 5
O-O Potential from N-N ab initio
N-N ab initio dataLennard Jones Fit
ε (e
V)
r (A)
F
127

The interaction coefficient of Fe and O, εFeO, was estimated from CALPHAD data [18,19]. However, 2nd NN interactions (to the BCC atom) are now included between the two sublattices. As there is no competition between the two different sublattices of a lattice site, the εii and εjj terms in Equation 5 are omitted and ωij = εij. To convert the interaction parameter ωij to first and second neighbor values, the Lennard-Jones potential from Equation 6 is used. The relative proportions of the interaction parameter are assumed to be distributed between the first and second NN as:
NNiO
NNiOiO
21 126 εε +=Ω (10) There are 6 first NN and 12 second NN bonds. Equations 6 and 7 can then be solved simultaneously to determine the 1st and 2nd NN interactions. For both yttrium and titanium, the interaction coefficients with oxygen in iron can be determined from the excess energy of formation of Y2O3 and Ti2O3 in iron where:
OiiOE XXG Ω=∆ (11)
where Xi and XO are the relative molar fractions of component i (Y and Ti) and oxygen in iron. The activity of oxygen is estimated using Sievert’s Law. The excess energy of formation in iron of Y2O3 is -17.70 eV and for Ti2O3 is -7.96 eV. The εii, εij and ωij are shown in Table 1. Results Verification of the Parameterization Verification of the system interaction parameters was performed using simulation cells of 5,488 BCC lattice sites (21,952 total sites) equivalent to a cell of 14x14x14 unit BCC Fe cells (4.01x4.01x4.01 nm3). The simulations were each performed for 5M MCS, enough to bring the systems to their lowest energy states. Based on the Fe-Y interaction parameter, ωFeY, the yttrium is anticipated to phase separate in iron. With increasing temperature, some Y will become soluble in the iron due to the limited solubility as well as the Gibbs-Thomson effect. The results for the system energy for Fe-1.0Y as a function of the MCS are shown in Fig. 3. The solubility can be expressed as XY = 4x10-31T8.81.
128
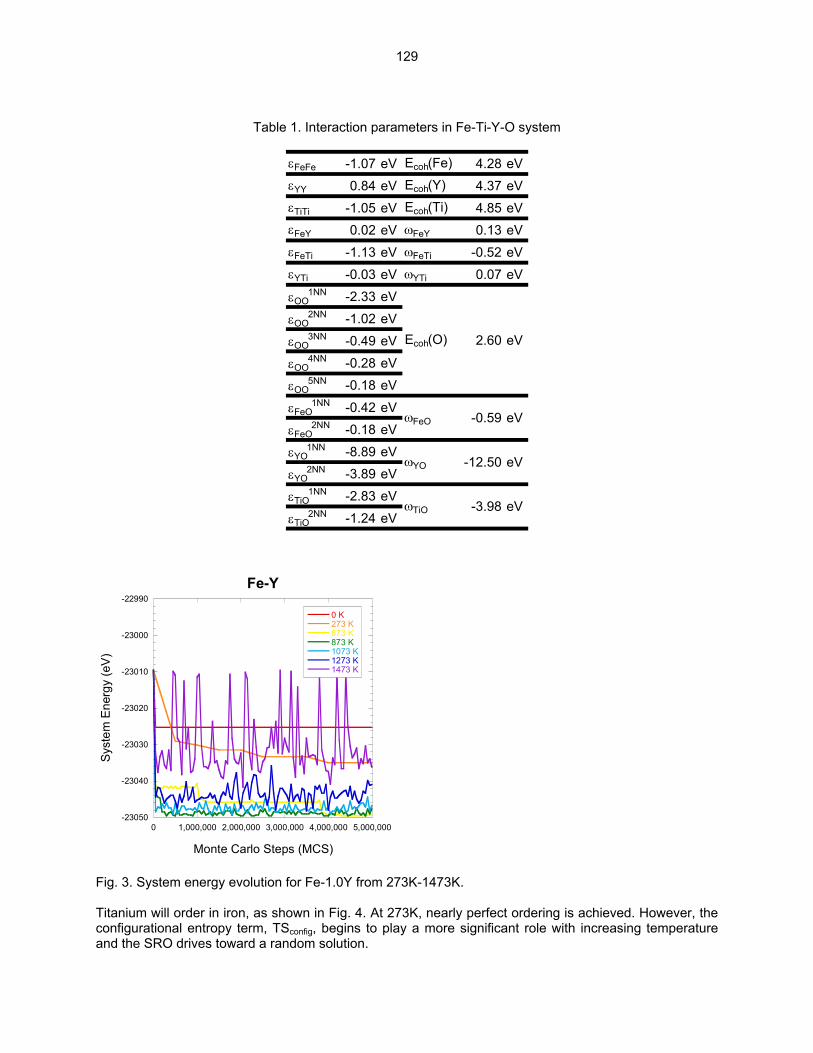
Table 1. Interaction parameters in Fe-Ti-Y-O system
Fig. 3. System energy evolution for Fe-1.0Y from 273K-1473K. Titanium will order in iron, as shown in Fig. 4. At 273K, nearly perfect ordering is achieved. However, the configurational entropy term, TSconfig, begins to play a more significant role with increasing temperature and the SRO drives toward a random solution.
-23050
-23040
-23030
-23020
-23010
-23000
-22990
0 1,000,000 2,000,000 3,000,000 4,000,000 5,000,000
Fe-Y
0 K273 K673 K873 K1073 K1273 K1473 K
Syst
em E
nerg
y (e
V)
Monte Carlo Steps (MCS)
ε FeFe -1.07 eV Ecoh(Fe) 4.28 eVEε YY 0.84 eV coh(Y) 4.37 eVEε TiTi -1.05 eV coh(Ti) 4.85 eV
ε FeY ω0.02 eV 0.13 eVFeY
ε FeTi ω-1.13 eV -0.52 eVFeTi
ε YTi ω-0.03 eV 0.07 eVYTi
ε OO1NN -2.33 eV
ε OO2NN -1.02 eV
ε OO3NN E-0.49 eV
ε OO4NN -0.28 eV
ε OO5NN -0.18 eV
ε FeO1NN -0.42 eV
ε FeO2NN -0.18 eV
ε YO 1NN -8.89 eV
ε YO 2NN -3.89 eV
ε TiO1NN -2.83 eV
ε TiO2NN -1.24 eV
ωTiO eV-3.98
coh(O) 2.60 eV
ω -0.59 eVFeO
ω -12.50 eVYO
129
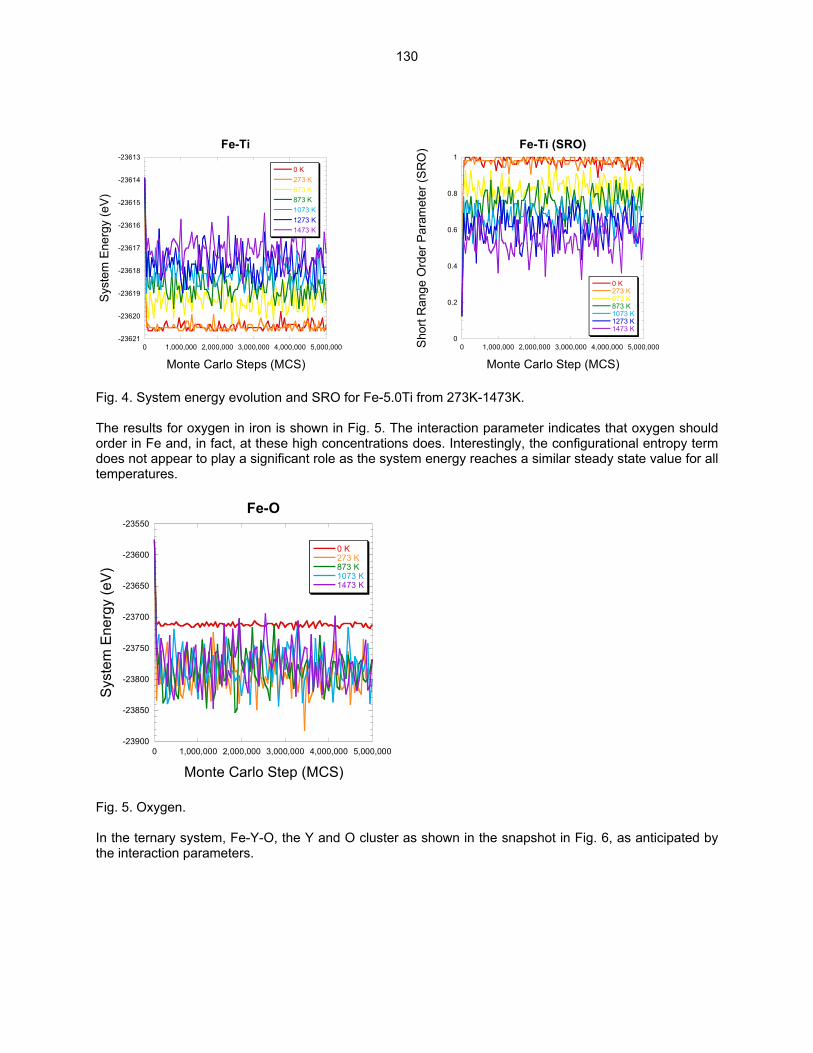
0
0.2
0.4
0.6
0.8
1
0 1,000,000 2,000,000 3,000,000 4,000,000 5,000,000
Fe-Ti (SRO)
0 K273 K673 K873 K1073 K1273 K1473 K
Shor
t Ran
ge O
rder
Par
amet
er (S
RO
)
Monte Carlo Step (MCS)
-23621
-23620
-23619
-23618
-23617
-23616
-23615
-23614
-23613
0 1,000,000 2,000,000 3,000,000 4,000,000 5,000,000
Fe-Ti
0 K273 K673 K873 K1073 K1273 K1473 K
Syst
em E
nerg
y (e
V)
Monte Carlo Steps (MCS) Fig. 4. System energy evolution and SRO for Fe-5.0Ti from 273K-1473K. The results for oxygen in iron is shown in Fig. 5. The interaction parameter indicates that oxygen should order in Fe and, in fact, at these high concentrations does. Interestingly, the configurational entropy term does not appear to play a significant role as the system energy reaches a similar steady state value for all temperatures.
-23900
-23850
-23800
-23750
-23700
-23650
-23600
-23550
0 1,000,000 2,000,000 3,000,000 4,000,000 5,000,000
Fe-O
0 K273 K873 K1073 K1473 K
Syst
em E
nerg
y (e
V)
Monte Carlo Step (MCS) Fig. 5. Oxygen. In the ternary system, Fe-Y-O, the Y and O cluster as shown in the snapshot in Fig. 6, as anticipated by the interaction parameters.
130
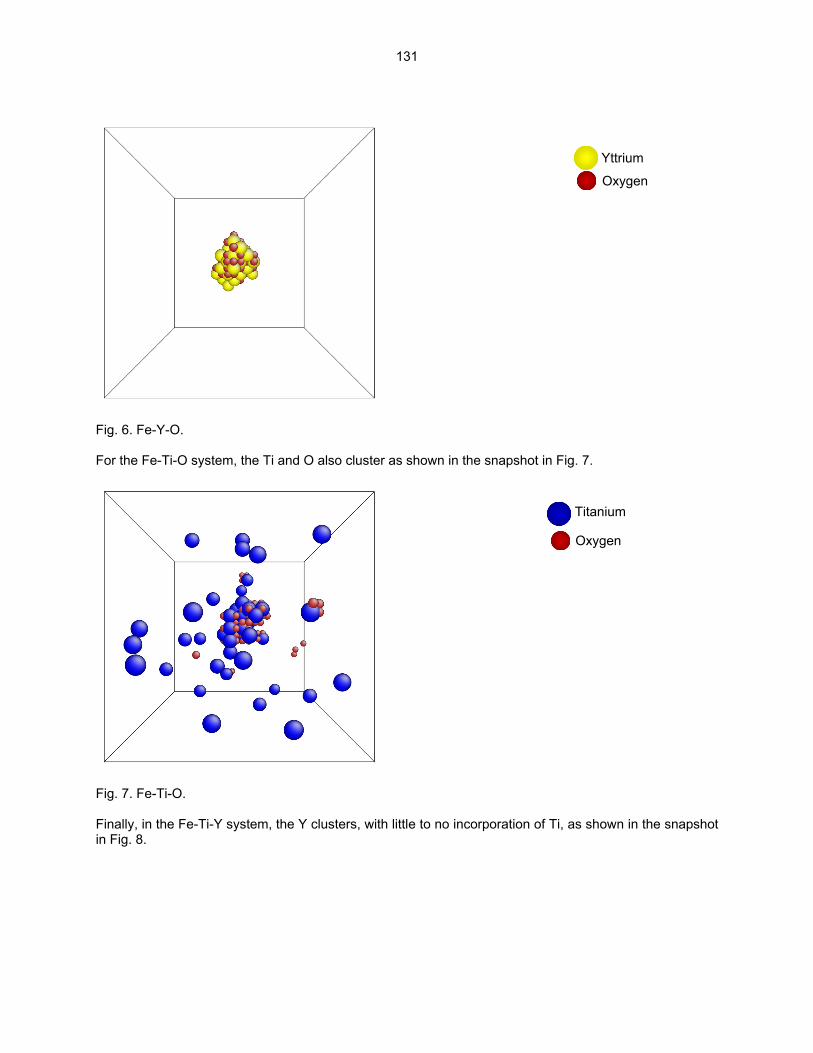
Fig. 6. Fe-Y-O. For the Fe-Ti-O system, the Ti and O also cluster as shown in the snapshot in Fig. 7.
Fig. 7. Fe-Ti-O. Finally, in the Fe-Ti-Y system, the Y clusters, with little to no incorporation of Ti, as sin Fig. 8.
131
Yttrium
h
Oxygen
m
n
OxygeTitaniu
own in the snapshot
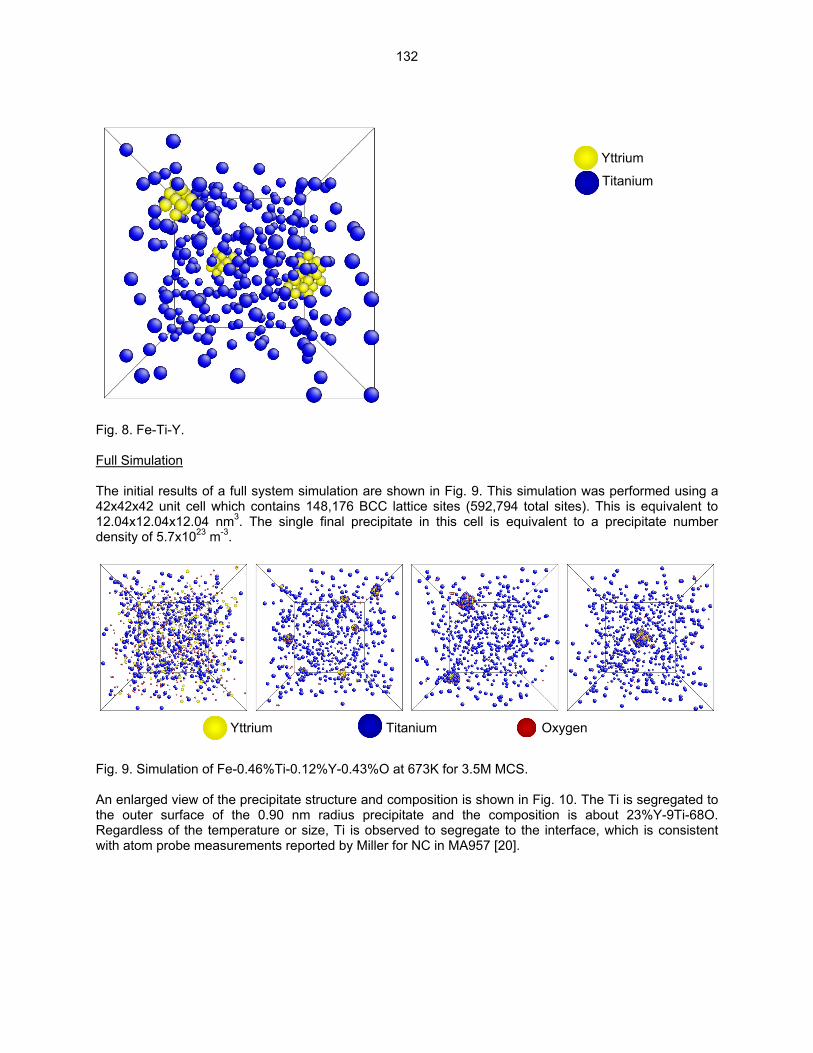
Fig. 8. Fe-Ti-Y. Full Simulation The initial results of a full system simulation are shown in Fig. 9. This simulation wa42x42x42 unit cell which contains 148,176 BCC lattice sites (592,794 total sites). 12.04x12.04x12.04 nm3. The single final precipitate in this cell is equivalent to adensity of 5.7x10²³ m-3.
Yttrium Titanium Oxygen Fig. 9. Simulation of Fe-0.46%Ti-0.12%Y-0.43%O at 673K for 3.5M MCS. An enlarged view of the precipitate structure and composition is shown in Fig. 10. Ththe outer surface of the 0.90 nm radius precipitate and the composition is aRegardless of the temperature or size, Ti is observed to segregate to the interfacewith atom probe measurements reported by Miller for NC in MA957 [20].
132
Yttrium
m
b
Titaniu
s performed using a This is equivalent to precipitate number
e Ti is segregated to out 23%Y-9Ti-68O.
, which is consistent

Yttrium Titanium Oxygen Fig. 10. NC composition for Fe-0.46Ti-0.12Y-0.43O simulation. Future Work Future work will focus on the following items: 1. Larger simulation cells (2M BCC atoms) for improved stochastic information. 2. Study the effects of temperature on NC composition. 3. Study the effects of excess oxygen on NC composition. 4. Study the effects of lattice strain energy. 5. Evaluate the formation energy of the NCs. 6. Evaluate the dissolution energy/binding energy. 7. Thorough comparison of the simulation results with SANS and APT data. Acknowledgements The authors would like to thank Hyon-Jee Lee for graciously calculating the LDA cohesive energies for Y and Ti on a BCC Fe lattice. This work has been supported by the Office of Fusion Energy Sciences, U.S. Department of Energy, under Grant DE-FG02-04ER54750.
References [1] M. J. Alinger, G. R. Odette, and D. T. Hoelzer, J. Nucl. Mater. 329–333 (2004) 382. [2] S. Ukai and M. Fujiwara, J. Nucl. Mater. 307–311 (2002) 749. [3] H. Kishimoto, M. J. Alinger, G. R. Odette, and T. Yamamoto, J. Nucl. Mater. 329–333 (2004) 369. [4] M. J. Alinger, On the Formation and Stability of Nanometer Scale Precipitates in Ferritic Alloys During Processing and High Temperature Service, dissertation submitted in partial fulfillment of Ph.D. degree in Materials from the University of California, Santa Barbara (2004). [5] C. Kittel, Introduction to Solid State Physics, John Wiley & Sons, Inc., New York (1996). [6] U. R. Kattner, JOM 49 (1997) 14. [7] D. U. Ting and W. Longmei, J. Less-Common Metals 110 (1985) 179.
133
[8] R. Coehoorn, Phys. Rev. B 39 (1989) 13072. [9] P. R. Subramanian and J. F. Smith, Calphad 8 (1984) 295. [10] J. L. Murray, Binary Alloy Phase Diagrams, ASM, Metals Park, Ohio (1986). [11] K. C. Hari Kumar, P. Wollants, and L. Delaey, Calphad 18 (1994) 223. [12] S. Jonsson, Metall. Mater. Trans. B 29 (1998) 361. [13] J. Cieslak and S. M. Dubiel, J. Alloy. Compd. 387 (2005) 36. [14] D. A. Porter and K. E. Easterling, Phase Transformations in Metals and Alloys, Nelson Thornes Ltd., Padstow (2001). [15] C. Domain, C. S. Becquart, and J. Foct, Phys. Rev. B 69 (2004). [16] R. Furth, Proceedings of the Royal Society of London, Series A, Math. Phys. Sci. 183 (1944) 87. [17] CRC, Handbook of Chemistry and Physics, 51st Ed., R. C. Weast (ed.), CRC Press, Cleveland, Ohio (1970) F-57. [18] M. Kowalski and P. J. Spencer, Calphad 19 (1995) 229. [19] P. J. Spencer and O. Kubaschewski, Calphad 2 (1978) 147. [20] M. K. Miller, D. T. Hoelzer, E. A. Kenik, and K. F. Russell, Intermetallics 13 (2005) 387.
134
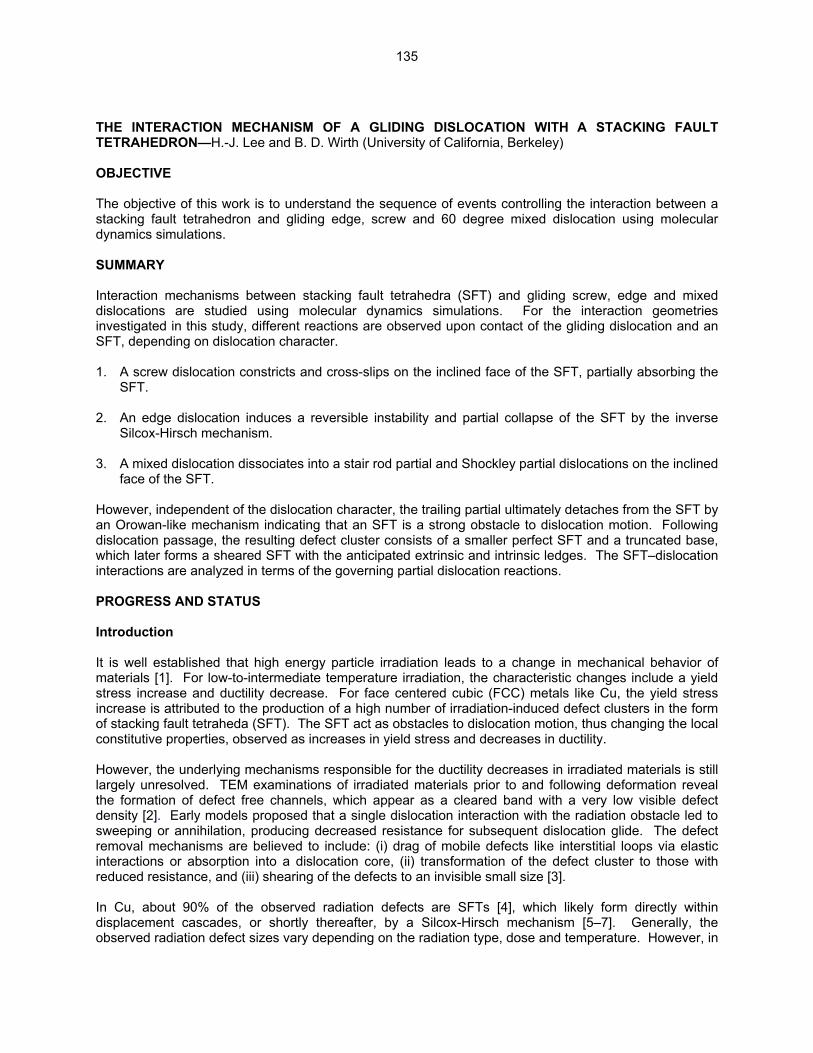
THE INTERACTION MECHANISM OF A GLIDING DISLOCATION WITH A STACKING FAULT TETRAHEDRON—H.-J. Lee and B. D. Wirth (University of California, Berkeley) OBJECTIVE The objective of this work is to understand the sequence of events controlling the interaction between a stacking fault tetrahedron and gliding edge, screw and 60 degree mixed dislocation using molecular dynamics simulations. SUMMARY Interaction mechanisms between stacking fault tetrahedra (SFT) and gliding screw, edge and mixed dislocations are studied using molecular dynamics simulations. For the interaction geometries investigated in this study, different reactions are observed upon contact of the gliding dislocation and an SFT, depending on dislocation character. 1. A screw dislocation constricts and cross-slips on the inclined face of the SFT, partially absorbing the
SFT. 2. An edge dislocation induces a reversible instability and partial collapse of the SFT by the inverse
Silcox-Hirsch mechanism. 3. A mixed dislocation dissociates into a stair rod partial and Shockley partial dislocations on the inclined
face of the SFT. However, independent of the dislocation character, the trailing partial ultimately detaches from the SFT by an Orowan-like mechanism indicating that an SFT is a strong obstacle to dislocation motion. Following dislocation passage, the resulting defect cluster consists of a smaller perfect SFT and a truncated base, which later forms a sheared SFT with the anticipated extrinsic and intrinsic ledges. The SFT–dislocation interactions are analyzed in terms of the governing partial dislocation reactions. PROGRESS AND STATUS Introduction It is well established that high energy particle irradiation leads to a change in mechanical behavior of materials [1]. For low-to-intermediate temperature irradiation, the characteristic changes include a yield stress increase and ductility decrease. For face centered cubic (FCC) metals like Cu, the yield stress increase is attributed to the production of a high number of irradiation-induced defect clusters in the form of stacking fault tetraheda (SFT). The SFT act as obstacles to dislocation motion, thus changing the local constitutive properties, observed as increases in yield stress and decreases in ductility. However, the underlying mechanisms responsible for the ductility decreases in irradiated materials is still largely unresolved. TEM examinations of irradiated materials prior to and following deformation reveal the formation of defect free channels, which appear as a cleared band with a very low visible defect density [2]. Early models proposed that a single dislocation interaction with the radiation obstacle led to sweeping or annihilation, producing decreased resistance for subsequent dislocation glide. The defect removal mechanisms are believed to include: (i) drag of mobile defects like interstitial loops via elastic interactions or absorption into a dislocation core, (ii) transformation of the defect cluster to those with reduced resistance, and (iii) shearing of the defects to an invisible small size [3]. In Cu, about 90% of the observed radiation defects are SFTs [4], which likely form directly within displacement cascades, or shortly thereafter, by a Silcox-Hirsch mechanism [5–7]. Generally, the observed radiation defect sizes vary depending on the radiation type, dose and temperature. However, in
135

neutron as well as ion - irradiated Cu, the average SFT size is 2.5±0.5nm over a fairly wide irradiation temperature regime of 20 ~ 200ºC [8]. Given the uncertainties on the controlling mechanisms of (defect free) channel formation, molecular dynamics (MD) simulation methods can provide understanding of the interaction between the SFT and dislocations, which govern (defect free) channel formation, irradiation hardening and ductility loss. Previous MD simulations have been used to understand the interaction between an SFT and an edge dislocation in Cu and shown that the SFT is neither absorbed nor destroyed by the interaction [9,10]. Upon further interactions with the edge dislocation, the SFT is sheared further and separated into two pieces, a smaller perfect SFT and a truncated base. Osetsky et al. reported that the critical resolved shear stress (CRSS) increases as the glide plane of an edge dislocation gets closer to the base of the SFT and the temperature decreases [10]. These results are in qualitative agreement with in situ-TEM observations [11]. A screw dislocation is presumed more effective at annihilating SFTs, due to its ability to cross-slip and remove the stacking faults, as initially proposed by Kimura and Maddin [12]. Indeed, early in-situ TEM observations by Johnson et al. [13] and more recently by Robach et al. [11] show that screw dislocations are more efficient than edge dislocations at removing radiation obstacles. Additionally, Matsukawa et al. has reported the annihilation of an SFT base portion by a moving dislocation in in-situ TEM experiments of quenched gold [14]. However, the atomistic details of the interaction between dislocations and SFT are not fully known. In this report, we present the results of MD simulations, which investigate the interactions between SFT and a moving screw, edge and mixed dislocation and the detailed interpretation of simulation results. Simulation Methods The MD simulations were performed using the MDCASK code [15] with an embedded atom method (EAM) potential by Mishin and co-workers [16]. The material properties obtained from the Cu EAM potential are summarized in Table 1. Note that the stacking fault energy obtained with this EAM potential (44.4 mJ/m2) is very close to the experimental value of 45 mJ/m2. A realistic stacking fault energy is important because this property controls the width of Shockley partial dislocation separation, as well as SFT stability.
Table 1. The physical properties of Cu
Experiment [17–18] EAM [16] α [Å] 3.615 3.615
Ecoh [eV] 3.54 3.54 B [GPa] 138.3 138.3
C11 [GPa] 170.0 169.9 C12 [GPa] 122.5 122.6 C44 [GPa] 75.8 76.2
γSF [mJ/m2] 45 44.4 The comparison between the experimental data and the values obtained from the EAM used in this work [16–18]. Here, the lattice constant α, cohesive energy Ecoh, bulk modulus B, elastic constants Cij, and stacking fault energy γSF are shown. A simulation cell with FCC crystalline structure in orientations of x = [ 111], y = 1/2[110] and z = 1/2[112 ] is used. For a screw dislocation, a simulation cell with 31.4 nm in x, 22.5 nm in y and 44.3 nm in z direction, which is (50 x 88 x 100) in unit cells and contains 2.6 x 10⁶ atoms is used. For an edge dislocation, a simulation cell with 31.4 nm in x, 25.5 nm in y and 39.0 nm in z direction, which is (50 x 100 x 88) in unit cells and contains 2.6 x 10⁶ atoms is used. For a mixed dislocation, a simulation cell with 12.5 nm in x, 22.5 nm in y and 35.3 nm in z direction, which is (20 x 88 x 80) in unit cells and contains ~
136
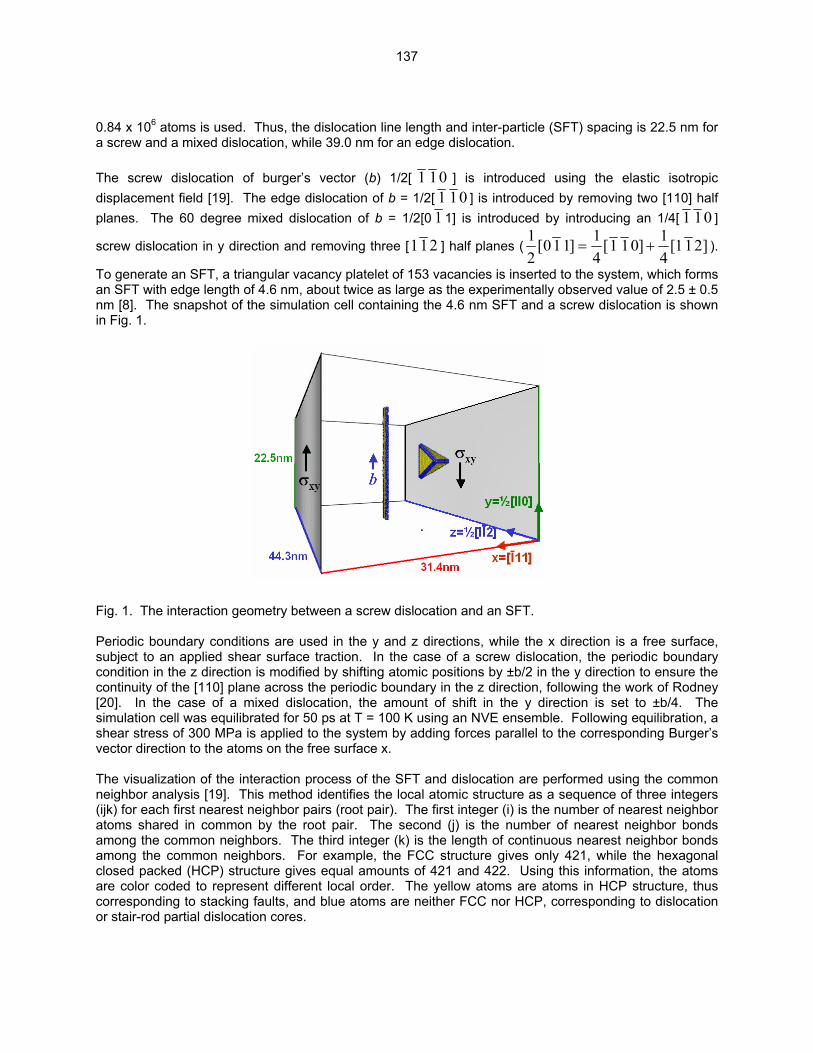
0.84 x 10⁶ atoms is used. Thus, the dislocation line length and inter-particle (SFT) spacing is 22.5 nm for a screw and a mixed dislocation, while 39.0 nm for an edge dislocation. The screw dislocation of burger’s vector (b) 1/2[ 1 10 ] is introduced using the elastic isotropic displacement field [19]. The edge dislocation of b = 1/2[ 1 10 ] is introduced by removing two [110] half planes. The 60 degree mixed dislocation of b = 1/2[0 1 1] is introduced by introducing an 1/4[ 1 10 ]
screw dislocation in y direction and removing three [112 ] half planes (12
011 14
1 10 14
112[ ] [ ] [= + ] ).
To generate an SFT, a triangular vacancy platelet of 153 vacancies is inserted to the system, which forms an SFT with edge length of 4.6 nm, about twice as large as the experimentally observed value of 2.5 ± 0.5 nm [8]. The snapshot of the simulation cell containing the 4.6 nm SFT and a screw dislocation is shown in Fig. 1. Fig. 1. The interaction geometry between a screw dislocation and an SFT. Periodic boundary conditions are used in the y and z directions, while the x direction is a free surface, subject to an applied shear surface traction. In the case of a screw dislocation, the periodic boundary condition in the z direction is modified by shifting atomic positions by ±b/2 in the y direction to ensure the continuity of the [110] plane across the periodic boundary in the z direction, following the work of Rodney [20]. In the case of a mixed dislocation, the amount of shift in the y direction is set to ±b/4. The simulation cell was equilibrated for 50 ps at T = 100 K using an NVE ensemble. Following equilibration, a shear stress of 300 MPa is applied to the system by adding forces parallel to the corresponding Burger’s vector direction to the atoms on the free surface x. The visualization of the interaction process of the SFT and dislocation are performed using the common neighbor analysis [19]. This method identifies the local atomic structure as a sequence of three integers (ijk) for each first nearest neighbor pairs (root pair). The first integer (i) is the number of nearest neighbor atoms shared in common by the root pair. The second (j) is the number of nearest neighbor bonds among the common neighbors. The third integer (k) is the length of continuous nearest neighbor bonds among the common neighbors. For example, the FCC structure gives only 421, while the hexagonal closed packed (HCP) structure gives equal amounts of 421 and 422. Using this information, the atoms are color coded to represent different local order. The yellow atoms are atoms in HCP structure, thus corresponding to stacking faults, and blue atoms are neither FCC nor HCP, corresponding to dislocation or stair-rod partial dislocation cores.
137

Results and Discussion For the interaction geometry used in this study, the resulting SFT structures immediately after the interaction with screw, mixed and edge dislocations are almost identical, even though the sequence of events during the interaction processes are different. As shown in Fig. 2, the SFT is effectively decomposed into a smaller perfect SFT and a truncated base regardless of the character of the dislocation with which it interacted. The truncated base is a sessile defect, composed of four Shockley and six stair-rod partial dislocations. D
C
B
C
B
D
C
B
D (a) (b) (c)
Fig. 2. The structure of SFT immediately after the detachment of trailing partial (δA) when the gliding dislocation is (a) Screw dislocation (b = BA), (b) Edge dislocation (b = BA), (c) Mixed dislocation (b = CA). The δA tailing partial detached by an Orowan-like mechanism, leaving δA segment on the SFT. Shortly after the detachment of the trailing partial, which occurs by an Orowan-like mechanism, additional dislocation reactions occur between the small perfect SFT and the truncated base, resulting in transformation to a sheared SFT structure containing ledges. These structures are shown in Fig. 3. The ledges shown in (a) and (c) are consistent with the anticipated interstitial (I) and vacancy (V)-ledges formed as a result of shear of the SFT [22]. Notably, the ledges are often unstable and can self-heal through dislocation glide reactions, as expected from the relatively high ledge energies.
B
A
(b)
B
A
C
(c)
B
A
C
(a) C Fig. 3. The structure of SFT 5ps after the detachment of trailing partial (δA) when the gliding dislocation is (a) Screw dislocation (b = BA), (b) Edge dislocation (b = BA), (c) Mixed dislocation (b = CA). Note that along the burgers vector, no ledges are formed on the sheared SFT surface.
138
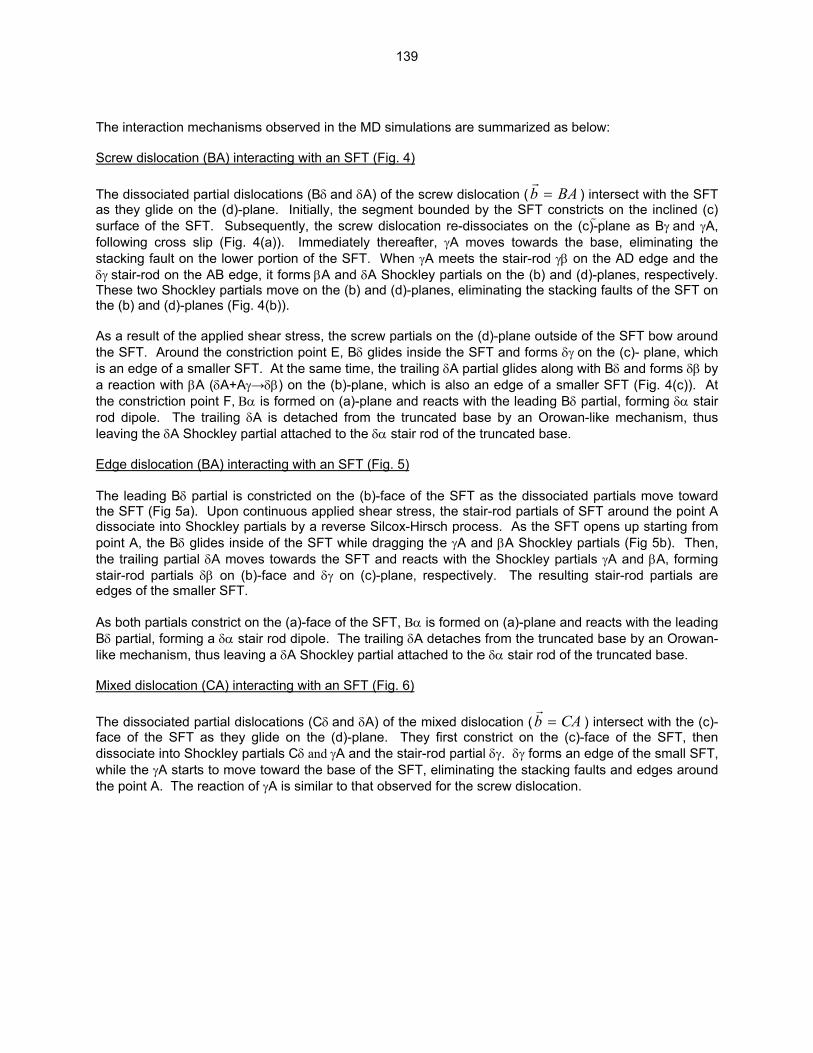
The interaction mechanisms observed in the MD simulations are summarized as below: Screw dislocation (BA) interacting with an SFT (Fig. 4) The dissociated partial dislocations (Bδ and δA) of the screw dislocation (
rb BA= ) intersect with the SFT
as they glide on the (d)-plane. Initially, the segment bounded by the SFT constricts on the inclined (c) surface of the SFT. Subsequently, the screw dislocation re-dissociates on the (c)-plane as Bγ and γA, following cross slip (Fig. 4(a)). Immediately thereafter, γA moves towards the base, eliminating the stacking fault on the lower portion of the SFT. When γA meets the stair-rod γβ on the AD edge and the δγ stair-rod on the AB edge, it forms βA and δA Shockley partials on the (b) and (d)-planes, respectively. These two Shockley partials move on the (b) and (d)-planes, eliminating the stacking faults of the SFT on the (b) and (d)-planes (Fig. 4(b)). As a result of the applied shear stress, the screw partials on the (d)-plane outside of the SFT bow around the SFT. Around the constriction point E, Bδ glides inside the SFT and forms δγ on the (c)- plane, which is an edge of a smaller SFT. At the same time, the trailing δA partial glides along with Bδ and forms δβ by a reaction with βA (δA+Aγ→δβ) on the (b)-plane, which is also an edge of a smaller SFT (Fig. 4(c)). At the constriction point F, Βα is formed on (a)-plane and reacts with the leading Bδ partial, forming δα stair rod dipole. The trailing δA is detached from the truncated base by an Orowan-like mechanism, thus leaving the δA Shockley partial attached to the δα stair rod of the truncated base. Edge dislocation (BA) interacting with an SFT (Fig. 5) The leading Bδ partial is constricted on the (b)-face of the SFT as the dissociated partials move toward the SFT (Fig 5a). Upon continuous applied shear stress, the stair-rod partials of SFT around the point A dissociate into Shockley partials by a reverse Silcox-Hirsch process. As the SFT opens up starting from point A, the Bδ glides inside of the SFT while dragging the γA and βA Shockley partials (Fig 5b). Then, the trailing partial δA moves towards the SFT and reacts with the Shockley partials γA and βA, forming stair-rod partials δβ on (b)-face and δγ on (c)-plane, respectively. The resulting stair-rod partials are edges of the smaller SFT. As both partials constrict on the (a)-face of the SFT, Βα is formed on (a)-plane and reacts with the leading Bδ partial, forming a δα stair rod dipole. The trailing δA detaches from the truncated base by an Orowan-like mechanism, thus leaving a δA Shockley partial attached to the δα stair rod of the truncated base. Mixed dislocation (CA) interacting with an SFT (Fig. 6) The dissociated partial dislocations (Cδ and δA) of the mixed dislocation (
rb CA= ) intersect with the (c)-
face of the SFT as they glide on the (d)-plane. They first constrict on the (c)-face of the SFT, then dissociate into Shockley partials Cδ and γA and the stair-rod partial δγ. δγ forms an edge of the small SFT, while the γA starts to move toward the base of the SFT, eliminating the stacking faults and edges around the point A. The reaction of γA is similar to that observed for the screw dislocation.
139

CB
C
BA
D D
Bδ
δΑ
δβ
δγ δα C
B D
Bδ
δA
C
B A
Βγ
γΑ
δΑ
βΑ
A
βα
γΑ
Βγ αγ γβ (a)
(b)
Fig. 4. Screw dislocation (b = BA) passing the SFT at applied shear stress 300 MPa.
C
B
C
B
DB
B
C
AδΑ Bδ
δβ
Bδ δΑ
Βα
δα
δγ
B
C
AδΑ
δβ
Bδ
Bδ δΑ
δα
δγ
γΑ
B
C
βα
δγ δα
D
γβ
δβ
αγ
βΑ δβ
δα δγ
δΑ
δα
βα δΑ
αγ
δα
(c)
(d)
(e)
140

B
C
C
B
B
C
B
C
A
δΑ
Bδ Bδ
δΑ δα
δγ
δβ
αγ
δβ
δγ βA δα δα Bδ
B
C
A
δΑ
Bδ Bδ
δΑ
δα
δβ
δγ
αγ
βα
B
C
A δΑ
Bδ Bδ
δΑ
δα αγ
βΑ
Bδ
γΑ
γΑ
B
C βΑ δβ
δα δγ
δΑ
δα
βα
δγ δα
D
αγ
δβ
Βα Βα
γβ
βα δΑ
αγ
(a) (b) (c) (d) Fig. 5. Edge dislocation (b = BA) passing the SFT at applied shear stress 300 MPa.
141
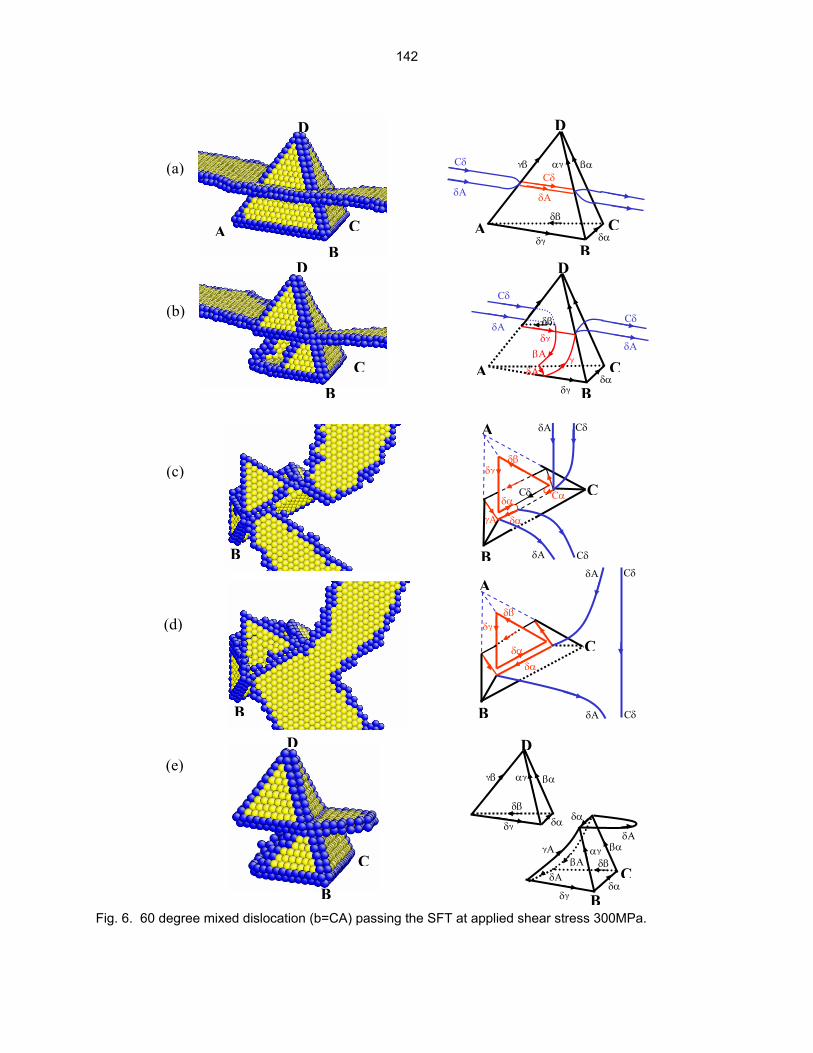
D
Cδ
δΑ
δβ
δγ δα C
B
B
DCδ
δΑ
δΑ
Cδ
A Cγ
δγ
δγ δα
βΑ
δΑ
δβ
A
βα
δΑ
Cδ αγ γβ
D
CB
C
B
D
B
B
CB
A
D
(a)
(b)
B
C
AδΑ
δβ
Cδ
Cδ δΑ
δα
δγ
δα
γA
B
C
A δΑ
δβ
Cδ
Cδ δΑ
δα
δγ
Cδ δα Cα
(c)
(d)
Fig. 6. 60 degree mixed dislocation (b=CA) passing the SFT at applied shear stress 300MPa.
γΑ
B
C
βα
δγ δα
D
γβ
δβ
αγ
βΑ
δα δγ
δΑ
δα
αγ δβ
βα δΑ
(e)
142

As the leading Cδ cuts through the SFT, the trailing δA forms δβ on the (b)-face of the SFT, producing an edge of the small SFT. When both partials constrict on the (a)-plane, Cα is formed. Cα reacts with Cδ, forming a δα stair-rod dipole. Identical to the previous two cases, the trailing δA detaches from the truncated base by an Orowan-like mechanism, thus leaving a δA Shockley partial attached to the δα stair rod of the truncated base. Conclusions The interaction mechanisms between an SFT and gliding screw, edge and mixed dislocations are studied using molecular dynamics simulation methods. Each type of dislocation exhibits a different interaction behavior upon initial contact with the SFT. A screw dislocation cross-slips onto the inclined surface of the SFT. One of the cross-slipped Shockley partials moves toward the base of the SFT, thereby partially eliminating the stacking fault of the SFT. An edge dislocation induces SFT instability and partial collapse by a reverse Silcox-Hirsch process upon contact. A mixed dislocation dissociates into Shockley partials and a stair rod partial dislocation on the inclined face of the SFT. However, in all cases, the dislocation bypasses the SFT prior to complete absorption or annihilation of the defect. The trailing partial detaches from the truncated base by an Orowan-like mechanism, independent of dislocation character. The detailed SFT–dislocation interactions are explained in terms of the governing partial dislocation reactions. Regardless of the dislocation character, an SFT is transformed to a smaller perfect SFT and a truncated base as the dislocation passes through the SFT, which then finally transforms into a sheared SFT with I and V-ledges. Acknowledgements This work has been supported by the Office of Fusion Energy Sciences, U.S. Department of Energy, under Grant DE-FG02-04ER54750. References [1] M. Victoria, N. Baluc, C. Bailat, Y. Dai, M. I. Luppo, R. Schaublin, and B. N. Singh, The microstructure and associated tensile properties of irradiated FCC and BCC metals, J. Nucl. Mater. 276 (2000) 114–122. [2] R. S. Averback and T. D. de la Rubia, Displacement damage in irradiated metals and semiconductors, Solid State Physics–Advances In Research and Applications 51 (1998) 281–402. [3] D. Rodney, Atomic-scale modeling of clear band formation in FCC metals, Nucl. Instrum. Methods Phys. Res. Sect. B: Beam Interact. Mater. 228 (2005) 100–110 (Special Issue SI). [4] B. N. Singh and S. J. Zinkle, Defect accumulation in pure FCC metals in the transient regime–A review, J. Nucl. Mater. 206 (2-3) (1993) 212–229. [5] J. Silcox and P. B. Hirsch, Direct observations of defects in quenched gold, Philos. Mag. 4 (37) (1959) 72–89. [6] B. D. Wirth, V. Bulatov, and T. D. de la Rubia, Atomistic simulation of stacking fault tetrahedra formation in Cu, J. Nucl. Mater. 283 (2000) 773–777 (Part B Ded). [7] Y. N. Osetsky, D. J. Bacaon, B. N. Singh, and B. Wirth, Atomistic study of the generation, interaction, accumulation, and annihilation of cascade-induced defect clusters, J. Nucl. Mater. 307 (2002) 852–861 (Part B). [8] B. N. Singh and S. J. Zinkle, Defect accumulation in pure FCC metals in the transient regime–A review, J. Nucl. Mater. 206 (2-3) (1993) 212–229. [9] B. D. Wirth, W. Bulatov, and T. D. de la Rubia, Dislocation-stacking fault tetrahedron interactions in Cu, J. Eng. Mater. Technol. (Trans. ASME) 124 (3) (2002) 329–334. [10] Y. N. Osetsky, R. E. Stoller, and Y. Matsukawa, Dislocation-stacking fault tetrahedron interaction: What can we learn from atomic-scale modeling, J. Nucl. Mater. 329 (2004) 1228–1232 (Part B). [11] J. S. Robach, I. M. Robertson, B. D. Wirth, and A. Arsenlis, In-situ transmission electron microscopy observations and molecular dynamics simulations of dislocation-defect interactions in ion-irradiated copper, Philos. Mag. 83 (8) (2003) 955–967.
143

[12] H. Kimura and R. Maddin, Lattice defects in quenched metals, in R. Cotterill (ed.), Proceedings of an International Conference, Argonne National Laboratory, June 15–17, 1964 (Academic Press, New York, 1965) 319. [13] E. Johnson and P. B. Hirsch, Insitu straining In the HVEM of neutron-irradiated copper-crystals, Philos. Mag. A–Phys. Cond. Matter Struc. Def. Mech. Prop. 43 (1) (1981) 157–170. [14] Y. Matsukawa and S. J. Zinkle, Dynamic observation of the collapse process of a stacking fault tetrahedron by moving dislocations, J. Nucl. Mater. 329–333 (2004) 919–923 (Part B). [15] T. D. De La Rubia and M. W. Guinan, Progress in the development of a molecular-dynamics code for high-energy cascade studies, J. Nucl. Mater. 174 (2-3) (1990) 151–157. [16] Y. Mishin et al., Structural stability and lattice defects in copper: Ab initio, tight-binding, and embedded-atom calculations, Phys. Rev. B 63 (22) (2001) Art. No. 224106. [17] G. Simons and H. Wang, Single Crystal Elastic Constants and Calculated Aggregate Properties, MIT Press, Cambridge, Mass. (1977). [18] C. B. Carter and I. L. F. Ray, Philos. Mag. 35 (1977) 189. [19] J. Weertman and J. R. Weertman, Elementary Dislocation Theory, Oxford University Press (1992). [20] D. Rodney, Molecular dynamics simulation of screw dislocations interacting with interstitial frank loops in a model FCC crystal, Acta Mater. 52 (3) (2004) 607–614. [21] A. S. Clarke and H. Jonsson, Structural-changes accompanying densification of random hard-sphere packings, Phys. Rev. E 47 (6) (1993) 3975–3984. [22] D. Kuhlmann, Growth and annealing of stacking fault tetrahedra, Acta Metall. 13 (3) (1965) 257.
144
10. DOSIMETRY, DAMAGE PARAMETERS, ANDACTIVATION CALCULATIONS
No contributions.
145

11. MATERIALS ENGINEERING AND DESIGNREQUIREMENTS
No contributions.
146

12. IRRADIATION FACILITIES AND TEST MATRICES
147
IRRADIATION PROGRESS OF MFE-RB-17J EXPERIMENT—D. K. Felde and R. L. Wallace (Oak Ridge National Laboratory) OBJECTIVE The objective of this work is to irradiate mostly vanadium alloy specimens in direct contact with lithium at temperatures of 450°C, 600°C, and 700°C in a europium-shielded RB position of the High Flux Isotope Reactor (HFIR). Some steel and ceramic specimens are included but are isolated from the primary lithium bath. SUMMARY The 17J experiment has been irradiated for 5 of the 10 planned cycles in the HFIR for a total of 9930 MWD. Cycles 403A, 404, and 403B were conducted during this reporting period. The upper capsule that had been operating below the target temperature of 700°C for the previous 2 cycles degraded further in Cycle 403A, falling more than 200°C below the target temperature. A possible cause is lithium leaking from the capsule and forming a thermal conduction path to the housing wall. The middle capsule has operated near its target temperature of 600°C, although a cooling trend has also been experienced for this capsule. This trend required increasing percentages of argon gas to maintain temperature. By the end of cycle 403B (performed after cycle 404), more than 95% argon was required to maintain temperature in the middle holder. The reason for the cooling trend is unknown at this time. Speculation includes possible swelling of the molybdenum capsule walls leading to a reduced gas gap or possible effects from lithium leaking from the upper capsule. The uncertainty in the cause of the cooling trend and the risk of not being able to maintain desired temperature for a marginal increase in dose based on the projected HFIR operating schedule led to a decision to discontinue irradiation of the experiment. PROGRESS AND STATUS Background The MFE-RB-17J irradiation experiment was described in an earlier report [1] and the first three operating cycles are described in previous progress reports [2, 3]. Three axially stacked specimen holders are contained within a common inner containment housing, which is itself contained in an outer containment housing tube. The two upper holders are made from the molybdenum alloy TZM and the lower holder is made from stainless steel. The holders are designed to irradiate three sets of metallurgical and ceramic test specimens in lithium baths at 700°C, 600°C, and 450°C, in order from top to bottom within the experiment. The temperatures of the three holders are controlled independently by adjusting the mixture of inert gases flowing between the holders and the inner housing, which effectively controls the thermal conductivity and consequently the temperature difference across the gas gap between the holder and the inner housing. Gas supply lines can feed helium, neon or argon or a mixture of either helium and neon or helium and argon to the plenums below each of the three holders. Gas from lower holders become part of the mixture for upper holders, so while the temperature of the zones can be independently controlled, they are dynamically coupled. A helium gas supply line, referred to as a purge line, is routed to the lower holder lower plenum at the base of the inner housing. Helium flows through this line passing upward past the specimen holders and out an effluent line opening at the top of the inner containment. The purge line remains open at all times and the flow is automatically increased in response to detected off-normal operating conditions while all other gas flows are stopped, ensuring that holder temperatures decrease.
148

Operation HFIR operating cycles 403A, 404, and 403B were conducted during the reporting period. Cycle 403A was initiated on January 26, 2005, with premature shutdown on February 4, 2005, for administrative reasons related to a review of seismic analysis of the reactor supports. A plot showing temperatures for the three zones along with reactor power is shown in Fig. 1. Of note is the rapid decrease in the upper holder temperature occurring a few hours after startup, followed by a continued trend downward. The upper holder with a target temperature of 700°C had exhibited problems in earlier cycles with maximum achievable temperatures below target by ~ 50°C for the previous cycle [3]. A temperature of only 600°C was reached at the start of this cycle before the precipitous decrease was observed. Although it will not be known until the experiment is disassembled, it is possible that a lithium leak created a thermal conduction path to the inner housing wall. Efforts to control the temperature for this holder were discontinued after this event. Temperatures were maintained for the two other holder positions at the nominal target temperatures of 600°C and 425°C.
0.00
100.00
200.00
300.00
400.00
500.00
600.00
700.00
26-J
an-0
5
27-J
an-0
5
28-J
an-0
5
29-J
an-0
5
30-J
an-0
5
31-J
an-0
5
01-F
eb-0
5
02-F
eb-0
5
03-F
eb-0
5
04-F
eb-0
5
05-F
eb-0
5
TE-501 TE-502 TE-503 TE-504 TE-505 TE-506 TE-507 TE-508 TE-509 REAC PWR
CY-403A
Fig.1. 17J temperature and power history for HFIR cycle 403A. Cycle 404, with new fuel elements, was started on April 6, 2005. The fresh core was installed to accommodate installation work for a new hydraulic rabbit tube system. The startup portion of cycle 404 is shown in Fig. 2 and the full cycle is shown in Fig. 3. Temperatures were maintained at nominal target values of 600°C and 425°C for the middle and lower holders. No attempt was made to control the upper holder temperature per the above discussion. Although not shown in the temperature plots, a noticeable trend upward in the percentage of argon gas required to maintain temperature for the middle capsule was observed (as compared to a similar point in previous operating cycles since the power profile changes over the cycle).
0.00
200.00
400.00
600.00
Dat
e
4/6/
2005
4/6/
2005
4/6/
2005
4/6/
2005
4/6/
2005
4/6/
2005
4/6/
2005
4/6/
2005
4/6/
2005
4/6/
2005
4/6/
2005
4/6/
2005
4/6/
2005
4/6/
2005
4/6/
2005
4/6/
2005
4/6/
2005
4/6/
2005
4/6/
2005
4/6/
2005
4/6/
2005
4/6/
2005
4/6/
2005
4/6/
2005
TE-501
TE-502
TE-503
TE-504
TE-505
TE-506
TE-507
TE-508
TE-509
Start of C-404
Fig. 2. 17J startup portion of HFIR operating cycle 404.
149
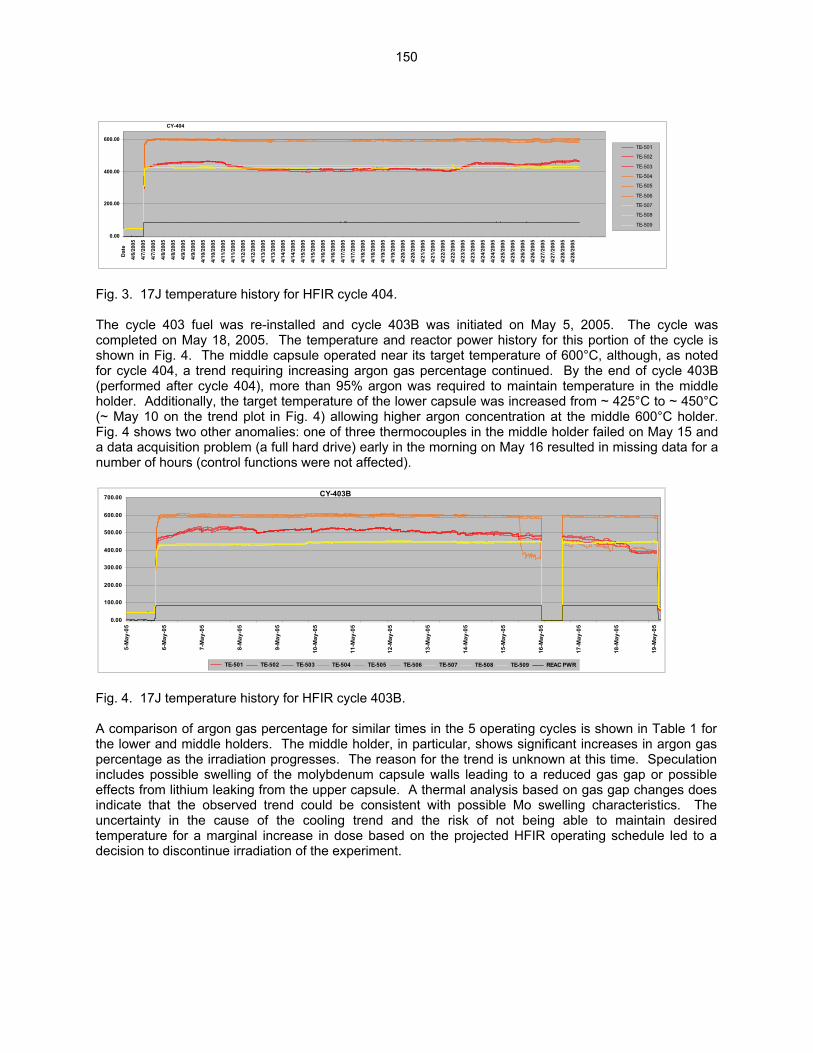
0.00
200.00
400.00
600.00
Dat
e
4/6/
2005
4/7/
2005
4/7/
2005
4/8/
2005
4/8/
2005
4/9/
2005
4/9/
2005
4/10
/200
5
4/10
/200
5
4/11
/200
5
4/11
/200
5
4/12
/200
5
4/12
/200
5
4/13
/200
5
4/13
/200
5
4/14
/200
5
4/14
/200
5
4/15
/200
5
4/15
/200
5
4/16
/200
5
4/16
/200
5
4/17
/200
5
4/17
/200
5
4/18
/200
5
4/18
/200
5
4/19
/200
5
4/19
/200
5
4/20
/200
5
4/20
/200
5
4/21
/200
5
4/21
/200
5
4/22
/200
5
4/22
/200
5
4/23
/200
5
4/23
/200
5
4/24
/200
5
4/24
/200
5
4/25
/200
5
4/25
/200
5
4/26
/200
5
4/26
/200
5
4/27
/200
5
4/27
/200
5
4/28
/200
5
4/28
/200
5
TE-501
TE-502
TE-503
TE-504
TE-505
TE-506
TE-507
TE-508
TE-509
CY-404
Fig. 3. 17J temperature history for HFIR cycle 404. The cycle 403 fuel was re-installed and cycle 403B was initiated on May 5, 2005. The cycle was completed on May 18, 2005. The temperature and reactor power history for this portion of the cycle is shown in Fig. 4. The middle capsule operated near its target temperature of 600°C, although, as noted for cycle 404, a trend requiring increasing argon gas percentage continued. By the end of cycle 403B (performed after cycle 404), more than 95% argon was required to maintain temperature in the middle holder. Additionally, the target temperature of the lower capsule was increased from ~ 425°C to ~ 450°C (~ May 10 on the trend plot in Fig. 4) allowing higher argon concentration at the middle 600°C holder. Fig. 4 shows two other anomalies: one of three thermocouples in the middle holder failed on May 15 and a data acquisition problem (a full hard drive) early in the morning on May 16 resulted in missing data for a number of hours (control functions were not affected).
0.00
100.00
200.00
300.00
400.00
500.00
600.00
700.00
5-M
ay-0
5
6-M
ay-0
5
7-M
ay-0
5
8-M
ay-0
5
9-M
ay-0
5
10-M
ay-0
5
11-M
ay-0
5
12-M
ay-0
5
13-M
ay-0
5
14-M
ay-0
5
15-M
ay-0
5
16-M
ay-0
5
17-M
ay-0
5
18-M
ay-0
5
19-M
ay-0
5
TE-501 TE-502 TE-503 TE-504 TE-505 TE-506 TE-507 TE-508 TE-509 REAC PWR
CY-403B
Fig. 4. 17J temperature history for HFIR cycle 403B. A comparison of argon gas percentage for similar times in the 5 operating cycles is shown in Table 1 for the lower and middle holders. The middle holder, in particular, shows significant increases in argon gas percentage as the irradiation progresses. The reason for the trend is unknown at this time. Speculation includes possible swelling of the molybdenum capsule walls leading to a reduced gas gap or possible effects from lithium leaking from the upper capsule. A thermal analysis based on gas gap changes does indicate that the observed trend could be consistent with possible Mo swelling characteristics. The uncertainty in the cause of the cooling trend and the risk of not being able to maintain desired temperature for a marginal increase in dose based on the projected HFIR operating schedule led to a decision to discontinue irradiation of the experiment.
150

Table 1. Comparison of argon gas percentages for 17J, ~ 6 days before end-of-cycle (EOC)
17J Experiment Lower Zone - 450 C Capsule Middle Zone- 600 C Capsule
FT-546 FT-531C FT-506C Argon % Avg. Temp FT-531B FT-506B Argon % Avg. TempHe(sccm) Ar(sccm) He(sccm) % (degC) Ar(sccm) He(sccm) % (degC)
Cycle 4006 days before EOC 15.86 21.24 0 57.3 428 4.95 4.93 55.7 600
Cycle 401~6 days before EOC 10.78 10.68 0 49.8 429 5.87 0 60.6 595
Cycle 402~6 days before EOC 7.07 12.83 4.88 51.8 428 24.22 0 75.6 595
Cycle 404~5 days before EOC 2.04 6.57 2.91 57.0 429 33.49 0 89.0 594
Cycle 403B(current) 0.71 7.38 2.6 69.0 445 50.76 0 94.6 596~6 days before EOC
The 17J experiment has been irradiated for 5 full cycles in the HFIR for a total of 9930 MWD. The estimated peak displacements per atom in vanadium for the RB* position is 0.74/cycle. The power history timeline for cycles 403A, 404, and 403B is shown in Table 2. This provides information on low power portions of the cycle where specimens are not at temperature (e.g., startup, operator training, etc.). Similar information for cycles 400 through 402 has been reported previously [2, 3].
151
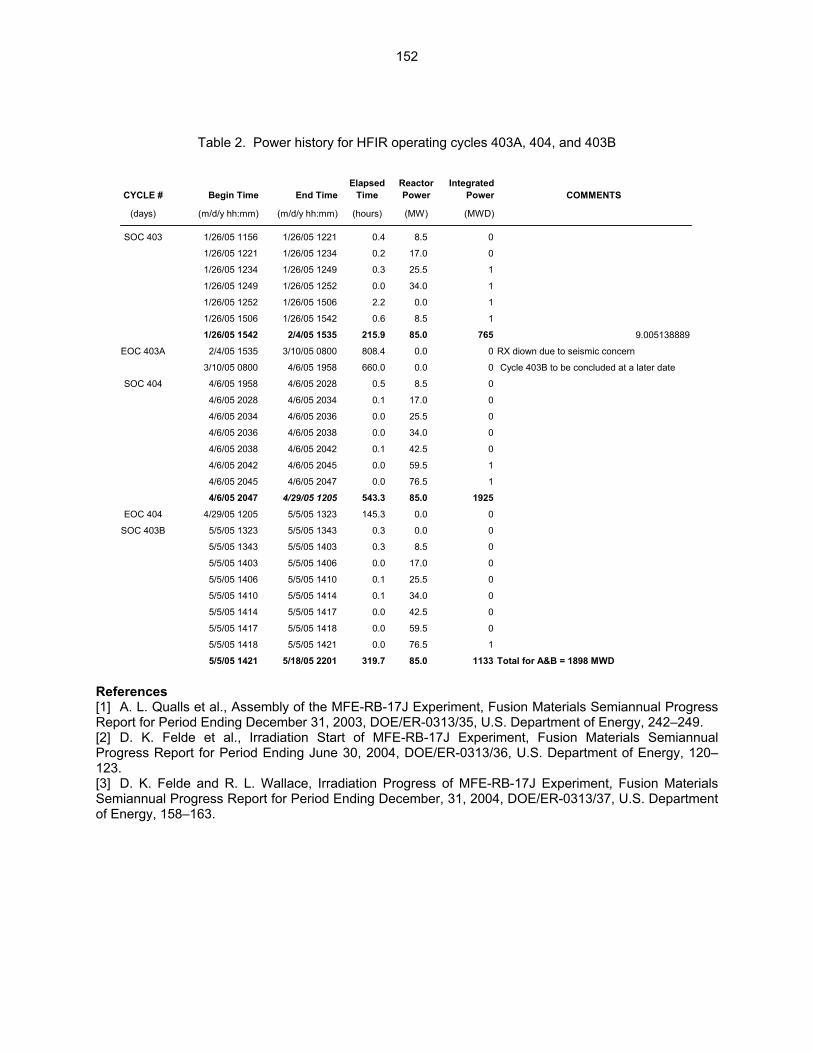
Table 2. Power history for HFIR operating cycles 403A, 404, and 403B
CYCLE # Begin Time End TimeElapsed
TimeReactor Power
Integrated Power COMMENTS
(days) (m/d/y hh:mm) (m/d/y hh:mm) (hours) (MW) (MWD)
SOC 403 1/26/05 1156 1/26/05 1221 0.4 8.5 0
1/26/05 1221 1/26/05 1234 0.2 17.0 0
1/26/05 1234 1/26/05 1249 0.3 25.5 1
1/26/05 1249 1/26/05 1252 0.0 34.0 1
1/26/05 1252 1/26/05 1506 2.2 0.0 1
1/26/05 1506 1/26/05 1542 0.6 8.5 1
1/26/05 1542 2/4/05 1535 215.9 85.0 765 9.005138889
EOC 403A 2/4/05 1535 3/10/05 0800 808.4 0.0 0 RX diown due to seismic concern
3/10/05 0800 4/6/05 1958 660.0 0.0 0 Cycle 403B to be concluded at a later date
SOC 404 4/6/05 1958 4/6/05 2028 0.5 8.5 0
4/6/05 2028 4/6/05 2034 0.1 17.0 0
4/6/05 2034 4/6/05 2036 0.0 25.5 0
4/6/05 2036 4/6/05 2038 0.0 34.0 0
4/6/05 2038 4/6/05 2042 0.1 42.5 0
4/6/05 2042 4/6/05 2045 0.0 59.5 1
4/6/05 2045 4/6/05 2047 0.0 76.5 1
4/6/05 2047 4/29/05 1205 543.3 85.0 1925
EOC 404 4/29/05 1205 5/5/05 1323 145.3 0.0 0
SOC 403B 5/5/05 1323 5/5/05 1343 0.3 0.0 0
5/5/05 1343 5/5/05 1403 0.3 8.5 0
5/5/05 1403 5/5/05 1406 0.0 17.0 0
5/5/05 1406 5/5/05 1410 0.1 25.5 0
5/5/05 1410 5/5/05 1414 0.1 34.0 0
5/5/05 1414 5/5/05 1417 0.0 42.5 0
5/5/05 1417 5/5/05 1418 0.0 59.5 0
5/5/05 1418 5/5/05 1421 0.0 76.5 1
5/5/05 1421 5/18/05 2201 319.7 85.0 1133 Total for A&B = 1898 MWD References [1] A. L. Qualls et al., Assembly of the MFE-RB-17J Experiment, Fusion Materials Semiannual Progress Report for Period Ending December 31, 2003, DOE/ER-0313/35, U.S. Department of Energy, 242–249. [2] D. K. Felde et al., Irradiation Start of MFE-RB-17J Experiment, Fusion Materials Semiannual Progress Report for Period Ending June 30, 2004, DOE/ER-0313/36, U.S. Department of Energy, 120–123. [3] D. K. Felde and R. L. Wallace, Irradiation Progress of MFE-RB-17J Experiment, Fusion Materials Semiannual Progress Report for Period Ending December, 31, 2004, DOE/ER-0313/37, U.S. Department of Energy, 158–163.
152
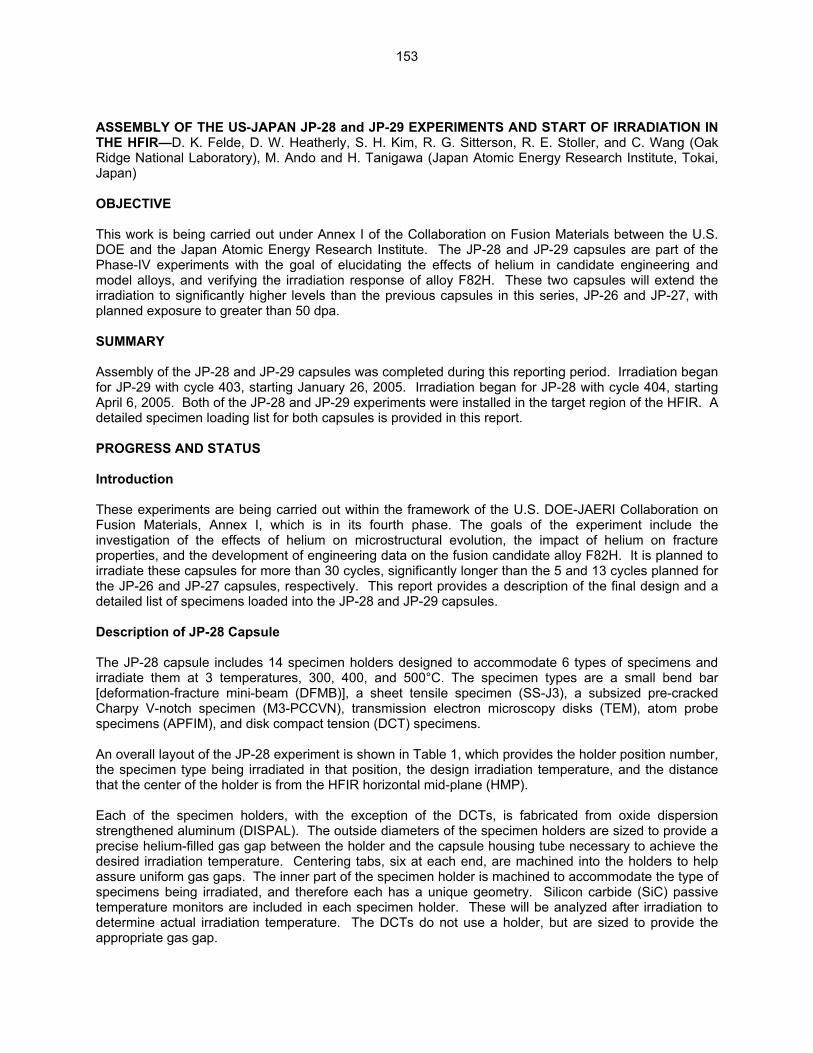
ASSEMBLY OF THE US-JAPAN JP-28 and JP-29 EXPERIMENTS AND START OF IRRADIATION IN THE HFIR—D. K. Felde, D. W. Heatherly, S. H. Kim, R. G. Sitterson, R. E. Stoller, and C. Wang (Oak Ridge National Laboratory), M. Ando and H. Tanigawa (Japan Atomic Energy Research Institute, Tokai, Japan) OBJECTIVE This work is being carried out under Annex I of the Collaboration on Fusion Materials between the U.S. DOE and the Japan Atomic Energy Research Institute. The JP-28 and JP-29 capsules are part of the Phase-IV experiments with the goal of elucidating the effects of helium in candidate engineering and model alloys, and verifying the irradiation response of alloy F82H. These two capsules will extend the irradiation to significantly higher levels than the previous capsules in this series, JP-26 and JP-27, with planned exposure to greater than 50 dpa. SUMMARY Assembly of the JP-28 and JP-29 capsules was completed during this reporting period. Irradiation began for JP-29 with cycle 403, starting January 26, 2005. Irradiation began for JP-28 with cycle 404, starting April 6, 2005. Both of the JP-28 and JP-29 experiments were installed in the target region of the HFIR. A detailed specimen loading list for both capsules is provided in this report. PROGRESS AND STATUS Introduction These experiments are being carried out within the framework of the U.S. DOE-JAERI Collaboration on Fusion Materials, Annex I, which is in its fourth phase. The goals of the experiment include the investigation of the effects of helium on microstructural evolution, the impact of helium on fracture properties, and the development of engineering data on the fusion candidate alloy F82H. It is planned to irradiate these capsules for more than 30 cycles, significantly longer than the 5 and 13 cycles planned for the JP-26 and JP-27 capsules, respectively. This report provides a description of the final design and a detailed list of specimens loaded into the JP-28 and JP-29 capsules. Description of JP-28 Capsule The JP-28 capsule includes 14 specimen holders designed to accommodate 6 types of specimens and irradiate them at 3 temperatures, 300, 400, and 500°C. The specimen types are a small bend bar [deformation-fracture mini-beam (DFMB)], a sheet tensile specimen (SS-J3), a subsized pre-cracked Charpy V-notch specimen (M3-PCCVN), transmission electron microscopy disks (TEM), atom probe specimens (APFIM), and disk compact tension (DCT) specimens. An overall layout of the JP-28 experiment is shown in Table 1, which provides the holder position number, the specimen type being irradiated in that position, the design irradiation temperature, and the distance that the center of the holder is from the HFIR horizontal mid-plane (HMP). Each of the specimen holders, with the exception of the DCTs, is fabricated from oxide dispersion strengthened aluminum (DISPAL). The outside diameters of the specimen holders are sized to provide a precise helium-filled gas gap between the holder and the capsule housing tube necessary to achieve the desired irradiation temperature. Centering tabs, six at each end, are machined into the holders to help assure uniform gas gaps. The inner part of the specimen holder is machined to accommodate the type of specimens being irradiated, and therefore each has a unique geometry. Silicon carbide (SiC) passive temperature monitors are included in each specimen holder. These will be analyzed after irradiation to determine actual irradiation temperature. The DCTs do not use a holder, but are sized to provide the appropriate gas gap.
153
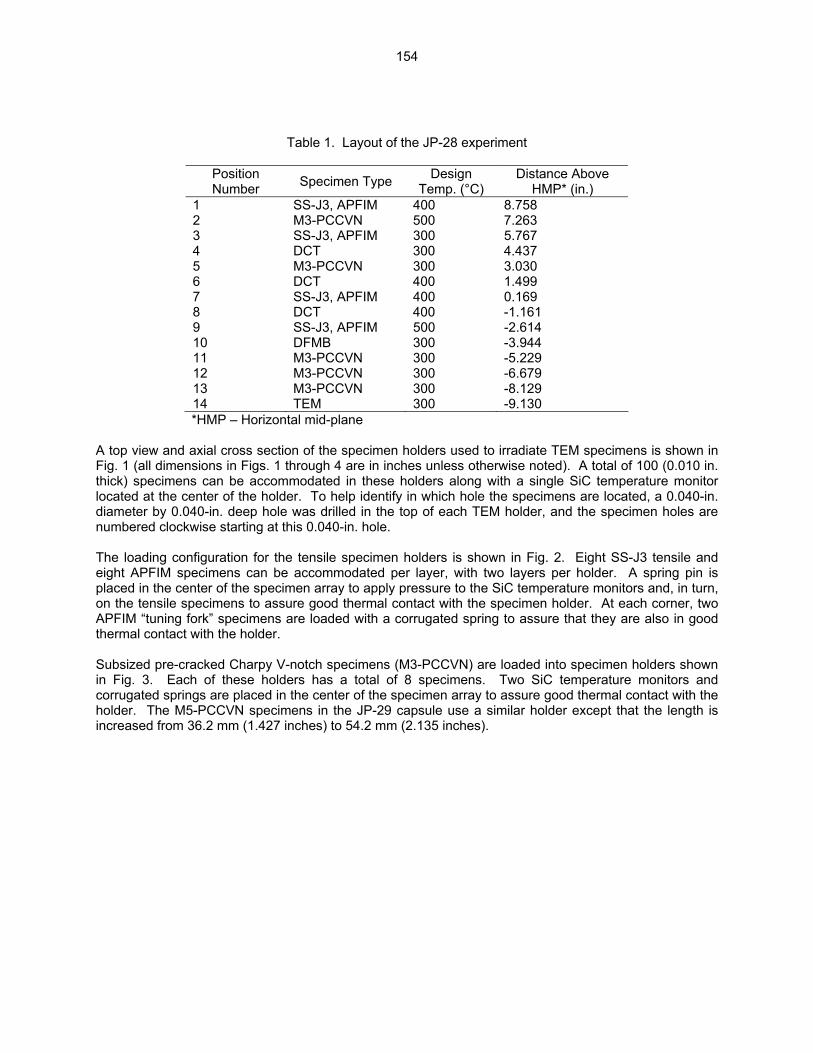
Table 1. Layout of the JP-28 experiment
Position Number Specimen Type Design
Temp. (°C) Distance Above
HMP* (in.) 1 SS-J3, APFIM 400 8.758 2 M3-PCCVN 500 7.263 3 SS-J3, APFIM 300 5.767 4 DCT 300 4.437 5 M3-PCCVN 300 3.030 6 DCT 400 1.499 7 SS-J3, APFIM 400 0.169 8 DCT 400 -1.161 9 SS-J3, APFIM 500 -2.614 10 DFMB 300 -3.944 11 M3-PCCVN 300 -5.229 12 M3-PCCVN 300 -6.679 13 M3-PCCVN 300 -8.129 14 TEM 300 -9.130
*HMP – Horizontal mid-plane A top view and axial cross section of the specimen holders used to irradiate TEM specimens is shown in Fig. 1 (all dimensions in Figs. 1 through 4 are in inches unless otherwise noted). A total of 100 (0.010 in. thick) specimens can be accommodated in these holders along with a single SiC temperature monitor located at the center of the holder. To help identify in which hole the specimens are located, a 0.040-in. diameter by 0.040-in. deep hole was drilled in the top of each TEM holder, and the specimen holes are numbered clockwise starting at this 0.040-in. hole. The loading configuration for the tensile specimen holders is shown in Fig. 2. Eight SS-J3 tensile and eight APFIM specimens can be accommodated per layer, with two layers per holder. A spring pin is placed in the center of the specimen array to apply pressure to the SiC temperature monitors and, in turn, on the tensile specimens to assure good thermal contact with the specimen holder. At each corner, two APFIM “tuning fork” specimens are loaded with a corrugated spring to assure that they are also in good thermal contact with the holder. Subsized pre-cracked Charpy V-notch specimens (M3-PCCVN) are loaded into specimen holders shown in Fig. 3. Each of these holders has a total of 8 specimens. Two SiC temperature monitors and corrugated springs are placed in the center of the specimen array to assure good thermal contact with the holder. The M5-PCCVN specimens in the JP-29 capsule use a similar holder except that the length is increased from 36.2 mm (1.427 inches) to 54.2 mm (2.135 inches).
154
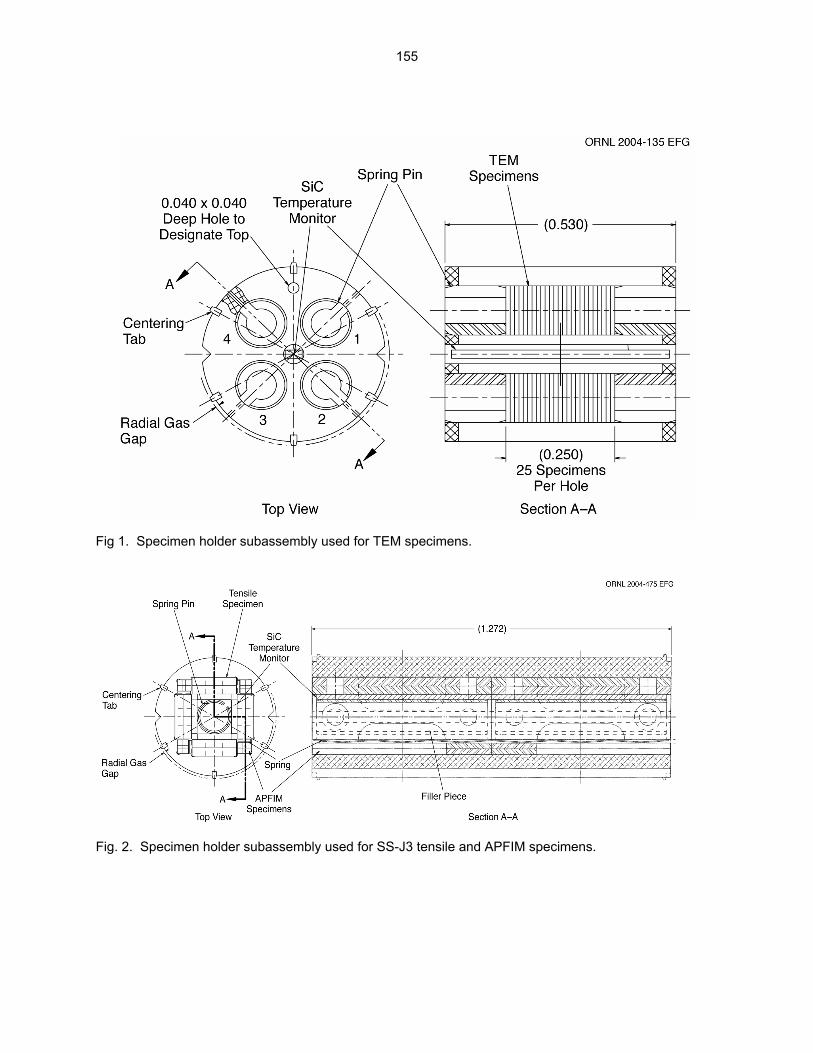
Fig 1. Specimen holder subassembly used for TEM specimens.
Fig. 2. Specimen holder subassembly used for SS-J3 tensile and APFIM specimens.
155

Fig. 3. Specimen holder subassembly used for M3-PCCVN specimens. The DFMB specimens are loaded into the holders as shown in Fig. 4. There are three layers of specimens with 16 specimens at each level. The outer row of each layer is made up of 12 specimens that are 1.68 mm square, while the inner four specimens are either 0.40 x 3.3 mm or 0.890 x 3.3 mm. A SiC temperature monitor and a corrugated spring are placed in the center of the specimen array, and two corrugated springs are placed in two of the outer rows to assure all specimens are in good thermal contact with the holder. Specimen locations are designated by a C, S, TM, M1, or M2, to more precisely identify loading locations (see loading list).
Fig. 4. Specimen holder subassembly used for DFMB specimens. A drawing of the DCT specimen configuration is shown in Fig. 5. Pins are inserted through the holes in a set of nine specimens. A retainer clip slides onto the flats on the pin ends to hold the specimens together. The diameter of the specimen determines the gas gap for temperature control.
156

Fig. 5. DCT specimen assembly. Specimen Loading The location of each of the specimens in JP-28 is reported in Table 2, which contains a box for each of the 14 specimen holder and 5 dosimeter positions. Because coatings applied to some of the TEM discs required the discs to be loaded in a prescribed manner, the boxes for the TEM specimen holder (position 14) has a column labeled “Engr. Face” to indicate which way the engraved face of the specimen was loaded (if applicable). A total of five neutron dosimeter packages provided by PNNL were loaded into JP-28, one each between positions 1 and 2, 2and 3, 5 and 6, 9 and 10, and below position 14. The M3-PCCVN specimens (in positions 2, 5, 11, 12, and 13) were all loaded with the notches facing towards the center of the holders. The outer rows of specimens in the DFMB holder (position 10) were loaded with the notches facing outward toward the holder, while the inner four specimens were loaded with their notches facing inward toward the center of the holder.
157

Table 2. JP-28 specimen and dosimetry loading list
SS-J3 Tensile
Specimen APFIM Specimen Passive Thermometry
1. inner ZP70 1. ZS74 2. outer ZQ70 2. ZS78
1. Ser. # N/A
3. inner ZP71 3. ZS75 4. outer ZQ71 4. ZS79
2. Ser. # N/A
5. inner ZP72 5. ZS76 6. outer ZQ72 6. 372
3. Ser. # N/A
7. inner ZR70 7. ZS77
POS. 1 JP-28 Top Half
8. outer ZR71 8. 373 4. Ser. # N/A
SS-J3 Tensile Specimen APFIM Specimen Passive Thermometry
9. inner 770 9. 773 10. outer 870 10. 873
5. Ser. # N/A
11. inner 771 11. 774 12. outer 871 12. 874
6. Ser. # N/A
13. inner 772 13. 777 14. outer 872 14. 877
7. Ser. # N/A
15. inner R70 15. 778
Bottom Half
16. outer R71 16. 878 8. Ser. # N/A
The spacer between positions number 1 and 2 contains Neutron Dosimeter Number ____K____
M3-PCCVN Spec. Passive Thermometry
1. outer 782 2. inner 882 3. inner 883 4. outer 783 5. outer 784 6. inner 884 7. inner 885
POS. 2 JP-28
8. outer 785
1. Ser. # 1
2. Ser. # 2
The spacer between positions number 2 and 3 contains Neutron Dosimeter Number ___H____
158
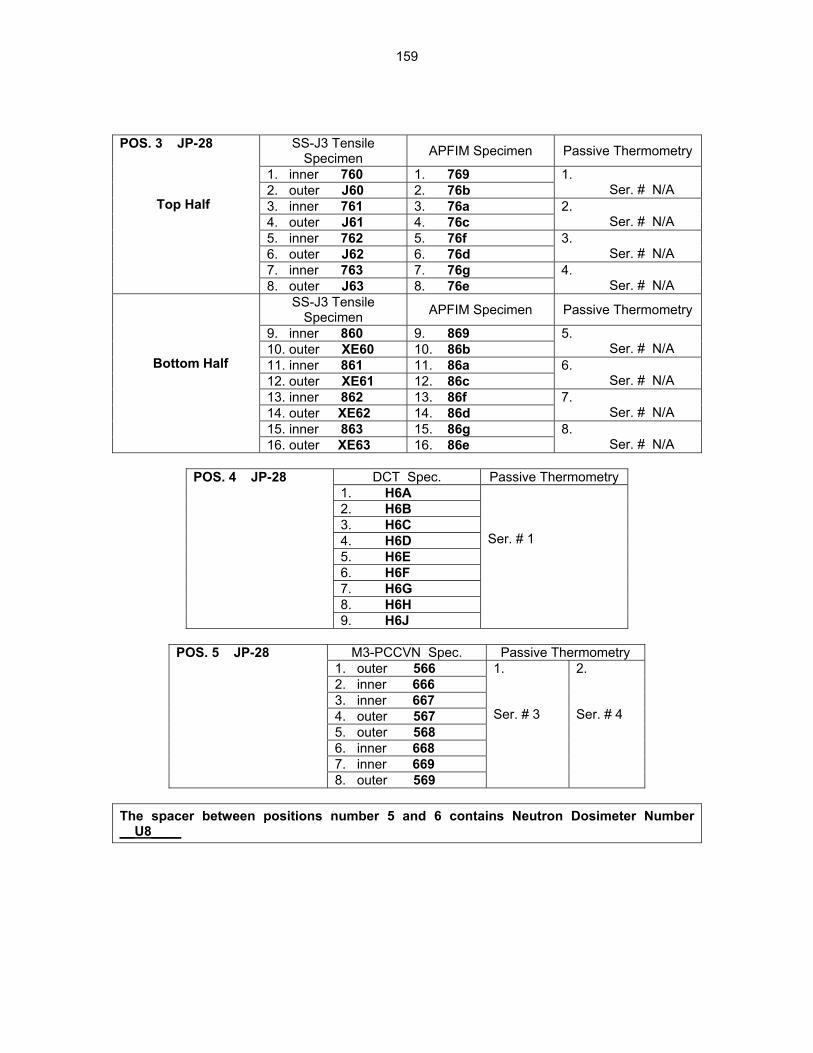
SS-J3 Tensile
Specimen APFIM Specimen Passive Thermometry
1. inner 760 1. 769 2. outer J60 2. 76b
1. Ser. # N/A
3. inner 761 3. 76a 4. outer J61 4. 76c
2. Ser. # N/A
5. inner 762 5. 76f 6. outer J62 6. 76d
3. Ser. # N/A
7. inner 763 7. 76g
POS. 3 JP-28 Top Half
8. outer J63 8. 76e 4. Ser. # N/A
SS-J3 Tensile Specimen APFIM Specimen Passive Thermometry
9. inner 860 9. 869 10. outer XE60 10. 86b
5. Ser. # N/A
11. inner 861 11. 86a 12. outer XE61 12. 86c
6. Ser. # N/A
13. inner 862 13. 86f 14. outer XE62 14. 86d
7. Ser. # N/A
15. inner 863 15. 86g
Bottom Half
16. outer XE63 16. 86e 8. Ser. # N/A
DCT Spec. Passive Thermometry
1. H6A 2. H6B 3. H6C 4. H6D 5. H6E 6. H6F 7. H6G 8. H6H
POS. 4 JP-28
9. H6J
Ser. # 1
M3-PCCVN Spec. Passive Thermometry
1. outer 566 2. inner 666 3. inner 667 4. outer 567 5. outer 568 6. inner 668 7. inner 669
POS. 5 JP-28
8. outer 569
1. Ser. # 3
2. Ser. # 4
The spacer between positions number 5 and 6 contains Neutron Dosimeter Number __U8____
159

DCT Spec. Passive Thermometry
1. H76 2. H77 3. H78 4. H79 5. H7A 6. H7B 7. H7C 8. H7D
POS. 6 JP-28
9. H7E
Ser. # 2
SS-J3 Tensile
Specimen APFIM Specimen Passive Thermometry
1. inner 570 1. 576 2. outer 070 2. 07F
1. Ser. # N/A
3. inner 571 3. 577 4. outer 071 4. 07G
2. Ser. # N/A
5. inner 572 5. 370 6. outer 072 6. 06RC
3. Ser. # N/A
7. inner 573 7. 374
POS. 7 JP-28 Top Half
8. outer 073 8. 06Rd 4. Ser. # N/A
SS-J3 Tensile Specimen APFIM Specimen Passive Thermometry
9. inner 670 9. 676 10. outer H70 10. H7Ja
5. Ser. # N/A
11. inner 671 11. 677 12. outer H71 12. H7Jb
6. Ser. # N/A
13. inner 672 13. 371 14. outer H72 14. H7K
7. Ser. # N/A
15. inner 673 15. 375
Bottom Half
16. outer H73 16. H7M 8. Ser. # N/A
DCT Spec. Passive Thermometry
1. 076 2. 077 3. 078 4. 079 5. 07A 6. 07B 7. 07C 8. 07D
POS. 8 JP-28
9. 07E
Ser. # 3
160

SS-J3 Tensile
Specimen APFIM Specimen Passive Thermometry
1. inner 580 1. 586 2. outer 080 2. 08H
1. Ser. # N/A
3. inner 581 3. 587 4. outer 081 4. 0HJ
2. Ser. # N/A
5. inner 582 5. 380 6. outer 082 6. 06Re
3. Ser. # N/A
7. inner 583 7. 382
POS. 9 JP-28 Top Half
8. outer 083 8. 06Rf 4. Ser. # N/A
SS-J3 Tensile Specimen APFIM Specimen Passive Thermometry
9. inner 680 9. 686 10. outer H80 10. H86
5. Ser. # N/A
11. inner 681 11. 687 12. outer H81 12. H87
6. Ser. # N/A
13. inner 682 13. 381 14. outer H82 14. H88
7. Ser. # N/A
15. inner 683 15. 383
Bottom Half
16. outer H83 16. H89 8. Ser. # N/A
The spacer between positions number 9 and 10 contains Neutron Dosimeter Number ___18___
POS.
10 JP-28
Outer Layer DFMB Specimens (.065 x .065 x .362)
C C C C S S S S TB TB TB TB
Inner Layer DFMB (.035
x.130x.362) M1 M1
Inner Layer DFMB (.0157
x.130x.362) M2 M2
Passive Therm.
1
2
3
4
5
6
7
8
9
10 11
12
1
2
1
2
R
ow 1
TOP
06K
a
06K
b
H6K
a
H6K
b
06K
g
06K
h
H6K
g
H6K
h
06K
p
06K
q
H6K
p
H6K
q
R6E
R6F
06Sa
364
Row
2
MID
DLE
06K
c
06K
d
H6K
c
H6K
d
06K
j
06K
k
H6K
j
H6K
k
06K
r
06K
s
H6K
r
H6K
s
R6G
06
Ta
H6T
56
E
Row
3
B
OTT
OM
06K
e
06K
f
H6K
e
H6K
f
06K
m
06K
n
H6K
m
H6K
n
06K
t
06K
u
06K
v
06K
w
366
H6V
66E
96a
1. Ser. # 1
161
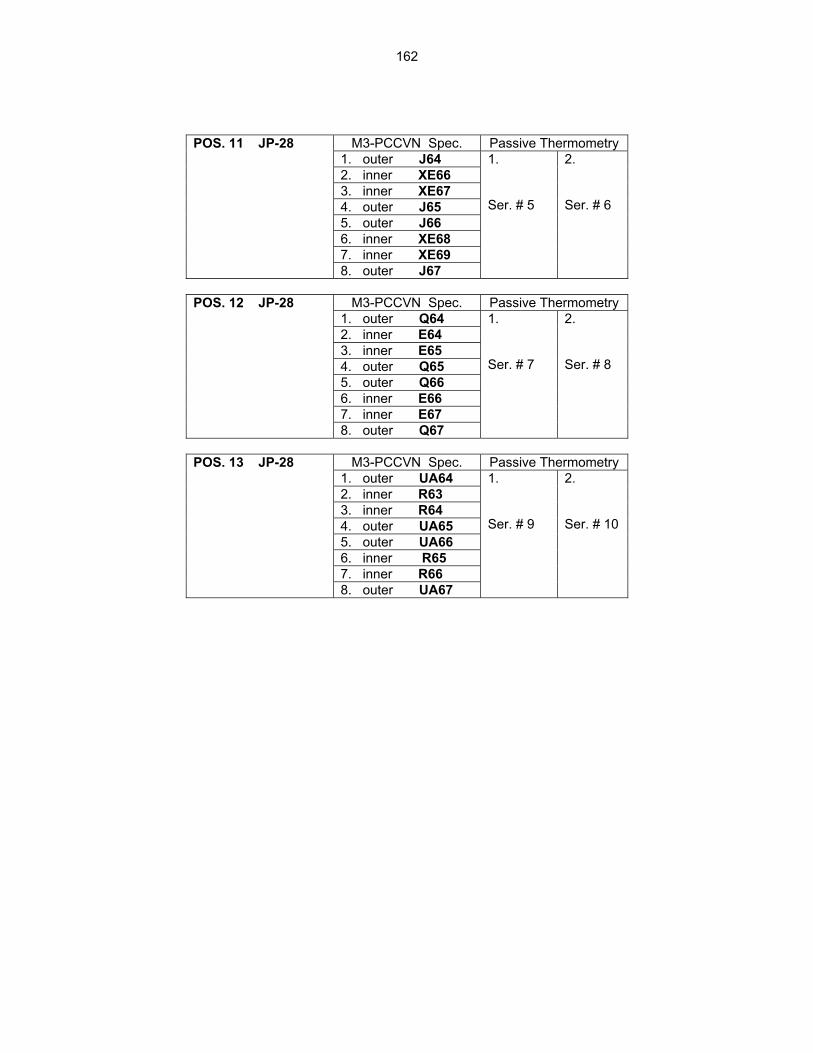
M3-PCCVN Spec. Passive Thermometry
1. outer J64 2. inner XE66 3. inner XE67 4. outer J65 5. outer J66 6. inner XE68 7. inner XE69
POS. 11 JP-28
8. outer J67
1. Ser. # 5
2. Ser. # 6
M3-PCCVN Spec. Passive Thermometry
1. outer Q64 2. inner E64 3. inner E65 4. outer Q65 5. outer Q66 6. inner E66 7. inner E67
POS. 12 JP-28
8. outer Q67
1. Ser. # 7
2. Ser. # 8
M3-PCCVN Spec. Passive Thermometry
1. outer UA64 2. inner R63 3. inner R64 4. outer UA65 5. outer UA66 6. inner R65 7. inner R66
POS. 13 JP-28
8. outer UA67
1. Ser. # 9
2. Ser. # 10
162
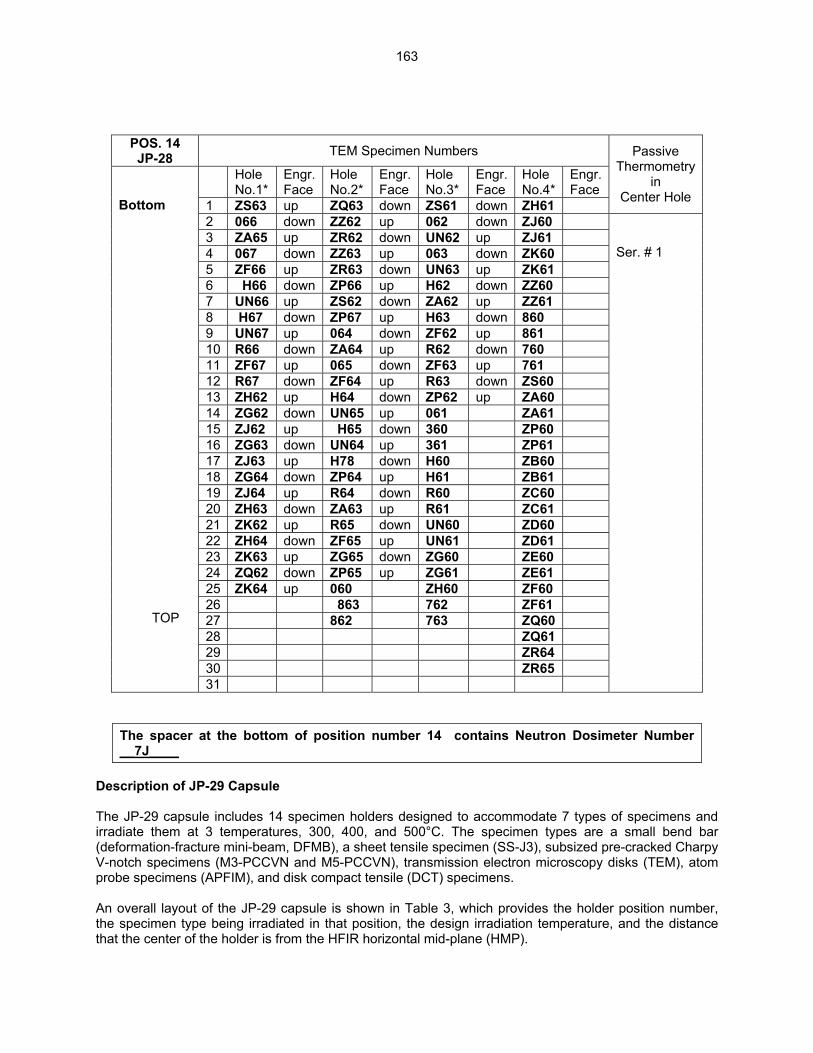
POS. 14 JP-28 TEM Specimen Numbers
Hole No.1*
Engr. Face
Hole No.2*
Engr. Face
Hole No.3*
Engr.Face
Hole No.4*
Engr. Face
1 ZS63 up ZQ63 down ZS61 down ZH61
Passive Thermometry
in Center Hole
2 066 down ZZ62 up 062 down ZJ60 3 ZA65 up ZR62 down UN62 up ZJ61 4 067 down ZZ63 up 063 down ZK60 5 ZF66 up ZR63 down UN63 up ZK61 6 H66 down ZP66 up H62 down ZZ60 7 UN66 up ZS62 down ZA62 up ZZ61 8 H67 down ZP67 up H63 down 860 9 UN67 up 064 down ZF62 up 861 10 R66 down ZA64 up R62 down 760 11 ZF67 up 065 down ZF63 up 761 12 R67 down ZF64 up R63 down ZS60 13 ZH62 up H64 down ZP62 up ZA60 14 ZG62 down UN65 up 061 ZA61 15 ZJ62 up H65 down 360 ZP60 16 ZG63 down UN64 up 361 ZP61 17 ZJ63 up H78 down H60 ZB60 18 ZG64 down ZP64 up H61 ZB61 19 ZJ64 up R64 down R60 ZC60 20 ZH63 down ZA63 up R61 ZC61 21 ZK62 up R65 down UN60 ZD60 22 ZH64 down ZF65 up UN61 ZD61 23 ZK63 up ZG65 down ZG60 ZE60 24 ZQ62 down ZP65 up ZG61 ZE61 25 ZK64 up 060 ZH60 ZF60 26 863 762 ZF61 27 862 763 ZQ60 28 ZQ61 29 ZR64 30 ZR65
Bottom TOP
31
Ser. # 1
The spacer at the bottom of position number 14 contains Neutron Dosimeter Number __7J____
Description of JP-29 Capsule The JP-29 capsule includes 14 specimen holders designed to accommodate 7 types of specimens and irradiate them at 3 temperatures, 300, 400, and 500°C. The specimen types are a small bend bar (deformation-fracture mini-beam, DFMB), a sheet tensile specimen (SS-J3), subsized pre-cracked Charpy V-notch specimens (M3-PCCVN and M5-PCCVN), transmission electron microscopy disks (TEM), atom probe specimens (APFIM), and disk compact tensile (DCT) specimens. An overall layout of the JP-29 capsule is shown in Table 3, which provides the holder position number, the specimen type being irradiated in that position, the design irradiation temperature, and the distance that the center of the holder is from the HFIR horizontal mid-plane (HMP).
163
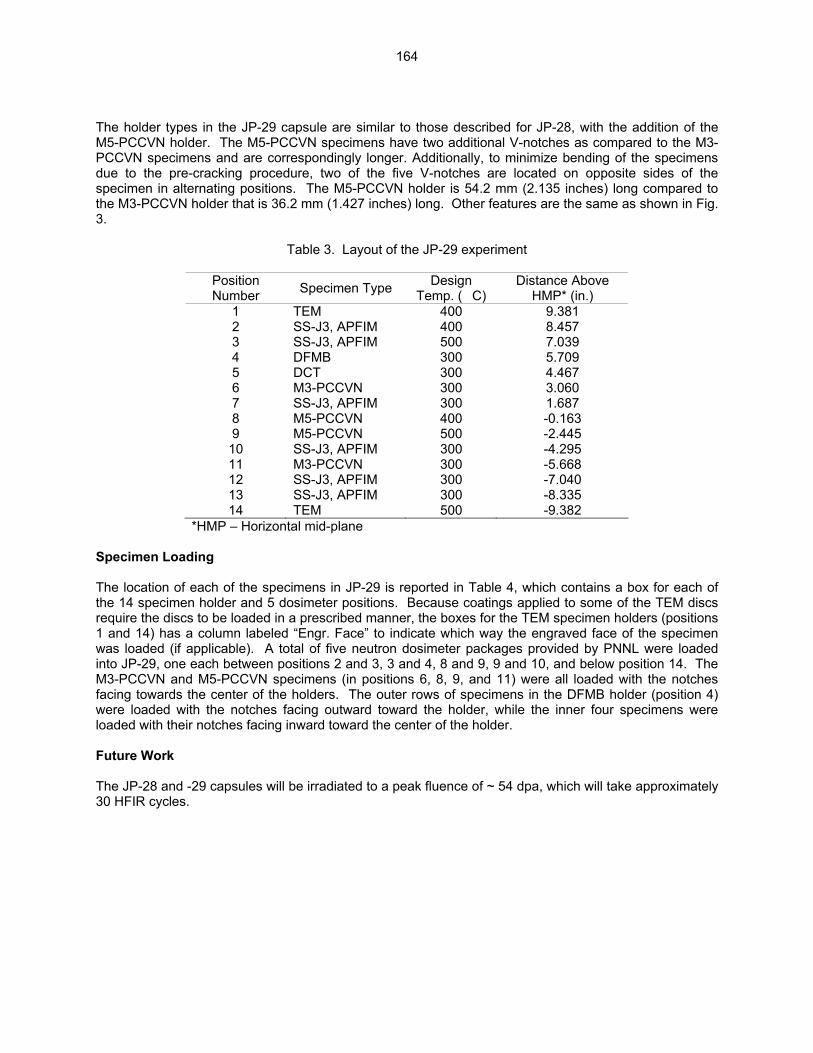
The holder types in the JP-29 capsule are similar to those described for JP-28, with the addition of the M5-PCCVN holder. The M5-PCCVN specimens have two additional V-notches as compared to the M3-PCCVN specimens and are correspondingly longer. Additionally, to minimize bending of the specimens due to the pre-cracking procedure, two of the five V-notches are located on opposite sides of the specimen in alternating positions. The M5-PCCVN holder is 54.2 mm (2.135 inches) long compared to the M3-PCCVN holder that is 36.2 mm (1.427 inches) long. Other features are the same as shown in Fig. 3.
Table 3. Layout of the JP-29 experiment
Position Number Specimen Type Design
Temp. (C) Distance Above
HMP* (in.) 1 TEM 400 9.381 2 SS-J3, APFIM 400 8.457 3 SS-J3, APFIM 500 7.039 4 DFMB 300 5.709 5 DCT 300 4.467 6 M3-PCCVN 300 3.060 7 SS-J3, APFIM 300 1.687 8 M5-PCCVN 400 -0.163 9 M5-PCCVN 500 -2.445 10 SS-J3, APFIM 300 -4.295 11 M3-PCCVN 300 -5.668 12 SS-J3, APFIM 300 -7.040 13 SS-J3, APFIM 300 -8.335 14 TEM 500 -9.382
*HMP – Horizontal mid-plane Specimen Loading The location of each of the specimens in JP-29 is reported in Table 4, which contains a box for each of the 14 specimen holder and 5 dosimeter positions. Because coatings applied to some of the TEM discs require the discs to be loaded in a prescribed manner, the boxes for the TEM specimen holders (positions 1 and 14) has a column labeled “Engr. Face” to indicate which way the engraved face of the specimen was loaded (if applicable). A total of five neutron dosimeter packages provided by PNNL were loaded into JP-29, one each between positions 2 and 3, 3 and 4, 8 and 9, 9 and 10, and below position 14. The M3-PCCVN and M5-PCCVN specimens (in positions 6, 8, 9, and 11) were all loaded with the notches facing towards the center of the holders. The outer rows of specimens in the DFMB holder (position 4) were loaded with the notches facing outward toward the holder, while the inner four specimens were loaded with their notches facing inward toward the center of the holder. Future Work The JP-28 and -29 capsules will be irradiated to a peak fluence of ~ 54 dpa, which will take approximately 30 HFIR cycles.
164

Table 4. JP-29 specimen and dosimetry loading list
POS. 1 JP-29
TEM Specimen Numbers
Hole No.1*
Engr. Face
Hole No.2*
Engr.Face
Hole No.3*
Engr.Face
Hole No.4*
Engr. Face
Passive Thermometry
in Center Hole
1 ZS73 up ZQ72 down 072 down ZH70 2 076 down ZZ72 up UN72 up ZH71 3 ZA75 up ZQ73 down 073 down ZJ70 4 077 down ZZ73 up UN73 up ZJ71 5 ZF76 up ZR72 down H72 down ZK70 6 H76 down ZP76 up ZA72 up ZK71 7 UN76 up ZR77 down H73 down ZZ70 8 H77 down ZP77 up ZF72 up ZZ71 9 UN77 up 074 down R72 down 870 10 R76 down ZA73 up ZF73 up 871 11 ZF77 up 075 down R73 down 770 12 R77 down ZF74 up ZP72 up 771 13 ZH72 up H74 down ZS71 down ZS74 14 ZG72 down UN74 up ZP73 up ZB70 15 ZJ72 up H75 down 071 ZB71 16 ZG73 down UN75 up 370 ZC70 17 ZJ73 up R74 down 371 ZC71 18 ZG74 down ZA74 up H70 ZD70 19 ZJ74 up R75 down H71 ZD71 20 ZH73 down ZF75 up R70 ZE70 21 ZK72 up ZG75 down R71 ZE71 22 ZS72 down ZP74 up UN70 ZF70 23 ZK73 up ZQ74 down UN71 ZF71 24 ZH74 down ZP75 up ZG70 ZA70 25 ZK74 up 070 ZG71 ZA71 26 872 772 ZP70 27 873 773 ZP71 28 ZQ70 29 ZQ71 30 ZR74
31 ZR74
Ser. # 2
165
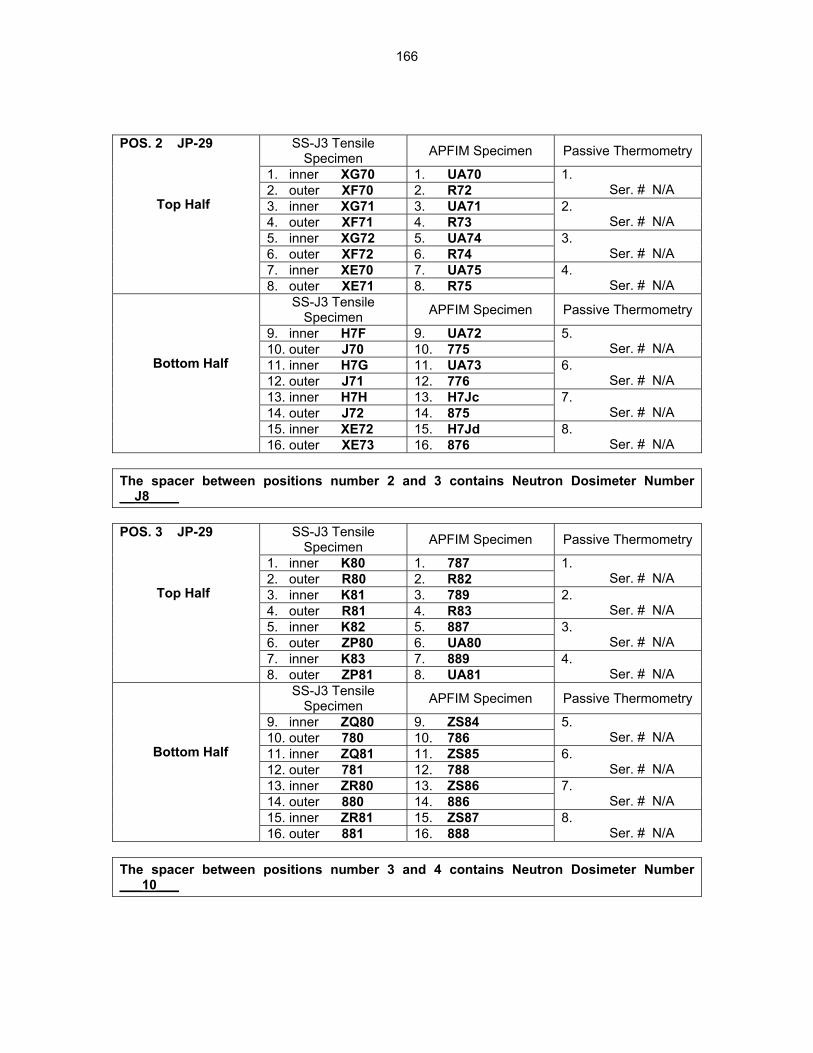
SS-J3 Tensile
Specimen APFIM Specimen Passive Thermometry
1. inner XG70 1. UA70 2. outer XF70 2. R72
1. Ser. # N/A
3. inner XG71 3. UA71 4. outer XF71 4. R73
2. Ser. # N/A
5. inner XG72 5. UA74 6. outer XF72 6. R74
3. Ser. # N/A
7. inner XE70 7. UA75
POS. 2 JP-29 Top Half
8. outer XE71 8. R75 4. Ser. # N/A
SS-J3 Tensile Specimen APFIM Specimen Passive Thermometry
9. inner H7F 9. UA72 10. outer J70 10. 775
5. Ser. # N/A
11. inner H7G 11. UA73 12. outer J71 12. 776
6. Ser. # N/A
13. inner H7H 13. H7Jc 14. outer J72 14. 875
7. Ser. # N/A
15. inner XE72 15. H7Jd
Bottom Half
16. outer XE73 16. 876 8. Ser. # N/A
The spacer between positions number 2 and 3 contains Neutron Dosimeter Number __J8____
SS-J3 Tensile
Specimen APFIM Specimen Passive Thermometry
1. inner K80 1. 787 2. outer R80 2. R82
1. Ser. # N/A
3. inner K81 3. 789 4. outer R81 4. R83
2. Ser. # N/A
5. inner K82 5. 887 6. outer ZP80 6. UA80
3. Ser. # N/A
7. inner K83 7. 889
POS. 3 JP-29 Top Half
8. outer ZP81 8. UA81 4. Ser. # N/A
SS-J3 Tensile Specimen APFIM Specimen Passive Thermometry
9. inner ZQ80 9. ZS84 10. outer 780 10. 786
5. Ser. # N/A
11. inner ZQ81 11. ZS85 12. outer 781 12. 788
6. Ser. # N/A
13. inner ZR80 13. ZS86 14. outer 880 14. 886
7. Ser. # N/A
15. inner ZR81 15. ZS87
Bottom Half
16. outer 881 16. 888 8. Ser. # N/A
The spacer between positions number 3 and 4 contains Neutron Dosimeter Number ___10___
166
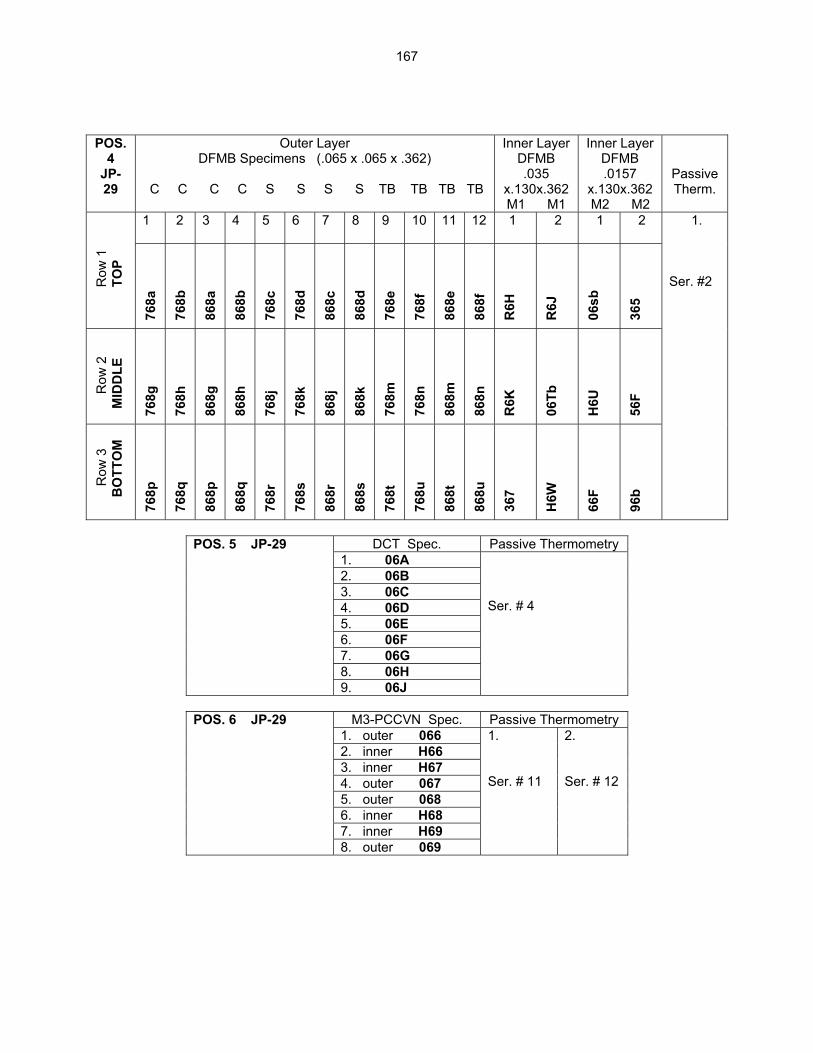
POS.
4 JP-29
Outer Layer DFMB Specimens (.065 x .065 x .362)
C C C C S S S S TB TB TB TB
Inner Layer DFMB .035
x.130x.362 M1 M1
Inner Layer DFMB .0157
x.130x.362 M2 M2
Passive Therm.
1
2
3
4
5
6
7
8
9
10 11
12
1
2
1
2
R
ow 1
TOP
768a
768b
868a
868b
768c
768d
868c
868d
768e
768f
868e
868f
R6H
R6J
06sb
365
Row
2
MID
DLE
768g
768h
868g
868h
768j
768k
868j
868k
768m
768n
868m
868n
R6K
06
Tb
H6U
56
F
Row
3
B
OTT
OM
768p
768q
868p
868q
768r
768s
868r
868s
768t
768u
868t
868u
367
H6W
66F
96b
1. Ser. #2
DCT Spec. Passive Thermometry
1. 06A 2. 06B 3. 06C 4. 06D 5. 06E 6. 06F 7. 06G 8. 06H
POS. 5 JP-29
9. 06J
Ser. # 4
M3-PCCVN Spec. Passive Thermometry
1. outer 066 2. inner H66 3. inner H67 4. outer 067 5. outer 068 6. inner H68 7. inner H69
POS. 6 JP-29
8. outer 069
1. Ser. # 11
2. Ser. # 12
167
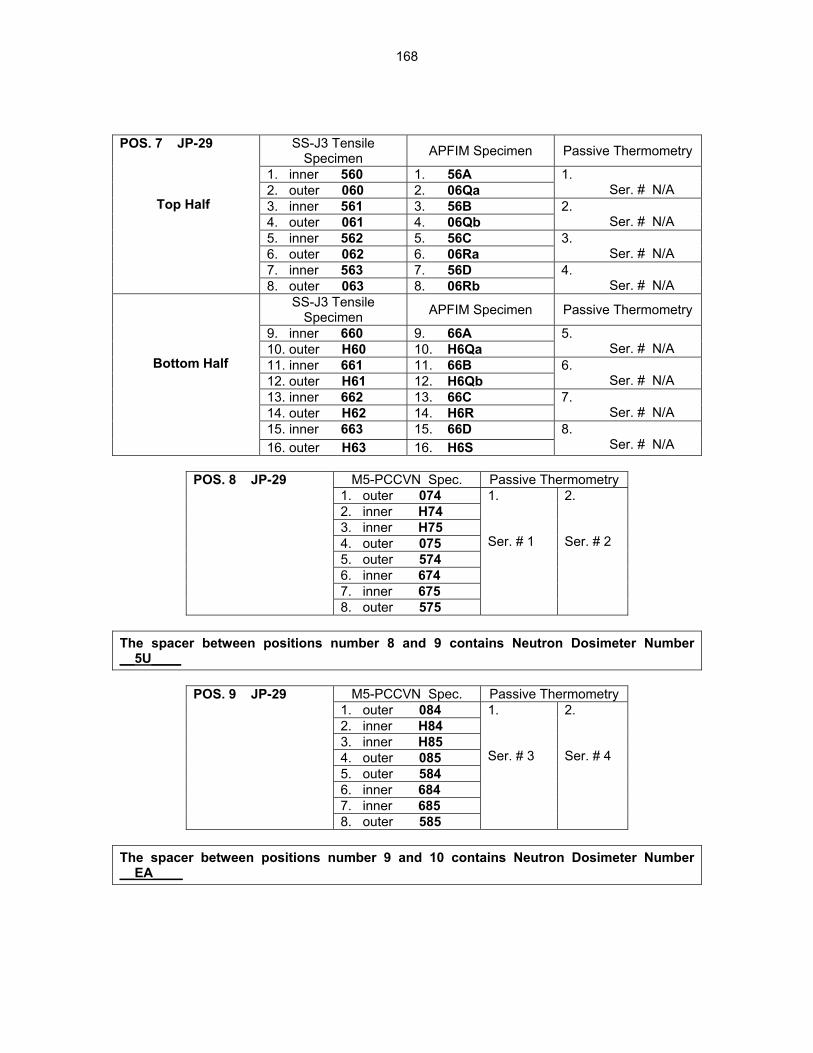
SS-J3 Tensile
Specimen APFIM Specimen Passive Thermometry
1. inner 560 1. 56A 2. outer 060 2. 06Qa
1. Ser. # N/A
3. inner 561 3. 56B 4. outer 061 4. 06Qb
2. Ser. # N/A
5. inner 562 5. 56C 6. outer 062 6. 06Ra
3. Ser. # N/A
7. inner 563 7. 56D
POS. 7 JP-29 Top Half
8. outer 063 8. 06Rb 4. Ser. # N/A
SS-J3 Tensile Specimen APFIM Specimen Passive Thermometry
9. inner 660 9. 66A 10. outer H60 10. H6Qa
5. Ser. # N/A
11. inner 661 11. 66B 12. outer H61 12. H6Qb
6. Ser. # N/A
13. inner 662 13. 66C 14. outer H62 14. H6R
7. Ser. # N/A
15. inner 663 15. 66D
Bottom Half
16. outer H63 16. H6S 8. Ser. # N/A
M5-PCCVN Spec. Passive Thermometry
1. outer 074 2. inner H74 3. inner H75 4. outer 075 5. outer 574 6. inner 674 7. inner 675
POS. 8 JP-29
8. outer 575
1. Ser. # 1
2. Ser. # 2
The spacer between positions number 8 and 9 contains Neutron Dosimeter Number __5U____
M5-PCCVN Spec. Passive Thermometry
1. outer 084 2. inner H84 3. inner H85 4. outer 085 5. outer 584 6. inner 684 7. inner 685
POS. 9 JP-29
8. outer 585
1. Ser. # 3
2. Ser. # 4
The spacer between positions number 9 and 10 contains Neutron Dosimeter Number __EA____
168
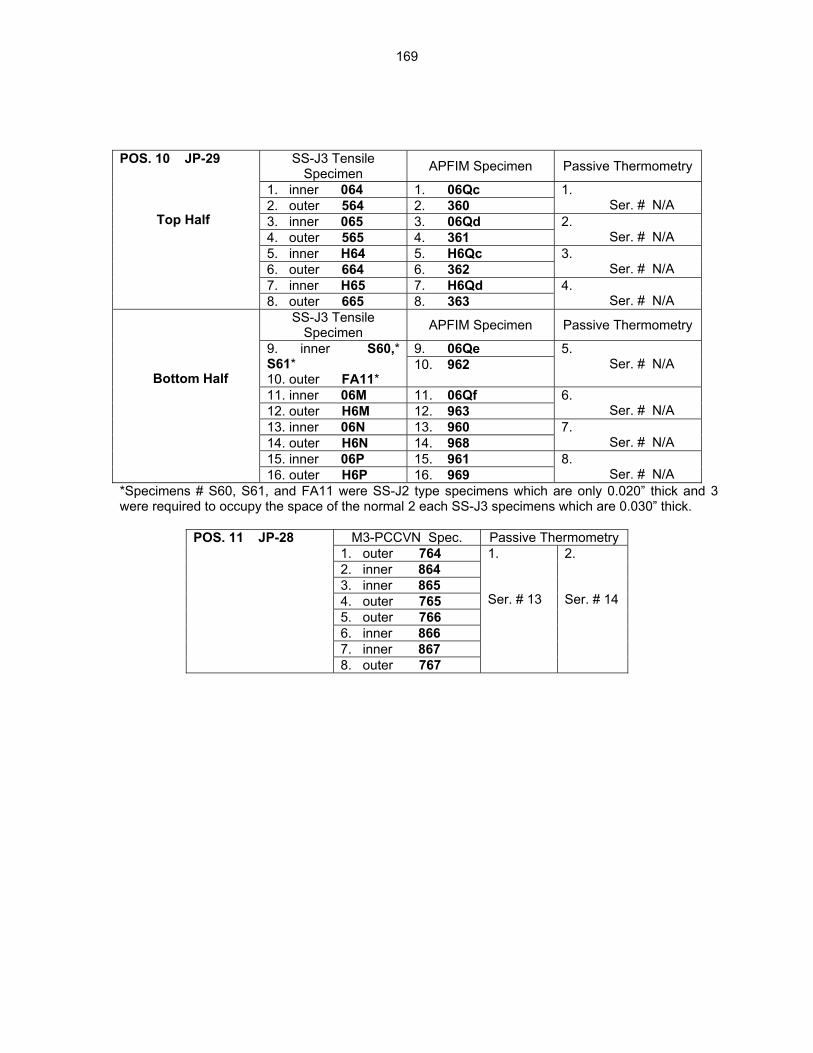
SS-J3 Tensile Specimen APFIM Specimen Passive Thermometry
1. inner 064 1. 06Qc 2. outer 564 2. 360
1. Ser. # N/A
3. inner 065 3. 06Qd 4. outer 565 4. 361
2. Ser. # N/A
5. inner H64 5. H6Qc 6. outer 664 6. 362
3. Ser. # N/A
7. inner H65 7. H6Qd
POS. 10 JP-29 Top Half
8. outer 665 8. 363 4. Ser. # N/A
SS-J3 Tensile Specimen APFIM Specimen Passive Thermometry
9. 06Qe 9. inner S60,* S61* 10. outer FA11*
10. 962 5. Ser. # N/A
11. inner 06M 11. 06Qf 12. outer H6M 12. 963
6. Ser. # N/A
13. inner 06N 13. 960 14. outer H6N 14. 968
7. Ser. # N/A
15. inner 06P 15. 961
Bottom Half
16. outer H6P 16. 969 8. Ser. # N/A
*Specimens # S60, S61, and FA11 were SS-J2 type specimens which are only 0.020” thick and 3 were required to occupy the space of the normal 2 each SS-J3 specimens which are 0.030” thick.
M3-PCCVN Spec. Passive Thermometry
1. outer 764 2. inner 864 3. inner 865 4. outer 765 5. outer 766 6. inner 866 7. inner 867
POS. 11 JP-28
8. outer 767
1. Ser. # 13
2. Ser. # 14
169
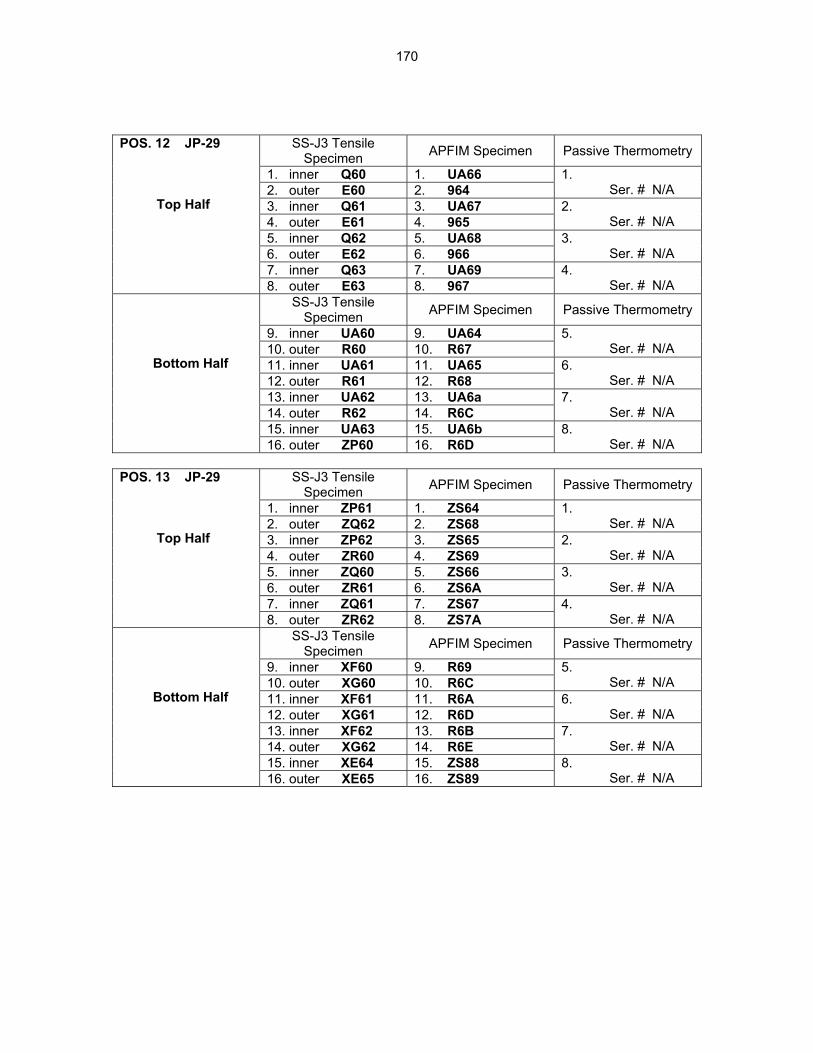
SS-J3 Tensile
Specimen APFIM Specimen Passive Thermometry
1. inner Q60 1. UA66 2. outer E60 2. 964
1. Ser. # N/A
3. inner Q61 3. UA67 4. outer E61 4. 965
2. Ser. # N/A
5. inner Q62 5. UA68 6. outer E62 6. 966
3. Ser. # N/A
7. inner Q63 7. UA69
POS. 12 JP-29 Top Half
8. outer E63 8. 967 4. Ser. # N/A
SS-J3 Tensile Specimen APFIM Specimen Passive Thermometry
9. inner UA60 9. UA64 10. outer R60 10. R67
5. Ser. # N/A
11. inner UA61 11. UA65 12. outer R61 12. R68
6. Ser. # N/A
13. inner UA62 13. UA6a 14. outer R62 14. R6C
7. Ser. # N/A
15. inner UA63 15. UA6b
Bottom Half
16. outer ZP60 16. R6D 8. Ser. # N/A
SS-J3 Tensile
Specimen APFIM Specimen Passive Thermometry
1. inner ZP61 1. ZS64 2. outer ZQ62 2. ZS68
1. Ser. # N/A
3. inner ZP62 3. ZS65 4. outer ZR60 4. ZS69
2. Ser. # N/A
5. inner ZQ60 5. ZS66 6. outer ZR61 6. ZS6A
3. Ser. # N/A
7. inner ZQ61 7. ZS67
POS. 13 JP-29 Top Half
8. outer ZR62 8. ZS7A 4. Ser. # N/A
SS-J3 Tensile Specimen APFIM Specimen Passive Thermometry
9. inner XF60 9. R69 10. outer XG60 10. R6C
5. Ser. # N/A
11. inner XF61 11. R6A 12. outer XG61 12. R6D
6. Ser. # N/A
13. inner XF62 13. R6B 14. outer XG62 14. R6E
7. Ser. # N/A
15. inner XE64 15. ZS88
Bottom Half
16. outer XE65 16. ZS89 8. Ser. # N/A
170
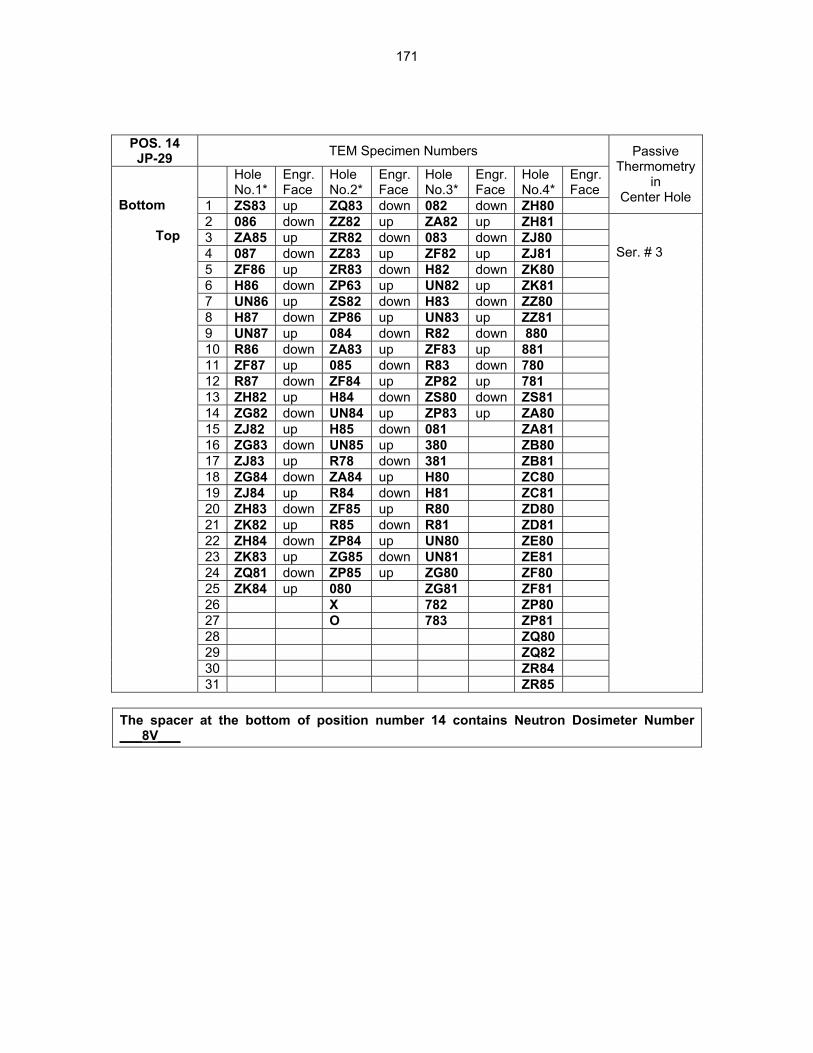
POS. 14 JP-29 TEM Specimen Numbers
Hole No.1*
Engr. Face
Hole No.2*
Engr.Face
Hole No.3*
Engr.Face
Hole No.4*
Engr. Face
1 ZS83 up ZQ83 down 082 down ZH80
Passive Thermometry
in Center Hole
2 086 down ZZ82 up ZA82 up ZH81 3 ZA85 up ZR82 down 083 down ZJ80 4 087 down ZZ83 up ZF82 up ZJ81 5 ZF86 up ZR83 down H82 down ZK80 6 H86 down ZP63 up UN82 up ZK81 7 UN86 up ZS82 down H83 down ZZ80 8 H87 down ZP86 up UN83 up ZZ81 9 UN87 up 084 down R82 down 880 10 R86 down ZA83 up ZF83 up 881 11 ZF87 up 085 down R83 down 780 12 R87 down ZF84 up ZP82 up 781 13 ZH82 up H84 down ZS80 down ZS81 14 ZG82 down UN84 up ZP83 up ZA80 15 ZJ82 up H85 down 081 ZA81 16 ZG83 down UN85 up 380 ZB80 17 ZJ83 up R78 down 381 ZB81 18 ZG84 down ZA84 up H80 ZC80 19 ZJ84 up R84 down H81 ZC81 20 ZH83 down ZF85 up R80 ZD80 21 ZK82 up R85 down R81 ZD81 22 ZH84 down ZP84 up UN80 ZE80 23 ZK83 up ZG85 down UN81 ZE81 24 ZQ81 down ZP85 up ZG80 ZF80 25 ZK84 up 080 ZG81 ZF81 26 X 782 ZP80 27 O 783 ZP81 28 ZQ80 29 ZQ82 30 ZR84
Bottom Top
31 ZR85
Ser. # 3
The spacer at the bottom of position number 14 contains Neutron Dosimeter Number ___8V___
171