DOE/LANL Hydrogen Fuel Quality - HyCoRa
26
Tommy Rockward (PI), J. Valdez, and R. Mukundan Los Alamos National Laboratory DOE/LANL Hydrogen Fuel Quality This presentation does not contain any proprietary, confidential, or otherwise restricted information Presented at 2015 DOE Hydrogen and Fuel Cells Program and Vehicle Technologies Program Annual Merit Review and Peer Evaluation Meeting June 8-12, 2015 Arlington, VA HyCoRA Workshop 2 nd OEM Worksop October 09, 2015
-
Upload
khangminh22 -
Category
Documents
-
view
0 -
download
0
Transcript of DOE/LANL Hydrogen Fuel Quality - HyCoRa

Tommy Rockward (PI), J. Valdez, and R.
Mukundan
Los Alamos National Laboratory
DOE/LANL Hydrogen Fuel Quality
This presentation does not contain any proprietary, confidential, or otherwise restricted information
Presented at 2015 DOE Hydrogen and Fuel Cells Program and Vehicle Technologies Program Annual Merit Review and Peer Evaluation MeetingJune 8-12, 2015
Arlington, VA
HyCoRA Workshop
2nd OEM Worksop
October 09, 2015

Overview
• Project start date: 10/1/06• Project end date: 9/30/15** Project continuation and direction
determined annually by DOE
• Barriers addressed– I. Conflicts between Domestic and
International Standards
– N. Insufficient Technical Data to Revise Standards
• Total project funding: $3325K– DOE share: 100%
– Contractor share: 0%
• Funding received in FY14: $475K
• Total funding planned for FY15: $475K
Timeline
Budget
Barriers
• Japan Automotive Research Institute
• Joint Research Centre- Greece
• CEA- Grenoble, France
• VTT-Finland (FCH JU HyCORA Project)
• National Hydrogen and Fuel Cell Codes and Standards Coordinating Committee Call
• ASTM
• SAE
• CAFP
• CDFA
• Smart Chemistry
Partners/Collaborators

OUTLINE
• Relevance: Objectives
• Approach and Technical Accomplishments:
1. Contributions to ASTM
� Sub-committee Chair D03.14
� Update
2. In-line Fuel Quality Analyzer
� Rationale & Approach
� Testing Status: CO and H2S
3. Hydrogen Fuel Quality Testing
� International Collaborations (Established)
� Low Loading Results with New MEAs
� Re-circulating System
• Summary
• Future Work

Objectives
� Contribute to the goals of ASTM as sub-committee chair for
D03.14 gaseous hydrogen fuel efforts.
� Develop an electrochemical analyzer to detect low levels of impurities in gaseous hydrogen fuel
� To investigate the impacts of contaminants at the levels indicated in the SAE J2719 and ISO TC197 WG12 documents
using 2015 DOE loadings.
� Collaborate with international partners to harmonize testing
protocols and fuel cell impurity testing
Relevance to Safety, Codes and Standards:
Milestones:

1. ASTM D03.14 Hydrogen and Fuel Cells Update
Approach/Objectives: Hydrogen and Fuel Cells is responsible for developing
standards, specifications, practices, and guidelines relating to hydrogen used in
energy generation or as feed gas to low, medium and high temperature fuel cells.
Accomplishments
� ASTM sub-committee chair
� Chaired two ASTM D02/D03 meetings per year
� New Agenda work items:
� Working with WG-24: Presentation –J. Schneider
� Tiger Optics: Florian Adler
� Inter-Laboratory Studies:
• Cavity Ring-Down Spectroscopy - Status: additional test sites needed.
• ASTM D7649 - Test Method for Determination of Trace CO2, Ar, N2, O2 and H20 in
Hydrogen Fuel by Jet Pulse Injection and GC/MS Analysis Testing complete
� Results received from SmartChemistry

Relevance:
• There is a need for an inline hydrogen analyzer to continuously monitor impurities
and alert the user to any fuel quality issues, both on-board in the fuel stream and at
the nozzle.
• To provide a quick response time to prevent damage to multiple vehicles
Concept:
Use a fuel cell type device to measure impurities in the fuel
stream. The device should be:
• Sensitive to the same impurities that would poison a fuel cell
stack� Use same components (Nafion®, Pt and C) as the fuel cell stack
• Orders of magnitude more sensitive to impurities than the fuel
cell stack� Use extremely low Pt loading and low surface areas
• Durable and low cost� Use small area cells, large Pt particle sizes (eliminate carbon), and
thick electrolytes
Approach: It operate as an electrochemical hydrogen pump,
using (MEA)-type configuration.
2. In-Line Fuel Quality Analyzer
Hydrogen
pumping cell

Approach: Electrode materials selections
• Pt: 30 wt %, Ru: 23.3 wt %, by
TKK., Japan
• Particle size 3.5 nm
• Carbon black with 5% Nafion®
painted decals
Reference electrode: S
pu
tte
rin
g S
yste
m
Gas Diffusion Electrode :
XRF used to confirm platinum
loadings
Use ultra-low loadings ≈
0.05mg.Pt/cm2
XRF Calibration test• Cal Standard: 0.214mg/cm2 Pt.
• Measured: 0.211 mg/cm2 Pt.
• Accuracy : 98.5%
Working electrode:
1 2
3 4
5
6
XRD
Pt particle size ≈
16nm

Exposure to 10 ppb H2S for 1 and 5hrs; and after CVs.
• Partial recovery after CVs were run up to 1.1V
• Losses were amplified as exposure time increased
• 1.4 V need and multiple cycles to reset analyzer
Technical Accomplishments:
CO
re
sult
s
• Pt Black sensitive to 0.1 ppm after 1 hr
• Sputtered sensitive to 0.025 ppm

Pt-Black Electrode Demonstration to 4 ppb H2S
SAE J2719 Fuel
Specification Limit
Approx. time for two
hydrogen fuel fillings
Approx. time to
Expend a tank of H2
4 ppb H2S response slower
and less severe…
How do we decrease the response time
and increase sensitivity?
Technical Accomplishments:

Working Electrode Type: Sputtered 0.067 mg Pt/cm2
Clear response after 1 hr
Is response in a few minutes possible?
More pronounced after 7 hrs
Technical Accomplishments:

Sputtered Electrode: Concentration
Much clearer response was observed at 10 ppb H2S…
At 4ppb, with the same electrode, their is little to no response, even after 7 hours
How do we improve response time at the SAE
limit?
Technical Accomplishments:

Sputtered Electrode: Flow-rate
• Responses increased as flows were
increased…
• Evident as we see the resistance increasing
• Total impurity dosage is critical
Technical Accomplishments:

0
0.01
0.02
0.03
0.04
0.05
0.06
0.07
0 0.02 0.04 0.06 0.08 0.1 0.12
0.2 PPM CO Repeat 2
MEA: A012115PtRu0409sput
0.0409 Pt/ 0.2 PtRu 30°C 100% RH 100 sccm H2/ H
2
Initial1Min2Min3Min5Min1Hr3Hr5Hr7Hr C
urr
ent
(A)
Potential (V)
Reduced Loading on working electrode to 0.0409 mg Pt/cm2
At SAE H2S level:
Clear response within minutes!!!
0
0.01
0.02
0.03
0.04
0.05
0.06
0.07
0 0.02 0.04 0.06 0.08 0.1 0.12
4 PPB H2S Repeat
MEA: A012115PtRu0409sput
0.0409 Pt/ 0.2 PtRu 30°C 100% RH 100 sccm H2/ H
2
Initial1Min2Min3Min5Min1Hr3Hr5Hr7Hr C
urr
ent
(A)
Potential (V)
Sputtered Electrode: LoadingTechnical Accomplishments:
At SAE CO level:

0
0.05
0.1
0.15
0 0.02 0.04 0.06 0.08 0.1 0.12
0.2 PPM CO & 4 ppb H2S MEA:
Working Electrode:0.0409 mg Pt/cm2
100% RH; 100 sccm H2
Initial
1Min
2Min
3Min
5Min
1Hr
3Hr
5Hr
7Hr
Cu
rrent
(mA
/cm
2)
Potential (V)
Measurements taken at shorter exposure time favors CO adsorption
Decay levels are not additive (as we anticipated)
Combined: 200 ppb CO & 4 ppb H2S
Technical Accomplishments:
0
2
4
6
8
10
12
14
0 100 200 300 400 500
Currnt Decay at 0.6 VCurrent Decay(200 ppb CO)
Current Decay(4 ppb H2S)
Current Decay(200 ppb CO & 4 ppb H2S)
Curr
ent D
ecay(m
A/c
m2)
Time/ minutes
0
2
4
6
8
10
12
14
0 2 4 6 8 10
Cu
rre
nt
De
ca
y(m
A/c
m2)
Time/ minutes

3. Hydrogen Fuel Quality Testing
� FUEL QUALITY Underway
• Test results compared with JARI’s MEAs
• New Baseline MEAs obtained
• Materials exchange: sent new MEAs to JARI and CEA
• Implement fuel quality testing with re-circulation system in
collaboration with JARI and CEA
� INTERNATIONAL COLLABORATIONS• LANL-JARI & LANL-CEA
o Baseline Evaluation of MEAs at each facility
o Impurity testing on low loaded MEAs.
• VTT-Finland/LANL Collaboration
• Implement identical fuel re-circulation system for impurity testing
• WG11
• PEFC document on Testing under development, Switzerland, June 2015
• Joint Research Centre- Georgios Tsotridis: Greece, Sept 2015
• Hydrogen Fuel Quality- Mukund and Rockward
• Abstract submitted - ICHS 2015 meeting, Japan, October 2015

Ion
Po
we
r P
roto
col
JAR
I P
roto
col
Technical
Accomplishments:
Comparison of MEAs measured at JARI Test Site
-both loaded with 0.15 mg Pt/cm2 (total)
Large performance gaps
differences observed
regardless of protocol?
Large discrepancies
observed in first
round of testing
JARI
IP

New MEAs with Low Loading:Reformulated ionomer to catalyst ratio in the electrode
Technical
Accomplishments:
0
0.2
0.4
0.6
0.8
1
0
0.5
1
1.5
2
0 1 2 3 4 5 6 7
030915A_LOW_IP5LANL
Cell
Voltage
Cu
rren
t De
nsity
(Am
ps/c
m^2
)
Time (Hours)
0
0.2
0.4
0.6
0.8
1
0
0.5
1
1.5
2
0 1 2 3 4 5 6 7
030915B_LANL_LOW_IP#5_LANL
Cell
Vo
ltage/
Volts
Curre
nt D
en
sity (A
mps/cm
^2)
Time/Hours
0
0.2
0.4
0.6
0.8
1
0
0.5
1
1.5
2
0 1 2 3 4 5 6 7
LANL_LOW_LANL_011415B
Cell
Voltage/
Volts
Curre
nt D
ensity
(Am
ps/c
m^2
)
Time (Hours)
0
0.2
0.4
0.6
0.8
1
0
0.5
1
1.5
2
0 1 2 3 4 5 6 7
LANL_LOW_LANL_041615
Cell
Vo
ltag
e/
Vo
lts
Cu
rren
t De
nsity
(Am
ps/c
m^2
)
Time (Hours)
Tests conducted with:
4 different samples
two different sets of
hardware
and two different test
stands.
Great
repeatability
demonstrated!

0
0.2
0.4
0.6
0.8
1
1.2
0
0.2
0.4
0.6
0.8
1
1.2
0 1 2 3 4 5
JARI MEA1_Low Pt
Cell V
olt
ag
e/
Vo
lts
Cu
rren
t De
nsity
(Am
ps
/cm
^2)
Time (Hours)
0.56 V0.55 V
0
0.2
0.4
0.6
0.8
1
1.2
0
0.2
0.4
0.6
0.8
1
1.2
0 1 2 3 4 5
042115_LOW_IP5 JARI HW and Protocol
Cell
Vo
ltage
/ V
oltag
e
Cu
rren
t Density
(Am
ps/cm
^2)
Time (Hours)
Comparison between MEAs :Identical Hardware using JARI’s Protocol
Technical
Accomplishments:
New MEA yields comparable results with JARI MEA!!!

Technical
Accomplishments:
0
0.2
0.4
0.6
0.8
1
0
0.5
1
1.5
2
0 1 2 3 4 5 6 7
LANL_LOW_LANL_012015
Ce
ll V
oltag
e/
Vo
lts
Cu
rren
t De
nsity
(Am
ps/c
m^2
)
Time (Hours)
1. Large performance improvement after changing electrode formulation.
- Old Ion Power MEA vs New MEA (new ink formulation)
2. Baseline testing shows great agreement between:
- MEAs (a) vs (b)
- Hardware (a) vs (c)
- Facilities (b) and (c)
1.
Comparison between MEAs, Hardware
& Facilities
(a) JARI Hardware with IP#5 (b) JARI Hardware and MEA (c) LANL Hardware with IP#5
JARI MEA
0
0.2
0.4
0.6
0.8
1
0
0.5
1
1.5
2
0 1 2 3 4 5 6 7
JARI_LOWIP5_LANL
Ce
ll V
olt
ag
e/
Vo
lts
Cu
rren
t De
ns
ity (A
mp
s/c
m^
2)
Time (Hours)

New MEAs with Low Loading: Initial Impurity Results: Identical Dosage CO
0.4
0.5
0.6
0.7
0.8
0.9
0
0.5
1
1.5
2
0 20 40 60 80 100 120 140
200 PPB CO/H2
A/C: 0.05/0.10 mg Pt/cm2
100% RH, 30 PSIG, H2/Air: 1.2/2.0 λλλλ
Ce
ll V
oltage
/ V
olts
Cu
rren
t De
nsity
(Am
ps/c
m^2
)
Time (Hours)
CO on
Left Figure: 100h of exposure to 200 ppb CO showed 8 mV loss
Center Figure: 50 h of exposure to 400 ppb CO 18 mV loss
Right Figure: 20 h of exposure to 1 ppm CO 21 mV loss
Our current testing plan is to test 2 ppm and 5 ppm CO with identical dosage, plot
the voltage loss versus CO concentration. We can then extrapolate the CO tolerance.
0.4
0.5
0.6
0.7
0.8
0.9
0
0.5
1
1.5
2
30 40 50 60 70 80 90 100
400 PPB CO/H2
A/C: 0.05/0.10 mg Pt/cm2
100% RH, 30 PSIG, H2/Air: 1.2/2.0 l
Ce
ll V
oltage
Cu
rrent D
en
sity (A
mp
s/c
m^2
)
Time (Hours)
CO on
0.4
0.5
0.6
0.7
0.8
0.9
0
0.5
1
1.5
2
45 50 55 60 65 70
1 PPM CO/H2
A/C: 0.05/0.10 mg Pt/cm2
100% RH, 30 PSIG, H2/Air: 1.2/2.0 l
Cell
Voltag
e/V
olts
Cu
rren
t De
nsity
(Am
ps/c
m^2
)
Time (Hours)
CO on
Technical
Accomplishments:

New Re-Circulation System for Fuel Quality Testing
Collaborator: VTT-Finland, Dr. Jari Ihonen
� Joint discussions and site visits by Dr. Jari Ihonen
�Newly implemented re-circulation system
Humidity
Bottle
Condenser/
Water Trap
Anodeh
yd
rog
en
CO
/H2
Cathode
MKS FC
Check
Valve
Automatic H20
Drain
Vent
Reservoir
SV
GC Dryer
HeaterT, RH
Check
Valve
Manual
Valve
Vent
T, RH, P
He
ate
r
[H2]
measurement
BPR
Pump
Technical
Accomplishments:

Summary
2. Hydrogen In-Line Analyzer• Improvements made to sensitivity
• Increasing particle size, reducing electrode loading, and increasing flow-
rates
• CO and H2S results
• Detection at SAE J2719 levels possible in few minutes
• Analyzer favors CO adsorption in short term exposures
• CO and H2S effects are not additive
1. ASTM• ILS 751- Test Method for Determination of Trace CO2, Ar, N2, O2 and H20 in
Hydrogen Fuel by Jet Pulse Injection and GC/MS Analysis
• Testing complete
• Coordination of results in progress
• Hydrogen Purity Analysis Using a Continuous Wave Cavity Ring-Down Spectroscopy
Analyzer
• Tests sites are needed to conduct -ILS study
• Presentation on technique scheduled for June 2015 ASTM meeting
.3. Hydrogen Fuel Quality
• International collaborations underway with JARI,CEA, and VTT
• Low loading tolerance lower than SAE J2719 levels
• Anode recirculation system installed
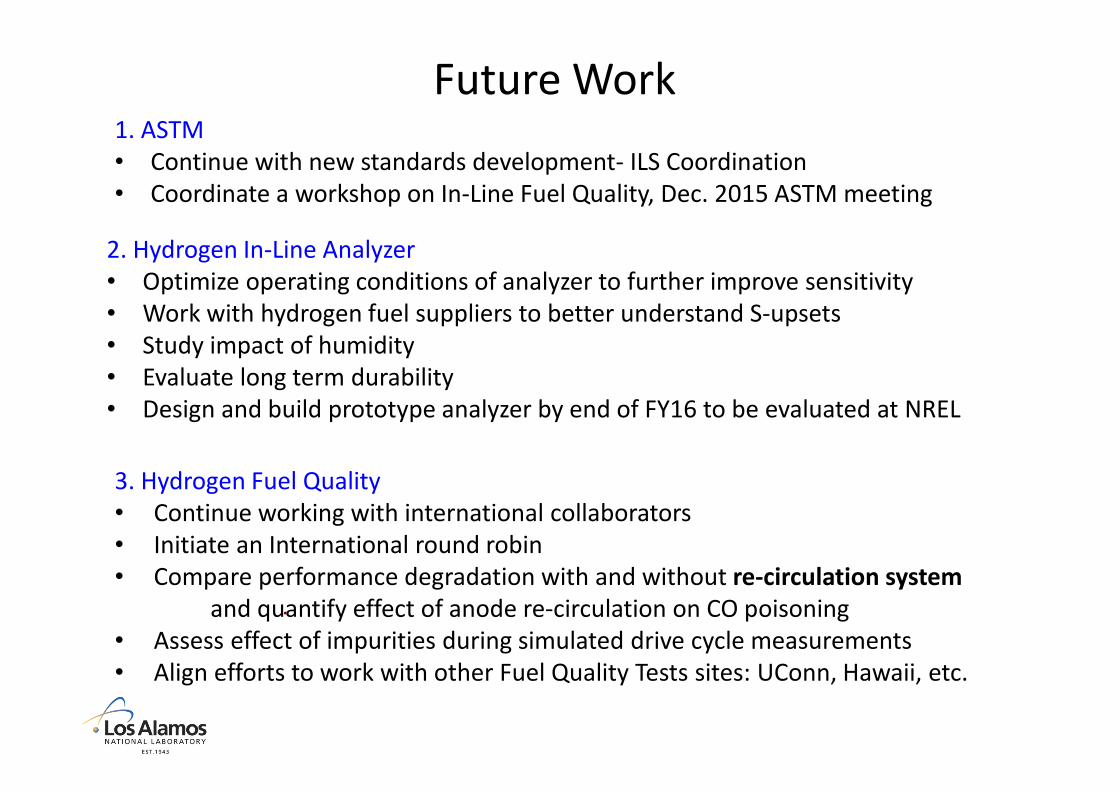
Future Work
2. Hydrogen In-Line Analyzer
• Optimize operating conditions of analyzer to further improve sensitivity
• Work with hydrogen fuel suppliers to better understand S-upsets
• Study impact of humidity
• Evaluate long term durability
• Design and build prototype analyzer by end of FY16 to be evaluated at NREL
1. ASTM
• Continue with new standards development- ILS Coordination
• Coordinate a workshop on In-Line Fuel Quality, Dec. 2015 ASTM meeting
.
3. Hydrogen Fuel Quality
• Continue working with international collaborators
• Initiate an International round robin
• Compare performance degradation with and without re-circulation system
and quantify effect of anode re-circulation on CO poisoning
• Assess effect of impurities during simulated drive cycle measurements
• Align efforts to work with other Fuel Quality Tests sites: UConn, Hawaii, etc.

Possible Collaboration Areas:1. Compare results from single cell impurity testing:
a) HyCoRA: VTT: Testing with Anode Recirculation
b) LANL: Potential Segmented Cell testing and
standard open anode testing
c) CEA- Hydrogen Fuel Quality
d) JARI- Hydrogen Fuel Quality/Re-Circ System
2. Anode loadings of Interest
a) US: total: 0.15 mg Pt/cm2
b) JARI total: 0.6 mg Pt/cm2
c) EU total: 0.35-0.40 mg Pt/cm2
3. Short term Impurity tests:
a) Typical vehicle operation time < 8 hrs
b) Drive cycle
c) Start/Stop FC operation
4. Test fresh and aged (ASTs) MEAs
5. Low cost hydrogen quality monitors for
a) On-board
b) At fuelling station
6. Novel materials (e.g. Pt-Pd anodes, NSTF)
7. Exchange of Materials/Protocols
a) Agree on common test protocol(s)
b) Baseline Tests
8. Gas Analysis/ Mass Balance

Acknowledgements
�Charles (Will) James Jr, PhD; Technologies Manager
�Calita Quesada (graduated-NMT) and Fernando Garzon (SNL & UNM)
�Our International Collaborators: JARI, VTT-Finland, CEA
�CSTT, SAE and ASTM D03.14 members

Publications/Presentations
Tommy Rockward, Calita Quesada, Fernando Garzon, and Rangachary Mukundan, Platinum
Electrode Properties Tailored to Respond to Ultra-Low Concentrations of H2S in Gaseous
Hydrogen Fuel, Electrochemical Society Meeting, Cancun, Mexico. October 2014
Tommy Rockward, Jacob Valdez, and Rangachary Mukundan, An In-Line Fuel Quality Analyzer for
Detecting Ultra-Low Levels of Hydrogen Contaminants, (abstract submitted ICHS 2015)
Reviewer’’’’s Comments
When asked what the final response time target is, the presenter answered that the target fill time
is four minutes; therefore, the response time target is four minutes. While this is an appropriate
target, this answer glossed over reality. A response time of four minutes from an hour
demonstrates that this technology has a long way to go. The project team successfully reduced the
time by a factor of five (five hours to one hour); however, this technology needs another factor of
15 (60 minutes to four minutes). We focused on reducing the analyzer’’’’s response time to t <
5minutes to avoid damage to multiple fleets and were successful. Results are shown.
It is recommended that the project include, from the outset, international partners in the efforts
(workshop and subsequent experimental activities) on hydrogen storage system cleanliness.
Interaction with JARI and the EU should be strengthened, including the identification of commonly
agreed loading cycles (stressors) representative for automotive applications, in addition to the
harmonized test protocols which should be
expanded from MEA to stack level. We are steadily increasing our international collaborations:
VTT-Finland and Department of Energy-Politecnico di Milano (Italy).