Addendum 9 to the - DOE Information Center
299
This document is approved for public release per review by: Peter J. Kortman (signature on file) 02/19/2020 UCOR Classification & Information Control Office Date DOE/OR/01-2224&D5/A9 Addendum 9 to the Remedial Design Report/Remedial Action Work Plan for Zone 2 Soils, Slabs, and Subsurface Structures for Exposure Unit Z2-19 with Technical Memorandum at East Tennessee Technology Park, Oak Ridge, Tennessee
-
Upload
khangminh22 -
Category
Documents
-
view
0 -
download
0
Transcript of Addendum 9 to the - DOE Information Center

This document is approved for public release per review by:
Peter J. Kortman (signature on file) 02/19/2020 UCOR Classification & Information Control Office
Date
DOE/OR/01-2224&D5/A9
Addendum 9 to the Remedial Design Report/Remedial Action Work Plan
for Zone 2 Soils, Slabs, and Subsurface Structures for Exposure Unit Z2-19 with Technical Memorandum at
East Tennessee Technology Park, Oak Ridge, Tennessee


DOE/OR/01-2224&D5/A9
Addendum 9 to the Remedial Design Report/Remedial Action Work Plan
for Zone 2 Soils, Slabs, and Subsurface Structures for Exposure Unit Z2-19 with Technical Memorandum at
East Tennessee Technology Park, Oak Ridge, Tennessee
Date IssuedFebruary 2020
Prepared for the U.S. Department of Energy
Oak Ridge Office of Environmental Management
URS | CH2M Oak Ridge LLC under contract DE-SC-0004645
E.0521.056.0435

This page intentionally left blank.

iii
CONTENTS
FIGURES ...................................................................................................................................................... v
TABLES ..................................................................................................................................................... vii
ACRONYMS ............................................................................................................................................... ix
1. INTRODUCTION ................................................................................................................................ 1
2. EU LOCATION AND DESCRIPTION ............................................................................................... 3
3. BACKGROUND AND SITE HISTORY ............................................................................................. 7 OPERATIONAL HISTORY .................................................................................................... 18
Building K-1410 ......................................................................................................... 18 3.1.1.1 K-1410 Drain Lines Leading to Outfall 360 ........................................................ 19
Building K-1031 ......................................................................................................... 21 Ancillary Buildings .................................................................................................... 22 Creek Bank Area ........................................................................................................ 22
3.1.4.1 NPDES and process drain outfalls ....................................................................... 22 3.1.4.2 K-1131 Neutralization Pit .................................................................................... 23 3.1.4.3 Creek Bank Area .................................................................................................. 23
HISTORICAL SAMPLING RESULTS ................................................................................... 24 Pre-DQO Scoping Summary Sampling ...................................................................... 24 DVS Sampling ............................................................................................................ 25
3.2.2.1 Maximum RL Screening ...................................................................................... 25 3.2.2.2 Average RL Screening ......................................................................................... 25 3.2.2.3 Threat to Groundwater ......................................................................................... 26 3.2.2.4 Evaluation Summary ............................................................................................ 27 3.2.2.5 Additional data collection .................................................................................... 29
4. CONCEPTUAL SITE MODEL ......................................................................................................... 31 PRIMARY SOURCE ................................................................................................................ 31 PRIMARY RELEASE MECHANISM .................................................................................... 31 SECONDARY SOURCE ......................................................................................................... 31 SECONDARY RELEASE MECHANISM .............................................................................. 32 MIGRATION PATHWAY ....................................................................................................... 32 IMPACTED MEDIA ................................................................................................................ 33 ANTICIPATED CONTAMINANT DISTRIBUTION............................................................. 33 DATA GAPS ............................................................................................................................ 33
5. TECHNICAL BASIS FOR RA DECISION ....................................................................................... 35 SAMPLING ACTIVITIES ....................................................................................................... 35 K-1410 NEUTRALIZATION PILE ......................................................................................... 38 OUTFALLS 350 AND 360 DRAINAGE DITCHES ............................................................... 39 OUTFALL 362 DRAINAGE DITCH ...................................................................................... 45 K-2527-BR GROUT SHOP ...................................................................................................... 53
3.1
3.2
4.1
4.2
4.3
4.4
4.5
4.6 4.7
4.8
5.1 5.2
5.3 5.4
5.5
3. 1.1
3.1.2
3.1.3
3. 1.4
3.2.1
3.2.2

iv
RA DECISION ......................................................................................................................... 55
6. RA QUANTITIES .............................................................................................................................. 57
7. CONFIRMATION SAMPLING ........................................................................................................ 61 CLASS 1 SOIL UNIT CONFIRMATION SAMPLING .......................................................... 61 CONFIRMATION SAMPLING IN THE OUTFALL 362 DITCH (DIG 2
EXPANSION)........................................................................................................................... 63
8. GROUNDWATER CONDITIONS .................................................................................................... 65
9. EU STATUS ....................................................................................................................................... 67
10. REFERENCES ................................................................................................................................... 69
EU Z2-19 DATA QUALITY ASSESSMENT AND PATH FORWARD ................ 1-1
EU Z2-19 CREEK BANK AREA DATA QUALITY OBJECTIVES FOR FINAL CHARACTERIZATION May 2019 ......................................................................... 2-1
EU-19 TM SAMPLE SUMMARY TABLE ............................................................. 3-1
EU-19 DATA SUMMARY TABLES....................................................................... 4-1
CONCURRENCE FORMS ....................................................................................... 5-1
BORING LOGS ........................................................................................................ 6-1
EXPANSION OF APPROVED REMEDIAL ACTION IN EU Z2-19 September 17, 2019 ........................................................................................................................... 7-1
5.6
7.1 7.2
ATTACHMENT I:
ATTACHMENT 2:
ATTACHMENT 3:
ATTACHMENT 4:
ATTACHMENT 5:
ATTACHMENT 6:
ATTACHMENT 7:

v
FIGURES
Figure 1. ETTP Zone 2 with EU Z2-19 highlighted. .................................................................................... 4 Figure 2. Location of current and historical facilities in EU Z2-19. ............................................................. 5 Figure 3. EU Z2-19 in 1951. ....................................................................................................................... 11 Figure 4. EU Z2-19 aerial taken in September 2018 (facing west)............................................................. 12 Figure 5. Historical sampling locations and storm drain lines in EU Z2-19. .............................................. 13 Figure 6. Results for the Class 1 SU radiation walkover survey performed July 2016 in EU Z2-19. ........ 14 Figure 7. Soil sample locations in the Class 1 SU (dates are provided in Attachment 3). .......................... 15 Figure 8. EU Z2-19 RAs. ............................................................................................................................ 16 Figure 9. Historical sampling locations used for the Creek Bank DQO (dates are provided in
Attachment 3). ............................................................................................................................ 17 Figure 10. Floor drains identified in K-1410 inside building. .................................................................... 20 Figure 11. Floor drains identified in 1945 drawing of K-1410 outside building. ....................................... 21 Figure 12. Storm water flow direction. ....................................................................................................... 22 Figure 13. K-1410 Limestone Pit ................................................................................................................ 23 Figure 14. Area west of EU Z2-19 (looking east) showing the slope to Poplar Creek. .............................. 24 Figure 15. Historical sample locations (2017) with exceedances identified in EU Z2-19
(FCN-ETTP-Zone 2-225). ........................................................................................................ 28 Figure 16. Samples collected in 2018 with TCE plume shown (sample dates are included in
Attachment 3). ........................................................................................................................... 30 Figure 17. Conceptual Site Model for EU Z2-19. ....................................................................................... 34 Figure 18. EU Z2-19 Class 1 Soil RA Areas .............................................................................................. 36 Figure 19. EU Z2-19 creek bank sampling location summary. .................................................................. 37 Figure 20. Radiation walkover survey in the K-1410 Neutralization Pile area. ......................................... 38 Figure 21. Radiation walkover survey in the Outfalls 350 and 360 surface drainage areas. ...................... 40 Figure 22. Outfall 350 ditch sampling results. ............................................................................................ 41 Figure 23. EU Z2-19 additional sampling activities. .................................................................................. 42 Figure 24. Delineation sample locations collected around location Z2-EU19B-717.................................. 44 Figure 25. EU Z2-19 Outfall 362 drainage ditch radiological walkover survey (January 2020). ............... 46 Figure 26. EU Z2-19 Poplar Creek radiological walkover survey at bottom of ditch (January
2020). ........................................................................................................................................ 47 Figure 27. Outfall 362 ditch soil sample locations. .................................................................................... 49 Figure 28. Delineation sampling areas in EU Z2-19 Outfall 362 ditch. ..................................................... 50 Figure 29. Delineation sample locations at the bottom of the ditch. ........................................................... 52 Figure 30. Radiological walkover assessment of K-2527-BR Grout Shop (December 2019). ................... 54 Figure 31. Remedial actions recommended for the Class 1 SU area in EU Z2-19. .................................... 58 Figure 32. Excavation proposed in the upper ditch area of the Dig 2 Expansion. ...................................... 59 Figure 33. Confirmation sample locations in Class 1 SU. .......................................................................... 62 Figure 34. Confirmation sample locations for upper portion of the Outfall 362 ditch. .............................. 64 Figure 35. Location of groundwater monitoring wells. .............................................................................. 66 Figure 36. 2019 aerial view of EU Z2-19 facing east. ................................................................................ 67

vi
This page intentionally left blank.

vii
TABLES
Table 1. Facilities within EU Z2-19. ............................................................................................................. 6 Table 2. EU Z2-19 sampling events.............................................................................................................. 8 Table 3. Historical sampling activities. ......................................................................................................... 8 Table 4. EU Z2-19 background documents. ................................................................................................. 9 Table 5. Class 1 SU analytes with maximum detected concentrations exceeding maximum RLs. ........... 25 Table 6. Class 1 SU analytes with maximum detected concentrations exceeding average RLs. ............... 26 Table 7. Class 1 SU analytes with maximum detected concentrations exceeding GW SSLs. ................... 27 Table 8. Conceptual Site Model for EU Z2-19. .......................................................................................... 32 Table 9. Delineation sampling in upper portion of Dig 2 Expansion in Outfall 362 Ditch. ....................... 48 Table 10. Bottom of ditch delineation sampling depths. ............................................................................ 53 Table 11. Approximate depths, areas, and volumes of material to be excavated during
recommended RAs to be performed in EU Z2-19. ..................................................................... 60 Table 12. EU Z2-19 monitoring well information. ..................................................................................... 65 Table 13. RA status for EU Z2-19 .............................................................................................................. 67

viii
This page intentionally left blank.

ix
ACRONYMS
Avg average bgs below ground surface COC contaminant of concern cpm counts per minute Cs-137 cesium-137 CSM conceptual site model D&D decontamination and decommissioning DOE U.S. Department of Energy DQO Data Quality Objective DVS Dynamic Verification Strategy EPA U.S. Environmental Protection Agency ETTP East Tennessee Technology Park EU exposure unit FFA Federal Facility Agreement GW groundwater GW SSL groundwater soil screening level Max maximum NFA no further action NNSS Nevada National Security Site NPDES National Pollutant Discharge Elimination System PCB polychlorinated biphenyl PCOC potential contaminant of concern PRG preliminary remediation goal RA remedial action RAO remedial action objective RCRA Resource Conservation and Recovery Act RDR/RAWP Remedial Design Report/Remedial Action Work Plan RL remediation level ROD Record of Decision SU soil unit TCE Trichloroethylene TCLP toxicity characteristic leaching procedure TDEC Tennessee Department of Environment and Conservation TM Technical Memorandum UF6 uranium hexafluoride VOC volatile organic compound

x
This page intentionally left blank.

1
1. INTRODUCTION
The purpose of this Technical Memorandum (TM) is to document the current state of progress for an action/no further action (NFA) recommendation for Zone 2 exposure unit (EU) Z2-19 in the Poplar Creek EU Group at the East Tennessee Technology Park (ETTP) in Oak Ridge, Tennessee. The progress toward the recommendation for this EU is based on existing historical data and Dynamic Verification Strategy (DVS) soil and concrete characterization activities, which are used to determine the nature and extent of contamination and evaluate the need for an action based on the requirements of Record of Decision for Soil, Buried Waste, and Subsurface Structures in Zone 2, East Tennessee Technology Park, Oak Ridge, Tennessee (DOE/OR/01-2161&D2; Zone 2 ROD).
EU Z2-19 is located toward the center portion of ETTP, but is in the western area of Zone 2. Historically, this EU was used as a support area for the gaseous diffusion process. This TM provides additional information for and evaluation of EU Z2-19. This TM provides supporting information to document evaluation of the entire EU, and to propose a recommendation for a remedial action (RA) or an NFA status for the EU. The recommendation for this EU is based on existing historical data, process knowledge, and characterization and sampling activities in compliance with the Zone 2 ROD. The objectives of this TM are also to document the characterization activities and RAs conducted in this area, interpret the characterization data, and make recommendations on how to reach a NFA status.
The data resulting from DVS and historical characterization activities conducted in EU Z2-19 are evaluated in this TM against the Zone 2 ROD remedial action objective (RAO) by comparing the data to certain industrial worker risk and groundwater protection criteria. The industrial worker risk criteria include remediation levels (RLs) for Zone 2 ROD primary contaminants of concern (COCs) and industrial worker preliminary remediation goals (PRGs) with which to evaluate aggregate risk from all chemicals and radionuclides. The groundwater protection criteria are a set of groundwater soil screening levels (GW SSLs) that are based on Zone 2 ROD groundwater protection requirements. The industrial worker RLs and the GW SSLs are taken from the Zone 2 ROD and are presented in the Remedial Design Report/Remedial Action Work Plan for Zone 2 Soils, Slabs, and Subsurface Structures, East Tennessee Technology Park, Oak Ridge Tennessee (DOE/OR/01-2224&D5; Zone 2 RDR/RAWP).

2
This page intentionally left blank.

3
2. EU LOCATION AND DESCRIPTION
EU Z2-19 is located in the central portion of ETTP, but is on the western edge of Zone 2. The EU is bounded by EU Z2-17 to the north, EUs Z2-20, Z2-21, and Z2-22 to the east, EU Z2-13 to the south, and Poplar Creek on the west (Figure 1). Under the DVS, EU Z2-19 was included in the Data Quality Objective Scoping Package for the Poplar Creek Group (EUs Z2-11, Z2-12, and Z2-19) at the East Tennessee Technology Park, Oak Ridge, Tennessee (BJC/OR-3231; DQO Scoping Package).
The Poplar Creek Group encompasses approximately 58.2 acres and includes potential sources for contamination. The land area of EU Z2-19 is approximately 23 acres. Almost all of the facilities within the EU are no longer in use. The only remaining facility, K-2527-BR Grout Shop, is still standing but is currently only used for storage of materials. The other above-grade facilities have been demolished and disposed, as identified in Table 1. Two of the remaining slabs were identified as potentially contaminated and the other remaining slabs in the EU were considered Class 3 slabs, in accordance with Appendix K of the Zone 2 RDR/RAWP. Figure 2 is a map of the EU Z2-19 and the layout of the historical and remaining structures.
The DQO Scoping Package lists two sites in EU Z2-19 that are included in Appendix C of the Federal Facility Agreement (FFA):
• K-1031 Waste Paint Accumulation Area
• K-1410 Neutralization Pits/Drain Lines
However, some of the facilities were added to the Action Memorandum via a letter from the U.S. Department of Energy (DOE) to be added to Appendix C:
• K-2527-BR Grout Shop
• K-1231-A Propane Storage
• K-1435-D4 Storage Rubb Tent
Except for K-2527-BR, all FFA sites in EU Z2-19 were buildings or facilities that were demolished during decontamination and decommissioning (D&D) activities and no longer exist. The concrete slabs associated with these buildings and other facilities not included in FFA Appendix C that remain in the EU are presented in Table 1 below.

4
Figure 1. ETTP Zone 2 with EU Z2-19 highlighted.

5
Figure 2. Location of current and historical facilities in EU Z2-19.

6
Table 1. Facilities within EU Z2-19.
Facility Status Demolition date Potentially
contaminated slab (Y/N)*
K-700-A-54 Substation Demolished Prior to 2006 N
K-700-A-70 Substation Demolished Prior to 2011 N
K-1031 Power and Utilities Storage Facility Demolished 1999 Y
K-1066-D Tanker Storage Facility (and tanks) Slab Always a slab N
K-1231-A Propane Storage Demolished, no slab remains Tanks were removed 1999 N
K-1410 Nickel Plating Facility Demolished 1999 Y
K-1410-B Effluent Treatment Facility Inactive NA NA
K-1435-D4 Rubb Tent Demolished 2016 N**
K-2527-BR Trailer Currently in place Planned FY20 N
K-1310-NF Trailer Currently in Place Planned FY20 TBD
K-1031-A Support Building Demolished 1999 N
*Based on RDR/RAWP Appendix K Table K.1. ** K-1435-D4 was on the footprint of slab K-1066-D. TBD – to be determined, facility still active NA – not applicable, below grade structures

7
3. BACKGROUND AND SITE HISTORY
Facilities located within EU Z2-19 were used to house support facilities for the gaseous diffusion process (i.e., storage areas, research and development, and waste management) and include primarily the K-1031 and K-1410 facilities. A historical photo of EU Z2-19 showing the facilities during operations is shown in Figure 3. A recent aerial is provided as Figure 4. The facilities were designed to support uranium enrichment with the larger structures housing mostly uranium hexafluoride (UF6) handling equipment and other structures being associated with chemical and waste processing equipment.
A schematic of EU Z2-19 that displays the locations of these facilities is shown in Figure 2. The schematic is shown with storm drain lines in Figure 5. The storm drain lines and the process drain lines predominantly flow toward Poplar Creek to the west.
Portions of EU Z2-19 were sampled prior to development of the DQO Scoping Package, primarily as part of the K-25 Radiological Survey (phase 1 in 1994 and phase 2 in 1995). Additional sampling was completed to support the ETTP Remedial Investigation in 1998, Remedial Investigation Report for the East Tennessee Technology Park, Oak Ridge, Tennessee (DOE/OR/01-1778/V3&D1). Information on sampling, including dates and summaries, is included in Table 2.
Execution of the activities identified in the DQO Scoping Package began in July 2016 with a radiation walkover survey of the Class 1 Soil Unit (SU). As described, the survey results were reviewed by the Project Team on August 24, 2016 (Figure 6). The resulting revisions to the RDR/RAWP Appendix G.2 identified sampling plan was documented in concurrence form FCN-ETTP-Zone 2-194 (Attachment 5). The plan was executed beginning in March 2017. The collection of samples from 30 locations was completed the same month. Further detail regarding the sampling, including analytes and sample depths, is included in Table 3. Following preliminary evaluation of the data against Zone 2 criteria, several maximum (Max) RL exceedances were identified and delineation sampling was conducted in an additional 57 sample locations. The delineation sampling was conducted from September 26, 2017 through October 30, 2017. A listing of all sample locations is presented in Attachment 3. The locations of the characterization and delineation sampling are provided in Figure 7.
The EU Z2-19 Class 1 SU data were evaluated against the Zone 2 ROD RAO decision criteria as described in the Zone 2 RDR/RAWP and documented in concurrence FCN-ETTP-Zone 2-225 (Attachment 5). The FCN contained an EU Z2-19 technical memorandum that presented the evaluation of the data and proposed an RA for the EU. A map showing all of the sample locations is provided as Figure 7. A map showing the proposed RA is Figure 8. The data will be further discussed in Section 5.
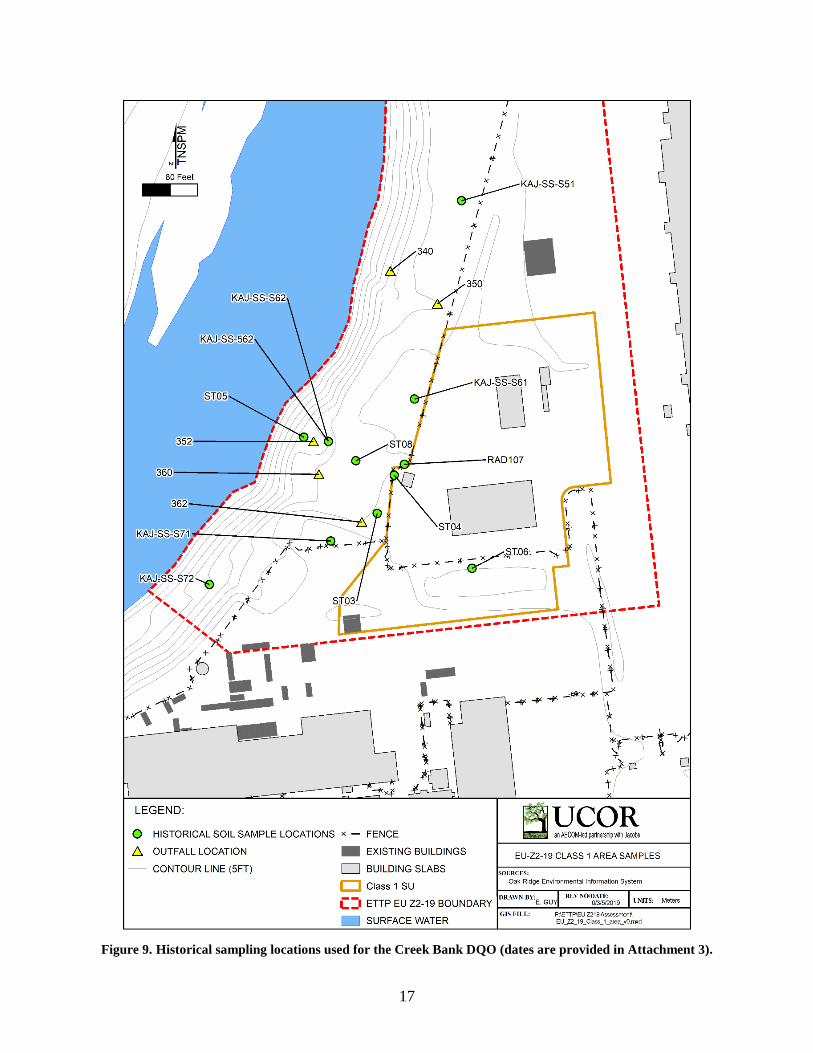
The historical samples used to determine whether a data gap exists outside the security fence are presented in Figure 9.

8
Table 2. EU Z2-19 sampling events.
Sampling event Summary Dates Data use
Phase 1 K-25 radiological survey
Provided an initial screening of sites at ETTP to identify areas of elevated radioactivity and collect surface soil samples.
1994 Identify areas of contamination at ETTP locations with exceedances to be re-sampled.
Phase 2 K-25 radiological survey
Provided an initial screening of sites at ETTP to identify areas of elevated radioactivity and collect surface soil samples.
1995 Identify areas of contamination at ETTP with exceedances to be re-sampled.
K-1410 Exterior Characterization
Presented and evaluated the nature and extent of contamination at ETTP. 1999 (draft)
Historical data evaluation to identify locations requiring additional sample collection.
DVS Characterization Sampling
Shallow discrete and 10 ft 3 interval composite samples were collected to support evaluation of the EU.
Mar-Apr 2017 Determine if contamination warranting an RA was present.
Delineation Sampling
Discrete 3 interval samples were collected. Sept-Oct 2017 Delineate the identified areas of
contamination warranting remediation.
DVS = Dynamic Verification Strategy ETTP = East Tennessee Technology Park EU = exposure unit RA = remedial action
Table 3. Historical sampling activities.
Sampling event Locations RAD Metals PCB SVOC VOC Comments Phase 1 K-25 radiological survey 25 X Surficial radiological
investigation (0-6 in.). Phase 2 K-25 radiological survey 12 X Surficial radiological
investigation (0-6 in.). K-1410 Exterior Characterization 7 X X X X Various targeted discrete 2 ft
intervals up to 9 ft deep.
DVS Characterization (as modified by FCN-ETTP-Zone 2-194)
30 X X X X X
Primarily shallow (0-1 ft) radiological with 3 full characterization (20%) and 5 utility corridor 10 ft 3-interval composite samples full suite.
DVS Delineation 57 X X X X
Predominantly three discrete interval samples (0.5, 2, and 4 ft) to delineate the areas of contamination.
Note: Additional information, including date, intervals, and analytes, regarding individual sample locations within each sampling event can be found in Attachment 3. DVS = Dynamic Verification Strategy RAD = radiological PCB = polychlorinated biphenyl SVOC = semivolatile organic compound VOC = volatile organic compound

9
Table 4. EU Z2-19 background documents.
Document Title Date Scope Relevance RCRA Facility Investigation Plan K-1410 Building Oak Ridge Gaseous Diffusion Plant Oak Ridge, Tennessee
December 1988 Contains data and information on the K-1410 building.
Provided process knowledge for K-1410 building
Remedial Site Evaluation for the K-1410 and K-1031 Facilities and Surrounding Area at the Oak Ridge K-25 Site, Oak Ridge Tennessee (DOE/OR/01-1412&D1)
October 1995
Contains data and information on the K-1410 and K-1031 buildings.
Provided process knowledge for K-1410 and K-1031 buildings
Radiological Characterization of Inactive Waste Sites at the Oak Ridge K-25 Site, Oak Ridge, Tennessee (K/ER-218)
May 1995
Provided an initial screening of sites at ETTP to identify areas of elevated radioactivity and collect surface soil samples
Provided historical radiological concentration information from surveys and sample results
Engineering Evaluation/Cost Analysis (EE/CA) for the Group 1 Auxiliary Facilities, K-25 Site, Oak Ridge, Tennessee (DOE/OR/02-1456/V2&D2)
June 1996
Support the D&D of 5 auxiliary facilities, including K-1410 and K-1031 buildings
Provided historical information on K-1410 and K-1031 buildings
Oak Ridge K-25 Site Outdoor Radiological Characterization, Phase II, Vol. 1-VI K/HS-620
September 1996
Provided an initial screening of sites at ETTP to identify areas of elevated radioactivity and collect surface soil samples
Provided historical radiological concentration information from surveys and sample results
Removal Action Work Plan for the K-25 Auxiliary Facilities Decommissioning Group I Buildings Demolition Project at the East Tennessee technology Park, Oak Ridge, Tennessee (DOE/OR/02-1657&D2)
December 1997
Support the D&D of 5 auxiliary facilities, including K-1410 and K-1031.
Provided historical information on K-1410 and K-1031
Remedial Investigation Report for the East Tennessee Technology Park, Oak Ridge, Tennessee, DOE/OR/01-1778/V3&D1, January 1999
January 1999
Document nature and extent of contamination and associated risk at ETTP.
Provides historical investigation information
Removal Action Report for the K-25 Auxiliary Facilities Decommissioning Group I Buildings Demolition Project at the East Tennessee Technology Park, Oak Ridge, Tennessee (DOE/OR/01-1829&D1)
August 1999
Support the D&D of 5 auxiliary facilities, including K-1410 and K-1031.
Provided historical information on K-1410 and K-1031.
Data Quality Objective Scoping package for the Poplar Creek Group (EUs Z2-11, Z2-12, and Z2-19) at the East Tennessee Technology Park, Oak Ridge, Tennessee (BJC/OR-3231)
April 2009
Provide background information on EU Z2-19 along with proposed characterization strategy.
Provided information on the original DVS characterization planning

10
Table 4. EU Z2-19 background documents (cont.)
Document Title Date Scope Relevance FCN-ETTP-Zone 2-194 - Documented the Class 1 sampling and revised the DQO Scoping Summary plan.
November 2016 Propose additional sampling in the Class 1 area of EU Z2-19.
Identifies additional sampling needed for EU characterization.
FCN-ETTP-Zone 2-225 - Documented the RA for EU Z2-19 inside the security fence.
May 2018
Evaluation of samples collected in accordance with RDR/RAWP Appendix G, as modified by FCN-ETTP-Zone 2-194.
Identified RA for EU Z2-19 inside the fence.
Appendix L Sampling and Analysis Plan for Exposure Unit Z2-19, East Tennessee Technology Park, Oak Ridge, Tennessee (DOE/OR/01-2224&D5)
January 2020
Support characterization of areas not evaluated as part of the Class 1 SU in EU Z2-19.
Provided remaining characterization data required to determine whether additional RAs are needed.
D&D = decontamination and decommissioning DQO = Data Quality Objectie EU = exposure unit RCRA = Resource Conservation and Recovery Act RDR/RAWP = Remedial Design Report/Remedial Action Work Plan

11
Figure 3. EU Z2-19 in 1951.

12
Figure 4. EU Z2-19 aerial taken in September 2018 (facing west).

13
Figure 5. Historical sampling locations and storm drain lines in EU Z2-19.

14
Figure 6. Results for the Class 1 SU radiation walkover survey performed July 2016 in EU Z2-19.

15
Figure 7. Soil sample locations in the Class 1 SU (dates are provided in Attachment 3).

16
Figure 8. EU Z2-19 RAs.
17
Figure 9. Historical sampling locations used for the Creek Bank DQO (dates are provided in Attachment 3).

18
OPERATIONAL HISTORY
Following is a brief discussion of the historical use and existing conditions of the facilities located in EU Z2-19.
Building K-1410
The K-1410 Building was used to mix media from the spent cascade traps for use in the K-25 Gaseous Diffusion Plant. Subsequently, it was used for decontamination and recovery of uranium from large pieces of process equipment. The building included two spray facilities to solubilize and remove uranium with nitric acid and to degrease pumps with Trichloroethylene (TCE). Finally, the facility was converted to an electroplating facility by removing the decontamination tanks and filling the degreasing pits with concrete. Only a concrete slab remains. The slab was covered with asphalt following the building demolition in 1994. The slab is within the Class 1 SU of EU Z2-19.
The operational use of the facility transitioned through time. A description of the facility use through time is provided below:
• 1945 – Facility constructed, original operations involved storage of clean trapping materials (alumina, carbon, and sodium fluoride), mixing carbon and cadmium-coated alumina for use in carbon traps.
• 1947 – Began operations to separate carbon from the alumina in spent trapping media for uranium recovery.
• 1948 – Building converted to a cleaning and decontamination facility when use of carbon in cascade traps was discontinued. Conversion included installation of two spray facilities in the west end of the building for decontaminating large pieces of equipment. The spray facilities included two 8x2x25 stainless steel spray tanks in pits with floor pans to collect spray. A degreaser that used tetrachloroethene, carbon tetrachloride, and TCE was installed between the two pits.
o A contaminated material incinerator was constructed near the SW corner of the building (no information on what was burned is available).
• 1953 1954 — The facility was dedicated to decontamination of equipment from the K-1131 Feed Manufacturing Plant (FMP), which processed spent reactor fuel from other DOE sites.
o During this period, and likely at other times, contaminated process equipment was stored periodically in outdoor areas adjacent to K-1410 (and K-1031).
o One documented episode involved outdoor storage of ash receivers associated with the FMP fluorination towers. The ash receivers were staged to allow time for short-lived isotopes to decay. The receivers were opened daily for stirring and off-gassing.
• 1963/1964 – The facility was converted to an electroplating facility. The conversion entailed filling in the spray pits, installing plating equipment, and adding a new degreasing station. A limestone neutralization pile was constructed near Poplar Creek to neutralize acid discharges from plating operations. The plating process used hydrochloric acid dips, alkali dips, sulfuric acid dips, and solvents for degreasing. The electroplating solution contained nickel sulfate, nickel chloride, boric acid, etc., in support of nickel electroplating.
• 1975 – Installed a concrete pit (K-1410-B) with equipment to allow for neutralization prior to discharge (discharge from the new pit went into the original limestone pile).
• 1979 – Facility was deactivated.

19
• 1999 – Facility demolition completed; the slab and three pits remain. These pits will be removed when the building slab is demolished.
3.1.1.1 K-1410 Drain Lines Leading to Outfall 360
The drain lines emanating from the K-1410 building are a primary source for the contamination found in the drainage ditch associated with Outfall 360 (Figure 12 below shows the outfalls in relation to K-1410). The contaminants of concern associated with the drain line include radionuclides, metals, and polychlorinated biphenyls (PCBs) due to the processes in the facility. The drain lines received various wastewater streams throughout the life of the facility. The lines ran from various floor drains in the facility, as shown in Figure 10, through a common cleanout box (Figure 11.) to the open ditch that is now Outfall 360.

20
Figure 10. Floor drains identified in K-1410 inside building.

21
Figure 11. Floor drains identified in 1945 drawing of K-1410 outside building.
Building K-1031
Constructed in 1945 as a maintenance support facility for the K-25 building, the K-1031 building was used to store and dispense trapping media for spent cascade traps and was later used as a cutting and size reduction area for process equipment from the Fercleve Thermal Diffusion Plan. Prior to demolition, the building was used for paint storage and mixing, equipment and material storage. Only the concrete slab remains. Walkover surveys performed in 1999 indicated low levels of contamination exist throughout the slab, with small areas of higher activity to the north and south of the building. The slab was covered with asphalt following the building demolition in 1999. Demolition of the K-1031 Building can be found in the Removal Action Report for the K-25 Auxiliary Facilities Decommissioning Group I Buildings Demolition Project (DOE/OR/01-1829&D1). The slab is within the Class 1 SU of EU Z2-19.

22
Ancillary Buildings
In the northern portion of the EU, temporary structures, including trailers and grouped Sealand containers/Rubb tents were brought in to support the grouting process at the K-25 demolition project. The structures were used to house personnel and to store containers of grouted material prior to shipment. All of the facilities except for the K-2527-BR Grout Shop have been removed from the area. The K-2527-BR Grout Shop is scheduled to be demolished in FY20.
Creek Bank Area
EU Z2-19 extends from the industrial area to Poplar Creek. The area west of the predominantly industrial area has also been potentially impacted by the operations of the facilities. There are four areas of potential contamination including the National Pollutant Discharge Elimination System (NPDES) and process drain outfalls, the K-1410-B Neutralization Pile, historical hotspots, and runoff from the industrial area.
3.1.4.1 NPDES and process drain outfalls
Past practices in the industrial area included disposal of wastes and potential contaminants into process drains and storm drains with outfalls along the banks of Poplar Creek. Historically, storm water runoff from ETTP was another potential source of contamination due to contact with contaminated facilities and soils. Demolition and removal of contaminated facilities and remediation of contaminated soil areas has resulted in significant improvements in water quality in the storm drain discharges from ETTP. Discharges from ETTP are regulated under an NPDES permit issued by the State of Tennessee. Currently, Outfalls 360 and 362 are authorized to discharge storm water runoff under NPDES Permit TN0002950. (In the DQO, Outfall 360 was chosen to represent this ditch, when OF 362 should have been referenced. This document corrects the discrepancy.) Outfalls 360 and 362 receive runoff from the K-1031 and K-1410 buildings. Even with recent improvements, residual contamination is known to be present in soils downstream of these outfalls. Figure 12 shows the storm water flow direction in the southern portion of the EU.
Figure 12. Storm water flow direction.

23
3.1.4.2 K-1131 Neutralization Pit
The K-1131 Neutralization Pile (Figure 13) was constructed in 1964 with limestone gravel, approximately 26 ft by 26 ft and connected to process lines running to the northwest from K-1410. A 4 in. vitrified clay drain line runs approximately 200 ft from K-1410 to the limestone acid disposal pit. The pipe was previously identified as Outfall 352, but was plugged in the late 1990’s and was identified in the 1997 permit renewal as “sealed and no longer requiring permitting”.
Figure 13. K-1410 Limestone Pit
3.1.4.3 Creek Bank Area
The area west of the EU Z2-19 industrial area is bounded by Poplar Creek, approximately 60-250 ft west of the industrial area fence. The topography drops, at its steepest, approximately 46 ft between the industrial area and Poplar Creek. Overland releases of contamination have occurred west of the industrial facilities, carrying contamination to the area between Poplar Creek and the industrial area. One portion of the creek bank is incised by a storm water outfall drainage ditch (Outfall 362) pictured in Figure 14.

24
Figure 14. Area west of EU Z2-19 (looking east) showing the slope to Poplar Creek.
HISTORICAL SAMPLING RESULTS
Pre-DQO Scoping Summary Sampling
Historical sampling was conducted in EU Z2-19 from 1994 through 1998, as part of the K-25 Radiological Survey Phase 1 (1994), Phase 2 (1995), and in support of the Remedial Investigation Report for the East Tennessee Technology Park, Oak Ridge, Tennessee (DOE/OR/01-1778/V3&D1). A listing of all sample locations are presented in Attachment 3. Samples exceeding the Zone 2 ROD criteria have been identified and discussed previously in FCN-ETTP-Zone 2-225 (Attachment 5), which identified an RA in the southern portion of the EU.
Surface and near surface soil samples were collected as part of a K-25 Radiological survey in 1994, documented in Radiological Characterization of Inactive Waste Sites at the Oak Ridge K-25 Site, Oak Ridge, Tennessee (K/ER-218). The 1995 radiological assessment, Oak Ridge K-25 Site Outdoor Radiological Characterization, Phase II, (Vol. I-VI K/HS-620), included further evaluation of the EU Z2-19 area. In 1998, soil borings were collected to support the Remedial Investigation Report for the East Tennessee Technology Park, Oak Ridge, Tennessee (DOE/OR/01-1778/V3&D1). A table containing sample locations, intervals, and an analyte list is found in Attachment 3.
In the historical sampling campaigns, numerous sample locations were identified as having Zone 2 ROD criteria exceedances for radiological constituents. As prescribed by the 2009 DQO Scoping Package, a radiological survey of the Class 1 SU was conducted to define contamination boundaries. During evaluation of the survey information, an apparent redistribution of contamination was identified and the characterization plan was revised by FCN-ETTP-Zone 2-194 (Attachment 5).

25
DVS Sampling
The investigation activities identified in FCN-ETTP-Zone 2-194 (Attachment 5) began in March 2017. The collection of samples from 30 locations was completed in March 2017. Following preliminary evaluation of the data against Zone 2 ROD criteria, several Max RL exceedances were identified (primarily radiological), and delineation sampling was conducted in an additional 57 sample locations, collected in September and October 2017. A listing of all sample locations are presented in Attachment 3.
The EU Z2-19 Class 1 SU data were evaluated against the Zone 2 ROD RAO decision criteria, as described in the Zone 2 RDR/RAWP, Section 3.2 and documented in FCN-ETTP-Zone 2-225 (Attachment 5). The FCN contained an EU Z2-19 technical memorandum that presented the evaluation of the data and proposed an RA for the EU, as presented in the following sections. A map showing all of the sample locations is provided as Figure 7. The primary focus of this characterization event was the Class 1 SU of EU Z2-19; however, samples were also collected in areas impacted by the operation of the K-1410 facility and in drainage pathways identified as being impacted by the Class 1 Area walkover survey, Figure 6.
3.2.2.1 Maximum RL Screening
There are 19 sample locations in the EU Z2-19 Class 1 SU with maximum RL exceedances, with 18 locations in the 0-1 ft depth and 1 location within the 0-2 ft depth. Table 5 indicates the analytes and the number of exceedances observed. There are no maximum exceedances at depths greater than 2 ft (Attachment 4). The distribution of sample locations is shown on Figure 7 and information regarding specific sample locations are presented in Attachment 3. According to the Zone 2 ROD, the area represented by these 19 sample locations requires an RA.
Table 5. Class 1 SU analytes with maximum detected concentrations exceeding maximum RLs.
Analyte with maximum RL exceedance(s)
Number of exceedances
SU maximum detected concentration
Maximum RL (pCi/g)
Ra/Th decay series 15/70 6,254 pCi/g 15 Cesium-137 6/70 4,060 pCi/g 20 Uranium-234 2/70 57,300 pCi/g 7000 Uranium-235 7/70 4,250 pCi/g 80 Uranium-238 8/70 17,300 500
Ra=radium RL=remediation level SU=soil unit Th=thorium
3.2.2.2 Average RL Screening
The process presented in Section 3.2 of the Zone 2 RDR/RAWP for conducting an average RL screen arrives at a conclusion about whether the EU average concentration of a primary COC exceeds the average RL. Typically, the average RL screen is conducted across the EU, however, since EU-wide characterization was not complete at the time, the average RL exceedances within SU 1 were used to help define the excavation boundaries for the Class 1 SU.
There are 36 sample locations with maximum detected concentrations exceeding average RLs, excluding locations with maximum RL exceedances. Of the 36 locations, 33 have constituents in the 0-4-ft depth

26
interval and three have constituents up to 10 ft in depth. Table 6 indicates the analytes and the number of exceedances observed. The distribution of the sample locations are shown on Figure 7.
Table 6. Class 1 SU analytes with maximum detected concentrations exceeding average RLs.
Analyte with maximum RL exceedance(s)
Number of exceedances
SU maximum detected concentration Average RL
Total PCBs 1/70 26,300 µg/kg 10,000 Ra/Th decay series 8/70 11.7 pCi/g 5 pCi/g Cesium-137 8/70 13.8 pCi/g 2 pCi/g Uranium-234 4/70 6,690 pCi/g 700 pCi/g Uranium-235 33/70 75.3 pCi/g 8 pCi/g Uranium-238 34/70 362 pCi/g 50 pCi/g
PCB = polychlorinated biphenyl Ra = radium RL=remediation level SU=soil unit Th = thorium
Historical radiological surveys of the slabs demonstrated the presence of elevated radioactivity, which resulted in the slabs being designated as a Contamination Area (K-1031) and a High Contamination Area (K-1410), as documented in the Removal Action Report for the K-25 Auxiliary Facilities Decommissioning Group I Buildings Demolition Project at the East Tennessee Technology Park, Oak Ridge, Tennessee (DOE/OR/01-1829&D1). Based on their location within the area of EU Z2-19, which has been demonstrated to pose a threat to the industrial worker and a probable threat to groundwater (i.e., Class 1 SU) as a result of the presence of radiological contamination, it is concluded that the slabs themselves pose similar risks. Removal of the K-1031 and K-1410 slabs will eliminate the risks associated with them.
3.2.2.3 Threat to Groundwater
This evaluation is performed to ensure constituent concentrations in soil do not exceed modeled concentrations (GW SSLs) such that leaching would lead to groundwater concentrations in excess of drinking water standards. Should constituents exceed GW SSLs, an RA is required to protect groundwater. There are 31 sample locations with maximum detected concentrations exceeding GW SSLs, 31 have constituents within the 0-4-ft depth and 3 have constituents up to 10 ft deep. Table 7 indicates the analytes and the number of exceedances observed.

27
Table 7. Class 1 SU analytes with maximum detected concentrations exceeding GW SSLs.
Analyte with Maximum RL exceedance(s)
Number of exceedances
SU maximum detected concentration Industrial RSL
Chromium 1/70 530 µg/kg 172 µg/kg Uranium-234 41/70 57,300 pCi/g 61.1 pCi/g Uranium-235 8/70 4,250 pCi/g 61.1 pCi/g Uranium-238 34/70 17,300 pCi/g 61.1 pCi/g Technetium-99 1/70 154 pCi/g 128 pCi/g
GW = groundwater RL = remediation level RSL = risk screening level SSL = soil screening level SU = soil unit
One step in evaluating possible threats to groundwater is to estimate the volumetric extent and mass of analytes with GW SSL exceedances to determine whether the analytes pose a threat to groundwater (Zone 2 RDR/RAWP, Section 3.2). The distribution of residual GW SSL exceedance locations forms a cluster near the interior of the Class 1 SU (Figure 15) to the point where there is probably sufficient volume of contaminated soil so that the mass of the detected constituents pose a threat to groundwater. As such, the area represented by these sample locations indicates that an RA is required, which was previously agreed upon in concurrence form FCN-ETTP-Zone 2-225).
3.2.2.4 Evaluation Summary
The evaluation of the Class 1 SU in EU Z2-19 identified a broad area of contaminants in exceedance of the various Zone 2 ROD criteria as discussed in the previous sections. A simple depiction of the contaminant distribution is provided as Figure 15. The figure shows that a large number of the Zone 2 ROD criteria exceedances are of the Max RL, with a prescribed RA of excavation. A figure containing sample identification numbers is provided as Figure 7. All DVS and early characterization activities were carried out according to the procedures and protocols of the Zone 2 RDR/RAWP including Appendix A: Quality Assurance Project Plan for Characterization Activities under the Dynamic Verification Strategy at the East Tennessee Technology Park, Oak Ridge, Tennessee. Attachment 3 presents the details of sampling and analysis at each characterization sample location in EU Z2-19. The information includes date, analyte groups, and sample intervals.

28
Figure 15. Historical sample locations (2017) with exceedances identified in EU Z2-19
(FCN-ETTP-Zone 2-225).

29
3.2.2.5 Additional data collection
Following preparation of FCN-ETTP-Zone 2-225, included in this TM as Attachment 5, additional data was required to support remedial action planning and waste disposal. Additional samples were collected in 2017 to determine the appropriate receiving facility for the waste material (soil, concrete, and sub-slab piping). Samples were also collected to support preparation of project execution support documents with analysis for additional radionuclides, to support toxicity characteristic leaching procedure (TCLP) with analysis for metals and volatile organic compounds (VOCs), and additional targeted VOC analysis to determine which materials might be subject to listing as F001 waste. The F001 listing was possible due to the facility process knowledge identifying degreasing operations in the western portion of the K-1410 building. Additional sampling was also required to support the waste stream characterization for the K-1410 and K-1031 concrete slabs.
The samples have been categorized as waste disposition, waste disposition/TCLP, delineated Nevada National Security Site (NNSS) excavations, gridded VOC, biased VOC subsurface structures, and groundwater (GW) source investigation.
• Waste disposition – predominantly concrete samples, the data supports waste disposal planning.
• Waste disposition – predominantly collection of samples at locations with results greater than 20 times the Resource Conservation and Recovery Act (RCRA) limit, to obtain TCLP results.
• Delineate NNSS excavations – some radionuclide concentrations in the soil exceed the limits allowed for Environmental Management Waste Management Facility disposal, thus causing the soil to be shipped to NNSS for disposal. These samples delineate the volumes of soil identified for NNSS disposal.
• Gridded VOC samples – the western portion of the K-1410 facility was historically used for degreasing operations, resulting in a potential F001 RCRA waste code for the waste material. These samples were planned to determine how much, if any, of the material in the general area would be impacted.
• Biased VOC samples – to further evaluate the impact of the degreasing operations, some samples were biased near the sub-slab drains and process drain lines.
• Subsurface structures – there are several subsurface structures in the EU. These samples were coupled with facility assessments, with water and/or sediment sample collection where media was available. The structures included electrical, transformer vaults, and the K-1410-B neutralization pit.
• GW source investigation – a GW plume has been identified in association with GW well BRW-058. Samples were collected to depths of bedrock or refusal to use in determining if the contamination is from an up-gradient source, or from within the EU.
Figure 16 shows the sample locations by sample type. More detailed information for each location is provided in Attachment 3. The detailed information includes category, sample identifier, sample description, date, analyte groups, and sample intervals. The pink dashed line in the western portion Figure 16 portrays an extension of the dig (Dig 2 Expansion), which was noted in a letter sent to the U.S. Environmental Protection Agency (EPA) and the Tennessee Department of Environment and Conservation (TDEC). Similar RL exceedances were found outside of the original dig areas (discussed in more detail in Section 5), so in accordance with the Zone 2 ROD, the RA area was extended to include all contaminated soil. The “dig areas” labeled on the Figure are RA areas that are approved via concurrence form FCN-ETTP-Zone 2-225.

30
Figure 16. Samples collected in 2018 with TCE plume shown (sample dates are included in Attachment 3).

31
4. CONCEPTUAL SITE MODEL
The conceptual site model (CSM) is a representation of how EU-associated contaminants within a given source may be released, transported, and made available for uptake by a receptor. The CSM serves to conceptualize the relationship between contaminant sources and receptors through the consideration of potential and actual release mechanisms, migration pathways, and exposure points. Understanding these relationships allows actions to be taken to disrupt (i.e., break) or eliminate pathways to reduce or eliminate risk to human health at the exposure points. The CSM for EU Z2-19 is shown in Table 8 and Figure 17. The following sections summarize the major elements of the CSM.
PRIMARY SOURCE
Primary sources are locations or entities from which the potential contaminants of concern (PCOCs) within the local environment arise. There are three primary sources located within EU Z2-19 that include the following:
1. Historical operations: decontamination and degreasing, plating and UF6 processing,
2. Outdoor storage of process equipment, and
3. Acid neutralization piles.
The primary sources are discussed in Section 2 EU and Description. Design, mode of operations, and the types of materials handled within these primary sources potentially affect the exposure pathways as depicted in the CSM. Within this EU, all current and former facility locations are known, therefore, specific footprints may be targeted for sampling.
PRIMARY RELEASE MECHANISM
The primary release mechanism for process facilities includes either planned or unplanned spills and direct releases to area surface soils and facility concrete slabs.
The primary release mechanism for subsurface structures includes leaks and unplanned discharges as a result of structural failures or containment breaches. Such releases would have contributed to subsurface soil contamination since these structures are several feet below grade.
SECONDARY SOURCE
Secondary sources consist of process and storm drains including catch basins, environmental and anthropogenic media that contain contaminants or a defined material that acts as a reservoir for contaminants that in turn contribute PCOCs to the environment. These media include surface soil, subsurface soil, and the concrete slabs of buildings that hold significant quantities of constituents, which may continue to be released to the environment over time. Delineating secondary sources allows actions to be taken that reduce or eliminate associated exposure pathways.

32
Table 8. Conceptual Site Model for EU Z2-19.
Primary Sources Facilities Primary COCs Secondary
sources Release
mechanism Migration pathways
Historical operations: Decontamination & degreasing, plating, UF6 processing
K-1410 U-234, -235, -238 Tc-99 & other fission products TCE & other VOCs
Process drains Storm drains & catch basins Contaminated soil
Discharge onto creek bank Ventilation hoods Spills, Leaks Demolition & downsizing
Surface run-off Erosion Air dispersion Downward percolation to GW
Outdoor storage of process equipment
K-1410 K-1031
U-234, -235, -238 Tc-99 & other fission products Transuranics Fluoride
Contaminated soil Accumulation areas Storm drains & catch basins
Spills, Leaks Contact with rain Routine discharges
Surface run-off Erosion Air dispersion
Acid neutralization pit
K-1410 Uranium Metals Acid residues Fluorides
Contaminated soil Accumulation areas
Routine discharges Leaching from rainfall
Surface run-off Erosion Downward percolation to GW
COC = contaminant of concern GW = groundwater VOC = volatile organic compound
SECONDARY RELEASE MECHANISM
Secondary release mechanisms for concrete slabs include runoff in accumulated precipitation into adjacent surface soils. While intact buildings eliminate accumulation of precipitation, once the structure is removed, constituents present in the concrete are available for runoff.
The release mechanisms for surface soil include suspension and entrainment in air as particulate matter and percolation and vertical migration into deeper soils via water infiltrating the soil column, which leads to contamination of subsurface soil. In addition, VOCs present in surface soil and subsurface soil may volatilize and migrate by vapor intrusion into future structures.
Secondary release mechanisms for subsurface soil include dissolution with percolation of water and vertical migration potentially to the water table.
MIGRATION PATHWAY
The migration pathway for the EU Z2-19 area consists of both surface spills/releases (contamination in soil) and liquid leaks/discharges (contamination from releases from pipes/conduits or pits). The contaminant migration will take the contaminants to deeper intervals of the soil and, eventually, to the groundwater.

33
IMPACTED MEDIA
The impacted media in this area could be soil, groundwater, and surface water/sediments. Based on sampling of the area, the impacted media have been identified as soil in the southern portion of the EU and along the bank of Poplar Creek, which is discussed in more detail in Section 5.
ANTICIPATED CONTAMINANT DISTRIBUTION
An industrial worker is the potential receptor for EU Z2-19 consistent with the future end use of industrial for ETTP Zone 2 as documented in the Zone 2 ROD. The exposure routes (i.e., mode of internalization of contaminants from environmental media into a receptors’ body) for both surface soil and subsurface soil include incidental ingestion, inhalation (particulates and vapors), dermal contact, and external exposure (for radionuclides). Because groundwater is to be addressed in a separate decision document for ETTP, this exposure medium is evaluated in terms of concentrations of constituents left in the soil that could lead to concentrations in groundwater via vertical migration that exceed maximum concentration limits or, if not available, risk-based concentrations based on domestic use.
DATA GAPS
The data gaps for making the action/NFA determination for EU Z2-19 were addressed by the characterization activities presented in the DQO Scoping Package and Project Team Concurrences FCN-ETTP-Zone 2-194 and FCN-ETTP-Zone 2-225 (Attachment 5).

34
Figure 17. Conceptual Site Model for EU Z2-19.

35
5. TECHNICAL BASIS FOR RA DECISION
Several sampling events have been conducted across EU Z2-19 since the first samples were collected in 1994. Only limited sampling had occurred in the EU prior to the DQO Scoping Package, so a large amount of sampling was conducted beginning in 2016 in order to characterize the EU. A majority of the EU was sampled in 2017 in accordance with concurrence form FCN-ETTP-Zone 2-194, which is discussed in detail in the technical memorandum in Attachment 5. The following sections discuss the characterization activities completed in 2019 to complete characterization of the EU.
SAMPLING ACTIVITIES
In this Section, the EU Z2-19 data are evaluated against the Zone 2 ROD RAO decision criteria in the manner described in Section 3.2 of the Zone 2 RDR/RAWP to make the action/NFA decision for the EU. The risk decision criteria include for both the industrial worker and maintenance worker scenarios the soils Max RL, average (Avg) RL, and 1 × 10⁻⁵ excess lifetime cancer risk or hazard index = 1 PRGs, as well as the non-scenario specific GW SSLs. The sources for and assumptions behind the Max RL, Avg RL, PRG, and GW SSL criteria values for both the industrial worker and maintenance worker scenarios are presented in Section 3 of the Zone 2 RDR/RAWP.
Initial DVS characterization results and process knowledge identified three soil excavation RAs needed to take place within the EU Z2-19 Class 1 SU to remove threats to the industrial worker and underlying groundwater (Figure 18). The proposed RA aerial boundaries are shown in the Technical Memorandum that is included in Attachment 5 (Figure 18). Following removal of contaminate soil and other materials within the excavation, confirmation samples will be collected to demonstrate that the RAs have achieved the RAOs presented in the Zone 2 ROD. Results from the confirmation sampling will be presented in the EU Z2-19 Phased Construction Completion Report once the RAs are complete.
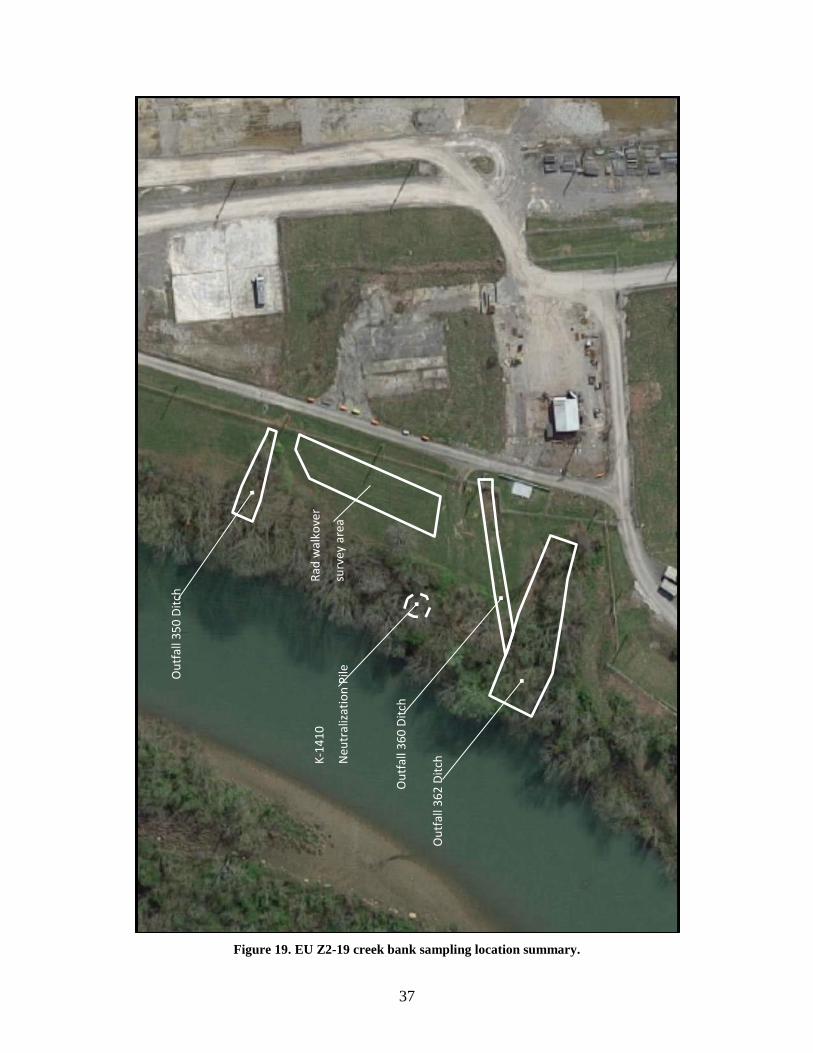
However, to reach an NFA/RA decision for the entire EU, additional sampling was deemed necessary. Characterization objectives were identified in the DQO Scoping Summary to complete remaining characterization of EU Z2-19. The four objectives are associated with historical waste discharge and are identified in Figure 19:
• Outfall 360 drainage channel o Received runoff from K-1031 and K-1410 areas.
• Outfall 362 drainage channel o Received runoff and process drain discharges from K-1410 building. o Received storm water runoff from drainage swale south of K-1410. Storm drainage from EU Z2-13 Surface runoff from K-1410
o Received process drain discharges from K-413 sludge disposal pit.
• Outfall 350 drainage channel o Received surface runoff from the K-1031 Maintenance Support Building. Used for storage and dispensing of trapping media for spent cascade traps. Used as cutting and size reduction of process equipment from Fercleve Thermal Diffusion
Plant. o Received storm water runoff from drainage swale north of K-1031.
• K-1410 Neutralization Pile o Designed to treat corrosive plating waste from the K-1410 building.

36
Evaluation of EU Z2-19 data to arrive at RA decisions begins with evaluating characterization data to identify specific sample locations with criteria exceedances that require sampling to delineate extent. Characterization data are evaluated in the following sections.
Figure 18. EU Z2-19 Class 1 Soil RA Areas
37
Figure 19. EU Z2-19 creek bank sampling location summary.
K-14
10
Neu
tral
izatio
n Pi
le
Out
fall
362
Ditc
h
Out
fall
350
Ditc
h
Out
fall
360
Ditc
h
Rad
wal
kove
r
surv
ey a
rea

38
K-1410 NEUTRALIZATION PILE
A radiation walkover survey was performed in the K-1410 Neutralization Pile area and no readings within the area exceeded two times background levels (Figure 20).
Figure 20. Radiation walkover survey in the K-1410 Neutralization Pile area.
K-1410 Neutralization Pile Area

39
Four sample locations were collected in the K-1410 Neutralization Pile area (Figure 23). Two of the locations (Z2-EU19B-713 and Z2-EU19B-714) were collected 0-1 ft and analyzed for rad, metals, and PCBs. Location Z2-EU19B-723 was drilled to 15 ft below ground surface (bgs), and location Z2-EU19B-724 was drilled to 18.5 ft bgs. Four feet of gravel was found at both locations, so soil sampling started at soil/gravel interface. The 0-1 and 1-2 ft samples were analyzed for rad, metals, and PCBs. Location Z2-EU19B-723 had 5-6 and 10 11 ft samples analyzed for metals and rad. Refusal was found at 11 ft below the soil/gravel interface. A map of the sample locations is located in Figure 23. Location Z2-EU19B-724 had 5-6, 10-11, and 13.5-14.5 ft samples analyzed for metals and rads. Refusal was found at 14.5 ft below soil/gravel interface. No exceedances were identified in any samples in the K-1410 Neutralization Pile area; therefore, an NFA is recommended for this area.
OUTFALLS 350 AND 360 DRAINAGE DITCHES
A radiation walkover survey was performed in the Outfalls 350 and 360 drainage areas and several readings within both ditches exceeded two times background levels (Figure 21).

40
Figure 21. Radiation walkover survey in the Outfalls 350 and 360 surface drainage areas.
Outfall 350 ditch
Outfall 360 ditch

41
Outfall 360 ditch. Two locations were collected in the Outfall 360 ditch (Figure 23). Locations Z2-EU19B-715 and Z2-EU19B-716 were collected 0-1 ft and analyzed for rads, metals, and PCBs. These locations were biased towards the highest readings found during the radiological walkover survey. Location Z2-EU19B-715 did not exceed Zone 2 ROD criteria. Location Z2-EU19B-716 exceeded the GW SSL for U-234 at 70.4 pCi/g (GW SSL is 61.1 pCi/g). The location falls within the current footprint of the Class 1 SU RA dig extension into the Outfall 360 ditch. This location will be remediated with the Class 1 SU discussed above. Outfall 350 ditch. Three locations were collected in the Outfall 250 ditch area (Figure 22). All locations were collected 0-1 ft and analyzed for rads, metals, and PCBs. Sample locations were biased towards the highest readings from the radiological walkover survey. Location Z2-EU19B-719 was added due to finding higher readings outside of the ditch area. The location was sampled to access surface runoff into the ditch. Locations Z2-EU19B-718 and Z2-EU19B-719 did not exceed Zone 2 criteria. Location Z2-EU19B-717 exceeded the GW SSL for U-234 (73.5 pCi/g) and the Avg RL for cesium-137 (Cs-137) (3.14 pCi/g) (Attachment 4). This location does not currently fall within the Class 1 SU RA boundaries.
Figure 22. Outfall 350 ditch sampling results.

42
Figure 23. EU Z2-19 additional sampling activities.

43
Location Z2-EU19B-717 exceeded the GW SSL for U-234 (73.5 pCi/g) and the Avg RL for Cs-137 (3.14 pCi/g). This location does not currently fall within the Class 1 SU RA boundaries, so further delineation was required in order to bound the contamination area. Three step-out locations (-717A, -717B, and -717C) were collected around the original location Z2-EU19B-717 (Figure 24). These samples were collected at a 0-1 ft depth and analyzed for rads. There were no Zone 2 ROD criteria exceedances detected in the step-out samples. Due to the GW SSL exceedance being a single-point hot spot and minimal in volume, it is not considered a source to groundwater and no further action is appropriate for this location.

44
Figure 24. Delineation sample locations collected around location Z2-EU19B-717.

45
OUTFALL 362 DRAINAGE DITCH
A radiological walkover survey was performed in the Outfall 362 drainage ditch area and several readings exceeded two times background levels (Figure 25). Readings within the ditch area exceeded two times background throughout the entire drainage channel. The highest reading encountered (over 500,000 counts per minute [cpm]) was in the vicinity of the drainage pipes (background was 1600 cpm). Contamination was attributed to discharges from both the 8-inch process drain line from K-1410 and the storm water discharges from the drainage swale immediately south of K-1410. The drainage swale is a posted radiological area with both surface and subsurface soil contamination. A radiological walkover survey was also performed at the bottom of the Outfall 362 ditch, in the soils that are exposed when TVA lowers the water levels in Watts Bar Lake, which lower water levels in Poplar Creek. Multiple locations from this area exceeded two times background. The highest reading encountered (19,157 cpm) was at the bottom of the ditch, near the upstream edge of the soils exposed during low water levels (Figure 26).

46
Figure 25. EU Z2-19 Outfall 362 drainage ditch radiological walkover survey (January 2020).

47
Figure 26. EU Z2-19 Poplar Creek radiological walkover survey at bottom of ditch (January 2020).

48
Sampling locations in the upper portion of the ditch were biased towards high rad readings, located adjacent to drainage pipes and within sediment accumulation areas. Nine sampling locations with discrete samples from 0-0.5 ft and 0.5-1 ft were completed in the ditch and in the transition area at the bottom of the ditch (Figure 27). Multiple sample locations exceeded Zone 2 ROD criteria (Attachment 4) and required further delineation. The delineation sampling included the collection of deeper samples from eight locations in the uppermost portion of the ditch, near the outfalls for the storm water and process drainpipes. Analytical results from these samples confirmed that the contamination was generally confined to the defined channel in the middle of the ditch. The delineation samples also confirmed that the contamination was limited primarily to surface and near surface soils, less than 2 ft in depth. A localized area associated with sampling locations Z2-EU19-605 and Z2-EU19-620 had deeper contamination, extending to depths of 5 ft. Delineation sampling results supported the development of excavation limits for the upper portion of the ditch, as detailed in the following section.
Table 9. Delineation sampling in upper portion of Dig 2 Expansion in Outfall 362 Ditch.
Location Sample Depths (ft bgs)
Z2-EU19-605 (deeper samples from original 605 location)
1 - 2 3.5 - 4
Z2-EU19-618 0 - 1 1.5 - 2
Z2-EU19-619 1.1 - 2.1 2.2 - 2.7
Z2-EU19-620 1 - 2 3.5 - 4
Z2-EU19-621 2.5 - 3.5 3.5 - 4
Z2-EU19-622 1 - 2
Z2-EU19-623 1 - 2 3.5 - 4
Z2-EU19-624 1 - 2 3.5 - 4
Z2-EU19-625 3 - 4 bgs = below ground surface ft = feet
Five geoprobe boring locations (Z2-EU19-613, -614, -615, -616, and -617) were completed around the perimeter of the ditch to determine whether contamination extended beyond the topographically defined ditch limits (Figure 28). These borings were completed to various depths in order to collect samples from elevations corresponding to the maximum depth of the ditch near the boring location. None of the samples from these geoprobe boring locations exceeded Zone 2 ROD criteria. No remedial action is required outside the boundaries of the upper portion of the ditch.

49
Figure 27. Outfall 362 ditch soil sample locations.

50
Figure 28. Delineation sampling areas in EU Z2-19 Outfall 362 ditch.

51
Three of the four sample locations at the bottom of the ditch exceeded Zone 2 ROD criteria (Z2-EU19-609, -611, and -612). Locations Z2-EU19-609 and Z2-EU19-611 had Max RL exceedances for Cs-137. Location Z2-EU19-612 had average RL exceedances for uranium and thorium (Attachment 4). In order to delineate the extent of contamination at the bottom of the ditch, 22 additional samples were collected (Figure 29). These samples were collected to depths of 1-3 ft (Table 10). Deeper sampling was attempted at most of the locations but was not successful due to the presence of saturated, granular soils and gravel. The presence of shallow groundwater was not unexpected given the proximity of the sampling locations to Poplar Creek. Locations Z2-EU19B-634, -641, and -645 were analyzed for rads, metals/Hg, PCBs, VOCs, and SVOCs. All of the other samples were analyzed for rads only.
The delineation sampling at the bottom of the ditch identified additional locations with Max RL exceedances. Similar to results from the upper portion of the ditch, the contamination exceeding RL criteria was limited to near surface soils less than 2 feet in depth. The bottom of the ditch lies within Poplar Creek as this area is submerged during higher water levels in the summer. A decision for this area — which should be considered sediment rather than soil — is outside the scope of the Zone 2 ROD. The middle portion of the ditch has a steep slope with exposed bedrock along the sides and bottom. No appreciable soil remains in the middle portion due to erosion driven by the steep slope. The walkover survey identified radiation levels greater than background but much lower than levels in the upper portion of the ditch. Given the lack of soil, and that the Zone 2 ROD limits remedial actions to soils above the top of bedrock, no remedial action will be conducted in the steep, rocky portions of the ditch.

52
Figure 29. Delineation sample locations at the bottom of the ditch.

53
Table 10. Bottom of ditch delineation sampling depths.
Sample Location Sample Depth (ft) Z2-EU19B-632 0-1 Z2-EU19B-633 0-1 Z2-EU19B-634 0-1 Z2-EU19B-635 0-1 Z2-EU19B-636 0-1 Z2-EU19B-637 0-1 Z2-EU19B-638 0-1 Z2-EU19B-639 0-1 Z2-EU19B-640 1-2 Z2-EU19B-641 0-1, 1-2 Z2-EU19B-642 0-1, 1-2 Z2-EU19B-643 0-1, 1-2 Z2-EU19B-644 0-1, 1-2 Z2-EU19B-645 0-1, 1-2 Z2-EU19B-646 0-1, 1-2 Z2-EU19B-647 0-1, 1-2, 2-3 Z2-EU19B-648 0-1, 1-2 Z2-EU19B-649 0-1, 1-2 Z2-EU19B-650 0-1, 1-2 Z2-EU19B-651 1-2, 2-3 Z2-EU19B-652 0-1, 1-2
ft = feet
K-2527-BR GROUT SHOP
The K-2527-BR Grout Shop was constructed in 2008 2009 and created by combining a number of structures under a common roof. To the north, three 8 ft x 8 ft x 20 ft storage containers are oriented side-by-side north to south. The interior and south walls of the containers were removed to make part of the space for a grout shop. A woodshed on the east side previously housed the high-efficiency particulate air ventilation unit. Two carports attached on the south side of the shop provided storage space, housed the equipment for mixing, and supply of the grout. The Grout Shop was used for stabilization of mined materials. Drums were placed on a conveyer and transported to a vent hood for addition of grout and mixing with the waste. The primary contaminants of concern are uranium isotopes (U-234, U-235, and U-238) and technetium-99. A Facility Assessment was conducted for the K-2527-BR Grout Shop, and a radiological walkover survey was performed around and inside the building (Figure 30). No levels exceeded two times background and the area is considered Class 3.

54
Figure 30. Radiological walkover assessment of K-2527-BR Grout Shop (December 2019).

55
RA DECISION
An RA has already been recommended in the Class 1 SU per concurrence FCN-ETTP-Zone 2-225 (Attachment 5). The additional characterization and delineation work outside the Class 1 SU identified multiple Zone 2 ROD criteria exceedances in the Outfall 362 drainage ditch. This contamination was attributed to storm water and process drain discharges from areas within the Class 1 SU. The types and distribution of contamination detected in the ditch were nearly identical to those detected in samples from the upgradient Class 1 SU. An extension of the Class 1 SU RA defined in FCN-ETTP-Zone 2-225 is justified based on the ditch sampling results, as stated in correspondence dated September 17, 2019 from DOE to TDEC and EPA (Attachment 7). The RA extension consists of the upper portion associated with the storm water runoff. No further action is required for the lower portion characterized by a steep slope with exposed bedrock and insignificant quantities of soil. A decision on remediation of the contaminated sediment exposed when TVA lowers water levels in Poplar Creek is outside the scope of the Zone 2 ROD. No further action is required for all other EU Z2-19 areas that lie outside the Class 1 SU and previously defined remedial action boundaries.

56
This page intentionally left blank.

57
6. RA QUANTITIES
Remedial action was recommended for multiple areas in EU Z2-19 (Section 5). Figures 31, 32, and 33 show the location of the recommended remedial action areas.

58
Figure 31. Remedial actions recommended for the Class 1 SU area in EU Z2-19.

59
Figure 32. Excavation proposed in the upper ditch area of the Dig 2 Expansion.

60
Dig 1. Dig 1 is located on the north end of the EU Z2-19 Class 1 SU. The area of Dig 1 is approximately 3800 sq. ft and excavation will be conducted to a depth of 3 ft.
Dig 2. Dig 2 is the largest of the EU Z2-19 RA digs. The area of Dig 2 is approximately 62,400 sq. ft and excavation will be conducted to a depth of 4 ft except in Dig 3 (below). The approximately 8700 sq. ft K-1410 concrete slab will be excavated during excavation of Dig 2 and therefore the depth of excavation at the K-1410 footprint will be 4 ft.
Dig 3. Dig 3 encompasses an area of approximately 2150 sq. ft and the depth of excavation will be 6 ft. The purpose for Dig 3 is to excavate the GW SSL exceedances at sample locations Z2-EU19B-152 and Z2-EU19B-157, which occur at depths between 5 and 6 ft.
K-1031 slab. The demolition of the K-1031 building left approximately a 4400 sq. ft concrete slab in place. A radiological survey of the slab was conducted in 1999 and showed elevated radioactivity over the slab. The slab was then covered with 2 in. of asphalt, which is its current state. Based on the inability to resurvey the slab, the entire slab will be removed as an RA. This will be approximately 154 yd3 (4163 sq. ft by 1 ft deep).
Dig 2 expansion into Outfall 362 ditch. Delineation sampling at the Outfall 362 drainage ditch defined an area for remediation under the Zone 2 ROD. The RA for the upper portion of the ditch includes an area of 1712 ft2 to be excavated to a depth of 2 ft and a smaller hot spot area of 25 ft2 that will be excavated to 5 ft.
Table 11 presents the estimated depths and area of excavations for the EU Z2-19 RAs. The areas referred to by Table 10 are shown on Figures 31, 32, and 33. Confirmation sampling for this RA is discussed in Section 7.
Table 11. Approximate depths, areas, and volumes of material to be excavated during recommended RAs to be performed in EU Z2-19.
Excavation area Excavation depth (ft) Excavation area (sq. ft) Estimate Volume
(in-place yd3) Dig 1 3 3800 422 Dig 2 4 62,400 9,244 Dig 3 6 2150 477
K-1031 slab 1 4400 163 Dig 2 expansion—
upper portion of ditch 2 1712 127
Dig 2 expansion—hot spot in upper
portion 5 25 4.7
EU = exposure unit ft = feet sq. = square yd = yard

61
7. CONFIRMATION SAMPLING
The approaches for confirmation sampling at four of the five RA areas have been reviewed by the Zone 2 Project Team and approved in concurrence FCN-ETTP-Zone 2-225, which is included in Attachment 5. The process of confirmation sampling for the Outfall 362 ditch has not been previously discussed with the Project Team in a concurrence form, but is provided here for review.
Confirmation sampling at the five RA areas described in Section 6 will be conducted as follows.
CLASS 1 SOIL UNIT CONFIRMATION SAMPLING
The following is a description of how sampling will be conducted to confirm that the RA in the EU Z2-19 Class 1 SU has successfully removed threats to the industrial worker and groundwater. Figure 33 is a map of the proposed confirmation sampling locations in the Class 1 SU. The conclusion from confirmation sampling that the RA was successful will apply only to the Class 1 SU:
• At the end of every day, when an approximately 30 ft x 50 ft excavation grid consisting of one or more walls along the excavation perimeter boundaries of Digs 1, 2, and 3 (Figure 31) has been completed, a radiological survey of the wall(s) will be conducted. Excavation into the wall(s) will continue wherever the radiological survey results exceed two times background. When the survey results are consistently less than two times background, samples will be collected at the five locations with highest radiological survey results and the five discrete samples will be sent to a laboratory for analysis.
• At the end of every day, when an approximately 30 ft x 50 ft excavation grid has reached its maximum depth in Digs 1, 2, and 3, a radiological survey of the excavation floor will be conducted if possible based on excavation depth and safety considerations. Excavation into the floor will continue wherever the radiological survey results exceed two times background. When the survey results are consistently less than two times background, samples will be collected at the five locations with highest radiological survey results and the five discrete samples will be sent to a laboratory for analysis.
• Confirmation soil samples will be sent to a laboratory for radionuclide analysis with a three-day turnaround time. Beginning the day after a sample has been sent to the laboratory and while waiting for the laboratory results, the excavation crew will continue by opening another 30 ft x 50 ft excavation area.
• If an analytical result exceeds an RL or GW SSL in a wall or floor confirmation sample, then an additional 1 ft of soil will be excavated from the area represented by the confirmation sample. A radiological survey will be conducted on the newly excavated area and excavation will continue until the radiological survey results are less than two times background. At that time, a confirmation sample of the newly excavated area will be collected and sent to the laboratory for analysis.
• When confirmation sampling shows that there are no RL or GW SSL exceedances in an excavation grid, then the excavation grid area that the confirmation sample(s) represents will be backfilled.
• Following excavation of the K-1031 concrete slab, a systematic grid of eight sample locations will be laid down on the exposed sub-slab soil footprint of the former slab. Discrete samples will be collected at each sample location from 0-1 ft and 1-2 ft each sample will be analyzed for metals, radionuclides, PCBs, semivolatile organic compounds, and VOCs.
• Upon receipt of the K-1031 concrete slab confirmation sample data from the laboratory, the data will be evaluated against the Zone 2 ROD criteria for protection of the industrial worker and groundwater. If the data indicate that the newly exposed soil is a threat to the industrial worker or groundwater, then

62
the exposed soil at the locations identified as possible threats will be excavated to 2 ft and a discrete confirmation sample from each newly excavated area.
• When the K-1031 confirmation samples demonstrate that the K-1031 footprint does not pose a threat to the industrial worker or groundwater, then the RA at K-1031 will be complete and, if soil excavation has been conducted, the excavation will be backfilled with clean soil.
Figure 33. Confirmation sample locations in Class 1 SU.

63
CONFIRMATION SAMPLING IN THE OUTFALL 362 DITCH (DIG 2 EXPANSION)
The following confirmation sampling approach will be used to determine the effectiveness of the RA at the High CA ditch and to fill data gaps remaining from delineation sampling (Figure 34):
• After the dig area has been excavated in the upper portion of the ditch, 13 discrete soil samples will be collected from the base of the soil excavation.
• Confirmation soil samples will be sent to a laboratory for radionuclide analysis with a three-day turnaround time.
• If an analytical result exceeds an RL or GW SSL in a wall or floor confirmation sample, then an additional 1 ft of soil will be excavated from the area represented by the confirmation sample. A radiological survey will be conducted on the newly excavated area and excavation will continue until the radiological survey results are less than two times background. At that time, a confirmation sample of the newly excavated area will be collected and sent to the laboratory for analysis.
• When confirmation sampling shows that there are no RL or GW SSL exceedances in an excavation grid, then the excavation grid area that the confirmation sample(s) represents will be backfilled.

64
Figure 34. Confirmation sample locations for upper portion of the Outfall 362 ditch.

65
8. GROUNDWATER CONDITIONS
Depth to groundwater in the area of EU Z2-19 ranges between 20 and 30 ft below ground surface. There are two existing groundwater monitoring wells (BRW-058 and UNW-060) in EU Z2-19 (Figure 35). Well BRW-058 is a bedrock well and UNW-060 is an unconsolidated zone well. Well construction information is provided in Table 12. Figure 35 identifies the location of the wells in the EU and provides site topography, a potentiometric surface, and groundwater flow direction based on available wells in the area. These wells lie between the operational area of EU Z2-19 where subsurface contamination has been identified and Poplar Creek, and are down gradient of the potential contaminant mass.
The most recent results in Oak Ridge Environmental Information System are from the October 2018 sampling event. The results from the 2017 sampling event are discussed in 2017 Remediation Effectiveness Report for the U.S. Department of Energy Oak Ridge Reservation Oak Ridge, Tennessee Data and Evaluation (DOE/OR/01-2731&D1), as “[t]he source of the VOC contamination in well BRW-058 is not suspected to be from the K-27/K-29 area operations but is more likely associated with groundwater contamination that originates in the K-25 area.” Well UNW-060 has been dry since initial installation. BRW-058 is part of the routine well monitoring program with samples collected twice each year. The groundwater samples are currently analyzed for Tc-99 and total VOCs.
Table 12. EU Z2-19 monitoring well information.
Well Ground surface
elevation (ft amsl)
Average Groundwater
elevation (ft amsl)
Total Depth (ft bgs)
Top of Screened interval (ft bgs)
Bottom of Screened interval (ft bgs)
BRW-058 778.58 751.38 70.0 54.3 64.3 UNW-060 778.78 <763.18 (dry) 21.4 20.8 15.6 BRW-124 787.3 755.92 66.0 55 65
amsl = above mean sea level bgs = below ground surface ft = feet

66
Figure 35. Location of groundwater monitoring wells.

67
9. EU STATUS
With the demolition of all of the buildings in EU Z2-19 excluding the K-2527-BR Grout Shop that will be demolished in FY20, there will be no remaining above-grade structures within the EU post-FY20. Various slabs have been evaluated and the contaminated slabs will be demolished as RAs (the K-1031 and K-1410 slabs). The K-1066-D slab was sampled in 2019 and determined to be uncontaminated, so the slab will remain in place.
All RAs that have been defined throughout the EU are documented in this TM or in the attachments to this TM. All completed RAs will be documented in the final Phased Construction Completion Report for the EU Z2-19. The RA status for the EU is discussed in Table 13.
Figure 36 is an aerial view of the EU Z2-19 taken in 2019.
Table 13. RA status for EU Z2-19
Action Status RA for removal of contaminated soil in Class 1 SU Planned FY20 RA for removal of contaminated soil in the Outfall 362 ditch Planned FY20
EU = exposure unit FY = fiscal year RA = remedial action SU = soil unit
Figure 36. 2019 aerial view of EU Z2-19 facing east.

68
This page intentionally left blank.

69
10. REFERENCES
BJC/OR-3231, Data Quality Objective Scoping Package for the Poplar Creek Group (EUs Z2-11, Z2-12, and Z2-19) at the East Tennessee Technology Park, Oak Ridge, Tennessee, 2009, Bechtel Jacobs Company LLC, Oak Ridge, TN.
DOE/OR/01-1778/V3&D1. Remedial Investigation Report for the East Tennessee Technology Park, Oak Ridge, Tennessee, 1999, U.S. Department of Energy, Office of Environmental Management, Oak Ridge, TN.
DOE/OR/01-1829&D1. Removal Action Report for the K-25 Auxiliary Facilities Decommissioning Group I Buildings Demolition Project at the East Tennessee Technology Park, Oak Ridge, Tennessee, 2005, U.S. Department of Energy, Office of Environmental Management, Oak Ridge, TN.
DOE/OR/01-2161&D2. Record of Decision for Soil, Buried Waste, and Subsurface Structures in Zone 2, East Tennessee Technology Park, Oak Ridge, Tennessee, 2005, U.S. Department of Energy, Office of Environmental Management, Oak Ridge, TN.
DOE/OR/01-2224&D5. Remedial Design Report/Remedial Action Work Plan for Zone 2 Soils, Slabs, and Subsurface Structures, East Tennessee Technology Park, Oak Ridge, Tennessee, 2016, U.S. Department of Energy, Office of Environmental Management, Oak Ridge, TN.
DOE/OR/01-2731&D1. 2017 Remediation Effectiveness Report for the U.S. Department of Energy Oak Ridge Reservation Oak Ridge, Tennessee Data and Evaluation, 2017, U.S. Department of Energy, Office of Environmental Management, Oak Ridge, TN.
K/ER-218. Radiological Characterization of Inactive Waste Sites at the Oak Ridge K-25 Site, Oak Ridge, Tennessee, 1995, U.S. Department of Energy, Office of Environmental Management, Oak Ridge, TN.
Vol. I-VI K/HS-620. Oak Ridge K-25 Site Outdoor Radiological Characterization, Phase II, 1996, U.S. Department of Energy, Office of Environmental Management, Oak Ridge, TN.

70
This page intentionally left blank.

EU Z2-19 DATA QUALITY ASSESSMENT
AND PATH FORWARD

1-2
This page intentionally left blank.

1-3
EU Z2-19 Data Quality Assessment
And Path Forward

1-4
. J .,:·1 ,a ~ ~
z2-02
; .. I a .t,
-
Z2-o~ J
POPLAR CREEK AREA
.. ,.,10,. IUQ_~,DQ,4 ,..,,.....,,__,,,..fJ ht -»,.,, •L-
.. 22-04
Z2-os
Z2-06
·1 '~
K-25 AREA
~---~ I NORT ~ AR H BY , I I 11;,.,, ;_ \ EA NORTHEAST
\.7 Z2-28"'
CENTRAL AREA
1-18 ·
K-1037 AREA & TSCAAREA
2

1-5
Z2-08
WATER
EU 22-19 Soil Units
N
w• • ,no .,,,
Fett
7.2-20
Z2-2 1
7.2-22
~,-,o,ir~, .\11 ,y~nw :,,,g,1-au-"""" ,-1·,,,1,.,. l""ill'\Mot-. 0-..r•--.!~1, ,.._,,,,io,.,\l'lfll' ,1:n,u.a,,,,,_ ,._,,,o,'l(1.,,U "fl 't,o,),lf n• 11 _,. 0..>I ">IJ ~-...
~~!t~.:.-i l.__:-:--S.u1. u 1·~ u. .....,..,..-~lo!-
3
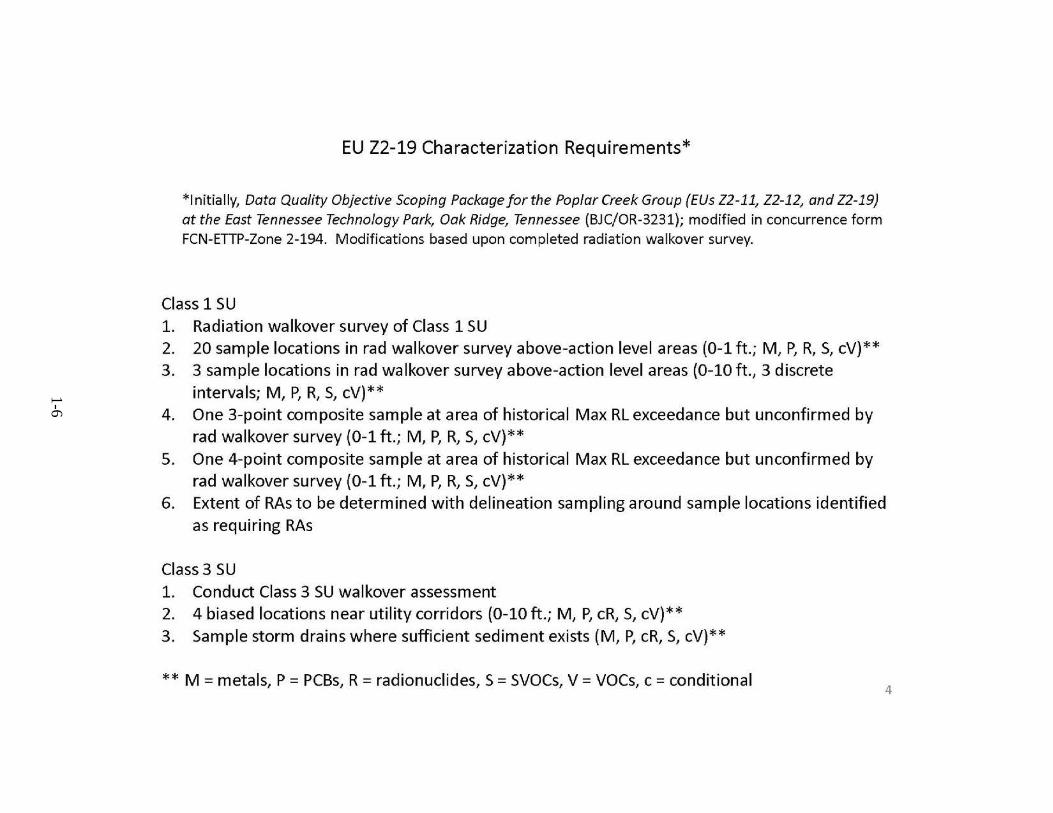
1-6
EU 22-19 Characterization Requirements*
*Initially, Data Quality Objective Scoping Package for the Poplar Creek Group {EUs Z2-11, Z2-12, and Z2-19)
at the East Tennessee Technology Park, Oak Ridge, Tennessee (BJC/OR-3231); modified in concurrence form FCN-ETTP-Zone 2-194. Modifications based upon completed radiation walkover survey.
Class 1 SU 1. Radiation walkover survey of Class 1 SU 2. 20 sample locations in rad walkover survey above-action level areas (0-1 ft.; M, P, R, S, cV)** 3. 3 sample locations in rad walkover survey above-action level areas (0-10 ft., 3 discrete
intervals; M, P, R, S, cV)** 4. One 3-point composite sample at area of historical Max RL exceedance but unconfirmed by
rad walkover survey (0-1 ft.; M, P, R, S, cV)** 5. One 4-point composite sample at area of historical Max RL exceedance but unconfirmed by
rad walkover survey (0-1 ft.; M, P, R, S, cV)** 6. Extent of RAs to be determined with delineation sampling around sample locations identified
as requiring RAs
Class 3 SU 1. Conduct Class 3 SU walkover assessment 2. 4 biased locations near utility corridors (0-10 ft.; M, P, cR, S, cV)** 3. Sample storm drains where sufficient sediment exists (M, P, cR, S, cV)**
** M = metals, P = PCBs, R = radionuclides, S = SVOCs, V = voes, c = conditional 4

1-7
l i'
OCA
Class 1 SU Characterization Requirement 1 Radiation Walkover Survey
L.EGJ.: ND
c:::::J EU BOt.Th'DARY RADIATION WALKOVER St.JR.VEY
~ BUil.DINGS ACTION LEVEL - 2 ,784 CPM
: SLABS • 707 to 1392 cpm
C=:] WATER
-- ROADS
* 1393 to 27S4 cpm
2785 to 5000 cpm
• 5000 to I 0000 com
• 10000 to 42030 cpm
100
Feet
!,1UCOR URS I CH2M Oak R idge LLC
Duosn:--i• l,!opAdo, ll.yLoo ! --M 1 l<1<111 t\i19_b.J'>..:,.,..wi"""l'_.o.aaa ~~':'".,!!'_ KW_lffl_s,a.r-_T-•_fIPS_•:oo
S-.-O .. Ldpt...- 1o1,,.,,,..;_1,...,. (0UIS)
5

1-8
Class 1 SU Characterization Requirement 2 20 Sample Locations in Radiation Walkover Survey Above-AL Areas
Samples collected from Oto 1 ft.; all samples analyzed for metals, PCBs, radionuclides, SVOCs
Sample Location Sample Location
Z2-EU19-101 Z2-EU19-111
Z2-EU19-102 Z2-EU19-112
Z2-EU19-103 Z2-EU19-113
Z2-EU19-104 Z2-EU19-114
Z2-EU19-105 Z2-EU19-115
Z2-EU19-106 Z2-EU19-116
Z2-EU19-107 Z2-EU19-117
Z2-EU19-108 Z2-EU19-118
Z2-EU19-109 Z2-EU19-119
Z2-EU19-110 Z2-EU19-120
6
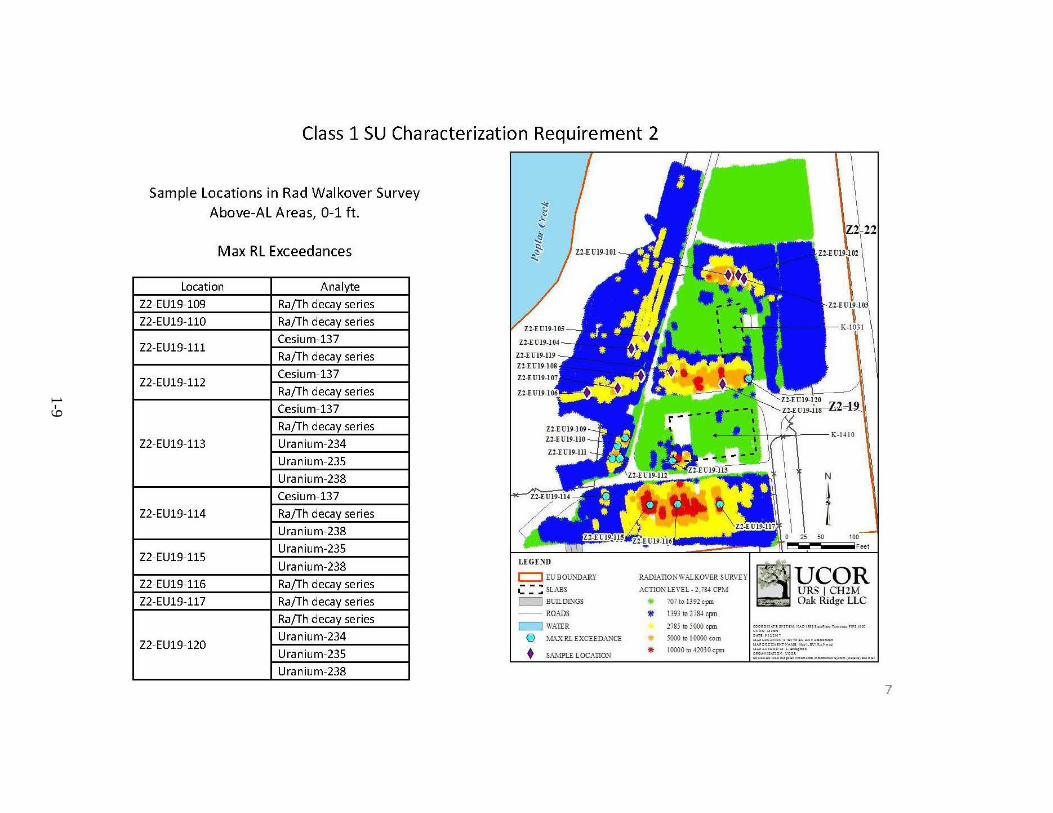
1-9
Class 1 SU Characterization Requirement 2
Sample Locations in Rad Walkover Survey
Above-AL Areas, 0-1 ft.
Max RL Exceedances
Location Analyte
Z2-EU19-109 Ra/Th decay series
Z2-EU19-110 Ra/Th decay series
Z2-EU19-111 Cesium-137
Ra/Th decay series
Cesium-137 Z2-EU19-112
Ra/Th decay series
Cesium-137
Ra/Th decay series
Z2-EU19-113 Uranium-234
Uranium-235
Uranium-238
Cesium-137
Z2-EU19-114 Ra/Th decay series
Uranium-238
Z2-EU19-115 Uranium-235
Uranium-238
Z2-EU19-116 Ra/Th decay series
Z2-EU19-117 Ra/Th decay se ries
Ra/Th decay series
Z2-EU19-120 Uranium-234
Uranium-235
Uranium-238
* " ~
6 ~ §,
.:i..
LEGIND
c::J EUBOUNDARY
C, =: SLABS
c:::::J BUil.DINGS
-- ROADS
c:::::J WA1E R
Q M'IX RL EXCTEDANCE
• SA .. 1\APLE LOCATION
""'Tr Z2-£Ul9-103
\ K-1031
, • » l K-1410
R.ADLI\.TION\VALKOVER SURVEY
ACTION LEVEL - 2,7S4 CPM
• 707 to 1392 C?O
* 1]93 to 2784 cµn
2785 to 5000 q:m
• 5000 to 10000 com
* 10000 to 42030 cpn
N
I 100
Feet
~ UCOR URS I CH2M Oak Ridge LLC
,..,._, • .,c .. no><· •-nn .:s:::1,,. • ..,,..a, . :>OC"'M YM,;,,...,.,_-··•••"0•»!
..... ._,.,,.01·M. t. a....,_,,a o~_.,.,, _ _., . . .. coa. »~·1c-s·o, t~<>< .,.,..,.,_""" ,..,,,,._.,,o.,~«,.!?HISJ ..,.._,,.,
7

1-10
Class 1 SU Characterization Requirement 2 Sample Locations in Rad Walkover
Survey Above-AL Areas, 0-1 ft.
Avg RL Exceedances not Captured
by Max RLs
Z2-EU19-101 Uranium-238
Z2-EU19-103 Uranium-235
Uranium-238
Z2-EU19-105 Uranium-235
Uranium-238
Z2-EU19-106 Uranium-238
Cesium-137
Z2-EU19-107 Ra/Th decay series
Uranium-235
Uranium-238
Z2-EU19-108 Ra/Th decay series
Cesium-137
Z2-EU19-109 Uranium-235
Uranium-238
Z2-EU19-110 Uranium-238
Z2-EU19-111 Uranium-235
Uranium-238
Z2-EU19-112 Uranium-235
Uranium-238
Z2-EU19-114 Uranium-235
Z2-EU19-115 Uranium-234
Z2-EU19-116 Cesium-137
Uranium-235
Uranium-238
Cesium-137
Z2-EU19-117 Uranium-235
Uranium-238
Z2-EU19-118 Uranium-235
Uranium-238
LrGrND
c::::J EU BOUl<1JARY
1: : : SLABS
i:==J BUILDINGS
--ROADS
i:==J WATER
A AVG RI. EXCEEDA_NCE
Q SAMPLE LOCATION
"'"'·t·r Z2-£Ulr 2\
Z2-£Ul\ lOJ
K-l031
, • ~ - 11 .J.'..'t K-1410
RADL~TIONWALKOVER SURVEY
ACTION LEVE.L - 2,784 CPM
* 707 to 1392 cp:n
* 1393 to 2784 cpn
2785 [(} 5000 cpm
5000 t-o 10000 com
* 10000 I0 420]0 CJJil
N
I 100
Feet
~UCOR URS I CH 2M Oak Ridge LLC
,..,.,,oc .. ty• <TT7 0C· za: ,,. . ...... , M.-.,:ioc··'¼ .,.,-.,~.,.· --.. ,_v",.,. . ..• ~ . :aO:l!..j . • • ..-- ....
ou.;.,::, ..,,n.:,,:- '.'CO:l
:o;,··1.cu O'>kJJ.,.,, ••-- =·•ob-•• •••"''"'('OU'<) w2<'
8

1-11
Class 1 SU Characterization Requirement 2
Sample Locations in Rad Walkover Survey Above-AL Areas, 0-1 ft.
RSL Exceedances not Captured by
Avg and Max RLs and Excluding K-40
Z2-EU19-103 Uranium
Z2-EU19-107 Uranium
Z2-EU19-109 Uranium
Z2-EU19-110 Uranium
Z2-EU19-111 Uranium
Z2-EU19-112 Plutonium-239
Uranium
Z2-EU19-113 Uranium
Z2-EU19-114 Uranium
Z2-EU19-115 Uranium
* ),) 'II
6 ~ .~ ~
i=J EU BOUNDARY
1: : : SLABS
C:]BUJLDINGS
-- RO-4J)S
C:] WA1ER
• RSL EXCEEDA-"1CE
0 SAMPLE LOCATION
e.2~22
il Z2-[ Ul9~101
,J,. \
K-1031
, • : • ..,..._1 K-1410
RADL~TIONWALKOVER SURVEY
ACTION LEVEL - 2,784 CPM
• 707 to 1392 cp:n
lit 1393 to2784 qxn
2785 to 5000 cpn
~ 5000 to 10000 com
lit 10000 to 42030 'I'll
N
I SO 100
,. -· ~•.:,~+..,.· .,. -,r7 •·· ··•~·,.•·u-.-.., ,.,u:,.:,c:•·,..._,. ,. . .... ,_, .·" - v,. ... ,..,UA" 'T><.O "-• ML ... OC,bM
O<.<;;.,;;:,<~O~-,.·c,02.
Feet
£1'.::lO:U· V, ..... ,L ... ~ .... --=a<;• .. --«u:
9

1-12
Class 1 SU Characterization Requirement 2
Sample Locations in Rad
Walkover Survey Above-AL
Areas, 0-1 ft.
GW SSL Exceedances
Uranium-234 Z2-EU19-101
Uranium-238
Z2-EU19-103 Uranium-234
Uranium-238
Z2-EU19-105 Uranium-234
Uranium-238
Z2-EU19-106 Uranium-234
Z2-EU19-107 Uranium-234
Uranium-238
Z2-EU19-109 Uranium-234
Uranium-238
Uranium-234 Z2-EU19-111
Uranium-238
Zl-22
. \ ZHU19-IOI
\ ;"""\
Z2-EUl\ 03
.. , Z1-fU19-120
Uranium-234 • • ....,_.) K-1410 Z2-EU19-112
Uranium-238
Chromium
Technetium-99
Z2-EU19-113 Uranium-234
Uranium-235
Uranium-238
Uranium-234 Z2-EU19-114
Uranium-238
Uranium-234
Z2-EU19-115 Uranium -235
Uranium-238
Uranium-234 Z2-EU19 -116
Uranium-238
Z2-EU19-117 Uranium -234
Uranium -238
Z2-EU19-118 Uranium-234
Uranium-238
Uranium -234
Z2-EU19-120 Uranium -235
Uranium -238
LrGrND
(=iEUBOUNDARY
1: : : SLABS
[=:) BUILDINGS
--ROADS
[=:J WAlER
0 GW SSL EXCEEDA ... NCE
0 S_',_',IPLE LOCATION
RADL~TIONWALKOVER SURVEY
ACTIONLEVEL - 2,784 CPM
• 707 to 1392 cp:n
* 1393 to 1784 q:m 2785 to 5000 cp:n
5000 to I 0000 com
* 10000to42030cpm
N
\r1 -t1 ?S SO 100
Feet
~UCOR URS I CH 2M Oak Ridge LLC
.~,.,a-,,:; ·:, .:.:<· > nu,.;-- ~:, ,,..,.,....,, ,.,.,;,,:,c;,.n .. -< " " "''--"' - ~-"" ,.,.,,.-:,,1~2.·M a_.,_,.. o ..c;;.,.,.;.r,,:,,:• c·c,:,;. .. ,_.,..,:, , kl.!o<l' <o,w_,_, .... ....,. •• ;,,.•(<llll$)
10

1-13
Class 1 SU Characterization Requirement 3 3 Sample Locations in Radiation Walkover Survey Above-AL Areas
0 to 10 ft., 3 discrete interval samples; all samples analyzed for metals, PCBs, radionuclides, SVOCs
Sample Location Sam pie Depth
Intervals (ft.)
Z2-EU19-121 0-0.5, 0.5-2, 2-10
Z2-EU19-122 0-0.5, 0.5-2, 2-10
Z2-EU19-123 0-0.5, 0.5-2, 2-10
11

1-14
Class 1 SU Characterization Requirement 3 Three Sample Locations in Above-
Action Level Areas
Max RL Exceedances
Uranium-235 (0-0.5 ft.)
Z2-EU19-122 Uranium-234 (0-0.5 ft.)*
Uranium-238 (0-0.5 ft.)
Ra/Th decay series (0-0.5 ft.)
Z2-EU19-123 Uranium-235 (0-0.5 ft.)
Uranium-238 (0-0.5 ft.)
Avg RL Exceedances**
Ra/Th decay series (0-0.5 ft.)
Z2-EU19-121 Uranium-234 (0-0.5 ft.)
Uranium-235 (0-0.5 ft.)
Uranium-238 (0-0.5 ft.)
Z2-EU19-122 Ra/Th decay series (0-0.5 ft.)
Cesium-137 (0-0.5 ft.)
Z2-EU19-123 Uranium-234 (0-0.5 ft.)
Uranium-235 (0.5-2 ft.)
Uranium-238 (0.5-2 ft.)
RSLExceedances***
Z2-EU19-121 Uranium (0-0.5 ft.)
Z2-EU19-122 Uranium (0-0.5 ft.)
Z2-EU19-123 Uranium (0-0.5 ft.)
Uranium (0.5-2 ft.)
*6960 pCi/g; Max RL = 7000 pCi/g **Not captured by Max RL exceedances *** Not captured by Max or Avg RL exceedances and not including K-40
"' ~ ~ 6 ~ ~ ~~ ...
• W' : ~ __....1 K-1410
(=::J EU BOUNDARY
1:: : SLABS
[:=:J BUILD!NGS
--ROADS
RADL~TIONWALKOVER SURVEY
ACTION LEVEL - 2,784 CPM
• 707 to 1392cµn
* 1393 to2784 q:m
[:=:J WA1ER 2785 to 5000 q:m.
Q SA.'-IPLE LOCATION 5000 to 10000 oom
* 10000 to 42030 q:m
zi-[Ul9-123
\ I -0 25 50 100
,.,.,, :.ocAno><·•··•• n ••·· ~a,, ,..,,...,M •u• oo, .• ,.._,,, .,.,, . ·•'<',.•: .. o. ... MAJ ;.~T~Ol.· M L . ...... ,_. oa.c;_..,,:,.;.r:o,;• ~-ci:,,.
Feet
~-·a.cu O• •L•"' L ·-~ ... ,., ...... o.s,~ .. -(;>U"<) ... U "
12

1-15
Class 1 SU Characterization Requirement 3
Three Sample Locations in AboveAction Level Areas
GW SSL Exceed a nces
Z2-EU19-121 Uranium-234 (0-0.5 ft.)
Uranium-238 (0-0.5 ft.)
Uranium-234 (0-0.5 ft.)
Z2-EU19-122 Uranium-234 (2-10 ft.)
Uranium-235 (0-0.5 ft.)
Uranium-238 (0-0.5 ft.)
Uranium-234 (0-0.5 ft.)
Uranium-234 (0.5-2 ft.)
Z2-EU19-123 Uranium-235 (0-0.5 ft.)
Uranium-238 (0-0.5 ft.)
Uranium-238 (0.5-2 ft.)
"' "' "' 6 ~ ~ ~~ ...
• W' : ~ __....1 K-1410
(=::J EU BOUNDARY
1:: : SLABS
[:=:J BUILD!NGS
--ROADS
RADL~TIONWALKOVER SURVEY
ACTION LEVEL - 2,784 CPM
• 707 to 1392 cµn
* 1393 to2784 q:m
[:=:J WA1ER 2785 to 5000 q:m.
Q SA_ll,IPLE LOCATION 5000 to 10000 oom
* 10000 to 42030 q:m
zi-[Ul9-123
\ I -0 25 50 100
,.,.,, :.ocAno><·•··•• n ••·· ~a,, ,..,,...,M •u• oo, .• ,.._,,, .,.,, . ·•'<',.•: .. o. ... MAJ ;.~T~Ol.· M L . ...... ,_. o a.c;_..,,:,.;.r:o,;• ~-ci:,,.
Feet
~-·a.c u O• •L•"' L ·-~ ... ,., ...... o.s,~ .. -(;>U "<) ... U "
13

1-16
Class 1 SU Characterization Requirement 4
One 3-pt. Composite in Unconfirmed Historical Max RL
Exceedance Area; 0-1 ft.
Max RL Exceedances
I Z2-EU19-124 I Ra/Th decay series
Avg RL Exceedances*
I Z2-EU19-124 Cesium-137
Uranium-238
RSLExceedances**
[ Z2-EU19-124 ] Uranium
GW SSL Exceedances
I Z2-EU19-124 Uranium-234
Uranium-238
*Not captured by Max RL exceedances **Not captured by Max or Avg RL exceedances and not including K-40
"' "' "' 6 ~ ~ ~~ ....
• W' : ~ __.....1 K-1410
(=::J EU BOUNDARY
1:: : SLABS
[:=:J BUILD!NGS
--ROADS
RADL.\TIONWALKOVER SlJllVEY
ACTION LEVEL - 2,784 CPM
• 707 to 1392cµn
* 1393 to2784 q:m [:=:J WA1ER 2785 to 5000 q:m.
Q SA.'-IPLE LOCATION ~ 5000 to 10000 oom
* 10000 to 42030 q:m
N
I
" "• ~oc,1.m;n.:-, n ., r·::·o ...... , • ..,, ,. .. , ~oc~.,•• :>:T ,__.,,.. ,...,~.•· · _, ..... :., · 1 ·,:t.aOa.·:A. t, :;,_,... oz.cAs:. :.on; .·c;,a.
100-
Feet
,;o::a.c;,-o,•,•><~ , ._,_ ....._, ,.. .. ......, ••• ,. ... eoa.•:s) ...,._.,
14

1-17
Class 1 SU Characterization Requirement 5
One 4-pt. Composite in Unconfirmed Historical Max RL Exceedance Area;
0-1 ft.
No criteria exceedances
"' ~ ~ 6 ~ ~ ~~ ...
• W' : ~ __....1 K-1410
(=::J EU BOUNDARY
1:: : SLABS
[:=:J BUILD!NGS
--ROADS
R.ADL.\TIONWALKOVER. SlJllVEY
ACTION LEVEL -2,784 CPM
• 707 to 1392cµn
* 1393 to2784 q:m [:=:J WA1ER 2785 to 5000 q:m.
Q SA_ll,fPLE LOCATION ~ 5000 to 10000 oom
* 10000 to 42030 q:m
N
I
•• -••o~r•Q ,-rnr· •·•~ ·• ·u..,_.• ,..,.7:,oc··,..u<>>:_.M~· ,.,._ _, ·~·- • ... ,.. - , · )ll·M. :..;,...,,... <>J.GA>a . . C01
100-
Feet
v.,··z.c· s·c,• "'•"•'"'"- =-..,......,. ,,,,..(<lz.··•)...,UI
15

1-18
Class 3 SU Characterization Requirement 1
Walkover assessment • • • •
19 assessment points 17 mid-points
5 discretionary points
1 biased sample based on walkover assessment
179350·
179300·
179250·
179200·
179150·
179100·
179050·
·17900 0·
178950·
178900·
178850·
178800·
178750·
178700·
178650·
178600·
not completed due to m w ~ -0 Assessment points %2? . vegetation : ·~
\
ZJ.EU:.-"'\\ ....
~ 1
·. zt~•.au' zu':.ua ; 110·
,,,-b4 C,,,,
1Dl
0»>.ill: DP
0 : Q .. ,
~ :::::--=--1
744400 744450 744500 744550 744600 744650 744700 744750 744800 744850 744900 16

1-19
Class 3 SU Characterization Requirement 2 Four Biased Locations Near Utility Corridors
0 to 10 ft., 3-point composite samples; all samples
analyzed for metals, PCBs, radionuclides, SVOCs
Z2-EU19B-301
Z2-EU19B-302
Z2-EU19B-303
Z2-EU19B-304
No criteria exceedances
Utility Cooridor Sample Locations
17

1-20
Class 3 SU Characterization Requirement 3 Sample Storm Drains Where Sufficient Sediment Exists
No sediment observed in storm drains.
Instead Oto 10 ft., 3-point composite sample next to
storm drain; analyzed for metals, PCBs, radionuclides,
svocs, voes
I 22-EU 19B-305
No criteria exceedances
Storm Drain Sample Locaiton
18

1-21
Conducted to bound criteria
exceeda nces observed in characterization sa m pies
57 sample locations
Delineation Sampling
~
I ~':""----
I II .,
-
.}!, ,.,·, ~..-- -' I . ,• I/~--'· --~; ..
' •. ' ....... ,..;•" · _ .' .I · · C t . i •. • " • t • I
i • ' ioi _, . '!a--· ., ' , l .I . ~ .. ~• ,J( .
. . r-~·· .r ., .r . ~ . ·.-~ , . . » l ~~ I . ,. I. ; - ~ - • . . c.--" ·.· ·. ~ '· ... ., . .,¾: .-~:·•''••:•-··· • ~ ·~l- . -A'· ,., 'f' . ,,-~.• .~ I •• ,~,,~·~1-~·· ;_,. ;.,~ .. ,.;.~ ::~·,..·
I _ ( . • - " ' ,-c;•~i • . ., .. .. .• .. . .SP. , I .... v ,., • • .·, .
/ ·,.--.-c ... ·;·· · · •· .:___ ,Jf . t-~_~,.1: -.... - . 1· :-k .. -~ ' , '· ~~ 'i~t·. I • . . - •• • , .,,. • "' 'S • ,. - - ·•• " ·· •· •r • i.,, ,. ,:. , •" . .,,. •... · . •·:::""=·- ~ ... ·•·,,,· / , • ., .- .. :•·•. . .... _.: ,,,1 " ' ,!~ ,;;,,. , · ,, · · . -- ••-;e.• z , ... , • . ••I" p'
/
. ,. I • • . ' ' . • \· . ,, . •·\i, ., . . . . ., .,. ,- ~ , -.;: • - . -~ , ~ ~ j,' ~L 't ' \.\\\ '
• . • . ' • • ' ' >' K, ._,,... . ; ·• . "\ ,ii · I , ,,. , ~- 1 I n 1 ... , L ' ·< ,, , I \ 1·--·\~:i :,i• ,
\
' .. ·' sl> fi1 l~ ' • . · t ' ' t ;1 ,"' -- . _' \ \ ... '.' ,:: -, - - ..
• ..... • . 'la', -;;.~ • - ~ -5 .· ~· .. .-. .. " .. ••. • } • . · ..... ;,· -~" ·f• '",
~-~ 1·
I ., .,
19

1-22
Characterization and Delineation Samples Max RL Exceedances
Delineation Samples Max RL Exceedances
Location Analyte
Z2-EU19-149 Ra/Th decay series
Z2-EU19-152 Ra/Th decay series
Z2-EU19-154 Cesium-137
Ra/Th decay series
Z2-EU19-155A Cesium-137
Cesium-137
Z2-EU19-157 Ra/Th decay series
Uranium-235
Uranium-238
Cesium-137
Z2-EU19-114 Ra/Th decay series
Uranium-238
Z2-EU19-168C Uranium-235
Legend
0 Characterizatin Sample Location
" Delineation Sample Location
0 EU Z2-19 outline
t"' Max RL Exceedance
n
II ;,1-~~
I, -. ."I .,,.. "
;•• • I "f.•
I 'l~ .~ z I ·; •~· . ~-• °'.;
_. l . l• "- ~ . ~ "'' rt>'• ,:, ... ,,rl\· ,, ~ :( ,._. l
Z2-EU19B-168 Z2,EU1'9i122 ':i . 6 .•- . , . ·~ ~ ' • I • · • l . ., . ., '1'--. -" >'>·•-~ ~:~ .. · . ·\
• "• .. . i .,22
-E~19s -15 .. 5 z2,.~tJ1e.,120~··
. "'""~{.#FF' ·"' =-~"Jcil.:,. ~ .. ,,~ ~-; .. z t1ourn'11o . • .. i ~·· ·· .,.. • ..,_..., 1
nE""·•l·,,, ,$\a•s,\ • •• . z•, ' ~,-,,' , \r,. . , Z2-Eurn!
1.7f4 _· ~•19f..1.Z>i1l ·Z.· -e'l'/,19 -·1-5i~. !~ .. • ,.· :; • _-\":'j ·
1/j . '
I
.. . . "·" i.-l."? 1·· ,...,. . . . ., '.;:;.' . ---~----- • --·• ' ,-;·,z2E •Jo • , , •• )·I • . ,•.· ·'· ,. , · · , . · · . c. ~°'m;,.,• · · • • · i ·: ' ' ·, . . .. "' . ., ,,,,,,... .... "..C"'""" ,. .... ' \' ; .,, ✓- • . • • . "-E""· > ~'°"' "'"" 6 . (. ; . , '; : ,:- '.'/
, . . """ . ' .,, ~• "' / • • . neo,,;m• · ~-"' l''•E""·"' • · '· , 111" , • • ~ . . , . ·I ,. 6 i I . r.t '.!n, 1
1 t-0 • 1. , ~ . t . \ • 1 I 1> ;i +' '" ~,, i .• \. 1· & · 'J, \fl· • \ I ~- .,~: '. ·-~ - ~ · · f -; ...... . -:~. · 1 . i. ¾f. .\;0 J ·~
! . • ~?-J \ ·."'\ti. •· ~ ,,· .-· • •.. l "I' ,.··- °N'T '-> -~-·-. -l~. /; ·•~~• I
~:..-' - I•~· . ~\ -~•
20

1-23
See attached EU 22-19 Criteria
Exceedance Table
Characterization and Delineation Samples Avg RL Exceedances ( not captured by Max R L exceeda nces)
Legend
T- Avg RLExceedance
0 Characterization Sample Location
.,. Delineation Sample Location
0 EUZ2-19outline
for exceedance details
21

1-24
Characterization and Delineation Samples GW SSL Exceedances
See attached EU 22-19 Criteria Exceedance Table for exceedance details
Legend
0 Characterization Sample Location
Delineation Sample Location
0 EUZ2-19outline
I" GW SSL Exceedance
22

1-25
Characterization and Delineation Samples All Criteria Exceedances . ~ -
All Exceedances ' ·, "'--
'..':- -.-.:-:-... I IE
I
11!1
,, •
I
0 ,, Characterization Sample Location
,. Delineation Sample Location
0 0
EU 22-19 outline
Location of an Exceedance
--·~
; ,. . ., . .,,.. ·- .
I . f (t l . -,· { '
.Y: ,.\ '.. ,a, ~ ·t . ,",'t' ~ .,.., ' . . .. ;;,,,-·• ., ., T • , .;. 1~ fa. ( • );•, I
• " ~ ~ l ' · I fr) ' . & 1. - , .. , • .• ., • t"• :\ .. -: • • ·9 A ' . ·'· i,a .. ,.,. l ,, . . . . ' I •• ' ' P.
a ,a, ·: ... , , • II .- .:K _,.., • . • f. y -:-110 • .., ' . r;,~,
. . I:. ~ ~ 'f .J .. . : ., '. \ . . -.-:;: ' . \ ., l¼J'~ t -; . ,·,·;·, ~· JL,~~- ,_;J}.~-·•I '1"IJ,
a · r:1 ." • 1 . --·- ·• ~- . """
I
" .,iiili" .. ,. . ..,r:wl'. '-'' .,.'- . ' :. .. -;:--=-:-~.:'•-;: " . t 18 • ~:-,., ,_.,. .r:l!IA ,'!\•~, I . --:-"", ., I, ( ... I \ I ~ - .f f ' f hi- -~ . , ' . ;,.; 'i'-~'
I . ' . •'°' . . . '.,. ., ' .. : :I . ' , ;' ·; -. .,.-, ... ,. -· ; .. ':-- :_-&'• · .. ,~ ,, .. ~.l • t-,"L ,. • · -,~---------. ~ ·, · !1 , .. :i-·- ., ----- -· . , . . ' , r · , , . J' · ,... ...., .• a·•'-"· "· • ... . ! j, ~.1/i•I . /, • :.D.: . ,, \ '. ._: . ,/.. _·' :'.! .... ,\_, ''\ · J JI' f ""'f A , 1 :••1"i"t1.'f H 'J:!,
/ • . . • • • : · ' • ' . ' 11.1\b -' ,,,. • ·, \ _ j, ,·_ ,· ~-- ,J ti; 11 • t. • .. ,S, ••• • ~
\ \-1" 1\ ft~i~.: \\ ~• f.~m;)'-- '. \ . l ~...,, ., .. .\
~ ~J • 5: ... ~_:;- :_,; '. ~.t ·~· " -300 ft '
~- .-;.-<·'":-" ~ .... - "'l .:--r "'!
Ii -
23

1-26
3 areas will be included in 2 RAs:
RA1 - 2 northern areas
RA2 - southern area including K-1410 slab
Path Forward - Remedial Actions
Legend
0 Characterizatin Sample Location
0 Criterior. Exceedance Location
Delineation Sample Location
0 Proposed RA
24

1-27
Path Forward (cont.)
• Complete 4 Class 3 SU assessment points • Investigate the high CA (drainage ditch) in the Class 3 SU • Evaluate pits and vaults • Evaluate K-1031 slab
25

1-28
This page intentionally left blank.

EU Z2-19 CREEK BANK AREA
DATA QUALITY OBJECTIVES FOR FINAL CHARACTERIZATION
May 2019

2-2
This page intentionally left blank.

2-3
EU Z2-19 Creek Bank Area
Data Quality Objectives for Final ~· ..
Cha·racterization ,:
Looking East into Outfall 360 Ditch from Poplar Creek
1 DQO for Areas Outside the Fence in EU Z2-19 Rev. 2

2-4
DQO APPROVALS The undersigned have prepared, reviewed, and/or provided comments to thJs DQO and hereby approve the sampling approach, as defined herein, for implementation to provide characterization data to support determination of remedial requirements in EU 22-19
APPROVED BY:
~(¼~ '7/lfl/l f_ U.S. Department of Energy Date
r/1-q.1 fJO, r . Envlronme~tal Pto}ection Agency Date
('- ~ ·oate and Conservation
DQO ro, Areas Outside the Fence In EU ll-19 Rev. 2
DQO for Areas Outside the Fence in EU Z2-19 Rev. 2 2

2-5
Objectives
• Review historical operations, process knowledge (PK) and historical data for the facilities in EUs Z2-19 that impact areas along Poplar Creek, west of the security fence (i.e., areas outside the fence)
• Follow the DQO process to identify data gaps associated with determining whether a remedial action is needed
• Develop a characterization strategy for resolving those gaps
• Reach consensus on the scope of a Sampling and Plan (SAP) to implement characterization strategy
• Scope does not include areas or facilities located inside the fence L'1
DQO for Areas Outside t he Fence in EU 22-19 Rev. 2
Western Portion of EU 13, Looking SE
3

2-6
Location of EU EU Z2-19
Exposure Unit EU 22-19
. 4;11
u.02;
, • u-ti
22-0•
22-0S
POPLAR CREEK AREA .
-~-···----
PENINSULA AREA
22-28
/ :~:': " ,o,"'""
' .
DQO for Areas Outside the Fence in EUZ2-19 Rev. 2
N
I .. ,.., ~....:i_~.___,..___,no_,
4

2-7
.. Area Outside the Fence in EU Z2-19
' f~ :J;_' ,lj '
' \ I I
Areas inside the fence in EU Z2-19 were addressed separately through historical and recent documentation:
DQO Scoping Package for the Poplar Creek Group ( EUs Z2-11, Z2-12 and Z2-19), Apr 2009
Zone 2 Exposure Unit Z2-19, Radiation Walkover Survey Results and Proposed Path Forward, Aug 2016
FCN-ETTP-Zone 2-194 for Revisions to the 2009 DQO Scoping Package for EU Z2-19, Nov 2016
EU Z2-19 Data Quality Assessment and Path Forward,
11':;
Dec2017 I; FCN-ETTP-Zone 2-225 for EU Z2-19 RA (includes EU ~I Z2-19 Class 1 Soil Unit Technical Memorandum), May 2018
l \ l«-,!
;_::..1 ' ' l , + \ \t.~ ~
f\ /.·I f I · . \ \ '-' II '.Iii t
~ A,, .. ~-~ l s-,:~·"\~ ~ --.::':'-~ --::.;•:s-:- EU~ 3~ . ~ f~ - .J.,. ia•1'--=';if· i( ~ I ~··~',- •-~ t"J~
c:J e:veour.oAAV --AAEII.OUTSIOE FENCE
.,~
' OU.iQLIS H~D
-.) $1.1,B
- FtQ.-.o
""'"'" • - • FENCE
DQO for Areas Outside the Fence in EU Z2-19 Rev. 2
j ~ ...
ll(utm,~•I.·~...._._, .;"° ·""'~--f>""'•'"' !!'Cit\ )S-IUl'l . .,.'t'Ult •1~n~ .. 1"" l• Ull•ltCl•r,\1\fl>(JC~"*"""~""· n:n •• "" -...u;r....~.~"'"'·u•"~'" ,., . .,_., ''"'•\""'•!" , .... 1';11"4"b
5

2-8
PK for Areas of Potential Concern in EU Z2-19
• Building K-1410 Operations and Process Drains
• K-1410-A and K-1410-A Annex
• Outfall 360 Ditch, including Outfalls 360 and 362
• K-1410 Acid Disposal Pit (former Outfall 352)
• Building 1031
• Storm Drain Outfall 350 and K-1031 associated ditche
Outfall 360 Ditch Leading to Poplar Creek _ .....i:::::a w • s: u :u:a ... ~~
DQO for Areas Outside the Fence in EU Z2-19 Rev. 2 6

2-9
Facilities in EU 22-19
DQO for Areas Outside the Fence in EU Z2-19 Rev. 2 7

2-10
K-1410 Operations • K-1410 constructed in 1945; original operations involved
storage of clean trapping materials (alumina, carbon, NaF), mixing carbon and cadmium-coated alumina for use in carbon traps
• 1947 -- Began operations to separate carbon from the alumina in spent trapping media for uranium recovery
• 1948 -- Building converted to a cleaning and decontamination facility when use of carbon in cascade traps was discontinued
o Conversion included installation of 2 spray facilities in west end of building for decontaminating large pieces of equipment
o Spray facilities included two 8x2x25 stainless steel spray tanks in pits with floor pans to collect spray
o A degreaser that used tetrachloroethene, carbon tetrachloride and TCE was installed between the 2 pits
• A contaminated material incinerator was constructed on near SW corner of building (no info on what was burned)
• Cleaning and decontamination included degreasing in a spray tank with TCE or Freon
o Also used peroxide solutions, sulfuric acid
DQO for Areas Outside the Fence in EU 22-19 Rev. 2
"'f"rl,1 r.ri;-7, 'I l"
nil.nm ..,,....,.. .. li,i&ti, UI Otc'~cT.'t
Rtmtdlal Sitt Em11alloa IOI' Ibo S •.1•10 111d K•IOJI Tadlltits
..,d Sun'OUadlt11 Ana II tb< 0•~ Rltlt:• K•:13 Sitt •
0111 'Rlqt. T,,,_,..
t1
I "·~ -~Op"
~~f.~ : ........... ~i· /!• \
• • I ~ 1 t ~I ta~ -l" '®s.sc, __ ,_.
CLEARED FOR
PUBLIC RELEASE
/-
--5
r I
1995 RSE provided detailed historical information
8

2-11
K-1410 Operations (cont.)
• 1953/1954 -- K-1410 was dedicated to decontamination of equipment from K-1131 Feed Manufacturing Plant (FMP), which processed spent reactor fuel from other DOE sites
• During this period, and likely at other times, contaminated process equipment was stored periodically in outdoor areas adjacent to K-1410 (and K-1031)
• One documented episode involved outdoor storage of ash receivers associated with the FMP fluorination towers o The ash receivers were staged
to allow time for short-lived isotopes to decay
o Receivers were opened daily for stirring and off-gassing
DQO for Areas Outside the Fence in EU Z2-19 Rev. 2 9

2-12
K-1410 Operations (cont.)
• 1963/1964 -- converted to an electroplating facility
• Conversion entailed filling in the spray pits, installing plating equipment and adding a new degreasing station
• Also constructed a limestone neutralization pile near Poplar Creek to neutralize acid discharges from plating operations
• 1975 a concrete pit (K-1410-B) installed with equipment to allow for neutralization prior to discharge (discharge from the new pit were into the original limestone pile)
• Plating process used hydrochloric acid dips, alkali dips, sulfuric acid dips, and solvents for degreasing
• Electroplating was a solution of nickel sulfate, nickel chloride, boric acid, etc. (items were nickel plated)
• Facility was deactivated in 1979
• Demolition occurred in 1999
• K-1410 slab and both neutralization pits remain
DQO for Areas Outside the Fence in EU Z2-19 Rev. 2 10

2-13
K-1410 Drain Lines
• Floor drains inside K-1410 tied into a drain line that terminated at what was later designated Outfall 360
• K-1410 discharges through this line began in 1945 and continued from the mid-1960's
• Historical records indicate decontamination solutions containing uranium, acids solutions, spent solvents and other materials were discharged into the floor drains during this period of time
• Upon conversion to a plating facility in the mid-1960's, the floor drains and other discharges were routed to t he neutralization pits
• Floor drain discharges from K-1410 comprise one of t he primary sources of contamination detected in the Outfall 360 ditch
DQO fo, A,eas Outside t he Fence in EU 22-19 Rev. 2 11

2-14
K-1410 Drain Lines Leading to Outfall 360
O Floor Drain
llllJ Sump
• -1 r--~1 1 : D I J ' l __ J l_ ,.J
- Subsurface drain line (cast iron}
Sourte: Kellei< Dwg 1410X-K30-GA, Rev. 4. Marth 1945
• U TM .. : ::~, - --• - ; "I•' I f ,· • j f ~ ... v& . ,., : 1 1 . J , j.l
[11
I
, --1 11: · j I
ffl) f~1 ·; . T .
:r ·- I I
~ 1
,,
[ApLU • .,._,t,••
[ -.-::7 c:?J
\
flQST f LOOQ PLAN ~~ ,-· .1\fY'
DQO for Areas Outside the Fence in EU Z2-19 Rev. 2 12

2-15
K-1410 Drain Lines Leading to Outfall 360 (cont.) • Floor drains and sumps
connected to 4" and 6" cast iron pipes beneath slab
• Drain pipes were 6 - 8 ft below top of slab (780.7 ft MSL)
• Connected to 8 ft deep cleanout box (manhole) that was 12 ft west of slab
• 8-inch cast iron drain line led to the Outfall 360/362 ditch.
\
8-inch Drain to Outfall 360 Ditch
Source: Ke llex 0\1.g 1200-~02-HA-20 Rev .5, Dec 1945 (As-Bui h )
DQO for Areas Outside the Fence in EU Z2-19 Rev. 2
:'? 70 OPE!i OITCJ{
--............. ...........
deanout Bott ~ ~
North Floor Drain
~I '
13

2-16
Profile View of K-1410 Process Drain to Outfall 360
le ~ ~
~ '~ i "' ~ ~
~~ ~ ' ~ v ~ Cleanout Box ~
~~ IJ I ~ '\: ~ ....... ,, I j _ • l?JSi .r.l .,.
• I i!_l ~ - J' -li:. - - _a_ ~-+- ---·- . - ---l- O•U•ll 360 I
~s ft deep
8-inch cast Iron Drain
>I ~ ~ \ • ____ , ~~
'-- so: · c ~ - --·-
-.,-· ..
Source: Ke I lex Dwg 1200·M· 02·HA·20 Rev.S, Dec 1945 IAs·Builtl
DQO for Areas Outside the Fence in EU Z2-19 Rev. 2 14

2-17
K-1410 COCs
COCs varied during different operational phases:
• 1945 - 1947 trap media operations: uranium, cadmium and other metals
o Decontamination experiments during this period of operation reportedly sent waste solutions with peroxides, hydroxides, sulfuric acid, nitric acid down the floor drains
• 1948 - 1962 operation as decontamination facility: UF6 and other uranium compounds, Freon, TCE and other chlorinated solvents), acids, metals, Cs-137, Tc-99, transuranics
• 1963 -1979 plating operations: acids and caustic solutions, nickel and other metals, TCE and other solvents, possibly PCBs
DQO for Areas Outside the Fence in EU Z2-19 Rev. 2 15

2-18
Storm Drain Outfall 362 • Drainage swale south of K-1410 conveys surface runoff and storm flow to
Outfall 362, adjacent to Outfall 360 (process drain from K-1410)
• Surface and near surface soils between the swale and K-1410 shown to be contaminated with U and other radionuclides
• Source of this contamination may be related to the outdoor storage of process equipment
• Outfall 360 and 362 are authorized to discharge storm water runoff under NPDES Permit TN0002950.
DQO for Areas Outside the Fence in EU Z2-19 Rev. 2 16

2-19
K-1410-A and Annex
K-1410-A Sand Blasting Shop constructed in mid-1950s immediately west of K-1410
• Used to decontaminate "heavily encrusted" K-1131 equipment
• Glove boxes were installed for protection during sand blasting
• COCs would be uranium and other radionuclides, metals, PCBs
In 1974, K-1410-A was modified for a UF6 transfer and "burping" station (K-1410-A Annex) • Cylinders were "burped" if contents were above
atmospheric pressure
• Offgases (from the burping) were a mixture of N, 0, H, Fl-, F2 and Freon
• Cylinders were heated to evacuate contents to a receiver cylinder, which were immersed in slush baths (Freon or TCE + dry ice)
• No operational information, other than ~30 cylinders were processed at this facility
• COCs include uranium, Fl , chlorinated VOCs
• Runoff of contaminated water and sediment would be toward drainage swale to south and Outfall 362
t ,~ .. ~ l", ' ,C, ~
DQO for Areas Outside t he Fence in EU Z2- 19 Rev. 2 17

2-20
K-1410 Limestone Acid Disposal Pit
• Constructed in 1964 +/-• Designed to treat corrosive plating waste from K-1410
• Connected to K-1410 via underground, 4" vitrified clay pipe
• 26 ft x 26 ft diked area filled with limestone gravel
• Discharge through a rip-rap lined weir to rip-rap-covered slope down to Poplar Creek
• Discharge of liquid wastes may have percolated to underlying soils in addition to flowing down slope to creek l•· . I I/VI
~.~ I I -- ,
l ,
The pipe was previously identified as Outfall 352, but was plugged in the late 1990's and was identified in the 1997 permit renewa I as "sealed and no longer requiring permitting".
- :%,-:..'t::t".~l ~ - -. .._.._~_,., ./ I , ! ! >-~ ..... , . . ~--· ' ilh Q ::::.fl ,------ ·- -,, • .--., ~ ----- :::b... /.,, ::. .µ,,,;,.,.,.,.,, ...... '- -
- L.,..,.t;,Jl'li!a~-=-
, w-,·, I "'",.•e=, ... •------1
- rretFAL Cf'P.'OS' ~ ,'F~ILflfY---~ .. ~
Source: UCC DwgE·S·31227B RevO, Dec 1965
DQO for Areas Outside the Fence in EU Z2-19 Rev. 2 18

2-21
K-1410 Acid Disposal Pit (Feb 2019)
DQO for Areas Outside the Fence in EU Z2-19 Rev. 2 19

2-22
K-1031 Maintenance Support Building
• Constructed in 1945 as maintenance support facility for K-25
• Used to store and dispense trapping media for spent cascade traps
• Later used as a cutting area for size reduction of process equipment removed from the Fercleve Thermal Diffusion Plant
• Early 1960s used for paint storage/mixing, storage of equipment and materials
• Demolished in 1999
• COCs include Cd and uranium from spent cascade traps
DQO for Areas Outside the Fence in EU Z2-19 Rev. 2 20

2-23
K-1031 Mai ntena nee Support Building (cont.)
• Adjacent surface soils contaminated with uranium, fission products (Cs-137) and transuranics due to outdoor storage of K-1131 ash receivers
• Drainage swales north and south of K-1031 are Soil CAs • Potential sources of contaminated runoff/sediment via storm flow toward
Poplar Creek (Outfall 350 North of K-1031 and ditch south of K-1031)
Drainage Swale South of 1<·1031
-. - ·.- .~- - - -;7 .. ;. - ' -,- :..- .
r - •·
. I -T",ft· --... . ' ' . ;. ' ~~:.I,.. 7t t,t.'";,.:' ~-~· . '. -... ~·
,->:..~,, i-'- ·"· -. , - ~» - II --• ' .... , ' .. ' . .,..,..-; YL ... ~ . J ' . . . I ~?' ..: ,r 1., . :- .. , . ~.
' ' . ' _, .. .,.:._ .... . _,.
/ , ... " ......
DQO for Areas Outside the Fence in EU Z2-19 Rev. 2 21

2-24
EU Z2-19 Historical Sampling Locations • 12 soil samples collected 1994 - 95
• 8 surface soi l (0-6 inch) samples, one f rom 0-2 ft, and 3 locat ions with subsurface soil to 9 ft
• Sample RAD107 (0-6 inches) from ditch south of K-1031 had U and other radionucl ides, including Cs-137 and Ra/Th, above the average RL o Source of contamination is likely
surface runoff from drainage between K-1410 and K-1034
• Soil boring (ST03) east of the Outfall 360 ditch did not detect any contamination (one sample f rom 6-8 ft)
• Surface/near surface soil samples (0-6 inch and 0-2 ft ) at the K-1410 acid disposal pit did not identify any contamination issues
I
I : I I
I
/'
3,Sz l P6
I I - I ~ . • .. ...."= - I
/ 350 .... :4+: ii /i _---;-,, ~- - l-- -
f ..
=u~ • I
I I I I I t t l \J I I I
_.,,. ,....-.,-- I ~t ,, 0 : :$';· " '
K•1~'s~ ,7 l ~ l , ST I
/ /~~~fl. - • . > I , • I
560) ,.t./ !RAO 1071
~ •'s-sn--e .t' .: - •-• - •~---- ( l , I r-.L..1.- r I ' • t I
' , / ...:;,.:_,e~ I ' ; I ' , IIL------,,,::-::::::-::::-::=:===~ ~ I ' x . -----~---
+ , ---- - - - ------ --------- --- t
--_6 _, - ' .. ""\..-• • • I I 1 \ ~ I L _J l f .. n ................ r
'!l->«- 1-,.1 1 ~ t ~\ ,-lo
-4 k t LEGEND:
0 HtST-OR!CA.1. SOILSA\!PLE LOCATIORS • - FENCE f:ll!d£2]; {> O\JTf"-l LOCATIOH - EXISTIM; 8UUla<•S QI.ZZ.19CLASS I AM.-\'SHM'lES
COHTOUR UNE f"5FTI D BUii.OM; S'f.ABS
CJ CJ!IS$1 SU
.:::> ETTP EUZ2-19 BOUNOARVr~ --~-~w.i ____ ,.._ ... , .... -
1 - SURFACEV,'.1,.TER c;;a,~ ~-
DQOfor Areas Outside the Fence in EU Z2-19Rev. 2 22

2-25
EU Z2-19 DQO Scoping Package
• Poplar Creek DQO Scoping Package issued in 2009
• Identified a Class 1 Soil Unit surrounding K-1410 and K-1031
• Designated the area outside the fence as a Class 3 Soil Unit o Proposed a walkover assessment based on
a random grid of assessment points, with biased sampling if necessary
• DQO did not identify the need to evaluate the Outfall 360 ditch
8ECHTEL JP.-f.9..13..~.• ~
ENVIRONMENTAL MANAGEMENT
8CCMTEL JACOBS COMPANY LLC
OAK RIDGE ENVIRONMCHTAL
MAHAGEM!HT CLEANUft CONTRA.Cf
WITH THE UNrTED STATES
DQO for Areas Outside the Fence in EU Z2-19 Rev. 2
lUCJOR-3231
Data Quality Objective Scoping Packll~e for tbe Poplar C=lc Group (EUs 22-11, Z.Z-12, and ZZ..19) al Ille
East Tennfflee Techoology Park, Oak Ridge, Trnn~e
n., dXIIMCCI • jffifOwd fi)I ~ tflci&N ,atw"itwb,--
6Cf;t,1 u.;e,:4r l)Cffn'~,a
-°""" ll.llll.£li 1, .. ,
23

2-26
Characterization of Class 1 Soil Unit
• Implementation of the 2009 DQOs focused on Class I Soil Unit (SU)
o Initial characterization activities were completed in 2016
• Follow-on sampling was done in 2017 and 2018 to support delineation of the RA and waste disposition
• Majority of the sampling focused on the Class 1 SU but included limited sampling outside the fence
Drainage ditch South of K-1031
d1Q
~-·~ .,.,,.-l. - •,r:-~
'· -•~IU!l·J, ,, ·t· .. ..;l'.',1.-·:111, '-i~· , ·~ -.-,~ - ~~- {. t1.•·=!J:- •. ~.~.~-~!;:r . -<-
K-1031
LJ, •.J!.• . ~ I ','J fl:-:•-~•· 1,.,. 'I. t. . 1.J., . ..., -"tl I.. . .1 •>· ,. ).· . - • -.. \ fl• • · . ~ .. , ,.. . , : • • CII . · · •• •~1~,;.-
)'1 '>' ··:. : .. J,/1° 1'·'" 1 ' ···.,; • __ , .• ,., ·~·-·.0 .,.· -.·"'·.L-.: ' \,' ' :, ,• . ·.!. J ' ' / 'f'' ' ' ~ ' .. .,_
.f,,, i_l~-1°'· ~ • 1~~- • • .f • • •. ··, -~ ~ , • . ','I',; •~:'l •1~. , ...... k_._ '. <r'l • , .r·I.· :,.: t. , , . 1,.. • i ,,. 1 , "· 4 ·:J,, • ~ _ : • - , ,•:71· • · · .'·/.,, r- \•;, ti"'.:~· •_ .• ,.·, ,.... s
• , ! • I_•--• ,. \ '- • . ·"t:· .. ,: ' - t . ·.•' :)· .... I} :-'(• I J /. j' / c •
r_ i:A°:. ·1 • , :.,,.;s..__ f~ . 'V•{· > , _,... ,.·, \
, .., ' ' "~ . -·
)' ,. ,,4',:~
J'•., ·t· ' -(!. -
DQO for Areas Outside the Fence in EU Z2-19 Rev. 2 24

2-27
EU Z2-19 Rad Wa I kove r Surveys
• Background radioactivity ranges from "'700 to "'1,400 counts per minute (CPM)
• The Yellow shaded areas represent more than twice the background
• Orange and red identify higher levels of radioactivity, with red areas essentially hot spots
• Black areas within the Outfall 360 ditch are associated with levels up to 500,000 CPM
• Highest readings were taken directly below the K-1410 drain line (Outfall 360)
~
'5 ' i ~
ACTION LEVEL - 2,784 CPM
707TO 1392CPM
* 1393 TO 2784 CPM
2785 TO 6000 CPM
500() 10 t00O<) COM
* 10000 ro 42000 CPt;1
llE 100,000 TO 500,000 CPM
DQO for Areas Outside the Fence in EU Z2-19 Rev. 2
1zt2
! !l9_Q~ \Vl.·tl'l.~t ~l\ltJt li\l' 11•1 ,..., - 1-.,.111"1 •!• IN"f'F.11-,w, U~lt
....... , .. .......... , ... "" .. ~-
...... .,. ..... lt,.11<~ ""···~-........ , .... ,., ....
.... \I' .\ ' U:,'11 ' <,\)) ... , ... ~, .. ,1e ... , • .,.. ---~ .......... .....,, ... ,_.._ __ .. _ 25

2-28
Class 1 Sampling Resu Its • SVOCs -typical runoff from asphalt
paving and roadways
• Metals - generally elevated in drainages leading away from 1031 and 1410, no exceedances of Rls
• PCBs - no results above average RL but detected in soil at 4 locations, mostly in upper 1-2 ft of soil
• Rad -Drainage swale south of K-1031 had U-238, U-235, Ra/Th decay series, and Cs-137 above Avg Rls
o Portion of the drainage swale south of K-1031 included with Class 1 SU excavation
• Shallow (0-6", 6"-24") soil samples from B-161 near Outfall 360 headwall did not identify any rad contamination
• Overall conclusion from limited scope of evaluation: storm water runoff was (is) an active migration pathway for contaminants from the Class 1 area
.1 ~
I'/// I _i I I I
I'/ (I ii' ' '
! i J )) . //. ·' ·' /I/';
I/
I '
/ 22·Etl19-105
/ , Z2 EtJ198 ,1•3e zf..eu1ti&.144e Z2-EU19·10<l e , '-.._ -, "'4' , I, -...,
'I I ~ ·22,EU190,t69 ) , . r • • I /; / ~~ ,. zi-eu,9.,o,~5n Ii ' ' ti-EU19-1060
I// ( I ( r] zHu1ee.14s /I, I /?- Z2-EU198-1&I
----•I!" /\ • I ----~ - se2·t:s --
\,.----1
~ I L-~~· .,
• • •
0
0 Q. • 4 --.0
K-1 410
'if ,;,,.. ) - ..fi----•--.... -.:·~~~~';_,
, .ili t ?2•EU198.i701
TVPE OF CRITE.RIAEXG£EQA~
• MAX Rt., AVG RL, A.NO GWS$l
Q AVGRLANOGWSSlONLV
Q (..'WSSLONLY
e NO CRITERIA.EXCEEOANCE$
1• _-~ ~•1" 10 NUETAAUZATIOH Pa.£
6 OUTFAU. LOCATION
: . \ -- ---·
CLASS 1 Sim. UNIT
Q OEMOUSHEO 0 $1.AS - ROAD
C]eueouNDMY C .... TER
-- CONTOUR UNE t5Fl)
--FENCE
'I
Q'JC.'WIU,.',11l$V~1'tM ~~Pl"'~llf'W~ttl"f•U,1 \;M\i;_ Md(., l').W,. ~v.101to 1-W'l.«ATiet-. ,. LTI~CIJZ!l+A.--.· ~~l'IX• IJ\l~.lo l 11,1, \II fl.I I:: 111 n,~n,~o,cf ..a~..i ,1,v,1' 4 l/l{K)lt '- W,,. . l)IIG,!,liU,t(Ul'lfY l .,1# 'j)tc1t<,·r,S· (W(llllf,t ,-Ml!(t:lf"AI IIUI..__ !lo,-
DQO for Areas Outside the Fence in EU Z2-19 Rev. 2 26

2-29
EU Z2-19 Utility Corridor Samples • B-301, -302, -303, -304 taken near
storm drain outfalls along Poplar Creek north of K-1031 in Maren 2017
• All locations were 10 ft borings with 3 interval composite sample from 0-0.5, 0.5-2, and a 1.5 ft section from the 2-10 ft interval
• Analyzed for metals, PCBs, Rad, SVOCs
• No exceedances of Rls or otherwise noteworthy evidence of impact
• Land uses in this area have been minimal and the most likely sources of contamination would be overland flow (runoff, erosion/deposition) from storm water
• Due to this area not being industrialized, and the investigation prescribed by DVS not identifying any Zone 2 criteria exceed a nces, further eva lu at ion oft he area north of the Class 1 area is not needed
_ ..... *, ,._
~-• H
:;!',·,..-...,,.,..-fl....._ ...... ~ JI, H
• l
1' ~l
,; - '1 '
; Z2-20
• t ,~ ... t I I • X X
:_ I I . ' . ii I t' }
'" ' I
' 1
i\
d 22-09 \
t > X
"'' I 1 .~ ti'.l•I lil'h1-J03 . q 1
t ' r,-ll...-• 122-2 1
• ' 2"1:06
'
11 •• I 1 •• ls.' •
.ll~,.-" 4,t +.- IC~.} , • _.,
,/ 22:--10 ,.
/ ,/
_,/·
0 $AMPLE LOCATION c::J CLASS I SU
'7i"' / \" ;(2 •1· .111?U•J<14f" 334
i I
po ~ A .1~$0
6 OUTf'.ALL t.OCATION ~ lk,tll .. DINGISTAlJCTIJRE SLAB ,. - FENCE c:::J E"TTP EXPOSVR!; \JNIT 80Ut,,1>AR'V
CONfUR UN( {5FT) IIIIS WATER
c:::J CLASS 3 SU
d!
* t 1<0- ,. ...
1 ~ ~ cl :t \, 4 ""
l ~ i' f 1'1.-1 iz2-22 • 4! l 1' 1 i' r' tt~-i-, t , l ,.,
'
!t••·~·~··""·•n" "'o .. ,, ... ,i1o,o1-11r ... ,• ""'" .. ....,. f.,U Ht,,o w.,1,. ,.n,,._ , .~ ·IN'l· ,;.,.,,_
•v•• ••-..,,IJ•·'-'« '"-"-''-~-•.<11_.,,... .,,.,.,.,, . ... 1(1...,.. 111,,,,w..,.-,.. • ._.,,._ .. ·••o:n ,._. om.,h-..-dlff .... ......,..,.
DQO for Areas Outside the Fence in EU Z2-19 Rev. 2 27

2-30
EU Z2-19 RA (Class 1 Are
• EU Z2-19 Data Quality Assessment for Class 1 SU presented to EPA and TDEC in April of 2018
o RA described in Concurrence Form FCN-ETTP-Zone 2-225, approved by TDEC and EPA in May of 2018
o Recommended a remedial action (excavation) of a large part of the Class 1 SU
o Included a Technical Memorandum for the Class 1 SU
• A small portion of the planned excavation extends westward beyond the fence - associated with drainage swale south of K-1031
.1 / ,/,// ( l/ · I / I
11/U;-' Z~~:ie• , /4, i \,---·,
!OtJ~t• ' !, I I 'i• I
. I •
'I I I ' \ '
fl/( ;r // - - o-\),
I 1/ I I l
/
TfPE u CAiTF~IA e,romw.ee . .. wtRL AVGRl., A.~OCf WSSI.
Q •WO RL AHO GWSSLONLY
0 GWSSt.OHLY
• NO CR1ll!Rt,t,E'.XC(!.D,N,1Cl=S
C Pl'tl\\AAV'Oic:J\W.l!ON OOUND,l,.RIES
C INT£AIOR OIG80lltlC>Aff (
'6, OU1T'ALLI.OCAn0t1
I ~ !~\- ; --
»/ . \ii)·\ -~ i 0 •
O Q.
\ I
- ---r \ \ ,\ \
Cl.ASS 1 SOil UNIT
C) ,v V,.,., flR
8Ull01NG
~.::J OE-'-'°'-'SHEO ..... -=•
CONTOUR UNI: (!iFt)
.-_-.: -<,1uo NUETAAl.ll.ATIONPILE.
.'.\ \
llJQlll'IIW.n.·$l'7T \/ ~i0$)91,,itf!A11T«-rll'S"lot IAIHi,.~ tv<n<,J. l-.~o,~ \V,l'l(l(..\ll(I);
f'.tnl'l)J)U/M-"",' ~M•!)Oll' \ !H•'I 'I.U, • • n •..u_i~J;'.\1:A\'- •l1$UJ \Uf'"VfflUll I(. /1,jli. 1)111(1,\)':.lM l!'el ! "(VII 11.11.""f\'~ 00 ,-~lal l!WUll:,lef\111111~~
DQO for Areas Outside the Fence in EU Z2-19 Rev. 2 28

2-31
bl I 11 noo
• K 27 and K 29 Building Group DQO Scoping Package issued in 2009
• Identified the entire creek bank area as a Class I Soil Unit
• Proposed a confirmation sample (O 1 ft) at location of max RL e~ECeedance
• Proposed additional rad 1Nal ko~1er surio1eys at both historical sampling locations and all other accessible areas
o Grid sampling of surface soils would be de1o<eloped on the basis of rad suri,1e•ts
o 20% of locations would be 10 ft borings with a ~ inteF¥al comoosite safflole
• DQOs issued prior to disco·o1er>y of uranium hot snot at utilit•, nole <location g112)
DQO for Areas Outside the Fence in EU Z2-19 Rev. 2
llJC/OR-3lJ2
Data Quality Objective ScopiDK P ackage for the .K-27 ud K-29
Bu.lldlni Croup (EUs Zl-13, 7..2-14, and Z.Z.15) at the
East Term- Ttdlnology Park, Oak Ridi:e, T"8D._._
,,. ....... .,~"'~-... ...-.,. /v.i!Mlok:llrilll: BX£m'OIIM~A lilllbtwl_..Qffla
l1.lla.ll.
"""
29

2-32
Conceptual Site Model
Primary Sources Facilities Primary COCs Secondary Sources Release Mechanism Migration Pathways
Historical operations: K-1410 • U-234, -235, -238 • Process drains • Discharge onto • Surface run-off Decontamination & • Tc-99 & other • Storm drains & creek bank • Erosion degreasing, plating, fiss ion products cat ch basins • Ventilat ion hoods • Air dispersion UF6 processing • TCE & ot her voes • Contaminated soil • Spills, Leaks • Downward
• Demolition & percolat ion to GW downsizing
Outdoor storage of K-1410 • U-234, -235, -238 • Contaminated soil • Spills, Leaks • Surface run-off process equipment K-1031 • Tc-99 & other • Sediment • Contact with rain • Erosion
fiss ion products accumulation areas • Routine discharges • Air dispersion • Transuran ics • Storm drains & • Fluorides catch basins
Acid neutralization K-1410 • Uranium • Contaminated soil • Routine discharges • Surface run-off piles • M etals • Sediment • Leaching from • Erosion
• Acid residues accumulation areas rainfall • Downward • Fluorides percolat ion t o GW
• Principal contamination issue is likely to be discharge or leaks/spills of wastes along with runoff and erosion/ deposition of contamination, with the likely impacts (due to topography) limited to surface soils
• Areas of waste discharge (Process Drain piping, drainage swales, and outfalls, K-1410 Neutralization Piles) also may be associated with subsurface soil contamination due to dow nward percolation of waste liquids and contaminated precipitation liquids
DQO for Areas Outside the Fence in EU Z2-19 Rev. 2 30

2-33
Revised/Updated DQOs for EU Z2-W 19 Creek Bank
Step 1: State the Problem
Former facility operations within EU 22-19 may have released Zone 2 COCs that could contribute to contamination of soil with the potential to impact surface water and sediment in Poplar Creek as well as future reuse of the site. The potential for contamination of underlying groundwater is also a concern.
The 2009 DQOs did not effectively address all potential contamination issues in those portions of EU 22-19 that border Poplar Creek. These areas will be the focus of the DQO characterization activities.
Step 2: Identify the decisions:
1. Determine whether soil, accumulated sediment (in drainage ditches) or subsurface structures are contaminated above Zone 2 ROD remediation levels for the protection of human health.
2. Determine whether sources for actual or potential surface water or groundwater contamination are present in soils, subsurface structures or related media.
3. Define the boundaries for excavation or removal as part of any required remedial action.
4. Generate sufficient data to support a final no further action decision for the EU (after any required remedial actions).
DQO for Areas Outside the Fence in EU Z2-19 Rev. 2 31

2-34
DQO Planning (cont.)
Step 3 - Inputs to the decision
1. Concentrations of contaminants in soil, concrete and related media compared to average and maximum remediation levels (RLs) from the Zone 2 ROD
2. Concentrations of contaminants in soil, concrete and related media compared to established risk criteria (e.g., PRGs)
3. Concentrations of contaminants in soil, accumulated sediment and related media compared to soil screening levels (SSLs) for the protection of groundwater as defined by the Zone 2 ROD
4. Horizontal and vertical extent of impacted soils that need to be removed based on No. 1 and No. 2 above.
5. Contemporaneous groundwater quality and water level data necessary to accurately evaluate No. 3 above.
Step 4- Study Boundary
Portions of EU 22-19 outside (west) of the security fence, as shown in previous slides, including surface soil, accumulated sediment, man-made features, and associated subsurface soils down to the depth of the water table or top of bedrock
DQO for Areas Outside the Fence in EU Z2-19 Rev. 2 32

2-35
DQO Planning (cont.)
Step 5 - Decision Rules
1. If soil concentrations for Zone 2 COCs are greater than maximum Rls, conduct a remedial action until concentrations are below maximum Rls
2. If soil concentrations for Zone 2 COCs are greater than average Rls, conduct a remedial action until concentrations across the entire EU are below average Rls
3. If soil concentrations exceed established risk criteria (PRGs), calculate the aggregate risk to human health; if the risk exceeds Zone 2 ROD criteria (>10-4 or HI > 1), conduct a remedial action until Zone 2 ROD risk criteria are met
4. If soil concentrations exceed SSLs for protection of groundwater, conduct a remedial action until concentrations are below SSLs
5. If soil concentrations are below Rls, SSLs, and risk-based criteria, no further action is required.
Step 6 - Limits on Decision Error
The potential for decision error is minimized through collection of more than the minimum required data. This translates into more sampling locations, more discrete samples collected at each location, and expanded analyses to investigation all potential contaminants
Uncertainty is also minimized through compliance with the Zone 2 QAPP (Appendix A of the Zone 2 RDR/RAWP).
0QO for Areas Outside the Fence in EU 22-19 Rev. 2 33

2-36
DQO Planning (cont.)
Step 7- Optimize Sample Design
Proposed sampling scheme integrates the CSM with DQO requirements to support decisions on the following:
1. The need for and extent of any required remedial actions
2. Final status determination of No Further Action for both EUs, following completion of any required remedial actions.
DQO for Areas Outside the Fena! in EU Z2-19 Rev. 2 34

2-37
Characterization Objectives for EU Z2-19 Creek Bank
• Determine nature/extent of surficial contamination related to historic waste discharges in the Outfall 360 Ditch o Conduct rad walkover surveys in accessible portions of ditch, focusing on areas
potentially impacted by retention of contaminated sediment
o Biased sampling of accumulated sediment or surface soils (0-1 ft) based on rad survey results and/or field observations
• Determine whether downward percolation of liquid wastes discharged at Outfall 360 have impacted subsurface soils o Biased soil borings (15 ft) adjacent to drain lines leading to Outfall 360 and 362
• Investigate the presence of surface contamination in drainage ditches associated with outfalls downstream of known contamination areas o Conduct rad walkover surveys in accessible portions of ditch south of K-1031
(downstream of area included with RA) and Outfall 350 ditch
o Biased surface soil samples (0-1 ft} based on rad survey or field observations
• Determine whether historical waste discharges and subsequent runoff or percolation have impacted subsurface soils at the K-1410 Neutralization pile o Biased soil borings (15 ft) within the former limits of the pile
o Biased surface soil samples downstream of the pile
DQO for Areas Outside the Fence in EU Z2-19 Rev. 2 35

2-38
Surface Topography Along Poplar Creek in EU Z2-19
OutfallS90 ·,;...,....; ;.: . ( IIJJ, U1UW1 ) h
K~:1410 N,.:,t~on PIie
Outf1111 ~ _q.fJ. Ditch . J .p(, z
' ~ •
&~ ~~~~ o· '--:--.. 0
0
IC-1410
DQO for Areas Outside the Fence in EU Z2-19 Rev. 2
' I
't t
0 1 ..
36

2-39
EU 22-19 Outside the Fence Sampling
OQO for Areas Outside t he Fence i n EU n -19 Rev. 2 37

2-40
Proposed Surveys and Sampling in EU Z2-19
Rad surveys in Outfall 360 Ditch will be completed to the extent practicable
• Areas of Planned Rad Walkover Surveys
V 10 or 15 ft soil boring
0 0-1 ft surface soil
~
&~ '~~~ 0
' I
't t
0
IC-1410
DQO for Areas Outside the Fence in EU Z2-19 Rev. 2 38

2-41
Proposed Sampling in Outfall 360 Ditch
• Number and exact locations of samples will depend on the accessibility of ditch segments for sampling
• 15 locations assumed • Depth of soil or sediment is
expected to be variable o Bedrock is exposed in much
of lower reaches of ditch
• Soil borings will be located near drain lines leading to outfalls from K-413 and K-1410
• Three locations will be sediment samples in the f lood plain [the area between summer (741 msl) and w inter pool (736 msl)].
:-1-·~'l,'o
CJ -::,..~
Q.OQ,
(lj
- 1<'1;:cl
DQO for Areas Outside the Fence in EU Z2-19 Rev. 2
7
1'., Areas of Planned Rad
V Walkover Surveys
V 10 or 15 ft soil boring
0 0-1 ft surface soil
39

2-42
Soil Sampling Summary Table - EU Z2-19 Planned Analyses
I Samples/ Interval Cs-EU 22-19 Plan Depth Location (ft) U-iso Ra/Th Tc-99 137 Metals voes PCBs Fl-
Surface Soils
Outfall 360 Ditch 12 0-1 ft 1 0-1 v v v v v
K1410 NP Drainage 2 0-1 ft 1 0-1 v I v v
Outfall 350/drainage 4
I 0-1 ft 1 0-1 v v v v v v
swale S of K-1031
Sediment samples in 3 0-2 ft 2 0-2 v v ,, v v v
flood plain
TBD Locations 4 0-1 ft 1 0-1 v v v
Subtotal 25 -- -- -- 28 22 22 10 28 0 26 2
Soil Borings
Outfall 360 Drains 2 0-15 ft 5 0, 2 v v v v v v
5,10, 15 v v I v v
K-1410 NP 2 0-15 ft 5 0, 2 v v v
5,10, 15 v v
TBD Locations 1 0-15 ft 5 0, 2 v v I v v TBD = To Be Determined
5,10, 15 v v v NP = Neutralization Pile
Subtotal 5 -- -- -- 25 4 10 6 25 9 5 4
DQO for Areas Outside the Fence in EU Z2-19 Rev. 2 40

2-43
Path Forward • Incorporate comments or changes into DQO after EPA and TDEC review
o Submit revised DQO for approval by EPA and TDEC
• Develop Sampling and Analysis Plan to document DQO results
o Submit SAP for approval by EPA and TDEC
• Implement field sampling and analysis activities
• Evaluate results and present recommendations in Data Quality Assessment (DQA) with EPA and TDEC
Looking East into q.utfall 360 Ditch from Poplar Creek
DQO for Areas Outside the Fence in EU Z2-19 Rev. 2 41

2-44
Attachments
1. Historical data (from ORE/5)
2. DVS data to date (from PEMS) Note: Due to file sizes, attachments to be provided separately.
'~:-.i.,::.,;,
DQO for Areas Outside the Fence in EU Z2-19 Rev. 2 42

EU-19 TM SAMPLE SUMMARY TABLE

3-2
This page intentionally left blank.

3-3
Diile.HmJiled
411 7.119
4117/19
4flil\9
4{17/ !9
41171!9
41171!9
4/17/19
4117/19
4{17/) 9
WJ2!1 9
9112119
9{12.119
1211 111':f
12111.'19
12112/19
1211211':f
12112119
11'21'20
112lt:0
1122120
1122.120
1'12'20
1122''20
1122120
1122.120
1122120
l f30!'20
1130/20
1130/'20
1130120
1/30/2(1
1(30120
1130/20
1130./20
1130.120
1(30120
1130/20
1130/20
1130.120
l f30f2(1
1/30120
1130,120
1130!20
1130/20
l/30120
Siimple luciilion
Z2-EUl 'JIH,ijl
Z2-EU l 9B-602
Z2-EUl 'J(3.6()}
Z2-EUl 'Jl3-6(H
Z2-EUl 9B-60S
Z2-EU1913-60()
Z2-EUl 'Jl3-6ij7
Z2-EUl 9B-608
Z2-EUl 'Jl3-609
l2-EUl 'Jl3-610
Z2-EU19B-61 I
Z2-EUl 'Jl3-612
l2-LiUl 'J8-613
Z2-EUl 9B-614
Z2-EU1913-61.'i
Z2-EUl 'JB-616
Z2-EUl 9B-61 7
l2-EUl \f13-618
Z2-EU19B-619
Z2-EU19-620
Z2-t:u19-621
Z2-CU1 9-622
Z2-EU19-623
Z2-EU19-624
z2.1_:u19-62.'i
Z2-EU J9B-605
Z2-EUl9B-632
Z2-EUl 'JB-6U
Z2-EU l 9B-634
Z2-EUl 9B-63S
l 2-EUl 'JB-636
Z2-EU l 9B-637
Z2-EUl 9B-63S
Z2-EUI\IB-639
Z2-EU l 9B-640
Z2-EU l 9B-641
l2-LiUl9B-642
Z2-EUl 9B-643
Z2-EUl 9B-644
Z2-EUl 'J8-64.'i
Z2-EUl 9B-646
Z2-EUl 9B-647
Z2-EUI\IB-648
Z2-EU19B-649
Z2-EUl 9B-MO
Coocdiniiles"
l>i g 2 hpa11,;ion S1111plr l .ocalK>l1\
i44S<i.\l
744569.4
i -14570.3
i44.'i68 . .'i
744567.2
i-14.'i6S.3
i 44.'i.'i4. J
744541.2
i •l4.'il.'iJ
i44.'il l.3
744513.2
i 44.'il7.0
:144562
744571
i-14.'i72.3
:14456{,
744 558
744567.0
i44570. I
744566.8
i44.'i69.0
i 44566 . .'i
744568.3
744567.0
i44566.1
744567.2
744514.0
744513.4
744512.7
7445J U07
i 44510.2
744516.3
744514.9
i44513.8
744513.2
744512.0
i445 11.3
744516.4
7445 17.5
i 4451 6.4
i44515.l
744513.8
i44.'il2.9
744512 .1
744517.i
178639.8
178641.2
178643.9
178643.2
17864.'iA
1786'18.6
178652.(1
178653.9
178656.6
178656.6
178659.9
178659.9
178642
178635
1786'15.9
1786.'i()
178655
1786'13.l
1786'\Ui
178646.1
178645.4
178644 .J
178646.9
li8647.l
178648.6
178645.4
178663.41
17866J.9i
li866(U
178659.0
178657.(1
178662.5
178660.6
178659.J
178658.3
178657.1
178656.0
178664.1
178661.6
178659.8
178658.2
178656.8
J 786.'i6.0
178654 .9
178659.9
Su np\elnter>'al
0-1 ft.
0-1 ft
0-0..'i ft
0-l ft
0-1 ft
O•l ft.
().1 ft
0-0.3 ft
0-0.5 ft
0-1 ft.
o-o.5 n 0.1 ft
0-15 ft
0- !S rt
0·l0 ft
0-10fl:
0- lOrt
0-2 fl
1.1·2 .7ft
1-4 ft
2.S-4 ft
1-2 fl.
1-4 ft
1-4 ft
3-4 ft.
1-4 ft
0-1 ft
0-1 ft.
0- l ft
0-1 ft
().1 fl,
0-1 ft
0- l ft
0.1 ft
J-2ft
0-2 ft
0-2ft
0-2 ft
0-2ft
0-2 fl
0-2 ft
0-3 ft
0-2 ft.
0-2ft
0-2 ft
Mel.:l ls TCLP Metals
00-.'li.t e l~lmratory ~n~ly!lll!li
PCB RAD TCLP S\'OC SVOC voe Cornmen b a ml no tr.s

3-4
Diile.HmJiled
1/30/21)
1130120
3115/18
3/15/18
)/15/18
3115/!8
J/19!!8
3/19/18
3119.'!8
3(19/18
J/20!1 8
3120.1!8
3/20/18
Jf2U/!8
J,'20/!8
Jf20!l8
3f20/!8
3122118
Jf22/l8
Jf22/!8
J/22118
3122/lS
J/22/!8
J/22118
Jf22! 18
4125118
l ln!l 9
llnfl9
lln/!9
lln!l9
]/21/17
3f22'17
3122117
]/22117
Jf22l17
3f23!17
3123.117
3123.117
3123/17
]/23/17
3123117
3l27/l7
]/2'/17
3127/17
Siimple luciilion
'l.2-EIJl':IB-6.51
Z2-EU19B-65 2
Z2-EU19-41i
Z2-EU19-419
Z2-EUl9-420
Z2-EU19-42l
Z2-EUl9-4M
Z2-EU19-415
Z2-EU19-416
Z2-EU19-418
Z2-EUl9-40\
Z 2-EU19-402
Z.2-U/19-403
Z2-EU19-406
Z2-EU19-407
Z2-EUl9-41 1
Z2-EUl9-4ll
Z2-EU19-400
Z2-EU19-4CH
Z2-EUl9-408
Z 2-EU19-409
Z 2-EU19-410
Z2-EU19-413
Z2-EU19-43i
Z2-EUl 9B-4J8
Z 2-EUl9-405
Z2-EU! 9-9707
Z2-EU19-9708
Z2-EU19 -9709
Z2-EU19-9710
7.2-f.\119-124
Z 2-EU19-ll0
Z2-EU19-ll l
7.2.f.l119-112
Z2-EU19-113
Z 2-EU1 9-l09
7-2-f.\119-1 14
Z2-EU19-115
Z2-EU19-116
7.2-f.lJ19-l 1i
Z 2-EU19-l23
Z2-EU19-101
7.2-TI/19-102
Z2-EU19-l03
i44515.7
744514.3
Coocdiniiles"
Concre le Samples
74'1634.6
744631.6
744631.6
744637.6
7,M628.6
7·M634.6
744631.6
7,!4628.6
744614.2
744622.3
7,M6JO.J
744618.3
744626.J
744622.3
744630.3
744606.2
7,!4638.3
74463'1.J
744642 .J
7•M60U
744638.3
744630.0
7,M6M.2
7446 10.2
744646.6
7·14616.1
744659.9
744659.7
CbancleTizal.ion Siimple l.oalio11 ~
744.W.,.O
744582.8
7 ·14580.2
i44.~ln. J
744607.1
7-1<1585.6
744.~16 .6
744598.4
7•14611.1
744630.2
744611.5
7 ·14632.9
i446.16.7
744639.4
liS657-1
178656.7
178699.2
17869-1.0
178688.8
178688.8
178701.J
178701.J
178699.2
17869-1.0
178656.0
178656.0
178656.0
178&19.I
178649.1
1786-12.1
1786'12.I
178656.0
178656.0
1786'19.I
178649.1
1786-12.1
1786-12.1
178709.1
1786"2.I
1786-19.1
178742.0
178759.2
178762.1
178743.36
178631.l
178641.3
178637.6
178631.8
178636.7
1786-16.5
17S619J!
178617.3
178617.J
178617-l
178617.3
178719.0
178720.J
178718.l
Sunp\elnter>'al
1-l fl
0-2.ft
~]~
~3~
~3~
~]~
~]~
~l~
~]~
~3~
~3~
~]~
~l~
~3~
~]~
~3~
~l~
~]~
~3~
~3~
~3~
~l~
~3~
~3~
~3~
~l~
~]~
~3~
~3~
~]~ ~~ l ft ~ l ft ~~ ]ft
Q. lft ~~ I .ft ~· ~-~· ~ I .ft ~~ l ft
Mel.:lls TCLP Metals
00-.'li.t e lalmratory analy!lll!li
PCB RAD TCLP S\'OC SVOC voe Cornmenb a ml notr.s
K-1031 slab
K-1031 slab
K-1 031 slab
K-1031 slab
K-1031 slab
K-1031 slab
K-1031 slab
K-1 031 slab
K-HIQslab
K-1410slab
K-1410slab
K-1 410slab
K-1410s\ab
K-141Q s lab
K-1410slab
K-1410slab
K-1410slab
K-141Qslab
K-1410slab
K-1410slab
K-1410slab
K-1410slab
K-14l0slab
K-1410slab
K-1066-D slab
K-1066-Dslab
K-1066-Vslab
K-1066-Dslab

3-5
Diile.HmJiled
J/27111
3127/11
3f2&117
]/28/17
3f2&117
3/28/17
.1/28.117
3/29.117
3129/17
]129/17
3129.117
3/30.117
Ji.lO!l7
3/30/17
3130/17
J/.l0/11
9/26111
9/26/17
9126.lli
9127/17
9i27.117
912"//!7
9127/17
9127/17
9127.111
912&117
9/28/17
JO,Z/li
1011117
10/3.117
10/J lli
10/3.117
10/4117
10/4/17
10/4117
10/4./17
10/4/1 7
10/4117
10/5.117
10/5/17
10/5.117
10/5111
1om 11
10/9!17
10/9.117
10/10/li
Siimple luciilion
7.2-f1J19-IO.,
Z2-EU19-108
Z2-EUI9-l l8
7.2-r.l/19-1 19
Z2-EU19-120
Z2-EU19-l2l
7.2-f1Jl9-122
Z2-EU19-10.I
Z2-EU19-106
7.2-f.U19-1 25
Z2-EUl 9B-30S
Z2-EU19-107
7.2-Etll9B-.\-OI
Z2-EUl 9B-302
Z2-EUl 9B-303
7.2-1\1.IIYB-.104
Z2-EUl 9B-129
Z2-EUl 9B-131
7.2-Elll9R- 132
Z2-EUl9B-IJS
Z2-EUl 9B-155
7.2-EIJ1 9B-l.5.,A
Z2-E Ul 98-I S58
Z2-EUI98-155C
7,2-Ell19B-1551)
Z2-EUl98-133
Z2-EUl98-154
7.2-EUl9R-1 27
Z2-EUl 9B-12S
Z2-EUl98-130
7.2-Etll9B-1 .B
Z2-EUl98-136
Z2-EUl 9B-134
7.2-EU19B-16'
Z2-EUJ9B -167A
Z2-EU198-1678
7.2-ElJl9R-16iC
Z2-EUl ?B -167D
Z2-EUl 9B-16S
7-2-EIJ 19B-16RA
Z2-E U198-1688
Z2-EU198-168C
7,2-EIJ19B -16flT>
Z2-EU19B-16S
Z2-EUl 9B-166
7.2-EIJl9B-141
i4459.~.I
744592.2
744631.0
i44609.6
744640.3
744621.0
i446J4.8
744588.9
744568.8
i44644.S
74466'-l
744582.8
i44S91.1
744603.l
7446 16.6
i44629.6
744642.4
744658.4
i44655 .. l
744655.2
7 ·146--10.3
i44640 .. l
744640.9
744639.9
i446395
7446--10.6
744638.S
i44631.4
744625.4
7446--18.9
i44612.8
744614.8
744625.8
i44621.0
744621.0
744621.3
i44621.0
744620.7
744605.6
i4460H
744605.9
744605.6
i446'l.U
744609.S
7 ·14619.l
i44S9.~.i
Coocdiniiles"
li8691.4
178674 .4
178671.6
17867H
178673.2
178673.9
178681.3
178685.8
178666.3
178688.9
178621.5
178669.0
17919Ll
179089.l
178%1.9
178838.8
178727.8
178704.2
lin689.6
178674 .3
178673.2
178673.S
178673.S
178672.8
I 78673.~
178693.6
178719.4
178733.4
178727.6
178719.9
1787(17_4
178692.9
178715.4
178673.9
178674 .2
178673.9
178673.6
178673.9
178677.3
178677.6
178677.3
178677.0
178677.3
178672.3
178680.S
1786.50.0
Sunp\e lnter>'al
0-1 fl
0-J ft 0-1 ft
0-1 fl.
O• l ft
0-JOft
0-10 fl
0-1 ft
O•l ft
0-l fl.
0-JOft
0-10 .ft
0- I0 fl
O•l Oft
0-JOft
0-10 fl
0.4ft
0•4 ft
0-4 fl.
O•lOft
0-4 ft
0-J fl
0-3 ft
0-3 .ft
0-3 fl.
0-4.ft
0•4 ft
0-4 fl.
0-4.ft
0-4ft
0-4 fl.
0-4 ft
0•4 ft
()..4 fl.
0-3ft
0-3 ft
O..l fl
0-3 ft
0-4 .ft
0-3 fl.
0.3ft
0-3 ft
0-J fl.
0-4 .ft
0-4 ft
0.4ft
00-.'li.t e l~lmratory ~n~ly!lll!li
Mel.:lls TCLP Metals PCB RAD TCLP S\'OC SVOC voe Cornmenb a ml notr.s

3-6
Diile. HmJiled
10/10/li
IO/ll/17
10/llili
10/lllli
10/11/li
10/12/li
10/12/li
10/16117
IOll6Jli
I 0.116-'li
10/16117
10/17/li
10/17/li
10/1:'/ li
IOIIS.117
10/18/li
10/18.ili
10/19.ili
10/19/li
10/24.ili
10/24.ili
10/2.Vli
10/25.ili
10/25117
10/2.~/l i
10/26/li
3/13/lS
3113118
3113118
3/14.118
.\/l!/18
3/27/ 18
3127!!8
3127.118
3127/18
3127/ 18
3127/18
3f27/l8
41<1/ 18
414/18
415/18
415/18
4i9/18
419/18
4110.118
4/1(1118
Siimple luciilion
l'.2-Elll':IB-142
Z2-EUl 9B-152
Z2-EUl 9B-156
7.2-EUl9B-161
Z2-EU l 9B-164
Z2-EUl 9B-139
7.2-Elll':IB-140
Z2-EU l 9B-147
Z2-EUl 9B-148
7.2-EUl!IR- 162
Z2-EUl 9B-170
Z2-EUl 9B-158
7.2-Etll9B-1 W
Z2-EU l 9B-160
Z2-EUJ9B-126
7.2-El.119B-141
Z2-EU l 9B-144
Z2-EUl 9B-146
7.2-Elll9R- 161
Z2-EUl 9B-145
Z2-EUl 9B-169
7.2-Elll9B-149
Z2-EUl 9B-150
Z2-EUl 9B-151
7.2-Elll!IR-1 57
Z2-EU l 9B-153
Z2-EUl 98-16SC•I
7.2- r.tJ19R- 168C-2
Z2-EUl 98-16SC-3
Z2-EUl 9B-182
7.2-11.119-422
Z2-EU19-423
Z2-EUl 9-424
7.2-f:019-425
Z2-EUJ:M26
Z2-EU19-427
7.2-f.U19-42R
Z2-EU19-429
Z2-EU19-431
7,2-r:1.)19-434
Z2-EU19-430
Z2-EUl 9-432
7.2-11.119-433
Z2-EU1 9B -1:'8A
Z2-E Ul9B-1788
7.2-EU19R-1 7RC
i44602.5
7446 16.6
744606.8
i44602.2
744606.3
744658.6
i44632.I
744566.6
744618.8
i44602.2
744538.1
744569.6
i44S8.U
744583.0
744605.7
i445R45
744562.0
7445'18.9
i44574.0
744583.5
7 ·145-i7.6
i446l6.2
744641.8
744611.7
i44613.3
744628.8
744605.3
i44604.6
744602.5
7446--11.4
i44634.8
744635.6
744634.S
i44634.1
744640.3
7446--11.2
i44639.8
744639.1
744608.7
i446l.L~
744605.6
744601.1
744607.1
744619.1
7 ·14620.7
i44619.0
Coocdiniiles"
li8654 .9
178636.5
178637.9
178637.8
178643.0
1786'18.6
178663.1
178630.9
178634 .3
178631.8
178605.0
178614.8
178614.6
178624.1
178738.3
li8690.J
178687.4
178657.0
lin642.l
178661.3
178676.7
178624 .6
178626.l
178612.l
178618.1
178654 .8
178675.4
17R672.0
178671.3
178673.4
1786R2.0
178681.3
178680.5
178681.3
178674 .2
178673.5
178672.4
178673.6
178636.7
178637.8
178636.7
178636.7
178635.2
178624.1
178622.3
li8620 _l
Su np\elnter>'al
0-Hl
0-J0ft
0-lOft
0-4 fl.
0.4 ft
0-4ft
0-4 fl.
0-4 ft
0-4 ft
0-4 fl.
0-4ft
().<ft
0.4 ft.
0-4 ft
0-4 ft
0-4 fl.
0.4ft
0- !0 ft
0-4 fl.
0-4ft
0-4 ft
0-4 ft
0-4 ft
0-4ft
0-10 fl
0-4ft
0-0.5 ft
0-0.5 fl
0-0.5 ft
0-1 ft
0-0.5 fl
0-0.5 ft
0-0.5 ft
0-0.5 ft
0-0.5 ft 0-0.5 ft
0.0.5 ft
0-0.5 ft
0-7.Sft 0-10 ft
0.10 ft
0-6 ft
0-11J ft
0-J0ft
0-l Oft
0--10 ft
Mel.:lls TC LP Meta ls PCB
00-.'li.t e l~lmratory ~n~ly!lll!li
RAD TCLP S\'OC SVOC voe Cornmen b a ml notr.s

3-7
Diile. HmJiled
4110/18
4111!18
4/ll/18
4111118
4/ll/1 8
4116/18
4(\7/18
411&118
4f24/l 8
5130/18
71J21l8
71J2118
7112/18
7116/18
7116/l8
i/16/18
8l30'18
8/30/18
Si.l0/18
915/18
915/18
915/18
916/18
916/18
916/18
9110'18
9110/18
9/10/18
91191! 8
?119.118
9/19118
9f24/18
912411 8
9124/18
I0/J.118
10/1.118
JOfl.118
1012118
10/2118
10/J.118
10t.V18
10/4!! 8
Jl)/4/18
10/9!18
10/9/18
10/10/18
Siimple luciilion
,',2-Ell1 9B-178D
Z2-EU19-ll3
Z2-EU19-1258
7.2-EU19 -1 2.~C
Z2-EU19-125D
22-EUl ?B-173
7.2-Elll':IB-1 '2
Z2-EU19-ll3
Z2-EUl 9B• l 75
7.2-EU19R- 1i7
2 2-EUl ?B-186
22-EUl ?B-187
7.2-Etll':IB-1 88
Z2-EUl 98-183
2 2-EUl ?B-184
7.2-Elll':IB-18~
Z2-EU19-438
Z2-EU19-439
7.2-f.U19-442
Z 2-EU19-440
Z2-EU19-,Ml
7,2. f.U19-444
Z2-EU19-445
Z 2-EU19-4<16
7-2-f.019-4.B
Z 2-EU19-451
Z2-EU19-452
7.2-f.U1 9-4S4
Z 2-EU19-450
22-EUl ?B-470
7.2-EIJl':IB-4i2
Z2-EU19-447
Z2-EU19-4<18
'/.2-EU19B-4~7
2 2-EUl ?-4<13
22-EUl ?B-468
7.2-Elll':IB-4 58
Z2-EUl 98-459
22-EUl ?B-461
7.2-Elll':IB-41'0
22-EU l ?B-463
Z2-EUl 9-455
7.2-Elll!IR-4 71
2 2-EUl ?-456
Z2-EU19-457
7.2-ElJl':fB-464
i446l1.1
744607.l
744636.1
i446.14.I
i44627.0
74468-U
i446'>l.4
744607.1
744668.6
i4459I.0
744602.6
744617.0
i44644.6
744606.4
744624.9
i44640.I
744637.6
744627.9
i446.17.6
744598.6
7 ·14618.1
i44608.4
744627.9
744617.4
i44627.9
744588.9
744608.4
i44.~79. I
744637.6
744619.4
i4461U
744580.1
744598.6
i'4464i'
744569.4
744586.9
i'445S6
744593
741605
i'446(12
744605
744598.6
i'446o$
744618. l
7 ·1<1637.6
i'446H)
Coocdiniiles"
li8622.2
178636.7
178690.6
l i869J_l
178691.l
178633.2
178648.J
178636.7
178723.4
1786'>1 .2
178626.5
178626.5
178621.7
178666.9
178668.4
li867L1
178713.3
178696.4
178679.5
178679.S
178679.5
178662.6
178662.6
178662.6
li8628.9
178628.9
178628.9
178612.0
li8645.8
178626.6
17863.U
178645.8
178645.8
178654
178665.6
178656.4
178646
178648
178647
1186.,0
178637
l i8612.0
178619.7
178612.0
178612.0
178640
Su np\elnter>'al
0-10 ft
0-J ft 0-1 ft
0-1 ft.
0-1 ft
0-0.5 ft
0-05. ft
2-2.Sft
0-2 ft
0-0.5 ft
1.S-8.Sft
1.5-8.5 ft
U-8.:ift
2-S ft
2-8 .ft
2-8ft.
3-l0ft
3-l 0 ft
3-1 0 ft
3-J0ft
3-l0ft
.1-10ft
3-l 0 ft
3-J0ft
,1-15 0
3-J0ft
3-l S ft
.1·10ft
3- l0ft
2-J5ft
2-8ft.
3-l 0 ft
3- !0 ft
2-15ft
3-J0ft
2-15 ft
2-1 5 ft
2-JS ft
2-15ft
2-15ft
2-15 ft
3- l0 ft
2-1 5 1\
3-l l.8ft
3-l 0 ft
4 -1 :i ft
Mel.:lls TCLP Metals
00-.'li.t e l~lmratory ~n~ly!lll!li
PCB RAD TCLP S\'OC SVOC voe Cornmen b a ml notr.s

3-8
Dllle. SlllllJlled
10/10/18
10/15118
I OIISi lS
10/16/18
711&1!9
7122'19
7/2J IJ 9
7,'24./19
7124/19
7124/19
7125.119
7125/ 19
7129.f\9
7129/19
7130/19
if.l0/19
7/30,/19
7(30/19
71.10!19
7130/!9
7(31/19
7131.11 9
7131/ 19
7131! !9
1f.l2i2i)
l/23120
1123/20
7118/94
7118/94
111&194
7118/9'1
7/18/94
711&194
8/25/94
8f25/9'1
8125/94
8125/94
8/25/94
8f25!94
8i26/9'1
8(26/94
&126.194
8/2619'1
8/26/94
8126/94
S11mple h JCllliOH
'l.2-EIJl':IB-469
Z2-EU19B-4G2
Z2-EUl 9B-466
7.2-EUl ':IB-46~
Z2-EU19-70S
Z2-EUI 9-707
7.2-flJ19-709
Z2-EU19-706
Z2-EUl 9B-721
'/.2-EU19B- 722
Z2-EU19-702
Z2-EUl9B-7l4
7.2-f.Ul 9-701
Z2-EUl 9B-723
Z2-EU19-703
7-2-flJ19-705
Z2-EUl 9B-713
Z2-EUl 9B-7 14
'/.2-Elll':ffl. 71~
Z2-EUl 9B-716
Z2-EU1 9-710
7.2-Elll':IB-117
Z2-EUl 9B- 718
Z2-EU l 9B-719
7,2-E lJ 19B-717A
Z2-E U19B-717B
Z2-EUl 9B-7l iC
RADIO!
RADI07
RADl l '.5
RADl16
RAD117
RADl18
RADI06
RADI09
RADt \0
RADI I I
RADI I:?
RADl l3
RADIOO
RADl20
RADl21
RADl24
IW."'2
RAD93
i44607.2
744603
74-1628
744615
744687.0
744680.7
i44517.6
744617.4
744Y75.6
i44580.7
744595.5
7445-17.1
i44640.9
744544.0
744605.5
i4460.~.8
744538.8
74455 1.l
i 44550. I
744566.9
7 ·14594.4
i4458U
744594.0
744597.8
i44586.3
744584.7
744579.3
Coocdi1111les"
IWZ2-19111~1CM"kal Sample Loa tloiu
i ·M586A
744586.4
744644.2
; ,14635.5
7-14634.3
7446'.27.3
7,14641.4
74461 7.6
744621.l
7,14633.4
744626.l
744634 .8
7,14645,1
7-14632.3
744632.6
7,!4636.3
7-1462•1.J
744598.8
1i86J7.HI
178642
178649
178650
178629.4
178734.1
l i8S':f5.)
178626.6
178633.0
744.~80.7
178643.6
178672.9
li86;2.4
178677.4
1786"4.4
l i863L~
178674 .l
178682.4
lin662.8
178665.S
178642.l
I 78740.5
178739.0
178732.9
178745.3
178738-3
178745.0
1786'16.4
178667.6
178689.8
178691.j
1786923
178691-7
178673.4
178673.J
178673.9
178675.4
178674 .7
178681.1
1786'19.0
1787283
1787'.28.4
178750.l
li86J5.4
178633.9
Su nple lnter>';il
4-15 ft
2-JSft
2-15ft
2-1 5ft
14-24 ft
2-J3.5ft
l 7-47 n
0-28ft
0-15ft
0.15 ft
0-J0ft
0-14.Sft
O..l7 .. lfl
0- !0 ft
0-9.4 ft
0-21-90
0-1 ft
0-1 ft
0-1 ft.
0-1 ft
13.9-20 .75 ft
0.1 ft
0-1 ft
0-1 ft
0-1 ft.
0-J ft
0-1 ft
Surface soil 0--0.S ft
Sl.lrfa..:e soil0--0.S ft
Surface soil 0-05 n
Surfacesoil o-o.s ft
Surface soil0--0.S ft
Sort'.icc soil 0-0.S n
Sl.lrfa..:c soil 0--0.S ft
surface soilo-o.s ft
Sorfaccsoil O.Q.S J\
Surface soil 0--0.S ft
Sl.lrfa..:c soil 0-0.5 ft
Sort11.cc 1>1Jil 0-05 n
surface soil 0-0.5 ft
Surface soil0-0.S ft
Sortltce soil 0-0.5 n
Sl.lrfaccooil 0-0.5 ft
Surface soil 0-0.5 ft
Sortltcc soil 0.0.5 n
Mel.:l ls TC LP Mel11ls
00-.'li.t e l~lmn tory ~n~ty-
PCB RAD TCLP S\'OC SVOC voe Commen b ll ml no tr.s
TCE lnVt>'ligatioo
TCEltive.1igatioo
Tffilnve~.iga1.i1111
TCE Inve,1.ig11ioo
TCE Inve,tigatioo
TCE lnvest.igaJ.ioo
TCE Inve;,igatioo
TCE l11vc;d.iga1i1111
TCE Invc.Sliga!ioo
K-25 Radiation $\lr'.'cy
K-25 Radiation Survey
K-25 Radialh:.'fl Survey
K-25 Radiation Survey
K-25 RadiationSi.lr'.'cy
K-'.25 Radiatiun Survey
K-25 Radiation Survey
K-25 Radiation Survg:
K-25 Radiati('fl Survey
K-25 Radiation $\Jr,•~·
K-25 Radiation Si.1rvcy
K-'.25 R.9Jialion Survey
K-25 Radiation sur.•~· K-25 Radiation $\lr','C)"
K-'.25 Radiatiun Survey
K-25 Radiation Si.lr'.'C}"
K-25 Radiation S\lr'.'g.·
K-25Radfath:.'fi&lrvey

3-9
Diile.HmJiled
8/26/94
8126.194
8126/94
8126/94
8126/94
913/94
7/121,;,_~
'.l /12/9.'i
7113195
7113.195
7114195
1114195
7(171,;,:'i
10/23.'95
10/23195
10123195
10123195
10/23!95
10/23-'95
1()123195
10/23195
10/23195
10/23-'95
10/28-'04
Siimple luciilion
RAl)94
R.'°95
R.'°97
RA[)98
R.'°99
RADll9
ST04
ST0S
STO)
ST06
ST02
ST05
ST0l
KAJ-SS-S1 1
KAJ-SS-S12
KAJ-SS-S2 1
KAJ -SS--S31
KAJ-SS-541
KAJ-SS--S5l
KAJ-SS-S6!
KAJ.SS-562
KAJ -SS--S71
KAJ -SS--S72
PCC-SS5
"Coord/notrs ctr i.'I Trnnrssrr stotir p.tonir mr tirr,
EU = hposureUnit
PCS= potychlori~ted blpt,enyl
i44596.8
744595.9
74.16-17
i44.,94.8
744595.5
744652.0
i4458 l.8
i 44.'i64.8
744574.3
744616.
i 44585.0
i44541.i
7446025
744543.7
744579.7
7·M5?1.7
7H60U
744616.7
7•11161 1.6
i -145?0.8
744552.6
i •M.'i.H.6
7441!19.8
744523.7
RAD= radionudid• axcapt w han u,:ad in a ~ample location nama
SVOC = ~ millobitila orea nie eompound
VOC = volatile organic: compound
Coocdiniiles"
l i8635.0
178637.2
178646
178642.8
178643.2
178700.5
178662-1
178669.1
li8645.8
178621.4
178648.2
178679.6
178650.i
179271.1
179228.6
179157.1
17?0"5.6
178896.9
1787S1.5
1786%.5
178677.7
178633.5
178614 .3
li9259.8
Sunp\e lnter>'al
Surface !'Oil 0-05 n
Surface soiJ0-0.5 ft
Surface soil 0-0.5 ft
S.urfacc !'flil O-O.Sn
Surface soi! 0-0.5 ft
Surface soiJ0-0.5 ft
1-9fl
4-8 ft.
6-8 1t
0-6 1t
6-8 fl
0-2 ft.
0-8 fl.
Sut11icc soil 0-0.5 n
Surlltcc soil 0 -0.SJ\
Surface 50il 0-Qj ft
Surfa..:e 50jJO-O . .'i ft
Surlltcc wil 0 -0 . .'i n
Su1fa..:c soil o -o..s ft
Surfa..:c 50iJO.(lj ft
Surfacc soil O-O.S J\
Surfa..:e 50iJO--O..'i ft
Surfa..:c roil0-0.5 ft
0-1 It
Mel.:lls TC LP Metals
00-.'li.t e l~lmratory ~n~ly!lll!li
PCB RAD TCLP S\'OC SVOC voe Cornmenbaml notr.s
K-25 Radialion Survey
K-25 Radiation SUrvey
K-2.'i Radiation Sur\'cy
K-2.'i Radialion Survey
K-25 Radiation Sur\'cy
K -25 Radiation SUf\'CY
K-14HJ r:xt.erior (,11an.d ai1.2tion a11d Site
K-1410 Bxtcrior l-"hncta ir.itioo and Site K-1410 Exterit.- Chanictcriiaiion and Site
K-1410 E:dcrioc ai:ar:iictai.::Atio11 ai1d Site
K-14Hl Extcrioc a1 anidaiZ21 ior1 aitd Site
J.: -1410 Exterior C11an.d a-iralior1 311d Site
K -1410 f:xtcrior Ch:iradai1.atio11 a11d S ite
K-1410 Extcril'I" Chanicterization ai1d Site K-25 RaJiological Sur\·cy Phast D
K-25 Radiological Sur,cy Phase II
K-25 Radiologi..:al Sur-..cy Phase II
K-2.'i RaJiuk'!iC~l Suf\'C)' Ph ast Il
K-25 Radiologi..:al sur••cy Phase ll
K-25 Radiologi..:al Su.r,cy Phase 11
K-25 R.aJiological Sun.·ey P11ast Il
K-2.'i Radiologi..:al Sur.cy Phase ll
K-25 Radiologi..:al $1.1r,;cy Phase II
K-25 Sitcwidc Reshkiid Cootamh1alio11

3-10
This page intentionally left blank.

EU-19 DATA SUMMARY TABLES

4-2
This page intentionally left blank.
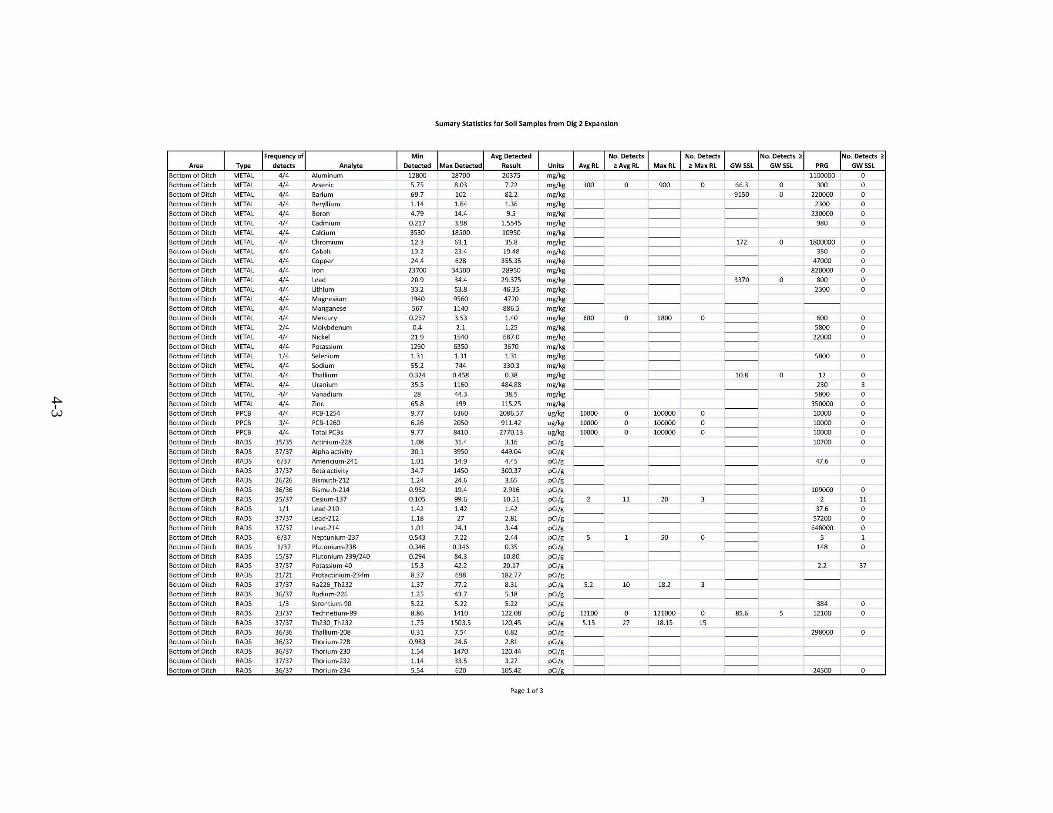
4-3
Sumary Statistics for Soil Samples from Dig 2 Expansion
Frequency of Min Avg Detected No. Detects No. Detects No. Detects 2: lNo. Detects 2: Area Type detects Analyte Detected Ma1t Detected Result Units AvgRL 2: Avg RL Max RL 2: Max RL GWSSL GW SSL PRG GWSSL
Bottom of Ditch METAL 4/4 Aluminum 12800 28700 20375 mg/kg 1100000 Bottom of Ditch METAL 4/4 Arsenic 5.75 8.03 7.22 mg/kg 300 0 900 0 66.3 0 300
Bottom of Ditch METAL 4/4 Barium 69.7 102 82.2 mg/kg 9150 0 220000 Bottom of Ditch METAL 4/4 Beryllium 1.14 1.64 1.36 mg/kg ---- 2300 Bottom of Ditch METAL 4/4 Boron 4 .79 14.4 9.5 mg/kg ---- 230000 Bottom of Ditch METAL 4/4 cadmium 0 .217 3.98 l.5S45 mg/kg - --- I 980 Bottom of Ditch METAL 4/4 calcium 3530 18 500 10950 mg/kg
---1·
Bottom of Ditch METAL 4/4 Chromium 12.3 63.1 35.8 mg/kg ------i"
172 0 1800000 Bottom of Ditch METAL 4/4 Cobalt 13.2 23.4 l'J.48 mg/kg --- --- 350 Bottom of Ditch METAL 4/4 Copper 24.4 628 355.35 mg/kg --- I --- 47000 Bottom of Ditch METAL 4/4 Iron 23700 34500 28950 mg/kg I 820000 Bottom of Ditch METAL 4/4 Lead 20.9 34.4 29.375 mg/kg ---- r-----1- 3370 0 800 Bottom of Ditch METAL 4/4 Lithium 33.2 53.8 46.35 mg/kg 2300 Bottom of Ditch METAL 4/4 Magnesium 1940 9560 4720 mg/kg Bottom of Ditch METAL 4/4 Manganese 567 1140 886.5 mg/kg Bottom of Ditch METAL 4/4 Mercury 0 .267 3.53 1.40 mg/kg 600 0 1800 0 600
Bottom of Ditch METAL 2/4 Molybdenum 0.4 2.1 1.25 mg/kg --- --- ---- 5800 Bottom of Ditch METAL 4/4 Nickel 21.9 1S40 687.0 mg/kg --- ---- --- 22000 Bottom of Ditch METAL 4/4 Potassium 1260 6350 3670 mg/kg --- ---- ---Bottom of Ditch METAL 1/4 Selenium 1.31 1.31 1.31 mg/kg 5800 ----Bottom of Ditch METAL 4/4 Sodium 55.2 744 330.3 mg/kg I
----Bottom of Ditch METAL 4/4 Thc111ium 0 .324 0.458 0 .38 mg/kg ---- I 10.8 0 12 Bottom of Ditch METAL 4/4 Urnnium 35.5 1160 484.88 mg/kg
~ .-230 ----
Bottom of Ditch METAL 4/4 Vanadium 28 44.3 38.5 mg/kg 5800 --- ----Bottom of Ditch METAL 4/4 Zinc 65.8 199 115.25 mg/kg ---- 350000 Bottom of Ditch PPCB 4/4 PCB-1254 9 .77 6360 2086.57 ug/kg 10000 0 100000 0 ---- 10000 Bottom of Ditch PPCB 3/4 PCB-1260 6.26 2050 911.42 ug/kg 10000 0 100000 0 10000 Bottom of Ditch PPCB 4/4 Total PCBs 9.77 8410 2770.13 ug/kg 10000 0 100000 0 --- 10000 Bottom of Ditch RAOS 35/35 Actinium-228 1.08 31.4 3.16 pCi/g ---- 10700 Bottom of Ditch RADS 37/37 Alpha activity 30.1 3950 449.04 pCi/g Bottom of Ditch RADS 6/37 Americium-241 l.Dl 14.9 4.45 pCi/g I 47.6 Bottom of Ditch RADS 37/37 Beta activi ty 34.7 1450 300.37 pCi/g Bottom of Ditch RADS 26/26 Bismuth-212 1.24 24.6 3.65 pCi/g Bottom of Ditch RADS 36/36 Bismuth-214 0 .962 19.4 2.916 pCi/g 109000 Bottom of Ditch RADS 25/37 Cesium-137 0 .105 99.6 10.51 pCi/g 2 11 20 3 - --- 2 11 Bottom of Ditch RADS 1/ 1 Lead-210 1.42 1.42 1.42 pCi/ g 37 .6 Bottom of Ditch RADS 37/37 Lead-212 1.18 27 2.81 pCi/g 57200 Bottom of Ditch RADS 37/37 Lead-214 1.01 24.1 3.44 pCi/g --- 648000 Bottom of Ditch RADS 6/37 Neptunium-237 0 .543 7.22 2.44 pCi/g 5 1 so 0 --- 5 Bottom of Ditch RADS 1/37 Plutonium-238 0.346 0.346 0 .35 pCi/g ---- 148 Bottom of Ditch RADS 15/37 Plutonium-239/240 0.294 84.3 10.80 pCi/g ---- - --- ----Bottom of Ditch RADS 37/37 Potassium-40 15.3 42.2 20.17 pCi/g 2.2 37 Bottom of Ditch RADS 21/21 Protactinium-234m 8 .37 698 182.77 pCi/g Bottom of Ditch RADS 37/37 Ra226_Th232 1.37 77.2 8 .31 pCi/g 5.2 10 18 .2 Bottom of Ditch RADS 36/37 Radium-226 1.25 43.7 S.lB pCi/g Bottom of Ditch RADS 1/3 Strontium-90 5.22 5.22 5.22 pCi/g 384 Bottom of Ditch RADS 23/37 Technetium-99 8 .86 1410 122.08 pCi/g 12100 0 121000 0 85.6 5 12100 Bottom of Ditch RADS 37/37 Th230_ Th232 1.75 1503.5 120.45 pCi/g S.15 27 18.15 15 - - -Bottom of Ditch RADS 36/36 Thallium-208 0 .31 7.54 0 .82 pCi/g 298000 Bottom of Ditch RADS 36/37 Thorium-228 0 .983 24 .6 2.81 pCi/g Bottom of Ditch RADS 36/37 Thorium-230 1.54 1470 120.44 pCi/g Bottom of Ditch RADS 37/37 Thorium-232 1.14 33.5 3.27 pCi/g Bottom of Ditch RADS 36/37 Thorium-234 5.54 620 105.42 ecv~ >-;·
24500
Pc1ge 1 of 3

4-4
Sumary Statistics for Soil Samples from Dig 2 Expansion
Frequency of Min Avg Detected No. Detects No. Detects No. Detects 2: lNo. Detects 2: Area Type detects Analyte Detected Ma1t Detected Result Units AvgRL 2: Avg RL Max RL 2: Max RL GWSSL GW SSL PRG GWSSL
Bottom of Ditch RADS 37/37 Uranium-234 5.26 638 111.00 pCi/g 700 0 7000 0 61.1 14 700 Bottom of Ditch RADS 2/3 Uranium-235 7.93 21.4 14.67 pCi/g 8 1 80 0 61.1 0 Bottom of Ditch RADS 32/37 Uranium-235/236 0.327 S4.2 8.68 pCi/g Bottom of Ditch RADS 37/37 Uranium-238 6.07 62S 113.31 pCi/g so 17 soo 2 61.1 14 50 17 Bottom of Ditch SVOA 1/3 Acenaphthene 114 114 114 ug/kg 45000000 Bottom of Ditch SVOA 1/3 Anthracene 204 204 204 ug/kg - --- ---- 230000000 Bottom of Ditch SVOA 2/3 Benz(a)anthracene 45.5 502 273.75 ug/kg
---1· 210000
Bottom of Ditch SVOA 1/3 Benzo(a)pyrene 4S7 457 457 ug/kg ------i"
--- 21000 Bottom of Ditch SVOA 1/3 Benzo(b)fluoranthene 658 658 658 ug/kg --- ---- 210000 Bottom of Ditch SVOA 1/3 Benzo(ghi)perylene 274 274 274 ug/kg --- I ---Bottom of Ditch SVOA 1/3 Benzo(k)fluoranthene 180 180 180 ug/kg I 2100000 Bottom of Ditch SVOA 1/3 Carbazole 113 113 113 ug/kg Bottom of Ditch SVOA 1/3 Chiysene 432 432 432 ug/kg ---- ~ - --- - 21000000 Bottom of Ditch SVOA 1/3 Dibenz(a,h)anthracene 67.1 67.1 67.1 ug/k8 21000 Bottom of Ditch SVOA 2/3 Fluoranthene 59.3 1070 564.65 ug/k8 ---- I ---- 30000000 Bottom of Ditch SVOA 1/3 Fluorene 103 103 103 ug/kg C 30000000 Bottom of Ditch SVOA 1/3 lndeno( 1,2,3-cd)pyrene 323 323 323 ug/kg ---- I ---- 210000 Bottom of Ditch SVOA 1/3 Phenanthrene 979 979 979 ug/kg ---
---1· ---
Bottom of Ditch SVOA 2/3 Pyrene 46.9 1140 593.4S ug/kg --- ---- --- 23000000 Bottom of Ditch VOA 3/4 Acetone 17.7 32.3 24.4 ug/kg ---- ---- 670000000 Upper Ditch METAL 47/47 Aluminum 8460 44600 17405.11 mg/kg 1100000 Upper Ditch METAL 18/47 Antimony 0.362 S.22 1.24 mg/kg 144 0 470 Upper Ditch METAL 47/47 Arsenic 2.76 14 7.83 mg/kg 300 0 900 0 66.3 0 300
Upper Ditch METAL 47/47 Barium 30.2 689 91.50 mg/kg --- 91S0 0 220000 Upper Ditch METAL 45/47 Beryllium 0.32S 4.71 1.05 mg/kg 2300 Upper Ditch METAL 33/47 Boron 1.81 37.9 8.83 mg/kg ---- I ---- 230000 Upper Ditch METAL 45/47 cadmium 0.0244 34.1 1.40 mg/kg ---i" 980 Upper Ditch METAL 47/47 calcium 131 69600 8026.94 mg/kg ---i" ---
- - -Upper Ditch METAL 47/47 Chromium 11.9 1140 66.53 mg/kg ---- 172 3 1800000 Upper Ditch METAL 47/47 Cobalt 7.64 72.1 19.47 mg/kg I 3S0 Upper Ditch METAL 47/47 Copper 6.74 2180 300.78 mg/kg ___ I_ 47000 Upper Ditch METAL 47/47 Iron 17800 60400 30121.28 mg/kg I 820000 Upper Ditch METAL 47/47 Lead 10.7 18S0 84.03 mg/kg ~ - 3370 0 800 Upper Ditch METAL 47/47 Lithium 7.08 S79 42.10 mg/kg I 2300 Upper Ditch METAL 47/47 Magnesium 377 38 100 2969.87 mg/kg Upper Ditch METAL 47/47 Manganese 118 3750 1375.64 mg/kg Upper Ditch METAL 47/47 Mercury 0.0184 22.8 0 .68 mg/kg 600 0 1800 0 600 Upper Ditch METAL 35/47 Molybdenum 0.396 S8.2 4.75 mg/kg --- --- --- 5800 Upper Ditch METAL 47/47 Nickel 4.25 2S40 277.67 mg/kg 22000 Upper Ditch M ETAL 47/47 Potassium 396 31300 3198.19 mg/kg Upper Ditch METAL 11/47 Selenium 1.02 5.19 2.59 mg/kg ---- I ---- 5800 Upper Ditch METAL 12/47 Silver 0.285 57.6 7.30 mg/kg ----
~ - 5800 Upper Ditch METAL 4S/47 Sodium 8 .23 6840 382.8S mg/kg ----
~ i" Upper Ditch METAL 46/47 Thallium 0.18 1.6S 0.44 mg/kg ---- I 10.8 0 12 Upper Ditch METAL 47/47 Uranium 0.839 53800 2622.91 mg/kg ----
I 230 11 Upper Ditch METAL 46/47 Vanadium 8 .92 64.7 41.15 mg/kg --- --- ---- 5800 0 Upper Ditch METAL 47/47 Zinc 10.6 656 95.51 mg/kg 350000 Upper Ditch PPCB 1/47 PCB-1248 11.1 11.1 11.10 ug/kg 10000 0 100000 0 ---- 10000 Upper Ditch PPCB 28/47 PCB-12S4 5.12 324000 14941.79 ug/kg 10000 4 100000 1 ---- 10000 Upper Ditch PPCB 26/47 PCB-1260 4.37 102000 5180.25 ug/kg 10000 2 100000 1 ---- 10000 Upper Ditch PPCB 1/47 PCB-1268 16.2 16.2 16.20 ug/kg 10000 0 100000 0 ---- 10000 Upper Ditch PPCB 28/47 Total PCBs 9.49 426000 19752.99 ug/kg 10000 4 100000 1 ---- 10000 Upper Ditch RADS 40/40 Actinium-228 0.701 2590 97.97 eCi/ji 10700
Page 2 of 3

4-5
Sumary Statistics for Soil Samples from Dig 2 Expansion
Frequency of Min Avg Detected No. Detects No. Detects No. Detects 2: lNo. Detects 2: Area Type detects Analyte Detected Ma1t Detected Result Units AvgRL 2: Avg RL Max RL 2: Max RL GWSSL GW SSL PRG GWSSL
Upper Ditch RADS 46/47 Alpha activity 10.5 696000 19810.68 pCi/g ---Upper Ditch RADS 9/47 Americium-241 0.909 230 67.03 pCi/g 47 .6 Upper Ditch RADS 47/47 Betc1 c1ctivity lS.9 138000 4239.20 pCi/g Upper Ditch RADS 28/28 Bismuth-212 1.26 2810 139.41 pCi/g Upper Ditch RADS 41/41 Bismuth-214 0 .645 8180 242.26 pCi/g ---- 109000 Upper Ditch RADS 20/47 Cesium-137 0 .121 518 60.63 pCi/g 2 12 20 7 2 12 ----Upper Ditch RADS 6/6 Lead-210 1.79 1320 242.08 pCi/g --- --- 37.6 Upper Ditch RADS 43/43 Lead-212 0.941 2770 93.57 pCi/g --- --- --- 57200 Upper Ditch RADS 43/43 Lead-214 0.765 9230 259.36 pCi/g 648000 ----Upper Ditch RADS 10/47 Neptunium-237 1.28 197 38.79 pCi/g 5 6 50 2 5 ---Upper Ditch RADS 6/47 Plutonium-238 1.03 12.9 4.59 pCi/g 148 Upper Ditch RADS 13/47 Plutonium-239/240 1.38 3320 417.57 pCi/g Upper Ditch RADS 40/47 Potc1ssium-40 5.69 55.1 21.87 pCi/g 2.2 40
Upper Ditch RADS 2/2 Protc1ctinium-233 0.517 37.6 19.06 pCi/g Upper Ditch RADS 10/10 Protactinium-234m 89.3 28000 4417.03 pCi/g Upper Ditch RADS 47/47 Ra226_Th232 0 .677 15990 455.46 pCi/g 5.2 13 18.2 10 Upper Ditch RADS 47/47 Radium-226 0.677 12300 339.51 pCi/g Upper Ditch RADS 23/47 Technetium-99 8.18 22700 1320.03 pCi/g 12100 1 121000 0 85.6 11 12100 Upper Ditch RADS 43/43 Th230_ Th232 2.39 SS5690 15868.54 pCi/g S.15 22 18.15 12 ---Upper Ditch RADS 43/43 Thallium-208 0.268 847 29.09 pCi/g 298000 Upper Ditch RADS 41/47 Thorium-228 0.97 2370 90.18 pCi/g Upper Ditch RADS 43/47 Thorium-230 1.09 552000 15741.81 pCi/g Upper Ditch RADS 41/47 Thorium-232 1.18 3690 132.92 pCi/g Upper Ditch RADS 28/47 Thorium-234 2.08 16200 1106.59 pCi/g 24500 Upper Ditch RADS 46/47 Uranium-234 0.644 20500 812.96 pCi/g 700 5 7000 2 61.1 16 700 Upper Ditch RADS 6/6 Uranium-235 2.2 52.1 15.41 pCi/g 8 3 80 0 61.1 0 Upper Ditch RADS 21/47 Uranium-235/236 0 .781 1140 108.66 pCi/8 Upper Ditch RADS 46/47 Uranium-238 1.16 21300 845.25 pCi/g 50 16 500 7 61.1 15 50 16 Upper Ditch SVOA 1/9 Benz(a)anthracene 86.5 86.5 86.5 ug/kg 210000 Upper Ditch SVOA 1/9 Benzo(a)pyrene 58.1 58.1 58.1 ug/kg 21000 Upper Ditch SVOA 1/9 Benzo(b)fluoranthene 78.8 78.8 78.8 ug/kg I 210000
Upper Ditch SVOA 1/9 Bis(2-ethylhexyl)phthalate 143 143 143 ug/kg - r 2350000 0 1600000
Upper Ditch SVOA 1/9 Chrysene 59.4 59.4 59.4 ug/kg I 21000000 Upper Ditch SVOA 1/9 Fluoranthene 96.8 96.8 96.8 ug/kg --- - _ __ I_ 30000000 Upper Ditch SVOA 1/9 F>yrene 87.8 87 .8 8 7.8 ug/kg I 23000000 Upper Ditch VOA 1/9 1,1-Dichloroethene 5.24 5.24 5.24 ug/kg
---1· 1750 0 1000000
Upper Ditch VOA 1/9 1,2-Dichloroethane 0.429 0.429 0.43 ug/kg --- 729 0 20000 Upper Ditch VOA 1/9 Acetone 4.92 4.92 4.92 ug/k8 --- --- 670000000 Upper Ditch VOA 6/9 cis-1,2-Dich loroethene 1.29 3490 622.05 ug/k8 ---- I 2300000 Upper Ditch VOA 2/9 Tetrachloroethene 0.619 1.35 0.98 ug/k8 ----
- --1· 4720 0 390000
Upper Ditch VOA 1/9 Toluene 0.504 0.50 0.50 ug/kg ----~ - 502000 0 47000000
Upper Ditch VOA 3/9 trans-1,2-Dichloroethene 0.545 12.3 4.65 ug/kg ----~ i" 23000000
Upper Ditch VOA 6/9 Trichloroethene 0.726 39.3 9.27 ug/kg ---- I 1720 0 19000 Up.e_er Ditch VOA 1/9 Vinyl chloride 21.1 21.1 21.1 uR/kg I 176 0 17000
Page 3 of 3

4-6
This page intentionally left blank.

4-7
EU Z2-19 Data Summary 012920~!
N umber N umber of Number
Avg of detects detects PRG<7J N umber or detects Frequency Min Max detected Max :::Max Avg :::Avg (10-' or of detocls GW :::GW
Analyte of detect detcct0,3) delcctC!.>l result<>> RV'> RV>l RV6l RU>l HI=l ) > PRG<» SSLOO SSL~l Anions (m~/kl>I Fluoride 6/6 0.514 4.19 2.22 lnoreanics lm•l~o\ Aluminum 247/247 283 46200) 13199 1100000 0 Antimonv 46/247 0.314) 26.3 1.78 470 0 144 0 Arsenic 2451250 0.723J 62.91 7.92 900 0 300 0 300 0 66.3 0 Barium 250/250 0,285 841J 69.1 220000 0 9150 0 Bervllimn 237/247 0.19J 15,2 1.33 2300 0 Boron 168/247 l.lJ 37.9 5.57 230000 0 Cadmium 247/250 0.0229) 298 4.36 980 0 Calcium 246/246 147 307000 29299 Chromium 247/250 1.14 1140 3 1.6 1800000 0 172 4 Cobalt 247/247 0,198J 624 16.1 350 1 Coooer 246/247 6.2 2180 98,2 47000 0 Tron 2471247 1:160 R2100 '/.~090 R'/.0000 0 Lead 234/250 0.0119 22200) 143 800 2 3370 l Lithimn 247/247 2.49 579 3 1.8 2300 0 Magnesium 247/247 3 10 13 1000 7363 Manganese 247/247 70.5J 8910 973 26000 0 Mercurv 206/214 0.00419) 30 0,439 1800 0 600 0 600 0 Molvbdenum 222/247 0.261) 58.2 2.08 5800 0 Nickel 247/247 1.88 4300 134 22000 0 Potassium 247/247 )42 18500 1407 Selenitm1 118/249 0.551 12.9) 2.0 1 5800 0 Silver 89/250 0.l 12J 57.6 1.56 5800 0 Sodium 225/247 7.921 6840 136 Thnllium 201/246 0,156 4.65) 0.444 12 0 10,8 0 Uranilllfl 250/250 0.203 53800 861 230 46 Vanadium 246/247 5.94 8 l.4J 333 5800 0 Zinc 247/247 4.51 2530 125 350000 0 Polychlorlnaled blohem•h I uolk2) PCB-1016 0/ L64 100000 0 10000 0 10000 0 PCB-1221 0/ 164 100000 0 l0000 0 10000 0 PCB-1 232 0/ 164 100000 0 l0000 0 10000 0 PC B-1 242 O/ l64 100000 0 l0000 0 10000 0 PCB-I 248 5/ 164 50.6 )4800 4290 100000 0 10000 l 10000 I
1

4-8
EU ZZ-19 Data Summary 012920 (cont.)
Number Number of Number
Avg of detects detects PRG<7J N umber of detects Frequency Min Max detected Max :::Max Avg :::Mg (10·5 or of detects GW ::: GW
Analvte of detect detect<'•') delect-'•3> rewlt<3> RV'> RV<> RV"> RL<OJ Hl=Jl > PRG<OJ SSL(ll) SSLI'> PCB-1 254 106/164 2.691 324000 8264 100000 2 10000 15 10000 15 PCB-1 260 100/164 l. 73J 102000 1948 100000 1 10000 3 lOOOO 3 PCB-1262 0/143 100000 0 10000 0 10000 0 PCB-1 268 4/ l43 10.9 429 120 100000 0 10000 0 LOOOO 0 Total PCBs 116/164 173J 426000 9419 100000 2 ]0000 15 10000 LS Radlonuclides In< lie) Actin.ium-228 257/259 0.312 2590 15.8 10700 0 Aloha activitv 3481349 3.29 696000 3 l56 AmericitllTI-241 40/340 0.0436 230 22.1 47.3 5 Beta acti vi tv 348/349 2.621 138000 864 Bismuth-212 56159 115J 2810 70.7 531000 0 Bismuth-214 3031303 0.25 8180 32.6 109000 0 Cesium-137 1271341 0.0528 4060 56.1 20 2 1 2 44 2 44 Cobalt-60 0/341 0.483 0 CuritllTI-244 0/ 141 348 0 CuritllTI-247 0/2 Eurooium-152 0/2 0.574 0
Europium-154 0/2 0.697 0 Europium-I 55 0/2 52.6 0 Lead-210 919 1.25 1320 l62 37.6 2 Lead-212 3121312 0.1 43 2770 13.5 53400 0 Lead-214 313/313 0.21 9230 35.7 599000 0 Nepnmium-237 16/332 0.471 197 21.5 50 2 5 4 5 4 Niobimn-94 0/2 0.243 0 PlutonitllTI-238 8/332 0.429J 12.9 3.6 148 0 PlutonitllTI-239 57/332 0.0622) 3320 103 128 6 Plutonitll1l-24 l 1/ 141 0.887J 0.887) 0.887 l5300 0 Potassitm -40 337/34 1 0.772 56.7 22.2 2.2 320 Protactinirnn-234 2/2 2.59 20.8 11,7 ProtactiJiium-234m 98198 14.6 28000 1270 l .51E+08 0 Ra/Th decay series0>> 3401341 0 555687 1980 15 35 5 52 Radium-226<10J 323/341 0.22 12300 49.4 Strontimn-90 10/144 0.936 125 16.8 384 0 Technetium-99 66/347 204 22700 461 12 1000 0 12100 I l2100 1 85.6 15 Thallium-208 263/263 0.0702 847 4.8 298000 0 ThoritllTI-228<10> 3091341 0.225 2370 12.6 Thorium-230<10> 3351341 0.27 552000 1994 Thoritun-2320°> 315134 1 0.274 3690 18.5
7

4-9
EU ZZ-19 Data Summary 012920 (cont.)
Number Number of Number
Avg of detects detects PRG<7J N umber of detects Frequency Min Max detected Max :::Max Avg :::Mg (10·5 or of detects GW ::: GW
Analvte of detect detect<'•') delect-'•3> rewlt<3> RV'> RV<> RV"> RL<OJ Hl=Jl > PRG<OJ SSL(ll) SSLI'> Thorium-234 253/341 0.889 16200 360 24500 0 Uranimn-234 37 1/374 0.46 57300) 448 7000 6 700 19 700 19 6 1.1 9 1 Uranium-235 198/413 0.249 4250) 65.6 80 16 8 72 8 72 6 1.1 20 Uranium-238 373/376 0.396 2 1300 285 500 22 50 86 50 86 6 1.1 74 Sem1'•olal1Je oreanlc comoounds ( 110/k a \
I 2 4-Trichlorobenzene 0/120 260000 0 1,2-Dichlorobenzene 0/120 9300000 0 1, 3-Dichlorobenzene 0/ 120 1, 4-Dichloroben:zene 0/ 186 110000 0 2,3,4,6-Tetrachlorophenol 0/ 120 25000000 0 2, 4,5-Trichlorophenol 0/120 82000000 0 2 4.6-Trich!oroohenol 0/120 820000 0 2,4-Dichloroohenol 0/120 2500000 0 2, 4-Dimethyl phenol 0/ 120 16000000 0 2, 4-Dinitroohenol 0/ 119 1600000 0 2,4-Dinitrotoluene 0/ 120 74000 0 2,6-Dinitrotoluene 0/ 120 15000 0
2-Q\loronaphthalene 0/120 60000000 0 2-Chlorovhenol 0/ 120 5800000 0 2- l\fothvl-4,6-dinitrouhenol 0/ 120 66000 0 2-Methv!naphthalene 10/120 14.4) 120) 39.3 3000000 0 2-Methvlohenol 0/ 120 4 1000000 0 2-Nitrobenzenamine 0/ 120 8000000 0 2-Nitrophenol 0/ 120 3,3' -Dichlorobenzidine 0/ 116 5 1000 0 3-Nitrobenzenamine 0/120 4-Bromophenyl phenyl ether 0/ 120 4-Chloro-3-methvluhenol 0/ 120 82000000 0 4-Chlorobenzenami.ne 0/ 120 110000 0 4-a\lorophenyl phenyl ether 0/ 120 4-Nitrobenzenamine 0/ 120 1100000 0 4-Nitroohenol 0/120 Acenaohthene 6/ 120 14.9J 764J 196 45000000 0 Acenaohthvlene 5/ 120 14) l 76J 54.1 Aniline 0/ 120 4000000 0 Anthracene 10/120 138J 4490 570 2.3E+08 0
~

4-10
EU ZZ-19 Data Summary 012920 (cont.)
Number Number of Number
Avg of detects detects PRG<7J N umber of detects Frequency Min Max detected Max :::Max Avg :::Mg (10·5 or of detects GW ::: GW
Analvte of detect detect<'•') delect-'•3> rewlt<3> RV'> RV<> RV"> RL<OJ Hl=Jl > PRG<OJ SSL(ll) SSLI'> Benz(a)anthracene 35/116 13.3J 81100 252 1 2LOOOO 0 Benzenemethanol O/ l20 82000000 0 Benzo(aJpyrene 31/1 18 16.1 J 70400) 2513 21000 1 Benzo(b) fl uoranthene 32/1 18 15.5) 114000) 3907 2 10000 0 Benzo(ghj)om1ene 35/120 18 7) 27100) 1369 Benzo(k)fluoranthene 21/118 15.3J 37000) 1925 2100000 0 Benzoic acid 0/119 3.3E+09 0 Bis(2-chloroetho>.'V)methane 0/120 2500000 0 Bis(2-chloroethyl) ether 0/120 10000 0 Bis(2-chloroisopropyl) ether 0/120 47000000 0 Bis(2-ethvlhe>.-vn ohthalate 6/ l 16 15.3J 1080 223 1600000 0 2350000 0 Butyl benzvl phthalate 1/ l 16 12.8) 12.8] 12.8 I 2000000 0 Carbazole 10/120 19.3J 3500 506 CIU'VSene 32/116 12.6J 69100 2395 21000000 0 Dibenz( a.h )anthracene 16/120 26.8J 97S0J 131S 21000 0 Dibenzofuran 1/120 166) 166) 166 1000000 0 Diethvl ohthalate l/l20 15.6J 15.6] 15.6 6.6E+08 0 Dimethvl ohthala1e l/ l20 239) 239] 239 Di-n-octylphthalate 0/118 8200000 0 Diohenvlamine 0/120 82000000 0 Fluoranthene 39/120 13.2J 86100 2497 30000000 0 Fluorene 6/120 16.7J 913J 320 30000000 0 Hexachlorobenzene O/l20 9600 0 Hexachlorobutadiene O/ l20 53000 0 Hexachlorocvclooentadiene 0/ L 19 7500 0 Hexachloroethane 0/120 80000 0 lndeno( 1,2 ,3-cd)ovrene 27/120 15) 35300) 1856 2LOOOO 0 lsoPhorone 3/ l20 730 1660 1307 24000000 0 m+o Meth~iohenol O/ l20 Naphthalene 9/ l20 16.7J 620 108 170000 0 Nitrobenzene O/ L20 220000 0 N-Nitrose>-di-n-oroo\'lamine O/ l20 3300 0 PentachJoroPhenol 0/120 40000 0 Phenantlu-ene 30/120 13.8J 14500 708 Phenol 1/120 149) 149J 149 2.5E+08 0
4

4-11
EU ZZ-19 Data Summary 012920 (cont.)
N umber N umber of N umber
Avg of detects detects PRG<7J N umber of detects Frequency Min Max detected Max :::Max Avg :::Mg (10·5 or of detects GW ::: GW
Analvte of detect detect<'•') delect-'•3> rewlt<3> RV '> RV<> RV"> RL<OJ Hl=Jl > PRG<OJ SSL(ll) SSLI'> Pvrene 38/ 116 12.5J 135000 3842 23000000 0 Pvridine 2/ l20 3691 556 462 1200000 0 Volatile or~~nic compounds (umk.•\ I, I, I -Trichloroethane O/ L91 36000000 0 97900 0 I, I J,2-Tetrachloroethane O/l90 27000 0 I I 2-TrichloroeUiane O/ L91 6300 0 1370 0 I, 1-Dichloroethane l/L91 0.596 0.596 0.596 160000 0 I, 1-Dichloroethene 2/ l91 0.958 1.2 1.08 1000000 0 1750 0 1,2-Dichloroethane 0/ 191 20000 0 729 0 1,2-Dichloroorooone 0/ 191 66000 0 2-Butanone 16/ 191 U3 19.I J 4.7 l.9E+08 0 2-Hexanone 0/ 191 1300000 0 4-1\fothvl-2-oentanone 0/ 191 1.4E+08 0 Acetone 86/ 191 1.75 279J 13.9 6.7E+08 0 Benzene 4/ l91 0.314 0.834 059 [ 5 1000 0 11 50 0 Bromodichloromethane 0/ 191 13000 0 Bromofonn 0/ 191 860000 0 BromomeU1ane 0/ 191 30000 0 Carbon disulfide 2/ L91 4.<19 7,061 5.78 3500000 0 Carbon tetrachloride O/ l 91 29000 0 2770 0 Chlorobenzene O/ l91 1300000 0 Chloroetbane 0/ 191 57000000 0 Chlorofonn 0/ 191 14000 0 1230 0 Chloromethane 0/ 191 460000 0 cis- 1,2-Dichloroethene 40/191 0.396 175 18.8 2300000 0 cis-1,3-Dicltloroorovene 0/190 Dibromochlorometbane O/ l91 390000 0 Et.hvlbenzene 3/ l91 0.767 1.37 1.08 250000 0 Methvlene chloride 7/ 191 2.9 6.13 4 3200000 0 241 0 Styrene 0/ 190 35000000 0 Tetrachloroethene 28/ 191 0.396 54.7 10.3 390000 0 4720 0 Toluene 19/ 191 0.422 18.6 2.29 47000000 0 502000 0
Total Xvlene 2/ 191 2.65 5.51 4.08 2500000 0 trans- 1,2-Dichloroethene 13/1 91 0.433 62.1 10.2 23000000 0 trans- 1,3-Dichlorovropene 0/ 191 T,ichloroethene 43/ 191 0.475 45.6 5 19000 0 1720 0 Vinyl chloride 18/ 191 0.5 52.4 10.4 17000 0 176 0
'i

4-12
EU ZZ-19 Data Summary 012920 (cont.)
Number Number of Number
Avg of detects detects PRG<7J N umber of detects Frequency I Min I Max I detected Max :::Max Avg :::A,·g (10·5 or ofdetects GW ::: GW
Analvte I of detect detect<'•'> delect",3> rewlt<3> RV'> RV"> RV"> RV"> Hl=ll :> PRG<5J SSL(ll) SSLI'> cnstations in summary include Z2-EU19-101, Z2-EUl9-102. Z2-EU19-103. Z2-EU19-104. Z2-EU19-105, Z2-EU19-106, Z2-EU19-107. Z2-EUl9-108, Z2-EU19-109. Z2-EU19-l 10, Z2-EU19-l 11 , Z2-EU19-l 12, Z2-EU19-l 13, 22-EU19-l 14, 22-EU19-l 15, 22-EU19-l 16, Z2-EU19-l 17, Z2-EU19-l 18, Z2-EU19-l 19, Z2-EUL9-l20, Z2-EU19-121, 22-EUL9-122, Z2-EU19-123, Z2-EU19-124, 22-EUI 9-125, 22-EUI 9-182, 22-EUJ9-400, Z2-EU19-401, 22-EU I 9-402, Z2-EUI 9-403, Z2-EUI 9-404, 22-EUI 9-405, 22-EU l9-406, 22-EUJ 9-407, 22-EUI 9-408, 22-EUI 9-409, Z2-EU19-410, Z2-EU19-411, 22-EUI 9-412, Z2-EU19-413, Z2-EUI 9-414, Z2-EUt 9-415. Z2-EU19-416. Z2-EU19-4I i . Z2-EU19-418. Z2-EU19-419. 22-EUI 9-420, Z2-EUI 9-421, Z2-EU19-422, Z2-EU19-423, 22-EUI 9-424, Z2-EUL9-425, Z2-EUL9-426, Z2-EU L9-427, Z2-EU L9-42S, 22-EUI 9-429, 22-ll.UI 9-430, Z2-EUI 9-431, Z2-EUI9-432, Z2-EUI9-433, Z2-EU19-434, Z2-EU19-43 7, 22-EUI 9-438, 22-EUl 9-439, 22-EUl 9-440, 22-EU19-44 l , 22-EUJ 9-442, Z2-EU19-443, 22-EUJ 9-444, 22-EUJ 9-445, 22-EUI 9-446, 22-EUI 9-447, 22-EU I 9-448, 2 2-EUI 9-450, 22-EUI 9-451. Z2-EU19-452. Z2-EU19-453, Z2-EU19-454, Z2-EU19-4SS, Z2-EUl9al56, Z2-EU19-457, Z2-EU19-701, Z2-EU19-702, Z2-EU19-703, Z2-EU19-705, Z2-EU19-706, Z2-EU19-707, Z2-EU19-708, Z2-EUJ9-709, Z2-EU19 •710, Z2-EU198-126, Z2-EU19B-l27, Z2-EU19B-128, Z2-EU198-129, Z2-EU19B-130, Z2-EUJ98-131, Z2-EUJ98-132, Z2-EUJ98-l33, Z2 -EUl 9B-134, Z2-EU198-135, Z2-EU198-136. Z2-EU19B-137, Z2-EU19B-138, Z2-EU19B-l 39, Z2-EU19B-140, Z2-EUl9B-141, Z2-EU19B-142, Z2-EUl 9B-143, Z2-EU19B-144, 22-EUl 9B-145. Z2-EUl9B-146, Z2-EU19B-147, Z2-EU19B-148, Z2-EUl9B-149. Z2-EUl9B-150, Z2-EUl9B-151, Z2-EU19B-152, Z2-EUl9B-153, Z2-EUl9B-154. Z2-EUl9B-155, Z2-EU19B-l 55A, Z2-EU19B-155B, Z2-EU19B-1 55C, 22-EU19B-155D, Z2-EU19B-156, Z2-EU19B-1 57, Z2-EU19B-158, Z2-EU19B-159, Z2-EU19B-160, Z2-EU19B-1 61, Z2-EU19B-1 62, Z2-EU19B-163, 22-EUI 9B-164, Z2-EU19B-165, Z2-EU19B-166, 22-EU19B-167, 22-EUI 9B-167A, Z2-EU19B-167B, Z2-EUI 9B-167C, 22-EUI 9B-167D, 22-EUI 9B-168, 22-EUl 9B-168A, Z2-EU19B-168B, 22-EUl 98-168C, Z2-EU19B-l6SC-l, Z2-EU198-168C-2, Z2-EU198-J6SC-3, Z2-EU198-168D, Z2-EUI98-169, Z2-EU19B -l 70, Z2-EU198-l 72, Z2-EU198-J 73, 22-EUI 913-175, 22-EUJ 98-177, Z2-EUI98-l 7SA. Z2-EU198-l 788, Z2-EU198 -1 7SC, Z2-EU198 -J 78D, Z2-EUJ9B-I83, Z2-EU198-184, Z2-EU198-J85. Z2-EU198-l 86, Z2-EUl98-l87, Z2-EU198-IS8, Z2-EUl9B-301. Z2-EUl9B-302, Z2-EU19B-303, Z2-filll9B-304. Z2-EUl 9B-30S, Z2-EUl9B-438. Z2-EU19B-45S, Z2-EU19B-4S9, Z2-EU19B-460. Z2-EU19B-461. Z2-EU19B-462. Z2-EU19B-463, Z2-EU19B-464, Z2-EU19B-46S, Z2-filll9B-466. Z2-EU19B-467, 22-EUJ 9B-468, Z2-EU19B-469, Z2-EU19B-470, Z2-EU19B-471. Z2-EUl 9B-4 72. Z2-EU19B-60I. 22-EUl 9B-602, 22· EU19B-603, Z2-EU19B-604, Z2-EU19B-605, Z2-EUl9B-606, Z2-EUl9B-607, Z2-EU19B-608. Z2-EUJ9B-609, 22-EUl 9B-610, Z2-EUl 9B-61 l , Z2-EU19B-612. Z2-EUl 9B-713, Z2-EUl9B-714, Z2-EU19B-715, Z2-EU19B-716, Z2-EU19B-717, Z2-EU19B-71 S, 22-EUl 98-719, Z2-EU19B-721. Z2-EU19B-722. Z2-EU19B-723, and 22-EU19B-724.
(}')The "1' validation qualifier means that the analyte was positively identified and the result is the approximate concentration in the sample.
CllJ31anks indicate thaJ the ana.l>tc was not ddcctc:d.
C•>i.1:ix RL values are preoented; blanks indicate tl,at there is no Ma.x RL for tl,c anal~te. Max RLs are from Zone 2 ROD Table 2.13 except for technctium-99 whidl is presented in Zone 2 RDR/RAWP Sect. 3.1.2.
c»slanks indicate that tlle criterion does not apply to the analyte.
C~Avg RL values are presented; bl,nks indicale 11181 there is no Avg RL for the analyte. Avg RLs ,re from Zone 2 ROD Table 2.14 except fortechnctium-99 whidl is presented in Zone 2 RDR/RAWl' Seel. 3.1.2.
(7)pRG values are presalle~ blanks indicate that there is no PRG for the anal)1e. Chemical PRGs were calculated from regional screening levels using the website athttpJ/cpa-prgs.oml.gov/cgibin/chemicalslcsl_search, November 2019 revision; radimuclide PRGs were cakulated during November 2019 using Ihe website at http://epa-prgs.oml.gov/cgi-bin/radionuclideslrprg_scarch.
Cl)Q-W SSL values arc presented; blanks indicate that there is no OW SSL for lhc anal)'tc. OW SSLs arc from Zone 2 ROD Table C.5 except for tcchnctium-99 which is prcsa1tcd in Zone 2 RDR/RAWP Seel. 3.1.2.
C9>Tue Rlli11l (r,diumlthorium) decay series resulls are calculated values for each sample based on detections of radium-226, thorium-230, ,nd Ihorium-232 as discussed in the Zone 2 ROD. Because the calculatiCfl involves subtraction ofbackground from analytical results and negative numbers arc not allowed, 0 (zero) is a legitimalc result.
(IO)l11csc radionuclidcs arc not included in aggregate risk cakulatioos for the EU. Instead. human health risk effects of these radionuclidcs (Uwrium -228 is inc:ludcd in the lhorium-232 decay series) are evaluated w ith the Ra/Th dec:ay series RLs as discussed in the Zone 2 ROD.
Avg = average EU= cx:posure unit. GW = groundwater HI = hazard index Max = maximum
Min = minimum PRG = preliminary remediation goal RDR/RAWP = Ranedial Design Report/Ranedial Action Work Plan RL = rcmedi ation leve I ROD = Rc:cord ofDccis:ion
fi

CONCURRENCE FORMS

5-2
This page intentionally left blank.

5-3
Project Team Concurrence
I. INTRODUCTION
Project Team Agreement Log #: 363 Area Poplar Creek EU Group
FCN-ETTP-Zone 2-194 Page I
The purpose of this concurrence form is to make changes to the sample plan presented in 8.JC/OR/3231 Data Quality Objective Scoping Package for the Poplar Creek Group (£Us Z2-I I, Z2-l 2, and Z2-19) at the East Tennessee Technology Park, Oak Ridge, Tennessee (Poplar Creek DQO Scoping Package), for characterizing the exposure unit (EU) Z2-19 Class 1 soil unit (SU). The matetial contained in this concurrence was presented to the Project Team during a teleconference held on August 24, 2016.
2. AREA
Zone 2 Poplar Creek EU Group, EU 2 2-19.
3. BACKGROUND
Exposure Unit 2 2-1.9 is located immediately west of the fotmer Bldg. K-25 on the east bank of Poplar Creek (Fig. 1). ·n1e EU Z2-19 bounda1ies encompass approximately 20 acres of land, which the Poplar Creek DQO Scoping Package divided into approximately 3 acres of Class 1 SUs and 17 acres of Class 3 SUs (Fig. 2). According to the Poplar Creek DQO Scoping Package, characterization of EU 22-19 was to be conducted as desctibed below.
Class 1 SU Char acterization
• Perform radiological survey of the 3 acres firsl to define the contamination boundaries (at least 80 percent of the Class 1 SU will be suiveyed with a target of 100 percent).
• Calculate the remedial action bounda1y (RAB) of this Class 1 SU using the Visual Sampling Plan'"M (VSP) software after review of the smvey results by the Project Team.
• Collect all samples from 0-1 ft. and analyze for metals, polychlorinated biphenyls (PCBs), and/or semivolatile organic compounds (SVOCs). Samples will be screened for radiation and volatile organic compounds (VOCs) and will be analyzed for radionuclides and VOCs if the respective action levels are exceeded dming screening.
• Select randomly 20 percent of the samples for full suite analysis.
• Collect at least two samples as 0-10 ft., tlu·ee-intetval composite samples. For locations that fall on paved suifaces, the sampling interval will begin at the base of the paved smface. These samples will be analyzed for metals, PCBs, radionuclides, SVOCs, and VOCs.
• Select 25 percent of the histo1ical samples exceeding the maximum (Max) remediation levels (RLs) for confitmation sampling based on the results of the radiological smvey. Samples will be collected from 0-l ft. beginning beneath the pavement or concrete.
Class 3 SU Char acterization
• Conduct the Class 3 SU walkover assessment according to prolocol.
• Sample four biased locations near lhe underground utility conidors.
• Collect samples from soil between 0-10 fl. or to nalive material.
• Examine storm drain lines at entry points in lhe interior of facilities. Take a sample where sufficient sediment is found.
• Collect samples as close as possible to the infrastructure when sampling infrastructure where there may be leachable constituents.
• Screen all samples for radionuclides and VOCs and analyze for melals, PCBs, and SVOCs.
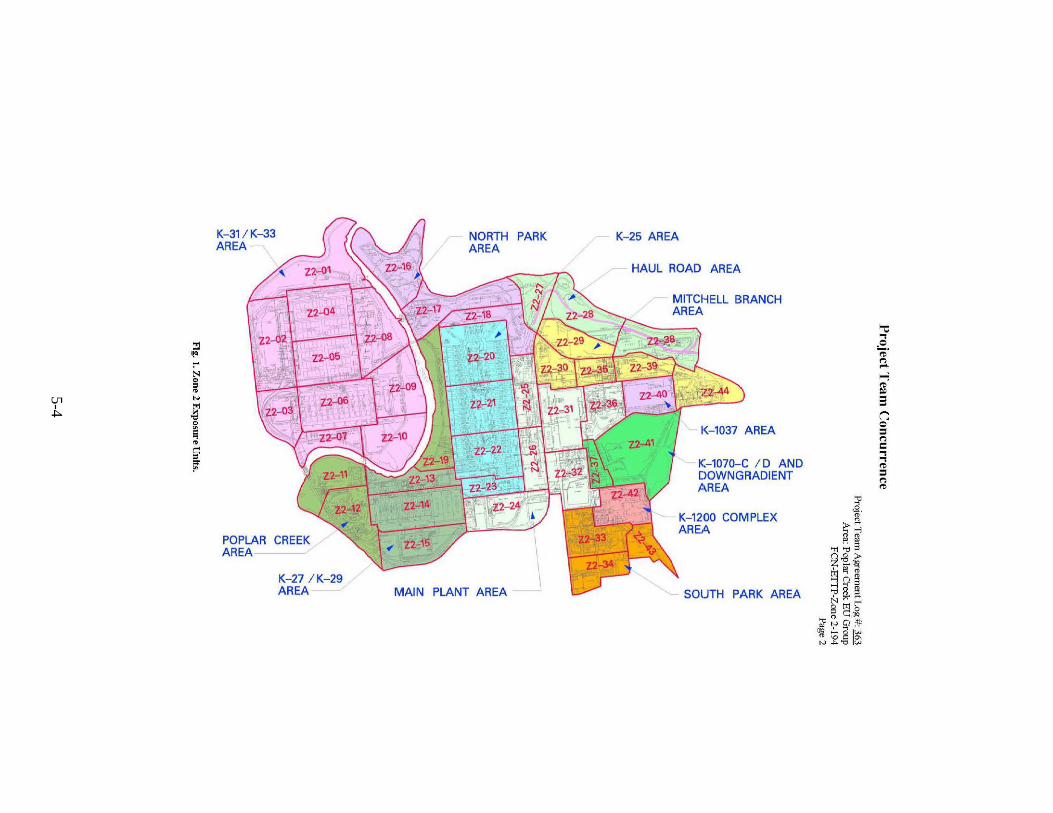
5-4
:al ~
t'" l'-l g '" N
g 0
~ '" ~ F
K-31 / K-33 AREA
POPLAR CREEK AREA
K-27 / K- 29 AREA
NORTH PARK AREA
MAIN PLANT AREA
K- 25 AREA
HAUL ROAD AREA
MITCHELL BRANCH AREA
1(-1037 AREA
l<:-1070-C I D AND C>OWNGRADIENT -"1REA
K-12t00 COMPLEX AREA
SOUTH PARK AREA
4' &. g
•-..., ..., &l &l
'T1;.;, 3 Q.g • ' ~~ ~ Q g "C ~ g N;:;~ g Coo
;?~ Q:ll' rw ~ 8 l:s; N J:)."O v.>
"'C ., 0 ..... ~ (") .... i-3 !E 3 n 0 = (")
C
=! ~ = (") ~

5-5
Project Team Concurrence
f.-1231-A
Project Team Agreement Log#. 363 Area: Poplar Creek EU Group
FCN-ETrP-Zone 2-194 Page3
K-103 1 (FOR MER l OCATION)
(FOR MER l OCAT ION) K- 1410 (FO RMER l OCATION)
(FD RMER LOCATION)
Fig. 2. EU Z:2--19 Class 1 (yellow outline) and Class 3 (grein outline) soil writ b ow u laries.

5-6
Project Team Concurrence
Project Team Agreement Log #: 363 Area Poplar Creek EU Group
FCN-ETTP-Zone 2-194 Page4
In-place Concrete
The Poplar Creek DQO Scoping Package specifically calls out K-700-A-54, K-1031 , K-1410, and K-1410-A concrete slabs in EU Z2-19 for characte1ization:
• Review historical data and process knowledge to identify most probable locations of contamination.
• Inspect visually to identify most probable locations of contamination.
• Conduct radiological and chemical field screens at locations of probable contamination.
• Propose a sampling g1id consistent with the Dynamic Ye1ification Strategy (DYS) for Project Team concurrence once the area of contamination is approximated.
4. CLASS l SU RAIJIATION W ALKOYER SURVEY RESULTS
The Class 1 SU radiation walkover smvey in EU Z2-l9 was conducted <luting July 2016. 'f11e results of the survey are depicted graphically on Fig. 3. ·n1e su,vey covered almost 100 percent of the Class 1 SU and was extended north and west into the Class 3 SU to ensure completeness. -Yl1e survey was conducted according to the DYS radiation walkover su1vey protocol. Background radiation was determined according to the protocol to be 1392 counts per minute (cpm) and the action level was set at 2 times background (2784 cpm) as specified by the protocol. As shown on Fig. 3, there are tlu·ee relatively large areas in the Class 1 SU that exceed the action level (yellow, orange, and red colors), plus several smaller areas with action level exceedances. Also, there are three relatively large and several smaller areas in the Class 3 SU with action level exceedances. Finally, there are relatively large areas of the survey footprint that are less than the survey' s background value (green areas) as well as large areas wi th radiation measurements faUing between background and the action level (blue areas).
S. RATIONALE FOR CHANGING THE DQO SCOPING CHARACTERIZATION APPROACH
As stated in Sect. 1, the purpose of this concw·rence is to propose changing the approach to the characterization of EU 2 2-19 as is described in the Poplar Creek DQO Scoping Package. TI1ere are two reasons desc1ibed below for changing this approach. TI1ese reasons include evidence for redistribution of contaminants and the need to implement a characterization strategy that will define the nature and extent of contamination as it exists today.
S. l Contaminant Redistribution
Figure 4 illustrates the locations ofhistotical samples collected in EU Z2-19. TI1e inset of Fig. 4 focuses on the po11ion of the radiation walkover smvey area that included the 12 historical sample location<i with Max RL exceedances (Table 1).
Table J. EU Z2-l9 historical snmplc locations with Mnx RL exceedances
RAD95' RAD98• RAD99• RAD109
Sample locfllions RADIIO RADII! RADll2 RAD113
RAD! 15• RADIJ6• RADII ?• R.AD11 8·
"Occurs in below.background radialion walkover survey area.

5-7
Z2-19
LEGEND
c::::J EU BOUNDARY
1::: SLABS
c:::J BUILDINGS
-- ROADS
c:::I WATER
Project Team Concurrence
RADIATION WALKOVER SURVEY
ACTION LEVEi, - 2.784 CPM
• 707 to 1392 cpm
* 1393 to 2784 cpm
2785 to 5000 cpm
5000 to I 0000 com
* 10000 to 42030 cpm
Project Team Agreement Log #: 363 Area: Poplar Creek EU Group
FCN-ETTP-Zone 2-194 Page 5
Z2-22
K-1031
N
! 100
:-••t
UCOR URS I CH2M Oak Ridge LLC
o,,i, ot,,1t::o,, M•Mlloor:1,tory t.0•8,..1• F',t.:S-•· EVlt_ .. .W.&• .. - ·-,_..O.• •d ~::•: ~:•• NAD_l!lll_S1111,N.,_T_,_,_tll'S_4100
.S...•• Qol: a1c1•~ &..,.. .. , .. i.r-•- Sr•-IQUISI
Fig. 3. EU Z2-19 Class 1 SU radiation walkover snrvey results.

5-8
Project Team Concurrence
Z2-09
LEGEND
Q HISTORICAL SA:\IPLE LOCATIONS RADIATION WALKOVER SURVEY
C:::J EU BOUNDARY ACTIO~ LEVEL-l.784 CPM
BUILDINGS
• ______ _' SLABS
-- ROADS
CJ WATER
• • • •
707 to 1392 cpm
1393 to 2784 cpm
2785 to 5000 cpm
5000 to I 0000 com
10000 to 42030 1..-pm
0
Project Team Agreement Log#: 363 Area: Poplar Creek EU Group
FCN-ETTP-Zone 2-194 Page 6
!.,,
.----.) ;,
tJ J
125 250
@-"½_ 500 ·i
Feet ,,..j
O•t Ol/11 !016
UCOR URS I CH2M Oak Ridge LLC
Mop A..,u,r: M-r LM 11-'"Ni'•• .iloN-• Etlit. k.odWo.11.:.-·..S.,.,t)_H-..,• - . -0•~4 (!...iit110S)·• • SAi> IMl. ~ .. •'1••.T-•-•.RP!I ~ IM Uuo; M<1.,. ,._.,,_ o• k..,, £•~ .... .. ,,. 1.r- •- .$,",._ (Ok1:.1i ,
Fig. 4. Historical sample locations in EU Z2--19.

5-9
Project Team Concurrence
Project Team Agreement Log #: 363 Area Poplar Creek EU Group
FCN-ETTP-Zone 2-194 Page 7
inspection of Fig. 4 and Table 1 shows that seven of the 12 histo1i cal sample locations with Max RL exceedances occur in radiation walkover survey areas of below-background radiation. All of these historical sample locations originally were identified during a radiation walkover survey conducted in 1994. The samples themselves were collected from O to 6 in. below ground surface, therefore representing the uppermost soil levels. Based on the overlay of the historical Max RL exceedance sample location~ with the cun-enl radialion walkover survey results, it is concluded that there has been a redistribution of surface contamination over the more than 20 years since the historical samples were collected. The redistribution of contamination is most evident for the seven historical sample locations currently in below-background areas of the current radiation survey for which redistribution has occun-ed on a large scale. Based on this large-scale contaminant redistribution, it can be infeJTed that there is a reasonable probability that contaminant redistribution also has occurred at the historical sample locations in above-action level areas of the current radial ion walkover survey, but on a smaller scale.
5.2 Refine the Existing Sampling Plan to Correspond to Existing Conditions
The Poplar Creek DQO Scoping Package gives direction for two sampling approaches in the EU Z2-19 Class 1 SU that will no longer adequately characterize the nature and extent of contamination in the SU to make remedial action decisions.
First, the Poplar Creek DQO Scoping Package says that 25 percent of the historical sample locations with Max RL excecdances are to be sampled. As discussed in Sect. 5.1 of this concurrence, more than half of the historical sample locations with Max RL exceedances now occur in areas in which below-background levels ofradioactivi ly are characlcristic. The interprelalion of this observation includes that some locations of the Class 1 SU have had a large-scale migration of contaminants and that !here has probably been migration on smaller scales throughout the SU. As a result, resampling historical locations at their recorded coordinates is not likely to sample the contamination originally observed at those coordinates.
Second, the Poplar Creek DQO Scoping Package says lhal upon completion of the Class 1 SU radiation walkover survey and review of the survey results, a systematic grid ofsample locations will be calculated to define RABs. In accordance with this direction, systematic sample grids were calculated for the larger of the above-action level areas delinealed during the radialion walkover survey discussed in Sect. 4. The sample grids are shown overlain on lhe radiation walkover survey graphical results on Fig. 5. Systematic sample location grids are nol shown for the smaller areas of above-action level radiation because only one or two sample locations per area resulted from lhe calculations. Inspection of Fig. 5 shows that the calculaled grid sample locations do not fall on most of the locations with highest radioactivity as determined by the radiation walkover survey. Therefore, the systematic grid sample locations required by the Poplar Creek DQO Scoping Package will not provide information on the nature of the contaminants that would likely cause the greatest risk ancVor potential threats to groundwater. A primary conlributing factor lo this conclusion is the fact that location infonnation for the major contaminants, which was delennined in 1994, has been lost owing to redistJibulion of conlaminants.
6. PROPOSED CLASS 1 SU CHARACTERIZATION STRATEGY
A characteriz,.,tion strategy is proposed that uses data fi-om the radiation walkover survey conducted during July 2016 (Sect. 4) to effectively and efficiently determine the nature and extent of contaminalion in the EU Z2-19 Class 1 SU. Using the data collected during th.is approach, decisions will be made on lhe need for remedial actions and subsequent sampling will delineate RABs. Only a new characterization approach to lhe Class 1 SU is proposed. Characlerization of the EU Z2-19 Class 3 SU will proceed as described in the Poplar Creek DQO Scoping Package and concrete slabs will be addressed with the DVS in-place concrete assessment protocol. The Class 3 SU sample locations (Z2-EU19B-301 through Z2-Ul9B-305) are shown on Fig. 6 and the delails of sampling and analysis at these locations are presented in Table 2. The proposed Class 1 SU characterization slrategy is a two-phase approach as described below.

5-10
Z2-19
LEGEND
• GRID LOCATIONS
c::J EU BOUNDARY
l==:J BUILDINGS
•-------· SLABS
c:::::::I WATER
--- ROADS
Project Team Concurrence
RADIATION WALKOVER SURVEY
ACTION LEVEL- 2.784 CPM
• 707 to 1392 cpm
* 1393 to 2784 cpm
2785 10 5000 cpm
5000 to 10000 com
* 10000 to 42030 cpm
Project Team Agreement Log #: 363 Area: Poplar Creek EU Group
FCN-ETTP-Zone 2-194 Page 8
D•• OI ll'l01'
ZZ-22
N
1 25 50 100
I ceet
UCOR URS I CH2M Oak Ridge LLC
M ....... ..- Mo,ylN llt.,..i,1 ... f'dtN-• (U19 .... ~ol.••-..$wvoy_On<L«• - - >(l•xd ~•:~!!;••·?-AO_lff"J_Sllll•P1••-T-•- •_Fll'$_4100
-· o • aldp r., ____ ,,..., __ Syfl- (OllElSj
F1g. 5. Systematic grid sample locations on EU Z2-19 radiation walkover survey above-action lev el areas.

5-11
Project Team Concurrence
Z2-09
LEGEND
• PROPOSED SAMPLE LOCATIONS RADIATION WALKOVER SURVEY
ACTION LEVEL - 2.784 CPM
t::J EU BOUNDARY
I=:] BUlLDINGS
L-_-_-_-_-_·; SLABS
- - ROADS
[::::J WATER
• 707 to 1392 cpm * I 393 10 2784 cpm
2785 to 5000 cpm
5000 to I 0000 com
* I 0000 to 42030 cpm
Project Team Agreement Log # : 363 Area: Poplar Creek EU Group
FCN-ETTP-Zone 2-194 Page 9
500 :)
Feet t;
UCOR URS I CH2M Oak Ridge LLC
0.010l/ll/1016 M•A.lldr,or. MW'fLOllllf..,.i.loa 1-l k-N•• · EU19 "ldWal;owfSW\'oy_Proi,oud~-•-vt.• l ~-=:~,:;;!!••, NAO~ I MJ .&•• Pi.,. T-•-•. FlPS . • IOG
SMrct· Olk " id1t Eil\TOll• .,.1tl lllf- • - S)i• .. (Ott.fl.SI
Fig. 6. Proposed EU Z2-19 sample locations.

5-12
Project Team Concurrence
6. 1 Determine If and Where Remedia l Actions Are Required
Project Team Agreement Log #: 363 Area Poplar Creek EU Group
FCN-ETTP-Zone 2-194 Page 10
The first phase of the proposed Class 1 SU characteri zation strategy will be implemented by perfotming the following:
• Collect samples from radiation walkover smvey spots of highest radiation measurements ( designated red on Fig. 3) to determine the nature of con1arnination and whether that contamination requires remedial action.
• Collect samples at locations with lower radiation measurements, but still above the action level (designated yellow areas on Fig. 3) to understand the relationship between the radiation walkover survey measurements and contaminant concentrations.
• Collect swface samples to correlate analytical data with survey measurement results.
• Collect subsurface samples to detennine contaminant distribution with depth.
• Ve1ify the absence of historical Max RL exceedances by compositing samples from the areas in which the historical Max RL occurred.
The proposed Class l SU sample locations are shown on Fig. 6 and the details of sampling and analysis at each location are presented in Table 2. In summary, the following shall be performed:
• Collect 20 sample locations (Z2-EU19-101 through Z2-EU 19-120) in rad.iation walkover smvey aboveaction level areas (depicted as yellow, orange, and red colors on Fig. 6) with samples collected from the 0- to ) -ft-depth interval and analyzed for metals, PCBs, radionuclides, and SVOCs, plus conditional VOCs if screening action levels are exceeded.
• Tlu.·ee sample locations (Z2-EU19-121 through Z2-EU19-123) in radiation walkover survey aboveaction level areas (depicted as yellow, orange, and red colors on Fig. 6) with samples collected at three discrete depth inte1vals from the 0- to IO-ft-depth inte1val and analyzed for metals, PCBs, radionuclides, and SVOCs, plus conditional VOCs if screening action levels are exceeded.
• One three-point composite sample at an area of historical Max RL exceedances unconfirmed by the current radiation walkover survey (labeled Z2-EU19-124 on Fig. 6) with sample points collected from the 0- to 1-ti-depth intc1val and analyzed for metals, PCBs, radionuclidcs, and SVOCs, plus conditional VOCs if screening action levels are exceeded.
• One four-point composite sample at an area of historical Max RL exceedances unconfomed by the cutrnnt radiation walkover smvey (labeled Z2-EUl9-125 on Fig. 6) with sample points collected from the 0-to 1-ti-depth interval and analyzed for metals, PCBs, rad.ionuclides, and SVOCs, plus conditional VOCs if screening action levels are exceeded.
6.2 Follow-on Sampling aller Determining Where Remedia l Actions Are Required
After determining where remedial actions are required in the first phase of characterization, follow-on sampling will be conducted to determine the extent of the remedial actions by conducting delineation sampling around sample locations identified during the first phase of sampling as requiring remedial actions. Subsutface sample data from the fi rst phase of sampling will be used to plan sample depths for the remedial action delineation sample locations.

5-13
Project Team Concurrence
Project Team Agreement Log#: 363
7, CONCLUSION AND SUMMARY
Area: Poplor Creek EU Group l'CN·ETTP-Zone 2-194
Page II
This concurrence fonn proposes an ahemale characlcrization Slralegy for lhe EU 22·19 Class I lhal will more effectively define lhe nature and ex1en1 of con1amina1ion in the SU and thereby belier enable delinealion of remedial action boundaries if such nctions are determined to be necessmy. The proposed sample locations for this alt.ema1e characterization s1rat.eSY are shown on Fig. 6 of 1his concurrence and the details of sampling and analysis at eac;h location are presented in Table 2. No change is being proposed for sampling the EU 22-19 Class 3 SU; concrcle slabs in the EU will be addressed wirh the in-place concrete assessment protocol. The chnrac1eriza1ioo stnrt js currently planned for June 19. 2017.
Concurrence:
,rfv/1• Date
}~nessce D cnt of Environment and Conservation
(dit*_, Date

5-14
T:oble 2. IW Z2-19 Clas-, 1 SU (proposed) a nd Clas-, 3 St: sampling
u,boratorv anal\,.is Samo!• location X y S:nnnlhu, interval Metal PCB RAD SVOC
P1·opostU Lh1ss l SU ~•m pl, locaHon.s Z2-Ell l9-l (II 74463'.!.19 17872t).36 0-1 tt soil I I I I Z'.:!-ELl\9-lll'.! 744636.76 1787:,,.36 ll-1 (1 soil I I I 1 1/.'.:!-El.l l\LJC1., 7446W51 17871 X(\( I tl-1 ft soil I I 1 I Z2-EU l9-I O-l 744588.61 178686.99 0-1 It soil I I I 1 1/.'.:!-El.11\Llt15 7H,95.6'.:! 178692.6.l t1.1 ft soil I I 1 1 7.'.:!-El.l 19-1 ('6 744569.C>I 178667 15 (1. J Ii soil I 1 1 I Z2-EU19- 1l)7 744582.81 1 7866!}. 1 (1 t)-1 ti soil I I I 1 7.'.:!-ElJ I 9- I (18 74459'.!.87 178674.8(1 (1.( Ii soil I I 1 I 7.'.:!-F.1J 19-1 (19 744585.86 178647.1:::! (I. I ti soil I I I I L.2-ELl\9-II U 744~82.51 178643 49 ll-1 ti soil I I I I 7.'.:!-F.lJ 19-11 1 74458t'l.n7 178637.82 Cl- I ft soil I I I I Z2-Ell l9-112 744583.4:::! 178637.M 0-1 tt soil I I I I Z'.:!-ELl\9-11'.\ 744607.: tJ 178636.73 ll-1 (1 soil I I 1 1 Z2-Ell l9-l 14 744577.33 I 7862(1(i_l (1-1 ti SOIi I I I I Z2-EU l9-l 15 744596.83 178616.98 0-1 tt soil I I I 1 1/.'.:!-El.11\l-116 74-16'19.3] 178617.16 ti-1 ft soil I I I 1 Z2-EUl9-11 7 7446'.!8.53 178617.11) 0-1 tt soil I I I 1 Z2-EU19-118 7446:::!9.75 17867t).99 0-1 ti soil I I 1 1 7.'.:!-El.l 19-119 7446()6.59 178676.87 (1.J ft soil I I 1 1 7.'.:!-F.1J 19-12(1 744641.44 17867.,.45 r1. I ti soil at R AT)J (>6 I I I I L.2-ELl\9-1:1 744621.tX> 1n673.94 ,1. JC! ti lhree chscret~-interval soil 3 J 5 3
0-0.5. 0 5-:. 2- It) I\ at lustorical location RADI JO
Z2-EUl9-122 744634-88 I 78681. I 7 0-1 I) h thrc~ discr~t~-intcrval soil 3 3 5 3 n.n.s, 05 -~, :. 1 c, fr at hL~orical location RJ\1)11.l
7.'.:!-F.1.119-1 :.; 74461754 178617.,2 (1. 1 Cl ft three disc.rctc mter\·al soil .l .l -' 1 0-05. 0 5-:. 2-1 (> h
Z~-EU 19-l :4 74459S.\>4 178637.: 5 0-1 Ii three-point 0<1mposite at l 1 I 1 (RAD95) (RAD95) Justorical locativn.s RAI}95. 744S9H 8 17864: .88 R,\ D98nnd , R;\1)99 (RAD'J~) (1<.AJ.1!181
7.'.:!-F.1.119-124 744595.56 17864.l.'.:!.\ I I I I (cont.) (RAD99i (R,\ 1)99) 7.'.:!-ElJ 19-125 744644.25 178689.89 Cl- I ti three-noint comnositc at I I I I
YOC Co mments
' ,, " ,, , ..
"
"
,_.
"
'
,,
"
,.
•'
-· -
" ! •
- !•
,,
-
~ .£. i »~ .., ...,
" " "11 ~ 3 Q-8 • '~'IQ gJ O g ;j ij § N :,;-;::
"d~ §1& ~ ';-' Q :i;, " - 0 I<.,.) "'"""\O C: 0,, N~"O (.N
"'C ., 0 '-· (I> n .... .-3 (I> :.i
= ('j 0 = n C: ., ., (I>
= n (I>

5-15
Ta b it 2. EL" Z2- 1!> Cl••• L SU (proposed) and ClassJ SL" sampling (cont.)
Laboratory analvsi~ S11mph: loca1io11 X y Sampliul! inkrrnl .1\-lrl•l PCB RAU svoc voe <.:um111c1.11s
(RAnt 15) iR.\J')J J5i historical loc:1t inns RADl I\ 744635 5 178691.48 R/\lll 16. Ri\lll 17. R:\lll 18 (RADI IG) (RAD116) 744634 38 17869:.)8 (RADl 17) (RADl 17) 7446:!7 38 178691.7~ (RA1)1 18i (RAD118)
Ch1~s J SC s:.unoll' locations 7.'.!-F.l:19P,-3fl1 74458(\ 35 179'235.44 c'J-111 ft thrcc-int~r\'nl comrx,R:itc 1 I C 1
soil 11-ll . .\ 0.5-::!.. :!- J(1 tl n-En9B-3o: 744599.36 I 7911 ~ 54 (l-\(1 rt three-interval composite I l C 1 •'
SOI i (1 •. (1 ,_'\, 0.5-~. 2-1 (I ft 7.'.!-F.l: J9P,-3f1., 744614 ((! 178984.9} c'J.-1 fl ft thrcc-inter\'nl compclsitc I I C 1
•. soil t•-l•.5. 0.5-'.!. :. 1 ll ii
z:-En9B-304 7446~8.<xl 178840 75 0-1(1 rt thrcc-intcr\'al comp<>sitc I l C 1 ' soil fl.fl.\ 05-'.!. 2-1 fl Ii
Z'.!-El:198-305 74467.2.57 178640 28 (1.1(1 rt three-interval composite l l C 1 " soi l i"1-(15, O.S-~ ~-1 fl ft
Total EU 22-19 analvst!. 36 36 3715• 36 1/29' "Cot1di1t.:111tl malys:i~ bascJ (')JI SCfOCIJirlg resull5. ~ ,rec di~n.tc mtcrv.th: voe~ t:lttd1tiom1I .it cad1 inlcr\·.tl: RAD,tist.1'Clc at lligJu:::;1 rcaJmg :II ca..:h iulccval ct vt ri if attion lc,.•d is twl r.:'tl'.cakllr. m~;al,. Pen~. aml SVC-Cs c,,. J,x:alC\l \.\,\h RAO
~11mvk l.,.i-scd Olt \i~rnt 1:uc~ 1.11 c.:.id1 iulcrv:d. up l() l\, u ..tJ...liliu1mt lli~1-ctc samplc:!'Sm:iytx: i:vJla.:tc<l for n.,\l()lc.iiiul t1Jlli)"$b within lh.e 2- 1(1 IO-fi iule1\; II t,.i:,;:cd vu RAD ~t:ilXIJmg;. m1cofdJ1.:twu additional Ji.<;;erC1e samples will be collected al lht bouom of the IO•ft i111trvat :;ccond ad.chtiooal di:S(tc:te $ample wil l c11he1· be ciollectc:d bc:rwtc:n 2 ft and the di..<;;ertle sam1>le colltc1.td based on the RAD ,urvc>· url>4:1,-,.1:~n UJ(' d1~ 1ac.: ,itm('k collc\.'.tc.-..l li.t~li).1,11 llir;RAD sw·-,,cy,mJ 10 fl.
-U1-;;..nlt samples will IJc hd d 111 llJe lalt pa1tfo!J$ (;OfllfJt1~1h: ~ 11111le r~ult~ a:: cxpo,run; unit PCB - 11vly\.:hlo1im11eJIJivh~1)"l RAD = radt111ucli<lc
SC= ~UII llflll
SVOC - ~tnlinil:.rile vrs:mi1.. cm1J}.,oun,t VOC = ._:..,(,.tik ~irganic u impounJ
~ .£. i »~ .., ....,
" " "11 ~ 3 Q-8 • '~'IQ gJ ("Jg ;j ij § N :,;-;::
"d~ §1& ~ ';-' Q :i;, " - 0 I<.,.) """"" \O C: 0,, t.,M~"O (,N
"'C ., 0 '-· (I> n .... .-3 (I> :.i
= ('j 0 = n C: ., ., (I>
= n (I>

5-16
This page intentionally left blank.

5-17
Core Team Concurrence
Area:
Project Team Agreement Log # _J2Q_ Area: Poplar Creek EU Group
FCN-ETTP-Zone 2-225
This concurrence form documents the characteriz,1tion efforts to determine the need for and extent of remedial action (RA) within the Class 1 Soil Unit (SU), and adjacent areas as deemed appropriate, in Exposure Unit (EU) 22-19 in accordance with Data Quality Objective Scoping Package for the Poplar Creek Group (EUs Z2-1 l , Z2-l 2, and Z2-l 9) at the East Tennessee Technology Park, Oak Ridge, Tennessee (BJC/OR-3231) (Poplar Creek DQO Scoping Package). Sampling locations for EU Z2-19 are identified in Appendix G of Remedial Design Report/Remedial Action Work Plan for Zone 2 Soils, Slabs, and Subsurface Structures, East Tennessee Technology Park, Oak Ridge, Tennessee (DOE/OR/01-2224&O5) (RDR/RA WP). Modifications to the sampling plan for the Class 1 SU were approved in FCN-ElTP-Zone 2-194. Th.is concuJTence form presents a summary of the background information, characterization objectives and strategy, evaluation of sample results, and the extent of the three planned RA~ within the Class 1 SU.
Summar y Information:
Description: EU 22-19 is located immediately west of the fonner Bldg. K-25 on the east bank of Poplar Creek. The EU 22-19 boundaries encompass approximately 20 acres ofland, which the Poplar Creek DQO Scoping Package divided into approximately 3 acres of Class 1 SUs and 17 acres of Class 3 SUs. Tius concuJTence is primarily in the Class 1 SU, which includes the former Bldg. K-1031 concrete slab and the former Bldg. K-1410 concrete slab.
Constructed in 1945 as a maintenance suppo1t facility for the K-25 building, Bldg. K-103 lwas used to store and dispense trapping media for spent cascade traps and was later used as a cutting and size reduction area for process equipment from the Fercleve Thermal Diffusion Plan. Prior to demolition, the building was used for equipment and material storage. Only the concrete slab remains. Walkover smveys pe1fonned indicate low levels of contamination exist through.out the site, with small areas of higher activity to the north and south of the building.
The Bldg. K-1410 was used to mix media from the spent cascade traps for use in the K-25 Gaseous Diffusion Plant. Subsequently, it was used for decontamination and recove1y of uranium from large pieces of equipment. The building included two spray facilities to solubilize and remove uranium with nitric acid and to degrease pumps with trichloroethene. Finally, the facility was converted to an electroplating facility by removing the decontamination tanks and filling the degreasing pits with concrete. Only a concrete slab remains.
Both the K-1031 and K-1410 slabs have been covered witl1 asphalt. Within the Class I SU, tl\l'ee distinct soil excavation actions are to take place, designated as Dig 1, Dig 2, and Dig 3, based on tl1e results oftl1e characterization effo1t.
Data Quality Objectives:
The goal of the EU Z2-19 Class 1 SU is to release this area for its intended future end use. To achieve this goal, the types, distributions, and concentrations of chemicals and radionuclides in soils, building slabs, and related media must be detennined to make decisions of RA or no further action (NF A). Characteiization of the Class I SU is used to answer the following two primary decision statements:

5-18
Project Team Agreement Log # _J2Q_ Area: Poplar Creek EU Group
FCN-ETTP-Zone 2-225
1. If the concentration of chemical~ and/or radionuclides in the Class 1 SU and related media exceed acceptable limits, then conduct an RA to achieve acceptable end state conditions; otherwise, take NF A.
2. If sources of potential &'foundwater contamination are found to exist in soils within the Class 1 SU, then conduct a RA to achieve acceptable end-state conditions; otherwise, take NF A.
Char acterization Summary:
A radiological walkover survey in and around the EU Z2-19 Class 1 SU was conducted during spring 2016. Based on these results, FCN-ETTP-Zone 2-194 approved the soil sampling approach to address areas with elevated radioactivity. Specifics of the samples collected are presented in Attachment 1 and the sample locations are shown on Fig. 4 of the Technical Memorandum.
The EU Z2-19 Class l SU data are evaluated against the Zone 2 Record of Decision remedial action objective decision critetia as described in the Remedial Design Report/Remedial Action Work Plan for Zone 2 Soils, Slabs, and Subsurface Stn1ctures, East Tennessee Technology Park, Oak Ridge Tennessee (DOE/OR/01-2224&D5, Sect. 3.2) (Zone 2 RDRIRA WP). Table I presents the summary of the results of the Class 1 SU characterization samples following cl.ta evaluation.
Table 1. Data summary for EU Z2-19 Class 1 ~'U
Analvte TotalPCBs Chromiw11 Uranium (total) Ra/Th decay series Ccsium- 137 Uraniwn-234 UraniW11-235 Uran iw,1-238 Plutoniwn-239 Technetium-99
EU = Exposure Unit PCB = polychlorinaled biphenyl Ra • radium RL = rancdialion level
Type of RL exceedance Maximum RL Groundwater SSL Industrial RSL Maximum RL, Average RL Maximum RL, Average RL Maximum RL, Average RL, Groundwater SSL Maximum RL, Average RL, Groundwater SSL Maximum RL, Average RL, Groundwater SSL Industrial RSL Groundwater SSL
RSL = risk screening level SSL = soil screening level SU • Soil Unit Th= thorium
Radiological surveys of the slabs demonstrated the presence of elevated radioactivity which resulted in the slabs being desi&>nated as Contamination Area (K-1031) and High Contamination Area (K-1410). Based on their location within the area of EU 2 2-19 which has been demonstrated to pose a threat to the industrial worker and a probable threat to groundwater (i.e., Class 1 SU) as a result of the presence of
radiological contamination, it is concluded that the slabs themselves pose similar risks. Removal of the slabs will e liminate the risks associated with them.
RA Decision:
Based on the presence of remediation level (RL) exceedances in soils and a probable threat to &'fOumiwater from primarily isotopic uranium in soils, a decision was made to conduct an RA in EU 22-19. As demonstrated in the Technical Memorandum (see Fig. 5), the sample locations with RL exceedances and residual groundwater (GW) soils screening level (SSL) exceedances are clustered near the interior of the Class 1 SU and are largely swTOunded by sample locations with no criteria exceedances. Tberefore, the
2

5-19
Project Team Agreement Log # _J2Q_ Area: Poplar Creek EU Group
FCN-ETTP-Zone 2-225
areal extents of the RAs are known with a high degree of certainly; confirmation sampling conducted following the RA (described below) will verify the RA has been successful.
The EU Z2-19 RA will be conducted within tlu·ee primary boundaries referred to as Dig 1, Dig 2 and Dig 3, with the smaller dig, Dig 3, located within the boundaries of Dig 2 (see the Technical Memorandum, Fig. 6). In addition, the K-1031 and K-1410 concrete slabs will be removed as part of Dig 2. The K-1410 slab portion of Dig 2 will be to a depth of 4 ft with the exception of the pit area. The area of the filled pit will be excavated to the depth of the pit. The K-1031 slab portion of Dig 2 will be concrete and incidental soil only. A summary of the planned RAs in EU Z2-19 Class 1 SU are presented in Table 2.
Table 2. Summary of planned RAs in EU Z2-19 Class 1 SU
RADig# RA material 1 Soil
2 Soil Concrete
3 Soil EU = Exposure Unit RA - remedial action SU = Soil Unit
O,·pth of excavation E~timatcd volume (ft) (cy) 3 422
4 8773
I 634
6 178
Soil and concrete excavation will commence using standard earthmoving equipment and dump trucks and/or dedicated waste containers for waste shipments. Excavation will progress from an initial starting point on a perimeter of a dig area until the entire area and depth is reached. The area of Dig 2 may be subdivided into smaller excavation area due to tl1e need to have less area open at a given time to minimize stonn water collection. Water management actions, including run-on/run-off controls and cover (using clean fill or membranes), will be implemented during ongoing excavation actions pending receipt of analytical confirmation samples results to protect the integrity of the excavation.
Most of tile materials excavated during the EU Z2-19 RA will be disposed at the Environmental Management Waste Management Facility in accordance with an applicable Zone 2 waste profile, with smaller volumes of material being disposed offsite, as required. Actual waste volumes disposed and disposal facilities used will be presented in the RA completion report.
Conlirmation Sampling:
Upon completion of both the lateral and veitical extent of a dig and excavation of the concrete slabs or when excavation activities warrant safe access to the excavation areas, a radiological survey of the excavation walls and floor will be performed to semi-quantitatively identify potential areas within the excavation that exceed 2 tin1es background. Locations exhibiting unacceptably high readings will be marked for additional excavation (nominally I fl. in all applicable directions into the underlying material) and the locations re-surveyed. This process will continue until it is detem1ined that excavation surfaces meet this criterion.
Following the radio logical survey and fina l excavation actions, the area consisting of the walls and floor will be determined. Similar to the characterization sampling, a statistical sampling approach has been developed based on the area using a superimposed two-dimensional f,'fid spanning the excavation areas (or portions thereof, if required) using site coordinates and field measurements. The appropriate number of
3

5-20
Project Team Agreement Log # _J2Q_ Area: Poplar Creek EU Group
FCN-ETTP-Zone 2-225
confirmatory samples based on statistical parameters of95% confidence and 80% coverage was determined and a triangular grid with a random sta1t was prepared for each dig area (see Fig. 7). Using this approach, 11 sample locations will be selected from the floor and 3 from the wall of Dig 1. Similarly, l 7grid locations were identified for the floor of Dig 2 with an additional 3 locations from the wall (area including Dig 3). Finally, biased samples will be collected as determined in the field, with up to 2 biased samples collected from Dig l (approximately 16 sample locations in Dig 1), with up to 6 biased samples collected from Dig 2 and up to three collected from Dig 3 (approximately 29 sample locations in Dig 2). Once excavation in an area is deemed complete, the grid nodes in the area will be marked in the excavation and sample collected from the 0-1 ft. interval and sent to a laboratory for analysis with a nominal 3-day turnaround. Biased samples will be collected based on the highest radiological reading in an open excavation. The confumatory samples will be discrete samples.
When the average concentration of all con~lituents of concern are less tlian their respective average remediation level (both average RL and GW SSL), the excavation will be declared complete and may be filled with clean fill and the site stabilized as necessary.
EU Z2-J9 Class l SU Closure Actions:
When final confirmation sampling indicates there are no RL or GW SSL exceedances in an excavation, then the excavation area that the confirmation samples represents will be backfilled and the entire area will be contoured and stabilized, as appropriate.
Provisional Management for slabs K-1031 and K-1410:
The RDR/RA WP Appendi,x K, Provisional Management of Slabs, requires slabs requiring remediation have provisional management if not remediated within 60 days or a period agreed to by the project team. Slabs K-1031 and K-1410 will not be remediated within the 60 days, but have planned remediation dates of August 2018 and October 2018, respectively. Since the slabs are covered by asphalt, the provisional management would be an annual inspection to ensure contaminant migration is prevented by the asphalt cover. Due to the removal of the slabs being planned for removal in less than a year, no provisional management is proposed.
Conclusion and Summary:
This concurrence form proposes that three RAs be taken within the EU Z2-19 Class 1 SU to remove threats to tl1e industrial worker and underlying groundwater. The proposed RA aerial boundaries are shown in the Technical Memorandum (see Fig. 6). Following impacted material excavation and disposal, confinnation samples will be collected to demonstrate that the RAs have achieved the remedial action objectives presented i.11 the Zone 2 ROD.
4

5-21
Concurrence:
U.S. Environmental Protection Agency
s
Project Team Agreement Log# 390 Area: Poplar Creek EU Group
FCN-ETTP-Zone 2-225
5/29/18
Date
5-22
ATTACHMENT!. EXPOSURE UNIT EU Z2-19 CLASS 1 SOIL UNIT
TECHNICAL MEMORANDUM

5-23
EXPOSURE UNIT (EU) GROUP: EU Z2-19
I INTRODUCTION
This Technical Memorandum presents the background infonnation, analytical results, data evaluations, and other related information that serve as the rationale for recommending a remedial action (RA) in the Class I soil unit (SU), and areas in close proximity as deemed necessary, of Exposure Unit (EU) Z2-19, located in the west central area of ETTP along the east s ide of Poplar Creek (Figs. I and 2). Figure 2 identifies two Federal Facilities Agreement sites in EU Z2-19 K-1031 pad andK-1410 pad Upon completion of the RA, the Class I SU will have been fully addressed and require no further action (NFA) under DOE/OR/01-2161&O2, Record of Decision for Soil, Buried Waste. and Subswface Structure Actions in Zone 2, East Tennessee Technology Park, Oak Ridge, Tennessee (Zone 2 ROD).
On December 14, 2017, the ETTP Core Team was briefed on the field sampling results presented herein. As discussed, additional characterization activities will be conducted in EU Z2- I 9 to address pits, vaults, buildings, and soils outside the Class I SU. After completing the remaining characterization activities, the Core Team will be briefed on the results and a path forward for the remaining portions of the EU, as appropriate.
1.0 I BACKGROUND INFORMATION AND EU SUMMARY Exposure Unit Z2-19 is located un mediately west of the former B ldg. K-25 on the east bank of Poplar Creek. The EU Z2-19 boundaries encompass approximately 20 acres of land, which the Poplar Creek Data Quality Objective Scoping Package divided into approxi mately 3 acres of C lass I SUs and 17 acres of Class 3 SUs. This technical memorandum and RA concurrence is l imited to the Class I SU and a small adj acent area only, which includes the former Bldg. Kl 031 concrete slab, the former Bldg. K-1410 concrete slab, and soil areas in and around these slabs.
A radiological walkover survey in and around the EU Z2- l 9 Class I SU was conducted during the spring 2016. The survey results are depicted graphically on Fig. 3. FCN-ETTP-Zone 2-194 approved the soil sampling approach to address areas with elevated radioactivity Specifics of the samples collected are presented in Attachment IA and the sample locations are shown on Fig. 4.
1.1 I CHARACTERIZATION ANDDELINATION SAMPLINGAl'IALYTICALRESULTS Alt8chment lB presents a summary of the data col lected ard a comparison oflhose data to Zone 2 remediation levels (RLs) consistent with the ROD remedial action object ives (RAOs) for protection of the industrial worker and groundwater. This summary shows that there are multiple exceedances of RLs, inc ludtng maximum RLs, average RLs, indu5trial risk screening levels (RSL), and groundwater (GW) soil screening levels (SSL) in EU Z2-19.
Attachment 1 C presents a comprehensive list of criteria exceedances in the existing data for EU Z2-19. There are 19 sample locations with one or more exceedance of the maxim um RLs, 36 sample locations with exccedances of the average RLs, 15 additional sample locations w ith RSL exceedances, and 31 sample locations with OW SSL exceedances. The sample locations with exceedances ofRLs are shown on Fig. 5.
Note that several sample locations exhibit multiple excecdances of different RLs, mostly within the shallow interval (i.e., 0 - 1 ft.) a lthough average RLs, industrial RSLs, and GW SSLs are exceeded in depths up to 10 ft. These results are used to define the nature and e;d,ent of contamination within the Class I SU and define the RA necessary to reduce contaminant mass and achieve the RAOs in EU-Z2-19 as discussed below.
1.2 I EU Z2-19 CLASS 1 SU DATA EVALUATION
The EU Z2-19 Class 1 SU data are eva luated against the Zone 2 ROD RAO decision criteria as described in Remedial Design Report/Remedial Action Work Plan for Zone 2 Soils, Slabs, and Subsurface Structures, East Tennessee Technology Park, Oak Ridge Tennessee (DOE/ORIO l-2224&D5, Sect. 3.2) (Zone 2 RDR/RA WP).
Maximum RL Screening. There are 19 sample locat ions in the EU Z2-19 C lass 1 SU with maximum RL exceedances, with 18 in the 0-1-ft depth and I within the 0-2-ft depth Table 1 indicates the analytes and the nwnbcr of exccedances observed. There are no maximum exceedances at depths greater than 2 ll (Attachn,ent 1 C). The distribution of sample locations is shown on Fig. 5 and information regarding specific sample locations is presented in Attachment JC. According to the Zone 2 ROD, the area represented by these 19 sample locations requires an RA.

5-24
Table 1. Class 1 SU a nalytes with maximum detected concentrations exceeding maximum RLs
Analyte with maximum RL exceedance( s)
Ra/fh decay series Cesiwn-137 Uranium-234 Uranium-235 Uranium-238
Ra • radium RL • remediation level
Number of exceedances
15 6 2 7 8
SU maximum detected
concentration 6,254 pCi/g 4,060 pCi/g 57,300 pCi/g 4,250pCi/g
17,300 SU • Soil Unit Th • thorium
Maximum RL (pCi/g)
15 20
7000 80
500
Average RL Screening. The process presented in Sect. 3.2 or the Zone 2 RDR/RA WP for conducting an average RL screen arrives at a conclusion about whether the EU average concentration of a primary COC exceeds the average RL. Typically, the average RL screen is conducted across the EU; however, since EU-wide characterization is not complete, the average RL exceedances within SU 1 are u.<;ed to help define the excavation boundaries for the Class 1 SU.
There are 36 sample locations with maximum detected concentrations exceeding average RLs, excluding locations with maximum RL exceedances, 33 have constituent5 in lhe 0-4-ft depth interval and 3 have constituents up to 10 fl in depth. Table 2 indicates the analytes and the number of exceedances observed. The distribution of the sample locations arc shown on Fig. 5.
Table 2. Class 1 SU anal}1es with maximum detected concentrations exceeding average RLs
Anal}1e with maximum RL exceedance(s)
Total PCBs Ra/Th decay series Cesium-137 Uranium-234 Uranium-235 Uranium-238
Ra • r.Hlium 111 • thorium
SU maximum Number of detcct.cd
exceedance.s concentration 1 26,300 µg/kg 8 11.7 pCi/g 8 13.8 pCi/g 4 6,690 pCi/g
33 75.3 pCi/g 34 362 pCi/g
RL • rcrm:di a1.ion level SU • Soil Unil
PCB • polychlorinatcd biphcnyl
AverageRL 10,000 5 pCi/g 2 pCi/g
700 pCi/g 8 pCi/g
50 pCi/g
Jndu.~trial RSL evaluation. This evaluation is performed to insure that the additional non-contaminant of concern (COC) chemicals and radionuclides, in which either maximwn or average RLs are not defined, do not result in a total risk greater than l x JO-" (for carcinogens) or a total hazard index of l (for noncarcinogens). Remediation screening levels (RSLs) for carcinogenic con.~tiruents are set at 1 x 1 o·' to ensure the total risk (i.e., sum of individual constituent risks) meets the 1 x 10·1 total risk goal. RSLs for non-car~inogenic constituents are set at a hazard quotient (HQ) of 0.1 to ensure the Hazard Index (HI) (i.e., the sum ofHQs) meets the target ID goal of I. Similar to the average RL exceedance evaluation, this evaluation arrives at a conclusion about whether the average " non-COC" constituent concentrations within the SU that do not have RLs defined do not exceed the total risk and HI targets for the industrial exposure scenario. Because the EU-wide characterization is not complete, the RSL exceedances within SU I also are used to define the excavation boundaries for the Class I SU.
There are 15 sample locations with maximum detected concentrations exceeding industrial RSLs, 14 having constituents within the 0-2-fi depth interval and I has constituents up to 10 fl deep. Attachment IC provides the results of chemicals and radionuclides with maximum detections greater than their respective RSLs. As such, the area represented by these sample locations indicates that an RA is required. Table 3 indicates the analytcs and the number of exceedances observed.
2

5-25
Table 3. Class 1 SU analytes with maximum detected concentrations exceeding industrial RSLs
Analyte with maximum RL exceedance(s)
Number of exceedances
Uranium (total) Plutonium-239
RL ~ remediation level RSL = risk S<.Tetning level SU= Soil Unit
17
SU maximum detected
concentration 21,000 µg/kg
154
Industrial RSL
230 µg/kg 128 pCi/g
With the exception of sample location Z2-EU19-107, all ,nmple locations with maximum detected concentration<; of both tota l uran ium and plutonium-239 exceed corresponding industrial RSLs are coincident with locations defined by the con<;tituents presented above that exceed maximum or average RLs. When the uranium total concentrations coincident with the locations that have the maximum RL exceedances are eliminated, the resultant average uranium total within the Class I SU ( 47.4 µg/kg) would be less than the industrial RSL.
According to the Zone 2 RDRJRAWP (see Sect. 3.2), the final step in the risk evaluation is to evaluate the cumulative impact on risk over an entire EU from all chemicals and radionuclides with RSL exceedanees by comparing the sum of fractions (SOF) (average detected concentration/RSL) to 7.5 (because RSLs for carcinogens are set at 10 times less than their I x 104 excess lifetime cancer risks, the 7.5 SOF is approximately 75 percent of the Zone 2 ROD risk limit). Following complete characterization and RA within EU Z2-19, a fmal SOF for the EU Z2-19 risk screen will be performed.
Threat to groundwater. This evaluation is performed to ensure constituent concentrations in soil do not exceed modeled concentrations (GW SSLs) such that leaching would lead to groundwater concentrations in excess of drinking waler standards. Should constituents exceed GW SSLs, RA is required to protect groundwater. There are 31 sample locations with maximum detected concentrations exceeding GW SSLs, 31 have constituents within the 0-4-ft depth and 3 have constituents up to 1 O fl deep. Table 4 indicates the analytes and the number of exceedances observed.
Table 4. Class 1 SU analytcs w ith maximum detected concentrations exceeding GW SSLs
Analytc with Maximum RL exceedance(s)
Chromium Uranium-234 Uranium-235 Uranium-238 Technetium-99
GS~ groundwat..-
N umber of exceedances
I 4 1 8
34 I
RL • r<.1ncdia1ion level RSL • risk screening level
SU maximum detected
concentration 530 µg/kg
57,300 4,250 17,300
154 SSL ~ soil screening level SU • Soil Unit
Industrial RSL
172 µg/kg 6 1.1 61.1 611
128 pCi/g
One step in evaluating possible threats to groundwater is to estimate the volumetric extent and mass of analytes with G W SSL exceedances to determine whether the analytes pose a threat to groundwater (Zone 2 RDR!RA WP, Sect. 3. 2). The distribution of residual GW SSL exceedance locations forms a cluster near the interior of the Class I SU (Fig. 5) to the point where there is probably sufficient volume of contaminated soil so that the mass of the detected constituents pose a threat to groundwater. As such, the area represented by these sample location~ indicates that a RA is required.
1.4 I K-1031 Concrete S lab
Building K-1031 was constructed in 1945 as a maintenance support facility for Bldg. K-25. Building K-1031 was first used to store and dispense trapping media for spent cascade traps and was later used as a cutting and size-reduction area for process equipment removed from the Fercleve Thermal Diffusion Plant Beginning in the early l 960s,
3

5-26
Bldg. K-1031 was used for paint storage and mixing. Prior to demolition, the building was used for equipment and material storage.
Building K-1031 was demolished in 1999, leaving an approximately 4400 s r concrete slab in place. Demolition of Bldg. K-1031 is described in the Removal Action Report for the K-25 Awdlia,y Facilities Decommissioning Group I Buildings Demolition Pro_1ect at the East Tennessee Technology Park, OakRidge, Tennessee (DOE/OR/0l-l 829&DI) (K-25 AllXi liary Facilities RmAR). A radiological survey of the concrete slab was conducted in 1999 (Appendix A) that showed elevated radioactivity over the slab ranging up to 224,084 dpm/100 cm2 • Based on the radiological survey results, the K-1031 concrete slab was designated as a Contamination Area. Following the radiological survey, the slab was covered with 2 in. of asphalt, which is its current state. Based on this information, a RA is required.
1.5 I K-1410 Concrete Slab
BuildingK-1410 was constructed in 1944 to mix media from spent cascade traps for use in theK-25 Gaseous Diffusion Plant. Later the building was used for decontamination and recovery of uranium from large pieces of equipment. Two spray facilities were used to solubil ize and remove uranium contamination with nitric acid and to degrease pumps with trichloroethene. In 1963, Bldg. K-1410 was converted to an electroplating facility by remov ing the decontamination tanks and filling the degreasing pits with concrete.
Building K-1410 was demolished in 1999 leav ing an approximately 8700 sf" concrete slab in place. Demolition of Bldg. K-1410 is described in the K-25 Auxiliary Facilities RmAR. A radiological survey of the building floor was conducted in 1998 prior to demolition (Appendix BI), which showed elevated radioactivity over the floor ranging up to 48,000 dpm/100 cm2. A second radiological survey was conducted on a p it inside the facility in 1998 (Appendix B2). The results of the pit survey showed elevated radioactivity over the slab ranging up to 11,216 dpm/100 cm2
. A final radiological survey was conducted after demolit ion in 1999 on the end of an exposed pipe in the southwest comer of the concrete slab (Appendix B3). Results of the pipe survey showed elevated radioactiv ity of I, 718,200 dpm/100 cm2. The survey technicians reported the presence of "visible product inside and around the pipe openings".
Based on the radiological survey results, the Bldg. K-1410 concrete slab was designated a~ a High Contamination Area. Following building demolition and after final radiological surveying, the slab was covered with 2 in. of asphalt, which is its current state. Based on this information, a RA is required.
Decision
Based on the presence of ma'timum (Max) RL exceedances in soils, the presence of average (Ave) RL exceedances in soi ls, and a probable threat to groundwater from primarily isotopic uranium in soils, a decision has been made to conduct an RA in EU 22-19. As demonstrated on Fig. 5, the sample locations with 1',,!ax RL exceedances, Ave RL exceedances, and res idual GW SSL exceedances are clustered near the interior of the Class I SU and largely surrounded by sample locations with no criteria exceedance.~. Therefore, the are.al extents of the RAs are known with a high degree of certainty. Confirmation sampling condueced following the RA ( described below) will verify that the RA has been successful
ln add.it ion to soil excavation, the RA will also remove the Bldgs. K-1031 and K-1 410 concrete slabs. The two slabs are located within or adjacent to the boundaries for soil excavation (see Remedial Action Description section), but both slabs have been covered with approximately 2 in. of asphalt. The two slabs are listed in Appendix K of the Zone 2 RDR/RA WP as potentially contam inatcd. Evaluation of potentially contaminated slabs under the Zone 2 RDR/RA WP requires radiological surveys, visual inspections, and sampling in response to survey and visual observations. Because of the asphalt covering on each slab, neither slab can be evaluated in the manner prescribed by the Zone 2 RDR/RAWP. However, pre-asphalt radiological surveys of the slabs (Appendices A, B l , and B2) demonstrated the presence of elevated radioactivity, which resulted in the s labs' designations as Contamination Arca (K-1031) and High Contamination Area (K-1410). Based on the location within the area of EU Z2-19, which has been demonstrated to pose a threat to the industrial worker and a probable threat to groundwater as a result of radiological contamination, combined with historical radiological surveys of the slabs that show the slabs are radiologically contaminated, it is concluded that the slabs themselves pose a risk to the industrial worker under the Zone 2 ROD.
4

5-27
Remedial Action Description
The EU Z2-19 RA will be conducted within three primal)· boundaries referred to as Dig I , Dig 2 and Dig 3 (Fig 6), with the smaller dig, Dig 3, located within the bowidaries or Dig 2 (Fig. 6). Concrete demolishing equipment will be used to break up slabs, including any filled pits that are encowitered, into dimensions that are acceptable for disposal. Typical earth moving equipment will be used to excavate soil to the requisite depths as previously described. Remedial actions will begin at a pre-determined dig boundary and proceed inward and around to the lateral extent of the dig boundaries. C lean fill may be u5ed for clean working surfaces and for creating in-excavation berms for water control to prevent a potential for cross contaminating finished excavations pending confirmation sampling.
The I<-1410 and I<- I 031 concrete slabs are also located within the Dig 2 boundaries (Fig. 6).
Sample locations to be removed during the excavation of each dig are presented in Table 5. The contaminant mass characterized by these samples locations, in addition to the volume surrounding the sample locat ions, will be removed and replaced ultimately with clean fill. The RAs will result in both contaminant mass reduction and exposure pathway el imination, thereby providing protection to the indu5trial worker and groundwater. Following are descriptions of the digs that make up the RA
Dig l. Dig I is located on the north end or the EU Z2-19 Class I SU (Fig. 6). The area of Dig I is approximately 3800 sf and excavation will be conducted to a depth of3 ft.
Dig 2. Dig 2 is the largest of the EU Z2- l 9 RA digs (Fig. 6) The area of Dig 2 is approxin1ately 62,400 sf and excavation will be conducted to a depth or 4 ft, except in Dig 3 (below). The approximately 8700-sfK-14 IO concrete s lab will be excavated during excavation of Dig 2; therefore, the depth of excavation at the K-1410 footprint wi ll be 4 ft. One except.ion will be in the area of the filled pit, where the area be removed to the depth of the pit. The approximately 4400-sfI<-1 031 concrete slab is located on che north end of Dig 2 (Fig. 6). The K-1031 slab excavation will include the slab and incidental soil.
Dig 3. Dig 3 encompasses an area of approximately 4400 sf and the depth of excavation in Dig 3 will be 6 ft. The purpose for Dig 3 is to excavate the GW SSL exceedances at sample locations Z2-EU19B-152 and Z2-EU19B-157, which occur at depths between 5-6 ft below ground surface (Attachment IC).
During the remedial actions the boundaries of Dig I and Dig 2, including the K-1410 footprint, the K- 1031 footprint, and the footprint of Dig 3 to a depth of 6 ll in Dig 2, wi II be recorded using geospatial coordinates by means of an infield global positioning system instrwnent. This approach will .. map" the excavations for future reference as necessary.
Table 5. EU Z2-19 sample locutions included in the remedial action !xmnduries
Z2-EUl9- IOJ• Z2-EUl9-102 Z2-EU19- J03•
Z2-EU19-105' Z2-EUJ9- J06• Z2-EU19-107° Z2-EU19-108° Z2-EUJ 9- I 09 • Z2-EU19- I I0• Z2-EU1 9-1 I I • Z2-EUl9- l 12" Z2-EU19-l 13 • Z2-EUJ9- l 14 ° Z2-EUJ 9-115 • Z2-EUl9- l 16° Z2-EUl9- l l 7 • Z2-EU19-118•
D ig 1 immple locations Z2-EUl9-128 Z2-EUI 9-129 Z2-EU19-130
D ig 2 s;1mplc locations Z2-EU19-121 • Z2-EUJ9-124° Z2-EUl9B- l38 Z2-EUI 9B-139 • Z2-EUJ9B-140 Z2-EUI9B- 141 Z2-EU19B-142 Z2-EUl9B-145 Z2-EU19B-148 Z2-EU19B-149" Z2-EU19B- 168C' Z2-EUl9B-150 Z2-EUl9B- 151 Z2-EUI 9B-155 '
Z2-EUJ9B-134 Z2-EU19B-1 54 '
Z2-EUI 9B-15 ' Z2-EUJ9B-158 Z2-EU19B-159 Z2-EU19B-1 60 Z2-EU19B-162' Z2-EU19B-1 63 Z2-EU I 9B-164 ' Z2-EUJ 9B-165' Z2-EU19B-166 " Z2-EUJ9B-167 ' Z2-EUJ9B-167A • Z2-EUJ9B-167B• Z2-EUl9B-167C Z2-EU19B-167D"

5-28
Table 5. EU Z2-19 sample locations included in the remedial action boundaries (cont.)
Z2-EU19-l 19 Z2-EU19-120 • Z2-EU19-122" Z2-EU19-123"
Z2-EU198 -1 52 •
Dig 2 sample locations (cont.) Z2-EU19B- 155A Z2-EUI 9B-155B Z2-EUl9B-155C Z2-EU19B- 155D
Dig 3 sample locations Z2-EU19B- 157"
K-1031 concrete slab sample locations
Z2-EU19B-168 Z2-EUI 9B-l 68A Z2-EU!9B-168B Z2-EU19B-168D
Z2-EUI 9B-137 ( concrete only) K-1410 concrete slab sample locations
Z2-EU19B-153 ' (concrete and sub-slab soil) 17lOnc 2 ROD criteria excced:mccs loca1io11s; see Att.1chmcr1L 1 C for excecd;mce details.
Waste Disposition
Most of the materials excavated during the EU Z2-l 9 RA will be disposed at the Environmental Management Waste Management Facility (EMWMF) in accordance with an applicable Zone 2 waste profile, with smaller volumes of material being disposed oITsite as required. Table 6 presents the current estimate of waste for disposal. Actual waste volumes and di~posal facil it ies will be presented in the RA completion report.
Confirmation Sampling
Table 6. Projected volumes of material for disposal from the EU Z2-19 remedial action
\.Yaste medium Soil Concrete
CU • Exposure Unit
Projected volume for disposal {cy)
10,644 888
The following describes the process of sam piing to confirm the RA in the EU Z2-l 9 Class I SU has successfully removed threats to the industrial work.er and groundwater:
• Upon completion of both the lateral and vertical extent of a dig and excavation of the concrete slabs or when excavation activities warrant safe access to the excaYation areas, a radiological survey of the excavation walls and floor will be performed to semi-quantitatively identify potential areas within the excavation that exceed 2 times background. Locations exhibiting unacceptably high readings will be marked for additional excavation (nominally 1 fl. in all applicable directions into the underlying material) and the locations re-surveyed. This process wi ll continue until it is determined that excavation surfaces meet this criterion.
• Following the radiological survey and final excavation actions, the area consisting of the walls and floor will be determined. Similar to the characterization sampling, a statistical sampling approach has been developed based on the area using a superimposed two-dimensional grid spanning the excavation areas (or portions thereof, if required) using site coordinates and field measurements. The appropriate number of confirmatory samples based on statistical parameters of 95% confidence and 80% coverage was determined over a lTiangular grid w ith a random start for each dig area (see Fig. 7). Using this approach, approximately I ! sample locations will be selected from the floor and 3 from the wall of Dig I. Similarly, 17 grid locations were identified for the floor of Dig 2 with an additional 3 locations from the wall (which includes D ig 3). Finally, biased samples will be collected as detennined in the field, with up to 2 biased samples collected from Dig I (tota l of 16 samples), with up to 6 biased samples collected from Dig 2 and up to three collected from Dig 3 (approximately 29 samples in Dig 2/3). Once excavation in an area is deemed complete, the grid nodes in the area will be marked in the excavation and sample collected from the 0-1 ft. interval and sent to a laboratory for analysis with a nominal 3-day turnaround. Biased samples will be collected based on the highest radiological reading in an open excavation with the locations marked and recorded. The confirmatory samples w ill be discrete samples.
6

5-29
• Water management actions, including run-on/run-off controls, cover using clean fill or membranes will be implemented pending receipt of analytical confirmation samples results lo protect the integrity of the excavation.
• If an analytical result exceeds an RL or GW SSL in a wall or lloor confirmation sample, then the areas of the excavation that arc below criteria will undergo backfilling or covering with clean fill and an additional I ft of soil (moving radially away from the sample location in all applicable directions) will be excavated from the location represented by the confirmation sample. As discussed above, water management controls will be implemented 10
ensure the integrity of the additional excavated area pending receipt of sample analytical results.
• When confirmation sampling shows there are no RL or GW SSL exceedances in an excavation area, then the excavation area that the additional confirmation sample(s) represents will be backfilled. The entire area will be contoured and stabilized as appropriate once all excavation areas have been backfilled.
Expccl~.d Post-RA Conditions
As previously discussed, complete characterization of EU 2 2-19 is pending As such, data from additional sample locations will be combined with current locations outside of the RA in the Class I SU, as well as with appli cable data within the footprints of the RA s not impacted by the excavat ions, to determine a final r isk condition throughout the entire EU. Based on this evaluation, either a NFA will be determined for the EU or additional actions, as necessary, wi 11 be taken to ensure protection of the industrial worker and groundwater.
7

5-30
Attaclunent IA. Sample summ:u·y ror EU Z2-J9
Dote Laboratory analyses
EU collected Sample local.Ion Sa mule inlen:al Metals PCB RAD svoc voe Comme nts/descriptions Otaracterlzallon Samoll1ll! Z2-19 3127/2017 Z2-EUl 9-J0I 0-1 ft soil I I I I Class I SU RAD walkover &1r,•ey above-action level
Z2-19 3/27/2017 Z2-EU19-l02 0-1 ft soil 1 1 I I Class I SU RAD walkover rurvey above-action level
Z2-1 9 3/27/201 i Z2-EUI 9-103 0-1 fl soil I I I L Class I SU RAD walkover ~urvcy ilbovc-action level
Z2-19 312912017 Z2-EU L 9-104 0-1 ft soil I I I I Class I SU RAD walkover sonrcy above-action level
Z2-19 3/271201 7 Z2-EUl9-l05 0-1 ft soil 1 I I I Class 1 SU RAD walkover g1nrey above-.action level
22-1 9 3/291201 i 22-EU I 9-106 0-1 ft soil I I I I Class I SU RAD \\'alkovcr 91rvcy .1bovc-action level
Z2-19 313012017 Z2-EU L9-107 0-1 O .fl 3-interval composite I I I L Class I SU RAD walkover survey above-action level
Z2-19 3/27/2017 Z2-EU19-l08 0-1 ft soil 1 I I I Class I SU RAD walkover ~urvey 11bove-action level
22-1 9 3/231201 i 22-EU19-J09 0-l ft soil I l I t Class I SU RAD v.'alkovcr 91rvcy above-action level
Z2-19 3/2212017 Z2-EUI 9-110 0-1 ft soil t I 1 L Class I SU RAD walkover Y.Jrvey above-action level
Z2-19 31221201 7 Z2-EUl9-ll l 0-l ft soil I 1 I I Class 1 SU RAD walkover &1rvey above-action level
22-1 9 3/2212017 Z2-EU t9-112 0-1 ft soil I I I I Class I SU RAD walkover 9.1nrey above-action level
"" Z2-1 9 3/22/201 7 Z2-EUl 9-113 0-1 ft soil 1 l I I Class I SU RAD walkover survey abov~action level
22-1 9 3/231201 i 22-EU t9-114 0-l ft soil I l l t Class I SU RAD walkover 9.1nrcy above-action level
Z2-19 312312017 Z2-EUl 9-115 0-1 ft soil 1 I 1 L Class I SU RAD walkover runrey above-action level
Z2-19 3/23/2017 Z2-EU1 9-116 0-1 ft soil 1 1 I I Class 1 SU RAD walkover !11nrey above-action level
Z2-1 9 3/2312017 22-EU L9-117 0-l ft soil 1 l I I Class I SU RAD walkover 9,1nrey above-action level
Z2-19 312812017 Z2-EU l 9-118 0-1 ft soil 1 I 1 L Class I SU RAD walkover 9.l.rvey above.action level
Z2-19 312812017 Z2-EUl9-119 0-1 ft soil 1 1 I I Class I SU RAD walkover survey above.action level
Z2-1 9 3/2812017 Z2-EU19-l20 0-1 ft soil 1 l I I Class I SU RAD walkover &uvey above-action level
Z2-19 3/2812017 Z2-EUl 9-121 0-10 ft - 3 discrelc interval soil 0-0.5, 0.5-2, 3 3 4 3 Class I SU RAD walkover 9.l.rvcy above-action level L.S I\ witliin 2-10 ft - at RADI to
Z2-19 312812017 Z2-EU t9-122 0-10 f\ - 3 discrete interval soil 0-0.5, 0.5-2, 3 3 4 3 Class I SU RAD walkover sur,•cy above-action level 1.5 ft withill 2-10 ft. at RADI 13
Z2-19 3/2312017 Z2-EU 19-123 0-10 f\ - 3 discrele interval soil 0-0.5, 0.5-2, 3 3 4 3 Class I SU RAD walkover rurvey above-action level L.5 !\within 2-10 ft
Z2-1 9 3/2112017 Z2-EUl9-124 0-1 ft - 3-pou,t composite 1 l I I 3-point composite in area of historical Max RL
22-1 9 3/2912017 Z2-EU19-l25 0-1 ft - 4-ooint comoosite I l I I 4-ooint conmosite in area of historical Max RL

5-31
AUaclm1ent IA. Somple summary for EU Z2-19 (cont.)
Date Laboratory analyses
tu collected Samnle location Sm mole interval Meta.ls PCB RAD svoc voe Comments/descrloUons Delineation Samnllne-Z2-l 9 10/JS/Jl Z2-EU19B-l 26 LO fl • 4-interval - 0.5, 2, 4, and4-I Oft 3 3 3 3 4-L0 ft sample is conditional based on field screening 22-19 l0/2/17 22-EU19B-l27 lO fl - 4-interval - 0.5, 2, 4, and4-I Otl J 4-l0 ft sample is conditional based on field scrccning Z2-1 9 10/2/18 Z2-EU198- l28 LO fl - 4-int.erval - 0.5, 2, 4, and4-10ft 3 4-10 ft sample is conditional based on field screening 22-1 9 9/26117 Z2-EU t98-1 29 lO fl· 4-interval - 0.5, 2, 4, and4-I Otl 3 4-t0 ft sample is conditional based on field screening 22-19 10/3/ 17 22-EU l9B-130 10 fl, 4-inlerval • 0.5, 2, 4, and 4-IOft 3 3 J J 4-10 ft sample is conditional based on field screening 22-19 9/26/17 22-EUl9B-IJI 10 fl• 4-interval • 0.5. 2. 4. and4-10ft 3 4-L0 ft sample is conditional based 011 field screa1ing 22-19 9/26/17 22-EUl9B-l32 10 fl· 4-interval - 0.5, 2, 4, and4-10ft J 4-L0 ft sample is conditional based on field scrca1ing
22-19 9/28117 22-EUl98-133 10 fl· 4-interval • 0.5, 2. 4. and4-l0ft J 4-lO ft sample is conditional based on field screening 22-19 10/4/17 22-EUl9B-134 10 ft. 4-interval. 0.5, 2. 4, and4-10fl 3 3 3 3 4-10 ft sample is conditional based on field screening Z2-1 9 10/3/1 7 Z2-EU198-135 10 fl · 4-int.erval - 0.5, 2, 4, and4-l0fl 3 4-10 fl sample is conditional based on field screening 22-1 9 10/3/ l 7 22-EUl98-l36 lO fl · 4-interval - 0.5, 2, 4, and4-I Oft J 4-t0 ft sample is conditional based on field screening Z2-1 9 10/30/11 22-EU198-137 JO fl . 4-interval - 0.5, 2. 4, and4-IO ft; I 4 4-10 ft sample is conditional based on field screming;
concrete grab location ism the concrete pad (covered with asphalt. collect concrclc samp le for PCBs and RAD [remove •SJlhaltD
22-19 9/27/ 17 22-EUl9B-138 10 ft , 4-interval • 0.5. 2. 4, and 4-1 Oft 4 4 4 4 4-10 ft sample is conditional based on field screening Z2-19 10/12/17 22-EUl9B-139 10 ft - 4-int.erval - 0.5, 2. 4, and4-l0fl 3 4-10 fl sample is conditional based on field screening 22-1 9 IO/J2/J7 Z2-EU198-140 JO fl • 4-interval - 0.5, 2, 4, and4-1 0ft 3 4-L0 ft sample is conditional based on field screening
'-C 22-19 10/10/17 22-EU19B-14I lO fl - 4-intcrval • 0.5. 2. 4. and 4-IOtl 3 4-L0 ft sample is conditional based on field screening Zl-1 9 10/10/17 Z2-EU198- l42 10 ft . 4-int.erval . 0.5, 2. 4, and 4-1 Oft 3 3 3 3 4-L0 ft sample is conditional based on field screening 22-1 9 10/18117 Z2-EU L9B-143 lO fl · 4-intcrval - 0.5, 2, 4, and4-I Ofi J 4-10 ft sample is conditional based on field screening 22-19 10/18/17 22-EU l9B-144 10 ft, 4-interval • 0.5, 2, 4, and 4-IOft J 4-10 ft sample is conditional based on field screening 22-19 10/24/17 22-EUl9B-145 10 fl. 4-interval . 0.5. 2. 4, and4-10fl 3 4-10 fl sample is conditional based on field screening 22-19 10/19/17 22-EUl9B- l46 10 fl, 4-interval . 0.5, 2. 4, and4-10ft 4 4 4 4 4-l0 fl sample is conditional based on field screening 22-19 10116/17 22-EUl9B-147 10 fl• 4-interval • 0.5. 2. 4. and4-10fl 3 4-L0 ft sample is conditional based on field scrca1ing 22-19 10/16/17 22-EUl98- l48 lO fl-4-interval -0.5, 2. 4, and4-10ft 3 4-10 ft sample is conditional based on field screening Z2-1 9 10125/)) Z2-EU198-149 10 fl - 4-int.erval - 0.5, 2, 4, and4 -!0fl 3 4-L0 ft sample is conditional based on field screening 22-1 9 10/25/17 Z2-EU L9B-l50 lO fl . 4-interval - 0.5, 2, 4, and4-!0ft 3 3 J 3 4-10 fl sample is conditional based on field screening 22-1 9 10/25/17 Z2-EU198-15l lO fl . 4-interval - 0.5, 2, 4, and4-l0fl 3 4-10 ft sample is conditional based on field screening 22-1 9 10/ll/l 7 22-EU19B-l52 lO fl . 4-interval . 0.5, 2. 4, and4-I Oft 4 4-LO ft sample is conditional based on field scrcQ"ling 22-19 10/26/17 22-EUl9B-l 53 lO ft· 4-in terval • 0.5, 2, 4, and4-IO ft; l 4 4-l0 ft sample is conditional based on field screening;
concrete grab location is on the concrete pad (covered with asphalt, collect concrclc sample for PCBs and RAD [remove a.svhaltll
22-19 9/28117 22-EU l9B-l54 10 fl . 4-interval . 0.5, 2, 4, and 4-IOtl J 3 J 3 4-t0 ft sample is conditional based on field screening 22-19 9/27/l 7 22-EUl98-155 lO ft. 4-interval . 0.5, 2, 4, and4-10ft 3 Al fonner location 22-EUI 9-120; 4-LO ft sample is
conditional based on field screenin2 Z2-1 9 9/27/ \ 7 22-EU19B-155A 3 fl - 3-inta-val - 0.5 ft, 2 fl, and 3 ft 3 3 I ft north of Z2-EU19B- I 55; U-235 aJ1alysis and
metals 22-1 9 9/2711 7 22-EU 198-l 558 3 fl - ) -interval - 0.5 ft, 2 fl, and 3 ft 3 J I ft cast of Z2-EU19B-l 55; U-235 analysis and metals

5-32
.... 0
Date tu collected Samnle location
Z2-l9 9/27117 22-EUI 9B-155C
Z2-19 9/27111 Z2-EU19B-155D
Z2-1 9 10/11117 Z2-EU l9B-156 Z2-19 10125117 Z2-EU19B-157 22-1 9 10/17/l) Z2-EU19B-158 22-19 10117/17 Z2-EUl98-159 Z2-1 9 10/))117 Z2-EU198- l60 22-19 I 0/19/l 7 Z2-EU t9B-161 22-19 10/16117 22-EUl9B-162 22-19 10/11/17 Z2-EUl9B-163 Z2-l 9 10/11/17 Z2-EUl9B-164 Z2-19 10/9117 Z2-EUl9B-165 Z2-19 10/9117 Z2-EUl9B-166 Z2-19 10/411 7 Z2-EU19B-167
22-1 9 L0/4111 22-EU198-L6i A
Z2-19 10/4117 Z2-EUl9B-1678 Z2-19 10/4/17 Z2-EU198-167C
Z2-19 1014117 Z2-EU19B-167D
Z2-19 10/5117 Z2-EUl9B-168
22-19 1015117 22-EU198-168A Z2-19 10/5117 Z2-EUl9B-168B 22-19 1015117 Z2-EU198-168C
Z2-19 10/5117 Z2-EU19B-168D Z2-19 I 0/24/1 7 Z2-EU19B-169
Z2-19 I 0/16117 Z2-EU19B-l 70
aass 3 Soll Unit Sampling Z2-19 3/30/2017 Z2-EUl9B-30I
22-1 9 3130/2017 Z2-EU19B-302
Z2-l9 3130/2017 Z2-EU19B-303
AUaclm1ent IA. Somple summary for EU Z2-19 (cont.)
Laboratory analyses
Sm mole interval Meta.ls PCB RAD svoc voe Comments/descrloUons 3 fl· 3-interval • 0.5, 2, and 3 ll 3 3 I fl south of Z2-EU19B- l 55; U-235 analysis and
metals 3 ft - 3-intaval - 0.5, 2, and 3 I\ 3 3 I ft west ofZZ-EUI 98-155; U-235 analysis and
metals 10 n. 4-interval • 0.5. 2. 4. and 4-IOft 4 4-10 ft sample is conditional based on field scree,iing 10 ft - 4-int.erval - 0.5, 2, 4, and4 -10ft 4 4-10 ft sample is conditional based on field screening 10 fl - 4-interval - 0.5, 2, 4, and4-10ft 3 3 3 3 4-10 ft sample is conditional based on field scrcc:ni_ng 10 fl - 4-interval - 0.5, 2, 4, and4-10ft 3 4-10 ft sample is conditional based on field screening 10 fl - 4-interval - 0.5, 2, 4, and 4-1 Oft 3 4-10 ft sample is conditional based on field screening IO fl · 4-intcrval - 0.5, 2, 4, and4-l Oft 3 4-t0 fl sample is conditional based on field screening 10 (I, 4-interval • 0.5, 2, 4, and 4-IOft 3 3 3 3 4-10 ft sample is conditional based on field scree,iing 10 ft - 4-interval • 0.5. 2. 4. and4-10ft 3 4-10 ft sample is conditional based on field screening 10 (l. 4-interval -0.5, 2, 4, and4-10ft 3 4-10 ft sample is conditional based on field scrcating 10 ft· 4-interval • 0.5. 2. 4, and 4-IOft 3 4-10 ft sample is conditional based on field scree,iing 10 ft . 4-interval -0.5, 2. 4, and4-10ft 3 4-10 ft sample is conditional based on field screening 10 ft - 4-int.erval - 0.5, 2, 4, and 4-JOft 3 At fonner location RAOI 10; 4-1 0 ft sample is
conditional based on field screenin2 3 fl - 3-inl.erval - 0.5, 2, and 3 fl 3 3 L ft north ofZ2-IWI98-161; U2-35 analysis and
metals 3 fl - 3-interval - 0.5, 2. and 3 ft 3 3 I ft east of Z2-EUl9B-167; U-235 analysis and metals 3 ft - 3-intorval - 0.5, 2, and 3 ft 3 3 I ft south ofZ2-EU198-167; U-235 analysis and
metals 3 fl - 3-interval - 0.5, 2, and 3 II 3 3 I fl west of Z2-EUI 9B-167; U-235 analysis and
metals 10 ft• 4-interval • 0.5. 2. 4. and4-10ft 3 At hot svot based on BAR survey (general area of
fonner location Z2-EU19- ll 9); 4-10 ft sample is conditional based on field screening
3 ft - )-interval - 0 .5, 2, and 3 ft 3 3 I ft north ofZ2-EU198-16S; U-235 analysis metals 3 fl - 3-interval - 0.5, 2. and 3 n 3 3 I ft east of Z2-EUl 9B-168; U-235 analysis metals 3 ft - 3-intorval - 0.5, 2, and 3 ft 3 3 I ft south ofZ2-EU19B-168; U-235 and U-238
analvsi s metaJs 3 fl - 3-interval - 0.5, 2, and 3 II 3 3 I ft west of Z2-EUI 9B-168: U-235 analysis metals LO ft . 4-interval - 0.5, 2, 4, and 4-JO!l J Pipe draining into the CA; 4-1 O fl sample is
condilional based on field ~ccning LO ft - 4-intcrval - 0.5, 2, 4, and4-I O!l 3 Hol st:JOI near staircase; 4.10 ft sample is condiliCJrnl
based on field screening
0-10 ft. 3 interval composite soil 0-0.5. 0.5-2, I I 1 I Class l SU utility corridor sample location l.5 ft within 2-10 ft 0-10 fl. 3 interval composite soil 0-0.5, 0.5-2, I I I I Class 3 SU utility corridor sample location LS ft within 2-10 ft 0-1 0 J1. 3 interval composite soil 0-0.5, 0.5-2, I I l L Class 3 SU utility corridor sample loca1ion l.5 fl witltin 2-10 ft

5-33
.... ....
Date tu collected Samnle location
Z2-l 9 3/30/2017 Z2-EU L9B-304
Z2-19 3/291201 7 Z2-EU L9B-305
SAR = biased area radiation CA ;;;: contamination area EU = Exposure Unit Max = maximum PCB = polychlorinated biphenyl
AUaclm1ent IA. Somple summary for EU Z2-19 (cont.)
Sm mole interval Meta.ls 0-10 fl. 3 interval composite soil 0-0.5, 0.5--2. l.5 fl witl1in 2-10 ft 0-10 fl. 3 interval composite soil 0-0.5, 0.5-2. l.5 fl within 2-10 ft
Total EU Z2-19 Analyses
RAD = radiological RL ;;; remediation level SU = Soil Unit SVOC = scmivolatile organic compound VOC = volatile organic compound
I
I
104
Laboratory analyses
PCB RAD svoc I 1 l
1 I l
?O 182 68
voe Comments/descrloUons Class 3 SU utility corridor sample location
l Class 3 SU adjacent to storm drain
I

5-34
Attachment IB. EU Z2- 19 Class l SU data summary•
Number A \'g Number Number or Number of dete<t,;
Freqmmcy MJn Max detected o f detects 2: detects 2: RSL' (10~ or detects 2: e! GW AnaJ,•le or detect detectJ.c: detect"' result' Mu RL' MaxRL' Avg RI./ A~RLe orHl: l) RSL' GwssL• SSL'
Inoroantcs m .. Aluminum 1041104 2860 320001 13126 1100000 0 Antimony 7/1 04 0.3621 6.07J 1.61 470 0 144 0 Arsenic 104/104 3.14) 62.9J 8.57 900 0 300 0 300 0 66.3 0 Barium 1041104 17J 221 66.7 220000 0 9 150 0
Beryllium 981104 0.383/ 2 .99 1.24 2300 0 Boron i S/104 1.53) 11.S 4 .83 230000 0 Cadmium 103/104 0 .0307 J 298 6.74 980 0 Calcium 103/103 283 223000J 13414 Chromium 1041104 6.93 530 27.1 1800000 0 172 Cobalt 104/104 0.1 98/ 28.6J 12.7 350 0 Copper 1041104 6.2 836 39.5 47000 0 Iron 104/104 8730 82100 26586 820000 0 Lead 102/104 1.43) 4281 37.3 800 0 3370 0 Lithium 104/104 6.751 152 29.5 2300 0 Magnesium 104/104 452J 40000) 3900 Manganese 104/104 IOSJ 7S20J 1096 26000 0 Mercury 6 7/68 0 .0128J 0.928 0.131 1800 0 600 0 600 0 Molybdenum 941104 0.3281 39.2 1.68 5800 0 Nickel 104/104 5.88 957 54.8 22000 0 Pota:ssiurn 1041104 3311 10800/ 1201 Selenium 67/103 0.5671 l 2.9J 2.09 5800 0 Silver 43/104 0.1 351 7.13J 0.583 5800 0 Sodium 1021104 7.921 3940J 78.1 n,allium 971104 0.1641 4.65J 0.405 12 0 10.8 0 Uranium 104/104 1.16) 21000) 346 230 17 Vanadium 1041104 9.56 79.9 35.8 5800 0 Zinc 104/104 7.41) 821 104 350000 0 Poll'chlo rinated biphenvls !!!;g~ PCB-1016 0170 100000 0 10000 0 10000 0 PCB-1221 0/iO 100000 0 10000 0 10000 0 PCB-1232 0/iO 100000 0 10000 0 10000 0 PCB-1242 0/70 100000 0 10000 0 10000 0 PCB-1248 1/70 2790 2790 2 790 100000 0 10000 0 10000 0 PCB-1254 39/70 3.2J 21700 811 100000 0 10000 I 10000 I PCB-1260 39/70 1.73) 4590 288 100000 0 10000 0 10000 0 PCB-1262 0170 100000 0 10000 0 10000 0 PCB-1268 1/70 429 429 429 100000 0 10000 0 10000 n Total PCBs 44/70 1.73) 26300 1048 100000 0 10000 I 10000 RadionucUdes Clf Actiniunt•228 1361138 0.513 26.3J 2.1 6 l OiOO 0 Alpha activity 1811181 7.27) 60100 913 Amcricium-241 17/180 0.0436 32.7J 4 .57 47.6 0 Beta aclivity 180/181 8.08) 29800) 326 Bismuth-212 515 2.7 9 .99 7.03 536000 0

5-35
Attachment lB. EU ZZ-19 Class I SU data summary• (cont.)
Number Avg Number Number of Number of detects
Frequency l\Un Max dcledoo of detects ;;, detects;;, RSL1 (10-' or d etects ;;, ;;, GW AnaMe or detect detcct'-c delecl"' result' MaxRL' ~tax RV' Avg Rl/ A!!:RL' or HJ: !) RSL' GWSSL• SSL'
Bismuth-214 167/167 0.525 64.8 2.43 109000 0 Cesium-137 65/181 0 ,0829J 4060 67.8 20 6 2 14 2 14 Cobalt-GO 0/181 0.483 0 CUrium-244 0/141 348 0 Lcad-2 10 1/1 2.14 2 .1 4 2.14 Ji.6 0 Lead-2 12 174/1 74 0.666 9.71 1.69 57200 0 Lead-214 173/173 0.683 54.2 236 648000 0 Neptunium-237 4/181 0.471 1.23 0.781 50 0 5 0 5 0 Plutoniurn-238 3/181 0.836 2.35J 1.4 7 148 0 Plutonium-239 321181 0 ,0622J 154) 13,7 128 1 Plutonium-241 11141 0,887 J 0,887 J 0,887 15300 0 Potassium40 179/181 l.09 5 1.6 20.7 2.2 177 Protactinium-234m 43/43 28.1 17300 646 UE+08 0 Ra/Th decay series' 181/18 1 0.0000) 6254 76.7 15 15 5 23 5 23 Radium-226' 175/181 0.342 71.7 2.52 Slronlium-90 91141 0.936 125 18 384 0 Technctium-99 231181 2.04 2640J 134 121000 0 12100 0 12100 0 85,6 '11,allium-208 142/142 0.215 2.Sl 0.534 298000 0 Toorium-228' 1741181 0.557 10.4J 1.51 Toorium-230' ISi/iSi 0.43 6 170J 16,6 Thorium-23 2J 177/181 0.63 86.7J 2.68 Thorium-234 135/181 0.974 11400 165 24500 0 .... Uranium-234 181/1 8 1 I.I I J 5i300J 507 7000 2 700 6 700 6 61.1 4 1 w Uranium-235 114/21 i 0.249 4250) 71.2 80 7 8 40 s 40 61.1 8 Uranium-238 ISl/182 0,995 17300) 163 500 s 50 42 50 42 61.1 34 Scmlvolattle organic com~unds (!1glke.} 1.2.4-Trichlorobenzene 0/68 260000 0 1.2-Dichlorobcnzcne 0/68 9300000 0 L.3-Dichlorobenzene 0/68 L.4-Dichlorobenzene 0/68 1 IOOOO 0 2.3.4,6-Telrachlorophmol 0/68 25000000 0 2,4,5-Trich lorophenol 0168 82000000 0 2,4,6-Trichlorophenol 0168 820000 0 2,4-Dich lorophmol 0168 2500000 0 2,4-Dimelhylphmol 0168 16000000 0 2.4-Dinitrcphenol 0/68 1600000 0 2.4-Dinitrotoluene 0/68 74000 0 2.6-Dinitrotolucne 0168 15000 0 2-C11loronaphlhalene 0168 60000000 0 2-Clilorophenol 0/68 5800000 0 2-Mctliyl-4,6-dinilrophenol 0/68 66000 0 2-MctJ1yh1 ,phthalcnc 8168 14.4) 120) 43 3000000 0 2-Mcthylphenol 0168 41000000 0 2-Nitrobcnzcnaminc 0168 8000000 0 2-Nilrophcnol 0/68 3,3'-Dichlorobenzidine 0/68 51000 0 3-Nitrobe112cnaminc 0168 4-Bromophenyl phenyl etlicr 0168

5-36
Attachme nt lB. EU ZZ-19 C lass I SU d ata summary• (cont.)
Number Avg Number Number of Number of detects
Frequency l\Un Max dcledoo of detects ;;, detects;;, RSL1 (10-' or d etects ;;, ;;, GW AnaMe or detect detcct'-c delecl"' result' Max RL' ~tax RV' Avg Rl/ A!!:RL' or HJ: !) RSL' GWSSL• SSL'
4-0lloro-3-methylphenol 0/68 82000000 0 4-0llorobenzenarnine 0/68 110000 0 4-Oilorophenyl pho1)! etlier 0/68 4-Nitrobenzenamine 0/68 1100000 0 4-Nitrophcnol 0168 ACaltlphthalc: 4168 14.91 209) 74.6 45000000 0 Accnaphthylcnc 4168 22.Sl 176) 64.1 Aniline 0168 4000000 0 Anthraccne 6168 2l.5J 6081 162 2.3E+08 0 Bcnz(a)anthracene 24/68 13.31 902 148 210000 0 Bcnzenernethanol 0/68 82000000 0 Bcnzo(a)pyrcne 21/68 16.1 l 703 146 21000 0 Benzo(b)lluorantliene 22/68 15.Sl 929 189 210000 0 Bcnzo(ghi)pcrylcnc 20/68 I S.il 3321 88 9 Bcnzo(k)fluoranthcnc 14168 I 5.31 365 Ill 2100000 0 Be112.oic acid 0168 3.3E+09 0 Bis(2-chloroethoxy)methane 0168 2500000 0 Bis(2-chloroethjil) ether 0168 ]0000 0 Bis(2-chloroisopropyl) ether 0/68 47000000 0 Bis(2-ethylhexyl)phthalate J /68 166J 1661 166 1600000 0 ?1 1;i00 00 n Butyl benzyl phtlialate 0/68 12000000 0 Carl>azole 6/68 19.ll 1030 232
~ ChrysCJte 23168 12.6) 85i 150 21000000 0 Dib en z( a,h )an lh ra ccn c 6168 33.2) 138 68 21000 0 Dibmzofuran 1/68 l 66J 166) 166 1000000 0 Diethyl phthalate 0/68 6.6E+08 0 Dim ethyl phthalate 0168 Di-n-octylphthal,te 0/68 8200000 0 Diphenylamine 0/68 82000000 0 Fluorantl1ene 28168 13.21 19S0J 215 30000000 0 Fluorenc 4168 16.71 7251 226 30000000 0 Hcx:achlorobenzene 0168 9600 0 Hcxachlorobutadicnc 0168 53000 0 Hexachlorocydopentadiene 0/68 7500 0 Hexachloroethane 0/68 80000 0 Indeno(l ,2,3-cd)pi,rene 13/68 15J 338 116 210000 0 l sophorone J /68 730 730 730 24000000 0 m+p Metl1ylphenol 0/68 Naphtl1alene 7168 17.J l 620 133 170000 0 Nitro benzene 0168 220000 0 N•Nitroso•di-n-propylamine 0168 3300 0 Pcnli1diloropha10I 016$ 40000 0 Phenanlhrene 23/68 13.8) 3300J 226 Phenol ) /68 149J 149) 149 2.SE+08 0 P)'Tene 2 i/68 12.5J l800J 195 23000000 0 P idine 0/68 1200000 0 VolalUe orga.nJc componnds (ttg~) J.1.1-Trichloroetliane 0/1 36000000 0 97900 0

5-37
.... v ,
AnaMe 1.1 .2.2-Tetrach loroethane 1.1.2-Trichloroethane l.1 -Dichloroethane 1.1 -Dichloroethene 1.2-Didilorocthanc l ,2-Dic:hloroprop:me 2-Bulanone 2-Hcxanone 4-Methyl-2-pentanone Acetone Benzene BromodichlororneUrnne Bromofom, Sromomethanc Carbon disulfide Carbon tetrac:hloride Chlorobcnzene Chloroethane Chlorofom, Chloromethane cis-1, 2-Did1loroctJ1cne cis-1,3-Didiloropropcne Dibromoch loromethane Ethyl benzene Methylene chloride St;rcne Tetrachloroethene Toluene Total Xylene tr a.ns-1 ,2-Dich lorod.hcnc tr ans-l ,3-Dich loropropcn e Trichloroethene Vin\1 chloride
Frequency or detect
Oi l Oi l Oil Oi l 011 011 Ill Oi l 011 1/1 Oi l 011 Oi l 011 Oi l Oi l Oil Oi l Oi l Oi l 0/1 0/1 0/1 0/1 Oi l Oi l 0/1 Oi l Oi l Oi l Oil 0/1 0/1
l\Un detcct'-c
3.491
t S.81
Attachment lB. EU ZZ-19 Class I SU data summary• (cont.)
Max detect"'
3.49]
1.1.8]
Avg detected result'
3.49
1.1.S
Number of detects ;;,
Max R L' ~tax RV ' Avg Rl/
Number of detects;;, A!!:RL'
RSL1 (10" or HJ: !)
27000 6300
160000 1000000 20000 66000
l.9E+08 1300000 1.4E+08 6.7E+08 51000 13000
860000 30000
3500000 29000
1300000 57000000
14000 460000 2300000
390000 250000
3200000 35000000
390000 47000000 2500000
23000000
)9000 J 7000
Number or d etects ;;,
RSL' 0 0 0 0 0 0 0 0 0 0 0 0 0 0 0 0 0 0 0 0 0
0 0 0 0 0 0 0 0
0 0
Number of detects
;;, GW GWSSL• SSL'
1370 0
l ~O 0 ng o
1150 0
?iiO 0
1230 0
241 0
4720 0 102000 0
1720 0 176 0
'Stations in S11mmary incluclc Z2·EU 19- l 0 t , Z2-EU19-102, Z2-EUJ9- 103, Z2·EUJ9-1 04, Z2·EU19-1 05, Z2·EU19- t06, Z2-EU19-10i, Z2-EU19- 108, Z2-EUJ9. L09, Z2-EUJ9. t1 0, Z2-EUI 9-111, Z2-EU19-112, Z2-EU19-I 13, Z2-EU l9- 114, Z2-EU19-l 15, Z2-EU19-116. Z2-EU19-117. Z2-EU19-! 18. Z2-EUI 9-119, Z2-EU19-120. Z2-EU19-121. Z2-EU19-122. Z2-EUl 9-123, Z2-EU19· 124, Z2-EU19-125, Z2-EU198-126, Z2-EU 19B-l27, Z2-EUJ98-128, Z2-EUJ98-129, Z2-EU198-130, Z2-EU198-131, Z2-EU198-I32. Z2-EUI98-133, Z2-EUI98-134, Z2-EUI98- 135, Z2-EU19B-136. Z2-EUl98-137, Z2-EUl 98-138, Z2-EUl 98-139. Z2,EUl 98-140, Z2-EUl9B,14 1. Z2-EUl9B-142, Z2-EUl98-143. Z2-EUl 98-144. Z2-EUl98-145, Z2-EUl9B,146, Z2-EU l 9B,147, Z2-EU198 -148, Z2-EUl98-l49, Z2-EUJ98-150, Z2-EUl 9B-l 51, Z2-EUl 98-152. Z2-EU19B,153, Z2-EUl98-l54, Z2-EU198-155. Z2-EU19B,155A. Zl-EUl9B-155B. Z2-EU198 -155C, ZlEUJ9B-155D, Z2,EUl 98-156, Z2-EUl 98-157. Z2-EUl 98-158, Z2-EUl98-159, Z2-EUl 9B-160, Z2-EUl98-161, Zl-EU19B-162, Z2-EUl 98-163, Zl-EUl 98 -164, Z2-EUl98-165, Z2-EU19B-166, Z2-EU198-167, Z2-EU198-167A, Z2-EU L98-1678, Z2-EUI 98 -167C, Z2-EU198-167D, Z2-EU198-168, Z2-EUl98-168 A, Z2-EUI 98-168B, Z2-EUJ98-168C, Z2-EUl98-168D, 22-EUI 98-169, Z2-EU198-l70, Z2-EUJ9B-301, Z2-EU 19B-302, Z2-EU198 -l0l, Z2-EU198-304, andZ2,EUl 98-305.
~•r validation qualifier means the analytewas positively identified and the result is the approximate c-onccnlration in lhe sample. 'Blanks indicalc the analytcwas not detected. "Max RL values are presented; blanks indicate there is no Max RL for the anal)te, Max RLs are from Zone 2 ROD Table 2. 13, °"cept for technetium-99, which is presented in Zone 2 RDRIRA WP
Sect.3.1.2. "Blanks indicate Uie criterion docs not apply to the analytc. I Avg RL values are presented; b lanks indicate U1ere is no AvgRL for U1e anal)le. Avg RLsare from Zone 2 ROD T, ble 2.1 4, except fortechnetium-99, which is presented u, Zone 2 RDRIRAWP
Sect 1. 1.2

5-38
.... "'
Attachment lB. EU ZZ-19 Class I SU data summary• (cont.)
Number Avg Number Number of Number of detects
Frequency i\'Hn Max dcledoo of detects ;;, detects;;, RSL1 (10-' or dctects ;;, ;;, GW Analyte or detect detcctM delecl"' result' Max RL' Max RL' Avg Rl/ Avg RL' or HJ: !) RSL' GW ssL• SSL'
'RSL values r,rc presented; blanks indicate !here is no RSL for the onal}te. Chemical RSLs were calculated using the website al hllp:llcpa-prgs.oml.govlcgi-bin/chc,nicals/csl_scard1, June 2017 revision; radionuclide RSLs were calculated during June 201 7 using the website at http://epa-prgs.om l.govlcgi-bin/radionuclidesltprg_scard>.
' GW SSL values are presented; blanks indicate there is no GW SSL for the anal)te. GW SSLs are from Zone 2 ROD Table C.5, except for technetium-99, which is presented in Zone 2 ROR./RA ll'P Sect. 3.1.2.
JThe Ra/111 (radium/thorium) decay series results are calculated values for each sample base<1 on detections ofra.dittm•226. thorium.230, and lhorium-232 as di9:ussed in the Zone 2 ROD.Because the calculation involves subtraction of background from analytical results and negative numbers are not atlowe(\ 0 (zero) is a legitimate result.
' These radionuclide, are not included in aggregate risk calculations for the EU, instead, human health risl< effects of these radionuclide, (thorium-228 is included in the thorium-232 decay series) arc evaluated with Ute Ra/Th decay series RLs as discussed in Ute Zone 2 ROD.
Avg - average EU = exposure unit GW = groundwater HI = hazard index Max= maximum Min - mininlunl PCB = polychlorinated biphcnyl
RDRIR,\WP = Rcmcdi:L! Design Rcport/Ranedial Action Work Plan RL = remediation level ROD = Record of Decision RSL = risk screening level SSL = soil screening level SU = Soil Unit

5-39
AU.achment l C. Details of Zone 2 ROD criteria exceedances in EU Z2-19, Class 1 SU charactcriwtion and delineation samples
Start depth Sample location (ft) End depth (ft) Analyte Result" Criterion value•
Max RL exceecfances Z2-EU19-109 0 Ra/ f h decay series 6254 15 Z2-EUl9- I IO 0 Ra/fh decay series 4113 15 Z2-EU1 9-11 I 0 Cesium-137 38.4 20
Ra/fh decay series 881 15 Z2-EUI 9-112 0 Cesiwii-137 46.9 20
Ra/fh decay series 1330 15 Z2-EU19-113 0 Ccsiw11-137 4060 20
Ra/Th decay series 569 15 Uraniwn-234 16900 7000 Uranium-235 977 80 Uranium-238 17300 500
Z2-EU19- l 14 0 Cesium-137 24.9 20 Raff h decay series 28.4 15 Uranium-238 599 500
Z2-EU1 9-115 0 Uranium-235 106 80 Uraniwn-238 1390 500
Z2-EUl9- l 16 0 Ra/f'h decay series 28.1 15 Z2-EU19-117 0 Ra/fh decay series 28.1 15 Z2-EU1 9-120 0 Ra/ f h decay series 59 15
Uranium-234 57300 7000 Uranium-235 4250 80 Uranium-238 1950 500
Z2-EU1 9-122 0 0.5 Uranium-235 473 80 Uraniwn-238 501 500
Z2-EUl9-123 0 0.5 Ra/fh decay series 90.9 15 Uranium-235 112 80 Uranium-238 1260 500
Z2-EU19-124 0 1 Ra/fh decay series 15.7 15 Z2-EUI 9B-149 0 0.5 Ra/ J'h decay series 53.1 15 Z2-EU19B-152 0 0.5 Ra/fh decay series 18.9 15 Z2-EU1 9B-1 54 0 0.5 Cesium-137 125 20
Ra/ f'h decay series 132.8 15 Z2-EU19B-1 55A 0.5 0.5 Uranium-235 780 80 Z2-EU19B-157 0 0.5 Ccsiw11-137 208 20
Ra/l' h decay series 79.83 15 Uraniwn-238 516 500
2 2 Uranium-238 571 500 Z2-EU19B- l 68C 0.5 0.5 Uraniwn-235 495 80 Avg RL cxcccdanccs ( not accounted for by Max RL cxcccdanccs) Z2-EU19-101 0 1 Uranium-238 61.9 50 Z2-EU19- I03 0 1 Uranium-235 18.2 8
Uranium-238 180 50 Z2-EU19-105 0 Uranium-235 12 8
Uraniwn-238 119 50 Z2-EUI 9-106 0 Uraniwn-238 50.7 50 Z2-EU19-107 0 Ccsiw11-137 2.13 2
Ra/Th decay series 5.43 5 Uraniwn-235 8.77 8 Uranium-238 83.8 50
Z2-EUl9-108 0 Ra/fh decay series 11.7 5
17

5-40
Attachment l C. Details of Zone 2 ROD criteria excec.dances in EU Z2-19, Class 1 SU characterization and delineation samples (cont.)
Stnrt depth Samele location {ft} End dceth {ft} Annlvte Result• Criterion vnluc•
Z2-EUl9-109 0 I Ccsiwn-137 4.04 2 Uranium-235 8.95 8 Uranium-238 83.7 50
Z2-EUI 9-110 0 Uranium-238 55.8 50 Z2-EU19-lll 0 Uranium-235 18.3 8
Uranium-238 221 50 Z2-EUI 9- 112 0 Uranium-235 9. 16 8
Uranium-238 103 50 Z2-EU19- l 14 0 Uranium-235 55.4 8 Z2-EUI 9-115 0 Uranium-234 1280 700 Z2-EUl9-l 16 0 Ccsium-137 12.5 2
Uranium-235 9.12 8 Uraniwn-238 66.2 50
Z2-EUI 9-117 0 Ccsium-137 16.4 2 Uranium-235 20.6 8 Uranium-238 246 50
Z2-EU19-118 0 Uranium-235 19 8 Uranium-238 274 50
Z2-EU19-121 0 0.5 Rafrh decay series 5.4 5 Uranium-234 728 700 Uranium-235 47.2 8 Uraniwn-238 290 50
Z2-EU19-122 0 0.5 Ra/fh decay series 5.1 5 Uranium-234 6960 700
Z2-EU19-123 0 0.5 Ccsium-137 11.4 2 Uraniwn-234 1220 700
0.5 2 Uranium-235 26. 1 8 Uranium-238 322 50
Z2-EU1 9-124 0 Ccsium-137 5.17 2 Uraniwn-238 78.1 50
Z2-EUI 9B-139 0 0.5 Raff h decay series 5.61 5 2 2 Uranium-238 55.2 50
Z2-EU1 9B-1 49 0 0.5 Ccsium-137 13.8 2 Uranium-238 52.5 50
2 2 Uranium-235 28.3 8 Uranium-238 246 50
4 4 Uranium-235 8.37 8 Uranium-238 99.3 50
Z2-EU19B-1 52 0 0.5 Uranium-235 8. 12 8 Uraniwn-238 79.7 50
5 5 Uranium-235 8.36 8 Uranium-238 56.7 50
Z2-EU19B-1 53 0 3 Total PCBs 26300 10000 Z2-EU19B-154 0 0.5 Uranium-235 9.57 8
Uraniwn-238 94.6 50 2 2 Raffh decay series 10.83 5
Uranium-238 57.5 50 Z2-EU19B-155 0.5 0.5 Ccsium-137 2.77 2
Ra/l'h decay series 6.23 5 Z2-EU1 9B-1 55A 2 2 Uranium-235 74.3 8
18

5-41
Attachment l C. Details of Z one 2 ROD criteria excec.dances in EU Z2-19, Class 1 SU characterization and delineation samples (cont.)
Stnrt depth Samele location {ft} End dceth {ft} Annlvte Result• Criterion vnluc•
Z2-EUl9B-156 2 2 Uranium-238 111 50 4 4 Uranium-235 15.8 8
Uranium-238 207 50 5.25 5 25 Uranium-238 58. 1 50
Z2-EU19B-157 0 0.5 Uranium-235 44.4 8 2 2 Raff h decay series 7.06 5
Uranium-235 51.8 8 4 4 Uranium-235 33.7 8
Uranium-238 362 50 5.7 5.7 Uranium-238 83.6 50
Z2-EUI 98-164 0 0.5 Uranium-23 5 15.1 8 0 0.5 Uranium-238 160 50 2 2 Uranium-238 79.9 50 4 4 Uranium-235 22.4 8
Uranium-238 200 50 Z2-EUI 9B-1 65 0 0.5 Uranium-235 13.5 8
Uranium-238 95.2 50 Z2-EUl9B-166 0 0.5 Uranium-235 8.6 8 Z2-EU19B-1 67 0 0.5 Uranium-235 14.8 8
Uranium-238 78.6 50 Z2-EU19B-167 A 0 0.5 Uraniwn-235 25.4 8
2 2 Uranium-235 16.3 8 Z2-EUI 98- l 67B 0 0.5 Uranium-235 24.7 8 Z2-EUI 9B-1 67D 0 0.5 Uranium-235 13.7 8
Z2-EU198-168C 2 2 Uraniwn-235 23.3 8 3 3 Uranium-235 23.5 8
Uranium-238 52.2 50 RSL exceedances {not accounted for by RL exceedances} Z2-EU19-103 0 1 Uranium 574 230 Z2-EUl9-107 0 10 Uranium 421 230 Z2-EU19- 109 0 1 Uranium 273 230 Z2-EU19-110 0 Uranium 388 230 Z2-EUl9-l l l 0 Uranium 260 230 Z2-EU19-l 12 0 Uranium 391 230
Plutonium-239 154 128 Z2-EU1 9-113 0 1 Uranium 21000 230 Z2-EUl9-l 14 0 I Uranium 1090 230 Z2-EU19- 11 5 0 1 Uranium 1100 230 Z2-EUl9-121 0 0.5 Uraniwn 365 230 Z2-EU19-122 0 0.5 Uranium 325 230 Z2-EUI 9-123 0 0.5 Uranium 2940 230
0.04 0.17 Uranium 1060 230 Z2-EU19-124 0 1 Uranium 520 230 Z2-EUI 9B-167 A 2 2 Uranium 236 230 Z2-EU19B-168C 0.5 0.5 Uranium 1850 230
2 2 Uraniwn 239 230 GW SSL cxcccdanccs Z2-EU19-101 0 Uranium-234 71.8 611
Uranium-238 61.9 6Ll Z2-EUl9-103 0 Uraniwn-234 194 6Ll
Uranium-238 180 6 1.1
19

5-42
Attachment l C. Details of Zone 2 ROD criteria excec.dances in EU Z2-19, Class 1 SU characterization and delineation samples (cont.)
Stnrt depth Samele location {ft} End dceth {ft} Annlvte Result• Criterion vnluc•
Z2-EUl9-105 0 I Uranium-234 114 61.1 Uranium-238 119 6 Ll
Z2-EU19-106 0 Uranium-234 78 1 611 Z2-EUl9-107 0 Uranium-234 113 61.1
Uranium-238 83.8 61.1 Z2-EU19-109 0 Uraniwn-234 83.4 6 1.1
Uranium-238 83.7 61.1 Z2-EUl9-l l l 0 Uranium-234 215 61.1
Uranium-238 221 6 11 Z2-EU19-l 12 0 Uranium-234 90.9 6 1.1
Uranium-238 103 6 1.1 Z2-EU1 9-1 13 0 Chromium 530 172
Technetiwn-99 2640 85.6 Uranium-234 16900 6 11 Uranium-235 977 6 1.1 Uranium-238 17300 611
Z2-EU19-114 0 Uranium-234 563 611 Uranium-238 599 6 1.1
Z2-EU19-l 15 0 Uraniwn-234 1280 6 1.1 Uranium-235 106 61.1 Uranium-238 1390 611
Z2-EU19-116 0 Uranium-234 69.7 611 Uraniwn-238 66.2 6 1.1
Z2-EU19-117 0 Uraniwn-234 291 6 1.1 Uranium-238 246 61.1
Z2-EU1 9- I I 8 0 Uranium-234 280 6 Ll Uranium-238 274 61.1
Z2-EUl9-120 0 Uranium-234 57300 6 1.1 Uranium-235 4250 61.1 Uranium-238 1950 6 1.1
Z2-EU19-121 0 0.5 Uranium-234 728 611 Uranium-238 290 6 1.1
Z2-EU19-122 0 0.5 Uraniwn-234 6960 61.1 Uranium-235 473 61.1 Uranium-238 501 611
4.4 4.4 Uranium-234 70.9 6 1.1 Z2-EU19-123 0 0.5 Uraniwn-234 1220 6 1.1
Uranium-235 112 61.1 Uranium-238 1260 611
0.5 2 Uranium-234 318 61.1 Uranium-238 322 61.1
Z2-EU19-124 0 Uraniwn-234 85.3 6 1.1 Uranium-238 78. 1 61.1
Z2-EUI 9B-149 2 2 Uranium-234 247 61.1 Uranium-238 246 6 1.1
4 4 Uraniwn-234 103 6 1.1 Uranium-238 99.3 61.1
Z2-EUI 9B-152 0 0.5 Uranium-234 87.9 61.1 Uranium-238 79.7 6 1.1
5 5 Uraniwn-234 100 61.1
20

5-43
Attachment l C. Details of Zone 2 ROD criteria excec.dances in EU Z2-19, Class 1 SU characterization and delineation samples (cont.)
Stnrt depth Sample location (ft) End depth (ft) Annlvte Result• Criterion vnluc•
Z2-EUl9B-154 0 0.5 Uranium-234 103 61.1 Uranium-238 94.6 611
2 2 Uranium-234 65.3 6 1.1 Z2-EUl98-155 2 2 Uranium-234 64.4 61.1 Z2-EU19B-155A 0.5 0.5 Uranium-235 780 61.1
2 2 Uranium-235 74.3 611 Z2-EUI 9B-156 2 2 Uranium-234 112 61.1
Uranium-238 111 6 1.1 4 4 Uranium-234 200 61.1
Uranium-238 207 6 1.1 Z2-EUl9B-157 0 0.5 Uranium-234 459 61.1
Uranium-238 5 16 6 1.1 2 2 Uraniwn-234 568 61.1
Uranium-238 571 61.1 4 4 Uranium-234 237 611
Uranium-238 362 611 5.7 57 Uranium-234 79.4 6 1.1
Uranium-238 83.6 61.1 Z2-EU19B-1 64 0 0.5 Uranium-234 178 611
Uranium-238 160 61.1 2 2 Uranium-234 89.6 61.1
Uranium-238 79.9 61.1 4 4 Uranium-234 220 6 1.1
Uraniwn-238 200 61.1 Z2-EUl9B-165 0 0.5 Uranium-234 175 61.1
Uranium-238 95.2 611 Z2-EU19B-1 66 0 0.5 Uranium-234 107 611 Z2-EUI 9B-167 0 0.5 Uraniwn-234 168 61.1
Uranium-238 78.6 61.1 2 2 Uranium-234 836 6 1.1
Z2-EU19B-1 68C 0.5 0.5 Uranium-235 495 611 ai.Jnits: metals= mg/kg, PCBs = pg/kg, and 111.dionuclides = pCi/g. Avg • average RI.. • remediation level EU = Exposure Unil ROD = Record of Decision OW • groundw:d.a RSI.. • risk screening level Max • maximum SSL, • soil screening level PCB = pol)~hlorinalcd b iphcnyl SU= Soil Unit
21

5-44
Attachment ID. EU Z2-19 Class 1 SU characterization and delineation sample locations with Avg RL, RSL, and GW SSL exccedanccs aflcr removal of sample
locations with Max RL exceedances to a depth of 4 ft"
Sample location Residual Avg RL Exceedances Z2-EU19-101 Z2-EUl9-103 Z2-EU19-105 Z2-EU19-106 Z2-EU19-107 Z2-EU19-108 Z2-EU19-1 18 Z2-EU19-121 Z2-EU19B-1 39 Z2-EUI 9B-152 (5-5 ft)h Z2-EU19B-153 Z2-EU19B-1 55 22-EUI 9B-156 Z2-EU19B-157 (5.7-5.7 ll )0
Z2-EU1 9B-1 64 Z2-EU!9B-!65 Z2-EU19B-1 66 22-EUI 9B-167 Z2-EU19B-167A Z2-EU!9B-!67B Z2-EU19B-167D
Analyte
Uran ium -238 Uranium-235, uranium-238 Uranium-235, uranium-238 Uran ium -238 Cesium- I 37, Ra/Th decay series, uranium-235, uranium-238 Ra/Th decay series Uraniwii-235, uraniwn-238 Ra/Th decay series, uranium-234, uranium-235, uranium-238 Ra/Th decay series, uranium-238 Uraniw11-235, uraniwn-238 TotalPCBs Cesium-I 37, Ra/Th decay series Uraniurn-235, uranium-238 Uraniwn-235, uranium-238 Uran ium-235, uranium-238 Uraniwn-235, uranium-238 Uraniurn-235 Uraniurn-235, uranium-238 Uranium-235 Uraniwii-235 Uraniwn-235
Residual RSL exceedanccs (not including residual Avg RL cxcccdanccs or potassium-40Y,' Z2-EU19-103 Uranium 22-EUI 9-107 Uraniwi1 Z2-EU19-121 Uranium Z2-EU19B-1 67 A Uraniwn Residual GW SSL exceedances Z2-EU19-103 Z2-EU!9-105 Z2-EU19-106 Z2-EU19-107 Z2-EUI 9-118 Z2-EU19- 121 Z2-EU19B-1 22 ( 4.4 to 4.4 ft.)(2) 22-EUI 9B-152 (5 to 5 ft )(2l Z2-EU19B-155 Z2-EUI 9B-156 Z2-EU19B-157 (5.7 to 5.7 ft_)(2l Z2-EU19B-1 64 Z2-EUI 9B-165 Z2-EU19B-166 22-EUI 9B-1 67
Uranium-234, uranium-238 Uraniwn-234, uranium-238 Uraniw11-234, uranium-238 Uraniwll-234, uranium-238 Uraniwn-234, uraniurn-238 Uranium-234, uranium-238 Uranium-234 Uraniwi,-234 Uranium-234 Uraniwn-234, uraniwn-238 Uraniw11-235, uranium-238 Uranium-234, uranium-238 Uraniwn-234, uraniwn-238 Uraniwii-234 Uranium-234, uranium-238
~elails of rcs:ichJal criteria. exccedances, includir1g sample depU1s and analyle concentrations: al each sample location and criterion values enn be found in Att.."ld1meut 3.
"l\.<Iax RL excccdances will be excavated at these sample locations from depths up to 4 ft. eRSL values are the same as Avg RL values for all ofll1e analyles will1 residual Avg RL exccedances except for ll1e Ram1 decay series.
1l1cre is no Ra/111 decay series RSL because radium and thorium isolopcs arc 1101 included in EU risk calculations as discussed in the Zone 1 ROD.
4Potassium-40 is not evaluated for risk if its average concentrati<in is less than the potassiurn-40 background concentration (32.12 pCi/g). "l11eavcragc polassium-40co11ccntratio11 in EU z2.J9 is presented in 'fable 3. Avg • average Max • maximum EU• Exposure Unit PCB • polychlorinatcd biphcnyl OW = groundwater RL = remediation level
22
ROD• Record of Decision RSL • ri~ screening level SSL= soil screening level

5-45
FIGURES
23

5-46
::al '!" ~
t"< 0
" .. ~ 0 = 0 ....,
N M .j;,.
c
~ "' :!?. M
:l ~
Le~end
c::J EU c::J EU 22-1 9 BOUNDARY
[=:J WATER
ROAD
BUILDING l_ _____ J DEMOLISHED
- EXISTING [=:J SLAB
N
I 500 1,000 2,000
Feet
MAP Ll>r'All0'1· \l;TTP\Fll Zll9~•~-~M\ \1At i>O<"t ME~TNA\U"; fU,, .. U_\9_toc_v1 .... ~ MAP AUTIIOI.; Ii:. ZitJ\tr O,.OANIZATIOIII; UCOA sou11.cr.s, Oil '-id:1,,-&,wu..J .. HIII lt(~n11•N111 :!ly111H1
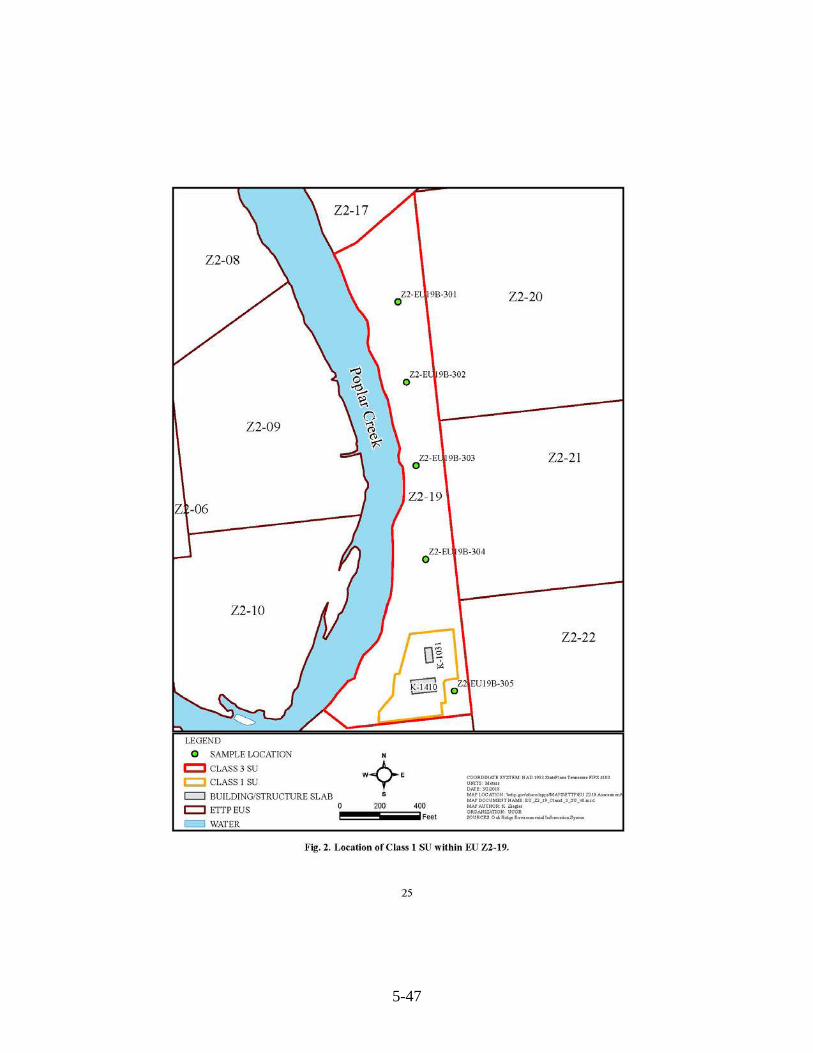
5-47
lWEND
0 SAMPl E lOCATION
c::::J ClASS 3 SU
c::::J ClASS I SU
c::J BUilDING/STRUCTURE SlAB
l=i ETTPEUS
i::::I WATER
Z2-19
N
W~ E
• 200 400
feet
Z2-20
Z2-21
98-304
Z2-22
OOOR.OIHATI!: S'f~!M HAD l ffl :!i~tflteA TtM.UNt PtPl!: -'100 UlfliS: Mtttu OAti! ~121)\8 t.dAPLO(;.UtO:!f. '61ttp.~1d°"p1'MA1:N:TTP\l!ll n 1t A,...,_,,n1 tu.tDOeUN&NTN ...... 11 IU~.)f. C"111u_:,,;:u_..o .. ,d t.u.tl\Vfl!Ofll'..Zltfor OROAHIZATIOJC, VWR !PGVRC'~ O!ll<llto.tvln-..,_,~ld""u'l"'-~,._
F ig. 2. Location of Class I SU within EU Z2-19.
25

5-48
Z2-19
LEGEND
CLASS I SU
c::::J EU OOUNDARY
1::: SLABS
- BUILDINGS
-- ROADS
c:::::J WATER
RADIATION WALKOVER SURVEY
ACTION LE VEL - 2.784 CPM
• 707 to 1392 opm
* 1393 to 2784 cpm
2785 to 5000 cpm
• 5000 to IOOO0 com
* 10000 lo 42030 cpm
MapA••~or K, Zio.gltt
Z2-22
N
i 25 50 100
I Feet
UCOR URS I CH2M Oak Ridge LLC
MAP DOCU.!ENTNAME. EU 19_J.1dWall:o-Sunt y_c1u,_1_, I mxd Coonliuu Syiltu NAD_i 9U _llu11cX.:•_T.,......,.o,_FIPS_4 100 U•ilo: Mot..-. $o1r<t · Oat: M.14Je t:n~1t0rla <l'.llal lnl&rai111,on s, .. , 111 (010:]SI
Fig. 3. Walkover survey results for Class 1 SU in EU Z2-19.
26

5-49
jZ2-Et.:19D-167A
%.2-EU19-121 J .t'z2-EC19Il-167
~
~G..z2-EU198-167B
a_ 7.2-EI JI 9R-I 67C
Z2-El"19f3-167D
/ L2-J:.U l91:!-168A
0 / Z2-Et.:19B- 16&
1 G'G-Z2-EUl9B-168B
c;Z2-Et.:19-JJ9
\.z2-EU19H-168C
Z2-EC19D-168D
• 0
I
F.U 7.2--19 Cll.4.UACTERIZATION AND DELJ:-..·EATION SAMPLE LOCATION
C LASS I SOIL U:--IT
c::J EU
c:J \\'ATF.R
-- ROAD
BUILDl'.'0
c.-~J DEMOLISHED
- EXISTINU
c::=J SLAll O
I
35
K- 14 IO
✓z:-eu19s.1s1
/ Z2-EC 19B-155A
~/ll-Wl?U-155
\
G G. 7.2.f:1J t9B-155ll
Q. 7.2 -ElJ191l-155C
22-EU190-155D
N
I 70
C00ROI/\A1£ S\'$Tl;:M· NAD 1\/83 Statel'lane 'l'emei!- FIPS 4 100 UNIT':)• .\l.et.::u DATF., J/;'/201R Ml\l'l.oc'ATIO~; P\F.1TP'.F.U7Jl9A.~~-~ MAP IX)ClI\1ENT 1'MIE· F.ti_Z2_19_0l/\R_l)f1._M\1P_l,OC_'l2 nL>: MJ\P/\UTIIOR: K.Zkgl;::r ORGA~IZATIOi\: UCOR OC>URC[S: 0111. RidJ,., EnvirQfu1,c,;1W lntlT11'®<J11 S>itc:m
140
Feet
Fig. 4. Soil sample locations in the Class 1 SU in EU Z2-19.
27

5-50
K-1031
• • • •
0
K - 1410
•
• •
Legend TYPE OF CRITERIA EXCEEl>ANCE \VAl'ER
• 0
MAX Rl ,.AV(j Rl,.ANDGWSSJ, c=J AVG RL ANDGW SSL ONLY
0 GW SSL ONLY
•
RUI IDIN\1
l_ ______ : DEhlOLISflEI>
-EXISTING
c:::::::J SLAB
• • r---------\
,_ _________ _
• • •
•
• •
0 • •
0
•••D •
N
l
•
-
COORDIN't\TE SYSTBI: NAD 1983 SL1tcPl6neT¢1U\O!-$-CC F!PS 4100 UNITS: Meters DATE: J/7'2018 M.'1.P LOCATION. P:\£TTP\£U Z219 A:s:se~mellt\ MAPIX)Cl)MENTNAMl:: EU 22 19 EXCEEDANCI: v2.m.-.:d MAP AUTHOR: K. 21.egler - - - -ORGANIZATION: UCOR S)I..RCES: Oal. Ridge Em'i roi, ncnttl b1!Crnulio11 S)'stcm NO CRITERJA EXCEEDANCES
CLASS I SOIL UNIT ROAi> 25 50 100
Feet c:::J EU
Fig. 5. Swnmary of RUGW SSL exceedances.
28

5-51
Legend
D PRIMARY EXCAVATION BOUNDARIES
c:::] ~~i~~~~IG c::::J EU
WATER
OUILDIN"G
: _______ : DE.:\IQLISIIED
c::::J EXISTING
c::::J SLAB
ROAD
N
! COORDINATE SYSTEM: NAD 1983 SmePlane Tenn~s« Fll'S 4100 UNITS. Mell!'!'$ DATE:4110/2018 MAP 1.0CATION· IH.F.JTP\EU l219Assrumen1\ MAP DOCUMENT NAME; EU Z2 19 EXCAV ,6.m:,;d MAPAUTIIOR;K.Z1egler - - - -
ORGANIZATION UCOR SOURCES; ()a.I.: Ridge Environmtntal lnform:uion System and Google Eanh
0 25 50 100
Feet
Fig. 6. EU Z2-19 Class 1 SU RA dig locations.
29

5-52
Lc-gc-nd
.6_ HIGH WALL SAMPLE
• REGULAR SAMPLE
Cl PRIMARY EXCAVATION BOUNDARIES
c:::J :~~~~~~IG
c::J cu
WATER
8 UII.IJJNG
: --··-··: OE.MOLISHE.D
c::J 1;x1s·nNG
c::J SLAB
ROAD
N
I 25 50
COORDINATE SYSTEM. NAO 1983 Stai~PlaneTtnneuft fll'S 4100 UNITS: MtlffS DATE: .C/11no1s MAP LOCATION P·\ El "fl'IJ::.U 2.219 ,\$S('SSfflCtlll
MAPOOCUMENTI\AMl:;·Eu Z2 19 EXCAV ,·S.rn:ic(;I MAf'AU11l0R K Ziqs.lo:r - - - -0kGAN17.AI ION UCOK SOURCF.S Cb.k Rid~ En,iron1nffl1a l lnrOl'mauo., S)~!Cm and Googft F.ar1h
100 Feet
Fig. 7. EU Z2-19 Class 1 SU RA dig areas with approximate confirmation sample locations.
30

BORING LOGS

6-2
This page intentionally left blank.

6-3
~!:.!.£(;?~BORING LOG DRJWNc; COMPANY DRIU/NGR/G
Cascade Drilling Geoprobe 6620DT DRIWNG METHOD HAMMER WEIGHT I FALL
Direct-Push DEPTH I ELEVATION TO WATER
ll. 7,HI/ ,J. 16...lfl/ PiftooYtcrDTWflba,s
78 -
UJ u z < > 0 < 0: UJ .J .. :E < .,,
4 A /62 B
n.a. roe ELEVATION
not surveyed
0
!;; "' :,_
~ z 0
~ > UJ .J UJ
i--f-- - I-- - -
100 - 4 A/ 52 B 0
t--- -- --
78 - 3A/72B 0
PROJECT JOB NUMBER SHEU NUMBER HOLE NUMBER
Z2-EU19-701 Deep Soil Boring; UKKXI9ET I of 3 SFTE
ETTP K-1410, EUI9 Poplar Creek TCE Investigation
BEGUN
7-29-19
FIN/SJ/ED
7-29-19 SrTE LOCATION or MAP DESCRIPTION ELEVATION TOTALDEF'TH
37.3 ft N 178,672.5 E 744,640.9 not surveyed LOGGED BY REVl~ED _or ,J,J..:l,h,~ ANGLE (from lluri:.) HOLE DIAME:TER
2.25in K. Helfernon M. Martm I 1-12. r, Vertical
- I
- 2
-
- 3
-
- 4
- 5
- 6
-
- 7
-
- 8
- 9
r- 10
-11
-
- 12
-
- 13
DESCRI PTfON and CLASS/ FICATION NOTES
_- 0-0.7 ft ORGANIC SOIL (OL) Very dark gray [I0YR 3/1) trace Discrete Soil _- fine to coarse subangular sand, trace fine gravel. fuel odor, weak Sampling:
I ccmentation, soft dry I RA079-FSLOOI
ii
ii
ii
10.5 ft - 0.7 ft, GRAVEL (GW), fine limestone gravel lense. lsuban2Ular, FIU Logbook: E1TP-0.7-2.3 ft CLAY (CH) Reddish brown [5YR 414) trace fine to DPBORE-007 coarse subangular sand, trace fine gravel, high plasticity stiff dry to moist Radiological
readinos· 2.3-6.4 ft SILTY CLAY (CL) Dark reddish brown [5YR 3/3] A= alph; trace fine to coarse subangular sand, medium plasticity stiff B = beta moist
6.4-8.7 ft CLAY (CH) Reddish brown [5YR 414] trace fine to medium sand, trace fine to coarse gravel. chert, high plasticity firm moist to wet
7.7 ft - 8.7 ft. firm to soft
8.7-17.4 ft SILTY CLAY (CL) Dark reddish brown [5YR 313] trace fine 10 medium sand, medium plasticity soft wet
0 ft (0 ft bgs): Collected RA079-002 for voes at 0938.
5 ft (5 ft bgs): Collected RA079-003 for voes at 1006.
10 ft (IO ft bgs): Collected RA079-004 (reg) and RA079-702 (dup) for voes at 1026.
SEE EXPLANATION FOR I\YELL/BOR/NGI..OCATTON SYMBOIS AND ABBREVIATIONS EU19, WPl-18-KDS(,33, WC-07
HOLE NUMBER
Z2-EU19-701

6-4
~ Y.£2.R BORING LOG
78 -
100 -
~~
100 -
~~
100 -
-~
100
-~
100 -
I
3 A/72 8
0A/135 8
- -
0A /70 8
+ 6A/ 122 8
t 14 A/70
8
+ 6 A /76 B
l
I 0
0
- -
0
+ 0
- -
0
-l-0
l
I;; Ul u. ~ z 0
~ > Ul ..J Ul
PROJECT
Deep Soil Borings
JOB NUMBER ISHEF.:f NUMBER
UKKX19ET 2 of 3
HOLE NUMBER
Z2-EU19-701
-
I;; Ul u. ~ :,: t Ul
"
- 15
-
- 16
-
- 17
-
- 18
-
- 19
- 20
- 21
- 22
- 23
r - 24
-
- 25
-
- 26
-
1- 27
-
1- 28
-29
v v
DESCRIPTION and CLASSIFICATION
17.4-21 ft CLAY (CL) Yellowish red [5YR 4/6] little fine to coarse subangular sand, low plasticity very stiff moist
20 ft - 20.5 ft, little Mn oxide nodules
NOTES
15 ft (15 ft bgs): Collected RA079-005 for voes at I 053.
18.1 ft(l8.I ft bgs): Collected RA079-00 I (reg) and RA079-70 I (dup) for biased RAD with highest FIDLER reading of 507 cpm at 1056.
==-2-1--3-6.-6-f-t C_LA_Y_E_Y_S-IL-T-(M_L_)_D_a_r_k_red_di-,h-bro_w_n_[S_Y_R_J/3 ___ J _12~Jle~~,;' bgs):
trace fine to medium sand, homogeneous, friable, no plasticity ~~9;~ {g~ very stiff dry to moist
25 ft (25 ft bgs): Collected RA079-007 for VOCs at 1256.
SEE EXPLANATION FOR IIVEU/BORINGLOCATION
SYMBOLS AND ABBREVIATIONS EU19, WP2-1S-KD5633, WC-07 I
HOLE NUMBER
Z2-EU19-701

6-5
~1J.£Q~ BORING LOG >"' OJ > 0
tl "' Ul .J
; < "' ~
100 -
100 -
100 -
"' u z < > 0 < "' "' i :a < U)
-f-----
--
--
11 A/80 0 B
l i-3 A/75 B 0
t t 2 A/76 B 0
J_ J_
PROJECT
Deep Soil Borings
- 31
- 32
- 35
~ 36
- 37
JOB NUMBER ISHEET NUMBER
UKKX19ET 3 of 3
DESCRIPTION and CLASSIFICATION
HOI.ENUMBER
Z2-EU19-701
NOTES
30 ft (30 ft bgs): Collected RA079-008 for voes at 1323.
35 ft (35 ft bgs): Collected RA079-009 for voes at I 343.
~ 36.6-37.3 ft CLAY with SILT (CL) Pale olive [SY 613] trace W2 fin~ to medium sand. low to medium plasticity very stiff dry to '\ffiO!St r 37.3 ft (37.3 ft
bgs): Collected Bottom or Boring at 37.3 Ft RA079-0I0 for
voes at 1346.
DPT Refusal (2.25 in. OD) at 37.3 ft.
Temporary piezometer installed with I in. PVC. IO ft screen. 0.0IO in. slots, TD at 37.3 ft bgs.
Piezometer removed and borehole abandoned on 7/31/19 following groundwater sample collection.
SEE EXPLANATION FOR I WELL/BORING LOCATION
SYMBOLS AND ABBREV/A TIONS EU19, WP2-18-KDS633, WC-07 I
HOLE NUMBER
Z2-EU19-701

6-6
This page intentionally left blank.

6-7
~ 1lfj?,E_ BORING LOG PROJECT
Deep Soil Borings
JOB NUMBER SHEET NUMBER
UKKX191IT I of 2
HOL£NUMB£R
Z2-EU19-702 DRIWNG COMPANY DRJUJNG RIG SrrE BEGUN
7-25-19
FINIS/IED
Cascade Drilling ETfP K-1410,
Geoprobe 6620DT EU19 Poplar Creek TCE Investigation 7-25-19 DRJWNG METl/OD
Oireet-Push
IIAMMER WF.IGlfr I FAU SfTE LOCATION or MAP DESCRIPTION ELEVATION TOTALDEYT'H
15.0 ft DEPTH I ELEVATION TO WATER
l1 ,Y DRY PKzomrter
66 -
90 -
UJ u z < > Cl < "' UJ
i :,; < Ul
~~
2.4 A /740 B
1
T 3.4 A /78
B
n.a. roe ELEVATION
n.a.
I
1 --
0
t;; te ~ z 0
~ > UJ .J UJ
f--t---- -~ --
92 3.4A /1 14 B
0
N 178,643.6 E 744,595.6 not surveyed LOGCWBY REVJE\VED.BY )J,,J'h,~ ANGLE(JrantHr,ri=.) HOLE DIAMETER
2.25in K. Heffernan M. Martin II· l2•f'f Vertical
-
- I
,-:
- 2
-
-3
I-
- 4
- 5
I-
...,: 6
I-
- 7
- 8
- 9
- 10
- II
- 12
- 13
...J
~ ::. > "' rJ 5: .. < " 0
DESCRIPTION and CLASS! FICA TION NOTES
_- 0-0.4 ft ORGANIC SOIL (OL) Brown [ I 0YR 4/3] some fine to Discrete Soil ~ \ medium sand, littl~ gravel. accumulated sediment on concrete { Sampling: • • \surface. trace organics I RA079-FSL002 for 0.4-1 ft CONCRETE r
~. I,(, 1-1 .4 ft GRAVEL with Clay Logbook: ElTP-1.4-3.3 ft CLAY (CH) Reddish brown [5YR 4/4] trace Mn DPBORE-007 oxide nodules. high plasticity stiff moist
2.3 fl - 2.5 fl, SAND (SP) lense. line 10 medium sand, moist
3.3-5 ft No Recovery
5-5.9 ft CLAY (CH) Reddish brown [5YR 4/4] trace Mn oxide nodules, high plasticity stiff moist 5.3 ft - 5.9 ft, firm, moist 10 wet
5.9-15 ft CLAYEY SILT (ML) Reddish brown [5YR 4/4] trace medium sand, homogeneous, finn wet
IO ft - I 5 fl, very stiff, moist
Radiological readings: A= alpha B = beta
0 ft ( I ft bgs): Collected RA079-012 for voes at 0838 and RA079-0J I for biased RAD with ADLER reading of 474 cpm at 0850.
5 ft (6 fl bgs): Colleeted RA079-013 for voes at 0924.
JO ft (11 ft bgs): Collected RA079-014 for voes at 1002.
SE£ EXPUNATION FOR IWEJL/BORINGWCATION SYMBOLS AND ABBREV/A TIONS EU19, WP2-18-KDS633, WC-07
HOLE NUMBER
Z2-EU19-702

6-8
PROJECT
!1Y..9,.2~BORING LOG Deep Soil Borings
JOB NUMBER ISHEE:T NUMBER
UKKX19ET 2 of2
flOLF.NUMBER
Z2-EU19-702
UJ u z <t > 0 <t
"' UJ .J ... ::; < "'
92 J 3.4 A~ I 14
L _ ___.l_
I 0
_i_ - 15
.J g ::; > "' "' u :i: ... < "' 0
DESCRI PT/ON and CLASS! FI CATION
14.6- I 5 ft No Recovery
Bottom of Boring at 15.0 Ft
NOTES
14 ft ( 15 ft bgs): RA079--015 for voes inadvertently not collected.
DPT Refusal (2.25 in. OD) at 15 ft.
Temporary piezometer installed with I in. PVC, IO ft screen. 0.0 IO in. slots, TD at 15 ft bgs.
Piczometer removed and borehole abandoned on 7129/19 following groundwater sample collection.
SEE EXPLANATION FOR IIVELJ.I BORING wc,noN SYMBOLS AND ABBREVIATIONS EVl9, WP2-18-KDS633, WC-07
'
HOLE NUMBER
Z2-EU19-702

6-9
~ !J .. 9£' .. ~BORING LOG PROJECT
Deep Soil Borings
108 NUMBER SHEET NUMBER
UKKX19ET 1 of 2
HOLE NUMBER
Z2-EU19-703 DRIWNG COMPANY
Cascade Drilling
DRIWNG RIG SITE BEGUN
7-30-19
FINISHED ETTP K-1410,
Geoprobe 6620DT EU19 Poplar Creek TCE Investigation 7-J0..19 DRIU.ING METHOD
Direct-Push
HAMMER WEIGHT I FAU SrTE WCATION tJr MAP DESCRIPTION ELEVATION TOTAL DEPTH
15.0 ft n.a. DEPTll/£1...EVATJONTO WATER
5/.
TOC ELEVATION
n.a . .?. ORY Pitzometer
48 -
90 -
0 -
ti z < > 0 < "' "' i ::;: < "'
--
--
r r I A/41 B 0
11
TT I A/93 B 0
11
N 178,644.5 E 744,605.5 not surveyed WGGEDBY
K. Heffernan REVIEWED !y J,J,,J,/t,~ ANGLE (from Hori:.)
M. Marlin II· l2-1' Vertical
I/OLE DIAME:TER
2.2Sin
~ I
..J 0
"' ::;: >"' 1'.l ~ < "' 0
DESCRIPTION and CLASSIFICATION NOTES
0-0.1 ft clayey GRAVEL (GC), accumulated sediment on { Discrete Soil asohalt surface / Sampling: 0.1-0.6 ft ASPHALT - [ RA079-FSL003 0.5-0.6 ft - 0.6 ft. GRAVEL with C!av. FILL / 0.6-2.4 ft CLAY (CH) Reddish brown [5YR 4/4] cohesive, high Logbook: ETTP-plasticity firm moist DPBORE-007
~ 2 1.8 ft - 2.4 ft, little silt. moist 10 wet Radiological
~""'1-----------------------ireadings: A= alpha B =beta
- 3
- 7
- 9
I-
~ 10
- I I \ I
- 12
- 13 / \
2.4-5 ft No Recovery
5-9.4 ft CLAYEY SILT (ML) Reddish brown [5YR 4/4] friable, no to low plasticity stiff moist
9 .4-10 ft No Recovery
I 0-15 ft Unable to extract soil core liner from core barrel.
0 ft (0.6 ft bgs): Collected RA079-022 for voes at 0805.
5 ft (5.6 fl bgsJ: Collected RA079-024 for voes at 0825.
6.9 ft (7.5 ft bgs): Collected RA079-02 I for biased RAD with Fl OLER reading of 348 cpm at 0841.
9.4 ft (10 ft bgs): Collected RA079-026 for VOCs and RA079-025 for RAD at 0830.
SEE EXPLANATION FOR I WELLIBOR/NGWCA1'/0N SYMBOLS AND ABBREVIATIONS EU19, WP2-18-KDS633, WC-07
HOLE NUMBER
Z2-EU19-703

6-10
PROJECT
~ 17.f...Q~BORING LOG Deep Soil Borings
JOBNUMBER ISIIEETNUMBER
UKKX19ET 2 or 2
HOLE NUMBER
Z2-EU19-703
t;; ..J Ul t;;
0 0 "- "' z ~ Ul ::;; 15- "- i;; <::. z ~ Ul 0. 0 "' ,:!:, f'=
:,: u C < t :i: ;: > Ul ..
Ul C < ..J °' Ul 0
1- 15
DESCRIPTION a11d C/.ASSIFICATION
Bottom of Boring at 15.0 Ft
NOTES
14.4 ft (15 ft bgs): Unable lo extract I 0-15 ft soil core; RA079-028 for voes and RA079-027 for RAD nOI collected.
DPT Refusal (2.25 in. OD) at 15 ft.
Temporary piezomercr installed with I in. PVC, IO ft screen. 0.010 in. slO!s. TD at 14.7 ft bgs.
Piezometer removed and borehole abandoned on Mll/19 following groundwater sample collection.
SEE EXPLANATION FOR I \VEUI BORING LOCSTION SYMBOLS AND ABBREVIATIONS EU19, WP2-18-KDS633, WC-07
'
HOLE NUMBER
Z2-EU19-703

6-11
a!J.f...Q_g_BORING LOG DRIWNG COMPANY DRIWNGRIG
Cascade Drilling Geoprobe 6620DT DRIWNG MF:THOD HA.\1MER WEIGlfT I FALL
Direct-Push n.a. D£/'THIELEVA.TlONTO WATER
l1
TOC EUVATION
not surveyed .S. 11.on, Piezomr1crOTWrtbgs
72 -
80
JOO
w u z < > 0 < "' i ::; < "'
6 A 139 B 0
11
I A/ 59 B 0
3A/68B 0
PROJECT JOB NUMBER SHEET NUMBER
Deep Soil Borings UKKX19J;'T l of 3 SfTE BEGUN
ETI'P K-1410, EU19 Poplar Creek TCE Investigation 7-30-19
SITE WCATION or MAP DESCRIPTION EUYATION
N 178,635.5 E 744,605.9 not surveyed LOGGED BY
K. Heffernan REVIEWED •BY )J,J,/,,,~ ANGLE (from Hori:J
M. Manm II· l2· r, Vertical
2
3
4
5
6
7
8
9
10
- II
..J 0
"' ::; >"' 1'.l ~ < "' 0
DESCRIPTION a11d CLASSIFICATION
0-0.3 ft gravelly CLAY with organics. accumulated sediment on as halt surface 0.3-0.6 ft ASPHALT 0.5 ft - 0.6 ft. GRAVEL with Cla 0.6-3 ft CLAY (CH) Reddish brown [5YR 4/3] trace fine 10 coarse subangular sand. high plasticity firm moist
2.7 ft• 3 ft. soft. moist 10 wet
3-3.6 ft CLAY (CH) Olive brown [2.5Y 4/4] fuel odor. high plasticity soft moist to wet
3.6-5 ft No Recovery
5-7.9 ft CLAY (CH) Ohve brown [2.5Y 4/4] fuel odor. high plasticity stiff moist
7.9-12.1 ft CLAY (CH) Reddish brown [5YR 4/3] trace fine 10 coarse subangular sand. fuel odor from 7.9•10 ft, high plasticity firm moist
I/OLE NUMBER
Z2-EU19-705 FINISHED
7-30-19 TOTAL DEPT/I
28.Srt HOU DIAMITER
2.25in
NOTES
Discrete Soil Sampling: RA079-FSL005
Logbook: ETTP-DPBORE-007
Radiological readings: A= alpha B =beta
0 ft (0.6 ft bgs): Collected RA079-048 for voes at 0942.
5 ft (5.6 fl bgs): Collected RA079-050 for voes at I 005.
5.1 ft (5.7ft bgs): Collected RA079-04 7 for biased RAD with Fl OLER reading of369cpmat 1008.
10 ft (10.6 fl bgs): Collected RA079-052 for voes and RA079-05 I for RAD at 1058.
SEE EXPLANATION FOR SYMBOLS AND ABBREVIATIONS
WEUI BORING LOC,fflON HOLE NUMBER
Z2-EUI9-705 EU19, WP2-18-KD5633, WC-07

6-12
a 11s..2.s.soRING LOG PROJECT JOBNUMBER ISHEETNUMBER HOLE NUMBER
Deep Soil Borings UKKX19ET 2 of 3 Z2-EU19-70S
,.. Ul
_., !;; _.,
"' < -;; Ul u u 0 > z
G z
0 Ul !;; a, < E u.
0 > 0 E z ~
Ul ::;: u 0 o- u. ,.. Ul 5if'I z ~ "' DESCRIPTION and CLASSIFICATION NOTES "' < < lE
~~-~ u,O. 0 "' Ul "' "''= 1= :,: u _., Ul Ii: :i: .. _., N 0 < ::;: 0. a: > Ul 0.
< ::;: 0 ::;: Ul 0 < "' <
_., s _., "' .. "'
Ul Ul 0 u:
I I 12. 1-16 ft CLAYEY SILT (ML) Light olive brown [2.SY 5/4] 100 - 3A/68B 0 - trace fine to medium sand. friable. low plasticity very stiff dry to
t moist
~I--- t - 13
I-
100 - 4 A 189 B 0 t- 14 I
I-
c-1--- - - - - 1- 15
-15 ft (15.6 ft bgs):
- 16 Collected
16-20.3 ft SILTY CLAY (CL) Dark reddish brown [5YR 3/4] RA079-054 for VOCs and
100 - 2 A /79 B 0 - trace fine to medium sand, low plasticity stiff moist RA079-053 for RAD at 1309.
- 17
I-
~I--- - - - - - 18
'
100 - 2 A 189 B 0 t- 19
-
~ I--- - - - - - 20
- 20.3-28.5 ft CLAYEY SILT (ML) Dark reddish brown [SYR 314] trace fine to medium sand, homogeneous, friable, no 20 ft (20.6 ft bgs):
1- 21 to low plasticity very s tiff dry to moist Collected RA079-056 (reg) and RA079-706
100 I A/ 128 0 (dup) for voes B and RA079-055
,- 22 (reg) and RA079-705 (dup) for RAD at I 335.
~I--- - - - - - 23
100 - 9 A 186 B 0 t- 24 23.9 ft - 24.2 ft. light yellowish brown (2.SY 6141
-i -i 25 ft (25.6 ft bgs): Collected RA079-058 for
~I--- - 25 voes and RA079-057 for
100 - 2 A 163 B 0 RAD at 1408.
SEE EXPUNATION FOR I WELL/ BORING LOCATION SYMBOLS AND ABBREVIATIONS EUl9, WP2-l8-KD5633, WC-07
IHOLENUMBER Z2-EU19-705

6-13
PROJECT elY.f~~ BORING LOG Deep Soil Borings JOBNUMBER ISHEE:T"NUMBER
UKKX19ET 3of3
HOUNUMBER
Z2-EU19-705
>"' w > 0
&l "' UJ .J .. ::;; ;,; ..
100 -
w ~ < > 0 < "' w .J
~ ;);
2A/63B 0
Iii If ~ :,: I;: w 0
'"- 26
-
'"- 27
~
- 28
~
.J 0 Ol ::;;
DESCR/ PT/ON and CLASS/FICA TION ~ "' u 5: .. < "' 0
Bottom of Boring at 28.5 Ft
NOTES
26.8 fl (27.4 fl bgs): Collected RA079-049 for biased RAD with FIDLER reading of 692 cpm at 1414.
27.9 ft (28.5 ft bgs): Collected RA079-060 for voes and RA079-059 for RAD at 1411.
DPT Refusal (2.25 in. OD) at 28.5 fl. Overdrill with 3.25 in. OD tooling not perfonned.
Semi-pennanent piezometer installed with I in. PVC, IO ft screen, 0.010 in. slots, TD ; 27 ft, bentonite seal only.
Note: Larger diameter tooling not used to ensure piezometer placement at total depth. Sand filter pack not installed due to borehole collapse, and pre-packed screen not used due to smaller diameter borehole.
SEE EXPLANATION FOR I IVELLIBORINGLOCATION SYMBOLS AND ABBREVIATIONS EU19, WP2-18-KD5633, WC-07
I
HOLE NUMBER
Z2-EU19-705

6-14
This page intentionally left blank.

6-15
!;1 !JS.£~ BORING LOG PROJECf
Deep Soil Borings
JOB NUMBER SHEET NUMBER
UKKX19ET 1 of3
HOLE NUMBER
Z2-EU19-706 DRIUJNG COMPANY
Cascade Drilling
DRIWNG RIG srrE BEGUN
7-24-19
FINISHED ETTP K-1410,
Geoprohe 6620DT EU19 Poplar Creek TCE Investigation 7-24-19 DRJWNG METHOD
Direct-Push
HAMMER WEICHT I FAIL SlTE LOCATION or MAP DESCRIPTION ELEVATION TOTAL DEPTH
28.0 ft DEPTH/ELEVATION TO \VATER
~ 1s.srt1 t: 10.4 rtt Piezometer DTW rt bgs
n.a. roe llEVAnON
not surveyed
ii:; ~ ~ z 0
~ > UJ ...J UJ
3.4 Arf 271 0
68
100
100 -
11
0.4A/46 B
1.4 A/277 B
0
0
N 178,626.7 E 744,617.5 not surveyed LOGGEOBY
K. Heffernan REV/£\VED BY J4JI. M.Martin l·l2·/'f
ANGLE (from Hori::/
Vertical
HOLE DIAMETER
2.2Sin
4
6
9
10
II
...J 0 "' :E /;; "' u :i: ... < °' 0
DESCRIPTION and CIASSIFICATION
0-0.4 fl ORGANIC SOIL (OL) Dark grayish brown [ I 0YR 4/2] little roots, low lasticit stiff d to moist 0.4-3.4 ft CLAY (CH) Strong brown [7.5YR 4/6] trace to little tine LO coarse subangular sand, trace fine subangular gravel, chert. high plasticity very stiff dry to moist
3.4-5 ft No Recovery
NOTES
Discrete Soil Sampling: RA079-FSL006
Logbook: ETIPDPBORE-007
Radiological readings: A~ alpha B = beta
0 ft (0 ft bgs): Collected RA079-064 for voes at 1524.
ln~---:5---:_ 7::-_6-:-:cft-C""L:-A-Y:-:--(c:C---:H---:)---:S:-t,-o-n0•---:-b,-o-w-n---:[7-::c.-::5:--:y-::cR-4:-/6-::]-tra-ce-to---:-li1---:1l-e 5 ft (5 tt bgs):
Collected fine to coarse subangular sand, trace fine subangular gravel. RA079_065 for chert, high plasticity very stiff dry to moist voes at t 544.
7.6-9.5 ft CLAY (CH) Yellowish brown [I0YR 5/6] trace fine to coarse sand, high plasticity finn moist to wet
9.5-10.7 ft SANDY CLAY (CLS) Dark yellowish brown [I0YR 4/4] fine to coarse subangular sand, trace fine subangular gravel, low plasticity firm moist to wet
10.7-15.8 ft CLAY (CH) Strong brown [7.5YR 4/6] trace to little fine to coarse subangular sand, trace fine subangular gravel, chert. high plasticity stiff moist to wet
10 ft (10 ft bgs): Collected RA079-066 for voes at 1559.
II.I ft(ll .1 ft bgs): See next page.
SEE EXPLANATION FOR SYMBOLS AND ABBREV/A TIONS
11/EU I BORING LOCATION HOLE NUMBER
Z2-EU19-706 EU19, WP2-18-KD5633, WC-07

6-16
B "!-.lf.Q~ BORING LOG >"' w > § "' w i ::;: < "' ...
100
100
100 -
100 -
100
w u z < > Cl < "' w i ::;: < "'
IAA /277 B
6.4 A/ 200 B
2.4 A/ 222 B
+
0
0
0
1.4 i/96 O
-l l 0.4 A/ 72
B 0
t;; ll: ~ z 0
~ > w .J w
PROJECT
Deep Soil Borings
13
14
15
.J 0 "' ::;: >"' ~ x "-~ 0
JOB NUMBER SHEF:f NUMBER
UKKX19ET 2 or 3
DESCRIPTION and CL.ASSIFICAT!ON
HOLE NUMBER
Z2-EU19-706
NOTES
I I.I ft (I I.I ft bgs): Collected RA079-063 for biased RAD with ADLER reading of 341 cpm at 1616.
15 ft (15 fl bgs): Collected RA079-067 for
~--------------------- voe, at 1610. 16
17
18
- 19
20
21
22
23
24
25
15.8-17.4 ft SANDY CLAY (CLS) Dark yellowish brown [IOYR 4/4] fine to coarse subangular sand, trace fine subangular gravel, low plasticity soft wet
17.4-21.1 ft CLAY (CH) Yellowish brown [IOYR 5/6] tract fine to coarse sand, high plasticity soft wet
2 1. 1-25 ft SILT (ML) Yellowish brown [ IOYR 5/6] trace fine to medium sand, little clay, low plasticity soft wet
22 ft · 23.8 ft, stiff, moist
23.8 ft· 24.7 ft, soft, wet
24.7 ft - 25 ft, light olive brown [2.5Y 4/4]
25-27 ft CLAYEY SILT (ML) Reddish brown [5YR 4/4] trace fine to medium sand. no to low plasticity soft wet
20 ft (20 ft bgs): Collected RA079-068 for voes at 1627.
25 ft (25 ft bgs): Collected RA079-069 for voes at 1647.
SEE EXPU\NATION FOR IVELJ.IBORINGLOCATION 1/0LENUMBF.R
Z2-EU19-706 SYMBOLS AND ABBREVIATIONS EU19, WP2-18-KDS633, WC-07

6-17
~1I_.9..Q£BORING LOG w
~ < > 0 < "' ~ :. < "'
I 100 - 0.4 i112 o
__ l l
~ ~ z 0
~ > w .J w
PROJECT
Deep Soil Borings JOB NUMBER ISH£ETNUMB£R
UKKX19ET 3 of 3
~ 26
~ 27
~ 28
DESCRIP110N and CLASSIFICATION
27-28 ft SILT (ML) Yellowish brown [IOYR 516] trace fine to medium sand, little clay, low plasticity soft wet 27.6 ft - 28 ft, hard, dry to moist
Bottom of Boring at 28.0 Ft
IIOlENUMBF.R
Z2-EU19-706
NOTES
28 ft (28 ft bgs): Collected RA079-070 for voes at 1650.
DPT Refusal (2.25 in. OD) at 28 ft.
Temporary piezometer installed with I in. PVC, IO ft screen, 0.010 in. slots, TD at 28 ft bgs.
Piezometer removed and borehole abandoned on 7125/19 following groundwater sample collection.
SEE EXPLANATION FOR I \VElL/BORINGWO.TTON SYMBOLS AND ABBREVIATIONS EU19, WP2,18-KD5~33, WC-07
jHDLENUMBER
I Z2-EU19-706

6-18
This page intentionally left blank.

6-19
~Y.S_Q];,BORING LOG DR/LUNG COMPANY DRIWNGRIG
Cascade Drilling Geoprobe 6620DT DRIWNG METHOD HAMMER WEIGi-ff I FAU
Direct-Push DEPTH I ELEVATION TO WATER
~ JO.Ort/ .1. U ft/ Piezomectr DTW ft bgs
"' u z < > Cl < "' "' 0: :;; i
100 -
,-~
100 -
100 -
2.4 A /90 B
- r--
<l..c A/ 156B
1.4A/107 B
I
n.a. TOC ELEVATION
not surveyed
I
- r--
o
0
I
t;; if ~ z 0
~ > "' _, "'
PROJECT JOB NUMBER SH£F.T NUMBER
Deep Soil Borings UKKX19ET 1 or2 srr£ BEGUN
ETTPK-1410, EU19 Poplar Creek TCE Investigation 7-22-19
SITE LOCATION or MAP DESCRIPTION ELEVATION
N 178,734.2 E 744,680.8 not surveyed LOGCEDBY
K. Heffernan
,- I
,- 2
- 3
-
- 4
-
- 5
-
,- 6
,- 7
- 8
- 9
.J 0 a, :;; >"' "' u ~ < 6
·• ·• I ~· ·•
I
DESCRI PT/ON and ClASS! FICA T!ON
0-1.2 ft GRAVEL (GW) limestone, FILL
1.2-93 ft CLAYEY SILT (ML) Reddish brown [5YR 4/4] homogeneous, slight cohesion, no to low plasticity linn moist
7.2 ft - 7.7 ft. olive yellow [2.5Y 6/6]
7.7 ft - 9.3 ft, dark yellowish brown, hule Mn oxide nodules, significant weathering
HOLE NUMBER
Z2-EU19-707 FINISHED
7-22-19 TOTAi~ DEPTH
13.5 ft HOLE DIAMETER
2.25in
NOTES
Discrete Soil Sampling: RA079-FSL007
Logbook: ETTPDPBORE-007
Radiological readings: A= alpha B =beta
2.7 ft (2.7 ft bgs): Collected RA079-077 for biased VOCs with PID reading of 1 ppm at 1014.
3.5 ft (3.5 ft bgs): Collected RA079-07 4 for VOCsat l018.
8.5 ft (8.5 ft bgs): Collected RA079-075 for
V,clt---------------------lVOCs at 1044. -
- 10 V
- V
- II V
-V
9.3-13.5 ft SIL TY CLAY (CL) Dark yellowish brown [ I 0YR 4/4] cohesive, low plasticity soft moist 10 wet
IO ft - I 0.6 ft, saturated
10.6 ft - 13.5 fl, wet
8.4 ft (8.4 ft bgs): Collected RA079-073 for biased RAD with FIDLER reading of251 cpm at 1046.
SEE EXPLANATION FOR I IV£LL/BORINC LOCATION SYMBOLS AND ABBREVIATIONS EU19, WP2-18-KDS633, WC-07
IIOLENUMBE.R
Z2-EU19-707

6-20
PROJECT
~ !1£.Q~BORING LOG Deep Soil Borings
JOBNUMBER ISHEETNUMBER
UKKX19ET 2 of 2
HOlENUMBER
Z2-EU19-707
100 -
Ul u z < > 0 < "' w ...l
~ < "'
I l.4A/107
B
I 0
_L c. 13
..J 0
"' ::.: /;; 1'.l ~ < "' (J
DESCRIPTION and CLASSIFICATION
12.8 ft - 13.2 ft, SILT (ML) lense. wet
13.5 ft LIMESTONE, laminated, weathered cylinders. highly effervescent
Bottom or Boring at 13.S Ft
NOTES
13.5 ft( l3.5 ft bgs): Collected RA079-076 for VOCs at 11 15.
DPT Refusal (2.25 in. 00) at 13.5 ft. DPTOverdrill Refusal (3.25 in. OD) at 13.5 ft.
Semi-pennanent piezometer installed with I in. PVC, IO ft pre-packed screen, 0.010 in. slots, TD= 13.25 ft. sand filter pack, bentonile seal.
SEE EXPV.NATION FOR I WEILi BORING LOCATION SYMBOLS AND ABBREVIATIONS EU19, WP2-18-KDS633, WC-07 lHOLE I/UMBER
Z2-EU19-707

6-21
~1lf~~BORING LOG DR/WNG COMPANY DRJWNGRIG
PROJECT
Deep Soil Borings SfTE
ETTP K-1410,
JOB NUMBER SH£IT NUMBER
UKKX19ET l of2 BEGUN
HOLE NUMBER
Z2-EU19-708 FINISHED I
Cascade DriUing DRILLING METHOD
Geoprobe 6620DT HAMMER WEJGlll' I FAU
EU19 Poplar Creek TCE Investigation 7-18-19 7-22-19 SffE LOCATION IH' MAP DESCRIPTION --~-----,'.==""aT"1o"N,.,.---+-=7o"'r."'a"'"L""DEPT=~H--,
Direct-Push n.a. N 178,629.5 E 744,687.0 not surveyed 24.2 ft DEPT'// I ELEVATION TO WATER WGGEDBY
~ 15.2(1 /
TOC ELEVATION
not surveyed K. Heffernan REVIEWED~Y ),J,J,,I,,~ ANGLF.(fromHori:.J
M. Marlln II• I l• l'f Vertical
HOL£ DIAMETER
2.25in ~ 9.6ft/ P~rerDTWrtbp
Ul u z < > C, < "' UJ
0: ::;; < "'
NIA N/A
-1----- -- - f-
80 - 3.4A/119 B
0
t:i ~ ~ z 0
~ > Ul .J UJ
- I
- 2
- 4
- 5
,_ 6
- 7
- 8
- 9
1- 10
,- II
- 12
- 13
DESCRIPTION and CLASSIFICATION
().IO ft Soil description not required: target depth 10 ft above DPT refusal.
10-11.7 ft SILTY CLAY (CL) Brown [7.5YR 4/4] little fine to coarse subangular sand, fine subangular gravel. low plasticity soft wet
11.7- 14 ft CLAYEY SILT (ML) Light olive brown [2.SY 5/4] trace fine to coarse subangular sand, trace fine subrounded gravel, no plasticity hard dry 12.4 ft· 14 ft, firm, moist to wet
NOTES
Discrete Soil Sampling: RA079-FSL008
Logbook: E'JTP. DPBORE--007
Radiological readings: A = alpha B = beta
14 ft (14 ft bgs): Collected RA079-088 for voes at 1021.
SEE EXPLANATION FOR I \VELLIBORINGLOCATION SYMBOLS AND ABBREVIATIONS EU19, WP2-18-KD5633, WC-07
HOLE NUMBER
Z2-EU19-708

6-22
a 11 .. 9...Q~BORING LOG PROJECT JOB NUMBER I SHEET NUMBER HOLE NUMBER
Deep Soil Borings UKKX19ET 2 of 2 Z2-EU19-708
>- Ul ~ ';; Iii ..., "' Ul u 0 z u z Ii:! Iii > < 8 E
0 "' 8 > z ~ Ii:! ::. UJ 0
..., _e o- >-
"' < !2t ':! .:::. z ~ "' DESCRIPTION and CLASSIFICATION NOTES Ul "' ~~-= UJ'" Q :,: El ..., Ul a::::o I- Ii: 5: 0.. ..J Cl:: ~ 0 < ::. :i 0: > Ul 0..
< 0 ::. UJ 0 < "' ~
..., g, ..., "' UJ 0
~ u: UJ
14-15 fl No Recovery 80 - -
>-+--- - - '- 15
T 15-16.9 ft SILTY CLAY (CL) Brown [7.5YR 414] little fine 10
- coarse subangular sand. fine subangular gravel, low plasticity soft WCI
- 16 v 15.2 fl - 16.3 ft, saturated
- I 6.3 ft - I 6.9 ft, moist to wet
..: 17 16.9-24.2 ft CLAYEY SILT (ML) Reddish brown [5YR 4/4]
100 - <LcA/68 0 - trace fine 10 medium sand, no to low plasticity very stiff moist B
- 18
-
- 19 18.8 fl - 20 ft, hard, dry to moist 19 ft (19 fl bgs): Collected - RA079-089 for
>-+--- - .__ - - - 20 voes at I 107.
20 fl - 21.4 ft, saturated
- 21
21.4 ft -22.3 ft, firm, wet
100 - 2.4A / 157 0 - 22 22.9 ft (22.9 ft 8 22.3 ft - 22.4 ft, gravelly SILT lense, wet bgs): Collected
1 1 22.4 ft - 22.8 ft, light yellowish brown [2.5Y 6/4]. firm, moist 10 RA079-087 for
biased RAD with - 23 wet
FIDLER reading 22.8 ft - 24.2 fl, reddish brown [5YR 4/4], very stiff. dry to moist of 216 cpm at
1143.
- 24 24 ft (24 ft bgs): ~~
Collected
Bottom of Boring at 24.2 Ft RA079-090 for v oes at 1142.
DPT Refusal (2.25 in. OD) at 24.2 ft. DPT Overdrill Refusal (3.25 in. OD) al 20 ft on 7/1 8/19.
Semi-permanent piezome1er installed on 7(22/19 with I in. PVC, JO fl pre-packed screen. 0.0 IO in. slots, TD ~ 20 ft, sand filter pack, bentonite seal.
SEE EX Pu.NATION FOR I IVE/.1. / BORING LOCATION SYMBOLSANDABBREVIATIONS EU l9, WP2-18-KD5633, WC-07
1 HOL£ NUMBER Z2-EU19-708

6-23
~ !J,.91? .. ~BORING LOG PROJECT
Deep Soil Borings
JOB NUMBER SHffT NUMBER
UKKX19ET l of 4
HOLE NUMBER
Z2-EU19-709 DRIWNG COMPANY DRIWNG RIG Sll'E BEGUN FINISHED
ETfP K-1410, Geoprobe 6620DT EU19 Poplar Creek TCE Investigation 7-22-19 7-23-19 Cascade Drilling
DRIWNG MITHOD HAMMER WEIGHT I FAU SfTE WCATION or MAP DESCRIPTION £.LEVATION TOTAL DEPTH
47.0 ft Direct-Push DEPTH/ELEVATION TO WATER
'S/.. 2S.9f't/ :t. 36.9 rt/ Piezomtttr onv rt bgs
NIA
n.a. roe ELEVATION
not surveyed
NIA
m ~ z 0 ;:: <(
> uJ ..J UJ
N 178,595.5 E 744,517.6 not surveyed LOGGED BY
K. Heffernan REVIEWED !y }J,,J,I,, ~ ANGLE (jrum llori:)
M. MartJn II· ll·!'l Vertical
HOLE DIAMF:TER
2.25 in
.... 13
DESCRIPTION and CLASSIFICATION NOTES
0-0.5 ft ASPHALT Discrete Soil ---------------------- Sampling:
0.5-1.1 ft ORA VEL with Clay, FILL RA079-FSL009
1.1-3.4 fl CLAY with Silt (CL) Yellowish brown [I0YR 5/6], stiff, moist, FILL
Logbook: ETTP- 1
DPBORE-007
Radiological readings: A= alpha B = beta
~c+-----------------------1Field screening 3.4-25 ft CLAYEY SILT (ML) Reddish brown [SYR 4/4] fine to medium sand, no to low plasticity finn to stiff moist
not required 0-25 fl; target depth IO ft above DPT refusal.
SEE EXPLANATION FOR I WELL I BORING LOCATION SYMBOLS AND ABBREVIATIONS EU19, WP2-18-KDS633, WC-07
HOLE NUMBER
Z2-EU19-709

6-24
l!) !-}.f,.2J:~BORING LOG >"' UJ > § "' UJ ..J 0. ;:; < "' ,;,
100 -
UJ u z < > 0 < 0: Ul
i ;:; < Ul
NIA
,----,---
0.4 A /105 B
l
NIA
- ,.._
0
l
PROJECT
Deep Soil Borings
JOB NUMBER I SHEET NUMBER
UKKX19ET 2 of 4
~ 15
- 16
~ 17
- 18
- 19
- 20
-21
- 22
- 23
- 24
- 25
I-
- 26
- 27
- 28
- 29
..J 0 "' ;:; >"' i'.l 5: 0. < 0: 0
DESCRIPTION and CLASSIFICATION
25-33.4 ft CLAYEY SILT (ML) Reddish brown [5YR 414] trace fine to medium sand, homogeneous, no to low plasticity stiff wet
25.9 ft - 26.9 ft, soft, saturated
26.9 ft - 26.9 ft, finn, soft
HOL£ NUM8£R
Z2-EU19-709
NOTES
Continued on 7/23/19 at 25 fl.
SEE EXPI.ANATION FOR I WEUI BORING LOCATION
SYMBOLS AND ABBREVIATIONS EU19, WP2-18-KD5633, WC-07 !
HOLE NUMBER
Z2-EU19-709

6-25
e1 !.lfj?~ BORING LOG PROJECT JOB NUMBER I SHEET NUMBER HOLE NUMBER
Deep Soil Bor ings UKKX19ET 3of4 Z2-EUJ9-709
>- UJ ..J ti; ..J °' < i UJ u u 0 z Ul ti; > < 8 E
0 u. "' 0 > z ;,; Ul ::;: u 0 ..J~ E a~ u. >-UJ "' DESCRIPTION and CLASSIFICATION NOTES °' < Qi~ <::;: z ;,; Ul °'
Ul 0.. 0 l'.l ~8,5 °'~ ;::: :,: ..J UJ t ~ 0.. ..J °' !::: 0 < ::;: "- .: > UJ ::;,: 0 < ~ ..J ::;: UJ 0
°' < 8 ..J
1/1 "' UJ UJ 0 ii:
30.3 ft - 30.5 ft, SILT lense, olive yellow, wet
- 31
100 - 3.4A/l11 B
0 -
+ + t- 32
->-- - 33
33.4-35.9 fl SILT (ML) Yellowish brown [I0YR 5/6] trace line
100 - 0.4 A 197 0 - 34 10 medium sand, lillle clay, soft saturated
B
f-f---- t t - 35
-
.: 36 35.9-38.7 ft CLAY (CH) trace line 10 coarse subangular sand,
100 - l.4A/42 0 high plasticity stiff moist
B
+ + - 37 36.9 ft - 37 fl. sandy CLAY lense. wet 37 fl (37 ft bgs):
Collected - RA079-093 for
VOCs al 1435. -- - 38
100 - 2.4 A /136 0 - 39 38.7-40 ft SILT (ML) Yellowish brown [ I0YR 516] trace line 10
B medium sand, little clay, soft saturated
t t -
f-~- - 40 40-42 ft SILTY CLAY (CL) Dark reddish brown [5YR 3/4] trace fine to medium sand, low plasticity firm wet
-41
100 - 1.4 A 1132 0 B
+ + - 42 42 ft (42 ft bgs): 42-47 ft SILT (ML) Yellowish brown [I0YR 5/6] trace line 10 Collected medium sand, liule clay. stiff wet RA079-094 f0<
VOCs al 1509. f-f---- - 43
42.3 fl ( 42.3 fl
100 - 1.4Al90 0 -44 bgs): Collected
B RA079-092 for
+ biased RAD with
+ FIDLER reading
- 45 of 179 cpm at
f-f---- 1512.
100 - 0.4 A/ 85 0 B
I
SEE EXP LANA TJON FOR I W£1LI BORJNG LOCATION SYMBOLS AND ABBREVIATIONS EU19, WP2-18-KD5633, WC-07
IHOU: NUMBER Z2-EU19-709

6-26
!;11J_f£)~ BORING LOG PROJECT
Deep Soil Borings
..J 0 "' ~
JOB NUMBER ISHEET NUMBER
UKKX19ET 4 or 4
HOI.ENUMBER
Z2-EU19-709
>"' "' u
DESCRIPTION and CLASSIFICATION NOTES
I 0
__L_ - 47
5: 0. < "' 0
Ill Bottom of Boring at 47.0 Ft
SEE EXPLANATION FOR IWE:UIBORINGWCATION SYMBOLS AND ABBREVIATIONS EU19, WP2-18-KD5633, WC-07
47 ft (47 ft bgs): Collected RA079-095 for VOCs al 1539.
DPT Refusal (2.25 in. OD) at 47 ft.
Temporary piezometer installed with I in. PVC, IO ft screen, 0.010 in. slots, TD at 47 ft bgs.
Piezometer removed and borehole abandoned on 7/25/19 following groundwater sample collection.
I
I/OLE NUMBE:R
Z2-EU19-709

6-27
!:11!Si? .. ~ BORING LOG PROJECT
Deep Soil Borings
JOB NUMBER SHEET NUMBER
UKKX19ET l or 2 DRIWNG COMPANY
Cascade Drilling
DRILLING RIG SffE BEGUN ETTP K-1410,
Geoprobe 6620DT EU19 Poplar Creek TCE Investigation 7-31-19 DRIWNGMFTHOD
Direct-Push
HAMMER WEIGi-ff I FALL SfTE LOCATION 1ir MAP DESCRIPTION ELEVATION
DEPTH I ELEVATION TO WATER
'l-s 20.t fl/ Piezorn.!ter-DTW(t bgs
80
68
7.4A/187 B
n.a. TOC ELEVATION
not surveyed
0
tii ~ :!: z 0
~ > UJ -' UJ
TT 100 -
100 1.4 A 1142 B
0
N 178,642.2 E 744,594.4 not surveyed LOGGED BY
K. Heffernan REV/£\VED
0
8Y ),J,..,,,,_~ ANGLE (from Hod:.)
M. Martin l!-12·1'1 Vertical
tii UJ u. ?; :,: I;: UJ 0
4
5
6
7
- 9
II
12
13
-' 0
"' ~ >"' l'.l ~ -< "' 0
DESCRIPTION and CLASSIFICATION
6.4 ft - 8.1 ft, dark yellowish brown [I0YR 4/4]. firm, moist to wet
8.1 f1 - 8.4 fl, dark yellowish brown [I0YR 3/4]. stiff, moist
8.4-1 0 ft No Recovery
I 0-11.3 fl CLAY (CH) Dark yellowish brown [ I 0YR 3/4] trace fine to coarse subangular sand, tmce Mn oxide nodules. high plasticity stiff moist
11.3-20.75 ft CLAYEY SILT (ML) Reddish brown [SYR 413] trace fine to medium sand. homogeneous, friable, firm dry to moist
13.6 ft - 14.6 fl, ligh1 yellowish brown [2.5Y 6/4]
HOLE NUMBER
Z2-EU19-710 FINISHED
7-31-19 TOTAL DEPTH
20.8ft HOLE DIAMETER
2.25 in
NOTES
Discrele Soil Sampling: RA079-FSL0IO
Logbook: ETil'DPBORE-007
Radiological readings: A =alpha B = beta
S££ EXPLANATION FOR SYMBOLS AND ABBR£VIA110NS
WELL/ BORING LOCATION
EU19, WP2-18-KD5633, WC-07
HOLE NUMBER
Z2-EU19-7l0

6-28
!l 1lf...Q~ BORING LOG PROJECT JOBNUMBER ISHEETNUMBER HOLE NUMBER.
Deep Soil Borings UKKX19ET 2 or 2 Z2-EU19-710
>- Ul ..J !;; "' u < 1 ..J Ul z u
~ !;; 0 > < 5 0 "' 8 > 0
C z ~ If :i;
Ul 0 ...J -- ;: o- >-
"' < O:E:N ,c:i; z ~ "' DESCRIPTION and CLASSIFICATION NOTES -o.. K Ul o.. 0 "' Ul "' ~~-= °' !::. ~ :,: (.)
..J Ul t 5: 0.. ..J "' N 0 :. 0.. 0 - .: > Ul 0..
< :i; :i; Ul 0 < "' < ..J s ..J °' ~ "'
Ul Ul 0 u: I I I 13.9 fl (13.9 ft
100 - l.4A/142 0 bgs): Collected B 14.6 ft - 20.75 ft. reddish brown [5YR 4/3) RA079-097 for
~~
T T '- 15 biased RAD with
FIDLER reading of 424cpm at 0956.
- 16 15 ft (15 ft bgs):
100 - 11.4 A/ 0 Collected
149 B RA079-098 for
+ voes at 1021.
+ - 17
20 ft (20 ft ~): Collected
~~ - 18 RA079-099 (reg) and RA079-707
-(dup) for voes at 1039.
100 - 2.4 A /136 0 ~ 19 20.6 ft (20.75 ft B
--!- j_ - bgs): Collected RA079-I0I for
~~
biased RAD with ..._ 20 FIDLER reading
100 - 1.4 A/ II I 0 of 646cpmat B
I 1105. -- -- _J__
Bottom of Boring at 20.8 Ft 20.75 ft (20.75 ft bgs): Collected RA079- I 00 for voes at 1101.
DPT Refusal (2.25 in. OD) at 20.75 ft.
Temporary piezometer installed with I in. PVC, IO ft screen, 0.0 IO in. slots. TD at 20. 75 ft bgs.
Piezometer removed and borehole abandoned on 8/01/19 following groundwater sample collection.
SEE EXPLANATION FOR I \VELLI BORING LOCATION SYMBOLS AND ABBREVIATIONS EU19, WP2-18-KD5633, WC-07
lHOLE NUMBER Z2-EU19-710

EXPANSION OF
APPROVED REMEDIAL ACTION IN EU Z2-19
September 17, 2019

7-2
This page intentionally left blank.

7-3
Department of Energy
Oak Ridge Office of Environmental Management P.O. Box 2001
Oak Ridge, Tennessee 37831
September 17, 2019
CERTIFIED LETTER
Ms. Constance A. Jones Superfund and Emergency Management Division U.S. Environmental Protection Agency Region4
Atlanta Federal Center 6 I Forsyth Street Atlanta, Georgia 30303-8960
Mr. Randy C. Young State of Tennessee Department of Environment and Conservation Division of Remediation - Oak Ridge 761 Emory Valley Road Oak Ridge, Tennessee 37830-7072
Dear Ms. Jones and Mr. Young:
EXPANSION OF APPROVED REMEDIAL ACTION IN ZONE 2, EXPOSURE UNIT Z2-19 AT THE EAST TENNESSEE TECHNOLOGY PARK
Pursuant to the agreement reached at the August 22, 2019 East Tennessee Technology Park (ETTP) Project Team meeting, the U.S. Department of Energy is providing notification to the U.S. Evironmental Protection Agency and the Tennessee Department of Enviromnent and Conservation that there will be an expansion in the scope of the approved remedial action (RA) in Exposure Unit (EU) Z2-l 9. The expanded RA will include the excavation of soil from the Outfall 362 drainage ditch that lies adjacent to and downgradient of the original RA area as defined in FCN-ETTP-Zone 2-225.
FCN-ETTP-Zone 2-225 (Attachment A) was approved in June 2018 to remediate soil in EU Z2-19 under the Record of Decision/or Soil, Buried Waste, and Subsu,face Structure Actions in Zone 2, East Tennessee Technology Park, Oak Ridge, Tennessee (DOE/OR/0l-2161&O2; Zone 2 ROD). The RA was based on the discovery of soil contamination in excess of Zone 2 ROD remediation levels (RLs) and soil screening levels (SSLs) as summarized in the table below. Attachment B presents the boundaries of the RA as defined in FCN-ETTP-Zone 2-225.
CERTIFIED - RETURN RECEIPT REQUESTED (JONES 7017 2620 0000 6500 3580)
(YOUNG 7017 2620 0000 6500 3573)

7-4
Constance A. Jones/Randy C. Young -2- September 17, 2019
EXPANSION OF APPROVED REMEDIAL ACTION IN ZONE 2, EXPOSURE UNIT Z2-19 AT THE EAST TENNESSEE TECHNOLOGY PARK
FCN-225 RA in EU Z2-19 Outfall 362 Drainage Ditch
MaxRL Avg GW Ind Max Avg GW Ind RL SSL RSL RL RL SSL RSL
Total PCBs X X X
Chromium X X
Uranium (total) X X
Ra/Th decay series X X X X
Cesium-137 X X X X
Uranium-234 X X X X X X
Uranium-235 X X X X X X
Uranium-238 X X X X X X
Plutonium-239 X X
Technetium-99 X X X
PCBs = Polychlorinated biphenyls Ra = Radium Th= Thorium RL = Remediation Level RSL = Risk-based screening level
Soil contammat10n m the Outfall 362 dramage ditch, which hes m EU Z2-19 muned1ately west and downgradient of the planned RA, was identified as part of an effort to resolve data gaps concerning delineation of the downgradient extent of potential soil contamination derived from the planned excavation area. The delineation was being performed as required in the Remedial Design Report/Remedial Action Work Plan/or Zone 2 Soils, Slabs, and Subsurface Structures, East Tennessee Technology Park, Oak Ridge, Tennessee (DOE/OR/01-2224&D5). Sampling in the ditch was also intended to support initial characterization work being performed under the EU Z2-l 9 Creek Bank Area Data Quality Objectives for Final Characterization, approved by EPA and Tennessee Department of Environment and Conservation in July 2019.
As shown in the table above, preliminary results from the soil sampling analysis indicate that the contamination detected in the ditch are nearly identical to those identified in the excavation area defined in the approved FCN-ETTP-Zone 2-225. Given the presence of maximum RL exceedances in the ditch soils, DOE will expand the planned EU Z2-19 soil remedial action to include the drainage ditch, extending the excavation westward down to the edge of Poplar Creek. Figure 1 also shows the approximate boundaries of the expanded excavation into the drainage ditch. The exact boundaries of the remedial action will be defined on the basis of further delineation sampling. The final RA area will be defmed in a technical·memorandum for all ofEU-19.
CERTIFIED - RETURN RECEIPT REQUESTED (JONES 7017 2620 0000 6500 3580)
(YOUNG 7017 2620 0000 6500 3573)

7-5
Constance A. Jones/Randy C. Young -3- September 17, 2019
EXPANSION OF APPROVED REMEDIAL ACTION IN ZONE 2, EXPOSURE UNIT Z2-19 AT IBE EAST TENNESSEE TECHNOLOGY PARK
If you have any questions, or ifwe can be of further assistance, please contact Steve Clemons at (865) 576-2938.
Enclosures: 1. Attachment A 2. Attachment B
cc w/enclosures Neema Atashi, EPA Region 4 Sid Garland, RSI Randy Hoffmeister, TDEC [email protected] Steve Clemons, EM-921 Pat Halsey, EM-942
Sincerely,
£{,£_ / k:s Y. Daffron
ting Portfolio Federal Project Director
CERTIFIED - RETURN RECEIPT REQUESTED (JONES 7017 2620 0000 6500 3580) (YOUNG 7017 2620 0000 6500 3573)

7-6
Core Team Concurrence
Area:
Attachment A Project Team Agreement Log# __l2Q__
Area: Poplar Creek EU Group FCN-ETTP-Zone 2-225
This concurrence form documents the characterization efforts to determine the need for and extent of remedial action (RA) within the Class I Soil Unit (SU), and adjacent areas as deemed appropriate, in Exposure Unit (EU) Z2-l 9 in accordance with Data Quality Objective Scoping Package for the Poplar Creek Group (EUs Z2-11, Z2-12, and Z2-19) at the East Tennessee Technology Park, Oak Ridge, Tennessee (BJC/OR-3231) (Poplar Creek DQO Scoping Package). Sampling locations for EU Z2-19 are identified in Appendix G of Remedial Design Report/Remedial Action Work Plan for Zone 2 Soils, Slabs. and Subsurface Structures, East Tennessee Technology Park, Oak Ridge, Tennessee (DOE/ORIO l-2224&D5) (RDR/RA WP). Modifications to the sampling plan for the Class I SU were approved in FCN-ETTP-Zone 2-194. This concurrence form presents a summary of the background information, characterization objectives and strategy, evaluation of sample results, and the extent of the three planned RAs within the Class 1 SU.
Summary Information:
Description: EU Z2-l 9 is located immediately west of the former Bldg. K-25 on the east bank of Poplar Creek. The EU Z2-l 9 boundaries encompass approximately 20 acres ofland, which the Poplar Creek DQO Scoping Package divided into approximately 3 acres of Class 1 SUs and 17 acres of Class 3 SUs. This concurrence is primarily in the Class I SU, which includes the former Bldg. K-1031 concrete slab and the former Bldg. K-1410 concrete slab.
Constructed in 1945 as a maintenance support facility for the K-25 building, Bldg. K-1031 was used to store and dispense trapping media for spent cascade traps and was later used as a cutting and size reduction area for process equipment from the Fercleve Thermal Diffusion Plan. Prior to demolition, the building was used for equipment and material storage. Only the concrete slab remains. Walkover surveys performed indicate low levels of contamination exist throughout the site, with small areas of higher activity to the north and south of the building.
The Bldg. K-1410 was used to mix media from the spent cascade traps for use in the K-25 Gaseous Diffusion Plant. Subsequently, it was used for decontamination and recovery of uranium from large pieces of equipment. The building included two spray facilities to solubilize and remove uranium with nitric acid and to degrease pumps with trichloroethene. Finally, the facility was converted to an electroplating facility by removing the decontamination tanks and filling the degreasing pits with concrete. Only a concrete slab remains.
Both the K-1031 and K-1410 slabs have been covered with asphalt. Within the Class I SU, three distinct soil excavation actions are to take place, designated as Dig I , Dig 2, and Dig 3, based on the results of the characterization effort.
Data Quality Objectives:
The goal of the EU Z2-19 Class I SU is to release this area for its intended future end use. To achieve this goal, the types, distributions, and concentrations of chemicals and radionuclides in soils, building slabs, and related media must be determined to make decisions of RA or no further action (NFA). Characterization of the Class I SU is used to answer the following two primary decision statements:

7-7
Attachment A Project Team Agreement Log# ..J.2Q.._
Area: Poplar Creek EU Group FCN-ETTP-Zone 2-225
I. If the concentration of chemicals and/or radionuclides in the Class 1 SU and related media exceed acceptable limits, then conduct an RA to achieve acceptable end state conditions; otherwise, take NF A.
2. If sources of potential groundwater contamination are found to exist in soils within the Class 1 SU, then conduct a RA to achieve acceptable end-state conditions; otherwise, take NFA.
Characterization Summary:
A radiological walkover survey in and around the EU Z2-19 Class I SU was conducted during spring 2016. Based on these results, FCN-ETTP-Zone 2-194 approved the soil sampling approach to address areas with elevated radioactivity. Specifics of the samples collected are presented in Attachment I and the sample locations are shown on Fig. 4 of the Technical Memorandum.
The EU 22-19 Class I SU data are evaluated against the Zone 2 Record of Decision remedial action objective decision criteria as described in the Remedial Design Report/Remedial Action Work Plan for Zone 2 Soils, Slabs, and Subsurface Structures, East Tennessee Technology Park, Oak Ridge Tennessee (DOE/OR/01-2224&O5, Sect. 3.2) (Zone 2 RDR/RA WP). Table I presents the summary of the results of the Class I SU characterization samples following data evaluation.
Table 1. Data summary for EU Z2-19 Class I SU
Analyte Total PCBs Chromium Uranium (total) Ra/Th decay series Cesium-137 Uranium-234 Uranium-235 Uranium-238 Plutonium-239 Technetium-99
EU ;;;': Exposure Unit PCB - polychlorinated biphenyl Ra= radium RL = remediation level
Type of RL exceedance MaximumRL Groundwater SSL Industrial RSL Maximum RL, Average RL Maximum RL, Average RL Maximum RL, Average RL, Groundwater SSL Maximum RL, Average RL, Groundwater SSL Maximum RL, Average RL, Groundwater SSL Industrial RSL Groundwater SSL
RSL = risk screening level SSL= soil screening level SU= Soil Unit Th = thorium
Radiological surveys of the slabs demonstrated the presence of elevated radioactivity which resulted in
the slabs being designated as Contamination Area (K-1031) and High Contamination Area (K-1410). Based on their location within the area of EU 22-19 which has been demonstrated to pose a threat to the
industrial worker and a probable threat to groundwater (i.e., Class I SU) as a result of the presence of radiological contamination, it is concluded that the slabs themselves pose similar risks. Removal of the
slabs will eliminate the risks associated with them.
RA Decision:
Based on the presence of remediation level (RL) exceedances in soils and a probable threat to groundwater from primarily isotopic uranium in soils, a decision was made to conduct an RA in EU 22-19. As demonstrated in the Technical Memorandum (see Fig. 5), the sample locations with RL exceedances and residual groundwater (GW) soils screening level (SSL) exceedances are clustered near the interior of the Class I SU and are largely surrounded by sample locations with no criteria exceedances. Therefore, the
2

7-8
Attachment A Project Team Agreement Log# ___1!lQ__
Area: Poplar Creek EU Group FCN-ETTP-Zone 2-225
areal extents of the RAs are known with a high degree of certainty; confirmation sampling conducted following the RA (described below) will verify the RA has been successful.
The EU 22-19 RA will be conducted within three primary boundaries referred to as Dig I, Dig 2 and Dig 3, with the smaller dig, Dig 3, located within the boundaries of Dig 2 (see the Technical Memorandum, Fig. 6). In addition, the K-1031 and K-1410 concrete slabs will be removed as part of Dig 2. The K-1410 slab portion of Dig 2 will be to a depth of 4 ft with the exception of the pit area. The area of the filled pit will be excavated to the depth of the pit. The K-l031 slab portion of Dig 2 will be concrete and incidental soil only. A summary of the planned RAs in EU 22-19 Class I SU are presented in Table 2.
Table 2. Summary of planned RAs in EU Z2-19 Class l SU
RA Dig# RA material I Soil
2 Soil
Concrete
3 Soil
EU= Exposure Unit RA= remedial action SU = Soil Unit
Depth of excavation Estimated volume (ft) (cy) 3 422
4 8773
I 634
6 178
Soil and concrete excavation will commence using standard earthmoving equipment and dump trucks and/or dedicated waste containers for waste shipments. Excavation will progress from an initial starting point on a perimeter of a dig area until the entire area and depth is reached. The area of Dig 2 may be subdivided into smaller excavation area due to the need to have less area open at a given time to minimize storm water collection. Water management actions, including run-on/run-off controls and cover (using clean fill or membranes), will be implemented during ongoing excavation actions pending receipt of analytical confirmation samples results to protect the integrity of the excavation.
Most of the materials excavated during the EU 22-19 RA will be disposed at the Environmental Management Waste Management Facility in accordance with an applicable Zone 2 waste profile, with smaller volumes of material being disposed offsite, as required. Actual waste volumes disposed and disposal facilities used will be presented in the RA completion report.
Confirmation Sampling:
Upon completion of both the lateral and vertical extent of a dig and excavation of the concrete slabs or when excavation activities warrant safe access to the excavation areas, a radiological survey of the excavation walls and floor will be performed to semi-quantitatively identify potential areas within the excavation that exceed 2 times background. Locations exhibiting unacceptably high readings will be marked for additional excavation (nominally I ft. in a ll applicable directions into the underlying material) and the locations re-surveyed. This process will continue until it is determined that excavation surfaces meet this criterion.
Following the radiological survey and final excavation actions, the area consisting of the walls and floor will be determined. Similar to the characterization sampling, a statistical sampling approach has been developed based on the area using a superimposed two-dimensional grid spanning the excavation areas (or portions thereof, if required) using site coordinates and field measurements. The appropriate number of
3

7-9
Attachment A Project Team Agreement Log# __J_2Q_
Area: Poplar Creek EU Group FCN-ETTP-Zone 2-225
confirmatory samples based on statistical parameters of95% confidence and 80% coverage was determined and a triangular grid with a random start was prepared for each dig area (see Fig. ?). Using this approach, 11 sample locations will be selected from the floor and 3 from the wall of Dig I. Similarly, 1 ?grid locations were identified for the floor of Dig 2 with an additional 3 locations from the wall (area including Dig 3). Finally, biased samples will be collected as determined in the field, with up to 2 biased samples collected from Dig 1 (approximately 16 sample locations in Dig 1), with up to 6 biased samples collected from Dig 2 and up to three collected from Dig 3 (approximately 29 sample locations in Dig 2). Once excavation in an area is deemed complete, the grid nodes in the area will be marked in the excavation and sample collected from the 0-1 ft. interval and sent to a laboratory for analysis with a nominal 3-day turnaround. Biased samples will be collected based on the highest radiological reading in an open excavation. The confirmatory samples will be discrete samples.
When the average concentration of all constituents of concern are less than their respective average remediation level (both average RL and OW SSL), the excavation will be declared complete and may be filled with clean fill and the site stabilized as necessary.
EU Z2-19 Class 1 SU Closure Actions:
When final confirmation sampling indicates there are no RL or OW SSL exceedances in an excavation, then the excavation area that the confirmation samples represents will be backfilled and the entire area will be contoured and stabilized, as appropriate.
Provisional Management for slabs K-1031 and K-1410:
The RDR/RA WP Appendix K, Provisional Management of Slabs, requires slabs requiring remediation have provisional management if not remediated within 60 days or a period agreed to by the project team. Slabs K-1031 and K-1410 will not be remediated within the 60 days, but have planned remediation dates of August 2018 and October 2018, respectively. Since the slabs are covered by asphalt, the provisional management would be an annual inspection to ensure contaminant migration is prevented by the asphalt cover. Due to the removal of the slabs being planned for removal in less than a year, no provisional management is proposed.
Conclusion and Summary:
This concurrence form proposes that three RAs be taken within the EU 22-19 Class I SU to remove threats to the industrial worker and underlying groundwater. The proposed RA aerial boundaries are shown in the Technical Memorandum (see Fig. 6). Following impacted material excavation and disposal, confirmation samples will be collected to demonstrate that the RAs have achieved the remedial action objectives presented in the Zone 2 ROD.
4

7-10
Concurrence!
U.S. DepartmentofEnergy
U.S. Environmental Protection Agency
5
Project Team Agreement Log# l2Jl Area: Poplar Creek EU Group
FCN-EITP-Zone 2-225
5/29/18
Date
5'/zq j,a Date

7-11
ATTACHMENT 1. EXPOSURE UNIT EU Z2-19 CLASS 1 SOIL UNIT
TECHNICAL MEMORANDUM

7-12
INTRODUCTION
This Technical Memorandum presents the background information, analytical results, data evaluations, and other related information that serve as the rationale for recommending a remedial action (RA) in the Class 1 soil unit (SU), and areas in close proximity as deemed necessary, of Exposure Unit (EU) 22-19, located in the west central area of ETTP along the east side of Poplar Creek (Figs. 1 and 2). Figure 2 identifies two Federal Facilities Agreement sites in EU 22-19: K-1031 pad and K-1410 pad. Upon completion of the RA, the Class I SU will have been fully addressed and require no further action (NFA) under DOE/OR/01-2161&D2, Record of Decision for Soil, Buried Waste, and Subsurface Structure Actions in Zone 2, East Tennessee Technology Park, Oak Ridge, Tennessee (Zone 2ROD).
On December 14, 2017, the ETTP Core Team was briefed on the field sampling results presented herein. As discussed, additional characterization activities will be conducted in EU 22-19 to address pits, vaults, buildings, and soils outside the Class I SU. After completing the remaining characterization activities, the Core Team will be briefed on the results and a path forward for the remaining portions of the EU, as appropriate.
:,_1,11 · . . : .:: I BACKGROUND INFORMATION AND EU SUMMARY
Exposure Unit 22-19 is located immediately west of the former Bldg. K-25 on the east bank of Poplar Creek. The EU 22-19 boundaries encompass approximately 20 acres ofland, which the Poplar Creek Data Quality Objective Scoping Package divided into approximately 3 acres of Class I SUs and 17 acres of Class 3 SUs. This technical memorandum and RA concurrence is limited to the Class 1 SU and a small adjacent area only, which includes the former Bldg. K-1031 concrete slab, the former Bldg. K-1410 concrete slab, and soil areas in and around these slabs.
A radiological walkover survey in and around the EU 22-l 9 Class 1 SU was conducted during the spring 2016. The survey results are depicted graphically on Fig. 3. FCN-ETTP-Zone 2-194 approved the soil sampling approach to address areas with elevated radioactivity. Specifics of the samples collected are presented in Attachment IA and the sample locations are shown on Fig. 4.
f:!;I' : .,JlEd CHARACTERIZATION AND DELINATION SAM PLING ANALYTICAL RESULTS
Attachment 1B presents a summary of the data collected and a comparison of those data to Zone 2 remediation levels (RLs) consistent with the ROD remedial action objectives (RAOs) for protection of the industrial worker and groundwater. This summary shows that there are multiple exceedances of RLs, including maximum RLs, average RLs, industrial risk screening levels (RSL ), and groundwater (GW) soil screening levels (SSL} in EU 22- I 9.
Attachment IC presents a comprehensive list of criteria exceedances in the existing data for EU 22-19. There are 19 sample locations with one or more exceedance of the maximum RLs, 36 sample locations with exceedances of the average RLs, 15 additional sample locations with RSL exceedances, and 31 sample locations with GW SSL exceedances. The sample locations with exceedances ofRLs are shown on Fig. 5.
Note that several sample locations exhibit multiple exceedances of different RLs, mostly within the shallow interval (i.e., 0 - I ft.) although average RLs, industrial RSLs, and GW SSLs are exceeded in depths up to 10 ft. These results are used to define the nature and extent of contamination within the Class I SU and define the RA necessary to reduce contaminant mass and achieve the RAOs in EU-22-19 as discussed below.
;;J'.z :':~:lpJ EU Z2-19 CLASS 1 SU DATA EVALUATION
The EU 22-19 Class I SU data are evaluated against the Zone 2 ROD RAO decision criteria as described in Remedial Design Report/Remedial Action Work Plan for Zone 2 Soils, Slabs, and Subsurface Structures, East Tennessee Technology Park, Oak Ridge Tennessee (DOE/OR/01-2224&D5, Sect. 3.2) (Zone 2 RDR/RA WP).
Maximum RL Screening. There are 19 sample locations in the EU 22-19 Class I SU with maximum RL exceedances, with 18 in the 0-1-ft depth and I within the 0-2-ft depth. Table I indicates the analytes and the number of exceedances observed. There are no maximum exceedances at depths greater than 2 ft (Attachment IC). The distribution of sample locations is shown on Fig. 5 and information regarding specific sample locations is presented in Attachment l C. According to the Zone 2 ROD, the area represented by these 19 sample locations requires an RA.

7-13
Table I. Class I SU analytes with maximum detected concentrations exceeding maximum RLs
SU maximum Analyte with maximum Number of detected Maximum RL
RL exceedance{s) exceedances concentration {eCi/g) Ra/Th decay series 15 6,254 pCi/g 15 Cesium-137 6 4,060 pCi/g 20 Uranium-234 2 57,300 pCi/g 7000 Uranium-235 7 4,250 pCi/g 80 Uranium-238 8 17,300 500
Ra= radium SU = Soil Unit RL = remediation level Th =thorium
Average RL Screening. The process presented in Sect. 3.2 of the Zone 2 RDR/RA WP for conducting an average RL screen arrives at a conclusion about whether the EU average concentration of a primary COC exceeds the average RL. Typically, the average RL screen is conducted across the EU; however, since EU-wide characterization is not complete, the average RL exceedances within SU I are used to help define the excavation boundaries for the Class I SU.
There are 36 sample locations with maximum detected concentrations exceeding average RLs, excluding locations with maximum RL exceedances, 33 have constituents in the 0-4-ft depth interval and 3 have constituents up to 10 ft in depth. Table 2 indicates the analytes and the number of exceedances observed. The distribution of the sample locations are shown on Fig. 5.
Table 2. Class 1 SU analytes with maximum detected concentrations exceeding average RLs
Analyte with maximum RL exceedance{s)
Total PCBs Ra/Th decay series Cesium-137 Uranium-234 Uranium-235 Uranium-238
Ra= radium Th = thorium
Number of exceedances
1 8 8 4 33 34
PCB= polychlorinated biphenyl
SU maximum detected
concentration 26,300 µg/kg
11.7 pCi/g 13.8 pCi/g
6,690 pCi/g 75 .3 pCi/g 362 pCi/g
RL = remediation level SU= Soil Unit
Average RL 10,000 5 pCi/g 2 pCi/g
700 pCi/g 8 pCi/g 50 pCi/g
Industrial RSL evaluation. This evaluation is performed to insure that the additional non-contaminant of concern (COC) chemicals and radionuclides, in which either maximum or average RLs are not defined, do not result in a total risk greater than I x 104 (for carcinogens) or a total hazard index of 1 (for noncarcinogens). Remediation screening levels (RSLs) for carcinogenic constituents are set at I x I o·'to ensure the total risk (i.e., sum of individual constituent risks) meets the I x 10·•total risk goal. RSLs for non-carcinogenic constituents are set at a hazard quotient (HQ) of 0.1 to ensure the Hazard Index (HI) (i.e., the sum ofHQs) meets the target HI goal of I. Similar to the average RL exceedance evaluation, this evaluation arrives at a conclusion about whether the average "non-COC" constituent concentrations within the SU that do not have RLs defined do not exceed the total risk and HI targets for the industrial exposure scenario. Because the EU-wide characterization is not complete, the RSL exceedances within SU l also are used to define the excavation boundaries for the Class I SU.
There are 15 sample locations with maximum detected concentrations exceeding industrial RSLs, 14 having constituents within the 0-2-ft depth interval and I has constituents up to 10 ft deep. Attachment IC provides the results of chemicals and radionuclides with maximum detections greater than their respective RSLs. As such, the area represented by these sample locations indicates that an RA is required. Table 3 indicates the analytes and the number of exceedances observed.
2

7-14
Table 3. Class l SU analytes with maximum detected concentrations exceeding industrial RSLs
Analyte with maximum RL exceedance(s)
Number of exceedances
Uranium (total) Plutonium-239
RL - remediation level RSL = risk screening level SU = Soil Unit
17
SU maximum detected
concentration 21,000 µg/kg
154
Industrial RSL
230 µg/kg 128 pCi/g
With the exception of sample location Z2-EU19-107, all sample locations with maximum detected concentrations of both total uranium and plutonium-239 exceed corresponding industrial RSLs are coincident with locations defined by the constituents presented above that exceed maximum or average RLs. When the uranium total concentrations coincident with the locations that have the maximum RL exceedances are eliminated, the resultant average uranium total within the Class I SU (47.4 µg/kg) would be less than the industrial RSL.
According to the Zone 2 RDR/RA WP (see Sect. 3.2), the final step in the risk evaluation is to evaluate the cumulative impact on risk over an entire EU from all chemicals.and radionuclides with RSL exceedances by comparing the sum offractions (SOF) (average detected concentration/RSL) to 7.5 (because RSLs for carcinogens are set at IO times less than their I x 104 excess lifetime cancer risks, the 7.5 SOF is approximately 75 percent of the Zone 2 ROD risk limit). Following complete characterization and RA within EU Z2-19, a final SOF for the EU Z2-19 risk screen will be performed.
Threat to groundwater. This evaluation is performed to ensure constituent concentrations in soil do not exceed modeled concentrations (GW SSLs) such that leaching would lead to groundwater concentrations in excess of drinking water standards. Should constituents exceed GW SSLs, RA is required to protect groundwater. There are 31 sample locations with maximum detected concentrations exceeding GW SSLs, 31 have constituents within the 0-4-ft depth and 3 have constituents up to IO ft deep. Table 4 indicates the analytes and the number of exceedances observed.
Table 4. Class I SU analytes with maximum detected concentrations exceeding GW SSLs
Analyte with MaximumRL exceedance(s)
Chromium Uranium-234 Uranium-235 Uranium-238 Technetium-99
GS = groundwater
Number of exceedances
I 41 8 34 I
RL = remediation level RSL = risk screening level
SU maximum detected
concentration 530 µg/kg
57,300 4,250 17,300
154 SSL = soil screening leve SU = Soil Unit
Industrial RSL
172 µg/kg 61.1 61.1 61.1
128 pCi/g
One step in evaluating possible threats to groundwater is to estimate the volumetric extent and mass of analytes with GW SSL exceedances to determine whether the analytes pose a threat to groundwater (Zone 2 RDR/RA WP, Sect. 3.2). The distribution ofresidual GW SSL exceedance locations forms a cluster near the interior of the Class I SU (Fig. 5) to the point where there is probably sufficient volume of contaminated soil so that the mass of the detected constituents pose a threat to groundwater . As such, the area represented by these sample locations indicates that a RA is required.
::i!~r:~;~);;:: ;;I K-1031 Concrete Slab
B~;i~~~;~-~;31 was constructed in 1945 as a maintenance support facility for Bldg. K-25. Building K-1031 was first used to store and dispense trapping media for spent cascade traps and was later used as a cutting and size-reduction area for process equipment removed from the Fercleve Thermal Diffusion Plant. Beginning in the early I 960s,
3

7-15
Bldg. K-1031 was used for paint storage and mixing. Prior to demolition, the building was used for equipment and material storage.
Building K-1031 was demolished in 1999, leaving an approximately 4400 sf concrete slab in place. Demolition of Bldg. K-1031 is described in the Removal Action Report/or the K-25 Auxiliary Facilities Decommissioning Group l Buildings Demolition Project at the East Tennessee Technology Park, Oak Ridge, Tennessee (DOE/ORIO l-l 829&D I) (K-25 Auxiliary Facilities RmAR). A radiological survey of the concrete slab was conducted in 1999 (Appendix A) that showed elevated radioactivity over the slab ranging up to 224,084 dpm/100 cm'. Based on the radiological survey results, the K-1031 concrete slab was designated as a Contamination Area. Following the radiological survey, the slab was covered with 2 in. of asphalt, which is its current state. Based on this information, a RA is required.
jJ51:f1•:;:;;,:H K-1410 Concrete Slab
B~iki;·~;Q:·;~ IO was constructed in 1944 to mix media from spent cascade traps for use in the K-25 Gaseous Diffusion Plant. Later the building was used for decontamination and recovery of uranium from large pieces of equipment. Two spray facilities were used to solubilize and remove uranium contamination with nitric acid and to degrease pumps with trichloroethene. In 1963, Bldg. K-1410 was convened to an electroplating facility by removing the decontamination tanks and filling the degreasing pits with concrete.
Building K-1410 was demolished in 1999 leaving an approximately 8700 sf concrete slab in place. Demolition of Bldg. K-1410 is described in the K-25 Auxiliary Facilities RmAR. A radiological survey of the building floor was conducted in 1998 prior to demolition {Appendix BI), which showed elevated radioactivity over the floor ranging up to 48,000 dpm/100 cm'. A second radiological survey was conducted on a pit inside the facility in 1998 {Appendix B2). The results of the pit survey showed elevated radioactivity over the slab ranging up to 11,216 dpm/100 cm2• A final radiological survey was conducted after demolition in 1999 on the end ofan exposed pipe in the southwest comer of the concrete slab (Appendix B3). Results of the pipe survey showed elevated radioactivity of 1,718,200 dpm/100 cm2• The survey technicians reported the presence of"visible product inside and around the pipe openings".
Based on the radiological survey results, the Bldg. K-1410 concrete slab was designated as a High Contamination Area. Following building demolition and after final radiological surveying, the slab was covered with 2 in. of asphalt, which is its current state. Based on this information, a RA is required.
Decision
Based on the presence of maximum (Max) RL exceedances in soils, the presence of average (Ave) RL exceedances in soils, and a probable threat to groundwater from primarily isotopic uranium in soils, a decision has been made to conduct an RA in EU Z2-19. As demonstrated on Fig. 5, the sample locations with Max RL exceedances, Ave RL exceedances, and residual GW SSL exceedances are clustered near the interior of the Class I SU and largely surrounded by sample locations with no criteria exceedances. Therefore, the areal extents of the RAs are known with a high degree of certainty. Confirmation sampling conducted following the RA (described below) will verify that the RA has been successful.
In addition to soil excavation, the RA will also remove the Bldgs. K- 1031 and K- 1410 concrete slabs. The two slabs are located within or adjacent to the boundaries for soil excavation {see Remedial Action Description section), but both slabs have been covered with approximately 2 in. of asphalt. The two slabs are listed in Appendix K of the Zone 2 RDR/RA WP as potentially contaminated. Evaluation of potentially contaminated slabs under the Zone 2 RDR/RA WP requires radiological surveys, visual inspections, and sampling in response to survey and visual observations. Because of the asphalt covering on each slab, neither slab can be evaluated in the manner prescribed by the Zone 2 RDR/RA WP. However, pre-asphalt radiological surveys of the slabs (Appendices A, Bl , and B2) demonstrated the presence of elevated radioactivity, which resulted in the slabs ' designations as Contamination Area (K-1031) and High Contamination Area (K-1410). Based on the location within the area of EU Z2-l 9, which has been demonstrated to pose a threat to the industrial worker and a probable threat to groundwater as a result of radiological contamination, combined with historical radiological surveys of the slabs that show the slabs are radiologically contaminated, it is concluded that the slabs themselves pose a risk to the industrial worker under the Zone 2 ROD.
4

7-16
Remedial Action Description
The EU Z2-19 RA will be conducted within three primary boundaries referred to as Dig I, Dig 2 and Dig 3 (Fig 6), with the smaller dig, Dig 3, located within the boundaries of Dig 2 (Fig. 6). Concrete demolishing equipment will be used to break up slabs, including any filled pits that are encountered, into dimensions that are acceptable for disposal. Typical earth moving equipment will be used to excavate soil to the requisite depths as previously described. Remedial actions will begin at a pre-determined dig boundary and proceed inward and around to the lateral extent of the dig boundaries. Clean fill may be used for clean working surfaces and for creating in-excavation berms for water control to prevent a potential for cross contaminating finished excavations pending confirmation sampling.
The K-1410 and K-1031 concrete slabs are also located within the Dig 2 boundaries (Fig. 6).
Sample locations to be removed during the excavation of each dig are presented in Table 5. The contaminant mass characterized by these samples locations, in addition to the volume surrounding the sample locations, will be removed and replaced ultimately with clean fill. The RAs will result in both contaminant mass reduction and exposure pathway elimination, thereby providing protection to the industrial worker and groundwater. Following are descriptions of the digs that make up the RA:
Dig 1. Dig I is located on the north end of the EU Z2-19 Class I SU (Fig. 6). The area of Dig I is approximately 3800 sf and excavation will be conducted to a depth of 3 ft.
Dig 2. Dig 2 is the largest of the EU 22-19 RA digs (Fig. 6). The area of Dig 2 is approximately 62,400 sf and excavation will be conducted to a depth of 4 ft, except in Dig 3 (below). The approximately 8700-sfK-1410 concrete slab will be excavated during excavation of Dig 2; therefore, the depth of excavation at the K-1410 footprint will be 4 ft. One exception will be in the area of the filled pit, where the area be removed to the depth of the pit. The approximately 4400-sfK-1031 concrete slab is located on the north end ofDig2 (Fig. 6). The K-1031 slab excavation will include the slab and incidental soil.
Dig 3. Dig 3 encompasses an area of approximately 4400 sf and the depth of excavation in Dig 3 will be 6 ft. The purpose for Dig 3 is to excavate the GW SSL exceedances at sample locations Z2-EU19B-152 and Z2-EUl9B-157, which occur at depths between 5-6 ft below ground surface (Attachment IC).
During the remedial actions the boundaries of Dig I and Dig 2, including the K-1410 footprint, the K-1031 footprint, and the footprint of Dig 3 to a depth of 6 ft in Dig 2, will be recorded using geospatial coordinates by means of an infield global positioning system instrument. This approach will "map" the excavations for future reference as necessary.
Table S. EU Z2-19 sample locations included in the remedial action boundaries
Z2-EU 19-101° 22-EUJ 9-102 Z2-EU19-103 a
Z2-EU19-105 ° Z2-EU19-106 a
Z2-EUl9-107 a
Z2-EUl9-108 ° Z2-EU19-109 a
Z2-EUl9-l 10 ° Z2-EU19-l ll 0
Z2-EU19-l 12 ° Z2-EUl9-113 ° Z2-EUl9-l 14 • Z2-EU19-l 15 ° Z2-EU19-116 ° Z2-EU19-l 17 ° Z2-EUl9-l 18 •
Dig l sample locations Z2-EU19-128 Z2-EUI 9-129 Z2-EU19-130
Dig 2 sample locations Z2-EUJ9-121 a
Z2-EUJ9-124 ° Z2-EU 19B-138 Z2-EUJ9B-139 ° Z2-EUJ 9B-140 Z2-EU19B-141 Z2-EU19B-142 Z2-EU19B- 145 Z2-EUl9B-148 Z2-EUl9B-149 • Z2-EU19B-168C • Z2-EU 19B-150 Z2-EU19B-15 l Z2-EUJ9B-155 a
5
22-EU 19B-134 Z2-EU19B-154 °
Z2-EUl9B-15 ° Z2-EUl9B-158 Z2-EUl 9B-159 Z2-EUl9B-160 Z2-EUl9B-162 a
22-EUI 9B-163 22-EUI 9B-164 • Z2-EUI 9B-165 ° Z2-EUI 9B-166 ° 22-EUI 9B-167 • Z2-EUl 9B-167A • 22-EU I 9B-167B • 22-EUI 9B-167C 22-EUJ 9B-1670 °

7-17
Table 5. EU Z2-19 sample locations included in the remedial action boundaries (cont.)
22-EU 19-119 22-Eut 9-120 " Z2-EU19-122 ° 22-EUI 9-123"
22-Eut 98-152 °
Dig 2 sample locations (cont.) Z2-EUl9B-155A Z2-EUl9B-1558 Z2-EU19B-155C Z2-EU19B-155D
Dig 3 sample locations Z2-EU19B-157 •
K-1031 concrete slab sample locations
Z2-EUl9B-168 Z2-EUl9B-168A Z2-EUl9B-168B 22-EU 198-168D
Z2-EUl9B-137 (concrete only) K-1410 concrete slab sample locations
Z2-EUl9B-153 •(concrete and sub-slab soil) "Zone 2 ROD criteria exceedances locations; see Attachment IC for exceedance details.
Waste Disposition
Most of the materials excavated during the EU 22-19 RA will be disposed at the Environmental Management Waste Management Facility (EMWMF) in accordance with an applicable Zone 2 waste profile, with smaller volumes of material being disposed offsite as required. Table 6 presents the current estimate of waste for disposal. Actual waste volumes and disposal facilities will be presented in the RA completion report.
Confirmation Sampling
Table 6. Projected volumes of material for disposal from the EU Z2-19 remedial action
Waste medium Soil Concrete
EU = Exposure Unit
Projected volume for disposal (cy)
10,644 888
The following describes the process of sampling to confirm the RA in the EU 22-19 Class I SU has successfully removed threats to the industrial worker and groundwater:
• Upon completion of both the lateral and vertical extent of a dig and excavation of the concrete slabs or when excavation activities warrant safe access to the excavation areas, a radiological survey of the excavation walls and floor will be performed to semi-quantitatively identify potential areas within the excavation that exceed 2 times background. Locations exhibiting unacceptably high readings will be marked for additional excavation (nominally I ft. in all applicable directions into the underlying material) and the locations re-surveyed. This process will continue until it is determined that excavation surfaces meet this criterion.
Following the radiological survey and final excavation actions, the area consisting of the walls and floor will be determined. Similar to the characterization sampling, a statistica l sampling approach has been developed based on the area using a superimposed two-dimensional grid spanning the excavation areas (or portions thereof, if required) using site coordinates and field measurements. The appropriate number of confirmatory samples based on statistical parameters of 95% confidence and 80% coverage was determined over a triangular grid with a random start for each dig area (see Fig. 7). Using this approach, approximately 11 sample locations will be selected from the floor and 3 from the wall of Dig I. Similarly, 17 grid locations were identified for the floor of Dig 2 with an additional 3 locations from the wall (which includes Dig 3). Finally, biased samples will be collected as determined in the field, with up to 2 biased samples collected from Dig 1 (total of 16 samples), with up to 6 biased samples collected from Dig 2 and up to three collected from Dig 3 (approximately 29 samples in Dig 2/3). Once excavation in an area is deemed complete, the g rid nodes in the area will be marked in the excavation and sample collected from the 0-1 ft. interval and sent to a laboratory for analysis with a nominal 3-day turnaround. Biased samples will be collected based on the highest radiological reading in an open excavation with the locations marked and recorded. The confirmatory samples will be discrete samples.
6

7-18
• Water management actions, including run-on/run-off controls, cover using clean fill or membranes will be implemented pending receipt of analytical confirmation samples results to protect the integrity of the excavat ion.
If an analytical result exceeds an RL or GW SSL in a wall or floor confirmation sample, then the areas of the excavation that are below criteria will undergo backfilling or covering with clean fill and an additional 1 ft of soil (moving radially away from the sample location in all applicable directions) will be excavated from the location represented by the confirmation sample. As discussed above, water management controls will be implemented to ensure the integrity of the additional excavated area pending receipt of sample analytical results.
• When confirmation sampling shows there are no RL or GW SSL exceedances in an excavation area, then the excavation area that the additional confirmation sample(s) represents will be backfilled. The entire area will be contoured and stabilized as appropriate once all excavation areas have been backfilled.
Expected Post-RA Conditions
As previously discussed, complete characterization of EU 22-19 is pending. As such, data from additional sample locations will be combined with current locations outside of the RA in the Class I SU, as well as with applicable data within the footprints of the RAs not impacted by the excavations, to determine a final risk condition throughout the entire EU. Based on this evaluation, either a NFA will be determined for the EU or additional actions, as necessary, will be taken to ensure protection of the industrial worker and groundwater.
7

7-19
Attacllmeal IA. Sample summuy for EU Z2-19
Date Laboratory analyHs
F.U tolk:tted Samo!~ location Sa mole interval Metals PCB RAD svoc voe Commentl/dcscriptions Cbarae~ri1.atloo Sam Jiu : Z2-19 J/27(2017 Z2-EUl9-101 0-1 ft soil I I I I Clasi I SU RAD walkover survey above.action level
21-19 J/27/2017 22-EU19-102 0.1 ft soil 1 1 1 1 Class I SU RAD w.llkover swvey above-action level
Z2-19 J/27/2017 Z2-EU19-103 0-1 ft soil 1 I 1 1 Cte.ss I SU RAD walkover SUT'Yey above-action level
22-19 3129/2017 Z2-EUJ9-104 0.1 ft soil I I I I Class 1 SU RAD ""8.lkover survey above-action level
Z2-19 )/27n.017 Z2-ElJl9-I05 0-1 ftsoil 1 1 1 I Class I SU RAD walkover survey above-action level
22-19 3129/2017 Z2-EUl9-1 06 0.1 ft soil I I 1 1 Class I SU RAD walkover survey above-action level
2.2-19 3130/2017 Z2-EU19-l07 0-IO fl ]-interval co1nposite I I I I Class I SU RAD walkover survey above-action level
71-19 J/27/2017 Z2-EU19-1 08 0-1 ft soil I I I I C1ass I SU RAD W<llkover survey above-action level
22-1 9 3/23/2017 Z2-EUI 9-109 0-1 ft soil 1 1 1 1 Cla~s I SU RAD ,,.,'alkover survey 11bove-action level
22-19 l/2Y2017 Z2-EU19-1 10 0-1 ft soil 1 1 I 1 Class I SU RAD walkover survey above-action level
Z2· 19 l/22/2017 Z2 ·EU19-1 IJ 0-1 ft soil 1 1 1 I Class I SU RAD walkover survey above-action level
Z2-1 9 m2no11 Z2-EU19•l 12 0- l ftsoil I 1 1 I Class I SU RAD walkover survey above-action level
Z2-19 l/2212017 Z2-EU19-l 13 0. l ftSOtl 1 1 1 1 CIMS I SU RAD Wlllkovcr survey above-action level
22-1 9 l/23/l0]7 Z2-EU19-l t4 0-1 ft.soil 1 1 1 I CIMS I SU RAD walkover survey above-action level
z2. 19 1/23/2017 Zl ·EU19-I 15 0-1 ft soil 1 I I I Class I SU RAD walkover survey above-ill.ction level
2 2-19 l/23/2017 22-EUl9-l 16 0-1 ft soil 1 1 1 1 Class I SU RAD walkover survey above-action level
Z2-1 9 l/2J/2017 l.2-EU19·1 17 0-1 ft soil I I I I Class I SU RAD walkover survey above-action lt\·el
Z2-19 3/28/2017 Z2-EUl9-1 18 0-lftSQi\ I I I I Class I SU RAD walkover survey above-action level
2 2-1 9 3/28/2017 Z1-EU19· 119 0-1 ft soil 1 1 I I Clas.s I SU RAD walkover survey i,.bove-action level
2 2-19 3/28/2017 Z2-EUl9-120 0- 1 ft soil 1 I 1 I Class I SU RAD w-<1tkover survey ll.bove-aetion kvel
Z2-l 9 3/28/2017 Z2-EUl9-12 I 0-10 ft - 3 discrete interval soil 0--0.5. 0.5-2, 3 3 4 3 Class I SU RAD walkover survey above.action level 1.5 ftwithin :2-10 ft-at RAO\ JO
7.2-1 9 msn.011 Z2-EU19-122 0.10 ft. 3 dill(':rerc interval $()ii 0.0.5. 0.5-2, 1.5 flwithin2-I0 ft - atRADIJJ
3 3 ' 3 Chm I SU RAD walkover survey above-accion level
22-19 ll2Jn.o17 Z2-EUl9-123 0-10 ft - 3 discrete interval soil 0--0.5, 0.5-2. 3 J 4 3 Class I SU RA.D w.i.lkover surv!!:y above-action level 1.5ftwithin2-10 ft
Z2-l 9 31.2:1/2017 Z2-EUl9-124 0-1 ft - 3-point composite 1 I I I 3-point composite in area of historical Max RL
22-19 l/2912017 Z2-EUl9-125 0-1 ft - 4-point composite 1 1 I 1 4-ooinl comoosite m area of h1s1oric11I Max RL

7-20
Datt Ell cc.llectc:d
Dtlintalion Samplin1:
2 2-19 10/18/17
Z2-1 9 10/2/11
22-1 9 10/2/18
22- 19 9/26/17
2.2-19 10/l/17
2.2-19 9n.6/17
22-19 9n.6/17
22- 19 9/28/17
12-19 10/4/ 17
Z2-19 l{l{J/17
Zl-19 lCV3!17
ll-19 !0/30/17
Z2-19 9fl1111 Z2-19 ltvl2/17
22-19 HY12/1 7
"' l:J.- 19 ICV\0/17
ll-19 ICVI0/17
22- 19 l tvl8/17
22- 19 HYIS/17
22-19 10'24/17
22-1 9 HYl9/17
22-19 1M 6/1 7
Z2-1 9 J(.Vl6/17
Zl- 19 l0'25/17
22-19 l tv2S/17
22-19 ICV2S/\ 7
22-19 10/11/ 17
'll- 19 ICV26/17
22- 19 9/28/17
22 -19 9/27/17
Z2-l9 9n1111
22-19 9/27/ 17
\ 1!11.chml'11 ! lA. Samplt 1ummary fn EU Z,2-19 (ront.)
Samplt llletrvtl
22-EUl98-126 10 ft - 4-interval - 0 ,5, 2, 4, and 4- IOft
Z2-EUl98-127 10 ft - 4 -intrnral - 0 ,S, 2 , 4, and 4-!0ft
22-EU 19B-128 10 ft - 4 -interval - O.S,2, 4,and 4- !0ft
22- EU!98- l29 10 ft - 4-interval- 0 .5, 2 , 4, and 4- IOft
22-EU19B-130 10 ft -4-inteivaJ - O.S, 2 , 4,and 4- IOft 22-EU \ 9B-131 10 ft - 4- intcival 0.5, 2,4,and 4-IOft
22-EUl9B-1 32 !Oft - 4- interval 0.5, 2 . 4,and4-l0ft
Z2-EU1 9B-133 10 ft. 4- interval - 0.5. 2,4, and 4- IOft
12-EUl9B-I J4 10 ft - 4- interval - 0.5. 2 . 4. and 4- IOft
Z2-EU19B-1 3S 10 ft- 4-intervnl - 0.S, 2 , 4, and 4- IOft
Z2- EUl9B-136 10 fl . 4-inlcrvttl - O.S, 2 . 4. and 4- IOtl
Z2-EU1 9H-137 10 fi. 4-lnlcrval . O.S, 2. 4. and 4-10 ~
concrete grab
Z2·EU l 9B-1 38 lO fl • 4-intcrval - 0.5, 1, 4, and 4-!0ft
Z2-EU19B-139 !Oft - 4-interva1 • 0.5 , 2, 4, and 4-IOl't
Z2-EU1913-140 10 ft - 4-inteIVal - 0.5, 2 , 4 , and 4-IOft
Z2-EUJ9B-1 41 IO ft· 4-intcrval • 0.5, 2,4, and 4-IOft
Zl-EUl 9B- 142 10 ft - 4-interval - 0.5, 2,4, and 4-I Oft
Z2-EU19B- l43 10 ft - 4-interval - 0.5, 2, 4, and 4-IOft
22-EU19B- 144 JO ft - 4-interval - 0.5, 2, 4 , and 4-IOl't
Z2-EU19B-1 45 JO ft · 4-interval • 0.5, 2, 4 , and 4-IOft
Z2-EU19D-146 JO ft - 4-interval • 0.5, 2, 4, and 4-IOl't
22-EU19B-1 47 10 ft - 4-interval - 0.5, 2, 4, and 4- IOl't
Z2-ElJ19B•l 48 10 ft - 4-intctva1 - 0.5, 2,4, and 4- IOl't
Z2-EUJ9B-1 49 JO ft • 4-interval - 0.5, 2, 4 , and 4-IOl't
22-EU19B-ISO JO ft - 4-interval - 0.5, 2, 4 , and 4-IOl't
Z2-EU l9B-15 1 10 ft - 4-interva1 - 0.5. 2. 4 , and 4- I Oft
22-EUJ9B-152 JOH - 4-interval O.S, 2. 4. and 4-IOft
Z2-EU19B- 153 10ft - 4-interva1 O.S, 2 . 4. and 4-1 0 ft;
conc:rc lc grab
2.2-EU\98-154 10 fi - 4-intcrval - 0.5, 2,4, and 4-I Ofi
22-EUJ 9B-155 10 ft - 4-interval - 0.5 , 2,4, and 4-IOft
Zl•EU l9B-155A 3 fl - 3-intcrval - 0 .5 fi, 2 ft, and.3 ft
Z2-EU l 9B-155B J ft - J- inteIVaJ - 0 .5 ft, 2 ft, and J ft
Latboratory .111aty1t1>
Melals PCB RAD SVOC voe Commn lS.ldu triptloni
4-1 0 ft samplt is cond itional based on field screening
4-10 ft sample is conditiooal based on field screening
4-10 ft sample is conditional based on field screening
4-10 ft sample is conditional based on field screening
4-10 ft sample is conditional based on field screening
4 -10 ft sample is conditiollll.l based on field screening
4 -10 ft sample is conditioml based on field screening
4 -10 ft sample is cond itiOflll based on field screenin.g
4 -10 ft sample is conditiOflll based on field screening
4-10 ft s!U1!.p lc is conditiOMl based on field screening
4 -10 n sample is condilioMl based on field ~rccning
4 . 10 ft sample is cond ition!l! based on fie ld screening;
location is oo the concrete p11d (coverc,d with r.sphalt,
co llect concrete sample for PCBs and RAD [remove
asphalt})
4-10 ft sample is conditio nal bast"d on field screening
4-10 ft sample is conditional hosed on fitld screening
4 -10 ft sample is conditio nal based oo field s creening
4 -10 ft sample is conditional based on field screen ing
4-10 ft sample is condi1ional based on fie ld screen ing
4 - 10 ft sample is conditional based on field screening
4-10 ft sample is conditional based oo field screening
4 -10 ft sample is conditional based on field s creening
4-10 ft sample is conditional based on field screening
4 -10 ft sample is conditio nal bast"d oo field screening
4-10 ft sample is conditional based on field screening
4-10 ft sample is conditional based oo field screening
4-10 ft sample is conditiooal based on field screening
4-10 ft sample is conditional based on field screening
4 -10 ft sample is conditio nal based on field screening
4-to ft sample is conditiO!'ll:il based on field screen in~ location is on the concrete pad (covered with asph11lt, collcc.t concrete sample fOf PCBs Md RAO (remove <1IDhaltll 4-10 fi sample is condilional based on fie ld screen ing
At former location Z2-EUJ 9-120; 4- 10 ft sample is conditiOM! hued on field scttening
1 fl north of 22~EUl98 - IS5; U-235 analysis a nd m etals I ft eMt o f 22- EU19B-1 55; U-235 analysis and metals

7-21
nate EU collrc ted Sample location
22-19 9/27117 Z2-EUl 98- 155C
Z2-19 9/27/17 Z2- EUl98- 15SD
22-19 10/11/17 22-EU19B-156
'U-19 )()/15/17 Z2-EUl9B-157
72-19 10/17/17 Z2-EUl98 -158
'U-19 10/17117 Z2-EUl9B-159
22-19 10/)7/17 7,2-EUl9R- J60
22-19 10/19117 Z2-EU l9B-16 1
l..2-19 10/16117 Z2-EUl9B-162
2.2-19 10/11/17 Z2-EUl9B-!63
72 -19 lOI J 1/ 17 7..2-EU l9B- 164
22-19 10/9/17 Z2-EUl9B-I6S
22-19 10/9/17 22-EU l9 B-166
22-19 10/4/17 22-EUl9B-167
Z2-19 \0,'4/17 7.2- EU198- 167A
0 22-19 10/4117 Z2-EUl9B-167B
2 2-19 10/4/17 Z2-EU19B-167C
2 2-19 10/4/17 22-EUI 9B- 167D
22-19 10/5/17 Z2-EU 19 D- l68
2 2-19 I OIS/17 Z2-EU I 98-168A
22-1 9 10/5/17 Z2-EUl 98-168B
2 2-19 I OIS/17 Z2-EU19B-168C
22-19 IOIS/17 Z2-EUl9B- 168D
Z2- l 9 JOJ24J]7 Z2-EU l9B- l69
22-19 IW16Jl 7 Z2-EU19B- l70
Clas! 3 Soil Ua.it Sampling
22-19 3/3CW2017 Z2-EU l9B-301
22- 19 3/300017 Z2-EU19B-302
Z2-l 9 3/30/20 17 Z2·EU19B·303
\ttachment IA. S11mplc mmmary (or EU Zl-19 (cont.}
Sample interval
3 ft - ) -interval - 0 .5, 2. and 3 ft
3 ft - ) -interval - 0.5, 2 , and 3 fl
IO fl - 4 -int.erval - 0 5 . 2, 4. and 4-!0ft JO I\• 4 -interval - 0.5, 2, 4 , and 4-JOft IO ft - 4-interva! - 0.5, 2, 4, and 4-!0ft
10 ft . 4-i11tcrval - OS , 2, 4 , l!lld 4-lOft.
10 ft. • 4-iiltcrval - 0.5, 2, 4, and 4-JOfl 10 ft - 4-intcrval - 0.5, 2, 4, and 4-lOft 10 ft- 4-interval - 0.5, 2, 4 , and 4- IOft IO ft- 4-interval - 0.5, 2, 4 , &nd 4-lOft
10 ft- 4-interval - 0,5, 2, 4 , and 4-101\ 10 ft- 4-interval - 0 .5,2, 4 , and 4-!0ft
10 ft - 4-interval - 0.5, 2, 4 , and 4-IOft
10 ft - 4-inrem,.l - 0.5, 2. 4, w,d 4- lOft
3 ff - ) -interval - 0.5, 2, and 3 ft
3 ft - 3-interval - 05, 2, and 3 ft
3 fl- ]-intt:rval - 0 .5, 2, and 3 ft
3 ft - 3-interval - 0 .5, 2, and 3 ft
10 ft - •-interval • 0 .5, 2, 4, and 4- IOfl
3 ft - )-intmal- 0.5, 2, and 3 fl
3 ft - 3-interval - 0,5, 2, and 3 ft 3 ft - ] -interval - 0.5, 2, 811d 3 fl
3 ft - ) -interval - 0.5, 2, and 3 ft 10 ft - 4-intemil • 0 .5, 2. 4 , and 4- IOft
10 ft - 4-inlerval - O.S. 2. 4 , and 4- IOft
0- 10 ft - 3 interval compmite soil 0-0.5, 0 .5-2, I .S ftwithin2- l0 ft 0- 10 ft, 3 inteJVal composite soil 0 -0 .S, 0 .5-2. l .5 ftwithin2-10ft
0· 10 ft. 3 interval composite soil 0 -0 .5, 0 .5·2, 1.5 ft within 2- lO ft
La bor:atorv analV!lu
Metals PCB RAD SVOC VOC Comltlllnts/d~~ripti1J11s
3 3 I ft south ofZ2-BU19B-155;U-235analysisand metals
I ft v.rcst o f Z2-EU 19R-155; U-235 analysis and metals
4-10 fl $11.mple is conditiOfllll based on field screening 4 -10 ft sample is conditional based on field screening 4 -10 ft sample is conditional based on field screening 4-10 ft sample is conditional based on field screening 4-10 ft sample is conditional based on field screening 4-IO ft sample is conditional based on field screening 4-10 ft sample is oonditior'IIII based on field screen ing 4-10 ft sample i:i condit ional based on field s creen ing
4-10 ft sample is cooditional based on field screening
4-10 ft sample i.!i cond.iLio1111I based on field :¾:recning
4 -10 ft sample is cO!'lditional based on field scrccnin1
Al former \oc,1tion RADI IO; 4-10 ft sample is conditional ba'it"li on field scroenin11: I ft nonh ofZ2-EU J9B-167; U2-3S analysis and metals I n cast o f Z2-F-U 198-167; U-235 analysis and metals
I ft south ofZ2-EU l 9B-167; U-235 analysis and mct.als I fl w~st ofZl-EUl98-1 67; U-235 analysis and metals At hot spot t).,sed on BAR survey (general w-ea of
former location Z2-EU 19-119); 4 -10 ft sample is
conditional based on field screening
I ft north ofZ2-EU19B-168~ U-235 analysis metals
I ft east o f Z2-EU19B-1 68: U-235 analysis metals
I ft south o fZ2-Ell \9 B- 16S; U-235 and U-238 analysis metals
I ft west o f 22-EU1 9B-168; U-235 analysi.!I metals
Pipe d.rnining into the CA:. 4-10 ft sample is conditional based on field screening
Hot s pot near staircase; 4-10 ft sample is conditional based on field screening
Class 3 SU utility corridor sample local~
Class 3 SU u1ility corridor sample location
Class 3 SU utility corridor sampl e loc8lion

7-22
02ft EU coll«tcd S ample lonfion
7.2-19 )/30-'2017 Z2-EUI9B-304
22-19 3129/2017 Z2-EUl9B-30S
UAR• b1a.,ed area rad1at10n CA • oontamination area EU • Expo.sure Unit
Max =maximum PCB • polychlorinated biphenyl
4rt11chme11t IA. s~mplt• s11mmary for EU Zl-19 (con t.)
S.rnplc inltrYal Met.ls 0- 10 ft, 3 iotm al composite soil 0-0.5, 0.S-2, 1.5 ftwithin 2-10ft
0-10 ft, 3 interval composite soil 0-0.S, 0.S-2, 1.5 ft within 2-10 ft
Total EU Z2-19 Analy~es
RA D • rad1olng1cal RL ... remediation level
SU- Soil Unit
SVOC = semivolatile organic compound voe- volatile organic compound
I
I
104
Laboraforv a nalVtts
PCB RAD svoc I I I
I I I
70 182 .. voe Commcnts/dcscriptious
Class ) SU utility corridor sample location
I Class 3 S U adjacent to stOtm drain
I

7-23
Atr:u•bmtnl 18. EU Zl~l'J Cl&IIS I SU d:1.11 summary•
Nu mber ... Number N umber of 1\umber ofdefcctl Frequency M io Mu detected ofdetnt52: detedli2 RSl/(10'~ ofddeds2: 2:GW
Anal,rte of detect det«t'-' d eteet¥ n~ull"' Max RL' MaxRL• Avg Rl/ AvgRL"" 11rHI- I} RSL• GWSSL• SSL• loo aoics( ) Aluminum 104/104 2860 J2000J 13126 l l OOC:00 Antimony 7/104 0.3621 6.07J 1.61 470 144 Arsenic 104/104 J .14J 62.9J 8.57 900 JOO JOO 66.J Barium 104/104 17) 221 66.7 220000 9150 Bel)'llium 98/104 OJ83J 2.99 1.24 2300 Bosm 78/104 l. 53J 11.8 4.83 230000 Cadmium 103/104 0.0307J 298 6.74 980 Calcium 103/103 283 223000) 13414 Chromium 104/104 6 .93 530 27.1 1800000 172 Cobalt 104/104 0.1981 28.6J 12,7 350 Copp« 104/104 6.2 836 39,5 47000 boo 11)4/104 8730 82100 26586 820000 Lead 102/104 1.431 4281 37.3 800 3370 Lithium 104/104 6.151 152 29.5 2300 Magnes ium 104/104 4511 40000J 3900 Manganese 104/104 1081 7820J 1096 26000 Mercmy 67/68 0,01281 0.928 0.131 1800 600 600 Molybdenum 94/104 0.3281 39,2 J.68 5800 Nickel 104/104 5.88 957 54.8 22000 Potassium 104/!04 JJIJ 10800J 1201 Selenium 67/103 0.5671 l2.9J 2.09 5800 Sil..,er 41/I04 0 .1351 7.131 0 .583 5800 Sodiwn 102/104 7.92J 39401 78.1 Thallium 97/104 0.164J 4.65J 0.405 12 10.8 Uranium \04/!04 1.161 2\000J 346 230 17 V•nlll:iium , 104/104 9.56 79.9 35.8 5800 0 Zinc 104/104 7.4 \J &21 104 350000 0 Po11·thlorln1.led biP:henrh (~&~) PCB-1016 ono 100000 10000 10000 PCB·1221 ono 100000 10000 10000 PCB-1232 ono 100000 10000 10000 PCB·IZ42 ono 100000 10000 10000 PCB-1248 ,no 27<JO 2790 2790 100000 10000 10000 PCB-1254 39/70 3.21 21700 811 100000 111000 10000 PCB-1260 39/70 l.73J 4590 288 100000 10000 10000 PCB-1262 ono 100000 10000 10000 PCB-1268 1no 429 429 429 100000 10000 10000 Total PCBs 44170 l.7JJ 26300 1048 100000 10000 10000 Radionudides (pCilg) Actm,um-22!1 136/13& 0 .513 26.JJ 2.16 10700 Alpha activity 181/181 1.27] 60100 913 Americium-241 17/180 0.0436 32.7J 4.57 47.6 Beta activity 180/181 8.08J l9800J 326 Bismuth-212 S/5 l.7 9.99 7,03 536000

7-24
Att1u;bnunt 18, EU Zl-1\J C IU$ l SU d;1la sum nrnry" (c;ont.)
Num~r A,g Number Nu111Mrnf Numbu of detects
Fnquenc;y detected 1>fdetcc:U ? detects!': RSL'(IO-' ofdetec:b!': ?:GW Analvte u rdetei;t resulr' MuRL' Max Rt.' Avt Rlf Av RLr or Jil.aJ RSI..' GW SSL8 SSL•
1smuth- 14 I /1 -• I 00 CH ium-131 65/181 O.O&l9J 4060 6 7.8 20 14 2 14 Cobalt-60 0/181 0.483 0 Curium-244 0/141 348 0 Lcad-210 1/1 2. 14 l .14 2 .1 4 37.6 0 Lead-212 174/114 0.666 9. 71 1.69 57200 0 Lead-214 173/173 0.683 54.2 2 .36 648000 0 Neptunium-237 4/181 0.471 1.23 0 .781 ,o ' 0 Plutoniom-238 3/18 1 0 .836 2 .3:5J 1.47 148 0 Plutonium-239 32/181 0.0622J 1'41 13.7 12& I Plutonium-241 1/141 0.887J 0 .887J 0 .887 15300 0 Pota5sium-40 179/181 1.09 5 1.6 20.7 2.2 177 Protact inium--234m 43/43 28 .1 17300 646 1.SE+o8 0 Ra/Th decay scrk-.•l 1&11181 0 .00001 6254 76.1 15 15 23 23 Rltdium-226' 175/181 0.342 71.7 2.52 Strontlnm-90 9/141 0.936 125 18 31'4 Tcchn~ilEl-99 23/181 2.04 2640J 134 121000 12 100 12100 85.6 Thallium-208 1421142 0.21 5 2 .81 0.534 298000 Thorium-228i 174fl81 0.557 10.4J I.S I Thorium-230 1 l &t/18 1 0.43 6 l70J 76.6 ThClfium-232 1 177'181 0.63 &6.7J 2.68 Thorium-234 1}5'181 0.974 11400 165 24500 0
w Unmium-234 181118 1 l.llJ S73001 507 7000 700 6 700 6 61.1 41 Uranium-235 1141217 0 .249 4250) 71.2 ,o ' 40 ' 40 61.l 8 Uranium-238 181/182 0 .995 17300) 163 500 ,o 42 50 42 61.1 34 Semivolal ile O!:J:llnit tompound1 (J.lg/kg.) l ,2,4•Tn~hlorobcn;r,cnc 0/68 260000 l .). -Dich\orohenu-ne 0/68 9300000 1,J -Dichlorobenzene 0/68 1.4 -Dlchlorobcn= 0/68 110000 2.J, 4 ,6-Trtrachlorophcnol 0/68 2;oooooo 2,4,5-T richlorophcrtol 0/68 82000000 2,4 ,6-T richlorophcnol 0/68 820000 2,4-Dich \orophe-nol 0/68 2500000 2.4 -Dimethylphrnol 0/68 16000000 2.4-Dinitrophrnol 0/68 1600000 2,4-Dinitrotoluenc: 0/68 74000 2.6-Din itrotolocne 0/68 1,000 2-Chloronaphthalcnc 0/68 60000000 2-Chlorophcnol 0/68 5800000 2-MC"!hyl-4,6-din itrophcnol 0/68 66000 2-Methylnaphthalene 8168 14.4J 1201 43 3000000 2-Methylpheool 0/68 4100(()()0 2- Nitrobcnzenaminc 0/6R 8000000 2- Nitropheno! 0/6R 3.J'-Dichlorobenzidine 0/68 '1000 3-N itrobenzenamine 0/68 4- Bro hcnyl hen 1 ether 0/68

7-25
AUacbmtnf 18. EU 22-19 ClaS!ii I SU da ta ~ummllry' (cont.)
Number A,g Number Numbf'rof Number ofddtcls
f,'req utucy Min Mn detected o[ dcktb 2: dettclr~ RSU(tO·' ofddrds::>: ;?:CW Analrtr oldrlttt dtttcr'° detectl-~ result' Max RL' Max RL• Avg RI/ Avi;: RP orHI=I) RSL• GWSSL• SSL•
4..Qiloro-3-methy !phenol 0/68 82000000 0 4-0ilorobenzenamine 0/68 I JOOCO 0 4-Chlorophenyl phenyl ether 0/68 4-Nitrobenzenamine 0/68 1100000 4-Nitrophenol 0/68 Acem1phthene 4/68 14.9] 2091 74.6 4SOOCX)()0 Acem1phthylme 4/68 22.5] !16J 64. 1 Aniline 0/68 4000000 Anthracene 6/68 2 l .5J 60SJ 162 2-3E+08 Be-nz(a)anthracene 24/68 13.J J 902 14' 210000 Benzenemetha1X1! 0/68 8200®0 BenT..o(a)pyrenc 21/68 l6. IJ 703 146 2H)OO fkITTm(b)fluoIW1thenc 22/68 15.SJ 929 189 210000 Benzo(ghi)perylcnc 20/68 18.7J 332J 88.9 Benzo(k)floonmd1ene 14/68 lBJ 365 I ll '100000 Benzoic BCid 0/68 3.3E+09 Bis{2-<:hloroetho,cy)methane 0168 2500000 Bis(2-<:hloroc1hyl) ether 0/68 10000 Bis{2-chlocoisopropyl) ether 0168 47000000 Bis{2-elhylhe1.yl )phthalatc 1168 166.1 1661 166 1600000 2350000 Butyl benzyl phthalate 0/68 12000000 Carbazolc 6168 19.31 I030 232
:;;: Ch,,,,,,. 23/68 12.6J 857 150 21 000000 Dibenz( a.li).vithraccne 6168 3l2J 138 68 21000 Oibcnzofuran 1168 1661 1661 166 1000000 Diethyl phlhalate 0/68 6.6E+08 Dimethyl phthalate 0/68 Di-n-octylphthalate 0/68 8200000 Oiphcnylaminc 0/68 82000000 Fluoraothene 2&168 J3. 2J l950J 215 30000000 Fluorenc 4/68 J6.7J 7251 221, 30000000 Hexathlorobfflune 0/68 9600 Hexachlornbutadiene 0/68 53000 Hcxachlorncyi;lopent~ icnc 0/68 7500 Hexachlornethane 0/68 80000 lndeno(l.2,3-cd)pyrtnc 13168 15J 338 116 210000 lsophon:,nc 1/68 730 730 730 24000000 m+p Methyl phenol 0168 Naphthalene 7/68 17.31 620 133 170000 NitrobCJJ-,...eue 0/68 220000 N-N itroso-di-n-propylam inc 0/68 3300 l'cntrtehlorophcnol 0/68 40000 Phcnanthrene 23/68 13.SJ JJOOJ 226 PllCIXII 1/68 1-491 1491 149 25E+08 Pyrene 27/68 12.SJ ISOOJ 195 23000000 Pyridine 0/68 1200000 Volatilt •~nit COffll!:0\IDds (t!:~ ) 1,1, I-Trichloroethane Oil 36000000 97900

7-26
Frequency Min Analyte of detect dtttct"-'
l,l;l.:Z·Tetrach\oroethanc OJI 1,1,2·Trichloroetl11mc 0/1 1,1-Dichlorocthanc 0/1 l,1-Dichloroethcnc 0/1 l,2-Dichlorocth1tnc 0/1 1,2-Dichloroprope.ne 0/1 2•Buumorn: 1/1 3-491 2-Hexttnonc 0/1 4•Methyl•2-penmnone 0/1 Acetone 1/ 1 15.81 Benzene 0/1 Bromodichloromethane 0/1 Bromoform 0/1 Bromomethane Oil Carbon di sulfide 0/1 Carbon tetrachloride 0/1 Chlorobenzcne 0/1 Chloroelhane 0/ 1 Chloroform 0/1 Chloromethsne 0/J cis-1,2- Dichloroohene 0/1 eis-1 ,3-Dichloropropene 0/ 1 Dibromochloromethane 0/1 Ethylbenzcm: 0/1 Methylene ehlOt"ide 0/1 Styrene 0/ 1 Tetrachlo rocihme 0/1 Toluene 0/1 Total Xylene 0/1 trans-1 ;2-Dichknoethene 0/1 trans-1,l-Dichloropropcnc 0/1
\11.ichment IB. t:ll Zl-19 Class I SU d.;ita !lummary" (cont.)
3.49J
15.81
Avg detected result'
1.49
15.8
ofddtds ~ Ma11 RL~ AvgRI/
Numbu of detett• ~ Avg RL~
RSU(HJ-ll orHl• J)
21000 6300
160000 1000000 20000 660011 l.9E-+08 1300000 1.4E+08 6.7E+-08
5 1000 13000
860000 30000
3S0OCOO 29000
1300000 57000000
14000 460000 2300000
3911000 250000
3200000 35000000 390000
47000000 2500000 23000000
ordctuhi~ RSL~ GWSSL•
1370
1750 729
1150
2770
1230
241
4720 502000
Trichloroethene 0/1 19000 1720 Yin I chloride 0/1 17000 176
Nw.m bcr ofdttccts ~cw SSL~
"Stations in summary include 22-ElJ \<)..JOI , 22-EU 19-102, 22-F.U 19-103, Z2-EU l9-104, 22- EUI 9-!05, Z2- EUl9-106, Z2-EU 19-107, 2 2- EU 19- 108, Z2-EUJ9. 109, 22-EUI 9-1 IO, 22-EUI 9-1 I l ,Z2-EUl9-l 12, Z2-EU19- l 13, Z2-EUl 9-114, 22•EU19-115, Z2-EU1 9-116. Z2-ElJl9- 117, 7..2-EU19-1 18, Z2-EUl9- l l9, 22-EU\ 9-120, Z2-EUl9- 121, Z2-EU19-122, Z2-EUJ9. 12J . Z2-EU19-124, Z2-EUl9-125, Z2-EUl98-126, Z2-EU198-127. Z2-EUl 9B-128, Z2-EU19B.!29. Z2-EU19B-130, Z2-EU19B-131, Z2-EU19B-132, Z2-EU19B-133, Z2-EU19B-134, Z2-EU19B-135. 1.2-EU 19B- I 16, l.2-EU 198-137, Z2-EU 198. 138, Z2-EU l98-139, Z2-EU19B- l40, 22-EU 19B• !41. 22-EU 198 -142, Z2-EU l9B- 143, U.-EU 19B-144, Z2-EU 198- 145, 1.2-EU 19B-146, 22-EU 19B-147. l2-EUl9B-148, Zl-EU \9B- 149, Z2-EU19B-l50, Z2-EUJ9B-ISI, Z2-EU19B-IS2, Z2- EUl9B-1 53, Z2-EUl9B-154, Z2-EUl9B-1 55, Z2-EUl 9B.! 55A. Z2-EU 19B-155B. Z2-EU 19IHSSC, 'O.· l:ll19B-IS5D, Z2•EUl 9B-156, 7.2-EU \9B-157, Z2-EU l9B- 158, Z2-EU19B-IS9, Z2-EU19B-160, 1.2.ElJJ9B-l61. Z2-EU19B- 162, Z2.EU19B- 163. Z2-E U l9B-164, Z2-EU1913-165. Z2-blJ l9B· 166, 7.2-EU l9R-167, l1•EU 19B•l67A,Z2•EUJ9B-l67B, Z2•EU l9B· 167C.Z2•EUl9B-161D,Z2•EU19B·l68,Z2-EUJ9B-168A,22-EUl9B-1 68B.22-EU19B-168C, Z2-EU19B-168D,Z2•EU1 9B-169, 22-Etl 198-170. 22-EU 19B.J0I, 22-EU 198-302, 72-EU 198-303, Z2-EU 198-304, and Z2- EUl9B-305.
~ J" validatiQn qualifier mean, the analytc w,u positively identified and the result is the approximate concentration in the sample. ' Blanks indicate the analyte was not detected "Max RL values are presented; blanks indicaie there is no Max RL for the analytc. Max Rt.s arc from Zone 2 ROD Table 2.13, except for technetium-99, which is presented in Zone 2 RDRJR.A WP
Sect. 3.1.2. 'Blanks indtcate the criterion docs not apply to the analyte. I Avg RL values are presented; blanks indicate thert is no Avg RL fot the analyte. Avg RLs ttre from Zone 2 ROD Table 2.14, except for technetiwn-99, which is presented in Zone 2 RDR/RA WP
Sect. 3.1.2.

7-27
,\lh1cflmr11118. EUZ2--l9 llin I SU data su111.muy'"(co11t.)
Numbrr Avg Number Number or Numbu ofdetttls
Frequency Mia Mu dctc-cted ofdc:tC"tb~ detects~ RSl/(10~~ ofddtth:~ ~GW Aaailyte ofdetetl dttec~ detc-ct" nsult' MuRL,1 MuRL" AvgRl/ AvgRL~ orHl- 1) RSL• GWSSL" SSL'
'RSL values we presented; blanb indicate then: is no RSL for the aoalyte. Chemical RSLs were calculated using the website at http:l/epa-prgs.oml.gov/cgi-binlchemicals/csJ_Sttirch, June 2017 revision; radionuclide RSLs were cakulated during June 2017 using the websiic at hup://epa-prgs.omLgov/cgi-bin/radionudidc:i/rprg_sc11rch
-'GW SSL values arc prc:scnted; blanks indic.ate thctt i~ noGW SSL for the 11rndytc, GW SSI .s are from Zone 2 ROD Table C.S, except fortechnetium-99, which is presented in Zone 2 RDR/RA WP Sect. 3.1.2.
'Th: RafTh (radium/thorium)decay series results are calculated values for each sample based on detections ofradium-226, thorium-230, and Umrium-232 as discussed in the Zone 2 ROD. Ilec11Use the calculation involves subtraction of background from analytical result!l and negative numbers are not allowed, 0 (zero) is a legitimate result.
i'Thcsc radionuclide, arc not included in aggregate risk calculations for the EU, instead, human health risk effects. of these radionuclides (thorium-228 is included in the thorium-232 decay sc-rics) arc evaluated with the Ra/111 decay series RLs os discus.sod in the Zone 2 ROD.
Avg= average EU • exposure unit. GW- groundwater Ill • hazard index Max ... maximum Min - minimum PCB • polychlorinated biphenyl
RDR/RA WP-= Remedial Design Report/Remedial Aclion Work Plan RL - remediation level ROD - Record ofDccision RSL • risk screening lcvd SSL ... soil screening kvcl SU • Soil Unit

7-28
Attachment lC. Details of Zone 2 ROD criteria exceedances in EU Z2-19, Class I SU characterization and delineation samples
Start depth Sample location (fQ End depth (ft) Analyte Result" Criterion value•
Max RL exceedances Z2-EU 19-109 0 Ra/Th decay series 6254 15 Z2-EU19-110 0 Ra/Th decay series 4113 15 Z2-EU19-l 11 0 Cesium-137 38.4 20
Ra/Th decay series 881 15 Z2-EU19-I 12 0 Cesium-137 46.9 20
Ra/Th decay series 1330 15 Z2-EU19-113 0 Cesium-137 4060 20
Ra/Th decay series 569 15 Uranium-234 16900 7000 Uranium-235 977 80 Uranium-238 17300 500
Z2-EU19-l 14 0 Cesium-137 24.9 20 Ra/Th decay series 28.4 15 Uranium-238 599 500
Z2-EU19-l 15 0 Uranium-235 106 80 Uranium-238 1390 500
Z2-EUl9-l 16 0 Ra/Th decay series 28.1 15 Z2-EU19-I 17 0 Ra/Th decay series 28.1 15 Z2-EUI9-120 0 Ra/Th decay series 59 15
Uranium-234 57300 7000 Uranium-235 4250 80 Uranium-238 1950 500
Z2-EU19-122 0 0.5 Uranium-235 473 80 Uranium-238 501 500
Z2-EU19-123 0 0.5 Ra/Th decay series 90.9 15 Uranium-235 112 80 Uranium-238 1260 500
Z2-EU19-124 0 1 Ra/Th decay series 15.7 15 Z2-EU 19B-149 0 0.5 Ra/Th decay series 53.1 15 Z2-EU l 9B-152 0 0.5 Raffh decay series 18.9 15 Z2-EUI 9B-154 0 0.5 Cesium-137 125 20
Ra/Th decay series 132.8 15 Z2-EU19B-155A 0.5 0.5 Uranium-235 780 80 Z2-EU19B-157 0 0.5 Cesium-137 20.8 20
Ra/Th decay series 79.83 15 Uranium-238 516 500
2 2 Uranium-238 57 1 500 Z2-EU19B-168C 0.5 0.5 Uranium-235 495 80 Avg RL exceedances (not accounted for by Max RL exceedances) Z2-EUJ9-101 0 1 Uranium-238 61.9 50 Z2-EU19-103 0 1 Uranium-235 18.2 8
U ranium-23 8 180 50 Z2-EU19-105 0 Uranium-235 12 8
Uranium-238 119 50 Z2-EU 19-106 0 Uranium-238 50.7 50 Z2-EUJ 9-107 0 Cesium-137 2.13 2
Raffh decay series 5.43 5 Uranium-235 8.77 8 Uranium-238 83.8 50
Z2-EU19-108 0 Ra/Th decay series 11.7 5
17

7-29
Attachment l C. Details of Zone 2 ROD criteria exceedances in EU Z2-19, Class 1 SU cha racterization and delineation samples (cont)
Start depth Sample location {ft} End depth (ft) Analyte Result" C riterion value•
Z2-EU 19-109 0 I Cesium-137 4 .04 2 Uranium-235 8 .95 8 Uranium-238 83.7 50
Z2-EU19-1 IO 0 Uranium-238 55.8 50 Z2-EU19-1 11 0 Uranium-235 18.3 8
Uranium-238 221 50
Z2-EUl9-I 12 0 U ranium-235 9 .16 8 Uranium-238 103 50
Z2-EU19- 114 0 Uranium-235 55.4 8 Z2-EU 19- l 15 0 Uranium-234 1280 700 Z2-EU19-116 0 Cesium-137 12.5 2
Uranium-235 9.12 8 Uranium-238 66.2 50
Z2-EU19- I 17 0 Cesium-137 16.4 2 Uranium-235 20.6 8 Uranium-238 246 50
Z2-EU19-l 18 0 Uranium-235 19 8 Uranium-238 274 50
Z2-EU 19-12 1 0 0.5 Ra/Th decay series 5.4 5 Uranium-234 728 700 Uranium-235 47.2 8 Uranium-238 290 50
Z2-EU19-1 22 0 0.5 Ra/Th decay series 5.1 5 Uranium-234 6 960 700
Z2-EU19-1 23 0 0.5 Cesium-137 11.4 2 Uranium-234 1220 700
0.5 2 Uranium-235 26.1 8 Uranium-238 322 50
Z2-EU19-1 24 0 Cesium-137 5.17 2 Uranium-238 78.1 50
Z2-EU19B-139 0 0.5 Ra/Th decay series 5 .6 1 5 2 2 Uranium-238 55.2 50
Z2-EU 19B-149 0 0.5 Cesium-137 13 .8 2 Uranium-238 52.5 50
2 2 Uranium-235 28.3 8 Uranium-238 246 50
4 4 Uranium-235 8.37 8 Uranium-238 99.3 50
Z2-EU19B-152 0 0.5 Uranium-235 8 .12 8 Uranium-238 79.7 50
5 Uranium-235 8.36 8 Uranium-238 56.7 50
Z2-EU19B- 153 0 Total PCBs 26300 10000
Z2-EU19B- 154 0 0.5 Uranium-235 9 .57 8 Uranium-238 94.6 50
2 2 Ra/Th decay series 10.83 5 Uranium-238 57.5 50
Z2-EU19B- 155 0.5 0.5 Cesium- 137 2.77 2 Ra/Th decay series 6 .23 5
Z2-EU 19B- 155A 2 2 Uranium-235 74.3 8
18

7-30
Attachment IC. Details of Zone 2 ROD criteria exceedances in EU Zl-19, Class I SU characterization and delineation samples (cont)
Start depth Sample location {ft} End deeth (ft) Analyte Result• Criterion value'
22-EUl9B-156 2 2 Uranium-238 111 50 4 4 Uranium-235 15.8 8
l ranium-238 207 50 5.25 5.25 t.:ranium-238 58.1 50
22-EUI 9B-I 57 0 0.5 lranium-235 44.4 8 2 2 Raffh decay series 7.06 5
Lranium-235 51.8 8 4 4 Lranium-235 33.7 8
Lranium-238 362 50 5.7 5.7 Lranium-238 83.6 50
22-EUl9B-164 0 0.5 Lranium-235 15.1 8 0 0.5 Lranium-238 160 50 2 2 Uranium-238 79.9 50 4 4 Uranium-235 22.4 8
Uranium-238 200 50 22-EUl9B-165 0 0.5 Uranium-235 13.5 8
Uranium-238 95.2 50 22-EU19B-166 0 0.5 Uranium-235 8.6 8 Z2-EU19B-167 0 0.5 Uranium-235 14.8 8
Uranium-238 78.6 50 22-EU19B-167A 0 0.5 Uranium-235 25.4 8
2 2 Uranium-235 16.3 8 22-EUl 9B-167B 0 0.5 Uranium-235 24.7 8 22-EUl9B-167D 0 0.5 Uranium-235 13.7 8
Z2-EUl9B-168C 2 2 Uranium-235 23.3 8 3 3 Uranium-235 23.5 8
Uranium-238 52.2 50 RSL exceedances (not accounted for by RL exceedances) 22-EUI 9-103 0 1 Uranium 574 230 22-EU I 9-107 0 10 Uranium 42 1 230 22-EU19-109 0 I Uranium 273 230 Z2-EU19-l lO 0 I Uranium 388 230 22-EUl9-1 11 0 1 Uranium 260 230 22-EUJ9-112 0 I Uranium 39 1 230
Plutonium-239 154 128 22-EU19-l 13 0 1 Uranium 21000 230 22-EUl9-114 0 1 Uranium 1090 230 22-EUl9- I 15 0 I Uranium 1100 230 Z2-EU19-121 0 0.5 Uranium 365 230 Z2-EU19-122 0 0.5 Uranium 325 230 Z2-EU19-123 0 0.5 Uranium 2940 230
0.04 0.17 Uranium 1060 230 Z2-EU19-124 0 1 Uranium 520 230 Z2-EU19B-167A 2 2 Uranium 236 230 Z2-EUl9B-168C 0.5 0.5 Uranium 1850 230
2 2 Uranium 239 230 GW SSL exceedances Z2-EU19-101 0 Uranium-234 71.8 61.1
Uranium-238 61.9 61.1 Z2-EU19-103 0 Uranium-234 194 61.1
Uranium-238 180 61.1
19

7-31
Attachment IC. Details of Zone 2 ROD criteria exceedances in EU Z2-19, Class 1 SU characterization and delineation samples (cont.)
Start depth Sample location (ft} End depth (fti Analyte Result" Criterion value•
Z2-EU!9-105 0 I Uranium-234 114 61.1 Uranium-238 119 6 1.1
Z2-EU19-I06 0 Uranium-234 78.1 61.1 Z2-EU19-I07 0 Uranium-234 113 61.1
Uranium-238 83.8 61.1 Z2-EU!9-109 0 Uranium-234 83.4 61.1
Uranium-238 83.7 61.1 Z2-EU!9-1 11 0 Uranium-234 21 5 61.1
Uranium-238 221 61.1 Z2-EU19-112 0 l.iranium-234 90.9 61.1
Uranium-238 103 61.1 22-EU! 9-113 0 Chromium 530 172
Technetium-99 2640 85.6 Uranium-234 16900 61.1 C rani um-23 5 977 61.1 Cranium-238 17300 61.1
Z2-EU19-l 14 0 Cranium-234 563 61.1 Cranium-238 599 61.1
Z2-EU!9-l 15 0 Cranium-234 1280 61.1 Cranium-235 106 61.1 Cranium-238 1390 61. l
Z2-EU 19-116 0 Cranium-234 69.7 61.1 Cranium-238 66.2 61. 1
Z2-EUI 9-117 0 Cranium-234 291 61.1 Cranium-238 246 61.1
Z2-EU!9-l 18 0 Cranium-234 280 61.1 Cranium-238 274 61.1
22-EUI 9-120 0 Cranium-234 57300 61.1 Cranium-235 4250 61.1 Cranium-238 1950 61.1
Z2-EU19-121 0 0.5 Cranium-234 728 61.1 Uranium-238 290 61.1
Z2-EU19-122 0 0.5 Uranium-234 6960 6 1.1 Uranium-23 5 473 61.1 Uranium-238 501 61.1
4.4 4.4 Uranium-234 70.9 61.1 22-EUl 9-123 0 0.5 Uranium-234 1220 61.1
Uranium-235 112 61.1 Uranium-238 1260 61.1
0.5 2 Uranium-234 318 61.1 Uranium-238 322 61.1
Z2-EU19-124 0 Uranium-234 85.3 61.1 Uranium-238 78.1 61.1
Z2-EU 19B-149 2 2 Uranium-234 247 61.1 Uranium-238 246 61.1
4 4 Uranium-234 103 61.1 Uranium-238 99.3 61.1
Z2-EU 19B-152 0 0.5 Uranium-234 87.9 61.1 Uranium-238 79.7 61.1
5 5 Uranium-234 100 61.1
20

7-32
Attachment IC. Details of Zone 2 ROD criteria exceedances in EU Z2-19, Class I SU characterization and delineation samples (cont.)
Start depth Sample location (ft} End depth (ft) Analyte Result' Criterion value•
Z2-EU198-154 0 0.5 Uranium-234 103 61.1 Uranium-238 94.6 61.1
2 2 Uranium-234 65.3 61.1 Z2-EUl98-155 2 2 Uranium-234 64.4 61.1 Z2-EUl98-155A 0.5 0.5 Uranium-235 780 61.1
2 2 Uranium-235 74.3 61.1 22-EUI 98-I 56 2 2 Uranium-234 112 61.1
Uranium-23 8 II I 61.1 4 4 Uranium-234 200 61.1
Uranium-238 207 61.1 Z2-EU198-157 0 0.5 Uranium-234 459 61.1
Uranium-238 516 61.1 2 2 Uranium-234 568 61.1
Uranium-238 571 61.1 4 4 Uranium-234 237 61.1
Uranium-238 362 61.1 5.7 5.7 Uranium-234 79.4 61.1
Uranium-238 83.6 61. 1 Z2-EUl98-164 0 0.5 Uranium-234 178 61.1
Uranium-238 160 61.1 2 2 Uranium-234 89.6 61.1
Uranium-238 79.9 61.1 4 4 Uranium-234 220 61.1
Uranium-238 200 61.1 22-EU 198-165 0 0.5 Uranium-234 175 61.1
Uranium-238 95.2 61.1 22-EUI 98-166 0 0.5 Uranium-234 107 61.1 22-EU I 98-167 0 0.5 Uranium-234 168 61.1
Uranium-238 78.6 61.1 2 2 Uranium-234 83.6 61.1
22-EUI 98-I 68C 0.5 0.5 Uranium-235 495 61.1 "Units: metals• mg/kg. PCBs • µg/kg, and radionuolides = pCi/g. Avg = average RL = remediation level EU = Exposure Unit ROD = Record of Decision GW = groundwater RSL = risk screening level Max = maximum SSL= soil screening level PCB= polychlorinated biphenyl SU= Soil Unit
21

7-33
Attachment ID. EU Z2-19 Class I SU characterization and delineation sample locations with Avg RL, RSL, and GW SSL exceedances after removal ofsample
locations with Max RL exceedances to a depth of 4 ft"
Sample location Residual Avg RL Exceedances Z2-EUl9-IOI Z2-EUl9-103 Z2-EUl9-105 Z2-EU 19-106 Z2-EUl9-107 Z2-EUl9-108 Z2-EU19-l 18 Z2-EUl9-121 Z2-EUl9B-139 Z2-EU19B-152 (5-5 ftf Z2-EUl9B-153 Z2-EUl9B- 155 Z2-EUl9B-156 Z2-EU19B-157 (5.7-5.7 ft.jh Z2-EU19B-164 Z2-EU19B-165 Z2-EUl9B-166 22-EUI 9B-167 Z2-EU19B-167A Z2-EUl9B-167B Z2-EUl9B-167D
Analyte
Uranium -238 Uranium-235, uranium-238 Uranium-235, uranium-238 Uranium -238 Cesium-137, Raffh decay series, uranium-235, uranium-238 Ra/Th decay series Uranium-235, uranium-238 Ra/Th decay series, uranium-234, uranium-235, uranium-238 Ra/Th decay series, uranium-238 Uranium-235, uranium-238 Total PCBs Cesium-137, Ra/Th decay series Uranium-235, uranium-238 Uranium-235, uranium-238 Uranium-235, uranium-238 Uranium-235, uranium-238 Uranium-235 Uranium-235, uranium-238 Uranium-235 Uranium-235 Uranium-235
Residual RSL exceedances (not including residual Avg RL exceedances or potassium-40)"' Z2-EU19-103 Uranium Z2-EUl9-107 Uranium Z2-EUl9-12 1 Uranium Z2-EUI9B-167A Uranium Residual GW SSL exceedances Z2-EUl9-103 Z2-EUl9-105 Z2-EUl9-106 22-EUI 9-107 22-EUI 9-118 22-EUI 9-121 Z2-EUl9B-122 (4.4 to 4.4 ft.)<2> Z2-EU19B-152 (5 to 5 ft. )C2>
Z2-EUl9B-155 Z2-EUl9B-156 Z2-EUl9B-157 (5.7 to 5.7 ft.)Cl) Z2-EUl9B-164 Z2-EU I 9B-165 Z2-EU19B-166 Z2-EUl9B-167
Uranium-234, uranium-238 Uranium-234, uranium-238 Uranium-234, uranium-238 Uranium-234, uranium-238 Uranium-234, uranium-238 Uranium-234, uranium-238 Uranium-234 Uranium-234 Uranium-234 Uranium-234, uranium-238 Uranium-235, uranium-238 Uranium-234, uranium-238 Uranium-234, uranium-238 Uranium-234 Uranium-234, uranium-238
•Details of residual criteria cxcecdanccs, including sample depths and analyte concentrations at each sample location and criterion values can be fowxt in Attachment 3.
~ax RL cxceedances will be excavated at these sample locations from depths up to 4 ft. cRSL values arc the same~ Avg RL values for all of the analytes with residual Avg RL cxceeda.nccs except for the Ra/Th decay series.
'There is no RafTh decay series RSL because radium and thorium isotopes are not included in EU risk calculations as discussed in the Zone 2 ROD.
1>otassiwn-40 is not evaluated for risk if its average concentration is less than the potassium-40 background concentration (32.12 pCi/g). 11lC average potassium-40 cmcentration in EU 22· 19 is presented in Table 3. Avg • average EU = Exposure Unit GW = groundwater
Max• maximum PCB • polychlorinated biphenyl RL = remediation level
22
ROD = Record of Decision RSL = risk screening level SSL= soil screening level

7-34
23.
' . ,( . ... ,

7-35
0
,,,,_ at Errr. Fig. 1. Location ot' EU .,.~ 19
24

7-36
LEGEND
0 SAMPLE LOCATION
c=J CLASS3SU
CLASS I SU
c:::J BUILDING/STRUCTURE SLAB
c:::::J ETTP EUS
[=:J W.A:fER
98-301 Z2-20
98-303 Z2-21
Z2-19
Z2-E 0
-
200 400
Feel
98-304
""22 EU I 98-305 0
Z2-22
COOKD11-"11lSYSBM MII.Dtli1J:J1o!Al'l"""l-••• Flf'l4L» tll/lTS M,,.,u DAT"l· JnOCll !.IAPUICAnoK """P""-lll"'"'lff-"-'IAf'SlLTTrll!tl t)~Auu••"" MAP OOCVMltlf NAkl IU,.UJ,_C1u11&J-'U_..0,1u,t MIit A!JTNOJt r. ~,.,,. CROANl;AT:ON ucoi:: :tt>UR:t'£J O.a:R.••l•"'•-Ulll•l&t.•t11<1t<Sf-
Fig. 2. Location of Class I SU within EU 22-19.
25

7-37
~ ,li
Q :... ~ §, ~
Z2-1 9
LEGEND
CLASS I SI:
c::J EU UOUNIJARY
1: : : SI.ABS
I BUJJ.l)JNGS
ROADS
c:=J WATER
~ADIATION WALKOVER SURVEY
ACTIOK LEVEL - 2.78-1 Cl'M
• 707 lo D92 cpll\
• 139.l to 27::l-1 cpm
2i85 lO 5000 C)'Hn
;iOO() to 10000 com
• WOOO to4WJO epm
D.'11 .l " !t t• ~• .... ~\; ho~ ....
N
i
\
+2 \ \ \
I \
~ \
100 Feet
UCOR URS I CH2M Oak Ridge LLC
J.1,\JC<Cl~ L1"'TN.oil!: cn~.a~-....,~f, u1-, 1 -i .. ,,. t':,'"',t:!!""1111 M~.1t-t)0 S1,1.-"-..-.i.-c,,,u. t11':1o. tl-N
Jc,nt o • 1tlmlo-•Mflll l"°'"'_,_,..._ fll lU'IM
Fig. 3. Walkover survey results for Class I SU in EU Z2-19.
26

7-38
JZl-El'19ll- 167.\
~
/.2-Elll'J-121 7.2-Fl' 1':ll~ lfii
~ (3...,Z-2-t-:l119B-167H
O--z2 ... ·1·19n.1r.1c·
72-F1' 19J\..16il)
• 0
c.'11.\llACTl:llli' •. \l'l()X A~O Dt:Ll~"f::..\1 10~' S.\MPI.F. l ,OC,\TIOS
(.'tASS 1 SOIi,. l'\'rr
c::::J w
c::::J w-rn-:R -- R<>An
Btl ll.l>l;\U
L:-.~J DF.~IOUSIIED
- >XISTIM,
I
0 ,. SJ..\8
I I / 72-El"1911"1~~,,\
<!J;l2·1.lJl?H· l~S
'~ B 12-1·:t 11•JJ\..15SB \G. / ,?-MIJ'Jl~I~~<.·
i',2-m"l911-JSSD
\ \ \ \
N
l "'
\
t11mt,lU1o.\TL. MSO~l l'I.Al)l"ll\St~i..1,-.r.....--...:.,,1l~-U\O l.Ml!i.\:~ fMtT ,\":,OlC ,,,,r- u'.l\·,,nn--:- r rrrrr-1:1.:11 \.\~-.:,w ,ur .:, .. , \'i:•:J :,.-1,\IE. J:1 1.: 19 CH,\ll l'::H. i:;:,,,.\'l' IA}\." V!..t:\~ ~l.\J'I 1\1.'TI IQa. K.. Zi--s:I:: OR~'llZ.,TIQ.\: t;C'CR ~)ll lt('ES Qal,. ,:_..:.,., J'o;.1r,;~J..J l1 l:1• ,,1:1.,..,:,..i~11
Fig. 4. Soil sample locations in the Class 1 SU in EU Z2-19.
27

7-39
• •
0
• Legend TYPE OF CRITf.lUA EXCEW.-\NCJ•;
• M1\X RT . r\\'CT Rl~,\NO<i\\'!-:~t
Q A\"l'i lU. ,\X:OG\\' SSl. 01':I.Y
Q UWSSLOXI,\'
e KOCRITERI,\ EXCEEl> \:S:CES
CL\ SS I SOILU:SIT
Q Et'
• •
0
• • ···•·•····,
i:
• •
•
•
• •
0
• • ... ,.: . -
nl"] ln[l\'(;
=--~~:! DE~IOUSIIED
-1.XISII~<;
___] SL\U
N
l RO.II) 25 so
•
C()(>fl.02).,\TE SYSTB I N,\D l1U S~Pl,n. T-.'Klo.-.:,,: FIPS ,1100 lxrrs ve:ti~ O,\TF.; ,-•~UI Mt.Pw~·.An;;~; ? [TI'P,[l,;l~lo@ A,~..:">l.11C'.II MAP D,.l'.'UMr,T~Mr ru l? !0 EXCt[DA:-.C:t ,·2.m.,;,I :\.t,.\P,\ t .-rllOil l.: ~I« - • - -Uit<A\11.AIK)\ Utt.J~ s.>, Jl(."l:S 0,.S. ~: t;Jl\ ih'flJ);Sf.lf lt1J<1tJ1111Mm S)-....:ll
100
r-\.\.:1
F'ig. 5. Summary of RU CW SSL exceedances.
28
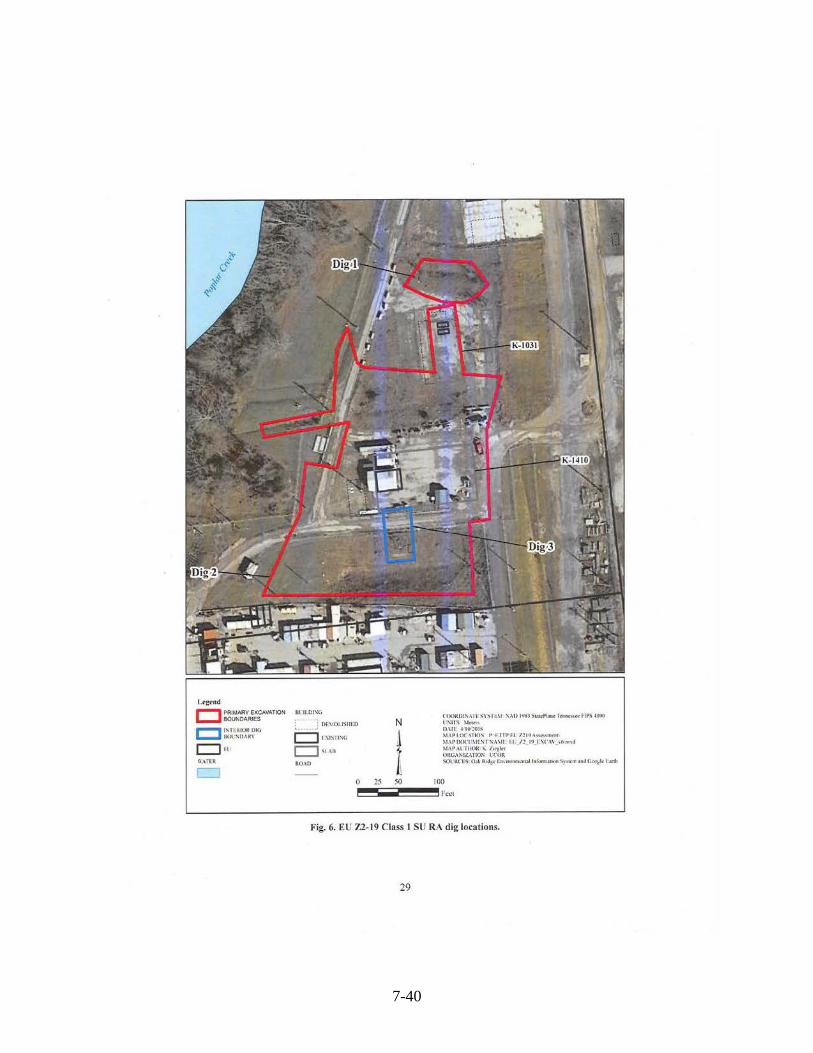
7-40
l~end
C] PRIMARY EXCAVATK).'f BOUNCA.RIES
c:::J ~1~:~4::R~IG t:::] >I
lll lWI~(,
, .. u•• : DI \tol.lSl lt:D
D •~ISW,G
Q.;rAR
10,\ l l
0
N
l 50
( '(l()kUl~, \11 '\'l:-1~\ I ' Al>l\l'SJ~Llk'P'l.:111ot ININ('( H~-tlOII l ' NIIS \l,'WI, IHI! I 10:01$ ).1.-\PiOC',Ul<'I' JI rlTPI-L /!l<l_.,"'<",.,,_ 1 MAPIX){'lJMt., r ~,\\ l[ rt _l?. 14_r\'.(' \\ . ~t>-,d MAP Al THOR.. K IW'f-1.."I
ORGA~l.l,\TIQ:'I. l'("<>F. ~ ilCl,:S-O~l 'hdic l.n,1mil!:l.-11\al lr,(oni;atl'OII :-pkm 111J(,ooi:k t-.ri
100
Fig. 6. EU Z2-19 C lass I SU RA dig locations.
29

7-41
l.t'fl:<'IILI
8_ HCGH WAU.. SM1PI.E
• REGULAR SAMPLE
Cl PRIMARY EXCAVATION BOONl)>.RlES
c:::::J ~~:~~ c::1 111
\l.,\Tf.ft
: 01:\ll H I\IIH I
b ) .'1:hll:-.:0
N
! Cl•u• 0 25 $()
..---;;;;
('OORDl',",\T[: 'iY$lL\I :-..\D l ~ .ISI.IUftat '•-n rs.1100 lSIT$ Mn«' IHn.;: • O :'Ot~ -'!,\P l t )(_'.\11<1:,;' P t-1 fll ti / :1••,\":t•IIM!llt .\l,\~IXX.l \1t, l, ,\.I~ •I / ! IOI t- \ C,\ ,,t11ul \l\l',\V lll(jl< It. /!f\ll..•1 ()II.V,\'l,1/,\11{)' I HNI '°''.IU t, O,~R,~cf11•11-fflt:dlnf.'ffll1ll~-. , ,'lk'•l.-.d(~ l .-1Ji
100
i •-'t.-cl
Fig. 7. EU Z2-19 Class I SU RA dig areas with approximate confirmation sample locations.
30

7-42
UJ
!~i rJ) l3 z <(
"" z 0 20 06080
~ Feet
POPLAR CREEK
~........... . ...... EXISTING STRUCTURE ~ ............... REMAINING SLAB FOUNDATION I=== J... ...... , ......... DEMOLISHED STRUCTURE
......................•. ..... ASPHALT ROAD ~ ............... ........ . ..... SURFACE WATER c::=1 ........... EXPOSURE UNIT (EU) BOUNDARY
....... GROUND CONTOUR (2-FT INTERVAL) ~ - --••.•. GROUND CONTOUR (10-FT INTERVAL) c::=t ......... PRIMARY EXCAVATION BOUNDARY c:::=::::J ......... INTERIOR EXCAVATION BOUNDARY L::.=J ..... EXPANSION EXCAVATION BOUNDARY O OF 302..... . ...... STORM DRAIN OUTFALL
,=:::::i., ,, ....... . ...... STORM DRAIN MAIN PIPE
Attachment B
Z2-19
DIG2
K-1410
780
780
1
I' L J
UA E: , ·~,
S. MUNDY AUG 26, 2019 METERS

DOE/OR/01-2224&D5/A9
RECORD COPY DISTRIBUTION
File—DMC—RC